UNITED STATES
SECURITIES AND EXCHANGE COMMISSION
Washington, D.C. 20549
FORM N-CSR
CERTIFIED SHAREHOLDER REPORT OF REGISTERED
MANAGEMENT INVESTMENT COMPANIES
Investment Company Act file number: 811-08194
FINANCIAL INVESTORS TRUST
(Exact name of registrant as specified in charter)
1290 Broadway, Suite 1100, Denver, Colorado 80203
(Address of principal executive offices) (Zip code)
Karen Gilomen, Esq., Secretary
Financial Investors Trust
1290 Broadway, Suite 1100
Denver, Colorado 80203
(Name and address of agent for service)
Registrant’s telephone number, including area code: 303-623-2577
Date of fiscal year end: April 30
Date of reporting period: May 1, 2017 – April 30, 2018
Item 1. Reports to Stockholders.
TABLE OF CONTENTS
| | PAGE |
| Manager Commentary | |
| Aspen Managed Futures Strategy Fund | 1 |
| Aspen Portfolio Strategy Fund | 3 |
| Performance Update | |
| Aspen Managed Futures Strategy Fund | 5 |
| Aspen Portfolio Strategy Fund | 7 |
| Consolidated Disclosure of Fund Expenses | 9 |
| Consolidated Schedule of Investments | |
| Aspen Managed Futures Strategy Fund | 10 |
| Aspen Portfolio Strategy Fund | 12 |
| Consolidated Statements of Assets & Liabilities | 14 |
| Consolidated Statements of Operations | 16 |
| Consolidated Statements of Changes in Net Assets | |
| Aspen Managed Futures Strategy Fund | 17 |
| Aspen Portfolio Strategy Fund | 18 |
| Consolidated Financial Highlights | |
| Aspen Managed Futures Strategy Fund | 19 |
| Aspen Portfolio Strategy Fund | 21 |
| Notes to Consolidated Financial Statements | 23 |
| Report of Independent Registered Public Accounting Firm | 34 |
| Disclosure Regarding Approval of Fund Advisory Agreements | 35 |
| Additional Information | 37 |
| Trustees and Officers | 38 |
| Privacy Policy | 43 |
| Aspen Managed Futures Strategy Fund | Manager Commentary |
April 30, 2018 (Unaudited)
April 30, 2018
Performance Results
For the twelve-month period ending April 30, 2018, the Class I shares of the Aspen Managed Futures Strategy Fund (the “Fund”) posted a return of -3.13%. Per its mandate, the Fund maintained tight correlation to the Aspen Managed Futures Beta Index (“Aspen MFBI” or the “Index”). The Index uses a combination of trend and counter-trend algorithms to determine exposures to 23 futures markets. In following the Index, the Fund can take long or short positions in each of the eligible markets. A long position in a futures market will profit if the price of the futures contract rises, whereas a short position will profit if the price of the futures contract falls.
The Barclay BTOP50 Index, a managed futures benchmark, returned -0.61% over the same period. It is important to note that there are substantive differences between the Fund and this index in terms of construction. There were no significant changes to the Fund strategy during this period.
Explanation of Fund Performance
Until January of 2018, broad backdrop market volatility remained near all-time lows globally, as it had been for virtually all of 2017. While low volatility is typically not an auspicious backdrop for trend following strategies, it does not usually tend to produce significantly poor results either. The May-December period was an example of that phenomenon, as a series of relatively small monthly gains and small monthly losses for the Fund combined to produce a small end-to-end loss.
When backdrop volatility is abnormally low, occasional “events” that punctuate the markets with brief spikes of more elevated volatility can have an outsized effect on trend following performance. One such event occurred in May 2017. Heading into that month, the Fund was positioned on the short side in energy futures. But midmonth, Saudi Arabia and Russia announced a deal in principle to extend an oil output freeze for an extra nine months. Energy prices soared on the news, causing losses for the Fund in energies, and causing the trend model to reverse into long energy positions. Then in late May the official OPEC meeting occurred. Though OPEC members ratified the pre-announced deal, no further supportive measures were forthcoming. Disappointment in the markets caused energy prices to plunge once again, causing classic “V-top” losses for the Fund (i.e., losses arising from prices moving up and then down in an inverted V-shaped pattern). Largely as a consequence of this move, the Fund returned -1.51% in May.
The first several weeks of June were profitable, if uneventful. Then in the last week of the month, European Central Bank (ECB) president Mario Draghi gave a speech that markets interpreted as unexpectedly hawkish. The resulting activity could be described as a European version of the “taper tantrum” that hit the markets after similar comments by US Federal Reserve president Ben Bernanke were interpreted similarly: Both equity and fixed income markets declined rapidly as markets contemplated the consequences of potentially faster-than-expected reductions in ECB accommodation. This produced losses for Fund, albeit insufficient to eliminate the entire monthly gain. The final June fund return was +1.10%.
The entirety of the third and fourth quarters constituted a fairly uneventful and incredibly low-volatility period for investment markets. A few sustained trends developed (most notably long positions in equities and a long position in copper); others were profitable at times with occasional reversals (e.g., downtrends in fixed income, which performed well in July and reversed in August, but then resumed at the end of the year; and uptrends across most currencies, which were profitable through most of the third quarter, reversed at the end of September, and also resumed as the year ended). The result of primarily low-vol, range-bound activity was a continued series of minor monthly returns. For the months of July, August, September, October, November, and December, Fund returns were +1.63%, -1.81%, 0.76%, +0.33%, -1.31%, and +1.33%, respectively.
Long equity trends carried into 2018, where they proved profitable in the equity “melt-up” that characterized most of January. Interestingly, volatility—direct and implied—increased as the month progressed, but initially risk assets like equities and energies continued rising, and bonds lost value as interest rates rose as well (traditionally another “risk on” occurrence). The Fund was well-positioned for these movements, and returned +2.29% for the month of January.
Late in January, however, markets peaked and began a very rapid descent. In just six trading days, equity markets gave back all of their year-to-date gains and more, as did the Fund. The carnage ended in early February and recovered somewhat from there, but Fund return was -3.84% for the full month.
Notably, as we have often had occasion to mention, many other trend-following Call to Action (CTAs) (as proxied by benchmarks like the BTOP50 Index) have demonstrated significantly greater exposure to long equity futures positioning than does the Fund. The first two months of 2018 were a good example, as the BTOP50 Index returned +3.13% in January and -5.58% in February. In fact, February was the worst month for the benchmark since 2003.
After February, broad market volatility remained higher than it had been in 2017. The losses sustained by the Fund’s trend following model led to mostly defensive, internally hedged positioning for much of March and April, resulting in mostly small daily and monthly moves. March and April returns were -0.11% and -0.33%, respectively. April performance was bolstered by positive returns from the Fund’s counter-trend model, which itself was bolstered by the inclusion of the US dollar as a “long” leg (actually expressed as a flat position), making counter-trend net short foreign
| Annual Report | April 30, 2018 | 1 |
| Aspen Managed Futures Strategy Fund | Manager Commentary |
April 30, 2018 (Unaudited)
exchange overall, coinciding with a rally in the US dollar in April. However, the same phenomenon caused reversals in long currency trend positioning, which had built up due to US dollar weakness over the preceding months.
Outlook
While the sudden reversal of entrenched long equity trends and the lack of directional consensus among other risk assets produced mild losses for the Fund in the early months of 2018, the return of volatility, if it holds up, is generally a cause for optimism. Of course, volatility is always bidirectional, and the ride may continue to be wilder from here. But whereas the wild ups and downs of an elevated volatility backdrop are often detrimental to risk asset performance, they have historically tended to accumulate to positive returns for traditional trend following models like the one executed in the Fund.
The counter-trend model appears set to remain net short foreign exchange futures for the foreseeable future, portending positive returns if the latest US dollar rally continues, and losses if it reverses instead.
Sincerely,
Bryan R. Fisher
William Ware Bush
Aspen Partners, Ltd.
Performance data quoted represents past performance. Past performance does not guarantee future results. Investment return and principal value of an investment will fluctuate so that an investor’s shares, when sold or redeemed, may be worth more or less than the original cost. Current performance data may be higher or lower than actual data quoted. For the most current month-end performance data please call 1-855-845-9444.
The views of Aspen Partners, Ltd. and information discussed in this commentary are as of the date of publication, are subject to change, and may not reflect the writers’ current views. The views expressed are those of the Fund’s adviser only, and represent an assessment of market conditions at a specific point in time, are opinions only and should not be relied upon as investment advice regarding a particular investment or markets in general. Such information does not constitute a recommendation to buy or sell specific securities or investment vehicles. It should not be assumed that any investment will be profitable or will equal the performance of the portfolios or any securities or any sectors mentioned in this letter. The subject matter contained in this letter has been derived from several sources believed to be reliable and accurate at the time of compilation. Neither Aspen Partners Ltd. nor the Fund accepts any liability for losses either direct or consequential caused by the use of this information.
The Aspen Managed Futures Strategy Fund is distributed by ALPS Distributors, Inc.
The Fund is subject to investment risks, including possible loss of the principal amount invested and therefore is not suitable for all investors. The Fund may not achieve its objectives.
Diversification does not eliminate the risk of experiencing investment losses.
Correlation - a statistical measure of how two securities or portfolios move in relation to each other.
Aspen Managed Futures Beta Index (Aspen MFBI) is constructed using a quantitative, rules-based model designed to replicate the trend following and counter-trend exposure of futures markets by allocating assets to liquid futures contracts of certain financial and commodities futures markets. The Index therefore seeks to reflect the performance of strategies and exposures common to a broad universe of futures markets, i.e., managed futures beta. The Index is not actively managed and does not reflect any deduction for fees, expenses or taxes. An investor cannot invest directly in the Index.
Barclay BTOP50 Index is an index of the largest investable CTA programs as measured by assets under management. The index is not actively managed and does not reflect any deduction for fees, expenses or taxes. An investor may not invest directly into the Index.
Taper tantrum - the term used to refer to the 2013 surge in U.S. Treasury yields, which resulted from the Federal Reserve’s use of tapering to gradually reduce the amount of money it was feeding into the economy.
| Aspen Portfolio Strategy Fund | Manager Commentary |
April 30, 2018 (Unaudited)
April 30, 2018
Performance Results
For the twelve-month period ending April 30, 2018, the Class I shares of the Aspen Portfolio Strategy Fund (the “Fund”) posted a return of +7.76%. Per its mandate, the Fund traded the Aspen Portfolio Strategy, which combines full exposure to US large-cap equities (the “Equity Strategy”) with full exposure to Aspen’s proprietary diversified trend following program (the “Futures Strategy”). To capture the Equity Strategy, the Fund can employ a variety of vehicles, including exchange-traded funds and futures contracts. To capture the Futures Strategy, the Fund can take long or short positions in each eligible futures market. A long position in a futures market will profit if the price of the futures contract rises, whereas a short position will profit if the price of the futures contract falls.
The S&P 500 Index, a US large-cap equity benchmark, returned +13.27%. See the following section for a description of the sources of the sub-period and full-period return differential between the Fund and the S&P 500.
Explanation of Fund Performance
Until January of 2018, broad backdrop market volatility remained near all-time lows globally. A low volatility regime is often a good backdrop for risk assets like equities, and given the return of the Equity Strategy, the period in question was no exception. Conversely, low volatility is typically not an auspicious backdrop for trend following strategies.
When backdrop volatility is abnormally low, occasional “events” that punctuate the markets with brief spikes of more elevated volatility can have an outsized effect on trend following performance. One such event occurred in May 2017. Heading into that month, the Fund was positioned on the short side in energy futures. But midmonth, Saudi Arabia and Russia announced a deal in principle to extend an oil output freeze for an extra nine months. Energy prices soared on the news, causing losses for the Fund in energies, and causing the Futures Strategy to reverse into long energy positions. Then in late May the official OPEC meeting occurred. Though OPEC members ratified the pre-announced deal, no further supportive measures were forthcoming. Disappointment in the markets caused energy prices to plunge once again, causing classic “V-top” losses for the Futures Strategy (i.e., losses arising from prices moving up and then down in an inverted V-shaped pattern). Conversely, May was a strong positive month for equities, and the Fund was able to produce a mildly positive return of +0.20% despite the losses in the Futures Strategy.
The first several weeks of June were profitable for both the Equity Strategy and the Futures Strategy. Then in the last week of the month, European Central Bank president Mario Draghi gave a speech that markets interpreted as unexpectedly hawkish. The resulting activity could be described as a European version of the “taper tantrum” that hit the markets after similar comments by US Federal Reserve president Ben Bernanke were interpreted similarly in 2013: Both equity and fixed income markets declined rapidly as markets contemplated the consequences of potentially faster-than-expected reductions in ECB accommodation. This produced losses for Fund, albeit insufficient to eliminate the entire monthly gain. The final June fund return was +0.82 %.
The entirety of the third and fourth quarters constituted a fairly uneventful and incredibly low-volatility period for investment markets. A few sustained trends developed and benefitted the Futures Strategy (most notably long positions in equities and a long position in copper); others were profitable briefly and then reversed (e.g., downtrends in fixed income, which performed well in July and reversed in August, but then resumed at the end of the year; and uptrends across most currencies, which were profitable through most of the third quarter, reversed at the end of September, and also resumed as the year ended). Over that same timeframe, the Equity Strategy continued to contribute positively and fairly consistently.
Overall Fund returns were +3.36%, -0.86%, +1.58%, +3.11%, +2.94%, and +0.77% in July, August, September, October, November, and December, respectively. (I.e., of these six months, only in August were there negative Futures Strategy returns in sufficient quantity to outrun minor positive Equity Strategy returns.)
Incredibly, the S&P 500 (which is tracked directly by the Equity Strategy) posted a positive total return for thirteen consecutive months ending in January 2018—the longest such streak in over 30 years. January was arguably the crowning achievement of the entire streak. A strong monthly gain for US and global equities, as tracked by long trends in the Futures Strategy, produced a gain of +8.50% for the Fund that month. Interestingly, volatility—direct and implied—increased as the month progressed, but initially risk assets like equities and energies continued rising, and bonds lost value as interest rates rose as well (traditionally another “risk on” occurrence).
Late in January, however, markets peaked and began a very rapid descent. In just six trading days, equity markets gave back all of their year-to-date gains and more, as did the Fund. The carnage ended in early February and recovered somewhat from there, but Fund return was -8.00% for the full month. As we’ve noted elsewhere, historically the combination of equity and trend following returns tends to reduce both the kurtosis (think “fat-tailedness”) and skewness (think “tendency for outliers to fall to one side”) of both asset classes stand-alone. The combined portfolio is more Gaussian—more “normalized”—than either stand-alone. A consequence of reducing the dangerous tail observations, though, is what mathematicians call “broad shoulders”: I.e., there are more observations of intermediate-sized volatility. The January gain and February loss are illustrative of the positive and negative “broad shoulders” of a normalized distribution.
| Annual Report | April 30, 2018 | 3 |
| Aspen Portfolio Strategy Fund | Manager Commentary |
April 30, 2018 (Unaudited)
Further losses in US equities contributed to a negative month in March, resulting in Fund returns of -2.88%. In April, losses in long currency trend positioning contributed to the Fund’s -0.49% return, as the US dollar rallied from its descent over several months prior.
Outlook
While the sudden reversal of entrenched long equity trends and the lack of directional consensus among other risk assets produced losses for both the Equity Strategy and the Futures Strategy in the early months of 2018, the return of volatility, if it holds up, is generally a cause for optimism at least for trend following strategies. Of course, volatility is always bidirectional, and the ride may continue to be wilder from here. The ideal scenario would be one in which US equities could resume their generally upward trajectory against a backdrop of sustained elevated volatility with the potential to produce tradable trends across the market spectrum. Such a scenario has not generally prevailed in the post-Great Financial Crisis years, but it was commonplace for both US equities and traditional trend following managers to post gains simultaneously in the years prior.
Sincerely,
Bryan R. Fisher
William Ware Bush
Performance data quoted represents past performance. Past performance does not guarantee future results. Investment return and principal value of an investment will fluctuate so that an investor’s shares, when sold or redeemed, may be worth more or less than the original cost. Current performance data may be higher or lower than actual data quoted. For the most current month-end performance data please call 1-855-845-9444.
The views of Aspen Partners, Ltd. and information discussed in this commentary are as of the date of publication, are subject to change, and may not reflect the writers’ current views. The views expressed are those of the Fund’s adviser only, and represent an assessment of market conditions at a specific point in time, are opinions only and should not be relied upon as investment advice regarding a particular investment or markets in general. Such information does not constitute a recommendation to buy or sell specific securities or investment vehicles. It should not be assumed that any investment will be profitable or will equal the performance of the portfolios or any securities or any sectors mentioned in this letter. The subject matter contained in this letter has been derived from several sources believed to be reliable and accurate at the time of compilation. Neither Aspen Partners Ltd. nor the Fund accepts any liability for losses either direct or consequential caused by the use of this information.
The Aspen Portfolio Strategy Funds are distributed by ALPS Distributors, Inc.
The Fund is subject to investment risks, including possible loss of the principal amount invested and therefore is not suitable for all investors. The Fund may not achieve its objectives.
Diversification does not eliminate the risk of experiencing investment losses.
The S&P 500® Index is an unmanaged index of 500 common stocks chosen for market size, liquidity and industry group representation. It is a market-value weighted index. The Index is not actively managed and does not reflect any deductions for fees, expenses or taxes. An investor may not invest directly in the Index.
Taper tantrum - the term used to refer to the 2013 surge in U.S. Treasury yields, which resulted from the Federal Reserve’s use of tapering to gradually reduce the amount of money it was feeding into the economy.
| Aspen Managed Futures Strategy Fund | Performance Update |
April 30, 2018 (Unaudited)
Annualized Total Return Performance as of April 30, 2018
| | | | | Since | Expense Ratios |
| Aspen Managed Futures Strategy Fund | 1 Year | 3 Year | 5 Year | Inception* | Total | Net(1) |
| Aspen Managed Futures Strategy Fund - Class A (NAV)(2) | -3.33% | -5.21% | -1.00% | -1.82% | 1.62% | 1.62% |
| Aspen Managed Futures Strategy Fund - Class A (MOP)(3) | -8.61% | -6.97% | -2.11% | -2.64% | 1.62% | 1.62% |
| Aspen Managed Futures Strategy Fund - Class I | -3.15% | -5.17% | -0.83% | -1.59% | 1.29% | 1.29% |
| SG CTA Index(4) | -0.26% | -1.85% | 1.58% | 0.65% | | |
| Aspen Managed Futures Beta Index(5) | -2.39% | -4.74% | -0.43% | -1.11% | | |
Performance data quoted represents past performance. Past performance does not guarantee future results. Investment return and principal value of an investment will fluctuate so that an investor’s shares, when sold or redeemed, may be worth more or less than the original cost. Current performance data may be higher or lower than actual data quoted. For the most current month-end performance data, please call 1-855-845-9444.
The table does not reflect the deduction of taxes that a shareholder would pay on Fund distributions or the redemption of Fund shares.
Subject to investment risks, including possible loss of the principal amount invested.
Returns for periods less than 1 year are cumulative.
| * | Fund Inception date of August 2, 2011. |
| (1) | Aspen Partners, Ltd. (the “Adviser”) has agreed to waive and/or reimburse fees or expenses in order to limit total annual Fund operating expenses after fee waiver/expense reimbursements (excluding distribution and service (12b-1) fees, shareholder services fees, acquired fund fees and expenses, brokerage expenses, interest expenses, taxes and extraordinary expenses) to 1.55% of the Funds’ average daily net assets. This agreement (the “Expense Agreement”) is in effect through August 31, 2018. The Adviser will be permitted to recover, on a class-by-class basis, expenses it has borne through the Expense Agreement to the extent that the Funds’ expenses in later periods fall below the expense cap in effect at the time of waiver or reimbursement. Notwithstanding the foregoing, the Fund will not be obligated to pay any such deferred fees and expenses more than three years after the date of the waiver or reimbursement. The Expense Agreement may not be terminated or modified prior to August 31, 2018 except with the approval of the Funds’ Board of Trustees |
| (2) | Net Asset Value (NAV) is the share price without sales charges. |
| (3) | Maximum Offering Price (MOP) includes sales charges. Class A returns include effects of the Funds’ maximum sales charge of 5.50%. |
| (4) | The SG CTA Index (formerly, the Newedge CTA Index) provides the market with a reliable daily performance benchmark of major commodity trading advisors (CTAs). The SG CTA Index calculates the daily rate of return for a pool of CTAs selected from the larger managers that are open to new investment. Selection of the pool of qualified CTAs used in construction of the Index will be conducted annually, with re-balancing on January 1st of each year. A committee of industry professionals has been established to monitor the methodology of the index on a regular basis. The Index is not actively managed and does not reflect any deduction for fees, expenses or taxes. An investor cannot invest directly in the Index. |
| (5) | Aspen Managed Futures Beta Index – The Managed Futures Beta Index is constructed using a quantitative, rules-based model designed to replicate the trend-following and counter-trend exposure of futures markets by allocating assets to liquid futures contracts of certain financial and commodities futures markets. The Index therefore seeks to reflect the performance of strategies and exposures common to a broad universe of futures markets, i.e., managed futures beta. The index is not actively managed and does not reflect any deductions for fees, expense or taxes. An investor may not invest directly in an index. |
Portfolio Composition as of April 30, 2018
As a percentage of Net Assets^
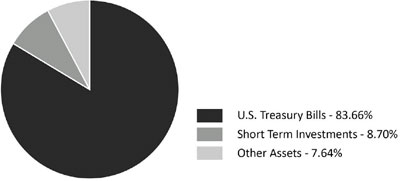
| ^ | Holdings subject to change, and may not reflect the current or future position of the portfolio. |
| Annual Report | April 30, 2018 | 5 |
| Aspen Managed Futures Strategy Fund | Performance Update |
April 30, 2018 (Unaudited)
Performance of $10,000 Initial Investment (as of April 30, 2018)
Comparison of change in value of a $10,000 investment (includes applicable sales loads)
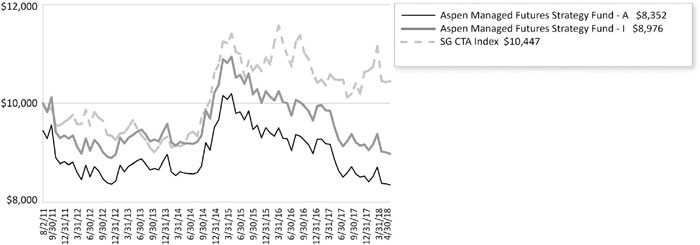
The chart above represents historical performance of a hypothetical investment of $10,000 in the Fund since inception. Past performance does not guarantee future results. This chart does not reflect the deduction of taxes that a shareholder would pay on Fund distributions or the redemption of Fund shares.
Investing in the Fund is subject to investment risks, including possible loss of the principal amount invested.
| Aspen Portfolio Strategy Fund | Performance Update |
April 30, 2018 (Unaudited)
Annualized Total Return Performance as of April 30, 2018
| | | | Expense Ratios |
| Aspen Portfolio Strategy Fund | 1 Year | Since Inception* | Gross | Net(1) |
| Aspen Portfolio Strategy Fund - Class A (NAV)(2) | 7.44% | 3.77% | 2.83% | 1.99% |
| Aspen Portfolio Strategy Fund - Class A (MOP)(3) | 1.54% | -0.54% | 2.83% | 1.99% |
| Aspen Portfolio Strategy Fund - Class I | 7.76% | 4.10% | 2.26% | 1.59% |
| S&P 500® Index(4) | 13.27% | 15.17% | | |
Performance data quoted represents past performance. Past performance does not guarantee future results. Investment return and principal value of an investment will fluctuate so that an investor’s shares, when sold or redeemed, may be worth more or less than the original cost. Current performance data may be higher or lower than actual data quoted. For the most current month-end performance data, please call 1-855-845-9444.
The table does not reflect the deduction of taxes that a shareholder would pay on Fund distributions or the redemption of Fund shares.
Subject to investment risks, including possible loss of the principal amount invested.
Returns for periods less than 1 year are cumulative.
| * | Fund Inception date of December 28, 2016. |
| (1) | Aspen Partners, Ltd. (the “Adviser”) has agreed to waive and/or reimburse fees or expenses in order to limit total annual Fund operating expenses after fee waiver/expense reimbursements (excluding distribution and service (12b-1) fees, shareholder services fees, acquired fund fees and expenses, brokerage expenses, interest expenses, taxes and extraordinary expenses) to 1.55% of the Funds’ average daily net assets. This agreement (the “Expense Agreement”) is in effect through August 31, 2018. The Adviser will be permitted to recover, on a class-by-class basis, expenses it has borne through the Expense Agreement to the extent that the Funds’ expenses in later periods fall below the expense cap in effect at the time of waiver or reimbursement. Notwithstanding the foregoing, the Fund will not be obligated to pay any such deferred fees and expenses more than three years after the date of the waiver or reimbursement. The Expense Agreement may not be terminated or modified prior to August 31, 2018 except with the approval of the Funds’ Board of Trustees |
| (2) | Net Asset Value (NAV) is the share price without sales charges. |
| (3) | Maximum Offering Price (MOP) includes sales charges. Class A returns include effects of the Funds’ maximum sales charge of 5.50%. |
| (4) | The S&P 500® Index is an unmanaged index of 500 common stocks chosen for market size, liquidity and industry group representation. It is a market-value weighted index. The Index is not actively managed and does not reflect any deductions for fees, expenses or taxes. An investor may not invest directly in the Index. |
Portfolio Composition as of April 30, 2018
As a percentage of Net Assets^
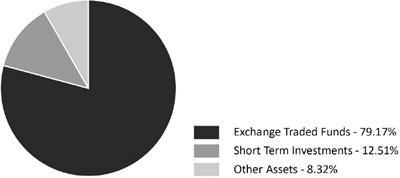
| ^ | Holdings subject to change, and may not reflect the current or future position of the portfolio. |
| Annual Report | April 30, 2018 | 7 |
| Aspen Portfolio Strategy Fund | Performance Update |
April 30, 2018 (Unaudited)
Performance of $10,000 Initial Investment (as of April 30, 2018)
Comparison of change in value of a $10,000 investment (includes applicable sales loads)
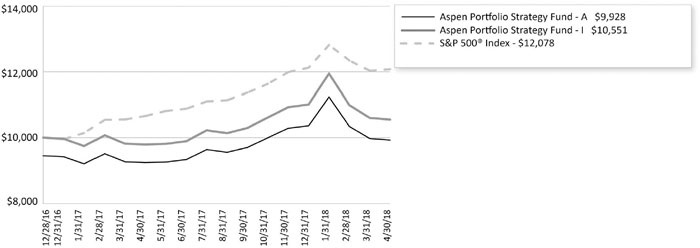
The chart above represents historical performance of a hypothetical investment of $10,000 in the Fund since inception. Past performance does not guarantee future results. This chart does not reflect the deduction of taxes that a shareholder would pay on Fund distributions or the redemption of Fund shares.
Investing in the Fund is subject to investment risks, including possible loss of the principal amount invested.
| Aspen Funds | Consolidated Disclosure of Fund Expenses |
| April 30, 2018 (Unaudited) |
As a shareholder of the Fund, you incur two types of costs: transaction costs, including sales charges (loads) on purchase payments, reinvested dividends, or other distributions; redemption fees; and exchange fees; and (2) ongoing costs, including management fees; distribution and/or service (12b-1) fees; shareholder servicing fees; and other fund operating expenses. This example is intended to help you understand your ongoing costs (in dollars), of investing in the Fund and to compare these costs with the ongoing costs of investing in other mutual funds.
This example is based on an investment of $1,000 invested at the beginning of the period and held for the entire six-month period of November 1, 2017 through April 30, 2018.
Actual Expenses The first line of the table below provides information about actual account values and actual expenses. You may use the information in this line, together with the amount you invested, to estimate the expenses that you paid over the period. Simply divide your account value by $1,000 (for example, an $8,600 account value divided by $1,000 = 8.6), then multiply the result by the number in the first line under the heading “Expenses Paid During Period” to estimate the expenses you paid on your account during this period.
Hypothetical Example for Comparison Purposes The second line of the table below provides information about hypothetical account values and hypothetical expenses based on the Funds’ actual expense ratio and an assumed rate of return of 5% per year before expenses, which is not the Funds’ actual return. The hypothetical account values and expenses may not be used to estimate the actual ending account balance or expenses you paid for the period. You may use this information to compare the ongoing costs of investing in the Fund and other funds. To do so, compare this 5% hypothetical example with the 5% hypothetical examples that appear in the shareholder reports of other mutual funds.
Please note that the expenses shown in the table are meant to highlight your ongoing costs only and do not reflect any transactional costs, such as applicable sales charges (loads), redemption fees, or exchange fees. Therefore, the second line of the table is useful in comparing ongoing costs only and will not help you determine the relative total costs of owning different funds. In addition, if these transactional costs were included, your costs would have been higher.
| | Beginning
Account Value
11/1/17 | Ending
Account Value
4/30/18 | Expense Ratio(a) | Expenses Paid
During period
11/1/17 - 4/30/18(b) |
| Aspen Managed Futures Strategy Fund | | | | |
| Class A | | | | |
| Actual | $1,000.00 | $978.80 | 1.52% | $7.46 |
| Hypothetical (5% return before expenses) | $1,000.00 | $1,017.26 | 1.52% | $7.60 |
| Class I | | | | |
| Actual | $1,000.00 | $979.20 | 1.45% | $7.12 |
| Hypothetical (5% return before expenses) | $1,000.00 | $1,017.60 | 1.45% | $7.25 |
| Aspen Portfolio Strategy Fund | | | | |
| Class A | | | | |
| Actual | $1,000.00 | $993.20 | 1.65% | $8.15 |
| Hypothetical (5% return before expenses) | $1,000.00 | $1,016.61 | 1.65% | $8.25 |
| Class I | | | | |
| Actual | $1,000.00 | $993.90 | 1.55% | $7.66 |
| Hypothetical (5% return before expenses) | $1,000.00 | $1,017.11 | 1.55% | $7.75 |
| (a) | The Fund's expense ratios have been based on the Fund's most recent fiscal half-year expenses. |
| (b) | Expenses are equal to the Fund's annualized expense ratio multiplied by the average account value over the period, multiplied by the number of days in the most recent fiscal half-year (181)/365 (to reflect the half-year period). |
| Annual Report | April 30, 2018 | 9 |
| Aspen Managed Futures Strategy Fund | Consolidated Schedule of Investments |
| | | Principal Amount/Shares | | | Value (Note 2) | |
| SHORT TERM INVESTMENTS (92.36%) | | | | | | | | |
| MONEY MARKET FUND (8.70%) | | | | | | | | |
| Dreyfus Treasury & Agency Cash Management Fund - Institutional Shares, 7-day yield, 1.537% | | | 7,721,143 | | | $ | 7,721,143 | |
| | | | | | | | | |
| U.S. TREASURY BILLS (83.66%) | | | | | | | | |
| 1.159%, 05/24/2018(a) | | $ | 5,500,000 | | | | 5,494,404 | |
| 1.126%, 06/21/2018(a) | | | 11,200,000 | | | | 11,173,344 | |
| 1.171%, 07/19/2018(a) | | | 9,000,000 | | | | 8,965,462 | |
| 1.267%, 08/16/2018(a) | | | 9,700,000 | | | | 9,646,827 | |
| 1.411%, 09/13/2018(a) | | | 13,350,000 | | | | 13,256,258 | |
| 1.548%, 10/11/2018(a) | | | 10,300,000 | | | | 10,209,409 | |
| 1.752%, 11/08/2018(a) | | | 6,550,000 | | | | 6,483,799 | |
| 1.819%, 12/06/2018(a) | | | 9,150,000 | | | | 9,048,694 | |
| | | | | | | | 74,278,197 | |
| | | | | | | | | |
| TOTAL SHORT TERM INVESTMENTS | | | | | | | | |
| (Cost $82,082,859) | | | | | | | 81,999,340 | |
| | | | | | | | | |
| TOTAL INVESTMENTS (92.36%) | | | | | | | | |
| (Cost $82,082,859) | | | | | | $ | 81,999,340 | |
| | | | | | | | | |
| Other Assets In Excess Of Liabilities (7.64%) | | | | | | | 6,787,620 | (b) |
| | | | | | | | | |
| NET ASSETS (100.00%) | | | | | | $ | 88,786,960 | |
| (a) | Rate shown represents the bond equivalent yield to maturity at date of purchase. |
| (b) | Includes cash which is being held as collateral for futures contracts. |
See Notes to Consolidated Financial Statements.
10
| Aspen Managed Futures Strategy Fund | Consolidated Schedule of Investments |
FUTURES CONTRACTS
At April 30, 2018, the Fund had the following outstanding futures contracts:
| Description | | Position | | | Contracts | | | Expiration
Date | | Notional
Value | | | Value and
Unrealized
Appreciation | |
| Commodity Contracts | | | | | | | | | | | | | | | | | | |
| Corn Future(a) | | | Long | | | | 191 | | | 07/13/2018 | | $ | 3,827,162 | | | $ | 47,043 | |
| NY Harbor ULSD Future(a) | | | Long | | | | 41 | | | 05/31/2018 | | | 3,701,095 | | | | 44,295 | |
| Soybean Future(a) | | | Long | | | | 48 | | | 07/13/2018 | | | 2,516,400 | | | | 22,023 | |
| WTI Crude Future(a) | | | Long | | | | 55 | | | 05/22/2018 | | | 3,771,350 | | | | 5,741 | |
| Equity Contracts | | | | | | | | | | | | | | | | | | |
| FTSE 100 Index Future | | | Long | | | | 51 | | | 06/15/2018 | | | 5,237,794 | | | | 136,812 | |
| Nikkei 225 Index Future | | | Long | | | | 48 | | | 06/07/2018 | | | 5,388,000 | | | | 189,263 | |
| Foreign Currency Contracts | | | | | | | | | | | | | | | | | | |
| CHF Currency Future | | | Short | | | | 156 | | | 06/18/2018 | | | (19,757,400 | ) | | | 345,852 | |
| Euro FX Currency Future | | | Short | | | | 99 | | | 06/18/2018 | | | (15,002,213 | ) | | | 122,180 | |
| | | | | | | | | | | | | $ | (10,317,812 | ) | | $ | 913,209 | |
| Description | | Position | | | Contracts | | | Expiration
Date | | Notional
Value | | | Value and
Unrealized
Depreciation | |
| Commodity Contracts | | | | | | | | | | | | | | | | | | |
| Copper Future(a) | | | Long | | | | 16 | | | 07/27/2018 | | $ | 1,229,600 | | | $ | (33,452 | ) |
| Gold 100 Oz Future(a) | | | Long | | | | 19 | | | 06/27/2018 | | | 2,506,480 | | | | (41,482 | ) |
| Silver Future(a) | | | Long | | | | 15 | | | 07/27/2018 | | | 1,230,075 | | | | (13,249 | ) |
| Sugar No. 11 (World) Future(a) | | | Short | | | | 291 | | | 06/29/2018 | | | (3,829,560 | ) | | | (206,450 | ) |
| Equity Contracts | | | | | | | | | | | | | | | | | | |
| EURO STOXX 50 Index Future | | | Short | | | | 63 | | | 06/15/2018 | | | (2,642,978 | ) | | | (45,048 | ) |
| S&P 500 E-Mini Future | | | Long | | | | 20 | | | 06/15/2018 | | | 2,647,000 | | | | (52,396 | ) |
| Foreign Currency Contracts | | | | | | | | | | | | | | | | | | |
| Australian Dollar Currency Future | | | Long | | | | 133 | | | 06/18/2018 | | | 10,014,900 | | | | (329,975 | ) |
| Canadian Dollar Currency Future | | | Long | | | | 63 | | | 06/19/2018 | | | 4,910,220 | | | | (22,216 | ) |
| Japanese Yen Currency Future | | | Long | | | | 43 | | | 06/18/2018 | | | 4,933,175 | | | | (115,213 | ) |
| Interest Rate Contracts | | | | | | | | | | | | | | | | | | |
| Canadian 10 Year Bond Future | | | Short | | | | 147 | | | 06/20/2018 | | | (15,049,768 | ) | | | (52,456 | ) |
| Euro-Bund Future | | | Short | | | | 52 | | | 06/07/2018 | | | (9,968,113 | ) | | | (85,355 | ) |
| Long Gilt Future | | | Short | | | | 88 | | | 06/27/2018 | | | (14,811,754 | ) | | | (160,724 | ) |
| U.S. 10 Year Treasury Note Future | | | Short | | | | 125 | | | 06/20/2018 | | | (14,953,125 | ) | | | (34,417 | ) |
| | | | | | | | | | | | | $ | (33,783,848 | ) | | $ | (1,192,433 | ) |
Common Abbreviations:
FTSE - Financial Times and the London Stock Exchange
S&P - Standard and Poor's
ULSD - Ultra Low Sulfur Diesel
| (a) | Owned by an entity that is owned by the Fund and is consolidated as described in Note 1 of the Notes to the Consolidated Financial Statements. |
For Fund compliance purposes, the Fund's industry classifications refer to any one or more of the industry sub-classifications used by one or more widely recognized market indexes or ratings group indexes, and/or as defined by Fund management. This definition may not apply for purposes of this report, which may combine industry sub-classifications for reporting ease. Industries are shown as a percentage of net assets.
See Notes to Consolidated Financial Statements.
| Annual Report | April 30, 2018 | 11 |
| Aspen Portfolio Strategy Fund | Consolidated Schedule of Investments |
| | | Shares | | | Value (Note 2) | |
| EXCHANGE TRADED FUNDS (79.17%) | | | | | | | | |
| SPDR® S&P 500® ETF Trust | | | 150,442 | | | $ | 39,795,140 | |
| | | | | | | | | |
| TOTAL EXCHANGE TRADED FUNDS | | | | | | | | |
| (Cost $35,492,605) | | | | | | | 39,795,140 | |
| | | | | | | | | |
| SHORT TERM INVESTMENTS (12.51%) | | | | | | | | |
| MONEY MARKET FUND (12.51%) | | | | | | | | |
| Dreyfus Treasury & Agency Cash Management Fund - Institutional Shares, 7-day yield, 1.537% | | | 6,285,392 | | | | 6,285,392 | |
| | | | | | | | | |
| TOTAL SHORT TERM INVESTMENTS | | | | | | | | |
| (Cost $6,285,392) | | | | | | | 6,285,392 | |
| | | | | | | | | |
| TOTAL INVESTMENTS (91.68%) | | | | | | | | |
| (Cost $41,777,997) | | | | | | $ | 46,080,532 | |
| | | | | | | | | |
| Other Assets In Excess Of Liabilities (8.32%) | | | | | | | 4,181,600 | (a) |
| | | | | | | | | |
| NET ASSETS (100.00%) | | | | | | $ | 50,262,132 | |
| (a) | Includes cash which is being held as collateral for futures contracts. |
See Notes to Consolidated Financial Statements.
12
| Aspen Portfolio Strategy Fund | Consolidated Schedule of Investments |
FUTURES CONTRACTS
At April 30, 2018, the Fund had the following outstanding futures contracts:
| Description | | Position | | | Contracts | | | Expiration
Date | | Notional
Value | | | Value and
Unrealized
Appreciation | |
| Commodity Contracts | | | | | | | | | | | | | | | | | | |
| Corn Future(a) | | | Long | | | | 124 | | | 07/13/2018 | | $ | 2,484,650 | | | $ | 51,804 | |
| NY Harbor ULSD Future(a) | | | Long | | | | 27 | | | 05/31/2018 | | | 2,437,306 | | | | 35,322 | |
| Soybean Future(a) | | | Long | | | | 31 | | | 07/13/2018 | | | 1,625,175 | | | | 22,360 | |
| WTI Crude Future(a) | | | Long | | | | 35 | | | 05/22/2018 | | | 2,399,950 | | | | 26,016 | |
| Equity Contracts | | | | | | | | | | | | | | | | | | |
| FTSE 100 Index Future | | | Long | | | | 33 | | | 06/15/2018 | | | 3,389,161 | | | | 97,743 | |
| Nikkei 225 Index Future | | | Long | | | | 31 | | | 06/07/2018 | | | 3,479,750 | | | | 145,279 | |
| Foreign Currency Contracts | | | | | | | | | | | | | | | | | | |
| Australian Dollar Currency Future | | | Short | | | | 84 | | | 06/18/2018 | | | (6,325,200 | ) | | | 24,078 | |
| | | | | | | | | | | | | $ | 9,490,792 | | | $ | 402,602 | |
| Description | | Position | | | Contracts | | | Expiration
Date | | Notional
Value | | | Value and
Unrealized
Depreciation | |
| Commodity Contracts | | | | | | | | | | | | | | | | | | |
| Copper Future(a) | | | Long | | | | 10 | | | 07/27/2018 | | $ | 768,500 | | | $ | (20,033 | ) |
| Gold 100 Oz Future(a) | | | Long | | | | 12 | | | 06/27/2018 | | | 1,583,040 | | | | (33,959 | ) |
| Silver Future(a) | | | Long | | | | 9 | | | 07/27/2018 | | | 738,045 | | | | (10,199 | ) |
| Sugar No. 11 (World) Future(a) | | | Short | | | | 189 | | | 06/29/2018 | | | (2,487,240 | ) | | | (142,553 | ) |
| Equity Contracts | | | | | | | | | | | | | | | | | | |
| EURO STOXX 50 Index Future | | | Short | | | | 41 | | | 06/15/2018 | | | (1,720,034 | ) | | | (37,239 | ) |
| S&P 500 E-Mini Future | | | Long | | | | 109 | | | 06/15/2018 | | | 14,426,150 | | | | (378,684 | ) |
| Foreign Currency Contracts | | | | | | | | | | | | | | | | | | |
| Canadian Dollar Currency Future | | | Long | | | | 41 | | | 06/19/2018 | | | 3,195,540 | | | | (10,087 | ) |
| Euro FX Currency Future | | | Long | | | | 21 | | | 06/18/2018 | | | 3,182,288 | | | | (82,626 | ) |
| Japanese Yen Currency Future | | | Long | | | | 28 | | | 06/18/2018 | | | 3,212,300 | | | | (102,456 | ) |
| Interest Rate Contracts | | | | | | | | | | | | | | | | | | |
| Canadian 10 Year Bond Future | | | Short | | | | 96 | | | 06/20/2018 | | | (9,828,420 | ) | | | (25,938 | ) |
| Euro-Bund Future | | | Short | | | | 34 | | | 06/07/2018 | | | (6,517,613 | ) | | | (55,826 | ) |
| Long Gilt Future | | | Short | | | | 58 | | | 06/27/2018 | | | (9,762,292 | ) | | | (117,866 | ) |
| U.S. 10 Year Treasury Note Future | | | Short | | | | 82 | | | 06/20/2018 | | | (9,809,250 | ) | | | (17,658 | ) |
| | | | | | | | | | | | | $ | (13,018,986 | ) | | $ | (1,035,124 | ) |
Common Abbreviations:
FTSE - Financial Times and the London Stock Exchange
S&P - Standard and Poor's
ULSD - Ultra Low Sulfur Diesel
| (a) | Owned by an entity that is owned by the Fund and is consolidated as described in Note 1 of the Notes to the Consolidated Financial Statements. |
For Fund compliance purposes, the Fund's industry classifications refer to any one or more of the industry sub-classifications used by one or more widely recognized market indexes or ratings group indexes, and/or as defined by Fund management. This definition may not apply for purposes of this report, which may combine industry sub-classifications for reporting ease. Industries are shown as a percentage of net assets.
See Notes to Consolidated Financial Statements.
| Annual Report | April 30, 2018 | 13 |
| Aspen Funds | Consolidated Statements of Assets & Liabilities |
| | | Aspen Managed
Futures Strategy
Fund | | | Aspen Portfolio
Strategy Fund | |
| ASSETS: | | | | | | | | |
| Investments, at value | | $ | 81,999,340 | | | $ | 46,080,532 | |
| Foreign cash due from broker for futures contracts(Cost $– and $248,168) (Note 3) | | | – | | | | 246,547 | |
| Deposit with broker for futures contracts (Note 3) | | | 7,762,766 | | | | 4,087,800 | |
| Receivable for shares sold | | | 11,726 | | | | 144,090 | |
| Interest receivable | | | 11,805 | | | | 7,152 | |
| Prepaid and other assets | | | 5,662 | | | | 10,469 | |
| Total assets | | | 89,791,299 | | | | 50,576,590 | |
| | | | | | | | | |
| LIABILITIES: | | | | | | | | |
| Foreign cash due to broker for futures contracts (Note 3) | | | 574,524 | | | | – | |
| Payable to advisor | | | 55,813 | | | | 27,199 | |
| Payable for investments purchased | | | 3 | | | | 276 | |
| Variation margin payable | | | 134,579 | | | | 201,247 | |
| Payable for shares redeemed | | | 100,079 | | | | – | |
| Payable for administration fees | | | 37,760 | | | | 27,224 | |
| Payable for distribution and service fees | | | | | | | | |
| Class A | | | 3,125 | | | | 1,884 | |
| Payable for transfer agency fees | | | 13,995 | | | | 12,377 | |
| Delegated transfer agent equivalent services fees | | | | | | | | |
| Class A | | | 157 | | | | – | |
| Class I | | | 15,819 | | | | 6,661 | |
| Payable for trustee fees and expenses | | | 1,005 | | | | 546 | |
| Payable for professional fees | | | 30,134 | | | | 25,603 | |
| Payable for chief compliance officer fees | | | 4,912 | | | | 2,669 | |
| Payable for principal financial officer fees | | | 540 | | | | 293 | |
| Payable for licensing fees | | | 18,605 | | | | – | |
| Accrued expenses and other liabilities | | | 13,289 | | | | 8,479 | |
| Total liabilities | | | 1,004,339 | | | | 314,458 | |
| NET ASSETS | | $ | 88,786,960 | | | $ | 50,262,132 | |
| | | | | | | | | |
| NET ASSETS CONSIST OF: | | | | | | | | |
| | | | | | | | | |
| Paid-in capital (Note 5) | | $ | 116,680,030 | | | $ | 47,462,200 | |
| Accumulated net investment loss | | | (367,562 | ) | | | (24,568 | ) |
| Accumulated net realized loss | | | (27,176,061 | ) | | | (843,616 | ) |
| Net unrealized appreciation/(depreciation) | | | (349,447 | ) | | | 3,668,116 | |
| NET ASSETS | | $ | 88,786,960 | | | $ | 50,262,132 | |
| | | | | | | | | |
| INVESTMENTS, AT COST | | $ | 82,082,859 | | | $ | 41,777,997 | |
See Notes to Consolidated Financial Statements.
14
| Aspen Funds | Consolidated Statements of Assets & Liabilities |
| | | Aspen Managed
Futures Strategy
Fund | | | Aspen Portfolio
Strategy Fund | |
| PRICING OF SHARES: | | | | | | | | |
| Class A: | | | | | | | | |
| Net Asset Value, offering and redemption price per share | | $ | 7.85 | | | $ | 25.81 | |
| Net Assets | | $ | 3,452,141 | | | $ | 2,729,664 | |
| Shares of beneficial interest outstanding | | | 439,627 | | | | 105,747 | |
| Maximum offering price per share (NAV/0.9450), based on maximum sales charge of 5.50% of the offering price | | $ | 8.31 | | | $ | 27.31 | |
| | | | | | | | | |
| Class I: | | | | | | | | |
| Net Asset Value, offering and redemption price per share | | $ | 7.99 | | | $ | 25.87 | |
| Net Assets | | $ | 85,334,819 | | | $ | 47,532,469 | |
| Shares of beneficial interest outstanding | | | 10,676,386 | | | | 1,837,591 | |
| See Notes to Consolidated Financial Statements. |
| Annual Report | April 30, 2018 | 15 |
| Aspen Funds | Consolidated Statements of Operations |
For the Year Ended April 30, 2018
| | | Aspen Managed
Futures Strategy
Fund | | | Aspen Portfolio
Strategy Fund | |
| INVESTMENT INCOME: | | | | | | |
| Interest | | $ | 1,049,678 | | | $ | – | |
| Dividends | | | 90,544 | | | | 799,750 | |
| Total investment income | | | 1,140,222 | | | | 799,750 | |
| | | | | | | | | |
| EXPENSES: | | | | | | | | |
| Investment advisory fees (Note 6) | | | 920,192 | | | | 473,083 | |
| Investment advisory fees - subsidiary (Note 6) | | | 118,827 | | | | 13,170 | |
| Administrative fees | | | 232,293 | | | | 118,908 | |
| Distribution and service fees | | | | | | | | |
| Class A | | | 23,067 | | | | 6,059 | |
| Transfer agency fees | | | 64,288 | | | | 49,860 | |
| Delegated transfer agent equivalent services fees | | | | | | | | |
| Class A | | | 819 | | | | – | |
| Class I | | | 90,551 | | | | 28,138 | |
| Professional fees | | | 36,068 | | | | 28,003 | |
| Offering costs | | | – | | | | 48,967 | |
| Custodian fees | | | 11,454 | | | | 9,577 | |
| Trustee fees and expenses | | | 15,012 | | | | 13,573 | |
| Principal financial officer fees | | | 3,513 | | | | 1,487 | |
| Chief compliance officer fees | | | 32,012 | | | | 12,844 | |
| Licensing fees | | | 306,731 | | | | – | |
| Other | | | 64,181 | | | | 42,079 | |
| Total expenses before waiver/reimbursement | | | 1,919,008 | | | | 845,748 | |
| Waiver of investment advisory fees | | | – | | | | (93,224 | ) |
| Waiver of investment advisory fees - subsidiary (Note 6) | | | (118,827 | ) | | | (13,170 | ) |
| Total net expenses | | | 1,800,181 | | | | 739,354 | |
| NET INVESTMENT INCOME/(LOSS) | | | (659,959 | ) | | | 60,396 | |
| | | | | | | | | |
| Net realized gain/(loss) on investments | | | (53,018 | ) | | | 985 | |
| Net realized loss on futures contracts | | | (4,914,905 | ) | | | (22,118 | ) |
| Net realized gain/(loss) on foreign currency transactions | | | (253,967 | ) | | | 32,019 | |
| Total net realized gain/(loss) | | | (5,221,890 | ) | | | 10,886 | |
| Net change in unrealized appreciation of investments | | | 64,154 | | | | 3,678,102 | |
| Net change in unrealized appreciation/(depreciation) on futures contracts | | | 2,236,408 | | | | (651,297 | ) |
| Net change in unrealized depreciation on translation of assets and liabilities denominated in foreign currency transactions | | | (51,962 | ) | | | (4,306 | ) |
| Net change in unrealized appreciation | | | 2,248,600 | | | | 3,022,499 | |
| NET REALIZED AND UNREALIZED GAIN/(LOSS) ON INVESTMENTS | | | (2,973,290 | ) | | | 3,033,385 | |
| NET INCREASE/(DECREASE) IN NET ASSETS RESULTING FROM OPERATIONS | | $ | (3,633,249 | ) | | $ | 3,093,781 | |
See Notes to Consolidated Financial Statements.
16
| Aspen Managed Futures Strategy Fund | Consolidated Statements of Changes in Net Assets |
| | | For the
Year Ended
April 30, 2018 | | | For the
Year Ended
April 30, 2017 | |
| OPERATIONS: | | | | | | |
| Net investment loss | | $ | (659,959 | ) | | $ | (1,929,803 | ) |
| Net realized loss | | | (5,221,890 | ) | | | (7,661,403 | ) |
| Net change in unrealized appreciation/(depreciation) | | | 2,248,600 | | | | (7,772,050 | ) |
| Net decrease in net assets resulting from operations | | | (3,633,249 | ) | | | (17,363,256 | ) |
| | | | | | | | | |
| DISTRIBUTIONS TO SHAREHOLDERS (Note 4): | | | | | | | | |
| From net investment income | | | | | | | | |
| Class A | | | – | | | | (87,401 | ) |
| Class I | | | – | | | | (2,130,729 | ) |
| Net decrease in net assets from distributions | | | – | | | | (2,218,130 | ) |
| | | | | | | | | |
| SHARE TRANSACTIONS (Note 5): | | | | | | | | |
| Class A | | | | | | | | |
| Proceeds from sales of shares | | | 1,957,143 | | | | 5,709,455 | |
| Distributions reinvested | | | – | | | | 77,296 | |
| Cost of shares redeemed | | | (4,685,659 | ) | | | (18,518,215 | ) |
| Redemption fees | | | 40 | | | | 2,337 | |
| Class I | | | | | | | | |
| Proceeds from sales of shares | | | 36,658,111 | | | | 67,326,891 | |
| Distributions reinvested | | | – | | | | 1,277,264 | |
| Cost of shares redeemed | | | (142,925,441 | ) | | | (119,175,878 | ) |
| Redemption fees | | | 7,858 | | | | 9,991 | |
| Net decrease from share transactions | | | (108,987,948 | ) | | | (63,290,859 | ) |
| | | | | | | | | |
| Net decrease in net assets | | | (112,621,197 | ) | | | (82,872,245 | ) |
| | | | | | | | | |
| NET ASSETS: | | | | | | | | |
| Beginning of period | | | 201,408,157 | | | | 284,280,402 | |
| End of period* | | $ | 88,786,960 | | | $ | 201,408,157 | |
| *Includes accumulated net investment loss of: | | $ | (367,562 | ) | | $ | (592,781 | ) |
| | | | | | | | | |
| Other Information: | | | | | | | | |
| SHARE TRANSACTIONS: | | | | | | | | |
| Class A | | | | | | | | |
| Sold | | | 244,494 | | | | 657,148 | |
| Distributions reinvested | | | – | | | | 8,695 | |
| Redeemed | | | (584,494 | ) | | | (2,116,176 | ) |
| Net decrease in shares outstanding | | | (340,000 | ) | | | (1,450,333 | ) |
| | | | | | | | | |
| Class I | | | | | | | | |
| Sold | | | 4,482,058 | | | | 7,602,448 | |
| Distributions reinvested | | | – | | | | 141,447 | |
| Redeemed | | | (17,442,220 | ) | | | (13,558,549 | ) |
| Net decrease in shares outstanding | | | (12,960,162 | ) | | | (5,814,654 | ) |
See Notes to Consolidated Financial Statements.
| Annual Report | April 30, 2018 | 17 |
| Aspen Portfolio Strategy Fund | Consolidated Statements of Changes in Net Assets |
| | For the
Year Ended
April 30, 2018 | | | For the Period December 29, 2016
(Commencement) to April 30, 2017 | |
| OPERATIONS: | | | | | | |
| Net investment income/(loss) | | $ | 60,396 | | | $ | (2,905 | ) |
| Net realized gain/(loss) | | | 10,886 | | | | (1,514,647 | ) |
| Net change in unrealized appreciation | | | 3,022,499 | | | | 645,617 | |
| Net increase/(decrease) in net assets resulting from operations | | | 3,093,781 | | | | (871,935 | ) |
| | | | | | | | | |
| DISTRIBUTIONS TO SHAREHOLDERS (Note 4): | | | | | | | | |
| From net investment income | | | | | | | | |
| Class A | | | (10,269 | ) | | | – | |
| Class I | | | (268,936 | ) | | | – | |
| From net realized gains on investments | | | | | | | | |
| Class A | | | (34,580 | ) | | | – | |
| Class I | | | (612,820 | ) | | | – | |
| Net decrease in net assets from distributions | | | (926,605 | ) | | | – | |
| | | | | | | | | |
| SHARE TRANSACTIONS (Note 5): | | | | | | | | |
| Class A | | | | | | | | |
| Proceeds from sales of shares | | | 717,112 | | | | 4,346,888 | |
| Distributions reinvested | | | 44,794 | | | | – | |
| Cost of shares redeemed | | | (345,910 | ) | | | (2,024,348 | ) |
| Class I | | | | | | | | |
| Proceeds from sales of shares | | | 9,638,520 | | | | 42,535,105 | |
| Distributions reinvested | | | 767,869 | | | | – | |
| Cost of shares redeemed | | | (6,046,036 | ) | | | (669,987 | ) |
| Redemption fees | | | 284 | | | | 2,600 | |
| Net increase from share transactions | | | 4,776,633 | | | | 44,190,258 | |
| | | | | | | | | |
| Net increase in net assets | | | 6,943,809 | | | | 43,318,323 | |
| | | | | | | | | |
| NET ASSETS: | | | | | | | | |
| Beginning of period | | | 43,318,323 | | | | – | |
| End of period* | | $ | 50,262,132 | | | $ | 43,318,323 | |
| *Includes accumulated net investment income/(loss) of: | | $ | (24,568 | ) | | $ | 62,516 | |
| | | | | | | | | |
| Other Information: | | | | | | | | |
| SHARE TRANSACTIONS: | | | | | | | | |
| Class A | | | | | | | | |
| Sold | | | 27,302 | | | | 173,467 | |
| Distributions reinvested | | | 1,679 | | | | – | |
| Redeemed | | | (13,079 | ) | | | (83,622 | ) |
| Net increase in shares outstanding | | | 15,902 | | | | 89,845 | |
| | | | | | | | | |
| Class I | | | | | | | | |
| Sold | | | 361,712 | | | | 1,707,193 | |
| Distributions reinvested | | | 28,731 | | | | – | |
| Redeemed | | | (232,745 | ) | | | (27,300 | ) |
| Net increase in shares outstanding | | | 157,698 | | | | 1,679,893 | |
See Notes to Consolidated Financial Statements.
18
| Aspen Managed Futures Strategy Fund – Class A | Consolidated Financial Highlights |
For a share outstanding throughout the periods presented.
| | | For the Year Ended April 30, 2018 (a) | | For the Year Ended April 30, 2017 (a) | | For the Year Ended April 30, 2016 (a) | | For the Year Ended April 30, 2015 (a) | | For the Year Ended April 30, 2014 (a) | |
| NET ASSET VALUE, BEGINNING OF PERIOD | | $ | 8.12 | | $ | 8.83 | | $ | 10.01 | | $ | 8.97 | | $ | 9.29 | |
| INCOME/(LOSS) FROM OPERATIONS: | | | | | | | | | | | | | | | | |
| Net investment loss(b) | | | (0.06 | ) | | (0.04 | ) | | (0.12 | ) | | (0.14 | ) | | (0.16 | ) |
| Net realized and unrealized gain/(loss) on investments | | | (0.21 | ) | | (0.57 | ) | | (0.39 | ) | | 1.39 | | | (0.05 | ) |
| Total from investment operations | | | (0.27 | ) | | (0.61 | ) | | (0.51 | ) | | 1.25 | | | (0.21 | ) |
| LESS DISTRIBUTIONS: | | | | | | | | | | | | | | | | |
| From net investment income | | | – | | | (0.10 | ) | | (0.14 | ) | | – | | | – | |
| Distributions from net realized gain on investments | | | – | | | – | | | (0.53 | ) | | (0.21 | ) | | (0.12 | ) |
| Total distributions | | | – | | | (0.10 | ) | | (0.67 | ) | | (0.21 | ) | | (0.12 | ) |
| REDEMPTION FEES ADDED TO PAID IN CAPITAL | | | 0.00 | (c) | | 0.00 | (c) | | 0.00 | (c) | | 0.00 | (c) | | 0.01 | |
| INCREASE/(DECREASE) IN NET ASSET VALUE | | | (0.27 | ) | | (0.71 | ) | | (1.18 | ) | | 1.04 | | | (0.32 | ) |
| NET ASSET VALUE, END OF PERIOD | | $ | 7.85 | | $ | 8.12 | | $ | 8.83 | | $ | 10.01 | | $ | 8.97 | |
| | | | | | | | | | | | | | | | | |
| TOTAL RETURN(d) | | | (3.33 | %) | | (6.97 | %) | | (5.20 | %) | | 14.00 | % | | (2.15 | %) |
| | | | | | | | | | | | | | | | | |
| RATIOS AND SUPPLEMENTAL DATA: | | | | | | | | | | | | | | | | |
| Net assets, end of period (000's) | | $ | 3,452 | | $ | 6,331 | | $ | 19,682 | | $ | 23,850 | | $ | 12,914 | |
| | | | | | | | | | | | | | | | | |
| RATIOS TO AVERAGE NET ASSETS: | | | | | | | | | | | | | | | | |
| Operating expenses excluding fee waivers/reimbursements | | | 1.66 | %(e) | | 1.00 | %(e) | | 1.56 | %(e) | | 1.64 | % | | 1.83 | % |
| Operating expenses including fee waivers/reimbursements | | | 1.66 | % | | 1.00 | % | | 1.56 | % | | 1.64 | % | | 1.83 | % |
| Net investment loss including fee waivers/reimbursements | | | (0.72 | %) | | (0.52 | %) | | (1.24 | %) | | (1.50 | %) | | (1.72 | %) |
| | | | | | | | | | | | | | | | | |
| PORTFOLIO TURNOVER RATE | | | 0 | % | | 31 | % | | 58 | % | | 38 | % | | 90 | % |
| (a) | Per share amounts and ratios to average net assets include income and expenses of the Aspen Futures Fund Ltd. (subsidiary), exclusive of the subsidiary's management fee. |
| (b) | Per share numbers have been calculated using the average shares method. |
| (c) | Less than $0.005 per share. |
| (d) | Total return does not reflect the effect of sales charges. |
| (e) | The ratio of operating expenses excluding fee waiver/reimbursements to average net assets is calculated excluding the waived Subsidiary management fee (see Note 6 for additional detail). The ratio inclusive of that fee would be 1.76%, 1.07% and 1.64% for the years ended April 30, 2018, April 30, 2017 and April 30, 2016, respectively. |
See Notes to Consolidated Financial Statements.
| Annual Report | April 30, 2018 | 19 |
| Aspen Managed Futures Strategy Fund – Class I | Consolidated Financial Highlights |
For a share outstanding throughout the periods presented.
| | | For the Year Ended April 30, 2018 (a) | | For the Year Ended April 30, 2017 (a) | | For the Year Ended April 30, 2016 (a) | | For the Year Ended April 30, 2015 (a) | | For the Year Ended April 30, 2014 (a) | |
| NET ASSET VALUE, BEGINNING OF PERIOD | | $ | 8.25 | | $ | 8.98 | | $ | 10.17 | | $ | 9.07 | | $ | 9.36 | |
| INCOME/(LOSS) FROM OPERATIONS: | | | | | | | | | | | | | | | | |
| Net investment loss(b) | | | (0.04 | ) | | (0.07 | ) | | (0.09 | ) | | (0.11 | ) | | (0.11 | ) |
| Net realized and unrealized gain/(loss) on investments | | | (0.22 | ) | | (0.58 | ) | | (0.40 | ) | | 1.42 | | | (0.06 | ) |
| Total from investment operations | | | (0.26 | ) | | (0.65 | ) | | (0.49 | ) | | 1.31 | | | (0.17 | ) |
| LESS DISTRIBUTIONS: | | | | | | | | | | | | | | | | |
| From net investment income | | | – | | | (0.08 | ) | | (0.17 | ) | | – | | | – | |
| Distributions from net realized gain on investments | | | – | | | – | | | (0.53 | ) | | (0.21 | ) | | (0.12 | ) |
| Total distributions | | | – | | | (0.08 | ) | | (0.70 | ) | | (0.21 | ) | | (0.12 | ) |
| REDEMPTION FEES ADDED TO PAID IN CAPITAL | | | 0.00 | (c) | | 0.00 | (c) | | 0.00 | (c) | | 0.00 | (c) | | 0.00 | (c) |
| INCREASE/(DECREASE) IN NET ASSET VALUE | | | (0.26 | ) | | (0.73 | ) | | (1.19 | ) | | 1.10 | | | (0.29 | ) |
| NET ASSET VALUE, END OF PERIOD | | $ | 7.99 | | $ | 8.25 | | $ | 8.98 | | $ | 10.17 | | $ | 9.07 | |
| | | | | | | | | | | | | | | | | |
| TOTAL RETURN | | | (3.15 | %) | | (7.33 | %) | | (4.97 | %) | | 14.51 | % | | (1.81 | %) |
| | | | | | | | | | | | | | | | | |
| RATIOS AND SUPPLEMENTAL DATA: | | | | | | | | | | | | | | | | |
| Net assets, end of period (000's) | | $ | 85,335 | | $ | 195,077 | | $ | 264,598 | | $ | 242,575 | | $ | 167,258 | |
| | | | | | | | | | | | | | | | | |
| RATIOS TO AVERAGE NET ASSETS: | | | | | | | | | | | | | | | | |
| Operating expenses excluding fee waivers/reimbursements | | | 1.46 | %(d) | | 1.28 | %(d) | | 1.22 | %(d) | | 1.25 | % | | 1.30 | % |
| Operating expenses including fee waivers/reimbursements | | | 1.46 | % | | 1.28 | % | | 1.22 | % | | 1.25 | % | | 1.30 | % |
| Net investment loss including fee waivers/reimbursements | | | (0.53 | %) | | (0.78 | %) | | (0.94 | %) | | (1.11 | %) | | (1.20 | %) |
| | | | | | | | | | | | | | | | | |
| PORTFOLIO TURNOVER RATE | | | 0 | % | | 31 | % | | 58 | % | | 38 | % | | 90 | % |
| (a) | Per share amounts and ratios to average net assets include income and expenses of the Aspen Futures Fund Ltd. (subsidiary), exclusive of the subsidiary's management fee. |
| (b) | Per share numbers have been calculated using the average shares method. |
| (c) | Less than $0.005 per share. |
| (d) | The ratio of operating expenses excluding fee waiver/reimbursements to average net assets is calculated excluding the waived Subsidiary management fee (see Note 6 for additional detail). The ratio inclusive of that fee would be 1.56%, 1.35% and 1.30% for the years ended April 30, 2018, April 30, 2017 and April 30, 2016, respectively. |
See Notes to Consolidated Financial Statements.
20
| Aspen Portfolio Strategy Fund – Class A | Consolidated Financial Highlights |
For a share outstanding throughout the periods presented.
| | | For the
Year Ended
April 30 , 2018(a) | | | For the
Period Ended
April 30, 2017(a)(b) | |
| NET ASSET VALUE, BEGINNING OF PERIOD | | $ | 24.45 | | | $ | 25.00 | |
| INCOME/(LOSS) FROM OPERATIONS: | | | | | | | | |
| Net investment loss(c) | | | (0.02 | )(d) | | | (0.03 | ) |
| Net realized and unrealized gain/(loss) on investments | | | 1.86 | | | | (0.52 | ) |
| Total from investment operations | | | 1.84 | | | | (0.55 | ) |
| LESS DISTRIBUTIONS: | | | | | | | | |
| From net investment income | | | (0.11 | ) | | | – | |
| Distributions from net realized gain on investments | | | (0.37 | ) | | | – | |
| Total distributions | | | (0.48 | ) | | | – | |
| INCREASE/(DECREASE) IN NET ASSET VALUE | | | 1.36 | | | | (0.55 | ) |
| NET ASSET VALUE, END OF PERIOD | | $ | 25.81 | | | $ | 24.45 | |
| | | | | | | | | |
| TOTAL RETURN(e) | | | 7.44 | % | | | (2.20 | %)(f) |
| | | | | | | | | |
| RATIOS AND SUPPLEMENTAL DATA: | | | | | | | | |
| Net assets, end of period (000's) | | $ | 2,730 | | | $ | 2,196 | |
| | | | | | | | | |
| RATIOS TO AVERAGE NET ASSETS: | | | | | | | | |
| Operating expenses excluding fee waivers/reimbursements | | | 1.93 | %(g) | | | 2.79 | %(g)(h) |
| Operating expenses including fee waivers/reimbursements | | | 1.79 | % | | | 1.95 | %(h) |
| Net investment loss including fee waivers/reimbursements | | | (0.09 | %) | | | (0.40 | %)(h) |
| | | | | | | | | |
| PORTFOLIO TURNOVER RATE | | | 0 | % | | | 0 | %(f)(i) |
| (a) | Per share amounts and ratios to average net assets include income and expenses of the Aspen Portfolio Strategy Fund Ltd. (subsidiary), exclusive of the subsidiary's management fee. |
| (b) | The Aspen Portfolio Strategy Fund is for the period from December 29, 2016 (commencement of operations) to April 30, 2017. |
| (c) | Per share numbers have been calculated using the average shares method. |
| (d) | The amount shown for a share outstanding throughout the period may not correlate with the Statement of Operations for the period due to the timing of sales and redemptions of Fund shares in relation to income earned and/or fluctuating market value of the investments of the Fund. |
| (e) | Total return does not reflect the effect of sales charges. |
| (g) | The ratio of operating expenses excluding fee waiver/reimbursements to average net assets is calculated excluding the waived Subsidiary management fee (see Note 6 for additional detail). The ratio inclusive of that fee would be 1.96% and 2.82% for the year ended April 30, 2018 and for the period ended April 30, 2017, respectively. |
See Notes to Consolidated Financial Statements.
| Annual Report | April 30, 2018 | 21 |
| Aspen Portfolio Strategy Fund – Class I | Consolidated Financial Highlights |
For a share outstanding throughout the periods presented.
| | | For the
Year Ended
April 30, 2018(a) | | | For the
Period Ended
April 30, 2017(a)(b) | |
| NET ASSET VALUE, BEGINNING OF PERIOD | | $ | 24.48 | | | $ | 25.00 | |
| INCOME/(LOSS) FROM OPERATIONS: | | | | | | | | |
| Net investment income(c) | | | 0.04 | | | | 0.00 | (d)(e) |
| Net realized and unrealized gain/(loss) on investments | | | 1.88 | | | | (0.52 | ) |
| Total from investment operations | | | 1.92 | | | | (0.52 | ) |
| LESS DISTRIBUTIONS: | | | | | | | | |
| From net investment income | | | (0.16 | ) | | | – | |
| Distributions from net realized gain on investments | | | (0.37 | ) | | | – | |
| Total distributions | | | (0.53 | ) | | | – | |
| REDEMPTION FEES ADDED TO PAID IN CAPITAL | | | 0.00 | (d) | | | 0.00 | (d) |
| INCREASE/(DECREASE) IN NET ASSET VALUE | | | 1.39 | | | | (0.52 | ) |
| NET ASSET VALUE, END OF PERIOD | | $ | 25.87 | | | $ | 24.48 | |
| | | | | | | | | |
| TOTAL RETURN | | | 7.76 | % | | | (2.08 | %)(f) |
| | | | | | | | | |
| RATIOS AND SUPPLEMENTAL DATA: | | | | | | | | |
| Net assets, end of period (000's) | | $ | 47,532 | | | $ | 41,122 | |
| | | | | | | | | |
| RATIOS TO AVERAGE NET ASSETS: | | | | | | | | |
| Operating expenses excluding fee waivers/reimbursements | | | 1.75 | %(g) | | | 2.22 | %(g)(h) |
| Operating expenses including fee waivers/reimbursements | | | 1.55 | % | | | 1.55 | %(h) |
| Net investment income including fee waivers/reimbursements | | | 0.14 | % | | | 0.01 | %(h) |
| | | | | | | | | |
| PORTFOLIO TURNOVER RATE | | | 0 | % | | | 0 | %(f)(i) |
| (a) | Per share amounts and ratios to average net assets include income and expenses of the Aspen Portfolio Strategy Fund Ltd. (subsidiary), exclusive of the subsidiary's management fee. |
| (b) | The Aspen Portfolio Strategy Fund is for the period from December 29, 2016 (commencement of operations) to April 30, 2017. |
| (c) | Per share numbers have been calculated using the average shares method. |
| (d) | Less than $0.005 per share. |
| (e) | The amount shown for a share outstanding throughout the period may not correlate with the Statement of Operations for the period due to the timing of sales and redemptions of Fund shares in relation to income earned and/or fluctuating market value of the investments of the Fund. |
| (g) | The ratio of operating expenses excluding fee waiver/reimbursements to average net assets is calculated excluding the waived Subsidiary management fee (see Note 6 for additional detail). The ratio inclusive of that fee would be 1.78% and 2.25% for the year ended April 30, 2018 and for the period ended April 30, 2017, respectively. |
See Notes to Consolidated Financial Statements.
22
| Aspen Funds | Notes to Consolidated Financial Statements |
April 30, 2018
1. ORGANIZATION
Financial Investors Trust (the “Trust”), a Delaware statutory trust, is an open-end management investment company registered under the Investment Company Act of 1940, as amended (“1940 Act”). As of October 31, 2017, the Trust consists of multiple separate portfolios or series. This annual report describes the Aspen Managed Futures Strategy Fund and the Aspen Portfolio Strategy Fund (individually a “Fund” and collectively, the “Funds”). The Aspen Managed Futures Strategy Fund seeks investment results that replicate as closely as possible, before fees and expenses, the price and yield performance of the Aspen Managed Futures Beta Index (the “MFBI” or “Index”). The Aspen Portfolio Strategy Fund seeks long-term capital appreciation. The Funds offer Class A and Class I shares.
Basis of Consolidation
Aspen Futures Fund, Ltd. (the “Aspen Fund Subsidiary”), a Cayman Islands exempted company, is a wholly owned subsidiary of the Aspen Managed Futures Strategy Fund and Aspen Portfolio Strategy Fund, Ltd. (the “Aspen Portfolio Subsidiary”), a Cayman Islands exempted company, is a wholly owned subsidiary of the Aspen Portfolio Strategy Fund. The investment objective of both the Aspen Fund Subsidiary and the Aspen Portfolio Subsidiary (collectively the “Subsidiaries”) is designed to enhance the ability of the Funds to obtain exposure to equities, financial, currency and commodities markets consistent with the limits of the U.S. federal tax law requirements applicable to registered investment companies. The Subsidiaries are subject to substantially the same investment policies and investment restrictions as the Funds. The Subsidiaries act as an investment vehicle for the Funds in order to effect certain commodity-related investments on behalf of the Funds. Investments in the Subsidiaries are expected to provide the Funds with exposure to the commodity markets within the limitations of Subchapter M of the Internal Revenue Code of 1986, as amended (the “Code”), and recent IRS revenue rulings, as discussed below under “Federal Income Taxes”. The Funds are the sole shareholder of the Subsidiaries pursuant to a subscription agreement dated as of August 2, 2011 for the Aspen Fund Subsidiary and December 16, 2016 for the Aspen Portfolio Subsidiary and it is intended that each Fund will remain the sole shareholder and will continue to control the Subsidiaries. Under the Articles of Association of the Subsidiaries, shares issued by the Subsidiaries confers upon a shareholder the right to wholly own and vote at general meetings of the Subsidiaries and certain rights in connection with any winding-up or repayment of capital, as well as the right to participate in the profits or assets of the Subsidiaries. Each Fund may invest up to 25% of their total assets in shares of the Subsidiaries. All investments held by the Subsidiaries are disclosed in the accounts of each Fund. As a wholly owned subsidiary of the Funds, all assets and liabilities, income and expenses of the Subsidiaries are consolidated in the financial statements and financial highlights of the Funds. All investments held by the Subsidiaries are disclosed in the accounts of the Funds. As of April 30, 2018, net assets of the Aspen Managed Futures Strategy Fund were $88,786,960, of which net assets of $15,592,443 or 17.56%, represented the Fund’s ownership of all issued shares and voting rights of the Aspen Fund Subsidiary. As of April 30, 2018, net assets of the Aspen Portfolio Strategy Fund were $50,262,132, of which $1,535,385 or 3.05%, represented the Fund's ownership of all issued shares and voting rights of the Aspen Portfolio Subsidiary.
2. SIGNIFICANT ACCOUNTING POLICIES
The accompanying financial statements were prepared in accordance with accounting principles generally accepted in the United States of America (“U.S. GAAP”). The preparation of financial statements in conformity with U.S. GAAP requires management to make certain estimates and assumptions that affect the reported amounts of assets and liabilities and disclosures of contingent assets and liabilities at the date of the financial statements and the reported amounts of revenue and expenses during the period. Actual results could differ from those estimates. The Funds are considered an investment company for financial reporting purposes under U.S. GAAP and follows the accounting and reporting guidance applicable to investment companies in the Financial Accounting Standards Board Accounting Standards Codification Topic 946. The following is a summary of significant accounting policies consistently followed by the Funds and Subsidiaries in preparation of the financial statements.
Investment Valuation: The Funds generally value their securities based on market prices determined at the close of regular trading on the New York Stock Exchange (“NYSE”), normally 4:00 p.m. Eastern Time, on each day the NYSE is open for trading.
For equity securities and mutual funds that are traded on an exchange, the market price is usually the closing sale or official closing price on that exchange. In the case of equity securities not traded on an exchange, or if such closing prices are not otherwise available, the securities are valued at the mean of the most recent bid and ask prices on such day. Redeemable securities issued by open-end registered investment companies are valued at the investment company’s applicable net asset value, with the exception of exchange-traded open-end investment companies, which are priced as equity securities.
The market price for debt obligations is generally the price supplied by an independent third-party pricing service approved by the Board of Trustees (the “Board”), which may use a matrix, formula or other objective method that takes into consideration quotations from dealers, market transactions in comparable investments, market indices and yield curves. If vendors are unable to supply a price, or if the price supplied is deemed to be unreliable, the market price may be determined using quotations received from one or more brokers–dealers that make a market in the security.
| Annual Report | April 30, 2018 | 23 |
| Aspen Funds | Notes to Consolidated Financial Statements |
Futures contracts that are listed or traded on a national securities exchange, commodities exchange, contract market or comparable over-the-counter market, and that are freely transferable, are valued at their closing settlement price on the exchange on which they are primarily traded or based upon the current settlement price for a like instrument acquired on the day on which the instrument is being valued. A settlement price may not be used if the market makes a limit move with respect to a particular commodity.
Forward currency exchange contracts have a fair value determined by the prevailing foreign currency exchange daily rates and current foreign currency exchange forward rates. The foreign currency exchange forward rates are calculated using an automated system that estimates rates on the basis of the current day foreign currency exchange rates and forward foreign currency exchange rates supplied by a pricing service.
Investment securities that are primarily traded on foreign securities exchanges are valued at the preceding closing values of such securities on their respective exchanges, except when an occurrence subsequent to the time a value was so established is likely to have changed such value. In such an event, the fair value of those securities are determined in good faith through consideration of other factors in accordance with procedures established by and under the general supervision of the Board.
When such prices or quotations are not available, or when Aspen Partners, Ltd. (the “Adviser”) believes that they are unreliable, securities may be priced using fair value procedures approved by the Board.
Fair Value Measurements: The Funds disclose the classification of their fair value measurements following a three-tier hierarchy based on the inputs used to measure fair value. Inputs refer broadly to the assumptions that market participants would use in pricing the asset or liability, including assumptions about risk. Inputs may be observable or unobservable. Observable inputs reflect the assumptions market participants would use in pricing the asset or liability that are developed based on market data obtained from sources independent of the reporting entity. Unobservable inputs reflect the reporting entity’s own assumptions about the assumptions market participants would use in pricing the asset or liability that are developed based on the best information available.
Various inputs are used in determining the value of each of the Funds’ investments as of the end of the reporting period. When inputs used fall into different levels of the fair value hierarchy, the level in the hierarchy within which the fair value measurement falls is determined based on the lowest level input that is significant to the fair value measurement in their entirety. The designated input levels are not necessarily an indication of the risk or liquidity associated with these investments. These inputs are categorized in the following hierarchy under applicable financial accounting standards:
| Level 1 – | Unadjusted quoted prices in active markets for identical investments, unrestricted assets or liabilities that the Funds have the ability to access at the measurement date; |
| Level 2 – | Quoted prices which are not active, quoted prices for similar assets or liabilities in active markets or inputs other than quoted prices that are observable (either directly or indirectly) for substantially the full term of the asset or liability; and |
| Level 3 – | Significant unobservable prices or inputs (including the Funds’ own assumptions in determining the fair value of investments) where there is little or no market activity for the asset or liability at the measurement date. |
| Aspen Funds | Notes to Consolidated Financial Statements |
The following is a summary of each input used to value the Funds as of April 30, 2018:
Aspen Managed Futures Strategy Fund
| Investments in Securities at Value | | Level 1 -
Quoted Prices | | | Level 2 -
Other Significant Observable Inputs | | | Level 3 -
Significant Unobservable Inputs | | | Total | |
| Short Term Investments | | | | | | | | | | | | | | | | |
| Money Market Fund | | | 7,721,143 | | | | – | | | | – | | | | 7,721,143 | |
| U.S. Treasury Bills | | | – | | | | 74,278,197 | | | | – | | | | 74,278,197 | |
| TOTAL | | $ | 7,721,143 | | | $ | 74,278,197 | | | $ | – | | | $ | 81,999,340 | |
| Other Financial Instruments | | | | | | | | | | | | | | | | |
| Assets: | | | | | | | | | | | | | | | | |
| Futures Contracts | | | | | | | | | | | | | | | | |
| Commodity Contracts | | $ | 119,102 | | | $ | – | | | $ | – | | | $ | 119,102 | |
| Equity Contracts | | | 326,075 | | | | – | | | | – | | | | 326,075 | |
| Foreign Currency Contracts | | | 468,032 | | | | – | | | | – | | | | 468,032 | |
| Liabilities: | | | | | | | | | | | | | | | | |
| Futures Contracts | | | | | | | | | | | | | | | | |
| Commodity Contracts | | | (294,633 | ) | | | – | | | | – | | | | (294,633 | ) |
| Equity Contracts | | | (97,444 | ) | | | – | | | | – | | | | (97,444 | ) |
| Foreign Currency Contracts | | | (467,404 | ) | | | – | | | | – | | | | (467,404 | ) |
| Interest Rate Contracts | | | (332,952 | ) | | | – | | | | – | | | | (332,952 | ) |
| TOTAL | | $ | (279,224 | ) | | $ | – | | | $ | – | | | $ | (279,224 | ) |
Aspen Portfolio Strategy Fund
| Investments in Securities at Value | | Level 1 -
Quoted Prices | | | Level 2 -
Other Significant Observable Inputs | | | Level 3 -
Significant Unobservable Inputs | | | Total | |
| Exchange Traded Funds | | $ | 39,795,140 | | | $ | – | | | $ | – | | | $ | 39,795,140 | |
| Short Term Investments | | | 6,285,392 | | | | – | | | | – | | | | 6,285,392 | |
| TOTAL | | $ | 46,080,532 | | | $ | – | | | $ | – | | | $ | 46,080,532 | |
| Other Financial Instruments | | | | | | | | | | | | | | | | |
| Assets: | | | | | | | | | | | | | | | | |
| Futures Contracts | | | | | | | | | | | | | | | | |
| Commodity Contracts | | $ | 135,502 | | | $ | – | | | $ | – | | | $ | 135,502 | |
| Equity Contracts | | | 243,022 | | | | – | | | | – | | | | 243,022 | |
| Foreign Currency Contracts | | | 24,078 | | | | – | | | | – | | | | 24,078 | |
| Liabilities: | | | | | | | | | | | | | | | | |
| Futures Contracts | | | | | | | | | | | | | | | | |
| Commodity Contracts | | | (206,744 | ) | | | – | | | | – | | | | (206,744 | ) |
| Equity Contracts | | | (415,923 | ) | | | – | | | | – | | | | (415,923 | ) |
| Foreign Currency Contracts | | | (195,169 | ) | | | – | | | | – | | | | (195,169 | ) |
| Interest Rate Contracts | | | (217,288 | ) | | | – | | | | – | | | | (217,288 | ) |
| TOTAL | | $ | (632,522 | ) | | $ | – | | | $ | – | | | $ | (632,522 | ) |
The Funds recognize transfers between levels as of the end of the period. For the year ended April 30, 2018, the Funds did not have any transfers between Level 1 and Level 2 securities. For the year ended April 30, 2018, the Funds did not have any securities that used significant unobservable inputs (Level 3) in determining fair value.
| Annual Report | April 30, 2018 | 25 |
| Aspen Funds | Notes to Consolidated Financial Statements |
April 30, 2018
Investment Transactions and Investment Income: Investment transactions are accounted for on the date the investments are purchased or sold (trade date). Realized gains and losses from investment transactions are reported on an identified cost basis, which is the same basis the Funds use for federal income tax purposes. Interest income, which includes accretion of discounts, is accrued and recorded as earned. Dividend income is recognized on the ex-dividend date or for certain foreign securities, as soon as information is available to the Funds. All of the realized and unrealized gains and losses and net investment income, are allocated daily to each class in proportion to their average daily net assets.
Foreign Securities: The Funds may directly purchase securities of foreign issuers. Investing in securities of foreign issuers involves special risks not typically associated with investing in securities of U.S. issuers. The risks include possible reevaluation of currencies, the inability to repatriate foreign currency, less complete financial information about companies and possible future adverse political and economic developments. Moreover, securities of many foreign issuers and their markets may be less liquid and their prices more volatile than those of securities of comparable U.S. issuers.
Foreign Currency Translation: The books and records of the Funds are maintained in U.S. dollars. Investment valuations and other assets and liabilities initially expressed in foreign currencies are converted each business day into U.S. dollars based upon current exchange rates. Prevailing foreign exchange rates may generally be obtained at the close of the NYSE (normally, 4:00 p.m. Eastern Time). The portion of realized and unrealized gains or losses on investments due to fluctuations in foreign currency exchange rates is not separately disclosed and is included in realized and unrealized gains or losses on investments, when applicable.
Foreign Currency Spot Contracts: The Funds may enter into foreign currency spot contracts to facilitate transactions in foreign securities or to convert foreign currency receipts into U.S. dollars. A foreign currency spot contract is an agreement between two parties to buy and sell currencies at the current market rate, for settlement generally within two business days. The U.S. dollar value of the contracts is determined using current currency exchange rates supplied by a pricing service. The contract is marked-to-market daily for settlements beyond one day and any change in market value is recorded as an unrealized gain or loss. When the contract is closed, the Funds record a realized gain or loss equal to the difference between the value on the open and close date. Losses may arise from changes in the value of the foreign currency, or if the counterparties do not perform under the contract’s terms. The maximum potential loss from such contracts is the aggregate face value in U.S. dollars at the time the contract was opened.
Trust Expenses: Some expenses of the Trust can be directly attributed to each of the Funds. Expenses which cannot be directly attributed to the Funds are apportioned among all funds in the Trust based on average net assets of each fund.
Fund and Class Expenses: Expenses that are specific to a class of shares of the Funds, including distribution fees (Rule 12b-1 fees) and shareholder servicing fees, are charged directly to that share class. All expenses of the Funds, other than class specific expenses, are allocated daily to each class in proportion to their average daily net assets.
Offering Costs: Offering costs, including costs of printing initial prospectuses, legal and registration fees, are being amortized over twelve months from the inception date of the Aspen Portfolio Strategy Fund. Amounts amortized during the period ended April 30, 2018 for the Aspen Portfolio Strategy Fund are shown on the Statements of Operations. As of April 30, 2018, the offering costs have been fully amortized for the Aspen Portfolio Strategy Fund.
Federal Income Taxes: The Funds comply with the requirements under Subchapter M of the Internal Revenue Code of 1986, as amended, applicable to regulated investment companies and intends to distribute substantially all of their net taxable income and net capital gains, if any, each year so that it will not be subject to excise tax on distributed income and gains. The Funds are not subject to income taxes to the extent such distributions are made.
As of and during the year or period ended April 30, 2018, the Funds did not have a liability for any unrecognized tax benefits. The Funds file U.S. federal, state, and local tax returns as required. The Funds’ tax returns are subject to examination by the relevant tax authorities until expiration of the applicable statute of limitations, which is generally three years after the filing of the tax return for federal purposes and four years for most state returns. Tax returns for open years have incorporated no uncertain tax positions that require a provision for income taxes.
Distributions to Shareholders: The Funds normally pay dividends and distributes capital gains, if any, on an annual basis. Income dividend distributions are derived from interest and other income the Funds receive from their investments, including short term capital gains. Long term capital gains distributions are derived from gains realized when the Funds sell a security it has owned for more than a year. The Funds may make additional distributions and dividends at other times if the portfolio manager believes doing so may be necessary for the Funds to avoid or reduce taxes.
26
| Aspen Funds | Notes to Consolidated Financial Statements |
April 30, 2018
3. DERIVATIVE INSTRUMENTS
The Funds use derivatives (including futures) to pursue their investment objective. The Funds’ use of derivative instruments involves risks different from, or possibly greater than, the risks associated with investing directly in securities and other traditional investments. These risks may include (i) the risk that the counterparty to a derivative transaction may not fulfill their contractual obligations, (ii) risk of mispricing or improper valuation, and (iii) the risk that changes in the value of the derivative may not correlate perfectly with the underlying asset, rate or index. These risks could cause the Funds to lose more than the principal amount invested. In addition, investments in derivatives involve leverage, which means a small percentage of assets invested in derivatives can have a disproportionately large impact on the Funds.
The Funds’ use of derivatives can result in losses due to unanticipated changes in the market risk factors and the overall market. In instances where the Funds are using derivatives to decrease, or hedge, exposures to market risk factors for securities held by the Funds, there are also risks that those derivatives may not perform as expected resulting in losses for the combined or hedged positions. Derivatives may have little or no initial cash investment relative to their market value exposure and therefore can produce significant gains or losses in excess of their cost. This use of embedded leverage allows the Funds to increase their market value exposure relative to their net assets and can substantially increase the volatility of the Funds’ performance.
In addition, use of derivatives may increase or decrease exposure to the following risk factors:
| ● | Equity Risk: Equity risk relates to the change in value of equity securities as they relate to increases or decreases in the general market. |
| ● | Interest Rate Risk: When the Funds invest in fixed-income securities or derivatives, the value of an investment in the Funds will fluctuate with changes in interest rates. Typically, a rise in interest rates causes a decline in the value of fixed-income securities or derivatives owned by the Funds. In general, the market price of debt securities with longer maturities will increase or decrease more in response to changes in interest rates than shorter-term securities. Other risk factors include credit risk (the debtor may default) and prepayment risk (the debtor may pay their obligation early, reducing the amount of interest payments). |
| ● | Foreign Currency Risk: Currency trading involves significant risks, including market risk, interest rate risk, country risk, counterparty credit risk and short sale risk. Market risk results from the price movement of foreign currency values in response to shifting market supply and demand. Interest rate risk arises whenever a country changes its stated interest rate target associated with its currency. Country risk arises because virtually every country may interfere with international transactions in its currency. Counterparty credit risk arises when the counterparty will not fulfill its obligations to the Funds. Short sale risk arises from the sale of a security that is not owned, or any sale that is completed by the delivery of a security borrowed. |
| ● | Commodity Risk: Exposure to the commodities markets may subject the Funds to greater volatility than investments in traditional securities. Commodity prices are influenced by unfavorable weather, animal and plant disease, geologic and environmental factors, as well as changes in government regulation such as tariffs, embargoes or burdensome production rules and restrictions. |
Futures: The Funds and the Subsidiaries may enter into futures contracts. Futures contracts are agreements between two parties to buy and sell a particular commodity, instrument or index for a specified price on a specified future date. When the Funds or the Subsidiaries enter into a futures contract, it is required to deposit with (or for the benefit of) their broker an amount of cash or short-term high-quality securities as “initial margin”. The margin requirements are set by the exchange on which the contract is traded and may be modified during the term of the contract. The initial margin is in the nature of a performance bond or good faith deposit on the futures contract that is returned to the Funds upon termination of the contract, assuming all contractual obligations have been satisfied. As the value of the contract changes, the value of the futures contract position increases or declines. Subsequent payments, known as “variation margin”, are made or received by the Funds or the Subsidiaries each day, depending on the price fluctuations in the fair value of the contract and the value of cash or securities on deposit with the broker. Such payments or receipts are recorded for financial statement purposes as unrealized gains or losses by the Funds. Variation margin does not represent a borrowing or loan by the Funds but is instead a settlement between the Funds and the broker of the amount one would owe the other if the futures contract expired. When the contract is closed, the Funds record a realized gain or loss equal to the difference between the value of the contract at the time it was opened and the value at the time it was closed. When the Funds or the Subsidiaries enter into a futures contract certain risks may arise, such as illiquidity in the futures market, which may limit the Funds’ or the Subsidiaries’ ability to close out a futures contract prior to settlement date, and unanticipated movements in the value of securities, commodities or interest rates. Futures contracts are exchange-traded. Exchange-traded futures are standardized contracts and are settled through a clearing house with fulfillment supported by the credit of the exchange. Therefore, counterparty credit risk to the Funds and the Subsidiaries are reduced. With exchange traded futures, there is minimal counterparty credit risk to the Funds since futures are exchange traded and the exchange’s clearinghouse, as a counterparty to all exchange traded futures, guarantees the futures against default.
| Annual Report | April 30, 2018 | 27 |
| Aspen Funds | Notes to Consolidated Financial Statements |
April 30, 2018
Consolidated Statements of Assets and Liabilities - Fair Value of Derivative Instruments as of April 30, 2018:
| Risk Exposure | | Asset Derivatives
Statements of Assets and
Liabilities Location | | Fair Value | | | Liabilities Derivatives
Statements of Assets and
Liabilities Location | | Fair Value | |
| Aspen Managed Futures Strategy Fund | | | | | | | | | | |
| Futures Contracts | | Unrealized appreciation on futures contracts(a) | | $ | 913,209 | | | Unrealized depreciation on futures contracts(a) | | $ | 1,192,433 | |
| | | | | $ | 913,209 | | | | | $ | 1,192,433 | |
| | | | | | | | | | | | | |
| | | Risk Exposure to Fund | | | | | | | | | | |
| | | Commodity Contracts | | $ | 119,102 | | | | | $ | 294,633 | |
| | | Equity Contracts | | | 326,075 | | | | | | 97,444 | |
| | | Foreign Currency Contracts | | | 468,032 | | | | | | 467,404 | |
| | | Interest Rate Contracts | | | – | | | | | | 332,952 | |
| | | | | $ | 913,209 | | | | | $ | 1,192,433 | |
| Aspen Portfolio Strategy Fund | | | | | | | | | | |
| Futures Contracts | | Unrealized appreciation on futures contracts(a) | | $ | 402,602 | | | Unrealized depreciation on futures contracts(a) | | $ | 1,035,124 | |
| | | | | $ | 402,602 | | | | | $ | 1,035,124 | |
| | | | | | | | | | | | | |
| | | Risk Exposure to Fund | | | | | | | | | | |
| | | Commodity Contracts | | $ | 135,502 | | | | | $ | 206,744 | |
| | | Equity Contracts | | | 243,022 | | | | | | 415,923 | |
| | | Foreign Currency Contracts | | | 24,078 | | | | | | 195,169 | |
| | | Interest Rate Contracts | | | – | | | | | | 217,288 | |
| | | | | $ | 402,602 | | | | | $ | 1,035,124 | |
| (a) | Represents cumulative appreciation/(depreciation) of futures contracts as reported in the Consolidated Schedule of Investments. Only the current day’s net variation margin is reported within the Consolidated Statements of Assets and Liabilities. |
28
| Aspen Funds | Notes to Consolidated Financial Statements |
April 30, 2018
Consolidated Statements of Operations - The effect of Derivative Instruments for the year ended April 30, 2018:
| Derivatives Instruments | | Location of Gain/(Loss) on Derivatives
Statements of Operations | | Realized Gain/(Loss) on Derivatives Statements of Operations | | | Change in Unrealized Appreciation/(Depreciation) on Derivatives Statements of Operations | |
| Aspen Managed Futures Strategy Fund | | | | | | | | |
| Futures Contracts | | Net realized loss on futures contracts/Net change in unrealized appreciation/ (depreciation) on futures contracts | | $ | (4,914,905 | ) | | $ | 2,236,408 | |
| | | | | $ | (4,914,905 | ) | | $ | 2,236,408 | |
| | | | | | | | | | | |
| | | Risk Exposure to Fund | | | | | | | | |
| | | Commodity Contracts | | $ | (2,827,167 | ) | | $ | 327,515 | |
| | | Equity Contracts | | | 966,831 | | | | (74,509 | ) |
| | | Foreign Currency Contracts | | | (2,076,857 | ) | | | 2,272,251 | |
| | | Interest Rate Contracts | | | (977,712 | ) | | | (288,849 | ) |
| | | | | $ | (4,914,905 | ) | | $ | 2,236,408 | |
| | | | | | | | | | | |
| Aspen Portfolio Strategy Fund | | | | | | | | | | |
| Futures Contracts | | Net realized loss on futures contracts/Net change in unrealized appreciation/ (depreciation) on futures contracts | | $ | (22,118 | ) | | $ | (651,297 | ) |
| | | | | $ | (22,118 | ) | | $ | (651,297 | ) |
| | | | | | | | | | | |
| | | Risk Exposure to Fund | | | | | | | | |
| | | Commodity Contracts | | $ | (702,818 | ) | | $ | 14,398 | |
| | | Equity Contracts | | | 1,053,381 | | | | (232,150 | ) |
| | | Foreign Currency Contracts | | | (253,536 | ) | | | (226,384 | ) |
| | | Interest Rate Contracts | | | (119,145 | ) | | | (207,161 | ) |
| | | | | $ | (22,118 | ) | | $ | (651,297 | ) |
The average notional value of futures contracts, net of both long and short positions, held by the Aspen Managed Futures Strategy Fund and the Aspen Portfolio Strategy Fund during the year was $29,973,759 and $23,134,301, respectively.
4. TAX BASIS INFORMATION
Reclassifications: Reclassifications to paid-in capital relate primarily to differing book/tax treatment of foreign currency transactions, net operating losses, income from a controlled foreign corporation, and non-deductible expenses. For the year ended April 30, 2018, the following reclassifications, which had no impact on results of operations or net assets, were recorded to reflect tax character:
| Fund | | Paid-in Capital | | | Accumulated Net Investment Income/(Loss) | | | Accumulated Net Realized Gain/(Loss) | |
| Aspen Managed Futures Strategy Fund | | $ | (3,966,612 | ) | | $ | 885,178 | | | $ | 3,081,434 | |
| Aspen Portfolio Strategy Fund | | | (803,018 | ) | | | 131,725 | | | | 671,293 | |
Included in those amounts reclassified was a net operating loss offset to Paid-in capital for the Aspen Managed Futures Strategy Fund in the amount of $1,225,358.
| Annual Report | April 30, 2018 | 29 |
| Aspen Funds | Notes to Consolidated Financial Statements |
April 30, 2018
Tax Basis of Investments: As of April 30, 2018, the aggregate cost of investments, gross unrealized appreciation/(depreciation) and net unrealized depreciation for Federal tax purposes was as follows:
| | | Cost of Investments | | | Gross Appreciation (excess of value over tax cost) | | | Gross Depreciation (excess of tax cost over value) | | | Net Appreciation on Futures Contracts and Foreign Currencies | | | Net Appreciation/ (Depreciation) on Investments | |
| Aspen Managed Futures Strategy Fund | | $ | 82,082,859 | | | $ | 1,016,483 | | | $ | (1,276,857 | ) | | $ | 13,295 | | | $ | (247,079 | ) |
| Aspen Portfolio Strategy Fund | | | 41,778,106 | | | | 5,265,728 | | | | (1,035,564 | ) | | | (1,897 | ) | | | 4,228,267 | |
Components of Distributable Earnings: At April 30, 2018, components of distributable earnings were on a tax basis as follows:
| | | Aspen Managed Futures Strategy Fund | | | Aspen Portfolio Strategy Fund | |
| Accumulated net capital losses | | | (27,278,429 | ) | | | (1,403,767 | ) |
| Net unrealized appreciation/(depreciation) | | | (247,079 | ) | | | 4,228,267 | |
| Other cumulative effect of timing differences | | | (367,562 | ) | | | (24,568 | ) |
| Total distributable earnings | | $ | (27,893,070 | ) | | $ | 2,799,932 | |
Capital Losses: As of April 30, 2018, the Funds have available for Federal income tax purposes unused capital losses that may be used to offset future realized capital gains. The Aspen Managed Futures Strategy Fund had $10,342,876 in short-term losses and $15,489,191 in long-term losses that will be carried forward indefinitely to offset future realized gains.
The Aspen Managed Futures Strategy Fund and the Aspen Portfolio Strategy Fund elect to defer $1,446,362 and $1,403,767, respectively, to the period ending April 30, 2019, capital losses recognized during the period November 1, 2017 to April 30, 2018.
Ordinary Losses: As of April 30, 2018, Aspen Managed Futures Strategy Fund and the Aspen Portfolio Strategy Fund elected to defer to the period ending April 30, 2019, late year ordinary losses in the amount of $367,562 and $24,568, respectively.
Tax Basis of Distributions to Shareholders: Distributions are determined in accordance with federal income tax regulations, which differ from GAAP, and, therefore, may differ significantly in amount or character from net investment income and realized gains for financial reporting purposes. Financial reporting records are adjusted for permanent book/tax differences to reflect tax character but are not adjusted for temporary differences.
The tax character of distributions paid during the year ending April 30, 2018 were as follows:
| | | Ordinary Income | | | Long-Term Capital Gain | |
| Aspen Managed Futures Strategy Fund | | $ | – | | | $ | – | |
| Aspen Portfolio Strategy Fund | | | 538,089 | | | | 388,516 | |
The tax character of distributions paid during the year ending April 30, 2017 were as follows:
| | | Ordinary Income | | | Long-Term Capital Gain | |
| Aspen Managed Futures Strategy Fund | | $ | 2,217,954 | | | $ | – | |
| Aspen Portfolio Strategy Fund | | | – | | | | – | |
30
| Aspen Funds | Notes to Consolidated Financial Statements |
April 30, 2018
5. SHARES OF BENEFICIAL INTEREST
The capitalization of the Trust consists of an unlimited number of shares of beneficial interest with no par value per share. Holders of the shares of each of the Funds of the Trust have one vote for each share held and a proportionate fraction of a vote for each fractional share. All shares issued and outstanding are fully paid and are transferable and redeemable at the option of the shareholder. Purchasers of the shares do not have any obligation to make payments to the Trust or its creditors solely by reason of the purchasers’ ownership of the shares. Shares have no pre-emptive rights.
Fund shares redeemed within 30 days of purchase may incur a 2% short-term redemption fee deducted from the redemption amount. The amount of redemption fees received during the period are presented in the Consolidated Statements of Changes in Net Assets.
6. MANAGEMENT AND RELATED-PARTY TRANSACTIONS
The Adviser, subject to the authority of the Board, is responsible for the overall management and administration of the Funds’ business affairs. The Adviser manages the investments of the Funds in accordance with the Funds’ investment objective, policies and limitations and investment guidelines established jointly by the Adviser and the Board. Pursuant to each Fund’s Investment Advisory Agreement, (the “Advisory Agreement”), the Aspen Managed Futures Strategy Fund will pay the Adviser an annual management fee of 0.75%, based on the Fund’s average daily net asset. The Aspen Portfolio Strategy Fund will pay the Adviser an annual management fee of 1.00%, based on the Fund’s average daily net assets. The management fee is paid on a monthly basis.
The Subsidiaries have each entered into a separate advisory agreement (collectively, the “Subsidiary Advisory Agreement”) with the Adviser for the management of each Subsidiary’s portfolio pursuant to which the Subsidiaries are obligated to pay the Adviser a management fee at the same rate that the Funds pay the Adviser for investment advisory services provided to the Funds. The Adviser has agreed to waive the advisory fee it receives from the Funds in an amount equal to the management fee paid by the Subsidiaries. This agreement may be terminated based on the terms of the Advisory Agreement. For the year ended April 30, 2018, this amount equaled $118,827 and $13,170 for Aspen Managed Futures Strategy Fund and the Aspen Portfolio Strategy Fund, respectively, and are disclosed in the Consolidated Statements of Operations. These waivers are not subject to reimbursement/recoupment.
The Adviser has contractually agreed to limit the Funds’ total annual fund operating expenses (exclusive of distribution and service (12b-1) fees, shareholder services fees, acquired fund fees and expenses, brokerage expenses, interest expense, taxes and extraordinary expenses) to 1.55% of each of the Funds’ average daily net assets for each of Class A and Class I Shares. This agreement (the “Expense Agreement”) is in effect from September 1, 2017 through August 31, 2018 for the Aspen Managed Futures Strategy Fund. The prior Expense Agreement for the Aspen Managed Futures Strategy Fund was in effect from September 1, 2016 through August 31, 2017. The Expense Agreement for the Aspen Portfolio Strategy Fund is in effect from December 14, 2016 through August 31, 2018. The Adviser will be permitted to recover, on a class-by-class basis, expenses it has borne through the Expense Agreement to the extent that the Funds’ expenses in later periods fall below the expense cap in effect at the time of waiver or reimbursement. Notwithstanding the foregoing, the Funds will not be obligated to pay any such fees and expenses more than three years after the date of the waiver or reimbursement. The Adviser may not discontinue or modify this waiver prior to August 31, 2018 without the approval by the Funds’ Board of Trustees.
As of April 30, 2018, the fee waivers/reimbursements and recoupments of past waived fees were as follows:
| Fund | | Fees Waived/Reimbursed By Advisor | | | Recoupment of Past Waived Fees By Advisor | | | Total | |
| Aspen Managed Futures Strategy Fund - Class A | | $ | – | | | $ | – | | | $ | – | |
| Aspen Managed Futures Strategy Fund - Class I | | | – | | | | – | | | | – | |
| Aspen Portfolio Strategy Fund - Class A | | | (3,450 | ) | | | – | | | | (3,450 | ) |
| Aspen Portfolio Strategy Fund - Class I | | | (89,774 | ) | | | – | | | | (89,774 | ) |
As of April 30, 2018, the balances of recoupable expenses for each Fund were as follows:
| Fund | | Expires 2019 | | | Expires 2020 | | | Expires 2021 | | | Total | |
| Aspen Managed Futures Strategy Fund | | | | | | | | | | | | | | | | |
| Class A | | $ | – | | | $ | – | | | $ | – | | | $ | – | |
| Class I | | | – | | | | – | | | | – | | | | – | |
| Aspen Portfolio Strategy Fund | | | | | | | | | | | | | | | | |
| Class A | | | – | | | | 8,063 | | | | 3,450 | | | | 11,513 | |
| Class I | | | – | | | | 61,839 | | | | 89,774 | | | | 151,613 | |
| Annual Report | April 30, 2018 | 31 |
| Aspen Funds | Notes to Consolidated Financial Statements |
April 30, 2018
Fund Administrator Fees and Expenses
ALPS Fund Services, Inc. (“ALPS”) serves as administrator to the Funds and the Funds have agreed to pay expenses incurred in connection with its administrative activities. Pursuant to an Administration Agreement, ALPS provides operational services to the Fund including, but not limited to, fund accounting and fund administration and generally assist in the Funds’ operations. Officers of the Trust are employees of ALPS. The Funds’ administration fee is accrued on a daily basis and paid monthly. Administration fees paid by the Funds for the year or period ended April 30, 2018 are disclosed in the Consolidated Statements of Operations.
ALPS is reimbursed by the Funds for certain out-of-pocket expenses.
Transfer Agent
ALPS serves as transfer, dividend paying and shareholder servicing agent for the Funds. ALPS receives an annual minimum fee, a fee based upon the number of shareholder accounts, and is also reimbursed by the Funds for certain out-of-pocket expenses. Transfer agent fees paid by the Funds for the year or period ended April 30, 2018 are disclosed in the Consolidated Statements of Operations.
Compliance Services
ALPS provides services that assist the Trust’s chief compliance officer in monitoring and testing the policies and procedures of the Trust in conjunction with requirements under Rule 38a-1 under the 1940 Act and receives an annual base fee. ALPS is reimbursed for certain out-of-pocket expenses by the Funds. Compliance service fees paid by the Funds for the year or period ended April 30, 2018 are disclosed in the Consolidated Statements of Operations.
Principal Financial Officer
ALPS receives an annual fee for providing principal financial officer services to the Funds. Principal financial officer fees paid by the for the year or period ended April 30, 2018 are disclosed in the Consolidated Statements of Operations.
Distributor
ALPS Distributors, Inc. (“ADI” or the “Distributor”) (an affiliate of ALPS) acts as the distributor of the Funds’ shares pursuant to a Distribution Agreement with the Trust. Shares are sold on a continuous basis by ADI as agent for the Funds, and ADI has agreed to use its best efforts to solicit orders for the sale of the Funds’ shares, although it is not obliged to sell any particular amount of shares. ADI is not entitled to any compensation for its services as Distributor. ADI is registered as a broker-dealer with the U.S. Securities and Exchange Commission.
The Funds have adopted a plan of distribution for Class A shares pursuant to Rule 12b-1 under the 1940 Act (the “Plan”). The Plan allows the Funds to use Class A assets to pay fees in connection with the distribution and marketing of Class A shares and/or the provision of shareholder services to Class A shareholders. The Plan permits payment for services in connection with the administration of plans or programs that use Class A shares as their funding medium and for related expenses. The recipients of such payments may include the Distributor, other affiliates of the Adviser, broker-dealers, financial institutions, plan sponsors and administrators and other financial intermediaries through which investors may purchase shares of the Funds. The Plan permits the Funds to use their Class A assets to make total payments at an annual rate of up to 0.25% of the Funds’ average daily net assets attributable to their Class A shares. The expenses of the plan are reflected as distribution and service fees in the Consolidated Statements of Operations.
The Funds have adopted a shareholder service plan (a “Shareholder Services Plan”) for Class A shares. Under the Shareholder Services Plan the Funds are authorized to compensate certain financial intermediaries, including broker-dealers and the Funds’ affiliates, which may include the Distributor, Adviser and/or the transfer agent (“Participating Organizations”), an aggregate fee in an amount not to exceed on an annual basis 0.15% for Class A shares of the average daily net asset value of the Class A shares attributable to or held in the name of a Participating Organizations for its clients as compensation for providing shareholder service activities, which do not include distribution services, pursuant to an agreement with a Participating Organizations. Any amount of such payment not paid to the Participating Organizations during the Funds’ fiscal year for such service activities shall be reimbursed to the Funds as soon as practicable. Shareholder Services Plan fees are included with distribution and service fees on the Consolidated Statements of Operations. Fees recaptured pursuant to the Shareholder Services Plan for the year or period ended April 30, 2018 are included as an offset to distribution and service fees as disclosed in the Consolidated Statements of Operations.
Certain intermediaries may charge networking, omnibus account or other administrative fees with respect to transactions in shares of the Funds. Transactions may be processed through the National Securities Clearing Corporation (“NSCC”) or similar systems or processed on a manual basis. These fees are paid by the Funds to the Distributor, which uses such fees to reimburse intermediaries. In the event an intermediary receiving payments from the Distributor on behalf of the Funds converts from a networking structure to an omnibus account structure or otherwise experiences increased costs, fees borne by the Funds may increase. Fees paid by the Funds for the year or period ended April 30, 2018 are disclosed in the Consolidated Statements of Operations as Delegated Transfer Agent Equivalent Services.
��
32
| Aspen Funds | Notes to Consolidated Financial Statements |
April 30, 2018
Index Licensing Services
The Aspen Managed Futures Strategy Fund has adopted an Index Licensing Agreement and the Adviser pursuant to which the Fund pays the Adviser a monthly annualized licensing fee of 0.25%, based on the Fund’s average daily net assets for the right to use the Index in connection with the Fund. Fees paid by the Fund for the year ended April 30, 2018 are disclosed in the Consolidated Statement of Operations as Licensing fees.
7. SECURITIES TRANSACTIONS
The cost of purchases and proceeds from sales (excluding short-term securities) of U.S. Government securities for the Aspen Managed Futures Strategy Fund and Exchange Traded Funds for the Aspen Portfolio Strategy Fund during the year ended April 30, 2018 were as follows:
| Aspen Managed Futures Strategy Fund | | | |
| Cost of Investments Purchased | | $ | – | |
| Proceeds from Investments Sold | | $ | 54,589,870 | |
| Aspen Portfolio Strategy Fund | | | | |
| Cost of Investments Purchased | | $ | 2,341,529 | |
| Proceeds from Investments Sold | | $ | – | |
8. INDEMNIFICATIONS
Under the Trust’s organizational documents, its officers and Trustees are indemnified against certain liability arising out of the performance of their duties to the Trust. Additionally, in the normal course of business, the Trust enters into contracts with service providers that may contain general indemnification clauses, which may permit indemnification to the extent permissible under applicable law. The Trust’s maximum exposure under these arrangements is unknown, as this would involve future claims that may be made against the Trust that have not yet occurred.
| Annual Report | April 30, 2018 | 33 |
| Aspen Funds | Report of Independent Registered Public Accounting Firm |
To the shareholders and the Board of Trustees of Financial Investors Trust
Opinion on the Financial Statements and Financial Highlights
We have audited the accompanying consolidated statements of assets and liabilities, including the consolidated schedules of investments, of Aspen Managed Futures Strategy Fund and subsidiary and Aspen Portfolio Strategy Fund and subsidiary (the “Funds”), two of the funds constituting the Financial Investors Trust, as of April 30, 2018; the related consolidated statements of operations for the year then ended, the consolidated statements of changes in net assets for each of the two years in the period then ended, the consolidated financial highlights for each of the five years in the period then ended for Aspen Managed Futures Strategy Fund and subsidiary; the related consolidated statement of operations for the year ended April 30, 2018, and the consolidated statements of changes in net assets and consolidated financial highlights for the year ended April 30, 2018, and for the period from December 28, 2016 (commencement of operations) through April 30, 2017 for Aspen Portfolio Strategy Fund and subsidiary; and the related notes.
In our opinion, the consolidated financial statements and financial highlights present fairly, in all material respects, the financial position of Aspen Managed Futures Strategy Fund and subsidiary as of April 30, 2018, and the results of their operations for the year then ended, the changes in their net assets for each of the two years in the period then ended, and the financial highlights for each of the five years in the period then ended in conformity with accounting principles generally accepted in the United States of America. Also, in our opinion, the consolidated financial statements and financial highlights present fairly, in all material respects, the financial position of Aspen Portfolio Strategy Fund and subsidiary as of April 30, 2018, and the results of their operations for the year then ended, and the changes in their net assets and financial highlights for the year ended April 30, 2018 and for the period from December 28, 2016 (commencement of operations) through April 30, 2017 in conformity with accounting principles generally accepted in the United States of America.
Basis for Opinion
These financial statements and financial highlights are the responsibility of the Funds’ management. Our responsibility is to express an opinion on the Funds’ financial statements and financial highlights based on our audits. We are a public accounting firm registered with the Public Company Accounting Oversight Board (United States) (PCAOB) and are required to be independent with respect to the Funds in accordance with the U.S. federal securities laws and the applicable rules and regulations of the Securities and Exchange Commission and the PCAOB.
We conducted our audits in accordance with the standards of the PCAOB. Those standards require that we plan and perform the audit to obtain reasonable assurance about whether the financial statements and financial highlights are free of material misstatement, whether due to error or fraud. The Funds are not required to have, nor were we engaged to perform, an audit of their internal control over financial reporting. As part of our audits we are required to obtain an understanding of internal control over financial reporting but not for the purpose of expressing an opinion on the effectiveness of the Funds’ internal control over financial reporting. Accordingly, we express no such opinion.
Our audits included performing procedures to assess the risks of material misstatement of the financial statements and financial highlights, whether due to error or fraud, and performing procedures that respond to those risks. Such procedures included examining, on a test basis, evidence regarding the amounts and disclosures in the financial statements and financial highlights. Our audits also included evaluating the accounting principles used and significant estimates made by management, as well as evaluating the overall presentation of the financial statements and financial highlights. Our procedures included confirmation of securities owned as of April 30, 2018, by correspondence with the custodian and brokers; when replies were not received from brokers, we performed other auditing procedures. We believe that our audits provide a reasonable basis for our opinion.
DELOITTE & TOUCHE LLP
Denver, Colorado
June 26, 2018
We have served as the auditor of one or more investment companies advised by Aspen Partners, Ltd. since 2012.
34
| Aspen Funds | Disclosure Regarding Approval of Fund Advisory Agreement |
April 30, 2018 (Unaudited)
ASPEN MANAGED FUTURES STRATEGY FUND
ASPEN PORTFOLIO STRATEGY FUND
On December 12, 2017, the Trustees met in person to discuss, among other things, the approval of the investment advisory agreement between the Trust and the Adviser, in accordance with Section 15(c) of the 1940 Act. In renewing and approving the Investment Advisory Agreement, the Trustees, including the Independent Trustees, considered the following factors with respect to the Aspen Funds:
Investment Advisory Fee Rate: The Trustees reviewed and considered the contractual annual advisory fee paid by the Trust, on behalf of the Aspen Managed Futures Strategy Fund (the “Aspen Managed Futures Fund”) of 0.75% of the Fund’s daily net assets and on behalf of the Aspen Portfolio Strategy Fund (the “Aspen Portfolio Fund”) of 1.00% of the Fund’s daily net assets, to Aspen, in light of the extent and quality of the advisory services provided by Aspen to the Funds.
The Board received and considered information including a comparison of the Aspen Funds’ contractual and actual advisory fees and overall expenses with those of funds in the peer groups and universes of funds provided by an independent provider of investment company data (the “Data Provider”). The Trustees noted that the contractual advisory fee rate for both classes of the Managed Futures Funds was below the median of the funds in the Data Provider peer group, the contractual advisory fee rate for Class A of Aspen Portfolio Fund was the same as the median of the funds in the Data Provider peer group, and the contractual advisory fee rate for Class I of the Aspen Portfolio Fund was below the median of the funds in the Data Provider peer group.
Total Expense Ratios: The Trustees further reviewed and considered the total expense ratio (after waivers) of 1.61% and 1.28% for the Aspen Managed Futures Fund’s Class A and Class I shares, respectively, and 1.95% and 1.55% for the Aspen Portfolio Fund’s Class A and Class I shares, respectively. The Trustees noted that for both classes of the Aspen Managed Futures Fund, the total expense ratio (after waivers) was below the Data Provider peer group median total expense ratio (after waivers), for Class A of the Aspen Portfolio Fund the total expense ratio (after waivers) was above the Data Provider peer group median total expense ratio (after waivers), and for Class I of the Aspen Portfolio Fund the total expense ratio (after waivers) was below the Data Provider peer group median total expense ratio (after waivers).
Nature, Extent, and Quality of the Services under the Investment Advisory Agreement: The Trustees received and considered information regarding the nature, extent, and quality of services provided to the Aspen Funds under the Investment Advisory Agreement. The Trustees reviewed certain background materials supplied by Aspen in its presentation, including its Form ADV.
The Trustees reviewed and considered Aspen’s investment advisory personnel, its history as an asset manager, and its performance and the amount of assets currently under management by Aspen and its affiliated entities. The Trustees also reviewed the research and decision-making processes utilized by Aspen, including the methods adopted to seek to achieve compliance with the investment objectives, policies, and restrictions of the Aspen Funds.
The Trustees considered the background and experience of Aspen’s management in connection with the Aspen Funds, including reviewing the qualifications, backgrounds, and responsibilities of the management team primarily responsible for the day-to-day portfolio management of the Funds and the extent of the resources devoted to research and analysis of actual and potential investments.
The Trustees also reviewed, among other things, Aspen’s insider trading policies and procedures and its Code of Ethics.
Performance: The Trustees reviewed performance information for the Aspen Funds. That review included a comparison of the Aspen Funds’ performance to the performance of a group of comparable funds selected by Data Provider. The Trustees noted the performance of each class of the Aspen Managed Futures Fund was below the respective Data Provider performance universe median for the three-month, one-year, three-year, and five-year periods ended December 31, 2017 and the performance of each class of the Aspen Portfolio Fund was above the respective Data Provider performance universe median for the three-month and one-year periods ended December 31, 2017. The Trustees also considered Aspen’s performance and reputation generally and its investment techniques, risk management controls and decision-making processes.
Comparable Accounts: The Trustees noted Aspen’s statements that it did not offer either Aspen Fund’s strategy to other clients.
Profitability: The Trustees received and considered a retrospective and projected profitability analysis prepared by Aspen based on the fees payable under the Investment Advisory Agreement with respect to the Aspen Funds. The Trustees considered the profits, if any, anticipated to be realized by Aspen in connection with the operation of the Aspen Funds. The Board then reviewed Aspen’s audited consolidated financial statements and supplemental schedule for the years ended December 31, 2016 and 2015 in order to analyze the financial condition and stability and profitability of Aspen.
| Annual Report | April 30, 2018 | 35 |
| Aspen Funds | Disclosure Regarding Approval of Fund Advisory Agreement |
April 30, 2018 (Unaudited)
Economies of Scale: The Trustees considered whether economies of scale in the provision of services to the Aspen Funds will be passed along to the shareholders under the agreements.
Other Benefits to the Adviser: The Trustees reviewed and considered any other incidental benefits derived or to be derived by Aspen from its relationship with the Aspen Funds, including whether soft dollar arrangements were used.
In renewing Aspen as the Aspen Funds’ investment adviser and renewing the Investment Advisory Agreement and the fees charged under the Investment Advisory Agreement, the Trustees concluded that no single factor reviewed by the Trustees was identified by the Trustees to be determinative as the principal factor in whether to renew the Investment Advisory Agreement. Further, the Independent Trustees were advised by separate independent legal counsel throughout the process. The Trustees, including all of the Independent Trustees, concluded that:
| ● | the contractual advisory fee rate for both classes of the Managed Futures Funds was below the median of the funds in the Data Provider peer group, the contractual advisory fee rate for Class A of Aspen Portfolio Fund was the same as the median of the funds in the Data Provider peer group, and the contractual advisory fee rate for Class I of the Aspen Portfolio Fund was below the median of the funds in the Data Provider peer group; |
| ● | for both classes of the Aspen Managed Futures Fund, the total expense ratio (after waivers) was below the Data Provider peer group median total expense ratio (after waivers), for Class A of the Aspen Portfolio Fund the total expense ratio (after waivers) was above the Data Provider peer group median total expense ratio (after waivers), and for Class I of the Aspen Portfolio Fund the total expense ratio (after waivers) was below the Data Provider peer group median total expense ratio (after waivers); |
| | ● | the nature, extent and quality of services rendered by Aspen under the Investment Advisory Agreement with respect to the Aspen Funds were adequate; |
| ● | the performance of each class of the Aspen Managed Futures Fund was below the respective Data Provider performance universe median for the three-month, one-year, three-year, and five-year periods ended December 31, 2017 and the performance of each class of the Aspen Portfolio Fund was above the respective Data Provider performance universe median for the three-month and one-year periods ended December 31, 2017; |
| ● | there were no directly comparable accounts managed by Aspen for the Board to consider; |
| ● | the profit, if any, realized by Aspen in connection with the operation of the Aspen Funds is not unreasonable to the Aspen Funds; and |
| ● | there were no material economies of scale or other incidental benefits accruing to Aspen in connection with its relationship with the Aspen Funds. |
Based on the Trustees’ deliberations and their evaluation of the information described above, the Trustees, including all of the Independent Trustees, concluded that Aspen’s compensation for investment advisory services is consistent with the best interests of the Aspen Funds and their shareholders.
36
| Aspen Funds | Additional Information |
April 30, 2018 (Unaudited)
1. FUND HOLDINGS
The Fund files its complete schedule of portfolio holdings with the Securities and Exchange Commission (the “SEC”) for the first and third quarters of each fiscal year on Form N-Q within 60 days after the end of the period. Copies of the Funds’ Form N-Q are available without charge on the SEC website at http://www.sec.gov. You may also review and copy the Form N-Q at the SEC’s Public Reference Room in Washington, DC. For more information about the operation of the Public Reference Room, please call the SEC at 1-800-SEC-0330.
2. FUND PROXY VOTING POLICIES, PROCEDURES AND SUMMARIES
The Funds’ policies and procedures used in determining how to vote proxies and information regarding how the Fund voted proxies relating to portfolio securities during the most recent prior 12-month period ending June 30 are available without charge, (1) upon request, by calling (toll-free) 855-845-9444 and (2) on the SEC’s website at http://www.sec.gov.
3. TAX INFORMATION (UNAUDITED)
The Funds designated the following for federal income tax purposes for distributions made during the calendar year ended December 31, 2017:
| | QDI | DRD |
| Aspen Managed Futures Strategy Fund | 0.00% | 0.00% |
| Aspen Portfolio Strategy Fund | 0.00% | 0.00% |
In early 2018, if applicable, shareholders of record received this information for the distribution paid to them by the Funds during the calendar year 2017 via Form 1099. The Funds will notify shareholders in early 2019 of amounts paid to them by the Funds, if any, during the calendar year 2018.
Pursuant to Section 852(b)(3) of the Internal Revenue Code, the Aspen Portfolio Strategy Fund designated $388,516 as long-term capital gain dividends.
| Annual Report | April 30, 2018 | 37 |
| Aspen Funds | Trustees and Officers |
April 30, 2018 (Unaudited)
Additional information regarding the Fund’s trustees is included in the Statement of Additional Information, which can be obtained without charge by calling 855-828-9909.
INDEPENDENT TRUSTEES
| Name, Address* & Year of Birth | Position(s) Held with Fund | Term of Office** and Length of Time Served | Principal Occupation(s) During Past 5 Years*** | Number of Funds in Fund Complex Overseen by Trustee**** | Other Directorships Held by Trustee During Past 5 Years*** |
Mary K. Anstine,
1940 | Trustee and Chairman | Ms. Anstine was elected at a special meeting of shareholders held on March 21, 1997 and re-elected at a special meeting of shareholders held on August 7, 2009. Ms. Anstine was appointed Chairman of the Board at the June 6, 2017 meeting of the Board of Trustees. | Ms. Anstine was formerly an Executive Vice President of First Interstate Bank of Denver until 1994, President/Chief Executive Officer of HealthONE Alliance, Denver, Colorado, from 1994 to 2004, and has been retired since 2004. Ms. Anstine is also Trustee/Director of AV Hunter Trust and Colorado Uplift Board. Ms. Anstine was formerly a Director of the Trust Bank of Colorado (later purchased and now known as Northern Trust Bank), HealthONE and Denver Area Council of the Boy Scouts of America, and a member of the American Bankers Association Trust Executive Committee. | 32 | Ms. Anstine is a Trustee of ALPS ETF Trust (21 funds); ALPS Variable Investment Trust (9 funds); Reaves Utility Income Fund (1 fund); and Westcore Trust (14 funds). |
Jeremy W. Deems,
1976 | Trustee | Mr. Deems was appointed as a Trustee at the March 11, 2008 meeting of the Board of Trustees and elected at a special meeting of shareholders held on August 7, 2009. | Mr. Deems is the Co-Founder, Chief Operations Officer and Chief Financial Officer of Green Alpha Advisors, LLC, a registered investment advisor, and Co-Portfolio Manager of the Shelton Green Alpha Fund. Prior to joining Green Alpha Advisors, Mr. Deems was CFO and Treasurer of Forward Management, LLC, ReFlow Management Co., LLC, ReFlow Fund, LLC, a private investment fund, and Sutton Place Management, LLC, an administrative services company, from 1998 to June 2007. From 2004 to 2005, Mr Deems also served as Treasurer of the Forward Funds and the Sierra Club Funds. | 32 | Mr. Deems is a Trustee of ALPS ETF Trust (21 funds); ALPS Variable Investment Trust (9 funds); Clough Funds Trust (1 fund); and Reaves Utility Income Fund (1 fund). |
38
| Aspen Funds | Trustees and Officers |
April 30, 2018 (Unaudited)
INDEPENDENT TRUSTEES
| Name, Address* & Year of Birth | Position(s)
Held with
Fund | Term of Office**
and Length of
Time Served | Principal Occupation(s) During
Past 5 Years*** | Number of
Funds in Fund
Complex
Overseen by
Trustee**** | Other Directorships Held by Trustee During Past 5 Years*** |
| Jerry G. Rutledge, 1944 | Trustee | Mr. Rutledge was elected at a special meeting of shareholders held on August 7, 2009. | Mr. Rutledge is the President and owner of Rutledge’s Inc., a retail clothing business. He served as Director of University of Colorado Hospital from 2008 to 2016. He was from 1994 to 2007 a Regent of the University of Colorado. | 32 | Mr. Rutledge is a Trustee of Principal Real Estate Fund (1 fund), Clough Global Dividend and Income Fund (1 fund), Clough Global Equity Fund (1 fund) and Clough Global Opportunities Fund (1 fund). |
Michael “Ross” Shell,
1970 | Trustee | Mr. Shell was elected at a special meeting of shareholders held on August 7, 2009. | Mr. Shell is Founder and CEO of Red Idea, LLC, a strategic consulting/early stage venture firm (since June 2008). From 1999 to 2009, he was a part-owner and Director of Tesser, Inc., a brand agency. From December 2005 to May 2008, he was Director, Marketing and Investor Relations, of Woodbourne, a REIT/real estate hedge fund and private equity firm. Prior to this, from May 2004 to November 2005, he worked as a business strategy consultant; from June 2003 to April 2004, he was on the Global Client Services team of IDEO, a product design/innovation firm; and from 1999 to 2003, he was President of Tesser, Inc. Mr. Shell graduated with honors from Stanford University with a degree in Political Science. | 32 | None. |
| Annual Report | April 30, 2018 | 39 |
| Aspen Funds | Trustees and Officers |
April 30, 2018 (Unaudited)
INTERESTED TRUSTEE
| Name, Address* & Year of Birth | Position(s)
Held
with Fund | Term of Office**
and Length of
Time Served | Principal Occupation(s) During
Past 5 Years*** | Number of
Funds in Fund
Complex
Overseen by
Trustee**** | Other Directorships Held by
Trustee During Past 5 Years*** |
| Edmund J. Burke, 1961 | Trustee and President | Mr. Burke was elected as Trustee at a special meeting of shareholders held on August 7, 2009. Mr. Burke was elected President of the Trust at the December 17, 2002 meeting of the Board of Trustees. | Mr. Burke is President and a Director of ALPS Holdings, Inc. (“AHI”) and ALPS Advisors, Inc. (“AAI”), and Director of Boston Financial Data Services, Inc. (“BFDS”), ALPS Distributors, Inc. (“ADI”), ALPS Fund Services, Inc. (“AFS”) and ALPS Portfolio Solutions Distributor, Inc. (“APSD”). Because of his positions with AHI, BFDS, AAI, ADI, AFS and APSD, Mr. Burke is deemed an affiliate of the Trust as defined under the 1940 Act. | 32 | Mr. Burke is a Trustee of Clough Global Dividend and Income Fund (1 fund); Clough Global Equity Fund (1 fund); Clough Global Opportunities Fund (1 fund); Clough Funds Trust (1 fund); Liberty All- Star Equity Fund (1 fund); Director of the Liberty All- Star Growth Fund, Inc. (1 fund); Trustee of ALPS ETF Trust (21 funds). |
40
| Aspen Funds | Trustees and Officers |
April 30, 2018 (Unaudited)
OFFICERS
Name, Address* &
Year of Birth | Position(s) Held
with Fund | Term of Office** and Length of Time Served | Principal Occupation(s) During Past 5 Years*** |
Kimberly R. Storms,
1972 | Treasurer | Ms. Storms was elected Treasurer of the Trust at the March 12, 2013 meeting of the Board of Trustees. | Ms. Storms is Senior Vice President - Director of Fund Administration of ALPS. Because of her position with ALPS, Ms. Storms is deemed an affiliate of the Trust as defined under the 1940 Act. Ms. Storms is also Treasurer of Liberty All-Star Equity Fund, Liberty All-Star Growth Fund, Inc., ALPS Series Trust and Elevation ETF Trust. Ms. Storms also serves as a Board member and Treasurer of The Center for Trauma & Resilience, a nonprofit agency. |
Karen S. Gilomen,
1970 | Secretary | Ms. Gilomen was elected Secretary of the Trust at the December 13, 2016 meeting of the Board of Trustees. | Ms. Gilomen joined ALPS in August 2016 as Vice President and Senior Counsel. Prior to joining ALPS, Ms. Gilomen was Vice President - General Counsel & CCO of Monticello Associates, Inc. from 2010 to 2016. Because of her position with ALPS, Ms. Gilomen is deemed an affiliate of the Trust, as defined under the 1940 Act. Ms. Gilomen is also the Secretary of Clough Funds Trust, Clough Global Dividend and Income Fund, Clough Global Equity Fund, Clough Global Opportunities Fund, Reaves Utility Income Fund, and the Assistant Secretary of the WesMark Funds. |
Ted Uhl,
1974 | Chief Compliance Officer (“CCO”) | Mr. Uhl was appointed CCO of the Trust at the June 8, 2010 meeting of the Board of Trustees. | Mr. Uhl joined ALPS in October 2006, and is currently Deputy Compliance Officer of ALPS. Prior to his current role, Mr. Uhl served as Senior Risk Manager for ALPS from October 2006 until June 2010. Before joining ALPS, Mr. Uhl served a Sr. Analyst with Enenbach and Associates (RIA), and a Sr. Financial Analyst at Sprint. Because of his position with ALPS, Mr. Uhl is deemed an affiliate of the Trust as defined under the 1940 Act. Mr. Uhl is also CCO of the Boulder Growth & Income Fund, Inc., Centre Funds, Elevation ETF Trust, Index Funds, Reality Shares ETF Trust and Reaves Utility Income Fund. |
Jennell Panella,
1974 | Assistant Treasurer | Ms. Panella was elected Assistant Treasurer of the Trust at the September 15, 2015 meeting of the Board of Trustees. | Ms. Panella joined ALPS in June 2012 and is currently Fund Controller of ALPS Fund Services, Inc. Prior to joining ALPS, Ms. Panella served as Financial Reporting Manager for Parker Global Strategies, LLC (2009-2012). Because of her position with ALPS, Ms. Panella is deemed an affiliate of the Trust as defined under the 1940 Act. Ms. Panella also serves as Assistant Treasurer of James Advantage Funds. |
Alan Gattis,
1980 | Assistant Treasurer | Mr. Gattis was elected Assistant Treasurer of the Trust at the September 13, 2016 meeting of the Board of Trustees. | Mr. Gattis joined ALPS in 2011 and is currently Vice President and Fund Controller of ALPS. Prior to joining ALPS, Mr. Gattis was an Auditor at Spicer Jeffries LLP (2009 through 2011) and an Auditor at PricewaterhouseCoopers LLP (2004 - 2009). Because of his position with ALPS, Mr. Gattis is deemed an affiliate of the Trust as defined under the 1940 Act. Mr. Gattis is also Assistant Treasurer of ALPS Series Trust and Elevation ETF Trust. |
| Annual Report | April 30, 2018 | 41 |
| Aspen Funds | Trustees and Officers |
April 30, 2018 (Unaudited)
OFFICERS
Name, Address* &
Year of Birth | Position(s)
Held with Fund | Term of Office** and Length of Time Served | Principal Occupation(s) During Past 5 Years*** |
Sharon Akselrod,
1974 | Assistant Secretary | Ms. Akselrod was elected Assistant Secretary of the Trust at the September 15, 2015 meeting of the Board of Trustees. | Ms. Akselrod joined ALPS in August 2014 and is currently Senior Investment Company Act Paralegal of ALPS Fund Services, Inc. Prior to joining ALPS, Ms. Akselrod served as Corporate Governance and Regulatory Associate for Nordstrom fsb (2013-2014) and Senior Legal Assistant – Legal Manager for AXA Equitable Life Insurance Company (2008-2013). Because of her position with ALPS, Ms. Akselrod is deemed an affiliate of the Trust as defined under the 1940 Act. Ms. Akselrod is also Assistant Secretary of ALPS ETF Trust and Principal Real Estate Fund. |
Jennifer Craig
1973 | Assistant Secretary | Ms. Craig was elected Assistant Secretary of the Trust at the June 8, 2016 meeting of the Board of Trustees. | Ms. Craig joined ALPS in 2007 and is currently Assistant Vice President and Paralegal Manager of ALPS. Prior to joining ALPS, Ms. Craig was Legal Manager at Janus Capital Management LLC and served as Assistant Secretary of Janus Investment Fund, Janus Adviser Series and Janus Aspen Series. Because of her position with ALPS, Ms. Craig is deemed an affiliate of the Trust as defined under the 1940 Act. Ms. Craig is also Assistant Secretary of Clough Global Dividend and Income Fund, Clough Global Equity Fund, Clough Global Opportunities Fund, Clough Funds Trust, Liberty All-Star Equity Fund, Liberty All-Star Growth Fund, Inc. and ALPS Series Trust. |
Sareena Khwaja-Dixon,
1980 | Assistant Secretary | Ms. Khwaja-Dixon was elected Assistant Secretary of the Trust at the December 12, 2017 meeting of the Board of Trustees. | Ms. Khwaja-Dixon joined ALPS in August 2015 and is currently Senior Counsel and Vice President of ALPS Fund Services, Inc. Prior to joining ALPS, Ms. Khwaja-Dixon served as a Senior Paralegal/Paralegal for Russell Investments (2011 – 2015). Ms. Khwaja-Dixon is also Secretary of Liberty All-Star Equity Fund and Liberty All-Star Growth Fund, Inc., and Assistant Secretary of Clough Funds Trust, Clough Dividend and Income Fund, Clough Global Opportunities Fund and Clough Global Equity Fund. |
| * | All communications to Trustees and Officers may be directed to Financial Investors Trust c/o 1290 Broadway, Suite 1100, Denver, CO 80203. |
| ** | This is the period for which the Trustee or Officer began serving the Trust. Each Trustee serves an indefinite term, until his successor is elected. Officers are elected on an annual basis. |
| *** | Except as otherwise indicated, each individual has held the office shown or other offices in the same company for the last five years. |
| **** | The Fund Complex includes all series of the Trust (currently 32) and any other investment companies for which any Trustee serves as trustee for and which Aspen Partners, Ltd. provides investment advisory services (currently none). |
42
| Aspen Funds | Privacy Policy |
| April 30, 2018 (Unaudited) |
| Who We Are | |
| Who is providing this notice? | Aspen Managed Futures Strategy Fund and Aspen Portfolio Strategy Fund. |
| What We Do | |
| How do the Funds protect my personal information? | To protect your personal information from unauthorized access and use, we use security measures that comply with federal law. These measures include computer safeguards and secured files and buildings. |
| How do the Funds collect my personal information? | We collect your personal information, for example, when you |
| | ● open an account ● provide account information or give us your contact information ● make a wire transfer or deposit money |
| Why can’t I limit all sharing? | Federal law gives you the right to limit only |
| | ● sharing for affiliates’ everyday business purposes – information about your
creditworthiness ● affiliates from using your information to market to you ● sharing for non-affiliates to market to you |
| | State laws and individual companies may give you additional rights to limit sharing. |
| Definitions | |
| Affiliates | Companies related by common ownership or control. They can be financial and nonfinancial companies. |
| Non-affiliates | Companies not related by common ownership or control. They can be financial and nonfinancial companies. |
| | ● The Funds do not share with non-affiliates so they can market to you. |
| Joint marketing | A formal agreement between non-affiliated financial companies that together market financial products or services to you. |
| | ● The Funds do not jointly market. |
| Other Important Information | |
| California Residents | If your account has a California home address, your personal information will not be disclosed to nonaffiliated third parties except as permitted by applicable California law, and we will limit sharing such personal information with our affiliates to comply with California privacy laws that apply to us. |
| Vermont Residents | The State of Vermont requires financial institutions to obtain your consent prior to sharing personal information that they collect about you with affiliated companies and nonaffiliated third parties other than in certain limited circumstances. Except as permitted by law, we will not share personal information we collect about you with nonaffiliated third parties or other affiliated companies unless you provide us with your written consent to share such information. |
| Annual Report | April 30, 2018 | 43 |
| Aspen Funds | Privacy Policy |
| April 30, 2018 (Unaudited) |
| FACTS | WHAT DO THE FUNDS DO WITH YOUR PERSONAL INFORMATION? |
| Why? | Financial companies choose how they share your personal information. Federal law gives consumers the right to limit some but not all sharing. Federal law also requires us to tell you how we collect, share, and protect your personal information. Please read this notice carefully to understand what we do. |
| What? | The types of personal information we collect and share depend on the product or service you have with us. This information can include: |
| | ● Social Security number and account transactions ● Account balances and transaction history ● Wire transfer instructions |
| How? | All financial companies need to share customers’ personal information to run their everyday business. In the section below, we list the reasons financial companies can share their customers’ personal information; the reasons the Funds choose to share; and whether you can limit this sharing. |
| Reasons we can share your personal information | Do the Funds share: | Can you limit this sharing? |
| For our everyday business purposes — such as to process your transactions, maintain your account(s), respond to court orders and legal investigations, or report to credit bureaus | Yes | No |
| For our marketing purposes — to offer our products and services to you | No | We do not share. |
| For joint marketing with other financial companies | No | We do not share. |
| For our affiliates’ everyday business purposes — information about your transactions and experiences | Yes | No |
| For our affiliates’ everyday business purposes — information about your creditworthiness | No | We do not share. |
| For non-affiliates to market to you | No | We do not share. |
44

This material must be accompanied or preceded by the prospectus.

TABLE OF CONTENTS
ANNUAL REPORT
| SHAREHOLDER LETTER | 1 |
| PERFORMANCE UPDATE | 4 |
| DISCLOSURE OF FUND EXPENSES | 6 |
| PORTFOLIO OF INVESTMENTS | 7 |
| STATEMENT OF ASSETS AND LIABILITIES | 17 |
| STATEMENT OF OPERATIONS | 18 |
| STATEMENTS OF CHANGES IN NET ASSETS | 19 |
| FINANCIAL HIGHLIGHTS | 20 |
| NOTES TO FINANCIAL STATEMENTS | 22 |
| REPORT OF INDEPENDENT REGISTERED PUBLIC ACCOUNTING FIRM | 30 |
| ADDITIONAL INFORMATION | 31 |
| SHAREHOLDER VOTING RESULTS | 32 |
| DISCLOSURE REGARDING APPROVAL OF FUND ADVISORY AGREEMENTS | 33 |
| TRUSTEES AND OFFICERS | 36 |
| PRIVACY POLICY | 41 |
Disciplined Growth Investors’ goal is to communicate clearly and transparently with our clients and mutual fund shareholders. It is mutually beneficial when our shareholders understand how we invest, what we are currently thinking and forecasting, and the specific investment decisions we have made. Our views and opinions regarding the investment prospects of our portfolio holdings and the Fund are “forward looking statements” which may or may not be accurate over the long term. While we believe we have a reasonable basis for these forecasts and have confidence in our investment team’s views, actual results may differ materially from those we anticipate. Information provided in this report should not be considered a recommendation to purchase or sell any particular security.
You can identify forward looking statements as those including words such as “believe”, “expect”, “anticipate”, “forecast”, and similar statement. We cannot assure future performance. These forward-looking statements are made only as-of the date of this report. Following the publication of this report, we will not update any of the forward-looking statements included here.
This material must be preceded or accompanied by a prospectus. Please read the prospectus carefully before investing.
THE DISCIPLINED GROWTH INVESTORS FUND
| APRIL 30, 2018 | DGIFUND.COM |
| The Disciplined Growth Investors Fund | Shareholder Letter |
April 30, 2018 (Unaudited)
Updates to The DGI Fund in 2017:
During 2017, we made changes intended to improve your experience as a shareholder. These changes touch everything from the quarterly statements you receive to the Fund’s minimum investment amount and forms; from how we communicate with you to how we promote the Fund to new investors. These are exciting first steps for us in making sure your service experience meets our standards.
Each quarter on your statements we will inform you of how we are doing, how your investment is doing, what you own in the Fund, and what investment decisions we made.
For both new and existing investors, we changed the initial investment minimum in the Fund to include a $100-per-month savings program (as an alternative to the $10,000 initial investment minimum). Along with this, we began updating the account applications and forms to make them easier to complete.
This past February, Disciplined Growth Investors, Inc. (“DGI”) instituted an annual shareholder conference call with our investment team. We will hold this call every year the Tuesday after the pro football championship game.
We also launched a new DGI Fund website using the same www.dgifund.com address. This new website supports our first promotional campaign for the Fund. We have advertisements on busses and billboards in the Minneapolis area. A few examples are below. The goal, along with online advertising, is to catch the attention of more investors like you.

If you live in or visit the Minneapolis area and see these ads, we would love to hear what you think of them.
| Annual Report | April 30, 2018 | 1 |
| The Disciplined Growth Investors Fund | Shareholder Letter |
April 30, 2018 (Unaudited)
Fund Performance and Asset Mix:
The DGI Fund’s fiscal year ends on April 30th each year. For the 2017 fiscal year (5/1/17-4/30/18), The DGI Fund returned 9.75%.
During the fiscal year, The DGI Fund held 39 stocks that increased in value and 15 stocks that declined in value. The ten largest equity holdings accounted for 6.26% of the Fund’s total performance. Stocks in the Fund returned 15.42% while bonds returned 0.08%.*
Past performance is no guarantee of future results.
Stocks in The DGI Fund outperformed the S&P 500’s stocks, which increased 13.27% during the fiscal year. The Fund’s bond portfolio was essentially even through the year in a rising interest rate environment. With 70.2% stocks and 29.8% bonds and cash as of 4/30/18, we have positioned the Fund to reflect our view that the investment environment heavily favors stocks while maintaining an adequate allocation to bonds.
Portfolio Activity:
In the past twelve months, our investment team added six new stocks to The DGI Fund. We sold two holdings and three portfolio companies were acquired. New investments and sales for the first six months of the fiscal year were reported in the semiannual report (10/31/17). Our sole new addition since the semi-annual report we issued six months ago was Medidata solutions.
Medidata Solutions (MDSO) makes software that helps medical companies run official trials to test drugs and devices. We believe the company can become the industry-wide standard for trial planning and execution. After expanding their functionality, several large drug companies have adopted their platform, moving them towards the goal of being the de facto standard in the industry. This confirmation of our investment thesis, and an attractive expected return, caused us to make an initial purchase. Please note that this company is well known to our team because we have owned it for many years in another institutional investment portfolio for smaller companies.
Sincerely,
CFA -- Portfolio Manager
Disciplined Growth Investors, Inc.
| * | Asset class-specific performance is before fees. The Fund’s single fee – the management fee – is paid from the Fund’s holding of cash. Total Fund net-of-fees performance is presented in this letter, later in this annual report, and is updated monthly on the Fund’s website, www.dgifund.com. |
| 2 | 1-855-DGI-FUND (344-3863) | www.DGIfund.com |
| The Disciplined Growth Investors Fund | Shareholder Letter |
April 30, 2018 (Unaudited)
The views of Disciplined Growth Investors, Inc. and information discussed in this commentary are as of the date of publication, are subject to change, and may not reflect the writers’ current views. The views expressed are those of the Fund’s adviser only, and represent an assessment of market conditions at a specific point in time, are opinions only and should not be relied upon as investment advice regarding a particular investment or markets in general. Such information does not constitute a recommendation to buy or sell specific securities or investment vehicles. It should not be assumed that any investment will be profitable or will equal the performance of the portfolios or any securities or any sectors mentioned in this letter. The subject matter contained in this letter has been derived from several sources believed to be reliable and accurate at the time of compilation. Neither Disciplined Growth Investors, Inc. nor the Fund accepts any liability for losses either direct or consequential caused by the use of this information.
The Fund is distributed by ALPS Distributors, Inc.
The Fund is subject to investment risks, including possible loss of the principal amount invested and therefore is not suitable for all investors. The Fund may not achieve its objectives.
Diversification does not eliminate the risk of experiencing investment losses.
Fred Martin is a registered representative of ALPS Distributors, Inc. CFA Institute Marks are trademarks owned by the CFA Institute.
| Annual Report | April 30, 2018 | 3 |
| The Disciplined Growth Investors Fund | Performance Update |
April 30, 2018 (Unaudited)
Annualized Total Return Performance (for the period ended April 30, 2018)
| | 6 month | YTD | 1 Year | 3 Year | 5 Year | Since Inception* |
| Disciplined Growth Investors Fund | 4.31% | 0.20% | 9.75% | 7.31% | 9.92% | 12.04% |
| S&P 500® Total Return Index(1) | 3.82% | -0.38% | 13.27% | 10.57% | 12.96% | 15.21% |
Performance data quoted represents past performance. Past performance does not guarantee future results. Investment return and principal value of an investment will fluctuate so that an investor’s shares, when sold or redeemed, may be worth more or less than the original cost. Current performance data may be higher or lower than actual data quoted. For the most current month-end performance data please call 1.855.DGI.FUND.
The table does not reflect the deductions of taxes a shareholder would pay on Fund distributions or redemptions of Fund shares.
Subject to investment risks, including possible loss of the principal amount invested.
Returns for periods less than 1 year are cumulative.
| * | Fund Inception date of August 12, 2011. |
| (1) | The S&P 500® Total Return Index is an unmanaged index of 500 common stocks chosen for market size, liquidity and industry group representation. It is a market-value weighted index. The Index is not actively managed and does not reflect any deductions for fees, expenses or taxes. An investor may not invest directly in the Index. |
| 4 | 1-855-DGI-FUND (344-3863) | www.DGIfund.com |
| The Disciplined Growth Investors Fund | Performance Update |
April 30, 2018 (Unaudited)
Growth of $10,000 Investment in the Fund (for the period ended April 30, 2018)
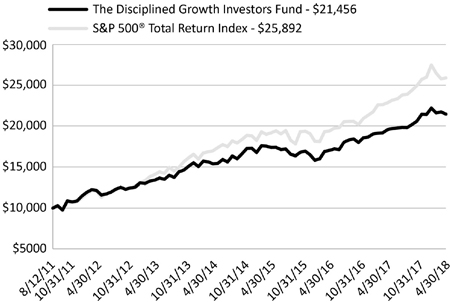
The chart above represents historical performance of a hypothetical investment of $10,000 in the Fund since inception. Past performance does not guarantee future results. This chart does not reflect the deduction of taxes that a shareholder would pay on Fund distributions or the redemption of Fund shares.
Investing in the Fund is subject to investment risks, including possible loss of the principal amount invested.
Industry Sector Allocation
(as a % of Net Assets)*
| Technology | 31.13% |
| Consumer Discretionary | 15.58% |
| Health Care | 12.40% |
| Industrials | 7.39% |
| Financials | 0.72% |
| Energy | 1.94% |
| Closed End Funds | 1.01% |
| Corporate Bonds | 20.81% |
| Foreign Government Bonds | 0.40% |
| Government & Agency Obligations | 3.76% |
| Short Term Investments | 4.63% |
| Other Assets in Excess of Liabilities | 0.23% |
Top Ten Holdings
(as a % of Net Assets)*
| Edwards Lifesciences Corp. | 4.26% |
| U.S. Treasury Note | 3.41% |
| United States Treasury Bill | 3.39% |
| Intuit, Inc. | 3.38% |
| TJX Cos., Inc. | 3.24% |
| Autodesk, Inc. | 3.16% |
| Align Technology, Inc. | 3.13% |
| Intuitive Surgical, Inc. | 3.04% |
| Middleby Corp. | 2.71% |
| Open Text Corp. | 2.49% |
| Top Ten Holdings | 32.21% |
| * | Holdings are subject to change, and may not reflect the current or future position of the portfolio. |
| Annual Report | April 30, 2018 | 5 |
| The Disciplined Growth Investors Fund | Disclosure of Fund Expenses |
April 30, 2018 (Unaudited)
As a shareholder of the Fund, you incur two types of costs: (1) transaction costs, including sales charges (loads) on purchase payments, reinvested dividends, or other distributions; redemption fees; and exchange fees; and (2) ongoing costs, including management fees; distribution and/or service (12b-1) fees; and other fund operating expenses. This example is intended to help you understand your ongoing costs (in dollars), of investing in the Fund and to compare these costs with the ongoing costs of investing in other mutual funds.
This example is based on an investment of $1,000 invested at the beginning of the period and held for the entire six-month period of November 1, 2017 through April 30, 2018.
Actual Expenses The first line of the table below provides information about actual account values and actual expenses. You may use the information in this line, together with the amount you invested, to estimate the expenses that you paid over the period. Simply divide your account value by $1,000 (for example, an $8,600 account value divided by $1,000 = 8.6), then multiply the result by the number in the first line under the heading “Expenses Paid During Period” to estimate the expenses you paid on your account during this period.
Hypothetical Example for Comparison Purposes The second line of the table below provides information about hypothetical account values and hypothetical expenses based on the Fund’s actual expense ratio and an assumed rate of return of 5% per year before expenses, which is not the Fund’s actual return. The hypothetical account values and expenses may not be used to estimate the actual ending account balance or expenses you paid for the period. You may use this information to compare the ongoing costs of investing in the Fund and other mutual funds. To do so, compare this 5% hypothetical example with the 5% hypothetical examples that appear in the shareholder reports of the other funds.
Please note that the expenses shown in the table are meant to highlight your ongoing costs only and do not reflect transactional costs, such as sales charges (loads), redemption fees or exchange fees. Therefore, the second line of the table is useful in comparing ongoing costs only and will not help you determine the relative total costs of owning different funds. In addition, if these transactional costs were included, your costs would have been higher.
| | Beginning
Account Value
11/1/2017 | Ending
Account Value
4/30/2018 | Expense
Ratio(a) | Expenses Paid
During period
11/1/2017 -
4/30/2018(b) |
| Actual | $1,000.00 | $1,043.10 | 0.78% | $3.95 |
| Hypothetical (5% return before expenses) | $1,000.00 | $1,020.93 | 0.78% | $3.91 |
| (a) | The Fund’s expense ratios have been annualized based on the Fund’s most recent fiscal half-year expenses. |
| (b) | Expenses are equal to the Fund’s annualized expense ratio, multiplied by the average account value over the period, multiplied by the number of days in the most recent fiscal half-year (181)/365 (to reflect the half-year period). |
| 6 | 1-855-DGI-FUND (344-3863) | www.DGIfund.com |
| The Disciplined Growth Investors Fund | Portfolio of Investments |
April 30, 2018
| | | Shares | | | Value
(Note 2) | |
| CLOSED END FUNDS (1.01%) | | | | | | | | |
| Altaba, Inc. (a) | | | 29,462 | | | $ | 2,064,697 | |
| | | | | | | | | |
| TOTAL CLOSED END FUNDS | | | | | | | | |
| (Cost $1,085,903) | | | | | | | 2,064,697 | |
| | | | | | | | | |
| COMMON STOCKS (69.16%) | | | | | | | | |
| CONSUMER DISCRETIONARY (15.58%) | | | | | | | | |
| Apparel & Textile Products (1.40%) | | | | | | | | |
| Ralph Lauren Corp. | | | 13,193 | | | | 1,449,251 | |
| Under Armour, Inc., Class A(a) | | | 79,050 | | | | 1,403,928 | |
| | | | | | | | 2,853,179 | |
| | | | | | | | | |
| Automotive (2.14%) | | | | | | | | |
| Gentex Corp. | | | 140,450 | | | | 3,193,833 | |
| Gentherm, Inc. (a) | | | 34,825 | | | | 1,177,085 | |
| | | | | | | | 4,370,918 | |
| | | | | | | | | |
| Gaming, Lodging & Restaurants (2.37%) | | | | | | | | |
| Cheesecake Factory, Inc. | | | 21,687 | | | | 1,126,640 | |
| Royal Caribbean Cruises, Ltd. | | | 34,312 | | | | 3,712,215 | |
| | | | | | | | 4,838,855 | |
| | | | | | | | | |
| Leisure (0.29%) | | | | | | | | |
| TripAdvisor, Inc. (a) | | | 15,612 | | | | 584,201 | |
| | | | | | | | | |
| Passenger Transportation (1.38%) | | | | | | | | |
| JetBlue Airways Corp. (a) | | | 147,000 | | | | 2,820,930 | |
| | | | | | | | | |
| Retail - Consumer Discretionary (8.00%) | | | | | | | | |
| Ethan Allen Interiors, Inc. | | | 65,381 | | | | 1,441,651 | |
| L Brands, Inc. | | | 65,602 | | | | 2,290,166 | |
| Nordstrom, Inc. | | | 48,325 | | | | 2,443,312 | |
| Select Comfort Corp. (a) | | | 82,848 | | | | 2,347,912 | |
| TJX Cos., Inc. | | | 77,925 | | | | 6,611,936 | |
| Urban Outfitters, Inc. (a) | | | 29,550 | | | | 1,189,979 | |
| | | | | | | | 16,324,956 | |
| | | | | | | | | |
| TOTAL CONSUMER DISCRETIONARY | | | | | | | 31,793,039 | |
| Annual Report | April 30, 2018 | 7 |
| The Disciplined Growth Investors Fund | Portfolio of Investments |
April 30, 2018
| | | Shares | | | Value
(Note 2) | |
| ENERGY (1.94%) | | | | | | |
| Oil, Gas & Coal (1.94%) | | | | | | | | |
| Core Laboratories NV | | | 10,862 | | | $ | 1,330,052 | |
| Southwestern Energy Co. (a) | | | 446,693 | | | | 1,831,441 | |
| Ultra Petroleum Corp. (a)(b)(c) | | | 19,213 | | | | 41,846 | |
| Ultra Petroleum Corp. (a) | | | 314,490 | | | | 761,066 | |
| | | | | | | | 3,964,405 | |
| | | | | | | | | |
| TOTAL ENERGY | | | | | | | 3,964,405 | |
| | | | | | | | | |
| FINANCIALS (0.72%) | | | | | | | | |
| Banks (0.72%) | | | | | | | | |
| TCF Financial Corp. | | | 59,362 | | | | 1,473,958 | |
| | | | | | | | | |
| TOTAL FINANCIALS | | | | | | | 1,473,958 | |
| | | | | | | | | |
| HEALTH CARE (12.40%) | | | | | | | | |
| Medical Equipment & Devices (12.40%) | | | | | | | | |
| Align Technology, Inc. (a) | | | 25,575 | | | | 6,389,914 | |
| Edwards Lifesciences Corp. (a) | | | 68,300 | | | | 8,698,688 | |
| Intuitive Surgical, Inc. (a) | | | 14,068 | | | | 6,200,893 | |
| Myriad Genetics, Inc. (a) | | | 39,537 | | | | 1,118,502 | |
| Varian Medical Systems, Inc. (a) | | | 25,100 | | | | 2,901,309 | |
| | | | | | | | 25,309,306 | |
| | | | | | | | | |
| TOTAL HEALTH CARE | | | | | | | 25,309,306 | |
| | | | | | | | | |
| INDUSTRIALS (7.39%) | | | | | | | | |
| Electrical Equipment (0.65%) | | | | | | | | |
| Cognex Corp. | | | 28,450 | | | | 1,315,812 | |
| | | | | | | | | |
| Machinery (3.64%) | | | | | | | | |
| Graco, Inc. | | | 43,086 | | | | 1,895,353 | |
| Middleby Corp. (a) | | | 43,966 | | | | 5,532,682 | |
| | | | | | | | 7,428,035 | |
| | | | | | | | | |
| Manufactured Goods (1.54%) | | | | | | | | |
| Proto Labs, Inc. (a) | | | 26,375 | | | | 3,142,581 | |
| | | | | | | | | |
| Transportation & Logistics (1.56%) | | | | | | | | |
| Landstar System, Inc. | | | 31,375 | | | | 3,189,269 | |
| | | | | | | | | |
| TOTAL INDUSTRIALS | | | | | | | 15,075,697 | |
| 8 | 1-855-DGI-FUND (344-3863) | www.DGIfund.com |
| The Disciplined Growth Investors Fund | Portfolio of Investments |
April 30, 2018
| | | Shares | | | Value
(Note 2) | |
| TECHNOLOGY (31.13%) | | | | | | |
| Design, Manufacturing & Distribution (2.19%) | | | | | | | | |
| Plexus Corp. (a) | | | 81,637 | | | $ | 4,476,973 | |
| | | | | | | | | |
| Hardware (9.08%) | | | | | | | | |
| Dolby Laboratories, Inc., Class A | | | 24,000 | | | | 1,435,680 | |
| Garmin, Ltd. | | | 48,850 | | | | 2,866,030 | |
| Plantronics, Inc. | | | 50,687 | | | | 3,302,258 | |
| Seagate Technology PLC | | | 71,687 | | | | 4,149,960 | |
| Super Micro Computer, Inc. (a) | | | 59,025 | | | | 1,044,743 | |
| Ubiquiti Networks, Inc. (a) | | | 52,137 | | | | 3,715,283 | |
| ViaSat, Inc. (a) | | | 31,381 | | | | 2,007,756 | |
| | | | | | | | 18,521,710 | |
| | | | | | | | | |
| Semiconductors (3.32%) | | | | | | | | |
| Microchip Technology, Inc. | | | 29,075 | | | | 2,432,415 | |
| Power Integrations, Inc. | | | 52,418 | | | | 3,553,940 | |
| Synaptics, Inc. (a) | | | 17,862 | | | | 777,354 | |
| | | | | | | | 6,763,709 | |
| | | | | | | | | |
| Software (12.89%) | | | | | | | | |
| Akamai Technologies, Inc. (a) | | | 52,762 | | | | 3,780,397 | |
| Autodesk, Inc. (a) | | | 51,212 | | | | 6,447,591 | |
| Intuit, Inc. | | | 37,287 | | | | 6,890,265 | |
| Manhattan Associates, Inc. (a) | | | 31,700 | | | | 1,365,002 | |
| Open Text Corp. | | | 144,099 | | | | 5,091,018 | |
| RealPage, Inc. (a) | | | 51,137 | | | | 2,735,829 | |
| | | | | | | | 26,310,102 | |
| | | | | | | | | |
| Technology Services (3.65%) | | | | | | | | |
| FactSet Research Systems, Inc. | | | 20,033 | | | | 3,788,441 | |
| IHS Markit, Ltd. (a) | | | 25,736 | | | | 1,264,410 | |
| Medidata Solutions, Inc. (a) | | | 17,271 | | | | 1,232,458 | |
| Paychex, Inc. | | | 19,337 | | | | 1,171,242 | |
| | | | | | | | 7,456,551 | |
| | | | | | | | | |
| TOTAL TECHNOLOGY | | | | | | | 63,529,045 | |
| | | | | | | | | |
| TOTAL COMMON STOCKS | | | | | | | | |
| (Cost $92,189,489) | | | | | | | 141,145,450 | |
| Annual Report | April 30, 2018 | 9 |
| The Disciplined Growth Investors Fund | Portfolio of Investments |
April 30, 2018
| | | Principal
Amount | | | Value
(Note 2) | |
| CORPORATE BONDS (20.81%) | | | | | | | | |
| COMMUNICATIONS (1.25%) | | | | | | | | |
| Cable & Satellite (0.31%) | | | | | | | | |
| Comcast Corp. | | | | | | | | |
| 3.375% 08/15/2025 | | $ | 648,000 | | | $ | 629,742 | |
| | | | | | | | | |
| Entertainment Content (0.31%) | | | | | | | | |
| CBS Corp. | | | | | | | | |
| 4.000% 01/15/2026 | | | 647,000 | | | | 634,537 | |
| | | | | | | | | |
| Wireless Telecommunications Services (0.63%) | | | | | | | | |
| AT&T, Inc. | | | | | | | | |
| 4.250% 03/01/2027 | | | 635,000 | | | | 631,204 | |
| AT&T, Inc. | | | | | | | | |
| 4.450% 04/01/2024 | | | 4,000 | | | | 4,101 | |
| Verizon Communications, Inc. | | | | | | | | |
| 4.125% 03/16/2027 | | | 645,000 | | | | 644,742 | |
| | | | | | | | 1,280,047 | |
| TOTAL COMMUNICATIONS | | | | | | | 2,544,326 | |
| CONSUMER DISCRETIONARY (2.68%) | | | | | | | | |
| Airlines (0.31%) | | | | | | | | |
| Southwest Airlines Co. | | | | | | | | |
| 3.000% 11/15/2026 | | | 685,000 | | | | 643,585 | |
| | | | | | | | | |
| Apparel & Textile Products (0.32%) | | | | | | | | |
| Cintas Corp. | | | | | | | | |
| 3.700% 04/01/2027 | | | 660,000 | | | | 648,729 | |
| | | | | | | | | |
| Automobiles Manufacturing (0.64%) | | | | | | | | |
| Ford Motor Co. | | | | | | | | |
| 4.346% 12/08/2026 | | | 640,000 | | | | 628,509 | |
| General Motors Co. | | | | | | | | |
| 4.875% 10/02/2023 | | | 650,000 | | | | 670,462 | |
| | | | | | | | 1,298,971 | |
| Restaurants (0.31%) | | | | | | | | |
| McDonald’s Corp. | | | | | | | | |
| 6.300% 03/01/2038 | | | 507,000 | | | | 638,095 | |
| | | | | | | | | |
| Retail - Consumer Discretionary (1.10%) | | | | | | | | |
| Advance Auto Parts, Inc. | | | | | | | | |
| 4.500% 12/01/2023 | | | 620,000 | | | | 635,383 | |
| Advance Auto Parts, Inc. | | | | | | | | |
| 5.750% 05/01/2020 | | | 3,000 | | | | 3,137 | |
| Amazon.com, Inc. | | | | | | | | |
| 5.200% 12/03/2025 | | | 885,000 | | | | 979,696 | |
| 10 | 1-855-DGI-FUND (344-3863) | www.DGIfund.com |
| The Disciplined Growth Investors Fund | Portfolio of Investments |
April 30, 2018
| | | Principal Amount | | | Value (Note 2) | |
| Retail - Consumer Discretionary (continued) | | | | | | | | |
| Lowe’s Cos., Inc. | | | | | | | | |
| 2.500% 04/15/2026 | | $ | 680,000 | | | $ | 622,530 | |
| | | | | | | | 2,240,746 | |
| TOTAL CONSUMER DISCRETIONARY | | | | | | | 5,470,126 | |
| CONSUMER STAPLES (0.98%) | | | | | | | | |
| Food & Beverage (0.30%) | | | | | | | | |
| Anheuser-Busch InBev Finance, Inc. | | | | | | | | |
| 3.650% 02/01/2026 | | | 637,000 | | | | 622,952 | |
| | | | | | | | | |
| Mass Merchants (0.36%) | | | | | | | | |
| Costco Wholesale Corp. | | | | | | | | |
| 2.750% 05/18/2024 | | | 760,000 | | | | 735,440 | |
| | | | | | | | | |
| Supermarkets & Pharmacies (0.32%) | | | | | | | | |
| CVS Health Corp. | | | | | | | | |
| 5.000% 12/01/2024 | | | 620,000 | | | | 651,526 | |
| | | | | | | | | |
| TOTAL CONSUMER STAPLES | | | | | | | 2,009,918 | |
| ENERGY (2.35%) | | | | | | | | |
| Exploration & Production (0.32%) | | | | | | | | |
| Conoco Funding Co. | | | | | | | | |
| 7.250% 10/15/2031 | | | 496,000 | | | | 649,040 | |
| | | | | | | | | |
| Pipeline (2.03%) | | | | | | | | |
| Boardwalk Pipelines LP | | | | | | | | |
| 5.950% 06/01/2026 | | | 602,000 | | | | 645,875 | |
| Enbridge Energy Partners LP | | | | | | | | |
| 5.875% 10/15/2025 | | | 573,000 | | | | 625,901 | |
| Enbridge Energy Partners LP | | | | | | | | |
| 4.200% 09/15/2021 | | | 4,000 | | | | 4,036 | |
| Enterprise Products Operating LLC | | | | | | | | |
| 3.350% 03/15/2023 | | | 647,000 | | | | 640,685 | |
| MarkWest Energy Partners LP / MarkWest Energy Finance Corp. | | | | | | | | |
| 4.500% 07/15/2023 | | | 507,000 | | | | 511,362 | |
| ONEOK Partners LP | | | | | | | | |
| 4.900% 03/15/2025 | | | 556,000 | | | | 576,722 | |
| TransCanada PipeLines, Ltd. | | | | | | | | |
| 7.250% 08/15/2038 | | | 415,000 | | | | 552,865 | |
| Williams Partners LP | | | | | | | | |
| 3.900% 01/15/2025 | | | 603,000 | | | | 587,441 | |
| | | | | | | | 4,144,887 | |
| TOTAL ENERGY | | | | | | | 4,793,927 | |
| Annual Report | April 30, 2018 | 11 |
| The Disciplined Growth Investors Fund | Portfolio of Investments |
April 30, 2018
| | | Principal Amount | | | Value (Note 2) | |
| FINANCIALS (4.05%) | | | | | | |
| Banks (0.31%) | | | | | | |
| Bank of America Corp., Series L | | | | | | | | |
| 4.183% 11/25/2027 | | $ | 655,000 | | | $ | 636,887 | |
| | | | | | | | | |
| Consumer Finance (0.31%) | | | | | | | | |
| American Express Co. | | | | | | | | |
| 3.625% 12/05/2024 | | | 638,000 | | | | 625,608 | |
| | | | | | | | | |
| Diversified Banks (1.24%) | | | | | | | | |
| Citigroup, Inc. | | | | | | | | |
| 4.300% 11/20/2026 | | | 650,000 | | | | 641,117 | |
| JPMorgan Chase & Co. | | | | | | | | |
| 3.375% 05/01/2023 | | | 650,000 | | | | 637,172 | |
| US Bancorp | | | | | | | | |
| 3.100% 04/27/2026 | | | 669,000 | | | | 629,620 | |
| Wells Fargo & Co., Series M | | | | | | | | |
| 3.450% 02/13/2023 | | | 645,000 | | | | 631,920 | |
| | | | | | | | 2,539,829 | |
| Financial Services (1.27%) | | | | | | | | |
| Blackrock, Inc. | | | | | | | | |
| 3.200% 03/15/2027 | | | 670,000 | | | | 644,098 | |
| Morgan Stanley | | | | | | | | |
| 2.750% 05/19/2022 | | | 695,000 | | | | 674,429 | |
| National Rural Utilities Cooperative Finance Corp. | | | | | | | | |
| 2.950% 02/07/2024 | | | 657,000 | | | | 635,183 | |
| Northern Trust Corp. | | | | | | | | |
| 3.950% 10/30/2025 | | | 626,000 | | | | 639,599 | |
| | | | | | | | 2,593,309 | |
| Life Insurance (0.31%) | | | | | | | | |
| Metlife, Inc. | | | | | | | | |
| 3.600% 11/13/2025 | | | 639,000 | | | | 625,687 | |
| | | | | | | | | |
| Property & Casualty Insurance (0.31%) | | | | | | | | |
| American International Group, Inc. | | | | | | | | |
| 3.750% 07/10/2025 | | | 639,000 | | | | 626,403 | |
| | | | | | | | | |
| Real Estate (0.30%) | | | | | | | | |
| Welltower, Inc. | | | | | | | | |
| 4.250% 04/01/2026 | | | 632,000 | | | | 624,249 | |
| | | | | | | | | |
| TOTAL FINANCIALS | | | | | | | 8,271,972 | |
| 12 | 1-855-DGI-FUND (344-3863) | www.DGIfund.com |
| The Disciplined Growth Investors Fund | Portfolio of Investments |
April 30, 2018
| | | Principal Amount | | | Value (Note 2) | |
| HEALTH CARE (1.23%) | | | | | | | | |
| Managed Care (0.62%) | | | | | | | | |
| Anthem, Inc. | | | | | | | | |
| 3.650% 12/01/2027 | | $ | 656,000 | | | $ | 625,025 | |
| UnitedHealth Group, Inc. | | | | | | | | |
| 3.750% 07/15/2025 | | | 632,000 | | | | 631,918 | |
| | | | | | | | 1,256,943 | |
| Pharmaceuticals (0.61%) | | | | | | | | |
| AbbVie, Inc. | | | | | | | | |
| 3.600% 05/14/2025 | | | 639,000 | | | | 620,901 | |
| Johnson & Johnson | | | | | | | | |
| 5.850% 07/15/2038 | | | 497,000 | | | | 633,836 | |
| | | | | | | | 1,254,737 | |
| TOTAL HEALTH CARE | | | | | | | 2,511,680 | |
| INDUSTRIALS (2.83%) | | | | | | | | |
| Aerospace & Defense (0.64%) | | | | | | | | |
| Lockheed Martin Corp. | | | | | | | | |
| 3.100% 01/15/2023 | | | 680,000 | | | | 672,599 | |
| Rockwell Collins, Inc. | | | | | | | | |
| 3.500% 03/15/2027 | | | 670,000 | | | | 636,834 | |
| | | | | | | | 1,309,433 | |
| Commercial Services & Supplies (0.31%) | | | | | | | | |
| Waste Management, Inc. | | | | | | | | |
| 3.150% 11/15/2027 | | | 680,000 | | | | 638,935 | |
| | | | | | | | | |
| Electrical Equipment Manufacturing (0.53%) | | | | | | | | |
| Emerson Electric Co. | | | | | | | | |
| 5.000% 04/15/2019 | | | 1,000 | | | | 1,022 | |
| General Electric Co. | | | | | | | | |
| 5.875% 01/14/2038 | | | 535,000 | | | | 608,028 | |
| Tyco Electronics Group SA | | | | | | | | |
| 3.500% 02/03/2022 | | | 463,000 | | | | 466,049 | |
| | | | | | | | 1,075,099 | |
| Industrial Other (0.23%) | | | | | | | | |
| Fluor Corp. | | | | | | | | |
| 3.375% 09/15/2021 | | | 469,000 | | | | 468,659 | |
| | | | | | | | | |
| Railroad (0.51%) | | | | | | | | |
| Burlington Northern Santa Fe LLC | | | | | | | | |
| 4.700% 10/01/2019 | | | 1,000,000 | | | | 1,025,593 | |
| Burlington Northern Santa Fe LLC | | | | | | | | |
| 3.000% 03/15/2023 | | | 2,000 | | | | 1,965 | |
| | | | | | | | 1,027,558 | |
| Annual Report | April 30, 2018 | 13 |
| The Disciplined Growth Investors Fund | Portfolio of Investments |
April 30, 2018
| | | Principal Amount | | | Value (Note 2) | |
| Transportation & Logistics (0.30%) | | | | | | | | |
| United Parcel Service, Inc. | | | | | | | | |
| 6.200% 01/15/2038 | | $ | 487,000 | | | $ | 617,736 | |
| | | | | | | | | |
| Waste & Environmental Services & Equipment (0.31%) | | | | | | | | |
| Republic Services, Inc. | | | | | | | | |
| 5.500% 09/15/2019 | | | 1,000 | | | | 1,035 | |
| Republic Services, Inc. | | | | | | | | |
| 3.375% 11/15/2027 | | | 670,000 | | | | 633,823 | |
| | | | | | | | 634,858 | |
| TOTAL INDUSTRIALS | | | | | | | 5,772,278 | |
| TECHNOLOGY (0.26%) | | | | | | | | |
| Hardware (0.26%) | | | | | | | | |
| Corning, Inc. | | | | | | | | |
| 6.625% 05/15/2019 | | | 502,000 | | | | 521,125 | |
| | | | | | | | | |
| TOTAL TECHNOLOGY | | | | | | | 521,125 | |
| UTILITIES (5.18%) | | | | | | | | |
| Utilities (5.18%) | | | | | | | | |
| Ameren Illinois Co. | | | | | | | | |
| 9.750% 11/15/2018 | | | 411,000 | | | | 426,193 | |
| Arizona Public Service Co. | | | | | | | | |
| 8.750% 03/01/2019 | | | 415,000 | | | | 435,744 | |
| Baltimore Gas & Electric Co. | | | | | | | | |
| 3.350% 07/01/2023 | | | 557,000 | | | | 554,293 | |
| CenterPoint Energy Resources Corp. | | | | | | | | |
| 4.500% 01/15/2021 | | | 346,000 | | | | 355,297 | |
| CMS Energy Corp. | | | | | | | | |
| 5.050% 03/15/2022 | | | 417,000 | | | | 438,694 | |
| Consolidated Edison Co. of New York, Inc. | | | | | | | | |
| 7.125% 12/01/2018 | | | 516,000 | | | | 528,394 | |
| Dominion Energy, Inc., Series B | | | | | | | | |
| 2.750% 09/15/2022 | | | 695,000 | | | | 667,717 | |
| DTE Energy Co., Series C | | | | | | | | |
| 3.500% 06/01/2024 | | | 645,000 | | | | 631,434 | |
| Duke Energy Corp. | | | | | | | | |
| 3.750% 04/15/2024 | | | 638,000 | | | | 636,720 | |
| Edison International | | | | | | | | |
| 2.400% 09/15/2022 | | | 565,000 | | | | 536,260 | |
| Interstate Power & Light Co. | | | | | | | | |
| 3.650% 09/01/2020 | | | 420,000 | | | | 425,419 | |
| ITC Holdings Corp. | | | | | | | | |
| 4.050% 07/01/2023 | | | 540,000 | | | | 545,920 | |
| Jersey Central Power & Light Co. | | | | | | | | |
| 7.350% 02/01/2019 | | | 521,000 | | | | 537,447 | |
| 14 | 1-855-DGI-FUND (344-3863) | www.DGIfund.com |
| The Disciplined Growth Investors Fund | Portfolio of Investments |
April 30, 2018
| | | Principal Amount | | | Value (Note 2) | |
| Utilities (continued) | | | | | | | | |
| Nevada Power Co. | | | | | | | | |
| 7.125% 03/15/2019 | | $ | 3,000 | | | $ | 3,111 | |
| Oncor Electric Delivery Co. LLC | | | | | | | | |
| 7.000% 09/01/2022 | | | 460,000 | | | | 524,555 | |
| PacifiCorp | | | | | | | | |
| 5.650% 07/15/2018 | | | 17,000 | | | | 17,109 | |
| PPL Capital Funding, Inc. | | | | | | | | |
| 3.500% 12/01/2022 | | | 587,000 | | | | 585,317 | |
| PSEG Power LLC | | | | | | | | |
| 5.125% 04/15/2020 | | | 620,000 | | | | 641,807 | |
| Puget Energy, Inc. | | | | | | | | |
| 5.625% 07/15/2022 | | | 416,000 | | | | 444,104 | |
| Sempra Energy | | | | | | | | |
| 2.875% 10/01/2022 | | | 548,000 | | | | 533,627 | |
| Southern Power Co., Series 15B | | | | | | | | |
| 2.375% 06/01/2020 | | | 565,000 | | | | 555,636 | |
| Wisconsin Electric Power Co. | | | | | | | | |
| 3.100% 06/01/2025 | | | 558,000 | | | | 539,844 | |
| | | | | | | | | |
| TOTAL UTILITIES | | | | | | | 10,564,642 | |
| TOTAL CORPORATE BONDS | | | | | | | | |
| (Cost $43,682,566) | | | | | | | 42,459,994 | |
| | | | | | | | | |
| FOREIGN GOVERNMENT BONDS (0.40%) | | | | | | | | |
| Province of Quebec Canada, Series NN | | | | | | | | |
| 7.125% 02/09/2024 | | | 351,000 | | | | 418,111 | |
| | | | | | | | | |
| Corp Andina de Fomento | | | | | | | | |
| 8.125% 06/04/2019 | | | 375,000 | | | | 396,499 | |
| | | | | | | | | |
| TOTAL FOREIGN GOVERNMENT BONDS | | | | | | | | |
| (Cost $823,085) | | | | | | | 814,610 | |
| | | | | | | | | |
| GOVERNMENT & AGENCY OBLIGATIONS (3.76%) | | | | | | | | |
| U.S. Treasury Note | | | | | | | | |
| 1.500% 01/31/2019 | | | 7,000,000 | | | | 6,964,453 | |
| | | | | | | | | |
| U.S. Treasury Bond | | | | | | | | |
| 1.500% 08/15/2026 | | | 689,000 | | | | 616,144 | |
| Annual Report | April 30, 2018 | 15 |
| The Disciplined Growth Investors Fund | Portfolio of Investments |
April 30, 2018
| | | Principal Amount | | | Value (Note 2) | |
| GOVERNMENT & AGENCY OBLIGATIONS (continued) | | | | | | | | |
| U.S. Treasury Bond | | | | | | | | |
| 6.500% 11/15/2026 | | $ | 77,000 | | | $ | 97,778 | |
| | | | | | | | | |
| TOTAL GOVERNMENT & AGENCY OBLIGATIONS | | | | | | | | |
| (Cost $7,726,664) | | | | | | | 7,678,375 | |
| | | Yield | | Shares | | | Value (Note 2) | |
| SHORT TERM INVESTMENTS (4.63%) | | | | | | | | | | | |
| MONEY MARKET FUND (1.24%) | | | | | | | | | | | |
| Fidelity Institutional Money Market | | | | | | | | | | | |
| Government Portfolio - Class I | | | 1.58 | %(d) | | 2,518,456 | | | | 2,518,456 | |
| | | | | | | | | | | | |
| U.S. TREASURY BILLS (3.39%) | | | | | | | | | | | |
| United States Treasury Bill, 12/06/2018 | | | 1.66 | %(e) | | 7,000,000 | | | | 6,922,498 | |
| | | | | | | | | | | | |
| TOTAL SHORT TERM INVESTMENTS | | | | | | | | | | | |
| (Cost $9,447,373) | | | | | | | | | | 9,440,954 | |
| | | | | | | | | | | | |
| TOTAL INVESTMENTS (99.77%) | | | | | | | | | | | |
| (Cost $154,955,080) | | | | | | | | | $ | 203,604,080 | |
| | | | | | | | | | | | |
| Other Assets In Excess Of Liabilities (0.23%) | | | | | | | | | | 464,397 | |
| | | | | | | | | | | | |
| NET ASSETS (100.00%) | | | | | | | | | $ | 204,068,477 | |
| (a) | Non-Income Producing Security. |
| (b) | As a result of the use of significant unobservable inputs to determine fair value, these investments have been classified as Level 3 assets. See also footnote 2 to the financial statements for additional information. |
| (c) | Restricted security; these securities may only be resold in transactions exempt from registration under the Securities Act of 1933. |
| (d) | Represents the 7-day yield. |
| (e) | Rate shown represents the bond equivalent yield to maturity at date of purchase. |
For Fund compliance purposes, the Fund’s industry classifications refer to any one or more of the industry sub-classifications used by one or more widely recognized market indexes or ratings group indexes, and/or as defined by Fund management. This definition may not apply for purposes of this report, which may combine industry sub-classifications for reporting ease. Industries are shown as a percent of net assets.
See Notes to Financial Statements.
| 16 | 1-855-DGI-FUND (344-3863) | www.DGIfund.com |
| The Disciplined Growth Investors Fund | Statement of Assets and Liabilities |
April 30, 2018
| ASSETS | | | |
| Investments, at value | | $ | 203,604,080 | |
| Receivable for shares sold | | | 150,251 | |
| Dividends and interest receivable | | | 533,192 | |
| Total assets | | | 204,287,523 | |
| | | | | |
| LIABILITIES | | | | |
| Payable for shares redeemed | | | 87,750 | |
| Payable to adviser | | | 131,296 | |
| Total liabilities | | | 219,046 | |
| NET ASSETS | | $ | 204,068,477 | |
| | | | | |
| NET ASSETS CONSIST OF | | | | |
| Paid-in capital (Note 5) | | $ | 154,586,428 | |
| Accumulated net investment income | | | 76,473 | |
| Accumulated net realized gain | | | 756,576 | |
| Net unrealized appreciation | | | 48,649,000 | |
| NET ASSETS | | $ | 204,068,477 | |
| | | | | |
| INVESTMENTS, AT COST | | $ | 154,955,080 | |
| | | | | |
| PRICING OF SHARES | | | | |
| Net Asset Value, offering and redemption price per share | | $ | 19.12 | |
| Shares of beneficial interest outstanding | | | 10,671,798 | |
See Notes to Financial Statements.
| Annual Report | April 30, 2018 | 17 |
| The Disciplined Growth Investors Fund | Statement of Operations |
| | | For the Year Ended April 30, 2018 | |
| INVESTMENT INCOME | | | | |
| Dividends | | $ | 1,266,024 | |
| Foreign taxes withheld | | | (14,636 | ) |
| Interest | | | 1,369,530 | |
| Total investment income | | | 2,620,918 | |
| | | | | |
| EXPENSES | | | | |
| Investment advisory fees (Note 6) | | | 1,441,119 | |
| Total expenses | | | 1,441,119 | |
| NET INVESTMENT INCOME | | | 1,179,799 | |
| | | | | |
| REALIZED AND UNREALIZED GAIN ON INVESTMENTS | | | | |
| Net realized gain on investments | | | 5,798,256 | |
| Net increase from payment by affiliate (Note 6) | | | 36,717 | |
| Net change in unrealized appreciation on investments | | | 9,802,428 | |
| NET REALIZED AND UNREALIZED GAIN ON INVESTMENTS | | | 15,637,401 | |
| NET INCREASE IN NET ASSETS RESULTING FROM OPERATIONS | | $ | 16,817,200 | |
See Notes to Financial Statements.
| 18 | 1-855-DGI-FUND (344-3863) | www.DGIfund.com |
| The Disciplined Growth Investors Fund | Statements of Changes in Net Assets |
| | | For the Year Ended April 30, 2018 | | | For the Year Ended April 30, 2017 | |
| OPERATIONS | | | | | | |
| Net investment income | | $ | 1,179,799 | | | $ | 702,109 | |
| Net realized gain | | | 5,834,973 | | | | 3,378,091 | |
| Net change in unrealized appreciation | | | 9,802,428 | | | | 15,325,356 | |
| Net increase in net assets resulting from operations | | | 16,817,200 | | | | 19,405,556 | |
| | | | | | | | | |
| DISTRIBUTIONS (Note 3) | | | | | | | | |
| From net investment income | | | (1,134,526 | ) | | | (707,562 | ) |
| From net realized gains on investments | | | (6,984,215 | ) | | | (415,680 | ) |
| Net decrease in net assets from distributions | | | (8,118,741 | ) | | | (1,123,242 | ) |
| | | | | | | | | |
| CAPITAL SHARE TRANSACTIONS (Note 5) | | | | | | | | |
| Proceeds from sales of shares | | | 50,597,596 | | | | 40,314,153 | |
| Issued to shareholders in reinvestment of distributions | | | 8,084,564 | | | | 1,115,854 | |
| Cost of shares redeemed, net of redemption fees | | | (23,086,274 | ) | | | (19,795,072 | ) |
| Net increase from capital share transactions | | | 35,595,886 | | | | 21,634,935 | |
| | | | | | | | | |
| Net increase in net assets | | | 44,294,345 | | | | 39,917,249 | |
| | | | | | | | | |
| NET ASSETS | | | | | | | | |
| Beginning of period | | | 159,774,132 | | | | 119,856,883 | |
| End of period* | | $ | 204,068,477 | | | $ | 159,774,132 | |
| | | | | | | | | |
| *Including accumulated net investment income of: | | $ | 76,473 | | | $ | 30,658 | |
| | | | | | | | | |
| OTHER INFORMATION | | | | | | | | |
| Share Transactions | | | | | | | | |
| Issued | | | 2,685,263 | | | | 2,352,037 | |
| Issued to shareholders in reinvestment of distributions | | | 428,168 | | | | 64,640 | |
| Redeemed | | | (1,218,824 | ) | | | (1,149,715 | ) |
| Net increase in share transactions | | | 1,894,607 | | | | 1,266,962 | |
See Notes to Financial Statements.
| Annual Report | April 30, 2018 | 19 |
The Disciplined Growth Investors Fund
| NET ASSET VALUE, BEGINNING OF PERIOD |
| |
| INCOME FROM OPERATIONS |
| Net investment income(a) |
| Net realized and unrealized gain/(loss) on investments |
| Total from investment operations |
| |
| DISTRIBUTIONS |
| From net investment income |
| From net realized gain on investments |
| Total distributions |
| |
| REDEMPTION FEES ADDED TO PAID-IN CAPITAL |
| INCREASE/(DECREASE) IN NET ASSET VALUE |
| NET ASSET VALUE, END OF PERIOD |
| |
| TOTAL RETURN |
| |
| RATIOS AND SUPPLEMENTAL DATA |
| Net assets, end of period (000’s) |
| |
| RATIOS TO AVERAGE NET ASSETS |
| Expenses |
| Net investment income |
| |
| PORTFOLIO TURNOVER RATE |
| (a) | Per share numbers have been calculated using the average shares method. |
| (b) | In 2018 the Fund’s total return consists of a voluntary reimbursement by the advisor for a realized investment loss. Excluding this item, total return would not have been impacted. (Note 6). |
See Notes to Financial Statements.
| 20 | 1-855-DGI-FUND (344-3863) | www.DGIfund.com |
Financial Highlights
For a share outstanding during the periods presented
For the Year Ended April 30, 2018 | | | For the Year Ended April 30, 2017 | | | For the Year Ended April 30, 2016 | | | For the Year Ended April 30, 2015 | | | For the Year Ended April 30, 2014 | |
| $ | 18.20 | | | $ | 15.96 | | | $ | 16.75 | | | $ | 15.02 | | | $ | 13.17 | |
| | | | | | | | | | | | | | | | | | | |
| | 0.12 | | | | 0.09 | | | | 0.09 | | | | 0.10 | | | | 0.07 | |
| | 1.64 | | | | 2.29 | | | | (0.44 | ) | | | 1.83 | | | | 1.90 | |
| | 1.76 | | | | 2.38 | | | | (0.35 | ) | | | 1.93 | | | | 1.97 | |
| | | | | | | | | | | | | | | | | | | |
| | (0.12 | ) | | | (0.09 | ) | | | (0.10 | ) | | | (0.09 | ) | | | (0.07 | ) |
| | (0.72 | ) | | | (0.05 | ) | | | (0.34 | ) | | | (0.11 | ) | | | (0.05 | ) |
| | (0.84 | ) | | | (0.14 | ) | | | (0.44 | ) | | | (0.20 | ) | | | (0.12 | ) |
| | | | | | | | | | | | | | | | | | | |
| | – | | | | – | | | | – | | | | – | | | | – | |
| | 0.92 | | | | 2.24 | | | | (0.79 | ) | | | 1.73 | | | | 1.85 | |
| $ | 19.12 | | | $ | 18.20 | | | $ | 15.96 | | | $ | 16.75 | | | $ | 15.02 | |
| | | | | | | | | | | | | | | | | | | |
| | 9.75 | %(b) | | | 14.96 | % | | | (2.05 | %) | | | 12.87 | % | | | 15.02 | % |
| | | | | | | | | | | | | | | | | | | |
| $ | 204,068 | | | $ | 159,774 | | | $ | 119,857 | | | $ | 113,342 | | | $ | 86,741 | |
| | | | | | | | | | | | | | | | | | | |
| | 0.78 | % | | | 0.78 | % | | | 0.78 | % | | | 0.78 | % | | | 0.78 | % |
| | 0.64 | % | | | 0.50 | % | | | 0.59 | % | | | 0.61 | % | | | 0.47 | % |
| | | | | | | | | | | | | | | | | | | |
| | 18 | % | | | 16 | % | | | 13 | % | | | 14 | % | | | 10 | % |
| Annual Report | April 30, 2018 | 21 |
| The Disciplined Growth Investors Fund | Notes to Financial Statements |
April 30, 2018
1. ORGANIZATION
Financial Investors Trust (the “Trust”), a Delaware statutory trust, is an open-end management investment company registered under the Investment Company Act of 1940, as amended (“1940 Act”). The Trust consists of multiple separate portfolios or series. This annual report describes The Disciplined Growth Investors Fund (the “Fund”). The Fund seeks long-term capital growth and as a secondary objective, modest income with reasonable risk.
2. SIGNIFICANT ACCOUNTING POLICIES
The accompanying financial statements were prepared in accordance with accounting principles generally accepted in the United States of America (“U.S. GAAP”). The preparation of financial statements in conformity with U.S. GAAP requires management to make certain estimates and assumptions that affect the reported amounts of assets and liabilities and disclosures of contingent assets and liabilities at the date of the financial statements and the reported amounts of revenue and expenses during the period. Actual results could differ from those estimates. The Fund is considered an investment company for financial reporting purposes under U.S. GAAP and follows the accounting and reporting guidance applicable to investment companies in the Financial Accounting Standards Board Accounting Standards Codification Topic 946. The following is a summary of significant accounting policies consistently followed by the Fund in preparation of its financial statements.
Investment Valuation: The Fund generally values its securities based on market prices determined at the close of regular trading on the New York Stock Exchange (“NYSE”), normally 4:00 p.m. Eastern Time, on each day the NYSE is open for trading.
For equity securities and mutual funds that are traded on an exchange, the market price is usually the closing sale or official closing price on that exchange. In the case of equity securities not traded on an exchange, or if such closing prices are not otherwise available, the securities are valued at the mean of the most recent bid and ask prices on such day. Redeemable securities issued by open-end registered investment companies are valued at the investment company’s applicable net asset value, with the exception of exchange-traded open-end investment companies, which are priced as equity securities.
The market price for debt obligations is generally the price supplied by an independent third-party pricing service approved by the Board of Trustees (the “Board”), which may use a matrix, formula or other objective method that takes into consideration quotations from dealers, market transactions in comparable investments, market indices and yield curves. If vendors are unable to supply a price, or if the price supplied is deemed to be unreliable, the market price may be determined using quotations received from one or more broker–dealers that make a market in the security. Fixed-income obligations, excluding municipal securities, having a remaining maturity of greater than 60 days, are typically valued at the mean between the evaluated bid and ask prices formulated by an independent pricing service. Corporate Bonds, U.S. Government & Agency, and U.S. Treasury Bonds & Notes are valued using market models that consider trade data, quotations from dealers and active market makers, relevant yield curve and spread data, creditworthiness, trade data or market information on comparable securities, and other relevant security specific information. Mortgage-related and asset-backed securities are valued based on models that consider trade
| 22 | 1-855-DGI-FUND (344-3863) | www.DGIfund.com |
| The Disciplined Growth Investors Fund | Notes to Financial Statements |
April 30, 2018
data, prepayment and default projections, benchmark yield and spread data and estimated cash flows of each tranche of the issuer. Publicly traded foreign government debt securities are typically traded internationally in the over-the-counter market and are valued at the mean between the bid and asked prices as of the close of business of that market.
When such prices or quotations are not available, or when Disciplined Growth Investors, Inc. (the “Adviser”) believes that they are unreliable, securities may be priced using fair value procedures approved by the Board.
Fair Value Measurements: The Fund discloses the classification of its fair value measurements following a three-tier hierarchy based on the inputs used to measure fair value. Inputs refer broadly to the assumptions that market participants would use in pricing the asset or liability, including assumptions about risk. Inputs may be observable or unobservable. Observable inputs reflect the assumptions market participants would use in pricing the asset or liability that are developed based on market data obtained from sources independent of the reporting entity. Unobservable inputs reflect the reporting entity’s own assumptions about the assumptions market participants would use in pricing the asset or liability that are developed based on the best information available.
Various inputs are used in determining the value of the Fund’s investments as of the end of the reporting period. When inputs used fall into different levels of the fair value hierarchy, the level in the hierarchy within which the fair value measurement falls is determined based on the lowest level input that is significant to the fair value measurement in its entirety. The designated input levels are not necessarily an indication of the risk or liquidity associated with these investments. These inputs are categorized in the following hierarchy under applicable financial accounting standards:
| Level 1 – | Unadjusted quoted prices in active markets for identical investments, unrestricted assets or liabilities that the Fund has the ability to access at the measurement date; |
| Level 2 – | Quoted prices which are not active, quoted prices for similar assets or liabilities in active markets or inputs other than quoted prices that are observable (either directly or indirectly) for substantially the full term of the asset or liability; and |
| Level 3 – | Significant unobservable prices or inputs (including the Fund’s own assumptions in determining the fair value of investments) where there is little or no market activity for the asset or liability at the measurement date. |
| Annual Report | April 30, 2018 | 23 |
| The Disciplined Growth Investors Fund | Notes to Financial Statements |
April 30, 2018
The following is a summary of each input used to value the Fund as of April 30, 2018:
| Investments in Securities at Value | | Level 1 - Unadjusted Quoted Prices | | | Level 2 - Other Significant Observable Inputs | | | Level 3 - Significant Unobservable Inputs | | | Total | |
| Closed End Funds | | $ | 2,064,697 | | | $ | – | | | $ | – | | | $ | 2,064,697 | |
| Common Stocks | | | | | | | | | | | | | | | | |
| Consumer Discretionary | | | 31,793,039 | | | | – | | | | – | | | | 31,793,039 | |
| Energy | | | 3,922,559 | | | | – | | | | 41,846 | | | | 3,964,405 | |
| Financials | | | 1,473,958 | | | | – | | | | – | | | | 1,473,958 | |
| Health Care | | | 25,309,306 | | | | – | | | | – | | | | 25,309,306 | |
| Industrials | | | 15,075,697 | | | | – | | | | – | | | | 15,075,697 | |
| Technology | | | 63,529,045 | | | | – | | | | – | | | | 63,529,045 | |
| Corporate Bonds(a) | | | – | | | | 42,459,994 | | | | – | | | | 42,459,994 | |
| Foreign Government Bonds | | | – | | | | 814,610 | | | | – | | | | 814,610 | |
| Government & Agency | | | | | | | | | | | | | | | | |
| Obligations | | | – | | | | 7,678,375 | | | | – | | | | 7,678,375 | |
| Short Term Investments | | | | | | | | | | | | | | | | |
| Money Market Fund | | | 2,518,456 | | | | – | | | | – | | | | 2,518,456 | |
| U.S. Treasury Bills | | | – | | | | 6,922,498 | | | | – | | | | 6,922,498 | |
| TOTAL | | $ | 145,686,757 | | | $ | 57,875,477 | | | $ | 41,846 | | | $ | 203,604,080 | |
| (a) | For detailed descriptions of the underlying industries, see the accompanying Portfolio of Investments. |
The Fund recognizes transfers between levels as of the end of the period. For the year ended April 30, 2018, the Fund did not have any transfers between Level 1 and Level 2 securities.
The following is a reconciliation of the investments in which significant unobservable inputs (Level 3) were used in determining fair value:
| Investments in Securities at Value | | Balance as of 04/30/2017 | | | Return of Capital | | | Realized Gain/(Loss) | | | Change in Unrealized Appreciation/ Depreciation | | | Purchases | | | Sales Proceeds | | | Transfer in and/or (out) of Level 3 | | | Balance as of 04/30/2018 | | | Net change in unrealized appreciation/ (depreciation) attributable to Level 3 investments held at 04/30/2018 | |
| Common Stocks | | $ | 193,667 | | | $ | – | | | $ | – | | | $ | (151,821 | ) | | $ | – | | | $ | – | | | $ | – | | | $ | 41,846 | | | $ | (151,821 | ) |
| Total | | $ | 193,667 | | | $ | – | | | $ | – | | | $ | (151,821 | ) | | $ | – | | | $ | – | | | $ | – | | | $ | 41,846 | | | $ | (151,821 | ) |
Net change in unrealized appreciation/depreciation on Level 3 securities is included on the Statement of Operations under Net change in unrealized appreciation on investments.
| 24 | 1-855-DGI-FUND (344-3863) | www.DGIfund.com |
| The Disciplined Growth Investors Fund | Notes to Financial Statements |
April 30, 2018
Investment Transactions and Investment Income: Investment transactions are accounted for on the date the investments are purchased or sold (trade date). Realized gains and losses from investment transactions are reported on an identified cost basis, which is the same basis the Fund uses for federal income tax purposes. Interest income, which includes accretion of discounts, is accrued and recorded as earned. Dividend income is recognized on the ex-dividend date or for certain foreign securities, as soon as information is available to the Fund.
Trust Expenses: Some expenses of the Trust can be directly attributed to the Fund. Expenses which cannot be directly attributed to the Fund are apportioned among all funds in the Trust based on average net assets of each fund.
Fund Expenses: Expenses that are specific to the Fund are charged directly to the Fund.
Federal Income Taxes: The Fund complies with the requirements under Subchapter M of the Internal Revenue Code of 1986, as amended, applicable to regulated investment companies and intends to distribute substantially all of their net taxable income and net capital gains, if any, each year so that it will not be subject to excise tax on undistributed income and gains. The Fund is not subject to income taxes to the extent such distributions are made.
As of and during the year ended April 30, 2018, the Fund did not have a liability for any unrecognized tax benefits. The Fund files U.S. federal, state, and local tax returns as required. The Fund’s tax returns are subject to examination by the relevant tax authorities until expiration of the applicable statute of limitations, which is generally three years after the filing of the tax return for federal purposes and four years for most state returns. Tax returns for open years have incorporated no uncertain tax positions that require a provision for income taxes.
Distributions to Shareholders: The Fund normally pays dividends, if any, quarterly and distributes capital gains, if any, on an annual basis. Income dividend distributions are derived from dividends and other income the Fund receives from its investments, including short term capital gains. Long term capital gain distributions are derived from gains realized when the Fund sells a security it has owned for more than a year. The Fund may make additional distributions and dividends at other times if the portfolio manager believes doing so may be necessary for the Fund to avoid or reduce taxes.
3. TAX BASIS INFORMATION
Reclassifications: As of April 30, 2018, permanent differences in book and tax accounting were reclassified. These differences had no effect on net assets and were primarily attributed to minor differences between book and tax characterizations of paydown transactions.
The reclassifications as of April 30, 2018 were as follows:
| Fund | | Paid-in Capital | | | Accumulated Net Investment Income | | | Accumulated Net Realized Gain/(Loss) on Investments | |
| The Disciplined Growth Investors Fund | | $ | – | | | $ | 542 | | | $ | (542 | ) |
| Annual Report | April 30, 2018 | 25 |
| The Disciplined Growth Investors Fund | Notes to Financial Statements |
April 30, 2018
Tax Basis of Investments: As of April 30, 2018, the aggregate cost of investments, gross unrealized appreciation/ (depreciation) and net unrealized appreciation for Federal tax purposes was as follows:
| | | The Disciplined Growth Investors Fund | |
| Gross appreciation (excess of value over tax cost) | | $ | 57,992,211 | |
| Gross depreciation (excess of tax cost over value) | | | (9,343,348 | ) |
| Net unrealized appreciation | | $ | 48,648,863 | |
| Cost of investments for income tax purposes | | $ | 154,955,217 | |
Components of Earnings: As of April 30, 2018, components of distributable earnings were as follows:
| Undistributed ordinary income | | $ | 151,718 | |
| Accumulated capital gains | | | 681,468 | |
| Net unrealized appreciation on investments | | | 48,648,863 | |
| Total | | $ | 49,482,049 | |
Tax Basis of Distributions to Shareholders: The character of distributions made during the year from net investment income or net realized gains may differ from its ultimate characterization for federal income tax purposes. Also, due to the timing of dividend distributions, the fiscal year in which amounts are distributed may differ from the fiscal year in which the income or realized gain was recorded by the Fund.
The tax character of distributions paid during the year ended April 30, 2018, were as follows:
| | | Ordinary Income | | | Long-Term Capital Gain | |
| The Disciplined Growth Investors Fund | | $ | 1,182,759 | | | $ | 6,935,982 | |
The tax character of distributions paid during the year ended April 30, 2017, were as follows:
| | | Ordinary Income | | | Long-Term Capital Gain | |
| The Disciplined Growth Investors Fund | | $ | 833,014 | | | $ | 290,228 | |
| 26 | 1-855-DGI-FUND (344-3863) | www.DGIfund.com |
| The Disciplined Growth Investors Fund | Notes to Financial Statements |
April 30, 2018
4. SECURITIES TRANSACTIONS
During the year ended April 30, 2018, equity holdings, asset/mortgage backed securities, fixed income securities and U.S. Treasury Bonds were transferred in-kind into the Fund. The intent of the transfers was to save on equity transaction costs both for the new shareholders at the institution they transferred from and for the Fund on the addition of assets. The assets of four separate accounts were transferred-in-kind into the Fund in the amount of $19,146,064.
The cost of purchases and proceeds from sales of securities (excluding short-term securities, transfers-in-kind, and U.S. Government Obligations) during the year ended April 30, 2018, were as follows:
| Fund | | Purchases of Securities | | | Proceeds From Sales of Securities | |
| The Disciplined Growth Investors Fund | | $ | 40,017,805 | | | $ | 30,673,311 | |
Investment transactions in U.S. Government Obligations (excluding transfers-in-kind) during the year ended April 30, 2018 were as follows:
| Fund | | Purchases of Securities | | | Proceeds From Sales of Securities | |
| The Disciplined Growth Investors Fund | | $ | 6,974,883 | | | $ | – | |
5. SHARES OF BENEFICIAL INTEREST
The capitalization of the Trust consists of an unlimited number of shares of beneficial interest with no par value per share. Holders of the shares of the Fund of the Trust have one vote for each share held and a proportionate fraction of a vote for each fractional share. All shares issued and outstanding are fully paid and are transferable and redeemable at the option of the shareholder. Purchasers of the shares do not have any obligation to make payments to the Trust or its creditors (other than the purchase price for the shares or make contributions to the Trust or its creditors solely by reason of the purchasers’ ownership of the shares. Shares have no pre-emptive rights.
Prior to September 1, 2015, shares redeemed within 90 days of purchase may have incurred a 2% short-term redemption fee deducted from the redemption amount. Effective September 1, 2015, the Fund no longer imposes redemption fees. For the year ended April 30, 2018, the Fund did not receive any redemption fees.
6. MANAGEMENT AND RELATED-PARTY TRANSACTIONS
The Adviser, subject to the authority of the Board, is responsible for the overall management and administration of the Fund’s business affairs. The Adviser manages the investments of the Fund in accordance with the Fund’s investment objective, policies and limitations and investment guidelines established jointly by the Adviser and the Trustees. Pursuant to the Advisory Agreement, the Fund pays the Adviser a unitary management fee for the services and facilities it provides payable on a monthly basis at the annual rate of 0.78% of the Fund’s average daily net assets. The management fee is paid on a monthly basis.
| Annual Report | April 30, 2018 | 27 |
| The Disciplined Growth Investors Fund | Notes to Financial Statements |
April 30, 2018
Out of the unitary management fee, the Adviser pays substantially all expenses of the Fund, including the cost of transfer agency, custody, fund administration, bookkeeping and pricing services, legal, audit and other services, except for interest expenses, brokerage expenses, taxes and extraordinary expenses not incurred in the ordinary course of the Fund’s business. Also included are Trustee fees which were $3,755 for the year ended April 30, 2018.
Payment from Affiliate
For the year ended April 30, 2018, the Fund was reimbursed $36,717 from the Advisor as a result of a trading error.
Fund Administrator Fees and Expenses
ALPS Fund Services, Inc. (“ALPS”) serves as administrator to the Fund. Pursuant to an Administration Agreement, ALPS provides operational services to the Fund including, but not limited to, fund accounting and fund administration and generally assists in the Fund’s operations. Officers of the Trust are employees of ALPS. The Fund’s administration fee is accrued on a daily basis and paid monthly. The Administrator is also reimbursed for certain out-of-pocket expenses. The administrative fee and out-of-pocket expenses are included in the unitary management fee paid to the Adviser.
Transfer Agent
ALPS serves as transfer, dividend paying and shareholder servicing agent for the Fund. ALPS receives an annual minimum fee, a fee based upon the number of shareholder accounts, and is also reimbursed for certain out-of-pocket expenses. The fee and out-of-pocket expenses are included in the unitary management fee paid to the Adviser.
Compliance Services
ALPS provides services that assist the Trust’s chief compliance officer in monitoring and testing the policies and procedures of the Trust in conjunction with requirements under Rule 38a-1 under the 1940 Act and receives an annual base fee. ALPS is reimbursed for certain out-of-pocket expenses. The fee and out-of-pocket expenses are included in the unitary management fee paid to the Adviser.
Principal Financial Officer
ALPS receives an annual fee for providing principal financial officer services to the Fund. The fee is included in the unitary management fee paid to the Adviser.
Distributor
ALPS Distributors, Inc. (“ADI” or the “Distributor”) (an affiliate of ALPS) acts as the distributor of the Fund’s shares pursuant to a Distribution Agreement with the Trust. Shares are sold on a continuous basis by ADI as agent for the Fund, and ADI has agreed to use its best efforts to solicit orders for the sale of the Fund’s shares, although it is not obliged to sell any particular amount of shares. ADI is not entitled to any compensation for its services as Distributor. ADI is registered as a broker-dealer with the Securities and Exchange Commission.
| 28 | 1-855-DGI-FUND (344-3863) | www.DGIfund.com |
| The Disciplined Growth Investors Fund | Notes to Financial Statements |
April 30, 2018
7. INDEMNIFICATIONS
Under the Trust’s organizational documents, its officers and Trustees are indemnified against certain liability arising out of the performance of their duties to the Trust. Additionally, in the normal course of business, the Trust enters into contracts with service providers that may contain general indemnification clauses, which may permit indemnification to the extent permissible under applicable law. The Trust’s maximum exposure under these arrangements is unknown, as this would involve future claims that may be made against the Trust that have not yet occurred.
| Annual Report | April 30, 2018 | 29 |
| The Disciplined Growth Investors Fund | Report of Independent Registered Public Accounting Firm |
To the shareholders and the Board of Trustees of Financial Investors Trust
Opinion on the Financial Statements and Financial Highlights
We have audited the accompanying statement of assets and liabilities, including the portfolio of investments, of The Disciplined Growth Investors Fund (the “Fund”), one of the funds constituting the Financial Investors Trust, as of April 30, 2018, the related statement of operations for the year then ended, the statements of changes in net assets for each of the two years in the period then ended, the financial highlights for each of the five years in the period then ended, and the related notes. In our opinion, the financial statements and financial highlights present fairly, in all material respects, the financial position of The Disciplined Growth Investors Fund of Financial Investors Trust as of April 30, 2018, the results of its operations for the year then ended, the changes in its net assets for each of the two years in the period then ended, and the financial highlights for each of the five years in the period then ended in conformity with accounting principles generally accepted in the United States of America.
Basis for Opinion
These financial statements and financial highlights are the responsibility of the Fund’s management. Our responsibility is to express an opinion on the Fund’s financial statements and financial highlights based on our audits. We are a public accounting firm registered with the Public Company Accounting Oversight Board (United States) (PCAOB) and are required to be independent with respect to the Fund in accordance with the U.S. federal securities laws and the applicable rules and regulations of the Securities and Exchange Commission and the PCAOB.
We conducted our audits in accordance with the standards of the PCAOB. Those standards require that we plan and perform the audit to obtain reasonable assurance about whether the financial statements and financial highlights are free of material misstatement, whether due to error or fraud. The Fund is not required to have, nor were we engaged to perform, an audit of its internal control over financial reporting. As part of our audits we are required to obtain an understanding of internal control over financial reporting but not for the purpose of expressing an opinion on the effectiveness of the Fund’s internal control over financial reporting. Accordingly, we express no such opinion.
Our audits included performing procedures to assess the risks of material misstatement of the financial statements and financial highlights, whether due to error or fraud, and performing procedures that respond to those risks. Such procedures included examining, on a test basis, evidence regarding the amounts and disclosures in the financial statements and financial highlights. Our audits also included evaluating the accounting principles used and significant estimates made by management, as well as evaluating the overall presentation of the financial statements and financial highlights. Our procedures included confirmation of securities owned as of April 30, 2018, by correspondence with the custodian and brokers; when replies were not received from brokers, we performed other auditing procedures. We believe that our audits provide a reasonable basis for our opinion.
DELOITTE & TOUCHE LLP
Denver, Colorado
June 26, 2018
We have served as the auditor of one or more investment companies advised by Disciplined Growth Investors, Inc. since 2012.
| 30 | 1-855-DGI-FUND (344-3863) | www.DGIfund.com |
| The Disciplined Growth Investors Fund | Additional Information |
April 30, 2018 (Unaudited)
1. FUND HOLDINGS
The Fund files its complete schedule of portfolio holdings with the Securities and Exchange Commission (the “SEC”) for the first and third quarters of each fiscal year on Form N-Q within 60 days after the end of the period. Copies of the Fund’s Form N-Q are available without charge on the SEC website at http://www.sec.gov. You may also review and copy the Form N-Q at the SEC’s Public Reference Room in Washington, DC. For more information about the operation of the Public Reference Room, please call the SEC at 1-800-SEC-0330.
2. FUND PROXY VOTING POLICIES, PROCEDURES AND SUMMARIES
The Fund’s policies and procedures used in determining how to vote proxies and information regarding how the Fund voted proxies relating to portfolio securities during the most recent prior 12-month period ending June 30 are available without charge, (1) upon request, by calling (toll-free) 855-DGI-Fund and (2) on the SEC’s website at http://www.sec.gov.
3. TAX DESIGNATIONS
The Fund designates the following for federal income tax purposes for distributions made during the calendar year ended December 31, 2017:
| Dividend Received Deduction | 70.81% |
| Qualified Dividend Income | 100.00% |
Pursuant to Section 852(b)(3) of the Internal Revenue Code, the Disciplined Growth Investors Fund designated $6,935,982 as long-term capital gain dividends.
In early 2018, if applicable, shareholders of record received this information for the distributions paid to them by the Fund during the calendar year 2017 via Form 1099. The Fund will notify shareholders in early 2019 of amounts paid to them by the Fund, if any, during the calendar year 2018.
| Annual Report | April 30, 2018 | 31 |
| The Disciplined Growth Investors Fund | Shareholder Voting Results |
April 30, 2018 (Unaudited)
A Special Meeting of Shareholders of the Fund was held on February 12, 2018. Shareholders of record as of the close of business on December 26, 2017 voted to approve the following proposal:
Proposal: To approve a new Advisory Agreement among Financial Investors Trust, on behalf of the Fund, and Disciplined Growth Investors, Inc.
Shares Voted In Favor | Shares Voted Against or Abstentions |
| 5,830,167 | 5,582 |
| 32 | 1-855-DGI-FUND (344-3863) | www.DGIfund.com |
| The Disciplined Growth Investors Fund | Disclosure Regarding Approval of Fund Advisory Agreements |
April 30, 2018 (Unaudited)
On December 12, 2017, the Trustees met in person to discuss, among other things, the approval of an interim investment advisory agreement (the “Interim Agreement”) and a new investment advisory agreement (the “New Agreement”), each between the Trust and the Adviser (collectively, the “Agreements”), in accordance with Section 15(c) of the 1940 Act.
In approving the Interim Agreement, the Trustees, including the Independent Trustees, considered the following factors with respect to the DGI Fund:
Compensation: The compensation to be received under the Interim Agreement is the same compensation as is being received under the current investment advisory agreement between the Trust and the Adviser (the “Current Agreement”).
Nature, Extent, and Quality of the Services: The scope and quality of services under the Interim Agreement are the same as those under the Current Agreement.
Termination: The Interim Agreement includes a provision for termination by the Board or the DGI Fund’s shareholders upon not more than 10 calendar days’ written notice to DGI.
Terms and Conditions: The terms and conditions in the Interim Agreement are substantially the same as those in the Current Agreement, except for the effective and termination dates and the inclusion of specific provisions required by Rule 15a-4 of the 1940 Act.
In determining whether to recommend that DGI Fund shareholders approve the New Agreement, the Trustees, including the Independent Trustees, considered the following factors with respect to the DGI Fund, but did not identify any single factor as all-important or controlling:
| ● | The assurances from DGI that the way the DGI Fund’s assets are managed will not change in any material manner, that the personnel who currently manage the Fund’s assets will continue to do so after the Transaction, and that there is not expected to be any diminution in the nature, quality and extent of services provided to the Fund; |
| ● | The fact that the material terms of the New Agreement, including the fees payable by the DGI Fund, are substantively identical to the material terms of the Current Agreement; |
| ● | The history, reputation, qualifications and background of DGI and its key personnel; |
| ● | The fact that DGI Fund shareholders will not bear any costs relating to the Transaction, insofar as DGI and its affiliates thereof have agreed to pay such expenses, including proxy solicitation expenses; |
| ● | Information provided by representatives of DGI regarding the anticipated impact of the Transaction; and |
| ● | Other factors described in greater detail below. |
In approving the Agreements, the Trustees, including the Independent Trustees, also considered the following factors with respect to the DGI Fund:
Investment Advisory Fee Rate: The Trustees reviewed and considered the contractual annual advisory fee to be paid by the Trust, on behalf of the DGI Fund, to DGI, of 0.78% of the Fund’s daily net assets, in light of the extent and quality of the advisory services to be provided by DGI to
| Annual Report | April 30, 2018 | 33 |
| The Disciplined Growth Investors Fund | Disclosure Regarding Approval of Fund Advisory Agreements |
April 30, 2018 (Unaudited)
the DGI Fund. The Trustees noted that the advisory fee is a “unitary” fee whereby DGI pays substantially all expenses of the DGI Fund from the advisory fee, including the cost of transfer agency, custody, fund administration, bookkeeping and pricing services, legal, audit and other services, except for interest expenses, brokerage expenses, taxes and extraordinary expenses not incurred in the ordinary course of the Fund’s business.
The Board received and considered information including a comparison of the DGI Fund’s contractual advisory fee rate with those of funds in the expense group and universe of funds provided by an independent provider of investment company data (the “Data Provider”). The Trustees noted that the DGI Fund’s contractual advisory fee rate was above the Data Provider peer group median, at least in part because of the additional scope of services under the unitary fee arrangement.
Total Expense Ratios: The Trustees noted that the total expense ratio was attributable entirely to the unitary fee payable to DGI. The Trustees further reviewed and considered that the DGI Fund’s total expense ratio of 0.78% was below the Data Provider peer group median.
Nature, Extent, and Quality of the Services: The Trustees received and considered information regarding the nature, extent, and quality of services to be provided to the DGI Fund under the Agreements, including potential changes as a result of the Transaction. The Trustees reviewed certain background materials supplied by DGI in its presentation, including its Form ADV.
The Trustees reviewed and considered DGI’s investment advisory personnel, its history as an asset manager, and its performance and the amount of assets currently under management by DGI and its affiliated entities. The Trustees also reviewed the research and decision-making processes utilized by DGI, including the methods adopted to seek to achieve compliance with the investment objectives, policies, and restrictions of the DGI Fund.
The Trustees considered the background and experience of DGI’s management in connection with the DGI Fund, including reviewing the qualifications, backgrounds, and responsibilities of the management team primarily responsible for the day-to-day portfolio management of the Fund and the extent of the resources devoted to research and analysis of actual and potential investments.
The Trustees also reviewed, among other things, DGI’s insider trading policies and procedures and its Code of Ethics.
Performance: The Trustees reviewed performance information for the DGI Fund for the 3-month, 1-year, 3-year, 5-year, and since inception periods ended September 30, 2017. That review included a comparison of the DGI Fund’s performance to the performance of the group of comparable funds selected by the Data Provider. The Trustees noted that the performance of the DGI Fund was below the Data Provider universe median for the 3-month and 1-year periods, but top quartile for the 5-year period and top decile for the 3-year and since inception periods. The Trustees also considered DGI’s discussion of its reputation generally and its investment techniques, risk management controls, and decision-making processes.
| 34 | 1-855-DGI-FUND (344-3863) | www.DGIfund.com |
| The Disciplined Growth Investors Fund | Disclosure Regarding Approval of Fund Advisory Agreements |
April 30, 2018 (Unaudited)
Comparable Accounts: The Trustees noted certain information provided by DGI regarding fees charged to its other clients utilizing a strategy similar to that employed by the DGI Fund.
Profitability: The Trustees received and considered a retrospective and projected profitability analysis prepared by DGI based on the fees payable under the Agreements with respect to the DGI Fund. The Trustees considered the profits, if any, anticipated to be realized by DGI in connection with the operation of the Fund. The Board then reviewed DGI’s audited financial statements for the years ended December 31, 2016 and 2015 in order to analyze the financial condition and stability and profitability of DGI.
Economies of Scale: The Trustees considered whether economies of scale in the provision of services to the DGI Fund will be passed along to the shareholders under the proposed agreements.
Other Benefits to the Adviser: The Trustees reviewed and considered any other incidental benefits derived or to be derived by DGI from its relationship with the DGI Fund, including whether soft dollar arrangements were used.
In approving the Agreements and the fees charged under the Agreements, the Trustees concluded that no single factor reviewed by the Trustees was identified by the Trustees to be determinative as the principal factor in whether to approve the Agreements. Further, the Independent Trustees were advised by separate independent legal counsel throughout the process. The Trustees, including all of the Independent Trustees, concluded that:
| ● | the DGI Fund’s contractual advisory fee rate was above the Data Provider peer group median; |
| ● | the DGI Fund’s total expense ratio was below its Data Provider peer group median; |
| ● | the nature, extent and quality of services rendered by DGI under the Agreements with respect to the DGI Fund would be adequate; |
| ● | for the period ended September 30, 2017, the performance of the DGI Fund was below the Data Provider universe median for the 3-month and 1-year periods, but top quartile for the 5-year period and top decile for the 3-year and since inception periods; |
| ● | bearing in mind the limitations of comparing different types of managed accounts and the different levels of service typically associated with such accounts, the fee structures applicable to DGI’ other clients employing a comparable strategy to the DGI Fund was not indicative of any unreasonableness with respect to the advisory fee payable by the Fund; |
| ● | the profit, if any, realized by DGI in connection with the operation of the Fund is not unreasonable to the Fund; and |
| ● | there were no material economies of scale or other incidental benefits accruing to DGI in connection with its relationship with the DGI Fund. |
Based on the Trustees’ deliberations and their evaluation of the information described above, the Trustees, including all of the Independent Trustees, concluded that DGI’s compensation for investment advisory services is consistent with the best interests of the DGI Fund and its shareholders.
| Annual Report | April 30, 2018 | 35 |
| The Disciplined Growth Investors Fund | Trustees and Officers |
| | April 30, 2018 (Unaudited) |
Additional information regarding the Fund’s trustees is included in the Statement of Additional Information, which can be obtained without charge by calling 877-421-5078.
INDEPENDENT TRUSTEES
| Name, Address* & Year of Birth | Position(s) Held with Fund | Term of Office** and Length of Time Served | Principal Occupation(s) During Past 5 Years*** | Number of Funds in Fund Complex Overseen by Trustee**** | Other Directorships Held by Trustee During Past 5 Years*** |
Mary K. Anstine,
1940 | Trustee and Chairman | Ms. Anstine was elected at a special meeting of shareholders held on March 21, 1997 and re-elected at a special meeting of shareholders held on August 7, 2009. Ms. Anstine was appointed Chairman of the Board at the June 6, 2017 meeting of the Board of Trustees. | Ms. Anstine was formerly an Executive Vice President of First Interstate Bank of Denver until 1994, President/Chief Executive Officer of HealthONE Alliance, Denver, Colorado, from 1994 to 2004, and has been retired since 2004. Ms. Anstine is also Trustee/Director of AV Hunter Trust and Colorado Uplift Board. Ms. Anstine was formerly a Director of the Trust Bank of Colorado (later purchased and now known as Northern Trust Bank), HealthONE and Denver Area Council of the Boy Scouts of America, and a member of the American Bankers Association Trust Executive Committee. | 32 | Ms. Anstine is a Trustee of ALPS ETF Trust (21 funds); ALPS Variable Investment Trust (9 funds); Reaves Utility Income Fund (1 fund); and Westcore Trust (14 funds). |
Jeremy W. Deems,
1976 | Trustee | Mr. Deems was appointed as a Trustee at the March 11, 2008 meeting of the Board of Trustees and elected at a special meeting of shareholders held on August 7, 2009. | Mr. Deems is the Co-Founder, Chief Operations Officer and Chief Financial Officer of Green Alpha Advisors, LLC, a registered investment advisor, and Co- Portfolio Manager of the Shelton Green Alpha Fund. Prior to joining Green Alpha Advisors, Mr. Deems was CFO and Treasurer of Forward Management, LLC, ReFlow Management Co., LLC, ReFlow Fund, LLC, a private investment fund, and Sutton Place Management, LLC, an administrative services company, from 1998 to June 2007. From 2004 to 2005, Mr Deems also served as Treasurer of the Forward Funds and the Sierra Club Funds. | 32 | Mr. Deems is a Trustee of ALPS ETF Trust (21 funds); ALPS Variable Investment Trust (9 funds); Clough Funds Trust (1 fund); and Reaves Utility Income Fund (1 fund). |
| 36 | 1-855-DGI-FUND (344-3863) | www.DGIfund.com |
| The Disciplined Growth Investors Fund | Trustees and Officers |
| | April 30, 2018 (Unaudited) |
INDEPENDENT TRUSTEES (continued)
| Name, Address* & Year of Birth | Position(s) Held with Fund | Term of Office** and Length of Time Served | Principal Occupation(s) During Past 5 Years*** | Number of Funds in Fund Complex Overseen by Trustee**** | Other Directorships Held by Trustee During Past 5 Years*** |
Jerry G. Rutledge,
1944 | Trustee | Mr. Rutledge was elected at a special meeting of shareholders held on August 7, 2009. | Mr. Rutledge is the President and owner of Rutledge’s Inc., a retail clothing business. He served as Director of University of Colorado Hospital from 2008 to 2016. He was from 1994 to 2007 a Regent of the University of Colorado. | 32 | Mr. Rutledge is a Trustee of Principal Real Estate Fund (1 fund), Clough Global Dividend and Income Fund (1 fund), Clough Global Equity Fund (1 fund) and Clough Global Opportunities Fund (1 fund). |
Michael “Ross” Shell,
1970 | Trustee | Mr. Shell was elected at a special meeting of shareholders held on August 7, 2009. | Mr. Shell is Founder and CEO of Red Idea, LLC, a strategic consulting/early stage venture firm (since June 2008). From 1999 to 2009, he was a part-owner and Director of Tesser, Inc., a brand agency. From December 2005 to May 2008, he was Director, Marketing and Investor Relations, of Woodbourne, a REIT/real estate hedge fund and private equity firm. Prior to this, from May 2004 to November 2005, he worked as a business strategy consultant; from June 2003 to April 2004, he was on the Global Client Services team of IDEO, a product design/innovation firm; and from 1999 to 2003, he was President of Tesser, Inc. Mr. Shell graduated with honors from Stanford University with a degree in Political Science. | 32 | None. |
| Annual Report | April 30, 2018 | 37 |
| The Disciplined Growth Investors Fund | Trustees and Officers |
| | April 30, 2018 (Unaudited) |
INTERESTED TRUSTEE
| Name, Address* & Year of Birth | Position(s) Held with Fund | Term of Office** and Length of Time Served | Principal Occupation(s) During Past 5 Years*** | Number of Funds in Fund Complex Overseen by Trustee**** | Other Directorships Held by Trustee During Past 5 Years*** |
Edmund J. Burke,
1961 | Trustee and President | Mr. Burke was elected as Trustee at a special meeting of shareholders held on August 7, 2009. Mr. Burke was elected President of the Trust at the December 17, 2002 meeting of the Board of Trustees. | Mr. Burke is President and a Director of ALPS Holdings, Inc. (“AHI”) and ALPS Advisors, Inc. (“AAI”), and Director of Boston Financial Data Services, Inc. (“BFDS”), ALPS Distributors, Inc. (“ADI”), ALPS Fund Services, Inc. (“AFS”) and ALPS Portfolio Solutions Distributor, Inc. (“APSD”). Because of his positions with AHI, BFDS, AAI, ADI, AFS and APSD, Mr. Burke is deemed an affiliate of the Trust as defined under the 1940 Act. | 32 | Mr. Burke is a Trustee of Clough Global Dividend and Income Fund (1 fund); Clough Global Equity Fund (1 fund); Clough Global Opportunities Fund (1 fund); Clough Funds Trust (1 fund); Liberty All-Star Equity Fund (1 fund); Director of the Liberty All-Star Growth Fund, Inc. (1 fund); Trustee of ALPS ETF Trust (21 funds). |
| 38 | 1-855-DGI-FUND (344-3863) | www.DGIfund.com |
| The Disciplined Growth Investors Fund | Trustees and Officers |
| | April 30, 2018 (Unaudited) |
OFFICERS
| Name, Address* & Year of Birth | Position(s) Held with Fund | Term of Office** and Length of Time Served | Principal Occupation(s) During Past 5 Years*** |
Kimberly R. Storms,
1972 | Treasurer | Ms. Storms was elected Treasurer of the Trust at the March 12, 2013 meeting of the Board of Trustees. | Ms. Storms is Senior Vice President - Director of Fund Administration of ALPS. Because of her position with ALPS, Ms. Storms is deemed an affiliate of the Trust as defined under the 1940 Act. Ms. Storms is also Treasurer of Liberty All-Star Equity Fund, Liberty All-Star Growth Fund, Inc., ALPS Series Trust and Elevation ETF Trust. Ms. Storms also serves as a Board member and Treasurer of The Center for Trauma & Resilience, a nonprofit agency. |
Karen S. Gilomen,
1970 | Secretary | Ms. Gilomen was elected Secretary of the Trust at the December 13, 2016 meeting of the Board of Trustees. | Ms. Gilomen joined ALPS in August 2016 as Vice President and Senior Counsel. Prior to joining ALPS, Ms. Gilomen was Vice President - General Counsel & CCO of Monticello Associates, Inc. from 2010 to 2016. Because of her position with ALPS, Ms. Gilomen is deemed an affiliate of the Trust, as defined under the 1940 Act. Ms. Gilomen is also the Secretary of Clough Funds Trust, Clough Global Dividend and Income Fund, Clough Global Equity Fund, Clough Global Opportunities Fund, Reaves Utility Income Fund, and the Assistant Secretary of the WesMark Funds. |
Ted Uhl,
1974 | Chief Compliance Officer (“CCO”) | Mr. Uhl was appointed CCO of the Trust at the June 8, 2010 meeting of the Board of Trustees. | Mr. Uhl joined ALPS in October 2006, and is currently Deputy Compliance Officer of ALPS. Prior to his current role, Mr. Uhl served as Senior Risk Manager for ALPS from October 2006 until June 2010. Before joining ALPS, Mr. Uhl served a Sr. Analyst with Enenbach and Associates (RIA), and a Sr. Financial Analyst at Sprint. Because of his position with ALPS, Mr. Uhl is deemed an affiliate of the Trust as defined under the 1940 Act. Mr. Uhl is also CCO of the Boulder Growth & Income Fund, Inc., Centre Funds, Elevation ETF Trust, Index Funds, Reality Shares ETF Trust and Reaves Utility Income Fund. |
Jennell Panella,
1974 | Assistant Treasurer | Ms. Panella was elected Assistant Treasurer of the Trust at the September 15, 2015 meeting of the Board of Trustees | Ms. Panella joined ALPS in June 2012 and is currently Fund Controller of ALPS Fund Services, Inc. Prior to joining ALPS, Ms. Panella served as Financial Reporting Manager for Parker Global Strategies, LLC (2009-2012). Because of her position with ALPS, Ms. Panella is deemed an affiliate of the Trust as defined under the 1940 Act. Ms. Panella also serves as Assistant Treasurer of James Advantage Funds. |
| Annual Report | April 30, 2018 | 39 |
| The Disciplined Growth Investors Fund | Trustees and Officers |
| | April 30, 2018 (Unaudited) |
OFFICERS (continued)
| Name, Address* & Year of Birth | Position(s) Held with Fund | Term of Office** and Length of Time Served | Principal Occupation(s) During Past 5 Years*** |
Alan Gattis,
1980 | Assistant Treasurer | Mr. Gattis was elected Assistant Treasurer of the Trust at the September 13, 2016 meeting of the Board of Trustees | Mr. Gattis joined ALPS in 2011 and is currently Vice President and Fund Controller of ALPS. Prior to joining ALPS, Mr. Gattis was an Auditor at Spicer Jeffries LLP (2009 through 2011) and an Auditor at PricewaterhouseCoopers LLP (2004 - 2009). Because of his position with ALPS, Mr. Gattis is deemed an affiliate of the Trust as defined under the 1940 Act. Mr. Gattis is also Assistant Treasurer of ALPS Series Trust and Elevation ETF Trust. |
Sharon Akselrod,
1974 | Assistant Secretary | Ms. Akselrod was elected Assistant Secretary of the Trust at the September 15, 2015 meeting of the Board of Trustees. | Ms. Akselrod joined ALPS in August 2014 and is currently Senior Investment Company Act Paralegal of ALPS Fund Services, Inc. Prior to joining ALPS, Ms. Akselrod served as Corporate Governance and Regulatory Associate for Nordstrom fsb (2013-2014) and Senior Legal Assistant – Legal Manager for AXA Equitable Life Insurance Company (2008-2013). Because of her position with ALPS, Ms. Akselrod is deemed an affiliate of the Trust as defined under the 1940 Act. Ms. Akselrod is also Assistant Secretary of ALPS ETF Trust and Principal Real Estate Fund. |
Jennifer Craig,
1973 | Assistant Secretary | Ms. Craig was elected Assistant Secretary of the Trust at the June 8, 2016 meeting of the Board of Trustees. | Ms. Craig joined ALPS in 2007 and is currently Assistant Vice President and Paralegal Manager of ALPS. Prior to joining ALPS, Ms. Craig was Legal Manager at Janus Capital Management LLC and served as Assistant Secretary of Janus Investment Fund, Janus Adviser Series and Janus Aspen Series. Because of her position with ALPS, Ms. Craig is deemed an affiliate of the Trust as defined under the 1940 Act. Ms. Craig is also Assistant Secretary of Clough Global Dividend and Income Fund, Clough Global Equity Fund, Clough Global Opportunities Fund, Clough Funds Trust, Liberty All-Star Equity Fund, Liberty All-Star Growth Fund, Inc. and ALPS Series Trust. |
Sareena Khwaja-Dixon,
1980 | Assistant Secretary | Ms. Khwaja-Dixon was elected Assistant Secretary of the Trust at the December 12, 2017 meeting of the Board of Trustees. | Ms. Khwaja-Dixon joined ALPS in August 2015 and is currently Senior Counsel and Vice President of ALPS Fund Services, Inc. Prior to joining ALPS, Ms. Khwaja-Dixon served as a Senior Paralegal/Paralegal for Russell Investments (2011 – 2015). Ms. Khwaja-Dixon is also Secretary of Liberty All-Star Equity Fund and Liberty All-Star Growth Fund, Inc., and Assistant Secretary of Clough Funds Trust, Clough Dividend and Income Fund, Clough Global Opportunities Fund and Clough Global Equity Fund. |
| * | All communications to Trustees and Officers may be directed to Financial Investors Trust c/o 1290 Broadway, Suite 1100, Denver, CO 80203. |
| ** | This is the period for which the Trustee or Officer began serving the Trust. Each Trustee serves an indefinite term, until his successor is elected. Officers are elected on an annual basis. |
| *** | Except as otherwise indicated, each individual has held the office shown or other offices in the same company for the last five years. |
| **** | The Fund Complex includes all series of the Trust (currently 32) and any other investment companies for which any Trustee serves as trustee for and which Disciplined Growth Investors, Inc. provides investment advisory services (currently none). |
| 40 | 1-855-DGI-FUND (344-3863) | www.DGIfund.com |
| The Disciplined Growth Investors Fund | Privacy Policy |
| WHO WE ARE | |
| Who is providing this notice? | The Disciplined Growth Investors Fund |
| WHAT WE DO | |
| How does the Fund protect my personal information? | To protect your personal information from unauthorized access and use, we use security measures that comply with federal law. These measures include computer safeguards and secured files and buildings. |
| How does the Fund collect my personal information? | We collect your personal information, for example, when you ● open an account ● provide account information or give us your contact information ● make a wire transfer or deposit money |
| Why can’t I limit all sharing? | Federal law gives you the right to limit only ● sharing for affiliates’ everyday business purposes- information about your creditworthiness ● affiliates from using your information to market to you ● sharing for non-affiliates to market to you State laws and individual companies may give you additional rights to limit sharing. |
| DEFINITIONS | |
| Affiliates | Companies related by common ownership or control. They can be financial and nonfinancial companies. |
| Non-affiliates | Companies not related by common ownership or control. They can be financial and nonfinancial companies. ● The Fund does not share with non-affiliates so they can market to you. |
| Joint marketing | A formal agreement between non-affiliated financial companies that together market financial products or services to you. ● The Fund does not jointly market. |
| Annual Report | April 30, 2018 | 41 |
| The Disciplined Growth Investors Fund | Privacy Policy |
| FACTS | WHAT DOES THE FUND DO WITH YOUR PERSONAL INFORMATION? |
| WHY? | Financial companies choose how they share your personal information. Federal law gives consumers the right to limit some but not all sharing. Federal law also requires us to tell you how we collect, share, and protect your personal information. Please read this notice carefully to understand what we do. |
| WHAT? | The types of personal information we collect and share depend on the product or service you have with us. This information can include: ● Social Security number and account transactions ● Account balances and transaction history ● Wire transfer instructions |
| HOW? | All financial companies need to share customers’ personal information to run their everyday business. In the section below, we list the reasons financial companies can share their customers’ personal information; the reasons the Fund chooses to share; and whether you can limit this sharing. |
| REASONS WE CAN SHARE YOUR PERSONAL INFORMATION | DOES THE FUND SHARE: | CAN YOU LIMIT THIS SHARING? |
For our everyday business purposes – such as to process your transactions, maintain your account(s), respond to court orders and legal investigations, or report to credit bureaus | Yes | No |
For our marketing purposes – to offer our products and services to you | No | We do not share. |
| For joint marketing with other financial companies | No | We do not share. |
For our affiliates’ everyday business purposes – information about your transactions and experiences | Yes | No |
For our affiliates’ everyday business purposes – information about your creditworthiness | No | We do not share. |
| For non-affiliates to market to you | No | We do not share. |
| 42 | 1-855-DGI-FUND (344-3863) | www.DGIfund.com |
| The Disciplined Growth Investors Fund | Privacy Policy |
| OTHER IMPORTANT INFORMATION |
| California Residents | If your account has a California home address, your personal information will not be disclosed to nonaffiliated third parties except as permitted by applicable California law, and we will limit sharing such personal information with our affiliates to comply with California privacy laws that apply to us. |
| Vermont Residents | The State of Vermont requires financial institutions to obtain your consent prior to sharing personal information that they collect about you with affiliated companies and nonaffiliated third parties other than in certain limited circumstances. Except as permitted by law, we will not share personal information we collect about you with nonaffiliated third parties or other affiliated companies unless you provide us with your written consent to share such information. |
| Annual Report | April 30, 2018 | 43 |

THIS MATERIAL MUST BE PRECEDED OR ACCOMPANIED BY A PROSPECTUS.
THE DISCIPLINED GROWTH INVESTORS FUND IS DISTRIBUTED BY ALPS DISTRIBUTORS, INC.
TABLE OF CONTENTS
| Manager Commentary | |
| Emerald Growth Fund | 1 |
| Emerald Small Cap Value Fund | 6 |
| Emerald Insights Fund | 12 |
| Emerald Banking and Finance Fund | 16 |
| Disclosure of Fund Expenses | 22 |
| Schedule of Investments | |
| Emerald Growth Fund | 24 |
| Emerald Small Cap Value Fund | 26 |
| Emerald Insights Fund | 28 |
| Emerald Banking and Finance Fund | 30 |
| Statements of Assets and Liabilities | 32 |
| Statements of Operations | 33 |
| Statements of Changes in Net Assets | |
| Emerald Growth Fund | 34 |
| Emerald Small Cap Value Fund | 35 |
| Emerald Insights Fund | 37 |
| Emerald Banking and Finance Fund | 38 |
| Financial Highlights | |
| Emerald Growth Fund | 40 |
| Emerald Small Cap Value Fund | 44 |
| Emerald Insights Fund | 48 |
| Emerald Banking and Finance Fund | 52 |
| Notes to Financial Statements | 56 |
| Report of Independent Registered Public Accounting Firm | 65 |
| Disclosure Regarding Approval of Fund Advisory Agreements | 66 |
| Additional Information | 68 |
| Trustees & Officers | 69 |
| Privacy Policy | 74 |
| Emerald Growth Fund | Manager Commentary |
April 30, 2018 (Unaudited)
April 30, 2018
Dear Shareholders:
Investment Results:
The performance of the Emerald Growth Fund’s Class A shares (without sales load), for the twelve months ended April 30, 2018, advanced by 19.06% outpacing the Russell 2000® Growth Index(1) which appreciated by 16.60%.
The last twelve months have been a tale of two parts. Calendar year 2017 was a record year for the S&P 500® Index(2). While the S&P 500® Index’s total return of 21.8% was certainly notable, it wasn’t the return that set records, it was the index’s seemingly unrelenting advance. In the process of hitting all-time highs 62 times during the course of the year (Source: https://www.marketwatch.com/story/sp-500-breaks-54-year-old-record-for-all-time-highs-notched-in-january-2018-01-23), the index recorded a positive return in each and every month of 2017, representing the first time in the history of the S&P 500® Index that this has occurred. The volatility of returns was similarly low with the worst drop from the peak of 2017 limited to just 2.8%. The driving force behind these consistent gains and low volatility were the collective combination of the broad-based synchronized acceleration in global economic growth, improving forward looking economic indicators and strong corporate profit recovery. The market backdrop however shifted dramatically entering 2018, and after a strong start to January with the S&P 500® Index advancing 7.5% in the first 18 days of trading, the S&P 500® Index over the proceeding weeks and months retraced, erasing early gains as uncertainty and volatility rose in tandem. While the absolute change in volatility has been dramatic, the factors driving the market’s volatility have varied from month to month with inverse volatility ETF’s, inflationary fears, Federal Reserve (Fed) concerns, the specter of a trade war with China, fears of peaking growth rates of both global economic and corporate earnings, a flattening yield curve, the surge in LIBOR (London Interbank Offered Rate) and the widening TED spread (the spread between 3-month LIBOR and 3-month Treasury Bill) all contributing to spiking volatility and the market’s rising wall of worry.
Despite all of the concerns that have gated market returns on year-to-date basis, the underlying fundamental factors that have driven the market over the last 12 months remain firmly intact. Domestic economic growth appears to be reaccelerating after a weaker than expected first quarter report and corporate earnings and outlooks have continued to demonstrate resounding strength. According to FactSet’s May 4, 2018 Earnings Insight report, the blended earnings growth for Q1 S&P 500 earnings per share currently stands at 24.2%, better than the 11.3% expected at the start of the quarter. The blended revenue growth rate is 8.5%. Of the 81% of S&P 500 companies that have now reported as of the May 4, 2018 FactSet Report for Q1, 78% have beaten consensus earnings expectations, better than the one-year average of 74% and above the 70% five-year average. In addition, 77% have surpassed consensus sales expectations, above the 70% one-year average and the 57% five-year average. While it is true that some of the benefit to year over year earnings growth is coming from tax reform (estimated 1000 bps contribution to earnings growth), revenue growth is exceeding expectations and meaningfully contributing to the upside relative to consensus expectations. Forward earnings guidance has been equally impressive. Bank of America Merrill Lynch, in a May 7, 2018 earnings update report indicated that guidance this earnings season has been stronger than expected with management guiding above consensus two times as much as below consensus, which represents the best monthly ratio since 2010. While we agree that the rate of corporate earnings growth is unlikely to accelerate beyond the 24% achieved during the first quarter, in our opinion the fact that revenue growth has accelerated sequentially and is tracking better than expectations is encouraging and supportive of ongoing strength.
This strong corporate earnings backdrop has been favorable for growth stocks which have demonstrated meaningful outperformance relative to their value counterparts. Small capitalization growth stocks as measured by the Russell 2000® Growth Index for the trailing 12-month period ended April 28, 2018 appreciated by 16.60% outpacing small capitalization value stocks as measured by Russell 2000® Value Index(3) which gained a more modest 11.54%.
Investment Analysis:
On a relative basis, the portfolio outpaced the benchmark for the trailing period as the positive contribution to return from stock selection within the financial services, technology, utilities, and healthcare sectors offset relative underperformance within the producer durables, consumer discretionary and materials sectors.
The financial services sector was the largest contributor to return for the trailing period as stock selection within the consumer lending, banking, and diversified financial services industries contributed to the relative outperformance.
The technology sector also contributed positively to return driven by a combination of the portfolio’s relative overweight position and stock selection within the electronics, communication technology, electronic entertainment, semiconductor, and telecommunications equipment industries. The portfolio also demonstrated relative outperformance within the utilities and healthcare sectors driven largely by stock selection within the telecommunications, biotechnology and healthcare services industries.
| Annual Report | April 30, 2018 | 1 |
| Emerald Growth Fund | Manager Commentary |
April 30, 2018 (Unaudited)
Relative outperformance in the aforementioned was partially offset by relative underperformance within the producer durables, consumer discretionary and materials sectors. Performance within the producer durables sector was the most significant detractor to performance as challenging stock selection within the industrial machinery, air transport, trucking and construction industries offset relative outperformance within the aerospace industry.
Performance within the consumer discretionary and materials sectors also detracted from returns as the collective negative contribution from stock selection within the consumer services, restaurant, casinos and gambling, and glass industries weighed on relative performance.
Exiting April 2018, the portfolio held the largest active exposure to the financial services, energy, technology and utilities sectors. Thoughts on those sectors and other areas of notable opportunity/ portfolio exposure are highlighted below:
The portfolio has maintained its overweight to the financial services sector, with a notable overweight to the banking and consumer lending industries. Emerald continues to believe that the underlying fundamentals of small cap community bank stocks remain attractive and in fact begin to look more attractive when we add in the benefits from reduced corporate tax rates, possible regulatory relief, loan growth that outpaces that of their large cap brethren and continued rate increases from the Fed.
Specific to the technology sector, the portfolio is overweight the communications technology, electronics, computer technology and computer software and services industries. Software remains the portfolio’s largest absolute industry exposure with holdings focused on areas of secular growth such as enterprise security and vertical software. We believe that security spending will continue to be strong given the current fundamental backdrop, which includes a number of high profile attacks (i.e. Wannacry and Equifax) and the implementation of the new General Data Protection Regulation (GDPR) in Europe in 2018. Further, we see the potential for enterprise software spending to accelerate in 2018 in response to increased corporate profits, increased investment by the financial services industry (20% of technology spending), deregulation and better spending in Europe.
The portfolio also maintains an overweight position to the utilities sector. Within the utilities sector, Emerald continues to believe that adoption of unified communications among mid-market and enterprise customers is in the very early stages and that the segment will continue to expand, shifting market leadership from traditional telephony equipment providers to a new group of software/network centric companies.
The portfolio also holds a meaningful absolute weighting within the healthcare sector. The healthcare sector also remains an area of meaningful exposure within the portfolio, although the portfolio remains underweight relative to the benchmark. At the industry level, the biotechnology industry remains the largest aggregate exposure. Emerald remains optimistic regarding the ongoing opportunity within the biotechnology industry given the high-level of innovation and the substantive progress being witnessed in drug development amidst what continues to be a very accommodating FDA (46 new drugs were approved over the course of 2017). Further, Emerald also believes that the biotechnology industry could be a beneficiary if merger and acquisition activity accelerates during 2018.
Market Outlook:
As we look to the balance of calendar 2018, while the recent market narrative has been altered by the uncertainty related to global trade and peaking rates of global growth, the fundamental underpinnings of our optimism entering 2018 remain firmly intact. Global economic growth in aggregate remains strong and the earnings outlook has improved thanks to lower taxes and better top-line growth. As a result of rising earnings and more muted first quarter market returns, valuations across the equity universe have gotten more reasonable. All of these factors on a fundamental basis keep us highly encouraged.
While positive on the underlying fundamentals of the marketplace, we remain mindful of the growing list of uncertainties that have driven the acceleration in volatility year to date. Of these, trade tensions have moved to the top of the list as a trade war with China could have broad implications to growth and inflation. Although we are more inclined to expect a rational and potentially beneficial outcome to trade discussions, the markets daily handicapping of the vast array of potential outcomes is likely to keep volatility elevated. Further, we continue to monitor inflation, the direction of monetary policy, the shape of the yield curve(4), credit conditions, and the direction of the dollar. Geopolitical risk similarly remains elevated in our view as is domestic political/policy risk, particularly as it relates to the outcome of mid-term elections and the implications to U.S. congressional control. While the list of risks is long and evolving each of these issues independently has the potential to be disruptive to the market. That being said with all of these risks acknowledged, Emerald continues to believe that the improving global economic backdrop will be supportive of further positive revisions in forward earnings growth and market returns. Within this backdrop, we believe small capitalization stocks are particularly well positioned as we move through the balance of 2018.
| 2 | www.emeraldmutualfunds.com |
| Emerald Growth Fund | Manager Commentary |
April 30, 2018 (Unaudited)
| Top Contributors: | Top Detractors: | |
| LendingTree, Inc. | Nutrisystem Inc. | |
| Chegg Inc. | Spirit Airlines Inc. | |
| Sarepta Therapeutics Inc. | Tile Shop Holdings Inc. | |
| Ignyta Inc. | MicroStrategy Incorporated | |
| Varonis Systems Inc. | Apogee Enterprises Inc. | |
| | | |
| Kenneth G. Mertz II, CFA | Stacey L. Sears | Joseph W. Garner |
| Chief Investment Officer | Portfolio Manager | Portfolio Manager |
| Portfolio Manager | | |
Emerald Mutual Fund Advisers Trust
Past performance does not guarantee future results. Fund prices fluctuate as the underlying assets have exposure to market fluctuations and other risks, as described in the Fund’s prospectus. Please visit www.emeraldmutualfunds.com to obtain current performance information and for the current prospectus and statement of additional information. This material must be preceded or accompanied by a prospectus. Please read the prospectus carefully before investing.
The views of Emerald Mutual Fund Advisers Trust and information discussed in this commentary are as of the date of publication, are subject to change, and may not reflect the writer’s current views. The views expressed are those of the author only, and represent an assessment of market conditions at a specific point in time, are opinions only and should not be relied upon as investment advice regarding a particular investment or markets in general. Such information does not constitute a recommendation to buy or sell specific securities or investment vehicles. It should not be assumed that any investment will be profitable or will equal the performance of the Fund or any securities or any sectors mentioned in this letter. The subject matter contained in this letter has been derived from several sources believed to be reliable and accurate at the time of compilation. Neither Emerald Mutual Fund Advisers Trust nor the Fund accepts any liability for losses either direct or consequential caused by the use of this information. The Emerald Growth Fund is distributed by ALPS Distributors, Inc.
The Fund is subject to investment risks, including possible loss of the principal amount invested and therefore is not suitable for all investors. The Fund may not achieve its objectives.
Diversification does not eliminate the risk of experiencing investment losses.
| (1) | The Russell 2000® Growth Index measures the performance of the small-cap growth segment of the U.S. equity universe. It includes those Russell 2000® Index companies with higher price-to-value ratios and higher forecasted growth values. The Index is not actively managed and does not reflect any deductions for fees, expenses or taxes. An investor may not invest directly into the Index. |
| (2) | The S&P 500® Index is an unmanaged index of 500 common stocks chosen for the market size, liquidity and industry group representation. It is a market-value weighted index. The Index is not actively managed and does not reflect any deduction for fees, expenses or taxes. An investor may not invest directly into the Index. |
| (3) | The Russell 2000® Value Index measures the performance of small-cap value segment of the U.S. equity universe. It includes those Russell 2000 companies with lower price-to-book ratios (A ratio used to compare a stock’s market value to its book value. It is calculated by dividing the current closing price of the stock by the latest quarter’s book value per share.) and lower forecasted growth values. The Index is not actively managed and does not reflect any deductions for fees, expenses or taxes. An investor may not invest directly into the Index. |
| (4) | A yield curve is a line that plots the interest rates, at a set point in time, of bonds having equal credit quality but differing maturity dates. The most frequently reported yield curve compares the three-month, two-year, five-year and 30-year U.S. Treasury debt. This yield curve is used as a benchmark for other debt in the market, such as mortgage rates or bank lending rates, and it is also used to predict changes in economic output and growth. |
| Annual Report | April 30, 2018 | 3 |
| Emerald Growth Fund | Manager Commentary |
April 30, 2018 (Unaudited)
TOP TEN HOLDINGS
(as a % of Net Assets)*
| Chegg, Inc. | 2.44% |
| FCB Financial Holdings, Inc. | 2.09% |
| KLX, Inc. | 2.06% |
| Vonage Holdings Corp. | 1.95% |
| Varonis Systems, Inc. | 1.93% |
| EPAM Systems, Inc. | 1.84% |
| LendingTree, Inc. | 1.82% |
| Pacific Premier Bancorp, Inc. | 1.65% |
| Cadence BanCorp | 1.60% |
| Proofpoint, Inc. | 1.56% |
| Top Ten Holdings | 18.94% |
INDUSTRY SECTOR ALLOCATION
(as a % of Net Assets)
| Technology | 21.59% |
| Health Care | 17.67% |
| Consumer Discretionary | 17.16% |
| Financial Services | 16.23% |
| Producer Durables | 12.08% |
| Materials & Processing | 6.33% |
| Energy | 3.38% |
| Utilities | 3.36% |
| Consumer Staples | 1.08% |
| Cash, Cash Equivalents, & Other Net Assets | 1.12% |
| * | Holdings are subject to change, and may not reflect the current or future position of the portfolio. |
ANNUALIZED TOTAL RETURN (for the period ended April 30, 2018)
| | 1 Year | 3 Year | 5 Year | 10 Year | Since Inception(1) | Expense Ratio |
| Gross(2) | Net(2) |
| Class A (NAV) | 19.06% | 10.00% | 14.70% | 12.01% | 11.39% | 1.08% | 1.08% |
| Class A (MOP) | 13.39% | 8.23% | 13.59% | 11.46% | 11.18% | 1.08% | 1.08% |
| Russell 2000® Growth Index† | 16.60% | 9.89% | 13.07% | 10.41% | 8.48% | | |
| Class C (NAV) | 18.29% | 9.30% | 13.96% | 11.31% | 6.42% | 1.73% | 1.73% |
| Class C (CDSC) | 17.29% | 9.30% | 13.96% | 11.31% | 6.42% | 1.73% | 1.73% |
| Russell 2000® Growth Index† | 16.60% | 9.89% | 13.07% | 10.41% | 5.43% | | |
| Investor Class | 18.99% | 9.94% | 14.66% | – | 12.09% | 1.13% | 1.13% |
| Russell 2000® Growth Index† | 16.60% | 9.89% | 13.07% | – | 10.96% | | |
| Institutional Class | 19.41% | 10.35% | 15.06% | – | 15.75% | 0.77% | 0.77% |
| Russell 2000® Growth Index† | 16.60% | 9.89% | 13.07% | – | 14.80% | | |
Performance quoted represents past performance, does not guarantee future results and current performance may be lower or higher than the data quoted. The investment return and principal value of an investment will fluctuate so that shares, when redeemed, may be worth more or less than their original cost. Performance data current to the most recent month end may be obtained at www.emeraldmutualfunds.com.
Performance shown for periods prior to March 16, 2012, reflects the performance of the Forward Growth Fund, a series of Forward Funds (as a result of a reorganization of the Forward Growth Fund into the Emerald Growth Fund).
Returns for periods less than 1 year are cumulative.
The table does not reflect the deduction of taxes that a shareholder would pay on Fund distributions or the redemption of Fund shares.
Subject to investment risks, including possible loss of the principal amount invested.
Maximum Offering Price (MOP) for Class A shares includes the Fund’s maximum sales charge of 4.75%. Performance shown at NAV does not include these sales charges and would have been lower had it been taken into account.
A Contingent Deferred Sales Charge (CDSC) of 1.00% may apply to Class C shares redeemed within the first 12 months after a purchase.
| (1) | Inception Dates - Class A: 10/01/1992, Class C: 07/01/2000, Class Institutional: 10/21/2008, Class Investor: 05/01/2011 |
| (2) | Emerald Mutual Fund Advisers Trust (“Emerald” or the “Adviser”) has agreed contractually to waive a portion of its fees and reimburse other expenses until August 31, 2018 in amounts necessary to limit the Fund’s operating expenses (exclusive of Acquired Fund Fees and Expenses, brokerage expenses, interest expenses, taxes and extraordinary expense) for Class A, Class C, Institutional Class, and Investor Class shares to an annual rate (as percentage of the Fund’s average daily net assets) of 1.29%, 1.94%, 0.99% and 1.34% respectively. The Adviser will be permitted to recover, on a class-by-class basis, expenses it has borne through the agreement described above to the extent that the Fund’s expenses in later periods fall below the annual rates set forth in the relevant agreement. The Fund will not be obligated to pay any such deferred fees and expenses more than three years after the year(s) in which the fees and expense were incurred. The Adviser may not discontinue this waiver prior to August 31, 2018, without the approval by the Fund’s Board of Trustees. Ratios as of the Prospectus dated August 31, 2017 and may differ from the ratios presented in the Financial Highlights. |
| † | The Russell 2000® Growth Index measures the performance of the small-cap growth segment of the U.S. equity universe. It includes those Russell 2000® Index companies with higher price-to-value ratios and higher forecasted growth values. The Index is not actively managed and does not reflect any deduction for fees, expenses or taxes. An investor may not invest directly into the Index. |
| 4 | www.emeraldmutualfunds.com |
| Emerald Growth Fund | Manager Commentary |
April 30, 2018 (Unaudited)
GROWTH OF $10,000 INVESTMENT IN THE FUND (for the period ended April 30, 2018)
Comparison of change in value of a $10,000 investment (includes applicable sales loads)
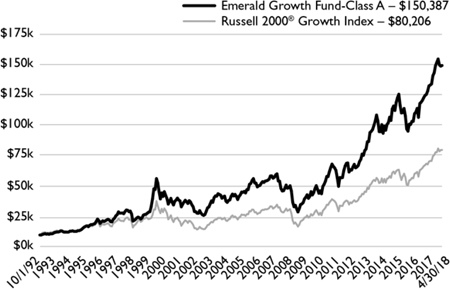
The chart represents historical performance of a hypothetical investment of $10,000 in the Fund since inception. Past performance does not guarantee future results. This chart does not reflect the deduction of taxes that a shareholder would pay on Fund distributions or the redemption of Fund shares.
Investing in the Fund is subject to investment risks, including possible loss of the principal amount invested.
| Annual Report | April 30, 2018 | 5 |
| Emerald Small Cap Value Fund | Manager Commentary |
April 30, 2018 (Unaudited)
April 30, 2018
Dear Shareholders:
Investment Results:
The performance of the Emerald Small Cap Value Fund Investor Class, for the twelve months ended April 30, 2018, reflected a gain of 12.54% (without sales load) outperforming the Russell 2000® Value Index(1) (or “R2V”) which was up 6.53%.
After a strong performance in 2016 small cap value stocks lagged other U.S. domestic equity asset classes. During the past year, larger companies outperformed smaller ones, and growth beat value. Heading into 2017 our belief was that the Trump’s administration “America First” policies, coupled with the Federal Reserves’ interest rate hikes, would meaningfully favor small value companies domiciled in the U.S. However, this thesis did not yet come to fruition.
Volatility significantly increased from the benign environment we experienced in 2017. The VIX Index(2) rose from 9 to 39 and now stands in the mid-teens, which is below the VIX average of around 20, going back to 1990 according to Steven DeSanctis of Jefferies(3). In addition, an interesting reversal in Exchange Traded Funds (ETF) fund flows occurred during the first quarter of 2018, as large cap ETF flows went from +$18.6 billion to -$19 billion in the latter part of the quarter, and small caps experienced outflows of $4.3 billion by March 2, but saw inflows of $3.8 billion since. “This has been a driver behind the smallest of the small holding up well and not kind to active managers’ performance” according to Steven DeSanctis of Jefferies.
Investment Analysis:
The Emerald Small Cap Value Fund (without sales load) outperformed its benchmark for the 12-month period ended April 30, 2018. At the sector level, relative outperformance was driven by stock selection within the consumer discretionary, utilities and financial services sectors, and our relative underweight in consumer staples. Relative underperformance was experienced within the healthcare sector, driven by our underweight to the biotechnology industry. It is worth to mention that for the 12 month period ending on April 30, 2018, the Fund had no sector with a negative stock selection attribution.
The Fund’s outperformance in the financial services sector was due to strong stock selection within our bank holdings versus the benchmark. We are still overweight banks, as we believe that the underlying fundamentals of small cap community bank stocks remain attractive and in fact begin to look more attractive when we add in the potential benefits from reduced corporate tax rates, possible regulatory relief, loan growth that outpaces that of their large cap brethren and continued rate increases from the Fed. Our primary concern as we enter the second quarter of 2018 will be the cost of deposits. Funding pressures and deposit costs are growing for small cap community banks, but not as quickly as they are at larger institutions. We believe the ability of small cap community banks to lag deposit rates set by larger competitors should allow community banks to report additional net interest margin expansion over the next few years. We believe that banks with $10 billion in assets or less will produce further increases in margins, and coupled with a lower tax rate, can produce superior community bank returns.
Over the past year, we have increased our weight in the energy sector, and we also added new healthcare holdings to our portfolio. The Healthcare sector has performed well in the past 18 months within our R2V benchmark. Most of the outperformance came from the biotechnology industry, which is 3.1% of the R2V. We are actively looking to narrow our relative underweight to this group.
Market Outlook:
Despite higher volatility, more moderate domestic economic indicators, increased geopolitical risk, potential trade wars with adversaries and allies, Federal Reserve tapping on the breaks (rate hikes and balance sheet reduction), and a stock market that is only 6% away from its all-time high, we have not changed our outlook over the last quarter.
We are often asked: why do you believe small cap value will do well given recent underperformance relative to other domestic equity asset classes? And below, is our response.
While we still believe that the US business cycle is maturing, current market conditions are supportive of further growth and margin expansion in domestic companies. ISM Manufacturing and Non-Manufacturing PMIs have been strong, signaling rapid growth (www.instituteforsupplymanagement.org). NFIB Small Business Optimism Index has been at lofty levels since the 2016 election (www.nfib.com), the unemployment rate is at 3.9%, and the U6 underemployment rate fell to 7.8 % (www.bls.gov) both lowest in over a decade and indicative of full employment. Small caps (who generally have more of their revenues generated in the U.S. vs. large caps) can benefit by pro-growth domestic policy such as the recently passed tax reform, ongoing deregulation, and an eventual sizable increase in infrastructure spending.
| 6 | www.emeraldmutualfunds.com |
| Emerald Small Cap Value Fund | Manager Commentary |
April 30, 2018 (Unaudited)
As 2017 came to a close the price/earnings ratio of the average small-cap growth fund was 28.3, vs. 19.8 for the average small-cap value funds. The average price-to-book ratio of small-cap growth funds was 3.7, vs. 1.7 for small-cap value funds, according to Fidelity. These are some of the widest gaps in valuation that we have seen in some time.
Furthermore, an investor should note that, by nature, financial stocks, such as banks and insurance companies, represent a larger portion of the average value index than the average growth index (currently 40.9% in R2V vs. 10.5% in Russell 2000® Growth Index(4)). This oversize exposure can carry more market risk than growth stocks during recessions. For example, during The Great Depression, and more recently The Great Recession of 2007 and 2008, financial stocks experienced much larger losses in price than any other sector. We would argue that the underperformance that we have seen in value stocks since the Great Recession has been largely driven by the overweight to banks in the value indices and the perception that the low rate environment, increased regulatory environment and the slow growth economy would all be a negative for the earnings power at banks.
We believe that the set-up for banks over the next several years is positive given the tailwinds of a Fed that is raising rates, regulatory relief for the banks, reduced corporate taxes and a stronger growth economy. We also believe strongly in the long term historical outperformance of value and that such outperformance can continue over time.
Recently, Furey Research, performed an analysis on small cap performance during different inflation regimes(5). The study shows that when the inflation rate is between 2% - 4% and rising, small cap value outperformed small cap growth 63% of the time. In addition, the median relative outperformance in these inflation conditions was 400 bps. Bottom line, small cap value has tended to outperform in more normal inflation environments.
So, will we see a reversal soon? Will Value finally outperform Growth over a significant period of time? Only time will tell. However, regardless which index will do better for the rest of 2018, we feel confident in the current holdings in the small cap value portfolio.
| Top Contributors: | Top Detractors: |
| Zagg, Inc. | Xperi Corp |
| Vonage Holdings Corp. | Jones Energy, Inc. |
| Mitel Networks Corporation | Tutor Perini Corporation |
| Microsemi Corporation | Gray Television, Inc. |
| ICF International, Inc. | Meritor, Inc. |
| | |
| Sincerely, | |
| | |
| Ori Elan | Steven E. Russell, Esq. |
| Vice President | Vice President |
| Portfolio Manager | Portfolio Manager |
Emerald Mutual Fund Advisers Trust
Past performance does not guarantee future results. Fund prices fluctuate as the underlying assets have exposure to market fluctuations and other risks, as described in the Fund’s prospectus. Please visit www.emeraldmutualfunds.com to obtain current performance information and for the current prospectus and statement of additional information. This material must be preceded or accompanied by a prospectus. Please read the prospectus carefully before investing.
The views of Emerald Mutual Fund Advisers Trust and information discussed in this commentary are as of the date of publication, are subject to change, and may not reflect the writer's current views. The views expressed are those of the author only, and represent an assessment of market conditions at a specific point in time, are opinions only and should not be relied upon as investment advice regarding a particular investment or markets in general. Such information does not constitute a recommendation to buy or sell specific securities or investment vehicles. It should not be assumed that any investment will be profitable or will equal the performance of the Fund or any securities or any sectors mentioned in this letter. The subject matter contained in this letter has been derived from several sources believed to be reliable and accurate at the time of compilation. Neither Emerald Mutual Fund Advisers Trust nor the Fund accepts any liability for losses either direct or consequential caused by the use of this information.
The Emerald Small Cap Value Fund is distributed by ALPS Distributors, Inc.
| Annual Report | April 30, 2018 | 7 |
| Emerald Small Cap Value Fund | Manager Commentary |
April 30, 2018 (Unaudited)
The Fund is subject to investment risks, including possible loss of the principal amount invested and therefore is not suitable for all investors. The Fund may not achieve its objectives.
Diversification does not eliminate the risk of experiencing investment losses.
| (1) | The Russell 2000® Value Index measures the performance of small-cap value segment of the U.S. equity universe. It includes those Russell 2000 companies with lower price-to-book ratios (A ratio used to compare a stock's market value to its book value. It is calculated by dividing the current closing price of the stock by the latest quarter's book value per share.) and lower forecasted growth values. The Index is not actively managed and does not reflect any deductions for fees, expenses or taxes. An investor may not invest directly into the Index. |
| (2) | The CBOE Volatility Index, known by its ticker symbol VIX, is a popular measure of the stock market's expectation of volatility implied by S&P 500® Index options, calculated and published by the Chicago Board Options Exchange (CBOE). It is colloquially referred to as the fear index or the fear gauge. |
| (3) | Jefferies, JEF's SMID-Cap Performance Scorecard: A very eventful Q1 ends with small on top, 01 April, 2018 |
| (4) | The Russell 2000® Growth Index measures the performance of the small-cap growth segment of the U.S. equity universe. It includes those Russell 2000® Index companies with higher price-to-value ratios and higher forecasted growth values. The Index is not actively managed and does not reflect any deductions for fees, expenses or taxes. An investor may not invest directly into the Index. |
| (5) | Furey Research, Thoughts on Value performance in Inflationary environments, 28 March, 2018. |
| 8 | www.emeraldmutualfunds.com |
| Emerald Small Cap Value Fund | Manager Commentary |
April 30, 2018 (Unaudited)
TOP TEN HOLDINGS
(as a % of Net Assets)*
| First Defiance Financial Corp. | 2.07% |
| BofI Holding, Inc. | 2.02% |
| Mitel Networks Corp. | 1.98% |
| Meta Financial Group, Inc. | 1.90% |
| Viad Corp. | 1.79% |
| ICF International, Inc. | 1.72% |
| Meritor, Inc. | 1.59% |
| Invacare Corp. | 1.58% |
| Koppers Holdings, Inc. | 1.54% |
| Builders FirstSource, Inc. | 1.49% |
| Top Ten Holdings | 17.68% |
INDUSTRY SECTOR ALLOCATION
(as a % of Net Assets)
| Financial Services | 46.42% |
| Consumer Discretionary | 12.13% |
| Materials & Processing | 10.88% |
| Technology | 8.49% |
| Energy | 7.07% |
| Producer Durables | 6.06% |
| Health Care | 3.76% |
| Utilities | 1.23% |
| Cash, Cash Equivalents, & Other Net Assets | 3.96% |
| * | Holdings are subject to change, and may not reflect the current or future position of the portfolio. |
ANNUALIZED TOTAL RETURN (for the period ended April 30, 2018)(1),(2)
| | 1 Year | 3 Years | 5 Years | Since Inception(2) | Expense Ratio |
| Gross(3) | Net(3) |
| Class A (NAV) | 12.41% | 10.52% | 11.40% | 13.12% | 2.27% | 1.36% |
| Class A (MOP) | 7.08% | 8.74% | 10.33% | 12.12% | 2.27% | 1.36% |
| Russell 2000® Value Index(4) | 6.53% | 9.27% | 10.36% | 12.28% | | |
| Class C (NAV) | 11.63% | 9.78% | 10.67% | 12.37% | 2.71% | 2.01% |
| Class C (CDSC) | 11.00% | 9.78% | 10.67% | 12.37% | 2.71% | 2.01% |
| Russell 2000® Value Index(4) | 6.53% | 9.27% | 10.36% | 12.28% | | |
| Investor Class | 12.54% | 10.68% | 11.54% | 13.27% | 1.84% | 1.26% |
| Russell 2000® Value Index(4) | 6.53% | 9.27% | 10.36% | 12.28% | | |
| Institutional Class | 12.76% | 10.88% | 11.77% | 13.49% | 1.57% | 1.01% |
| Russell 2000® Value Index(4) | 6.53% | 9.27% | 10.36% | 12.28% | | |
Performance quoted represents past performance, does not guarantee future results and current performance may be lower or higher than the data quoted. The investment return and principal value of an investment will fluctuate so that shares, when redeemed, may be worth more or less than their original cost. Performance data current to the most recent month end may be obtained at www.emeraldmutualfunds.com.
Returns for periods less than 1 year are cumulative.
The table does not reflect the deduction of taxes that a shareholder would pay on Fund distributions or the redemption of Fund shares.
Subject to investment risks, including possible loss of the principal amount invested.
Maximum Offering Price (MOP) for Class A shares includes the Fund's maximum sales charge of 4.75%. Performance shown at NAV does not include these sales charges and would have been lower had it been taken into account.
A Contingent Deferred Sales Charge (CDSC) of 1.00% may apply to Class C shares redeemed within the first 12 months after a purchase.
| (1) | As of June 26, 2015, the Emerald Small Cap Value Fund was reorganized as a successor to the Elessar Small Cap Value Fund (the Predecessor Fund), a series of Elessar Investment Trust. The performance shown for periods prior to June 26, 2015 reflects the performance of the Predecessor Fund's Institutional Class and Investor Class shares. The Predecessor Fund did not offer Class A or Class C shares. The performance shown for Class A and C shares prior to June 30, 2015 reflect the historical performance of the Predecessor Fund’s Institutional and Investor Shares since inception on October 15, 2012, calculated using the fees and expenses of Class A and C shares, respectively. |
| (2) | Commencement Dates - Class A: 06/30/2015, Class C: 06/30/2015, Class Institutional: 10/15/2012, Class Investor:10/15/2012 |
| (3) | Emerald Mutual Fund Advisers Trust (“Emerald” or the “Adviser”) has agreed contractually to waive a portion of its fees and reimburse other expenses until August 31, 2018 in amounts necessary to limit the Fund’s operating expenses (exclusive of Acquired Fund Fees and Expenses, brokerage expenses, interest expenses, taxes and extraordinary expense) for Class A, Class C, Institutional Class, and Investor Class shares to an annual rate (as percentage of the Fund’s average daily net assets) of 1.35%, 2.00%, 1.00% and 1.25% respectively. The Adviser will be permitted to recover, on a class-by-class basis, expenses it has borne through the agreement described above to the extent that the Fund's expenses in later periods fall below the annual rates set forth in the relevant agreement. The Fund will not be obligated to pay any such deferred fees and expenses more than three years after the year(s) in which the fees and expense were incurred. The Adviser may not discontinue this waiver prior to August 31, 2018, without the approval by the Fund's Board of Trustees. Ratios as of the Prospectus dated August 31, 2017 and may differ from the ratios presented in the Financial Highlights. |
| Annual Report | April 30, 2018 | 9 |
| Emerald Small Cap Value Fund | Manager Commentary |
April 30, 2018 (Unaudited)
| (4) | The Russell 2000® Value Index measures the performance of small-cap value segment of the U.S. equity universe. It includes those Russell 2000 companies with lower price-to-book ratios and lower forecasted growth values. The Index is not actively managed and does not reflect any deductions for fees, expenses or taxes. An investor may not invest directly into the Index. |
Important Risks
Investing in smaller companies generally will present greater investment risks, including: greater price volatility, greater sensitivity to changing economic conditions and less liquidity than the securities of larger, more mature companies.
| 10 | www.emeraldmutualfunds.com |
| Emerald Small Cap Value Fund | Manager Commentary |
April 30, 2018 (Unaudited)
GROWTH OF $10,000 INVESTMENT IN THE FUND (for the period ended April 30, 2018)
Comparison of change in value of a $10,000 investment (includes applicable sales loads)
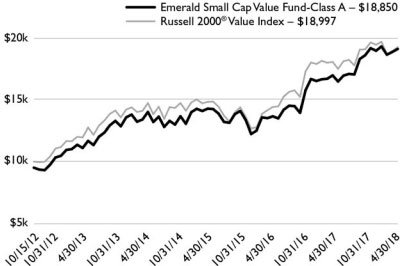
The chart represents historical performance of a hypothetical investment of $10,000 in the Fund since inception. Past performance does not guarantee future results. This chart does not reflect the deduction of taxes that a shareholder would pay on Fund distributions or the redemption of Fund shares.
Investing in the Fund is subject to investment risks, including possible loss of the principal amount invested.
| Annual Report | April 30, 2018 | 11 |
| Emerald Insights Fund | Manager Commentary |
April 30, 2018 (Unaudited)
April 30, 2018
Dear Shareholders:
Investment Results:
The performance of the Emerald Insights Fund’s Class A shares (without the sales load), for the prior 12 months reflected a gain of 15.53%, trailing the Russell Midcap® Growth Index(1) benchmark of 16.87% by 1.34%. Performance for the period was driven by outperformance in technology, healthcare and energy; with underperformance in financial services and producer durables.
Investment Analysis:
The last quarter of the Fund’s year saw the markets cool considerably as investors grew fearful of possible labor inflation and spiking short term rates. Then concerns of a trade war, poor weather, and the combined impact on earnings, plus a potential inversion of the yield curve(2) further heightened investor angst. However, most domestic economic statistics remained strong: employment registered gains through the quarter and capacity utilization, Institute of Supply Management (ISM) indicators, Consumer Confidence, and Gross Domestic Product (GDP) all pointed toward moderate growth. The only real economic/monetary negatives were a deceleration in money supply growth, a continued ballooning of the Federal deficit and lackluster retail sales growth. For the Fund's fiscal year ended April 30, 2018, strong earnings and generally strong economic indicators drove stock prices higher, despite persistent concerns about high valuations and expected inflation.
As noted, the Insights Fund slightly underperformed for the prior twelve months, as the March/April market correction hurt growth company performance the most. Our modest pro-growth cyclical bent initiated during 2017 affected performance, as did stock specific issues with a few technology and healthcare holdings.
Market Outlook:
From a positioning perspective, we remain overweight Technology, Energy, and Materials, and are modestly overweight Healthcare. We continue to underweight Consumer Discretionary and Staples, as well as non-bank Financial Services and Industrials.
Market fundamentals remain strong, and, as noted above, have improved markedly on the valuation side due to the most recent market pullback. The Insights Fund portfolio remains similarly sized as the Midcap benchmark, with similar or lower valuation metrics, yet with better expected earnings growth and a lower debt/capital profile. This valuation disparity has persisted for at least the past year, but that positioning has not yet been rewarded. We continue to believe that growth in revenue and earnings drives stock prices and the market will identify and reward the best growth equities over time.
Given the valuation reset associated with the recent market pullback, as well as the likely reversion to the mean away from what we see as large, crowded, over-followed and owned, benchmark growth names, we are more optimistic about mid-cap equities than we have been in some time. That optimism notwithstanding, during the past quarter, we transitioned the Fund from a portfolio focused predominantly on opportunities in the mid-cap growth market segment to a more broadly diversified all-cap growth portfolio. This positioning will allow us to further leverage Emerald’s in-house research assets to take advantage of investment opportunities in both smaller and larger cap equities in addition to the mid-cap companies on which we have previously focused our efforts. In fact, we have added to our mid cap exposure in all of our all cap growth portfolios as we think the asset class is very advantaged from a risk/reward perspective at this time.
We continue to believe that Emerald’s fundamental, bottom-up research uniquely positions us to identify growth companies with strong management teams and competitive advantages not properly valued or researched by the Street and should provide an opportunity to produce attractive returns regardless of market capitalization.
| Top Contributors: | Top Detractors: | |
| IPG Photonics Corporation | LendingTree, Inc. | |
| ServiceNow, Inc. | Spirit Airlines, Inc. | |
| Chegg, Inc. | Foot Locker, Inc. | |
| Sarepta Therapeutics, Inc. | Kroger Co. | |
| Alnylam Pharmaceuticals, Inc | Dick's Sporting Goods, Inc. | |
| | | |
| David A. Volpe, CFA | Stephen L. Amsterdam | Joseph Hovorka |
| Deputy Chief Investment Officer | Associate Portfolio Manager | Associate Portfolio Manager |
| Portfolio Manager | | |
| | | |
| Emerald Mutual Fund Advisers Trust | | |
| 12 | www.emeraldmutualfunds.com |
| Emerald Insights Fund | Manager Commentary |
April 30, 2018 (Unaudited)
Past performance does not guarantee future results. Fund prices fluctuate as the underlying assets have exposure to market fluctuations and other risks, as described in the Fund’s prospectus. Please visit www.emeraldmutualfunds.com to obtain current performance information and for the current prospectus and statement of additional information. This material must be preceded or accompanied by a prospectus. Please read the prospectus carefully before investing.
The views of Emerald Mutual Fund Advisers Trust and information discussed in this commentary are as of the date of publication, are subject to change, and may not reflect the writer's current views. The views expressed are those of the author only, and represent an assessment of market conditions at a specific point in time, are opinions only and should not be relied upon as investment advice regarding a particular investment or markets in general. Such information does not constitute a recommendation to buy or sell specific securities or investment vehicles. It should not be assumed that any investment will be profitable or will equal the performance of the Fund or any securities or any sectors mentioned in this letter. The subject matter contained in this letter has been derived from several sources believed to be reliable and accurate at the time of compilation. Neither Emerald Mutual Fund Advisers Trust nor the Fund accepts any liability for losses either direct or consequential caused by the use of this information.
The Emerald Insights Fund is distributed by ALPS Distributors, Inc.
The Fund is subject to investment risks, including possible loss of the principal amount invested and therefore is not suitable for all investors. The Fund may not achieve its objectives.
Diversification does not eliminate the risk of experiencing investment losses.
| (1) | The Russell MidCap® Growth Index measures the performance of the mid-cap growth segment of the U.S. equity universe. It includes those Russell MidCap Index companies with higher price-to-book ratios (A ratio used to compare a stock's market value to its book value. It is calculated by dividing the current closing price of the stock by the latest quarter's book value per share.) and higher forecasted growth values. The Index is not actively managed and does not reflect any deductions for fees, expenses or taxes. An investor may not invest directly into the Index. |
| (2) | A yield curve is a line that plots the interest rates, at a set point in time, of bonds having equal credit quality but differing maturity dates. The most frequently reported yield curve compares the three-month, two-year, five-year and 30-year U.S. Treasury debt. This yield curve is used as a benchmark for other debt in the market, such as mortgage rates or bank lending rates, and it is also used to predict changes in economic output and growth. |
| Annual Report | April 30, 2018 | 13 |
| Emerald Insights Fund | Manager Commentary |
April 30, 2018 (Unaudited)
TOP TEN HOLDINGS
(as a % of Net Assets)*
| Amazon.com, Inc. | 5.10% |
| Microsoft Corp. | 4.73% |
| Chegg, Inc. | 4.20% |
| Apple, Inc. | 3.92% |
| Facebook, Inc. | 2.99% |
| Alphabet, Inc. | 2.71% |
| LendingTree, Inc. | 2.26% |
| Varonis Systems, Inc. | 1.57% |
| Vonage Holdings Corp. | 1.56% |
| Extraction Oil & Gas, Inc. | 1.27% |
| Top Ten Holdings | 30.31% |
INDUSTRY SECTOR ALLOCATION
(as a % of Net Assets)
| Technology | 29.05% |
| Consumer Discretionary | 19.99% |
| Health Care | 13.21% |
| Financial Services | 9.85% |
| Producer Durables | 8.65% |
| Materials & Processing | 6.78% |
| Energy | 6.26% |
| Consumer Staples | 2.60% |
| Utilities | 1.57% |
| Cash, Cash Equivalents, & Other Net Assets | 2.04% |
| * | Holdings are subject to change, and may not reflect the current or future position of the portfolio. |
ANNUALIZED TOTAL RETURN (for the period ended April 30, 2018)
| | 1 Year | 3 Year | Since Inception(1) | Expense Ratio |
| Gross(2) | Net(2) |
| Class A (NAV) | 15.53% | 6.03% | 7.45% | 2.10% | 1.35% |
| Class A (MOP) | 10.00% | 4.32% | 6.06% | 2.10% | 1.35% |
| Russell MidCap® Growth Index† | 16.87% | 9.08% | 10.89% | | |
| Class C (NAV) | 14.85%(3) | 5.33% | 6.72% | 2.76% | 2.00% |
| Class C (CDSC) | 13.85%(3) | 5.33% | 6.72% | 2.76% | 2.00% |
| Russell MidCap® Growth Index† | 16.87% | 9.08% | 10.89% | | |
| Investor Class | 15.59% | 5.99% | 7.37% | 2.16% | 1.40% |
| Russell MidCap® Growth Index† | 16.87% | 9.08% | 10.89% | | |
| Institutional Class | 15.86% | 6.32% | 7.74% | 1.80% | 1.05% |
| Russell MidCap® Growth Index† | 16.87% | 9.08% | 10.89% | | |
The performance quoted represents past performance, does not guarantee future results and current performance may be lower or higher than the data quoted. The investment return and principal value of an investment will fluctuate so that shares, when redeemed, may be worth more or less than their original cost. Performance data current to the most recent month end may be obtained at www.emeraldmutualfunds.com.
Returns for periods less than 1 year are cumulative.
The table does not reflect the deduction of taxes that a shareholder would pay on Fund distributions or the redemption of Fund shares.
Subject to investment risks, including possible loss of the principal amount invested.
Maximum Offering Price (MOP) for Class A shares includes the Fund's maximum sales charge of 4.75%. Performance shown at NAV does not include these sales charges and would have been lower had it been taken into account.
A Contingent Deferred Sales Charge (CDSC) of 1.00% may apply to Class C shares redeemed within the first 12 months after a purchase.
| (1) | Inception Date – August 1, 2014. |
| (2) | Emerald Mutual Fund Advisers Trust ("Emerald" or the "Adviser") has agreed contractually to waive a portion of its fees and reimburse other expenses until August 31, 2018 in amounts necessary to limit the Fund's operating expenses (exclusive of Acquired Fund Fees and Expenses, brokerage expenses, interest expenses, taxes and extraordinary expense) for Class A, Class C, Institutional Class, and Investor Class shares to an annual rate (as percentage of the Fund's average daily net assets) of 1.35%, 2.00%, 1.05% and 1.40% respectively. The Adviser will be permitted to recover, on a class-by-class basis, expenses it has borne through the agreement described above to the extent that the Fund's expenses in later periods fall below the annual rates set forth in the relevant agreement. The Fund will not be obligated to pay any such deferred fees and expenses more than three years after the year(s) in which the fees and expense were incurred. The Adviser may not discontinue this waiver prior to August 31, 2018, without the approval by the Fund's Board of Trustees. Ratios as of the Prospectus dated August 31, 2017 and may differ from the ratios presented in the Financial Highlights. |
| (3) | Excludes adjustments in accordance with accounting principles generally accepted in the United States of America and as such, the net asset value and total return for shareholder transactions reported to the market may differ from the net asset value for financial reporting purposes. |
| † | The Russell MidCap® Growth Index measures the performance of the mid-cap growth segment of the U.S. equity universe. It includes those Russell Midcap Index companies with higher price-to-book ratios and higher forecasted growth values. The Index is not actively managed and does not reflect any deductions for fees, expenses or taxes. An investor may not invest directly into the Index. |
Important Risks
Investing in smaller companies generally will present greater investment risks, including: greater price volatility, greater sensitivity to changing economic conditions and less liquidity than the securities of larger, more mature companies.
| 14 | www.emeraldmutualfunds.com |
| Emerald Insights Fund | Manager Commentary |
April 30, 2018 (Unaudited)
GROWTH OF $10,000 INVESTMENT IN THE FUND (for the period ended April 30, 2018)
Comparison of change in value of a $10,000 investment (includes applicable sales loads)
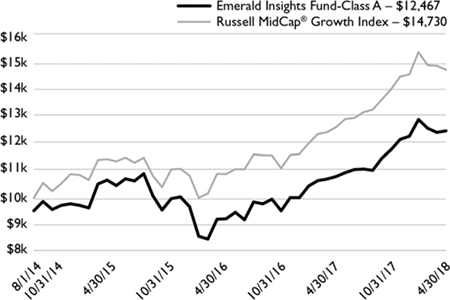
The chart represents historical performance of a hypothetical investment of $10,000 in the Fund since inception. Past performance does not guarantee future results. This chart does not reflect the deduction of taxes that a shareholder would pay on Fund distributions or the redemption of Fund shares.
Investing in the Fund is subject to investment risks, including possible loss of the principal amount invested.
| Annual Report | April 30, 2018 | 15 |
| Emerald Banking and Finance Fund | Manager Commentary |
April 30, 2018 (Unaudited)
April 30, 2018
Dear Shareholder:
Investment Results:
The Emerald Bank & Finance Fund – Class A outperformed the Russell 2000® Index(1) for the twelve months ended April 30, 2018, returning 13.57% vs. 11.54% for the Index. During the twelve months ended April 30, 2018, the Russell 2000® Financial Services Index(2) returned 5.97%; the SNL Small Cap U.S. Bank & Thrift Index(3) gained 7.30% versus a 13.27% gain delivered by the Standard & Poor’s 500 Index(4) and a gain of 6.53% for the Russell 2000® Value Index(5).
After years of post-crisis interventions we believe the central bank officials now have the economy largely where they want it. We view labor markets as strong. Wages are rising and inflation has reached the central bank’s 2% target but with no expectation of a breakout. The Federal Reserve (Fed), in a statement released after its May two day policy meeting, acknowledged the recent firming of inflation but signaled no plans to pick up the pace of rate increases in response. We believe Fed officials see 2% inflation as consistent with an economy with healthy demand for goods and services. Projections released after the Fed’s March meeting show that all 15 participants expected annual core inflation of at least 2% by 2020, and more than half of them see it rising to at least 2.1% in 2019 and staying there through 2020.
Fed officials voted in March 2018 to raise their benchmark rate to a range between 1.5% and 1.75%. At the May 2018 meeting the Fed voted unanimously to leave rates there for now. We believe the Fed now faces the difficulty of figuring out how to raise borrowing costs enough to prevent the economy from “overheating” but not so much that it tips the economy into a recession.
We believe that while the economy has performed in line with the Fed’s forecasts in 2018, there is great uncertainty as a result of the recent changes to corporate taxes, federal spending and trade policies and “the market” does not like uncertainty.
Investment Analysis:
According to S&P Global Research, community banks under $10 billion in assets posted strong first quarter 2018 results. The median net interest margin was 3.61% in the first quarter, up 9 basis points(6) from the year-ago quarter. Meanwhile, the median return on average assets increased to 1.07% from 0.09% and the median efficiency ratio dropped to 62.86% from 63.71%.
The largest banks in the analysis completed by S&P Global Research, those between $5 billion and $10 billion in assets, reported a median of 3.64%, up from 3.48% in the first quarter of 2017. Median Return on Assets (ROA) jumped 13 basis points to 1.14%, and the median efficiency ratio improved to 56.80% from 58.92%.
Additionally, S&P Global Research has indicated that community banks with less than $10 billion in assets generated median operating revenue growth of 10.9% year-over-year, compared to 8% in the year-ago quarter. The biggest banks in the analysis, those with $5 billion to $10 billion in assets, reported better results with a reported median of 11.1% operating revenue growth for the first quarter of 2018. Operating revenue at banks between $1 billion and $5 billion in assets however outperformed their larger peers with median growth of 11.7% year-over-year. The smallest banks in the analysis, those with less than $1 billion in assets, reported a median of 8.3% operating revenue growth year-over-year and a median efficiency ratio that improved marginally to 72.41% from 73.66% in the year-ago quarter. We believe the lower operating revenue growth and higher efficiency ratios highlight our opinion that banks below $1 billion in assets will find it difficult to sustain their independence and we will continue to see increased merger activity amongst these institutions.
Market Outlook:
We believe that the set-up for the next 12 months for the bank sector is the best we have had in some time. We believe that bank sector has several tailwinds that will improve the fundamentals for community banks over the next twelve months such as: lower corporate taxes, deregulation, rising loan yields and continued merger activity.
Bank merger and acquisition (M&A) activity remains robust and pricing is trending higher in 2018. Through the first four months of 2018, 83 deals were announced for a combined $6.13 billion and a median deal value-to-tangible book value (PTBV) ratio(7) of 180.2% according to S&P Global Research. Over the same time frame in 2017, 75 deals worth $11.19 billion were announced with a median value-to-tangible book value ratio of 158.6%. We believe that the smaller total combined deal value in 2018 is evidence of more deal activity taking place in the smaller community banks. We believe that the increased regulatory expenses will continue to weigh on the smaller community banks, sub $1 billion in assets, to remain independent despite the potential for increased loan yields as the Fed continues to raise rates.
On March 31st the Federal Reserve raised its benchmark interest rate for the sixth time in 3 years and signaled its intention to raise rates twice more in 2018, aiming for a Fed Funds target of 3.5% by 2020. LIBOR, the London Interbank Offered Rate, has risen even faster than the Fed Funds
| 16 | www.emeraldmutualfunds.com |
| Emerald Banking and Finance Fund | Manager Commentary |
April 30, 2018 (Unaudited)
rate, up to 2.3% from just 0.3% 2-1/2 years ago. Rising LIBOR rates are a benefit to many of the banks in our portfolio as we tend to invest in community banks that have a focus on commercial lending. Quite often these commercial loans are priced off of LIBOR. Therefore, we believe that new loans coming on to the loan portfolio of our banks will have higher yields than the banks’ current loan portfolio yields.
However, there will be a time, very soon, where our banks will also experience higher deposit costs as a result of the rising Fed rates. We believe community banks will be able to offset some of the increase in deposit costs as earning asset yields expand. We believe that the increases in loan yields will continue to outpace the increase in deposit costs in 2018 allowing net interest margins to continue to rise.
As expected given the recent rate hikes, deposit costs are growing for community banks but not as quickly as they are at larger institutions. We believe the ability to lag deposit rates set by larger competitors should allow community banks to report additional net interest margin (NIM) expansion over the next few years.
Despite three rate hikes by the Federal Reserve in 2017, community banks’ funding costs have held fairly steady with the cost of interest bearing deposits rising modestly to 0.53% from 0.46% in 2016 according to S&P Global Research. Community banks recorded a deposit beta, which is the percentage of changes in rates the banks have passed on to their customers, of just 11% in 2017, well below the roughly 20% beta recorded by the entire banking industry. We believe community banks are capable of maintaining lower deposit betas than larger institutions because of their focus on “relationship” banking and superior service. Additionally, community banks are often in rural areas that are not heavily banked.
According to S&P Global Research, community banks are seeing the highest increase in deposit betas on retail CDs. Community banks’ betas on retail CDs rose to 19.1% in 2017 from 13.3% in 2016, but the metric actually declined on larger Jumbo CDs. A number of community banks have actively marketed CD specials at above market rates in an effort to lock in rates on terms extending several years thus allowing institutions to hold the cost on those accounts for several years. Betas on retail CDs eventually rose to nearly 60% during the last rate tightening cycle. While we are not predicting 60% betas, we do expect CD betas to continue to rise as banks put more of their excess liquidity to work and loan-to-deposit ratios rise.
Surprisingly, community banks actually decreased their reliance on interest bearing deposits in 2017, according to S&P Global Research, while the industry as a whole saw those balances grow. We believe community banks will see interest bearing deposits as a percentage of total deposits grow in 2018 as higher yielding products become more available to customers.
The third “tailwind” that we believe should benefit community banks over the next twelve months is the lower corporate tax rate. The majority of community banks were previously taxed at a rate that was higher than 40% and we believe the average tax rate for community banks will be in the low twenty percent range. While U.S. banks plan to share some of the windfall created by tax reform with their employees and customers, the industry stands to retain more than 75% of the savings. S&P Global Market Intelligence projects that a lower U.S. corporate tax rate will push the banking industry's earnings nearly 13% higher in 2018 than results would have been under the previous statutory tax rate.
Finally, we believe regulatory relief is on its way and while we do not believe there will be a reduction in regulatory expenses we do believe that the year-over-year growth in regulatory expenses will begin to wane. We believe the bank sector will see some regulatory relief by the end of the second quarter of 2018 in the form of the S.2155 (the Crapo bill) which should be received by investors as a positive for the banking sector. The Crapo bill, which is legislation that will raise Dodd-Frank’s $50 billion threshold, has passed the Senate and is awaiting a vote in the House. An agreement between House and Senate leadership to advance the Senate’s bank regulatory relief bill through the House was announced by Speaker Ryan that will allow the Senate bill to move through the House unaltered with Chairman Hensarling expected to push for additional bank regulatory rollback measures in future legislation to be taken up by the Senate.
Our focus remains on seeking companies capable of producing above average organic growth, relatively stable net interest margins, and improving earnings power aided by lower efficiency ratios, with potential for accretive mergers & acquisitions activity, as we deploy Emerald’s 10-Step research process to seek out companies in this market environment that is poised for the potential of higher short-term interest rates.
| Annual Report | April 30, 2018 | 17 |
| Emerald Banking and Finance Fund | Manager Commentary |
April 30, 2018 (Unaudited)
| Top Contributors: | Top Detractors: |
| LendingTree, Inc. | Franklin Financial Network, Inc. |
| SVB Financial Group | Home BancShares, Inc. |
| Esquire Financial Holdings, Inc. | Customers Bancorp, Inc. |
| Meta Financial Group, Inc. | U.S. Global Investors, Inc. Class A |
| Bitcoin Investment Trust | Gold Coast Bancorp, Inc. |
| | |
| Kenneth G. Mertz II, CFA | Steven E. Russell, Esq. |
| Chief Investment Officer | Portfolio Manager |
| Portfolio Manager | |
| | |
| Emerald Mutual Fund Advisers Trust | |
Past performance does not guarantee future results. Fund prices fluctuate as the underlying assets have exposure to market fluctuations and other risks, as described in the Fund’s prospectus. Please visit www.emeraldmutualfunds.com to obtain current performance information and for the current prospectus and statement of additional information. This material must be preceded or accompanied by a prospectus. Please read the prospectus carefully before investing.
The views of Emerald Mutual Fund Advisers Trust and information discussed in this commentary are as of the date of publication, are subject to change, and may not reflect the writer's current views. The views expressed are those of the author only, and represent an assessment of market conditions at a specific point in time, are opinions only and should not be relied upon as investment advice regarding a particular investment or markets in general. Such information does not constitute a recommendation to buy or sell specific securities or investment vehicles. It should not be assumed that any investment will be profitable or will equal the performance of the Fund or any securities or any sectors mentioned in this letter. The subject matter contained in this letter has been derived from several sources believed to be reliable and accurate at the time of compilation. Neither Emerald Mutual Fund Advisers Trust nor the Fund accepts any liability for losses either direct or consequential caused by the use of this information.
The Emerald Banking and Finance Fund is distributed by ALPS Distributors, Inc.
The Fund is subject to investment risks, including possible loss of the principal amount invested and therefore is not suitable for all investors. The Fund may not achieve its objectives.
Diversification does not eliminate the risk of experiencing investment losses.
| (1) | The Russell 2000® Index measures the performance of the small-cap segment of the U.S. equity universe. The Russell 2000® Index is a subset of the Russell 3000® Index representing approximately 10% of the total market capitalization of that index. It includes approximately 2000 of the smallest securities based on a combination of their market cap and current index membership. The Index is not actively managed and does not reflect any deduction of fees, expenses or taxes. An investor may not invest directly into the Index. |
| (2) | The Russell 2000® Financial Services Index – is comprised of the smallest financial services companies in the Russell 3000 Index. The Index is not actively managed and does not reflect any deductions for fees, expense, or taxes. An investor may not invest directly in the Index. |
| (3) | SNL Small Cap Bank & Thrift Index: Includes all publicly traded (NYSE, NYSE Amex, NASDAQ, OTC BB, Pink Sheets) Banks and Thrifts in SNL's coverage universe with $250M to $1B Total Common Market Capitalization as of most recent pricing data. Source: SNL Financial, data as of April 30, 2018. |
| (4) | The Standard & Poor’s 500® Index is an unmanaged index of 500 common stocks chosen for the market size, liquidity and industry group representation. It is a market-value weighted index. The Index is not actively managed and does not reflect any deduction for fees, expenses or taxes. An investor may not invest directly into the Index |
| (5) | The Russell 2000® Value Index measures the performance of small-cap value segment of the U.S. equity universe. It includes those Russell 2000 companies with lower price-to-book ratios (A ratio used to compare a stock's market value to its book value. It is calculated by dividing the current closing price of the stock by the latest quarter's book value per share.) and lower forecasted growth values. The Index is not actively managed and does not reflect any deductions for fees, expenses or taxes. An investor may not invest directly into the Index. |
| (6) | Basis point (BPS) refer to a common unit of measure for interest rates and other percentages in finance. One basis point is equal to 1/100th of 1%, or 0.01% (0.0001), and is used to denote the percentage change in a financial instrument. |
| (7) | The price to tangible book value (PTBV) is a valuation ratio expressing the price of a security compared to its hard, or tangible, book value as reported in the company's balance sheet. The tangible book value number is equal to the company's total book value less the value of any intangible assets. |
| 18 | www.emeraldmutualfunds.com |
| Emerald Banking and Finance Fund | Manager Commentary |
April 30, 2018 (Unaudited)
TOP TEN HOLDINGS
(as a % of Net Assets)*
| LendingTree, Inc. | 2.74% |
| Meta Financial Group, Inc. | 2.62% |
| SVB Financial Group | 2.35% |
| Triumph Bancorp, Inc. | 2.30% |
| Bank of NT Butterfield & Son, Ltd. | 2.08% |
| FCB Financial Holdings, Inc. | 2.03% |
| RBB Bancorp | 2.00% |
| Merchants Bancorp | 1.98% |
| CenterState Bank Corp. | 1.97% |
| Ameris Bancorp | 1.96% |
| Top Ten Holdings | 22.03% |
INDUSTRY SECTOR ALLOCATION
(as a % of Net Assets)
| Banks: Diversified | 79.71% |
| Banks: Savings, Thrift & Mortgage Lending | 8.22% |
| Consumer Lending | 2.74% |
| Computer Services Software & Systems | 2.33% |
| Insurance: Property-Casualty | 2.31% |
| Real Estate Services | 1.74% |
| Financial Data & Systems | 1.65% |
| Commercial Finance & Mortgage Companies | 0.49% |
| Insurance: Multi Line | 0.33% |
| Cash, Cash Equivalents, & Other Net Assets | 0.48% |
| * | Holdings are subject to change, and may not reflect the current or future position of the portfolio. |
ANNUALIZED TOTAL RETURN (for the period ended April 30, 2018)
| | 1 Year | 3 Year | 5 Year | 10 Year | Since Inception(1) | Expense Ratio |
| Gross(2) | Net(2) |
| Class A (NAV) | 13.57%(3) | 17.89% | 18.67% | 10.34% | 9.72% | 1.43% | 1.43% |
| Class A (MOP) | 8.16% | 15.99% | 17.53% | 9.81% | 9.47% | 1.43% | 1.43% |
| Russell 2000® Index† | 11.54% | 9.64% | 11.74% | 9.49% | 8.39% | | |
| Russell 2000® Financial Services TR Index†† | 5.97% | 11.65% | 11.85% | 8.28% | 8.79% | | |
| Class C (NAV) | 12.85% | 17.13% | 17.92% | 9.64% | 9.98% | 2.08% | 2.08% |
| Class C (CDSC) | 11.85% | 17.13% | 17.92% | 9.64% | 9.98% | 2.08% | 2.08% |
| Russell 2000® Index† | 11.54% | 9.64% | 11.74% | 9.49% | 7.75% | | |
| Russell 2000® Financial Services TR Index†† | 5.97% | 11.65% | 11.85% | 8.28% | 9.78% | | |
| Investor Class | 13.67% | 17.91% | 18.70% | – | 14.72% | 1.48% | 1.48% |
| Russell 2000® Index† | 11.54% | 9.64% | 11.74% | – | 12.12% | | |
| Russell 2000® Financial Services TR Index†† | 5.97% | 11.65% | 11.85% | – | 12.27% | | |
| Institutional Class | 13.94%(3) | 18.26% | 19.06% | – | 18.76% | 1.14% | 1.14% |
| Russell 2000® Index† | 11.54% | 9.64% | 11.74% | – | 12.03% | | |
| Russell 2000® Financial Services TR Index†† | 5.97% | 11.65% | 11.85% | – | 13.37% | | |
The performance quoted represents past performance, does not guarantee future results and current performance may be lower or higher than the data quoted. The investment return and principal value of an investment will fluctuate so that shares, when redeemed, may be worth more or less than their original cost. Performance data current to the most recent month end may be obtained at www.emeraldmutualfunds.com.
Performance shown for periods prior to March 16, 2012, reflects the performance of the Forward Banking & Finance Fund, a series of Forward Funds (as a result of a reorganization of the Forward Banking & Finance Fund into the Emerald Banking & Finance Fund).
Returns for periods less than 1 year are cumulative.
The table does not reflect the deduction of taxes that a shareholder would pay on Fund distributions or the redemption of Fund shares.
Subject to investment risks, including possible loss of the principal amount invested.
Maximum Offering Price (MOP) for Class A shares includes the Fund's maximum sales charge of 4.75%. Performance shown at NAV does not include these sales charges and would have been lower had it been taken into account.
A Contingent Deferred Sales Charge (CDSC) of 1.00% may apply to Class C shares redeemed within the first 12 months after a purchase.
| (1) | Inception Dates - Class A: 02/18/1997, Class C: 07/01/2000, Class Institutional: 03/19/2012, Class Investor: 03/16/2010 |
| (2) | Emerald Mutual Fund Advisers Trust ("Emerald" or the "Adviser") has agreed contractually to waive a portion of its fees and reimburse other expenses until August 31, 2018 in amounts necessary to limit the Fund's operating expenses (exclusive of Acquired Fund Fees and Expenses, brokerage expenses, interest expenses, taxes and extraordinary expense) for Class A, Class C, Institutional Class, and Investor Class shares to an annual rate (as percentage of the Fund's average daily net assets) of 1.84%, 2.49%, 1.54% and 1.89% respectively. The Adviser will be permitted to recover, on a class-by-class basis, expenses it has borne through the agreement described above to the extent |
| Annual Report | April 30, 2018 | 19 |
| Emerald Banking and Finance Fund | Manager Commentary |
April 30, 2018 (Unaudited)
that the Fund's expenses in later periods fall below the annual rates set forth in the relevant agreement. The Fund will not be obligated to pay any such deferred fees and expenses more than three years after the year(s) in which the fees and expense were incurred. The Adviser may not discontinue this waiver prior to August 31, 2018, without the approval by the Fund's Board of Trustees. Ratios as of the Prospectus dated August 31, 2017 and may differ from the ratios presented in the Financial Highlights.
| (3) | Excludes adjustments in accordance with accounting principles generally accepted in the United States of America and as such, the net asset value and total return for shareholder transactions reported to the market may differ from the net asset value for financial reporting purposes. |
| † | The Russell 2000® Index measures the performance of the small-cap segment of the U.S. equity universe. The Russell 2000® is a subset of the Russell 3000® Index representing approximately 8% of the total market capitalization of that index. It includes approximately 2000 of the smallest securities based on a combination of their market cap and current index membership. The index is not actively managed and does not reflect any deductions for fees, expenses or taxes. An investor may not invest directly into an index. |
| †† | The Russell 2000® Financial Services TR Index is an additional index, and is comprised of the smallest financial services companies in the Russell 3000 Index. The Index is not actively managed and does not reflect any deductions for fees, expense, or taxes. An investor may not invest directly in the Index. |
Important Risks
A fund that concentrates in a particular industry will involve a greater degree of risk than a fund with a more diversified portfolio. Investing in smaller companies generally will present greater investment risks, including: greater price volatility, greater sensitivity to changing economic conditions and less liquidity than the securities of larger, more mature companies.
| 20 | www.emeraldmutualfunds.com |
| Emerald Banking and Finance Fund | Manager Commentary |
April 30, 2018 (Unaudited)
GROWTH OF $10,000 INVESTMENT IN THE FUND (for the period ended April 30, 2018)
Comparison of change in value of a $10,000 investment (includes applicable sales loads)
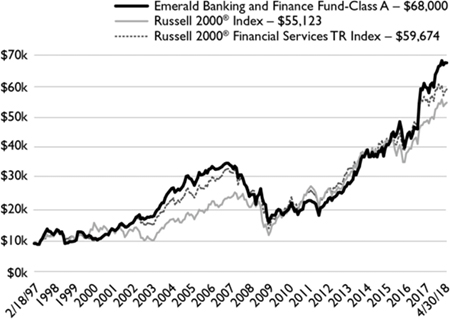
The chart represents historical performance of a hypothetical investment of $10,000 in the Fund since inception. Past performance does not guarantee future results. This chart does not reflect the deduction of taxes that a shareholder would pay on Fund distributions or the redemption of Fund shares.
Investing in the Fund is subject to investment risks, including possible loss of the principal amount invested.
| Annual Report | April 30, 2018 | 21 |
| Emerald Funds | Disclosure of Fund Expenses |
April 30, 2018 (Unaudited)
As a shareholder of the Funds, you incur two types of costs: (1) transaction costs, including applicable sales charges (loads); and (2) ongoing costs, including management fees, distribution and service (12b-1) fees, shareholder services fees and other Fund expenses. This example is intended to help you understand your ongoing costs (in dollars) of investing in the Funds and to compare these costs with the ongoing costs of investing in other mutual funds. The example is based on an investment of $1,000 invested at the beginning of the (six-month) period and held for the entire period November 1, 2017 through April 30, 2018.
Actual Expenses
The first line for each share class of the Fund in the table below provides information about actual account values and actual expenses. You may use this information, together with the amount you invested, to estimate the expenses that you paid over the period. Simply divide your account value by $1,000 (for example, an $8,600 account value divided by $1,000 = 8.6), then multiply the result by the number in the applicable line under the heading titled “Expenses Paid During Period” to estimate the expenses you paid on your account during this period.
Hypothetical Example For Comparison Purposes
The second line for each share class of each Fund in the table below provides information about hypothetical account values and hypothetical expenses based on the Fund’s actual expense ratio and an assumed rate of return of 5% per year before expenses, which is not the Fund’s actual return. The hypothetical account values and expenses may not be used to estimate the actual ending account balance or expenses you paid for the period. You may use this information to compare the ongoing costs of investing in the Funds and other funds. To do so, compare this 5% hypothetical example with the 5% hypothetical examples that appear in the shareholder reports of other mutual funds.
Please note that the expenses shown in the table below are meant to highlight your ongoing costs only and do not reflect any transactional costs, such as sales charges (loads), redemption fees or exchange fees. Therefore, the second line for each share class of the Fund within the table is useful in comparing ongoing costs only, and will not help you determine the relative total costs of owning different funds. If these transactional costs were included, your costs would have been higher.
| | Beginning Account Value 11/01/17 | Ending Account Value 04/30/18 | Expense Ratio(a) | Expense Paid During Period 11/01/17 - 4/30/18(b) |
| Emerald Growth Fund | | | | |
| Class A | | | | |
| Actual | $1,000.00 | $1,042.10 | 1.02% | $5.16 |
| Hypothetical (5% return before expenses) | $1,000.00 | $1,019.74 | 1.02% | $5.11 |
| Class C | | | | |
| Actual | $1,000.00 | $1,038.90 | 1.67% | $8.44 |
| Hypothetical (5% return before expenses) | $1,000.00 | $1,016.51 | 1.67% | $8.35 |
| Institutional Class | | | | |
| Actual | $1,000.00 | $1,043.80 | 0.70% | $3.55 |
| Hypothetical (5% return before expenses) | $1,000.00 | $1,021.32 | 0.70% | $3.51 |
| Investor Class | | | | |
| Actual | $1,000.00 | $1,041.90 | 1.05% | $5.32 |
| Hypothetical (5% return before expenses) | $1,000.00 | $1,019.59 | 1.05% | $5.26 |
| | | | | |
| Emerald Small Cap Value Fund | | | | |
| Class A | | | | |
| Actual | $1,000.00 | $1,026.90 | 1.35% | $6.78 |
| Hypothetical (5% return before expenses) | $1,000.00 | $1,018.10 | 1.35% | $6.76 |
| Class C | | | | |
| Actual | $1,000.00 | $1,023.50 | 2.00% | $10.03 |
| Hypothetical (5% return before expenses) | $1,000.00 | $1,014.88 | 2.00% | $9.99 |
| Institutional Class | | | | |
| Actual | $1,000.00 | $1,028.30 | 1.00% | $5.03 |
| Hypothetical (5% return before expenses) | $1,000.00 | $1,019.84 | 1.00% | $5.01 |
| Investor Class | | | | |
| Actual | $1,000.00 | $1,026.90 | 1.25% | $6.28 |
| Hypothetical (5% return before expenses) | $1,000.00 | $1,018.60 | 1.25% | $6.26 |
| 22 | www.emeraldmutualfunds.com |
| Emerald Funds | Disclosure of Fund Expenses |
April 30, 2018 (Unaudited)
| | Beginning Account Value 11/01/17 | Ending Account Value 04/30/18 | Expense Ratio(a) | Expense Paid During Period 11/01/17 - 4/30/18(b) |
| Emerald Insights Fund | | | | |
| Class A | | | | |
| Actual | $1,000.00 | $1,059.10 | 1.35% | $6.89 |
| Hypothetical (5% return before expenses) | $1,000.00 | $1,018.10 | 1.35% | $6.76 |
| Class C | | | | |
| Actual | $1,000.00 | $1,055.50 | 2.00% | $10.19 |
| Hypothetical (5% return before expenses) | $1,000.00 | $1,014.88 | 2.00% | $9.99 |
| Institutional Class | | | | |
| Actual | $1,000.00 | $1,060.10 | 1.05% | $5.36 |
| Hypothetical (5% return before expenses) | $1,000.00 | $1,019.59 | 1.05% | $5.26 |
| Investor Class | | | | |
| Actual | $1,000.00 | $1,059.30 | 1.40% | $7.15 |
| Hypothetical (5% return before expenses) | $1,000.00 | $1,017.85 | 1.40% | $7.00 |
| | | | | |
| Emerald Banking and Finance Fund | | | | |
| Class A | | | | |
| Actual | $1,000.00 | $1,041.60 | 1.42% | $7.19 |
| Hypothetical (5% return before expenses) | $1,000.00 | $1,017.75 | 1.42% | $7.10 |
| Class C | | | | |
| Actual | $1,000.00 | $1,038.10 | 2.06% | $10.41 |
| Hypothetical (5% return before expenses) | $1,000.00 | $1,014.58 | 2.06% | $10.29 |
| Institutional Class | | | | |
| Actual | $1,000.00 | $1,043.20 | 1.08% | $5.47 |
| Hypothetical (5% return before expenses) | $1,000.00 | $1,019.44 | 1.08% | $5.41 |
| Investor Class | | | | |
| Actual | $1,000.00 | $1,042.30 | 1.27% | $6.43 |
| Hypothetical (5% return before expenses) | $1,000.00 | $1,018.50 | 1.27% | $6.36 |
| (a) | The Fund's expense ratios have been based on the Fund's most recent fiscal half-year expenses. |
| (b) | Expenses are equal to the Fund's annualized expense ratio multiplied by the average account value over the period, multiplied by the number of days in the most recent fiscal half-year (181)/365 (to reflect the half-year period). |
| Annual Report | April 30, 2018 | 23 |
| Emerald Growth Fund | Schedule of Investments |
April 30, 2018
| Shares | | | | Value (Note 2) | |
| COMMON STOCKS: 98.88% | | | |
| Consumer Discretionary: 17.16% | | | | |
| | 510,592 | | American Eagle Outfitters, Inc. | | $ | 10,559,043 | |
| | 82,312 | | Burlington Stores, Inc.(a) | | | 11,182,085 | |
| | 1,283,779 | | Chegg, Inc.(a) | | | 29,796,511 | |
| | 56,446 | | Children's Place, Inc. | | | 7,199,687 | |
| | 187,299 | | Chuy's Holdings, Inc.(a) | | | 5,356,751 | |
| | 582,767 | | Entercom Communications Corp., Class A | | | 5,915,085 | |
| | 222,162 | | Five Below, Inc.(a) | | | 15,686,859 | |
| | 74,889 | | Instructure, Inc.(a) | | | 3,036,749 | |
| | 108,864 | | Jack in the Box, Inc. | | | 9,765,101 | |
| | 251,986 | | Marcus Corp. | | | 7,509,183 | |
| | 287,776 | | Meritage Homes Corp.(a) | | | 12,806,032 | |
| | 434,224 | | Meritor, Inc.(a) | | | 8,454,341 | |
| | 400,965 | | Nutrisystem, Inc. | | | 11,627,985 | |
| | 214,326 | | Ollie's Bargain Outlet Holdings, Inc.(a) | | | 13,331,077 | |
| | 328,673 | | Planet Fitness, Inc., Class A(a) | | | 13,242,235 | |
| | 371,626 | | PlayAGS, Inc.(a) | | | 8,402,464 | |
| | 91,851 | | Red Robin Gourmet Burgers, Inc.(a) | | | 5,726,910 | |
| | 464,135 | | SeaWorld Entertainment, Inc.(a) | | | 7,003,797 | |
| | 303,674 | | Steven Madden, Ltd. | | | 14,652,270 | |
| | 362,375 | | Tilly's, Inc., Class A | | | 4,062,224 | |
| | 265,542 | | Zoe's Kitchen, Inc.(a) | | | 3,916,745 | |
| | | | | | | 209,233,134 | |
| | | | | | | | |
| Consumer Staples: 1.08% | | | | |
| | 431,905 | | Freshpet, Inc.(a) | | | 8,551,719 | |
| | 51,690 | | National Beverage Corp. | | | 4,567,328 | |
| | | | | | | 13,119,047 | |
| | | | | | | | |
| Energy: 3.38% | | | | | |
| | 872,227 | | Callon Petroleum Co.(a) | | | 12,132,678 | |
| | 268,600 | | Enphase Energy, Inc.(a) | | | 1,114,690 | |
| | 775,270 | | Extraction Oil & Gas, Inc.(a) | | | 10,946,812 | |
| | 529,427 | | Keane Group, Inc.(a) | | | 8,232,590 | |
| | 525,000 | | Ring Energy, Inc.(a) | | | 8,778,000 | |
| | | | | | | 41,204,770 | |
| | | | | | | | |
| Financial Services: 16.23% | | | | |
| | 355,586 | | BofI Holding, Inc.(a) | | | 14,323,004 | |
| | 666,128 | | Cadence BanCorp | | | 19,470,921 | |
| | 40,144 | | CNB Financial Corp. | | | 1,138,484 | |
| | 441,020 | | FCB Financial Holdings, Inc., Class A(a) | | | 25,490,956 | |
| | 122,502 | | First Choice Bancorp | | | 3,258,553 | |
| | 82,881 | | First Foundation, Inc.(a) | | | 1,482,741 | |
| | 320,465 | | Industrial Logistics Properties Trust, REIT | | | 6,575,942 | |
| | 93,241 | | LendingTree, Inc.(a) | | | 22,228,654 | |
| | 391,230 | | Live Oak Bancshares, Inc. | | | 11,052,248 | |
| | 198,395 | | Merchants Bancorp | | | 4,241,685 | |
| | 214,690 | | Moelis & Co., Class A | | | 11,550,322 | |
| Shares | | | | Value (Note 2) | |
| Financial Services (continued) | | | | |
| | 457,343 | | Monmouth Real Estate Investment Corp. | | $ | 7,148,271 | |
| | 229,926 | | National Commerce Corp.(a) | | | 9,955,796 | |
| | 350,335 | | OceanFirst Financial Corp. | | | 9,452,038 | |
| | 370,221 | | Opus Bank | | | 10,440,232 | |
| | 505,986 | | Pacific Premier Bancorp, Inc.(a) | | | 20,112,944 | |
| | 199,849 | | Triumph Bancorp, Inc.(a) | | | 7,764,134 | |
| | 322,454 | | Union Bankshares Corp. | | | 12,191,986 | |
| | | | | | | 197,878,911 | |
| | | | | | | | |
| Health Care: 17.67% | | | | |
| | 313,474 | | Adamas Pharmaceuticals, Inc.(a) | | | 9,463,780 | |
| | 230,744 | | Aimmune Therapeutics, Inc.(a) | | | 7,162,294 | |
| | 714,855 | | Alder Biopharmaceuticals, Inc.(a) | | | 10,150,941 | |
| | 246,207 | | Amicus Therapeutics, Inc.(a) | | | 3,483,829 | |
| | 231,410 | | Arena Pharmaceuticals, Inc.(a) | | | 9,219,374 | |
| | 152,335 | | ARMO BioSciences, Inc.(a) | | | 4,055,158 | |
| | 65,248 | | Assembly Biosciences, Inc.(a) | | | 2,836,983 | |
| | 269,960 | | AtriCure, Inc.(a) | | | 6,001,211 | |
| | 192,982 | | Biohaven Pharmaceutical Holding Co., Ltd.(a) | | | 5,627,355 | |
| | 15,192 | | Bluebird Bio, Inc.(a) | | | 2,584,919 | |
| | 437,450 | | CareDx, Inc.(a) | | | 4,282,636 | |
| | 325,867 | | Catalent, Inc.(a) | | | 13,396,392 | |
| | 494,178 | | Catalyst Pharmaceuticals, Inc.(a) | | | 1,383,698 | |
| | 97,703 | | Clovis Oncology, Inc.(a) | | | 4,238,356 | |
| | 800,000 | | ConforMIS, Inc.(a) | | | 1,036,000 | |
| | 252,464 | | Deciphera Pharmaceuticals, Inc.(a) | | | 5,665,292 | |
| | 195,763 | | Dicerna Pharmaceuticals, Inc.(a) | | | 2,390,266 | |
| | 200,000 | | Eloxx Pharmaceuticals, Inc.(a) | | | 2,454,000 | |
| | 218,604 | | Exact Sciences Corp.(a) | | | 10,932,386 | |
| | 279,101 | | G1 Therapeutics, Inc.(a) | | | 10,703,523 | |
| | 374,674 | | Insmed, Inc.(a) | | | 9,115,818 | |
| | 100,125 | | Integer Holdings Corp.(a) | | | 5,496,863 | |
| | 557,396 | | K2M Group Holdings, Inc.(a) | | | 10,646,264 | |
| | 174,830 | | Merit Medical Systems, Inc.(a) | | | 8,479,255 | |
| | 10,000 | | NeoGenomics, Inc.(a) | | | 95,800 | |
| | 328,490 | | OraSure Technologies, Inc.(a) | | | 5,824,128 | |
| | 189,099 | | Puma Biotechnology, Inc.(a) | | | 12,055,061 | |
| | 289,653 | | Reata Pharmaceuticals, Inc., Class A(a) | | | 7,658,425 | |
| | 67,994 | | Sage Therapeutics, Inc.(a) | | | 9,785,697 | |
| | 129,471 | | Sarepta Therapeutics, Inc.(a) | | | 9,886,406 | |
| | 186,939 | | Savara, Inc.(a) | | | 1,731,055 | |
| | 129,090 | | Tabula Rasa HealthCare, Inc.(a) | | | 5,291,399 | |
| | 285,399 | | Teladoc, Inc.(a) | | | 12,272,157 | |
| | | | | | | 215,406,721 | |
| | | | | | | | |
| Materials & Processing: 6.33% | | | | |
| | 916,985 | | AK Steel Holding Corp.(a) | | | 4,208,961 | |
| | 277,081 | | Allegheny Technologies, Inc.(a) | | | 7,362,042 | |
| | 289,508 | | Carpenter Technology Corp. | | | 15,419,196 | |
| | 436,620 | | Cleveland-Cliffs, Inc.(a) | | | 3,239,721 | |
| 24 | www.emeraldmutualfunds.com |
| Emerald Growth Fund | Schedule of Investments |
April 30, 2018
| Shares | | | | Value (Note 2) | |
| Materials & Processing (continued) | | | |
| | 56,752 | | Innospec, Inc. | | $ | 4,125,870 | |
| | 141,061 | | Installed Building Products, Inc.(a) | | | 8,139,220 | |
| | 502,731 | | PQ Group Holdings, Inc.(a) | | | 6,987,961 | |
| | 167,973 | | Trex Co., Inc.(a) | | | 17,449,035 | |
| | 174,983 | | US Concrete, Inc.(a) | | | 10,227,756 | |
| | | | | | | 77,159,762 | |
| | | | | | | | |
| Producer Durables: 12.08% | | | | |
| | 261,413 | | Air Transport Services Group, Inc.(a) | | | 5,290,999 | |
| | 169,692 | | Atlas Air Worldwide Holdings, Inc.(a) | | | 10,758,473 | |
| | 47,752 | | Blue Bird Corp.(a) | | | 1,134,110 | |
| | 641,975 | | Daseke, Inc.(a) | | | 5,315,553 | |
| | 139,049 | | Dycom Industries, Inc.(a) | | | 14,441,629 | |
| | 140,962 | | Evoqua Water Technologies Corp.(a) | | | 2,879,854 | |
| | 336,922 | | H&E Equipment Services, Inc. | | | 10,899,427 | |
| | 440,074 | | Kennametal, Inc. | | | 16,040,697 | |
| | 321,576 | | KLX, Inc.(a) | | | 25,156,890 | |
| | 1,231,686 | | Kratos Defense & Security Solutions, Inc.(a) | | | 12,329,177 | |
| | 71,365 | | Manitowoc Co., Inc.(a) | | | 1,759,147 | |
| | 106,163 | | NV5 Global, Inc.(a) | | | 6,247,693 | |
| | 51,080 | | OSI Systems, Inc.(a) | | | 3,270,142 | |
| | 211,574 | | Tetra Tech, Inc. | | | 10,240,182 | |
| | 116,067 | | TopBuild Corp.(a) | | | 9,250,540 | |
| | 53,190 | | TriNet Group, Inc.(a) | | | 2,747,263 | |
| | 463,557 | | Tutor Perini Corp.(a) | | | 9,572,452 | |
| | | | | | | 147,334,228 | |
| | | | | | | | |
| Technology: 21.59% | | | |
| | 218,467 | | Alarm.com Holdings, Inc.(a) | | | 8,821,698 | |
| | 543,080 | | Box, Inc., Class A(a) | | | 12,414,809 | |
| | 14,600 | | Ceridian HCM Holding, Inc.(a) | | | 461,068 | |
| | 449,455 | | Ciena Corp.(a) | | | 11,573,466 | |
| | 615,814 | | Cloudera, Inc.(a) | | | 8,775,350 | |
| | 196,586 | | EPAM Systems, Inc.(a) | | | 22,479,609 | |
| | 265,476 | | ForeScout Technologies, Inc.(a) | | | 8,492,577 | |
| | 143,392 | | GrubHub, Inc.(a) | | | 14,502,667 | |
| | 390,469 | | GTT Communications, Inc.(a) | | | 18,762,035 | |
| | 116,649 | | Guidewire Software, Inc.(a) | | | 9,870,838 | |
| | 224,680 | | II-VI, Inc.(a) | | | 8,560,308 | |
| | 166,930 | | Imperva, Inc.(a) | | | 7,470,118 | |
| | 288,737 | | Internap Corp.(a) | | | 3,409,984 | |
| | 68,605 | | IPG Photonics Corp.(a) | | | 14,614,923 | |
| | 730,058 | | Leaf Group, Ltd.(a) | | | 5,365,926 | |
| | 88,793 | | Lumentum Holdings, Inc.(a) | | | 4,479,607 | |
| | 326,285 | | Mercury Systems, Inc.(a) | | | 10,467,223 | |
| | 76,653 | | MKS Instruments, Inc. | | | 7,849,267 | |
| | 311,360 | | Model N, Inc.(a) | | | 5,339,824 | |
| | 93,284 | | Monolithic Power Systems, Inc. | | | 10,923,556 | |
| | 4,294 | | nLight, Inc.(a) | | | 107,049 | |
| | 160,820 | | Proofpoint, Inc.(a) | | | 18,967,111 | |
| | 445,490 | | Pure Storage, Inc., Class A(a) | | | 9,012,263 | |
| | 116,046 | | Q2 Holdings, Inc.(a) | | | 5,715,266 | |
| Shares | | | | Value (Note 2) | |
| Technology (continued) | | | | |
| | 33,020 | | Rapid7, Inc.(a) | | $ | 932,485 | |
| | 221,026 | | Reis, Inc. | | | 4,641,546 | |
| | 473,341 | | USA Technologies, Inc.(a) | | | 4,141,734 | |
| | 360,161 | | Varonis Systems, Inc.(a) | | | 23,536,521 | |
| | 50,000 | | Zscaler, Inc.(a) | | | 1,494,500 | |
| | | | | | | 263,183,328 | |
| | | | | | | | |
| Utilities: 3.36% | | | | |
| | 153,911 | | Cogent Communications Holdings, Inc. | | | 7,256,903 | |
| | 800,000 | | Fusion Telecommunications International, Inc.(a) | | | 2,504,000 | |
| | 197,613 | | Shenandoah Telecommunications Co. | | | 7,459,891 | |
| | 2,124,695 | | Vonage Holdings Corp.(a) | | | 23,754,090 | |
| | | | | | | 40,974,884 | |
| | | | | | | | |
| | | | Total Common Stocks | | | | |
| | | | (Cost $904,588,109) | | | 1,205,494,785 | |
| | | | | | | | |
| SHORT TERM INVESTMENTS: 1.45% | | | | |
| | 17,686,023 | | Dreyfus Government Cash Management Fund - Institutional Class 1.590% (7-Day Yield) | | | 17,686,023 | |
| | | | | | | | |
| | | | Total Short Term Investments | | | | |
| | | | (Cost $17,686,023) | | | 17,686,023 | |
| | | | | | | | |
| Total Investments: 100.33% | | | |
| (Cost $922,274,132) | | | 1,223,180,808 | |
| | | | | | | | |
| Liabilities In Excess Of Other Assets: (0.33)% | | | (3,963,293 | ) |
| Net Assets: 100.00% | | $ | 1,219,217,515 | |
| (a) | Non-income producing security. |
For Fund compliance purposes, the Fund's industry classifications refer to any one or more of the industry sub-classifications used by one or more widely recognized market indexes or ratings group indexes, and/or as defined by Fund management. This definition may not apply for purposes of this report, which may combine industry sub-classifications for reporting ease. Industries are shown as a percentage of net assets.
See Notes to Financial Statements.
| Annual Report | April 30, 2018 | 25 |
| Emerald Small Cap Value Fund | Schedule of Investments |
April 30, 2018
| Shares | | | | Value (Note 2) | |
| COMMON STOCKS: 96.04% | | |
| Consumer Discretionary: 12.13% | | | | |
| | 2,558 | | Aaron's, Inc. | | $ | 106,848 | |
| | 8,691 | | Gray Television, Inc.(a) | | | 98,208 | |
| | 12,621 | | MDC Partners, Inc., Class A(a) | | | 95,289 | |
| | 6,380 | | Meritor, Inc.(a) | | | 124,219 | |
| | 3,023 | | Nutrisystem, Inc. | | | 87,667 | |
| | 2,096 | | Penske Automotive Group, Inc. | | | 94,530 | |
| | 4,152 | | PlayAGS, Inc.(a) | | | 93,877 | |
| | 2,755 | | Viad Corp. | | | 139,815 | |
| | 9,487 | | ZAGG, Inc.(a) | | | 106,254 | |
| | | | | | | 946,707 | |
| | | | | | | | |
| Energy: 7.07% | | | | |
| | 5,378 | | Extraction Oil & Gas, Inc.(a) | | | 75,937 | |
| | 3,655 | | Liberty Oilfield Services, Inc., Class A(a) | | | 72,881 | |
| | 3,515 | | Mammoth Energy Services, Inc.(a) | | | 114,167 | |
| | 7,963 | | SRC Energy, Inc.(a) | | | 87,912 | |
| | 8,351 | | Superior Energy Services, Inc.(a) | | | 89,606 | |
| | 2,715 | | Whiting Petroleum Corp.(a) | | | 110,826 | |
| | | | | | | 551,329 | |
| | | | | | | | |
| Financial Services: 46.42% | | |
| | 2,283 | | BancorpSouth Bank | | | 75,453 | |
| | 1,850 | | BankUnited, Inc. | | | 73,279 | |
| | 3,903 | | BofI Holding, Inc.(a) | | | 157,213 | |
| | 1,350 | | Chemical Financial Corp. | | | 74,102 | |
| | 3,400 | | CNB Financial Corp. | | | 96,424 | |
| | 3,220 | | ConnectOne Bancorp, Inc. | | | 85,008 | |
| | 2,950 | | Customers Bancorp, Inc.(a) | | | 85,019 | |
| | 1,320 | | Eagle Bancorp, Inc.(a) | | | 77,484 | |
| | 2,071 | | Employers Holdings, Inc. | | | 84,704 | |
| | 3,290 | | Entegra Financial Corp.(a) | | | 95,575 | |
| | 3,897 | | ESSA Bancorp, Inc. | | | 56,974 | |
| | 2,178 | | First Bancorp | | | 83,091 | |
| | 2,700 | | First Defiance Financial Corp. | | | 161,081 | |
| | 2,898 | | First Financial Bancorp | | | 89,693 | |
| | 941 | | First Merchants Corp. | | | 40,538 | |
| | 800 | | First Savings Financial Group, Inc. | | | 57,984 | |
| | 1,892 | | FS Bancorp, Inc. | | | 108,941 | |
| | 1,457 | | Hancock Holding Co. | | | 71,174 | |
| | 2,190 | | HomeStreet, Inc.(a) | | | 55,845 | |
| | 1,150 | | IBERIABANK Corp. | | | 86,193 | |
| | 3,670 | | Investar Holding Corp. | | | 93,402 | |
| | 2,120 | | LegacyTexas Financial Group, Inc. | | | 87,068 | |
| | 3,638 | | Live Oak Bancshares, Inc. | | | 102,774 | |
| | 1,330 | | Meta Financial Group, Inc. | | | 147,830 | |
| | 1,825 | | Moelis & Co., Class A | | | 98,185 | |
| | 3,107 | | Northeast Bancorp | | | 60,587 | |
| | 1,420 | | Northrim BanCorp, Inc. | | | 49,984 | |
| | 2,893 | | OceanFirst Financial Corp. | | | 78,053 | |
| | 2,324 | | PCSB Financial Corp.(a) | | | 47,107 | |
| | 4,545 | | PennyMac Financial Services, Inc.,
Class A(a) | | | 93,627 | |
| Shares | | | | Value (Note 2) | |
| Financial Services (continued) | | | |
| | 2,924 | | People's Utah Bancorp | | $ | 93,129 | |
| | 2,380 | | Popular, Inc. | | | 110,169 | |
| | 1,457 | | Preferred Bank | | | 92,869 | |
| | 3,600 | | Rexford Industrial Realty, Inc., REIT | | | 109,980 | |
| | 2,142 | | Standard AVB Financial Corp. | | | 64,710 | |
| | 3,010 | | State Bank Financial Corp. | | | 94,845 | |
| | 3,650 | | Summit Financial Group, Inc. | | | 91,433 | |
| | 1,740 | | Timberland Bancorp, Inc. | | | 56,811 | |
| | 2,172 | | TriCo Bancshares | | | 81,168 | |
| | 3,333 | | TriState Capital Holdings, Inc.(a) | | | 83,325 | |
| | 2,060 | | Union Bankshares Corp. | | | 77,889 | |
| | 8,410 | | Western New England Bancorp, Inc. | | | 90,828 | |
| | | | | | | 3,621,548 | |
| | | | | | | | |
| Health Care: 3.76% | | | | |
| | 2,869 | | Acadia Healthcare Co., Inc.(a) | | | 102,079 | |
| | 1,217 | | Biohaven Pharmaceutical Holding Co., Ltd.(a) | | | 35,488 | |
| | 1,336 | | Insmed, Inc.(a) | | | 32,505 | |
| | 6,770 | | Invacare Corp. | | | 123,214 | |
| | | | | | | 293,286 | |
| | | | | | | | |
| Materials & Processing: 10.88% | | | | |
| | 13,400 | | AK Steel Holding Corp.(a) | | | 61,506 | |
| | 1,877 | | Apogee Enterprises, Inc. | | | 77,163 | |
| | 3,860 | | Baycom Corp.(a) | | | 84,920 | |
| | 6,381 | | Builders FirstSource, Inc.(a) | | | 116,326 | |
| | 20,933 | | Goldfield Corp.(a) | | | 87,919 | |
| | 3,131 | | Kirkland Lake Gold, Ltd. | | | 54,636 | |
| | 2,743 | | Koppers Holdings, Inc.(a) | | | 120,143 | |
| | 2,538 | | PolyOne Corp. | | | 106,215 | |
| | 1,933 | | Universal Forest Products, Inc. | | | 61,624 | |
| | 1,335 | | US Concrete, Inc.(a) | | | 78,031 | |
| | | | | | | 848,483 | |
| | | | | | | | |
| Producer Durables: 6.06% | | | | |
| | 4,534 | | Blue Bird Corp.(a) | | | 107,683 | |
| | 872 | | Dycom Industries, Inc.(a) | | | 90,566 | |
| | 1,999 | | ICF International, Inc. | | | 134,132 | |
| | 1,191 | | OSI Systems, Inc.(a) | | | 76,248 | |
| | 3,099 | | Tutor Perini Corp.(a) | | | 63,994 | |
| | | | | | | 472,623 | |
| | | | | | | | |
| Technology: 8.49% | | | |
| | 3,893 | | ARRIS International PLC(a) | | | 105,111 | |
| | 3,283 | | Kulicke & Soffa Industries, Inc.(a) | | | 75,148 | |
| | 13,860 | | Mitel Networks Corp.(a) | | | 154,678 | |
| | 10,095 | | Photronics, Inc.(a) | | | 77,227 | |
| | 2,915 | | Tower Semiconductor, Ltd.(a) | | | 75,411 | |
| | 6,405 | | Xcerra Corp.(a) | | | 77,372 | |
| | 4,432 | | Xperi Corp. | | | 97,504 | |
| | | | | | | 662,451 | |
| 26 | www.emeraldmutualfunds.com |
| Emerald Small Cap Value Fund | Schedule of Investments |
April 30, 2018
| Shares | | | | Value (Note 2) | |
| Utilities: 1.23% | | | |
| 8,572 | | Vonage Holdings Corp.(a) | | $ | 95,835 | |
| | | | | | | |
| | | Total Common Stocks | | | | |
| | | (Cost $6,433,768) | | | 7,492,262 | |
| | | | | | | |
| SHORT TERM INVESTMENTS: 3.07% | | | | |
| 239,140 | | Dreyfus Government Cash Management Fund - Institutional Class 1.590% (7-Day Yield) | | | 239,140 | |
| | | | | | | |
| | | Total Short Term Investments | | | | |
| | | (Cost $239,140) | | | 239,140 | |
| | | | | | | |
| Total Investments: 99.11% | | | | |
| (Cost $6,672,908) | | | 7,731,402 | |
| | | | | | | |
| Other Assets In Excess Of Liabilities: 0.89% | | | 69,046 | |
| Net Assets: 100.00% | | $ | 7,800,448 | |
| (a) | Non-income producing security. |
For Fund compliance purposes, the Fund's industry classifications refer to any one or more of the industry sub-classifications used by one or more widely recognized market indexes or ratings group indexes, and/or as defined by Fund management. This definition may not apply for purposes of this report, which may combine industry sub-classifications for reporting ease. Industries are shown as a percentage of net assets.
See Notes to Financial Statements.
| Annual Report | April 30, 2018 | 27 |
| Emerald Insights Fund | Schedule of Investments |
April 30, 2018
| Shares | | | | Value (Note 2) | |
| COMMON STOCKS: 97.41% | | | | |
| Consumer Discretionary: 19.99% | | | | |
| 352 | | Amazon.com, Inc.(a) | | $ | 551,278 | |
| 1,996 | | BorgWarner, Inc. | | | 97,684 | |
| 669 | | Burlington Stores, Inc.(a) | | | 90,884 | |
| 19,540 | | Chegg, Inc.(a) | | | 453,523 | |
| 2,591 | | Cinemark Holdings, Inc. | | | 101,490 | |
| 536 | | Home Depot, Inc. | | | 99,053 | |
| 3,208 | | MGM Resorts International | | | 100,795 | |
| 2,210 | | Nutrisystem, Inc. | | | 64,090 | |
| 899 | | Papa John's International, Inc. | | | 55,738 | |
| 3,050 | | PlayAGS, Inc.(a) | | | 68,961 | |
| 964 | | Royal Caribbean Cruises, Ltd. | | | 104,295 | |
| 8,549 | | SeaWorld Entertainment, Inc.(a) | | | 129,004 | |
| 1,806 | | Sinclair Broadcast Group, Inc., Class A | | | 51,200 | |
| 874 | | Six Flags Entertainment Corp. | | | 55,272 | |
| 1,944 | | Tenneco, Inc. | | | 86,877 | |
| 1,180 | | Toll Brothers, Inc. | | | 49,749 | |
| | | | | | 2,159,893 | |
| | | | | | | |
| Consumer Staples: 2.60% | | | | |
| 251 | | Constellation Brands, Inc., Class A | | | 58,516 | |
| 1,993 | | Energizer Holdings, Inc. | | | 114,318 | |
| 1,228 | | National Beverage Corp. | | | 108,506 | |
| | | | | | 281,340 | |
| | | | | | | |
| Energy: 6.26% | | | | |
| 361 | | Andeavor | | | 49,934 | |
| 1,070 | | Diamondback Energy, Inc.(a) | | | 137,441 | |
| 9,751 | | Extraction Oil & Gas, Inc.(a) | | | 137,684 | |
| 1,597 | | Mammoth Energy Services, Inc.(a) | | | 51,871 | |
| 4,076 | | Patterson-UTI Energy, Inc. | | | 87,308 | |
| 310 | | Pioneer Natural Resources Co. | | | 62,481 | |
| 2,859 | | Ring Energy, Inc.(a) | | | 47,802 | |
| 5,938 | | WPX Energy, Inc.(a) | | | 101,480 | |
| | | | | | 676,001 | |
| | | | | | | |
| Financial Services: 9.30% | | | | |
| 609 | | Affiliated Managers Group, Inc. | | | 100,400 | |
| 228 | | Alliance Data Systems Corp. | | | 46,295 | |
| 1,789 | | Bank of America Corp. | | | 53,527 | |
| 1,083 | | Bank of the Ozarks | | | 50,684 | |
| 1,639 | | Citigroup, Inc. | | | 111,895 | |
| 1,023 | | LendingTree, Inc.(a) | | | 243,883 | |
| 5,778 | | Newmark Group, Inc., Class A(a) | | | 87,248 | |
| 366 | | SBA Communications Corp., REIT(a) | | | 58,644 | |
| 264 | | SVB Financial Group(a) | | | 79,097 | |
| 917 | | Visa, Inc., Class A | | | 116,349 | |
| 956 | | Western Alliance Bancorp(a) | | | 56,385 | |
| | | | | | 1,004,407 | |
| | | | | | | |
| Health Care: 13.21% | | | | |
| 1,246 | | Abbott Laboratories | | | 72,430 | |
| 705 | | AbbVie, Inc. | | | 68,068 | |
| Shares | | | | Value (Note 2) | |
| Health Care (continued) | | | | |
| 2,895 | | Acadia Healthcare Co., Inc.(a) | | $ | 103,004 | |
| 749 | | Aimmune Therapeutics, Inc.(a) | | | 23,249 | |
| 3,394 | | Alder Biopharmaceuticals, Inc.(a) | | | 48,195 | |
| 961 | | Alnylam Pharmaceuticals, Inc.(a) | | | 90,843 | |
| 1,280 | | ARMO BioSciences, Inc.(a) | | | 34,074 | |
| 1,505 | | Biohaven Pharmaceutical Holding Co., Ltd.(a) | | | 43,886 | |
| 3,482 | | BioTelemetry, Inc.(a) | | | 133,012 | |
| 942 | | Clovis Oncology, Inc.(a) | | | 40,864 | |
| 1,718 | | Deciphera Pharmaceuticals, Inc.(a) | | | 38,552 | |
| 10,964 | | Dicerna Pharmaceuticals, Inc.(a) | | | 133,870 | |
| 3,167 | | Insmed, Inc.(a) | | | 77,053 | |
| 1,856 | | Integer Holdings Corp.(a) | | | 101,894 | |
| 1,294 | | Puma Biotechnology, Inc.(a) | | | 82,492 | |
| 337 | | Sage Therapeutics, Inc.(a) | | | 48,501 | |
| 1,399 | | Sarepta Therapeutics, Inc.(a) | | | 106,828 | |
| 2,968 | | Teladoc, Inc.(a) | | | 127,624 | |
| 750 | | Veeva Systems, Inc., Class A(a) | | | 52,598 | |
| | | | | | 1,427,037 | |
| | | | | | | |
| Materials & Processing: 6.78% | | | | |
| 1,163 | | Berry Global Group, Inc.(a) | | | 63,965 | |
| 4,329 | | GMS, Inc.(a) | | | 134,892 | |
| 1,012 | | Innospec, Inc. | | | 73,572 | |
| 1,016 | | Installed Building Products, Inc.(a) | | | 58,623 | |
| 1,307 | | Koppers Holdings, Inc.(a) | | | 57,247 | |
| 2,521 | | Masco Corp. | | | 95,470 | |
| 1,708 | | Nucor Corp. | | | 105,247 | |
| 1,012 | | Scotts Miracle-Gro Co. | | | 84,583 | |
| 570 | | Trex Co., Inc.(a) | | | 59,212 | |
| | | | | | 732,811 | |
| | | | | | | |
| Producer Durables: 8.65% | | | | |
| 252 | | CoStar Group, Inc.(a) | | | 92,398 | |
| 6,775 | | Daseke, Inc.(a) | | | 56,097 | |
| 1,122 | | Dycom Industries, Inc.(a) | | | 116,531 | |
| 540 | | Fortive Corp. | | | 37,967 | |
| 1,049 | | KLX, Inc.(a) | | | 82,063 | |
| 2,911 | | Kratos Defense & Security Solutions, Inc.(a) | | | 29,139 | |
| 1,672 | | OSI Systems, Inc.(a) | | | 107,042 | |
| 320 | | Parker-Hannifin Corp. | | | 52,678 | |
| 2,585 | | Quanta Services, Inc.(a) | | | 84,013 | |
| 1,517 | | Southwest Airlines Co. | | | 80,143 | |
| 1,067 | | TopBuild Corp.(a) | | | 85,040 | |
| 1,726 | | Trinity Industries, Inc. | | | 55,008 | |
| 378 | | United Rentals, Inc.(a) | | | 56,700 | |
| | | | | | 934,819 | |
| | | | | | | |
| Technology: 29.05% | | | | |
| 1,741 | | Alarm.com Holdings, Inc.(a) | | | 70,302 | |
| 287 | | Alphabet, Inc., Class A(a) | | | 292,332 | |
| 2,565 | | Apple, Inc. | | | 423,892 | |
| 28 | www.emeraldmutualfunds.com |
| Emerald Insights Fund | Schedule of Investments |
April 30, 2018
| Shares | | | | Value (Note 2) | |
| Technology (continued) | | | | |
| 425 | | Coherent, Inc.(a) | | $ | 71,494 | |
| 1,632 | | Dropbox, Inc., Class A(a) | | | 49,140 | |
| 1,878 | | Facebook, Inc., Class A(a) | | | 323,016 | |
| 1,742 | | Fortinet, Inc.(a) | | | 96,437 | |
| 545 | | IAC/InterActive Corp.(a) | | | 88,366 | |
| 4,162 | | Internap Corp.(a) | | | 49,153 | |
| 377 | | IPG Photonics Corp.(a) | | | 80,312 | |
| 1,084 | | Micron Technology, Inc.(a) | | | 49,842 | |
| 5,465 | | Microsoft Corp. | | | 511,087 | |
| 480 | | NVIDIA Corp. | | | 107,952 | |
| 3,100 | | ON Semiconductor Corp.(a) | | | 68,448 | |
| 530 | | Palo Alto Networks, Inc.(a) | | | 102,030 | |
| 13,087 | | Pixelworks, Inc.(a) | | | 56,012 | |
| 1,138 | | Proofpoint, Inc.(a) | | | 134,216 | |
| 793 | | PTC, Inc.(a) | | | 65,304 | |
| 684 | | salesforce.com, Inc.(a) | | | 82,757 | |
| 530 | | ServiceNow, Inc.(a) | | | 88,054 | |
| 663 | | Splunk, Inc.(a) | | | 68,057 | |
| 302 | | Take-Two Interactive Software, Inc.(a) | | | 30,112 | |
| 253 | | Ultimate Software Group, Inc.(a) | | | 60,700 | |
| 2,600 | | Varonis Systems, Inc.(a) | | | 169,910 | |
| | | | | | 3,138,925 | |
| | | | | | | |
| Utilities: 1.57% | | | | |
| 15,121 | | Vonage Holdings Corp.(a) | | | 169,053 | |
| | | | | | | |
| | | Total Common Stocks | | | | |
| | | (Cost $9,491,727) | | | 10,524,286 | |
| | | | | | | |
| MASTER LIMITED PARTNERSHIPS: 0.55% | |
| Financial Services: 0.55% | | | | |
| 1,086 | | Lazard, Ltd., Class A | | | 59,100 | |
| | | | | | | |
| | | Total Master Limited Partnerships | | | | |
| | | (Cost $35,382) | | | 59,100 | |
| | | | | | | |
| SHORT TERM INVESTMENTS: 3.30% | | | | |
| 356,505 | | Dreyfus Government Cash Management Fund - Institutional Class 1.590% (7-Day Yield) | | | 356,505 | |
| | | | | | | |
| | | Total Short Term Investments | | | | |
| | | (Cost $356,505) | | | 356,505 | |
| | | | | | | |
| Total Investments: 101.26% | | | | |
| (Cost $9,883,614) | | | 10,939,891 | |
| | | | | | | |
| Liabilities In Excess Of Other Assets: (1.26)% | | | (135,650 | ) |
| Net Assets: 100.00% | | $ | 10,804,241 | |
| (a) | Non-income producing security. |
For Fund compliance purposes, the Fund's industry classifications refer to any one or more of the industry sub-classifications used by one or more widely recognized market indexes or ratings group indexes, and/or as defined by Fund management. This definition may not apply for purposes of this report, which may combine industry sub-classifications for reporting ease. Industries are shown as a percentage of net assets.
See Notes to Financial Statements.
| Annual Report | April 30, 2018 | 29 |
| Emerald Banking and Finance Fund | Schedule of Investments |
April 30, 2018
| Shares | | | | Value (Note 2) | |
| COMMON STOCKS: 99.52% | | | |
| Financial Services: 97.19% | | | | |
| Banks: Diversified: 79.71% | | | | |
| 100,000 | | 1st Source Corp. | | $ | 5,200,000 | |
| 59,178 | | American Business Bank(a) | | | 2,355,225 | |
| 169,900 | | American Riviera Bank(a) | | | 3,296,060 | |
| 206,237 | | Ameris Bancorp | | | 10,662,453 | |
| 424,577 | | Bank of Commerce Holdings | | | 4,734,033 | |
| 238,604 | | Bank of NT Butterfield & Son, Ltd. | | | 11,321,760 | |
| 100,000 | | Bank of Princeton(a) | | | 3,322,000 | |
| 722,896 | | Bridgewater Bancshares, Inc.(a) | | | 9,404,877 | |
| 99,440 | | Business First Bancshares, Inc.(a) | | | 2,585,440 | |
| 457,815 | | Byline Bancorp, Inc.(a) | | | 9,728,569 | |
| 298,590 | | Cadence BanCorp | | | 8,727,786 | |
| 145,214 | | Carolina Financial Corp. | | | 5,693,841 | |
| 344,000 | | Carolina Trust Bancshares, Inc.(a) | | | 2,786,400 | |
| 358,750 | | CBTX, Inc. | | | 10,403,750 | |
| 370,213 | | CenterState Bank Corp. | | | 10,728,773 | |
| 118,810 | | Civista Bancshares, Inc. | | | 2,725,501 | |
| 150,002 | | CNB Financial Corp. | | | 4,254,057 | |
| 26,498 | | County Bancorp, Inc. | | | 746,184 | |
| 228,773 | | Equity Bancshares, Inc., Class A(a) | | | 8,723,114 | |
| 331,830 | | Esquire Financial Holdings, Inc.(a) | | | 7,993,785 | |
| 215 | | Farmers & Merchants Bank of Long Beach | | | 1,702,800 | |
| 86,853 | | Farmers National Banc Corp. | | | 1,281,082 | |
| 131,782 | | FB Financial Corp. | | | 5,248,877 | |
| 191,017 | | FCB Financial Holdings, Inc., Class A(a) | | | 11,040,783 | |
| 113,927 | | First Bancshares, Inc. | | | 3,685,538 | |
| 588,963 | | First Bank | | | 8,274,930 | |
| 163,498 | | First Choice Bancorp | | | 4,349,047 | |
| 578,105 | | First Foundation, Inc.(a) | | | 10,342,298 | |
| 190,000 | | First Internet Bancorp | | | 6,498,000 | |
| 41,281 | | First Merchants Corp. | | | 1,778,385 | |
| 125,475 | | First Resource Bank(a) | | | 1,458,647 | |
| 258,714 | | Freedom Bank of Virginia(a) | | | 3,421,493 | |
| 45,000 | | FS Bancorp, Inc. | | | 2,591,100 | |
| 92,837 | | FVCBankcorp, Inc.(a) | | | 1,609,329 | |
| 169,868 | | Gold Coast Bancorp, Inc.(a) | | | 2,254,998 | |
| 177,886 | | Guaranty Bancorp | | | 5,069,751 | |
| 200,000 | | Guaranty Bancshares, Inc. | | | 6,558,000 | |
| 138,670 | | Heritage Commerce Corp. | | | 2,286,668 | |
| 50,000 | | Independent Bank Corp. | | | 1,195,000 | |
| 254,042 | | Investar Holding Corp. | | | 6,465,369 | |
| 121,689 | | John Marshall Bancorp, Inc.(a) | | | 2,112,521 | |
| 65,781 | | Lakeland Bancorp, Inc. | | | 1,282,729 | |
| 46,615 | | Lakeland Financial Corp. | | | 2,215,145 | |
| 197,180 | | Level One Bancorp, Inc.(a) | | | 5,718,220 | |
| 269,682 | | Live Oak Bancshares, Inc. | | | 7,618,516 | |
| 53 | | Mechanics Bank(a) | | | 1,689,375 | |
| 87,881 | | Mercantile Bank Corp. | | | 3,102,199 | |
| 503,773 | | Merchants Bancorp | | | 10,770,667 | |
| 207,881 | | Metropolitan Bank Holding Corp.(a) | | | 9,839,008 | |
| 239,209 | | National Commerce Corp.(a) | | | 10,357,750 | |
| Shares | | | | Value (Note 2) | |
| Banks: Diversified (continued) | | | |
| 48,060 | | Nicolet Bankshares, Inc.(a) | | $ | 2,670,694 | |
| 203,594 | | Old Line Bancshares, Inc. | | | 6,932,376 | |
| 199,383 | | OP Bancorp(a) | | | 2,512,226 | |
| 158,129 | | Opus Bank | | | 4,459,238 | |
| 599,284 | | Pacific Mercantile Bancorp(a) | | | 5,603,305 | |
| 260,115 | | Pacific Premier Bancorp, Inc.(a) | | | 10,339,571 | |
| 212,884 | | People's Utah Bancorp | | | 6,780,355 | |
| 240,584 | | Professional Holding Corp.(a) | | | 4,101,957 | |
| 93,253 | | QCR Holdings, Inc. | | | 4,219,698 | |
| 398,258 | | RBB Bancorp | | | 10,880,409 | |
| 254,684 | | Seacoast Commerce Banc Holdings | | | 5,119,148 | |
| 246,130 | | ServisFirst Bancshares, Inc. | | | 10,327,615 | |
| 200,000 | | SmartFinancial, Inc.(a) | | | 4,770,000 | |
| 71,032 | | Southern First Bancshares, Inc.(a) | | | 3,256,817 | |
| 775,000 | | Sterling Bancorp, Inc. | | | 9,873,500 | |
| 300,000 | | Stewardship Financial Corp. | | | 3,600,000 | |
| 182,747 | | Sussex Bancorp | | | 5,509,822 | |
| 42,656 | | SVB Financial Group(a) | | | 12,780,164 | |
| 712,579 | | The Bancorp, Inc.(a) | | | 7,375,193 | |
| 355,851 | | TriState Capital Holdings, Inc.(a) | | | 8,896,275 | |
| 321,966 | | Triumph Bancorp, Inc.(a) | | | 12,508,379 | |
| 231,891 | | Union Bankshares Corp. | | | 8,767,799 | |
| 168,750 | | Unity Bancorp, Inc. | | | 3,712,500 | |
| 135,517 | | Veritex Holdings, Inc.(a) | | | 3,892,048 | |
| 109,942 | | West Town Bancorp, Inc.(a) | | | 3,166,330 | |
| 76,670 | | Western Alliance Bancorp(a) | | | 4,521,997 | |
| | | | | | 433,789,249 | |
| | | | | | | |
| Banks: Savings, Thrift & Mortgage Lending: 8.22% |
| 75,100 | | BofI Holding, Inc.(a) | | | 3,025,028 | |
| 230,146 | | Heritage Financial Corp. | | | 6,835,336 | |
| 267,003 | | Malvern Bancorp, Inc.(a) | | | 6,795,226 | |
| 128,396 | | Meta Financial Group, Inc. | | | 14,271,216 | |
| 196,808 | | OceanFirst Financial Corp. | | | 5,309,880 | |
| 169,608 | | WSFS Financial Corp. | | | 8,497,361 | |
| | | | | | 44,734,047 | |
| | | | | | | |
| Commercial Finance & Mortgage Companies: 0.49% | |
| 96,527 | | Marlin Business Services, Inc. | | | 2,644,840 | |
| | | | | | | |
| Consumer Lending: 2.74% | |
| 62,481 | | LendingTree, Inc.(a) | | | 14,895,470 | |
| | | | | | | |
| Financial Data & Systems: 1.65% | |
| 137,093 | | Cardlytics, Inc.(a) | | | 1,922,044 | |
| 8,930 | | WEX, Inc.(a) | | | 1,445,946 | |
| 68,910 | | Worldpay, Inc., Class A(a) | | | 5,596,870 | |
| | | | | | 8,964,860 | |
| | | | | | | |
| Insurance: Multi Line: 0.33% | |
| 50,000 | | James River Group Holdings, Ltd. | | | 1,816,000 | |
| | | | | | | |
| Insurance: Property-Casualty: 2.31% | |
| 150,000 | | Goosehead Insurance, Inc., Class A(a) | | | 2,220,000 | |
| 30 | www.emeraldmutualfunds.com |
| Emerald Banking and Finance Fund | Schedule of Investments |
April 30, 2018
| Shares | | | | Value (Note 2) | |
| Insurance: Property-Casualty (continued) | |
| 185,000 | | Kingstone Cos., Inc. | | $ | 3,163,500 | |
| 42,570 | | Kinsale Capital Group, Inc. | | | 2,194,483 | |
| 361,308 | | NMI Holdings, Inc., Class A(a) | | | 5,004,116 | |
| | | | | | 12,582,099 | |
| | | | | | | |
| Real Estate Services: 1.74% | |
| 462,855 | | Newmark Group, Inc., Class A(a) | | | 6,989,111 | |
| 51,020 | | Zillow Group, Inc., Class A(a) | | | 2,467,837 | |
| | | | | | 9,456,948 | |
| | | | | | | |
| Technology: 2.33% | | | | |
| Computer Services Software & Systems: 2.33% | |
| 141,914 | | Q2 Holdings, Inc.(a) | | | 6,989,264 | |
| 106,158 | | RealPage, Inc.(a) | | | 5,679,453 | |
| | | | | | 12,668,717 | |
| | | | | | | |
| | | Total Common Stocks | | | | |
| | | (Cost $396,457,113) | | | 541,552,230 | |
| SHORT TERM INVESTMENTS: 0.63% |
| 3,437,077 | | Dreyfus Government Cash Management Fund - Institutional Class 1.590% (7-Day Yield) | | | 3,437,077 | |
| | | | | | | |
| | | Total Short Term Investments | | | | |
| | | (Cost $3,437,077) | | | 3,437,077 | |
| | | | | | | |
| Total Investments: 100.15% | | | | |
| (Cost $399,894,190) | | | 544,989,307 | |
| | | | | | | |
| Liabilities In Excess Of Other Assets: (0.15)% | | | (790,253 | ) |
| Net Assets: 100.00% | | $ | 544,199,054 | |
| (a) | Non-income producing security. |
For Fund compliance purposes, the Fund's industry classifications refer to any one or more of the industry sub-classifications used by one or more widely recognized market indexes or ratings group indexes, and/or as defined by Fund management. This definition may not apply for purposes of this report, which may combine industry sub-classifications for reporting ease. Industries are shown as a percentage of net assets.
See Notes to Financial Statements.
| Annual Report | April 30, 2018 | 31 |
| Emerald Funds | Statements of Assets and Liabilities |
April 30, 2018
| | | Emerald Growth Fund | | | Emerald Small Cap Value Fund | | | Emerald Insights Fund | | | Emerald Banking and Finance Fund | |
| ASSETS: | | | | | | | | | | | | |
| Investments, at value | | $ | 1,223,180,808 | | | $ | 7,731,402 | | | $ | 10,939,891 | | | $ | 544,989,307 | |
| Receivable for investments sold | | | 2,983,566 | | | | 27,345 | | | | – | | | | 2,977,389 | |
| Receivable for shares sold | | | 1,233,202 | | | | 82,284 | | | | – | | | | 586,468 | |
| Receivable due from advisor | | | – | | | | 5,652 | | | | 302 | | | | – | |
| Interest and dividends receivable | | | 162,461 | | | | 2,162 | | | | 1,934 | | | | 96,445 | |
| Other assets | | | 22,534 | | | | 6,886 | | | | 7,859 | | | | 21,445 | |
| Total Assets | | | 1,227,582,571 | | | | 7,855,731 | | | | 10,949,986 | | | | 548,671,054 | |
| LIABILITIES: | | | | | | | | | | | | | | | | |
| Payable for investments purchased | | | 6,226,196 | | | | 24,643 | | | | 107,792 | | | | 3,336,009 | |
| Payable for shares redeemed | | | 993,720 | | | | – | | | | 5,572 | | | | 325,762 | |
| Investment advisory fees payable | | | 576,045 | | | | – | | | | – | | | | 412,646 | |
| Payable to fund accounting and administration | | | 84,426 | | | | 3,035 | | | | 2,822 | | | | 39,392 | |
| Payable for distribution and service fees | | | 323,854 | | | | 1,303 | | | | 3,229 | | | | 241,702 | |
| Payable for trustee fees and expenses | | | 13,006 | | | | 81 | | | | 119 | | | | 5,777 | |
| Payable for transfer agency fees | | | 46,278 | | | | 6,689 | | | | 7,029 | | | | 44,751 | |
| Payable for chief compliance officer fee | | | 7,163 | | | | 44 | | | | 64 | | | | 3,183 | |
| Payable for principal financial officer fee | | | 1,142 | | | | 7 | | | | 10 | | | | 507 | |
| Payable for professional fees | | | 25,822 | | | | 16,266 | | | | 16,282 | | | | 22,686 | |
| Accrued expenses and other liabilities | | | 67,404 | | | | 3,215 | | | | 2,826 | | | | 39,585 | |
| Total Liabilities | | | 8,365,056 | | | | 55,283 | | | | 145,745 | | | | 4,472,000 | |
| NET ASSETS | | $ | 1,219,217,515 | | | $ | 7,800,448 | | | $ | 10,804,241 | | | $ | 544,199,054 | |
| NET ASSETS CONSIST OF: | | | | | | | | | | | | | | | | |
| Paid-in capital (Note 5) | | $ | 854,172,055 | | | $ | 5,636,971 | | | $ | 8,300,996 | | | $ | 363,009,820 | |
| Accumulated net investment loss | | | (1,459,831 | ) | | | (6,508 | ) | | | – | | | | (1,277,168 | ) |
| Accumulated net realized gain | | | 65,598,615 | | | | 1,111,491 | | | | 1,446,968 | | | | 37,371,285 | |
| Net unrealized appreciation | | | 300,906,676 | | | | 1,058,494 | | | | 1,056,277 | | | | 145,095,117 | |
| NET ASSETS | | $ | 1,219,217,515 | | | $ | 7,800,448 | | | $ | 10,804,241 | | | $ | 544,199,054 | |
| INVESTMENTS, AT COST | | $ | 922,274,132 | | | $ | 6,672,908 | | | $ | 9,883,614 | | | $ | 399,894,190 | |
| PRICING OF SHARES | | | | | | | | | | | | | | | | |
| Class A: (a) | | | | | | | | | | | | | | | | |
| Net Asset Value, offering and redemption price per share | | $ | 25.99 | | | $ | 10.45 | | | $ | 13.09 | | | $ | 46.01 | |
| Net Assets | | $ | 239,315,840 | | | $ | 3,959,228 | | | $ | 9,321,214 | | | $ | 172,337,865 | |
| Shares of beneficial interest outstanding | | | 9,209,189 | | | | 378,946 | | | | 712,033 | | | | 3,745,626 | |
| Maximum offering price per share (NAV/.9525, based on maximum sales charge of 4.75% of the offering price) | | $ | 27.29 | | | $ | 10.97 | | | $ | 13.74 | | | $ | 48.30 | |
| Class C: (a) | | | | | | | | | | | | | | | | |
| Net Asset Value, offering and redemption price per share | | $ | 22.18 | | | $ | 10.15 | | | $ | 12.75 | | | $ | 40.83 | |
| Net Assets | | $ | 33,197,472 | | | $ | 107,758 | | | $ | 128,780 | | | $ | 78,987,775 | |
| Shares of beneficial interest outstanding | | | 1,497,006 | | | | 10,619 | | | | 10,097 | | | | 1,934,644 | |
| Institutional Class: | | | | | | | | | | | | | | | | |
| Net Asset Value, offering and redemption price per share | | $ | 26.94 | | | $ | 10.59 | | | $ | 13.22 | | | $ | 46.95 | |
| Net Assets | | $ | 839,075,593 | | | $ | 3,177,435 | | | $ | 1,228,350 | | | $ | 221,637,715 | |
| Shares of beneficial interest outstanding | | | 31,148,632 | | | | 299,946 | | | | 92,902 | | | | 4,720,609 | |
| Investor Class: | | | | | | | | | | | | | | | | |
| Net Asset Value, offering and redemption price per share | | $ | 25.88 | | | $ | 10.46 | | | $ | 13.05 | | | $ | 44.05 | |
| Net Assets | | $ | 107,628,610 | | | $ | 556,027 | | | $ | 125,897 | | | $ | 71,235,699 | |
| Shares of beneficial interest outstanding | | | 4,158,249 | | | | 53,149 | | | | 9,650 | | | | 1,617,226 | |
| (a) | Redemption price per share may be reduced for any applicable contingent deferred sales charge. For a description of a possible sales charge, please see the Funds' Prospectus. |
See Notes to Financial Statements.
| 32 | www.emeraldmutualfunds.com |
| Emerald Funds | Statements of Operations |
For the Year Ended April 30, 2018
| | | Emerald Growth Fund | | | Emerald Small Cap Value Fund | | | Emerald Insights Fund | | | Emerald Banking and Finance Fund | |
| INVESTMENT INCOME: | | | | | | | | | | | | | | | | |
| Dividends | | $ | 4,433,353 | | | $ | 78,115 | | | $ | 84,928 | | | $ | 3,821,605 | |
| Total Investment Income | | | 4,433,353 | | | | 78,115 | | | | 84,928 | | | | 3,821,605 | |
| | | | | | | | | | | | | | | | | |
| EXPENSES: | | | | | | | | | | | | | | | | |
| Investment advisory fee (Note 6) | | | 6,657,367 | | | | 59,393 | | | | 83,116 | | | | 4,646,371 | |
| Recoupment of previously waived fees (Note 6) | | | – | | | | – | | | | 22 | | | | – | |
| Administration fee | | | 465,218 | | | | 8,591 | | | | 8,607 | | | | 209,341 | |
| Custodian fee | | | 101,533 | | | | 5,000 | | | | 5,000 | | | | 54,397 | |
| Professional fees | | | 32,640 | | | | 16,902 | | | | 16,938 | | | | 26,259 | |
| Transfer agent fee | | | 234,929 | | | | 30,526 | | | | 33,172 | | | | 197,759 | |
| Delegated transfer agent equivalent services fees | | | | | | | | | | | | | | | | |
| Class A | | | 2,843 | | | | – | | | | – | | | | 13,308 | |
| Class C | | | 937 | | | | – | | | | – | | | | 2,625 | |
| Institutional Class | | | 770 | | | | 810 | | | | – | | | | – | |
| Investor Class | | | 3,253 | | | | 39 | | | | – | | | | 18 | |
| Trustee fees and expenses | | | 25,053 | | | | 165 | | | | 233 | | | | 11,189 | |
| Registration/filing fees | | | 74,191 | | | | 43,422 | | | | 37,039 | | | | 80,400 | |
| Reports to shareholder and printing fees | | | 97,952 | | | | 2,048 | | | | 2,232 | | | | 61,170 | |
| Distribution and service fees | | | | | | | | | | | | | | | | |
| Class A | | | 944,372 | | | | 9,548 | | | | 33,986 | | | | 605,932 | |
| Class C | | | 348,402 | | | | 1,178 | | | | 1,215 | | | | 767,454 | |
| Institutional Class | | | 318,979 | | | | – | | | | 237 | | | | 59,854 | |
| Investor Class | | | 413,666 | | | | 1,536 | | | | 308 | | | | 228,471 | |
| Chief compliance officer fee | | | 42,410 | | | | 294 | | | | 412 | | | | 18,739 | |
| Principal financial officer fee | | | 6,856 | | | | 48 | | | | 67 | | | | 3,029 | |
| Other | | | 29,768 | | | | 6,925 | | | | 6,654 | | | | 16,208 | |
| Total expenses before waiver | | | 9,801,139 | | | | 186,425 | | | | 229,238 | | | | 7,002,524 | |
| Less fees waived/reimbursed by investment advisor (Note 6) | | | – | | | | (94,955 | ) | | | (82,246 | ) | | | – | |
| Total Net Expenses | | | 9,801,139 | | | | 91,470 | | | | 146,992 | | | | 7,002,524 | |
| NET INVESTMENT INCOME/(LOSS): | | | (5,367,786 | ) | | | (13,355 | ) | | | (62,064 | ) | | | (3,180,919 | ) |
| | | | | | | | | | | | | | | | | |
| REALIZED AND UNREALIZED GAIN/(LOSS) | | | | | | | | | | | | | | | | |
| Net realized gain | | | 124,517,595 | | | | 1,207,917 | | | | 2,535,047 | | | | 59,497,046 | |
| Net change in unrealized appreciation/(depreciation) | | | 72,091,969 | | | | (267,114 | ) | | | (848,799 | ) | | | 6,208,469 | |
| NET REALIZED AND UNREALIZED GAIN | | | 196,609,564 | | | | 940,803 | | | | 1,686,248 | | | | 65,705,515 | |
| NET INCREASE IN NET ASSETS RESULTING FROM OPERATIONS | | $ | 191,241,778 | | | $ | 927,448 | | | $ | 1,624,184 | | | $ | 62,524,596 | |
See Notes to Financial Statements.
| Annual Report | April 30, 2018 | 33 |
| Emerald Growth Fund | Statements of Changes in Net Assets |
| | | Year Ended April 30, 2018 | | | Year Ended April 30, 2017 | |
| OPERATIONS: | | | | | | | | |
| Net investment loss | | $ | (5,367,786 | ) | | $ | (4,274,031 | ) |
| Net realized gain/(loss) | | | 124,517,595 | | | | (12,296,303 | ) |
| Net change in unrealized appreciation | | | 72,091,969 | | | | 231,448,346 | |
| Net increase in net assets resulting from operations | | | 191,241,778 | | | | 214,878,012 | |
| | | | | | | | | |
| SHARE TRANSACTIONS (NOTE 5): | | | | | | | | |
| Class A | | | | | | | | |
| Proceeds from sale of shares | | | 37,090,912 | | | | 49,638,686 | |
| Cost of shares redeemed | | | (116,095,204 | ) | | | (171,619,113 | ) |
| Net decrease from share transactions | | | (79,004,292 | ) | | | (121,980,427 | ) |
| Class C | | | | | | | | |
| Proceeds from sale of shares | | | 725,120 | | | | 816,759 | |
| Cost of shares redeemed | | | (8,056,239 | ) | | | (16,701,281 | ) |
| Net decrease from share transactions | | | (7,331,119 | ) | | | (15,884,522 | ) |
| Institutional Class | | | | | | | | |
| Proceeds from sale of shares | | | 259,029,418 | | | | 156,854,187 | |
| Cost of shares redeemed | | | (135,414,218 | ) | | | (126,583,340 | ) |
| Net increase from share transactions | | | 123,615,200 | | | | 30,270,847 | |
| Investor Class | | | | | | | | |
| Proceeds from sale of shares | | | 22,305,690 | | | | 33,837,835 | |
| Cost of shares redeemed | | | (47,223,965 | ) | | | (56,901,183 | ) |
| Net decrease from share transactions | | | (24,918,275 | ) | | | (23,063,348 | ) |
| Net increase in net assets | | $ | 203,603,292 | | | $ | 84,220,562 | |
| NET ASSETS: | | | | | | | | |
| Beginning of period | | | 1,015,614,223 | | | | 931,393,661 | |
| End of period (including accumulated net investment loss of $(1,459,831) and $(1,696,980)) | | $ | 1,219,217,515 | | | $ | 1,015,614,223 | |
| | | | | | | | | |
| Other Information: | | | | | | | | |
| SHARE TRANSACTIONS: | | | | | | | | |
| Class A | | | | | | | | |
| Sold | | | 1,523,709 | | | | 2,527,651 | |
| Redeemed | | | (4,700,055 | ) | | | (8,617,707 | ) |
| Net decrease in shares outstanding | | | (3,176,346 | ) | | | (6,090,056 | ) |
| Class C | | | | | | | | |
| Sold | | | 34,568 | | | | 47,529 | |
| Redeemed | | | (385,002 | ) | | | (978,592 | ) |
| Net decrease in shares outstanding | | | (350,434 | ) | | | (931,063 | ) |
| Institutional Class | | | | | | | | |
| Sold | | | 9,981,574 | | | | 7,655,150 | |
| Redeemed | | | (5,275,531 | ) | | | (6,327,481 | ) |
| Net increase in shares outstanding | | | 4,706,043 | | | | 1,327,669 | |
| Investor Class | | | | | | | | |
| Sold | | | 888,563 | | | | 1,717,976 | |
| Redeemed | | | (1,972,720 | ) | | | (2,920,705 | ) |
| Net decrease in shares outstanding | | | (1,084,157 | ) | | | (1,202,729 | ) |
See Notes to Financial Statements.
| 34 | www.emeraldmutualfunds.com |
| Emerald Small Cap Value Fund | Statements of Changes in Net Assets |
| | | Year Ended April 30, 2018 | | | Year Ended April 30, 2017 | |
| OPERATIONS: | | | | | | | | |
| Net investment income/(loss) | | $ | (13,355 | ) | | $ | 4,504 | |
| Net realized gain | | | 1,207,917 | | | | 4,115,975 | |
| Net change in unrealized depreciation | | | (267,114 | ) | | | (52,528 | ) |
| Net increase in net assets resulting from operations | | | 927,448 | | | | 4,067,951 | |
| | | | | | | | | |
| DISTRIBUTIONS TO SHAREHOLDERS (NOTE 3): | | | | | | | | |
| From net realized gains | | | | | | | | |
| Class A | | | (1,059,065 | ) | | | – | |
| Class C | | | (47,326 | ) | | | – | �� |
| Institutional Class | | | (2,006,350 | ) | | | – | |
| Investor Class | | | (306,751 | ) | | | – | |
| Net decrease in net assets from distributions | | | (3,419,492 | ) | | | – | |
| SHARE TRANSACTIONS (NOTE 5): | | | | | | | | |
| Class A | | | | | | | | |
| Proceeds from sale of shares | | | 2,516,038 | | | | 1,560,733 | |
| Issued to shareholders in reinvestment of distributions | | | 1,059,065 | | | | – | |
| Cost of shares redeemed | | | (740,130 | ) | | | (134,941 | ) |
| Net increase from share transactions | | | 2,834,973 | | | | 1,425,792 | |
| Class C | | | | | | | | |
| Proceeds from sale of shares | | | 9,102 | | | | 45,700 | |
| Issued to shareholders in reinvestment of distributions | | | 47,327 | | | | – | |
| Cost of shares redeemed | | | (123,065 | ) | | | (542,424 | ) |
| Net decrease from share transactions | | | (66,636 | ) | | | (496,724 | ) |
| Institutional Class | | | | | | | | |
| Proceeds from sale of shares | | | 2,040,666 | | | | 1,392,366 | |
| Issued to shareholders in reinvestment of distributions | | | 2,006,349 | | | | – | |
| Cost of shares redeemed | | | (4,415,382 | ) | | | (13,535,683 | ) |
| Net decrease from share transactions | | | (368,367 | ) | | | (12,143,317 | ) |
| Investor Class | | | | | | | | |
| Proceeds from sale of shares | | | 72,427 | | | | 208,364 | |
| Issued to shareholders in reinvestment of distributions | | | 306,751 | | | | – | |
| Cost of shares redeemed | | | (210,226 | ) | | | (1,881,505 | ) |
| Net increase/(decrease) from share transactions | | | 168,952 | | | | (1,673,141 | ) |
| Net increase/(decrease) in net assets | | $ | 76,878 | | | $ | (8,819,439 | ) |
| NET ASSETS: | | | | | | | | |
| Beginning of period | | | 7,723,570 | | | | 16,543,009 | |
| End of period (including accumulated net investment income/(loss) of $(6,508) and $–) | | $ | 7,800,448 | | | $ | 7,723,570 | |
| Annual Report | April 30, 2018 | 35 |
| Emerald Small Cap Value Fund | Statements of Changes in Net Assets |
| | | Year Ended April 30, 2018 | | | Year Ended April 30, 2017 | |
| Other Information: | | | | | | | | |
| SHARE TRANSACTIONS: | | | | | | | | |
| Class A | | | | | | | | |
| Sold | | | 204,655 | | | | 100,045 | |
| Distributions reinvested | | | 100,671 | | | | – | |
| Redeemed | | | (43,758 | ) | | | (8,816 | ) |
| Net increase in shares outstanding | | | 261,568 | | | | 91,229 | |
| Class C | | | | | | | | |
| Sold | | | 565 | | | | 3,424 | |
| Distributions reinvested | | | 4,622 | | | | – | |
| Redeemed | | | (7,663 | ) | | | (34,059 | ) |
| Net decrease in shares outstanding | | | (2,476 | ) | | | (30,635 | ) |
| Institutional Class | | | | | | | | |
| Sold | | | 131,987 | | | | 93,538 | |
| Distributions reinvested | | | 188,390 | | | | – | |
| Redeemed | | | (325,646 | ) | | | (839,700 | ) |
| Net decrease in shares outstanding | | | (5,269 | ) | | | (746,162 | ) |
| Investor Class | | | | | | | | |
| Sold | | | 5,844 | | | | 15,147 | |
| Distributions reinvested | | | 29,131 | | | | – | |
| Redeemed | | | (19,594 | ) | | | (127,290 | ) |
| Net increase/(decrease) in shares outstanding | | | 15,381 | | | | (112,143 | ) |
See Notes to Financial Statements.
| 36 | www.emeraldmutualfunds.com |
| Emerald Insights Fund | Statements of Changes in Net Assets |
| | | Year Ended April 30, 2018 | | | Year Ended April 30, 2017 | |
| OPERATIONS: | | | | | | |
| Net investment loss | | $ | (62,064 | ) | | $ | (67,028 | ) |
| Net realized gain | | | 2,535,047 | | | | 126,174 | |
| Net change in unrealized appreciation/(depreciation) | | | (848,799 | ) | | | 1,844,247 | |
| Net increase in net assets resulting from operations | | | 1,624,184 | | | | 1,903,393 | |
| | | | | | | | | |
| SHARE TRANSACTIONS (NOTE 5): | | | | | | | | |
| Class A | | | | | | | | |
| Proceeds from sale of shares | | | 842,288 | | | | 462,283 | |
| Cost of shares redeemed | | | (3,072,936 | ) | | | (3,391,810 | ) |
| Net decrease from share transactions | | | (2,230,648 | ) | | | (2,929,527 | ) |
| Class C | | | | | | | | |
| Proceeds from sale of shares | | | 614 | | | | 1,539 | |
| Cost of shares redeemed | | | – | | | | (6,433 | ) |
| Net increase/(decrease) from share transactions | | | 614 | | | | (4,894 | ) |
| Institutional Class | | | | | | | | |
| Proceeds from sale of shares | | | 103,001 | | | | 155,403 | |
| Cost of shares redeemed | | | (90,992 | ) | | | (1,042,010 | ) |
| Net increase/(decrease) from share transactions | | | 12,009 | | | | (886,607 | ) |
| Investor Class | | | | | | | | |
| Proceeds from sale of shares | | | 24,500 | | | | 20,000 | |
| Cost of shares redeemed | | | – | | | | (31,991 | ) |
| Net increase/(decrease) from share transactions | | | 24,500 | | | | (11,991 | ) |
| Net decrease in net assets | | $ | (569,341 | ) | | $ | (1,929,626 | ) |
| NET ASSETS: | | | | | | | | |
| Beginning of period | | | 11,373,582 | | | | 13,303,208 | |
| End of period (including accumulated net investment loss of $– and $(22,262)) | | $ | 10,804,241 | | | $ | 11,373,582 | |
| | | | | | | | | |
| Other Information: | | | | | | |
| SHARE TRANSACTIONS: | | | | | | |
| Class A | | | | | | | | |
| Sold | | | 67,803 | | | | 44,012 | |
| Redeemed | | | (249,908 | ) | | | (325,340 | ) |
| Net decrease in shares outstanding | | | (182,105 | ) | | | (281,328 | ) |
| Class C | | | | | | | | |
| Sold | | | 49 | | | | 156 | |
| Redeemed | | | – | | | | (621 | ) |
| Net increase/(decrease) in shares outstanding | | | 49 | | | | (465 | ) |
| Institutional Class | | | | | | | | |
| Sold | | | 8,256 | | | | 14,591 | |
| Redeemed | | | (7,228 | ) | | | (100,431 | ) |
| Net increase/(decrease) in shares outstanding | | | 1,028 | | | | (85,840 | ) |
| Investor Class | | | | | | | | |
| Sold | | | 1,890 | | | | 1,928 | |
| Redeemed | | | – | | | | (3,068 | ) |
| Net increase/(decrease) in shares outstanding | | | 1,890 | | | | (1,140 | ) |
See Notes to Financial Statements.
| Annual Report | April 30, 2018 | 37 |
| Emerald Banking and Finance Fund | Statements of Changes in Net Assets |
| | | Year Ended April 30, 2018 | | | Year Ended April 30, 2017 | |
| OPERATIONS: | | | | | | |
| Net investment loss | | $ | (3,180,919 | ) | | $ | (1,792,957 | ) |
| Net realized gain | | | 59,497,046 | | | | 4,322,806 | |
| Net change in unrealized appreciation | | | 6,208,469 | | | | 93,673,078 | |
| Net increase in net assets resulting from operations | | | 62,524,596 | | | | 96,202,927 | |
| | | | | | | | | |
| DISTRIBUTIONS TO SHAREHOLDERS (NOTE 3): | | | 0 | | | | 0 | |
| From net realized gains | | | | | | | | |
| Class A | | | (4,810,448 | ) | | | – | |
| Class C | | | (2,417,291 | ) | | | – | |
| Institutional Class | | | (5,388,614 | ) | | | – | |
| Investor Class | | | (1,956,089 | ) | | | – | |
| Net decrease in net assets from distributions | | | (14,572,442 | ) | | | – | |
| SHARE TRANSACTIONS (NOTE 5): | | | | | | | | |
| Class A | | | | | | | | |
| Proceeds from sale of shares | | | 61,794,273 | | | | 82,950,236 | |
| Issued to shareholders in reinvestment of distributions | | | 4,334,289 | | | | – | |
| Cost of shares redeemed | | | (82,932,615 | ) | | | (54,060,196 | ) |
| Net increase/(decrease) from share transactions | | | (16,804,053 | ) | | | 28,890,040 | |
| Class C | | | | | | | | |
| Proceeds from sale of shares | | | 11,650,753 | | | | 19,290,062 | |
| Issued to shareholders in reinvestment of distributions | | | 2,128,924 | | | | – | |
| Cost of shares redeemed | | | (17,500,493 | ) | | | (12,226,940 | ) |
| Net increase/(decrease) from share transactions | | | (3,720,816 | ) | | | 7,063,122 | |
| Institutional Class | | | | | | | | |
| Proceeds from sale of shares | | | 109,407,696 | | | | 67,765,563 | |
| Issued to shareholders in reinvestment of distributions | | | 3,157,033 | | | | – | |
| Cost of shares redeemed | | | (42,560,350 | ) | | | (15,914,560 | ) |
| Net increase from share transactions | | | 70,004,379 | | | | 51,851,003 | |
| Investor Class | | | | | | | | |
| Proceeds from sale of shares | | | 41,406,943 | | | | 70,741,101 | |
| Issued to shareholders in reinvestment of distributions | | | 1,838,759 | | | | – | |
| Cost of shares redeemed | | | (64,240,554 | ) | | | (92,011,035 | ) |
| Net decrease from share transactions | | | (20,994,852 | ) | | | (21,269,934 | ) |
| Net increase in net assets | | $ | 76,436,812 | | | $ | 162,737,158 | |
| NET ASSETS: | | | | | | | | |
| Beginning of period | | | 467,762,242 | | | | 305,025,084 | |
| End of period (including accumulated net investment loss of $(1,277,168) and $(877,904)) | | $ | 544,199,054 | | | $ | 467,762,242 | |
| 38 | www.emeraldmutualfunds.com |
| Emerald Banking and Finance Fund | Statements of Changes in Net Assets |
| | | Year Ended April 30, 2018 | | | Year Ended April 30, 2017 | |
| Other Information: | | | | | | | | |
| SHARE TRANSACTIONS: | | | | | | | | |
| Class A | | | | | | | | |
| Sold | | | 1,390,894 | | | | 2,115,853 | |
| Distributions reinvested | | | 92,023 | | | | – | |
| Redeemed | | | (1,873,252 | ) | | | (1,517,305 | ) |
| Net increase/(decrease) in shares outstanding | | | (390,335 | ) | | | 598,548 | |
| Class C | | | | | | | | |
| Sold | | | 291,776 | | | | 562,255 | |
| Distributions reinvested | | | 50,822 | | | | – | |
| Redeemed | | | (448,025 | ) | | | (378,982 | ) |
| Net increase/(decrease) in shares outstanding | | | (105,427 | ) | | | 183,273 | |
| Institutional Class | | | | | | | | |
| Sold | | | 2,429,922 | | | | 1,678,568 | |
| Distributions reinvested | | | 65,771 | | | | – | |
| Redeemed | | | (943,291 | ) | | | (456,066 | ) |
| Net increase in shares outstanding | | | 1,552,402 | | | | 1,222,502 | |
| Investor Class | | | | | | | | |
| Sold | | | 976,209 | | | | 1,995,462 | |
| Distributions reinvested | | | 40,807 | | | | – | |
| Redeemed | | | (1,546,423 | ) | | | (2,533,701 | ) |
| Net decrease in shares outstanding | | | (529,407 | ) | | | (538,239 | ) |
See Notes to Financial Statements.
| Annual Report | April 30, 2018 | 39 |
| Emerald Growth Fund | Financial Highlights |
For a share outstanding throughout the periods presented
| | | CLASS A | | |
| | | Year Ended April 30, 2018 | | Year Ended April 30, 2017 | | Year Ended April 30, 2016 | | Year Ended April 30, 2015 | | Year Ended April 30, 2014 | |
| NET ASSET VALUE, BEGINNING OF PERIOD | | $ | 21.83 | | $ | 17.52 | | $ | 20.02 | | $ | 18.11 | | $ | 15.60 | |
| INCOME/(LOSS) FROM OPERATIONS: | | | | | | | | | | | | | | | | |
| Net investment loss(a) | | | (0.16 | ) | | (0.11 | ) | | (0.15 | ) | | (0.18 | ) | | (0.21 | ) |
| Net realized and unrealized gain/(loss) on investments | | | 4.32 | | | 4.42 | | | (1.88 | ) | | 3.43 | | | 4.33 | |
| Total from Investment Operations | | | 4.16 | | | 4.31 | | | (2.03 | ) | | 3.25 | | | 4.12 | |
| | | | | | | | | | | | | | | | | |
| LESS DISTRIBUTIONS: | | | | | | | | | | | | | | | | |
| From capital gains | | | – | | | – | | | (0.47 | ) | | (1.34 | ) | | (1.61 | ) |
| Total Distributions | | | – | | | – | | | (0.47 | ) | | (1.34 | ) | | (1.61 | ) |
| NET INCREASE/(DECREASE) IN NET ASSET VALUE | | | 4.16 | | | 4.31 | | | (2.50 | ) | | 1.91 | | | 2.51 | |
| NET ASSET VALUE, END OF PERIOD | | $ | 25.99 | | $ | 21.83 | | $ | 17.52 | | $ | 20.02 | | $ | 18.11 | |
| | | | | | | | | | | | | | | | | |
| TOTAL RETURN(b) | | | 19.06 | % | | 24.60 | % | | (10.28 | )% | | 18.38 | % | | 26.01 | % |
| RATIOS/SUPPLEMENTAL DATA: | | | | | | | | | | | | | | | | |
| Net Assets, End of Period (000s) | | $ | 239,316 | | $ | 270,389 | | $ | 323,603 | | $ | 123,828 | | $ | 77,900 | |
| RATIOS TO AVERAGE NET ASSETS: | | | | | | | | | | | | | | | | |
| Net Investment loss | | | (0.64 | )% | | (0.57 | )% | | (0.81 | )% | | (0.93 | )% | | (1.12 | )% |
| Operating expenses excluding reimbursement/waiver | | | 1.03 | % | | 1.08 | % | | 1.17 | % | | 1.29 | % | | 1.31 | % |
| Operating expenses including reimbursement/waiver | | | 1.03 | % | | 1.08 | % | | 1.17 | % | | 1.29 | % | | 1.29 | % |
| PORTFOLIO TURNOVER RATE | | | 66 | % | | 54 | % | | 45 | % | | 68 | % | | 70 | % |
| (a) | Per share amounts are based upon average shares outstanding. |
| (b) | Total return does not reflect the effect of sales charges. |
See Notes to Financial Statements.
| 40 | www.emeraldmutualfunds.com |
| Emerald Growth Fund | Financial Highlights |
For a share outstanding throughout the periods presented
| | | CLASS C | |
| | | Year Ended April 30, 2018 | | Year Ended April 30, 2017 | | Year Ended April 30, 2016 | | Year Ended April 30, 2015 | | Year Ended April 30, 2014 | |
| NET ASSET VALUE, BEGINNING OF PERIOD | | $ | 18.75 | | $ | 15.14 | | $ | 17.48 | | $ | 16.07 | | $ | 14.07 | |
| INCOME/(LOSS) FROM OPERATIONS: | | | | | | | | | | | | | | | | |
| Net investment loss(a) | | | (0.27 | ) | | (0.21 | ) | | (0.24 | ) | | (0.27 | ) | | (0.30 | ) |
| Net realized and unrealized gain/(loss) on investments | | | 3.70 | | | 3.82 | | | (1.63 | ) | | 3.02 | | | 3.91 | |
| Total from Investment Operations | | | 3.43 | | | 3.61 | | | (1.87 | ) | | 2.75 | | | 3.61 | |
| | | | | | | | | | | | | | | | | |
| LESS DISTRIBUTIONS: | | | | | | | | | | | | | | | | |
| From capital gains | | | – | | | – | | | (0.47 | ) | | (1.34 | ) | | (1.61 | ) |
| Total Distributions | | | – | | | – | | | (0.47 | ) | | (1.34 | ) | | (1.61 | ) |
| NET INCREASE/(DECREASE) IN NET ASSET VALUE | | | 3.43 | | | 3.61 | | | (2.34 | ) | | 1.41 | | | 2.00 | |
| NET ASSET VALUE, END OF PERIOD | | $ | 22.18 | | $ | 18.75 | | $ | 15.14 | | $ | 17.48 | | $ | 16.07 | |
| | | | | | | | | | | | | | | | | |
| TOTAL RETURN(b) | | | 18.29 | % | | 23.84 | % | | (10.87 | )% | | 17.58 | % | | 25.19 | % |
| RATIOS/SUPPLEMENTAL DATA: | | | | | | | | | | | | | | | | |
| Net Assets, End of Period (000s) | | $ | 33,197 | | $ | 34,642 | | $ | 42,075 | | $ | 15,427 | | $ | 11,645 | |
| RATIOS TO AVERAGE NET ASSETS: | | | | | | | | | | | | | | | | |
| Net Investment loss | | | (1.30 | )% | | (1.22 | )% | | (1.46 | )% | | (1.58 | )% | | (1.77 | )% |
| Operating expenses excluding reimbursement/waiver | | | 1.68 | % | | 1.73 | % | | 1.81 | % | | 1.94 | % | | 1.96 | % |
| Operating expenses including reimbursement/waiver | | | 1.68 | % | | 1.73 | % | | 1.81 | % | | 1.94 | % | | 1.94 | % |
| PORTFOLIO TURNOVER RATE | | | 66 | % | | 54 | % | | 45 | % | | 68 | % | | 70 | % |
| (a) | Per share amounts are based upon average shares outstanding. |
| (b) | Total return does not reflect the effect of sales charges. |
See Notes to Financial Statements.
| Annual Report | April 30, 2018 | 41 |
| Emerald Growth Fund | Financial Highlights |
For a share outstanding throughout the periods presented
| | | INSTITUTIONAL CLASS | |
| | | Year Ended April 30, 2018 | | Year Ended April 30, 2017 | | Year Ended April 30, 2016 | | Year Ended April 30, 2015 | | Year Ended April 30, 2014 | |
| NET ASSET VALUE, BEGINNING OF PERIOD | | $ | 22.56 | | $ | 18.04 | | $ | 20.54 | | $ | 18.49 | | $ | 15.86 | |
| INCOME/(LOSS) FROM OPERATIONS: | | | | | | | | | | | | | | | | |
| Net investment loss(a) | | | (0.09 | ) | | (0.05 | ) | | (0.10 | ) | | (0.12 | ) | | (0.16 | ) |
| Net realized and unrealized gain/(loss) on investments | | | 4.47 | | | 4.57 | | | (1.93 | ) | | 3.51 | | | 4.40 | |
| Total from Investment Operations | | | 4.38 | | | 4.52 | | | (2.03 | ) | | 3.39 | | | 4.24 | |
| | | | | | | | | | | | | | | | | |
| LESS DISTRIBUTIONS: | | | | | | | | | | | | | | | | |
| From capital gains | | | – | | | – | | | (0.47 | ) | | (1.34 | ) | | (1.61 | ) |
| Total Distributions | | | – | | | – | | | (0.47 | ) | | (1.34 | ) | | (1.61 | ) |
| NET INCREASE/(DECREASE) IN NET ASSET VALUE | | | 4.38 | | | 4.52 | | | (2.50 | ) | | 2.05 | | | 2.63 | |
| NET ASSET VALUE, END OF PERIOD | | $ | 26.94 | | $ | 22.56 | | $ | 18.04 | | $ | 20.54 | | $ | 18.49 | |
| | | | | | | | | | | | | | | | | |
| TOTAL RETURN | | | 19.41 | % | | 25.06 | % | | (9.97 | )% | | 18.77 | % | | 26.35 | % |
| RATIOS/SUPPLEMENTAL DATA: | | | | | | | | | | | | | | | | |
| Net Assets, End of Period (000s) | | $ | 839,076 | | $ | 596,550 | | $ | 453,190 | | $ | 174,107 | | $ | 134,440 | |
| RATIOS TO AVERAGE NET ASSETS: | | | | | | | | | | | | | | | | |
| Net Investment loss | | | (0.33 | )% | | (0.26 | )% | | (0.51 | )% | | (0.63 | )% | | (0.82 | )% |
| Operating expenses excluding reimbursement/waiver | | | 0.72 | % | | 0.77 | % | | 0.87 | % | | 0.99 | % | | 1.00 | % |
| Operating expenses including reimbursement/waiver | | | 0.72 | % | | 0.77 | % | | 0.87 | % | | 0.99 | % | | 0.99 | % |
| PORTFOLIO TURNOVER RATE | | | 66 | % | | 54 | % | | 45 | % | | 68 | % | | 70 | % |
| (a) | Per share amounts are based upon average shares outstanding. |
See Notes to Financial Statements.
| 42 | www.emeraldmutualfunds.com |
| Emerald Growth Fund | Financial Highlights |
For a share outstanding throughout the periods presented
| | | INVESTOR CLASS | |
| | | Year Ended April 30, 2018 | | Year Ended April 30, 2017 | | Year Ended April 30, 2016 | | Year Ended April 30, 2015 | | Year Ended April 30, 2014 | |
| NET ASSET VALUE, BEGINNING OF PERIOD | | $ | 21.75 | | $ | 17.46 | | $ | 19.97 | | $ | 18.06 | | $ | 15.57 | |
| INCOME/(LOSS) FROM OPERATIONS: | | | | | | | | | | | | | | | | |
| Net investment loss(a) | | | (0.17 | ) | | (0.12 | ) | | (0.16 | ) | | (0.17 | ) | | (0.23 | ) |
| Net realized and unrealized gain/(loss) on investments | | | 4.30 | | | 4.41 | | | (1.88 | ) | | 3.42 | | | 4.33 | |
| Total from Investment Operations | | | 4.13 | | | 4.29 | | | (2.04 | ) | | 3.25 | | | 4.10 | |
| | | | | | | | | | | | | | | | | |
| LESS DISTRIBUTIONS: | | | | | | | | | | | | | | | | |
| From capital gains | | | – | | | – | | | (0.47 | ) | | (1.34 | ) | | (1.61 | ) |
| Total Distributions | | | – | | | – | | | (0.47 | ) | | (1.34 | ) | | (1.61 | ) |
| NET INCREASE/(DECREASE) IN NET ASSET VALUE | | | 4.13 | | | 4.29 | | | (2.51 | ) | | 1.91 | | | 2.49 | |
| NET ASSET VALUE, END OF PERIOD | | $ | 25.88 | | $ | 21.75 | | $ | 17.46 | | $ | 19.97 | | $ | 18.06 | |
| | | | | | | | | | | | | | | | | |
| TOTAL RETURN | | | 18.99 | % | | 24.57 | % | | (10.36 | )% | | 18.44 | % | | 25.93 | % |
| RATIOS/SUPPLEMENTAL DATA: | | | | | | | | | | | | | | | | |
| Net Assets, End of Period (000s) | | $ | 107,629 | | $ | 114,033 | | $ | 112,526 | | $ | 23,517 | | $ | 15,870 | |
| RATIOS TO AVERAGE NET ASSETS: | | | | | | | | | | | | | | | | |
| Net Investment loss | | | (0.68 | )% | | (0.61 | )% | | (0.84 | )% | | (0.91 | )% | | (1.18 | )% |
| Operating expenses excluding reimbursement/waiver | | | 1.07 | % | | 1.12 | % | | 1.19 | % | | 1.27 | % | | 1.34 | % |
| Operating expenses including reimbursement/waiver | | | 1.07 | % | | 1.12 | % | | 1.19 | % | | 1.27 | % | | 1.34 | % |
| PORTFOLIO TURNOVER RATE | | | 66 | % | | 54 | % | | 45 | % | | 68 | % | | 70 | % |
| (a) | Per share amounts are based upon average shares outstanding. |
See Notes to Financial Statements.
| Annual Report | April 30, 2018 | 43 |
| Emerald Small Cap Value Fund | Financial Highlights |
For a share outstanding throughout the periods presented
| | | CLASS A | |
| | | Year Ended April 30, 2018 | | Year Ended April 30, 2017 | | For the Period October 1, 2015 to April 30, 2016(a) | | Period Ended September 30, 2015(b) | |
| NET ASSET VALUE, BEGINNING OF PERIOD | | $ | 16.27 | | $ | 13.00 | | $ | 12.70 | | $ | 14.12 | |
| INCOME/(LOSS) FROM OPERATIONS: | | | | | | | | | | | | | |
| Net investment loss(c) | | | (0.06 | )(d) | | (0.07 | )(d) | | (0.09 | ) | | (0.01 | ) |
| Net realized and unrealized gain/(loss) on investments | | | 2.13 | | | 3.34 | | | 0.44 | | | (1.03 | ) |
| Total from Investment Operations | | | 2.07 | | | 3.27 | | | 0.35 | | | (1.04 | ) |
| | | | | | | | | | | | | | |
| LESS DISTRIBUTIONS: | | | | | | | | | | | | | |
| From investment income | | | – | | | – | | | (0.05 | ) | | – | |
| From capital gains | | | (7.89 | ) | | – | | | – | | | (0.38 | ) |
| Total Distributions | | | (7.89 | ) | | – | | | (0.05 | ) | | (0.38 | ) |
| NET INCREASE/(DECREASE) IN NET ASSET VALUE | | | (5.82 | ) | | 3.27 | | | 0.30 | | | (1.42 | ) |
| NET ASSET VALUE, END OF PERIOD | | $ | 10.45 | | $ | 16.27 | | $ | 13.00 | | $ | 12.70 | |
| | | | | | | | | | | | | | |
| TOTAL RETURN(e) | | | 12.41 | % | | 25.15 | % | | 2.77 | %(f) | | (7.49 | )%(f) |
| RATIOS/SUPPLEMENTAL DATA: | | | | | | | | | | | | | |
| Net Assets, End of Period (000s) | | $ | 3,959 | | $ | 1,909 | | $ | 340 | | $ | 14 | |
| RATIOS TO AVERAGE NET ASSETS: | | | | | | | | | | | | | |
| Net Investment loss | | | (0.42 | )% | | (0.46 | )% | | (1.13 | )%(g) | | (0.24 | )%(g) |
| Operating expenses excluding reimbursement/waiver | | | 2.56 | % | | 2.26 | % | | 2.69 | %(g) | | 2.16 | %(g) |
| Operating expenses including reimbursement/waiver | | | 1.35 | % | | 1.35 | % | | 1.35 | %(g) | | 1.35 | %(g) |
| PORTFOLIO TURNOVER RATE | | | 71 | % | | 66 | % | | 31 | %(f) | | 69 | %(f)(h) |
| (a) | Effective March 3, 2015 the Board approved changing the fiscal year-end of the Fund from September 30 to April 30. |
| (b) | Class A commenced operations on June 30, 2015. |
| (c) | Per share amounts are based upon average shares outstanding. |
| (d) | The amount shown for a share outstanding throughout the period may not correlate with the Statement of Operations for the period due to the timing of sales and redemptions of Fund shares in relation to income earned and/or fluctuating market value of the investments of the Fund. |
| (e) | Total return does not reflect the effect of sales charges. |
| (h) | Portfolio turnover rate is calculated at the Fund level and represents the year ended September 30, 2015. |
See Notes to Financial Statements.
| 44 | www.emeraldmutualfunds.com |
| Emerald Small Cap Value Fund | Financial Highlights |
For a share outstanding throughout the periods presented
| | | | CLASS C | |
| | | | Year Ended April 30, 2018 | | | | Year Ended April 30, 2017 | | | | For the Period October 1, 2015 to April 30, 2016(a) | | | | Period Ended September 30, 2015(b) | |
| NET ASSET VALUE, BEGINNING OF PERIOD | | $ | 16.10 | | | $ | 12.94 | | | $ | 12.68 | | | $ | 14.12 | |
| INCOME/(LOSS) FROM OPERATIONS: | | | | | | | | | | | | | | | | |
| Net investment loss(c) | | | (0.13 | )(d) | | | (0.13 | )(d) | | | (0.14 | ) | | | (0.03 | ) |
| Net realized and unrealized gain/(loss) on investments | | | 2.07 | | | | 3.29 | | | | 0.43 | | | | (1.03 | ) |
| Total from Investment Operations | | | 1.94 | | | | 3.16 | | | | 0.29 | | | | (1.06 | ) |
| | | | | | | | | | | | | | | | | |
| LESS DISTRIBUTIONS: | | | | | | | | | | | | | | | | |
| From investment income | | | – | | | | – | | | | (0.03 | ) | | | – | |
| From capital gains | | | (7.89 | ) | | | – | | | | – | | | | (0.38 | ) |
| Total Distributions | | | (7.89 | ) | | | – | | | | (0.03 | ) | | | (0.38 | ) |
| NET INCREASE/(DECREASE) IN NET ASSET VALUE | | | (5.95 | ) | | | 3.16 | | | | 0.26 | | | | (1.44 | ) |
| NET ASSET VALUE, END OF PERIOD | | $ | 10.15 | | | $ | 16.10 | | | $ | 12.94 | | | $ | 12.68 | |
| | | | | | | | | | | | | | | | | |
| TOTAL RETURN(e) | | | 11.63 | % | | | 24.42 | % | | | 2.28 | %(f) | | | (7.63 | )%(f) |
| RATIOS/SUPPLEMENTAL DATA: | | | | | | | | | | | | | | | | |
| Net Assets, End of Period (000s) | | $ | 108 | | | $ | 211 | | | $ | 566 | | | $ | 14 | |
| RATIOS TO AVERAGE NET ASSETS: | | | | | | | | | | | | | | | | |
| Net Investment loss | | | (0.98 | )% | | | (0.93 | )% | | | (2.06 | )%(g) | | | (0.89 | )%(g) |
| Operating expenses excluding reimbursement/waiver | | | 3.20 | % | | | 2.70 | % | | | 3.37 | %(g) | | | 2.81 | %(g) |
| Operating expenses including reimbursement/waiver | | | 2.00 | % | | | 2.00 | % | | | 2.00 | %(g) | | | 2.00 | %(g) |
| PORTFOLIO TURNOVER RATE | | | 71 | % | | | 66 | % | | | 31 | %(f) | | | 69 | %(f)(h) |
| (a) | Effective March 3, 2015 the Board approved changing the fiscal year-end of the Fund from September 30 to April 30. |
| (b) | Class C commenced operations on June 30, 2015. |
| (c) | Per share amounts are based upon average shares outstanding. |
| (d) | The amount shown for a share outstanding throughout the period may not correlate with the Statement of Operations for the period due to the timing of sales and redemptions of Fund shares in relation to income earned and/or fluctuating market value of the investments of the Fund. |
| (e) | Total return does not reflect the effect of sales charges. |
| (h) | Portfolio turnover rate is calculated at the Fund level and represents the year ended September 30, 2015. |
See Notes to Financial Statements.
| Annual Report | April 30, 2018 | 45 |
| Emerald Small Cap Value Fund | Financial Highlights |
For a share outstanding throughout the periods presented
| | | | INSTITUTIONAL CLASS | |
| | | | Year Ended April 30, 2018 | | | | Year Ended April 30, 2017 | | | | For the Period October 1, 2015 to April 30, 2016(a) | | | | Year Ended September 30, 2015(b) | | | | Year Ended September 30, 2014 | | | | Period Ended September 30, 2013(c) | |
| NET ASSET VALUE, BEGINNING OF PERIOD | | $ | 16.35 | | | $ | 13.02 | | | $ | 12.71 | | | $ | 12.76 | | | $ | 12.56 | | | $ | 10.00 | |
| INCOME FROM OPERATIONS: | | | | | | | | | | | | | | | | | | | | | | | | |
| Net investment income/(loss)(d) | | | 0.00 | (e) | | | 0.02 | | | | (0.01 | ) | | | 0.06 | | | | 0.09 | | | | 0.05 | |
| Net realized and unrealized gain on investments | | | 2.13 | | | | 3.31 | | | | 0.38 | | | | 0.33 | | | | 0.76 | | | | 2.54 | |
| Total from Investment Operations | | | 2.13 | | | | 3.33 | | | | 0.37 | | | | 0.39 | | | | 0.85 | | | | 2.59 | |
| | | | | | | | | | | | | | | | | | | | | | | | | |
| LESS DISTRIBUTIONS: | | | | | | | | | | | | | | | | | | | | | | | | |
| From investment income | | | – | | | | – | | | | (0.06 | ) | | | (0.06 | ) | | | (0.01 | ) | | | (0.03 | ) |
| From capital gains | | | (7.89 | ) | | | – | | | | – | | | | (0.38 | ) | | | (0.64 | ) | | | – | |
| Total Distributions | | | (7.89 | ) | | | – | | | | (0.06 | ) | | | (0.44 | ) | | | (0.65 | ) | | | (0.03 | ) |
| NET INCREASE/(DECREASE) IN NET ASSET VALUE | | | (5.76 | ) | | | 3.33 | | | | 0.31 | | | | (0.05 | ) | | | 0.20 | | | | 2.56 | |
| NET ASSET VALUE, END OF PERIOD | | $ | 10.59 | | | $ | 16.35 | | | $ | 13.02 | | | $ | 12.71 | | | $ | 12.76 | | | $ | 12.56 | |
| | | | | | | | | | | | | | | | | | | | | | | | | |
| TOTAL RETURN | | | 12.76 | % | | | 25.58 | % | | | 2.94 | %(f) | | | 2.93 | % | | | 6.64 | % | | | 25.99 | %(f) |
| SUPPLEMENTAL DATA: | | | | | | | | | | | | | | | | | | | | | | | | |
| Net Assets, End of Period (000s) | | $ | 3,177 | | | $ | 4,989 | | | $ | 13,691 | | | $ | 16,507 | | | $ | 24,343 | | | $ | 8,442 | |
| RATIOS TO AVERAGE NET ASSETS: | | | | | | | | | | | | | | | | | | | | | | | | |
| Net Investment income/(loss) | | | 0.02 | % | | | 0.13 | % | | | (0.07 | )%(g) | | | 0.45 | % | | | 0.65 | % | | | 0.48 | %(g) |
| Operating expenses excluding reimbursement/waiver | | | 2.20 | % | | | 1.56 | % | | | 1.75 | %(g) | | | 1.43 | % | | | 1.29 | % | | | 1.95 | %(g) |
| Operating expenses including reimbursement/waiver | | | 1.00 | % | | | 1.00 | % | | | 1.00 | %(g) | | | 1.00 | % | | | 1.00 | % | | | 1.00 | %(g) |
| PORTFOLIO TURNOVER RATE | | | 71 | % | | | 66 | % | | | 31 | %(f) | | | 69 | % | | | 49 | % | | | 67 | %(f) |
| (a) | Effective March 3, 2015 the Board approved changing the fiscal year-end of the Fund from September 30 to April 30. |
| (b) | Prior to its June 26, 2015 reorganization with and into the Emerald Small Cap Value Fund, the Fund was known as the Elessar Small Cap Value Fund. |
| (c) | For the period October 15, 2012 (commencement of investment operations) through September 30, 2013. |
| (d) | Per share amounts are based upon average shares outstanding. |
| (e) | Less than $0.005 per share. |
See Notes to Financial Statements.
| 46 | www.emeraldmutualfunds.com |
| Emerald Small Cap Value Fund | Financial Highlights |
For a share outstanding throughout the periods presented
| | | | INVESTOR CLASS | |
| | | | Year Ended April 30, 2018 | | | | Year Ended April 30, 2017 | | | | For the Period October 1, 2015 to April 30, 2016(a) | | | | Year Ended September 30, 2015(b) | | | | Year Ended September 30, 2014 | | | | Period Ended September 30, 2013(c) | |
| NET ASSET VALUE, BEGINNING OF PERIOD | | $ | 16.26 | | | $ | 12.98 | | | $ | 12.68 | | | $ | 12.73 | | | $ | 12.54 | | | $ | 10.00 | |
| INCOME FROM OPERATIONS: | | | | | | | | | | | | | | | | | | | | | | | | |
| Net investment income/(loss)(d) | | | (0.04 | )(e) | | | (0.02 | )(e) | | | (0.02 | ) | | | 0.03 | | | | 0.07 | | | | 0.02 | |
| Net realized and unrealized gain on investments | | | 2.13 | | | | 3.30 | | | | 0.37 | | | | 0.35 | | | | 0.76 | | | | 2.54 | |
| Total from Investment Operations | | | 2.09 | | | | 3.28 | | | | 0.35 | | | | 0.38 | | | | 0.83 | | | | 2.56 | |
| | | | | | | | | | | | | | | | | | | | | | | | | |
| LESS DISTRIBUTIONS: | | | | | | | | | | | | | | | | | | | | | | | | |
| From investment income | | | – | | | | – | | | | (0.05 | ) | | | (0.05 | ) | | | – | | | | (0.02 | ) |
| From capital gains | | | (7.89 | ) | | | – | | | | – | | | | (0.38 | ) | | | (0.64 | ) | | | – | |
| Total Distributions | | | (7.89 | ) | | | – | | | | (0.05 | ) | | | (0.43 | ) | | | (0.64 | ) | | | (0.02 | ) |
| NET INCREASE/(DECREASE) IN NET ASSET VALUE | | | (5.80 | ) | | | 3.28 | | | | 0.30 | | | | (0.05 | ) | | | 0.19 | | | | 2.54 | |
| NET ASSET VALUE, END OF PERIOD | | $ | 10.46 | | | $ | 16.26 | | | $ | 12.98 | | | $ | 12.68 | | | $ | 12.73 | | | $ | 12.54 | |
| | | | | | | | | | | | | | | | | | | | | | | | | |
| TOTAL RETURN | | | 12.54 | % | | | 25.27 | % | | | 2.80 | %(f) | | | 2.82 | % | | | 6.46 | % | | | 25.69 | %(f) |
| SUPPLEMENTAL DATA: | | | | | | | | | | | | | | | | | | | | | | | | |
| Net Assets, End of Period (000s) | | $ | 556 | | | $ | 614 | | | $ | 1,946 | | | $ | 399 | | | $ | 474 | | | $ | 271 | |
| RATIOS TO AVERAGE NET ASSETS: | | | | | | | | | | | | | | | | | | | | | | | | |
| Net Investment income/(loss) | | | (0.25 | )% | | | (0.11 | )% | | | (0.25 | )%(g) | | | 0.22 | % | | | 0.52 | % | | | 0.16 | %(g) |
| Operating expenses excluding reimbursement/waiver | | | 2.44 | % | | | 1.83 | % | | | 2.14 | %(g) | | | 1.67 | % | | | 1.56 | % | | | 2.49 | %(g) |
| Operating expenses including reimbursement/waiver | | | 1.25 | % | | | 1.25 | % | | | 1.25 | %(g) | | | 1.25 | % | | | 1.25 | % | | | 1.25 | %(g) |
| PORTFOLIO TURNOVER RATE | | | 71 | % | | | 66 | % | | | 31 | %(f) | | | 69 | % | | | 49 | % | | | 67 | %(f) |
| (a) | Effective March 3, 2015 the Board approved changing the fiscal year-end of the Fund from September 30 to April 30. |
| (b) | Prior to its June 26, 2015 reorganization with and into the Emerald Small Cap Value Fund, the Fund was known as the Elessar Small Cap Value Fund. |
| (c) | For the period October 15, 2012 (commencement of investment operations) through September 30, 2013. |
| (d) | Per share amounts are based upon average shares outstanding. |
| (e) | The amount shown for a share outstanding throughout the period may not correlate with the Statement of Operations for the period due to the timing of sales and redemptions of Fund shares in relation to income earned and/or fluctuating market value of the investments of the Fund. |
See Notes to Financial Statements.
| Annual Report | April 30, 2018 | 47 |
| Emerald Insights Fund | Financial Highlights |
For a share outstanding throughout the periods presented
| | | | CLASS A | |
| | | | Year Ended April 30, 2018 | | | | Year Ended April 30, 2017 | | | | Year Ended April 30, 2016 | | | | For the Period August 1, 2014 (Inception) to April 30, 2015 | |
| NET ASSET VALUE, BEGINNING OF PERIOD | | $ | 11.33 | | | $ | 9.69 | | | $ | 10.98 | | | $ | 10.00 | |
| INCOME/(LOSS) FROM OPERATIONS: | | | | | | | | | | | | | | | | |
| Net investment loss(a) | | | (0.07 | ) | | | (0.06 | ) | | | (0.05 | ) | | | (0.05 | ) |
| Net realized and unrealized gain/(loss) on investments | | | 1.83 | | | | 1.70 | | | | (1.24 | ) | | | 1.03 | |
| Total from Investment Operations | | | 1.76 | | | | 1.64 | | | | (1.29 | ) | | | 0.98 | |
| | | | | | | | | | | | | | | | | |
| NET INCREASE/(DECREASE) IN NET ASSET VALUE | | | 1.76 | | | | 1.64 | | | | (1.29 | ) | | | 0.98 | |
| NET ASSET VALUE, END OF PERIOD | | $ | 13.09 | | | $ | 11.33 | | | $ | 9.69 | | | $ | 10.98 | |
| | | | | | | | | | | | | | | | | |
| TOTAL RETURN(b) | | | 15.53 | % | | | 16.92 | % | | | (11.75 | %) | | | 9.80 | %(c) |
| RATIOS/SUPPLEMENTAL DATA: | | | | | | | | | | | | | | | | |
| Net Assets, End of Period (000s) | | $ | 9,321 | | | $ | 10,127 | | | $ | 11,388 | | | $ | 6,493 | |
| RATIOS TO AVERAGE NET ASSETS: | | | | | | | | | | | | | | | | |
| Net Investment loss | | | (0.58 | %) | | | (0.57 | %) | | | (0.54 | %) | | | (0.66 | %)(d) |
| Operating expenses excluding reimbursement/waiver | | | 2.10 | % | | | 2.10 | % | | | 2.01 | % | | | 2.57 | %(d)(e) |
| Operating expenses including reimbursement/waiver | | | 1.35 | % | | | 1.35 | % | | | 1.35 | % | | | 1.35 | %(d)(e) |
| PORTFOLIO TURNOVER RATE | | | 138 | % | | | 75 | % | | | 99 | % | | | 88 | %(c) |
| (a) | Per share amounts are based upon average shares outstanding. |
| (b) | Total return does not reflect the effect of sales charges. |
| (e) | Expense ratios before reductions for startup costs may not be representative of longer term operating periods. |
See Notes to Financial Statements.
| 48 | www.emeraldmutualfunds.com |
| Emerald Insights Fund | Financial Highlights |
For a share outstanding throughout the periods presented
| | | | CLASS C | |
| | | | Year Ended April 30, 2018 | | | | Year Ended April 30, 2017 | | | | Year Ended April 30, 2016 | | | | For the Period August 1, 2014 (Inception) to April 30, 2015 | |
| NET ASSET VALUE, BEGINNING OF PERIOD | | $ | 11.11 | | | $ | 9.56 | | | $ | 10.92 | | | $ | 10.00 | |
| INCOME/(LOSS) FROM OPERATIONS: | | | | | | | | | | | | | | | | |
| Net investment loss(a) | | | (0.15 | ) | | | (0.13 | ) | | | (0.11 | ) | | | (0.10 | ) |
| Net realized and unrealized gain/(loss) on investments | | | 1.79 | | | | 1.68 | | | | (1.25 | ) | | | 1.02 | |
| Total from Investment Operations | | | 1.64 | | | | 1.55 | | | | (1.36 | ) | | | 0.92 | |
| | | | | | | | | | | | | | | | | |
| NET INCREASE/(DECREASE) IN NET ASSET VALUE | | | 1.64 | | | | 1.55 | | | | (1.36 | ) | | | 0.92 | |
| NET ASSET VALUE, END OF PERIOD | | $ | 12.75 | | | $ | 11.11 | | | $ | 9.56 | | | $ | 10.92 | |
| | | | | | | | | | | | | | | | | |
| TOTAL RETURN(b) | | | 14.76 | % | | | 16.21 | % | | | (12.45 | %) | | | 9.20 | %(c) |
| RATIOS/SUPPLEMENTAL DATA: | | | | | | | | | | | | | | | | |
| Net Assets, End of Period (000s) | | $ | 129 | | | $ | 112 | | | $ | 101 | | | $ | 27 | |
| RATIOS TO AVERAGE NET ASSETS: | | | | | | | | | | | | | | | | |
| Net Investment loss | | | (1.24 | %) | | | (1.22 | %) | | | (1.17 | %) | | | (1.34 | %)(d) |
| Operating expenses excluding reimbursement/waiver | | | 2.75 | % | | | 2.76 | % | | | 2.70 | % | | | 7.25 | %(d)(e) |
| Operating expenses including reimbursement/waiver | | | 2.00 | % | | | 2.00 | % | | | 2.00 | % | | | 2.00 | %(d)(e) |
| PORTFOLIO TURNOVER RATE | | | 138 | % | | | 75 | % | | | 99 | % | | | 88 | %(c) |
| (a) | Per share amounts are based upon average shares outstanding. |
| (b) | Total return does not reflect the effect of sales charges. |
| (e) | Expense ratios before reductions for startup costs may not be representative of longer term operating periods. |
See Notes to Financial Statements.
| Annual Report | April 30, 2018 | 49 |
| Emerald Insights Fund | Financial Highlights |
For a share outstanding throughout the periods presented
| | | | INSTITUTIONAL CLASS | |
| | | | Year Ended April 30, 2018 | | | | Year Ended April 30, 2017 | | | | Year Ended April 30, 2016 | | | | For the Period August 1, 2014 (Inception) to April 30, 2015 | |
| NET ASSET VALUE, BEGINNING OF PERIOD | | $ | 11.41 | | | $ | 9.73 | | | $ | 10.99 | | | $ | 10.00 | |
| INCOME/(LOSS) FROM OPERATIONS: | | | | | | | | | | | | | | | | |
| Net investment loss(a) | | | (0.04 | ) | | | (0.03 | ) | | | (0.00 | )(b) | | | (0.03 | ) |
| Net realized and unrealized gain/(loss) on investments | | | 1.85 | | | | 1.71 | | | | (1.26 | ) | | | 1.02 | |
| Total from Investment Operations | | | 1.81 | | | | 1.68 | | | | (1.26 | ) | | | 0.99 | |
| | | | | | | | | | | | | | | | | |
| NET INCREASE/(DECREASE) IN NET ASSET VALUE | | | 1.81 | | | | 1.68 | | | | (1.26 | ) | | | 0.99 | |
| NET ASSET VALUE, END OF PERIOD | | $ | 13.22 | | | $ | 11.41 | | | $ | 9.73 | | | $ | 10.99 | |
| | | | | | | | | | | | | | | | | |
| TOTAL RETURN | | | 15.86 | % | | | 17.27 | % | | | (11.46 | %) | | | 9.90 | %(c) |
| RATIOS/SUPPLEMENTAL DATA: | | | | | | | | | | | | | | | | |
| Net Assets, End of Period (000s) | | $ | 1,228 | | | $ | 1,048 | | | $ | 1,729 | | | $ | 279 | |
| RATIOS TO AVERAGE NET ASSETS: | | | | | | | | | | | | | | | | |
| Net Investment loss | | | (0.29 | %) | | | (0.28 | %) | | | (0.05 | %) | | | (0.34 | %)(d) |
| Operating expenses excluding reimbursement/waiver | | | 1.77 | % | | | 1.78 | % | | | 1.90 | % | | | 4.66 | %(d)(e) |
| Operating expenses including reimbursement/waiver | | | 1.05 | % | | | 1.05 | % | | | 1.05 | % | | | 1.05 | %(d)(e) |
| PORTFOLIO TURNOVER RATE | | | 138 | % | | | 75 | % | | | 99 | % | | | 88 | %(c) |
| (a) | Per share amounts are based upon average shares outstanding. |
| (b) | Less than $0.005 per share. |
| (e) | Expense ratios before reductions for startup costs may not be representative of longer term operating periods. |
See Notes to Financial Statements.
| 50 | www.emeraldmutualfunds.com |
| Emerald Insights Fund | Financial Highlights |
For a share outstanding throughout the periods presented
| | | | INVESTOR CLASS | |
| | | | Year Ended April 30, 2018 | | | | Year Ended April 30, 2017 | | | | Year Ended April 30, 2016 | | | | For the Period August 1, 2014 (Inception) to April 30, 2015 | |
| NET ASSET VALUE, BEGINNING OF PERIOD | | $ | 11.29 | | | $ | 9.67 | | | $ | 10.96 | | | $ | 10.00 | |
| INCOME/(LOSS) FROM OPERATIONS: | | | | | | | | | | | | | | | | |
| Net investment loss(a) | | | (0.08 | ) | | | (0.07 | ) | | | (0.08 | ) | | | (0.05 | ) |
| Net realized and unrealized gain/(loss) on investments | | | 1.84 | | | | 1.69 | | | | (1.21 | ) | | | 1.01 | |
| Total from Investment Operations | | | 1.76 | | | | 1.62 | | | | (1.29 | ) | | | 0.96 | |
| | | | | | | | | | | | | | | | | |
| NET INCREASE/(DECREASE) IN NET ASSET VALUE | | | 1.76 | | | | 1.62 | | | | (1.29 | ) | | | 0.96 | |
| NET ASSET VALUE, END OF PERIOD | | $ | 13.05 | | | $ | 11.29 | | | $ | 9.67 | | | $ | 10.96 | |
| | | | | | | | | | | | | | | | | |
| TOTAL RETURN | | | 15.59 | % | | | 16.75 | % | | | (11.77 | %) | | | 9.60 | %(b) |
| RATIOS/SUPPLEMENTAL DATA: | | | | | | | | | | | | | | | | |
| Net Assets, End of Period (000s) | | $ | 126 | | | $ | 88 | | | $ | 86 | | | $ | 448 | |
| RATIOS TO AVERAGE NET ASSETS: | | | | | | | | | | | | | | | | |
| Net Investment loss | | | (0.65 | %) | | | (0.63 | %) | | | (0.72 | %) | | | (0.67 | %)(c) |
| Operating expenses excluding reimbursement/waiver | | | 2.07 | % | | | 2.09 | % | | | 1.91 | % | | | 2.96 | %(c)(d) |
| Operating expenses including reimbursement/waiver | | | 1.40 | % | | | 1.40 | % | | | 1.40 | % | | | 1.40 | %(c)(d) |
| PORTFOLIO TURNOVER RATE | | | 138 | % | | | 75 | % | | | 99 | % | | | 88 | %(b) |
| (a) | Per share amounts are based upon average shares outstanding. |
| (d) | Expense ratios before reductions for startup costs may not be representative of longer term operating periods. |
See Notes to Financial Statements.
| Annual Report | April 30, 2018 | 51 |
| Emerald Banking and Finance Fund | Financial Highlights |
For a share outstanding throughout the periods presented
| | | | CLASS A | |
| | | | Year Ended April 30, 2018 | | | | Year Ended April 30, 2017 | | | | Year Ended April 30, 2016 | | | | Year Ended April 30, 2015 | | | | Year Ended April 30, 2014 | |
| NET ASSET VALUE, BEGINNING OF PERIOD | | $ | 41.61 | | | $ | 31.27 | | | $ | 28.85 | | | $ | 26.11 | | | $ | 20.08 | |
| INCOME/(LOSS) FROM OPERATIONS: | | | | | | | | | | | | | | | | | | | | |
| Net investment loss(a) | | | (0.29 | ) | | | (0.17 | ) | | | (0.06 | ) | | | (0.16 | ) | | | (0.13 | ) |
| Net realized and unrealized gain on investments | | | 5.98 | | | | 10.51 | | | | 2.48 | | | | 2.90 | | | | 6.16 | |
| Total from Investment Operations | | | 5.69 | | | | 10.34 | | | | 2.42 | | | | 2.74 | | | | 6.03 | |
| | | | | | | | | | | | | | | | | | | | | |
| LESS DISTRIBUTIONS: | | | | | | | | | | | | | | | | | | | | |
| From capital gains | | | (1.29 | ) | | | – | | | | – | | | | – | | | | – | |
| Total Distributions | | | (1.29 | ) | | | – | | | | – | | | | – | | | | – | |
| NET INCREASE IN NET ASSET VALUE | | | 4.40 | | | | 10.34 | | | | 2.42 | | | | 2.74 | | | | 6.03 | |
| NET ASSET VALUE, END OF PERIOD | | $ | 46.01 | | | $ | 41.61 | | | $ | 31.27 | | | $ | 28.85 | | | $ | 26.11 | |
| | | | | | | | | | | | | | | | | | | | | |
| TOTAL RETURN(b) | | | 13.59 | % | | | 33.07 | % | | | 8.39 | % | | | 10.49 | % | | | 30.03 | % |
| RATIOS/SUPPLEMENTAL DATA: | | | | | | | | | | | | | | | | | | | | |
| Net Assets, End of Period (000s) | | $ | 172,338 | | | $ | 172,106 | | | $ | 110,601 | | | $ | 48,575 | | | $ | 48,622 | |
| RATIOS TO AVERAGE NET ASSETS: | | | | | | | | | | | | | | | | | | | | |
| Net Investment loss | | | (0.65 | )% | | | (0.46 | )% | | | (0.21 | )% | | | (0.58 | )% | | | (0.53 | )% |
| Operating expenses excluding reimbursement/waiver | | | 1.41 | % | | | 1.43 | % | | | 1.48 | % | | | 1.60 | % | | | 1.72 | % |
| Operating expenses including reimbursement/waiver | | | 1.41 | % | | | 1.43 | % | | | 1.48 | % | | | 1.60 | % | | | 1.72 | % |
| PORTFOLIO TURNOVER RATE | | | 62 | % | | | 36 | % | | | 30 | % | | | 33 | % | | | 34 | % |
| (a) | Per share amounts are based upon average shares outstanding. |
| (b) | Total return does not reflect the effect of sales charges. |
See Notes to Financial Statements.
| 52 | www.emeraldmutualfunds.com |
| Emerald Banking and Finance Fund | Financial Highlights |
For a share outstanding throughout the periods presented
| | | | CLASS C | |
| | | | Year Ended April 30, 2018 | | | | Year Ended April 30, 2017 | | | | Year Ended April 30, 2016 | | | | Year Ended April 30, 2015 | | | | Year Ended April 30, 2014 | |
| NET ASSET VALUE, BEGINNING OF PERIOD | | $ | 37.29 | | | $ | 28.20 | | | $ | 26.19 | | | $ | 23.86 | | | $ | 18.46 | |
| INCOME/(LOSS) FROM OPERATIONS: | | | | | | | | | | | | | | | | | | | | |
| Net investment loss(a) | | | (0.51 | ) | | | (0.36 | ) | | | (0.24 | ) | | | (0.30 | ) | | | (0.26 | ) |
| Net realized and unrealized gain on investments | | | 5.34 | | | | 9.45 | | | | 2.25 | | | | 2.63 | | | | 5.66 | |
| Total from Investment Operations | | | 4.83 | | | | 9.09 | | | | 2.01 | | | | 2.33 | | | | 5.40 | |
| | | | | | | | | | | | | | | | | | | | | |
| LESS DISTRIBUTIONS: | | | | | | | | | | | | | | | | | | | | |
| From capital gains | | | (1.29 | ) | | | – | | | | – | | | | – | | | | – | |
| Total Distributions | | | (1.29 | ) | | | – | | | | – | | | | – | | | | – | |
| NET INCREASE IN NET ASSET VALUE | | | 3.54 | | | | 9.09 | | | | 2.01 | | | | 2.33 | | | | 5.40 | |
| NET ASSET VALUE, END OF PERIOD | | $ | 40.83 | | | $ | 37.29 | | | $ | 28.20 | | | $ | 26.19 | | | $ | 23.86 | |
| | | | | | | | | | | | | | | | | | | | | |
| TOTAL RETURN(b) | | | 12.85 | % | | | 32.23 | % | | | 7.67 | % | | | 9.77 | % | | | 29.25 | % |
| RATIOS/SUPPLEMENTAL DATA: | | | | | | | | | | | | | | | | | | | | |
| Net Assets, End of Period (000s) | | $ | 78,988 | | | $ | 76,072 | | | $ | 52,366 | | | $ | 31,862 | | | $ | 28,222 | |
| RATIOS TO AVERAGE NET ASSETS: | | | | | | | | | | | | | | | | | | | | |
| Net Investment loss | | | (1.30 | )% | | | (1.11 | )% | | | (0.87 | )% | | | (1.23 | )% | | | (1.18 | )% |
| Operating expenses excluding reimbursement/waiver | | | 2.06 | % | | | 2.08 | % | | | 2.13 | % | | | 2.25 | % | | | 2.38 | % |
| Operating expenses including reimbursement/waiver | | | 2.06 | % | | | 2.08 | % | | | 2.13 | % | | | 2.25 | % | | | 2.38 | % |
| PORTFOLIO TURNOVER RATE | | | 62 | % | | | 36 | % | | | 30 | % | | | 33 | % | | | 34 | % |
| (a) | Per share amounts are based upon average shares outstanding. |
| (b) | Total return does not reflect the effect of sales charges. |
See Notes to Financial Statements.
| Annual Report | April 30, 2018 | 53 |
| Emerald Banking and Finance Fund | Financial Highlights |
For a share outstanding throughout the periods presented
| | | | INSTITUTIONAL CLASS | |
| | | | Year Ended April 30, 2018 | | | | Year Ended April 30, 2017 | | | | Year Ended April 30, 2016 | | | | Year Ended April 30, 2015 | | | | Year Ended April 30, 2014 | |
| NET ASSET VALUE, BEGINNING OF PERIOD | | $ | 42.30 | | | $ | 31.69 | | | $ | 29.15 | | | $ | 26.29 | | | $ | 20.15 | |
| INCOME/(LOSS) FROM OPERATIONS: | | | | | | | | | | | | | | | | | | | | |
| Net investment income/(loss)(a) | | | (0.15 | ) | | | (0.05 | ) | | | 0.03 | | | | (0.07 | ) | | | (0.06 | ) |
| Net realized and unrealized gain on investments | | | 6.09 | | | | 10.66 | | | | 2.51 | | | | 2.93 | | | | 6.20 | |
| Total from Investment Operations | | | 5.94 | | | | 10.61 | | | | 2.54 | | | | 2.86 | | | | 6.14 | |
| | | | | | | | | | | | | | | | | | | | | |
| LESS DISTRIBUTIONS: | | | | | | | | | | | | | | | | | | | | |
| From capital gains | | | (1.29 | ) | | | – | | | | – | | | | – | | | | – | |
| Total Distributions | | | (1.29 | ) | | | – | | | | – | | | | – | | | | – | |
| NET INCREASE IN NET ASSET VALUE | | | 4.65 | | | | 10.61 | | | | 2.54 | | | | 2.86 | | | | 6.14 | |
| NET ASSET VALUE, END OF PERIOD | | $ | 46.95 | | | $ | 42.30 | | | $ | 31.69 | | | $ | 29.15 | | | $ | 26.29 | |
| | | | | | | | | | | | | | | | | | | | | |
| TOTAL RETURN | | | 13.97 | % | | | 33.48 | % | | | 8.71 | % | | | 10.88 | % | | | 30.47 | % |
| RATIOS/SUPPLEMENTAL DATA: | | | | | | | | | | | | | | | | | | | | |
| Net Assets, End of Period (000s) | | $ | 221,638 | | | $ | 134,027 | | | $ | 61,654 | | | $ | 23,730 | | | $ | 22,062 | |
| RATIOS TO AVERAGE NET ASSETS: | | | | | | | | | | | | | | | | | | | | |
| Net Investment income/(loss) | | | (0.34 | )% | | | (0.14 | )% | | | 0.11 | % | | | (0.25 | )% | | | (0.23 | )% |
| Operating expenses excluding reimbursement/waiver | | | 1.09 | % | | | 1.11 | % | | | 1.15 | % | | | 1.27 | % | | | 1.37 | % |
| Operating expenses including reimbursement/waiver | | | 1.09 | % | | | 1.11 | % | | | 1.15 | % | | | 1.27 | % | | | 1.37 | % |
| PORTFOLIO TURNOVER RATE | | | 62 | % | | | 36 | % | | | 30 | % | | | 33 | % | | | 34 | % |
| (a) | Per share amounts are based upon average shares outstanding. |
See Notes to Financial Statements.
| 54 | www.emeraldmutualfunds.com |
| Emerald Banking and Finance Fund | Financial Highlights |
For a share outstanding throughout the periods presented
| | | | INVESTOR CLASS | |
| | | | Year Ended April 30, 2018 | | | | Year Ended April 30, 2017 | | | | Year Ended April 30, 2016 | | | | Year Ended April 30, 2015 | | | | Year Ended April 30, 2014 | |
| NET ASSET VALUE, BEGINNING OF PERIOD | | $ | 39.86 | | | $ | 29.95 | | | $ | 27.64 | | | $ | 25.01 | | | $ | 19.23 | |
| INCOME/(LOSS) FROM OPERATIONS: | | | | | | | | | | | | | | | | | | | | |
| Net investment loss(a) | | | (0.25 | ) | | | (0.16 | ) | | | (0.07 | ) | | | (0.15 | ) | | | (0.12 | ) |
| Net realized and unrealized gain on investments | | | 5.73 | | | | 10.07 | | | | 2.38 | | | | 2.78 | | | | 5.90 | |
| Total from Investment Operations | | | 5.48 | | | | 9.91 | | | | 2.31 | | | | 2.63 | | | | 5.78 | |
| | | | | | | | | | | | | | | | | | | | | |
| LESS DISTRIBUTIONS: | | | | | | | | | | | | | | | | | | | | |
| From capital gains | | | (1.29 | ) | | | – | | | | – | | | | – | | | | – | |
| Total Distributions | | | (1.29 | ) | | | – | | | | – | | | | – | | | | – | |
| NET INCREASE IN NET ASSET VALUE | | | 4.19 | | | | 9.91 | | | | 2.31 | | | | 2.63 | | | | 5.78 | |
| NET ASSET VALUE, END OF PERIOD | | $ | 44.05 | | | $ | 39.86 | | | $ | 29.95 | | | $ | 27.64 | | | $ | 25.01 | |
| | | | | | | | | | | | | | | | | | | | | |
| TOTAL RETURN | | | 13.67 | % | | | 33.09 | % | | | 8.36 | % | | | 10.52 | % | | | 30.06 | % |
| RATIOS/SUPPLEMENTAL DATA: | | | | | | | | | | | | | | | | | | | | |
| Net Assets, End of Period (000s) | | $ | 71,236 | | | $ | 85,557 | | | $ | 80,404 | | | $ | 27,440 | | | $ | 19,235 | |
| RATIOS TO AVERAGE NET ASSETS: | | | | | | | | | | | | | | | | | | | | |
| Net Investment loss | | | (0.60 | )% | | | (0.46 | )% | | | (0.23 | )% | | | (0.56 | )% | | | (0.53 | )% |
| Operating expenses excluding reimbursement/waiver | | | 1.37 | % | | | 1.43 | % | | | 1.48 | % | | | 1.58 | % | | | 1.69 | % |
| Operating expenses including reimbursement/waiver | | | 1.37 | % | | | 1.43 | % | | | 1.48 | % | | | 1.58 | % | | | 1.69 | % |
| PORTFOLIO TURNOVER RATE | | | 62 | % | | | 36 | % | | | 30 | % | | | 33 | % | | | 34 | % |
| (a) | Per share amounts are based upon average shares outstanding. |
See Notes to Financial Statements.
| Annual Report | April 30, 2018 | 55 |
| Emerald Funds | Notes to Financial Statements |
1. ORGANIZATION
Financial Investors Trust (the “Trust”), a Delaware statutory trust, is an open-end management investment company registered under the Investment Company Act of 1940, as amended (the “1940 Act”). The Trust consists of multiple separate portfolios or series. This annual report describes the Emerald Growth Fund, Emerald Small Cap Value Fund, Emerald Insights Fund, and Emerald Banking and Finance Fund (each a “Fund” and collectively, the “Funds”). The Emerald Small Cap Value Fund is a successor to a previously operational fund which was a series of Elessar Funds Investment Trust, a Delaware statutory trust, and was organized into a series of the Trust effective as of the close of business on June 26, 2015. Effective March 3, 2015, the Board approved changing the fiscal year end of the Emerald Small Cap Value Fund from September 30 to April 30.
The Emerald Growth Fund and Emerald Insights Fund seek to achieve long-term growth through capital appreciation. The Emerald Small Cap Value Fund seeks long-term capital appreciation. The Emerald Banking and Finance Fund seeks to achieve long term growth through capital appreciation with income as a secondary objective.
2. SIGNIFICANT ACCOUNTING POLICIES
The accompanying financial statements were prepared in accordance with accounting principles generally accepted in the United States of America (“U.S. GAAP”). The preparation of financial statements in conformity with U.S. GAAP requires management to make certain estimates and assumptions that affect the reported amounts of assets and liabilities and disclosures of contingent assets and liabilities at the date of the financial statements and the reported amounts of revenue and expenses during the period. Actual results could differ from those estimates. The Funds are considered an investment company for financial reporting purposes under U.S. GAAP and follows the accounting and reporting guidance applicable to investment companies in the Financial Accounting Standards Board Accounting Standards Codification Topic 946. The following is a summary of significant accounting policies consistently followed by the Funds in preparation of their financial statements.
Investment Valuation: The Funds generally value their securities based on market prices determined at the close of regular trading on the New York Stock Exchange (“NYSE”), normally, 4:00 p.m. Eastern time, on each business day the NYSE is open for trading.
For equity securities and mutual funds that are traded on an exchange, the market price is usually the closing sale or official closing price on that exchange. In the case of equity securities not traded on an exchange, or if such closing prices are not otherwise available, the securities are valued at the mean of the most recent bid and ask prices on such day. Redeemable securities issued by open-end registered investment companies are valued at the investment company’s applicable net asset value, with the exception of exchange-traded open-end investment companies, which are priced as equity securities.
The market price for debt obligations is generally the price supplied by an independent third-party pricing service approved by the Board of Trustees (the “Board”), which may use a matrix, formula or other objective method that takes into consideration quotations from dealers, market transactions in comparable investments, market indices and yield curves. If vendors are unable to supply a price, or if the price supplied is deemed to be unreliable, the market price may be determined using quotations received from one or more brokers–dealers that make a market in the security.
Equity securities that are primarily traded on foreign securities exchanges are valued at the preceding closing values of such securities on their respective exchanges, except when an occurrence subsequent to the time a value was so established is likely to have changed such value. In such an event, the fair values of those securities are determined in good faith through consideration of other factors in accordance with procedures established by and under the general supervision of the Board.
When such prices or quotations are not available, or when Emerald Mutual Fund Advisers Trust, (the “Adviser”), believes that they are unreliable, securities may be priced using fair value procedures approved by the Board.
Fair Value Measurements: A three-tier hierarchy has been established to classify fair value measurements for disclosure purposes. Inputs refer broadly to the assumptions that market participants would use in pricing the asset or liability, including assumptions about risk. Inputs may be observable or unobservable. Observable inputs are inputs that reflect the assumptions market participants would use in pricing the asset or liability that are developed based on market data obtained from sources independent of the reporting entity. Unobservable inputs are inputs that reflect the reporting entity’s own assumptions about the assumptions market participants would use in pricing the asset or liability that are developed based on the best information available. Various inputs are used in determining the value of each Fund’s investments as of the reporting period end. The designated input levels are not necessarily an indication of the risk or liquidity associated with these investments.
| 56 | www.emeraldmutualfunds.com |
| Emerald Funds | Notes to Financial Statements |
These inputs are categorized in the following hierarchy under applicable financial accounting standards:
| Level 1 – | Unadjusted quoted prices in active markets for identical investments, unrestricted assets or liabilities that the Funds have the ability to access at the measurement date; |
| Level 2 – | Quoted prices which are not active, quoted prices for similar assets or liabilities in active markets or inputs other than quoted prices that are observable (either directly or indirectly) for substantially the full term of the asset or liability; and |
| Level 3 – | Significant unobservable prices or inputs (including the Funds’ own assumptions in determining the fair value of investments) where there is little or no market activity for the asset or liability at the measurement date. |
The following is a summary of each input used to value the Funds as of April 30, 2018:
| Investments in Securities at Value | | Level 1 - Quoted Prices | | | Level 2 - Other Significant Observable Inputs | | | Level 3 - Significant Unobservable Inputs | | | Total | |
| Emerald Growth Fund | | | | | | | | | | | | |
| Common Stocks(a) | | $ | 1,205,494,785 | | | $ | – | | | $ | – | | | $ | 1,205,494,785 | |
| Short Term Investments | | | 17,686,023 | | | | – | | | | – | | | | 17,686,023 | |
| TOTAL | | $ | 1,223,180,808 | | | $ | – | | | $ | – | | | $ | 1,223,180,808 | |
| Investments in Securities at Value | | Level 1 - Quoted Prices | | | Level 2 - Other Significant Observable Inputs | | | Level 3 - Significant Unobservable Inputs | | | Total | |
| Emerald Small Cap Value Fund | | | | | | | | | | | | |
| Common Stocks | | | | | | | | | | | | | | | | |
| Financial Services | | $ | 3,556,838 | | | $ | 64,710 | | | $ | – | | | $ | 3,621,548 | |
| Other(a) | | | 3,870,714 | | | | – | | | | – | | | | 3,870,714 | |
| Short Term Investments | | | 239,140 | | | | – | | | | – | | | | 239,140 | |
| TOTAL | | $ | 7,666,692 | | | $ | 64,710 | | | $ | – | | | $ | 7,731,402 | |
| Investments in Securities at Value | | Level 1 - Quoted Prices | | | Level 2 - Other Significant Observable Inputs | | | Level 3 - Significant Unobservable Inputs | | | Total | |
| Emerald Insights Fund | | | | | | | | | | | | |
| Common Stocks(a) | | $ | 10,524,286 | | | $ | – | | | $ | – | | | $ | 10,524,286 | |
| Master Limited Partnerships(a) | | | 59,100 | | | | – | | | | – | | | | 59,100 | |
| Short Term Investments | | | 356,505 | | | | – | | | | – | | | | 356,505 | |
| TOTAL | | $ | 10,939,891 | | | $ | – | | | $ | – | | | $ | 10,939,891 | |
| Investments in Securities at Value | | Level 1 - Quoted Prices | | | Level 2 - Other Significant Observable Inputs | | | Level 3 - Significant Unobservable Inputs | | | Total | |
| Emerald Banking and Finance Fund | | | | | | | | | | | | | | | | |
| Common Stocks | | | | | | | | | | | | | | | | |
| Banks: Diversified | | $ | 419,253,450 | | | $ | 14,535,799 | | | $ | – | | | $ | 433,789,249 | |
| Other(a) | | | 107,762,981 | | | | – | | | | – | | | | 107,762,981 | |
| Short Term Investments | | | 3,437,077 | | | | – | | | | – | | | | 3,437,077 | |
| TOTAL | | $ | 530,453,508 | | | $ | 14,535,799 | | | $ | – | | | $ | 544,989,307 | |
| (a) | For detailed descriptions of sector and industry, see the accompanying Schedule of Investments. |
| Annual Report | April 30, 2018 | 57 |
| Emerald Funds | Notes to Financial Statements |
The Funds recognize transfers between levels as of the end of the period. For the year ended April 30, 2018, the Funds had the following transfers between Level 1 and Level 2 securities.
| | | Level 1 | | | Level 2 | |
| Emerald Banking and Finance Fund | | Transfer In | | | Transfers (Out) | | | Transfer In | | | Transfers (Out) | |
| Common Stocks | | $ | 7,231,669 | | | $ | (8,744,467 | ) | | $ | 8,744,467 | | | $ | (7,231,669 | ) |
| Total | | $ | 7,231,669 | | | $ | (8,744,467 | ) | | $ | 8,744,467 | | | $ | (7,231,669 | ) |
The above transfers from Level 2 to Level 1 were due to the ability to obtain a closing market price within an active market for a security that previously had no market to trade. Additionally, the above transfers from Level 1 to Level 2 were due to the inability to obtain a closing market price due to an inactive market to trade. For the year ended April 30, 2018, the Emerald Growth Fund, the Emerald Small Cap Value Fund and Emerald Insights Fund did not have any transfers between Level 1 and Level 2 securities.
For the year ended April 30, 2018, the Funds did not have any securities that used significant unobservable inputs (Level 3) in determining fair value.
Investment Transactions and Investment Income: Investment transactions are accounted for on the date the investments are purchased or sold (trade date). Realized gains and losses from investment transactions are reported on an identified cost basis, which is the same basis the Funds use for federal income tax purposes. Interest income, which includes accretion of discounts, is accrued and recorded as earned. Dividend income is recognized on the ex-dividend date or for certain foreign securities, as soon as information is available to the Funds. All of the realized and unrealized gains and losses and net investment income, are allocated daily to each class in proportion to its average daily net assets.
Real Estate Investment Trusts (“REITs”): The Funds may invest a portion of their assets in REITs and are subject to certain risks associated with direct investment in REITs. REITs may be affected by changes in the value of their underlying properties and by defaults by borrowers or tenants. REITs depend generally on their ability to generate cash flow to make distributions to shareowners, and certain REITs have self-liquidation provisions by which mortgages held may be paid in full and distributions of capital returns may be made at any time. In addition, the performance of a REIT may be affected by its failure to qualify for tax-free pass-through of income under the Internal Revenue Code of 1986, as amended (the “Code”), or its failure to maintain exemption from registration under the 1940 Act. A Fund’s investments in REITs may result in such Fund’s receipt of cash in excess of the REITs’ earnings. If the Fund receives such distributions all or a portion of these distributions will constitute a return of capital to such Fund. Receiving a return of capital distribution from REITs will reduce the amount of income available to be distributed to Fund shareholders. Income from REITs generally will not be eligible for treatment as qualified dividend income. As the final character of the distributions is not known until reported by the REITs on their 1099s, the Funds utilize an average of the prior year’s reallocation information as an estimate for the current year character of distributions.
Trust Expenses: Some expenses of the Trust can be directly attributed to the Funds. Expenses which cannot be directly attributed to the Funds are apportioned among all funds in the Trust based on average net assets of each fund.
Fund and Class Expenses: Expenses that are specific to a Fund or class of shares of a Fund, including distribution fees (Rule 12b-1 fees) and shareholder servicing fees, are charged directly to that Fund or share class. All expenses of a Fund, other than class specific expenses, are allocated daily to each class in proportion to its average daily net assets. Expenses that are common to the Funds generally are allocated among the Funds in proportion to their average daily net assets.
Federal Income Taxes: Each Fund complies with the requirements under Subchapter M of the Internal Revenue Code of 1986, as amended, applicable to regulated investment companies and intends to distribute substantially all of its net taxable income and net capital gains, if any, each year so that the Funds will not be subject to excise tax on undistributed income and gains. The Funds are not subject to income taxes to the extent such distributions are made.
As of and during the year ended April 30, 2018, the Funds did not have a liability for any unrecognized tax benefits. The Funds file U.S. federal, state, and local tax returns as required. The Funds’ tax returns are subject to examination by the relevant tax authorities until expiration of the applicable statute of limitations, which is generally three years after the filing of the tax return for federal purposes and four years for most state returns. Tax returns for open years have incorporated no uncertain tax positions that require a provision for income taxes.
| 58 | www.emeraldmutualfunds.com |
| Emerald Funds | Notes to Financial Statements |
April 30, 2018
Distributions to Shareholders: Each Fund normally pays dividends and distributes capital gains, if any, on an annual basis. Income dividend distributions are derived from dividends and other income each Fund receives from its investments, including short-term capital gains. Long term capital gain distributions are derived from gains realized when each Fund sells a security it has owned for more than a year. Each Fund may make additional distributions and dividends at other times if the portfolio manager believes doing so may be necessary for each Fund to avoid or reduce taxes.
3. TAX BASIS INFORMATION
Reclassifications: As of April 30, 2018, permanent differences on book and tax accounting were reclassified. These differences had no effect on net assets and were primarily attributed to treatment of partnerships and net investment losses. These reclassifications were as follows:
| | | Undistributed Net Investment Income/(Loss) | | | Accumulated Net Realized Gain/(Loss) on Investments | | | Paid-in Capital | |
| Emerald Growth Fund | | $ | 5,604,935 | | | $ | – | | | $ | (5,604,935 | ) |
| Emerald Small Cap Value Fund | | | 6,847 | | | | (1 | ) | | | (6,846 | ) |
| Emerald Insights Fund | | | 84,326 | | | | (84,326 | ) | | | – | |
| Emerald Banking and Finance Fund | | | 2,781,655 | | | | 34,593 | | | | (2,816,248 | ) |
Included in those amounts reclassified was a net operating loss offset to Paid-in capital for the Emerald Growth Fund, the Emerald Small Cap Value Fund, and the Emerald Banking and Finance Fund in the amount of $5,604,935, $6,846, and $2,816,248 respectively.
Tax Basis of Investments: As of April 30, 2018, the aggregate cost of investments, gross unrealized appreciation/(depreciation) and net unrealized appreciation/(depreciation) for Federal tax purposes was as follows:
| | | Gross Appreciation (excess of value over tax cost) | | | Gross Depreciation (excess of tax cost over value) | | | Net Unrealized Appreciation/ (Depreciation) | | | Cost of Investments for Income Tax Purposes | |
| Emerald Growth Fund | | $ | 338,994,341 | | | $ | (40,989,862 | ) | | $ | 298,004,479 | | | $ | 925,176,329 | |
| Emerald Small Cap Value Fund | | | 1,325,614 | | | | (270,426 | ) | | | 1,055,188 | | | | 6,676,214 | |
| Emerald Insights Fund | | | 1,427,319 | | | | (445,358 | ) | | | 981,961 | | | | 9,957,930 | |
| Emerald Banking and Finance Fund | | | 147,130,084 | | | | (2,214,436 | ) | | | 144,915,648 | | | | 400,073,659 | |
Components of Distributable Earnings: As of April 30, 2018, components of distributable earnings were as follows:
| | | Emerald Growth Fund | | | Emerald Small Cap Value Fund | | | Emerald Insights Fund | | | Emerald Banking and Finance Fund | |
| Undistributed ordinary income | | $ | – | | | $ | – | | | $ | 22,553 | | | $ | – | |
| Accumulated capital gains | | | 68,500,812 | | | | 1,114,797 | | | | 1,498,731 | | | | 37,550,754 | |
| Net unrealized appreciation on investments | | | 298,004,479 | | | | 1,055,188 | | | | 981,961 | | | | 144,915,648 | |
| Other cumulative effect of timing differences | | | (1,459,831 | ) | | | (6,508 | ) | | | – | | | | (1,277,168 | ) |
| Total | | $ | 365,045,460 | | | $ | 2,163,477 | | | $ | 2,503,245 | | | $ | 181,189,234 | |
During the year ended April 30, 2018, $55,659,946, $710,274, and $5,913,786 of capital loss carryforwards were utilized by the Emerald Growth Fund, Emerald Insights Fund, and Emerald Banking and Finance Fund.
Ordinary Losses: As of April 30, 2018, Emerald Growth Fund, Emerald Small Cap Value Fund, and Emerald Banking and Finance Fund elected to defer to the period ending April 30, 2019, late year ordinary losses in the amount of $1,459,831, $6,508 and $1,277,168, respectively.
| Annual Report | April 30, 2018 | 59 |
| Emerald Funds | Notes to Financial Statements |
April 30, 2018
Tax Basis of Distributions to Shareholders: The character of distributions made during the year from net investment income or net realized gains may differ from its ultimate characterization for federal income tax purposes. Also, due to the timing of dividend distributions, the fiscal year in which amounts are distributed may differ from the fiscal year in which the income or realized gain were recorded by each Fund.
The tax characters of distributions paid by the Funds for the fiscal year ended April 30, 2018 were as follows:
| | | Ordinary Income | | | Long-Term Capital Gain | |
| Emerald Growth Fund | | $ | – | | | $ | – | |
| Emerald Small Cap Value Fund | | | 506,928 | | | | 2,912,564 | |
| Emerald Insights Fund | | | – | | | | – | |
| Emerald Banking and Finance Fund | | | – | | | | 14,572,442 | |
For the fiscal year ended April 30, 2017, the Funds did not pay any distributions.
4. SECURITIES TRANSACTIONS
The cost of purchases and proceeds from sales of securities (excluding short-term securities) during the year ended April 30, 2018 was as follows:
| Funds | | Cost of Investments Purchased | | | Proceeds from Investments Sold | |
| Emerald Growth Fund | | $ | 755,001,524 | | | $ | 745,482,307 | |
| Emerald Small Cap Value Fund | | | 5,437,356 | | | | 6,508,802 | |
| Emerald Insights Fund | | | 15,023,514 | | | | 17,427,798 | |
| Emerald Banking and Finance Fund | | | 323,622,767 | | | | 307,515,283 | |
5. SHARES OF BENEFICIAL INTEREST
The capitalization of the Trust consists of an unlimited number of shares of beneficial interest with no par value per share. Holders of the shares of the Funds of the Trust have one vote for each share held and a proportionate fraction of a vote for each fractional share. All shares issued and outstanding are fully paid and are transferable and redeemable at the option of the shareholder. Purchasers of the shares do not have any obligation to make payments to the Trust or its creditors (other than the purchase price for the shares) or make contributions to the Trust or its creditors solely by reason of the purchaser’s ownership of the shares. Shares have no pre-emptive rights.
| 60 | www.emeraldmutualfunds.com |
| Emerald Funds | Notes to Financial Statements |
April 30, 2018
6. MANAGEMENT AND RELATED-PARTY TRANSACTIONS
The Adviser, subject to the authority of the Board, is responsible for the overall management and administration of the Funds’ business affairs. The Adviser manages the investments of the Funds in accordance with the Funds’ investment objective, policies and limitations and investment guidelines established jointly by the Adviser and the Trustees. Pursuant to the Advisory Agreement, the Funds pay the Adviser fees for the services and facilities it provides payable on a monthly basis at the annual rate set forth below of the Funds’ average daily net assets. The management fee is paid on a monthly basis.
| Emerald Growth Fund | |
| Average Total Net Assets | Contractual Fee |
| Up to and including $250M | 0.75% |
| Over $250M and including $500M | 0.65% |
| Over $500M and including $750M | 0.55% |
| Over $750M | 0.45% |
| Emerald Small Cap Value Fund | |
| Average Total Net Assets | Contractual Fee |
| Up to and including $250M | 0.75% |
| Over $250M and including $500M | 0.65% |
| Over $500M and including $750M | 0.55% |
| Over $750M | 0.45% |
| Emerald Insights Fund | |
| Average Total Net Assets | Contractual Fee |
| Up to and including $250M | 0.75% |
| Over $250M and including $500M | 0.65% |
| Over $500M and including $750M | 0.55% |
| Over $750M | 0.45% |
| Emerald Banking and Finance Fund | |
| Average Total Net Assets | Contractual Fee |
| Up to and including $100M | 1.00% |
| Over $100M | 0.90% |
The Adviser has contractually agreed to limit each Fund’s total annual operating expenses (exclusive of acquired fund fees and expenses, brokerage expenses, interest expenses, taxes and extraordinary expense) set forth in the following table for Class A, Class C, Institutional Class, and Investor Class shares to the annual rates (as percentages of a Fund’s average daily net assets). This agreement (the “Expense Agreement”) is in effect from September 1, 2017 through August 31, 2018. The prior Expense Agreement was in effect from September 1, 2016 through August 31, 2017 for all Funds except the Emerald Small Cap Value Fund. The Emerald Small Cap Value Fund’s prior agreement was in effect from June 26, 2015 through August 31, 2017. The Adviser will be permitted to recover, on a class-by-class basis, expenses it has borne through the expense agreement to the extent that a Fund’s expenses in later periods fall below the expense cap in effect at the time of the waiver or reimbursement. Notwithstanding the foregoing, the Funds will not be obligated to pay any such fees and expenses more than three years after the date of the waiver or reimbursement. The Adviser may not discontinue this waiver, prior to August 31, 2018, without the approval by the Fund’s Board. Fees waived/reimbursed by the Adviser for the year ended April 30, 2018 are disclosed in the Statements of Operations.
| Annual Report | April 30, 2018 | 61 |
| Emerald Funds | Notes to Financial Statements |
April 30, 2018
| Emerald Growth Fund |
| Class A | Class C | Institutional Class | Investor Class |
| 1.29% | 1.94% | 0.99% | 1.34% |
| Emerald Small Cap Value Fund |
| Class A | Class C | Institutional Class | Investor Class |
| 1.35% | 2.00% | 1.00% | 1.25% |
| Emerald Insights Fund |
| Class A | Class C | Institutional Class | Investor Class |
| 1.35% | 2.00% | 1.05% | 1.40% |
| Emerald Banking and Finance Fund |
| Class A | Class C | Institutional Class | Investor Class |
| 1.84% | 2.49% | 1.54% | 1.89% |
For the year ended April 30, 2018, the fee waivers/reimbursements and recoupments of past waived fees were as follows:
| Fund | | Fees Waived/ Reimbursed By Adviser | | | Recoupment of Past Waived Fees By Adviser | |
| Emerald Growth Fund | | | | | | |
| Class A | | $ | – | | | $ | – | |
| Class C | | | – | | | | – | |
| Institutional Class | | | – | | | | – | |
| Investor Class | | | – | | | | – | |
| Emerald Small Cap Value Fund | | | | | | | | |
| Class A | | $ | 32,984 | | | $ | – | |
| Class C | | | 1,410 | | | | – | |
| Institutional Class | | | 53,258 | | | | – | |
| Investor Class | | | 7,303 | | | | – | |
| Emerald Insights Fund | | | | | | | | |
| Class A | | $ | 72,407 | | | $ | – | |
| Class C | | | 908 | | | | – | |
| Institutional Class | | | 8,238 | | | | – | |
| Investor Class | | | 693 | | | | 22 | |
| Emerald Banking and Finance Fund | | | | | | | | |
| Class A | | $ | – | | | $ | – | |
| Class C | | | – | | | | – | |
| Institutional Class | | | – | | | | – | |
| Investor Class | | | – | | | | – | |
| 62 | www.emeraldmutualfunds.com |
| Emerald Funds | Notes to Financial Statements |
April 30, 2018
As of April 30, 2018, the balances of recoupable expenses for each Fund were as follows:
| Fund | | Expires 2019 | | | Expires 2020 | | | Expires 2021 | | | Total | |
| Emerald Growth Fund | | | | | | | | | | | | |
| Class A | | $ | – | | | $ | – | | | $ | – | | | $ | – | |
| Class C | | | – | | | | – | | | | – | | | | – | |
| Institutional Class | | | – | | | | – | | | | – | | | | – | |
| Investor Class | | | – | | | | – | | | | – | | | | – | |
| Emerald Small Cap Value Fund | | | | | | | | | | | | | | | | |
| Class A | | $ | 286 | | | $ | 6,552 | | | $ | 32,984 | | | $ | 39,822 | |
| Class C | | | 647 | | | | 4,441 | | | | 1,410 | | | | 6,498 | |
| Institutional Class | | | 101,745 | | | | 67,420 | | | | 53,258 | | | | 222,423 | |
| Investor Class | | | 6,582 | | | | 8,254 | | | | 7,303 | | | | 22,139 | |
| Emerald Insights Fund | | | | | | | | | | | | | | | | |
| Class A | | $ | 67,047 | | | $ | 80,509 | | | $ | 72,407 | | | $ | 219,963 | |
| Class C | | | 467 | | | | 793 | | | | 908 | | | | 2,168 | |
| Institutional Class | | | 5,690 | | | | 9,736 | | | | 8,238 | | | | 23,664 | |
| Investor Class | | | 3,372 | | | | 615 | | | | 693 | | | | 4,680 | |
| Emerald Banking and Finance Fund | | | | | | | | | | | | | | | | |
| Class A | | $ | – | | | $ | – | | | $ | – | | | $ | – | |
| Class C | | | – | | | | – | | | | – | | | | – | |
| Institutional Class | | | – | | | | – | | | | – | | | | – | |
| Investor Class | | | – | | | | – | | | | – | | | | – | |
Fund Administrator Fees and Expenses: ALPS Fund Services, Inc. (“ALPS”) serves as administrator to the Funds and the Funds have agreed to pay expenses incurred in connection with their administrative activities. Pursuant to an Administration Agreement, ALPS provides operational services to the Funds including, but not limited to, fund accounting and fund administration and generally assist in the Funds’ operations. Officers of the Trust are employees of ALPS. The Funds’ administration fee is accrued on a daily basis and paid monthly. Administration fees paid by the Funds for the year ended April 30, 2018 are disclosed in the Statements of Operations.
The Administrator is also reimbursed by the Funds for certain out-of-pocket expenses.
Transfer Agent: ALPS serves as transfer, dividend paying and shareholder servicing agent for the Funds. ALPS receives an annual minimum fee, a fee based upon the number of shareholder accounts, and is also reimbursed by the Funds for certain out-of-pocket expenses. Transfer agent fees paid by the Funds for the year ended April 30, 2018 are disclosed in the Statements of Operations.
Compliance Services: ALPS provides services that assist the Trust’s chief compliance officer in monitoring and testing the policies and procedures of the Trust in conjunction with requirements under Rule 38a-1 under the 1940 Act and receives an annual base fee. ALPS is reimbursed for certain out-of-pocket expenses by the Funds. Compliance service fees paid by the Funds for the year ended April 30, 2018 are disclosed in the Statements of Operations.
Principal Financial Officer: ALPS receives an annual fee for providing principal financial officer services to the Funds. Principal financial officer fees paid by the Funds for the year ended April 30, 2018 are disclosed in the Statements of Operations.
Distributor: ALPS Distributors, Inc. (“ADI” or the “Distributor”) (an affiliate of ALPS Fund Services Inc. (“ALPS”)) acts as the distributor of the Funds’ shares pursuant to a Distribution Agreement with the Trust. Shares are sold on a continuous basis by ADI as agent for the Funds, and ADI has agreed to use its best efforts to solicit orders for the sale of Funds’ shares, although it is not obliged to sell any particular amount of shares. ADI is not entitled to any compensation for its services as Distributor. ADI is registered as a broker-dealer with the U.S. Securities and Exchange Commission.
Each Fund has adopted a separate Distribution and Services Plan (each a “Plan” and collectively, the “Plans”) pursuant to Rule 12b-1 of the 1940 Act. The Plans allow each Fund, as applicable, to use each Fund’s assets to pay fees in connection with the distribution and marketing of the Funds’ shares and/or the provision of shareholder services to the Funds’ shareholders. The Plan permits payment for services in connection with the administration of plans or programs that use shares of each Fund as their funding medium and for related expenses. The recipients of such payments may include other affiliates of the Adviser, broker-dealers, financial institutions, plan sponsors and administrators and other financial intermediaries through which investors may purchase shares of the Fund. The Plans permit each Fund to make total payments at an annual rate of up to 0.35%, 0.75% and 0.25% of the average daily net asset value of Class A, Class C and Investor Class, respectively. Because these fees are paid
| Annual Report | April 30, 2018 | 63 |
| Emerald Funds | Notes to Financial Statements |
April 30, 2018
out of the Funds’ assets on an ongoing basis, over time they will increase the cost of an investment in the Funds, and Plan fees may cost an investor more than other types of sales charges.
Each Fund, except the Emerald Small Cap Value Fund, has adopted a Shareholder Services Plan (a “Shareholder Services Plan”) with respect to its Class C, Institutional Class and Investor Class shares. Under the Shareholder Services Plan, a Fund is authorized to compensate certain financial intermediaries, including broker-dealers and Fund affiliates which may include the Distributor, Adviser and/or the transfer agent (the “Participating Organizations”), an aggregate fee in an amount not to exceed on an annual basis 0.25%, 0.05% and 0.15% of the average daily net asset value of Class C, Institutional Class and Investor Class, respectively, of the Funds attributable to or held in the name of the Participating Organizations pursuant to an agreement with such Participating Organizations (the “Agreement”). Each Agreement will set forth the non-distribution related shareholder services to be performed by the Participating Organizations for the benefit of a Fund’s shareholders who have elected to have such Participating Organizations service their accounts. Any amount of such payment not paid to Participating Organizations during a Fund’s fiscal year for such service activities shall be reimbursed to the Fund as soon as practicable. Shareholder Services Plan fees are included with distribution and service fees in the Statements of Operations. Fees recaptured pursuant to the Shareholder Services Plan for the year ended April 30, 2018 are included as an offset to distribution and service fees as disclosed in the Statements of Operations.
The Emerald Small Cap Value Fund has adopted a Shareholder Services Plan (the “Plan”) with respect to its Class C shares. Under the Plan, the Fund is authorized to pay banks and its affiliates and other institutions, including broker-dealers and Fund affiliates which may include the Distributor, Adviser and/or the transfer agent (“Class C Participating Organizations”), an aggregate fee in an amount not to exceed on an annual basis 0.25% of the average daily net asset value of Class C shares of the Fund attributable to or held in the name of the Participating Organizations for its clients as compensation for providing shareholder service activities, which do not include distribution services pursuant to an agreement with Participating Organizations. Any amount of such payment not paid to the Participating Organizations during the Fund’s fiscal year for such service activities shall be reimbursed to the Fund as soon as practicable. Plan fees are included with distribution and service fees in the Statements of Operations. Fees recaptured pursuant to the Plan for the year ended April 30, 2018 are included as an offset to distribution and service fees as disclosed in the Statements of Operations.
7. INDEMNIFICATIONS
Under the Trust’s organizational documents, its officers and Trustees are indemnified against certain liability arising out of the performance of their duties to the Trust. Additionally, in the normal course of business, the Trust enters into contracts with service providers that may contain general indemnification clauses, which may permit indemnification to the extent permissible under applicable law. The Trust’s maximum exposure under these arrangements is unknown, as this would involve future claims that may be made against the Trust that have not yet occurred.
| 64 | www.emeraldmutualfunds.com |
| Emerald Funds | Report of Independent Registered Public Accounting Firm |
To the shareholders and the Board of Trustees of Financial Investors Trust
Opinion on the Financial Statements and Financial Highlights
We have audited the accompanying statements of assets and liabilities, including the schedules of investments, of Emerald Growth Fund, Emerald Small Cap Value Fund, Emerald Insights Fund, and Emerald Banking and Finance Fund (the "Funds"), four of the funds constituting the Financial Investors Trust, as of April 30, 2018; the related statements of operations for the year then ended, the statements of changes in net assets for each of the two years in the period then ended, the financial highlights for each of the five years in the period then ended for Emerald Growth Fund and Emerald Banking and Finance Fund; the related statements of operations, changes in net assets, and the financial highlights for the periods indicated in the table below for the Emerald Small Cap Value Fund and Emerald Insights Fund; and the related notes. In our opinion, the financial statements and financial highlights present fairly, in all material respects, the financial position of each of the funds listed above constituting the Financial Investors Trust as of April 30, 2018, and the results of their operations for the year then ended, the changes in their net assets for each of the two years in the period then ended, and the financial highlights for each of the five years in the period then ended (or for the period listed in the table below) in conformity with accounting principles generally accepted in the United States of America.
| Individual Fund Comprising the Financial Investors Trust | Statement of Operations | Statements of Changes in Net Assets | Financial Highlights |
| Emerald Small Cap Value Fund | For the year ended April 30, 2018 | For the years ended April 30, 2018 and 2017 | For each of the two years in the period ended April 30, 2018, the period from October 1, 2015 to April 30, 2016, and for the year ended September 30, 2015* |
| Emerald Insights Fund | For the year ended April 30, 2018 | For the years ended April 30, 2018 and 2017 | For each of the three years in the period ended April 30, 2018, and for the period August 1, 2014 (commencement of investment operations) to April 30, 2015 |
| * | The financial highlights for the Emerald Small Cap Value Fund for the year ended September 30, 2014 and for the period from October 15, 2012 (commencement of investment operations), to September 30, 2013 were audited by other auditors whose report, dated November 24, 2014, expressed an unqualified opinion on such financial highlights. |
Basis for Opinion
These financial statements and financial highlights are the responsibility of the Funds’ management. Our responsibility is to express an opinion on the Funds’ financial statements and financial highlights based on our audits. We are a public accounting firm registered with the Public Company Accounting Oversight Board (United States) (PCAOB) and are required to be independent with respect to the Funds in accordance with the U.S. federal securities laws and the applicable rules and regulations of the Securities and Exchange Commission and the PCAOB.
We conducted our audits in accordance with the standards of the PCAOB. Those standards require that we plan and perform the audit to obtain reasonable assurance about whether the financial statements and financial highlights are free of material misstatement, whether due to error or fraud. The Funds are not required to have, nor were we engaged to perform, an audit of their internal control over financial reporting. As part of our audits we are required to obtain an understanding of internal control over financial reporting but not for the purpose of expressing an opinion on the effectiveness of the Funds’ internal control over financial reporting. Accordingly, we express no such opinion.
Our audits included performing procedures to assess the risks of material misstatement of the financial statements and financial highlights, whether due to error or fraud, and performing procedures that respond to those risks. Such procedures included examining, on a test basis, evidence regarding the amounts and disclosures in the financial statements and financial highlights. Our audits also included evaluating the accounting principles used and significant estimates made by management, as well as evaluating the overall presentation of the financial statements and financial highlights. Our procedures included confirmation of securities owned as of April 30, 2018, by correspondence with the custodian and brokers; when replies were not received from brokers, we performed other auditing procedures. We believe that our audits provide a reasonable basis for our opinion.
DELOITTE & TOUCHE LLP
Denver, Colorado
June 26, 2018
We have served as the auditor of one or more investment companies advised by Emerald Mutual Fund Advisers Trust since 2012.
| Annual Report | April 30, 2018 | 65 |
| Emerald Funds | Disclosure Regarding Approval of Fund Advisory Agreements |
April 30, 2018 (Unaudited)
Emerald Banking and Finance Fund
Emerald Growth Fund
Emerald Insights Fund
Emerald Small Cap Value Fund
On December 12, 2017, the Trustees met in person to discuss, among other things, the approval of the investment advisory agreement between the Trust and the Adviser, in accordance with Section 15(c) of the 1940 Act. In renewing and approving the Investment Advisory Agreement, the Trustees, including the Independent Trustees, considered the following factors with respect to the Emerald Funds:
Investment Advisory Fee Rate: The Trustees reviewed and considered the contractual annual advisory fee paid by the Trust, on behalf of the Emerald Funds, to Emerald of 1.00% of the Emerald Banking and Finance Fund’s daily average net asset up to and including $100 million and 0.90% in excess of $100 million and 0.75% of each of the other Emerald Fund’s daily average net assets up to and including $250 million, 0.65% in excess of $250 million and up to and including $500 million, 0.55% in excess of $500 million and up to and including $750 million, 0.45% in excess of $750 million, in light of the extent and quality of the advisory services provided by Emerald to the Emerald Funds.
The Board received and considered information including a comparison of each of the Emerald Fund’s contractual advisory fees and total expenses (net of waivers) with those of funds in the expense groups and universes of funds provided by an independent provider of investment company data (the “Data Provider”). The Trustees noted that the Banking and Finance Fund’s contractual advisory fee rate, for each share class, was above its Data Provider peer group median contractual advisory fee rate. The Trustees further noted that each of the other Emerald Fund’s contractual advisory fee rates, for each share class, were at or below their respective Data Provider peer group median contractual advisory fee rates.
Total Expense Ratios: Based on such information, the Trustees further reviewed and considered the total expense ratios (after waivers) of 1.43% for Class A, 2.08% for Class C, 1.14% for Institutional Class, and 1.48% for Investor Class of the Emerald Banking and Finance Fund; 1.08% for Class A, 1.73% for Class C, 0.77% for Institutional Class, and 1.13% for Investor Class of the Emerald Growth Fund; 1.35% for Class A, 2.00% for Class C, 1.05% for Institutional Class, and 1.40% for Investor Class of the Emerald Insights Fund; and 1.35% for Class A, 2.00% for Class C, 1.00% for Institutional Class, and 1.25% for Investor Class of the Emerald Small Cap Value Fund.
The Trustees noted that the total expense ratios (after waivers) for all classes of the Emerald Growth Fund and the Emerald Small Cap Fund were below the applicable Data Provider median total expense ratios (after waivers). The Trustees also noted that the total expense ratios (after waivers) for Emerald Banking and Finance Fund for Class A, Class C and Investor Class were similar to the applicable Data Provider median total expense ratios (after waivers) and for Institutional Class were above. The Trustees also noted that the total expense ratios (after waivers) for Emerald Insights Fund for Class A, Class C and Institutional Class were below the applicable Data Provider median total expense ratios (after waivers) and for Investor Class were above.
Nature, Extent, and Quality of the Services under the Investment Advisory Agreement: The Trustees received and considered information regarding the nature, extent, and quality of services to be provided to the Emerald Funds under the Investment Advisory Agreement. The Trustees reviewed certain background materials supplied by Emerald in its presentation, including its Form ADV.
The Trustees reviewed and considered Emerald’s investment advisory personnel, its history as an asset manager, and its performance and the amount of assets currently under management by Emerald and its affiliated entities. The Trustees also reviewed the research and decision-making processes utilized by Emerald, including the methods adopted to seek to achieve compliance with the investment objectives, policies, and restrictions of the Emerald Funds.
The Trustees considered the background and experience of Emerald’s management in connection with the Emerald Funds, including reviewing the qualifications, backgrounds, and responsibilities of the management team primarily responsible for the day-to-day portfolio management of the Emerald Funds and the extent of the resources devoted to research and analysis of actual and potential investments.
The Trustees also reviewed, among other things, Emerald’s insider trading policies and procedures and its Code of Ethics.
Performance: The Trustees reviewed performance information for each of the Emerald Funds for the 3-month, 1-year, 3-year, 5-year, 10-year, and since inception periods ended September 30, 2017, as applicable. That review included a comparison of each Emerald Fund’s performance to the performance of the group of comparable funds selected by the Data Provider. The Trustees noted that the performance of all of the share classes of the Emerald Insights Fund for the available time periods were below their respective Data Provider universe median, and the performance of all of the share classes of the other Emerald Funds for the available time periods were above their respective Data Provider universe median.
| 66 | www.emeraldmutualfunds.com |
| Emerald Funds | Disclosure Regarding Approval of Fund Advisory Agreements |
April 30, 2018 (Unaudited)
The Trustees also considered Emerald’s discussion of each Emerald Fund’s underlying portfolio diversification categories, its top contributors and top detractors, as well as Emerald’s performance and reputation generally and its investment techniques, risk management controls, and decision-making processes.
Comparable Accounts: The Trustees noted certain information provided by Emerald regarding fees charged to its other clients utilizing a strategy similar to that employed by an Emerald Fund.
Profitability: The Trustees received and considered a retrospective and projected profitability analysis prepared by Emerald based on the fees payable under the Investment Advisory Agreement with respect to each Emerald Fund. The Trustees considered the profits, if any, anticipated to be realized by Emerald in connection with the operation of each Emerald Fund. The Board then reviewed Emerald’s audited financial statements for the years ended September 30, 2016 and 2015 in order to analyze the financial condition and stability and profitability of Emerald.
Economies of Scale: The Trustees considered whether economies of scale in the provision of services to the Emerald Funds are or will be passed along to the shareholders under the proposed agreements.
Other Benefits to the Adviser: The Trustees reviewed and considered any other incidental benefits derived or to be derived by Emerald from its relationship with the Emerald Funds, including whether soft dollar arrangements were used.
In renewing Emerald as the Emerald Funds’ investment adviser and renewing the Investment Advisory Agreement and the fees charged under the Investment Advisory Agreement, the Trustees concluded that no single factor reviewed by the Trustees was identified by the Trustees to be determinative as the principal factor in whether to renew the Investment Advisory Agreement. Further, the Independent Trustees were advised by separate independent legal counsel throughout the process. The Trustees, including all of the Independent Trustees, concluded that:
| ● | the Banking and Finance Fund’s contractual advisory fee rate, for each share class, was above its Data Provider peer group median contractual advisory fee rate, and each of the other Emerald Fund’s contractual advisory fee rates, for each share class, were at or below their respective Data Provider peer group median contractual advisory fee rates; |
| ● | the total expense ratios (after waivers) for all classes of the Emerald Growth Fund and the Emerald Small Cap Fund were below the applicable Data Provider median total expense ratios (after waivers); the total expense ratios (after waivers) for Emerald Banking and Finance Fund for Class A, Class C and Investor Class were similar to the applicable Data Provider median total expense ratios (after waivers) and for Institutional Class were above; and the total expense ratios (after waivers) for Emerald Insights Fund for Class A, Class C and Institutional Class were below the applicable Data Provider median total expense ratios (after waivers) and for Investor Class were above; |
| ● | the nature, extent, and quality of services rendered by Emerald under the Investment Advisory Agreement with respect to the Emerald Funds were adequate; |
| ● | performance of all of the share classes of the Emerald Insights Fund for the available time periods ended September 30, 2017 were below their respective Data Provider universe median, and the performance of all of the share classes of the other Emerald Funds for the available time periods ended September 30, 2017 were above their respective Data Provider universe median; |
| ● | bearing in mind the limitations of comparing different types of managed accounts and the different levels of service typically associated with such accounts, the fee structures applicable to Emerald’s other clients employing a comparable strategy to one or more of the Emerald Funds were not indicative of any unreasonableness with respect to the advisory fees proposed to be payable by the Funds; |
| ● | the profit, if any, realized by Emerald in connection with the operation of the Emerald Funds is not unreasonable to the Funds; and |
| ● | there were no material economies of scale or other incidental benefits accruing to Emerald in connection with its relationship with the Emerald Funds. |
Based on the Trustees’ deliberations and their evaluation of the information described above, the Trustees, including all of the Independent Trustees, concluded that Emerald’s compensation for investment advisory services is consistent with the best interests of the Emerald Funds and their shareholders.
| Annual Report | April 30, 2018 | 67 |
| Emerald Funds | Additional Information |
April 30, 2018 (Unaudited)
1. FUND HOLDINGS
The Funds file their complete schedule of portfolio holdings with the Securities and Exchange Commission (the “SEC”) for the first and third quarters of each fiscal year on Form N-Q within 60 days after the end of the period. Copies of the Funds’ Form N-Q are available without charge on the SEC website at http://www.sec.gov. You may also review and copy the Form N-Q at the SEC’s Public Reference Room in Washington, DC. For more information about the operation of the Public Reference Room, please call the SEC at 1-800-SEC-0330.
2. FUND PROXY VOTING POLICIES, PROCEDURES AND SUMMARIES
Each Fund’s policies and procedures used in determining how to vote proxies and information regarding how the Funds voted proxies relating to portfolio securities during the most recent prior 12-month period ending June 30 are available without charge, (1) upon request, by calling (toll-free) (855) 828-9909 and (2) on the SEC’s website at http://www.sec.gov.
3. TAX INFORMATION (UNAUDITED)
The Funds designate the following for federal income tax purposes for distributions made during the calendar year ended December 31, 2017:
| | QDI | DRD |
| Emerald Banking and Finance Fund | N/A | N/A |
| Emerald Growth Fund | N/A | N/A |
| Emerald Insights Fund | N/A | N/A |
| Emerald Small-Cap Value Fund | 9.47% | 9.60% |
In early 2018, if applicable, shareholders of record received this information for the distribution paid to them by the Funds during the calendar year 2017 via Form 1099. The Funds will notify shareholders in early 2019 of amounts paid to them by the Funds, if any, during the calendar year 2018.
Pursuant to Section 852(b)(3) of the Internal Revenue Code, the Emerald Banking and Finance Fund and the Emerald Small Cap Value Fund designated $14,752,442 and $2,912,564, respectively, as long-term capital gain dividends.
| 68 | www.emeraldmutualfunds.com |
| Emerald Funds | Trustees and Officers |
April 30, 2018 (Unaudited)
Additional information regarding the Fund’s trustees is included in the Statement of Additional Information, which can be obtained without charge by calling 855-828-9909.
| INDEPENDENT TRUSTEES | | | | |
| Name, Address* & Year of Birth | Position(s) Held with Fund | Term of Office** and Length of Time Served | Principal Occupation(s) During Past 5 Years*** | Number of Funds in Fund Complex Overseen by Trustee**** | Other Directorships Held by Trustee During Past 5 Years*** |
Mary K. Anstine,
1940 | Trustee and Chairman | Ms. Anstine was elected at a special meeting of shareholders held on March 21, 1997 and re-elected at a special meeting of shareholders held on August 7, 2009. Ms. Anstine was appointed Chairman of the Board at the June 6, 2017 meeting of the Board of Trustees. | Ms. Anstine was formerly an Executive Vice President of First Interstate Bank of Denver until 1994, President/Chief Executive Officer of HealthONE Alliance, Denver, Colorado, from 1994 to 2004, and has been retired since 2004. Ms. Anstine is also Trustee/Director of AV Hunter Trust and Colorado Uplift Board. Ms. Anstine was formerly a Director of the Trust Bank of Colorado (later purchased and now known as Northern Trust Bank), HealthONE and Denver Area Council of the Boy Scouts of America, and a member of the American Bankers Association Trust Executive Committee. | 32 | Ms. Anstine is a Trustee of ALPS ETF Trust (21 funds); ALPS Variable Investment Trust (9 funds); Reaves Utility Income Fund (1 fund); and Westcore Trust (14 funds). |
Jeremy W. Deems,
1976 | Trustee | Mr. Deems was appointed as a Trustee at the March 11, 2008 meeting of the Board of Trustees and elected at a special meeting of shareholders held on August 7, 2009. | Mr. Deems is the Co-Founder, Chief Operations Officer and Chief Financial Officer of Green Alpha Advisors, LLC, a registered investment advisor, and Co-Portfolio Manager of the Shelton Green Alpha Fund. Prior to joining Green Alpha Advisors, Mr. Deems was CFO and Treasurer of Forward Management, LLC, ReFlow Management Co., LLC, ReFlow Fund, LLC, a private investment fund, and Sutton Place Management, LLC, an administrative services company, from 1998 to June 2007. From 2004 to 2005, Mr Deems also served as Treasurer of the Forward Funds and the Sierra Club Funds. | 32 | Mr. Deems is a Trustee of ALPS ETF Trust (21 funds); ALPS Variable Investment Trust (9 funds); Clough Funds Trust (1 fund); and Reaves Utility Income Fund (1 fund). |
| Annual Report | April 30, 2018 | 69 |
| Emerald Funds | Trustees and Officers |
April 30, 2018 (Unaudited)
| INDEPENDENT TRUSTEES |
| Name, Address* & Year of Birth | Position(s) Held with Fund | Term of Office** and Length of Time Served | Principal Occupation(s) During Past 5 Years*** | Number of Funds in Fund Complex Overseen by Trustee**** | Other Directorships Held by Trustee During Past 5 Years*** |
Jerry G. Rutledge,
1944 | Trustee | Mr. Rutledge was elected at a special meeting of shareholders held on August 7, 2009. | Mr. Rutledge is the President and owner of Rutledge’s Inc., a retail clothing business. He served as Director of University of Colorado Hospital from 2008 to 2016. He was from 1994 to 2007 a Regent of the University of Colorado. | 32 | Mr. Rutledge is a Trustee of Principal Real Estate Fund (1 fund), Clough Global Dividend and Income Fund (1 fund), Clough Global Equity Fund (1 fund) and Clough Global Opportunities Fund (1 fund). |
Michael “Ross” Shell,
1970 | Trustee | Mr. Shell was elected at a special meeting of shareholders held on August 7, 2009. | Mr. Shell is Founder and CEO of Red Idea, LLC, a strategic consulting/early stage venture firm (since June 2008). From 1999 to 2009, he was a part-owner and Director of Tesser, Inc., a brand agency. From December 2005 to May 2008, he was Director, Marketing and Investor Relations, of Woodbourne, a REIT/real estate hedge fund and private equity firm. Prior to this, from May 2004 to November 2005, he worked as a business strategy consultant; from June 2003 to April 2004, he was on the Global Client Services team of IDEO, a product design/innovation firm; and from 1999 to 2003, he was President of Tesser, Inc. Mr. Shell graduated with honors from Stanford University with a degree in Political Science. | 32 | None. |
| 70 | www.emeraldmutualfunds.com |
| Emerald Funds | Trustees and Officers |
| | April 30, 2018 (Unaudited) |
| INTERESTED TRUSTEE |
| Name, Address* & Year of Birth | Position(s) Held with Fund | Term of Office** and Length of Time Served | Principal Occupation(s) During Past 5 Years*** | Number of Funds in Fund Complex Overseen by Trustee**** | Other Directorships Held by Trustee During Past 5 Years*** |
Edmund J. Burke,
1961 | Trustee and President | Mr. Burke was elected as Trustee at a special meeting of shareholders held on August 7, 2009. Mr. Burke was elected President of the Trust at the December 17, 2002 meeting of the Board of Trustees. | Mr. Burke is President and a Director of ALPS Holdings, Inc. (“AHI”) and ALPS Advisors, Inc. (“AAI”), and Director of Boston Financial Data Services, Inc. (“BFDS”), ALPS Distributors, Inc. (“ADI”), ALPS Fund Services, Inc. (“AFS”) and ALPS Portfolio Solutions Distributor, Inc. (“APSD”). Because of his positions with AHI, BFDS, AAI, ADI, AFS and APSD, Mr. Burke is deemed an affiliate of the Trust as defined under the 1940 Act. | 32 | Mr. Burke is a Trustee of Clough Global Dividend and Income Fund (1 fund); Clough Global Equity Fund (1 fund); Clough Global Opportunities Fund (1 fund); Clough Funds Trust (1 fund); Liberty All-Star Equity Fund (1 fund); Director of the Liberty All-Star Growth Fund, Inc. (1 fund); Trustee of ALPS ETF Trust (21 funds). |
| Annual Report | April 30, 2018 | 71 |
| Emerald Funds | Trustees and Officers |
| | April 30, 2018 (Unaudited) |
| OFFICERS |
| Name, Address* & Year of Birth | Position(s) Held with Fund | Term of Office** and Length of Time Served | Principal Occupation(s) During Past 5 Years*** |
Kimberly R. Storms,
1972 | Treasurer | Ms. Storms was elected Treasurer of the Trust at the March 12, 2013 meeting of the Board of Trustees. | Ms. Storms is Senior Vice President - Director of Fund Administration of ALPS. Because of her position with ALPS, Ms. Storms is deemed an affiliate of the Trust as defined under the 1940 Act. Ms. Storms is also Treasurer of Liberty All-Star Equity Fund, Liberty All-Star Growth Fund, Inc., ALPS Series Trust and Elevation ETF Trust. Ms. Storms also serves as a Board member and Treasurer of The Center for Trauma & Resilience, a nonprofit agency. |
Karen S. Gilomen,
1970 | Secretary | Ms. Gilomen was elected Secretary of the Trust at the December 13, 2016 meeting of the Board of Trustees. | Ms. Gilomen joined ALPS in August 2016 as Vice President and Senior Counsel. Prior to joining ALPS, Ms. Gilomen was Vice President - General Counsel & CCO of Monticello Associates, Inc. from 2010 to 2016. Because of her position with ALPS, Ms. Gilomen is deemed an affiliate of the Trust, as defined under the 1940 Act. Ms. Gilomen is also the Secretary of Clough Funds Trust, Clough Global Dividend and Income Fund, Clough Global Equity Fund, Clough Global Opportunities Fund, Reaves Utility Income Fund, and the Assistant Secretary of the WesMark Funds. |
Ted Uhl,
1974 | Chief Compliance Officer (“CCO”) | Mr. Uhl was appointed CCO of the Trust at the June 8, 2010 meeting of the Board of Trustees. | Mr. Uhl joined ALPS in October 2006, and is currently Deputy Compliance Officer of ALPS. Prior to his current role, Mr. Uhl served as Senior Risk Manager for ALPS from October 2006 until June 2010. Before joining ALPS, Mr. Uhl served a Sr. Analyst with Enenbach and Associates (RIA), and a Sr. Financial Analyst at Sprint. Because of his position with ALPS, Mr. Uhl is deemed an affiliate of the Trust as defined under the 1940 Act. Mr. Uhl is also CCO of the Boulder Growth & Income Fund, Inc., Centre Funds, Elevation ETF Trust, Index Funds, Reality Shares ETF Trust and Reaves Utility Income Fund. |
Jennell Panella,
1974 | Assistant Treasurer | Ms. Panella was elected Assistant Treasurer of the Trust at the September 15, 2015 meeting of the Board of Trustees. | Ms. Panella joined ALPS in June 2012 and is currently Fund Controller of ALPS Fund Services, Inc. Prior to joining ALPS, Ms. Panella served as Financial Reporting Manager for Parker Global Strategies, LLC (2009-2012). Because of her position with ALPS, Ms. Panella is deemed an affiliate of the Trust as defined under the 1940 Act. Ms. Panella also serves as Assistant Treasurer of James Advantage Funds. |
Alan Gattis,
1980 | Assistant Treasurer | Mr. Gattis was elected Assistant Treasurer of the Trust at the September 13, 2016 meeting of the Board of Trustees. | Mr. Gattis joined ALPS in 2011 and is currently Vice President and Fund Controller of ALPS. Prior to joining ALPS, Mr. Gattis was an Auditor at Spicer Jeffries LLP (2009 through 2011) and an Auditor at PricewaterhouseCoopers LLP (2004 - 2009). Because of his position with ALPS, Mr. Gattis is deemed an affiliate of the Trust as defined under the 1940 Act. Mr. Gattis is also Assistant Treasurer of ALPS Series Trust and Elevation ETF Trust. |
| 72 | www.emeraldmutualfunds.com |
| Emerald Funds | Trustees and Officers |
| | April 30, 2018 (Unaudited) |
| OFFICERS |
| Name, Address* & Year of Birth | Position(s) Held with Fund | Term of Office** and Length of Time Served | Principal Occupation(s) During Past 5 Years*** |
Sharon Akselrod,
1974 | Assistant Secretary | Ms. Akselrod was elected Assistant Secretary of the Trust at the September 15, 2015 meeting of the Board of Trustees. | Ms. Akselrod joined ALPS in August 2014 and is currently Senior Investment Company Act Paralegal of ALPS Fund Services, Inc. Prior to joining ALPS, Ms. Akselrod served as Corporate Governance and Regulatory Associate for Nordstrom fsb (2013-2014) and Senior Legal Assistant – Legal Manager for AXA Equitable Life Insurance Company (2008-2013). Because of her position with ALPS, Ms. Akselrod is deemed an affiliate of the Trust as defined under the 1940 Act. Ms. Akselrod is also Assistant Secretary of ALPS ETF Trust and Principal Real Estate Income Fund. |
Jennifer Craig
1973 | Assistant Secretary | Ms. Craig was elected Assistant Secretary of the Trust at the June 8, 2016 meeting of the Board of Trustees. | Ms. Craig joined ALPS in 2007 and is currently Assistant Vice President and Paralegal Manager of ALPS. Prior to joining ALPS, Ms. Craig was Legal Manager at Janus Capital Management LLC and served as Assistant Secretary of Janus Investment Fund, Janus Adviser Series and Janus Aspen Series. Because of her position with ALPS, Ms. Craig is deemed an affiliate of the Trust as defined under the 1940 Act. Ms. Craig is also Assistant Secretary of Clough Global Dividend and Income Fund, Clough Global Equity Fund, Clough Global Opportunities Fund, Clough Funds Trust, Liberty All-Star Equity Fund, Liberty All-Star Growth Fund, Inc. and ALPS Series Trust. |
Sareena Khwaja-Dixon,
1980 | Assistant Secretary | Ms. Khwaja-Dixon was elected Assistant Secretary of the Trust at the December 12, 2017 meeting of the Board of Trustees. | Ms. Khwaja-Dixon joined ALPS in August 2015 and is currently Senior Counsel and Vice President of ALPS Fund Services, Inc. Prior to joining ALPS, Ms. Khwaja-Dixon served as a Senior Paralegal/Paralegal for Russell Investments (2011 – 2015). Ms. Khwaja-Dixon is also Secretary of Liberty All-Star Equity Fund and Liberty All-Star Growth Fund, Inc., and Assistant Secretary of Clough Funds Trust, Clough Dividend and Income Fund, Clough Global Opportunities Fund, and Clough Global Equity Fund. |
| * | All communications to Trustees and Officers may be directed to Financial Investors Trust c/o 1290 Broadway, Suite 1100, Denver, CO 80203. |
| ** | This is the period for which the Trustee or Officer began serving the Trust. Each Trustee serves an indefinite term, until his successor is elected. Officers are elected on an annual basis. |
| *** | Except as otherwise indicated, each individual has held the office shown or other offices in the same company for the last five years. |
| **** | The Fund Complex includes all series of the Trust (currently 32) and any other investment companies for which any Trustee serves as trustee for and which Emerald Mutual Fund Advisers Trust provides investment advisory services (currently none). |
| Annual Report | April 30, 2018 | 73 |
| Emerald Funds | Privacy Policy |
| Who We Are | |
| Who is providing this notice? | Emerald Banking and Finance Fund, Emerald Growth Fund, Emerald Insights Fund and Emerald Small Cap Value Fund |
| What We Do | |
| How do the Funds protect my personal information? | To protect your personal information from unauthorized access and use, we use security measures that comply with federal law. These measures include computer safeguards and secured files and buildings. |
| How do the Funds collect my personal information? | We collect your personal information, for example, when you ● open an account ● provide account information or give us your contact information ● make a wire transfer or deposit money |
| Why can’t I limit all sharing? | Federal law gives you the right to limit only ● sharing for affiliates’ everyday business purposes-information about your creditworthiness ● affiliates from using your information to market to you ● sharing for non-affiliates to market to you State laws and individual companies may give you additional rights to limit sharing. |
| Definitions | |
| Affiliates | Companies related by common ownership or control. They can be financial and nonfinancial companies. |
| Non-affiliates | Companies not related by common ownership or control. They can be financial and nonfinancial companies. ● The Funds do not share with non-affiliates so they can market to you. |
| Joint marketing | A formal agreement between non-affiliated financial companies that together market financial products or services to you. ● The Funds do not jointly market. |
| Other Important Information | |
| California residents | If your account has a California home address, your personal information will not be disclosed to nonaffiliated third parties except as permitted by applicable California law, and we will limit sharing such personal information with our affiliates to comply with California privacy laws that apply to us. |
| Vermont residents | The State of Vermont requires financial institutions to obtain your consent prior to sharing personal information that they collect about you with affiliated companies and nonaffiliated third parties other than in certain limited circumstances. Except as permitted by law, we will not share personal information we collect about you with nonaffiliated third parties or other affiliated companies unless you provide us with your written consent to share such information. |
| 74 | www.emeraldmutualfunds.com |
| Emerald Funds | Privacy Policy |
| FACTS | WHAT DO THE FUNDS DO WITH YOUR PERSONAL INFORMATION? |
| WHY? | Financial companies choose how they share your personal information. Federal law gives consumers the right to limit some but not all sharing. Federal law also requires us to tell you how we collect, share, and protect your personal information. Please read this notice carefully to understand what we do. |
| WHAT? | The types of personal information we collect and share depend on the product or service you have with us. This information can include: ● Social Security number and account transactions ● Account balances and transaction history ● Wire transfer instructions |
| HOW? | All financial companies need to share customers’ personal information to run their everyday business. In the section below, we list the reasons financial companies can share their customers’ personal information; the reasons the Funds choose to share; and whether you can limit this sharing. |
| Reasons we can share your personal information | Do the funds share: | Can you limit this sharing? |
For our everyday business purposes – such as to process your transactions, maintain your account(s), respond to court orders and legal investigations, or report to credit bureaus | Yes | No |
For our marketing purposes – to offer our products and services to you | No | We do not share. |
| For joint marketing with other financial companies | No | We do not share. |
For our affiliates’ everyday business purposes – information about your transactions and experiences | Yes | No |
For our affiliates’ everyday business purposes – information about your creditworthiness | No | We do not share. |
| For non-affiliates to market to you | No | We do not share. |
| Annual Report | April 30, 2018 | 75 |


TABLE OF CONTENTS
| Shareholder Letter | 1 |
| Performance Update | 5 |
| Disclosure of Fund Expenses | 26 |
| Portfolio of Investments | |
| Grandeur Peak Emerging Markets Opportunities Fund | 28 |
| Grandeur Peak Global Micro Cap Fund | 32 |
| Grandeur Peak Global Opportunities Fund | 36 |
| Grandeur Peak Global Reach Fund | 41 |
| Grandeur Peak Global Stalwarts Fund | 47 |
| Grandeur Peak International Opportunities Fund | 50 |
| Grandeur Peak International Stalwarts Fund | 54 |
| Statements of Assets and Liabilities | 57 |
| Statements of Operations | 59 |
| Statements of Changes in Net Assets | |
| Grandeur Peak Emerging Markets Opportunities Fund | 61 |
| Grandeur Peak Global Micro Cap Fund | 62 |
| Grandeur Peak Global Opportunities Fund | 63 |
| Grandeur Peak Global Reach Fund | 64 |
| Grandeur Peak Global Stalwarts Fund | 65 |
| Grandeur Peak International Opportunities Fund | 66 |
| Grandeur Peak International Stalwarts Fund | 67 |
| Financial Highlights | |
| Grandeur Peak Emerging Markets Opportunities Fund | 68 |
| Grandeur Peak Global Micro Cap Fund | 70 |
| Grandeur Peak Global Opportunities Fund | 71 |
| Grandeur Peak Global Reach Fund | 73 |
| Grandeur Peak Global Stalwarts Fund | 75 |
| Grandeur Peak International Opportunities Fund | 77 |
| Grandeur Peak International Stalwarts Fund | 79 |
| Notes to Financial Statements | 81 |
| Report of Independent Registered Public Accounting Firm | 94 |
| Additional Information | 96 |
| Trustees and Officers | 98 |
| Privacy Policy | 103 |
| Grandeur Peak Funds® | Shareholder Letter |
April 30, 2018 (Unaudited)
Dear Fellow Shareholders,
We continue to be pleased with both the sustained maturation of our research team and the process improvements we’re making, which allow us to better screen and analyze the large investible universe, and connect global dots. We are super passionate about global dot connecting. Global dot connecting is the deep comprehension that helps give us a fuller understanding of a company’s sustainable competitive advantage + business model + headroom to grow. We gain that comprehension by comparing, contrasting, and seeking to understand the companies with which it competes, or even resembles, globally, as well as its often global customer base and global supply chain.
When we think of the power and beauty of global dot connecting, we are reminded of a favorite story by the famed physicist, Richard Feynman:
“I have a friend who’s an artist and has sometimes taken a view which I don’t agree with very well. He’ll hold up a flower and say ‘look how beautiful it is,’ and I’ll agree. Then he says ‘I as an artist can see how beautiful this is but you as a scientist take this all apart and it becomes a dull thing,’ and I think that he’s kind of nutty. First of all, the beauty that he sees is available to other people and to me too, I believe, although I might not be quite as refined aesthetically as he is, I can appreciate the beauty of a flower.
At the same time, I see much more about the flower than he sees. I could imagine the cells in there, the complicated actions inside, which also have a beauty. I mean it’s not just beauty at this dimension, at one centimeter; there’s also beauty at smaller dimensions, the inner structure, also the processes. The fact that the colors in the flower evolved in order to attract insects to pollinate it is interesting; it means that insects can see the color. It adds a question: does this aesthetic sense also exist in the lower forms? Why is it aesthetic? All kinds of interesting questions which a science knowledge only adds to the excitement, the mystery and the awe of a flower. It only adds. I don’t understand how it subtracts.” (BBC Documentary “The Pleasure of Finding Things Out”. 1981, Christopher Sykes)
There are many parallels between this story and investing, not the least of which is our belief that investing is half art and half science. We are striving to take the best of both of those worlds at Grandeur Peak and find a happy medium between the two such that the limitations of each can be overcome and the benefits of each obtained. We believe we’re better investors by combining both, as we see so much more than what is perhaps on the surface using just one medium, be it art (common-sense investing) or science (quantitative).
But the bigger analogy has to do with how country-specific managers (whom we most often compete against for ideas in a given market) view the world. Blake recently spoke with two such PMs running country funds, one in the US and the other in China, who echoed the artist in the story above—they asked Blake why he would bother picking apart a given idea through a global lens instead of simply appreciating the beauty of the investment opportunity in its immediate landscape? To both, it felt like we were doing too much work. They believed they could grasp the general investing thesis without having to put forth such an effort, and to undertake such work would be lifestyle altering—this literally came up as a point in the conversation. We can’t understand that attitude, or how a PM could get comfortable enough with an idea to make it a meaningful positon in their portfolio without fully understanding the global landscape in which the company operates. It is this depth of knowledge that also gives us confidence to take advantage of volatility and buy up in what we believe are great companies when other investors may be panicking.
The really exciting part of global investing—of connecting global dots—is the clearer vision you get to be able see things as they really are. It’s being able to discern the investment reality of a given idea on a deeper level than you could have ever before imagined. You can see the beauty of a company and its competitive advantage at smaller (yet meaningful and material) dimensions, which increases your confidence in the idea and the potential, realistic return. This process only adds to, and subtracts nothing, from an investor. It may be cliché to talk about putting together the global mosaic on a very grassroots level by connecting one company-specific dot after another, and then diligently maintaining all of those dots via a database and watch lists, but this is what we seek to do at Grandeur Peak.
Fund Performance & Attribution
For more in-depth analysis of each Fund, please see the latest quarterly letter and/or individual Fund pages on our website at www.grandeurpeakglobal.com. After healthy absolute returns a year ago, the global markets continued to provide strong returns over the past twelve months, despite a cooling off so far in 2018.
Emerging Markets Opportunities: For the year, the Institutional share class returned 13.24% vs 17.55% for the benchmark. Sectors of strength in the Fund were Financials and Consumer Staples, while the largest detractors were Consumer Discretionary, Real Estate, and Industrials. The Fund was most notably hurt by less liquid holdings in Asia. On average the Fund held about 4% cash, which was a drag on performance in the continuing bull market. As we announced last quarter, we’ve decided to improve the liquidity profile of the Emerging Markets portfolio, and with the recent jump in market volatility we were able to make some shifts in the composition of the portfolio.
Past performance does not guarantee future results.
| Annual Report | April 30, 2018 | 1 |
| Grandeur Peak Funds® | Shareholder Letter |
April 30, 2018 (Unaudited)
Global Micro Cap: For the year, the Fund returned 17.68% vs 15.28% for the benchmark. Sectors of particular strength in the Fund were Technology, Consumer, and Financials, while the largest portfolio detractor was Real Estate. The Fund outperformed in the major regions, but lagged in Eastern Europe and Central Asia. Global economic growth feels moderate and we continue to find great ideas outside of the US, leading to an overweight in Emerging Markets that is likely to continue. We feel challenged in finding reasonably priced companies in the US micro-cap space, but we continue to look. Meanwhile, we are seeing strong and improving fundamentals in our holdings in other developed markets, especially Japan, United Kingdom, France and Sweden. We are also benefiting from volatility returning to the markets, making our Watch-A names more attractive. Maintaining a long Watch-A list is a team-based effort—we work together to vet high quality names that we would like to own, but which are simply too expensive at the moment.
Global Opportunities/International Opportunities: For the year, the Global Opportunities Institutional share class returned 18.62% vs 15.28% for the benchmark, and the International Opportunities Institutional share class returned 19.38% vs 17.95% for the benchmark. With respect to both Funds, the big contributing sectors were Technology and Financials, with the largest negative contribution coming from Materials. Both Funds outperformed in every region except Africa/Middle East. On the margin, we believe we used the recent market volatility to our advantage in rounding up in high quality names that were previously too expensive. We also exited names which were not as compelling at inflated prices. High quality names generally feel fully priced to us. Looking forward, we see so many ways we can continue to improve: better using our assessments of quality/value/momentum, listening to multiple minds and saluting the negative voice, weighting our portfolios to get more from our winners and better managing risk through controlled position size. We know we are often hard on ourselves, but we hold ourselves to a very high standard and are committed to continuous improvement.
Global Reach: For the year, the Institutional share class returned 18.69% vs 15.28% for the benchmark. Sectors of particular strength in the Fund were Financials and Technology. Our underperformance in Materials was a detractor. The Fund did well across geographies, with the only negative contribution coming from Asia. As of January 1st, we merged our Energy & Materials team with our Industrials team, so now the Fund is managed by five industry teams instead of six. These five teams still cover all stocks in the investable universe. The E&M and Industrials teams had found themselves working very closely together, and as you likely know, we are almost systemically underweight E&M given our investment approach. As such, it made sense to collapse these teams. The combined team will continue to screen all E&M names.
Global Stalwarts/International Stalwarts: For the year, the Global Stalwarts Institutional share class returned 20.05% vs 14.80% for the benchmark, and the International Stalwarts Institutional share class returned 20.79% vs 17.09% for the benchmark. With respect to both Funds, the big contributing sectors were Industrials and Financials, with the largest negative contribution coming from Materials. Both Funds did well across regions, with the only negative contribution coming from Africa/Middle East. As you know, we maintain a long list of Watch-A names and the recent market volatility gave us the chance to buy some high quality names. We also rounded up on some of our favorite owned names. It’s hard to say how much runway is left for stocks in the near term, but our strategy remains the same: to opportunistically add quality and defensiveness to the portfolio while incrementally selling our lower conviction holdings. Taking profits in big winners is also prudent to both controlling position size and managing risk. We’ve incrementally raised our positions in banking and energy as the opportunities from a rising interest rate and improving energy outlook has made some of our companies look more attractive on a fundamental basis.
Past performance does not guarantee future results.
Notes from the Road
Our team continues to travel throughout the world visiting companies, but last month we also had an incredible opportunity to travel to Ecuador with our spouses for a humanitarian project. Grandeur Peak Global Advisors partnered with Choice Humanitarian, an organization working to end global poverty. We joined with villagers in Cotacachi County, Ecuador in building a vocational school to provide access to technical training for the 1,500 students in the region. The work site is situated in the Intacara Valley and is susceptible to generous rainfall. Our teams worked to install a drainage canal around the school site by digging trenches, moving rocks, mixing, hauling and pouring cement and bending rebar for the forms. The school is scheduled to be completed in June 2019. We invited Bree Nielson and Riley Babbitt, both spouses of Grandeur Peak employees, to share their experiences.
By Bree Nielson, married to Dane Nielson, a research intern. Bree and Dane were part of Week 1 of our expedition.
While at home in Utah, I juggle multiple jobs, none of which demand the caliber of manual labor quite like our week in Ecuador. On weekdays, I teach 9th grade Biology to students whom I adore, yet want to lock up in a juvenile detention sometimes. On the weekends, I unwind as a respiratory therapist with all ages, but my favorite is being with the NICU babies. Dane and I have been married for a whopping 10 months now and going to Ecuador was our first big trip together. What could be better than a sharing a belated honeymoon/humanitarian trip down in the dirt and grime with your husband’s coworkers? To be honest, this trip was exactly the kind of fulfilling vacation Dane and I have dreamt about.
Ecuador was anything but relaxing as we worked side by side with the Indigenous people of Ecuador to build up a vocational school for their rising generation. The invitation to join my spouse in his company’s humanitarian trip was a pleasant surprise. As a newcomer to the Grandeur Peak family,
| 2 | 1.855.377.7325 | www.GrandeurPeakGlobal.com |
| Grandeur Peak Funds® | Shareholder Letter |
April 30, 2018 (Unaudited)
I’m glad that I got to meet everyone in our group at the Salt Lake City airport, having had a fresh morning shower – which was more pleasant than our group appeared at the end of the trip. Unfortunately, I went the “pack light” route and could have used a few more sets of clean clothes. But, there’s nothing quite like getting to know your spouse’s co-workers better than being sweaty and stinky together!
It wasn’t the sun being closer to the earth that made our welcome to the village of Pucará so warm, but the wonderful villagers who delightfully greeted us with their beautiful music, flowers and smiles. Our Ecuador Mamá took us into her home, which she graciously shared with us for the week. She spoke no English, and we spoke no Spanish. Problema? ¡No! I discovered that communication was not easy verbally, but there was no barrier to the love we shared with our new Ecuadorian friends and family. We got to know our sweet hostess throughout the week and discovered how self-sustaining she is. To start, she took in 4 nephews to raise up as her own when their mother left them. Her home is also situated on a sugar cane farm. She and her brothers are essential in the process of making sugar, an occupation that helps to sustain the family. What an exceptional woman she is, full of love, dedication, and certainly not afraid to get down and dirty with the boys.
Being a part of the building of a new vocational school was more than just pouring concrete and digging holes. It was a way to share laughter, hard work, and cultural experiences with one another. Turns out, we are not so different after all. We left behind a group of admirable Ecuadorian people, but went home with a work family bonded together in ways the walls of an office cannot do.
From Riley Babbitt, wife of Keefer Babbitt, a research analyst. Riley and Keefer were part of Week 2 of our expedition.
Though our welcome into the village of Pucará was a rainy one, our host family’s warmth made us feel right at home. Our mom, Alicia, and her daughter, Jessica, were incredibly thoughtful, kind, and patient as my husband and I navigated talking with little to no Spanish vocabulary. One of my favorite moments with Alicia was sitting out on her doorstep enjoying freshly-made empanadas and overlooking the misty mountains as I pet her dog, Thomas. The way of life in the village of Pucará is humble, yet beautiful and interconnected to the world and people who reside there.
The locals amazed me in many ways. For one, they were all incredibly willing to help their neighbor or community. Some who helped us at the vocational center, traveled over an hour just so they could help out! Another point of amazement was the widespread warmth of welcoming that I had felt immediately with our host family. All of the Ecuadorians at the work site were just as patient, if not more, with my attempts at Spanish conversations as Alicia, our host. However, I was most amazed at the Ecuadorians’ work ethic: they could race us up a hill with a full wheelbarrow and they would be at the top smiling at us as we were still wallowing with our own wheelbarrow in the mud. Turns out, a bunch of office-dwelling workers and their spouses aren’t as acclimated to the work of building a rural vocational center as the local Ecuadorians!
It’s difficult to summarize and explain the feelings I encountered on our trip to Ecuador, but the experiences we shared there have impacted my life at home immensely. Seeing the villagers so interconnected with not just their families, but also their friends and neighbors has encouraged me to reach out to my own friends and family more often. I also relished our group’s mealtimes and activities because everyone was openly conversing with each other and I was able to learn about the lives of many of my husband’s coworkers. Without the distractions of work, cellphones, and other obligations, this trip was the perfect opportunity to tune into what life should truly feel like: light, enjoyable, and filled with genuine connections to the people that surround you.
Business Update
This July will mark our 7th anniversary as a firm. We are very grateful to you for your trust and confidence in our team. Every day – whether it be in the office in Salt Lake City, or in some other part of the world where we are researching companies, expanding our global network, or visiting clients – we are mindful of the responsibility that we have to you and your financial goals.
Tomorrow, May 1st, also marks the first anniversary of the debut product launch from our joint venture with Laura Geritz and Rondure Global Advisors. We began this partnership with high hopes for what a collaboration with Laura and her team could bring to our research efforts, and we have not been disappointed. The collaboration has been impactful and we’re very grateful for the experience and skills the Rondure team adds to the mix. As we announced a few months ago, Zach Larkin has moved from Grandeur Peak to the Rondure team (although he is still sitting in the very same desk he has been for the past few years), which gives Rondure additional depth, but also allows for a more concentrated focus on frontier markets to benefit both firms.
We continue to see inflows into our two open Stalwarts strategies, which are now up to just over $1.2 million in AUM. As a firm we are managing roughly $4.1 billion in assets.
| Annual Report | April 30, 2018 | 3 |
| Grandeur Peak Funds® | Shareholder Letter |
April 30, 2018 (Unaudited)
As always, please feel free to reach out any time with any questions, requests or comments. We appreciate and enjoy our relationship with you and continue to work hard on your behalf.
Sincerely,
Robert Gardiner, CFA
Chairman & Portfolio Manager
Blake Walker
CEO & Portfolio Manager
Randy Pearce, CFA, MBA
CIO & Portfolio Manager
RISKS: Mutual fund investing involves risks and loss of principal is possible. Investing in small and micro-cap funds will be more volatile and loss of principal could be greater than investing in large cap or more diversified funds. Investing in foreign securities entails special risks, such as currency fluctuations and political uncertainties, which are described in more detail in the prospectus. Investments in emerging markets are subject to the same risks as other foreign securities and may be subject to greater risks than investments in foreign countries with more established economies and securities markets.
An investor should consider investment objectives, risks, charges, and expenses carefully before investing. To obtain a Grandeur Peak Funds prospectus, containing this and other information, visit www.grandeurpeakglobal.com or call 1-855-377-PEAK (7325). Please read it carefully before investing.
The views and information discussed in this commentary are as of the date of publication, are subject to change, and may not reflect the writer’s current views. The views expressed represent an assessment of market conditions at a specific point in time, are opinions only and should not be relied upon as investment advice regarding a particular investment or markets in general. Such information does not constitute a recommendation to buy or sell specific securities or investment vehicles. It should not be assumed that any investment will be profitable or will equal the performance of the Funds or any securities or any sectors mentioned herein. The subject matter contained herein has been derived from several sources believed to be reliable and accurate at the time of compilation. The Funds do not accept any liability for losses either direct or consequential caused by the use of this information.
Past performance does not guarantee future results.
ALPS Distributors, Inc. is the Distributor for the Grandeur Peak Funds.
| 4 | 1.855.377.7325 | www.GrandeurPeakGlobal.com |
| Grandeur Peak Emerging Markets Opportunities Fund | Performance Update |
April 30, 2018 (Unaudited)
Annualized Total Return Performance for the periods ended April 30, 2018
| | 6 Months | 1 Year | 3 Year | Since Inception(a) | Expense Ratio(b) |
| Gross | Net(c) |
| Grandeur Peak Emerging Markets Opportunities Fund – Investor (GPEOX) | 5.84% | 12.99% | 5.65% | 7.85% | 1.80% | 1.80% |
| Grandeur Peak Emerging Markets Opportunities Fund – Institutional (GPEIX) | 6.02% | 13.24% | 5.90% | 8.09% | 1.50% | 1.50% |
| Russell Emerging Markets Small Cap Index(d) | 6.22% | 17.55% | 4.65% | 6.07% | | |
Performance data quoted represents past performance. Past performance does not guarantee future results. Investment return and principal value of an investment will fluctuate so that an investor’s shares, when sold or redeemed, may be worth more or less than the original cost. The Fund imposes a 2.00% redemption fee on shares held for less than 60 days. Current performance data may be higher or lower than actual data quoted. For the most current month-end performance data, please call 1-855-377-PEAK (7325).
The table does not reflect the deduction of taxes a shareholder would pay on Fund distributions or redemption of Fund shares.
Subject to investment risks, including possible loss of the principal amount invested.
Returns for periods less than 1 year are cumulative.
| (a) | Fund inception date of December 16, 2013. |
| (b) | Ratios as of the Prospectus dated August 31, 2017 and may differ from the ratios presented in the Financial Highlights. |
| (c) | Grandeur Peak Global Advisors, LLC (the “Adviser”), has agreed to waive and/or reimburse fees or expenses in order to limit Total Annual Fund Operating Expenses After Fee Waiver/Expense Reimbursement (excluding acquired fund fees and expenses, brokerage expenses, interest expenses, taxes and extraordinary expenses) to 1.95% and 1.70% of the Fund’s average daily net assets for the Fund’s Investor Class Shares and Institutional Class Shares, respectively. This agreement (the “Expense Agreement”) is in effect through August 31, 2018. The Adviser will be permitted to recover, on a class- by-class basis, expenses it has borne through the Expense Agreement to the extent that a Fund’s expenses in later periods fall below annual rates set forth in the Expense Agreement; provided, however, that such recapture payments do not cause the Fund’s expense ratio (after recapture) to exceed the lesser of (i) the expense cap in effect at the time of the waiver and (ii) the expense cap in effect at the time of the recapture. Notwithstanding the foregoing, the Fund will not be obligated to pay any such deferred fees and expenses more than three years after the date on which the fee and expenses was deferred. The Expense Agreement may not be terminated or modified prior to August 31, 2018 except with the approval of the Fund’s Board of Trustees. |
| (d) | The Russell Emerging Markets Small Cap Index seeks to measure the performance of the small-cap equity universe of emerging countries. The Index is not actively managed and does not reflect any deductions for fees, expense, or taxes. An investor may not invest directly in the Index. |
| Annual Report | April 30, 2018 | 5 |
| Grandeur Peak Emerging Markets Opportunities Fund | Performance Update |
April 30, 2018 (Unaudited)
Growth of $10,000 for the period ended April 30, 2018
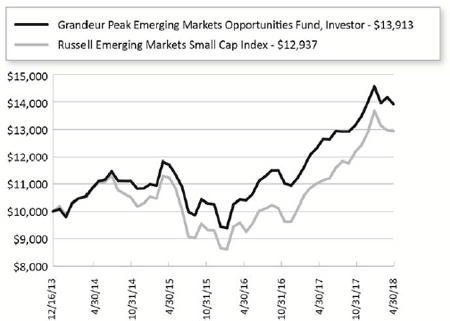
The chart shown above represent a hypothetical investment of $10,000 in the Fund’s Investor Class shares for the period from inception to April 30, 2018. All returns reflect reinvested dividends, but do not reflect the deduction of taxes that an investor would pay on distributions or redemptions.
Investing in the Fund is subject to investment risks, including possible loss of the principal amount invested.
The Fund also offers Institutional Class shares, performance for which is not reflected in the graphs above. The performance of Institutional Class shares may be higher or lower than the performance of the Investor Class shares shown in the graphs above based upon differences in fees paid by shareholders investing in the Investor Class shares and Institutional Class shares.
| 6 | 1.855.377.7325 | www.GrandeurPeakGlobal.com |
| Grandeur Peak Emerging Markets Opportunities Fund | Performance Update |
April 30, 2018 (Unaudited)
| Regional Allocation (as a % of Net Assets)* | |
| Asia ex Japan | 64.5% |
| Africa/Middle East | 9.0% |
| Latin America | 8.7% |
| Europe | 7.6% |
| North America | 4.5% |
| Cash, Cash Equivalents, & Other Net Assets | 5.7% |
| Total | 100.0% |
| Industry Sector Allocation (as a % of Net Assets)* | |
| Consumer | 25.7% |
| Financials | 21.4% |
| Technology | 19.6% |
| Health Care | 12.4% |
| Industrials | 9.6% |
| Energy & Materials | 5.6% |
| Cash, Cash Equivalents, & Other Net Assets | 5.7% |
| Total | 100.0% |
| Top 10 Holdings (as a % of Net Assets)* | |
| China Medical System Holdings, Ltd. | 2.9% |
| FirstCash, Inc. | 2.0% |
| Value Partners Group, Ltd. | 1.8% |
| WNS Holdings, Ltd. | 1.6% |
| Silergy Corp. | 1.6% |
| Dino Polska SA | 1.4% |
| Security Bank Corp. | 1.4% |
| Parex Resources, Inc. | 1.3% |
| Cyient, Ltd. | 1.3% |
| Man Wah Holdings, Ltd. | 1.2% |
| Total | 16.5% |
| * | Holdings are subject to change, and may not reflect the current or future position of the portfolio. |
| Annual Report | April 30, 2018 | 7 |
| Grandeur Peak Global Micro Cap Fund | Performance Update |
April 30, 2018 (Unaudited)
Annualized Total Return Performance for the periods ended April 30, 2018
| | 6 Months | 1 Year | Since Inception(a) | Expense Ratio(b) |
| Gross | Net(c) |
| Grandeur Peak Global MicroCap – Institutional (GPMCX) | 4.12% | 17.68% | 15.09% | 2.08% | 2.00% |
| Russell Global Small Cap Index(d) | 4.50% | 15.28% | 13.46% | | |
Performance data quoted represents past performance. Past performance does not guarantee future results. Investment return and principal value of an investment will fluctuate so that an investor’s shares, when sold or redeemed, may be worth more or less than the original cost. The Fund imposes a 2.00% redemption fee on shares held for less than 60 days. Current performance data may be higher or lower than actual data quoted. For the most current month-end performance data, please call 1-855-377-PEAK (7325).
The table does not reflect the deduction of taxes a shareholder would pay on Fund distributions or redemption of Fund shares.
Subject to investment risks, including possible loss of the principal amount invested.
Returns for periods less than 1 year are cumulative.
| (a) | Fund inception date of October 20, 2015. |
| (b) | Ratios as of the Prospectus dated August 31, 2017 and may differ from the ratios presented in the Financial Highlights. |
| (c) | Grandeur Peak Global Advisors, LLC (the “Adviser”), has agreed to waive and/or reimburse fees or expenses in order to limit Total Annual Fund Operating Expenses After Fee Waiver/ Expense Reimbursement (excluding acquired fund fees and expenses, brokerage expenses, interest expenses, taxes and extraordinary expenses) to 2.00% of the Fund’s average daily net assets for the Fund’s Institutional Class Shares. This agreement is in effect through August 31, 2018. The Adviser will be permitted to recover expenses it has borne through this agreement to the extent that a Fund’s expenses in later periods fall below annual rates set forth in the Expense Agreement; provided, however, that such recapture payments do not cause the Fund’s expense ratio (after recapture) to exceed the lesser of (i) the expense cap in effect at the time of the waiver and (ii) the expense cap in effect at the time of the recapture. Notwithstanding the foregoing, the Fund will not be obligated to pay any such deferred fees and expenses more than three years after the date on which the fee and expenses was deferred . This agreement may not be terminated or modified prior to August 31, 2018 except with the approval of the Fund’s Board of Trustees. |
| (d) | The Russell Global Small Cap Index seeks to measure the performance of the small-cap segment of the global equity universe. The Index is not actively managed and does not reflect any deductions for fees, expenses, or taxes. An investor may not invest directly in the Index. |
| 8 | 1.855.377.7325 | www.GrandeurPeakGlobal.com |
| Grandeur Peak Global Micro Cap Fund | Performance Update |
April 30, 2018 (Unaudited)
Growth of $10,000 for the period ended April 30, 2018
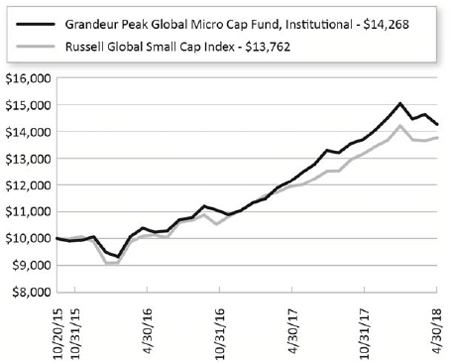
The chart shown above represent a hypothetical investment of $10,000 in the Fund’s Institutional Class shares for the period from inception to April 30, 2018. All returns reflect reinvested dividends, but do not reflect the deduction of taxes that an investor would pay on distributions or redemptions.
Investing in the Fund is subject to investment risks, including possible loss of the principal amount invested.
| Annual Report | April 30, 2018 | 9 |
| Grandeur Peak Global Micro Cap Fund | Performance Update |
April 30, 2018 (Unaudited)
| Regional Allocation (as a % of Net Assets)* | |
| Asia ex Japan | 29.8% |
| Europe | 27.4% |
| North America | 15.3% |
| Japan | 13.9% |
| Australia/New Zealand | 7.7% |
| Africa/Middle East | 2.5% |
| Latin America | 1.2% |
| Cash, Cash Equivalents, & Other Net Assets | 2.2% |
| Total | 100.0% |
| Industry Sector Allocation (as a % of Net Assets)* | |
| Financials | 24.9% |
| Consumer | 20.2% |
| Technology | 19.9% |
| Industrials | 15.7% |
| Health Care | 11.9% |
| Energy & Materials | 5.2% |
| Cash, Cash Equivalents, & Other Net Assets | 2.2% |
| Total | 100.0% |
| Top 10 Holdings (as a % of Net Assets)* | |
| M&A Capital Partners Co., Ltd. | 2.4% |
| Heska Corp. | 2.0% |
| Fiducian Group, Ltd. | 1.9% |
| Esquire Financial Holdings, Inc. | 1.9% |
| BBI Life Sciences Corp. | 1.5% |
| Plover Bay Technologies, Ltd. | 1.4% |
| Byke Hospitality, Ltd. | 1.3% |
| Hingham Institution for Savings | 1.3% |
| LoopUp Group PLC | 1.3% |
| Pryce Corp. | 1.3% |
| Total | 16.3% |
| * | Holdings are subject to change, and may not reflect the current or future position of the portfolio. |
| 10 | 1.855.377.7325 | www.GrandeurPeakGlobal.com |
| Grandeur Peak Global Opportunities Fund | Performance Update |
April 30, 2018 (Unaudited)
Annualized Total Return Performance for the periods ended April 30, 2018
| | 6 Months | 1 Year | 3 Years | 5 Years | Since Inception(a) | Expense Ratio(b) |
| Gross | Net(c) |
| Grandeur Peak Global Opportunities Fund – Investor (GPGOX) | 4.46% | 18.41% | 9.61% | 12.70% | 15.53% | 1.62% | 1.62% |
| Grandeur Peak Global Opportunities Fund – Institutional (GPGIX) | 4.78% | 18.62% | 9.86% | 12.95% | 15.87% | 1.37% | 1.37% |
| Russell Global Small Cap Index(d) | 4.50% | 15.28% | 8.89% | 9.31% | 11.45% | | |
| Russell Global Index(e) | 3.92% | 14.78% | 8.20% | 9.60% | 11.63% | | |
Performance data quoted represents past performance. Past performance does not guarantee future results. Investment return and principal value of an investment will fluctuate so that an investor’s shares, when sold or redeemed, may be worth more or less than the original cost. The Fund imposes a 2.00% redemption fee on shares held for less than 60 days. Current performance data may be higher or lower than actual data quoted. For the most current month-end performance data, please call 1-855-377-PEAK (7325).
The table does not reflect the deduction of taxes a shareholder would pay on Fund distributions or redemption of Fund shares.
Subject to investment risks, including possible loss of the principal amount invested.
Returns for periods less than 1 year are cumulative.
| (a) | Fund inception date of October 17, 2011. |
| (b) | Ratios as of the Prospectus dated August 31, 2017 and may differ from the ratios presented in the Financial Highlights. |
| (c) | Grandeur Peak Global Advisors, LLC (the “Adviser”), has agreed to waive and/or reimburse fees or expenses in order to limit Total Annual Fund Operating Expenses After Fee Waiver/ Expense Reimbursement (excluding acquired fund fees and expenses, brokerage expenses, interest expenses, taxes and extraordinary expenses) to 1.75% and 1.50% of the Fund’s average daily net assets for the Fund’s Investor Class Shares and Institutional Class Shares, respectively. This agreement (the “Expense Agreement”) is in effect through August 31, 2018. The Adviser will be permitted to recover, on a class- by-class basis, expenses it has borne the Expense Agreement to the extent that a Fund’s expenses in later periods fall below annual rates set forth in the Expense Agreement; provided, however, that such recapture payments do not cause the Fund’s expense ratio (after recapture) to exceed the lesser of (i) the expense cap in effect at the time of the waiver and (ii) the expense cap in effect at the time of the recapture . Notwithstanding the foregoing, the Fund will not be obligated to pay any such deferred fees and expenses more than three years after the date on which the fee and expenses was deferred. The Expense Agreement may not be terminated or modified prior to August 31, 2018 except with the approval of the Fund’s Board of Trustees. |
| (d) | The Russell Global Small Cap Index seeks to measure the performance of the small-cap segment of the global equity universe. The Index is not actively managed and does not reflect any deductions for fees, expense, or taxes. An investor may not invest directly in the Index. |
| (e) | The Russell Global Index is an additional index, and seeks to measure the performance of the global equity universe. The Index is not actively managed and does not reflect any deductions for fees, expense, or taxes. An investor may not invest directly in the Index. |
| Annual Report | April 30, 2018 | 11 |
| Grandeur Peak Global Opportunities Fund | Performance Update |
April 30, 2018 (Unaudited)
Growth of $10,000 for the period ended April 30, 2018
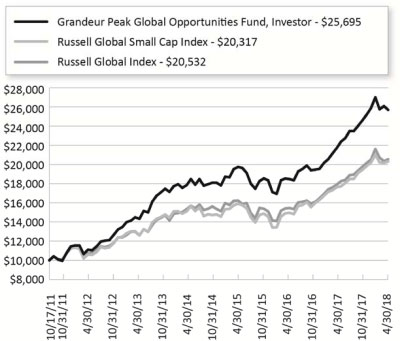
The chart shown above represent a hypothetical investment of $10,000 in the Fund’s Investor Class shares for the period from inception to April 30, 2018. All returns reflect reinvested dividends, but do not reflect the deduction of taxes that an investor would pay on distributions or redemptions.
Investing in the Fund is subject to investment risks, including possible loss of the principal amount invested.
The Fund also offers Institutional Class shares, performance for which is not reflected in the graphs above. The performance of Institutional Class shares may be higher or lower than the performance of the Investor Class shares shown in the graphs above based upon differences in fees paid by shareholders investing in the Investor Class shares and Institutional Class shares.
| 12 | 1.855.377.7325 | www.GrandeurPeakGlobal.com |
| Grandeur Peak Global Opportunities Fund | Performance Update |
April 30, 2018 (Unaudited)
| Regional Allocation (as a % of Net Assets)* | |
| North America | 33.7% |
| Europe | 28.3% |
| Asia ex Japan | 23.7% |
| Japan | 8.1% |
| Latin America | 2.9% |
| Africa/Middle East | 2.1% |
| Australia/New Zealand | 2.0% |
| Cash, Cash Equivalents, & Other Net Assets | -0.8% |
| Total | 100.0% |
| Industry Sector Allocation (as a % of Net Assets)* | |
| Financials | 27.5% |
| Industrials | 22.3% |
| Technology | 18.1% |
| Consumer | 18.1% |
| Health Care | 10.9% |
| Energy & Materials | 3.9% |
| Cash, Cash Equivalents, & Other Net Assets | -0.8% |
| Total | 100.0% |
| Top 10 Holdings (as a % of Net Assets)* | |
| Knight-Swift Transportation Holdings, Inc. | 2.2% |
| FirstCash, Inc. | 2.0% |
| Power Integrations, Inc. | 1.8% |
| Man Wah Holdings, Ltd. | 1.3% |
| Home BancShares, Inc. | 1.2% |
| First Republic Bank | 1.1% |
| EPAM Systems, Inc. | 1.1% |
| China Medical System Holdings, Ltd. | 1.1% |
| Palfinger AG | 1.0% |
| SVB Financial Group | 1.0% |
| Total | 13.8% |
| * | Holdings are subject to change, and may not reflect the current or future position of the portfolio. |
| Annual Report | April 30, 2018 | 13 |
| Grandeur Peak Global Reach Fund | Performance Update |
April 30, 2018 (Unaudited)
Annualized Total Return Performance for the periods ended April 30, 2018
| | | | | | Expense Ratio(b) |
| | 6 Months | 1 Year | 3 Years | Since Inception(a) | Gross | Net(c) |
| Grandeur Peak Global Reach Fund – Investor (GPROX) | 6.61% | 18.44% | 9.38% | 13.13% | 1.54% | 1.54% |
| Grandeur Peak Global Reach Fund – Institutional (GPRIX) | 6.73% | 18.69% | 9.64% | 13.38% | 1.29% | 1.29% |
| Russell Global Small Cap Index(d) | 4.50% | 15.28% | 8.89% | 9.72% | | |
| Russell Global Index(e) | 3.92% | 14.78% | 8.20% | 9.98% | | |
Performance data quoted represents past performance. Past performance does not guarantee future results. Investment return and principal value of an investment will fluctuate so that an investor’s shares, when sold or redeemed, may be worth more or less than the original cost. The Fund imposes a 2.00% redemption fee on shares held for less than 60 days. Current performance data may be higher or lower than actual data quoted. For the most current month-end performance data, please call 1-855-377-PEAK (7325).
The table does not reflect the deduction of taxes a shareholder would pay on Fund distributions or redemption of Fund shares.
Subject to investment risks, including possible loss of the principal amount invested.
Returns for periods less than 1 year are cumulative.
| (a) | Fund inception date of June 19, 2013. |
| (b) | Ratios as of the Prospectus dated August 31, 2017 and may differ from the ratios presented in the Financial Highlights. |
| (c) | Grandeur Peak Global Advisors, LLC (the “Adviser”), has agreed to waive and/or reimburse fees or expenses in order to limit Total Annual Fund Operating Expenses After Fee Waiver/Expense Reimbursement (excluding acquired fund fees and expenses, brokerage expenses, interest expenses, taxes and extraordinary expenses) to 1. 60% and 1.35% of the Fund’s average daily net assets for the Fund’s Investor Class Shares and Institutional Class Shares, respectively. This agreement (the “Expense Agreement”) is in effect through August 31, 2018. The Adviser will be permitted to recover, on a class- by-class basis, expenses it has borne through the Expense Agreement to the extent that a Fund’s expenses in later periods fall below annual rates set forth in the Expense Agreement; provided, however, that such recapture payments do not cause the Fund’s expense ratio (after recapture) to exceed the lesser of (i) the expense cap in effect at the time of the waiver and (ii) the expense cap in effect at the time of the recapture . Notwithstanding the foregoing, the Fund will not be obligated to pay any such deferred fees and expenses more than three years after the date on which the fee and expenses was deferred. The Expense Agreement may not be terminated or modified prior to August 31, 2018 except with the approval of the Fund’s Board of Trustees. |
| (d) | The Russell Global Small Cap Index seeks to measure the performance of the small-cap segment of the global equity universe. The Index is not actively managed and does not reflect any deductions for fees, expense, or taxes. An investor may not invest directly in the Index. |
| (e) | The Russell Global Index is an additional index, and seeks to measure the performance of the global equity universe. The Index is not actively managed and does not reflect any deductions for fees, expense, or taxes. An investor may not invest directly in the Index. |
| 14 | 1.855.377.7325 | www.GrandeurPeakGlobal.com |
| Grandeur Peak Global Reach Fund | Performance Update |
April 30, 2018 (Unaudited)
Growth of $10,000 for the period ended April 30, 2018
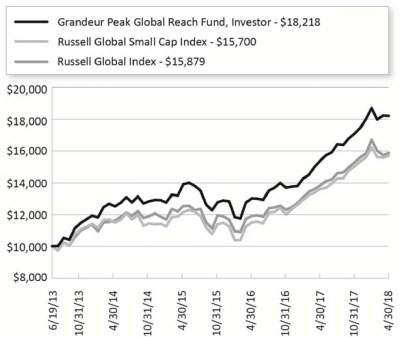
The chart shown above represent a hypothetical investment of $10,000 in the Fund’s Investor Class shares for the period from inception to April 30, 2018. All returns reflect reinvested dividends, but do not reflect the deduction of taxes that an investor would pay on distributions or redemptions.
Investing in the Fund is subject to investment risks, including possible loss of the principal amount invested.
The Fund also offers Institutional Class shares, performance for which is not reflected in the graphs above. The performance of Institutional Class shares may be higher or lower than the performance of the Investor Class shares shown in the graphs above based upon differences in fees paid by shareholders investing in the Investor Class shares and Institutional Class shares.
| Annual Report | April 30, 2018 | 15 |
| Grandeur Peak Global Reach Fund | Performance Update |
April 30, 2018 (Unaudited)
| Regional Allocation (as a % of Net Assets)* | |
| Europe | 30.1% |
| North America | 26.7% |
| Asia ex Japan | 25.3% |
| Japan | 6.5% |
| Africa/Middle East | 5.0% |
| Latin America | 3.7% |
| Australia/New Zealand | 3.2% |
| Cash, Cash Equivalents, & Other Net Assets | -0.5% |
| Total | 100.0% |
| Industry Sector Allocation (as a % of Net Assets)* | |
| Financials | 25.6% |
| Consumer | 20.6% |
| Technology | 19.4% |
| Industrials | 18.0% |
| Health Care | 12.0% |
| Energy & Materials | 4.9% |
| Cash, Cash Equivalents, & Other Net Assets | -0.5% |
| Total | 100.0% |
| Top 10 Holdings (as a % of Net Assets)* | |
| China Medical System Holdings, Ltd. | 1.3% |
| Wix.com, Ltd. | 1.3% |
| Dino Polska SA | 1.1% |
| Man Wah Holdings, Ltd. | 1.1% |
| WNS Holdings, Ltd. | 1.0% |
| SVB Financial Group | 1.0% |
| Wirecard AG | 0.9% |
| BBI Life Sciences Corp. | 0.8% |
| EPAM Systems, Inc. | 0.8% |
| Hamilton Lane, Inc. | 0.8% |
| Total | 10.1% |
| * | Holdings are subject to change, and may not reflect the current or future position of the portfolio. |
| 16 | 1.855.377.7325 | www.GrandeurPeakGlobal.com |
| Grandeur Peak Global Stalwarts Fund | Performance Update |
April 30, 2018 (Unaudited)
Annualized Total Return Performance for the periods ended April 30, 2018
| | | | | Expense Ratio(b) |
| | 6 Months | 1 Year | Since Inception(a) | Gross | Net(c) |
| Grandeur Peak Global Stalwarts – Investor (GGSOX) | 7.34% | 19.79% | 17.33% | 1.39% | 1.35% |
| Grandeur Peak Global Stalwarts – Institutional (GGSYX) | 7.45% | 20.05%(d) | 17.63% | 1.14% | 1.10% |
| Russell Global SMID Cap Index(e) | 4.34% | 14.80% | 13.85% | | |
| Russell Global Index(f) | 3.92% | 14.78% | 13.91% | | |
Performance data quoted represents past performance. Past performance does not guarantee future results. Investment return and principal value of an investment will fluctuate so that an investor’s shares, when sold or redeemed, may be worth more or less than the original cost. The Fund imposes a 2.00% redemption fee on shares held for less than 60 days. Current performance data may be higher or lower than actual data quoted. For the most current month-end performance data, please call 1-855-377-PEAK (7325).
The table does not reflect the deduction of taxes a shareholder would pay on Fund distributions or redemption of Fund shares.
Subject to investment risks, including possible loss of the principal amount invested.
Returns for periods less than 1 year are cumulative.
| (a) | Fund inception date of September 1, 2015. |
| (b) | Ratios as of the Prospectus dated August 31, 2017 and may differ from the ratios presented in the Financial Highlights. |
| (c) | Grandeur Peak Global Advisors, LLC (the “Adviser”), has agreed to waive and/or reimburse fees or expenses in order to limit Total Annual Fund Operating Expenses After Fee Waiver/ Expense Reimbursement (excluding acquired fund fees and expenses, brokerage expenses, interest expenses, taxes and extraordinary expenses) to 1.35% and 1.10% of the Fund’s average daily net assets for the Fund’s Investor Class Shares and Institutional Class Shares, respectively. This agreement is in effect through August 31, 2018. The Adviser will be permitted to recover, on a class-by-class basis, expenses it has borne through this agreement to the extent that a Fund’s expenses in later periods fall below annual rates set forth in the Expense Agreement; provided, however, that such recapture payments do not cause the Fund’s expense ratio (after recapture) to exceed the lesser of (i) the expense cap in effect at the time of the waiver and (ii) the expense cap in effect at the time of the recapture . Notwithstanding the foregoing, the Fund will not be obligated to pay any such deferred fees and expenses more than three years after the date on which the fee and expenses was deferred. This agreement may not be terminated or modified prior to August 31, 2018 except with the approval of the Fund’s Board of Trustees. |
| (d) | Excludes adjustments in accordance with accounting principles generally accepted in the United States of America and as such, the net asset value and total return for shareholder transactions reported to the market may differ from the net asset value for financial reporting purposes. |
| (e) | The Russell Global SMid Cap Index is designed to measure the performance of small- and mid-cap (SMid) securities and all capitalization securities respectively of issuers located in countries throughout the world representing developed and emerging markets. The Index is not actively managed and does not reflect any deductions for fees, expenses, or taxes. An investor may not invest directly in the Index. |
| (f) | The Russell Global Index is an additional index, and seeks to measure the performance of the global equity universe. The index is not actively managed and does not reflect any deductions for fees, expenses, or taxes. An investor may not invest directly in the Index. |
| Annual Report | April 30, 2018 | 17 |
| Grandeur Peak Global Stalwarts Fund | Performance Update |
April 30, 2018 (Unaudited)
Growth of $10,000 for the period ended April 30, 2018
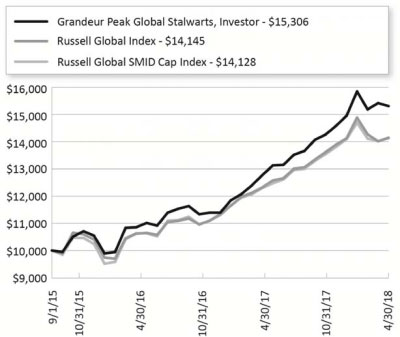
The graphs shown above represent a hypothetical investment of $10,000 in the Fund’s Investor Class shares for the period from inception to April 30, 2018. All returns reflect reinvested dividends, but do not reflect the deduction of taxes that an investor would pay on distributions or redemptions.
Investing in the Fund is subject to investment risks, including possible loss of the principal amount invested.
The Fund also offers Institutional Class shares, performance for which is not reflected in the graphs above. The performance of Institutional Class shares may be higher or lower than the performance of the Investor Class shares shown in the graphs above based upon differences in fees paid by shareholders investing in the Investor Class shares and Institutional Class shares.
| 18 | 1.855.377.7325 | www.GrandeurPeakGlobal.com |
| Grandeur Peak Global Stalwarts Fund | Performance Update |
April 30, 2018 (Unaudited)
| Regional Allocation (as a % of Net Assets)* | |
| North America | 36.1% |
| Europe | 26.1% |
| Asia ex Japan | 21.7% |
| Japan | 6.8% |
| Latin America | 4.4% |
| Africa/Middle East | 1.3% |
| Australia/New Zealand | 0.9% |
| Cash, Cash Equivalents, & Other Net Assets | 2.7% |
| Total | 100.0% |
| Industry Sector Allocation (as a % of Net Assets)* | |
| Financials | 26.3% |
| Consumer | 22.5% |
| Industrials | 20.5% |
| Technology | 14.5% |
| Health Care | 10.3% |
| Energy & Materials | 3.2% |
| Cash, Cash Equivalents, & Other Net Assets | 2.7% |
| Total | 100.0% |
| Top 10 Holdings (as a % of Net Assets)* | |
| Knight-Swift Transportation Holdings, Inc. | 2.2% |
| Stantec, Inc. | 2.0% |
| Nihon M&A Center, Inc. | 1.8% |
| B&M European Value Retail SA | 1.7% |
| Ritchie Bros Auctioneers, Inc. | 1.7% |
| Power Integrations, Inc. | 1.6% |
| FirstCash, Inc. | 1.6% |
| HealthEquity, Inc. | 1.6% |
| First Republic Bank | 1.6% |
| China Medical System Holdings, Ltd. | 1.5% |
| Total | 17.3% |
| * | Holdings are subject to change, and may not reflect the current or future position of the portfolio. |
| Annual Report | April 30, 2018 | 19 |
| Grandeur Peak International Opportunities Fund | Performance Update |
April 30, 2018 (Unaudited)
Annualized Total Return Performance for the periods ended April 30, 2018
| | | | | | | Expense Ratio(b) |
| | 6 Months | 1 Year | 3 Years | 5 Years | Since Inception(a) | Gross | Net(c) |
| Grandeur Peak International Opportunities Fund – Investor (GPIOX) | 4.83% | 19.30% | 9.82% | 12.09% | 15.22% | 1.62% | 1.62% |
| Grandeur Peak International Opportunities Fund – Institutional (GPIIX) | 4.97% | 19.38% | 10.06% | 12.30% | 15.45% | 1.37% | 1.37% |
| Russell Global ex-U.S. Small Cap Index(d) | 5.33% | 17.95% | 8.37% | 7.78% | 9.54% | | |
Performance data quoted represents past performance. Past performance does not guarantee future results. Investment return and principal value of an investment will fluctuate so that an investor’s shares, when sold or redeemed, may be worth more or less than the original cost. The Fund imposes a 2.00% redemption fee on shares held for less than 60 days. Current performance data may be higher or lower than actual data quoted. For the most current month-end performance data, please call 1-855-377-PEAK (7325).
The table does not reflect the deduction of taxes a shareholder would pay on Fund distributions or redemption of Fund shares.
Subject to investment risks, including possible loss of the principal amount invested.
Returns for periods less than 1 year are cumulative.
| (a) | Fund inception date of October 17, 2011. |
| (b) | Ratios as of the Prospectus dated August 31, 2017 and may differ from the ratios presented in the Financial Highlights. |
| (c) | Grandeur Peak Global Advisors, LLC (the “Adviser”), has agreed to waive and/or reimburse fees or expenses in order to limit Total Annual Fund Operating Expenses After Fee Waiver/Expense Reimbursements (excluding acquired fund fees and expenses, brokerage expenses, interest expenses, taxes and extraordinary expenses) to 1.75% and 1.50% of the Fund’s average daily net assets for the Fund’s Investor Class Shares and Institutional Class Shares, respectively. This agreement (the “Expense Agreement”) is in effect through August 31, 2018. The Adviser will be permitted to recover, on a class- by-class basis, expenses it has borne through the Expense Agreement to the extent that a Fund’s expenses in later periods fall below annual rates set forth in the Expense Agreement; provided, however, that such recapture payments do not cause the Fund’s expense ratio (after recapture) to exceed the lesser of (i) the expense cap in effect at the time of the waiver and (ii) the expense cap in effect at the time of the recapture . Notwithstanding the foregoing, the Funds will not be obligated to pay any such deferred fees and expenses more than three years after the date on which the fee and expenses was deferred. The Expense Agreement may not be terminated or modified prior to August 31, 2018 except with the approval of the Fund’s Board of Trustees. |
| (d) | The Russell Global ex-U.S. Small Cap Index seeks to measure the performance of the small-cap segment of the global equity universe, excluding companies assigned to the United States. The Index is not actively managed and does not reflect any deductions for fees, expense, or taxes. An investor may not invest directly in the Index. |
| 20 | 1.855.377.7325 | www.GrandeurPeakGlobal.com |
| Grandeur Peak International Opportunities Fund | Performance Update |
April 30, 2018 (Unaudited)
Growth of $10,000 for the period ended April 30, 2018
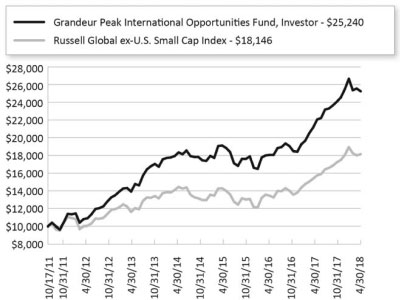
The chart shown above represent a hypothetical investment of $10,000 in the Fund’s Investor Class shares for the period from inception to April 30, 2018. All returns reflect reinvested dividends, but do not reflect the deduction of taxes that an investor would pay on distributions or redemptions.
Investing in the Fund is subject to investment risks, including possible loss of the principal amount invested.
The Fund also offers Institutional Class shares, performance for which is not reflected in the graphs above. The performance of Institutional Class shares may be higher or lower than the performance of the Investor Class shares shown in the graphs above based upon differences in fees paid by shareholders investing in the Investor Class shares and Institutional Class shares.
| Annual Report | April 30, 2018 | 21 |
| Grandeur Peak International Opportunities Fund | Performance Update |
April 30, 2018 (Unaudited)
| Regional Allocation (as a % of Net Assets)* | |
| Europe | 35.6% |
| Asia ex Japan | 31.4% |
| Japan | 11.4% |
| North America | 10.3% |
| Africa/Middle East | 3.7% |
| Latin America | 3.6% |
| Australia/New Zealand | 2.6% |
| Cash, Cash Equivalents, & Other Net Assets | 1.4% |
| Total | 100.0% |
| Industry Sector Allocation (as a % of Net Assets)* | |
| Financials | 24.8% |
| Consumer | 20.3% |
| Industrials | 20.1% |
| Technology | 17.6% |
| Health Care | 11.1% |
| Energy & Materials | 4.7% |
| Cash, Cash Equivalents, & Other Net Assets | 1.4% |
| Total | 100.0% |
| Top 10 Holdings (as a % of Net Assets)* | |
| FirstCash, Inc. | 2.0% |
| China Medical System Holdings, Ltd. | 1.5% |
| Wirecard AG | 1.2% |
| Man Wah Holdings, Ltd. | 1.2% |
| M&A Capital Partners Co., Ltd. | 1.1% |
| Silergy Corp. | 1.1% |
| Irish Residential Properties REIT PLC | 1.1% |
| EPAM Systems, Inc. | 1.1% |
| Create SD Holdings Co., Ltd. | 1.0% |
| WNS Holdings, Ltd. | 1.0% |
| Total | 12.3% |
| * | Holdings are subject to change, and may not reflect the current or future position of the portfolio. |
| 22 | 1.855.377.7325 | www.GrandeurPeakGlobal.com |
| Grandeur Peak International Stalwarts Fund | Performance Update |
April 30, 2018 (Unaudited)
Annualized Total Return Performance for the periods ended April 30, 2018
| | | | | Expense Ratio(b) |
| | 6 Months | 1 Year | Since Inception(a) | Gross | Net(c) |
| Grandeur Peak International Stalwarts – Investor | 7.03% | 20.50% | 18.62% | 1.27% | 1.27% |
| Grandeur Peak International Stalwarts – Institutional | 7.17% | 20.79% | 18.89% | 1.02% | 1.02% |
| Russell Global ex-U.S. SMID Cap Index(d) | 4.84% | 17.09% | 14.32% | | |
| Russell Global ex-U.S. Small Cap Index(e) | 5.33% | 17.95% | 14.84% | | |
Performance data quoted represents past performance. Past performance does not guarantee future results. Investment return and principal value of an investment will fluctuate so that an investor’s shares, when sold or redeemed, may be worth more or less than the original cost. The Fund imposes a 2.00% redemption fee on shares held for less than 60 days. Current performance data may be higher or lower than actual data quoted. For the most current month-end performance data, please call 1-855-377-PEAK (7325).
The table does not reflect the deduction of taxes a shareholder would pay on Fund distributions or redemption of Fund shares.
Subject to investment risks, including possible loss of the principal amount invested.
Returns for periods less than 1 year are cumulative.
| (a) | Fund inception date of September 1, 2015. |
| (b) | Ratios as of the Prospectus dated August 31, 2017 and may differ from the ratios presented in the Financial Highlights. |
| (c) | Grandeur Peak Global Advisors, LLC (the “Adviser”), has agreed to waive and/or reimburse fees or expenses in order to limit Total Annual Fund Operating Expenses After Fee Waiver/ Expense Reimbursements (excluding acquired fund fees and expenses, brokerage expenses, interest expenses, taxes and extraordinary expenses) to 1.35% and 1.10% of the Fund’s average daily net assets for the Fund’s Investor Class Shares and Institutional Class Shares, respectively. This agreement is in effect through August 31, 2018. The Adviser will be permitted to recover, on a class-by-class basis, expenses it has borne through this agreement to the extent that a Fund’s expenses in later periods fall below annual rates set forth in the Expense Agreement; provided, however, that such recapture payments do not cause the Fund’s expense ratio (after recapture) to exceed the lesser of (i) the expense cap in effect at the time of the waiver and (ii) the expense cap in effect at the time of the recapture . Notwithstanding the foregoing, the Funds will not be obligated to pay any such deferred fees and expenses more than three years after the date on which the fee and expenses was deferred This agreement may not be terminated or modified prior to August 31, 2018 except with the approval of the Fund’s Board of Trustees. |
| (d) | The Russell Global ex-US SMid Cap Index is constructed to provide a comprehensive and unbiased barometer for the small- and mid-cap (SMid) segments excluding companies assigned to the United States. The Russell Global ex-US SMid Cap Index is reconstituted annually to accurately reflect the changes in the market over time. The Index is not actively managed and does not reflect any deductions for fees, expenses, or taxes. An investor may not invest directly in the Index. |
| (e) | The Russell Global ex-U.S. Small Cap Index is designed to measure the performance of small capitalization securities outside of the U.S. The Index is not actively managed and does not reflect any deductions for fees, expenses, or taxes. An investor may not invest directly in the Index. |
| Annual Report | April 30, 2018 | 23 |
| Grandeur Peak International Stalwarts Fund | Performance Update |
April 30, 2018 (Unaudited)
Growth of $10,000 for the period ended April 30, 2018
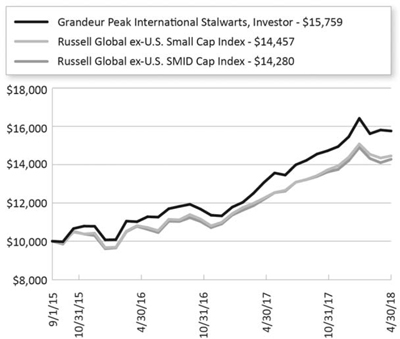
The chart shown above represent a hypothetical investment of $10,000 in the Fund’s Investor Class shares for the period from inception to April 30, 2018. All returns reflect reinvested dividends, but do not reflect the deduction of taxes that an investor would pay on distributions or redemptions.
Investing in the Fund is subject to investment risks, including possible loss of the principal amount invested.
The Fund also offers Institutional Class shares, performance for which is not reflected in the graphs above. The performance of Institutional Class shares may be higher or lower than the performance of the Investor Class shares shown in the graphs above based upon differences in fees paid by shareholders investing in the Investor Class shares and Institutional Class shares.
| 24 | 1.855.377.7325 | www.GrandeurPeakGlobal.com |
| Grandeur Peak International Stalwarts Fund | Performance Update |
April 30, 2018 (Unaudited)
| Regional Allocation (as a % of Net Assets)* | |
| Europe | 35.9% |
| Asia ex Japan | 27.9% |
| North America | 13.5% |
| Japan | 8.7% |
| Latin America | 5.9% |
| Africa/Middle East | 1.7% |
| Australia/New Zealand | 1.0% |
| Cash, Cash Equivalents, & Other Net Assets | 5.4% |
| Total | 100.0% |
| | |
| Industry Sector Allocation (as a % of Net Assets)* | |
| Consumer | 24.9% |
| Financials | 24.0% |
| Industrials | 18.8% |
| Technology | 13.7% |
| Health Care | 9.6% |
| Energy & Materials | 3.6% |
| Cash, Cash Equivalents, & Other Net Assets | 5.4% |
| Total | 100.0% |
| | |
| Top 10 Holdings (as a % of Net Assets)* | |
| Stantec, Inc. | 2.4% |
| Nihon M&A Center, Inc. | 2.2% |
| B&M European Value Retail SA | 2.2% |
| Ritchie Bros Auctioneers, Inc. | 2.1% |
| China Medical System Holdings, Ltd. | 1.9% |
| FirstCash, Inc. | 1.9% |
| Value Partners Group, Ltd. | 1.7% |
| MISUMI Group, Inc. | 1.6% |
| Brembo SpA | 1.6% |
| Vitasoy International Holdings, Ltd. | 1.6% |
| Total | 19.2% |
| * | Holdings are subject to change, and may not reflect the current or future position of the portfolio. |
| Annual Report | April 30, 2018 | 25 |
| Grandeur Peak Funds® | Disclosure of Fund Expenses |
April 30, 2018 (Unaudited)
As a shareholder of a Fund, you incur two types of costs: (1) transaction costs, including sales charges (loads) on purchase payments, reinvested dividends, or other distributions; redemption fees; and exchange fees; and (2) ongoing costs, including management fees; distribution and/or service (12b-1) fees; and other Fund expenses. This example is intended to help you understand your ongoing costs (in dollars) of investing in the Fund and to compare these costs with the ongoing costs of investing in other mutual funds.
This example is based on an investment of $1,000 invested at the beginning of the period and held for the entire six-month period of November 1, 2017 through of April 30, 2018.
Actual Expenses The first line of the table provides information about actual account values and actual expenses. You may use the information in this line, together with the amount you invested, to estimate the expenses that you paid over the period. Simply divide your account value by $1,000 (for example, an $8,600 account value divided by $1,000 = 8.6), then multiply the result by the number in the first line under the heading “Expenses Paid During Period” to estimate the expenses you paid on your account during this period.
Hypothetical Example for Comparison Purposes The second line of the table provides information about hypothetical account values and hypothetical expenses based on the Fund’s actual expense ratio and an assumed rate of return of 5% per year before expenses, which is not the Fund’s actual return. The hypothetical account values and expenses may not be used to estimate the actual ending account balance or expenses you paid for the period. You may use this information to compare the ongoing costs of investing in the Fund and other mutual funds. To do so, compare this 5% hypothetical example with the 5% hypothetical examples that appear in the shareholder reports of the other funds.
Please note that the expenses shown in the table are meant to highlight your ongoing costs only and do not reflect any transactional costs, such as redemption fees or exchange fees. Therefore, the second line of the table is useful in comparing ongoing costs only and will not help you determine the relative total costs of owning different funds. In addition, if these transactional costs were included, your costs would have been higher.
| 26 | 1.855.377.7325 | www.GrandeurPeakGlobal.com |
| Grandeur Peak Funds® | Disclosure of Fund Expenses |
April 30, 2018 (Unaudited)
| | Beginning
Account Value
November 1,
2017 | Ending
Account Value
April 30,
2018 | Expense Ratio(a) | Expenses Paid
During period
November 1,
2017 - April 30,
2018(b) |
| Grandeur Peak Emerging Markets Opportunities Fund | | | | |
| Investor Class | | | | |
| Actual | $1,000.00 | $1,058.40 | 1.77% | $9.03 |
| Hypothetical (5% return before expenses) | $1,000.00 | $1,016.02 | 1.77% | $8.85 |
| Institutional Class | | | | |
| Actual | $1,000.00 | $1,060.20 | 1.54% | $7.87 |
| Hypothetical (5% return before expenses) | $1,000.00 | $1,017.16 | 1.54% | $7.70 |
| Grandeur Peak Global Micro Cap Fund | | | | |
| Institutional Class | | | | |
| Actual | $1,000.00 | $1,041.20 | 2.00% | $10.12 |
| Hypothetical (5% return before expenses) | $1,000.00 | $1,014.88 | 2.00% | $9.99 |
| Grandeur Peak Global Opportunities Fund | | | | |
| Investor Class | | | | |
| Actual | $1,000.00 | $1,044.60 | 1.55% | $7.86 |
| Hypothetical (5% return before expenses) | $1,000.00 | $1,017.11 | 1.55% | $7.75 |
| Institutional Class | | | | |
| Actual | $1,000.00 | $1,047.80 | 1.31% | $6.65 |
| Hypothetical (5% return before expenses) | $1,000.00 | $1,018.30 | 1.31% | $6.56 |
| Grandeur Peak Global Reach Fund | | | | |
| Investor Class | | | | |
| Actual | $1,000.00 | $1,066.10 | 1.52% | $7.79 |
| Hypothetical (5% return before expenses) | $1,000.00 | $1,017.26 | 1.52% | $7.60 |
| Institutional Class | | | | |
| Actual | $1,000.00 | $1,067.30 | 1.28% | $6.56 |
| Hypothetical (5% return before expenses) | $1,000.00 | $1,018.45 | 1.28% | $6.41 |
| Grandeur Peak Global Stalwarts Fund | | | | |
| Investor Class | | | | |
| Actual | $1,000.00 | $1,073.40 | 1.35% | $6.94 |
| Hypothetical (5% return before expenses) | $1,000.00 | $1,018.10 | 1.35% | $6.76 |
| Institutional Class | | | | |
| Actual | $1,000.00 | $1,074.50 | 1.10% | $5.66 |
| Hypothetical (5% return before expenses) | $1,000.00 | $1,019.34 | 1.10% | $5.51 |
| Grandeur Peak International Opportunities Fund | | | | |
| Investor Class | | | | |
| Actual | $1,000.00 | $1,048.30 | 1.55% | $7.87 |
| Hypothetical (5% return before expenses) | $1,000.00 | $1,017.11 | 1.55% | $7.75 |
| Institutional Class | | | | |
| Actual | $1,000.00 | $1,049.70 | 1.30% | $6.61 |
| Hypothetical (5% return before expenses) | $1,000.00 | $1,018.35 | 1.30% | $6.51 |
| Grandeur Peak International Stalwarts Fund | | | | |
| Investor Class | | | | |
| Actual | $1,000.00 | $1,070.30 | 1.20% | $6.16 |
| Hypothetical (5% return before expenses) | $1,000.00 | $1,018.84 | 1.20% | $6.01 |
| Institutional Class | | | | |
| Actual | $1,000.00 | $1,071.70 | 0.95% | $4.88 |
| Hypothetical (5% return before expenses) | $1,000.00 | $1,020.08 | 0.95% | $4.76 |
| (a) | The Fund's expense ratios have been annualized based on the Fund's most recent fiscal half-year expenses. |
| (b) | Expenses are equal to the Fund's annualized expense ratio multiplied by the average account value over the period, multiplied by the number of days in the most recent fiscal half-year 181/365 (to reflect the half-year period). |
| Annual Report | April 30, 2018 | 27 |
| Grandeur Peak Emerging Markets Opportunities Fund | Portfolio of Investments |
April 30, 2018
| | | Shares | | | Value
(Note 2) | |
| COMMON STOCKS (94.12%) | | | | | | | | |
| Argentina (1.17%) | | | | | | | | |
| Despegar.com Corp.(a) | | | 110,900 | | | $ | 3,256,024 | |
| Globant SA(a) | | | 55,137 | | | | 2,481,716 | |
| | | | | | | | 5,737,740 | |
| | | | | | | | | |
| Bangladesh (1.11%) | | | | | | | | |
| Olympic Industries, Ltd. | | | 272,639 | | | | 866,928 | |
| Square Pharmaceuticals, Ltd. | | | 1,237,947 | | | | 4,576,043 | |
| | | | | | | | 5,442,971 | |
| | | | | | | | | |
| Brazil (3.21%) | | | | | | | | |
| Fleury SA | | | 376,500 | | | | 2,806,124 | |
| Hapvida Participacoes e Investimentos SA(a)(b)(c) | | | 53,600 | | | | 423,053 | |
| Hypermarcas SA | | | 221,300 | | | | 1,985,459 | |
| M Dias Branco SA | | | 199,200 | | | | 2,500,804 | |
| Notre Dame Intermedica Participacoes SA(a) | | | 133,000 | | | | 772,214 | |
| Pagseguro Digital, Ltd., Class A(a) | | | 96,125 | | | | 3,194,234 | |
| Raia Drogasil SA | | | 161,900 | | | | 3,175,887 | |
| Valid Solucoes e Servicos de Seguranca em Meios de Pagamento e Identificacao SA | | | 164,200 | | | | 871,809 | |
| | | | | | | | 15,729,584 | |
| | | | | | | | | |
| China (15.23%) | | | | | | | | |
| 58.com, Inc., ADR(a) | | | 38,250 | | | | 3,342,667 | |
| Alibaba Group Holding, Ltd., Sponsored ADR(a) | | | 14,450 | | | | 2,579,903 | |
| ANTA Sports Products, Ltd. | | | 644,000 | | | | 3,704,663 | |
| BBI Life Sciences Corp.(c) | | | 9,968,500 | | | | 4,140,497 | |
| BrightKing Holdings, Ltd. | | | 833,721 | | | | 2,040,167 | |
| China Medical System Holdings, Ltd. | | | 5,664,000 | | | | 13,971,198 | |
| CSPC Pharmaceutical Group, Ltd. | | | 1,027,000 | | | | 2,643,181 | |
| Ctrip.com International, Ltd., ADR(a) | | | 75,175 | | | | 3,074,657 | |
| Essex Bio-technology, Ltd. | | | 4,001,000 | | | | 3,578,580 | |
| JD.com, Inc., ADR(a) | | | 95,000 | | | | 3,468,450 | |
| Man Wah Holdings, Ltd. | | | 8,146,400 | | | | 6,061,549 | |
| O2Micro International, Ltd., ADR(a) | | | 462,244 | | | | 637,897 | |
| On-Bright Electronics, Inc. | | | 549,941 | | | | 4,488,897 | |
| Shanghai Haohai Biological Technology Co., Ltd., Class H(b)(c) | | | 567,800 | | | | 3,725,698 | |
| Silergy Corp. | | | 368,422 | | | | 7,745,373 | |
| Tencent Holdings, Ltd. | | | 47,900 | | | | 2,386,257 | |
| Xiabuxiabu Catering Management China Holdings Co., Ltd.(b)(c) | | | 2,366,500 | | | | 4,082,538 | |
| | | Shares | | | Value
(Note 2) | |
| China (continued) | | | | | | | | |
| Yum China Holdings, Inc. | | | 68,600 | | | $ | 2,933,336 | |
| | | | | | | | 74,605,508 | |
| | | | | | | | | |
| Colombia (2.31%) | | | | | | | | |
| Amerisur Resources PLC(a) | | | 6,100,400 | | | | 1,459,646 | |
| Gran Tierra Energy, Inc.(a) | | | 1,124,500 | | | | 3,722,095 | |
| Parex Resources, Inc.(a) | | | 356,831 | | | | 6,139,177 | |
| | | | | | | | 11,320,918 | |
| | | | | | | | | |
| Egypt (1.92%) | | | | | | | | |
| African Export-Import Bank, GDR(a) | | | 500,000 | | | | 1,987,500 | |
| Commercial International Bank Egypt SAE | | | 374,454 | | | | 1,990,513 | |
| Integrated Diagnostics Holdings PLC(b)(c) | | | 371,100 | | | | 1,762,725 | |
| Juhayna Food Industries | | | 1,422,650 | | | | 1,095,896 | |
| Obour Land For Food Industries | | | 2,116,943 | | | | 2,577,982 | |
| | | | | | | | 9,414,616 | |
| | | | | | | | | |
| Georgia (2.62%) | | | | | | | | |
| BGEO Group PLC | | | 122,812 | | | | 5,883,821 | |
| Georgia Healthcare Group PLC(a)(b)(c) | | | 319,225 | | | | 1,217,352 | |
| TBC Bank Group PLC | | | 225,706 | | | | 5,711,208 | |
| | | | | | | | 12,812,381 | |
| | | | | | | | | |
| Greece (1.00%) | | | | | | | | |
| Sarantis SA | | | 285,485 | | | | 4,912,713 | |
| | | | | | | | | |
| Hong Kong (5.57%) | | | | | | | | |
| International Housewares Retail Co., Ltd. | | | 8,126,000 | | | | 1,646,186 | |
| Jacobson Pharma Corp., Ltd.(c) | | | 5,020,000 | | | | 1,208,845 | |
| Plover Bay Technologies, Ltd.(c) | | | 8,892,000 | | | | 1,824,023 | |
| Samsonite International SA | | | 1,026,900 | | | | 4,657,825 | |
| TK Group Holdings, Ltd. | | | 5,467,000 | | | | 4,067,869 | |
| Value Partners Group, Ltd. | | | 9,436,800 | | | | 9,017,602 | |
| Vitasoy International Holdings, Ltd. | | | 1,837,900 | | | | 4,882,396 | |
| | | | | | | | 27,304,746 | |
| | | | | | | | | |
| India (12.53%) | | | | | | | | |
| Alkem Laboratories, Ltd. | | | 142,085 | | | | 4,207,517 | |
| Bajaj Finance, Ltd. | | | 169,000 | | | | 4,830,706 | |
| Byke Hospitality, Ltd. | | | 981,000 | | | | 2,805,272 | |
| City Union Bank, Ltd. | | | 1,198,250 | | | | 3,300,843 | |
| Control Print, Ltd. | | | 255,504 | | | | 1,757,403 | |
| Cyient, Ltd. | | | 537,595 | | | | 6,129,098 | |
| Essel Propack, Ltd. | | | 144,761 | | | | 583,143 | |
| Indiabulls Housing Finance, Ltd. | | | 179,500 | | | | 3,515,231 | |
| Kellton Tech Solutions, Ltd.(a) | | | 1,152,350 | | | | 1,136,983 | |
See Notes to Financial Statements.
| 28 | 1.855.377.7325 | www.GrandeurPeakGlobal.com |
| Grandeur Peak Emerging Markets Opportunities Fund | Portfolio of Investments |
April 30, 2018
| | | Shares | | | Value
(Note 2) | |
| India (continued) | | | | | | | | |
| Kovai Medical Center and Hospital | | | 75,083 | | | $ | 1,385,053 | |
| L&T Finance Holdings, Ltd. | | | 1,057,500 | | | | 2,744,366 | |
| L&T Technology Services, Ltd.(b)(c) | | | 171,540 | | | | 3,417,435 | |
| SBI Life Insurance Co., Ltd.(b)(c) | | | 32,443 | | | | 361,229 | |
| Somany Ceramics, Ltd. | | | 96,303 | | | | 802,284 | |
| Thyrocare Technologies, Ltd. | | | 248,644 | | | | 2,492,215 | |
| Time Technoplast, Ltd. | | | 2,390,721 | | | | 5,751,128 | |
| Vaibhav Global, Ltd.(a) | | | 200,319 | | | | 2,168,272 | |
| Vakrangee, Ltd. | | | 838,000 | | | | 1,254,991 | |
| WNS Holdings, Ltd., ADR(a) | | | 160,186 | | | | 7,837,901 | |
| Yes Bank, Ltd. | | | 905,500 | | | | 4,911,462 | |
| | | | | | | | 61,392,532 | |
| | | | | | | | | |
| Indonesia (4.30%) | | | | | | | | |
| Ace Hardware Indonesia Tbk PT | | | 12,870,000 | | | | 1,202,588 | |
| Arwana Citramulia Tbk PT | | | 58,293,000 | | | | 1,458,111 | |
| Bekasi Fajar Industrial Estate Tbk PT | | | 56,350,600 | | | | 1,077,395 | |
| Delfi, Ltd. | | | 866,400 | | | | 947,421 | |
| Hexindo Adiperkasa Tbk PT | | | 3,557,100 | | | | 859,073 | |
| Indonesia Pondasi Raya Tbk PT | | | 14,757,300 | | | | 891,007 | |
| Link Net Tbk PT | | | 7,350,500 | | | | 2,853,024 | |
| Lippo Cikarang Tbk PT(a) | | | 3,005,000 | | | | 498,943 | |
| Panin Sekuritas Tbk PT | | | 7,155,500 | | | | 853,774 | |
| Sarana Menara Nusantara Tbk PT | | | 9,443,000 | | | | 2,131,250 | |
| Selamat Sempurna Tbk PT | | | 38,912,900 | | | | 4,055,612 | |
| Tempo Scan Pacific Tbk PT | | | 17,950,700 | | | | 2,051,509 | |
| Ultrajaya Milk Industry & Trading Co., Tbk PT | | | 20,171,600 | | | | 2,160,337 | |
| | | | | | | | 21,040,044 | |
| | | | | | | | | |
| Kenya (0.69%) | | | | | | | | |
| Safaricom, Ltd. | | | 11,916,300 | | | | 3,356,286 | |
| | | | | | | | | |
| Malaysia (2.21%) | | | | | | | | |
| AEON Credit Service M Bhd | | | 1,224,400 | | | | 4,081,853 | |
| CB Industrial Product Holding Bhd | | | 2,761,800 | | | | 1,034,751 | |
| My EG Services Bhd | | | 4,339,900 | | | | 2,898,060 | |
| Mynews Holdings Bhd | | | 2,292,100 | | | | 882,139 | |
| Scicom MSC Bhd | | | 3,685,500 | | | | 1,944,434 | |
| | | | | | | | 10,841,237 | |
| | | | | | | | | |
| Mexico (2.47%) | | | | | | | | |
| Credito Real SAB de CV SOFOM ER(a) | | | 2,044,271 | | | | 2,977,531 | |
| Grupo Herdez SAB de CV | | | 1,081,600 | | | | 2,591,507 | |
| Regional SAB de CV | | | 649,900 | | | | 4,136,664 | |
| | | Shares | | | Value
(Note 2) | |
| Mexico (continued) | | | | | | | | |
| Unifin Financiera SAB de CV SOFOM ENR | | | 663,600 | | | $ | 2,377,344 | |
| | | | | | | | 12,083,046 | |
| | | | | | | | | |
| Oman (0.88%) | | | | | | | | |
| Tethys Oil AB | | | 480,023 | | | | 4,303,222 | |
| | | | | | | | | |
| Pakistan (0.81%) | | | | | | | | |
| Abbott Laboratories Pakistan, Ltd. | | | 132,850 | | | | 829,953 | |
| Akzo Nobel Pakistan, Ltd. | | | 852,800 | | | | 1,500,093 | |
| Meezan Bank, Ltd. | | | 2,408,320 | | | | 1,646,251 | |
| | | | | | | | 3,976,297 | |
| | | | | | | | | |
| Peru (2.04%) | | | | | | | | |
| Alicorp SAA | | | 1,439,086 | | | | 5,286,529 | |
| Credicorp, Ltd. | | | 20,325 | | | | 4,725,359 | |
| | | | | | | | 10,011,888 | |
| | | | | | | | | |
| Philippines (4.31%) | | | | | | | | |
| Concepcion Industrial Corp. | | | 2,912,792 | | | | 3,377,183 | |
| Holcim Philippines, Inc. | | | 3,694,500 | | | | 663,232 | |
| Pepsi-Cola Products Philippines, Inc. | | | 23,627,000 | | | | 1,196,200 | |
| Puregold Price Club, Inc. | | | 3,372,100 | | | | 3,088,678 | |
| Robinsons Land Corp. | | | 8,093,762 | | | | 2,799,608 | |
| Robinsons Retail Holdings, Inc. | | | 1,675,000 | | | | 2,945,439 | |
| Security Bank Corp. | | | 1,746,600 | | | | 7,053,969 | |
| | | | | | | | 21,124,309 | |
| | | | | | | | | |
| Poland (2.84%) | | | | | | | | |
| AmRest Holdings SE(a) | | | 9,628 | | | | 1,264,586 | |
| Dino Polska SA(a)(b)(c) | | | 261,600 | | | | 7,080,645 | |
| LiveChat Software SA | | | 239,800 | | | | 3,040,329 | |
| Medicalgorithmics SA | | | 27,700 | | | | 1,175,919 | |
| PGS Software SA | | | 426,467 | | | | 1,360,865 | |
| | | | | | | | 13,922,344 | |
| | | | | | | | | |
| Russia (0.60%) | | | | | | | | |
| MD Medical Group Investments PLC, GDR(c) | | | 117,400 | | | | 1,074,210 | |
| TCS Group Holding PLC, GDR(c) | | | 91,200 | | | | 1,878,720 | |
| | | | | | | | 2,952,930 | |
| | | | | | | | | |
| South Africa (4.40%) | | | | | | | | |
| ARB Holdings, Ltd. | | | 1,134,108 | | | | 518,605 | |
| Blue Label Telecoms, Ltd. | | | 1,363,023 | | | | 1,359,196 | |
| Capitec Bank Holdings, Ltd. | | | 23,200 | | | | 1,654,840 | |
| Cartrack Holdings, Ltd. | | | 1,526,449 | | | | 2,314,472 | |
| Cashbuild, Ltd. | | | 47,300 | | | | 1,650,662 | |
| City Lodge Hotels, Ltd. | | | 41,992 | | | | 552,482 | |
| Clicks Group, Ltd. | | | 113,000 | | | | 1,937,091 | |
| EOH Holdings, Ltd. | | | 396,824 | | | | 1,207,822 | |
| Interwaste Holdings, Ltd. | | | 15,918,682 | | | | 1,085,510 | |
See Notes to Financial Statements.
| Annual Report | April 30, 2018 | 29 |
| Grandeur Peak Emerging Markets Opportunities Fund | Portfolio of Investments |
April 30, 2018
| | | Shares | | | Value
(Note 2) | |
| South Africa (continued) | | | | | | | | |
| Italtile, Ltd. | | | 2,339,672 | | | $ | 2,691,608 | |
| Shoprite Holdings, Ltd. | | | 57,700 | | | | 1,152,611 | |
| Transaction Capital, Ltd. | | | 3,877,628 | | | | 5,450,144 | |
| | | | | | | | 21,575,043 | |
| | | | | | | | | |
| South Korea (7.58%) | | | | | | | | |
| BGF Retail Co., Ltd. | | | 17,674 | | | | 3,160,652 | |
| Daebongls Co., Ltd. | | | 26,500 | | | | 281,611 | |
| Hanssem Co., Ltd. | | | 17,500 | | | | 1,908,852 | |
| Hy-Lok Corp. | | | 55,300 | | | | 1,429,034 | |
| ISC Co., Ltd. | | | 165,732 | | | | 2,405,174 | |
| Kakao M Corp. | | | 42,500 | | | | 3,561,397 | |
| Koh Young Technology, Inc. | | | 30,244 | | | | 2,882,673 | |
| LEENO Industrial, Inc. | | | 68,200 | | | | 3,658,874 | |
| LG Household & Health Care, Ltd. | | | 4,625 | | | | 5,932,541 | |
| Medy-Tox, Inc. | | | 7,000 | | | | 4,572,071 | |
| NAVER Corp. | | | 5,512 | | | | 3,695,138 | |
| Vitzrocell Co., Ltd.(a)(d) | | | 444,769 | | | | 3,657,929 | |
| | | | | | | | 37,145,946 | |
| | | | | | | | | |
| Sri Lanka (0.89%) | | | | | | | | |
| Hemas Holdings PLC | | | 2,946,326 | | | | 2,335,388 | |
| Royal Ceramics Lanka PLC | | | 2,965,133 | | | | 2,011,853 | |
| | | | | | | | 4,347,241 | |
| | | | | | | | | |
| Switzerland (0.58%) | | | | | | | | |
| Wizz Air Holdings PLC(a)(b)(c) | | | 64,800 | | | | 2,849,373 | |
| | | | | | | | | |
| Taiwan (5.71%) | | | | | | | | |
| ASPEED Technology, Inc. | | | 69,929 | | | | 2,009,012 | |
| I Yuan Precision Ind Co., Ltd. | | | 430,000 | | | | 872,019 | |
| Materials Analysis Technology, Inc. | | | 501,000 | | | | 1,198,885 | |
| Rafael Microelectronics, Inc. | | | 262,000 | | | | 1,270,748 | |
| Sinmag Equipment Corp. | | | 1,039,133 | | | | 5,426,328 | |
| Sitronix Technology Corp. | | | 942,000 | | | | 2,712,670 | |
| Sporton International, Inc. | | | 1,044,317 | | | | 5,806,369 | |
| Tehmag Foods Corp. | | | 145,200 | | | | 1,079,682 | |
| Test Research, Inc. | | | 1,626,000 | | | | 3,006,175 | |
| TSC Auto ID Technology Co., Ltd. | | | 208,000 | | | | 1,645,075 | |
| TTFB Co., Ltd. | | | 179,000 | | | | 1,406,638 | |
| Voltronic Power Technology Corp. | | | 86,000 | | | | 1,534,754 | |
| | | | | | | | 27,968,355 | |
| | | | | | | | | |
| Thailand (1.77%) | | | | | | | | |
| Muangthai Leasing PCL | | | 1,963,000 | | | | 2,270,263 | |
| Srisawad Corp., PCL | | | 2,086,240 | | | | 3,437,404 | |
| TOA Paint Thailand PCL(a) | | | 2,428,000 | | | | 2,942,681 | |
| | | | | | | | 8,650,348 | |
| | | Shares | | | Value
(Note 2) | |
| Turkey (0.84%) | | | | | | |
| Aselsan Elektronik Sanayi Ve Ticaret AS | | | 144,900 | | | $ | 898,914 | |
| DP Eurasia NV(a)(b)(c) | | | 1,236,100 | | | | 3,233,305 | |
| | | | | | | | 4,132,219 | |
| | | | | | | | | |
| United Arab Emirates (0.25%) | | | | | | | | |
| Aramex PJSC | | | 1,123,419 | | | | 1,238,677 | |
| | | | | | | | | |
| United States (2.02%) | | | | | | | | |
| FirstCash, Inc. | | | 114,195 | | | | 9,900,706 | |
| | | | | | | | | |
| Vietnam (2.26%) | | | | | | | | |
| FPT Corp. | | | 713,527 | | | | 1,786,678 | |
| Ho Chi Minh City Development Joint Stock Commercial Bank | | | 1,583,953 | | | | 2,978,153 | |
| Lix Detergent JSC | | | 437,310 | | | | 864,496 | |
| Vietnam Dairy Products JSC | | | 666,076 | | | | 5,413,230 | |
| | | | | | | | 11,042,557 | |
| | | | | | | | | |
| TOTAL COMMON STOCKS | | | | | | | | |
| (Cost $372,027,690) | | | | | | | 461,135,777 | |
| | | Principal
Amount | | | Value
(Note 2) | |
| CORPORATE BONDS (0.14%) | | | | | | | | |
| Malaysia (0.14%) | | | | | | | | |
| AEON Credit Service M Bhd 3.50%, 09/15/2020 | | $ | 2,260,800 | | | $ | 674,177 | |
| | | | | | | | | |
| TOTAL CORPORATE BONDS | | | | | | | | |
| (Cost $537,071) | | | | | | | 674,177 | |
| | | | | | | | | |
| TOTAL INVESTMENTS (94.26%) | | | | | | | | |
| (Cost $372,564,761) | | | | | | $ | 461,809,954 | |
| | | | | | | | | |
| Other Assets In Excess Of Liabilities (5.74%) | | | | | | | 28,118,064 | |
| | | | | | | | | |
| NET ASSETS (100.00%) | | | | | | $ | 489,928,018 | |
See Notes to Financial Statements.
| 30 | 1.855.377.7325 | www.GrandeurPeakGlobal.com |
| Grandeur Peak Emerging Markets Opportunities Fund | Portfolio of Investments |
April 30, 2018
| (a) | Non-Income Producing Security. |
| (b) | Security exempt from registration under Rule 144A of the Securities Act of 1933. These securities may be resold in the ordinary course of business in transactions exempt from registration, normally to qualified institutional buyers. As of April 30, 2018, these securities had a total aggregate market value of $28,153,353 representing 5.75% of net assets. |
| (c) | Security was purchased pursuant to Regulation S under the Securities Act of 1933, which exempts securities offered and sold outside of the United States from registration. Such security cannot be sold in the United States without either an effective registration statement filed pursuant to the Securities Act of 1933, or pursuant to an exemption from registration. The security has been deemed liquid under guidelines approved by the Fund's Board of Trustees. As of April 30, 2018, the aggregate market value of those securities was $38,279,646, representing 7.81% of net assets. |
| (d) | As a result of the use of significant unobservable inputs to determine fair value, these investments have been classified as level 3 assets. See also footnote 2 to the financial statements for additional information. |
For Fund compliance purposes, the Fund's geographical classifications refer to any one or more of the country sub-classifications used by one or more widely recognized market indexes or ratings group indexes, and/or as defined by Fund management. This definition may not apply for purposes of this report, which may combine sub-classifications for reporting ease. Geographical regions are shown as a percentage of net assets.
See Notes to Financial Statements.
| Annual Report | April 30, 2018 | 31 |
| Grandeur Peak Global Micro Cap Fund | Portfolio of Investments |
April 30, 2018
| | | Shares | | | Value
(Note 2) | |
| COMMON STOCKS (97.31%) | | | | | | | | |
| Australia (7.12%) | | | | | | | | |
| Australian Ethical Investment, Ltd. | | | 415 | | | $ | 42,178 | |
| Beacon Lighting Group, Ltd. | | | 39,349 | | | | 43,843 | |
| Blue Sky Alternative Investments, Ltd. | | | 78,844 | | | | 182,822 | |
| Class, Ltd. | | | 72,133 | | | | 124,902 | |
| Fiducian Group, Ltd. | | | 241,628 | | | | 782,212 | |
| Hub24, Ltd.(a) | | | 25,700 | | | | 214,572 | |
| Kogan.com, Ltd. | | | 31,500 | | | | 184,264 | |
| Lycopodium, Ltd. | | | 89,026 | | | | 313,669 | |
| Mainstream Group Holdings, Ltd. | | | 974,669 | | | | 469,619 | |
| Mitula Group, Ltd.(a) | | | 387,052 | | | | 131,127 | |
| National Storage REIT | | | 196,847 | | | | 237,114 | |
| National Veterinary Care, Ltd. | | | 67,400 | | | | 122,288 | |
| Reject Shop, Ltd. | | | 21,835 | | | | 121,152 | |
| | | | | | | | 2,969,762 | |
| | | | | | | | | |
| Britain (10.84%) | | | | | | | | |
| AB Dynamics PLC | | | 12,432 | | | | 165,161 | |
| Arrow Global Group PLC | | | 31,219 | | | | 159,668 | |
| City of London Investment Group PLC | | | 37,697 | | | | 228,089 | |
| Curtis Banks Group PLC | | | 46,300 | | | | 192,498 | |
| dotdigital group PLC | | | 152,400 | | | | 185,681 | |
| Horizon Discovery Group PLC(a) | | | 42,400 | | | | 84,056 | |
| Impax Asset Management Group PLC | | | 144,325 | | | | 325,855 | |
| JTC PLC(a)(b)(c) | | | 104,200 | | | | 439,681 | |
| K3 Capital Group PLC | | | 48,679 | | | | 205,740 | |
| LoopUp Group PLC(a) | | | 89,733 | | | | 532,438 | |
| Morses Club PLC | | | 78,838 | | | | 158,192 | |
| Motorpoint group PLC(c) | | | 36,982 | | | | 132,374 | |
| On the Beach Group PLC(b)(c) | | | 51,200 | | | | 431,381 | |
| Oxford Immunotec Global PLC(a) | | | 22,794 | | | | 292,447 | |
| Premier Asset Management Group PLC | | | 121,300 | | | | 412,475 | |
| Premier Technical Services Group PLC | | | 62,313 | | | | 158,705 | |
| River & Mercantile Group PLC | | | 61,300 | | | | 258,239 | |
| Tracsis PLC | | | 19,300 | | | | 160,219 | |
| | | | | | | | 4,522,899 | |
| | | | | | | | | |
| Canada (0.92%) | | | | | | | | |
| Biosyent, Inc.(a) | | | 37,893 | | | | 295,128 | |
| Cipher Pharmaceuticals, Inc.(a) | | | 31,300 | | | | 88,248 | |
| | | | | | | | 383,376 | |
| | | | | | | | | |
| China (4.64%) | | | | | | | | |
| BBI Life Sciences Corp.(c) | | | 1,555,000 | | | | 645,882 | |
| BrightKing Holdings, Ltd. | | | 74,332 | | | | 181,895 | |
| Essex Bio-technology, Ltd. | | | 329,000 | | | | 294,265 | |
| | | Shares | | | Value
(Note 2) | |
| China (continued) | | | | | | | | |
| Hop Hing Group Holdings, Ltd. | | | 6,984,000 | | | $ | 163,730 | |
| O2Micro International, Ltd., ADR(a) | | | 122,075 | | | | 168,463 | |
| On-Bright Electronics, Inc. | | | 42,572 | | | | 347,494 | |
| Xiabuxiabu Catering Management China Holdings Co., Ltd.(b)(c) | | | 78,500 | | | | 135,423 | |
| | | | | | | | 1,937,152 | |
| | | | | | | | | |
| Colombia (1.24%) | | | | | | | | |
| Amerisur Resources PLC(a) | | | 1,326,900 | | | | 317,488 | |
| Gran Tierra Energy, Inc.(a) | | | 59,850 | | | | 198,104 | |
| | | | | | | | 515,592 | |
| | | | | | | | | |
| Egypt (0.54%) | | | | | | | | |
| Obour Land For Food Industries | | | 186,387 | | | | 226,979 | |
| | | | | | | | | |
| France (1.79%) | | | | | | | | |
| Esker SA | | | 3,500 | | | | 234,153 | |
| Neurones | | | 3,900 | | | | 120,567 | |
| Thermador Groupe | | | 2,721 | | | | 392,663 | |
| | | | | | | | 747,383 | |
| | | | | | | | | |
| Georgia (1.10%) | | | | | | | | |
| Georgia Healthcare Group PLC(a)(b)(c) | | | 34,700 | | | | 132,327 | |
| TBC Bank Group PLC | | | 12,822 | | | | 324,445 | |
| | | | | | | | 456,772 | |
| | | | | | | | | |
| Germany (0.76%) | | | | | | | | |
| Nexus AG | | | 6,200 | | | | 207,393 | |
| publity AG | | | 6,900 | | | | 109,988 | |
| | | | | | | | 317,381 | |
| | | | | | | | | |
| Greece (1.10%) | | | | | | | | |
| Sarantis SA | | | 26,700 | | | | 459,462 | |
| | | | | | | | | |
| Hong Kong (3.21%) | | | | | | | | |
| International Housewares Retail Co., Ltd. | | | 1,063,000 | | | | 215,345 | |
| Jacobson Pharma Corp., Ltd.(c) | | | 775,000 | | | | 186,625 | |
| Plover Bay Technologies, Ltd.(c) | | | 2,912,000 | | | | 597,341 | |
| TK Group Holdings, Ltd. | | | 457,000 | | | | 340,043 | |
| | | | | | | | 1,339,354 | |
| | | | | | | | | |
| India (5.36%) | | | | | | | | |
| Byke Hospitality, Ltd. | | | 196,779 | | | | 562,710 | |
| Control Print, Ltd. | | | 18,500 | | | | 127,247 | |
| Cyient, Ltd. | | | 23,640 | | | | 269,519 | |
| Essel Propack, Ltd. | | | 13,034 | | | | 52,505 | |
| Kellton Tech Solutions, Ltd.(a) | | | 98,464 | | | | 97,151 | |
See Notes to Financial Statements.
| 32 | 1.855.377.7325 | www.GrandeurPeakGlobal.com |
| Grandeur Peak Global Micro Cap Fund | Portfolio of Investments |
April 30, 2018
| | | Shares | | | Value
(Note 2) | |
| India (continued) | | | | | | | | |
| Kovai Medical Center and Hospital | | | 21,967 | | | $ | 405,224 | |
| Somany Ceramics, Ltd. | | | 9,033 | | | | 75,253 | |
| Thyrocare Technologies, Ltd. | | | 30,800 | | | | 308,715 | |
| Time Technoplast, Ltd. | | | 141,015 | | | | 339,226 | |
| | | | | | | | 2,237,550 | |
| | | | | | | | | |
| Indonesia (2.80%) | | | | | | | | |
| Arwana Citramulia Tbk PT | | | 7,920,100 | | | | 198,109 | |
| Astra Graphia Tbk PT | | | 1,109,700 | | | | 115,656 | |
| BFI Finance Indonesia Tbk PT | | | 5,268,300 | | | | 306,726 | |
| Hexindo Adiperkasa Tbk PT | | | 634,500 | | | | 153,238 | |
| Selamat Sempurna Tbk PT | | | 3,764,900 | | | | 392,388 | |
| | | | | | | | 1,166,117 | |
| | | | | | | | | |
| Ireland (1.67%) | | | | | | | | |
| Hostelworld Group PLC(b)(c) | | | 43,487 | | | | 242,468 | |
| Irish Residential Properties REIT PLC | | | 275,700 | | | | 453,458 | |
| | | | | | | | 695,926 | |
| | | | | | | | | |
| Japan (13.88%) | | | | | | | | |
| Abist Co., Ltd. | | | 4,400 | | | | 192,792 | |
| AIT Corp. | | | 19,600 | | | | 215,148 | |
| Amiyaki Tei Co., Ltd. | | | 2,200 | | | | 108,068 | |
| Anshin Guarantor Service Co., Ltd. | | | 19,200 | | | | 50,230 | |
| Arcland Service Holdings Co., Ltd. | | | 8,000 | | | | 171,387 | |
| Atrae, Inc.(a) | | | 6,900 | | | | 198,504 | |
| Central Automotive Products, Ltd. | | | 16,500 | | | | 257,341 | |
| eGuarantee, Inc. | | | 11,000 | | | | 220,563 | |
| Future Corp. | | | 19,600 | | | | 226,443 | |
| Hard Off Corp. Co., Ltd. | | | 20,000 | | | | 208,013 | |
| M&A Capital Partners Co., Ltd.(a) | | | 13,900 | | | | 1,005,754 | |
| Marklines Co, Ltd. | | | 22,100 | | | | 310,112 | |
| MKSystem Corp. | | | 12,400 | | | | 148,705 | |
| Naigai Trans Line, Ltd. | | | 10,800 | | | | 181,383 | |
| Open Door, Inc.(a) | | | 10,200 | | | | 190,620 | |
| Qol Co., Ltd. | | | 15,400 | | | | 316,678 | |
| Quick Co., Ltd. | | | 10,400 | | | | 171,431 | |
| Silver Life Co., Ltd.(a) | | | 9,000 | | | | 370,060 | |
| Synchro Food Co., Ltd.(a) | | | 29,400 | | | | 294,753 | |
| Syuppin Co., Ltd. | | | 25,500 | | | | 287,843 | |
| Trancom Co., Ltd. | | | 2,700 | | | | 204,994 | |
| Vega Corp Co., Ltd.(a) | | | 20,800 | | | | 295,295 | |
| Yakuodo Co., Ltd. | | | 4,700 | | | | 163,159 | |
| | | | | | | | 5,789,276 | |
| | | | | | | | | |
| Malaysia (2.11%) | | | | | | | | |
| AEON Credit Service M Bhd | | | 64,950 | | | | 216,527 | |
| Foundpac Group Bhd | | | 1,634,000 | | | | 91,622 | |
| Mynews Holdings Bhd | | | 1,142,000 | | | | 439,511 | |
| | | Shares | | | Value
(Note 2) | |
| Malaysia (continued) | | | | | | | | |
| Scicom MSC Bhd | | | 251,600 | | | $ | 132,742 | |
| | | | | | | | 880,402 | |
| | | | | | | | | |
| Mexico (0.33%) | | | | | | | | |
| Credito Real SAB de CV SOFOM ER(a) | | | 95,430 | | | | 138,996 | |
| | | | | | | | | |
| Netherlands (0.73%) | | | | | | | | |
| Shop Apotheke Europe NV(a)(b) | | | 6,475 | | | | 303,385 | |
| | | | | | | | | |
| New Zealand (0.55%) | | | | | | | | |
| CBL Corp., Ltd.(d) | | | 159,993 | | | | 25,891 | |
| Restaurant Brands New Zealand, Ltd. | | | 40,364 | | | | 203,913 | |
| | | | | | | | 229,804 | |
| | | | | | | | | |
| Norway (5.03%) | | | | | | | | |
| Infront ASA | | | 105,800 | | | | 369,271 | |
| Komplett Bank ASA(a) | | | 75,000 | | | | 160,054 | |
| Medistim ASA | | | 25,862 | | | | 255,967 | |
| Multiconsult ASA(b)(c) | | | 22,900 | | | | 194,109 | |
| Sbanken ASA(b)(c) | | | 57,900 | | | | 523,260 | |
| Self Storage Group ASA(a) | | | 82,800 | | | | 163,075 | |
| Webstep ASA(b)(c) | | | 133,000 | | | | 431,048 | |
| | | | | | | | 2,096,784 | |
| | | | | | | | | |
| Oman (0.74%) | | | | | | | | |
| Tethys Oil AB | | | 34,600 | | | | 310,176 | |
| | | | | | | | | |
| Pakistan (0.30%) | | | | | | | | |
| Akzo Nobel Pakistan, Ltd. | | | 71,300 | | | | 125,418 | |
| | | | | | | | | |
| Philippines (1.64%) | | | | | | | | |
| Concepcion Industrial Corp. | | | 129,770 | | | | 150,460 | |
| Pryce Corp. | | | 4,586,500 | | | | 531,773 | |
| | | | | | | | 682,233 | |
| | | | | | | | | |
| Poland (1.22%) | | | | | | | | |
| LiveChat Software SA | | | 18,500 | | | | 234,554 | |
| Medicalgorithmics SA | | | 2,600 | | | | 110,375 | |
| PGS Software SA | | | 51,047 | | | | 162,892 | |
| | | | | | | | 507,821 | |
| | | | | | | | | |
| Singapore (0.80%) | | | | | | | | |
| Riverstone Holdings, Ltd. | | | 419,800 | | | | 332,421 | |
| | | | | | | | | |
| South Africa (0.95%) | | | | | | | | |
| ARB Holdings, Ltd. | | | 400,143 | | | | 182,978 | |
| Cartrack Holdings, Ltd. | | | 43,100 | | | | 65,350 | |
| Trellidor Holdings, Ltd. | | | 344,300 | | | | 149,155 | |
| | | | | | | | 397,483 | |
| | | | | | | | | |
| South Korea (1.70%) | | | | | | | | |
| Daebongls Co., Ltd. | | | 898 | | | | 9,543 | |
See Notes to Financial Statements.
| Annual Report | April 30, 2018 | 33 |
| Grandeur Peak Global Micro Cap Fund | Portfolio of Investments |
April 30, 2018
| | | Shares | | | Value
(Note 2) | |
| South Korea (continued) | | | | | | | | |
| Hy-Lok Corp. | | | 6,412 | | | $ | 165,696 | |
| ISC Co., Ltd. | | | 12,695 | | | | 184,235 | |
| LEENO Industrial, Inc. | | | 4,800 | | | | 257,516 | |
| Vitzrocell Co., Ltd.(a)(d) | | | 11,180 | | | | 91,948 | |
| | | | | | | | 708,938 | |
| | | | | | | | | |
| Sri Lanka (0.37%) | | | | | | | | |
| Royal Ceramics Lanka PLC | | | 224,570 | | | | 152,372 | |
| | | | | | | | | |
| Sweden (2.81%) | | | | | | | | |
| Absolent Group AB | | | 11,329 | | | | 157,839 | |
| Bufab AB | | | 14,221 | | | | 192,609 | |
| HIQ International AB | | | 26,600 | | | | 215,676 | |
| Swedencare AB(a) | | | 44,878 | | | | 173,738 | |
| TF Bank AB(c) | | | 11,400 | | | | 101,546 | |
| Vitec Software Group AB, Class B | | | 35,500 | | | | 332,433 | |
| | | | | | | | 1,173,841 | |
| | | | | | | | | |
| Taiwan (4.79%) | | | | | | | | |
| I Yuan Precision Ind Co., Ltd. | | | 3,000 | | | | 6,084 | |
| Materials Analysis Technology, Inc. | | | 48,045 | | | | 114,971 | |
| Rafael Microelectronics, Inc. | | | 32,000 | | | | 155,206 | |
| RiTdisplay Corp. | | | 77,000 | | | | 309,702 | |
| Sinmag Equipment Corp. | | | 34,000 | | | | 177,547 | |
| Sitronix Technology Corp. | | | 66,000 | | | | 190,060 | |
| Sporton International, Inc. | | | 24,481 | | | | 136,114 | |
| Tai Shing Electronics Components Corp. | | | 135,000 | | | | 319,402 | |
| Tehmag Foods Corp. | | | 25,300 | | | | 188,126 | |
| TSC Auto ID Technology Co., Ltd. | | | 27,000 | | | | 213,543 | |
| TTFB Co., Ltd. | | | 24,000 | | | | 188,600 | |
| | | | | | | | 1,999,355 | |
| | | | | | | | | |
| Turkey (0.86%) | | | | | | | | |
| DP Eurasia NV(a)(b)(c) | | | 137,500 | | | | 359,663 | |
| | | | | | | | | |
| United States (14.10%) | | | | | | | | |
| Aratana Therapeutics, Inc.(a) | | | 31,500 | | | | 162,225 | |
| DXP Enterprises, Inc.(a) | | | 11,075 | | | | 402,022 | |
| Esquire Financial Holdings, Inc.(a) | | | 32,060 | | | | 772,325 | |
| First of Long Island Corp. | | | 13,150 | | | | 348,475 | |
| GBGI, Ltd. | | | 192,500 | | | | 234,538 | |
| Hackett Group, Inc. | | | 18,175 | | | | 294,617 | |
| Heska Corp.(a) | | | 10,000 | | | | 816,200 | |
| Hingham Institution for Savings | | | 2,715 | | | | 553,860 | |
| Kinsale Capital Group, Inc. | | | 2,725 | | | | 140,474 | |
| LeMaitre Vascular, Inc. | | | 3,192 | | | | 100,388 | |
| LGI Homes, Inc.(a) | | | 2,900 | | | | 200,680 | |
| Malibu Boats, Inc., Class A(a) | | | 4,686 | | | | 157,918 | |
| NV5 Global, Inc.(a) | | | 2,375 | | | | 139,769 | |
| | | Shares | | | Value
(Note 2) | |
| United States (continued) | | | | | | | | |
| People's Utah Bancorp | | | 4,700 | | | $ | 149,695 | |
| Reis, Inc. | | | 7,450 | | | | 156,450 | |
| Resources Connection, Inc. | | | 9,450 | | | | 147,892 | |
| Seacoast Commerce Banc Holdings | | | 15,325 | | | | 308,033 | |
| Smart Sand, Inc.(a) | | | 36,199 | | | | 264,977 | |
| STAAR Surgical Co.(a) | | | 11,050 | | | | 179,563 | |
| Transcat, Inc.(a) | | | 15,166 | | | | 250,239 | |
| Veracyte, Inc.(a) | | | 16,258 | | | | 98,523 | |
| | | | | | | | 5,878,863 | |
| | | | | | | | | |
| Vietnam (1.31%) | | | | | | | | |
| Lix Detergent JSC | | | 152,700 | | | | 301,865 | |
| Taisun Int'l Holding Corp. | | | 50,000 | | | | 243,354 | |
| | | | | | | | 545,219 | |
| | | | | | | | | |
| TOTAL COMMON STOCKS | | | | | | | | |
| (Cost $32,860,834) | | | | | | | 40,588,155 | |
| | | Principal
Amount | | | Value
(Note 2) | |
| CORPORATE BONDS (0.45%) | | | | | | | | |
| Germany (0.36%) | | | | | | | | |
| publity AG 3.50%, 11/17/2020 | | $ | 150,000 | | | $ | 150,165 | |
| | | | | | | | | |
| Malaysia (0.09%) | | | | | | | | |
| AEON Credit Service M Bhd 3.50%, 09/15/2020 | | | 129,900 | | | | 38,737 | |
| | | | | | | | | |
| TOTAL CORPORATE BONDS | | | | | | | | |
| (Cost $195,634) | | | | | | | 188,902 | |
| | | | | | | | | |
| TOTAL INVESTMENTS (97.76%) | | | | | | | | |
| (Cost $33,056,468) | | | | | | $ | 40,777,057 | |
| | | | | | | | | |
| Other Assets In Excess Of Liabilities (2.24%) | | | | | | | 932,293 | |
| | | | | | | | | |
| NET ASSETS (100.00%) | | | | | | $ | 41,709,350 | |
See Notes to Financial Statements.
| 34 | 1.855.377.7325 | www.GrandeurPeakGlobal.com |
| Grandeur Peak Global Micro Cap Fund | Portfolio of Investments |
April 30, 2018
| (a) | Non-Income Producing Security. |
| (b) | Security exempt from registration under Rule 144A of the Securities Act of 1933. These securities may be resold in the ordinary course of business in transactions exempt from registration, normally to qualified institutional buyers. As of April 30, 2018, these securities had a total aggregate market value of $3,192,745 representing 7.65% of net assets. |
| (c) | Security was purchased pursuant to Regulation S under the Securities Act of 1933, which exempts securities offered and sold outside of the United States from registration. Such security cannot be sold in the United States without either an effective registration statement filed pursuant to the Securities Act of 1933, or pursuant to an exemption from registration. The security has been deemed liquid under guidelines approved by the Fund's Board of Trustees. As of April 30, 2018, the aggregate market value of those securities was $4,553,127, representing 10.92% of net assets. |
| (d) | As a result of the use of significant unobservable inputs to determine fair value, these investments have been classified as level 3 assets. See also footnote 2 to the financial statements for additional information. |
For Fund compliance purposes, the Fund's geographical classifications refer to any one or more of the country sub-classifications used by one or more widely recognized market indexes or ratings group indexes, and/or as defined by Fund management. This definition may not apply for purposes of this report, which may combine sub-classifications for reporting ease. Geographical regions are shown as a percentage of net assets.
See Notes to Financial Statements.
| Annual Report | April 30, 2018 | 35 |
| Grandeur Peak Global Opportunities Fund | Portfolio of Investments |
April 30, 2018
| | | Shares | | | Value
(Note 2) | |
| COMMON STOCKS (100.70%) | | | | | | | | |
| Argentina (0.39%) | | | | | | | | |
| Globant SA(a) | | | 67,375 | | | $ | 3,032,549 | |
| | | | | | | | | |
| Australia (1.37%) | | | | | | | | |
| Blue Sky Alternative Investments, Ltd. | | | 663,700 | | | | 1,538,973 | |
| Class, Ltd. | | | 797,195 | | | | 1,380,387 | |
| Greencross, Ltd. | | | 242,916 | | | | 971,089 | |
| IPH, Ltd. | | | 499,167 | | | | 1,375,421 | |
| Magellan Financial Group, Ltd. | | | 151,464 | | | | 2,663,734 | |
| National Storage REIT | | | 1,661,347 | | | | 2,001,193 | |
| National Veterinary Care, Ltd. | | | 397,700 | | | | 721,575 | |
| | | | | | | | 10,652,372 | |
| | | | | | | | | |
| Austria (1.02%) | | | | | | | | |
| Palfinger AG | | | 212,735 | | | | 7,989,555 | |
| | | | | | | | | |
| Bangladesh (0.32%) | | | | | | | | |
| Square Pharmaceuticals, Ltd. | | | 668,185 | | | | 2,469,930 | |
| | | | | | | | | |
| Belgium (0.72%) | | | | | | | | |
| Melexis NV | | | 59,193 | | | | 5,650,612 | |
| | | | | | | | | |
| Bermuda (0.34%) | | | | | | | | |
| Bank of NT Butterfield & Son, Ltd. | | | 56,600 | | | | 2,685,670 | |
| | | | | | | | | |
| Brazil (0.50%) | | | | | | | | |
| Fleury SA | | | 312,100 | | | | 2,326,139 | |
| Hapvida Participacoes e Investimentos SA(a)(b)(c) | | | 43,300 | | | | 341,758 | |
| Notre Dame Intermedica Participacoes SA(a) | | | 215,400 | | | | 1,250,638 | |
| | | | | | | | 3,918,535 | |
| | | | | | | | | |
| Britain (10.71%) | | | | | | | | |
| Arrow Global Group PLC | | | 607,739 | | | | 3,108,246 | |
| Ascential PLC | | | 601,800 | | | | 3,491,292 | |
| B&M European Value Retail SA | | | 1,065,300 | | | | 5,944,125 | |
| boohoo.com PLC(a) | | | 1,140,400 | | | | 2,877,790 | |
| Clinigen Group PLC | | | 605,876 | | | | 7,319,312 | |
| Close Brothers Group PLC | | | 132,522 | | | | 2,802,326 | |
| Diploma PLC | | | 175,800 | | | | 2,918,808 | |
| Domino's Pizza Group PLC | | | 624,200 | | | | 3,121,969 | |
| EMIS Group PLC | | | 241,917 | | | | 2,837,562 | |
| Intertek Group PLC | | | 39,800 | | | | 2,685,389 | |
| JTC PLC(a)(b)(c) | | | 1,012,700 | | | | 4,273,175 | |
| Metro Bank PLC(a) | | | 75,800 | | | | 3,445,765 | |
| On the Beach Group PLC(b)(c) | | | 608,300 | | | | 5,125,174 | |
| Oxford Immunotec Global PLC(a) | | | 281,879 | | | | 3,616,508 | |
| Premier Asset Management Group PLC | | | 420,400 | | | | 1,429,549 | |
| | | Shares | | | Value
(Note 2) | |
| Britain (continued) | | | | | | | | |
| River & Mercantile Group PLC | | | 477,200 | | | $ | 2,010,302 | |
| RPS Group PLC | | | 1,508,839 | | | | 5,369,612 | |
| Sabre Insurance Group PLC(a)(b)(c) | | | 859,300 | | | | 3,028,476 | |
| Sanne Group PLC | | | 644,314 | | | | 5,508,440 | |
| Secure Trust Bank PLC | | | 87,000 | | | | 2,485,288 | |
| St James's Place PLC | | | 266,400 | | | | 4,168,147 | |
| Ted Baker PLC | | | 77,525 | | | | 2,843,252 | |
| Ultra Electronics Holdings PLC | | | 160,050 | | | | 3,102,400 | |
| | | | | | | | 83,512,907 | |
| | | | | | | | | |
| Canada (2.80%) | | | | | | | | |
| Biosyent, Inc.(a) | | | 233,500 | | | | 1,818,607 | |
| Cipher Pharmaceuticals, Inc.(a) | | | 588,400 | | | | 1,658,949 | |
| Richelieu Hardware, Ltd. | | | 258,165 | | | | 5,571,675 | |
| Ritchie Bros Auctioneers, Inc. | | | 124,825 | | | | 4,085,522 | |
| Spartan Energy Corp.(a) | | | 370,934 | | | | 1,837,408 | |
| Stantec, Inc. | | | 268,212 | | | | 6,824,632 | |
| | | | | | | | 21,796,793 | |
| | | | | | | | | |
| China (5.91%) | | | | | | | | |
| BBI Life Sciences Corp.(c) | | | 13,832,000 | | | | 5,745,233 | |
| BrightKing Holdings, Ltd. | | | 191,000 | | | | 467,389 | |
| China Medical System Holdings, Ltd. | | | 3,504,000 | | | | 8,643,198 | |
| CSPC Pharmaceutical Group, Ltd. | | | 871,000 | | | | 2,241,685 | |
| Man Wah Holdings, Ltd. | | | 13,153,200 | | | | 9,786,994 | |
| O2Micro International, Ltd., ADR(a) | | | 870,186 | | | | 1,200,857 | |
| On-Bright Electronics, Inc. | | | 724,181 | | | | 5,911,132 | |
| Silergy Corp. | | | 353,852 | | | | 7,439,066 | |
| Xiabuxiabu Catering Management China Holdings Co., Ltd.(b)(c) | | | 2,700,000 | | | | 4,657,871 | |
| | | | | | | | 46,093,425 | |
| | | | | | | | | |
| Colombia (1.06%) | | | | | | | | |
| Amerisur Resources PLC(a) | | | 3,109,700 | | | | 744,060 | |
| Gran Tierra Energy, Inc.(a) | | | 775,950 | | | | 2,568,394 | |
| Parex Resources, Inc.(a) | | | 288,300 | | | | 4,960,121 | |
| | | | | | | | 8,272,575 | |
| | | | | | | | | |
| Egypt (0.08%) | | | | | | | | |
| Integrated Diagnostics Holdings PLC(b)(c) | | | 131,600 | | | | 625,100 | |
| | | | | | | | | |
| Finland (0.37%) | | | | | | | | |
| Metso OYJ | | | 81,000 | | | | 2,894,365 | |
| | | | | | | | | |
| France (1.94%) | | | | | | | | |
| Alten SA | | | 17,853 | | | | 1,774,330 | |
| BioMerieux | | | 39,200 | | | | 3,105,369 | |
| Bureau Veritas SA | | | 93,100 | | | | 2,434,057 | |
| Esker SA | | | 30,047 | | | | 2,010,176 | |
See Notes to Financial Statements.
| 36 | 1.855.377.7325 | www.GrandeurPeakGlobal.com |
| Grandeur Peak Global Opportunities Fund | Portfolio of Investments |
April 30, 2018
| | | Shares | | | Value
(Note 2) | |
| France (continued) | | | | | | |
| Infotel SA | | | 12,620 | | | $ | 815,336 | |
| Medicrea International(a) | | | 91,851 | | | | 332,758 | |
| Neurones | | | 39,608 | | | | 1,224,464 | |
| Thermador Groupe | | | 23,869 | | | | 3,444,493 | |
| | | | | | | | 15,140,983 | |
| | | | | | | | | |
| Georgia (1.06%) | | | | | | | | |
| BGEO Group PLC | | | 111,900 | | | | 5,361,036 | |
| TBC Bank Group PLC | | | 114,900 | | | | 2,907,401 | |
| | | | | | | | 8,268,437 | |
| | | | | | | | | |
| Germany (4.03%) | | | | | | | | |
| Aroundtown SA | | | 734,200 | | | | 5,869,426 | |
| Dermapharm Holding SE(a) | | | 75,700 | | | | 2,513,922 | |
| GRENKE AG | | | 20,700 | | | | 2,445,989 | |
| Nexus AG | | | 125,024 | | | | 4,182,119 | |
| Norma Group SE | | | 76,768 | | | | 5,650,374 | |
| PATRIZIA Immobilien AG(a) | | | 187,213 | | | | 3,748,381 | |
| publity AG | | | 83,400 | | | | 1,329,423 | |
| Wirecard AG | | | 41,885 | | | | 5,720,637 | |
| | | | | | | | 31,460,271 | |
| | | | | | | | | |
| Hong Kong (2.13%) | | | | | | | | |
| International Housewares Retail Co., Ltd. | | | 12,296,000 | | | | 2,490,956 | |
| Samsonite International SA | | | 845,000 | | | | 3,832,761 | |
| Value Partners Group, Ltd. | | | 7,593,000 | | | | 7,255,706 | |
| Vitasoy International Holdings, Ltd. | | | 1,135,483 | | | | 3,016,420 | |
| | | | | | | | 16,595,843 | |
| | | | | | | | | |
| India (6.13%) | | | | | | | | |
| Alkem Laboratories, Ltd. | | | 209,631 | | | | 6,207,735 | |
| Bajaj Finance, Ltd. | | | 196,250 | | | | 5,609,621 | |
| Byke Hospitality, Ltd. | | | 869,500 | | | | 2,486,426 | |
| City Union Bank, Ltd. | | | 503,593 | | | | 1,387,258 | |
| Cyient, Ltd. | | | 532,616 | | | | 6,072,333 | |
| Genpact, Ltd. | | | 52,450 | | | | 1,672,631 | |
| Indiabulls Housing Finance, Ltd. | | | 82,000 | | | | 1,605,844 | |
| Kellton Tech Solutions, Ltd.(a) | | | 1,186,000 | | | | 1,170,184 | |
| Kovai Medical Center and Hospital | | | 25,501 | | | | 470,416 | |
| L&T Finance Holdings, Ltd. | | | 1,114,000 | | | | 2,890,992 | |
| L&T Technology Services, Ltd.(b)(c) | | | 29,848 | | | | 594,634 | |
| SBI Life Insurance Co., Ltd.(b)(c) | | | 73,797 | | | | 821,674 | |
| Thyrocare Technologies, Ltd. | | | 75,500 | | | | 756,753 | |
| Time Technoplast, Ltd. | | | 1,450,205 | | | | 3,488,619 | |
| Vakrangee, Ltd. | | | 1,189,000 | | | | 1,780,650 | |
| WNS Holdings, Ltd., ADR(a) | | | 158,125 | | | | 7,737,056 | |
| Yes Bank, Ltd. | | | 561,000 | | | | 3,042,883 | |
| | | | | | | | 47,795,709 | |
| | | Shares | | | Value
(Note 2) | |
| Indonesia (1.97%) | | | | | | | | |
| Arwana Citramulia Tbk PT | | | 59,516,800 | | | $ | 1,488,722 | |
| Astra Graphia Tbk PT | | | 7,527,400 | | | | 784,527 | |
| Delfi, Ltd. | | | 1,572,400 | | | | 1,719,442 | |
| Link Net Tbk PT | | | 3,945,800 | | | | 1,531,523 | |
| Panin Sekuritas Tbk PT | | | 4,960,800 | | | | 591,909 | |
| Selamat Sempurna Tbk PT | | | 59,713,000 | | | | 6,223,457 | |
| Tempo Scan Pacific Tbk PT | | | 15,553,000 | | | | 1,777,486 | |
| Ultrajaya Milk Industry & Trading Co., Tbk PT | | | 11,829,000 | | | | 1,266,861 | |
| | | | | | | | 15,383,927 | |
| | | | | | | | | |
| Ireland (0.33%) | | | | | | | | |
| Irish Residential Properties REIT PLC | | | 1,553,046 | | | | 2,554,375 | |
| | | | | | | | | |
| Israel (0.67%) | | | | | | | | |
| Wix.com, Ltd.(a) | | | 63,409 | | | | 5,215,390 | |
| | | | | | | | | |
| Italy (0.62%) | | | | | | | | |
| Brembo SpA | | | 182,700 | | | | 2,702,700 | |
| DiaSorin SpA | | | 22,591 | | | | 2,137,459 | |
| | | | | | | | 4,840,159 | |
| | | | | | | | | |
| Japan (8.15%) | | | | | | | | |
| AIT Corp. | | | 365,500 | | | | 4,012,075 | |
| Amiyaki Tei Co., Ltd. | | | 51,900 | | | | 2,549,424 | |
| Arcland Service Holdings Co., Ltd. | | | 144,100 | | | | 3,087,104 | |
| Create SD Holdings Co., Ltd. | | | 236,700 | | | | 6,863,694 | |
| Dip Corp. | | | 95,000 | | | | 2,309,824 | |
| Future Corp. | | | 220,300 | | | | 2,545,178 | |
| Japan Lifeline Co., Ltd. | | | 104,800 | | | | 3,096,451 | |
| M&A Capital Partners Co., Ltd.(a) | | | 78,400 | | | | 5,672,741 | |
| Macromill, Inc. | | | 47,300 | | | | 1,277,688 | |
| MISUMI Group, Inc. | | | 169,100 | | | | 4,686,910 | |
| Naigai Trans Line, Ltd. | | | 55,300 | | | | 928,749 | |
| Nihon M&A Center, Inc. | | | 178,000 | | | | 5,226,674 | |
| Nippon Valqua Industries, Ltd. | | | 70,900 | | | | 1,958,635 | |
| Prestige International, Inc. | | | 64,400 | | | | 742,850 | |
| Qol Co., Ltd. | | | 114,100 | | | | 2,346,293 | |
| Seria Co., Ltd. | | | 37,000 | | | | 1,814,124 | |
| Synchro Food Co., Ltd.(a) | | | 299,700 | | | | 3,004,676 | |
| Syuppin Co., Ltd. | | | 250,300 | | | | 2,825,377 | |
| Tokyo Century Corp. | | | 42,100 | | | | 2,634,138 | |
| Trancom Co., Ltd. | | | 78,270 | | | | 5,942,563 | |
| | | | | | | | 63,525,168 | |
| | | | | | | | | |
| Luxembourg (0.77%) | | | | | | | | |
| Grand City Properties SA | | | 116,300 | | | | 2,808,878 | |
| L'Occitane International SA | | | 1,696,753 | | | | 3,160,611 | |
| | | | | | | | 5,969,489 | |
| | | | | | | | | |
| Malaysia (0.72%) | | | | | | | | |
| AEON Credit Service M Bhd | | | 880,220 | | | | 2,934,441 | |
See Notes to Financial Statements.
| Annual Report | April 30, 2018 | 37 |
| Grandeur Peak Global Opportunities Fund | Portfolio of Investments |
April 30, 2018
| | | Shares | | | Value
(Note 2) | |
| Malaysia (continued) | | | | | | | | |
| My EG Services Bhd | | | 4,027,600 | | | $ | 2,689,515 | |
| | | | | | | | 5,623,956 | |
| | | | | | | | | |
| Mexico (0.63%) | | | | | | | | |
| Credito Real SAB de CV SOFOM ER(a) | | | 1,688,349 | | | | 2,459,122 | |
| Regional SAB de CV | | | 383,034 | | | | 2,438,041 | |
| | | | | | | | 4,897,163 | |
| | | | | | | | | |
| Netherlands (0.56%) | | | | | | | | |
| Aalberts Industries NV | | | 87,822 | | | | 4,331,241 | |
| | | | | | | | | |
| New Zealand (0.65%) | | | | | | | | |
| CBL Corp., Ltd.(d) | | | 1,107,672 | | | | 179,252 | |
| Restaurant Brands New Zealand, Ltd. | | | 961,802 | | | | 4,858,878 | |
| | | | | | | | 5,038,130 | |
| | | | | | | | | |
| Norway (1.89%) | | | | | | | | |
| Medistim ASA | | | 152,700 | | | | 1,511,335 | |
| Multiconsult ASA(b)(c) | | | 156,000 | | | | 1,322,314 | |
| Norwegian Finans Holding ASA(a) | | | 127,567 | | | | 1,555,171 | |
| Sbanken ASA(b)(c) | | | 761,300 | | | | 6,880,103 | |
| TGS NOPEC Geophysical Co., ASA | | | 109,400 | | | | 3,466,522 | |
| | | | | | | | 14,735,445 | |
| | | | | | | | | |
| Oman (0.30%) | | | | | | | | |
| Tethys Oil AB | | | 257,300 | | | | 2,306,596 | |
| | | | | | | | | |
| Peru (0.97%) | | | | | | | | |
| Alicorp SAA | | | 1,359,162 | | | | 4,992,925 | |
| Credicorp, Ltd. | | | 11,050 | | | | 2,569,015 | |
| | | | | | | | 7,561,940 | |
| | | | | | | | | |
| Philippines (1.75%) | | | | | | | | |
| Concepcion Industrial Corp. | | | 1,227,152 | | | | 1,422,799 | |
| Pepsi-Cola Products Philippines, Inc. | | | 25,184,900 | | | | 1,275,074 | |
| Puregold Price Club, Inc. | | | 5,230,000 | | | | 4,790,423 | |
| Robinsons Retail Holdings, Inc. | | | 1,096,000 | | | | 1,927,284 | |
| Security Bank Corp. | | | 1,051,640 | | | | 4,247,244 | |
| | | | | | | | 13,662,824 | |
| | | | | | | | | |
| Poland (0.82%) | | | | | | | | |
| Dino Polska SA(a)(b)(c) | | | 146,023 | | | | 3,952,358 | |
| LiveChat Software SA | | | 76,200 | | | | 966,110 | |
| PGS Software SA | | | 120,487 | | | | 384,476 | |
| Wawel SA | | | 3,656 | | | | 1,083,306 | |
| | | | | | | | 6,386,250 | |
| | | Shares | | | Value
(Note 2) | |
| Singapore (0.40%) | | | | | | | | |
| Riverstone Holdings, Ltd. | | | 3,984,200 | | | $ | 3,154,909 | |
| | | | | | | | | |
| South Africa (0.87%) | | | | | | | | |
| Cartrack Holdings, Ltd. | | | 1,715,256 | | | | 2,600,749 | |
| Cashbuild, Ltd. | | | 53,100 | | | | 1,853,069 | |
| EOH Holdings, Ltd. | | | 167,000 | | | | 508,302 | |
| Italtile, Ltd. | | | 1,595,243 | | | | 1,835,201 | |
| | | | | | | | 6,797,321 | |
| | | | | | | | | |
| South Korea (1.95%) | | | | | | | | |
| Hy-Lok Corp. | | | 159,212 | | | | 4,114,275 | |
| ISC Co., Ltd. | | | 141,074 | | | | 2,047,326 | |
| Kakao M Corp. | | | 26,500 | | | | 2,220,636 | |
| Koh Young Technology, Inc. | | | 26,081 | | | | 2,485,881 | |
| LEENO Industrial, Inc. | | | 46,500 | | | | 2,494,687 | |
| Medy-Tox, Inc. | | | 2,870 | | | | 1,874,549 | |
| | | | | | | | 15,237,354 | |
| | | | | | | | | |
| Sweden (2.71%) | | | | | | | | |
| AddTech AB, Class B | | | 182,127 | | | | 3,797,844 | |
| Beijer Alma AB | | | 85,931 | | | | 2,477,840 | |
| Bufab AB | | | 215,908 | | | | 2,924,256 | |
| HIQ International AB | | | 144,392 | | | | 1,170,748 | |
| Hoist Finance AB(b)(c) | | | 247,700 | | | | 2,197,905 | |
| Indutrade AB | | | 180,100 | | | | 4,265,643 | |
| Moberg Pharma AB(a) | | | 114,016 | | | | 352,856 | |
| Nibe Industrier AB, Class B | | | 308,400 | | | | 3,155,618 | |
| TF Bank AB(c) | | | 86,200 | | | | 767,828 | |
| | | | | | | | 21,110,538 | |
| | | | | | | | | |
| Switzerland (0.66%) | | | | | | | | |
| Luxoft Holding, Inc.(a) | | | 52,975 | | | | 2,137,541 | |
| VZ Holding AG | | | 10,796 | | | | 3,044,886 | |
| | | | | | | | 5,182,427 | |
| | | | | | | | | |
| Taiwan (1.19%) | | | | | | | | |
| ASPEED Technology, Inc. | | | 42,237 | | | | 1,213,440 | |
| Sinmag Equipment Corp. | | | 330,842 | | | | 1,727,649 | |
| Sporton International, Inc. | | | 773,249 | | | | 4,299,240 | |
| Test Research, Inc. | | | 665,000 | | | | 1,229,463 | |
| TSC Auto ID Technology Co., Ltd. | | | 104,000 | | | | 822,537 | |
| | | | | | | | 9,292,329 | |
| | | | | | | | | |
| Thailand (0.32%) | | | | | | | | |
| Srisawad Corp., PCL | | | 1,532,000 | | | | 2,524,208 | |
| | | | | | | | | |
| United Arab Emirates (0.19%) | | | | | | | | |
| Aramex PJSC | | | 1,364,364 | | | | 1,504,342 | |
| | | | | | | | | |
| United States (29.87%) | | | | | | | | |
| Aratana Therapeutics, Inc.(a) | | | 282,375 | | | | 1,454,231 | |
| Bank of the Ozarks | | | 123,250 | | | | 5,768,100 | |
See Notes to Financial Statements.
| 38 | 1.855.377.7325 | www.GrandeurPeakGlobal.com |
| Grandeur Peak Global Opportunities Fund | Portfolio of Investments |
April 30, 2018
| | | Shares | | | Value
(Note 2) | |
| United States (continued) | | | | | | | | |
| BioDelivery Sciences International, Inc.(a) | | | 407,328 | | | $ | 814,656 | |
| Blackline, Inc.(a) | | | 29,150 | | | | 1,206,810 | |
| CoBiz Financial, Inc. | | | 40,750 | | | | 821,112 | |
| Core Laboratories NV | | | 45,100 | | | | 5,522,495 | |
| Diamond Hill Investment Group, Inc. | | | 13,575 | | | | 2,652,826 | |
| Docusign, Inc.(a) | | | 100 | | | | 3,863 | |
| DXP Enterprises, Inc.(a) | | | 102,725 | | | | 3,728,917 | |
| EPAM Systems, Inc.(a) | | | 75,850 | | | | 8,673,447 | |
| Esquire Financial Holdings, Inc.(a) | | | 13,051 | | | | 314,399 | |
| ExlService Holdings, Inc.(a) | | | 52,700 | | | | 3,046,587 | |
| Fastenal Co. | | | 114,850 | | | | 5,741,351 | |
| First of Long Island Corp. | | | 25,425 | | | | 673,762 | |
| First Republic Bank | | | 96,400 | | | | 8,952,668 | |
| FirstCash, Inc. | | | 183,888 | | | | 15,943,090 | |
| Gentex Corp. | | | 137,475 | | | | 3,126,182 | |
| Grand Canyon Education, Inc.(a) | | | 21,225 | | | | 2,207,188 | |
| Hackett Group, Inc. | | | 149,500 | | | | 2,423,395 | |
| Hamilton Lane, Inc., Class A | | | 155,468 | | | | 6,506,336 | |
| Heska Corp.(a) | | | 47,150 | | | | 3,848,383 | |
| Hingham Institution for Savings | | | 20,620 | | | | 4,206,480 | |
| Home BancShares, Inc. | | | 387,875 | | | | 9,014,215 | |
| IDEX Corp. | | | 40,600 | | | | 5,426,596 | |
| Inphi Corp.(a) | | | 135,000 | | | | 3,858,300 | |
| Kinsale Capital Group, Inc. | | | 70,550 | | | | 3,636,853 | |
| Knight-Swift Transportation Holdings, Inc. | | | 439,970 | | | | 17,163,230 | |
| LeMaitre Vascular, Inc. | | | 63,473 | | | | 1,996,226 | |
| LGI Homes, Inc.(a) | | | 59,501 | | | | 4,117,469 | |
| Littelfuse, Inc. | | | 8,075 | | | | 1,509,379 | |
| LKQ Corp.(a) | | | 79,900 | | | | 2,478,498 | |
| Lululemon Athletica, Inc.(a) | | | 52,125 | | | | 5,202,075 | |
| MarketAxess Holdings, Inc. | | | 39,575 | | | | 7,860,782 | |
| MEDNAX, Inc.(a) | | | 100,975 | | | | 4,635,762 | |
| Microchip Technology, Inc. | | | 55,545 | | | | 4,646,895 | |
| Monro, Inc. | | | 102,700 | | | | 5,746,065 | |
| MSC Industrial Direct Co., Inc., Class A | | | 86,350 | | | | 7,464,094 | |
| NOW, Inc.(a) | | | 227,010 | | | | 2,753,631 | |
| NV5 Global, Inc.(a) | | | 50,875 | | | | 2,993,994 | |
| Paycom Software, Inc.(a) | | | 40,675 | | | | 4,645,492 | |
| Power Integrations, Inc. | | | 208,475 | | | | 14,134,605 | |
| PRA Group, Inc.(a) | | | 146,475 | | | | 5,214,510 | |
| Resources Connection, Inc. | | | 225,454 | | | | 3,528,355 | |
| Signature Bank(a) | | | 21,600 | | | | 2,746,440 | |
| Silicon Laboratories, Inc.(a) | | | 71,515 | | | | 6,643,744 | |
| Smart Sand, Inc.(a) | | | 475,699 | | | | 3,482,117 | |
| STAAR Surgical Co.(a) | | | 103,397 | | | | 1,680,201 | |
| SVB Financial Group(a) | | | 26,425 | | | | 7,917,194 | |
| TriMas Corp.(a) | | | 145,225 | | | | 3,935,598 | |
| | | Shares | | | Value
(Note 2) | |
| United States (continued) | | | | | | | | |
| Veracyte, Inc.(a) | | | 147,402 | | | $ | 893,256 | |
| | | | | | | | 232,961,854 | |
| | | | | | | | | |
| Vietnam (0.86%) | | | | | | | | |
| Ho Chi Minh City Development Joint Stock Commercial Bank | | | 2,005,870 | | | | 3,771,443 | |
| Vietnam Dairy Products JSC | | | 358,800 | | | | 2,915,984 | |
| | | | | | | | 6,687,427 | |
| | | | | | | | | |
| TOTAL COMMON STOCKS | | | | | | | | |
| (Cost $557,832,948) | | | | | | | 785,340,393 | |
| | | Principal
Amount | | | Value
(Note 2) | |
| CORPORATE BONDS (0.07%) | | | | | | | | |
| Malaysia (0.07%) | | | | | | | | |
| AEON Credit Service M Bhd 3.50%, 09/15/2020 | | $ | 1,678,440 | | | $ | 500,516 | |
| | | | | | | | | |
| TOTAL CORPORATE BONDS | | | | | | | | |
| (Cost $398,727) | | | | | | | 500,516 | |
| | | | | | | | | |
| TOTAL INVESTMENTS (100.77%) | | | | | | | | |
| (Cost $558,231,675) | | | | | | $ | 785,840,909 | |
| | | | | | | | | |
| Liabilities In Excess Of Other Assets (-0.77%) | | | | (5,991,732 | ) |
| | | | | | | | | |
| NET ASSETS (100.00%) | | | | | | $ | 779,849,177 | |
| (a) | Non-Income Producing Security. |
| (b) | Security exempt from registration under Rule 144A of the Securities Act of 1933. These securities may be resold in the ordinary course of business in transactions exempt from registration, normally to qualified institutional buyers. As of April 30, 2018, these securities had a total aggregate market value of $33,820,542 representing 4.34% of net assets. |
| (c) | Security was purchased pursuant to Regulation S under the Securities Act of 1933, which exempts securities offered and sold outside of the United States from registration. Such security cannot be sold in the United States without either an effective registration statement filed pursuant to the Securities Act of 1933, or pursuant to an exemption from registration. The security has been deemed liquid under guidelines approved by the Fund's Board of Trustees. As of April 30, 2018, the aggregate market value of those securities was $40,333,605, representing 5.17% of net assets. |
| (d) | As a result of the use of significant unobservable inputs to determine fair value, these investments have been classified as level 3 assets. See also footnote 2 to the financial statements for additional information. |
See Notes to Financial Statements.
| Annual Report | April 30, 2018 | 39 |
| Grandeur Peak Global Opportunities Fund | Portfolio of Investments |
April 30, 2018
For Fund compliance purposes, the Fund's geographical classifications refer to any one or more of the country sub-classifications used by one or more widely recognized market indexes or ratings group indexes, and/or as defined by Fund management. This definition may not apply for purposes of this report, which may combine sub-classifications for reporting ease. Geographical regions are shown as a percentage of net assets.
See Notes to Financial Statements.
| 40 | 1.855.377.7325 | www.GrandeurPeakGlobal.com |
| Grandeur Peak Global Reach Fund | Portfolio of Investments |
| | | Shares | | | Value
(Note 2) | |
| COMMON STOCKS (100.03%) | | | | | | | | |
| Argentina (0.70%) | | | | | | | | |
| Banco Macro SA, ADR | | | 3,350 | | | $ | 324,682 | |
| Despegar.com Corp.(a) | | | 18,900 | | | | 554,904 | |
| Globant SA(a) | | | 22,463 | | | | 1,011,060 | |
| Grupo Financiero Galicia SA, ADR | | | 5,650 | | | | 361,148 | |
| Grupo Supervielle SA, ADR | | | 12,050 | | | | 336,677 | |
| | | | | | | | 2,588,471 | |
| | | | | | | | | |
| Australia (2.85%) | | | | | | | | |
| Appen, Ltd. | | | 23,342 | | | | 169,404 | |
| Australian Ethical Investment, Ltd. | | | 4,878 | | | | 495,774 | |
| Beacon Lighting Group, Ltd. | | | 359,880 | | | | 400,985 | |
| Blue Sky Alternative Investments, Ltd. | | | 579,002 | | | | 1,342,578 | |
| Class, Ltd. | | | 436,300 | | | | 755,478 | |
| Fiducian Group, Ltd. | | | 61,644 | | | | 199,557 | |
| Hub24, Ltd.(a) | | | 97,900 | | | | 817,378 | |
| IPH, Ltd. | | | 400,697 | | | | 1,104,093 | |
| Kogan.com, Ltd. | | | 191,956 | | | | 1,122,875 | |
| Mainstream Group Holdings, Ltd. | | | 1,860,800 | | | | 896,578 | |
| Mitula Group, Ltd.(a) | | | 1,381,173 | | | | 467,917 | |
| National Storage REIT | | | 447,698 | | | | 539,279 | |
| National Veterinary Care, Ltd. | | | 249,500 | | | | 452,685 | |
| Netwealth Group, Ltd.(a) | | | 315,714 | | | | 1,711,335 | |
| | | | | | | | 10,475,916 | |
| | | | | | | | | |
| Austria (0.39%) | | | | | | | | |
| Palfinger AG | | | 38,148 | | | | 1,432,701 | |
| | | | | | | | | |
| Bangladesh (0.34%) | | | | | | | | |
| Square Pharmaceuticals, Ltd. | | | 335,766 | | | | 1,241,151 | |
| | | | | | | | | |
| Belgium (0.25%) | | | | | | | | |
| Melexis NV | | | 9,497 | | | | 906,591 | |
| | | | | | | | | |
| Bermuda (0.74%) | | | | | | | | |
| Bank of NT Butterfield & Son, Ltd. | | | 57,450 | | | | 2,726,003 | |
| | | | | | | | | |
| Brazil (0.96%) | | | | | | | | |
| Fleury SA | | | 122,300 | | | | 911,525 | |
| Hapvida Participacoes e Investimentos SA(a)(b)(c) | | | 44,200 | | | | 348,861 | |
| M Dias Branco SA | | | 59,200 | | | | 743,211 | |
| Notre Dame Intermedica Participacoes SA(a) | | | 101,400 | | | | 588,740 | |
| Pagseguro Digital, Ltd., Class A(a) | | | 28,600 | | | | 950,378 | |
| | | | | | | | 3,542,715 | |
| | | | | | | | | |
| Britain (11.55%) | | | | | | | | |
| AB Dynamics PLC | | | 95,393 | | | | 1,267,311 | |
| | | Shares | | | Value
(Note 2) | |
| Britain (continued) | | | | | | | | |
| Abcam PLC | | | 21,489 | | | $ | 361,220 | |
| Arrow Global Group PLC | | | 145,051 | | | | 741,855 | |
| Ascential PLC | | | 323,900 | | | | 1,879,078 | |
| B&M European Value Retail SA | | | 241,600 | | | | 1,348,072 | |
| boohoo.com PLC(a) | | | 510,600 | | | | 1,288,495 | |
| Clinigen Group PLC | | | 177,730 | | | | 2,147,075 | |
| Close Brothers Group PLC | | | 44,180 | | | | 934,235 | |
| Curtis Banks Group PLC | | | 214,200 | | | | 890,565 | |
| Diploma PLC | | | 81,700 | | | | 1,356,466 | |
| Domino’s Pizza Group PLC | | | 278,400 | | | | 1,392,432 | |
| dotdigital group PLC | | | 946,956 | | | | 1,153,752 | |
| EMIS Group PLC | | | 53,596 | | | | 628,654 | |
| Horizon Discovery Group PLC(a) | | | 282,600 | | | | 560,240 | |
| IDOX PLC | | | 550,000 | | | | 262,743 | |
| Impax Asset Management Group PLC | | | 390,442 | | | | 881,535 | |
| Intertek Group PLC | | | 11,400 | | | | 769,182 | |
| JTC PLC(a)(b)(c) | | | 470,542 | | | | 1,985,493 | |
| LoopUp Group PLC(a) | | | 218,949 | | | | 1,299,151 | |
| Metro Bank PLC(a) | | | 52,800 | | | | 2,400,216 | |
| Morses Club PLC | | | 475,200 | | | | 953,508 | |
| Mortgage Advice Bureau Holdings, Ltd. | | | 112,200 | | | | 962,322 | |
| On the Beach Group PLC(b)(c) | | | 275,700 | | | | 2,322,884 | |
| Oxford Immunotec Global PLC(a) | | | 68,850 | | | | 883,345 | |
| Premier Asset Management Group PLC | | | 314,200 | | | | 1,068,421 | |
| Premier Technical Services Group PLC | | | 232,587 | | | | 592,375 | |
| Purplebricks Group PLC(a) | | | 160,000 | | | | 762,141 | |
| RPS Group PLC | | | 287,699 | | | | 1,023,855 | |
| Sabre Insurance Group PLC(a)(b)(c) | | | 666,400 | | | | 2,348,629 | |
| Sanne Group PLC | | | 259,273 | | | | 2,216,605 | |
| Softcat PLC | | | 58,399 | | | | 553,138 | |
| St James’s Place PLC | | | 144,000 | | | | 2,253,053 | |
| Ted Baker PLC | | | 33,300 | | | | 1,221,287 | |
| Ultra Electronics Holdings PLC | | | 47,250 | | | | 915,891 | |
| WANdisco PLC(a) | | | 66,045 | | | | 882,874 | |
| | | | | | | | 42,508,098 | |
| | | | | | | | | |
| Canada (2.50%) | | | | | | | | |
| Biosyent, Inc.(a) | | | 111,100 | | | | 865,298 | |
| Birchcliff Energy, Ltd. | | | 111,300 | | | | 403,088 | |
| Cipher Pharmaceuticals, Inc.(a) | | | 160,200 | | | | 451,672 | |
| DIRTT Environmental Solutions(a) | | | 178,900 | | | | 784,460 | |
| NCS Multistage Holdings, Inc.(a) | | | 20,175 | | | | 367,589 | |
| Richelieu Hardware, Ltd. | | | 42,500 | | | | 917,228 | |
| Ritchie Bros Auctioneers, Inc. | | | 53,000 | | | | 1,734,690 | |
| Spartan Energy Corp.(a) | | | 252,400 | | | | 1,250,254 | |
| Stantec, Inc. | | | 62,520 | | | | 1,590,816 | |
| See Notes to Financial Statements. | |
| Annual Report | April 30, 2018 | 41 |
| Grandeur Peak Global Reach Fund | Portfolio of Investments |
April 30, 2018
| | | Shares | | | Value
(Note 2) | |
| Canada (continued) | | | | | | | | |
| TFI International, Inc. | | | 29,396 | | | $ | 851,006 | |
| | | | | | | | 9,216,101 | |
| | | | | | | | | |
| China (6.42%) | | | | | | | | |
| 58.com, Inc., ADR(a) | | | 4,750 | | | | 415,102 | |
| BBI Life Sciences Corp.(c) | | | 7,001,500 | | | | 2,908,129 | |
| BrightKing Holdings, Ltd. | | | 424,312 | | | | 1,038,318 | |
| China Medical System Holdings, Ltd. | | | 1,907,000 | | | | 4,703,932 | |
| CSPC Pharmaceutical Group, Ltd. | | | 399,000 | | | | 1,026,903 | |
| Essex Bio-technology, Ltd. | | | 1,248,000 | | | | 1,116,238 | |
| Hop Hing Group Holdings, Ltd. | | | 43,436,000 | | | | 1,018,293 | |
| JD.com, Inc., ADR(a) | | | 9,425 | | | | 344,107 | |
| Man Wah Holdings, Ltd. | | | 5,256,600 | | | | 3,911,315 | |
| O2Micro International, Ltd., ADR(a) | | | 292,039 | | | | 403,014 | |
| On-Bright Electronics, Inc. | | | 210,528 | | | | 1,718,436 | |
| Shanghai Haohai Biological Technology Co., Ltd., Class H(b)(c) | | | 217,700 | | | | 1,428,469 | |
| Silergy Corp. | | | 120,925 | | | | 2,542,219 | |
| Xiabuxiabu Catering Management China Holdings Co., Ltd.(b)(c) | | | 619,000 | | | | 1,067,860 | |
| | | | | | | | 23,642,335 | |
| | | | | | | | | |
| Colombia (1.34%) | | | | | | | | |
| Amerisur Resources PLC(a) | | | 5,262,400 | | | | 1,259,137 | |
| Gran Tierra Energy, Inc.(a) | | | 386,195 | | | | 1,278,305 | |
| Parex Resources, Inc.(a) | | | 139,061 | | | | 2,392,506 | |
| | | | | | | | 4,929,948 | |
| | | | | | | | | |
| Egypt (0.69%) | | | | | | | | |
| African Export-Import Bank, GDR(a) | | | 200,000 | | | | 795,000 | |
| Commercial International Bank Egypt SAE | | | 147,762 | | | | 785,470 | |
| Integrated Diagnostics Holdings PLC(b)(c) | | | 201,400 | | | | 956,650 | |
| | | | | | | | 2,537,120 | |
| | | | | | | | | |
| Finland (0.72%) | | | | | | | | |
| Ferratum OYJ(c) | | | 23,000 | | | | 740,199 | |
| Metso OYJ | | | 24,600 | | | | 879,029 | |
| Terveystalo Oyj(b)(c) | | | 43,700 | | | | 501,863 | |
| Tikkurila Oyj | | | 29,600 | | | | 535,460 | |
| | | | | | | | 2,656,551 | |
| | | | | | | | | |
| France (1.67%) | | | | | | | | |
| Alten SA | | | 10,400 | | | | 1,033,609 | |
| BioMerieux | | | 9,200 | | | | 728,811 | |
| Esker SA | | | 23,409 | | | | 1,566,087 | |
| Infotel SA | | | 14,560 | | | | 940,672 | |
| | | Shares | | | Value
(Note 2) | |
| France (continued) | | | | | | | | |
| Neurones | | | 17,282 | | | $ | 534,266 | |
| Thermador Groupe | | | 9,404 | | | | 1,357,075 | |
| | | | | | | | 6,160,520 | |
| | | | | | | | | |
| Georgia (0.85%) | | | | | | | | |
| BGEO Group PLC | | | 27,900 | | | | 1,336,666 | |
| Georgia Healthcare Group PLC(a)(b)(c) | | | 102,948 | | | | 392,588 | |
| TBC Bank Group PLC | | | 55,990 | | | | 1,416,757 | |
| | | | | | | | 3,146,011 | |
| | | | | | | | | |
| Germany (3.89%) | | | | | | | | |
| Aroundtown SA | | | 139,677 | | | | 1,116,622 | |
| CANCOM SE | | | 7,200 | | | | 849,474 | |
| Dermapharm Holding SE(a) | | | 15,000 | | | | 498,135 | |
| FinTech Group AG(a) | | | 24,700 | | | | 929,134 | |
| GRENKE AG | | | 16,000 | | | | 1,890,619 | |
| Hypoport AG(a) | | | 4,270 | | | | 825,033 | |
| Nexus AG | | | 32,485 | | | | 1,086,640 | |
| Norma Group SE | | | 32,960 | | | | 2,425,963 | |
| PATRIZIA Immobilien AG(a) | | | 49,904 | | | | 999,179 | |
| publity AG | | | 15,300 | | | | 243,887 | |
| Wirecard AG | | | 25,296 | | | | 3,454,918 | |
| | | | | | | | 14,319,604 | |
| | | | | | | | | |
| Greece (0.56%) | | | | | | | | |
| Sarantis SA | | | 119,670 | | | | 2,059,318 | |
| | | | | | | | | |
| Hong Kong (2.41%) | | | | | | | | |
| International Housewares Retail Co., Ltd. | | | 7,038,000 | | | | 1,425,776 | |
| Jacobson Pharma Corp., Ltd.(c) | | | 3,295,000 | | | | 793,455 | |
| Plover Bay Technologies, Ltd.(c) | | | 2,569,000 | | | | 526,981 | |
| Samsonite International SA | | | 361,800 | | | | 1,641,057 | |
| TK Group Holdings, Ltd. | | | 2,210,000 | | | | 1,644,410 | |
| Value Partners Group, Ltd. | | | 622,000 | | | | 594,370 | |
| Vitasoy International Holdings, Ltd. | | | 847,000 | | | | 2,250,062 | |
| | | | | | | | 8,876,111 | |
| | | | | | | | | |
| India (5.23%) | | | | | | | | |
| Alkem Laboratories, Ltd. | | | 45,482 | | | | 1,346,844 | |
| Bajaj Finance, Ltd. | | | 28,000 | | | | 800,354 | |
| Byke Hospitality, Ltd. | | | 756,500 | | | | 2,163,291 | |
| Control Print, Ltd. | | | 130,000 | | | | 894,164 | |
| Cyient, Ltd. | | | 181,100 | | | | 2,064,714 | |
| Essel Propack, Ltd. | | | 46,355 | | | | 186,733 | |
| Genpact, Ltd. | | | 12,100 | | | | 385,869 | |
| Kellton Tech Solutions, Ltd.(a) | | | 539,024 | | | | 531,836 | |
| Kovai Medical Center and Hospital | | | 18,322 | | | | 337,985 | |
| L&T Finance Holdings, Ltd. | | | 220,000 | | | | 570,932 | |
| L&T Technology Services, Ltd.(b)(c) | | | 49,185 | | | | 979,868 | |
| See Notes to Financial Statements. | |
| 42 | 1.855.377.7325 | www.GrandeurPeakGlobal.com |
| Grandeur Peak Global Reach Fund | Portfolio of Investments |
| | | Shares | | | Value
(Note 2) | |
| India (continued) | | | | | | | | |
| Poly Medicure, Ltd. | | | 190,208 | | | $ | 743,134 | |
| SBI Life Insurance Co., Ltd.(b)(c) | | | 48,754 | | | | 542,839 | |
| Somany Ceramics, Ltd. | | | 52,078 | | | | 433,853 | |
| Thyrocare Technologies, Ltd. | | | 72,000 | | | | 721,672 | |
| Time Technoplast, Ltd. | | | 385,256 | | | | 926,773 | |
| Vaibhav Global, Ltd.(a) | | | 83,939 | | | | 908,563 | |
| Vakrangee, Ltd. | | | 218,500 | | | | 327,226 | |
| WNS Holdings, Ltd., ADR(a) | | | 77,225 | | | | 3,778,619 | |
| Yes Bank, Ltd. | | | 112,000 | | | | 607,492 | |
| | | | | | | | 19,252,761 | |
| | | | | | | | | |
| Indonesia (1.85%) | | | | | | | | |
| Arwana Citramulia Tbk PT | | | 26,137,200 | | | | 653,782 | |
| Delfi, Ltd. | | | 804,500 | | | | 879,732 | |
| Hexindo Adiperkasa Tbk PT | | | 1,636,900 | | | | 395,327 | |
| Indonesia Pondasi Raya Tbk PT | | | 4,155,400 | | | | 250,892 | |
| Link Net Tbk PT | | | 1,814,400 | | | | 704,242 | |
| Sarana Menara Nusantara Tbk PT | | | 2,740,000 | | | | 618,408 | |
| Selamat Sempurna Tbk PT | | | 20,026,300 | | | | 2,087,197 | |
| Tempo Scan Pacific Tbk PT | | | 5,634,800 | | | | 643,977 | |
| Ultrajaya Milk Industry & Trading Co., Tbk PT | | | 5,474,800 | | | | 586,340 | |
| | | | | | | | 6,819,897 | |
| | | | | | | | | |
| Ireland (1.01%) | | | | | | | | |
| Hostelworld Group PLC(b)(c) | | | 371,708 | | | | 2,072,509 | |
| Irish Residential Properties REIT PLC | | | 997,777 | | | | 1,641,095 | |
| | | | | | | | 3,713,604 | |
| | | | | | | | | |
| Israel (1.63%) | | | | | | | | |
| IDI Insurance Co., Ltd. | | | 13,409 | | | | 809,619 | |
| Kornit Digital, Ltd.(a) | | | 38,560 | | | | 561,048 | |
| Wix.com, Ltd.(a) | | | 56,425 | | | | 4,640,956 | |
| | | | | | | | 6,011,623 | |
| | | | | | | | | |
| Italy (0.70%) | | | | | | | | |
| Brembo SpA | | | 108,750 | | | | 1,608,750 | |
| DiaSorin SpA | | | 10,428 | | | | 986,651 | |
| | | | | | | | 2,595,401 | |
| | | | | | | | | |
| Japan (6.50%) | | | | | | | | |
| Abist Co., Ltd. | | | 12,500 | | | | 547,704 | |
| Aeon Delight Co., Ltd. | | | 10,400 | | | | 364,837 | |
| AIT Corp. | | | 84,700 | | | | 929,748 | |
| Amiyaki Tei Co., Ltd. | | | 14,800 | | | | 727,003 | |
| Arcland Service Holdings Co., Ltd. | | | 45,600 | | | | 976,905 | |
| Create SD Holdings Co., Ltd. | | | 47,300 | | | | 1,371,579 | |
| Dip Corp. | | | 14,800 | | | | 359,846 | |
| Encourage Technologies Co., Ltd. | | | 46,800 | | | | 432,810 | |
| Future Corp. | | | 77,800 | | | | 898,842 | |
| | | Shares | | | Value
(Note 2) | |
| Japan (continued) | | | | | | | | |
| Hard Off Corp. Co., Ltd. | | | 86,300 | | | $ | 897,577 | |
| Japan Lifeline Co., Ltd. | | | 23,100 | | | | 682,519 | |
| M&A Capital Partners Co., Ltd.(a) | | | 20,000 | | | | 1,447,128 | |
| Macromill, Inc. | | | 24,600 | | | | 664,506 | |
| MISUMI Group, Inc. | | | 54,800 | | | | 1,518,880 | |
| MonotaRO Co., Ltd. | | | 31,500 | | | | 1,102,154 | |
| Nihon M&A Center, Inc. | | | 56,400 | | | | 1,656,092 | |
| Open Door, Inc.(a) | | | 65,300 | | | | 1,220,343 | |
| Qol Co., Ltd. | | | 99,600 | | | | 2,048,123 | |
| Quick Co., Ltd. | | | 39,000 | | | | 642,865 | |
| Synchro Food Co., Ltd.(a) | | | 113,400 | | | | 1,136,905 | |
| Syuppin Co., Ltd. | | | 116,400 | | | | 1,313,919 | |
| Trancom Co., Ltd. | | | 10,900 | | | | 827,570 | |
| Trust Tech, Inc. | | | 12,000 | | | | 385,291 | |
| Vega Corp Co., Ltd.(a) | | | 125,100 | | | | 1,776,026 | |
| | | | | | | | 23,929,172 | |
| | | | | | | | | |
| Kenya (0.26%) | | | | | | | | |
| Safaricom, Ltd. | | | 3,427,700 | | | | 965,429 | |
| | | | | | | | | |
| Luxembourg (0.21%) | | | | | | | | |
| Grand City Properties SA | | | 31,300 | | | | 755,958 | |
| | | | | | | | | |
| Malaysia (0.61%) | | | | | | | | |
| AEON Credit Service M Bhd | | | 222,900 | | | | 743,095 | |
| CB Industrial Product Holding Bhd | | | 795,633 | | | | 298,096 | |
| Mynews Holdings Bhd | | | 1,818,000 | | | | 699,676 | |
| Scicom MSC Bhd | | | 934,000 | | | | 492,769 | |
| | | | | | | | 2,233,636 | |
| | | | | | | | | |
| Mexico (0.51%) | | | | | | | | |
| Regional SAB de CV | | | 180,957 | | | | 1,151,805 | |
| Unifin Financiera SAB de CV SOFOM ENR | | | 202,450 | | | | 725,276 | |
| | | | | | | | 1,877,081 | |
| | | | | | | | | |
| Netherlands (0.80%) | | | | | | | | |
| Aalberts Industries NV | | | 28,682 | | | | 1,414,550 | |
| Shop Apotheke Europe NV(a)(b) | | | 33,000 | | | | 1,546,212 | |
| | | | | | | | 2,960,762 | |
| | | | | | | | | |
| New Zealand (0.37%) | | | | | | | | |
| CBL Corp., Ltd.(d) | | | 819,006 | | | | 132,538 | |
| Restaurant Brands New Zealand, Ltd. | | | 241,685 | | | | 1,220,956 | |
| | | | | | | | 1,353,494 | |
| | | | | | | | | |
| Norway (1.79%) | | | | | | | | |
| Infront ASA | | | 156,700 | | | | 546,926 | |
| Medistim ASA | | | 75,150 | | | | 743,790 | |
| Multiconsult ASA(b)(c) | | | 63,000 | | | | 534,012 | |
| Sbanken ASA(b)(c) | | | 184,000 | | | | 1,662,865 | |
| Self Storage Group ASA(a) | | | 481,500 | | | | 948,319 | |
| See Notes to Financial Statements. | |
| Annual Report | April 30, 2018 | 43 |
| Grandeur Peak Global Reach Fund | Portfolio of Investments |
| | | Shares | | | Value
(Note 2) | |
| Norway (continued) | | | | | | | | |
| TGS NOPEC Geophysical Co., ASA | | | 38,100 | | | $ | 1,207,262 | |
| Webstep ASA(b)(c) | | | 288,000 | | | | 933,398 | |
| | | | | | | | 6,576,572 | |
| | | | | | | | | |
| Oman (0.46%) | | | | | | | | |
| Tethys Oil AB | | | 186,900 | | | | 1,675,487 | |
| | | | | | | | | |
| Pakistan (0.09%) | | | | | | | | |
| Meezan Bank, Ltd. | | | 493,960 | | | | 337,655 | |
| | | | | | | | | |
| Peru (0.77%) | | | | | | | | |
| Alicorp SAA | | | 541,947 | | | | 1,990,860 | |
| Credicorp, Ltd. | | | 3,700 | | | | 860,213 | |
| | | | | | | | 2,851,073 | |
| | | | | | | | | |
| Philippines (0.98%) | | | | | | | | |
| Concepcion Industrial Corp. | | | 878,920 | | | | 1,019,048 | |
| Holcim Philippines, Inc. | | | 2,549,400 | | | | 457,665 | |
| Pryce Corp. | | | 5,447,000 | | | | 631,542 | |
| Puregold Price Club, Inc. | | | 860,700 | | | | 788,359 | |
| Security Bank Corp. | | | 178,700 | | | | 721,713 | |
| | | | | | | | 3,618,327 | |
| | | | | | | | | |
| Poland (1.59%) | | | | | | | | |
| Dino Polska SA(a)(b)(c) | | | 145,618 | | | | 3,941,397 | |
| LiveChat Software SA | | | 115,250 | | | | 1,461,209 | |
| PGS Software SA | | | 138,887 | | | | 443,191 | |
| | | | | | | | 5,845,797 | |
| | | | | | | | | |
| Russia (0.30%) | | | | | | | | |
| MD Medical Group | | | | | | | | |
| Investments PLC, GDR(c) | | | 14,755 | | | | 135,008 | |
| TCS Group Holding PLC, GDR(c) | | | 46,700 | | | | 962,020 | |
| | | | | | | | 1,097,028 | |
| | | | | | | | | |
| Singapore (0.33%) | | | | | | | | |
| Riverstone Holdings, Ltd. | | | 1,534,800 | | | | 1,215,339 | |
| | | | | | | | | |
| South Africa (1.70%) | | | | | | | | |
| ARB Holdings, Ltd. | | | 2,093,266 | | | | 957,209 | |
| Blue Label Telecoms, Ltd. | | | 564,502 | | | | 562,917 | |
| Cartrack Holdings, Ltd. | | | 826,600 | | | | 1,253,329 | |
| Cashbuild, Ltd. | | | 24,500 | | | | 854,994 | |
| Clicks Group, Ltd. | | | 81,600 | | | | 1,398,820 | |
| EOH Holdings, Ltd. | | | 68,600 | | | | 208,799 | |
| Interwaste Holdings, Ltd. | | | 5,043,434 | | | | 343,916 | |
| Transaction Capital, Ltd. | | | 488,600 | | | | 686,745 | |
| | | | | | | | 6,266,729 | |
| | | | | | | | | |
| South Korea (1.91%) | | | | | | | | |
| Daebongls Co., Ltd. | | | 4,368 | | | | 46,418 | |
| Hanssem Co., Ltd. | | | 3,300 | | | | 359,955 | |
| Hy-Lok Corp. | | | 36,240 | | | | 936,495 | |
| | | Shares | | | Value
(Note 2) | |
| South Korea (continued) | | | | | | | | |
| ISC Co., Ltd. | | | 59,496 | | | $ | 863,431 | |
| Kakao M Corp. | | | 10,000 | | | | 837,976 | |
| Koh Young Technology, Inc. | | | 10,143 | | | | 966,769 | |
| Medy-Tox, Inc. | | | 3,486 | | | | 2,276,891 | |
| Vitzrocell Co., Ltd.(a)(d) | | | 88,536 | | | | 728,150 | |
| | | | | | | | 7,016,085 | |
| | | | | | | | | |
| Spain (0.00%)(e) | | | | | | | | |
| Let’s GOWEX SA(a)(d) | | | 10,700 | | | | 1 | |
| | | | | | | | | |
| Sri Lanka (0.36%) | | | | | | | | |
| Hemas Holdings PLC | | | 921,961 | | | | 730,787 | |
| Royal Ceramics Lanka PLC | | | 893,948 | | | | 606,547 | |
| | | | | | | | 1,337,334 | |
| | | | | | | | | |
| Sweden (2.18%) | | | | | | | | |
| Bufab AB | | | 74,698 | | | | 1,011,709 | |
| HIQ International AB | | | 45,263 | | | | 366,998 | |
| Hoist Finance AB(b)(c) | | | 81,100 | | | | 719,621 | |
| Indutrade AB | | | 36,300 | | | | 859,760 | |
| KNOW IT AB | | | 14,484 | | | | 295,746 | |
| Moberg Pharma AB(a) | | | 111,100 | | | | 343,831 | |
| Nibe Industrier AB, Class B | | | 93,000 | | | | 951,597 | |
| Sweco AB, Class B | | | 69,700 | | | | 1,423,188 | |
| Swedencare AB(a) | | | 172,900 | | | | 669,355 | |
| TF Bank AB(c) | | | 85,800 | | | | 764,265 | |
| Vitec Software Group AB, Class B | | | 67,500 | | | | 632,091 | |
| | | | | | | | 8,038,161 | |
| | | | | | | | | |
| Switzerland (1.12%) | | | | | | | | |
| Luxoft Holding, Inc.(a) | | | 33,350 | | | | 1,345,673 | |
| Partners Group Holding AG | | | 1,985 | | | | 1,455,199 | |
| Wizz Air Holdings PLC(a)(b)(c) | | | 29,900 | | | | 1,314,757 | |
| | | | | | | | 4,115,629 | |
| | | | | | | | | |
| Taiwan (2.02%) | | | | | | | | |
| ASPEED Technology, Inc. | | | 32,771 | | | | 941,489 | |
| Bioteque Corp. | | | 134,000 | | | | 543,491 | |
| Sinmag Equipment Corp. | | | 169,371 | | | | 884,451 | |
| Sitronix Technology Corp. | | | 267,000 | | | | 768,878 | |
| Sporton International, Inc. | | | 277,089 | | | | 1,540,606 | |
| Test Research, Inc. | | | 409,440 | | | | 756,979 | |
| TSC Auto ID Technology Co., Ltd. | | | 64,600 | | | | 510,922 | |
| TTFB Co., Ltd. | | | 148,000 | | | | 1,163,030 | |
| Voltronic Power Technology Corp. | | | 19,000 | | | | 339,074 | |
| | | | | | | | 7,448,920 | |
| | | | | | | | | |
| Thailand (0.71%) | | | | | | | | |
| Muangthai Leasing PCL | | | 686,000 | | | | 793,378 | |
| Srisawad Corp., PCL | | | 421,960 | | | | 695,244 | |
| See Notes to Financial Statements. | |
| 44 | 1.855.377.7325 | www.GrandeurPeakGlobal.com |
| Grandeur Peak Global Reach Fund | Portfolio of Investments |
April 30, 2018
| | | Shares | | | Value
(Note 2) | |
| Thailand (continued) | | | | | | | | |
| TOA Paint Thailand PCL(a) | | | 916,000 | | | $ | 1,110,171 | |
| | | | | | | | 2,598,793 | |
| | | | | | | | | |
| Turkey (0.42%) | | | | | | | | |
| DP Eurasia NV(a)(b)(c) | | | 596,800 | | | | 1,561,068 | |
| | | | | | | | | |
| United Arab Emirates (0.19%) | | | | | | | | |
| Aramex PJSC | | | 643,565 | | | | 709,592 | |
| | | | | | | | | |
| United States (22.90%) | | | | | | | | |
| Acacia Communications, Inc.(a) | | | 8,475 | | | | 238,571 | |
| Amazon.com, Inc.(a) | | | 950 | | | | 1,487,823 | |
| Aratana Therapeutics, Inc.(a) | | | 134,150 | | | | 690,872 | |
| Axalta Coating Systems, Ltd.(a) | | | 31,375 | | | | 969,488 | |
| Bank of Hawaii Corp. | | | 13,600 | | | | 1,145,256 | |
| Bank of the Ozarks | | | 38,025 | | | | 1,779,570 | |
| BG Staffing, Inc. | | | 38,025 | | | | 725,137 | |
| BioDelivery Sciences International, Inc.(a) | | | 256,925 | | | | 513,850 | |
| Blackline, Inc.(a) | | | 18,925 | | | | 783,495 | |
| BofI Holding, Inc.(a) | | | 32,175 | | | | 1,296,009 | |
| Burford Capital, Ltd. | | | 97,500 | | | | 1,932,887 | |
| CoBiz Financial, Inc. | | | 60,687 | | | | 1,222,843 | |
| Core Laboratories NV | | | 8,475 | | | | 1,037,764 | |
| DexCom, Inc.(a) | | | 6,400 | | | | 468,352 | |
| Docusign, Inc.(a) | | | 50 | | | | 1,931 | |
| Dollar Tree, Inc.(a) | | | 10,425 | | | | 999,653 | |
| DXP Enterprises, Inc.(a) | | | 64,300 | | | | 2,334,090 | |
| Edwards Lifesciences Corp.(a) | | | 6,825 | | | | 869,232 | |
| EPAM Systems, Inc.(a) | | | 24,650 | | | | 2,818,727 | |
| ePlus, Inc.(a) | | | 6,542 | | | | 522,379 | |
| Esquire Financial Holdings, Inc.(a) | | | 114,787 | | | | 2,765,219 | |
| Evolent Health, Inc., Class A(a) | | | 30,000 | | | | 495,000 | |
| ExlService Holdings, Inc.(a) | | | 17,325 | | | | 1,001,558 | |
| Fastenal Co. | | | 40,475 | | | | 2,023,345 | |
| FCB Financial Holdings, Inc., Class A(a) | | | 31,325 | | | | 1,810,585 | |
| First Republic Bank | | | 23,725 | | | | 2,203,341 | |
| FirstCash, Inc. | | | 29,050 | | | | 2,518,635 | |
| GBGI, Ltd. | | | 692,460 | | | | 843,679 | |
| Hackett Group, Inc. | | | 43,575 | | | | 706,351 | |
| Hamilton Lane, Inc., Class A | | | 67,350 | | | | 2,818,597 | |
| HealthEquity, Inc.(a) | | | 13,525 | | | | 888,187 | |
| Heska Corp.(a) | | | 11,150 | | | | 910,063 | |
| Hingham Institution for Savings | | | 4,575 | | | | 933,300 | |
| Home BancShares, Inc. | | | 31,450 | | | | 730,898 | |
| Innospec, Inc. | | | 5,350 | | | | 388,945 | |
| Inphi Corp.(a) | | | 67,675 | | | | 1,934,151 | |
| K2M Group Holdings, Inc.(a) | | | 21,800 | | | | 416,380 | |
| Kinsale Capital Group, Inc. | | | 40,775 | | | | 2,101,951 | |
| Knight-Swift Transportation Holdings, Inc. | | | 24,375 | | | | 950,869 | |
| LeMaitre Vascular, Inc. | | | 16,925 | | | | 532,291 | |
| | | Shares | | | Value
(Note 2) | |
| United States (continued) | | | | | | | | |
| LGI Homes, Inc.(a) | | | 19,500 | | | $ | 1,349,400 | |
| Littelfuse, Inc. | | | 3,475 | | | | 649,547 | |
| Lululemon Athletica, Inc.(a) | | | 14,200 | | | | 1,417,160 | |
| MarketAxess Holdings, Inc. | | | 8,655 | | | | 1,719,143 | |
| MaxLinear, Inc., Class A(a) | | | 7,150 | | | | 159,659 | |
| MEDNAX, Inc.(a) | | | 32,700 | | | | 1,501,257 | |
| Microchip Technology, Inc. | | | 13,400 | | | | 1,121,044 | |
| Monro, Inc. | | | 27,600 | | | | 1,544,220 | |
| MSC Industrial Direct Co., Inc., Class A | | | 22,300 | | | | 1,927,612 | |
| NOW, Inc.(a) | | | 109,050 | | | | 1,322,776 | |
| NV5 Global, Inc.(a) | | | 15,000 | | | | 882,750 | |
| Palo Alto Networks, Inc.(a) | | | 3,950 | | | | 760,415 | |
| Patrick Industries, Inc.(a) | | | 11,437 | | | | 650,765 | |
| Paycom Software, Inc.(a) | | | 15,950 | | | | 1,821,650 | |
| People’s Utah Bancorp | | | 11,775 | | | | 375,034 | |
| Power Integrations, Inc. | | | 34,590 | | | | 2,345,202 | |
| Proto Labs, Inc.(a) | | | 5,988 | | | | 713,470 | |
| Qualys, Inc.(a) | | | 18,150 | | | | 1,396,643 | |
| Seacoast Commerce Banc Holdings | | | 44,700 | | | | 898,470 | |
| ServisFirst Bancshares, Inc. | | | 22,800 | | | | 956,688 | |
| Silicon Laboratories, Inc.(a) | | | 17,750 | | | | 1,648,975 | |
| Smart Sand, Inc.(a) | | | 158,800 | | | | 1,162,416 | |
| STAAR Surgical Co.(a) | | | 42,154 | | | | 685,003 | |
| SVB Financial Group(a) | | | 11,725 | | | | 3,512,927 | |
| Transcat, Inc.(a) | | | 82,377 | | | | 1,359,221 | |
| TriMas Corp.(a) | | | 50,425 | | | | 1,366,518 | |
| Veracyte, Inc.(a) | | | 104,979 | | | | 636,173 | |
| Webster Financial Corp. | | | 26,625 | | | | 1,602,559 | |
| | | | | | | | 84,297,971 | |
| | | | | | | | | |
| Vietnam (1.70%) | | | | | | | | |
| Ho Chi Minh City Development Joint Stock Commercial Bank | | | 1,044,211 | | | | 1,963,329 | |
| Lix Detergent JSC | | | 577,800 | | | | 1,142,223 | |
| Taisun Int’l Holding Corp. | | | 274,000 | | | | 1,333,581 | |
| Vietnam Dairy Products JSC | | | 222,291 | | | | 1,806,569 | |
| | | | | | | | 6,245,702 | |
| | | | | | | | | |
| TOTAL COMMON STOCKS | | | | | | | | |
| (Cost $276,353,008) | | | | | | | 368,287,346 | |
| | | | | | | | | |
| PREFERRED STOCKS (0.25%) | | | | | | | | |
| Germany (0.25%) | | | | | | | | |
| FUCHS PETROLUB SE | | | 17,100 | | | | 919,749 | |
| | | | | | | | | |
| TOTAL PREFERRED STOCKS | | | | | | | | |
| (Cost $898,389) | | | | | | | 919,749 | |
| See Notes to Financial Statements. | |
| Annual Report | April 30, 2018 | 45 |
| Grandeur Peak Global Reach Fund | Portfolio of Investments |
| | | Principal
Amount | | | Value
(Note 2) | |
| CORPORATE BONDS (0.25%) | | | | | | | | |
| Germany (0.22%) | | | | | | | | |
| publity AG | | | | | | | | |
| 3.50%, 11/17/2020 | | $ | 800,000 | | | $ | 800,881 | |
| | | | | | | | | |
| Malaysia (0.03%) | | | | | | | | |
| AEON Credit Service M Bhd | | | | | | | | |
| 3.50%, 09/15/2020 | | | 445,800 | | | | 132,939 | |
| | | | | | | | | |
| TOTAL CORPORATE BONDS | | | | | |
| (Cost $984,703) | | | | 933,820 | |
| | | | | | | | | |
| TOTAL INVESTMENTS (100.53%) | | | | | |
| (Cost $278,236,100) | | | $ | 370,140,915 | |
| | | | | | | | | |
| Liabilities In Excess Of Other Assets (-0.53%) | | | | (1,948,492 | ) |
| | | | | | | | | |
| NET ASSETS (100.00%) | | | | | | $ | 368,192,423 | |
| (a) | Non-Income Producing Security. |
| (b) | Security exempt from registration under Rule 144A of the Securities Act of 1933. These securities may be resold in the ordinary course of business in transactions exempt from registration, normally to qualified institutional buyers. As of April 30, 2018, these securities had a total aggregate market value of $27,161,843 representing 7.38% of net assets. |
| (c) | Security was purchased pursuant to Regulation S under the Securities Act of 1933, which exempts securities offered and sold outside of the United States from registration. Such security cannot be sold in the United States without either an effective registration statement filed pursuant to the Securities Act of 1933, or pursuant to an exemption from registration. The security has been deemed liquid under guidelines approved by the Fund’s Board of Trustees. As of April 30, 2018, the aggregate market value of those securities was $32,445,686, representing 8.81% of net assets. |
| (d) | As a result of the use of significant unobservable inputs to determine fair value, these investments have been classified as level 3 assets. See also footnote 2 to the financial statements for additional information. |
For Fund compliance purposes, the Fund’s geographical classifications refer to any one or more of the country sub-classifications used by one or more widely recognized market indexes or ratings group indexes, and/or as defined by Fund management. This definition may not apply for purposes of this report, which may combine sub-classifications for reporting ease. Geographical regions are shown as a percentage of net assets.
| See Notes to Financial Statements. | |
| 46 | 1.855.377.7325 | www.GrandeurPeakGlobal.com |
| Grandeur Peak Global Stalwarts Fund | Portfolio of Investments |
April 30, 2018
| | | Shares | | | Value
(Note 2) | |
| COMMON STOCKS (96.88%) | | | | | | | | |
| Argentina (0.74%) | | | | | | | | |
| Despegar.com Corp.(a) | | | 27,075 | | | $ | 794,922 | |
| Globant SA(a) | | | 13,275 | | | | 597,508 | |
| | | | | | | | 1,392,430 | |
| | | | | | | | | |
| Australia (0.88%) | | | | | | | | |
| carsales.com, Ltd. | | | 85,451 | | | | 922,518 | |
| Magellan Financial Group, Ltd. | | | 41,985 | | | | 738,373 | |
| | | | | | | | 1,660,891 | |
| | | | | | | | | |
| Bangladesh (0.46%) | | | | | | | | |
| Square Pharmaceuticals, Ltd. | | | 233,118 | | | | 861,715 | |
| | | | | | | | | |
| Belgium (0.65%) | | | | | | | | |
| Melexis NV | | | 12,732 | | | | 1,215,407 | |
| | | | | | | | | |
| Bermuda (0.65%) | | | | | | | | |
| Bank of NT Butterfield & Son, Ltd. | | | 25,910 | | | | 1,229,429 | |
| | | | | | | | | |
| Brazil (1.72%) | | | | | | | | |
| Fleury SA | | | 98,200 | | | | 731,903 | |
| Hapvida Participacoes e Investimentos SA(a)(b)(c) | | | 25,300 | | | | 199,688 | |
| M Dias Branco SA | | | 50,800 | | | | 637,755 | |
| Notre Dame Intermedica Participacoes SA(a) | | | 50,500 | | | | 293,209 | |
| Pagseguro Digital, Ltd., Class A(a) | | | 17,575 | | | | 584,017 | |
| Raia Drogasil SA | | | 40,600 | | | | 796,424 | |
| | | | | | | | 3,242,996 | |
| | | | | | | | | |
| Britain (9.45%) | | | | | | | | |
| Abcam PLC | | | 40,125 | | | | 674,482 | |
| Ascential PLC | | | 208,806 | | | | 1,211,370 | |
| B&M European Value Retail SA | | | 582,000 | | | | 3,247,424 | |
| boohoo.com PLC(a) | | | 230,700 | | | | 582,170 | |
| Clinigen Group PLC | | | 57,644 | | | | 696,371 | |
| Close Brothers Group PLC | | | 41,834 | | | | 884,627 | |
| Diploma PLC | | | 119,350 | | | | 1,981,569 | |
| Domino's Pizza Group PLC | | | 147,200 | | | | 736,228 | |
| Intertek Group PLC | | | 16,900 | | | | 1,140,278 | |
| Metro Bank PLC(a) | | | 34,075 | | | | 1,549,003 | |
| Sanne Group PLC | | | 230,020 | | | | 1,966,512 | |
| St James's Place PLC | | | 133,800 | | | | 2,093,461 | |
| Ted Baker PLC | | | 6,500 | | | | 238,389 | |
| Ultra Electronics Holdings PLC | | | 39,675 | | | | 769,058 | |
| | | | | | | | 17,770,942 | |
| | | | | | | | | |
| Canada (4.50%) | | | | | | | | |
| Gildan Activewear, Inc. | | | 48,067 | | | | 1,400,137 | |
| Ritchie Bros Auctioneers, Inc. | | | 97,475 | | | | 3,190,357 | |
| Spartan Energy Corp.(a) | | | 37,366 | | | | 185,091 | |
| | | Shares | | | Value
(Note 2) | |
| Canada (continued) | | | | | | | | |
| Stantec, Inc. | | | 145,142 | | | $ | 3,693,126 | |
| | | | | | | | 8,468,711 | |
| | | | | | | | | |
| China (6.68%) | | | | | | | | |
| 58.com, Inc., ADR(a) | | | 6,175 | | | | 539,633 | |
| ANTA Sports Products, Ltd. | | | 107,000 | | | | 615,526 | |
| China Medical System Holdings, Ltd. | | | 1,163,000 | | | | 2,868,733 | |
| CSPC Pharmaceutical Group, Ltd. | | | 358,000 | | | | 921,381 | |
| Ctrip.com International, Ltd., ADR(a) | | | 26,625 | | | | 1,088,962 | |
| JD.com, Inc., ADR(a) | | | 19,275 | | | | 703,730 | |
| Man Wah Holdings, Ltd. | | | 2,215,800 | | | | 1,648,726 | |
| Silergy Corp. | | | 104,000 | | | | 2,186,403 | |
| Tencent Holdings, Ltd. | | | 12,100 | | | | 602,792 | |
| Yum China Holdings, Inc. | | | 32,600 | | | | 1,393,976 | |
| | | | | | | | 12,569,862 | |
| | | | | | | | | |
| Colombia (0.83%) | | | | | | | | |
| Parex Resources, Inc.(a) | | | 90,795 | | | | 1,562,103 | |
| | | | | | | | | |
| Denmark (0.28%) | | | | | | | | |
| Ambu A/S | | | 22,511 | | | | 523,944 | |
| | | | | | | | | |
| Egypt (0.29%) | | | | | | | | |
| Commercial International Bank Egypt SAE | | | 103,662 | | | | 551,044 | |
| | | | | | | | | |
| France (2.01%) | | | | | | | | |
| Alten SA | | | 18,582 | | | | 1,846,782 | |
| BioMerieux | | | 15,575 | | | | 1,233,829 | |
| Bureau Veritas SA | | | 26,550 | | | | 694,138 | |
| | | | | | | | 3,774,749 | |
| | | | | | | | | |
| Georgia (0.70%) | | | | | | | | |
| BGEO Group PLC | | | 27,500 | | | | 1,317,502 | |
| | | | | | | | | |
| Germany (5.22%) | | | | | | | | |
| Aroundtown SA | | | 159,308 | | | | 1,273,558 | |
| CTS Eventim AG & Co., KGaA | | | 10,500 | | | | 492,484 | |
| Dermapharm Holding SE(a) | | | 21,500 | | | | 713,994 | |
| GRENKE AG | | | 15,800 | | | | 1,866,986 | |
| Norma Group SE | | | 30,390 | | | | 2,236,803 | |
| PATRIZIA Immobilien AG(a) | | | 82,015 | | | | 1,642,106 | |
| Wirecard AG | | | 11,650 | | | | 1,591,152 | |
| | | | | | | | 9,817,083 | |
| | | | | | | | | |
| Hong Kong (3.91%) | | | | | | | | |
| Samsonite International SA | | | 415,200 | | | | 1,883,269 | |
| Value Partners Group, Ltd. | | | 2,908,900 | | | | 2,779,682 | |
See Notes to Financial Statements.
| Annual Report | April 30, 2018 | 47 |
| Grandeur Peak Global Stalwarts Fund | Portfolio of Investments |
April 30, 2018
| | | Shares | | | Value
(Note 2) | |
| Hong Kong (continued) | | | | | | | | |
| Vitasoy International Holdings, Ltd. | | | 1,014,500 | | | $ | 2,695,027 | |
| | | | | | | | 7,357,978 | |
| | | | | | | | | |
| India (4.16%) | | | | | | | | |
| Alkem Laboratories, Ltd. | | | 39,524 | | | | 1,170,411 | |
| Bajaj Finance, Ltd. | | | 51,700 | | | | 1,477,796 | |
| Indiabulls Housing Finance, Ltd. | | | 24,700 | | | | 483,711 | |
| L&T Finance Holdings, Ltd. | | | 332,500 | | | | 862,886 | |
| SBI Life Insurance Co., Ltd.(b)(c) | | | 57,818 | | | | 643,760 | |
| Vakrangee, Ltd. | | | 204,000 | | | | 305,511 | |
| WNS Holdings, Ltd., ADR(a) | | | 35,875 | | | | 1,755,364 | |
| Yes Bank, Ltd. | | | 207,500 | | | | 1,125,487 | |
| | | | | | | | 7,824,926 | |
| | | | | | | | | |
| Israel (0.72%) | | | | | | | | |
| Wix.com, Ltd.(a) | | | 16,400 | | | | 1,348,900 | |
| | | | | | | | | |
| Italy (1.89%) | | | | | | | | |
| Brembo SpA | | | 156,149 | | | | 2,309,928 | |
| DiaSorin SpA | | | 13,230 | | | | 1,251,763 | |
| | | | | | | | 3,561,691 | |
| | | | | | | | | |
| Japan (6.85%) | | | | | | | | |
| Aeon Delight Co., Ltd. | | | 19,900 | | | | 698,102 | |
| Create SD Holdings Co., Ltd. | | | 52,800 | | | | 1,531,065 | |
| Dip Corp. | | | 41,100 | | | | 999,303 | |
| Ezaki Glico Co., Ltd. | | | 21,000 | | | | 1,135,291 | |
| Japan Lifeline Co., Ltd. | | | 12,300 | | | | 363,419 | |
| MISUMI Group, Inc. | | | 88,200 | | | | 2,444,621 | |
| MonotaRO Co., Ltd. | | | 38,000 | | | | 1,329,583 | |
| Nihon M&A Center, Inc. | | | 117,600 | | | | 3,453,128 | |
| Seria Co., Ltd. | | | 18,800 | | | | 921,771 | |
| | | | | | | | 12,876,283 | |
| | | | | | | | | |
| Kenya (0.33%) | | | | | | | | |
| Safaricom, Ltd. | | | 2,203,600 | | | | 620,655 | |
| | | | | | | | | |
| Luxembourg (0.47%) | | | | | | | | |
| Grand City Properties SA | | | 36,300 | | | | 876,718 | |
| | | | | | | | | |
| Malaysia (0.20%) | | | | | | | | |
| My EG Services Bhd | | | 574,000 | | | | 383,301 | |
| | | | | | | | | |
| Mexico (0.64%) | | | | | | | | |
| Regional SAB de CV | | | 188,600 | | | | 1,200,454 | |
| | | | | | | | | |
| Netherlands (1.11%) | | | | | | | | |
| Aalberts Industries NV | | | 42,463 | | | | 2,094,207 | |
| | | Shares | | | Value
(Note 2) | |
| Norway (0.45%) | | | | | | | | |
| TGS NOPEC Geophysical Co., ASA | | | 26,900 | | | $ | 852,372 | |
| | | | | | | | | |
| Peru (1.11%) | | | | | | | | |
| Alicorp SAA | | | 313,645 | | | | 1,152,185 | |
| Credicorp, Ltd. | | | 4,000 | | | | 929,960 | |
| | | | | | | | 2,082,145 | |
| | | | | | | | | |
| Philippines (2.00%) | | | | | | | | |
| Puregold Price Club, Inc. | | | 1,035,000 | | | | 948,009 | |
| Robinsons Land Corp. | | | 803,083 | | | | 277,784 | |
| Robinsons Retail Holdings, Inc. | | | 423,900 | | | | 745,416 | |
| Security Bank Corp. | | | 441,300 | | | | 1,782,272 | |
| | | | | | | | 3,753,481 | |
| | | | | | | | | |
| Poland (1.02%) | | | | | | | | |
| AmRest Holdings SE(a) | | | 6,800 | | | | 893,143 | |
| Dino Polska SA(a)(b)(c) | | | 37,634 | | | | 1,018,628 | |
| | | | | | | | 1,911,771 | |
| | | | | | | | | |
| South Korea (1.91%) | | | | | | | | |
| BGF Retail Co., Ltd. | | | 2,233 | | | | 399,329 | |
| LG Household & Health Care, Ltd. | | | 1,225 | | | | 1,571,321 | |
| Medy-Tox, Inc. | | | 2,470 | | | | 1,613,288 | |
| | | | | | | | 3,583,938 | |
| | | | | | | | | |
| Sweden (1.26%) | | | | | | | | |
| Indutrade AB | | | 34,825 | | | | 824,825 | |
| Nibe Industrier AB, Class B | | | 61,408 | | | | 628,341 | |
| Sweco AB, Class B | | | 45,300 | | | | 924,970 | |
| | | | | | | | 2,378,136 | |
| | | | | | | | | |
| Switzerland (1.21%) | | | | | | | | |
| Luxoft Holding, Inc.(a) | | | 11,675 | | | | 471,086 | |
| Partners Group Holding AG | | | 1,200 | | | | 879,718 | |
| Wizz Air Holdings PLC(a)(b)(c) | | | 21,200 | | | | 932,202 | |
| | | | | | | | 2,283,006 | |
| | | | | | | | | |
| Thailand (0.97%) | | | | | | | | |
| Muangthai Leasing PCL | | | 389,000 | | | | 449,889 | |
| Srisawad Corp., PCL | | | 413,320 | | | | 681,009 | |
| TOA Paint Thailand PCL(a) | | | 570,000 | | | | 690,827 | |
| | | | | | | | 1,821,725 | |
| | | | | | | | | |
| United States (30.23%) | | | | | | | | |
| Amazon.com, Inc.(a) | | | 500 | | | | 783,065 | |
| Axalta Coating Systems, Ltd.(a) | | | 27,425 | | | | 847,433 | |
| Bank of Hawaii Corp. | | | 5,750 | | | | 484,207 | |
| Bank of the Ozarks | | | 26,100 | | | | 1,221,480 | |
| Blackline, Inc.(a) | | | 9,206 | | | | 381,128 | |
| BofI Holding, Inc.(a) | | | 12,125 | | | | 488,395 | |
| Burford Capital, Ltd. | | | 52,500 | | | | 1,040,785 | |
See Notes to Financial Statements.
| 48 | 1.855.377.7325 | www.GrandeurPeakGlobal.com |
| Grandeur Peak Global Stalwarts Fund | Portfolio of Investments |
April 30, 2018
| | | Shares | | | Value
(Note 2) | |
| United States (continued) | | | | | | | | |
| Core Laboratories NV | | | 10,025 | | | $ | 1,227,561 | |
| Docusign, Inc.(a) | | | 25 | | | | 966 | |
| Dollar Tree, Inc.(a) | | | 16,075 | | | | 1,541,432 | |
| Edwards Lifesciences Corp.(a) | | | 8,525 | | | | 1,085,744 | |
| EPAM Systems, Inc.(a) | | | 18,600 | | | | 2,126,910 | |
| Fastenal Co. | | | 28,750 | | | | 1,437,212 | |
| FCB Financial Holdings, Inc., Class A(a) | | | 15,850 | | | | 916,130 | |
| First Republic Bank | | | 32,475 | | | | 3,015,953 | |
| FirstCash, Inc. | | | 35,553 | | | | 3,082,445 | |
| Hamilton Lane, Inc., Class A | | | 31,800 | | | | 1,330,830 | |
| Healthcare Services Group, Inc. | | | 42,650 | | | | 1,647,569 | |
| HealthEquity, Inc.(a) | | | 46,800 | | | | 3,073,356 | |
| Home BancShares, Inc. | | | 88,737 | | | | 2,062,248 | |
| IDEX Corp. | | | 6,325 | | | | 845,399 | |
| Inphi Corp.(a) | | | 19,450 | | | | 555,881 | |
| Knight-Swift Transportation Holdings, Inc. | | | 105,350 | | | | 4,109,704 | |
| LGI Homes, Inc.(a) | | | 13,725 | | | | 949,770 | |
| Littelfuse, Inc. | | | 4,175 | | | | 780,391 | |
| LKQ Corp.(a) | | | 32,350 | | | | 1,003,497 | |
| Lululemon Athletica, Inc.(a) | | | 15,700 | | | | 1,566,860 | |
| MarketAxess Holdings, Inc. | | | 11,650 | | | | 2,314,040 | |
| MEDNAX, Inc.(a) | | | 22,650 | | | | 1,039,862 | |
| Microchip Technology, Inc. | | | 14,750 | | | | 1,233,985 | |
| Monro, Inc. | | | 36,775 | | | | 2,057,561 | |
| MSC Industrial Direct Co., Inc., Class A | | | 17,725 | | | | 1,532,149 | |
| NOW, Inc.(a) | | | 90,300 | | | | 1,095,339 | |
| Palo Alto Networks, Inc.(a) | | | 4,675 | | | | 899,984 | |
| Paycom Software, Inc.(a) | | | 8,150 | | | | 930,812 | |
| Power Integrations, Inc. | | | 45,725 | | | | 3,100,155 | |
| PRA Group, Inc.(a) | | | 28,700 | | | | 1,021,720 | |
| Proto Labs, Inc.(a) | | | 7,850 | | | | 935,328 | |
| Silicon Laboratories, Inc.(a) | | | 13,875 | | | | 1,288,988 | |
| SVB Financial Group(a) | | | 6,025 | | | | 1,805,150 | |
| | | | | | | | 56,861,424 | |
| | | | | | | | | |
| Vietnam (1.38%) | | | | | | | | |
| Ho Chi Minh City Development Joint Stock Commercial Bank | | | 551,466 | | | | 1,036,868 | |
| Vietnam Dairy Products JSC | | | 191,174 | | | | 1,553,680 | |
| | | | | | | | 2,590,548 | |
| | | | | | | | | |
| TOTAL COMMON STOCKS | | | | | | | | |
| (Cost $147,601,834) | | | | | | | 182,222,467 | |
| | | Shares | | | Value
(Note 2) | |
| PREFERRED STOCKS (0.40%) | | | | | | | | |
| Germany (0.40%) | | | | | | | | |
| FUCHS PETROLUB SE | | | 13,800 | | | $ | 742,254 | |
| | | | | | | | | |
| TOTAL PREFERRED STOCKS | | | | | | | | |
| (Cost $721,657) | | | | | | | 742,254 | |
| | | | | | | | | |
| TOTAL INVESTMENTS (97.28%) | | | | | | | | |
| (Cost $148,323,491) | | | | | | $ | 182,964,721 | |
| | | | | | | | | |
| Other Assets In Excess Of Liabilities (2.72%) | | | | 5,119,981 | |
| | | | | | | | | |
| NET ASSETS (100.00%) | | | | | | $ | 188,084,702 | |
| (a) | Non-Income Producing Security. |
| (b) | Security exempt from registration under Rule 144A of the Securities Act of 1933. These securities may be resold in the ordinary course of business in transactions exempt from registration, normally to qualified institutional buyers. As of April 30, 2018, these securities had a total aggregate market value of $2,794,278 representing 1.49% of net assets. |
| (c) | Security was purchased pursuant to Regulation S under the Securities Act of 1933, which exempts securities offered and sold outside of the United States from registration. Such security cannot be sold in the United States without either an effective registration statement filed pursuant to the Securities Act of 1933, or pursuant to an exemption from registration. The security has been deemed liquid under guidelines approved by the Fund's Board of Trustees. As of April 30, 2018, the aggregate market value of those securities was $2,794,278, representing 1.49% of net assets. |
For Fund compliance purposes, the Fund's geographical classifications refer to any one or more of the country sub-classifications used by one or more widely recognized market indexes or ratings group indexes, and/or as defined by Fund management. This definition may not apply for purposes of this report, which may combine sub-classifications for reporting ease. Geographical regions are shown as a percentage of net assets.
See Notes to Financial Statements.
| Annual Report | April 30, 2018 | 49 |
| Grandeur Peak International Opportunities Fund | Portfolio of Investments |
| | | Shares | | | Value
(Note 2) | |
| COMMON STOCKS (98.56%) | | | | | | | | |
| Argentina (0.42%) | | | | | | | | |
| Globant SA(a) | | | 83,800 | | | $ | 3,771,838 | |
| | | | | | | | | |
| Australia (1.88%) | | | | | | | | |
| Blue Sky Alternative Investments, Ltd. | | | 996,639 | | | | 2,310,985 | |
| Class, Ltd. | | | 934,118 | | | | 1,617,477 | |
| Greencross, Ltd. | | | 371,731 | | | | 1,486,045 | |
| IPH, Ltd. | | | 783,978 | | | | 2,160,198 | |
| Magellan Financial Group, Ltd. | | | 172,600 | | | | 3,035,444 | |
| National Storage REIT | | | 3,722,452 | | | | 4,483,918 | |
| National Veterinary Care, Ltd. | | | 450,500 | | | | 817,373 | |
| Reject Shop, Ltd. | | | 159,931 | | | | 887,378 | |
| | | | | | | | 16,798,818 | |
| �� | | | | | | | | |
| Austria (0.92%) | | | | | | | | |
| Palfinger AG | | | 218,040 | | | | 8,188,791 | |
| | | | | | | | | |
| Bangladesh (0.53%) | | | | | | | | |
| Square Pharmaceuticals, Ltd. | | | 1,283,994 | | | | 4,746,254 | |
| | | | | | | | | |
| Belgium (0.76%) | | | | | | | | |
| Melexis NV | | | 70,792 | | | | 6,757,862 | |
| | | | | | | | | |
| Bermuda (0.46%) | | | | | | | | |
| Bank of NT Butterfield & Son, Ltd. | | | 86,084 | | | | 4,084,686 | |
| | | | | | | | | |
| Brazil (0.67%) | | | | | | | | |
| Fleury SA | | | 411,800 | | | | 3,069,222 | |
| Hapvida Participacoes e Investimentos SA(a)(b)(c) | | | 48,700 | | | | 384,379 | |
| M Dias Branco SA | | | 92,400 | | | | 1,160,011 | |
| Notre Dame Intermedica Participacoes SA(a) | | | 242,400 | | | | 1,407,403 | |
| | | | | | | | 6,021,015 | |
| | | | | | | | | |
| Britain (13.64%) | | | | | | | | |
| Alliance Pharma PLC | | | 2,321,634 | | | | 2,588,917 | |
| Arrow Global Group PLC | | | 1,052,741 | | | | 5,384,183 | |
| Ascential PLC | | | 957,200 | | | | 5,553,115 | |
| B&M European Value Retail SA | | | 1,374,500 | | | | 7,669,389 | |
| boohoo.com PLC(a) | | | 1,818,100 | | | | 4,587,960 | |
| Clinigen Group PLC | | | 725,073 | | | | 8,759,277 | |
| Close Brothers Group PLC | | | 213,022 | | | | 4,504,588 | |
| Diploma PLC | | | 224,500 | | | | 3,727,375 | |
| Domino's Pizza Group PLC | | | 699,900 | | | | 3,500,586 | |
| EMIS Group PLC | | | 274,600 | | | | 3,220,917 | |
| Impax Asset Management Group PLC | | | 400,171 | | | | 903,502 | |
| Intertek Group PLC | | | 59,600 | | | | 4,021,336 | |
| JTC PLC(a)(b)(c) | | | 1,133,800 | | | | 4,784,167 | |
| LoopUp Group PLC(a) | | | 332,200 | | | | 1,971,135 | |
| | | Shares | | | Value
(Note 2) | |
| Britain (continued) | | | | | | | | |
| Metro Bank PLC(a) | | | 108,800 | | | $ | 4,945,901 | |
| Motorpoint group PLC(c) | | | 594,495 | | | | 2,127,948 | |
| On the Beach Group PLC(b)(c) | | | 958,750 | | | | 8,077,858 | |
| Oxford Immunotec Global PLC(a) | | | 314,130 | | | | 4,030,288 | |
| Premier Asset Management Group PLC | | | 782,400 | | | | 2,660,512 | |
| Purplebricks Group PLC(a) | | | 575,900 | | | | 2,743,232 | |
| River & Mercantile Group PLC | | | 625,400 | | | | 2,634,624 | |
| RPS Group PLC | | | 1,681,911 | | | | 5,985,535 | |
| Sabre Insurance Group PLC(a)(b)(c) | | | 961,000 | | | | 3,386,903 | |
| Sanne Group PLC | | | 786,206 | | | | 6,721,518 | |
| Secure Trust Bank PLC | | | 98,500 | | | | 2,813,803 | |
| St James's Place PLC | | | 392,200 | | | | 6,136,439 | |
| Ted Baker PLC | | | 87,228 | | | | 3,199,113 | |
| Tracsis PLC | | | 190,900 | | | | 1,584,757 | |
| Ultra Electronics Holdings PLC | | | 180,000 | | | | 3,489,109 | |
| | | | | | | | 121,713,987 | |
| | | | | | | | | |
| Canada (3.74%) | | | | | | | | |
| Biosyent, Inc.(a) | | | 345,600 | | | | 2,691,694 | |
| Cipher Pharmaceuticals, Inc.(a) | | | 742,300 | | | | 2,092,859 | |
| Gildan Activewear, Inc. | | | 77,200 | | | | 2,248,748 | |
| Richelieu Hardware, Ltd. | | | 291,450 | | | | 6,290,026 | |
| Ritchie Bros Auctioneers, Inc. | | | 183,750 | | | | 6,014,138 | |
| Spartan Energy Corp.(a) | | | 422,934 | | | | 2,094,988 | |
| Stantec, Inc. | | | 302,210 | | | | 7,689,708 | |
| TFI International, Inc. | | | 145,200 | | | | 4,203,500 | |
| | | | | | | | 33,325,661 | |
| | | | | | | | | |
| China (7.06%) | | | | | | | | |
| BBI Life Sciences Corp.(c) | | | 15,551,500 | | | | 6,459,441 | |
| BrightKing Holdings, Ltd. | | | 723,291 | | | | 1,769,938 | |
| China Medical System Holdings, Ltd. | | | 5,542,000 | | | | 13,670,264 | |
| CSPC Pharmaceutical Group, Ltd. | | | 1,374,000 | | | | 3,536,251 | |
| Hop Hing Group Holdings, Ltd. | | | 33,160,000 | | | | 777,387 | |
| JD.com, Inc., ADR(a) | | | 55,000 | | | | 2,008,050 | |
| Man Wah Holdings, Ltd. | | | 14,795,000 | | | | 11,008,619 | |
| O2Micro International, Ltd., ADR(a) | | | 950,233 | | | | 1,311,322 | |
| On-Bright Electronics, Inc. | | | 813,780 | | | | 6,642,485 | |
| Silergy Corp. | | | 463,199 | | | | 9,737,880 | |
| Xiabuxiabu Catering Management China Holdings Co., Ltd.(b)(c) | | | 3,493,000 | | | | 6,025,905 | |
| | | | | | | | 62,947,542 | |
| | | | | | | | | |
| Colombia (1.27%) | | | | | | | | |
| Gran Tierra Energy, Inc.(a) | | | 1,178,037 | | | | 3,899,302 | |
| See Notes to Financial Statements. | |
| 50 | 1.855.377.7325 | www.GrandeurPeakGlobal.com |
| Grandeur Peak International Opportunities Fund | Portfolio of Investments |
| | | Shares | | | Value
(Note 2) | |
| Colombia (continued) | | | | | | | | |
| Parex Resources, Inc.(a) | | | 429,375 | | | $ | 7,387,277 | |
| | | | | | | | 11,286,579 | |
| | | | | | | | | |
| Egypt (0.08%) | | | | | | | | |
| Integrated Diagnostics Holdings PLC(b)(c) | | | 154,200 | | | | 732,450 | |
| | | | | | | | | |
| Finland (0.57%) | | | | | | | | |
| Ferratum OYJ(c) | | | 56,200 | | | | 1,808,659 | |
| Metso OYJ | | | 91,400 | | | | 3,265,987 | |
| | | | | | | | 5,074,646 | |
| | | | | | | | | |
| France (2.94%) | | | | | | | | |
| Alten SA | | | 51,300 | | | | 5,098,477 | |
| BioMerieux | | | 44,243 | | | | 3,504,868 | |
| Bureau Veritas SA | | | 140,600 | | | | 3,675,924 | |
| Esker SA | | | 97,543 | | | | 6,525,730 | |
| Infotel SA | | | 16,113 | | | | 1,041,006 | |
| Medicrea International(a) | | | 106,331 | | | | 385,216 | |
| Neurones | | | 50,872 | | | | 1,572,686 | |
| Thermador Groupe | | | 30,729 | | | | 4,434,448 | |
| | | | | | | | 26,238,355 | |
| | | | | | | | | |
| Georgia (1.17%) | | | | | | | | |
| BGEO Group PLC | | | 149,511 | | | | 7,162,948 | |
| TBC Bank Group PLC | | | 128,200 | | | | 3,243,941 | |
| | | | | | | | 10,406,889 | |
| | | | | | | | | |
| Germany (5.34%) | | | | | | | | |
| Aroundtown SA | | | 805,600 | | | | 6,440,220 | |
| CANCOM SE | | | 32,900 | | | | 3,881,626 | |
| Dermapharm Holding SE(a) | | | 85,500 | | | | 2,839,370 | |
| GRENKE AG | | | 28,800 | | | | 3,403,115 | |
| Nexus AG | | | 225,106 | | | | 7,529,915 | |
| Norma Group SE | | | 93,303 | | | | 6,867,404 | |
| PATRIZIA Immobilien AG(a) | | | 186,894 | | | | 3,741,994 | |
| publity AG | | | 115,200 | | | | 1,836,326 | |
| Wirecard AG | | | 81,111 | | | | 11,078,108 | |
| | | | | | | | 47,618,078 | |
| | | | | | | | | |
| Greece (0.10%) | | | | | | | | |
| Sarantis SA | | | 50,300 | | | | 865,578 | |
| | | | | | | | | |
| Hong Kong (2.84%) | | | | | | | | |
| International Housewares Retail Co., Ltd. | | | 13,906,000 | | | | 2,817,114 | |
| Samsonite International SA | | | 1,179,500 | | | | 5,349,990 | |
| TK Group Holdings, Ltd. | | | 4,923,000 | | | | 3,663,091 | |
| Value Partners Group, Ltd. | | | 9,103,000 | | | | 8,698,630 | |
| Vitasoy International Holdings, Ltd. | | | 1,797,338 | | | | 4,774,642 | |
| | | | | | | | 25,303,467 | |
| | | Shares | | | Value
(Note 2) | |
| India (6.92%) | | | | | | | | |
| Alkem Laboratories, Ltd. | | | 251,198 | | | $ | 7,438,645 | |
| Bajaj Finance, Ltd. | | | 219,760 | | | | 6,281,633 | |
| Byke Hospitality, Ltd. | | | 959,500 | | | | 2,743,791 | |
| City Union Bank, Ltd. | | | 940,821 | | | | 2,591,698 | |
| Cyient, Ltd. | | | 598,912 | | | | 6,828,171 | |
| Essel Propack, Ltd. | | | 229,189 | | | | 923,246 | |
| Indiabulls Housing Finance, Ltd. | | | 115,500 | | | | 2,261,889 | |
| Kellton Tech Solutions, Ltd.(a) | | | 1,337,558 | | | | 1,319,721 | |
| L&T Finance Holdings, Ltd. | | | 1,782,000 | | | | 4,624,549 | |
| L&T Technology Services, Ltd.(b)(c) | | | 38,311 | | | | 763,235 | |
| SBI Life Insurance Co., Ltd.(b)(c) | | | 83,885 | | | | 933,997 | |
| Thyrocare Technologies, Ltd. | | | 215,500 | | | | 2,160,005 | |
| Time Technoplast, Ltd. | | | 2,884,734 | | | | 6,939,527 | |
| Vakrangee, Ltd. | | | 1,534,000 | | | | 2,297,323 | |
| WNS Holdings, Ltd., ADR(a) | | | 188,200 | | | | 9,208,626 | |
| Yes Bank, Ltd. | | | 813,000 | | | | 4,409,739 | |
| | | | | | | | 61,725,795 | |
| | | | | | | | | |
| Indonesia (2.67%) | | | | | | | | |
| Arwana Citramulia Tbk PT | | | 75,956,500 | | | | 1,899,936 | |
| Astra Graphia Tbk PT | | | 10,610,800 | | | | 1,105,888 | |
| Bekasi Fajar Industrial Estate Tbk PT | | | 68,518,500 | | | | 1,310,039 | |
| Delfi, Ltd. | | | 1,445,600 | | | | 1,580,784 | |
| Indonesia Pondasi Raya Tbk PT | | | 19,134,800 | | | | 1,155,309 | |
| Link Net Tbk PT | | | 8,897,400 | | | | 3,453,438 | |
| Lippo Cikarang Tbk PT(a) | | | 2,189,000 | | | | 363,457 | |
| Panin Sekuritas Tbk PT | | | 8,494,000 | | | | 1,013,480 | |
| Selamat Sempurna Tbk PT | | | 69,686,300 | | | | 7,262,903 | |
| Tempo Scan Pacific Tbk PT | | | 19,383,500 | | | | 2,215,257 | |
| Ultrajaya Milk Industry & Trading Co., Tbk PT | | | 22,958,000 | | | | 2,458,754 | |
| | | | | | | | 23,819,245 | |
| | | | | | | | | |
| Ireland (1.08%) | | | | | | | | |
| Irish Residential Properties REIT PLC | | | 5,867,176 | | | | 9,650,048 | |
| | | | | | | | | |
| Israel (1.10%) | | | | | | | | |
| Sarine Technologies, Ltd. | | | 1,358,600 | | | | 1,075,814 | |
| Wix.com, Ltd.(a) | | | 106,683 | | | | 8,774,677 | |
| | | | | | | | 9,850,491 | |
| | | | | | | | | |
| Italy (0.66%) | | | | | | | | |
| Brembo SpA | | | 235,810 | | | | 3,488,362 | |
| DiaSorin SpA | | | 25,533 | | | | 2,415,817 | |
| | | | | | | | 5,904,179 | |
| | | | | | | | | |
| Japan (11.38%) | | | | | | | | |
| Aeon Delight Co., Ltd. | | | 52,300 | | | | 1,834,710 | |
| AIT Corp. | | | 500,200 | | | | 5,490,670 | |
| Amiyaki Tei Co., Ltd. | | | 67,000 | | | | 3,291,163 | |
| See Notes to Financial Statements. | |
| Annual Report | April 30, 2018 | 51 |
| Grandeur Peak International Opportunities Fund | Portfolio of Investments |
| | | Shares | | | Value
(Note 2) | |
| Japan (continued) | | | | | | | | |
| Anshin Guarantor Service Co., Ltd. | | | 375,000 | | | $ | 981,065 | |
| Arcland Service Holdings Co., Ltd. | | | 143,200 | | | | 3,067,823 | |
| Create SD Holdings Co., Ltd. | | | 318,300 | | | | 9,229,885 | |
| Dip Corp. | | | 147,900 | | | | 3,596,032 | |
| Future Corp. | | | 389,600 | | | | 4,501,142 | |
| Hard Off Corp. Co., Ltd. | | | 206,700 | | | | 2,149,816 | |
| Japan Lifeline Co., Ltd. | | | 118,800 | | | | 3,510,099 | |
| M&A Capital Partners Co., Ltd.(a) | | | 135,800 | | | | 9,825,997 | |
| Macromill, Inc. | | | 52,800 | | | | 1,426,257 | |
| MISUMI Group, Inc. | | | 253,800 | | | | 7,034,522 | |
| Nihon M&A Center, Inc. | | | 214,200 | | | | 6,289,627 | |
| Nippon Valqua Industries, Ltd. | | | 112,500 | | | | 3,107,848 | |
| Prestige International, Inc. | | | 135,500 | | | | 1,562,985 | |
| Qol Co., Ltd. | | | 172,500 | | | | 3,547,201 | |
| Quick Co., Ltd. | | | 209,400 | | | | 3,451,690 | |
| Seria Co., Ltd. | | | 83,500 | | | | 4,094,036 | |
| Synchro Food Co., Ltd.(a) | | | 337,500 | | | | 3,383,644 | |
| Syuppin Co., Ltd. | | | 314,800 | | | | 3,553,450 | |
| Tokyo Century Corp. | | | 104,500 | | | | 6,538,419 | |
| Trancom Co., Ltd. | | | 87,790 | | | | 6,665,359 | |
| Trust Tech, Inc. | | | 105,700 | | | | 3,393,771 | |
| | | | | | | | 101,527,211 | |
| | | | | | | | | |
| Luxembourg (0.91%) | | | | | | | | |
| Grand City Properties SA | | | 187,800 | | | | 4,535,747 | |
| L'Occitane International SA | | | 1,908,712 | | | | 3,555,436 | |
| | | | | | | | 8,091,183 | |
| | | | | | | | | |
| Malaysia (1.23%) | | | | | | | | |
| AEON Credit Service M Bhd | | | 1,130,560 | | | | 3,769,014 | |
| CB Industrial Product Holding Bhd | | | 2,484,400 | | | | 930,819 | |
| My EG Services Bhd | | | 6,480,400 | | | | 4,327,424 | |
| Scicom MSC Bhd | | | 3,754,500 | | | | 1,980,837 | |
| | | | | | | | 11,008,094 | |
| | | | | | | | | |
| Mexico (1.16%) | | | | | | | | |
| Credito Real SAB de CV SOFOM ER(a) | | | 3,075,340 | | | | 4,479,309 | |
| Regional SAB de CV | | | 560,065 | | | | 3,564,857 | |
| Unifin Financiera SAB de CV SOFOM ENR | | | 650,400 | | | | 2,330,055 | |
| | | | | | | | 10,374,221 | |
| | | | | | | | | |
| Netherlands (0.69%) | | | | | | | | |
| Aalberts Industries NV | | | 125,297 | | | | 6,179,448 | |
| | | | | | | | | |
| New Zealand (0.74%) | | | | | | | | |
| CBL Corp., Ltd.(d) | | | 1,542,256 | | | | 249,580 | |
| | | Shares | | | Value
(Note 2) | |
| New Zealand (continued) | | | | | | | | |
| Restaurant Brands New Zealand, Ltd. | | | 1,253,817 | | | $ | 6,334,094 | |
| | | | | | | | 6,583,674 | |
| | | | | | | | | |
| Norway (2.54%) | | | | | | | | |
| Medistim ASA | | | 420,559 | | | | 4,162,445 | |
| Multiconsult ASA(b)(c) | | | 176,700 | | | | 1,497,775 | |
| Norwegian Finans Holding ASA(a) | | | 215,600 | | | | 2,628,383 | |
| Sbanken ASA(b)(c) | | | 945,100 | | | | 8,541,160 | |
| TGS NOPEC Geophysical Co., ASA | | | 182,600 | | | | 5,785,987 | |
| | | | | | | | 22,615,750 | |
| | | | | | | | | |
| Oman (0.52%) | | | | | | | | |
| Tethys Oil AB | | | 517,908 | | | | 4,642,846 | |
| | | | | | | | | |
| Peru (1.24%) | | | | | | | | |
| Alicorp SAA | | | 1,952,297 | | | | 7,171,826 | |
| Credicorp, Ltd. | | | 16,850 | | | | 3,917,456 | |
| | | | | | | | 11,089,282 | |
| | | | | | | | | |
| Philippines (2.45%) | | | | | | | | |
| Concepcion Industrial Corp. | | | 2,933,800 | | | | 3,401,540 | |
| Holcim Philippines, Inc. | | | 2,303,300 | | | | 413,485 | |
| Pepsi-Cola Products Philippines, Inc. | | | 28,245,500 | | | | 1,430,028 | |
| Puregold Price Club, Inc. | | | 6,696,000 | | | | 6,133,207 | |
| Robinsons Retail Holdings, Inc. | | | 1,696,000 | | | | 2,982,367 | |
| Security Bank Corp. | | | 1,847,760 | | | | 7,462,523 | |
| | | | | | | | 21,823,150 | |
| | | | | | | | | |
| Poland (0.84%) | | | | | | | | |
| Dino Polska SA(a)(b)(c) | | | 221,200 | | | | 5,987,151 | |
| LiveChat Software SA | | | 85,000 | | | | 1,077,681 | |
| PGS Software SA | | | 130,778 | | | | 417,315 | |
| | | | | | | | 7,482,147 | |
| | | | | | | | | |
| Singapore (0.50%) | | | | | | | | |
| Riverstone Holdings, Ltd. | | | 5,677,000 | | | | 4,495,362 | |
| | | | | | | | | |
| South Africa (1.68%) | | | | | | | | |
| Blue Label Telecoms, Ltd. | | | 1,526,900 | | | | 1,522,613 | |
| Cartrack Holdings, Ltd. | | | 1,921,110 | | | | 2,912,874 | |
| Cashbuild, Ltd. | | | 84,092 | | | | 2,934,619 | |
| EOH Holdings, Ltd. | | | 349,156 | | | | 1,062,734 | |
| Italtile, Ltd. | | | 4,209,423 | | | | 4,842,609 | |
| Shoprite Holdings, Ltd. | | | 84,200 | | | | 1,681,974 | |
| | | | | | | | 14,957,423 | |
| | | | | | | | | |
| South Korea (3.08%) | | | | | | | | |
| Hy-Lok Corp. | | | 180,152 | | | | 4,655,395 | |
| ISC Co., Ltd. | | | 265,147 | | | | 3,847,927 | |
| See Notes to Financial Statements. | |
| 52 | 1.855.377.7325 | www.GrandeurPeakGlobal.com |
| Grandeur Peak International Opportunities Fund | Portfolio of Investments |
| | | Shares | | | Value
(Note 2) | |
| South Korea (continued) | | | | | | | | |
| Kakao M Corp. | | | 41,909 | | | $ | 3,511,873 | |
| Koh Young Technology, Inc. | | | 36,383 | | | | 3,467,805 | |
| LEENO Industrial, Inc. | | | 79,500 | | | | 4,265,109 | |
| Medy-Tox, Inc. | | | 6,905 | | | | 4,510,021 | |
| Vitzrocell Co., Ltd.(a)(d) | | | 390,884 | | | | 3,214,761 | |
| | | | | | | | 27,472,891 | |
| | | | | | | | | |
| Sweden (2.79%) | | | | | | | | |
| AddTech AB, Class B | | | 343,608 | | | | 7,165,163 | |
| Bufab AB | | | 386,694 | | | | 5,237,381 | |
| HIQ International AB | | | 162,196 | | | | 1,315,105 | |
| Hoist Finance AB(b)(c) | | | 414,200 | | | | 3,675,303 | |
| Indutrade AB | | | 186,250 | | | | 4,411,304 | |
| KNOW IT AB | | | 30,535 | | | | 623,487 | |
| Moberg Pharma AB(a) | | | 133,908 | | | | 414,417 | |
| Nibe Industrier AB, Class B | | | 82,700 | | | | 846,205 | |
| TF Bank AB(c) | | | 132,700 | | | | 1,182,027 | |
| | | | | | | | 24,870,392 | |
| | | | | | | | | |
| Switzerland (0.69%) | | | | | | | | |
| Luxoft Holding, Inc.(a) | | | 59,075 | | | | 2,383,676 | |
| VZ Holding AG | | | 13,480 | | | | 3,801,877 | |
| | | | | | | | 6,185,553 | |
| | | | | | | | | |
| Taiwan (2.76%) | | | | | | | | |
| ASPEED Technology, Inc. | | | 78,958 | | | | 2,268,410 | |
| Materials Analysis Technology, Inc. | | | 748,000 | | | | 1,789,951 | |
| Sinmag Equipment Corp. | | | 952,810 | | | | 4,975,551 | |
| Sitronix Technology Corp. | | | 841,000 | | | | 2,421,821 | |
| Sporton International, Inc. | | | 1,424,756 | | | | 7,921,598 | |
| Test Research, Inc. | | | 2,238,252 | | | | 4,138,116 | |
| TSC Auto ID Technology Co., Ltd. | | | 138,000 | | | | 1,091,444 | |
| | | | | | | | 24,606,891 | |
| | | | | | | | | |
| Thailand (0.32%) | | | | | | | | |
| Srisawad Corp., PCL | | | 1,722,000 | | | | 2,837,262 | |
| | | | | | | | | |
| United Arab Emirates (0.28%) | | | | | | | | |
| Aramex PJSC | | | 2,294,125 | | | | 2,529,493 | |
| | | | | | | | | |
| United States (4.94%) | | | | | | | | |
| Core Laboratories NV | | | 55,701 | | | | 6,820,587 | |
| Docusign, Inc.(a) | | | 125 | | | | 4,829 | |
| EPAM Systems, Inc.(a) | | | 84,075 | | | | 9,613,976 | |
| FirstCash, Inc. | | | 209,798 | | | | 18,189,487 | |
| GBGI, Ltd. | | | 1,426,215 | | | | 1,737,672 | |
| Lululemon Athletica, Inc.(a) | | | 77,250 | | | | 7,709,550 | |
| | | | | | | | 44,076,101 | |
| | | | | | | | | |
| Vietnam (1.00%) | | | | | | | | |
| Ho Chi Minh City Development Joint Stock Commercial Bank | | | 2,161,861 | | | | 4,064,737 | |
| | | Shares | | | Value
(Note 2) | |
| Vietnam (continued) | | | | | | | | |
| Vietnam Dairy Products JSC | | | 592,330 | | | $ | 4,813,893 | |
| | | | | | | | 8,878,630 | |
| | | | | | | | | |
| TOTAL COMMON STOCKS | | | | | | | | |
| (Cost $625,098,005) | | | | | | | 879,159,258 | |
| | | | | | | | | |
| | | Principal
Amount | | | Value
(Note 2) | |
| CORPORATE BONDS (0.07%) | | | | | | | | |
| Malaysia (0.07%) | | | | | | | | |
| AEON Credit Service M Bhd | | | | | | | | |
| 3.50%, 09/15/2020 | | $ | 2,235,120 | | | $ | 666,520 | |
| | | | | | | | | |
| TOTAL CORPORATE BONDS | | | | | |
| (Cost $530,970) | | | | 666,520 | |
| | | | | | | | | |
| TOTAL INVESTMENTS (98.63%) | | | | | |
| (Cost $625,628,975) | | | $ | 879,825,778 | |
| | | | | | | | | |
| Other Assets In Excess Of Liabilities (1.37%) | | | | 12,182,804 | |
| | | | | | | | | |
| NET ASSETS (100.00%) | | | $ | 892,008,582 | |
| (a) | Non-Income Producing Security. |
| (b) | Security exempt from registration under Rule 144A of the Securities Act of 1933. These securities may be resold in the ordinary course of business in transactions exempt from registration, normally to qualified institutional buyers. As of April 30, 2018, these securities had a total aggregate market value of $44,790,283 representing 5.02% of net assets. |
| (c) | Security was purchased pursuant to Regulation S under the Securities Act of 1933, which exempts securities offered and sold outside of the United States from registration. Such security cannot be sold in the United States without either an effective registration statement filed pursuant to the Securities Act of 1933, or pursuant to an exemption from registration. The security has been deemed liquid under guidelines approved by the Fund's Board of Trustees. As of April 30, 2018, the aggregate market value of those securities was $56,368,357, representing 6.32% of net assets. |
| (d) | As a result of the use of significant unobservable inputs to determine fair value, these investments have been classified as level 3 assets. See also footnote 2 to the financial statements for additional information. |
For Fund compliance purposes, the Fund's geographical classifications refer to any one or more of the country sub-classifications used by one or more widely recognized market indexes or ratings group indexes, and/or as defined by Fund management. This definition may not apply for purposes of this report, which may combine sub-classifications for reporting ease. Geographical regions are shown as a percentage of net assets.
| See Notes to Financial Statements. | |
| Annual Report | April 30, 2018 | 53 |
| Grandeur Peak International Stalwarts Fund | Portfolio of Investments |
April 30, 2018
| | | Shares | | | Value
(Note 2) | |
| COMMON STOCKS (94.09%) | | | | | | | | |
| Argentina (1.05%) | | | | | | | | |
| Despegar.com Corp.(a) | | | 106,600 | | | $ | 3,129,776 | |
| Globant SA(a) | | | 58,500 | | | | 2,633,085 | |
| | | | | | | | 5,762,861 | |
| | | | | | | | | |
| Australia (0.99%) | | | | | | | | |
| carsales.com, Ltd. | | | 254,980 | | | | 2,752,731 | |
| Magellan Financial Group, Ltd. | | | 151,709 | | | | 2,668,043 | |
| | | | | | | | 5,420,774 | |
| | | | | | | | | |
| Bangladesh (0.60%) | | | | | | | | |
| Square Pharmaceuticals, Ltd. | | | 886,742 | | | | 3,277,821 | |
| | | | | | | | | |
| Belgium (1.00%) | | | | | | | | |
| Melexis NV | | | 57,394 | | | | 5,478,878 | |
| | | | | | | | | |
| Bermuda (0.93%) | | | | | | | | |
| Bank of NT Butterfield & Son, Ltd. | | | 107,057 | | | | 5,079,855 | |
| | | | | | | | | |
| Brazil (2.36%) | | | | | | | | |
| Fleury SA | | | 441,500 | | | | 3,290,582 | |
| Hapvida Participacoes e Investimentos SA(a)(b)(c) | | | 73,000 | | | | 576,173 | |
| M Dias Branco SA | | | 204,500 | | | | 2,567,341 | |
| Notre Dame Intermedica Participacoes SA(a) | | | 144,800 | | | | 840,726 | |
| Pagseguro Digital, Ltd., Class A(a) | | | 67,275 | | | | 2,235,548 | |
| Raia Drogasil SA | | | 176,300 | | | | 3,458,363 | |
| | | | | | | | 12,968,733 | |
| | | | | | | | | |
| Britain (12.46%) | | | | | | | | |
| Abcam PLC | | | 173,050 | | | | 2,908,886 | |
| Ascential PLC | | | 706,800 | | | | 4,100,440 | |
| B&M European Value Retail SA | | | 2,127,800 | | | | 11,872,627 | |
| boohoo.com PLC(a) | | | 1,111,800 | | | | 2,805,618 | |
| Clinigen Group PLC | | | 222,300 | | | | 2,685,505 | |
| Close Brothers Group PLC | | | 158,598 | | | | 3,353,732 | |
| Diploma PLC | | | 455,217 | | | | 7,557,970 | |
| Domino's Pizza Group PLC | | | 633,200 | | | | 3,166,983 | |
| Intertek Group PLC | | | 84,900 | | | | 5,728,380 | |
| Metro Bank PLC(a) | | | 137,825 | | | | 6,265,338 | |
| Sanne Group PLC | | | 777,600 | | | | 6,647,943 | |
| St James's Place PLC | | | 474,200 | | | | 7,419,427 | |
| Ted Baker PLC | | | 19,300 | | | | 707,833 | |
| Ultra Electronics Holdings PLC | | | 164,450 | | | | 3,187,689 | |
| | | | | | | | 68,408,371 | |
| | | | | | | | | |
| Canada (5.61%) | | | | | | | | |
| Gildan Activewear, Inc. | | | 189,994 | | | | 5,534,309 | |
| Ritchie Bros Auctioneers, Inc. | | | 344,450 | | | | 11,273,849 | |
| Spartan Energy Corp.(a) | | | 154,861 | | | | 767,098 | |
| | | Shares | | | Value
(Note 2) | |
| Canada (continued) | | | | | | | | |
| Stantec, Inc. | | | 518,739 | | | $ | 13,199,270 | |
| | | | | | | | 30,774,526 | |
| | | | | | | | | |
| China (8.70%) | | | | | | | | |
| 58.com, Inc., ADR(a) | | | 25,450 | | | | 2,224,075 | |
| ANTA Sports Products, Ltd. | | | 424,000 | | | | 2,439,095 | |
| China Medical System Holdings, Ltd. | | | 4,296,600 | | | | 10,598,278 | |
| CSPC Pharmaceutical Group, Ltd. | | | 1,396,000 | | | | 3,592,873 | |
| Ctrip.com International, Ltd., ADR(a) | | | 94,950 | | | | 3,883,455 | |
| JD.com, Inc., ADR(a) | | | 77,850 | | | | 2,842,303 | |
| Man Wah Holdings, Ltd. | | | 8,170,600 | | | | 6,079,556 | |
| Silergy Corp. | | | 407,200 | | | | 8,560,607 | |
| Tencent Holdings, Ltd. | | | 54,000 | | | | 2,690,144 | |
| Yum China Holdings, Inc. | | | 113,525 | | | | 4,854,329 | |
| | | | | | | | 47,764,715 | |
| | | | | | | | | |
| Colombia (1.03%) | | | | | | | | |
| Parex Resources, Inc.(a) | | | 327,919 | | | | 5,641,754 | |
| | | | | | | | | |
| Denmark (0.39%) | | | | | | | | |
| Ambu A/S | | | 91,767 | | | | 2,135,880 | |
| | | | | | | | | |
| Egypt (0.41%) | | | | | | | | |
| Commercial International Bank Egypt SAE | | | 420,752 | | | | 2,236,623 | |
| | | | | | | | | |
| France (2.73%) | | | | | | | | |
| Alten SA | | | 77,014 | | | | 7,654,076 | |
| BioMerieux | | | 59,350 | | | | 4,701,623 | |
| Bureau Veritas SA | | | 100,200 | | | | 2,619,684 | |
| | | | | | | | 14,975,383 | |
| | | | | | | | | |
| Georgia (0.87%) | | | | | | | | |
| BGEO Group PLC | | | 99,500 | | | | 4,766,962 | |
| | | | | | | | | |
| Germany (7.13%) | | | | | | | | |
| Aroundtown SA | | | 727,564 | | | | 5,816,376 | |
| CTS Eventim AG & Co., KGaA | | | 45,650 | | | | 2,141,131 | |
| Dermapharm Holding SE(a) | | | 86,634 | | | | 2,877,029 | |
| GRENKE AG | | | 52,050 | | | | 6,150,421 | |
| Norma Group SE | | | 103,850 | | | | 7,643,697 | |
| PATRIZIA Immobilien AG(a) | | | 295,180 | | | | 5,910,098 | |
| Wirecard AG | | | 62,750 | | | | 8,570,370 | |
| | | | | | | | 39,109,122 | |
| | | | | | | | | |
| Hong Kong (4.53%) | | | | | | | | |
| Samsonite International SA | | | 1,467,360 | | | | 6,655,669 | |
| Value Partners Group, Ltd. | | | 9,761,000 | | | | 9,327,400 | |
See Notes to Financial Statements.
| 54 | 1.855.377.7325 | www.GrandeurPeakGlobal.com |
| Grandeur Peak International Stalwarts Fund | Portfolio of Investments |
April 30, 2018
| | | Shares | | | Value
(Note 2) | |
| Hong Kong (continued) | | | | | | | | |
| Vitasoy International Holdings, Ltd. | | | 3,347,000 | | | $ | 8,891,332 | |
| | | | | | | | 24,874,401 | |
| | | | | | | | | |
| India (5.59%) | | | | | | | | |
| Alkem Laboratories, Ltd. | | | 128,674 | | | | 3,810,382 | |
| Bajaj Finance, Ltd. | | | 171,250 | | | | 4,895,020 | |
| Indiabulls Housing Finance, Ltd. | | | 101,000 | | | | 1,977,929 | |
| L&T Finance Holdings, Ltd. | | | 1,319,500 | | | | 3,424,294 | |
| SBI Life Insurance Co., Ltd.(b)(c) | | | 243,705 | | | | 2,713,473 | |
| Vakrangee, Ltd. | | | 882,000 | | | | 1,320,886 | |
| WNS Holdings, Ltd., ADR(a) | | | 166,895 | | | | 8,166,172 | |
| Yes Bank, Ltd. | | | 809,250 | | | | 4,389,399 | |
| | | | | | | | 30,697,555 | |
| | | | | | | | | |
| Indonesia (0.18%) | | | | | | | | |
| Delfi, Ltd. | | | 893,700 | | | | 977,274 | |
| | | | | | | | | |
| Israel (0.93%) | | | | | | | | |
| Wix.com, Ltd.(a) | | | 62,200 | | | | 5,115,950 | |
| | | | | | | | | |
| Italy (2.44%) | | | | | | | | |
| Brembo SpA | | | 605,057 | | | | 8,950,671 | |
| DiaSorin SpA | | | 46,837 | | | | 4,431,506 | |
| | | | | | | | 13,382,177 | |
| | | | | | | | | |
| Japan (8.68%) | | | | | | | | |
| Aeon Delight Co., Ltd. | | | 79,400 | | | | 2,785,392 | |
| Create SD Holdings Co., Ltd. | | | 190,900 | | | | 5,535,611 | |
| Dip Corp. | | | 144,500 | | | | 3,513,364 | |
| Ezaki Glico Co., Ltd. | | | 76,000 | | | | 4,108,672 | |
| Japan Lifeline Co., Ltd. | | | 56,600 | | | | 1,672,320 | |
| MISUMI Group, Inc. | | | 325,000 | | | | 9,007,958 | |
| MonotaRO Co., Ltd. | | | 136,100 | | | | 4,762,006 | |
| Nihon M&A Center, Inc. | | | 419,300 | | | | 12,312,047 | |
| Seria Co., Ltd. | | | 80,000 | | | | 3,922,430 | |
| | | | | | | | 47,619,800 | |
| | | | | | | | | |
| Kenya (0.37%) | | | | | | | | |
| Safaricom, Ltd. | | | 7,156,700 | | | | 2,015,721 | |
| | | | | | | | | |
| Luxembourg (0.91%) | | | | | | | | |
| Grand City Properties SA | | | 207,200 | | | | 5,004,296 | |
| | | | | | | | | |
| Malaysia (0.31%) | | | | | | | | |
| My EG Services Bhd | | | 2,549,000 | | | | 1,702,149 | |
| | | | | | | | | |
| Mexico (0.96%) | | | | | | | | |
| Regional SAB de CV | | | 831,250 | | | | 5,290,971 | |
| | | | | | | | | |
| Netherlands (1.58%) | | | | | | | | |
| Aalberts Industries NV | | | 175,671 | | | | 8,663,813 | |
| | | Shares | | | Value
(Note 2) | |
| Norway (0.55%) | | | | | | |
| TGS NOPEC Geophysical Co., ASA | | | 95,600 | | | $ | 3,029,246 | |
| | | | | | | | | |
| Peru (1.47%) | | | | | | | | |
| Alicorp SAA | | | 1,142,439 | | | | 4,196,787 | |
| Credicorp, Ltd. | | | 16,725 | | | | 3,888,395 | |
| | | | | | | | 8,085,182 | |
| | | | | | | | | |
| Philippines (2.76%) | | | | | | | | |
| Puregold Price Club, Inc. | | | 4,374,200 | | | | 4,006,552 | |
| Robinsons Land Corp. | | | 3,694,438 | | | | 1,277,895 | |
| Robinsons Retail Holdings, Inc. | | | 1,927,320 | | | | 3,389,137 | |
| Security Bank Corp. | | | 1,605,200 | | | | 6,482,899 | |
| | | | | | | | 15,156,483 | |
| | | | | | | | | |
| Poland (1.39%) | | | | | | | | |
| AmRest Holdings SE(a) | | | 28,900 | | | | 3,795,860 | |
| Dino Polska SA(a)(b)(c) | | | 140,672 | | | | 3,807,525 | |
| | | | | | | | 7,603,385 | |
| | | | | | | | | |
| South Korea (2.25%) | | | | | | | | |
| BGF Retail Co., Ltd. | | | 7,814 | | | | 1,397,382 | |
| LG Household & Health Care, Ltd. | | | 4,350 | | | | 5,579,795 | |
| Medy-Tox, Inc. | | | 8,250 | | | | 5,388,512 | |
| | | | | | | | 12,365,689 | |
| | | | | | | | | |
| Sweden (2.03%) | | | | | | | | |
| Indutrade AB | | | 183,850 | | | | 4,354,461 | |
| Nibe Industrier AB, Class B | | | 305,300 | | | | 3,123,898 | |
| Sweco AB, Class B | | | 178,900 | | | | 3,652,917 | |
| | | | | | | | 11,131,276 | |
| | | | | | | | | |
| Switzerland (1.96%) | | | | | | | | |
| Luxoft Holding, Inc.(a) | | | 47,400 | | | | 1,912,590 | |
| Partners Group Holding AG | | | 5,090 | | | | 3,731,468 | |
| VZ Holding AG | | | 6,689 | | | | 1,886,554 | |
| Wizz Air Holdings PLC(a)(b)(c) | | | 73,500 | | | | 3,231,928 | |
| | | | | | | | 10,762,540 | |
| | | | | | | | | |
| Thailand (1.24%) | | | | | | | | |
| Muangthai Leasing PCL | | | 1,117,000 | | | | 1,291,841 | |
| Srisawad Corp., PCL | | | 1,595,920 | | | | 2,629,526 | |
| TOA Paint Thailand PCL(a) | | | 2,396,000 | | | | 2,903,897 | |
| | | | | | | | 6,825,264 | |
| | | | | | | | | |
| United States (5.99%) | | | | | | | | |
| Burford Capital, Ltd. | | | 167,500 | | | | 3,320,601 | |
| Core Laboratories NV | | | 37,825 | | | | 4,631,671 | |
| Docusign, Inc.(a) | | | 75 | | | | 2,897 | |
| EPAM Systems, Inc.(a) | | | 75,400 | | | | 8,621,990 | |
| FirstCash, Inc. | | | 120,062 | | | | 10,409,376 | |
See Notes to Financial Statements.
| Annual Report | April 30, 2018 | 55 |
| Grandeur Peak International Stalwarts Fund | Portfolio of Investments |
April 30, 2018
| | | Shares | | | Value
(Note 2) | |
| United States (continued) | | | | | | | | |
| Lululemon Athletica, Inc.(a) | | | 59,175 | | | $ | 5,905,665 | |
| | | | | | | | 32,892,200 | |
| | | | | | | | | |
| Vietnam (1.71%) | | | | | | | | |
| Ho Chi Minh City Development Joint Stock Commercial Bank | | | 1,888,008 | | | | 3,549,838 | |
| Vietnam Dairy Products JSC | | | 717,114 | | | | 5,828,018 | |
| | | | | | | | 9,377,856 | |
| | | | | | | | | |
| TOTAL COMMON STOCKS | | | | | | | | |
| (Cost $411,144,719) | | | | | | | 516,375,486 | |
| | | | | | | | | |
| PREFERRED STOCKS (0.48%) | | | | | | | | |
| Germany (0.48%) | | | | | | | | |
| FUCHS PETROLUB SE | | | 49,100 | | | | 2,640,918 | |
| | | | | | | | | |
| TOTAL PREFERRED STOCKS | | | | | | | | |
| (Cost $2,606,055) | | | | | | | 2,640,918 | |
| | | | | | | | | |
| TOTAL INVESTMENTS (94.57%) | | | | | | | | |
| (Cost $413,750,774) | | | | | | $ | 519,016,404 | |
| | | | | | | | | |
| Other Assets In Excess Of Liabilities (5.43%) | | | | 29,820,064 | |
| | | | | | | | | |
| NET ASSETS (100.00%) | | | | | | $ | 548,836,468 | |
| (a) | Non-Income Producing Security. |
| (b) | Security exempt from registration under Rule 144A of the Securities Act of 1933. These securities may be resold in the ordinary course of business in transactions exempt from registration, normally to qualified institutional buyers. As of April 30, 2018, these securities had a total aggregate market value of $10,329,099 representing 1.88% of net assets. |
| (c) | Security was purchased pursuant to Regulation S under the Securities Act of 1933, which exempts securities offered and sold outside of the United States from registration. Such security cannot be sold in the United States without either an effective registration statement filed pursuant to the Securities Act of 1933, or pursuant to an exemption from registration. The security has been deemed liquid under guidelines approved by the Fund's Board of Trustees. As of April 30, 2018, the aggregate market value of those securities was $10,329,099, representing 1.88% of net assets. |
For Fund compliance purposes, the Fund's geographical classifications refer to any one or more of the country sub-classifications used by one or more widely recognized market indexes or ratings group indexes, and/or as defined by Fund management. This definition may not apply for purposes of this report, which may combine sub-classifications for reporting ease. Geographical regions are shown as a percentage of net assets.
See Notes to Financial Statements.
| 56 | 1.855.377.7325 | www.GrandeurPeakGlobal.com |
| Grandeur Peak Funds® | Statements of Assets and Liabilities |
April 30, 2018
| | | Grandeur Peak Emerging Markets Opportunities Fund | | | Grandeur Peak Global Micro Cap Fund | | | Grandeur Peak Global Opportunities Fund | | | Grandeur Peak Global Reach Fund | |
| ASSETS | | | | | | | | | | | | |
| Investments, at value (Cost - see below) | | $ | 461,809,954 | | | $ | 40,777,057 | | | $ | 785,840,909 | | | $ | 370,140,915 | |
| Cash | | | 30,105,161 | | | | 714,147 | | | | 616,707 | | | | 1,731,498 | |
| Foreign cash, at value (Cost $129,192, $9,174, $300,786 and $338,554, respectively) | | | 129,023 | | | | 9,161 | | | | 300,075 | | | | 338,216 | |
| Dividends and interest receivable | | | 701,986 | | | | 114,967 | | | | 2,086,340 | | | | 790,858 | |
| Receivable for investments sold | | | 601,543 | | | | 253,955 | | | | 687,838 | | | | 1,138,349 | |
| Receivable for fund shares subscribed | | | 38,528 | | | | 1,240 | | | | 248,883 | | | | 146,121 | |
| Prepaid and other assets | | | 13,521 | | | | 4,750 | | | | 10,382 | | | | 2,941 | |
| Total assets | | | 493,399,716 | | | | 41,875,277 | | | | 789,791,134 | | | | 374,288,898 | |
| | | | | | | | | | | | | | | | | |
| LIABILITIES | | | | | | | | | | | | | | | | |
| Payable for investments purchased | | | 32,446 | | | | 50,215 | | | | 1,159,108 | | | | 1,087,837 | |
| Foreign capital gains tax | | | 243,055 | | | | 2,247 | | | | 93,577 | | | | 49,552 | |
| Payable for fund shares redeemed | | | 2,401,360 | | | | 600 | | | | 7,658,589 | | | | 4,452,741 | |
| Advisory fees payable | | | 538,948 | | | | 50,468 | | | | 779,470 | | | | 337,710 | |
| Administration fees payable | | | 19,874 | | | | 9,007 | | | | 27,269 | | | | 21,841 | |
| Custodian fees payable | | | 180,859 | | | | 22,201 | | | | 117,573 | | | | 83,681 | |
| Payable for trustee fees and expenses | | | 5,243 | | | | 452 | | | | 8,439 | | | | 3,934 | |
| Payable for chief compliance officer fee | | | 729 | | | | 63 | | | | 1,174 | | | | 547 | |
| Payable for principal financial officer fees | | | 125 | | | | 11 | | | | 201 | | | | 94 | |
| Distribution and service fees payable | | | 3,863 | | | | – | | | | 38,973 | | | | 13,649 | |
| Payable for transfer agency fees | | | 4,005 | | | | 3,981 | | | | 9,907 | | | | 7,493 | |
| Accrued expenses and other liabilities | | | 41,191 | | | | 26,682 | | | | 47,677 | | | | 37,396 | |
| Total liabilities | | | 3,471,698 | | | | 165,927 | | | | 9,941,957 | | | | 6,096,475 | |
| NET ASSETS | | $ | 489,928,018 | | | $ | 41,709,350 | | | $ | 779,849,177 | | | $ | 368,192,423 | |
| | | | | | | | | | | | | | | | | |
| NET ASSETS CONSISTS OF | | | | | | | | | | | | | | | | |
| Paid-in capital (Note 5) | | $ | 397,553,875 | | | $ | 32,171,671 | | | $ | 518,822,390 | | | $ | 263,629,210 | |
| Accumulated net investment income/(loss) | | | 309,589 | | | | (128,821 | ) | | | 607,070 | | | | 4,867 | |
| Accumulated net realized gain | | | 3,064,579 | | | | 1,948,582 | | | | 32,931,109 | | | | 12,710,195 | |
| Net unrealized appreciation | | | 88,999,975 | | | | 7,717,918 | | | | 227,488,608 | | | | 91,848,151 | |
| NET ASSETS | | $ | 489,928,018 | | | $ | 41,709,350 | | | $ | 779,849,177 | | | $ | 368,192,423 | |
| | | | | | | | | | | | | | | | | |
| INVESTMENTS, AT COST | | $ | 372,564,761 | | | $ | 33,056,468 | | | $ | 558,231,675 | | | $ | 278,236,100 | |
| | | | | | | | | | | | | | | | | |
| PRICING OF SHARES | | | | | | | | | | | | | | | | |
| Investor Class | | | | | | | | | | | | | | | | |
| Net Assets | | $ | 18,667,850 | | | $ | – | | | $ | 188,378,940 | | | $ | 65,923,438 | |
| Net Asset Value, offering and redemption price per share | | $ | 13.05 | | | $ | – | | | $ | 3.95 | | | $ | 16.97 | |
| Shares of beneficial interest outstanding | | | 1,430,574 | | | | – | | | | 47,681,581 | | | | 3,884,289 | |
| Institutional Class | | | | | | | | | | | | | | | | |
| Net Assets | | $ | 471,260,168 | | | $ | 41,709,350 | | | $ | 591,470,237 | | | $ | 302,268,985 | |
| Net Asset Value, offering and redemption price per share | | $ | 13.12 | | | $ | 13.12 | | | $ | 4.00 | | | $ | 17.02 | |
| Shares of beneficial interest outstanding | | | 35,927,763 | | | | 3,179,799 | | | | 147,949,683 | | | | 17,755,455 | |
See Notes to Financial Statements.
| Annual Report | April 30, 2018 | 57 |
| Grandeur Peak Funds® | Statements of Assets and Liabilities |
April 30, 2018
| | | Grandeur Peak Global Stalwarts Fund | | | Grandeur Peak International Opportunities Fund | | | Grandeur Peak International Stalwarts Fund | |
| ASSETS | | | | | | | | | |
| Investments, at value (Cost - see below) | | $ | 182,964,721 | | | $ | 879,825,778 | | | $ | 519,016,404 | |
| Cash | | | 4,048,308 | | | | 10,147,292 | | | | 25,015,153 | |
| Foreign cash, at value (Cost $215,136, $334,861 and $753,620, respectively) | | | 215,099 | | | | 334,298 | | | | 751,942 | |
| Dividends and interest receivable | | | 303,168 | | | | 2,930,283 | | | | 1,131,619 | |
| Receivable for investments sold | | | 2,133,540 | | | | 1,059,712 | | | | 7,322,274 | |
| Receivable for fund shares subscribed | | | 48,187 | | | | 399,668 | | | | 235,404 | |
| Prepaid and other assets | | | 6,136 | | | | 10,357 | | | | 7,917 | |
| Total assets | | | 189,719,159 | | | | 894,707,388 | | | | 553,480,713 | |
| | | | | | | | | | | | | |
| LIABILITIES | | | | | | | | | | | | |
| Payable for investments purchased | | | 1,265,238 | | | | 594,976 | | | | 3,774,855 | |
| Foreign capital gains tax | | | 20,847 | | | | 176,474 | | | | 64,295 | |
| Payable for fund shares redeemed | | | 118,858 | | | | 782,791 | | | | 261,508 | |
| Advisory fees payable | | | 122,038 | | | | 873,164 | | | | 353,106 | |
| Administration fees payable | | | 8,771 | | | | 30,188 | | | | 17,071 | |
| Custodian fees payable | | | 36,584 | | | | 162,110 | | | | 93,022 | |
| Payable for trustee fees and expenses | | | 1,918 | | | | 9,497 | | | | 5,537 | |
| Payable for chief compliance officer fee | | | 267 | | | | 1,321 | | | | 770 | |
| Payable for principal financial officer fees | | | 46 | | | | 226 | | | | 132 | |
| Distribution and service fees payable | | | 18,943 | | | | 16,323 | | | | 10,540 | |
| Payable for transfer agency fees | | | 7,618 | | | | 7,324 | | | | 14,607 | |
| Accrued expenses and other liabilities | | | 33,329 | | | | 44,412 | | | | 48,802 | |
| Total liabilities | | | 1,634,457 | | | | 2,698,806 | | | | 4,644,245 | |
| NET ASSETS | | $ | 188,084,702 | | | $ | 892,008,582 | | | $ | 548,836,468 | |
| | | | | | | | | | | | | |
| NET ASSETS CONSISTS OF | | | | | | | | | | | | |
| Paid-in capital (Note 5) | | $ | 150,457,803 | | | $ | 600,144,169 | | | $ | 434,541,799 | |
| Accumulated net investment income | | | 56,737 | | | | 1,101,791 | | | | 1,152,977 | |
| Accumulated net realized gain | | | 2,945,283 | | | | 36,780,394 | | | | 7,927,609 | |
| Net unrealized appreciation | | | 34,624,879 | | | | 253,982,228 | | | | 105,214,083 | |
| NET ASSETS | | $ | 188,084,702 | | | $ | 892,008,582 | | | $ | 548,836,468 | |
| | | | | | | | | | | | | |
| INVESTMENTS, AT COST | | $ | 148,323,491 | | | $ | 625,628,975 | | | $ | 413,750,774 | |
| | | | | | | | | | | | | |
| PRICING OF SHARES | | | | | | | | | | | | |
| Investor Class | | | | | | | | | | | | |
| Net Assets | | $ | 92,551,756 | | | $ | 78,686,219 | | | $ | 52,477,990 | |
| Net Asset Value, offering and redemption price per share | | $ | 15.06 | | | $ | 4.10 | | | $ | 15.53 | |
| Shares of beneficial interest outstanding | | | 6,145,035 | | | | 19,176,458 | | | | 3,379,689 | |
| Institutional Class | | | | | | | | | | | | |
| Net Assets | | $ | 95,532,946 | | | $ | 813,322,363 | | | $ | 496,358,478 | |
| Net Asset Value, offering and redemption price per share | | $ | 15.14 | | | $ | 4.12 | | | $ | 15.57 | |
| Shares of beneficial interest outstanding | | | 6,308,473 | | | | 197,210,493 | | | | 31,886,760 | |
See Notes to Financial Statements.
| 58 | 1.855.377.7325 | www.GrandeurPeakGlobal.com |
| Grandeur Peak Funds® | Statements of Operations |
For the Year Ended April 30, 2018
| | | Grandeur Peak Emerging Markets Opportunities Fund | | | Grandeur Peak Global Micro Cap Fund | | | Grandeur Peak Global Opportunities Fund | | | Grandeur Peak Global Reach Fund | |
| INVESTMENT INCOME | | | | | | | | | | | | |
| Dividends | | $ | 10,000,644 | | | $ | 877,051 | | | $ | 13,074,086 | | | $ | 5,918,803 | |
| Interest | | | 11,958 | | | | 6,727 | | | | 8,878 | | | | 34,570 | |
| Foreign taxes withheld | | | (803,559 | ) | | | (70,012 | ) | | | (818,065 | ) | | | (459,736 | ) |
| Total investment income | | | 9,209,043 | | | | 813,766 | | | | 12,264,899 | | | | 5,493,637 | |
| | | | | | | | | | | | | | | | | |
| EXPENSES | | | | | | | | | | | | | | | | |
| Investment advisor fees (Note 6) | | | 6,119,337 | | | | 610,902 | | | | 9,636,891 | | | | 3,893,761 | |
| Recoupment of previously waived fees (Note 6) | | | – | | | | 3,378 | | | | – | | | | – | |
| Administrative fees | | | 160,656 | | | | 32,196 | | | | 260,168 | | | | 141,186 | |
| Distribution and service fees - Investor Class | | | 42,932 | | | | – | | | | 451,216 | | | | 160,880 | |
| Transfer agent fees | | | 36,779 | | | | 37,636 | | | | 72,768 | | | | 58,738 | |
| Professional fees | | | 68,671 | | | | 39,726 | | | | 63,839 | | | | 48,380 | |
| Printing fees | | | 18,832 | | | | 3,105 | | | | 30,739 | | | | 23,252 | |
| Registration fees | | | 35,679 | | | | 19,149 | | | | 36,102 | | | | 38,072 | |
| Custodian fees | | | 572,989 | | | | 89,275 | | | | 360,038 | | | | 287,273 | |
| Trustee fees and expenses | | | 10,067 | | | | 897 | | | | 16,905 | | | | 7,778 | |
| Chief compliance officer fees | | | 8,389 | | | | 754 | | | | 14,267 | | | | 6,551 | |
| Principal financial officer fees | | | 1,480 | | | | 133 | | | | 2,517 | | | | 1,155 | |
| Other expenses | | | 13,906 | | | | 5,177 | | | | 19,838 | | | | 11,897 | |
| Total expenses | | | 7,089,717 | | | | 842,328 | | | | 10,965,288 | | | | 4,678,923 | |
| Voluntary waiver of investment advisory fees (Note 6) | | | (45,876 | ) | | | – | | | | (406,427 | ) | | | – | |
| Less fees waived/reimbursed by investment advisor (Note 6) | | | – | | | | (27,510 | ) | | | – | | | | – | |
| Total net expenses | | | 7,043,841 | | | | 814,818 | | | | 10,558,861 | | | | 4,678,923 | |
| NET INVESTMENT INCOME/(LOSS) | | | 2,165,202 | | | | (1,052 | ) | | | 1,706,038 | | | | 814,714 | |
| | | | | | | | | | | | | | | | | |
| REALIZED AND UNREALIZED GAIN/(LOSS) ON INVESTMENTS | | | | | | | | | | | | | | | | |
| Net realized gain on investments | | | 14,200,738 | | | | 4,077,314 | | | | 65,466,171 | | | | 23,748,250 | |
| Net realized loss on foreign currency transactions | | | (183,528 | ) | | | (2,302 | ) | | | (159,678 | ) | | | (63,790 | ) |
| Net realized gain | | | 14,017,210 | | | | 4,075,012 | | | | 65,306,493 | | | | 23,684,460 | |
| Net change in unrealized appreciation on investments (net of change in foreign capital gains tax of $(1,642,840), $(37,569), $(434,366) and $(262,184), respectively) | | | 37,634,355 | | | | 2,334,812 | | | | 61,160,412 | | | | 35,212,022 | |
| Net change in unrealized depreciation on translation of assets and liabilities in foreign currencies | | | (3,118 | ) | | | (433 | ) | | | (17,717 | ) | | | (7,425 | ) |
| Net change in unrealized appreciation | | | 37,631,237 | | | | 2,334,379 | | | | 61,142,695 | | | | 35,204,597 | |
| NET REALIZED AND UNREALIZED GAIN ON INVESTMENTS AND FOREIGN CURRENCY TRANSACTIONS | | | 51,648,447 | | | | 6,409,391 | | | | 126,449,188 | | | | 58,889,057 | |
| NET INCREASE IN NET ASSETS RESULTING FROM OPERATIONS | | $ | 53,813,649 | | | $ | 6,408,339 | | | $ | 128,155,226 | | | $ | 59,703,771 | |
See Notes to Financial Statements.
| Annual Report | April 30, 2018 | 59 |
| Grandeur Peak Funds® | Statements of Operations |
For the Year Ended April 30, 2018
| | | Grandeur Peak Global Stalwarts Fund | | | Grandeur Peak International Opportunities Fund | | | Grandeur Peak International Stalwarts Fund | |
| INVESTMENT INCOME | | | | | | | | | |
| Dividends | | $ | 2,074,937 | | | $ | 17,481,091 | | | $ | 6,945,828 | |
| Interest | | | – | | | | 11,822 | | | | – | |
| Foreign taxes withheld | | | (102,555 | ) | | | (1,432,392 | ) | | | (404,756 | ) |
| Total investment income | | | 1,972,382 | | | | 16,060,521 | | | | 6,541,072 | |
| | | | | | | | | | | | | |
| EXPENSES | | | | | | | | | | | | |
| Investment advisor fees (Note 6) | | | 1,188,576 | | | | 10,860,044 | | | | 3,455,880 | |
| Recoupment of previously waived fees (Note 6) | | | 118,610 | | | | – | | | | – | |
| Administrative fees | | | 56,469 | | | | 291,947 | | | | 144,440 | |
| Distribution and service fees - Investor Class | | | 195,432 | | | | 197,748 | | | | 105,343 | |
| Transfer agent fees | | | 55,796 | | | | 56,474 | | | | 91,591 | |
| Professional fees | | | 41,012 | | | | 60,029 | | | | 40,009 | |
| Printing fees | | | 10,335 | | | | 21,765 | | | | 18,147 | |
| Registration fees | | | 38,284 | | | | 32,873 | | | | 54,754 | |
| Custodian fees | | | 115,311 | | | | 497,269 | | | | 249,135 | |
| Trustee fees and expenses | | | 3,535 | | | | 19,128 | | | | 10,400 | |
| Chief compliance officer fees | | | 2,729 | | | | 16,082 | | | | 7,929 | |
| Principal financial officer fees | | | 481 | | | | 2,837 | | | | 1,398 | |
| Other expenses | | | 7,644 | | | | 21,757 | | | | 12,445 | |
| Total expenses | | | 1,834,214 | | | | 12,077,953 | | | | 4,191,471 | |
| Voluntary waiver of investment advisory fees (Note 6) | | | – | | | | (553,205 | ) | | | – | |
| Less fees waived/reimbursed by investment advisor (Note 6) | | | (576 | ) | | | – | | | | – | |
| Total net expenses | | | 1,833,638 | | | | 11,524,748 | | | | 4,191,471 | |
| NET INVESTMENT INCOME | | | 138,744 | | | | 4,535,773 | | | | 2,349,601 | |
| | | | | | | | | | | | | |
| REALIZED AND UNREALIZED GAIN/(LOSS) ON INVESTMENTS | | | | | | | | | | | | |
| Net realized gain on investments | | | 4,974,741 | | | | 65,489,581 | | | | 13,586,423 | |
| Net realized loss on foreign currency transactions | | | (63,304 | ) | | | (287,579 | ) | | | (223,868 | ) |
| Net realized gain | | | 4,911,437 | | | | 65,202,002 | | | | 13,362,555 | |
| Net change in unrealized appreciation on investments (net of change in foreign capital gains tax of $(88,786), $(933,111) and $(176,713), respectively) | | | 20,019,641 | | | | 81,861,284 | | | | 60,823,224 | |
| Net change in unrealized appreciation on translation of assets and liabilities in foreign currencies | | | 3,861 | | | | 10,153 | | | | 11,723 | |
| Net change in unrealized appreciation | | | 20,023,502 | | | | 81,871,437 | | | | 60,834,947 | |
| NET REALIZED AND UNREALIZED GAIN ON INVESTMENTS AND FOREIGN CURRENCY TRANSACTIONS | | | 24,934,939 | | | | 147,073,439 | | | | 74,197,502 | |
| NET INCREASE IN NET ASSETS RESULTING FROM OPERATIONS | | $ | 25,073,683 | | | $ | 151,609,212 | | | $ | 76,547,103 | |
See Notes to Financial Statements.
| 60 | 1.855.377.7325 | www.GrandeurPeakGlobal.com |
| Grandeur Peak Emerging Markets Opportunities Fund | Statements of Changes in Net Assets |
| | | For the
Year Ended
April 30, 2018 | | | For the
Year Ended
April 30, 2017 | |
| OPERATIONS | | | | | | |
| Net investment income | | $ | 2,165,202 | | | $ | 1,312,958 | |
| Net realized gain | | | 14,017,210 | | | | 1,045,085 | |
| Net change in unrealized appreciation | | | 37,631,237 | | | | 63,061,781 | |
| Net increase in net assets resulting from operations | | | 53,813,649 | | | | 65,419,824 | |
| | | | | | | | | |
| DISTRIBUTIONS TO SHAREHOLDERS (NOTE 3) | | | | | | | | |
| Net investment income | | | | | | | | |
| Investor Class | | | – | | | | (66,810 | ) |
| Institutional Class | | | (518,950 | ) | | | (1,961,876 | ) |
| Net decrease in net assets from distributions | | | (518,950 | ) | | | (2,028,686 | ) |
| | | | | | | | | |
| CAPITAL SHARE TRANSACTIONS (NOTE 5) | | | | | | | | |
| Investor Class | | | | | | | | |
| Proceeds from sales of shares | | | 775,580 | | | | 490,678 | |
| Distributions reinvested | | | – | | | | 65,088 | |
| Cost of shares redeemed | | | (2,386,409 | ) | | | (6,113,284 | ) |
| Redemption fees | | | – | | | | 130 | |
| Net decrease from capital shares transactions | | | (1,610,829 | ) | | | (5,557,388 | ) |
| | | | | | | | | |
| Institutional Class | | | | | | | | |
| Proceeds from sales of shares | | | 49,952,122 | | | | 15,112,959 | |
| Distributions reinvested | | | 468,941 | | | | 1,775,141 | |
| Cost of shares redeemed | | | (29,142,671 | ) | | | (27,797,275 | ) |
| Redemption fees | | | 322 | | | | 110 | |
| Net increase/(decrease) from capital shares transactions | | | 21,278,714 | | | | (10,909,065 | ) |
| | | | | | | | | |
| Net increase in net assets | | | 72,962,584 | | | | 46,924,685 | |
| | | | | | | | | |
| NET ASSETS | | | | | | | | |
| Beginning of year | | | 416,965,434 | | | | 370,040,749 | |
| End of year* | | $ | 489,928,018 | | | $ | 416,965,434 | |
| | | | | | | | | |
| *Including accumulated net investment income/(loss) of: | | $ | 309,589 | | | $ | (861,542 | ) |
| | | | | | | | | |
| OTHER INFORMATION | | | | | | | | |
| Shares Transactions | | | | | | | | |
| Investor Class | | | | | | | | |
| Issued | | | 60,550 | | | | 46,050 | |
| Issued to shareholders in reinvestment of distributions | | | – | | | | 6,419 | |
| Redeemed | | | (194,865 | ) | | | (580,153 | ) |
| Net decrease in share transactions | | | (134,315 | ) | | | (527,684 | ) |
| | | | | | | | | |
| Institutional Class | | | | | | | | |
| Issued | | | 3,752,939 | | | | 1,431,423 | |
| Issued to shareholders in reinvestment of distributions | | | 36,017 | | | | 174,375 | |
| Redeemed | | | (2,258,217 | ) | | | (2,673,849 | ) |
| Net increase/(decrease) in share transactions | | | 1,530,739 | | | | (1,068,051 | ) |
See Notes to Financial Statements.
| Annual Report | April 30, 2018 | 61 |
| Grandeur Peak Global Micro Cap Fund | Statements of Changes in Net Assets |
| | | For the
Year Ended
April 30, 2018 | | | For the
Year Ended
April 30, 2017 | |
| OPERATIONS | | | | | | |
| Net investment income/(loss) | | $ | (1,052 | ) | | $ | 36,054 | |
| Net realized gain | | | 4,075,012 | | | | 1,195,943 | |
| Net change in unrealized appreciation | | | 2,334,379 | | | | 3,987,884 | |
| Net increase in net assets resulting from operations | | | 6,408,339 | | | | 5,219,881 | |
| | | | | | | | | |
| DISTRIBUTIONS TO SHAREHOLDERS (NOTE 3) | | | | | | | | |
| Net investment income | | | | | | | | |
| Institutional Class | | | (184,962 | ) | | | (72,387 | ) |
| Net realized gains on investments | | | | | | | | |
| Institutional Class | | | (2,743,887 | ) | | | (318,826 | ) |
| Net decrease in net assets from distributions | | | (2,928,849 | ) | | | (391,213 | ) |
| | | | | | | | | |
| CAPITAL SHARE TRANSACTIONS (NOTE 5) | | | | | | | | |
| Institutional Class | | | | | | | | |
| Proceeds from sales of shares | | | 1,986,506 | | | | 2,802,634 | |
| Distributions reinvested | | | 2,815,178 | | | | 378,056 | |
| Cost of shares redeemed | | | (3,191,486 | ) | | | (2,125,169 | ) |
| Redemption fees | | | 17 | | | | 2 | |
| Net increase from capital shares transactions | | | 1,610,215 | | | | 1,055,523 | |
| | | | | | | | | |
| Net increase in net assets | | | 5,089,705 | | | | 5,884,191 | |
| | | | | | | | | |
| NET ASSETS | | | | | | | | |
| Beginning of year | | | 36,619,645 | | | | 30,735,454 | |
| End of year* | | $ | 41,709,350 | | | $ | 36,619,645 | |
| *Including accumulated net investment loss of: | | $ | (128,821 | ) | | $ | (2,594 | ) |
| | | | | | | | | |
| OTHER INFORMATION | | | | | | | | |
| Shares Transactions | | | | | | | | |
| Institutional Class | | | | | | | | |
| Issued | | | 150,447 | | | | 257,322 | |
| Issued to shareholders in reinvestment of distributions | | | 212,948 | | | | 34,940 | |
| Redeemed | | | (241,118 | ) | | | (194,608 | ) |
| Net increase in share transactions | | | 122,277 | | | | 97,654 | |
See Notes to Financial Statements.
| 62 | 1.855.377.7325 | www.GrandeurPeakGlobal.com |
| Grandeur Peak Global Opportunities Fund | Statements of Changes in Net Assets |
| | | For the
Year Ended
April 30, 2018 | | | For the
Year Ended
April 30, 2017 | |
| OPERATIONS | | | | | | | | |
| Net investment income | | $ | 1,706,038 | | | $ | 752,205 | |
| Net realized gain | | | 65,306,493 | | | | 13,115,814 | |
| Net change in unrealized appreciation | | | 61,142,695 | | | | 91,442,710 | |
| Net increase in net assets resulting from operations | | | 128,155,226 | | | | 105,310,729 | |
| | | | | | | | | |
| DISTRIBUTIONS TO SHAREHOLDERS (NOTE 3) | | | | | | | | |
| Net investment income | | | | | | | | |
| Investor Class | | | – | | | | – | |
| Institutional Class | | | (676,490 | ) | | | (682,795 | ) |
| Net realized gains on investments | | | | | | | | |
| Investor Class | | | (10,280,542 | ) | | | (208,741 | ) |
| Institutional Class | | | (31,457,520 | ) | | | (563,234 | ) |
| Net decrease in net assets from distributions | | | (42,414,552 | ) | | | (1,454,770 | ) |
| | | | | | | | | |
| CAPITAL SHARE TRANSACTIONS (NOTE 5) | | | | | | | | |
| Investor Class | | | | | | | | |
| Proceeds from sales of shares | | | 22,888,443 | | | | 16,005,788 | |
| Distributions reinvested | | | 9,719,833 | | | | 199,029 | |
| Cost of shares redeemed | | | (30,840,920 | ) | | | (50,076,349 | ) |
| Redemption fees | | | 1,110 | | | | 1,088 | |
| Net increase/(decrease) from capital shares transactions | | | 1,768,466 | | | | (33,870,444 | ) |
| | | | | | | | | |
| Institutional Class | | | | | | | | |
| Proceeds from sales of shares | | | 26,846,472 | | | | 55,465,734 | |
| Distributions reinvested | | | 30,664,935 | | | | 1,194,887 | |
| Cost of shares redeemed | | | (64,400,921 | ) | | | (52,607,866 | ) |
| Redemption fees | | | 274 | | | | 4,876 | |
| Net increase/(decrease) from capital shares transactions | | | (6,889,240 | ) | | | 4,057,631 | |
| | | | | | | | | |
| Net increase in net assets | | | 80,619,900 | | | | 74,043,146 | |
| | | | | | | | | |
| NET ASSETS | | | | | | | | |
| Beginning of year | | | 699,229,277 | | | | 625,186,131 | |
| End of year* | | $ | 779,849,177 | | | $ | 699,229,277 | |
| | | | | | | | | |
| *Including accumulated net investment income/(loss) of: | | $ | 607,070 | | | $ | (725,823 | ) |
| | | | | | | | | |
| OTHER INFORMATION | | | | | | | | |
| Shares Transactions | | | | | | | | |
| Investor Class | | | | | | | | |
| Issued | | | 5,933,663 | | | | 4,969,762 | |
| Issued to shareholders in reinvestment of distributions | | | 2,460,717 | | | | 62,984 | |
| Redeemed | | | (7,896,305 | ) | | | (15,424,679 | ) |
| Net increase/(decrease) in share transactions | | | 498,075 | | | | (10,391,933 | ) |
| | | | | | | | | |
| Institutional Class | | | | | | | | |
| Issued | | | 6,845,193 | | | | 16,979,178 | |
| Issued to shareholders in reinvestment of distributions | | | 7,666,235 | | | | 374,573 | |
| Redeemed | | | (16,296,273 | ) | | | (16,596,520 | ) |
| Net increase/(decrease) in share transactions | | | (1,784,845 | ) | | | 757,231 | |
See Notes to Financial Statements.
| Annual Report | April 30, 2018 | 63 |
| Grandeur Peak Global Reach Fund | Statements of Changes in Net Assets |
| | | For the
Year Ended
April 30, 2018 | | | For the
Year Ended
April 30, 2017 | |
| OPERATIONS | | | | | | | | |
| Net investment income | | $ | 814,714 | | | $ | 697,491 | |
| Net realized gain | | | 23,684,460 | | | | 7,092,527 | |
| Net change in unrealized appreciation | | | 35,204,597 | | | | 42,795,408 | |
| Net increase in net assets resulting from operations | | | 59,703,771 | | | | 50,585,426 | |
| | | | | | | | | |
| DISTRIBUTIONS TO SHAREHOLDERS (NOTE 3) | | | | | | | | |
| Net investment income | | | | | | | | |
| Investor Class | | | – | | | | (84,133 | ) |
| Institutional Class | | | (374,631 | ) | | | (681,502 | ) |
| Net realized gains on investments | | | | | | | | |
| Investor Class | | | (871,964 | ) | | | – | |
| Institutional Class | | | (3,954,777 | ) | | | – | |
| Net decrease in net assets from distributions | | | (5,201,372 | ) | | | (765,635 | ) |
| | | | | | | | | |
| CAPITAL SHARE TRANSACTIONS (NOTE 5) | | | | | | | | |
| Investor Class | | | | | | | | |
| Proceeds from sales of shares | | | 4,258,731 | | | | 4,112,844 | |
| Distributions reinvested | | | 821,348 | | | | 81,122 | |
| Cost of shares redeemed | | | (17,054,715 | ) | | | (14,422,937 | ) |
| Redemption fees | | | 51 | | | | 426 | |
| Net decrease from capital shares transactions | | | (11,974,585 | ) | | | (10,228,545 | ) |
| | | | | | | | | |
| Institutional Class | | | | | | | | |
| Proceeds from sales of shares | | | 18,157,332 | | | | 24,646,538 | |
| Distributions reinvested | | | 4,111,759 | | | | 642,714 | |
| Cost of shares redeemed | | | (22,861,068 | ) | | | (27,368,439 | ) |
| Redemption fees | | | 167 | | | | 1,027 | |
| Net decrease from capital shares transactions | | | (591,810 | ) | | | (2,078,160 | ) |
| | | | | | | | | |
| Net increase in net assets | | | 41,936,004 | | | | 37,513,086 | |
| | | | | | | | | |
| NET ASSETS | | | | | | | | |
| Beginning of year | | | 326,256,419 | | | | 288,743,333 | |
| End of year* | | $ | 368,192,423 | | | $ | 326,256,419 | |
| | | | | | | | | |
| *Including accumulated net investment income/(loss) of: | | $ | 4,867 | | | $ | (218,094 | ) |
| | | | | | | | | |
| OTHER INFORMATION | | | | | | | | |
| Shares Transactions | | | | | | | | |
| Investor Class | | | | | | | | |
| Issued | | | 268,300 | | | | 318,050 | |
| Issued to shareholders in reinvestment of distributions | | | 49,360 | | | | 6,264 | |
| Redeemed | | | (1,087,058 | ) | | | (1,110,221 | ) |
| Net decrease in share transactions | | | (769,398 | ) | | | (785,907 | ) |
| | | | | | | | | |
| Institutional Class | | | | | | | | |
| Issued | | | 1,125,868 | | | | 1,860,022 | |
| Issued to shareholders in reinvestment of distributions | | | 246,656 | | | | 49,592 | |
| Redeemed | | | (1,399,288 | ) | | | (2,115,611 | ) |
| Net decrease in share transactions | | | (26,764 | ) | | | (205,997 | ) |
See Notes to Financial Statements.
| 64 | 1.855.377.7325 | www.GrandeurPeakGlobal.com |
| Grandeur Peak Global Stalwarts Fund | Statements of Changes in Net Assets |
| | | For the
Year Ended
April 30, 2018 | | | For the
Year Ended
April 30, 2017 | |
| OPERATIONS | | | | | | | | |
| Net investment income/(loss) | | $ | 138,744 | | | $ | (76,695 | ) |
| Net realized gain | | | 4,911,437 | | | | 937,782 | |
| Net change in unrealized appreciation | | | 20,023,502 | | | | 12,316,556 | |
| Net increase in net assets resulting from operations | | | 25,073,683 | | | | 13,177,643 | |
| | | | | | | | | |
| DISTRIBUTIONS TO SHAREHOLDERS (NOTE 3) | | | | | | | | |
| Net investment income | | | | | | | | |
| Investor Class | | | – | | | | (38,237 | ) |
| Institutional Class | | | – | | | | (70,513 | ) |
| Net realized gains on investments | | | | | | | | |
| Investor Class | | | (1,233,885 | ) | | | – | |
| Institutional Class | | | (1,137,784 | ) | | | – | |
| Net decrease in net assets from distributions | | | (2,371,669 | ) | | | (108,750 | ) |
| | | | | | | | | |
| CAPITAL SHARE TRANSACTIONS (NOTE 5) | | | | | | | | |
| Investor Class | | | | | | | | |
| Proceeds from sales of shares | | | 30,508,717 | | | | 40,939,429 | |
| Distributions reinvested | | | 1,207,967 | | | | 37,612 | |
| Cost of shares redeemed | | | (12,629,686 | ) | | | (6,232,494 | ) |
| Redemption fees | | | 2,502 | | | | 1,969 | |
| Net increase from capital shares transactions | | | 19,089,500 | | | | 34,746,516 | |
| | | | | | | | | |
| Institutional Class | | | | | | | | |
| Proceeds from sales of shares | | | 47,116,433 | | | | 27,023,764 | |
| Distributions reinvested | | | 1,036,423 | | | | 66,016 | |
| Cost of shares redeemed | | | (10,882,140 | ) | | | (2,576,566 | ) |
| Redemption fees | | | 295 | | | | 216 | |
| Net increase from capital shares transactions | | | 37,271,011 | | | | 24,513,430 | |
| | | | | | | | | |
| Net increase in net assets | | | 79,062,525 | | | | 72,328,839 | |
| | | | | | | | | |
| NET ASSETS | | | | | | | | |
| Beginning of year | | | 109,022,177 | | | | 36,693,338 | |
| End of year* | | $ | 188,084,702 | | | $ | 109,022,177 | |
| | | | | | | | | |
| *Including accumulated net investment income/(loss) of: | | $ | 56,737 | | | $ | (1,806 | ) |
| | | | | | | | | |
| OTHER INFORMATION | | | | | | | | |
| Shares Transactions | | | | | | | | |
| Investor Class | | | | | | | | |
| Issued | | | 2,152,925 | | | | 3,565,906 | |
| Issued to shareholders in reinvestment of distributions | | | 82,511 | | | | 3,323 | |
| Redeemed | | | (888,539 | ) | | | (533,831 | ) |
| Net increase in share transactions | | | 1,346,897 | | | | 3,035,398 | |
| Institutional Class | | | | | | | | |
| Issued | | | 3,250,939 | | | | 2,334,427 | |
| Issued to shareholders in reinvestment of distributions | | | 70,505 | | | | 5,816 | |
| Redeemed | | | (749,691 | ) | | | (218,942 | ) |
| Net increase in share transactions | | | 2,571,753 | | | | 2,121,301 | |
See Notes to Financial Statements.
| Annual Report | April 30, 2018 | 65 |
| Grandeur Peak International Opportunities Fund | Statements of Changes in Net Assets |
| | | For the
Year Ended
April 30, 2018 | | | For the
Year Ended
April 30, 2017 | |
| OPERATIONS | | | | | | | | |
| Net investment income | | $ | 4,535,773 | | | $ | 2,817,200 | |
| Net realized gain | | | 65,202,002 | | | | 15,154,690 | |
| Net change in unrealized appreciation | | | 81,871,437 | | | | 101,628,897 | |
| Net increase in net assets resulting from operations | | | 151,609,212 | | | | 119,600,787 | |
| | | | | | | | | |
| DISTRIBUTIONS TO SHAREHOLDERS (NOTE 3) | | | | | | | | |
| Net investment income | | | | | | | | |
| Investor Class | | | (116,530 | ) | | | (373,708 | ) |
| Institutional Class | | | (2,382,835 | ) | | | (4,194,578 | ) |
| Net realized gains on investments | | | | | | | | |
| Investor Class | | | (2,657,014 | ) | | | (1,243,840 | ) |
| Institutional Class | | | (25,295,161 | ) | | | (10,524,647 | ) |
| Net decrease in net assets from distributions | | | (30,451,540 | ) | | | (16,336,773 | ) |
| | | | | | | | | |
| CAPITAL SHARE TRANSACTIONS (NOTE 5) | | | | | | | | |
| Investor Class | | | | | | | | |
| Proceeds from sales of shares | | | 9,422,538 | | | | 16,040,116 | |
| Distributions reinvested | | | 2,591,766 | | | | 1,519,011 | |
| Cost of shares redeemed | | | (23,474,795 | ) | | | (73,177,961 | ) |
| Redemption fees | | | 18 | | | | 346 | |
| Net decrease from capital shares transactions | | | (11,460,473 | ) | | | (55,618,488 | ) |
| | | | | | | | | |
| Institutional Class | | | | | | | | |
| Proceeds from sales of shares | | | 34,216,073 | | | | 82,878,502 | |
| Distributions reinvested | | | 24,999,053 | | | | 13,246,236 | |
| Cost of shares redeemed | | | (53,812,908 | ) | | | (70,160,974 | ) |
| Redemption fees | | | 1,808 | | | | 5,235 | |
| Net increase from capital shares transactions | | | 5,404,026 | | | | 25,968,999 | |
| | | | | | | | | |
| Net increase in net assets | | | 115,101,225 | | | | 73,614,525 | |
| | | | | | | | | |
| NET ASSETS | | | | | | | | |
| Beginning of year | | | 776,907,357 | | | | 703,292,832 | |
| End of year* | | $ | 892,008,582 | | | $ | 776,907,357 | |
| | | | | | | | | |
| *Including accumulated net investment income/(loss) of: | | $ | 1,101,791 | | | $ | (614,723 | ) |
| | | | | | | | | |
| OTHER INFORMATION | | | | | | | | |
| Shares Transactions | | | | | | | | |
| Investor Class | | | | | | | | |
| Issued | | | 2,374,458 | | | | 5,029,639 | |
| Issued to shareholders in reinvestment of distributions | | | 632,138 | | | | 494,792 | |
| Redeemed | | | (5,887,657 | ) | | | (23,531,613 | ) |
| Net decrease in share transactions | | | (2,881,061 | ) | | | (18,007,182 | ) |
| | | | | | | | | |
| Institutional Class | | | | | | | | |
| Issued | | | 8,496,775 | | | | 26,474,706 | |
| Issued to shareholders in reinvestment of distributions | | | 6,067,731 | | | | 4,300,726 | |
| Redeemed | | | (13,071,539 | ) | | | (21,629,721 | ) |
| Net increase in share transactions | | | 1,492,967 | | | | 9,145,711 | |
See Notes to Financial Statements.
| 66 | 1.855.377.7325 | www.GrandeurPeakGlobal.com |
| Grandeur Peak International Stalwarts Fund | Statements of Changes in Net Assets |
| | | For the
Year Ended
April 30, 2018 | | | For the
Year Ended
April 30, 2017 | |
| OPERATIONS | | | | | | | | |
| Net investment income | | $ | 2,349,601 | | | $ | 707,009 | |
| Net realized gain | | | 13,362,555 | | | | 1,792,829 | |
| Net change in unrealized appreciation | | | 60,834,947 | | | | 37,615,840 | |
| Net increase in net assets resulting from operations | | | 76,547,103 | | | | 40,115,678 | |
| | | | | | | | | |
| DISTRIBUTIONS TO SHAREHOLDERS (NOTE 3) | | | | | | | | |
| Net investment income | | | | | | | | |
| Investor Class | | | – | | | | (73,124 | ) |
| Institutional Class | | | (604,680 | ) | | | (929,880 | ) |
| Net realized gains on investments | | | | | | | | |
| Investor Class | | | (527,381 | ) | | | – | |
| Institutional Class | | | (5,037,487 | ) | | | – | |
| Net decrease in net assets from distributions | | | (6,169,548 | ) | | | (1,003,004 | ) |
| | | | | | | | | |
| CAPITAL SHARE TRANSACTIONS (NOTE 5) | | | | | | | | |
| Investor Class | | | | | | | | |
| Proceeds from sales of shares | | | 21,050,455 | | | | 8,549,781 | |
| Distributions reinvested | | | 485,971 | | | | 22,941 | |
| Cost of shares redeemed | | | (6,873,308 | ) | | | (4,109,607 | ) |
| Redemption fees | | | 663 | | | | 308 | |
| Net increase from capital shares transactions | | | 14,663,781 | | | | 4,463,423 | |
| | | | | | | | | |
| Institutional Class | | | | | | | | |
| Proceeds from sales of shares | | | 225,088,542 | | | | 143,867,333 | |
| Distributions reinvested | | | 5,267,972 | | | | 913,917 | |
| Cost of shares redeemed | | | (63,009,263 | ) | | | (33,019,442 | ) |
| Redemption fees | | | 9,004 | | | | 3,133 | |
| Net increase from capital shares transactions | | | 167,356,255 | | | | 111,764,941 | |
| | | | | | | | | |
| Net increase in net assets | | | 252,397,591 | | | | 155,341,038 | |
| | | | | | | | | |
| NET ASSETS | | | | | | | | |
| Beginning of year | | | 296,438,877 | | | | 141,097,839 | |
| End of year* | | $ | 548,836,468 | | | $ | 296,438,877 | |
| *Including accumulated net investment income/(loss) of: | | $ | 1,152,977 | | | $ | (134,092 | ) |
| | | | | | | | | |
| OTHER INFORMATION | | | | | | | | |
| Shares Transactions | | | | | | | | |
| Investor Class | | | | | | | | |
| Issued | | | 1,425,304 | | | | 728,649 | |
| Issued to shareholders in reinvestment of distributions | | | 32,141 | | | | 2,054 | |
| Redeemed | | | (457,934 | ) | | | (349,537 | ) |
| Net increase in share transactions | | | 999,511 | | | | 381,166 | |
| Institutional Class | | | | | | | | |
| Issued | | | 15,450,477 | | | | 12,243,757 | |
| Issued to shareholders in reinvestment of distributions | | | 347,951 | | | | 81,746 | |
| Redeemed | | | (4,230,944 | ) | | | (2,803,836 | ) |
| Net increase in share transactions | | | 11,567,484 | | | | 9,521,667 | |
See Notes to Financial Statements.
| Annual Report | April 30, 2018 | 67 |
| Grandeur Peak Emerging Markets Opportunities Fund | Financial Highlights |
For a Share Outstanding Throughout the Periods Presented
| Investor Class | | Year Ended April 30, 2018 | | | Year Ended April 30, 2017 | | | Year Ended April 30, 2016 | | | Year Ended April 30, 2015 | | | For the Period December 16, 2013 (Inception) to April 30, 2014 | |
| NET ASSET VALUE, BEGINNING OF PERIOD | | $ | 11.55 | | | $ | 9.82 | | | $ | 11.51 | | | $ | 10.53 | | | $ | 10.00 | |
| | | | | | | | | | | | | | | | | | | | | |
| INCOME FROM INVESTMENT OPERATIONS | | | | | | | | | | | | | | | | | | | | |
| Net investment income/(loss)(a) | | | 0.03 | | | | 0.02 | | | | 0.07 | | | | 0.02 | | | | (0.05 | ) |
| Net realized and unrealized gain/(loss) on investments | | | 1.47 | | | | 1.75 | | | | (1.41 | ) | | | 1.22 | | | | 0.58 | |
| Total income/(loss) from investment operations | | | 1.50 | | | | 1.77 | | | | (1.34 | ) | | | 1.24 | | | | 0.53 | |
| | | | | | | | | | | | | | | | | | | | | |
| DISTRIBUTIONS | | | | | | | | | | | | | | | | | | | | |
| From net investment income | | | – | | | | (0.04 | ) | | | – | | | | (0.01 | ) | | | – | |
| From net realized gain on investments | | | – | | | | – | | | | (0.35 | ) | | | (0.25 | ) | | | – | |
| Total distributions | | | – | | | | (0.04 | ) | | | (0.35 | ) | | | (0.26 | ) | | | – | |
| | | | | | | | | | | | | | | | | | | | | |
| REDEMPTION FEES ADDED TO PAID-IN CAPITAL | | | – | | | | 0.00 | (b) | | | 0.00 | (b) | | | 0.00 | (b) | | | 0.00 | (b) |
| | | | | | | | | | | | | | | | | | | | | |
| INCREASE/DECREASE IN NET ASSET VALUE | | | 1.50 | | | | 1.73 | | | | (1.69 | ) | | | 0.98 | | | | 0.53 | |
| NET ASSET VALUE, END OF PERIOD | | $ | 13.05 | | | $ | 11.55 | | | $ | 9.82 | | | $ | 11.51 | | | $ | 10.53 | |
| | | | | | | | | | | | | | | | | | | | | |
| TOTAL RETURN | | | 12.99 | % | | | 18.08 | % | | | (11.62 | )% | | | 12.06 | % | | | 5.30 | %(c) |
| | | | | | | | | | | | | | | | | | | | | |
| RATIOS AND SUPPLEMENTAL DATA | | | | | | | | | | | | | | | | | | | | |
| Net assets, end of period (in 000s) | | $ | 18,668 | | | $ | 18,074 | | | $ | 20,548 | | | $ | 39,896 | | | $ | 27,952 | |
| | | | | | | | | | | | | | | | | | | | | |
| RATIOS TO AVERAGE NET ASSETS | | | | | | | | | | | | | | | | | | | | |
| Expenses (excluding fees waived/reimbursed by investment advisor) | | | 1.79 | % | | | 1.76 | % | | | 1.77 | % | | | 1.82 | % | | | 2.01 | %(d)(e) |
| Expenses (including fees waived/reimbursed by investment advisor) | | | 1.78 | % | | | 1.76 | % | | | 1.77 | % | | | 1.82 | % | | | 1.95 | %(d)(e) |
| Net investment income/(loss) | | | 0.26 | % | | | 0.21 | % | | | 0.69 | % | | | 0.22 | % | | | (0.55 | )%(d) |
| | | | | | | | | | | | | | | | | | | | | |
| PORTFOLIO TURNOVER RATE | | | 33 | % | | | 42 | % | | | 40 | % | | | 53 | % | | | 26 | %(c) |
| (a) | Per share numbers have been calculated using the average shares method. |
| (b) | Less than $0.005 or ($0.005) per share. |
| (e) | Expense ratios during startup periods may not be representative of longer term operating periods. |
See Notes to Financial Statements.
| 68 | 1.855.377.7325 | www.GrandeurPeakGlobal.com |
| Grandeur Peak Emerging Markets Opportunities Fund | Financial Highlights |
For a Share Outstanding Throughout the Periods Presented
| Institutional Class | | Year Ended April 30, 2018 | | | Year Ended April 30, 2017 | | | Year Ended April 30, 2016 | | | Year Ended April 30, 2015 | | | For the Period December 16, 2013 (Inception) to April 30, 2014 | |
| NET ASSET VALUE, BEGINNING OF PERIOD | | $ | 11.60 | | | $ | 9.85 | | | $ | 11.52 | | | $ | 10.54 | | | $ | 10.00 | |
| | | | | | | | | | | | | | | | | | | | | |
| INCOME FROM INVESTMENT OPERATIONS | | | | | | | | | | | | | | | | | | | | |
| Net investment income/(loss)(a) | | | 0.06 | | | | 0.04 | | | | 0.08 | | | | 0.05 | | | | (0.03 | ) |
| Net realized and unrealized gain/(loss) on investments | | | 1.48 | | | | 1.77 | | | | (1.40 | ) | | | 1.21 | | | | 0.57 | |
| Total income/(loss) from investment operations | | | 1.54 | | | | 1.81 | | | | (1.32 | ) | | | 1.26 | | | | 0.54 | |
| | | | | | | | | | | | | | | | | | | | | |
| DISTRIBUTIONS | | | | | | | | | | | | | | | | | | | | |
| From net investment income | | | (0.02 | ) | | | (0.06 | ) | | | – | | | | (0.03 | ) | | | – | |
| From net realized gain on investments | | | – | | | | – | | | | (0.35 | ) | | | (0.25 | ) | | | – | |
| Total distributions | | | (0.02 | ) | | | (0.06 | ) | | | (0.35 | ) | | | (0.28 | ) | | | – | |
| | | | | | | | | | | | | | | | | | | | | |
| REDEMPTION FEES ADDED TO PAID-IN CAPITAL | | | 0.00 | (b) | | | 0.00 | (b) | | | 0.00 | (b) | | | 0.00 | (b) | | | 0.00 | (b) |
| | | | | | | | | | | | | | | | | | | | | |
| INCREASE/DECREASE IN NET ASSET VALUE | | | 1.52 | | | | 1.75 | | | | (1.67 | ) | | | 0.98 | | | | 0.54 | |
| NET ASSET VALUE, END OF PERIOD | | $ | 13.12 | | | $ | 11.60 | | | $ | 9.85 | | | $ | 11.52 | | | $ | 10.54 | |
| | | | | | | | | | | | | | | | | | | | | |
| TOTAL RETURN | | | 13.24 | % | | | 18.42 | % | | | (11.44 | )% | | | 12.22 | % | | | 5.40 | %(c) |
| | | | | | | | | | | | | | | | | | | | | |
| RATIOS AND SUPPLEMENTAL DATA | | | | | | | | | | | | | | | | | | | | |
| Net assets, end of period (in 000s) | | $ | 471,260 | | | $ | 398,891 | | | $ | 349,493 | | | $ | 428,048 | | | $ | 255,819 | |
| | | | | | | | | | | | | | | | | | | | | |
| RATIOS TO AVERAGE NET ASSETS | | | | | | | | | | | | | | | | | | | | |
| Expenses (excluding fees waived/reimbursed by investment advisor) | | | 1.55 | % | | | 1.55 | % | | | 1.55 | % | | | 1.58 | % | | | 1.76 | %(d)(e) |
| Expenses (including fees waived/reimbursed by investment advisor) | | | 1.54 | % | | | 1.55 | % | | | 1.55 | % | | | 1.58 | % | | | 1.70 | %(d)(e) |
| Net investment income/(loss) | | | 0.49 | % | | | 0.35 | % | | | 0.75 | % | | | 0.43 | % | | | (0.37 | )%(d) |
| | | | | | | | | | | | | | | | | | | | | |
| PORTFOLIO TURNOVER RATE | | | 33 | % | | | 42 | % | | | 40 | % | | | 53 | % | | | 26 | %(c) |
| (a) | Per share numbers have been calculated using the average shares method. |
| (b) | Less than $0.005 or ($0.005) per share. |
| (e) | Expense ratios during startup periods may not be representative of longer term operating periods. |
See Notes to Financial Statements.
| Annual Report | April 30, 2018 | 69 |
| Grandeur Peak Global Micro Cap Fund | Financial Highlights |
For a Share Outstanding Throughout the Periods Presented
| Institutional Class | | Year Ended
April 30, 2018 | | | Year Ended
April 30, 2017 | | | For the Period
October 21, 2015
(Commencement
of Operations) to
April 30, 2016 | |
| NET ASSET VALUE, BEGINNING OF PERIOD | | $ | 11.98 | | | $ | 10.38 | | | $ | 10.00 | |
| | | | | | | | | | | | | |
| INCOME FROM INVESTMENT OPERATIONS | | | | | | | | | | | | |
| Net investment income/(loss)(a) | | | (0.00 | )(b) | | | 0.01 | | | | (0.02 | ) |
| Net realized and unrealized gain on investments | | | 2.12 | | | | 1.72 | | | | 0.40 | |
| Total income from investment operations | | | 2.12 | | | | 1.73 | | | | 0.38 | |
| | | | | | | | | | | | | |
| DISTRIBUTIONS | | | | | | | | | | | | |
| From net investment income | | | (0.06 | ) | | | (0.02 | ) | | | – | |
| From net realized gain on investments | | | (0.92 | ) | | | (0.11 | ) | | | – | |
| Total distributions | | | (0.98 | ) | | | (0.13 | ) | | | – | |
| | | | | | | | | | | | | |
| REDEMPTION FEES ADDED TO PAID-IN CAPITAL | | | 0.00 | (b) | | | 0.00 | (b) | | | 0.00 | (b) |
| | | | | | | | | | | | | |
| INCREASE IN NET ASSET VALUE | | | 1.14 | | | | 1.60 | | | | 0.38 | |
| NET ASSET VALUE, END OF PERIOD | | $ | 13.12 | | | $ | 11.98 | | | $ | 10.38 | |
| | | | | | | | | | | | | |
| TOTAL RETURN | | | 17.68 | % | | | 16.81 | % | | | 3.80 | %(c) |
| | | | | | | | | | | | | |
| RATIOS AND SUPPLEMENTAL DATA | | | | | | | | | | | | |
| Net assets, end of period (in 000s) | | $ | 41,709 | | | $ | 36,620 | | | $ | 30,735 | |
| | | | | | | | | | | | | |
| RATIOS TO AVERAGE NET ASSETS | | | | | | | | | | | | |
| Expenses (excluding fees waived/ reimbursed by investment advisor) | | | 2.06 | % | | | 2.17 | % | | | 2.30 | %(d)(e) |
| Expenses (including fees waived/ reimbursed by investment advisor) | | | 2.00 | % | | | 2.00 | % | | | 2.00 | %(d)(e) |
| Net investment income/(loss) | | | (0.00 | )%(f) | | | 0.11 | % | | | (0.41 | )%(d) |
| | | | | | | | | | | | | |
| PORTFOLIO TURNOVER RATE | | | 46 | % | | | 37 | % | | | 8 | %(c) |
| (a) | Per share numbers have been calculated using the average shares method. |
| (b) | Less than $0.005 or ($0.005) per share. |
| (e) | Expense ratios during startup periods may not be representative of longer term operating periods. |
| (f) | Less than 0.005% of average net assets. |
See Notes to Financial Statements.
| 70 | 1.855.377.7325 | www.GrandeurPeakGlobal.com |
| Grandeur Peak Global Opportunities Fund | Financial Highlights |
For a Share Outstanding Throughout the Periods Presented
| Investor Class | | Year Ended
April 30, 2018 | | | Year Ended
April 30, 2017 | | | Year Ended
April 30, 2016 | | | Year Ended
April 30, 2015 | | | Year Ended
April 30, 2014 | |
| NET ASSET VALUE, BEGINNING OF PERIOD | | $ | 3.52 | | | $ | 3.01 | | | $ | 3.43 | | | $ | 3.31 | | | $ | 2.77 | |
| | | | | | | | | | | | | | | | | | | | | |
| INCOME FROM INVESTMENT OPERATIONS | | | | | | | | | | | | | | | | | | | | |
| Net investment income/(loss)(a) | | | 0.00 | (b) | | | (0.00 | )(b)(c) | | | 0.00 | (b) | | | 0.00 | (b) | | | (0.00 | )(b) |
| Net realized and unrealized gain/(loss) on investments | | | 0.65 | | | | 0.51 | | | | (0.18 | ) | | | 0.35 | | | | 0.67 | |
| Total income/(loss) from investment operations | | | 0.65 | | | | 0.51 | | | | (0.18 | ) | | | 0.35 | | | | 0.67 | |
| | | | | | | | | | | | | | | | | | | | | |
| DISTRIBUTIONS | | | | | | | | | | | | | | | | | | | | |
| From net investment income | | | – | | | | – | | | | (0.00 | )(b) | | | (0.01 | ) | | | – | |
| From net realized gain on investments | | | (0.22 | ) | | | (0.00 | )(b) | | | (0.24 | ) | | | (0.22 | ) | | | (0.13 | ) |
| Total distributions | | | (0.22 | ) | | | (0.00 | )(b) | | | (0.24 | ) | | | (0.23 | ) | | | (0.13 | ) |
| | | | | | | | | | | | | | | | | | | | | |
| REDEMPTION FEES ADDED TO PAID-IN CAPITAL | | | 0.00 | (b) | | | 0.00 | (b) | | | 0.00 | (b) | | | 0.00 | (b) | | | 0.00 | (b) |
| | | | | | | | | | | | | | | | | | | | | |
| INCREASE/DECREASE IN NET ASSET VALUE | | | 0.43 | | | | 0.51 | | | | (0.42 | ) | | | 0.12 | | | | 0.54 | |
| NET ASSET VALUE, END OF PERIOD | | $ | 3.95 | | | $ | 3.52 | | | $ | 3.01 | | | $ | 3.43 | | | $ | 3.31 | |
| | | | | | | | | | | | | | | | | | | | | |
| TOTAL RETURN | | | 18.41 | % | | | 17.09 | % | | | (5.03 | )% | | | 11.09 | % | | | 24.31 | % |
| | | | | | | | | | | | | | | | | | | | | |
| RATIOS AND SUPPLEMENTAL DATA | | | | | | | | | | | | | | | | | | | | |
| Net assets, end of period (in 000s) | | $ | 188,379 | | | $ | 166,284 | | | $ | 173,156 | | | $ | 201,462 | | | $ | 216,247 | |
| | | | | | | | | | | | | | | | | | | | | |
| RATIOS TO AVERAGE NET ASSETS | | | | | | | | | | | | | | | | | | | | |
| Expenses (excluding fees waived/ reimbursed by investment advisor) | | | 1.61 | % | | | 1.61 | % | | | 1.62 | % | | | 1.62 | % | | | 1.68 | % |
| Expenses (including fees waived/ reimbursed by investment advisor) | | | 1.55 | % | | | 1.59 | % | | | 1.62 | % | | | 1.62 | % | | | 1.68 | % |
| Net investment income/(loss) | | | 0.03 | % | | | (0.06 | )% | | | 0.06 | % | | | 0.12 | % | | | (0.15 | )% |
| | | | | | | | | | | | | | | | | | | | | |
| PORTFOLIO TURNOVER RATE | | | 29 | % | | | 30 | % | | | 32 | % | | | 37 | % | | | 38 | % |
| (a) | Per share numbers have been calculated using the average shares method. |
| (b) | Less than $0.005 or ($0.005) per share. |
| (c) | The per share amount does not correspond to activity reflected in the Statement of Operations due to class specific expenses during the period. |
See Notes to Financial Statements.
| Annual Report | April 30, 2018 | 71 |
| Grandeur Peak Global Opportunities Fund | Financial Highlights |
For a Share Outstanding Throughout the Periods Presented
| Institutional Class | | Year Ended
April 30, 2018 | | | Year Ended
April 30, 2017 | | | Year Ended
April 30, 2016 | | | Year Ended
April 30, 2015 | | | Year Ended
April 30, 2014 | |
| NET ASSET VALUE, BEGINNING OF PERIOD | | $ | 3.56 | | | $ | 3.03 | | | $ | 3.46 | | | $ | 3.34 | | | $ | 2.79 | |
| | | | | | | | | | | | | | | | | | | | | |
| INCOME FROM INVESTMENT OPERATIONS | | | | | | | | | | | | | | | | | | | | |
| Net investment income(a) | | | 0.01 | | | | 0.01 | | | | 0.01 | | | | 0.01 | | | | 0.00 | (b) |
| Net realized and unrealized gain/(loss) on investments | | | 0.65 | | | | 0.52 | | | | (0.19 | ) | | | 0.34 | | | | 0.68 | |
| Total income/(loss) from investment operations | | | 0.66 | | | | 0.53 | | | | (0.18 | ) | | | 0.35 | | | | 0.68 | |
| | | | | | | | | | | | | | | | | | | | | |
| DISTRIBUTIONS | | | | | | | | | | | | | | | | | | | | |
| From net investment income | | | (0.00 | )(b) | | | (0.00 | )(b) | | | (0.01 | ) | | | (0.01 | ) | | | (0.00 | )(b) |
| From net realized gain on investments | | | (0.22 | ) | | | (0.00 | )(b) | | | (0.24 | ) | | | (0.22 | ) | | | (0.13 | ) |
| Total distributions | | | (0.22 | ) | | | (0.00 | )(b) | | | (0.25 | ) | | | (0.23 | ) | | | (0.13 | ) |
| | | | | | | | | | | | | | | | | | | | | |
| REDEMPTION FEES ADDED TO PAID-IN CAPITAL | | | 0.00 | (b) | | | 0.00 | (b) | | | 0.00 | (b) | | | 0.00 | (b) | | | 0.00 | (b) |
| | | | | | | | | | | | | | | | | | | | | |
| INCREASE/DECREASE IN NET ASSET VALUE | | | 0.44 | | | | 0.53 | | | | (0.43 | ) | | | 0.12 | | | | 0.55 | |
| NET ASSET VALUE, END OF PERIOD | | $ | 4.00 | | | $ | 3.56 | | | $ | 3.03 | | | $ | 3.46 | | | $ | 3.34 | |
| | | | | | | | | | | | | | | | | | | | | |
| TOTAL RETURN | | | 18.62 | % | | | 17.81 | % | | | (5.12 | )% | | | 11.20 | % | | | 24.67 | % |
| | | | | | | | | | | | | | | | | | | | | |
| RATIOS AND SUPPLEMENTAL DATA | | | | | | | | | | | | | | | | | | | | |
| Net assets, end of period (in 000s) | | $ | 591,470 | | | $ | 532,946 | | | $ | 452,030 | | | $ | 526,394 | | | $ | 492,869 | |
| | | | | | | | | | | | | | | | | | | | | |
| RATIOS TO AVERAGE NET ASSETS | | | | | | | | | | | | | | | | | | | | |
| Expenses (excluding fees waived/ reimbursed by investment advisor) | | | 1.36 | % | | | 1.37 | % | | | 1.38 | % | | | 1.38 | % | | | 1.44 | % |
| Expenses (including fees waived/ reimbursed by investment advisor) | | | 1.31 | % | | | 1.35 | % | | | 1.38 | % | | | 1.38 | % | | | 1.44 | % |
| Net investment income | | | 0.28 | % | | | 0.18 | % | | | 0.30 | % | | | 0.35 | % | | | 0.08 | % |
| | | | | | | | | | | | | | | | | | | | | |
| PORTFOLIO TURNOVER RATE | | | 29 | % | | | 30 | % | | | 32 | % | | | 37 | % | | | 38 | % |
| (a) | Per share numbers have been calculated using the average shares method. |
| (b) | Less than $0.005 or ($0.005) per share. |
See Notes to Financial Statements.
| 72 | 1.855.377.7325 | www.GrandeurPeakGlobal.com |
| Grandeur Peak Global Reach Fund | Financial Highlights |
For a Share Outstanding Throughout the Periods Presented
| Investor Class | | Year Ended
April 30, 2018 | | | Year Ended
April 30, 2017 | | | Year Ended
April 30, 2016 | | | Year Ended
April 30, 2015 | | | For the Period
June 19, 2013
(Inception) to
April 30, 2014 | |
| NET ASSET VALUE, BEGINNING OF PERIOD | | $ | 14.52 | | | $ | 12.31 | | | $ | 13.65 | | | $ | 12.43 | | | $ | 10.00 | |
| | | | | | | | | | | | | | | | | | | | | |
| INCOME FROM INVESTMENT OPERATIONS | | | | | | | | | | | | | | | | | | | | |
| Net investment income/(loss)(a) | | | 0.01 | | | | 0.01 | | | | 0.01 | | | | 0.00 | (b) | | | (0.02 | ) |
| Net realized and unrealized gain/(loss) on investments | | | 2.66 | | | | 2.22 | | | | (0.89 | ) | | | 1.37 | | | | 2.54 | |
| Total income/(loss) from investment operations | | | 2.67 | | | | 2.23 | | | | (0.88 | ) | | | 1.37 | | | | 2.52 | |
| | | | | | | | | | | | | | | | | | | | | |
| DISTRIBUTIONS | | | | | | | | | | | | | | | | | | | | |
| From net investment income | | | – | | | | (0.02 | ) | | | (0.01 | ) | | | (0.01 | ) | | | (0.02 | ) |
| From net realized gain on investments | | | (0.22 | ) | | | – | | | | (0.45 | ) | | | (0.14 | ) | | | (0.08 | ) |
| Total distributions | | | (0.22 | ) | | | (0.02 | ) | | | (0.46 | ) | | | (0.15 | ) | | | (0.10 | ) |
| | | | | | | | | | | | | | | | | | | | | |
| REDEMPTION FEES ADDED TO PAID-IN CAPITAL | | | 0.00 | (b) | | | 0.00 | (b) | | | 0.00 | (b) | | | 0.00 | (b) | | | 0.01 | |
| | | | | | | | | | | | | | | | | | | | | |
| INCREASE/DECREASE IN NET ASSET VALUE | | | 2.45 | | | | 2.21 | | | | (1.34 | ) | | | 1.22 | | | | 2.43 | |
| NET ASSET VALUE, END OF PERIOD | | $ | 16.97 | | | $ | 14.52 | | | $ | 12.31 | | | $ | 13.65 | | | $ | 12.43 | |
| | | | | | | | | | | | | | | | | | | | | |
| TOTAL RETURN | | | 18.44 | % | | | 18.11 | % | | | (6.45 | )% | | | 11.09 | % | | | 25.31 | %(c) |
| | | | | | | | | | | | | | | | | | | | | |
| RATIOS AND SUPPLEMENTAL DATA | | | | | | | | | | | | | | | | | | | | |
| Net assets, end of period (in 000s) | | $ | 65,923 | | | $ | 67,574 | | | $ | 66,984 | | | $ | 87,354 | | | $ | 46,163 | |
| | | | | | | | | | | | | | | | | | | | | |
| RATIOS TO AVERAGE NET ASSETS | | | | | | | | | | | | | | | | | | | | |
| Expenses (excluding fees waived/reimbursed by investment advisor) | | | 1.52 | % | | | 1.52 | % | | | 1.60 | % | | | 1.60 | % | | | 1.91 | %(d)(e) |
| Expenses (including fees waived/reimbursed by investment advisor) | | | 1.52 | % | | | 1.52 | % | | | 1.60 | % | | | 1.60 | % | | | 1.60 | %(d)(e) |
| Net investment income/(loss) | | | 0.06 | % | | | 0.07 | % | | | 0.10 | % | | | 0.03 | % | | | (0.17 | )%(d) |
| | | | | | | | | | | | | | | | | | | | | |
| PORTFOLIO TURNOVER RATE | | | 43 | % | | | 42 | % | | | 46 | % | | | 46 | % | | | 39 | %(c) |
| (a) | Per share numbers have been calculated using the average shares method. |
| (b) | Less than $0.005 or ($0.005) per share. |
| (e) | Expense ratios during startup periods may not be representative of longer term operating periods. |
See Notes to Financial Statements.
| Annual Report | April 30, 2018 | 73 |
| Grandeur Peak Global Reach Fund | Financial Highlights |
For a Share Outstanding Throughout the Periods Presented
| Institutional Class | | Year Ended
April 30, 2018 | | | Year Ended
April 30, 2017 | | | Year Ended
April 30, 2016 | | | Year Ended
April 30, 2015 | | | For the Period
June 19, 2013
(Inception) to
April 30, 2014 | |
| NET ASSET VALUE, BEGINNING OF PERIOD | | $ | 14.55 | | | $ | 12.33 | | | $ | 13.66 | | | $ | 12.42 | | | $ | 10.00 | |
| | | | | | | | | | | | | | | | | | | | | |
| INCOME FROM INVESTMENT OPERATIONS | | | | | | | | | | | | | | | | | | | | |
| Net investment income(a) | | | 0.04 | | | | 0.04 | | | | 0.04 | | | | 0.03 | | | | 0.02 | |
| Net realized and unrealized gain/(loss) on investments | | | 2.67 | | | | 2.22 | | | | (0.89 | ) | | | 1.37 | | | | 2.52 | |
| Total income/(loss) from investment operations | | | 2.71 | | | | 2.26 | | | | (0.85 | ) | | | 1.40 | | | | 2.54 | |
| | | | | | | | | | | | | | | | | | | | | |
| DISTRIBUTIONS | | | | | | | | | | | | | | | | | | | | |
| From net investment income | | | (0.02 | ) | | | (0.04 | ) | | | (0.03 | ) | | | (0.02 | ) | | | (0.04 | ) |
| From net realized gain on investments | | | (0.22 | ) | | | – | | | | (0.45 | ) | | | (0.14 | ) | | | (0.08 | ) |
| Total distributions | | | (0.24 | ) | | | (0.04 | ) | | | (0.48 | ) | | | (0.16 | ) | | | (0.12 | ) |
| | | | | | | | | | | | | | | | | | | | | |
| REDEMPTION FEES ADDED TO PAID-IN CAPITAL | | | 0.00 | (b) | | | 0.00 | (b) | | | 0.00 | (b) | | | 0.00 | (b) | | | 0.00 | (b) |
| | | | | | | | | | | | | | | | | | | | | |
| INCREASE/DECREASE IN NET ASSET VALUE | | | 2.47 | | | | 2.22 | | | | (1.33 | ) | | | 1.24 | | | | 2.42 | |
| NET ASSET VALUE, END OF PERIOD | | $ | 17.02 | | | $ | 14.55 | | | $ | 12.33 | | | $ | 13.66 | | | $ | 12.42 | |
| | | | | | | | | | | | | | | | | | | | | |
| TOTAL RETURN | | | 18.69 | % | | | 18.36 | % | | | (6.18 | )% | | | 11.41 | % | | | 25.45 | %(c) |
| | | | | | | | | | | | | | | | | | | | | |
| RATIOS AND SUPPLEMENTAL DATA | | | | | | | | | | | | | | | | | | | | |
| Net assets, end of period (in 000s) | | $ | 302,269 | | | $ | 258,683 | | | $ | 221,759 | | | $ | 260,239 | | | $ | 88,311 | |
| | | | | | | | | | | | | | | | | | | | | |
| RATIOS TO AVERAGE NET ASSETS | | | | | | | | | | | | | | | | | | | | |
| Expenses (excluding fees waived/reimbursed by investment advisor) | | | 1.28 | % | | | 1.29 | % | | | 1.35 | % | | | 1.35 | % | | | 1.75 | %(d)(e) |
| Expenses (including fees waived/reimbursed by investment advisor) | | | 1.28 | % | | | 1.29 | % | | | 1.35 | % | | | 1.35 | % | | | 1.35 | %(d)(e) |
| Net investment income | | | 0.27 | % | | | 0.28 | % | | | 0.34 | % | | | 0.23 | % | | | 0.21 | %(d) |
| | | | | | | | | | | | | | | | | | | | | |
| PORTFOLIO TURNOVER RATE | | | 43 | % | | | 42 | % | | | 46 | % | | | 46 | % | | | 39 | %(c) |
| (a) | Per share numbers have been calculated using the average shares method. |
| (b) | Less than $0.005 or ($0.005) per share. |
| (e) | Expense ratios during startup periods may not be representative of longer term operating periods. |
See Notes to Financial Statements.
| 74 | 1.855.377.7325 | www.GrandeurPeakGlobal.com |
| Grandeur Peak Global Stalwarts Fund | Financial Highlights |
For a Share Outstanding Throughout the Periods Presented
| Investor Class | | Year Ended
April 30, 2018 | | | Year Ended
April 30, 2017 | | | For the Period
September 2, 2015
(Commencement
of Operations) to
April 30, 2016 | |
| NET ASSET VALUE, BEGINNING OF PERIOD | | $ | 12.76 | | | $ | 10.85 | | | $ | 10.00 | |
| | | | | | | | | | | | | |
| INCOME FROM INVESTMENT OPERATIONS | | | | | | | | | | | | |
| Net investment income/(loss)(a) | | | (0.00 | )(b) | | | (0.03 | ) | | | 0.00 | (b) |
| Net realized and unrealized gain on investments | | | 2.52 | | | | 1.95 | | | | 0.85 | |
| Total income from investment operations | | | 2.52 | | | | 1.92 | | | | 0.85 | |
| | | | | | | | | | | | | |
| DISTRIBUTIONS | | | | | | | | | | | | |
| From net investment income | | | – | | | | (0.01 | ) | | | (0.00 | )(b) |
| From net realized gain on investments | | | (0.22 | ) | | | – | | | | (0.00 | )(b) |
| Total distributions | | | (0.22 | ) | | | (0.01 | ) | | | (0.00 | )(b) |
| | | | | | | | | | | | | |
| REDEMPTION FEES ADDED TO PAID-IN CAPITAL | | | 0.00 | (b) | | | 0.00 | (b) | | | 0.00 | (b) |
| | | | | | | | | | | | | |
| INCREASE IN NET ASSET VALUE | | | 2.30 | | | | 1.91 | | | | 0.85 | |
| NET ASSET VALUE, END OF PERIOD | | $ | 15.06 | | | $ | 12.76 | | | $ | 10.85 | |
| | | | | | | | | | | | | |
| TOTAL RETURN | | | 19.79 | % | | | 17.70 | % | | | 8.55 | %(c) |
| | | | | | | | | | | | | |
| RATIOS AND SUPPLEMENTAL DATA | | | | | | | | | | | | |
| Net assets, end of period (in 000s) | | $ | 92,552 | | | $ | 61,212 | | | $ | 19,131 | |
| | | | | | | | | | | | | |
| RATIOS TO AVERAGE NET ASSETS | | | | | | | | | | | | |
| Expenses (excluding fees waived/ reimbursed by investment advisor) | | | 1.35 | % | | | 1.41 | % | | | 2.06 | %(d)(e) |
| Expenses (including fees waived/ reimbursed by investment advisor) | | | 1.35 | % | | | 1.35 | % | | | 1.35 | %(d)(e) |
| Net investment loss | | | (0.03 | )% | | | (0.23 | )% | | | 0.00 | %(d)(f) |
| | | | | | | | | | | | | |
| PORTFOLIO TURNOVER RATE | | | 30 | % | | | 32 | % | | | 24 | %(c) |
| (a) | Per share numbers have been calculated using the average shares method. |
| (b) | Less than $0.005 or ($0.005) per share. |
| (e) | Expense ratios during startup periods may not be representative of longer term operating periods. |
| (f) | Less than 0.005% of average net assets. |
See Notes to Financial Statements.
| Annual Report | April 30, 2018 | 75 |
| Grandeur Peak Global Stalwarts Fund | Financial Highlights |
For a Share Outstanding Throughout the Periods Presented
| Institutional Class | | Year Ended
April 30, 2018 | | | Year Ended
April 30, 2017 | | | For the Period
September 2, 2015
(Commencement
of Operations) to
April 30, 2016 | |
| NET ASSET VALUE, BEGINNING OF PERIOD | | $ | 12.79 | | | $ | 10.87 | | | $ | 10.00 | |
| | | | | | | | | | | | | |
| INCOME FROM INVESTMENT OPERATIONS | | | | | | | | | | | | |
| Net investment income(a) | | | 0.03 | | | | 0.01 | (b) | | | 0.02 | |
| Net realized and unrealized gain on investments | | | 2.54 | | | | 1.93 | | | | 0.85 | |
| Total income from investment operations | | | 2.57 | | | | 1.94 | | | | 0.87 | |
| | | | | | | | | | | | | |
| DISTRIBUTIONS | | | | | | | | | | | | |
| From net investment income | | | – | | | | (0.02 | ) | | | (0.00 | )(c) |
| From net realized gain on investments | | | (0.22 | ) | | | – | | | | (0.00 | )(c) |
| Total distributions | | | (0.22 | ) | | | (0.02 | ) | | | (0.00 | )(c) |
| | | | | | | | | | | | | |
| REDEMPTION FEES ADDED TO PAID-IN CAPITAL | | | 0.00 | (c) | | | 0.00 | (c) | | | 0.00 | (c) |
| | | | | | | | | | | | | |
| INCREASE IN NET ASSET VALUE | | | 2.35 | | | | 1.92 | | | | 0.87 | |
| NET ASSET VALUE, END OF PERIOD | | $ | 15.14 | | | $ | 12.79 | | | $ | 10.87 | |
| | | | | | | | | | | | | |
| TOTAL RETURN | | | 20.14 | % | | | 17.92 | % | | | 8.76 | %(d) |
| | | | | | | | | | | | | |
| RATIOS AND SUPPLEMENTAL DATA | | | | | | | | | | | | |
| Net assets, end of period (in 000s) | | $ | 95,533 | | | $ | 47,811 | | | $ | 17,562 | |
| | | | | | | | | | | | | |
| RATIOS TO AVERAGE NET ASSETS | | | | | | | | | | | | |
| Expenses (excluding fees waived/ reimbursed by investment advisor) | | | 1.10 | % | | | 1.17 | % | | | 1.86 | %(e)(f) |
| Expenses (including fees waived/ reimbursed by investment advisor) | | | 1.10 | % | | | 1.10 | % | | | 1.10 | %(e)(f) |
| Net investment income | | | 0.24 | % | | | 0.05 | % | | | 0.22 | %(e) |
| | | | | | | | | | | | | |
| PORTFOLIO TURNOVER RATE | | | 30 | % | | | 32 | % | | | 24 | %(d) |
| (a) | Per share numbers have been calculated using the average shares method. |
| (b) | The per share amount does not correspond to activity reflected in the Statement of Operations due to class specific expenses during the period. |
| (c) | Less than $0.005 or ($0.005) per share. |
| (f) | Expense ratios during startup periods may not be representative of longer term operating periods. |
See Notes to Financial Statements.
| 76 | 1.855.377.7325 | www.GrandeurPeakGlobal.com |
| Grandeur Peak International Opportunities Fund | Financial Highlights |
For a Share Outstanding Throughout the Periods Presented
| Investor Class | | Year Ended
April 30, 2018 | | | Year Ended
April 30, 2017 | | | Year Ended
April 30, 2016 | | | Year Ended
April 30, 2015 | | | Year Ended
April 30, 2014 | |
| NET ASSET VALUE, BEGINNING OF PERIOD | | $ | 3.55 | | | $ | 3.09 | | | $ | 3.42 | | | $ | 3.41 | | | $ | 2.83 | |
| | | | | | | | | | | | | | | | | | | | | |
| INCOME FROM INVESTMENT OPERATIONS | | | | | | | | | | | | | | | | | | | | |
| Net investment income(a) | | | 0.01 | | | | 0.01 | | | | 0.01 | | | | 0.01 | | | | 0.01 | |
| Net realized and unrealized gain/(loss) on investments | | | 0.68 | | | | 0.52 | | | | (0.20 | ) | | | 0.21 | | | | 0.68 | |
| Total income/(loss) from investment operations | | | 0.69 | | | | 0.53 | | | | (0.19 | ) | | | 0.22 | | | | 0.69 | |
| | | | | | | | | | | | | | | | | | | | | |
| DISTRIBUTIONS | | | | | | | | | | | | | | | | | | | | |
| From net investment income | | | (0.01 | ) | | | (0.02 | ) | | | (0.01 | ) | | | (0.01 | ) | | | (0.02 | ) |
| From net realized gain on investments | | | (0.13 | ) | | | (0.05 | ) | | | (0.13 | ) | | | (0.20 | ) | | | (0.09 | ) |
| Total distributions | | | (0.14 | ) | | | (0.07 | ) | | | (0.14 | ) | | | (0.21 | ) | | | (0.11 | ) |
| | | | | | | | | | | | | | | | | | | | | |
| REDEMPTION FEES ADDED TO PAID-IN CAPITAL | | | 0.00 | (b) | | | 0.00 | (b) | | | 0.00 | (b) | | | 0.00 | (b) | | | 0.00 | (b) |
| | | | | | | | | | | | | | | | | | | | | |
| INCREASE/DECREASE IN NET ASSET VALUE | | | 0.55 | | | | 0.46 | | | | (0.33 | ) | | | 0.01 | | | | 0.58 | |
| NET ASSET VALUE, END OF PERIOD | | $ | 4.10 | | | $ | 3.55 | | | $ | 3.09 | | | $ | 3.42 | | | $ | 3.41 | |
| | | | | | | | | | | | | | | | | | | | | |
| TOTAL RETURN | | | 19.30 | % | | | 17.50 | % | | | (5.53 | )% | | | 7.25 | % | | | 24.59 | % |
| | | | | | | | | | | | | | | | | | | | | |
| RATIOS AND SUPPLEMENTAL DATA | | | | | | | | | | | | | | | | | | | | |
| Net assets, end of period (in 000s) | | $ | 78,686 | | | $ | 78,403 | | | $ | 123,922 | | | $ | 173,842 | | | $ | 153,296 | |
| | | | | | | | | | | | | | | | | | | | | |
| RATIOS TO AVERAGE NET ASSETS | | | | | | | | | | | | | | | | | | | | |
| Expenses (excluding fees waived/ reimbursed by investment advisor) | | | 1.61 | % | | | 1.61 | % | | | 1.62 | % | | | 1.62 | % | | | 1.73 | % |
| Expenses (including fees waived/ reimbursed by investment advisor) | | | 1.55 | % | | | 1.58 | % | | | 1.62 | % | | | 1.62 | % | | | 1.73 | % |
| Net investment income | | | 0.31 | % | | | 0.16 | % | | | 0.45 | % | | | 0.37 | % | | | 0.20 | % |
| | | | | | | | | | | | | | | | | | | | | |
| PORTFOLIO TURNOVER RATE | | | 26 | % | | | 30 | % | | | 34 | % | | | 36 | % | | | 37 | % |
| (a) | Per share numbers have been calculated using the average shares method. |
| (b) | Less than $0.005 or ($0.005) per share. |
See Notes to Financial Statements.
| Annual Report | April 30, 2018 | 77 |
| Grandeur Peak International Opportunities Fund | Financial Highlights |
For a Share Outstanding Throughout the Periods Presented
| Institutional Class | | Year Ended
April 30, 2018 | | | Year Ended
April 30, 2017 | | | Year Ended
April 30, 2016 | | | Year Ended
April 30, 2015 | | | Year Ended
April 30, 2014 | |
| NET ASSET VALUE, BEGINNING OF PERIOD | | $ | 3.57 | | | $ | 3.11 | | | $ | 3.43 | | | $ | 3.42 | | | $ | 2.84 | |
| | | | | | | | | | | | | | | | | | | | | |
| INCOME FROM INVESTMENT OPERATIONS | | | | | | | | | | | | | | | | | | | | |
| Net investment income(a) | | | 0.02 | | | | 0.01 | | | | 0.02 | | | | 0.02 | | | | 0.01 | |
| Net realized and unrealized gain/(loss) on investments | | | 0.67 | | | | 0.52 | | | | (0.20 | ) | | | 0.21 | | | | 0.69 | |
| Total income/(loss) from investment operations | | | 0.69 | | | | 0.53 | | | | (0.18 | ) | | | 0.23 | | | | 0.70 | |
| | | | | | | | | | | | | | | | | | | | | |
| DISTRIBUTIONS | | | | | | | | | | | | | | | | | | | | |
| From net investment income | | | (0.01 | ) | | | (0.02 | ) | | | (0.01 | ) | | | (0.02 | ) | | | (0.03 | ) |
| From net realized gain on investments | | | (0.13 | ) | | | (0.05 | ) | | | (0.13 | ) | | | (0.20 | ) | | | (0.09 | ) |
| Total distributions | | | (0.14 | ) | | | (0.07 | ) | | | (0.14 | ) | | | (0.22 | ) | | | (0.12 | ) |
| | | | | | | | | | | | | | | | | | | | | |
| REDEMPTION FEES ADDED TO PAID-IN CAPITAL | | | 0.00 | (b) | | | 0.00 | (b) | | | 0.00 | (b) | | | 0.00 | (b) | | | 0.00 | (b) |
| | | | | | | | | | | | | | | | | | | | | |
| INCREASE/DECREASE IN NET ASSET VALUE | | | 0.55 | | | | 0.46 | | | | (0.32 | ) | | | 0.01 | | | | 0.58 | |
| NET ASSET VALUE, END OF PERIOD | | $ | 4.12 | | | $ | 3.57 | | | $ | 3.11 | | | $ | 3.43 | | | $ | 3.42 | |
| | | | | | | | | | | | | | | | | | | | | |
| TOTAL RETURN | | | 19.38 | % | | | 17.59 | % | | | (5.02 | )% | | | 7.41 | % | | | 24.70 | % |
| | | | | | | | | | | | | | | | | | | | | |
| RATIOS AND SUPPLEMENTAL DATA | | | | | | | | | | | | | | | | | | | | |
| Net assets, end of period (in 000s) | | $ | 813,322 | | | $ | 698,504 | | | $ | 579,371 | | | $ | 682,364 | | | $ | 658,127 | |
| | | | | | | | | | | | | | | | | | | | | |
| RATIOS TO AVERAGE NET ASSETS | | | | | | | | | | | | | | | | | | | | |
| Expenses (excluding fees waived/ reimbursed by investment advisor) | | | 1.37 | % | | | 1.37 | % | | | 1.38 | % | | | 1.38 | % | | | 1.46 | % |
| Expenses (including fees waived/ reimbursed by investment advisor) | | | 1.30 | % | | | 1.34 | % | | | 1.38 | % | | | 1.38 | % | | | 1.46 | % |
| Net investment income | | | 0.54 | % | | | 0.42 | % | | | 0.65 | % | | | 0.61 | % | | | 0.42 | % |
| | | | | | | | | | | | | | | | | | | | | |
| PORTFOLIO TURNOVER RATE | | | 26 | % | | | 30 | % | | | 34 | % | | | 36 | % | | | 37 | % |
| (a) | Per share numbers have been calculated using the average shares method. |
| (b) | Less than $0.005 or ($0.005) per share. |
See Notes to Financial Statements.
| 78 | 1.855.377.7325 | www.GrandeurPeakGlobal.com |
| Grandeur Peak International Stalwarts Fund | Financial Highlights |
For a Share Outstanding Throughout the Periods Presented
| Investor Class | | Year Ended
April 30, 2018 | | | Year Ended
April 30, 2017 | | | For the Period
September 2, 2015
(Commencement
of Operations) to
April 30, 2016 | |
| NET ASSET VALUE, BEGINNING OF PERIOD | | $ | 13.04 | | | $ | 11.02 | | | $ | 10.00 | |
| | | | | | | | | | | | | |
| INCOME FROM INVESTMENT OPERATIONS | | | | | | | | | | | | |
| Net investment income(a) | | | 0.05 | | | | 0.02 | | | | 0.03 | |
| Net realized and unrealized gain on investments | | | 2.62 | | | | 2.03 | | | | 0.99 | |
| Total income from investment operations | | | 2.67 | | | | 2.05 | | | | 1.02 | |
| | | | | | | | | | | | | |
| DISTRIBUTIONS | | | | | | | | | | | | |
| From net investment income | | | – | | | | (0.03 | ) | | | – | |
| From net realized gain on investments | | | (0.18 | ) | | | – | | | | – | |
| Total distributions | | | (0.18 | ) | | | (0.03 | ) | | | – | |
| | | | | | | | | | | | | |
| REDEMPTION FEES ADDED TO PAID-IN CAPITAL | | | 0.00 | (b) | | | 0.00 | (b) | | | 0.00 | (b) |
| | | | | | | | | | | | | |
| INCREASE IN NET ASSET VALUE | | | 2.49 | | | | 2.02 | | | | 1.02 | |
| NET ASSET VALUE, END OF PERIOD | | $ | 15.53 | | | $ | 13.04 | | | $ | 11.02 | |
| | | | | | | | | | | | | |
| TOTAL RETURN | | | 20.50 | % | | | 18.68 | % | | | 10.20 | %(c) |
| | | | | | | | | | | | | |
| RATIOS AND SUPPLEMENTAL DATA | | | | | | | | | | | | |
| Net assets, end of period (in 000s) | | $ | 52,478 | | | $ | 31,045 | | | $ | 22,028 | |
| | | | | | | | | | | | | |
| RATIOS TO AVERAGE NET ASSETS | | | | | | | | | | | | |
| Expenses (excluding fees waived/ reimbursed by investment advisor) | | | 1.19 | % | | | 1.27 | % | | | 1.45 | %(d)(e) |
| Expenses (including fees waived/ reimbursed by investment advisor) | | | 1.19 | % | | | 1.27 | % | | | 1.35 | %(d)(e) |
| Net investment income | | | 0.33 | % | | | 0.19 | % | | | 0.44 | %(d) |
| | | | | | | | | | | | | |
| PORTFOLIO TURNOVER RATE | | | 24 | % | | | 37 | % | | | 59 | %(c) |
| (a) | Per share numbers have been calculated using the average shares method. |
| (b) | Less than $0.005 or ($0.005) per share. |
| (e) | Expense ratios during startup periods may not be representative of longer term operating periods. |
See Notes to Financial Statements.
| Annual Report | April 30, 2018 | 79 |
| Grandeur Peak International Stalwarts Fund | Financial Highlights |
For a Share Outstanding Throughout the Periods Presented
| Institutional Class | | Year Ended
April 30, 2018 | | | Year Ended
April 30, 2017 | | | For the Period
September 2, 2015
(Commencement
of Operations) to
April 30, 2016 | |
| NET ASSET VALUE, BEGINNING OF PERIOD | | $ | 13.06 | | | $ | 11.03 | | | $ | 10.00 | |
| | | | | | | | | | | | | |
| INCOME FROM INVESTMENT OPERATIONS | | | | | | | | | | | | |
| Net investment income(a) | | | 0.08 | | | | 0.04 | | | | 0.04 | |
| Net realized and unrealized gain on investments | | | 2.63 | | | | 2.04 | | | | 0.99 | |
| Total income from investment operations | | | 2.71 | | | | 2.08 | | | | 1.03 | |
| | | | | | | | | | | | | |
| DISTRIBUTIONS | | | | | | | | | | | | |
| From net investment income | | | (0.02 | ) | | | (0.05 | ) | | | (0.00 | )(b) |
| From net realized gain on investments | | | (0.18 | ) | | | – | | | | – | |
| Total distributions | | | (0.20 | ) | | | (0.05 | ) | | | (0.00 | )(b) |
| | | | | | | | | | | | | |
| REDEMPTION FEES ADDED TO PAID-IN CAPITAL | | | 0.00 | (b) | | | 0.00 | (b) | | | 0.00 | (b) |
| | | | | | | | | | | | | |
| INCREASE IN NET ASSET VALUE | | | 2.51 | | | | 2.03 | | | | 1.03 | |
| NET ASSET VALUE, END OF PERIOD | | $ | 15.57 | | | $ | 13.06 | | | $ | 11.03 | |
| | | | | | | | | | | | | |
| TOTAL RETURN | | | 20.79 | % | | | 18.96 | % | | | 10.34 | %(c) |
| | | | | | | | | | | | | |
| RATIOS AND SUPPLEMENTAL DATA | | | | | | | | | | | | |
| Net assets, end of period (in 000s) | | $ | 496,358 | | | $ | 265,393 | | | $ | 119,070 | |
| | | | | | | | | | | | | |
| RATIOS TO AVERAGE NET ASSETS | | | | | | | | | | | | |
| Expenses (excluding fees waived/ reimbursed by investment advisor) | | | 0.94 | % | | | 1.02 | % | | | 1.20 | %(d)(e) |
| Expenses (including fees waived/ reimbursed by investment advisor) | | | 0.94 | % | | | 1.02 | % | | | 1.10 | %(d)(e) |
| Net investment income | | | 0.57 | % | | | 0.37 | % | | | 0.60 | %(d) |
| | | | | | | | | | | | | |
| PORTFOLIO TURNOVER RATE | | | 24 | % | | | 37 | % | | | 59 | %(c) |
| (a) | Per share numbers have been calculated using the average shares method. |
| (b) | Less than $0.005 or ($0.005) per share. |
| (e) | Expense ratios during startup periods may not be representative of longer term operating periods. |
See Notes to Financial Statements.
| 80 | 1.855.377.7325 | www.GrandeurPeakGlobal.com |
| Grandeur Peak Funds® | Notes to Financial Statements |
April 30, 2018
1. ORGANIZATION
Financial Investors Trust (the “Trust”), a Delaware statutory trust, is an open-end management investment company registered under the Investment Company Act of 1940, as amended (“1940 Act”). As of April 30, 2018, the Trust consists of multiple separate portfolios or series. This annual report describes the Grandeur Peak Emerging Markets Opportunities Fund, Grandeur Peak Global Micro Cap Fund, Grandeur Peak Global Opportunities Fund, Grandeur Peak Global Reach Fund, Grandeur Peak Global Stalwarts Fund, Grandeur Peak International Opportunities Fund, and Grandeur Peak International Stalwarts Fund (individually a “Fund” and collectively, the “Funds”). The Funds seek long-term growth of capital. The Funds offer Investor Class (except the Grandeur Peak Global Micro Cap Fund) and Institutional Class shares.
2. SIGNIFICANT ACCOUNTING POLICIES
The accompanying financial statements were prepared in accordance with accounting principles generally accepted in the United States of America (“U.S. GAAP”). The preparation of financial statements in conformity with U.S. GAAP requires management to make certain estimates and assumptions that affect the reported amounts of assets and liabilities and disclosures of contingent assets and liabilities at the date of the financial statements and the reported amounts of revenue and expenses during the period. Actual results could differ from those estimates. The Funds are considered an investment company for financial reporting purposes under U.S. GAAP and follows the accounting and reporting guidance applicable to investment companies in the Financial Accounting Standards Board Accounting Standards Codification Topic 946. The following is a summary of significant accounting policies consistently followed by the Funds in preparation of their financial statements.
Investment Valuation: The Funds generally value their securities based on market prices determined at the close of regular trading on the New York Stock Exchange (“NYSE”), normally 4:00 p.m. Eastern Time, on each day the NYSE is open for trading.
For equity securities and mutual funds that are traded on an exchange, the market price is usually the closing sale or official closing price on that exchange. In the case of equity securities not traded on an exchange, or if such closing prices are not otherwise available, the securities are valued at the mean of the most recent bid and ask prices on such day. Redeemable securities issued by open-end registered investment companies are valued at the investment company’s applicable net asset value, with the exception of exchange-traded open-end investment companies, which are priced as equity securities.
Equity securities that are primarily traded on foreign securities exchanges are valued at the closing values of such securities on their respective foreign exchanges, except when an event occurs subsequent to the close of the foreign exchange and the close of the NYSE that was likely to have changed such value. In such an event, the fair value of those securities are determined in good faith through consideration of other factors in accordance with procedures established by and under the general supervision of the Board of Trustees (the “Board”). The Funds will use a fair valuation model provided by an independent pricing service, which is intended to reflect fair value when a security’s value or a meaningful portion of each Fund’s portfolio is believed to have been materially affected by a valuation event that has occurred between the close of the exchange or market on which the security is traded and the close of the regular trading day on the NYSE. The Funds’ valuation procedures set forth certain triggers which instruct when to use the fair valuation model.
Corporate Bonds are valued using market models that consider trade data, quotations from dealers and active market makers, relevant yield curve and spread data, creditworthiness, trade data or market information on comparable securities, and other relevant security specific information.
Forward currency exchange contracts have a fair value determined by the prevailing foreign currency exchange daily rates and current foreign currency exchange forward rates. The foreign currency exchange forward rates are calculated using an automated system that estimates rates on the basis of the current day foreign currency exchange rates and forward foreign currency exchange rates supplied by a pricing service.
When such prices or quotations are not available, or when Grandeur Peak Global Advisors, LLC (the “Adviser”) believes that they are unreliable, securities may be priced using fair value procedures approved by the Board.
Fair Value Measurements: The Funds disclose the classification of their fair value measurements following a three-tier hierarchy based on the inputs used to measure fair value. Inputs refer broadly to the assumptions that market participants would use in pricing the asset or liability, including assumptions about risk. Inputs may be observable or unobservable. Observable inputs reflect the assumptions market participants would use in pricing the asset or liability that are developed based on market data obtained from sources independent of the reporting entity. Unobservable inputs reflect the reporting entity’s own assumptions about the assumptions market participants would use in pricing the asset or liability that are developed based on the best information available.
Various inputs are used in determining the value of the Funds’ investments as of the end of the reporting period. When inputs used fall into different levels of the fair value hierarchy, the level in the hierarchy within which the fair value measurement falls is determined based on the
| Annual Report | April 30, 2018 | 81 |
| Grandeur Peak Funds® | Notes to Financial Statements |
April 30, 2018
lowest level input that is significant to the fair value measurement in its entirety. The designated input levels are not necessarily an indication of the risk or liquidity associated with these investments. These inputs are categorized in the following hierarchy under applicable financial accounting standards:
Level 1 – Unadjusted quoted prices in active markets for identical investments, unrestricted assets or liabilities that the Funds have the ability to access at the measurement date;
Level 2 – Quoted prices which are not active, quoted prices for similar assets or liabilities in active markets or inputs other than quoted prices that are observable (either directly or indirectly) for substantially the full term of the asset or liability; and
Level 3 – Significant unobservable prices or inputs (including the Funds’ own assumptions in determining the fair value of investments) where there is little or no market activity for the asset or liability at the measurement date.
The following is a summary of each Fund’s investments in the fair value hierarchy as of April 30, 2018:
| Investments in Securities at Value | | Level 1 -
Quoted and
Unadjusted
Prices | | | Level 2 -
Other
Significant
Observable
Inputs | | | Level 3 -
Significant
Unobservable
Inputs | | | Total | |
| Grandeur Peak Emerging Markets Opportunities Fund | | | | | | | | | | | | | | | | |
| Common Stocks | | | | | | | | | | | | | | | | |
| Egypt | | $ | 7,427,116 | | | $ | 1,987,500 | | | $ | – | | | $ | 9,414,616 | |
| South Korea | | | 33,488,017 | | | | – | | | | 3,657,929 | | | | 37,145,946 | |
| Other* | | | 414,575,215 | | | | – | | | | – | | | | 414,575,215 | |
| Corporate Bonds* | | $ | – | | | $ | 674,177 | | | $ | – | | | $ | 674,177 | |
| Total | | $ | 455,490,348 | | | $ | 2,661,677 | | | $ | 3,657,929 | | | $ | 461,809,954 | |
| Investments in Securities at Value | | Level 1 -
Quoted and
Unadjusted
Prices | | | Level 2 -
Other
Significant
Observable
Inputs | | | Level 3 -
Significant
Unobservable
Inputs | | | Total | |
| Grandeur Peak Global Micro Cap Fund | | | | | | | | | | | | | | | | |
| Common Stocks | | | | | | | | | | | | | | | | |
| New Zealand | | $ | 203,913 | | | $ | – | | | $ | 25,891 | | | $ | 229,804 | |
| Norway | | | 1,296,465 | | | | 800,319 | | | | – | | | | 2,096,784 | |
| South Korea | | | 616,990 | | | | – | | | | 91,948 | | | | 708,938 | |
| Other* | | | 37,552,629 | | | | – | | | | – | | | | 37,552,629 | |
| Corporate Bonds* | | $ | – | | | $ | 188,902 | | | $ | – | | | $ | 188,902 | |
| Total | | $ | 39,669,997 | | | $ | 989,221 | | | $ | 117,839 | | | $ | 40,777,057 | |
| Investments in Securities at Value | | Level 1 -
Quoted and
Unadjusted
Prices | | | Level 2 -
Other
Significant
Observable
Inputs | | | Level 3 -
Significant
Unobservable
Inputs | | | Total | |
| Grandeur Peak Global Opportunities Fund | | | | | | | | | | | | | | | | |
| Common Stocks | | | | | | | | | | | | | | | | |
| New Zealand | | $ | 4,858,878 | | | $ | – | | | $ | 179,252 | | | $ | 5,038,130 | |
| Other* | | | 780,302,263 | | | | – | | | | – | | | | 780,302,263 | |
| Corporate Bonds* | | $ | – | | | $ | 500,516 | | | $ | – | | | $ | 500,516 | |
| Total | | $ | 785,161,141 | | | $ | 500,516 | | | $ | 179,252 | | | $ | 785,840,909 | |
| 82 | 1.855.377.7325 | www.GrandeurPeakGlobal.com |
| Grandeur Peak Funds® | Notes to Financial Statements |
April 30, 2018
| Investments in Securities at Value | | Level 1 -
Quoted and
Unadjusted
Prices | | | Level 2 -
Other
Significant
Observable
Inputs | | | Level 3 -
Significant
Unobservable
Inputs | | | Total | |
| Grandeur Peak Global Reach Fund | | | | | | | | | | | | | | | | |
| Common Stocks | | | | | | | | | | | | | | | | |
| Egypt | | $ | 1,742,119 | | | $ | 795,000 | | | $ | – | | | $ | 2,537,119 | |
| New Zealand | | | 1,220,956 | | | | – | | | | 132,538 | | | | 1,353,494 | |
| Norway | | | 5,096,248 | | | | 1,480,324 | | | | – | | | | 6,576,572 | |
| South Korea | | | 6,287,935 | | | | – | | | | 728,150 | | | | 7,016,085 | |
| Spain | | | – | | | | – | | | | 1 | | | | 1 | |
| Other* | | | 350,804,075 | | | | – | | | | – | | | | 350,804,075 | |
| Preferred Stocks* | | $ | 919,749 | | | $ | – | | | $ | – | | | $ | 919,749 | |
| Corporate Bonds* | | | – | | | | 933,820 | | | | – | | | | 933,820 | |
| Total | | $ | 366,071,082 | | | $ | 3,209,144 | | | $ | 860,689 | | | $ | 370,140,915 | |
| Investments in Securities at Value | | Level 1 -
Quoted and
Unadjusted
Prices | | | Level 2 -
Other
Significant
Observable
Inputs | | | Level 3 -
Significant
Unobservable
Inputs | | | Total | |
| Grandeur Peak Global Stalwarts Fund | | | | | | | | | | | | | | | | |
| Common Stocks* | | $ | 182,222,467 | | | $ | – | | | $ | – | | | $ | 182,222,467 | |
| Preferred Stocks* | | | 742,254 | | | | – | | | | – | | | | 742,254 | |
| Total | | $ | 182,964,721 | | | $ | – | | | $ | – | | | $ | 182,964,721 | |
| Investments in Securities at Value | | Level 1 -
Quoted and
Unadjusted
Prices | | | Level 2 -
Other
Significant
Observable
Inputs | | | Level 3 -
Significant
Unobservable
Inputs | | | Total | |
| Grandeur Peak International Opportunities Fund | | | | | | | | | | | | | | | | |
| Common Stocks | | | | | | | | | | | | | | | | |
| New Zealand | | $ | 6,334,094 | | | $ | – | | | $ | 249,580 | | | $ | 6,583,674 | |
| South Korea | | | 24,258,130 | | | | – | | | | 3,214,761 | | | | 27,472,891 | |
| Other* | | | 845,102,693 | | | | – | | | | – | | | | 845,102,693 | |
| Corporate Bonds* | | $ | – | | | $ | 666,520 | | | $ | – | | | $ | 666,520 | |
| Total | | $ | 875,694,917 | | | $ | 666,520 | | | $ | 3,464,341 | | | $ | 879,825,778 | |
| Investments in Securities at Value | | Level 1 -
Quoted and
Unadjusted
Prices | | | Level 2 -
Other
Significant
Observable
Inputs | | | Level 3 -
Significant
Unobservable
Inputs | | | Total | |
| Grandeur Peak International Stalwarts Fund | | | | | | | | | | | | | | | | |
| Common Stocks* | | $ | 516,375,486 | | | $ | – | | | $ | – | | | $ | 516,375,486 | |
| Preferred Stocks* | | | 2,640,918 | | | | – | | | | – | | | | 2,640,918 | |
| Total | | $ | 519,016,404 | | | $ | – | | | $ | – | | | $ | 519,016,404 | |
| * | For a detailed country breakdown, see the accompanying Portfolio of Investments. |
| Annual Report | April 30, 2018 | 83 |
| Grandeur Peak Funds® | Notes to Financial Statements |
April 30, 2018
The Funds recognize transfers between levels as of the end of the reporting period. The transfer amount disclosed in the tables below represents the value of the securities as of April 30, 2018 transferred in/(out) of Level 1 and Level 2 during the reporting period that were also held as of April 30, 2017. The below transfers from Level 2 to Level 1 were due to the ability to obtain a closing market price within an active market for a security that previously had no market to trade. Securities transferred into Level 3 due to a lack of observable market data.
The Funds had the following transfers between levels 1 and 2 during the year ended April 30, 2018:
| | | Level 1 - Quoted and
Unadjusted Prices | | | Level 2 - Other Significant
Observable Inputs | |
| | | | Transfers In | | | | Transfers (Out) | | | | Transfers In | | | | Transfers (Out) | |
| Grandeur Peak Emerging Markets Opportunities Fund | | | | | | | | | | | | | | | | |
| Common Stocks | | $ | 891,007 | | | $ | – | | | $ | – | | | $ | (891,007 | ) |
| Total | | $ | 891,007 | | | $ | – | | | $ | – | | | $ | (891,007 | ) |
| | | Level 1 - Quoted and
Unadjusted Prices | | | Level 2 - Other Significant
Observable Inputs | |
| | | | Transfers In | | | | Transfers (Out) | | | | Transfers In | | | | Transfers (Out) | |
| Grandeur Peak Global Micro Cap Fund | | | | | | | | | | | | | | | | |
| Common Stocks | | $ | 308,033 | | | $ | – | | | $ | – | | | $ | (308,033 | ) |
| Total | | $ | 308,033 | | | $ | – | | | $ | – | | | $ | (308,033 | ) |
| | | Level 1 - Quoted and
Unadjusted Prices | | | Level 2 - Other Significant
Observable Inputs | |
| | | | Transfers In | | | | Transfers (Out) | | | | Transfers In | | | | Transfers (Out) | |
| Grandeur Peak Global Reach Fund | | | | | | | | | | | | | | | | |
| Common Stocks | | $ | 1,149,362 | | | $ | – | | | $ | – | | | $ | (1,149,362 | ) |
| Total | | $ | 1,149,362 | | | $ | – | | | $ | – | | | $ | (1,149,362 | ) |
| | | Level 1 - Quoted and
Unadjusted Prices | | | Level 2 - Other Significant
Observable Inputs | |
| | | | Transfers In | | | | Transfers (Out) | | | | Transfers In | | | | Transfers (Out) | |
| Grandeur Peak International Opportunities Fund | | | | | | | | | | | | | | | | |
| Common Stocks | | $ | 1,155,309 | | | $ | – | | | $ | – | | | $ | (1,155,309 | ) |
| Total | | $ | 1,155,309 | | | $ | – | | | $ | – | | | $ | (1,155,309 | ) |
The following is a reconciliation of the investments in which significant unobservable inputs (Level 3) were used in determining fair value:
| Grandeur Peak Emerging Markets Opportunities Fund | | Common Stocks | | | Total | |
| Balance as of April 30, 2017 | | $ | 3,306,095 | | | $ | 3,306,095 | |
| Accrued discount/ premium | | | – | | | | – | |
| Return of Capital | | | – | | | | – | |
| Realized Gain/(Loss) | | | – | | | | – | |
| Change in Unrealized Appreciation/(Depreciation) | | | 351,834 | | | | 351,834 | |
| Purchases | | | – | | | | – | |
| Sales Proceeds | | | – | | | | – | |
| Transfer into Level 3 | | | – | | | | – | |
| Transfer out of Level 3 | | | – | | | | – | |
| Balance as of April 30, 2018 | | $ | 3,657,929 | | | $ | 3,657,929 | |
| Net change in unrealized appreciation/(depreciation) included in the Statements of Operations attributable to Level 3 investments held at April 30, 2018 | | $ | 351,835 | | | $ | 351,835 | |
| 84 | 1.855.377.7325 | www.GrandeurPeakGlobal.com |
| Grandeur Peak Funds® | Notes to Financial Statements |
April 30, 2018
| Grandeur Peak Global Micro Cap Fund | | Common Stocks | | | Total | |
| Balance as of April 30, 2017 | | $ | 83,107 | | | $ | 83,107 | |
| Accrued discount/ premium | | | – | | | | – | |
| Return of Capital | | | – | | | | – | |
| Realized Gain/(Loss) | | | – | | | | – | |
| Change in Unrealized Appreciation/(Depreciation) | | | 8,841 | | | | 8,841 | |
| Purchases | | | – | | | | – | |
| Sales Proceeds | | | – | | | | – | |
| Transfer into Level 3 | | | 25,891 | | | | 25,891 | |
| Transfer out of Level 3 | | | – | | | | – | |
| Balance as of April 30, 2018 | | $ | 117,839 | | | $ | 117,839 | |
| Net change in unrealized appreciation/(depreciation) included in the Statements of Operations attributable to Level 3 investments held at April 30, 2018 | | $ | (347,548 | ) | | $ | (347,548 | ) |
| Grandeur Peak Global Opportunities Fund | | Common Stocks | | | Total | |
| Balance as of April 30, 2017 | | $ | – | | | $ | – | |
| Accrued discount/ premium | | | – | | | | – | |
| Return of Capital | | | – | | | | – | |
| Realized Gain/(Loss) | | | – | | | | – | |
| Change in Unrealized Appreciation/(Depreciation) | | | – | | | | – | |
| Purchases | | | – | | | | – | |
| Sales Proceeds | | | – | | | | – | |
| Transfer into Level 3 | | | 179,252 | | | | 179,252 | |
| Transfer out of Level 3 | | | – | | | | – | |
| Balance as of April 30, 2018 | | $ | 179,252 | | | $ | 179,252 | |
| Net change in unrealized appreciation/(depreciation) included in the Statements of Operations attributable to Level 3 investments held at April 30, 2018 | | $ | (2,467,384 | ) | | $ | (2,467,384 | ) |
| Grandeur Peak Global Reach Fund | | Common Stocks | | | Total | |
| Balance as of April 30, 2017 | | $ | 658,125 | | | $ | 658,125 | |
| Accrued discount/ premium | | | – | | | | – | |
| Return of Capital | | | – | | | | – | |
| Realized Gain/(Loss) | | | – | | | | – | |
| Change in Unrealized Appreciation/(Depreciation) | | | 70,026 | | | | 70,026 | |
| Purchases | | | – | | | | – | |
| Sales Proceeds | | | – | | | | – | |
| Transfer into Level 3 | | | 132,538 | | | | 132,538 | |
| Transfer out of Level 3 | | | – | | | | – | |
| Balance as of April 30, 2018 | | $ | 860,689 | | | $ | 860,689 | |
| Net change in unrealized appreciation/(depreciation) included in the Statements of Operations attributable to Level 3 investments held at April 30, 2018 | | $ | (1,733,766 | ) | | $ | (1,733,766 | ) |
| Grandeur Peak International Opportunities Fund | | Common Stocks | | | Total | |
| Balance as of April 30, 2017 | | $ | 2,905,555 | | | $ | 2,905,555 | |
| Accrued discount/ premium | | | – | | | | – | |
| Return of Capital | | | – | | | | – | |
| Realized Gain/(Loss) | | | – | | | | – | |
| Change in Unrealized Appreciation/(Depreciation) | | | 309,206 | | | | 309,206 | |
| Purchases | | | – | | | | – | |
| Sales Proceeds | | | – | | | | – | |
| Transfer into Level 3 | | | 249,580 | | | | 249,580 | |
| Transfer out of Level 3 | | | – | | | | – | |
| Balance as of April 30, 2018 | | $ | 3,464,341 | | | $ | 3,464,341 | |
| Net change in unrealized appreciation/(depreciation) included in the Statements of Operations attributable to Level 3 investments held at April 30, 2018 | | $ | (3,126,229 | ) | | $ | (3,126,229 | ) |
| Annual Report | April 30, 2018 | 85 |
| Grandeur Peak Funds® | Notes to Financial Statements |
April 30, 2018
Change in unrealized appreciation/depreciation on Level 3 securities is included on the Statements of Operations under Net change in unrealized appreciation/(depreciation) on investments. Realized gain (loss) on Level 3 securities is included on the Statements of Operations under Net realized gain/(loss) on investments.
The table below provided additional information about the Level 3 Fair Value Measurements as of April 30, 2018:
Quantitative Information about Level 3 Fair Value Measurements
Grandeur Peak Emerging Markets Opportunities Fund
| Asset Class | Fair Value (USD)
at 4/30/18 | Valuation Technique | Unobservable Inputs(a) | Value |
| Foreign Common Stock | $3,657,929 | Earnings multiple approach | Price earnings multiple | 9x |
Grandeur Peak Global Micro Cap Fund
| Asset Class | Fair Value (USD)
at 4/30/18 | Valuation Technique | Unobservable Inputs(a) | Value |
| Foreign Common Stock | $91,948 | Earnings multiple approach | Price earnings multiple | 9x |
| Foreign Common Stock | 25,891 | Expected liquidation value | Book value multiple | 0.25x |
Grandeur Peak Global Opportunities Fund
| Asset Class | Fair Value (USD)
at 4/30/18 | Valuation Technique | Unobservable Inputs(a) | Value |
| Foreign Common Stock | $179,252 | Expected liquidation value | Book value multiple | 0.25x |
Grandeur Peak Global Reach Fund
| Asset Class | Fair Value (USD)
at 4/30/18 | Valuation Technique | Unobservable Inputs(a) | Value |
| Foreign Common Stock | $728,150 | Earnings multiple approach | Price earnings multiple | 9x |
| Foreign Common Stock | 132,538 | Expected liquidation value | Book value multiple | 0.25x |
Grandeur Peak International Opportunities Fund
| Asset Class | Fair Value (USD)
at 4/30/18 | Valuation Technique | Unobservable Inputs(a) | Value |
| Foreign Common Stock | $3,214,761 | Earnings multiple approach | Price earnings multiple | 9x |
| Foreign Common Stock | 249,580 | Expected liquidation value | Book value multiple | 0.25x |
| (a) | A change to the unobservable input may result in a significant change to the value of the investment as follows: |
| Unobservable Input | Impact to Value if Input Decreases | Impact to Value if Input Increases |
| Price earnings multiple | Decrease | Increase |
| Book value multiple | Decrease | Increase |
Investment Transactions and Investment Income: Investment transactions are accounted for on the date the investments are purchased or sold (trade date). Realized gains and losses from investment transactions are reported on an identified cost which is the same basis the Fund uses for federal income tax purposes. Interest income, which includes accretion of discounts and amortization of premiums, is accrued and recorded as earned. Dividend income is recognized on the ex-dividend date or for certain foreign securities, as soon as information is available to the Funds. All of the realized and unrealized gains and losses and net investment income, are allocated daily to each class in proportion to its average daily net assets.
Cash Management Transactions: The Funds subscribe to the Brown Brothers Harriman & Co. (“BBH”) Cash Management Service (“CMS”), whereby cash balances are automatically swept into overnight offshore demand deposits with either the BBH Grand Cayman branch or a branch of a pre-approved commercial bank. This fully automated program allows the Funds to earn interest on cash balances. Excess cash with deposit
| 86 | 1.855.377.7325 | www.GrandeurPeakGlobal.com |
| Grandeur Peak Funds® | Notes to Financial Statements |
April 30, 2018
institutions domiciled outside of the U.S. are subject to sovereign actions in the jurisdiction of the deposit institution including, but not limited to, freeze, seizure or diminution. Cash balances in the BBH CMS are included on the Statements of Assets and Liabilities under Cash and Foreign Cash, at Value. As of April 30, 2018, the Funds had the following cash balances participating in the BBH CMS:
| Fund | | | |
| Grandeur Peak Emerging Markets Opportunities Fund | | $ | 30,077,722 | |
| Grandeur Peak Global Micro Cap Fund | | | 713,681 | |
| Grandeur Peak Global Opportunities Fund | | | 614,736 | |
| Grandeur Peak Global Reach Fund | | | 1,729,608 | |
| Grandeur Peak Global Stalwarts Fund | | | 4,048,308 | |
| Grandeur Peak International Opportunities Fund | | | 10,137,151 | |
| Grandeur Peak International Stalwarts Fund | | | 24,996,091 | |
As of April 30, 2018, the Funds had the following foreign cash balances participating in the BBH CMS (cost and value of foreign cash balances are equal):
| Fund | | | |
| Grandeur Peak Emerging Markets Opportunities Fund | | $ | – | |
| Grandeur Peak Global Micro Cap Fund | | | 3,977 | |
| Grandeur Peak Global Opportunities Fund | | | – | |
| Grandeur Peak Global Reach Fund | | | 9,899 | |
| Grandeur Peak Global Stalwarts Fund | | | – | |
| Grandeur Peak International Opportunities Fund | | | 1,840 | |
| Grandeur Peak International Stalwarts Fund | | | 95,422 | |
Foreign Securities: The Funds may directly purchase securities of foreign issuers. Investing in securities of foreign issuers involves special risks not typically associated with investing in securities of U.S. issuers. The risks include possible reevaluation of currencies, the inability to repatriate foreign currency, less complete financial information about companies and possible future adverse political and economic developments. Moreover, securities of many foreign issuers and their markets may be less liquid and their prices more volatile than those of securities of comparable U.S. issuers.
Foreign Currency Translation: The books and records of the Funds are maintained in U.S. dollars. Investment valuations and other assets and liabilities initially expressed in foreign currencies are converted each business day into U.S. dollars based upon current exchange rates. Prevailing foreign exchange rates may generally be obtained at the close of the NYSE (normally, 4:00 p.m. Eastern Time). The portion of realized and unrealized gains or losses on investments due to fluctuations in foreign currency exchange rates is not separately disclosed and is included in realized and unrealized gains or losses on investments, when applicable.
Foreign Currency Spot Contracts: The Funds may enter into foreign currency spot contracts to facilitate transactions in foreign securities or to convert foreign currency receipts into U.S. dollars. A foreign currency spot contract is an agreement between two parties to buy and sell currencies at the current market rate, for settlement generally within two business days. The U.S. dollar value of the contracts is determined using current currency exchange rates supplied by a pricing service.
The contract is marked-to-market daily for settlements beyond one day and any change in market value is recorded as an unrealized gain or loss. When the contract is closed, a realized gain or loss is recorded equal to the difference between the value on the open and close date. Losses may arise from changes in the value of the foreign currency, or if the counterparties do not perform under the contract’s terms. The maximum potential loss from such contracts is the aggregate face value in U.S. dollars at the time the contract was opened.
Trust Expenses: Some expenses of the Trust can be directly attributed to the Funds. Expenses which cannot be directly attributed to the Funds are apportioned among all funds in the Trust based on average net assets of each fund.
Fund and Class Expenses: Expenses that are specific to a Fund or class of shares of a Fund, including distribution fees (Rule 12b-1 fees), are charged directly to that Fund or share class. Expenses that are common to all Funds generally are allocated among the Funds in proportion to their average daily net assets.
Federal Income Taxes: The Funds comply with the requirements under Subchapter M of the Internal Revenue Code of 1986, as amended, applicable to regulated investment companies and intend to distribute substantially all of their net taxable income and net capital gains, if any,
| Annual Report | April 30, 2018 | 87 |
| Grandeur Peak Funds® | Notes to Financial Statements |
April 30, 2018
each year so that it will not be subject to excise tax on undistributed income and gains. The Funds are not subject to income taxes to the extent such distributions are made.
As of and during year ended April 30, 2018, the Funds had a liability for unrecognized capital gains tax. These amounts are disclosed as Foreign Capital Gains Tax on the Statements of Assets and Liabilities. The Funds file U.S. federal, state, and local tax returns as required. The Funds’ tax returns are subject to examination by the relevant tax authorities until expiration of the applicable statute of limitations, which is generally three years after the filing of the tax return for federal purposes and four years for most state returns. Tax returns for open years have incorporated no uncertain tax positions that require a provision for income taxes.
Distributions to Shareholders: Each Fund normally pays dividends and distributes capital gains, if any, on an annual basis. Income dividend distributions are derived from dividends and other income each Fund receives from their investments, including short term capital gains. Long term capital gain distributions are derived from gains realized when each Fund sells a security it has owned for more than a year. Each Fund may make additional distributions and dividends at other times if the portfolio manager believes doing so may be necessary for each Fund to avoid or reduce taxes. The Funds intend to pass through foreign tax credits to shareholders.
3. TAX BASIS INFORMATION
Reclassifications: As of April 30, 2018, permanent differences in book and tax accounting were reclassified. These differences had no effect on net assets and are primarily attributed to the differing book/tax treatment of foreign currency transactions, PFIC investments, equalization, book/tax distribution differences and certain other investments. The reclassifications were as follows:
| Fund | | Paid-in Capital | | | Accumulated Net
Investment
Income/(Loss) | | | Accumulated Net
Realized
Gain/(Loss) on
Investments | |
| Grandeur Peak Emerging Markets Opportunities Fund | | $ | 65,211 | | | $ | (475,121 | ) | | $ | 409,910 | |
| Grandeur Peak Global Micro Cap Fund | | | 93,350 | | | | 59,787 | | | | (153,137 | ) |
| Grandeur Peak Global Opportunities Fund | | | 2,187,991 | | | | 303,345 | | | | (2,491,336 | ) |
| Grandeur Peak Global Reach Fund | | | 422,022 | | | | (217,122 | ) | | | (204,900 | ) |
| Grandeur Peak Global Stalwarts Fund | | | 171,733 | | | | (80,201 | ) | | | (91,532 | ) |
| Grandeur Peak International Opportunities Fund | | | 1,330,386 | | | | (319,894 | ) | | | (1,010,492 | ) |
| Grandeur Peak International Stalwarts Fund | | | 750,006 | | | | (457,852 | ) | | | (292,154 | ) |
Tax Basis of Investments: As of April 30, 2018, the aggregate cost of investments, gross unrealized appreciation/(depreciation) and net unrealized appreciation for Federal tax purposes was as follows:
| Fund | | Gross
Appreciation
(excess of value
over tax cost) | | | Gross
Depreciation
(excess of tax
cost over value) | | | Net
Appreciation/
(Depreciation) of
Foreign Currency | | | Net
Unrealized
Appreciation/
(Depreciation) | | | Cost of
Investments for
Income Tax
Purposes | |
| Grandeur Peak Emerging Markets Opportunities Fund | | $ | 120,888,930 | | | $ | (32,035,285 | ) | | $ | (245,218 | ) | | $ | 88,608,427 | | | $ | 372,956,309 | |
| Grandeur Peak Global Micro Cap Fund | | | 9,923,337 | | | | (2,328,765 | ) | | | (2,671 | ) | | | 7,591,901 | | | | 33,182,485 | |
| Grandeur Peak Global Opportunities Fund | | | 267,284,718 | | | | (40,012,937 | ) | | | (120,626 | ) | | | 227,151,155 | | | | 558,569,128 | |
| Grandeur Peak Global Reach Fund | | | 109,297,799 | | | | (17,626,706 | ) | | | (56,664 | ) | | | 91,614,429 | | | | 278,469,822 | |
| Grandeur Peak Global Stalwarts Fund | | | 38,684,537 | | | | (4,118,583 | ) | | | (16,351 | ) | | | 34,549,603 | | | | 148,398,767 | |
| Grandeur Peak International Opportunities Fund | | | 300,949,911 | | | | (47,014,021 | ) | | | (214,575 | ) | | | 253,721,315 | | | | 625,889,888 | |
| Grandeur Peak International Stalwarts Fund | | | 115,703,873 | | | | (10,992,556 | ) | | | (51,547 | ) | | | 104,659,770 | | | | 414,305,087 | |
| 88 | 1.855.377.7325 | www.GrandeurPeakGlobal.com |
| Grandeur Peak Funds® | Notes to Financial Statements |
April 30, 2018
Components of Earnings: As of April 30, 2018, components of distributable earnings on a tax basis were as follows:
| Fund | | Undistributed
Ordinary
Income | | | Accumulated
Capital
Gains/
(Losses) | | | Other
Accumulated
Gain/
(Loss) | | | Net
Unrealized Appreciation/
(Depreciation)
on
Investments
and Foreign
Currency | | | Total
Distributable
Earnings | |
| Grandeur Peak Emerging Markets Opportunities Fund | | $ | 310,154 | | | $ | 3,456,127 | | | $ | (565 | ) | | $ | 88,608,427 | | | $ | 92,374,143 | |
| Grandeur Peak Global Micro Cap Fund | | | 10,964 | | | | 1,937,619 | | | | (2,805 | ) | | | 7,591,901 | | | | 9,537,679 | |
| Grandeur Peak Global Opportunities Fund | | | 4,313,679 | | | | 29,562,083 | | | | (130 | ) | | | 227,151,155 | | | | 261,026,787 | |
| Grandeur Peak Global Reach Fund | | | 1,927,199 | | | | 11,021,582 | | | | 3 | | | | 91,614,429 | | | | 104,563,213 | |
| Grandeur Peak Global Stalwarts Fund | | | 55,605 | | | | 3,020,559 | | | | 1,132 | | | | 34,549,603 | | | | 37,626,899 | |
| Grandeur Peak International Opportunities Fund | | | 5,169,987 | | | | 32,971,723 | | | | 1,388 | | | | 253,721,315 | | | | 291,864,413 | |
| Grandeur Peak International Stalwarts Fund | | | 1,148,084 | | | | 8,481,922 | | | | 4,893 | | | | 104,659,770 | | | | 114,294,669 | |
Tax Basis of Distributions to Shareholders: The character of distributions made during the year from net investment income or net realized gains may differ from its ultimate characterization for federal income tax purposes. Also, due to the timing of dividend distributions, the fiscal year in which amounts are distributed may differ from the fiscal year in which the income or realized gain were recorded by the Funds.
The tax character of distributions paid by the Funds for the fiscal year and or period ended April 30, 2018 were as follows:
| Fund | | Ordinary
Income | | | Long-Term
Capital Gain | |
| Grandeur Peak Emerging Markets Opportunities Fund | | $ | 518,950 | | | $ | – | |
| Grandeur Peak Global Micro Cap Fund | | | 834,856 | | | | 2,093,993 | |
| Grandeur Peak Global Opportunities Fund | | | 1,359,717 | | | | 41,054,835 | |
| Grandeur Peak Global Reach Fund | | | 374,631 | | | | 4,826,741 | |
| Grandeur Peak Global Stalwarts Fund | | | – | | | | 2,371,669 | |
| Grandeur Peak International Opportunities Fund | | | 3,123,114 | | | | 27,328,426 | |
| Grandeur Peak International Stalwarts Fund | | | 604,680 | | | | 5,564,868 | |
The tax character of distributions paid by the Funds for the fiscal year or period ended April 30, 2017 were as follows:
| Fund | | Ordinary
Income | | | Long-Term
Capital Gain | |
| Grandeur Peak Emerging Markets Opportunities Fund | | $ | 2,028,686 | | | $ | – | |
| Grandeur Peak Global Micro Cap Fund | | | 380,816 | | | | 10,397 | |
| Grandeur Peak Global Opportunities Fund | | | 682,795 | | | | 771,975 | |
| Grandeur Peak Global Reach Fund | | | 765,635 | | | | – | |
| Grandeur Peak Global Stalwarts Fund | | | 108,750 | | | | – | |
| Grandeur Peak International Opportunities Fund | | | 4,568,286 | | | | 11,768,487 | |
| Grandeur Peak International Stalwarts Fund | | | 1,003,004 | | | | – | |
The Grandeur Peak Emerging Markets Opportunity Fund and the Grandeur Peak Global Reach Fund used capital loss carryovers during the period ended April 30, 2018 in the amounts of $6,261,205 and $5,696,933, respectively.
The following Funds elects to defer to the period ending April 30, 2019, late year ordinary losses in the amount of:
| Fund | | Ordinary Losses
Recognized | |
| Grandeur Peak Global Micro Cap Fund | | $ | 2,453 | |
| Annual Report | April 30, 2018 | 89 |
| Grandeur Peak Funds® | Notes to Financial Statements |
April 30, 2018
4. SECURITIES TRANSACTIONS
The cost of purchases and proceeds from sales of securities (excluding short term securities) during the year ended April 30, 2018 were as follows:
| Fund | | Purchases of
Securities | | | Proceeds From
Sales of Securities | |
| Grandeur Peak Emerging Markets Opportunities Fund | | $ | 160,188,541 | | | $ | 142,923,128 | |
| Grandeur Peak Global Micro Cap Fund | | | 18,576,935 | | | | 19,931,230 | |
| Grandeur Peak Global Opportunities Fund | | | 215,979,386 | | | | 253,536,373 | |
| Grandeur Peak Global Reach Fund | | | 150,003,225 | | | | 154,531,471 | |
| Grandeur Peak Global Stalwarts Fund | | | 93,681,101 | | | | 42,771,698 | |
| Grandeur Peak International Opportunities Fund | | | 216,406,056 | | | | 242,508,742 | |
| Grandeur Peak International Stalwarts Fund | | | 252,763,498 | | | | 100,586,499 | |
5. SHARES OF BENEFICIAL INTEREST
The capitalization of the Trust consists of an unlimited number of shares of beneficial interest with no par value per share. Holders of the shares of the Funds of the Trust have one vote for each share held and a proportionate fraction of a vote for each fractional share. All shares issued and outstanding are fully paid and are transferable and redeemable at the option of the shareholder. Purchasers of the share do not have any obligation to make payments to the Trust or its creditors solely by reason of the purchasers’ ownership of the shares. Shares have no pre-emptive rights.
Shares redeemed within 60 days of purchase may incur a 2% short-term redemption fee deducted from the redemption amount. For the year ended April 30, 2018 and the year ended April 30, 2017, the redemption fees charged by the Funds are presented in the Statements of Changes in Net Assets.
6. MANAGEMENT AND RELATED-PARTY TRANSACTIONS
The Adviser, subject to the authority of the Board, is responsible for the overall management and administration of the Funds’ business affairs. The Adviser manages the investments of the Funds in accordance with the Funds’ investment objective, policies and limitations and investment guidelines established jointly by the Adviser and the Trustees. Pursuant to the Advisory Agreement, (the “Advisory Agreement”), each Fund pays the Adviser an annual management fee based on each Fund’s average daily net assets. The management fee is paid on a monthly basis. The following table reflects the Funds’ advisory fee rates.
| Fund | Advisory Fee |
| Grandeur Peak Emerging Markets Opportunities Fund | 1.35% |
| Grandeur Peak Global Micro Cap Fund | 1.50% |
| Grandeur Peak Global Opportunities Fund | 1.25% |
| Grandeur Peak Global Reach Fund | 1.10% |
| Grandeur Peak Global Stalwarts Fund | 0.80% |
| Grandeur Peak International Opportunities Fund | 1.25% |
| Grandeur Peak International Stalwarts Fund | 0.80% |
| 90 | 1.855.377.7325 | www.GrandeurPeakGlobal.com |
| Grandeur Peak Funds® | Notes to Financial Statements |
April 30, 2018
The Adviser has contractually agreed to limit certain of each Fund’s expenses (excluding acquired fund fees and expenses, brokerage expenses, interest expenses, taxes and extraordinary expenses). The following table reflects the Funds’ expense cap.
| Fund | Expense Cap | Term of Expense Limit Agreements |
| Grandeur Peak Emerging Markets Opportunities Fund | | |
| Investor Class | 1.95% | September 1, 2016 – August 31, 2017 / |
| Institutional Class | 1.70% | September 1, 2017 – August 31, 2018 |
| Grandeur Peak Global Micro Cap Fund | | |
| Institutional Class | 2.00% | September 1, 2016 – August 31, 2017 / |
| | | September 1, 2017 – August 31, 2018 |
| Grandeur Peak Global Opportunities Fund | | |
| Investor Class | 1.75% | September 1, 2016 – August 31, 2017 / |
| Institutional Class | 1.50% | September 1, 2017 – August 31, 2018 |
| Grandeur Peak Global Reach Fund | | |
| Investor Class | 1.60% | September 1, 2016 – August 31, 2017 / |
| Institutional Class | 1.35% | September 1, 2017 – August 31, 2018 |
| Grandeur Peak Global Stalwarts Fund | | |
| Investor Class | 1.35% | September 1, 2016 – August 31, 2017 / |
| Institutional Class | 1.10% | September 1, 2017 – August 31, 2018 |
| Grandeur Peak International Opportunities Fund | | |
| Investor Class | 1.75% | September 1, 2016 – August 31, 2017 / |
| Institutional Class | 1.50% | September 1, 2017 – August 31, 2018 |
| Grandeur Peak International Stalwarts Fund | | |
| Investor Class | 1.35% | September 1, 2016 – August 31, 2017 / |
| Institutional Class | 1.10% | September 1, 2017 – August 31, 2018 |
Pursuant to these agreements, the Adviser may seek reimbursement from a Fund for any previous fee waivers and expense reimbursements made by the Adviser, provided that any such reimbursements made by the Funds to the Adviser will not cause the Funds’ expense limitation to exceed expense limitations in existence at the time the expense was incurred, or at the time of the reimbursement, whichever is lower, and the reimbursement is made within three years after the expenses were incurred. Fees waived/reimbursed by Adviser for the year ended April 30, 2018 are disclosed in the Statements of Operations.
In addition to the foregoing contractual arrangements, the Adviser has voluntarily agreed, effective September 1, 2016, to waive, with respect to the Grandeur Peak Global Opportunities Fund and the Grandeur Peak International Opportunities Fund, annual management fees to the extent such fees exceed 1.10% on assets above $500 million (the annual management fee rate with respect to such funds will remain 1.25% on the first $500 million in assets). The Adviser has also voluntarily agreed, effective January 1, 2018, to waive, with respect to the Grandeur Peak Emerging Markets Opportunities Fund, annual management fees to the extent such fees exceed 1.20% on all assets above $400 million (the annual management fee rate with respect to the Fund will remain 1.35% on the first $400 million in assets). These voluntary arrangements may be terminated at any time by the Adviser. Voluntary waivers are not subject to recoupment by the Adviser. Voluntary fees waive by the Adviser for the year ended April 30, 2018 are disclosed in the Statements of Operations.
| Annual Report | April 30, 2018 | 91 |
| Grandeur Peak Funds® | Notes to Financial Statements |
April 30, 2018
For the year ended April 30, 2018, the fee waivers/reimbursements and/or recoupments were as follows:
| Fund | | Fees
Waived/
Reimbursed By
Adviser | | | Recoupment
of Previously
Waived Fees
By Adviser | |
| Grandeur Peak Emerging Markets Opportunities Fund | | | | | | | | |
| Investor Class | | $ | – | | | $ | – | |
| Institutional Class | | | – | | | | – | |
| Grandeur Peak Global Micro Cap Fund | | | | | | | | |
| Institutional Class | | | 27,510 | | | | 3,378 | |
| Grandeur Peak Global Opportunities Fund | | | | | | | | |
| Investor Class | | $ | – | | | $ | – | |
| Institutional Class | | | – | | | | – | |
| Grandeur Peak Global Reach Fund | | | | | | | | |
| Investor Class | | $ | – | | | $ | – | |
| Institutional Class | | | – | | | | – | |
| Grandeur Peak Global Stalwarts Fund | | | | | | | | |
| Investor Class | | $ | 73 | | | $ | 63,422 | |
| Institutional Class | | | 503 | | | | 55,188 | |
| Grandeur Peak International Opportunities Fund | | | | | | | | |
| Investor Class | | $ | – | | | $ | – | |
| Institutional Class | | | – | | | | – | |
| Grandeur Peak International Stalwarts Fund | | | | | | | | |
| Investor Class | | $ | – | | | $ | – | |
| Institutional Class | | | – | | | | – | |
As of April 30, 2018, the balances of recoupable expenses for each Fund were as follows:
| Fund | | Expires 2019 | | | Expires 2020 | | | Expires 2021 | | | Total | |
| Grandeur Peak Emerging Markets Opportunities Fund | | | | | | | | | | | | | | | | |
| Investor Class | | $ | – | | | $ | – | | | $ | – | | | $ | – | |
| Institutional Class | | | – | | | | – | | | | – | | | | – | |
| Grandeur Peak Global Micro Cap Fund | | | | | | | | | | | | | | | | |
| Institutional Class | | $ | 40,042 | | | $ | 55,827 | | | $ | 27,510 | | | $ | 123,379 | |
| Grandeur Peak Global Opportunities Fund | | | | | | | | | | | | | | | | |
| Investor Class | | $ | – | | | $ | – | | | $ | – | | | $ | – | |
| Institutional Class | | | – | | | | – | | | | – | | | | – | |
| Grandeur Peak Global Reach Fund | | | | | | | | | | | | | | | | |
| Investor Class | | $ | – | | | $ | – | | | $ | – | | | $ | – | |
| Institutional Class | | | – | | | | – | | | | – | | | | – | |
| Grandeur Peak Global Stalwarts Fund | | | | | | | | | | | | | | | | |
| Investor Class | | $ | – | | | $ | 16,446 | | | $ | 73 | | | $ | 16,519 | |
| Institutional Class | | | – | | | | 22,391 | | | | 503 | | | | 22,894 | |
| Grandeur Peak International Opportunities Fund | | | | | | | | | | | | | | | | |
| Investor Class | | $ | – | | | $ | – | | | $ | – | | | $ | – | |
| Institutional Class | | | – | | | | – | | | | – | | | | – | |
| Grandeur Peak International Stalwarts Fund | | | | | | | | | | | | | | | | |
| Investor Class | | $ | – | | | $ | – | | | $ | – | | | $ | – | |
| Institutional Class | | | – | | | | – | | | | – | | | | – | |
| 92 | 1.855.377.7325 | www.GrandeurPeakGlobal.com |
| Grandeur Peak Funds® | Notes to Financial Statements |
April 30, 2018
Administrator Fees and Expenses
ALPS Fund Services, Inc. (“ALPS”) serves as administrator to the Funds and the Funds have agreed to pay expenses incurred in connection with their administrative activities. Pursuant to an Administration Agreement, ALPS provides operational services to the Funds including, but not limited to, fund accounting and fund administration and generally assists in the Funds’ operations. Officers of the Trust are employees of ALPS. The Funds’ administration fee is accrued on a daily basis and paid monthly. Administration fees paid by the Funds for the year ended April 30, 2018 are disclosed in the Statements of Operations.
ALPS is reimbursed by the Fund for certain out-of-pocket expenses.
Transfer Agent
ALPS serves as transfer, dividend paying and shareholder servicing agent for the Funds. ALPS receives an annual minimum fee, a fee based upon the number of shareholder accounts, and is also reimbursed by the Funds for certain out-of-pocket expenses. Transfer agent fees paid by the Funds for the year ended April 30, 2018 are disclosed in the Statements of Operations.
Compliance Services
ALPS provides services that assist the Trust’s chief compliance officer in monitoring and testing the policies and procedures of the Trust in conjunction with requirements under Rule 38a-1 under the 1940 Act and receives an annual base fee. ALPS is reimbursed for certain out-of-pocket expenses by the Funds. Compliance service fees paid by the Funds for the year ended April 30, 2018 are disclosed in the Statements of Operations.
Principal Financial Officer
ALPS receives an annual fee for providing principal financial officer services to the Funds. Principal financial officer fees paid by the Fund for the year ended April 30, 2018 are disclosed in the Statements of Operations.
Distributor: ALPS Distributors, Inc. (“ADI” or the “Distributor”) (an affiliate of ALPS) acts as the distributor of the Funds’ shares pursuant to a Distribution Agreement with the Trust. Shares are sold on a continuous basis by ADI as agent for the Funds, and ADI has agreed to use its best efforts to solicit orders for the sale of each Fund’s shares, although it is not obliged to sell any particular amount of shares. ADI is not entitled to any compensation for its services as Distributor. ADI is registered as a broker-dealer with the U.S. Securities and Exchange Commission.
Each Fund has adopted a Distribution and Services (Rule 12b-1) Plan pursuant to Rule 12b-1 of the 1940 Act (the “Plan”) for its Investor Class shares. The Plan allows the Funds to use Investor Class assets to pay fees in connection with the distribution and marketing of Investor Class shares and/or the provision of shareholder services to Investor Class shareholders. The Plan permits payment for services in connection with the administration of plans or programs that use Investor Class shares of each Fund as their funding medium and for related expenses. The recipients of such payments may include the Distributor, other affiliates of the Adviser, broker-dealers, financial institutions, plan sponsors and administrators and other financial intermediaries through which investors may purchase shares of the Fund. The Plan permits the Funds to make total payments at an annual rate of up to 0.25% of each Fund’s average daily net assets attributable to its Investor Class shares. The expenses of the Plan are reflected as distribution and service fees in the Statements of Operations.
7. INDEMNIFICATIONS
Under the Trust’s organizational documents, its officers and Trustees are indemnified against certain liability arising out of the performance of their duties to the Trust. Additionally, in the normal course of business, the Trust enters into contracts with service providers that may contain general indemnification clauses, which may permit indemnification to the extent permissible under applicable law. The Trust’s maximum exposure under these arrangements is unknown, as this would involve future claims that may be made against the Trust that have not yet occurred.
| Annual Report | April 30, 2018 | 93 |
| Grandeur Peak Funds® | Report of Independent Registered Public Accounting Firm |
To the shareholders and the Board of Trustees of Financial Investors Trust
Opinion on the Financial Statements and Financial Highlights
We have audited the accompanying statements of assets and liabilities, including the portfolios of investments, of Grandeur Peak Emerging Markets Opportunities Fund, Grandeur Peak Global Micro Cap Fund, Grandeur Peak Global Opportunities Fund, Grandeur Peak Global Reach Fund, Grandeur Peak Global Stalwarts Fund, Grandeur Peak International Opportunities Fund, and Grandeur Peak International Stalwarts Fund (the "Funds"), seven of the funds constituting the Financial Investors Trust, as of April 30, 2018; the related statements of operations for the year then ended, the statements of changes in net assets for each of the two years in the period then ended, the financial highlights for each of the five years in the period then ended for Grandeur Peak Global Opportunities Fund and Grandeur Peak International Opportunities Fund; the related statements of operations, changes in net assets, and the financial highlights for the periods indicated in the table below for the Grandeur Peak Emerging Markets Opportunities Fund, Grandeur Peak Global Micro Cap Fund, Grandeur Peak Global Reach Fund, Grandeur Peak Global Stalwarts Fund, and Grandeur Peak International Stalwarts Fund; and the related notes. In our opinion, the financial statements and financial highlights present fairly, in all material respects, the financial position of each of the funds listed above constituting the Financial Investors Trust as of April 30, 2018, and the results of their operations for the year then ended, the changes in their net assets for each of the two years in the period then ended, and the financial highlights for each of the five years in the period then ended (or for the period listed in the table below) in conformity with accounting principles generally accepted in the United States of America.
Individual Fund Comprising
the Financial Investors Trust | Statement of
Operations | Statements of Changes
in Net Assets | Financial Highlights |
| Grandeur Peak Emerging Markets Opportunities Fund | For the year ended April 30, 2018 | For the years ended April 30, 2018 and 2017 | For each of the four years in the period ended April 30, 2018, and for the period December 16, 2013 (commencement of investment operations) to April 30, 2014 |
| Grandeur Peak Global Micro Cap Fund | For the year ended April 30, 2018 | For the years ended April 30, 2018 and 2017 | For each of the two years in the period ended April 30, 2018, and for the period October 21, 2015 (commencement of investment operations) to April 30, 2016 |
| Grandeur Peak Global Reach Fund | For the year ended April 30, 2018 | For the years ended April 30, 2018 and 2017 | For each of the four years in the period ended April 30, 2018, and for the period June 19, 2013 (commencement of investment operations) to April 30, 2014 |
| Grandeur Peak Global Stalwarts Fund | For the year ended April 30, 2018 | For the years ended April 30, 2018 and 2017 | For each of the two years in the period ended April 30, 2018, and for the period September 2, 2015 (commencement of investment operations) to April 30, 2016 |
| Grandeur Peak International Stalwarts Fund | For the year ended April 30, 2018 | For the years ended April 30, 2018 and 2017 | For each of the two years in the period ended April 30, 2018, and for the period September 2, 2015 (commencement of investment operations) to April 30, 2016 |
Basis for Opinion
These financial statements and financial highlights are the responsibility of the Funds’ management. Our responsibility is to express an opinion on the Funds’ financial statements and financial highlights based on our audits. We are a public accounting firm registered with the Public Company Accounting Oversight Board (United States) (PCAOB) and are required to be independent with respect to the Funds in accordance with the U.S. federal securities laws and the applicable rules and regulations of the Securities and Exchange Commission and the PCAOB.
We conducted our audits in accordance with the standards of the PCAOB. Those standards require that we plan and perform the audit to obtain reasonable assurance about whether the financial statements and financial highlights are free of material misstatement, whether due to error or fraud. The Funds are not required to have, nor were we engaged to perform, an audit of their internal control over financial reporting. As part of our audits we are required to obtain an understanding of internal control over financial reporting but not for the purpose of expressing an opinion on the effectiveness of the Funds’ internal control over financial reporting. Accordingly, we express no such opinion.
Our audits included performing procedures to assess the risks of material misstatement of the financial statements and financial highlights, whether due to error or fraud, and performing procedures that respond to those risks. Such procedures included examining, on a test basis,
| 94 | 1.855.377.7325 | www.GrandeurPeakGlobal.com |
| Grandeur Peak Funds® | Report of Independent Registered Public Accounting Firm |
evidence regarding the amounts and disclosures in the financial statements and financial highlights. Our audits also included evaluating the accounting principles used and significant estimates made by management, as well as evaluating the overall presentation of the financial statements and financial highlights. Our procedures included confirmation of securities owned as of April 30, 2018, by correspondence with the custodian and brokers; when replies were not received from brokers, we performed other auditing procedures. We believe that our audits provide a reasonable basis for our opinion.
DELOITTE & TOUCHE LLP
Denver, Colorado
June 26, 2018
We have served as the auditor of one or more investment companies advised by Grandeur Peak Global Advisors, LLC since 2012.
| Annual Report | April 30, 2018 | 95 |
| Grandeur Peak Funds® | Additional Information |
April 30, 2018 (Unaudited)
1. FUND HOLDINGS
The Funds file their complete schedule of portfolio holdings with the Securities and Exchange Commission (the “SEC”) for the first and third quarters of each fiscal year on Form N-Q within 60 days after the end of the period. Copies of the Funds’ Form N-Q are available without charge on the SEC website at http://www.sec.gov. You may also review and copy the Form N-Q at the SEC’s Public Reference Room in Washington, DC. For more information about the operation of the Public Reference Room, please call the SEC at 1-800-SEC-0330.
2. FUND PROXY VOTING POLICIES, PROCEDURES AND SUMMARIES
The Funds’ policies and procedures used in determining how to vote proxies and information regarding how the Funds voted proxies relating to portfolio securities during the most recent prior 12-month period ending June 30 are available without charge, (1) upon request, by calling (toll-free) 855-377-PEAK(7325) and (2) on the SEC’s website at http://www.sec.gov.
3. TAX DESIGNATIONS
The Funds designate the following amounts for federal income tax purposes for the fiscal year ended April 30, 2018:
| | | Foreign
Taxes Paid | | | Foreign
Source Income | |
| Global Opportunities Fund | | $ | 724,677 | | | $ | 7,587,546 | |
| International Opportunities Fund | | $ | 1,327,659 | | | $ | 16,413,401 | |
| Global Reach Fund | | $ | 563,079 | | | $ | 5,267,551 | |
| Emerging Markets Opportunities Fund | | $ | 970,801 | | | $ | 9,645,104 | |
| Global Micro Cap Fund | | $ | 77,587 | | | $ | 812,469 | |
| Global Stalwarts Fund | | $ | 96,465 | | | $ | 1,593,156 | |
| International Stalwarts Fund | | $ | 353,092 | | | $ | 6,132,540 | |
Of the distributions paid by the Funds from ordinary income for the calendar year ended December 31, 2017, the following percentages met the requirements to be treated as qualifying for the corporate dividends received deduction and qualified dividend income:
| | Dividend
Received
Deduction | Qualified
Dividend
Income |
| Global Opportunities Fund | 91.86% | 100.00% |
| International Opportunities Fund | 3.77% | 100.00% |
| Global Reach Fund | 100.00% | 100.00% |
| Emerging Markets Opportunities Fund | 15.19% | 100.00% |
| Global Micro Cap Fund | 4.58% | 63.59% |
| Global Stalwarts Fund | – | – |
| International Stalwarts Fund | 13.22% | 100.00% |
In early 2018, if applicable, shareholders of record received this information for the distributions paid to them by the Funds during the calendar year 2017 via Form 1099. The Funds will notify shareholders in early 2019 of amounts paid to them by the Funds, if any, during the calendar year 2018.
Pursuant to Section 852(b)(3) of the Internal Revenue Code, the Funds designate the following as long-term capital gain dividends:
| Global Opportunities Fund | | $ | 41,054,835 | |
| International Opportunities Fund | | $ | 27,328,426 | |
| Global Reach Fund | | $ | 4,826,741 | |
| Emerging Markets Opportunities Fund | | | – | |
| Global Micro Cap Fund | | $ | 2,093,993 | |
| Global Stalwarts Fund | | $ | 2,371,669 | |
| International Stalwarts Fund | | $ | 5,564,868 | |
| 96 | 1.855.377.7325 | www.GrandeurPeakGlobal.com |
| Grandeur Peak Funds® | Additional Information |
April 30, 2018 (Unaudited)
For the fiscal year ended April 30, 2018, the following amounts were utilized as earnings and profits distributed to shareholders on redemptions:
| Global Opportunities Fund | | $ | 1,477,087 | |
| International Opportunities Fund | | $ | 275,366 | |
| Global Reach Fund | | $ | 190,703 | |
| Emerging Markets Opportunities Fund | | | – | |
| Global Micro Cap Fund | | $ | 39,324 | |
| Global Stalwarts Fund | | $ | 154,836 | |
| International Stalwarts Fund | | $ | 516,022 | |
| Annual Report | April 30, 2018 | 97 |
| Grandeur Peak Funds® | Trustees and Officers |
April 30, 2018 (Unaudited)
Additional information regarding the Fund’s trustees is included in the Statement of Additional Information, which can be obtained without charge by calling 855-377-7325.
INDEPENDENT TRUSTEES
Name,
Address*
& Year
of Birth | Position(s)
Held with Fund | Term of Office**
and Length of
Time Served | Principal Occupation(s)
During Past 5 Years*** | Number of
Funds in
Fund
Complex
Overseen by
Trustee**** | Other Directorships Held
by Trustee During Past 5 Years*** |
| Mary K. Anstine, 1940 | Trustee and Chairman | Ms. Anstine was elected at a special meeting of shareholders held on March 21, 1997 and re-elected at a special meeting of shareholders held on August 7, 2009. Ms. Anstine was appointed Chairman of the Board at the June 6, 2017 meeting of the Board of Trustees. | Ms. Anstine was formerly an Executive Vice President of First Interstate Bank of Denver until 1994, President/Chief Executive Officer of HealthONE Alliance, Denver, Colorado, from 1994 to 2004, and has been retired since 2004. Ms. Anstine is also Trustee/Director of AV Hunter Trust and Colorado Uplift Board. Ms. Anstine was formerly a Director of the Trust Bank of Colorado (later purchased and now known as Northern Trust Bank), HealthONE and Denver Area Council of the Boy Scouts of America, and a member of the American Bankers Association Trust Executive Committee. | 32 | Ms. Anstine is a Trustee of ALPS ETF Trust (21 funds); ALPS Variable Investment Trust (9 funds); Reaves Utility Income Fund (1 fund); and Westcore Trust (14 funds). |
| Jeremy W. Deems, 1976 | Trustee | Mr. Deems was appointed as a Trustee at the March 11, 2008 meeting of the Board of Trustees and elected at a special meeting of shareholders held on August 7, 2009. | Mr. Deems is the Co-Founder, Chief Operations Officer and Chief Financial Officer of Green Alpha Advisors, LLC, a registered investment advisor, and Co-Portfolio Manager of the Shelton Green Alpha Fund. Prior to joining Green Alpha Advisors, Mr. Deems was CFO and Treasurer of Forward Management, LLC, ReFlow Management Co., LLC, ReFlow Fund, LLC, a private investment fund, and Sutton Place Management, LLC, an administrative services company, from 1998 to June 2007. From 2004 to 2005, Mr Deems also served as Treasurer of the Forward Funds and the Sierra Club Funds. | 32 | Mr. Deems is a Trustee of ALPS ETF Trust (21 funds); ALPS Variable Investment Trust (9 funds); Clough Funds Trust (1 fund); and Reaves Utility Income Fund (1 fund). |
| 98 | 1.855.377.7325 | www.GrandeurPeakGlobal.com |
| Grandeur Peak Funds® | Trustees and Officers |
April 30, 2018 (Unaudited)
INDEPENDENT TRUSTEES
Name,
Address*
& Year
of Birth | Position(s)
Held with Fund | Term of Office**
and Length of
Time Served | Principal Occupation(s)
During Past 5 Years*** | Number of
Funds in
Fund
Complex
Overseen by
Trustee**** | Other Directorships
Held by Trustee During Past 5 Years*** |
| Jerry G. Rutledge, 1944 | Trustee | Mr. Rutledge was elected at a special meeting of shareholders held on August 7, 2009. | Mr. Rutledge is the President and owner of Rutledge’s Inc., a retail clothing business. He served as Director of University of Colorado Hospital from 2008 to 2016. He was from 1994 to 2007 a Regent of the University of Colorado. | 32 | Mr. Rutledge is a Trustee of Principal Real Estate Fund (1 fund), Clough Global Dividend and Income Fund (1 fund), Clough Global Equity Fund (1 fund) and Clough Global Opportunities Fund (1 fund). |
| Michael “Ross” Shell, 1970 | Trustee | Mr. Shell was elected at a special meeting of shareholders held on August 7, 2009. | Mr. Shell is Founder and CEO of Red Idea, LLC, a strategic consulting/early stage venture firm (since June 2008). From 1999 to 2009, he was a part-owner and Director of Tesser, Inc., a brand agency. From December 2005 to May 2008, he was Director, Marketing and Investor Relations, of Woodbourne, a REIT/real estate hedge fund and private equity firm. Prior to this, from May 2004 to November 2005, he worked as a business strategy consultant; from June 2003 to April 2004, he was on the Global Client Services team of IDEO, a product design/innovation firm; and from 1999 to 2003, he was President of Tesser, Inc. Mr. Shell graduated with honors from Stanford University with a degree in Political Science. | 32 | None. |
| Annual Report | April 30, 2018 | 99 |
| Grandeur Peak Funds® | Trustees and Officers |
April 30, 2018 (Unaudited)
INTERESTED TRUSTEE
Name,
Address*
& Year
of Birth | Position(s)
Held with Fund | Term of Office**
and Length of
Time Served | Principal Occupation(s)
During Past 5 Years*** | Number of
Funds in
Fund
Complex
Overseen by
Trustee**** | Other Directorships Held
by Trustee During Past 5 Years*** |
| Edmund J. Burke, 1961 | Trustee and President | Mr. Burke was elected as Trustee at a special meeting of shareholders held on August 7, 2009. Mr. Burke was elected President of the Trust at the December 17, 2002 meeting of the Board of Trustees. | Mr. Burke is President and a Director of ALPS Holdings, Inc. (“AHI”) and ALPS Advisors, Inc. (“AAI”), and Director of Boston Financial Data Services, Inc. (“BFDS”), ALPS Distributors, Inc. (“ADI”), ALPS Fund Services, Inc. (“AFS”) and ALPS Portfolio Solutions Distributor, Inc. (“APSD”). Because of his positions with AHI, BFDS, AAI, ADI, AFS and APSD, Mr. Burke is deemed an affiliate of the Trust as defined under the 1940 Act. | 32 | Mr. Burke is a Trustee of Clough Global Dividend and Income Fund (1 fund); Clough Global Equity Fund (1 fund); Clough Global Opportunities Fund (1 fund); Clough Funds Trust (1 fund); Liberty All-Star Equity Fund (1 fund); Director of the Liberty All-Star Growth Fund, Inc. (1 fund); Trustee of ALPS ETF Trust (21 funds). |
| 100 | 1.855.377.7325 | www.GrandeurPeakGlobal.com |
| Grandeur Peak Funds® | Trustees and Officers |
April 30, 2018 (Unaudited)
OFFICERS
Name, Address*
& Year of Birth | Position(s) Held with Fund | Term of Office**
and Length of Time Served | Principal Occupation(s) During Past 5 Years*** |
| Kimberly R. Storms, 1972 | Treasurer | Ms. Storms was elected Treasurer of the Trust at the March 12, 2013 meeting of the Board of Trustees. | Ms. Storms is Senior Vice President - Director of Fund Administration of ALPS. Because of her position with ALPS, Ms. Storms is deemed an affiliate of the Trust as defined under the 1940 Act. Ms. Storms is also Treasurer of Liberty All-Star Equity Fund, Liberty All-Star Growth Fund, Inc., ALPS Series Trust and Elevation ETF Trust. Ms. Storms also serves as a Board member and Treasurer of The Center for Trauma & Resilience, a nonprofit agency. |
| Karen S. Gilomen, 1970 | Secretary | Ms. Gilomen was elected Secretary of the Trust at the December 13, 2016 meeting of the Board of Trustees. | Ms. Gilomen joined ALPS in August 2016 as Vice President and Senior Counsel. Prior to joining ALPS, Ms. Gilomen was Vice President - General Counsel & CCO of Monticello Associates, Inc. from 2010 to 2016. Because of her position with ALPS, Ms. Gilomen is deemed an affiliate of the Trust, as defined under the 1940 Act. Ms. Gilomen is also the Secretary of Clough Funds Trust, Clough Global Dividend and Income Fund, Clough Global Equity Fund, Clough Global Opportunities Fund, Reaves Utility Income Fund, and the Assistant Secretary of the WesMark Funds. |
| Ted Uhl, 1974 | Chief Compliance Officer (“CCO”) | Mr. Uhl was appointed CCO of the Trust at the June 8, 2010 meeting of the Board of Trustees. | Mr. Uhl joined ALPS in October 2006, and is currently Deputy Compliance Officer of ALPS. Prior to his current role, Mr. Uhl served as Senior Risk Manager for ALPS from October 2006 until June 2010. Before joining ALPS, Mr. Uhl served a Sr. Analyst with Enenbach and Associates (RIA), and a Sr. Financial Analyst at Sprint. Because of his position with ALPS, Mr. Uhl is deemed an affiliate of the Trust as defined under the 1940 Act. Mr. Uhl is also CCO of the Boulder Growth & Income Fund, Inc., Centre Funds, Elevation ETF Trust, Index Funds, Reality Shares ETF Trust and Reaves Utility Income Fund. |
| Jennell Panella, 1974 | Assistant Treasurer | Ms. Panella was elected Assistant Treasurer of the Trust at the September 15, 2015 meeting of the Board of Trustees. | Ms. Panella joined ALPS in June 2012 and is currently Fund Controller of ALPS Fund Services, Inc. Prior to joining ALPS, Ms. Panella served as Financial Reporting Manager for Parker Global Strategies, LLC (2009-2012). Because of her position with ALPS, Ms. Panella is deemed an affiliate of the Trust as defined under the 1940 Act. Ms. Panella also serves as Assistant Treasurer of James Advantage Funds. |
| Alan Gattis, 1980 | Assistant Treasurer | Mr. Gattis was elected Assistant Treasurer of the Trust at the September 13, 2016 meeting of the Board of Trustees. | Mr. Gattis joined ALPS in 2011 and is currently Vice President and Fund Controller of ALPS. Prior to joining ALPS, Mr. Gattis was an Auditor at Spicer Jeffries LLP (2009 through 2011) and an Auditor at PricewaterhouseCoopers LLP (2004 - 2009). Because of his position with ALPS, Mr. Gattis is deemed an affiliate of the Trust as defined under the 1940 Act. Mr. Gattis is also Assistant Treasurer of ALPS Series Trust and Elevation ETF Trust. |
| Annual Report | April 30, 2018 | 101 |
| Grandeur Peak Funds® | Trustees and Officers |
April 30, 2018 (Unaudited)
OFFICERS
Name, Address*
& Year of Birth | Position(s) Held with Fund | Term of Office**
and Length of Time Served | Principal Occupation(s) During Past 5 Years*** |
| Sharon Akselrod, 1974 | Assistant Secretary | Ms. Akselrod was elected Assistant Secretary of the Trust at the September 15, 2015 meeting of the Board of Trustees. | Ms. Akselrod joined ALPS in August 2014 and is currently Senior Investment Company Act Paralegal of ALPS Fund Services, Inc. Prior to joining ALPS, Ms. Akselrod served as Corporate Governance and Regulatory Associate for Nordstrom fsb (2013-2014) and Senior Legal Assistant – Legal Manager for AXA Equitable Life Insurance Company (2008-2013). Because of her position with ALPS, Ms. Akselrod is deemed an affiliate of the Trust as defined under the 1940 Act. Ms. Akselrod is also Assistant Secretary of ALPS ETF Trust and Principal Real Estate Fund. |
| Jennifer Craig 1973 | Assistant Secretary | Ms. Craig was elected Assistant Secretary of the Trust at the June 8, 2016 meeting of the Board of Trustees. | Ms. Craig joined ALPS in 2007 and is currently Assistant Vice President and Paralegal Manager of ALPS. Prior to joining ALPS, Ms. Craig was Legal Manager at Janus Capital Management LLC and served as Assistant Secretary of Janus Investment Fund, Janus Adviser Series and Janus Aspen Series. Because of her position with ALPS, Ms. Craig is deemed an affiliate of the Trust as defined under the 1940 Act. Ms. Craig is also Assistant Secretary of Clough Global Dividend and Income Fund, Clough Global Equity Fund, Clough Global Opportunities Fund, Clough Funds Trust, Liberty All-Star Equity Fund, Liberty All-Star Growth Fund, Inc. and ALPS Series Trust. |
| Sareena Khwaja-Dixon, 1980 | Assistant Secretary | Ms. Khwaja-Dixon was elected Assistant Secretary of the Trust at the December 12, 2017 meeting of the Board of Trustees. | Ms. Khwaja-Dixon joined ALPS in August 2015 and is currently Senior Counsel and Vice President of ALPS Fund Services, Inc. Prior to joining ALPS, Ms. Khwaja-Dixon served as a Senior Paralegal/Paralegal for Russell Investments (2011 – 2015). Ms. Khwaja-Dixon is also Secretary of Liberty All-Star Equity Fund and Liberty All-Star Growth Fund, Inc., and Assistant Secretary of Clough Funds Trust, Clough Dividend and Income Fund, Clough Global Opportunities Fund, and Clough Global Equity Fund. |
| * | All communications to Trustees and Officers may be directed to Financial Investors Trust c/o 1290 Broadway, Suite 1100, Denver, CO 80203. |
| ** | This is the period for which the Trustee or Officer began serving the Trust. Each Trustee and/or Officer serves an indefinite term, until his successor is elected. Officers are elected on an annual basis. |
| *** | Except as otherwise indicated, each individual has held the office shown or other offices in the same company for the last five years. |
| **** | The Fund Complex includes all series of the Trust (currently 32) and any other investment companies for which Grandeur Peak Global Advisors LLC provides investment advisory services (currently none). |
| 102 | 1.855.377.7325 | www.GrandeurPeakGlobal.com |
| Grandeur Peak Funds® | Privacy Policy |
April 30, 2018 (Unaudited)
| Who We Are | |
| Who is providing this notice? | Grandeur Peak Global Opportunities Fund, Grandeur Peak International Opportunities Fund, Grandeur Peak Global Reach Fund, Grandeur Peak Emerging Markets Opportunities Fund, Grandeur Peak Global Micro Cap Fund, Grandeur Peak Global Stalwarts Fund, and Grandeur Peak International Stalwarts Fund. |
| What We Do | |
| How do the Funds protect my personal information? | To protect your personal information from unauthorized access and use, we use security measures that comply with federal law. These measures include computer safeguards and secured files and buildings. |
| How do the Funds collect my personal information? | We collect your personal information, for example, when you ● open an account ● provide account information or give us your contact information ● make a wire transfer or deposit money |
| Why can't I limit all sharing? | Federal law gives you the right to limit only ● sharing for affiliates’ everyday business purposes-information about your creditworthiness ● affiliates from using your information to market to you ● sharing for non-affiliates to market to you State laws and individual companies may give you additional rights to limit sharing. |
| Definitions | |
| Affiliates | Companies related by common ownership or control. They can be financial and nonfinancial companies. |
| Non-affiliates | Companies not related by common ownership or control. They can be financial and nonfinancial companies. ● The Funds does not share with non-affiliates so they can market to you. |
| Joint marketing | A formal agreement between non-affiliated financial companies that together market financial products or services to you. ● The Funds does not jointly market. |
| Other Important Information | |
| California Residents | If your account has a California home address, your personal information will not be disclosed to nonaffiliated third parties except as permitted by applicable California law, and we will limit sharing such personal information with our affiliates to comply with California privacy laws that apply to us. |
| Vermont Residents | The State of Vermont requires financial institutions to obtain your consent prior to sharing personal information that they collect about you with affiliated companies and nonaffiliated third parties other than in certain limited circumstances. Except as permitted by law, we will not share personal information we collect about you with nonaffiliated third parties or other affiliated companies unless you provide us with your written consent to share such information. |
| Annual Report | April 30, 2018 | 103 |
| Grandeur Peak Funds® | Privacy Policy |
April 30, 2018 (Unaudited)
| FACTS | WHAT DO THE FUNDS DO WITH YOUR PERSONAL INFORMATION? |
| Why? | Financial companies choose how they share your personal information. Federal law gives consumers the right to limit some but not all sharing. Federal law also requires us to tell you how we collect, share, and protect your personal information. Please read this notice carefully to understand what we do. |
| What? | The types of personal information we collect and share depend on the product or service you have with us. This information can include: ● Social Security number and account transactions ● Account balances and transaction history ● Wire transfer instructions |
| How? | All financial companies need to share customers’ personal information to run their everyday business. In the section below, we list the reasons financial companies can share their customers’ personal information; the reasons the Funds choose to share; and whether you can limit this sharing. |
| Reasons we can share your personal information | Do the Funds share: | Can you limit this sharing? |
| For our everyday business purposes — such as to process your transactions, maintain your account(s), respond to court orders and legal investigations, or report to credit bureaus | Yes | No |
| For our marketing purposes — to offer our products and services to you | No | We do not share. |
| For joint marketing with other financial companies | No | We do not share. |
| For our affiliates’ everyday business purposes — information about your transactions and experiences | Yes | No |
| For our affiliates’ everyday business purposes — information about your creditworthiness | No | We do not share. |
| For nonaffiliates to market to you | No | We do not share. |
| 104 | 1.855.377.7325 | www.GrandeurPeakGlobal.com |

| Contact Us |
| Mail: | Grandeur Peak Funds, P.O. Box 13664, Denver, CO 80201 | E-Mail: | grandeurpeakglobal@alpsinc.com |
| Phone: | 1.855.377.PEAK (7325) | Web: | www.GrandeurPeakGlobal.com |
ANNUAL April 30, 2018
Highland Resolute Fund
Class I RMRGX
| Highland Resolute Fund | Table of Contents |
| | PAGE |
| Shareholder Letter | 2 |
| Performance Update | 7 |
| Consolidated Disclosure of Fund Expenses | 9 |
| Consolidated Schedule of Investments | 10 |
| Consolidated Statement of Assets and Liabilities | 26 |
| Consolidated Statement of Operations | 27 |
| Consolidated Statements of Changes in Net Assets | 28 |
| Consolidated Financial Highlights | 29 |
| Notes to Consolidated Financial Statements | 30 |
| Report of Independent Registered Accounting Firm | 41 |
| Disclosure Regarding Approval of Fund Advisory Agreements | 42 |
| Additional Information | 45 |
| Trustees & Officers | 46 |
| Privacy Policy | 51 |
| Highland Resolute Fund | Shareholder Letter |
April 30, 2018 (Unaudited)
PERFORMANCE:
April 30, 2018
The Highland Resolute Fund outperformed the HFRX Global Hedge Fund Index(1) by over 250 basis points(2) over the twelve months ending April 30, 2018. The Fund historically has strong up market capture with down market capture in line with the index. Since inception, the Fund has outperformed the HFRX Global Hedge Fund Index by over 200 basis points annualized. This is due primarily to a higher level of net equity exposure than the benchmark to be able to keep up with strong equity markets.
When compared to the peer group (Morningstar Multi-Alternative Universe)(3), the Fund has outperformed the Universe over all time periods - by about 290 basis points during the past twelve months and 240 basis points annualized since inception. As with the HFRX Global Hedge Fund Index, the Universe is very diverse and contains a number of market-neutral and other low net equity strategies that cause the average net equity exposure for the Universe to be considerably less than our Fund. So, we anticipate outperforming the Universe in up markets and underperforming in down markets - recent performance has been consistent with our expectations.
Long/Short Managers - Long/Short equity managers outperformed the HFRX Equity Hedge Index(4) in a period of steady growth and low volatility in global equities, until the most recent quarter where volatility increased materially.
Macro - The sole Macro manager has materially outperformed the HFRX Macro Index(5) over the last 12 months. Equity and commodity positions were accretive in 2017, and short positions in fixed income and short-term rates added value during the past quarter. The systematic macro fund strives to take advantage of relative value differentials globally. This sector is a small allocation and is held as a risk-off return contributor.
Credit/GTAA - Chatham materially outperformed the HFRX Fixed Income - Credit Index(6) over the past 12 months. Option hedges were accretive during the increased volatility in the quarter.
Relative Value - The Relative Value sleeve outperformed the HFRX Relative Value Arbitrage Index(7) over the past 12 months. Material outperformance from WABR was only slightly offset by negative absolute returns from Clinton.
Event Driven - The Event Driven sleeve significantly outperformed the HFRX Event Driven Index(8), as it generated positive absolute returns compared to negative for that of the index. PSAM has been the best performer in the sleeve with merger arbitrage and special situations being responsible for most of its gains. AQR struggled during the 1st quarter and offset some of the outperformance.
Past performance is no guarantee of future results.
| Highland Resolute Fund | Shareholder Letter |
April 30, 2018 (Unaudited)
HIGHLAND RESOLUTE FUND
Table 1 notes the performance for the Fund as of quarter end under standard reporting (since inception) as well as of April 30th.
Table 1 (1)(3)(9)(10)
Performance (amounts greater than one year are annualized)
| | Standardized Performance Data
as of March 31, 2018 | Non-Standardized Performance Data
as of April 30, 2018 |
| | YTD | 1-Year | 3-Year | 5-Year | Since Inception (12/30/11) | YTD | 1-Year | 3-Year | 5-Year | Since Inception (12/30/11) |
| Highland Resolute Fund - Class I NAV | 0.09% | 5.90% | 2.91% | 3.49% | 4.28% | -0.28% | 5.51% | 2.78% | 3.07% | 4.16% |
| Morningstar Multi- Alternative Universe | -1.04% | 2.84% | 0.16% | 1.16% | 1.74% | -0.96% | 2.60% | 0.22% | 1.11% | 1.73% |
| HFRX Global Hedge Fund Index | -1.02% | 3.20% | 0.51% | 1.29% | 2.09% | -0.92% | 2.86% | 0.47% | 1.18% | 2.08% |
| S&P 500® Index | -0.76% | 13.99% | 10.78% | 13.31% | 15.01% | -0.38% | 13.27% | 10.57% | 12.96% | 14.86% |
| | Gross Expense
Ratio | Less Expense
Waivers | Net Expense Ratio | Net Ratio ex Dividend & Short Expense |
| Highland Resolute Fund - Class I NAV | 2.33% | -1.25% | 1.08% | 1.00% |
Performance data quoted represents past performance. Past performance does not guarantee future results. Investment return and principal value of an investment will fluctuate so that an investor’s shares, when sold or redeemed, may be worth more or less than the original cost. Current performance data may be higher or lower than actual data quoted. For the most current month-end performance data please call 1-855-268-2242.
The Fund has a redemption fee of 2.00% for shares redeemed within the first 90 days of purchase. Performance shown at NAV does not include these sales charges and would have been lower had it been taken into account.
The Adviser has agreed to waive the portion of its 1.50% Management Fee in excess of any sub-advisory fees paid by the Adviser to sub-advisors in connection with the Fund (“Sub-Advisory Fees”). This agreement (the “Expense Agreement”) is in effect through August 31, 2018. The Adviser may not discontinue this agreement to waive fees prior to August 31, 2018 without the approval by the Fund’s Board of Trustees.
Net Ratio ex Dividend & Short Expense is the Net Expense Ratio less any Dividend and Interest Expense on Securities Sold Short.
Portfolio Changes:
There was one change in the Long/Short Equity bucket. Boston Partners was terminated as a sub-advisor and liquidated at the end of 2017. The three remaining strategies in the bucket were re-weighted to maintain the same target weight for Long/Short Equity in the fund.
Closing:
We continue to add value both in our allocation and manager selection decisions. The changes outlined above should continue to provide additional value going forward. We appreciate your investment in our Highland Resolute Fund, please feel free to contact us with any questions.
Sincerely,

R. Scott Graham, CFA & Michael T. Lytle, CFA
Highland Associates, Inc.
Portfolio Managers(11)
| Annual Report | April 30, 2018 | 3 |
| Highland Resolute Fund | Shareholder Letter |
April 30, 2018 (Unaudited)
Underlying Allocation Weights:
Figure 1 lists the long-term target asset allocation for the Fund as well as the allocation as of April 30, 2018.
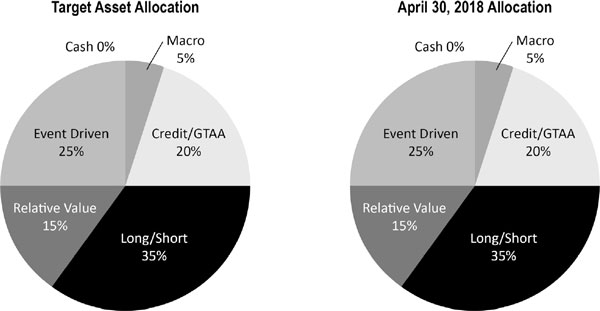
Holdings and allocations subject to change and may not reflect the current or future position of the portfolio.
| Highland Resolute Fund | Shareholder Letter |
April 30, 2018 (Unaudited)
IMPORTANT NOTES AND DISCLOSURES
Past performance does not guarantee future results.
Fund prices fluctuate as the underlying assets have exposure to market fluctuations and other risks, as described in the Fund’s prospectus. Please call 1-855-268-2242 to obtain current performance information and for the current prospectus and statement of additional information. This material must be preceded or accompanied by a prospectus. Please read the prospectus carefully before investing.
The views of Highland Associates, Inc. and the information discussed in this commentary are as of the date of publication, are subject to change, and may not reflect the writers’ current views. The views expressed are those of the Fund’s adviser only, and represent an assessment of market conditions at a specific point in time, are opinions only and should not be relied upon as investment advice regarding a particular investment or markets in general. Such information does not constitute a recommendation to buy or sell specific securities or investment vehicles. It should not be assumed that any investment will be profitable or will equal the performance of the portfolios or any securities or any sectors mentioned in this letter. The subject matter contained in this letter has been derived from several sources believed to be reliable and accurate at the time of compilation. Neither Highland Associates, Inc. nor the Fund accepts any liability for losses either direct or consequential caused by the use of this information.
The Highland Resolute Fund is distributed by ALPS Distributors, Inc.
The Fund is subject to investment risks, including possible loss of the principal amount invested and therefore is not suitable for all investors. The Fund may not achieve its objectives.
Diversification does not eliminate the risk of experiencing investment losses.
RISKS:
The Fund’s strategy may expose it to the risks of investments in Swap Contracts and Other Investment Companies. These risks include, but are not limited to higher expenses, allocation risk, underlying fund risk, transparency risk, and underlying fund managed portfolio risk. Investments which focus on alternative strategies are subject to increased risk and loss of principal and are not suitable for all investors. Swap Risk involves swap agreements and are subject to counterparty default risk and may not perform as intended. Derivatives Risk involves the exercise of skill and judgment. Derivatives may expire worthless or not perform as expected. Equity risk may cause the value of the securities held by the Fund to fall due to general market and economic conditions, perceptions regarding the industries in which the issuers of securities held by the Fund participate, or factors relating to specific companies in which the Fund invest.
The Fund’s investments in non-U.S. issuers may be even more volatile and may present more risks than investments in U.S. issuers.
Commodity Risk may subject the Funds to greater volatility than traditional investments because of global supply and demand, changes in interest rates, commodity index volatility, and factors affecting a particular industry or commodity. Commodity-linked investments may not move in the same direction and to the same extent as the underlying commodities.
| (1) | The HFRX Global Hedge Fund Index is designed to be representative of the overall composition of the hedge fund universe, and includes convertible arbitrage, distressed securities, equity hedge, equity market neutral, event driven, macro, merger arbitrage, and relative value strategies. The index returns are updated periodically and are subject to change. The returns were accurate as of the date of this publication. Investors cannot invest directly in an index. |
| (2) | Basis point is a common unit of measure for interest rates and other percentages in finance. One basis point is equal to 1/100th of 1% or 0.01%(.0001). |
| (3) | The Morningstar Multi-Alternative Universe is designed to represent the exposure to alternative investment tactics. Funds in this category have the majority of their assets exposed to alternative strategies. An investor’s exposure to different tactics may change slightly over time in response to market movements. Funds in this category include both funds with static allocations to alternative strategies and funds tactically allocating among alternative strategies and asset classes. The gross short exposure is greater than 20%. |
| (4) | The HFRX Equity Hedge Index is designed to be representative of a subset of the overall composition of the hedge fund universe. Equity Hedge strategies maintain positions both long and short in primarily equity and equity derivative securities. The index returns are updated periodically and are subject to change. The returns were accurate as of the date of this publication. The index figures do not reflect any fees, expense, or taxes. Investors cannot invest directly in an index. |
| (5) | The HFRX Macro Index is designed to be representative of a subset of the overall composition of the hedge fund universe. Macro strategy managers trade a broad range of strategies in which the investment process is predicated on movements in underlying economic variables and the impact these have on equity, fixed income, hard currency and commodity markets. Managers employ a variety of techniques, both discretionary and systematic analysis, combinations of top down and bottom up theses, quantitative and fundamental approaches and long and short-term holding periods. The index returns are updated periodically and are subject to change. The returns were accurate as of the date of this publication. The index figures do not reflect any fees, expense, or taxes. Investors cannot invest directly in an index. |
| (6) | The HFRX Fixed Income - Credit Index is designed to be representative of a subset of the overall composition of the hedge fund universe. It includes strategies with exposure to credit across a broad continuum of credit sub-strategies, including Corporate, Sovereign, Distressed, |
| Annual Report | April 30, 2018 | 5 |
| Highland Resolute Fund | Shareholder Letter |
April 30, 2018 (Unaudited)
Convertible, Asset Backed, Capital Structure Arbitrage, Multi-Strategy and other Relative Value and Event Driven sub-strategies. The index returns are updated periodically and are subject to change. The returns were accurate as of the date of this publication. The index figures do not reflect any fees, expense, or taxes. Investors cannot invest directly in an index.
| (7) | The HFRX Relative Value Arbitrage Index is designed to be representative of a subset of the overall composition of the hedge fund universe. Relative Value investment managers who maintain positions in which the investment thesis is predicated on realization of a valuation discrepancy in the relationship between multiple securities. Managers employ a variety of fundamental and quantitative techniques to establish investment theses, and security types range broadly across equity, fixed income, derivative or other security types. The index returns are updated periodically and are subject to change. The returns were accurate as of the date of this publication. The index figures do not reflect any fees, expense, or taxes. Investors cannot invest directly in an index. |
| (8) | The HFRX Event Driven Index maintains positions in companies currently or prospectively involved in corporate transactions of a wide variety including but not limited to mergers, restructurings, financial distress, tender offers, shareholder buybacks, debt exchanges, security issuance or other capital structure adjustments. Security types can range from most senior in the capital structure to most junior or subordinated, and frequently involve additional derivative securities. Event Driven exposure includes a combination of sensitivities to equity markets, credit markets and idiosyncratic, company specific developments. The index returns are updated periodically and are subject to change. The returns were accurate as of the date of this publication. The index figures do not reflect any fees, expense, or taxes. Investors cannot invest directly in an index. |
| (9) | The S&P 500® Index is an unmanaged index of 500 common stocks chosen for market size, liquidity, and industry group representation. It is a market value weighted index. The S&P 500® Index figures do not reflect any fees, expenses, or taxes. Investors cannot invest directly in this index. |
| (10) | Highland Associates, Inc. has agreed to waive the portion of its 1.50% Management Fee in excess of any sub-advisory fees paid by the Adviser to sub-advisors in connection with the Redmont Resolute Fund. This agreement is in effect through August 31, 2018. The Adviser may not discontinue this agreement to waive fees without the approval by the Fund’s Board of Trustees. |
| (11) | R. Scott Graham and Michael T. Lytle are registered representatives of ALPS Distributors, Inc. CFA Institute Marks are trademarks owned by the CFA Institute. |
| Highland Resolute Fund | Performance Update |
April 30, 2018 (Unaudited)
Performance (for the period ended April 30, 2018)
Highland Resolute Fund
| Cumulative Total Return | | | | | | |
| (for the period ended April 30, 2018) | 1 Year | 3 Year | 5 Year | Since Inception* | Gross Ratio(a) | Net Ratio(a) |
| Highland Resolute Fund - Class I - NAV | 5.51% | 2.78% | 3.07% | 4.16% | 2.33% | 1.08% |
| S&P 500® Index | 13.27% | 10.57% | 12.96% | 14.86% | | |
| Dow Jones U.S. Select Dividend Index | 9.09% | 11.14% | 12.01% | 13.70% | | |
| HFRX Global Hedge Fund Index | 2.86% | 0.47% | 1.18% | 2.08% | | |
Performance data quoted represents past performance. Past performance does not guarantee future results. Investment return and principal value of an investment will fluctuate so that an investor’s shares, when sold or redeemed, may be worth more or less than the original cost. Current performance data may be higher or lower than actual data quoted. For the most current month-end performance data please call 1-855-268-2242.
The Fund has a redemption fee of 2.00% for shares redeemed within the first 90 days of purchase. Performance shown at NAV does not include these sales charges and would have been lower had it been taken into account.
The Adviser has agreed to waive the portion of its 1.50% Management Fee in excess of any sub-advisory fees paid by the Adviser to sub-advisors in connection with the Fund (“Sub-Advisory Fees”). This agreement (the “Expense Agreement”) is in effect through August 31, 2018. The Adviser may not discontinue this agreement to waive fees prior to August 31, 2018 without the approval by the Fund’s Board of Trustees.
| * | Fund inception date of 12/30/11. |
| (a) | Ratios as of the Prospectus dated August 31, 2017 and may differ from the ratios presented in the Financial Highlights. |
| (b) | The S&P 500® Index is the Standard & Poor's composite index of 500 stocks, a widely recognized, unmanaged index of common stock prices. The index is not actively managed and does not reflect any deduction of fees, expenses or taxes. An investor may not invest directly in an index. |
| (c) | The Dow Jones U.S. Select Dividend Index is an additional index, and represents the country’s top stocks by dividend yield, selected annually and subject to screening and buffering criteria. The index is not actively managed and does not reflect any deductions of fees, expenses or taxes. An investor may not invest directly in an index. |
| (d) | The HFRX Global Hedge Fund Index is an additional index, and is designed to be representative of the overall composition of the hedge fund universe and includes convertible arbitrage, distressed securities, equity hedge, equity market neutral, event driven, macro, merger arbitrage and relative value strategies. The index returns are updated periodically and are subject to change. The returns were accurate as of the date of this publication. The index is not actively managed and does not reflect any deduction of fees, expenses or taxes. An investor may not invest directly in an index. |
The table does not reflect the deduction of taxes that a shareholder would pay on Fund distributions or the redemption of Fund shares.
Top Ten Holdings**
(for the period ended April 30, 2018)
| As a percentage of Net Assets | |
| PIMCO Short-Term Fund, Institutional Class | 29.22% |
| AQR Multi Strategy Alternative Fund, Class I | 10.55% |
| American Media, Inc. | 2.84% |
| Harland Clarke Holdings Corp. | 2.43% |
| Resolute Forest Products, Inc. | 2.22% |
| RR Donnelley & Sons Co. | 1.68% |
| One Call Corp. | 1.24% |
| Mohegan Tribal Gaming | 0.98% |
| McClatchy Co. | 0.79% |
| One Call Corp. | 0.76% |
| Top Ten Holdings | |
| ** | Holdings are subject to change, and may not reflect the current or future position of the portfolio. |
| Annual Report | April 30, 2018 | 7 |
| Highland Resolute Fund | Performance Update |
April 30, 2018 (Unaudited)
Performance of $10,000 Initial Investment (for the period ended April 30, 2018)
Comparison of change in value of a $10,000 investment
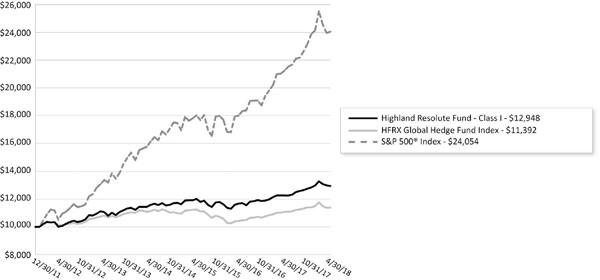
The chart represents historical performance of a hypothetical investment of $10,000 in the Fund since inception. Past performance does not guarantee future results. This chart does not reflect the deduction of taxes that a shareholder would pay on Fund distributions or the redemption of Fund shares.
Investing in the Fund is subject to investment risks, including possible loss of the principal amount invested.
| Highland Resolute Fund | Consolidated Disclosure of Fund Expenses |
April 30, 2018 (Unaudited)
As a shareholder of the Fund, you incur two types of costs: (1) transaction costs, including applicable sales charges (loads), redemption fees; and (2) ongoing costs, including management fees, distribution and service (12b-1) fees, shareholder services fees and other Fund operating expenses. This example is intended to help you understand your ongoing costs (in dollars) of investing in the Fund and to compare these costs with the ongoing costs of investing in other mutual funds.
This example is based on an investment of $1,000 invested at the beginning of the period and held for the six-month period of November 1, 2017 to April 30, 2018.
Actual Expenses. The first line of the table below provides information about actual account values and actual expenses. You may use the information in this line, together with the amount you invested to estimate the expenses that you paid over the period. Simply divide your account value by $1,000 (for example, an $8,600 account value divided by $1,000 = 8.6), then multiply the result by the number in the first line of the table below under the heading titled “Expenses Paid During Period” to estimate the expenses you paid on your account during this period.
Hypothetical Example for Comparison Purposes. The second line of the table below provides information about hypothetical account values and hypothetical expenses based on the Fund’s actual expense ratio and an assumed rate of return of 5% per year before expenses, which is not the Fund’s actual return. The hypothetical account values and expenses may not be used to estimate the actual ending account balance or expenses you paid for the period. You may use this information to compare the ongoing costs of investing in the Fund and other mutual funds. To do so, compare this 5% hypothetical example with the 5% hypothetical examples that appear in the shareholder reports of the other funds.
Please note that the expenses shown in the table below are meant to highlight your ongoing costs only and do not reflect any transactional costs, such as applicable sales charges (loads), redemption fees, or exchange fees. Therefore, the second line of the table below is useful in comparing ongoing costs only and will not help you determine the relative total costs of owning different funds. In addition, if these transactional costs were included, your costs would have been higher.
| Highland Resolute Fund | BEGINNING
ACCOUNT VALUE
11/01/17 | ENDING
ACCOUNT VALUE
04/30/18 | EXPENSE
RATIO(a) | EXPENSES PAID,
and DURING
PERIOD
11/01/17-04/30/18(b) |
| Class I | | | | |
| Actual | $1,000.00 | $1,015.00 | 0.76% | $3.80 |
| Hypothetical (5% return before expenses) | $1,000.00 | $1,021.03 | 0.76% | $3.81 |
| (a) | Annualized, based on the Fund's most recent fiscal half year expenses. |
| (b) | Expenses are equal to the Fund's annualized expense ratio multiplied by the average account value over the period, multiplied by the number of days in the most recent fiscal half-year (181)/365 (to reflect the half-year period). |
| Annual Report | April 30, 2018 | 9 |
| Highland Resolute Fund | Consolidated Schedule of Investments |
April 30, 2018
| Description | | Shares | | | Value
(Note 2) | |
| CLOSED END FUNDS (0.48%) | | | | | | | | |
| Altaba, Inc.(a) | | | 25,516 | | | $ | 1,788,161 | |
| | | | | | | | | |
| TOTAL CLOSED END FUNDS | | | | | | | | |
| (Cost $1,554,681) | | | | | | | 1,788,161 | |
| | | | | | | | | |
| COMMON STOCKS (10.38%) | | | | | | | | |
| BUILDING MATERIALS (1.26%) | | | | | | | | |
| Fortune Brands Home & Security, Inc. | | | 49,198 | | | | 2,690,638 | |
| Masco Corp. | | | 53,071 | | | | 2,009,799 | |
| | | | | | | | 4,700,437 | |
| | | | | | | | | |
| CASINO & GAMBLING (0.61%) | | | | | | | | |
| Caesars Entertainment Corp.(a)(b) | | | 200,026 | | | | 2,270,295 | |
| | | | | | | | | |
| CHEMICALS (0.42%) | | | | | | | | |
| The Sherwin-Williams Co. | | | 4,245 | | | | 1,560,717 | |
| | | | | | | | | |
| COMMERCIAL SERVICES (0.61%) | | | | | | | | |
| S&P Global, Inc.(b) | | | 11,994 | | | | 2,262,069 | |
| | | | | | | | | |
| DISTRIBUTION/WHOLESALE (0.62%) | | | | | | | | |
| LKQ Corp.(a)(b) | | | 75,008 | | | | 2,326,748 | |
| | | | | | | | | |
| DIVERSIFIED FINANCIAL SERVICES (0.82%) | | | | | | | | |
| Cboe Global Markets, Inc. | | | 18,511 | | | | 1,976,604 | |
| Visa, Inc., Class A | | | 8,586 | | | | 1,089,392 | |
| | | | | | | | 3,065,996 | |
| | | | | | | | | |
| INTERNET (0.69%) | | | | | | | | |
| Alibaba Group Holding, Ltd., Sponsored ADR(a) | | | 2,858 | | | | 510,267 | |
| Alphabet, Inc., Class A(a)(b) | | | 2,024 | | | | 2,061,606 | |
| | | | | | | | 2,571,873 | |
| | | | | | | | | |
| MACHINERY-DIVERSIFIED (0.56%) | | | | | | | | |
| The Middleby Corp.(a)(b) | | | 16,779 | | | | 2,111,469 | |
| | | | | | | | | |
| MEDIA (0.56%) | | | | | | | | |
| Liberty Media Corp.-Liberty SiriusXM, Class C(a)(b) | | | 9,696 | | | | 403,935 | |
| Liberty Media Corp.-Liberty SiriusXM, Class A(a)(b) | | | 40,831 | | | | 1,705,511 | |
| | | | | | | | 2,109,446 | |
| | | | | | | | | |
| RESTAURANTS (0.49%) | | | | | | | | |
| Restaurant Brands International, Inc. | | | 33,962 | | | | 1,848,212 | |
| | | | | | | | | |
| RETAIL (0.93%) | | | | | | | | |
| B&M European Value Retail SA | | | 223,664 | | | | 1,247,993 | |
See Notes to Financial Statements.
| Highland Resolute Fund | Consolidated Schedule of Investments |
April 30, 2018
| Description | | Shares | | | Value
(Note 2) | |
| RETAIL (0.93%) (continued) | | | | | | | | |
| O'Reilly Automotive, Inc.(a) | | | 8,639 | | | $ | 2,212,189 | |
| | | | | | | | 3,460,182 | |
| | | | | | | | | |
| SOFTWARE (1.63%) | | | | | | | | |
| CDK Global, Inc. | | | 33,230 | | | | 2,167,925 | |
| Fidelity National Information Services, Inc. | | | 16,901 | | | | 1,605,088 | |
| SS&C Technologies Holdings, Inc.(b) | | | 46,821 | | | | 2,324,663 | |
| | | | | | | | 6,097,676 | |
| | | | | | | | | |
| SPECIALTY FINANCE (0.59%) | | | | | | | | |
| Worldpay, Inc., Class A(a) | | | 27,262 | | | | 2,214,220 | |
| | | | | | | | | |
| TEXTILES (0.59%) | | | | | | | | |
| Mohawk Industries, Inc.(a)(b) | | | 10,558 | | | | 2,215,913 | |
| | | | | | | | | |
| TOTAL COMMON STOCKS | | | | | | | | |
| (Cost $38,547,222) | | | | | | | 38,815,253 | |
| | | | | | | | | |
| OPEN-END MUTUAL FUNDS (39.77%) | | | | | | | | |
| AQR Multi Strategy Alternative Fund, Class I | | | 4,512,890 | | | | 39,442,662 | |
| PIMCO Short-Term Fund, Institutional Class(b) | | | 11,058,717 | | | | 109,260,129 | |
| | | | | | | | 148,702,791 | |
| | | | | | | | | |
| TOTAL OPEN-END MUTUAL FUNDS | | | | | | | | |
| (Cost $150,011,906) | | | | | | | 148,702,791 | |
| | | Notional Amount | | | Exercise Date | | | Exercise Price | | | Contracts | | | Value
(Note 2) | |
| PURCHASED PUT OPTIONS (0.05%) | | | | | | | | | | | | | | | | | | |
| S&P 500® Index | | $ | 28,863,745 | | | 05/31/2018 | | | $ | 2,450 | | | 109 | | | | 62,675 | |
| S&P 500® Index | | | 34,159,845 | | | 05/31/2018 | | | | 2,500 | | | 129 | | | | 115,713 | |
| | | | | | | | | | | | | | | | | | 178,388 | |
| | | | | | | | | | | | | | | | | | | |
| TOTAL PURCHASED PUT OPTIONS | | | | | | | | | | | | | | | | | | |
| (Cost $251,724) | | | | | | | | | | | | | | | | | 178,388 | |
| Description | | | Principal Amount | | | Value
(Note 2) | |
| CORPORATE BONDS (18.87%) | | | | | |
| CASINO & GAMBLING (0.41%) | | | | | | |
| Jack Ohio Finance LLC | | | | | | | | |
| 10.25%, | 11/15/2022(c) | | $ | 749,000 | | | | 822,027 | |
| Rivers Pittsburgh Borrower LP/Rivers Pittsburgh Finance Corp. | | | | | | | |
| 6.13%, | 08/15/2021(c) | | | 732,000 | | | | 708,210 | |
| | | | | | | | | 1,530,237 | |
| | | | | | | | | | |
| COMMERCIAL SERVICES (2.45%) | | | | | | | |
| Great Lakes Dredge & Dock Corp. | | | | | | | |
| 8.00%, | 05/15/2022 | | | 100,000 | | | | 102,250 | |
| iPayment, Inc. | | | | | | | | |
| 10.75%, | 04/15/2024(c) | | | 1,108,000 | | | | 1,234,645 | |
See Notes to Financial Statements.
| Annual Report | April 30, 2018 | 11 |
| Highland Resolute Fund | Consolidated Schedule of Investments |
April 30, 2018
| Description | | | Principal Amount | | | Value
(Note 2) | |
| COMMERCIAL SERVICES (2.45%) (continued) | | | | | | | |
| RR Donnelley & Sons Co. | | | | | | | | |
| 6.00%, | 04/01/2024 | | $ | 600,000 | | | $ | 590,250 | |
| 6.50%, | 11/15/2023 | | | 6,206,000 | | | | 6,294,746 | |
| 7.00%, | 02/15/2022 | | | 122,000 | | | | 127,642 | |
| 8.88%, | 04/15/2021 | | | 740,000 | | | | 793,724 | |
| | | | | | | | | 9,143,257 | |
| | | | | | | | | | |
| COMPUTERS (3.14%) | | | | | | | | |
| Everi Payments, Inc. | | | | | | | | |
| 7.50%, | 12/15/2025(c) | | | 2,499,000 | | | | 2,536,485 | |
| Harland Clarke Holdings Corp. | | | | | | | | |
| 8.38%, | 08/15/2022(c) | | | 134,000 | | | | 137,685 | |
| 9.25%, | 03/01/2021(b)(c) | | | 8,758,000 | | | | 9,075,477 | |
| | | | | | | | | 11,749,647 | |
| | | | | | | | | | |
| ENTERTAINMENT | (0.98%) | | | | | | | | |
| Mohegan Tribal Gaming | | | | | | | | |
| 7.88%, | 10/15/2024(c) | | | 3,668,000 | | | | 3,681,755 | |
| | | | | | | | | | |
| | | | | | | | | | |
| EXPLORATION & PRODUCTION (0.04%) | | | | | | | |
| Endeavor Energy Resources LP / EER Finance, Inc. | | | | | | | |
| 5.50%, | 01/30/2026(c) | | | 157,000 | | | | 158,178 | |
| | | | | | | | | | |
| | | | | | | | | | |
| FOOD (0.54%) | | | | | | | | | |
| Dean Foods Co. | | | | | | | | |
| 6.50%, | 03/15/2023(c) | | | 2,082,000 | | | | 2,001,323 | |
| | | | | | | | | | |
| | | | | | | | | | |
| FOREST PRODUCTS & PAPER (2.26%) | | | | | | | |
| Mercer International, Inc. | | | | | | | | |
| 5.50%, | 01/15/2026(c) | | | 152,000 | | | | 149,720 | |
| Resolute Forest Products, Inc. | | | | | | | | |
| 5.88%, | 05/15/2023(b) | | | 8,102,000 | | | | 8,294,422 | |
| | | | | | | | | 8,444,142 | |
| | | | | | | | | | |
| HEALTHCARE-SERVICES (2.00%) | | | | | | | |
| One Call Corp. | | | | | | | | |
| 7.50%, | 07/01/2024(c) | | | 4,676,000 | | | | 4,629,240 | |
| 10.00%, | 10/01/2024(c) | | | 3,171,000 | | | | 2,845,972 | |
| | | | | | | | | 7,475,212 | |
| | | | | | | | | | |
| MACHINERY (0.27%) | | | | | | | | |
| Navistar International Corp. | | | | | | | | |
| 6.63%, | 11/01/2025(c) | | | 713,000 | | | | 743,303 | |
| Titan International, Inc. | | | | | | | | |
| 6.50%, | 11/30/2023(c) | | | 276,000 | | | | 280,747 | |
| | | | | | | | | 1,024,050 | |
| | | | | | | | | | |
| MEDIA (1.23%) | | | | | | | | | |
| Cequel Communications Holdings LLC / Ceque Capital Corp. | | | | | | | |
| 7.50%, | 04/01/2028(c) | | | 225,000 | | | | 229,219 | |
See Notes to Financial Statements.
12
| Highland Resolute Fund | Consolidated Schedule of Investments |
| Description | | | Principal Amount | | | | Value
(Note 2) | |
| MEDIA (1.23%) (continued) | | | | | | | | |
| Lee Enterprises, Inc. | | | | | | | | |
| 9.50%, | | 03/15/2022(c) | | $ | 1,676,000 | | | $ | 1,745,135 | |
| Meredith Corp. | | | | | | | | |
| 6.88%, | | 02/01/2026(c) | | | 2,597,000 | | | | 2,635,955 | |
| | | | | | | | | | 4,610,309 | |
| | | | | | | | | | | |
| OIL & GAS (0.19%) | | | | | | | |
| Jonah Energy LLC / Jonah Energy Finance Corp. | | | | | | | |
| 7.25%, | | 10/15/2025(c) | | | 581,000 | | | | 467,705 | |
| Par Petroleum LLC / Petroleum Finance Corp. | | | | | | | | |
| 7.75%, | | 12/15/2025(c) | | | 241,000 | | | | 245,820 | |
| | | | | | | | | | 713,525 | |
| | | | | | | | | | | |
| OIL & GAS SERVICES (0.06%) | | | | | | | | |
| USA Compression Partners LP / USA Compression Finance Corp. | | | | | | | | |
| 6.88%, | | 04/01/2026(c) | | | 206,000 | | | | 210,892 | |
| | | | | | | | | | | |
| | | | | | | | | | | |
| PIPELINES (0.05%) | | | | | | | | |
| Cheniere Corpus Christi Holdings LLC | | | | | | | | |
| 5.13%, | | 06/30/2027 | | | 198,000 | | | | 193,793 | |
| | | | | | | | | | | |
| | | | | | | | | | | |
| PUBLISHING & BROADCASTING (3.85%) | | | | | | | | |
| American Media, Inc. | | | | | | | | |
| 0.00%, | | 03/01/2022(c)(d) | | | 12,310,000 | | | | 10,601,988 | |
| McClatchy Co. | | | | | | | | |
| 6.88%, | | 03/15/2029 | | | 2,318,000 | | | | 2,958,347 | |
| 7.15%, | | 11/01/2027 | | | 346,000 | | | | 397,035 | |
| 9.00%, | | 12/15/2022 | | | 402,000 | | | | 423,105 | |
| | | | | | | | | | 14,380,475 | |
| | | | | | | | | | | |
| REAL ESTATE (0.33%) | | | | | | | | |
| Hunt Cos., Inc. | | | | | | | | |
| 6.25%, | | 02/15/2026(c) | | | 1,284,000 | | | | 1,226,220 | |
| | | | | | | | | | | |
| REFINING & MARKETING (0.43%) | | | | | | | | |
| Calumet Specialty Products Partners LP / Calumet Finance Corp. | | | | | | | | |
| 6.50%, | | 04/15/2021 | | | 1,471,000 | | | | 1,459,968 | |
| 7.75%, | | 04/15/2023 | | | 151,000 | | | | 149,490 | |
| | | | | | | | | | 1,609,458 | |
| | | | | | | | | | | |
| RETAIL (0.64%) | | | | | | | | |
| Golden Nugget, Inc. | | | | | | | | |
| 6.75%, | | 10/15/2024(c) | | | 834,000 | | | | 848,595 | |
| 8.75%, | | 10/01/2025(c) | | | 1,487,000 | | | | 1,557,632 | |
| | | | | | | | | | 2,406,227 | |
| | | | | | | | | | | |
| TOTAL CORPORATE BONDS | | | | | | | | |
| (Cost $67,221,125) | | | | | | | 70,558,700 | |
| See Notes to Financial Statements. | |
| Annual Report | April 30, 2018 | 13 |
| Highland Resolute Fund | Consolidated Schedule of Investments |
| Description | | Principal Amount/Shares | | | Value
(Note 2) | |
| SHORT TERM INVESTMENTS (7.11%) | | | | | | | | |
| MONEY MARKET FUNDS (7.11%) | | | | | | | | |
| Dreyfus Treasury Cash Management Fund, Institutional Class, 7-day yield, 1.537% (b) | | | 26,575,772 | | | $ | 26,575,772 | |
| | | | | | | | | |
| TOTAL SHORT TERM INVESTMENTS | | | | | | | | |
| (Cost $26,575,772) | | | | | | | 26,575,772 | |
| | | | | | | | |
| TOTAL INVESTMENTS (76.66%) | | | | | | | | |
| (Cost $284,162,430) | | | | | | $ | 286,619,065 | |
| | | | | | | | | |
| SEGREGATED CASH WITH BROKERS (28.76%)(e) | | | | | | | 107,519,007 | |
| | | | | | | | | |
| SECURITIES SOLD SHORT (-5.23%) | | | | | | | | |
| (Proceeds $19,667,238) | | | | | | $ | (19,539,515 | ) |
| | | | | | | | | |
| OTHER ASSETS IN EXCESS OF LIABILITIES (-0.19%) | | | | | | | (733,638 | ) |
| NET ASSETS (100.00%) | | | | | | $ | 373,864,919 | |
SCHEDULE OF SECURITIES SOLD SHORT
| Description | | Principal | | | Value
(Note 2) | |
| CORPORATE BONDS (-2.86%) | | | | | | | | |
| CASINO & GAMBLING (-0.22%) | | | | | | | | |
| CRC Escrow Issuer LLC / CRC Finco, Inc. | | | | | | | | |
| 5.25%, 10/15/2025(c) | | $ | (874,000 | ) | | $ | (836,855 | ) |
| | | | | | | | | |
| CHEMICALS (-0.49%) | | | | | | | | |
| CVR Partners LP / CVR Nitrogen Finance Corp. | | | | | | | | |
| 9.25%, 6/15/2023(c) | | | (1,758,000 | ) | | | (1,815,135 | ) |
| | | | | | | | | |
| COMPUTERS (-0.44%) | | | | | | | | |
| West Corp. | | | | | | | | |
| 8.50%, 10/15/2025(c) | | | (1,708,000 | ) | | | (1,656,760 | ) |
| | | | | | | | | |
| HEALTHCARE-SERVICES (-0.09%) | | | | | | | | |
| West Street Merger Sub, Inc. | | | | | | | | |
| 6.38%, 9/1/2025(c) | | | (331,000 | ) | | | (326,863 | ) |
| | | | | | | | | |
| OIL & GAS (-0.12%) | | | | | | | | |
| Precision Drilling Corp. | | | | | | | | |
| 7.13%, 1/15/2026(c) | | | (455,000 | ) | | | (460,688 | ) |
| | | | | | | | | |
| PHARMACEUTICALS (-1.11%) | | | | | | | | |
| Mylan NV | | | | | | | | |
| 3.95%, 6/15/2026 | | | (608,000 | ) | | | (578,072 | ) |
| Teva Pharmaceutical Finance Netherlands III BV | | | | | | | | |
| 6.75%, 3/1/2028(c) | | | (2,836,000 | ) | | | (2,803,405 | ) |
| Teva Pharmaceutical Finance Netherlands III BV | | | | | | | | |
| 3.15%, 10/1/2026 | | | (945,000 | ) | | | (753,791 | ) |
| | | | | | | | (4,135,268 | ) |
| See Notes to Financial Statements. |
| Highland Resolute Fund | Consolidated Schedule of Investments |
| Description | | Principal | | | Value
(Note 2) | |
| TELECOMMUNICATIONS (-0.39%) | | | | | | |
| GTT Communications, Inc. | | | | | | | | |
| 7.88%, 12/31/2024(c) | | $ | (1,147,000 | ) | | $ | (1,175,675 | ) |
| Plantronics, Inc. | | | | | | | | |
| 5.50%, 5/31/2023(c) | | | (288,000 | ) | | | (288,720 | ) |
| | | | | | | | (1,464,395 | ) |
| | | | | | | | | |
| TOTAL CORPORATE BONDS | | | | | | | | |
| (Proceeds $10,875,668) | | | | | | | (10,695,964 | ) |
| | | | | | | | | |
| Description | | | Shares | | | | Value
(Note 2) | |
| EXCHANGE TRADED FUNDS (-2.37%) | | | | | | | | |
| Consumer Staples Select Sector SPDR® Fund | | | (4,941 | ) | | | (249,273 | ) |
| Health Care Select Sector SPDR® Fund | | | (15,389 | ) | | | (1,265,899 | ) |
| iShares® 20+ Year Treasury Bond ETF | | | (14,433 | ) | | | (1,718,970 | ) |
| iShares® 7-10 Year Treasury Bond ETF | | | (8,659 | ) | | | (880,620 | ) |
| iShares® Nasdaq Biotechnology ETF | | | (989 | ) | | | (102,510 | ) |
| SPDR® S&P Biotech ETF | | | (1,173 | ) | | | (102,028 | ) |
| SPDR® S&P Pharmaceuticals ETF | | | (12,680 | ) | | | (510,624 | ) |
| SPDR® S&P Retail ETF | | | (22,646 | ) | | | (1,023,146 | ) |
| Utilities Select Sector SPDR® Fund | | | (9,519 | ) | | | (490,800 | ) |
| Vaneck Vectors Pharmaceutical ETF | | | (9,322 | ) | | | (528,184 | ) |
| Vanguard Total International Bond ETF | | | (36,108 | ) | | | (1,971,497 | ) |
| | | | | | | | (8,843,551 | ) |
| TOTAL EXCHANGE TRADED FUNDS (-2.37%) | | | | | | | | |
| (Proceeds $8,791,570) | | | | | | | (8,843,551 | ) |
| TOTAL SECURITIES SOLD SHORT | | | | | | | | |
| (Proceeds $19,667,238) | | | | | | $ | (19,539,515 | ) |
| (a) | Non-income producing security. |
| (b) | Security position either entirely or partially held in a segregated account as collateral for securities sold short and total return swaps. Aggregate total fair value of $138,419,361. |
| (c) | Security exempt from registration under rule 144A of the securities act of 1933. This security may be resold in transactions exempt from registration, normally to qualified institutional buyers. At period end, the fair value of those securities held in long positions was $48,773,928 and the value of the securities held in short positions was $(9,364,101). This totals $39,409,827, which represents 10.54% of the Fund's net assets. |
| (d) | Issued with a zero coupon. Income is recognized through the accretion of discount. |
| (e) | Includes cash which is being held as collateral for securities sold short and total return swap contracts. |
| See Notes to Financial Statements. | |
| Annual Report | April 30, 2018 | 15 |
| Highland Resolute Fund | Consolidated Schedule of Investments |
TOTAL RETURN SWAP CONTRACTS*
| Counterparty | | Reference Obligation | | Notional Amount | | | Value | | | Rate Paid by
the Fund | | Termination
Date | | Unrealized Appreciation/
(Depreciation) | |
| Morgan Stanley | | BHDG Systematic Trading Segregated Portfolio(a) | | $ | 18,315,069 | | | $ | 18,265,650 | | | 1-Month LIBOR BBA | | 09/13/2018 | | $ | (49,419 | ) |
| Morgan Stanley | | Clinton Segregated Portfolio(b) | | | 19,438,073 | | | | 19,223,352 | | | 1-Month LIBOR BBA | | 09/13/2018 | | | (214,721 | ) |
| Morgan Stanley | | iBoxx USD Liquid IG | | | (1,870,000 | ) | | | (1,853,704 | ) | | 3-Month LIBOR BBA | | 06/20/2018 | | | 16,296 | |
| Morgan Stanley | | iBoxx USD Liquid High Yield Index | | | (6,000,000 | ) | | | (5,995,286 | ) | | 3-Month LIBOR BBA | | 06/20/2018 | | | 4,714 | |
| Morgan Stanley | | iBoxx USD Liquid IG | | | (560,000 | ) | | | (560,548 | ) | | 3-Month LIBOR BBA | | 06/20/2018 | | | (548 | ) |
| Morgan Stanley | | iBoxx USD Liquid IG | | | (2,745,000 | ) | | | (2,750,748 | ) | | 3-Month LIBOR BBA | | 06/20/2018 | | | (5,748 | ) |
| Morgan Stanley | | iBoxx USD Liquid High Yield Index | | | (1,420,000 | ) | | | (1,416,087 | ) | | 3-Month LIBOR BBA | | 06/20/2018 | | | 3,913 | |
| Morgan Stanley | | Long/Short Segregated Portfolio(c) | | | 44,055,822 | | | | 43,926,147 | | | 1-Month LIBOR BBA | | 03/20/2019 | | | (129,675 | ) |
| Morgan Stanley | | Melchior Segregated Portfolio(d) | | | 44,604,786 | | | | 44,757,707 | | | 1-Month LIBOR BBA | | 03/20/2019 | | | 152,921 | |
| Morgan Stanley | | PSAM Highland(e) | | | 54,696,257 | | | | 54,638,205 | | | 1-Month EURIBOR | | 06/03/2021 | | | (58,052 | ) |
| Morgan Stanley | | WABR(f) | | | 37,332,696 | | | | 37,436,446 | | | 1-Month LIBOR BBA | | 09/01/2020 | | | 103,750 | |
| | | | | $ | 205,847,703 | | | $ | 205,671,134 | | | | | | | $ | (176,569 | ) |
| * | For the long positions, the Fund receives payments based on any positive return of the Reference Obligation less the rate paid by the Fund. The Fund makes payments on any negative return of such Reference Obligation plus the rate paid by the Fund. For short positions, the Fund receives payments based on any negative return of the Reference Obligation less the rate received by the fund. The Fund makes payments on any positive return of such Reference obligation plus the rate received by the Fund. Payments are made weekly. |
| (a) | BHDG Systematic Trading Segregated Portfolio is a quantitative trend following strategy that uses futures and forward foreign currency contracts. BHDG will employ some short, medium, and long term signals. Interest rate, commodity, equity, and sovereign debt futures will be used. Any asset class may have net long or short exposure, and exposures in aggregate may be net long or short. |
| (b) | Clinton Segregated Portfolio is a global, quantitative equity market neutral strategy. The Portfolio will invest in large, mid, and small cap stocks in developed and some emerging markets. The strategy will also attempt to minimize net exposure to any given country or sector. The strategy attempts to generate returns primarily through trading value, momentum, and mean reversion models. |
| (c) | Long/Short Segregated Portfolio is a European equity long/short strategy that employs a flexible, low-net strategy (0% to 50%), and long exposure will vary between 60% and 100%. The portfolio is primarily comprised of large and mid-cap stocks listed on European exchanges. |
| (d) | Melchior Segregated Portfolio is a global equity long/short strategy that uses a long-biased strategy that is focused on cyclical sectors. The strategy has a net exposure that ranges between 50% and 80%, and long exposure varies between 80% and 100%. The strategy is comprised of large cap stocks listed on exchanges of developed and emerging market countries. |
| (e) | PSAM Highland employs an event driven strategy. The fund will primarily make investments in equity special situations and merger arbitrage. The strategy will also opportunistically allocate to liquid high yield credit positions when trading at stressed levels. The strategy will employ gross long exposure of up to 120%, and net exposure will typically vary from 40% to 80%. |
| (f) | WABR incorporates an absolute return oriented approach within a risk parity framework. Active absolute return strategies include fundamental long/short equity, credit relative value, discretionary macro, and equity market neutral strategies. The strategy also maintains a passive risk weighted allocation to equities and fixed income, but each of the three allocations is equally risk weighted subject to a 40% limit on the absolute return allocation. Gross equity long exposure will typically be 140% or less, and net equity exposure will vary between 5% and 35%. |
See Notes to Financial Statements.
16
| Highland Resolute Fund | Consolidated Schedule of Investments |
BHDG SYSTEMATIC TRADING SEGREGATED PORTFOLIO
| Description | | Contracts | | | Value | | | Percentage
of Value | |
| LONG SECURITIES | | | | | | | | | | | | |
| OUTSTANDING FORWARD FOREIGN CURRENCY CONTRACTS | | | | | | | | | | | | |
| AUD TO USD FORWARD SD : 20-Jun-2018 | | | 2,933,607 | | | $ | 2,209,170 | | | | 12.09 | % |
| EUR TO PLN FORWARD SD : 20-Jun-2018 | | | 2,445,005 | | | | 2,963,457 | | | | 16.22 | % |
| EUR TO USD FORWARD SD : 20-Jun-2018 | | | 6,946,611 | | | | 8,419,606 | | | | 46.10 | % |
| GBP TO USD FORWARD SD : 20-Jun-2018 | | | 2,971,012 | | | | 4,099,337 | | | | 22.44 | % |
| INR TO USD FORWARD SD : 20-Jun-2018 | | | 127,694,734 | | | | 1,912,336 | | | | 10.47 | % |
| JPY TO AUD FORWARD SD : 20-Jun-2018 | | | 270,087,739 | | | | 2,479,056 | | | | 13.57 | % |
| JPY TO USD FORWARD SD : 20-Jun-2018 | | | 459,951,122 | | | | 4,221,757 | | | | 23.11 | % |
| KRW TO USD FORWARD SD : 20-Jun-2018 | | | 2,923,155,137 | | | | 2,733,222 | | | | 14.96 | % |
| MXN TO USD FORWARD SD : 20-Jun-2018 | | | 43,480,439 | | | | 2,308,392 | | | | 12.64 | % |
| NOK TO USD FORWARD SD : 20-Jun-2018 | | | 17,729,888 | | | | 2,214,073 | | | | 12.12 | % |
| NZD TO USD FORWARD SD : 20-Jun-2018 | | | 3,024,447 | | | | 2,127,712 | | | | 11.65 | % |
| PLN TO EUR FORWARD SD : 20-Jun-2018 | | | 10,318,389 | | | | 2,942,175 | | | | 16.11 | % |
| SGD TO USD FORWARD SD : 20-Jun-2018 | | | 6,599,280 | | | | 4,982,382 | | | | 27.28 | % |
| USD TO AUD FORWARD SD : 20-Jun-2018 | | | 3,453,893 | | | | 3,453,893 | | | | 18.91 | % |
| USD TO CAD FORWARD SD : 20-Jun-2018 | | | 2,222,247 | | | | 2,222,247 | | | | 12.17 | % |
| USD TO EUR FORWARD SD : 20-Jun-2018 | | | 8,595,296 | | | | 8,595,296 | | | | 47.06 | % |
| USD TO GBP FORWARD SD : 20-Jun-2018 | | | 3,018,125 | | | | 3,018,125 | | | | 16.52 | % |
| USD TO INR FORWARD SD : 20-Jun-2018 | | | 3,286,042 | | | | 3,286,042 | | | | 17.99 | % |
| USD TO JPY FORWARD SD : 20-Jun-2018 | | | 4,394,673 | | | | 4,394,673 | | | | 24.06 | % |
| USD TO KRW FORWARD SD : 20-Jun-2018 | | | 2,434,248 | | | | 2,434,248 | | | | 13.33 | % |
| USD TO MXN FORWARD SD : 20-Jun-2018 | | | 2,025,604 | | | | 2,025,604 | | | | 11.09 | % |
| USD TO NOK FORWARD SD : 20-Jun-2018 | | | 2,127,569 | | | | 2,127,569 | | | | 11.65 | % |
| USD TO NZD FORWARD SD : 20-Jun-2018 | | | 2,224,298 | | | | 2,224,298 | | | | 12.18 | % |
| USD TO PLN FORWARD SD : 20-Jun-2018 | | | 1,883,457 | | | | 1,883,457 | | | | 10.31 | % |
| USD TO SGD FORWARD SD : 20-Jun-2018 | | | 4,616,279 | | | | 4,616,278 | | | | 25.27 | % |
| | | | | | | | 83,894,405 | | | | 459.30 | % |
| TOTAL LONG | | | | | | $ | 83,894,405 | | | | 459.30 | % |
| | | | | | | | | | | | | |
| SECURITIES SOLD SHORT | | | | | | | | | | | | |
| OUTSTANDING FORWARD FOREIGN CURRENCY CONTRACTS | | | | | | | | | | | | |
| AUD TO JPY FORWARD SD : 20-Jun-2018 | | | (3,275,594 | ) | | | (2,466,706 | ) | | | -13.50 | % |
| AUD TO USD FORWARD SD : 20-Jun-2018 | | | (4,493,923 | ) | | | (3,384,175 | ) | | | -18.53 | % |
| CAD TO USD FORWARD SD : 20-Jun-2018 | | | (2,858,797 | ) | | | (2,229,634 | ) | | | -12.20 | % |
| EUR TO PLN FORWARD SD : 20-Jun-2018 | | | (2,449,120 | ) | | | (2,968,444 | ) | | | -16.25 | % |
| EUR TO USD FORWARD SD : 20-Jun-2018 | | | (6,973,328 | ) | | | (8,451,990 | ) | | | -46.27 | % |
| GBP TO USD FORWARD SD : 20-Jun-2018 | | | (2,158,793 | ) | | | (2,978,655 | ) | | | -16.31 | % |
| INR TO USD FORWARD SD : 20-Jun-2018 | | | (217,236,546 | ) | | | (3,253,300 | ) | | | -17.81 | % |
| JPY TO USD FORWARD SD : 20-Jun-2018 | | | (471,621,428 | ) | | | (4,328,875 | ) | | | -23.70 | % |
| KRW TO USD FORWARD SD : 20-Jun-2018 | | | (2,611,081,325 | ) | | | (2,441,425 | ) | | | -13.37 | % |
| MXN TO USD FORWARD SD : 20-Jun-2018 | | | (38,243,763 | ) | | | (2,030,375 | ) | | | -11.11 | % |
| NOK TO USD FORWARD SD : 20-Jun-2018 | | | (16,730,645 | ) | | | (2,089,289 | ) | | | -11.44 | % |
| NZD TO USD FORWARD SD : 20-Jun-2018 | | | (3,099,257 | ) | | | (2,180,341 | ) | | | -11.94 | % |
| PLN TO EUR FORWARD SD : 20-Jun-2018 | | | (10,355,793 | ) | | | (2,952,840 | ) | | | -16.17 | % |
| SGD TO USD FORWARD SD : 20-Jun-2018 | | | (6,096,987 | ) | | | (4,603,156 | ) | | | -25.20 | % |
| USD TO AUD FORWARD SD : 20-Jun-2018 | | | (2,282,857 | ) | | | (2,282,857 | ) | | | -12.50 | % |
| USD TO EUR FORWARD SD : 20-Jun-2018 | | | (8,628,687 | ) | | | (8,628,687 | ) | | | -47.24 | % |
| USD TO GBP FORWARD SD : 20-Jun-2018 | | | (4,161,036 | ) | | | (4,161,036 | ) | | | -22.78 | % |
| USD TO INR FORWARD SD : 20-Jun-2018 | | | (1,943,201 | ) | | | (1,943,201 | ) | | | -10.64 | % |
| USD TO JPY FORWARD SD : 20-Jun-2018 | | | (4,348,508 | ) | | | (4,348,508 | ) | | | -23.81 | % |
| USD TO KRW FORWARD SD : 20-Jun-2018 | | | (2,752,196 | ) | | | (2,752,196 | ) | | | -15.07 | % |
| USD TO MXN FORWARD SD : 20-Jun-2018 | | | (2,331,383 | ) | | | (2,331,383 | ) | | | -12.76 | % |
| See Notes to Financial Statements. | |
| Annual Report | April 30, 2018 | 17 |
| Highland Resolute Fund | Consolidated Schedule of Investments |
| Description | | Contracts | | | Value | | | Percentage
of Value | |
| OUTSTANDING FORWARD FOREIGN CURRENCY CONTRACTS (CONTINUED) | | | | | | | | | | | | |
| USD TO NOK FORWARD SD : 20-Jun-2018 | | | (2,290,840 | ) | | | (2,290,840 | ) | | | -12.54 | % |
| USD TO NZD FORWARD SD : 20-Jun-2018 | | | (2,208,082 | ) | | | (2,208,082 | ) | | | -12.09 | % |
| USD TO SGD FORWARD SD : 20-Jun-2018 | | | (5,032,673 | ) | | | (5,032,673 | ) | | | -27.55 | % |
| USD TO PLN FORWARD SD : 20-Jun-2018 | | | (1,907,871 | ) | | | (1,907,871 | ) | | | -10.45 | % |
| | | | | | | | (84,246,539 | ) | | | -461.23 | % |
| TOTAL SHORT | | | | | | $ | (84,246,539 | ) | | | -461.23 | % |
| | | | | | | | | | | | | |
| REMAINING SECURITIES, CASH AND OTHER ASSETS AND LIABILITIES | | | | | | $ | 18,617,784 | | | | 101.93 | % |
| TOTAL VALUE | | | | | | $ | 18,265,650 | | | | | |
CLINTON SEGREGATED PORTFOLIO
| Description | | | Notional | | | | Value | | | | Percentage
of Value | |
| LONG SECURITIES | | | | | | | | | | | | |
| EQUITY SWAPS | | | | | | | | | | | | |
| AGL Energy Ltd. | | | 12,843 | | | $ | (23,216 | ) | | | -0.12 | % |
| Anhui Conch Cement Co Ltd-H | | | 17,837 | | | | 14,763 | | | | 0.08 | % |
| Aristocrat Leisure Ltd. | | | 12,243 | | | | 43,287 | | | | 0.22 | % |
| B3 SA - Brasil Bolsa Balcao | | | 43,149 | | | | (25,606 | ) | | | -0.13 | % |
| Clicks Group Ltd | | | 4,453 | | | | 15,177 | | | | 0.08 | % |
| Country Garden Holdings Co. | | | 69,221 | | | | 16,587 | | | | 0.09 | % |
| Covestro AG | | | 2,181 | | | | (22,524 | ) | | | -0.12 | % |
| Deutsche Lufthansa | | | 7,009 | | | | 16,727 | | | | 0.09 | % |
| Ence Energia Y Celulosa SA | | | 14,503 | | | | 17,275 | | | | 0.09 | % |
| Gol Linhas Aereas Int. | | | 33,644 | | | | (24,040 | ) | | | -0.13 | % |
| Hiwin Technologies Corp. | | | 5,417 | | | | 16,855 | | | | 0.09 | % |
| LG Display Co Ltd. | | | 6,291 | | | | (28,248 | ) | | | -0.15 | % |
| Localiza Rent-A-Car | | | 33,698 | | | | (17,754 | ) | | | -0.09 | % |
| Mixi Inc. | | | 1,281 | | | | (15,220 | ) | | | -0.08 | % |
| Mondi Ltd. | | | 5,336 | | | | 15,586 | | | | 0.08 | % |
| Phison Electronics Corp. | | | 8,069 | | | | (21,032 | ) | | | -0.11 | % |
| Swedish Orphan Biovitrum AB | | | 2,528 | | | | 14,721 | | | | 0.08 | % |
| Western Digital Corp. | | | 1,789 | | | | (18,272 | ) | | | -0.10 | % |
| Zhongsheng Group Holdings | | | 22,995 | | | | 14,558 | | | | 0.08 | % |
| | | | | | | | (10,376 | ) | | | -0.05 | % |
| OUTSTANDING FORWARD FOREIGN CURRENCY CONTRACTS | | | | | | | | | | | | |
| HKD TO USD FORWARD SD : 02-MAY-2018 | | | 428,379 | | | | 54,580 | | | | 0.28 | % |
| USD TO NOK FORWARD SD : 02-MAY-2018 | | | 41,773 | | | | 41,773 | | | | 0.22 | % |
| USD TO SEK FORWARD SD : 02-MAY-2018 | | | 52,009 | | | | 52,009 | | | | 0.27 | % |
| USD TO EUR FORWARD SD : 02-MAY-2018 | | | 26,273 | | | | 26,273 | | | | 0.14 | % |
| | | | | | | | 174,635 | | | | 0.91 | % |
| TOTAL LONG | | | | | | $ | 164,259 | | | | 0.86 | % |
| | | | | | | | | | | | | |
| SECURITIES SOLD SHORT | | | | | | | | | | | | |
| EQUITY SWAPS | | | | | | | | | | | | |
| Baic Motor Corp Ltd. - Class H | | | (36,119 | ) | | | 14,830 | | | | 0.08 | % |
| Boskalis Westminster | | | (5,842 | ) | | | 21,116 | | | | 0.11 | % |
| BRF SA | | | (55,644 | ) | | | 29,847 | | | | 0.16 | % |
| Brilliance China Automotive | | | (34,892 | ) | | | 14,928 | | | | 0.08 | % |
| CCR SA | | | (123,786 | ) | | | 26,641 | | | | 0.14 | % |
| China Jinmao Holdings Group | | | (209,887 | ) | | | (14,957 | ) | | | -0.08 | % |
| China Longyuan Power Group - Class H | | | (117,800 | ) | | | (26,263 | ) | | | -0.14 | % |
| China Resources Land Ltd. | | | (33,957 | ) | | | (23,309 | ) | | | -0.12 | % |
See Notes to Financial Statements.
18
| Highland Resolute Fund | Consolidated Schedule of Investments |
| Description | | Notional | | | Value | | | Percentage
of Value | |
| EQUITY SWAPS (CONTINUED) | | | | | | | | | | | | |
| Chipotle Mexican Grill Inc | | | (347 | ) | | | (19,351 | ) | | | -0.10 | % |
| Delta Electronics Inc. | | | (39,569 | ) | | | 42,978 | | | | 0.22 | % |
| Dish Network Corp - Class A | | | (3,944 | ) | | | 17,644 | | | | 0.09 | % |
| Ericsson LM - B Shares | | | (15,731 | ) | | | (19,613 | ) | | | -0.10 | % |
| First Data Corp- Class A | | | (5,107 | ) | | | (14,464 | ) | | | -0.08 | % |
| Henry Schein Inc. | | | (3,313 | ) | | | (27,141 | ) | | | -0.14 | % |
| Hon Hai Precision Industry | | | (105,917 | ) | | | 31,449 | | | | 0.16 | % |
| Intrum AB | | | (2,126 | ) | | | 15,443 | | | | 0.08 | % |
| Lojas Americanas SA - Preferred Stock | | | (65,054 | ) | | | (34,144 | ) | | | -0.18 | % |
| Match Group Inc. | | | (1,670 | ) | | | (19,865 | ) | | | -0.10 | % |
| Sartorius Ag-Vorzug | | | (350 | ) | | | (18,830 | ) | | | -0.10 | % |
| Telefonica Brasil | | | (22,267 | ) | | | 22,544 | | | | 0.12 | % |
| Telstra Corp. Ltd. | | | (104,798 | ) | | | 31,045 | | | | 0.16 | % |
| Winbond Electronics Corp. | | | (94,054 | ) | | | 25,890 | | | | 0.13 | % |
| Yue Yuen Industrial Holdings | | | (29,846 | ) | | | 21,496 | | | | 0.11 | % |
| | | | | | | | 97,914 | | | | 0.50 | % |
| OUTSTANDING FORWARD FOREIGN CURRENCY CONTRACTS | | | | | | | | | | | | |
| NOK TO USD FORWARD SD : 02-MAY-2018 | | | (333,625 | ) | | | (41,636 | ) | | | -0.22 | % |
| SEK TO USD FORWARD SD : 02-MAY-2018 | | | (452,366 | ) | | | (51,715 | ) | | | -0.27 | % |
| USD TO HKD FORWARD SD : 02-MAY-2018 | | | (54,610 | ) | | | (54,610 | ) | | | -0.28 | % |
| EUR TO USD FORWARD SD : 02-MAY-2018 | | | (21,745 | ) | | | (26,262 | ) | | | -0.14 | % |
| | | | | | | | (174,223 | ) | | | -0.91 | % |
| TOTAL SHORT | | | | | | $ | (76,309 | ) | | | -0.41 | % |
| | | | | | | | | | | | | |
| REMAINING SECURITIES, CASH AND OTHER ASSETS AND LIABILITIES | | | | | | $ | 19,135,402 | | | | 99.55 | % |
| TOTAL VALUE | | | | | | $ | 19,223,352 | | | | | |
LONG/SHORT SEGREGATED PORTFOLIO
| Description | | | Notional/Shares | | | | Value | | | | Percentage
of Value | |
| LONG SECURITIES | | | | | | | | | | | | |
| COMMON STOCKS | | | | | | | | | | | | |
| American Airlines Group Inc. | | | 8,304 | | | $ | 356,491 | | | | 0.81 | % |
| Apple Inc. | | | 2,713 | | | | 448,350 | | | | 1.02 | % |
| Boeing Co. | | | 698 | | | | 232,825 | | | | 0.53 | % |
| Booking Holdings Inc. | | | 153 | | | | 333,234 | | | | 0.76 | % |
| Brunswick Corp. | | | 27,594 | | | | 1,652,329 | | | | 3.76 | % |
| Buzzi Unicem SPA | | | 12,494 | | | | 316,894 | | | | 0.72 | % |
| Canfor Corp. | | | 61,656 | | | | 1,418,059 | | | | 3.23 | % |
| Constellation Brands Inc. - Class A | | | 3,174 | | | | 739,955 | | | | 1.69 | % |
| Dr Horton Inc. | | | 12,854 | | | | 567,376 | | | | 1.29 | % |
| First Quantum Minerals Ltd. | | | 104,419 | | | | 1,506,591 | | | | 3.43 | % |
| Hess Corp. | | | 28,513 | | | | 1,624,956 | | | | 3.70 | % |
| Hudson Ltd. - Class A | | | 14,442 | | | | 214,175 | | | | 0.49 | % |
| Kansas City Southern | | | 8,995 | | | | 959,137 | | | | 2.18 | % |
| Marinemax Inc. | | | 37,613 | | | | 812,441 | | | | 1.85 | % |
| Marriott International - Class A | | | 6,649 | | | | 908,785 | | | | 2.07 | % |
| Microsoft Corp. | | | 9,320 | | | | 871,606 | | | | 1.98 | % |
| Mosaic Co. | | | 12,749 | | | | 343,585 | | | | 0.78 | % |
| Navistar International Corp. | | | 30,299 | | | | 1,054,708 | | | | 2.40 | % |
| Newfield Exploration Co. | | | 16,794 | | | | 500,461 | | | | 1.14 | % |
| Nintendo Co. Ltd. | | | 1,104 | | | | 467,094 | | | | 1.06 | % |
| Norwegian Cruise Line Holdings | | | 30,981 | | | | 1,656,554 | | | | 3.77 | % |
| See Notes to Financial Statements. | |
| Annual Report | April 30, 2018 | 19 |
| Highland Resolute Fund | Consolidated Schedule of Investments |
| Description | | Notional/Shares | | | Value | | | Percentage
of Value | |
| COMMON STOCKS (CONTINUED) | | | | | | | | | | | | |
| Rpc Inc. | | | 12,284 | | | | 221,235 | | | | 0.50 | % |
| Seaworld Entertainment Inc. | | | 44,328 | | | | 668,910 | | | | 1.52 | % |
| Sherwin-Williams Co. | | | 589 | | | | 216,552 | | | | 0.49 | % |
| Smith (A.O.) Corp. | | | 3,637 | | | | 223,130 | | | | 0.51 | % |
| Southwest Airlines Co. | | | 25,495 | | | | 1,346,901 | | | | 3.07 | % |
| Summit Materials Inc. - Class A | | | 19,763 | | | | 556,131 | | | | 1.27 | % |
| Swatch Group AG | | | 542 | | | | 262,126 | | | | 0.60 | % |
| Teck Resources Ltd. - Class B | | | 117,229 | | | | 2,945,965 | | | | 6.71 | % |
| Union Pacific Corp. | | | 4,024 | | | | 537,727 | | | | 1.22 | % |
| West Fraser Timber Co. Ltd. | | | 11,693 | | | | 793,121 | | | | 1.81 | % |
| | | | | | | | 24,757,404 | | | | 56.36 | % |
| EQUITY SWAPS | | | | | | | | | | | | |
| NVR ORD (NYS) | | | 721 | | | | 885,044 | | | | 2.01 | % |
| RIO TINTO ADR REP ONE ORD (NYS) | | | 32,054 | | | | 283,809 | | | | 0.65 | % |
| | | | | | | | 1,168,853 | | | | 2.66 | % |
| TOTAL LONG | | | | | | $ | 25,926,257 | | | | 59.02 | % |
| | | | | | | | | | | | | |
| SECURITIES SOLD SHORT | | | | | | | | | | | | |
| COMMON STOCKS | | | | | | | | | | | | |
| Ana Holdings Inc. | | | (7,782 | ) | | | (309,497 | ) | | | -0.70 | % |
| Domtar Corp. | | | (5,144 | ) | | | (225,822 | ) | | | -0.51 | % |
| Eaton Corp PLC | | | (3,047 | ) | | | (228,616 | ) | | | -0.52 | % |
| Ferrari NV | | | (2,002 | ) | | | (245,605 | ) | | | -0.56 | % |
| Ishares Stoxx Europe 600 | | | (11,688 | ) | | | (540,995 | ) | | | -1.23 | % |
| Kaiser Aluminum Corp. | | | (2,592 | ) | | | (255,416 | ) | | | -0.58 | % |
| Kirby Corp. | | | (3,286 | ) | | | (280,296 | ) | | | -0.64 | % |
| Louisiana-Pacific Corp. | | | (9,541 | ) | | | (270,297 | ) | | | -0.62 | % |
| Meritage Homes Corp. | | | (6,392 | ) | | | (284,444 | ) | | | -0.65 | % |
| Penske Automotive Group Inc. | | | (6,007 | ) | | | (270,916 | ) | | | -0.62 | % |
| Regal Beloit Corp. | | | (7,452 | ) | | | (530,582 | ) | | | -1.21 | % |
| Ryman Hospitality Properties | | | (3,249 | ) | | | (254,657 | ) | | | -0.58 | % |
| Terex Corp. | | | (7,865 | ) | | | (287,230 | ) | | | -0.65 | % |
| Tesla Inc. | | | (777 | ) | | | (228,360 | ) | | | -0.52 | % |
| Timken | | | (4,811 | ) | | | (205,670 | ) | | | -0.47 | % |
| Vail Resorts Inc. | | | (2,704 | ) | | | (620,054 | ) | | | -1.41 | % |
| Valmont Industries | | | (2,689 | ) | | | (382,107 | ) | | | -0.87 | % |
| | | | | | | | (5,420,563 | ) | | | -12.34 | % |
| TOTAL SHORT | | | | | | $ | (5,420,563 | ) | | | -12.34 | % |
| | | | | | | | | | | | | |
| REMAINING SECURITIES, CASH AND OTHER ASSETS AND LIABILITIES | | | | | | $ | 23,420,453 | | | | 53.32 | % |
| TOTAL VALUE | | | | | | $ | 43,926,147 | | | | | |
MELCHIOR SEGREGATED PORTFOLIO
| Description | | | Notional/Contracts | | | | Value | | | | Percentage
of Value | |
| LONG SECURITIES | | | | | | | | | | | | |
| CONTRACTS FOR DIFFERENCE | | | | | | | | | | | | |
| Alten SA | | | 9,064 | | | $ | 73,447 | | | | 0.16 | % |
| Altran Technologies SA | | | 55,808 | | | | 67,387 | | | | 0.15 | % |
| Ascential Plc | | | 86,211 | | | | 69,259 | | | | 0.16 | % |
| Asr Nederland NV | | | 32,842 | | | | 228,379 | | | | 0.51 | % |
| Befesa SA | | | 27,512 | | | | 67,474 | | | | 0.15 | % |
| Erste Group Bank AG | | | 26,211 | | | | 79,758 | | | | 0.18 | % |
See Notes to Financial Statements.
20
| Highland Resolute Fund | Consolidated Schedule of Investments |
| Description | | Notional/Contracts | | | Value | | | Percentage
of Value | |
| CONTRACTS FOR DIFFERENCE (CONTINUED) | | | | | | | | | | | | |
| Ferguson PLC | | | 20,350 | | | | 61,710 | | | | 0.14 | % |
| Finecobank SPA | | | 90,303 | | | | 149,949 | | | | 0.33 | % |
| Fluidra SA | | | 58,402 | | | | 58,700 | | | | 0.13 | % |
| Orange | | | 34,063 | | | | 44,239 | | | | 0.10 | % |
| Howden Joinery Group PLC | | | 194,087 | | | | 87,048 | | | | 0.19 | % |
| Ing Groep NV | | | 64,850 | | | | (50,037 | ) | | | -0.11 | % |
| Inmobiliaria Colonial Socimi | | | 92,434 | | | | 200,778 | | | | 0.45 | % |
| Jd Sports Fashion PLC | | | 200,233 | | | | 99,133 | | | | 0.22 | % |
| Jungheinrich - Preferred Stock | | | 23,101 | | | | (38,174 | ) | | | -0.09 | % |
| Lonza Group AG | | | 2,761 | | | | 44,889 | | | | 0.10 | % |
| Moncler SPA | | | 11,555 | | | | 172,902 | | | | 0.39 | % |
| Ovs SPA | | | 74,193 | | | | (189,243 | ) | | | -0.42 | % |
| Prosegur Cash SA | | | 1,021,653 | | | | (163,033 | ) | | | -0.36 | % |
| Prudential PLC | | | 73,266 | | | | 63,392 | | | | 0.14 | % |
| Sbanken ASA | | | 71,106 | | | | (50,581 | ) | | | -0.11 | % |
| Shire PLC | | | 15,149 | | | | 44,814 | | | | 0.10 | % |
| Total SA | | | 18,308 | | | | 134,687 | | | | 0.30 | % |
| Unicredit SPA | | | 35,411 | | | | 39,537 | | | | 0.09 | % |
| Compass Group PLC | | | 75,688 | | | | 35,700 | | | | 0.08 | % |
| Gima TT SPA | | | 39,403 | | | | (28,750 | ) | | | -0.06 | % |
| MTU Aero Engines AG | | | 4,989 | | | | 35,463 | | | | 0.08 | % |
| Ryanair Holdings PLC | | | 55,090 | | | | (29,244 | ) | | | -0.07 | % |
| Bayer AG | | | 4,977 | | | | 26,729 | | | | 0.06 | % |
| | | | | | | | 1,336,312 | | | | 2.99 | % |
| INDEX OPTIONS | | | | | | | | | | | | |
| DJ Euro STOXX 50 Euro Price Put @ 3300.0, June 18 | | | 219 | | | | 46,239 | | | | 0.10 | % |
| | | | | | | | 46,239 | | | | 0.10 | % |
| COMMON STOCKS | | | | | | | | | | | | |
| Grifols SA | | | 76,371 | | | | 1,551,856 | | | | 3.47 | % |
| | | | | | | | 1,551,856 | | | | 3.47 | % |
| TOTAL LONG | | | | | | $ | 2,934,407 | | | | 6.56 | % |
| | | | | | | | | | | | | |
| SECURITIES SOLD SHORT | | | | | | | | | | | | |
| CONTRACTS FOR DIFFERENCE | | | | | | | | | | | | |
| Babcock International Group PLC | | | (112,732 | ) | | | (92,223 | ) | | | -0.20 | % |
| Bayerische Motoren Werke AG | | | (6,787 | ) | | | (53,549 | ) | | | -0.12 | % |
| Bca Marketplace PLC | | | (154,871 | ) | | | (51,223 | ) | | | -0.11 | % |
| FTSE MID 250 INDEX | | | (87 | ) | | | (39,271 | ) | | | -0.09 | % |
| Marine Harvest | | | (25,435 | ) | | | (43,861 | ) | | | -0.10 | % |
| Nmc Health PLC | | | (12,983 | ) | | | (48,119 | ) | | | -0.11 | % |
| Norwegian Air Shuttle AS | | | (18,176 | ) | | | (62,192 | ) | | | -0.14 | % |
| Orpea | | | (3,630 | ) | | | (43,306 | ) | | | -0.10 | % |
| Pandora A/S | | | (10,551 | ) | | | (56,974 | ) | | | -0.13 | % |
| Pearson PLC | | | (62,332 | ) | | | (58,985 | ) | | | -0.13 | % |
| Pets At Home Group PLC | | | (285,468 | ) | | | 67,688 | | | | 0.15 | % |
| Publicis Groupe | | | (12,041 | ) | | | (59,114 | ) | | | -0.13 | % |
| Signify NV | | | (31,620 | ) | | | 150,486 | | | | 0.33 | % |
| Wirecard AG | | | (6,771 | ) | | | (105,248 | ) | | | -0.24 | % |
| Arcadis NV | | | (37,019 | ) | | | (33,766 | ) | | | -0.08 | % |
| Banco de Sabadell SA | | | (312,223 | ) | | | 25,278 | | | | 0.07 | % |
| | | | | | | | (504,379 | ) | | | -1.13 | % |
| See Notes to Financial Statements. |
| Annual Report | April 30, 2018 | 21 |
| Highland Resolute Fund | Consolidated Schedule of Investments |
April 30, 2018
| Description | | Notional/Contracts | | | Value | | | Percentage
of Value | |
| EQUITY FUTURES | | | | | | | | | | | | |
| DAX Mini Future Jun18 | | | (48 | ) | | | (99,391 | ) | | | -0.22 | % |
| EURO STOXX 50 Jun18 | | | (122 | ) | | | (91,377 | ) | | | -0.20 | % |
| FTSE 100 IDX FUT Jun18 | | | (35 | ) | | | (204,475 | ) | | | -0.46 | % |
| | | | | | | | (395,243 | ) | | | -0.88 | % |
| TOTAL SHORTS | | | | | | $ | (899,621 | ) | | | -2.01 | % |
| | | | | | | | | | | | | |
| REMAINING SECURITIES, CASH AND OTHER ASSETS AND LIABILITIES | | | | | | $ | 42,722,921 | | | | 95.45 | % |
| TOTAL VALUE | | | | | | $ | 44,757,707 | | | | | |
PSAM HIGHLAND
| Description | | Principal/ Shares/Notional | | | Value | | | Percentage
of Value | |
| LONG SECURITIES | | | | | | | | | | | | |
| COMMON STOCKS | | | | | | | | | | | | |
| ABLYNX | | | 10,063 | | | $ | 544,175 | | | | 1.00 | % |
| Aetna Inc. | | | 15,436 | | | | 2,763,685 | | | | 5.06 | % |
| Alpine Electronics | | | 19,261 | | | | 368,034 | | | | 0.67 | % |
| Altaba Inc. | | | 5,576 | | | | 390,740 | | | | 0.72 | % |
| Calpine Corp. | | | 58,049 | | | | 885,212 | | | | 1.62 | % |
| Conduent Inc. | | | 44,824 | | | | 872,241 | | | | 1.60 | % |
| Dell Technologies Inc. - Class V | | | 15,558 | | | | 1,116,566 | | | | 2.04 | % |
| Grupo Televisa SA | | | 47,942 | | | | 859,086 | | | | 1.57 | % |
| Hain Celestial Group Inc. | | | 17,659 | | | | 514,393 | | | | 0.94 | % |
| Kapstone Paper And Packaging | | | 29,061 | | | | 1,000,241 | | | | 1.83 | % |
| Linn Energy Inc. | | | 44,551 | | | | 1,746,323 | | | | 3.20 | % |
| McKesson Europe AG | | | 56,188 | | | | 1,791,309 | | | | 3.28 | % |
| Microsemi Corp. | | | 16,647 | | | | 1,076,868 | | | | 1.97 | % |
| Monsanto Co. | | | 15,982 | | | | 2,003,558 | | | | 3.67 | % |
| Nxp Semiconductors NV | | | 34,341 | | | | 3,602,219 | | | | 6.59 | % |
| Ocean Outdoor Ltd | | | 29,314 | | | | 280,671 | | | | 0.51 | % |
| Qurate Retail Inc. | | | 42,601 | | | | 997,246 | | | | 1.83 | % |
| Schulman (A.) Inc. | | | 28,633 | | | | 1,234,187 | | | | 2.26 | % |
| TDC A/S | | | 184,204 | | | | 1,500,265 | | | | 2.75 | % |
| Telecom Italia | | | 1,937,716 | | | | 1,914,578 | | | | 3.50 | % |
| Time Warner Inc. | | | 36,388 | | | | 3,464,069 | | | | 6.34 | % |
| Trinity Industries Inc. | | | 28,644 | | | | 912,858 | | | | 1.67 | % |
| Twenty-First Century Fox - Class A | | | 14,842 | | | | 542,619 | | | | 0.99 | % |
| VIVENDI | | | 23,383 | | | | 618,107 | | | | 1.13 | % |
| Xl Group Ltd. | | | 31,665 | | | | 1,760,193 | | | | 3.22 | % |
| | | | | | | | 32,759,443 | | | | 59.96 | % |
| CORPORATE BONDS | | | | | | | | | | | | |
| Bruce Mansfield, 6.85%, 06-01-2034 | | | 1,902,333 | | | | 598,100 | | | | 1.09 | % |
| Genon Energy Inc, 9.50%, 10-15-2018 | | | 758,465 | | | | 619,072 | | | | 1.13 | % |
| Genon Energy Inc, 9.875%, 10-15-2020 | | | 1,151,154 | | | | 941,390 | | | | 1.72 | % |
| Genon Energy Inc., 7.875%, 06-15-2018 | | | 509,336 | | | | 425,278 | | | | 0.78 | % |
| Hexion Inc., 10.375%, 02-01-2022 | | | 585,539 | | | | 584,600 | | | | 1.07 | % |
| Hexion Inc., 9.00%, 11-15-2020 | | | 713,709 | | | | 589,857 | | | | 1.08 | % |
| Mariposa Borrower Inc., 8.00%, 10-15-2021 | | | 1,094,652 | | | | 748,225 | | | | 1.37 | % |
| Monitronics International Inc., 9.125%, 04-01-2020 | | | 541,750 | | | | 387,392 | | | | 0.71 | % |
| Telecom Italia SPA, 5.303%, 05-30-2024 | | | 739,358 | | | | 769,451 | | | | 1.41 | % |
| | | | | | | | 5,663,365 | | | | 10.36 | % |
See Notes to Financial Statements.
22
| Highland Resolute Fund | Consolidated Schedule of Investments |
April 30, 2018
| Description | | Principal/ Shares/Notional | | | Value | | | Percentage
of Value | |
| EQUITY SWAPS | | | | | | | | | | | | |
| Altaba Inc. | | | 23,131 | | | | 727,821 | | | | 1.33 | % |
| Melrose Industries PLC | | | 176,705 | | | | 554,573 | | | | 1.01 | % |
| Sky PLC | | | 233,105 | | | | 1,321,935 | | | | 2.42 | % |
| | | | | | | | 2,604,329 | | | | 4.76 | % |
| OUTSTANDING FORWARD FOREIGN CURRENCY CONTRACTS | | | | | | | | | | | | |
| USD TO MXN FORWARD SD : 31-May-2018 | | | 842,276 | | | | 840,568 | | | | 1.54 | % |
| | | | | | | | 840,568 | | | | 1.54 | % |
| TOTAL LONG | | | | | | $ | 41,867,705 | | | | 76.62 | % |
| | | | | | | | | | | | | |
| SECURITIES SOLD SHORT | | | | | | | | | | | | |
| COMMON STOCKS | | | | | | | | | | | | |
| Alibaba Group Holding | | | (2,243 | ) | | | (400,406 | ) | | | -0.73 | % |
| At&T Inc. | | | (46,523 | ) | | | (1,544,488 | ) | | | -2.83 | % |
| Cvs Health Corp. | | | (8,286 | ) | | | (583,374 | ) | | | -1.07 | % |
| Unitedhealth Group Inc | | | (1,332 | ) | | | (314,827 | ) | | | -0.58 | % |
| Vmware Inc. - Class A | | | (4,694 | ) | | | (625,563 | ) | | | -1.14 | % |
| Walt Disney Co. | | | (8,552 | ) | | | (857,960 | ) | | | -1.57 | % |
| | | | | | | | (4,326,618 | ) | | | -7.92 | % |
| CORPORATE BONDS | | | | | | | | | | | | |
| Mattell Inc, 6.75%, 12-31-2025 | | | (370,831 | ) | | | (371,793 | ) | | | -0.68 | % |
| Pacific Gas & Electric, 3.5%, 10-01-2020 | | | (496,920 | ) | | | (500,313 | ) | | | -0.92 | % |
| Pacific Gas & Electric, 6.05%, 03-01-2034 | | | (592,453 | ) | | | (700,013 | ) | | | -1.28 | % |
| Vistra Energy Corp., 7.625%, 11-01-2024 | | | (243,553 | ) | | | (271,094 | ) | | | -0.50 | % |
| | | | | | | | (1,843,213 | ) | | | -3.38 | % |
| EQUITY SWAPS | | | | | | | | | | | | |
| Alibaba Group Holding Ltd. | | | (5,885 | ) | | | (278,151 | ) | | | -0.51 | % |
| | | | | | | | (278,151 | ) | | | -0.51 | % |
| OUTSTANDING FORWARD FOREIGN CURRENCY CONTRACTS | | | | | | | | | | | | |
| MXN TO USD FORWARD SD : 31-May-2018 | | | (15,780,112 | ) | | | (838,705 | ) | | | -1.54 | % |
| | | | | | | | (838,705 | ) | | | -1.54 | % |
| TOTAL SHORT | | | | | | $ | (7,286,687 | ) | | | -13.35 | % |
| | | | | | | | | | | | | |
| REMAINING SECURITIES, CASH AND OTHER ASSETS AND LIABILITIES | | | | | | $ | 20,057,187 | | | | 36.73 | % |
| TOTAL VALUE | | | | | | $ | 54,638,205 | | | | | |
WABR CAYMAN COMPANY LIMITED
| Description | | Principal/Shares | | | Value | | | Percentage
of Value | |
| LONG SECURITIES | | | | | | | | | | | | |
| COMMON STOCKS | | | | | | | | | | | | |
| American Campus Communities | | | 12,960 | | | $ | 506,866 | | | | 1.35 | % |
| American Homes 4 Rent Class A REIT | | | 16,313 | | | | 329,523 | | | | 0.88 | % |
| Apartment Invt & Mgmt Co. - Class A | | | 10,203 | | | | 414,242 | | | | 1.11 | % |
| Avalonbay Communities Inc. | | | 4,557 | | | | 742,791 | | | | 1.98 | % |
| Boston Properties Inc. | | | 4,489 | | | | 545,009 | | | | 1.45 | % |
| Corporate Office Properties | | | 16,319 | | | | 448,936 | | | | 1.20 | % |
| Eastgroup Properties Inc. | | | 4,492 | | | | 403,292 | | | | 1.08 | % |
| Equity Lifestyle Properties | | | 4,548 | | | | 405,500 | | | | 1.08 | % |
| Hudson Pacific Properties Inc. | | | 13,680 | | | | 449,662 | | | | 1.20 | % |
| iShares 7-10 Year Treasury Bond ETF | | | 39,612 | | | | 4,028,540 | | | | 10.76 | % |
| iShares Iboxx Investment Grade | | | 34,915 | | | | 4,022,906 | | | | 10.75 | % |
| iShares Iboxx USD High Yield Corporate Bond Fund ETF | | | 48,079 | | | | 4,120,370 | | | | 11.01 | % |
See Notes to Financial Statements.
| Annual Report | April 30, 2018 | 23 |
| Highland Resolute Fund | Consolidated Schedule of Investments |
April 30, 2018
| Description | | Principal/Shares | | | Value | | | Percentage
of Value | |
| COMMON STOCKS (CONTINUED) | | | | | | | | | | | | |
| Kilroy Realty Corp. | | | 5,256 | | | | 376,698 | | | | 1.01 | % |
| Liberty Property Trust | | | 13,287 | | | | 555,662 | | | | 1.48 | % |
| Paramount Group Inc. | | | 31,481 | | | | 451,752 | | | | 1.21 | % |
| Pwr S&P 500 Eqqual Weight | | | 20,060 | | | | 2,002,991 | | | | 5.35 | % |
| Vici Properties Inc. | | | 43,200 | | | | 785,376 | | | | 2.10 | % |
| | | | | | | | 20,590,116 | | | | 55.00 | % |
| CORPORATE BONDS | | | | | | | | | | | | |
| Aleris International Inc., 7.8750%, 11-01-2020 | | | 1,480,000 | | | | 1,465,200 | | | | 3.91 | % |
| Citgo Holding Inc., 10.75% , 02-15-2020 | | | 600,000 | | | | 638,250 | | | | 1.71 | % |
| Citgo Petroleum Corp., 6.25%, 08-15-2022 | | | 370,000 | | | | 371,850 | | | | 0.99 | % |
| Cvs Health Corp., 5.05%, 03-25-2048 | | | 340,000 | | | | 348,426 | | | | 0.93 | % |
| Djo Finance LLC/DJO Finance Corp., 8.125%, 06-15-2021 | | | 340,000 | | | | 342,975 | | | | 0.92 | % |
| General Mills Inc., 4.20%, 04-17-2028 | | | 345,000 | | | | 341,637 | | | | 0.91 | % |
| Global A&T Electronics, 8.50%, 01-12-2023 | | | 400,000 | | | | 402,000 | | | | 1.07 | % |
| Hexion Inc., 10.375%, 02-01-2022 | | | 370,000 | | | | 359,825 | | | | 0.96 | % |
| HSBC 3H, Floating Rate, 04-27-2049 | | | 510,000 | | | | 448,392 | | | | 1.20 | % |
| K Hovnanian Enterprises, 10.50%, 07-15-2024 | | | 560,000 | | | | 575,400 | | | | 1.54 | % |
| Natural Resource Partners LP, 10.50%, 03-15-2022 | | | 545,000 | | | | 585,875 | | | | 1.57 | % |
| Teekay Offshore Partners, 6.00%, 07-30-2019 | | | 866,000 | | | | 869,248 | | | | 2.32 | % |
| Vertiv Group Corp., 9.25%, 10-15-2024 | | | 370,000 | | | | 375,550 | | | | 1.00 | % |
| | | | | | | | 7,124,628 | | | | 19.03 | % |
| GOVERNMENT BONDS | | | | | | | | | | | | |
| US TREASURY BOND, 2.75%, 11-15-2047 | | | 1,058,000 | | | | 987,325 | | | | 2.64 | % |
| US TREASURY NOTE, 2.125%, 09-30-2024 | | | 346,000 | | | | 330,803 | | | | 0.88 | % |
| | | | | | | | 1,318,128 | | | | 3.52 | % |
| TOTAL LONG | | | | | | $ | 29,032,872 | | | | 77.55 | % |
| | | | | | | | | | | | | |
| SHORT SECURITIES | | | | | | | | | | | | |
| COMMON STOCKS | | | | | | | | | | | | |
| Alexandria Real Estate Equity | | | (3,096 | ) | | | (385,669 | ) | | | -1.03 | % |
| Brandywine Realty Trust | | | (23,054 | ) | | | (371,400 | ) | | | -0.99 | % |
| Douglas Emmett Inc. | | | (11,376 | ) | | | (423,983 | ) | | | -1.13 | % |
| Duke Realty Corp. | | | (15,183 | ) | | | (411,459 | ) | | | -1.10 | % |
| Education Realty Trust Inc. | | | (15,480 | ) | | | (509,447 | ) | | | -1.36 | % |
| Equity Residential | | | (8,261 | ) | | | (509,786 | ) | | | -1.36 | % |
| Essex Property Trust Inc. | | | (1,384 | ) | | | (331,731 | ) | | | -0.89 | % |
| Ishares 20+ Year Treasury Bond | | | (2,880 | ) | | | (343,008 | ) | | | -0.92 | % |
| Mid-America Apartment Communities | | | (4,208 | ) | | | (384,864 | ) | | | -1.03 | % |
| Sl Green Realty Corp. | | | (5,875 | ) | | | (574,223 | ) | | | -1.53 | % |
| SPDR Bloomberg Barclays High Yield Bond ETF | | | (32,928 | ) | | | (1,181,127 | ) | | | -3.15 | % |
| Vanguard Real Estate ETF | | | (6,768 | ) | | | (514,977 | ) | | | -1.38 | % |
| Vornado Realty Trust | | | (6,942 | ) | | | (472,264 | ) | | | -1.26 | % |
| | | | | | | | (6,413,938 | ) | | | -17.13 | % |
| CORPORATE BONDS | | | | | | | | | | | | |
| Gamestop Corp., 6.75%, 03-15-2021 | | | (403,000 | ) | | | (410,052 | ) | | | -1.10 | % |
| GE Capital International Funding, 4.4180%, 11-15-2035 | | | (1,075,000 | ) | | | (1,034,126 | ) | | | -2.76 | % |
| Standard Chartered PLC, 4.30%, 02-19-2027 | | | (365,000 | ) | | | (356,322 | ) | | | -0.95 | % |
| | | | | | | | (1,800,500 | ) | | | -4.81 | % |
See Notes to Financial Statements.
24
| Highland Resolute Fund | Consolidated Schedule of Investments |
April 30, 2018
| Description | | Principal/Shares | | | Value | | | Percentage
of Value | |
| GOVERNMENT BONDS | | | | | | | | | | | | |
| Republic of Turkey, 7.3750%, 02-05-2025 | | | (330,000 | ) | | | (363,413 | ) | | | -0.97 | % |
| US Treasury Note, 2.7500%, 02-15-2028 | | | (865,000 | ) | | | (851,531 | ) | | | -2.28 | % |
| | | | | | | | (1,214,943 | ) | | | -3.25 | % |
| TOTAL SHORT | | | | | | $ | (9,429,382 | ) | | | -25.19 | % |
| | | | | | | | | | | | | |
| REMAINING SECURITIES, CASH AND OTHER ASSETS AND LIABILITIES | | | | | | $ | 17,832,956 | | | | 47.64 | % |
| TOTAL VALUE | | | | | | $ | 37,436,446 | | | | | |
Common Abbreviations:
AQR - AQR Capital Management LLC.
BBA - British Bankers Association.
EURIBOR - Euro Interbank Offered Rate.
LIBOR - London Interbank Offered Rate.
PIMCO - Pacific Investment Management Company.
S&P - Standard & Poor's.
SPDR - Standard & Poor's Depositary Receipt.
Currency Abbreviations:
AUD - Australian Dollar
EUR - Euro
GBP - Great British Pound
HKD - Hong Kong Dollar
INR - India Rupee
JPY - Japan Yen
KRW - South Korea Won
MXN - Mexico Peso
NOK - Norwegian Krone
NZD - New Zealand Dollar
PLN - Poland Zloty
SEK - Swedish Krona
SGD - Singapore Dollar
USD - United States Dollar
See Notes to Financial Statements.
| Annual Report | April 30, 2018 | 25 |
| Highland Resolute Fund | Consolidated Statement of Assets and Liabilities |
April 30, 2018
| | | Highland Resolute Fund | |
| ASSETS | | | |
| Investments, at value | | $ | 286,619,065 | |
| Unrealized appreciation on total return swap contracts | | | 281,594 | |
| Deposits with brokers for securities sold short | | | 18,934,809 | |
| Deposits with brokers for total return swap contracts | | | 88,584,198 | |
| Cash | | | 776 | |
| Foreign currency, at value (Cost $695) | | | 676 | |
| Receivable for investments sold | | | 451,753 | |
| Receivable for shares sold | | | 84,000 | |
| Dividends receivable | | | 212,927 | |
| Interest receivable | | | 1,073,894 | |
| Other assets | | | 45,084 | |
| Total assets | | | 396,288,776 | |
| LIABILITIES | | | | |
| Securities sold short (Proceeds $19,667,238) | | | 19,539,515 | |
| Unrealized depreciation on total return swap contracts | | | 458,163 | |
| Investment advisory fees payable | | | 104,110 | |
| Distributions and service fees payable | | | 82,044 | |
| Payable for interest expense on securities sold short | | | 162,574 | |
| Payable for interest expense on total return swap contracts | | | 37,359 | |
| Payable for total return swap reset | | | 1,204,430 | |
| Payable for investments purchased | | | 627,381 | |
| Trustee fees and expenses payable | | | 3,723 | |
| Chief compliance officer fee payable | | | 7,437 | |
| Principal financial officer fees payable | | | 1,667 | |
| Administration fees payable | | | 61,019 | |
| Transfer agent fees payable | | | 18,288 | |
| Professional fees payable | | | 57,222 | |
| Custody fees payable | | | 18,273 | |
| Accrued expenses and other liabilities | | | 40,652 | |
| Total liabilities | | | 22,423,857 | |
| NET ASSETS | | $ | 373,864,919 | |
| NET ASSETS CONSIST OF | | | | |
| Paid-in capital (Note 6) | | $ | 356,278,826 | |
| Accumulated net income | | | 5,245,979 | |
| Accumulated net realized gain | | | 9,932,865 | |
| Net unrealized appreciation | | | 2,407,249 | |
| NET ASSETS | | $ | 373,864,919 | |
| INVESTMENTS, AT COST | | $ | 284,162,430 | |
| PRICING OF SHARES | | | | |
| Class I: | | | | |
| Net Asset Value, offering and redemption price per share | | $ | 10.81 | |
| Net Assets | | $ | 373,864,919 | |
| Shares of beneficial interest outstanding (unlimited number of shares, no par value common stock authorized) | | | 34,589,249 | |
See Notes to Financial Statements.
26
| Highland Resolute Fund | Consolidated Statement of Operations |
For the Year Ended April 30, 2018
| | | Highland Resolute Fund(a) | |
| INVESTMENT INCOME | | | |
| Dividends | | $ | 6,636,312 | |
| Interest | | | 5,846,515 | |
| Foreign taxes withheld | | | (6,028 | ) |
| Total investment income | | | 12,476,799 | |
| | | | | |
| EXPENSES | �� | | | |
| Investment advisory fees (Note 7) | | | 6,121,602 | |
| Investment advisory fee-subsidiary | | | 291,085 | |
| Broker fees and charges on securities sold short | | | 45,274 | |
| Administration fees | | | 275,265 | |
| Transfer agency fees | | | 61,157 | |
| Distribution and service fees | | | | |
| Class I | | | 82,044 | |
| Professional fees | | | 87,736 | |
| Custody fees | | | 66,374 | |
| Reports to shareholders and printing fees | | | 7,434 | |
| Trustee fees and expenses | | | 12,664 | |
| Registration/filing fees | | | 6,983 | |
| Chief compliance officer fees | | | 53,870 | |
| Principal financial officer fees | | | 10,000 | |
| Offering costs | | | 14,866 | |
| Dividend expense on securities sold short | | | 378,580 | |
| Interest expense on securities sold short | | | 660,959 | |
| Other | | | 23,862 | |
| Total expenses before waivers | | | 8,199,755 | |
| Less fees waived/reimbursed by investment adviser (Note 7) | | | | |
| Class I | | | (4,582,706 | ) |
| Waiver of investment advisory fees - subsidiary (Note 7) | | | (291,085 | ) |
| Total net expenses | | | 3,325,964 | |
| NET INVESTMENT INCOME | | | 9,150,835 | |
| Net realized gain on investments | | | 15,997,511 | |
| Net realized loss on securities sold short | | | (4,123,967 | ) |
| Net realized gain on total return swap contracts | | | 10,884,941 | |
| Net realized gain on foreign currency transactions | | | 234,814 | |
| Total net realized gain | | | 22,993,299 | |
| | | | | |
| Net change in unrealized depreciation on investments | | | (10,547,625 | ) |
| Net change in unrealized appreciation on securities sold short | | | 1,708,592 | |
| Net change in unrealized appreciation on total return swap contracts | | | 427,533 | |
| Net change in unrealized depreciation on translation of assets and liabilities in foreign currency transactions | | | (3,124 | ) |
| Total net change in unrealized depreciation | | | (8,414,624 | ) |
| NET REALIZED AND UNREALIZED GAIN ON INVESTMENTS | | | 14,578,675 | |
| NET INCREASE IN NET ASSETS RESULTING FROM OPERATIONS | | $ | 23,729,510 | |
| (a) | Prior to August 31, 2017 the Highland Resolute Fund was known as the Redmont Resolute Fund. |
See Notes to Financial Statements.
| Annual Report | April 30, 2018 | 27 |
| Highland Resolute Fund | Consolidated Statements of Changes in Net Assets |
| | | Highland Resolute Fund | |
| | | For the
Year Ended
April 30, 2018(a) | | | For the
Year Ended
April 30, 2017(b) | |
| OPERATIONS | | | | | | |
| Net investment income | | $ | 9,150,835 | | | $ | 5,052,253 | |
| Net realized gain | | | 22,993,299 | | | | 16,865,746 | |
| Net realized gain distributions from other investment companies | | | — | | | | 2,574,206 | |
| Net change in unrealized appreciation/(depreciation) | | | (8,414,624 | ) | | | 4,159,454 | |
| Net increase in net assets resulting from operations | | | 23,729,510 | | | | 28,651,659 | |
| DISTRIBUTIONS (NOTE 4) | | | | | | | | |
| Net investment income | | | | | | | | |
| Class I | | | (25,692,479 | ) | | | (6,470,084 | ) |
| Net realized gains on investments | | | | | | | | |
| Class I | | | (6,351,925 | ) | | | (778,253 | ) |
| Net decrease in net assets from distributions | | | (32,044,404 | ) | | | (7,248,337 | ) |
| BENEFICIAL INTEREST TRANSACTIONS (NOTE 6) | | | | | | | | |
| Shares sold | | | | | | | | |
| Class I | | | 101,112,642 | | | | 139,235,368 | |
| Dividends reinvested | | | | | | | | |
| Class I | | | 32,044,404 | | | | 7,248,336 | |
| Shares redeemed, net of redemption fees | | | | | | | | |
| Class I | | | (242,788,583 | ) | | | (362,734,552 | ) |
| Net decrease in net assets derived from beneficial interest transactions | | | (109,631,537 | ) | | | (216,250,848 | ) |
| Net decrease in Net Assets | | | (117,946,431 | ) | | | (194,847,526 | ) |
| NET ASSETS: | | | | | | | | |
| Beginning of period | | | 491,811,350 | | | | 686,658,876 | |
| End of period* | | $ | 373,864,919 | | | $ | 491,811,350 | |
| * Includes accumulated net investment income of: | | $ | 5,245,979 | | | $ | 10,952,159 | |
(a) Prior to August 31, 2017 the Highland Resolute Fund was known as the Redmont Resolute Fund.
(b) Prior to August 31, 2016 the Highland Resolute Fund was known as the Redmont Resolute Fund II.
See Notes to Financial Statements.
28
| Highland Resolute Fund | Consolidated Financial Highlights |
For a share outstanding throughout the periods presented
| | | Class I | |
| | | For the
Year Ended
April 30,
2018(a) | | | For the
Year Ended
April 30,
2017(b) | | | For the
Year Ended
April 30,
2016 | | | For the
Year Ended
April 30,
2015 | | | For the
Year Ended
April 30,
2014 | |
| | | | | | | | | | | | | | | | |
| NET ASSET VALUE, BEGINNING OF PERIOD | | $ | 11.14 | | | $ | 10.75 | | | $ | 11.32 | | | $ | 11.18 | | | $ | 11.05 | |
| INCOME/(LOSS) FROM OPERATIONS | | | | | | | | | | | | | | | | | | | | |
| Net investment income(c) | | | 0.25 | | | | 0.09 | | | | 0.16 | | | | 0.20 | | | | 0.13 | |
| Net realized and unrealized gain/(loss) on investments | | | 0.38 | | | | 0.45 | | | | (0.39 | ) | | | 0.26 | | | | 0.19 | |
| Total from Investment Operations | | | 0.63 | | | | 0.54 | | | | (0.23 | ) | | | 0.46 | | | | 0.32 | |
| | | | | | | | | | | | | | | | | | | | | |
| LESS DISTRIBUTIONS | | | | | | | | | | | | | | | | | | | | |
| Net investment income | | | (0.77 | ) | | | (0.13 | ) | | | (0.18 | ) | | | (0.24 | ) | | | (0.11 | ) |
| Net realized gain on investments | | | (0.19 | ) | | | (0.02 | ) | | | (0.16 | ) | | | (0.08 | ) | | | (0.08 | ) |
| Total Distributions | | | (0.96 | ) | | | (0.15 | ) | | | (0.34 | ) | | | (0.32 | ) | | | (0.19 | ) |
| NET INCREASE/(DECREASE) IN NET ASSET VALUE | | | (0.33 | ) | | | 0.39 | | | | (0.57 | ) | | | 0.14 | | | | 0.13 | |
| NET ASSET VALUE, END OF PERIOD | | $ | 10.81 | | | $ | 11.14 | | | $ | 10.75 | | | $ | 11.32 | | | $ | 11.18 | |
| TOTAL RETURN(d) | | | 5.51 | % | | | 5.04 | % | | | (2.02 | )% | | | 4.16 | % | | | 2.85 | % |
| | | | | | | | | | | | | | | | | | | | | |
| RATIOS/SUPPLEMENTAL DATA | | | | | | | | | | | | | | | | | | | | |
| Net assets, End of Period (000s) | | $ | 373,865 | | | $ | 491,811 | | | $ | 686,659 | | | $ | 689,266 | | | $ | 604,949 | |
| RATIOS TO AVERAGE NET ASSETS: | | | | | | | | | | | | | | | | | | | | |
| Operating expenses excluding reimbursement/waiver(e) | | | 1.94 | %(f)(g) | | | 1.77 | %(f)(g) | | | 1.69 | %(f) | | | 1.68 | %(f) | | | 1.69 | %(f) |
| Operating expenses including reimbursement/waiver(e) | | | 0.82 | %(f) | | | 0.52 | %(f) | | | 0.35 | %(f) | | | 0.33 | %(f) | | | 0.29 | %(f) |
| Net investment income including reimbursement/waiver(e) | | | 2.24 | % | | | 0.86 | % | | | 1.49 | % | | | 1.79 | % | | | 1.19 | % |
| PORTFOLIO TURNOVER RATE | | | 79 | % | | | 94 | % | | | 27 | % | | | 54 | % | | | 114 | % |
| | | | | | | | | | | | | | | | | | | | | |
| (a) | Prior to August 31, 2017 the Highland Resolute Fund was known as the Redmont Resolute Fund. |
| (b) | Prior to August 31, 2016 the Highland Resolute Fund was known as the Redmont Resolute Fund II. |
| (c) | Calculated using the average shares method. |
| (d) | Total investment return is calculated assuming a purchase of a common share at the opening of the first day and a sale at closing on the last day of each period reported. Dividends and distributions, if any, are assumed for purposes of this calculation to be reinvested at prices obtained under the Fund's dividend reinvestment plan. Total returns would have been lower had certain expenses not been waived during the period. Total investment returns do not reflect brokerage commissions, if any, and are not annualized. |
| (e) | The ratios exclude the impact of expenses of the underlying funds in which the Fund invests as represented in the Schedule of Investments. |
| (f) | Dividend and interest expense on securities sold short totaled 0.25%, 0.10%, 0.08%, 0.10%, and 0.08% of average net assets for the years ended April 30, 2018, 2017, 2016, 2015, and 2014, respectively. |
| (g) | The ratio of operating expenses excluding fee waiver/reimbursements to average net assets is calculated excluding the waived Subsidiary management fee (See Note 7 for additional detail). The ratio inclusive of that fee would be 2.01% and 1.81% for the years ended April 30, 2018 and 2017, respectively. |
See Notes to Financial Statements.
| Annual Report | April 30, 2018 | 29 |
| Highland Resolute Fund | Notes to Consolidated Financial Statements |
April 30, 2018
1. ORGANIZATION
Financial Investors Trust (the “Trust”), a Delaware statutory trust, is an open-end management investment company registered under the Investment Company Act of 1940, as amended (“1940 Act”). The Trust consists of multiple separate portfolios or series. This annual report describes the Highland Resolute Fund (the “Fund”). Effective August 31, 2017, the Fund changed its name from Redmont Resolute Fund. The Fund seeks to provide long-term total return with reduced volatility and reduced correlation to the conventional stock and bond markets. The Fund offers Class I shares.
Basis of Consolidation: Highland Resolute Cayman (the “Subsidiary”), a Cayman Islands exempted company, is a wholly owned subsidiary of the Fund. The Subsidiary’s investment objective is designed to enhance the ability of the Fund to obtain exposure to equities, financial, currency and commodities markets consistent with the limits of the U.S. federal tax law requirements applicable to registered investment companies. The Subsidiary is subject to substantially the same investment policies and investment restrictions as the Fund. The Subsidiary acts as an investment vehicle for the Fund in order to effect certain commodity-related investments on behalf of the Fund. Investments in the Subsidiary are expected to provide the Fund with exposure to the commodity markets within the limitations of Subchapter M of the Internal Revenue Code of 1986, as amended (the “Code”), and recent IRS revenue rulings, as discussed below under “Federal Income Taxes”. The Fund is the sole shareholder of the Subsidiary pursuant to a subscription agreement, and it is intended that the Fund will remain the sole shareholder and will continue to control the Subsidiary. Under the Articles of Association of the Subsidiary, shares issued by the Subsidiary confer upon a shareholder the right to wholly own and vote at general meetings of the Subsidiary and certain rights in connection with any winding-up or repayment of capital, as well as the right to participate in the profits or assets of the Subsidiary. The Fund may invest up to 25% of its total assets in shares of the Subsidiary. As a wholly owned subsidiary of the Fund, all assets and liabilities, income and expenses of the Subsidiary are consolidated in the financial statements and financial highlights of the Fund. All investments held by the Subsidiary are disclosed in the accounts of the Fund. As of April 30, 2018, net assets of the Fund were $373,864,919, of which $18,136,197 or 4.85%, represented the Fund’s ownership of all issued shares and voting rights of the Subsidiary.
2. SIGNIFICANT ACCOUNTING POLICIES
The accompanying financial statements were prepared in accordance with accounting principles generally accepted in the United States of America (“U.S. GAAP”). The preparation of financial statements in conformity with U.S. GAAP requires management to make certain estimates and assumptions that affect the reported amounts of assets and liabilities and disclosures of contingent assets and liabilities at the date of the financial statements and the reported amounts of revenue and expenses during the period. Actual results could differ from those estimates. The Fund is considered an investment company for financial reporting purposes under U.S. GAAP and follows the accounting and reporting guidance applicable to investment companies in the Financial Accounting Standards Board Accounting Standards Codification Topic 946. The following is a summary of significant accounting policies consistently followed by the Fund and Subsidiary in preparation of the financial statements.
Investment Valuation: The Fund generally values its securities based on market prices determined at the close of regular trading on the New York Stock Exchange (“NYSE”), normally 4:00 p.m. Eastern Time, on each day the NYSE is open for trading.
For equity securities and mutual funds that are traded on an exchange, the market price is usually the closing sale or official closing price on that exchange. In the case of equity securities not traded on an exchange, or if such closing prices are not otherwise available, the securities are valued at the mean of the most recent bid and ask prices on such day. Redeemable securities issued by open-end registered investment companies are valued at the investment company’s applicable net asset value, with the exception of exchange-traded open-end investment companies, which are priced as equity securities.
The market price for debt obligations is generally the price supplied by an independent third-party pricing service approved by the Board of Trustees (the “Board”), which may use a matrix, formula or other objective method that takes into consideration quotations from dealers, market transactions in comparable investments, market indices and yield curves. If vendors are unable to supply a price, or if the price supplied is deemed to be unreliable, the market price may be determined using quotations received from one or more brokers-dealers that make a market in the security. Municipal securities having a remaining maturity of greater than 60 days, are typically valued at the evaluated bid price formulated by an independent pricing service. Corporate Bonds, U.S. Government & Agency, and U.S. Treasury Bonds & Notes are valued using market models that consider trade data, quotations from dealers and active market makers, relevant yield curve and spread data, creditworthiness, trade data or market information on comparable securities, and other relevant security specific information. Mortgage-related and asset-backed securities are valued based on models that consider trade data, prepayment and default projections, benchmark yield and spread data and estimated cash flows of each tranche of the issuer. Publicly traded foreign government debt securities are typically traded internationally in the over-the-counter market and are valued at the mean between the bid and asked prices as of the close of business of that market.
30
| Highland Resolute Fund | Notes to Consolidated Financial Statements |
April 30, 2018
Futures contracts that are listed or traded on a national securities exchange, commodities exchange, contract market or comparable over the counter market, and that are freely transferrable, are valued at their closing settlement price on the exchange on which they are primarily traded or based upon the current settlement price for a like instrument acquired on the day on which the instrument is being valued. A settlement price may not be used if the market makes a limit move with respect to a particular commodity. Over-the-counter swap contracts for which market quotations are readily available are valued based on quotes received from independent pricing services or one or more dealers that make markets in such securities. Options contracts listed for trading on a securities exchange or board of trade are valued at the last quoted sales price or, in the absence of a sale at the mean of the last bid and asked price.
Forward currency exchange contracts have a fair value determined by the current foreign currency exchange forward rates. The foreign currency exchange forward rates are calculated using an automated system that estimates rates on the basis of the current day foreign currency exchange rates and forward foreign currency exchange rates supplied by a pricing service. Foreign exchange rates and forward foreign currency exchange rates may generally be obtained at the close of the NYSE, normally 4:00 p.m. Eastern Time.
When such prices or quotations are not available, or when Highland Associates, Inc. (the “Adviser”) believes that they are unreliable, securities may be priced using fair value procedures approved by the Board.
Fair Value Measurements: The Fund discloses the classification of its fair value measurements following a three-tier hierarchy based on the inputs used to measure fair value. Inputs refer broadly to the assumptions that market participants would use in pricing the asset or liability, including assumptions about risk. Inputs may be observable or unobservable. Observable inputs reflect the assumptions market participants would use in pricing the asset or liability that are developed based on market data obtained from sources independent of the reporting entity. Unobservable inputs reflect the reporting entity’s own assumptions about the assumptions market participants would use in pricing the asset or liability that are developed based on the best information available.
Various inputs are used in determining the value of the Fund’s investments as of the end of the reporting period. When inputs used fall into different levels of the fair value hierarchy, the level in the hierarchy within which the fair value measurement falls is determined based on the lowest level input that is significant to the fair value measurement in its entirety. The designated input levels are not necessarily an indication of the risk or liquidity associated with these investments. These inputs are categorized in the following hierarchy under applicable financial accounting standards:
| Level 1 – | Unadjusted quoted prices in active markets for identical investments, unrestricted assets or liabilities that the Fund has the ability to access at the measurement date; |
| Level 2 – | Quoted prices which are not active, quoted prices for similar assets or liabilities in active markets or inputs other than quoted prices that are observable (either directly or indirectly) for substantially the full term of the asset or liability; and |
| Level 3 – | Significant unobservable prices or inputs (including the Fund’s own assumptions in determining the fair value of investments) where there is little or no market activity for the asset or liability at the measurement date. |
| Annual Report | April 30, 2018 | 31 |
| Highland Resolute Fund | Notes to Consolidated Financial Statements |
April 30, 2018
The following is a summary of the inputs used to value the Fund’s investments as of April 30, 2018:
Highland Resolute Fund
| Investments in Securities at Value | | Level 1 -
Quoted Prices | | | Level 2 -
Other
Significant
Observable
Inputs | | | Level 3 -
Significant
Unobservable
Inputs | | | Total | |
| Closed End Funds | | $ | 1,788,161 | | | $ | – | | | $ | – | | | $ | 1,788,161 | |
| Common Stocks(*) | | | 38,815,253 | | | | – | | | | – | | | | 38,815,253 | |
| Open-End Mutual Funds | | | 148,702,791 | | | | – | | | | – | | | | 148,702,791 | |
| Purchased Put Options | | | 178,388 | | | | – | | | | – | | | | 178,388 | |
| Corporate Bonds(*) | | | – | | | | 70,558,700 | | | | – | | | | 70,558,700 | |
| Short Term Investments | | | | | | | | | | | | | | | | |
| Money Market Funds | | | 26,575,772 | | | | – | | | | – | | | | 26,575,772 | |
| Total | | $ | 216,060,365 | | | $ | 70,558,700 | | | $ | – | | | $ | 286,619,065 | |
| | | | | | | | | | | | | | | | | |
| Other Financial Instruments** | | | | | | | | | | | | | | | | |
| Assets: | | | | | | | | | | | | | | | | |
| Total Return Swap Contracts | | $ | – | | | $ | 281,594 | | | $ | – | | | $ | 281,594 | |
| Liabilities: | | | | | | | | | | | | | | | | |
| Corporate Bonds - Sold Short | | | – | | | $ | (10,695,964 | ) | | | – | | | $ | (10,695,964 | ) |
| Exchange Traded Funds Sold Short | | | (8,843,551 | ) | | | – | | | | – | | | | (8,843,551 | ) |
| Total Return Swap Contracts | | $ | – | | | $ | (458,163 | ) | | $ | – | | | $ | (458,163 | ) |
| Total | | | (8,843,551 | ) | | $ | (10,872,533 | ) | | | – | | | $ | (19,716,084 | ) |
| * | For detailed descriptions, see the accompanying Schedule of Investments. |
| ** | Other financial instruments are derivative instruments reflected in the Schedule of Investments. The derivatives shown in the table are reported at their unrealized appreciation/(depreciation) at measurement date, which represents the change in the contract’s value from trade date. |
The Fund recognizes transfers between levels as of the end of the period. For the year ended April 30, 2018, the Fund did not have any transfers between Level 1 and Level 2 securities. The following is a reconciliation of assets in which significant unobservable inputs (Level 3) were used in determining fair value:
| Investments in Securities at Value | | Balance as of 4/30/2017 | | | Return of Capital | | | Realized gain/(loss) | | | Change in unrealized appreciation/ (depreciation) | | | Purchases | | | Sales Proceeds | | | Transfer in and/or (out) of Level 3 | | | 4/30/2018 | | | Net change in unrealized appreciation/ (depreciation) attributable to Level 3 investments held at 4/30/2018 | |
| Common Stock | | $ | 107,200 | | | $ | – | | | $ | (60,947 | ) | | $ | (130,306 | ) | | $ | – | | | $ | 84,053 | | | $ | – | | | $ | – | | | $ | – | |
| Total | | $ | 107,200 | | | $ | – | | | $ | (60,947 | ) | | $ | (130,306 | ) | | $ | – | | | $ | 84,053 | | | $ | – | | | $ | – | | | $ | – | |
For the year ended April 30, 2018, the Fund did not have any securities that used significant unobservable inputs (Level 3) in determining fair value.
Trust Expenses: Some expenses of the Trust can be directly attributed to the Fund. Expenses which cannot be directly attributed to the Fund are apportioned among all funds in the Trust based on average net assets of the Fund.
Offering Costs: Offering costs, including costs of printing initial prospectuses, legal and registration fees, are being amortized over twelve months from the date the Subsidiary was established. Amounts amortized during the year ended April 30, 2018 for the Fund are shown on the Statements of Operations. As of April 30, 2018, the offering costs of the Fund have been fully amortized.
32
| Highland Resolute Fund | Notes to Consolidated Financial Statements |
April 30, 2018
Federal Income Taxes: The Fund complies with the requirements under Subchapter M of the Internal Revenue Code of 1986, as amended, applicable to regulated investment companies and intend to distribute substantially all of their net taxable income and net capital gains, if any, each year so that the Fund will not be subject to excise tax on undistributed income and gains. The Fund is not subject to income taxes to the extent such distributions are made.
As of and during the year ended April 30, 2018, the Fund did not have a liability for any unrecognized tax benefits. The Fund files U.S. federal, state, and local tax returns as required. The Fund’s tax returns are subject to examination by the relevant tax authorities until expiration of the applicable statute of limitations, which is generally three years after the filing of the tax return for federal purposes and four years for most state returns. Tax returns for open years have incorporated no uncertain tax positions that require a provision for income taxes.
Investment Transactions and Investment Income: Investment transactions are accounted for on the date the investments are purchased or sold (trade date basis). Net realized gains and losses from investment transactions are reported on an identified cost basis. Interest income, which includes accretion of discounts and amortization of premiums, is accrued and recorded as earned. Dividend income is recognized on the ex-dividend date or for certain foreign securities, as soon as information is available to the Fund. All of the realized and unrealized gains and losses and net investment income, are allocated daily to each class in proportion its average daily net assets.
Short Sales: The Fund may make short sales of securities consistent with its strategies. A short sale is a transaction in which a Fund sells a security it does not own in anticipation that the market price of that security will decline.
When a Fund makes a short sale, it must borrow the security sold short and deliver it to the broker dealer through which it made the short sale as collateral for its obligation to deliver the security upon conclusion of the sale. The Fund may have to pay a fee to borrow particular securities and is often obligated to pay over any accrued interest and dividends on such borrowed securities.
If the price of the security sold short increases between the time of the short sale and the time that a Fund replaces the borrowed security, the Fund will incur a loss; conversely, if the price declines, the Fund will realize a capital gain. Any gain will be decreased, and any loss increased, by the transaction costs described above. The successful use of short selling may be adversely affected by imperfect correlation between movements in the price of the security sold short and the securities being hedged.
To the extent that a Fund engages in short sales, it will provide collateral to the broker-dealer and (except in the case of short sales “against the box”) will maintain additional asset coverage in the form of segregated or “earmarked” assets determined to be liquid in accordance with procedures established by the Board and that is equal to the current market value of the securities sold short, or will ensure that such positions are covered by “offsetting” positions, until the Fund replaces the borrowed security. A short sale is “against the box” to the extent that the Fund contemporaneously owns, or has the right to obtain at no added cost, securities identical to those sold short. The Fund may engage in short selling to the extent permitted by the federal securities laws and rules and interpretations thereunder. To the extent a Fund engages in short selling in foreign (non-U.S.) jurisdictions, the Fund will do so to the extent permitted by the laws and regulations of such jurisdiction.
Distributions to Shareholders: The Fund normally pays dividends and distributes capital gains, if any, on an annual basis. Income dividend distributions are derived from interest and dividends and other income the Fund receives from their investments, including distributions of short term capital gains. Capital gain distributions are derived from gains realized when the Fund sells a security it has owned for more than a year. The Fund may make additional distributions and dividends at other times if its portfolio manager or managers believe doing so may be necessary for the Fund to avoid or reduce taxes.
3. DERIVATIVE INSTRUMENTS
Swap Contracts: The Fund may enter into swap transactions for hedging purposes or to seek to increase total return. At the present time, the Fund primarily enters into swap transactions for the purpose of increasing total return. Risks may arise as a result of the failure of the counterparty to the swap contract to comply with the terms of the swap contract. The loss incurred by the failure of a counterparty is generally limited to the net payment to be received by the Fund and/or the termination value at the end of the contract.
Therefore, the Fund considers the creditworthiness of each counterparty to a contract in evaluating potential credit risk. Additionally, risks may arise from unanticipated movements in interest rates or in the value of the underlying reference asset or index. Entering into these agreements involves, to varying degrees, market risk, liquidity risk and elements of credit, legal and documentation risk that are not directly reflected in the amounts recognized in the Statements of Assets and Liabilities.
| Annual Report | April 30, 2018 | 33 |
| Highland Resolute Fund | Notes to Consolidated Financial Statements |
April 30, 2018
The Fund invests in total return swaps to obtain exposure to a security or market without owning such security or investing directly in that market or to transfer the risk/return of one market (e.g., fixed income) to another market (e.g., equity) (equity risk and/or interest rate risk). Total return swaps are agreements in which there is an exchange of cash flows whereby one party commits to make payments based on the total return (coupons plus capital gains/losses) of an underlying instrument in exchange for fixed or floating rate interest payments. To the extent the total return of the instrument or index underlying the transaction exceeds or falls short of the offsetting interest rate obligation, the Fund will receive a payment from or make a payment to the counterparty. The Fund may pay or receive cash as collateral on these contracts which may be recorded as an asset and/or liability. The Fund must set aside liquid assets, or engage in other appropriate measures, to cover its obligations under these contracts. Swaps are marked to market daily using either pricing vendor quotations, counterparty prices or model prices and the change in value, if any, is recorded as an unrealized gain or loss. Upfront payments made and/or received by the Fund are recorded as an asset and/or liability and realized gains or losses are recognized ratably over the contract’s term/event, with the exception of forward starting interest rate swaps, whose realized gains or losses are recognized ratably from the effective start date. Periodic payments received or made on swap contracts are recorded as realized gains or losses. Gains or losses are realized upon termination of a swap contract and are recorded on the Statement of Operations. Swap agreements held at April 30, 2018 are disclosed in the Consolidated Schedule of Investments.
International Swaps and Derivatives Association, Inc. Master Agreements (“ISDA Master Agreements”) govern OTC financial derivative transactions entered into by the Fund and those counterparties. The ISDA Master Agreements maintain provisions for general obligations, representations, agreements, collateral and events of default or termination. Events of termination include conditions that may entitle counterparties to elect to terminate early and cause settlement of all outstanding transactions under the applicable ISDA Master Agreement. Any election to early terminate could be material to the financial statements.
Option Contracts: The Fund may enter into options transactions for hedging purposes and for non-hedging purposes such as seeking to enhance return. The Fund may write covered put and call options on any stocks or stock indices, currencies traded on domestic and foreign securities exchanges, or futures contracts on stock indices, interest rates and currencies traded on domestic and, to the extent permitted by the CFTC, foreign exchanges. A call option on an asset written by the Fund obligates the Fund to sell the specified asset to the holder (purchaser) at a stated price (the exercise price) if the option is exercised before a specified date (the expiration date). A put option on an asset written by a Fund obligates the Fund to buy the specified asset from the purchaser at the exercise price if the option is exercised before the expiration date. Premiums received when writing options are recorded as liabilities and are subsequently adjusted to the current value of the options written. Premiums received from writing options that expire are treated as realized gains. Premiums received from writing options, which are either exercised or closed, are offset against the proceeds received or amount paid on the transaction to determine realized gains or losses which are recorded on the Statement of Operations.
Futures: The Fund may enter into futures contracts for hedging purposes. A futures contract represents a commitment for the future purchase or sale of an asset at a specified price on a specified date. Upon entering into a futures contract, the Fund is required to deposit an initial margin with the broker in an amount equal to a certain percentage of the contract amount. The Fund receives from or pays to the broker, on a daily basis, an amount of cash equal to the daily fluctuation in value of the contract. Such receipts or payments are known as “variation margin,” and are recorded by the Fund as unrealized gains or losses. When the futures contract is closed, the Fund records a gain or loss equal to the difference between the value of the contract at the time it was opened and the value at the time it was closed.
The Fund’s potential losses from the use of futures extend beyond its initial investment in such contracts. The use of futures contracts involves, to varying degrees, elements of market risk in excess of the amount recognized in the Statements of Assets and Liabilities. The predominant risk is that the movement of a futures contract’s price may result in a loss, which could render the Fund’s hedging strategy unsuccessful. There is minimal counterparty credit risk since futures contracts are exchange traded and the exchange’s clearinghouse, as counterparty to all exchange traded futures, guarantees the futures against default.
34
| Highland Resolute Fund | Notes to Consolidated Financial Statements |
April 30, 2018
Risk Exposure: The following tables disclose the amounts related to the Fund’s use of derivative instruments.
The effect of derivatives instruments on the Statements of Assets and Liabilities as of April 30, 2018 was as follows:
| Risk Exposure | | Asset Derivatives Statements of Assets and Liabilities Location | | Fair Value | | | Liability Derivatives Statements of Assets and Liabilities Location | | Fair Value | |
| Highland Resolute Fund | | | | | | | | | | |
| Equity Contracts (Total Return Swap Contracts) | | Unrealized appreciation on total return swap contracts | | $ | 256,671 | | | Unrealized depreciation on total return swap contracts | | $ | 451,867 | |
| Interest Rate Contracts (Total Return Swap Contracts) | | Unrealized appreciation on total return swap contracts | | | 24,923 | | | Unrealized depreciation on total return swap contracts | | | 6,296 | |
| Equity Contracts (Purchased Options) | | Investments, at value | | | 178,388 | | | N/A | | | N/A | |
| Total | | | | $ | 459,982 | | | | | $ | 458,163 | |
The effect of derivatives instruments on the Statements of Operations for the year ended April 30, 2018 was as follows:
| Risk Exposure | | Statement of Operations Location | | Realized Gain/(Loss) on Derivatives Recognized in Income | | | Change in Unrealized Appreciation/
(Depreciation) on Derivatives Recognized in Income | |
| Highland Resolute Fund | | | | | | | | | | |
Equity Contracts
(Total Return Swap Contracts) | | Net realized gain on total return swap contracts/Net change in unrealized appreciation on total return swap contracts | | $ | 11,378,442 | | | $ | 408,906 | |
Interest Rate Contracts
(Total Return Swap Contracts) | | Net realized gain on total return swap contracts/Net change in unrealized depreciation on total return swap contracts | | $ | (493,501 | ) | | $ | 18,627 | |
Equity Contracts
(Purchased Options) | | Net realized loss on investments/Net change in unrealized depreciation on investments | | | (1,773,365 | ) | | | 5,644 | |
| Total | | | | $ | 9,111,576 | | | $ | 433,177 | |
| Annual Report | April 30, 2018 | 35 |
| Highland Resolute Fund | Notes to Consolidated Financial Statements |
April 30, 2018
Volume of Derivative Instruments for the Fund during the year ended April 30, 2018 was as follows:
| Derivative Type | Unit of Measurement | Monthly Average |
| Highland Resolute Fund | | |
| Total Return Swap Contracts | Notional Quantity | 188,547,956 |
| Purchased Options Contracts | Contracts | 527 |
Certain derivative contracts and repurchase agreements are executed under either standardized netting agreements or, for exchange-traded derivatives, the relevant contracts for a particular exchange which contain enforceable netting provisions. A derivative netting arrangement creates an enforceable right of set-off that becomes effective, and affects the realization of settlement on individual assets, liabilities and collateral amounts, only following a specified event of default or early termination. Default events may include the failure to make payments or deliver securities timely, material adverse changes in financial condition or insolvency, the breach of minimum regulatory capital requirements, or loss of license, charter or other legal authorization necessary to perform under the contract.
The following table presents financial instruments that are subject to enforceable netting arrangements or other similar agreements as of April 30, 2018:
Highland Resolute Fund
Offsetting of Derivatives Assets
| | | | | | | | | | | | Gross Amounts Not Offset in the Statement of
Assets and Liabilities |
| | | | Gross Amounts of Recognized Assets | | | | Gross Amounts Offset in the Statement of Assets and Liabilities | | | | Net Amounts Presented in the Statement of Assets and Liabilities | | | | Financial Instruments Available for Offset(a) | | | | Cash Collateral Received(a) | | | | Net Receivable Amount | |
| Total Return Swap Contracts | | $ | 281,594 | | | $ | – | | | $ | 281,594 | | | $ | (281,594 | ) | | $ | – | | | $ | – | |
| Total | | $ | 281,594 | | | $ | – | | | $ | 281,594 | | | $ | (281,594 | ) | | $ | – | | | $ | – | |
Highland Resolute Fund
Offsetting of Derivatives Liabilities
| | | | | | | | | | | | | | | | | | | |
| | | | | | | | | | | | Gross Amounts Not Offset in the Statement of
Assets and Liabilities |
| | | | Gross Amounts of Recognized Liabilities | | | | Gross Amounts Offset in the Statement of Financial Position | | | | Net Amounts Presented in the Statement of Financial Position | | | | Financial Instruments Available for Offset(a) | | | | Cash Collateral Pledged(a) | | | | Net Payable Amount | |
| Total Return Swap Contracts | | $ | 458,163 | | | $ | – | | | $ | 458,163 | | | $ | (281,594 | ) | | $ | (176,569 | ) | | $ | – | |
| Total | | $ | 458,163 | | | $ | – | | | $ | 458,163 | | | $ | (281,594 | ) | | $ | (176,569 | ) | | $ | – | |
| (a) | These amounts are limited to the derivative asset/liability balance and, accordingly, do not include excess collateral received/pledged. |
36
| Highland Resolute Fund | Notes to Consolidated Financial Statements |
April 30, 2018
4. TAX BASIS INFORMATION
Reclassifications: As of April 30, 2018, permanent differences in book and tax accounting were reclassified. These differences had no effect on net assets and were primarily attributed to differing book and tax treatment of investments in swaps, partnerships, and foreign currency. The reclassifications were as follows:
| | | | Undistributed Net Investment Income/(Loss) | | | Accumulated Net Realized Gain/(Loss) on Investments | | | Paid-in Capital | |
| Highland Resolute Fund | | $ | 10,835,464 | | $ | (10,926,876 | ) | $ | 91,412 | |
Tax Basis of Investments: As of April 30, 2018, the aggregate cost of investments, gross unrealized appreciation/(depreciation) and net unrealized appreciation for Federal tax purposes were as follows:
| | | | Gross Appreciation (excess of value over tax cost) | | | Gross Depreciation (excess of tax cost over value) | | Net Depreciation of Foreign Currency | | | Net Unrealized Appreciation | | | Cost of Investments for Income Tax Purposes | |
| Highland Resolute Fund | | $ | 238,120,806 | | $ | (236,529,479) | | $ | (540 | ) | | $ | 1,590,787 | | | $ | 285,399,786 | |
Components of Earnings: As of April 30, 2018, components of distributable earnings were as follows:
| | | | Accumulated Capital Gains | | | Undistributed Ordinary Income | | | Net Unrealized Appreciation | | | Other Cumulative Effect of Timing Differences | |
| Highland Resolute Fund | | | $ | 10,768,336 | | | $ | 5,226,970 | | | $ | 1,590,787 | | | $ | – | |
Tax Basis of Distributions to Shareholders: The character of distributions made during the year from net investment income or net realized gains may differ from its ultimate characterization for federal income tax purposes. Also, due to the timing of dividend distributions, the fiscal year in which amounts are distributed may differ from the fiscal year in which the income or realized gain were recorded by the Fund.
The tax character of distributions paid by the Fund for the fiscal year ended April 30, 2018, were as follows:
| | | Ordinary
Income | | | Long-Term
Capital Gains | |
| Highland Resolute Fund | | $ | 25,692,479 | | | $ | 6,351,925 | |
The tax character of distributions paid by the Fund for the fiscal year ended April 30, 2017, were as follows:
| | | Ordinary
Income | | | Long-Term
Capital Gains | |
| Highland Resolute Fund | | $ | 6,470,084 | | | $ | 778,253 | |
| Annual Report | April 30, 2018 | 37 |
| Highland Resolute Fund | Notes to Consolidated Financial Statements |
April 30, 2018
5. SECURITIES TRANSACTIONS
Purchases and sales of securities, excluding short-term securities and U.S. Government Obligations during the year ended April 30, 2018 were as follows:
| Fund | | Purchases of
Securities | | | Proceeds From
Sales of Securities | |
| Highland Resolute Fund | | $ | 227,099,590 | | | $ | 293,385,329 | |
6. BENEFICIAL SHARE TRANSACTIONS
The capitalization of the Trust consists of an unlimited number of shares of beneficial interest with no par value per share. Holders of the shares of the Fund of the Trust have one vote for each share held and a proportionate fraction of a vote for each fractional share. All shares issued and outstanding are fully paid and are transferable and redeemable at the option of the shareholder. Purchasers of the shares do not have any obligation to make payments to the Trust or its creditors solely by reason of the purchasers’ ownership of the shares. Shares have no pre-emptive rights.
Transactions in common shares were as follows:
Highland Resolute Fund
| | | For the | | | For the | |
| | | Year Ended | | | Year Ended | |
| Class I: | | April 30, 2018 | | | April 30, 2017 | |
| Common Shares Outstanding - Beginning of Period | | | 44,145,034 | | | | 63,881,394 | |
| Common Shares Sold | | | 9,179,527 | | | | 12,752,236 | |
| Common Shares Issued as Reinvestment of Dividends | | | 2,958,854 | | | | 666,208 | |
| Common Shares Redeemed | | | (21,694,166 | ) | | | (33,154,804 | ) |
| Common Shares Outstanding - End of Period | | | 34,589,249 | | | | 44,145,034 | |
Shares redeemed within 30 days of purchase may incur a 2% short-term redemption fee deducted from the redemption amount. Redemption fees are reflected in the “Shares redeemed, net of redemption fees” in the Statements of Changes in Net Assets. For the year ended April 30, 2018 and the year ended April 30, 2017, the Fund retained fees as follows:
| | | | | For the
Year Ended | | | | For the
Year Ended | |
| Fund | | | | April 30, 2018 | | | | April 30, 2017 | |
| Highland Resolute Fund | | | $ | – | | | $ | – | |
7. MANAGEMENT AND RELATED PARTY TRANSACTIONS
Investment Advisory
The Adviser, subject to the authority of the Board, is responsible for the overall management and administration of the Fund’s business affairs. Pursuant to the Investment Advisory Agreement (the “Advisory Agreement”), the Adviser is entitled to an investment advisory fee, computed daily and payable monthly of 1.50% of the average daily net assets for the Fund. The management fee is paid on a monthly basis.
The Subsidiary has entered into a separate advisory agreement (the “Subsidiary Advisory Agreement”) with the Adviser for the management of the Subsidiary’s portfolio pursuant to which the Subsidiary is obligated to pay the Adviser a management fee at the same rate that the Fund pays the Adviser for investment advisory services provided to the Fund. The Adviser has agreed to waive the advisory fee it receives from the Fund in an amount equal to the management fee paid by the Subsidiary. This waiver may not be terminated or modified without the consent of the Board. This agreement may not be terminated or modified prior to this date except with the approval of the Board. For the period ended April 30, 2018, this amount equaled $291,085 and is disclosed in the Consolidated Statement of Operations.
38
| Highland Resolute Fund | Notes to Consolidated Financial Statements |
April 30, 2018
The Adviser entered into an Investment Sub-Advisory Agreement with Boston Partners, Pinebridge Investments LLC (“Pinebridge”), Incline Global Management, LLC. (“Incline”), and Chatham Asset Management, LLC (“Chatham”). The Investment Sub-Advisory Agreements are in accordance with the Fund’s investment objective, policies and limitations and investment guidelines established jointly by the Adviser and the Board. The Adviser determines the allocation of the Fund’s assets among Boston Partners, Pinebridge, and Incline (collectively the “Sub-Advisers”) and other open-end investment companies. The Fund is not required to invest with any minimum number of sub-advisers or open-end investment companies, and does not have minimum or maximum limitations with respect to allocations of assets to the Sub-Advisers, investment strategy or market sector. Highland may change the allocation of the Fund’s assets among the available investment options, and may add or remove sub-advisers, at any time. Each Sub-Adviser is responsible for the day-to-day management of its allocated portion of Fund assets. Highland has ultimate responsibility, subject to the oversight of the Board of the Fund, to oversee the Sub-Advisers, and to recommend their hiring, termination and replacement.
Pursuant to each Investment Sub-Advisory Agreement, the Adviser pays the Sub-Advisers an annual sub-advisory management fee which is based on the Fund’s average quarterly market value of the assets managed by the Sub-Advisers. The Adviser is required to pay all fees due to Sub-Advisers out of the management fee the Adviser receives from the Fund. The following table reflects the Fund’s contractual sub-advisory fee rates.
| Sub-Advisers | Average Daily Market Value of the Fund | Contractual Sub-Advisory Fee |
| | First $50 Million | 1.25% |
| Boston Partners | Over $50 Million | 1.00% |
| Incline Global Management, LLC | | 1.25% |
| Chatham Asset Management, LLC | | 1.00% |
| | First $50 Million | 0.55% |
| Pinebridge Investments LLC | Over $50 Million | 0.50% |
The Adviser has agreed, with respect to the Fund’s Class I shares, to waive the portion of its 1.50% management fee in excess of any sub-advisory fees paid by the Adviser to Sub-Adviser in connection with the Fund. This agreement is in effect September 1, 2017 through August 31, 2018. The prior agreement was in effect from August 31, 2013 through August 31, 2017. The Adviser may not discontinue this agreement to waive fees prior to August 31, 2018 without the approval of the Fund’s Board of Trustees. The Adviser is not permitted to recoup any amounts waived or reimbursed to the extent actual fees and expenses for a fiscal period are less than the expense limitation cap. Fees waived/reimbursed by adviser for the year ended April 30, 2018 are disclosed in the Consolidated Statement of Operations.
For the year ended April 30, 2018, the fee waivers and/or reimbursements were as follows:
| | | Fees Waived/ Reimbursed By Adviser | |
| Highland Resolute Fund - Class I | | $ | (4,582,706 | ) |
Administrator Fees and Expenses
ALPS Fund Services, Inc. (“ALPS”) serves as administrator to the Fund, and the Fund has agreed to pay expenses incurred in connection with its administrative activities. Pursuant to an Administration Agreement, ALPS provides operational services to the Fund including, but not limited to, fund accounting and fund administration and generally assists in the Fund’s operations. Officers of the Trust are employees of ALPS. The Fund’s administration fee is accrued on a daily basis and paid monthly. Administration fees paid by the Fund for the year ended April 30, 2018 are disclosed in the Consolidated Statement of Operations.
ALPS is reimbursed by the Fund for certain out-of-pocket expenses.
Transfer Agent
ALPS serves as transfer, dividend paying and shareholder servicing agent for the Fund. ALPS receives an annual minimum fee, a fee based upon the number of shareholder accounts and is also reimbursed by the Fund for certain out-of-pocket expenses. Transfer agent fees paid by the Fund for the year ended April 30, 2018 are disclosed in the Consolidated Statement of Operations.
| Annual Report | April 30, 2018 | 39 |
| Highland Resolute Fund | Notes to Consolidated Financial Statements |
April 30, 2018
Compliance Services
ALPS provides services that assist the Fund’s chief compliance officer in monitoring and testing the policies and procedures of the Fund in conjunction with requirements under Rule 38a-1 under the 1940 Act and receives an annual base fee. ALPS is reimbursed for certain out-of-pocket expenses by the Fund. Compliance service fees paid by the Fund for the year ended April 30, 2018 are disclosed in the Consolidated Statement of Operations.
Principal Financial Officer
ALPS receives an annual fee for providing principal financial officer services to the Fund. Principal financial officer fees paid by the Fund for the year ended April 30, 2018 are disclosed in the Consolidated Statement of Operations.
Distributor
ALPS Distributors, Inc. (“ADI” or the “Distributor”) (an affiliate of ALPS) acts as the distributor of the Fund’s shares pursuant to a Distribution Agreement with the Trust on behalf of the Fund. Shares are sold on a continuous basis by ADI as agent for the Fund, and ADI has agreed to use its best efforts to solicit orders for the sale of Fund’s shares, although it is not obliged to sell any particular amount of shares. ADI is not entitled to any compensation for its services as Distributor. ADI is registered as a broker-dealer with the U.S. Securities and Exchange Commission.
Shareholder Services Plan
Effective December 12, 2017, the Fund has adopted a Shareholder Services Plan (the “Plan”) with respect to its Class I shares. Under the Plan, the Fund is authorized to pay banks and its affiliates and other institutions, including broker-dealers and Fund affiliates which may include the Distributor, Adviser and/or the transfer agent (“Participating Organizations”), an aggregate fee in an amount not to exceed on an annual basis 0.10% of the average daily net asset value of Class I shares of the Fund attributable to or held in the name of the Participating Organizations for its clients as compensation for providing shareholder service activities, which do not include distribution services pursuant to an agreement with Participating Organizations. Any amount of such payment not paid to the Participating Organizations during the Fund’s fiscal year for such service activities shall be reimbursed to the Fund as soon as practicable. Plan fees are included with distribution and service fees in the Statement of Operations. Fees recaptured pursuant to the Plan for the year ended April 30, 2018 are included as an offset to distribution and service fees as disclosed in the Statement of Operations.
8. INDEMNIFICATIONS
Under the Trust’s organizational documents, its officers and Trustees are indemnified against certain liability arising out of the performance of their duties to the Trust. Additionally, in the normal course of business, the Trust enters into contracts with service providers that may contain general indemnification clauses which may permit indemnification to the extent permissible under applicable law. The Trust’s maximum exposure under these arrangements is unknown, as this would involve future claims that may be made against the Trust that have not yet occurred.
40
| Highland Resolute Fund | Report of Independent Registered Accounting Firm |
April 30, 2018
To the shareholders and the Board of Trustees of Financial Investors Trust
Opinion on the Financial Statements and Financial Highlights
We have audited the accompanying statement of assets and liabilities, including the consolidated schedule of investments, of Highland Resolute Fund and subsidiary (formerly, Redmont Resolute Fund) (the "Fund"), one of the funds constituting the Financial Investors Trust, as of April 30, 2018, the related statements of operations for the year then ended, the statements of changes in net assets for each of the two years in the period then ended, the financial highlights for each of the five years in the period then ended, and the related notes. In our opinion, the financial statements and financial highlights present fairly, in all material respects, the financial position of Highland Resolute Fund of Financial Investors Trust as of April 30, 2018, the results of its operations for the year then ended, the changes in its net assets for each of the two years in the period then ended, and the financial highlights for each of the five years in the period then ended in conformity with accounting principles generally accepted in the United States of America.
Basis for Opinion
These financial statements and financial highlights are the responsibility of the Fund’s management. Our responsibility is to express an opinion on the Fund’s financial statements and financial highlights based on our audits. We are a public accounting firm registered with the Public Company Accounting Oversight Board (United States) (PCAOB) and are required to be independent with respect to the Fund in accordance with the U.S. federal securities laws and the applicable rules and regulations of the Securities and Exchange Commission and the PCAOB.
We conducted our audits in accordance with the standards of the PCAOB. Those standards require that we plan and perform the audit to obtain reasonable assurance about whether the financial statements and financial highlights are free of material misstatement, whether due to error or fraud. The Fund is not required to have, nor were we engaged to perform, an audit of its internal control over financial reporting. As part of our audits we are required to obtain an understanding of internal control over financial reporting but not for the purpose of expressing an opinion on the effectiveness of the Fund’s internal control over financial reporting. Accordingly, we express no such opinion.
Our audits included performing procedures to assess the risks of material misstatement of the financial statements and financial highlights, whether due to error or fraud, and performing procedures that respond to those risks. Such procedures included examining, on a test basis, evidence regarding the amounts and disclosures in the financial statements and financial highlights. Our audits also included evaluating the accounting principles used and significant estimates made by management, as well as evaluating the overall presentation of the financial statements and financial highlights. Our procedures included confirmation of securities owned as of April 30, 2018, by correspondence with the custodian and brokers; when replies were not received from brokers, we performed other auditing procedures. We believe that our audits provide a reasonable basis for our opinion.
DELOITTE & TOUCHE LLP
Denver, Colorado
June 26, 2018
We have served as the auditor of one or more investment companies advised by Highland Associates, Inc. since 2012.
| Annual Report | April 30, 2018 | 41 |
| Highland Resolute Fund | Disclosure Regarding Approval of Fund Advisory Agreements |
April 30, 2018 (Unaudited)
On December 12, 2017, the Trustees met in person to discuss, among other things, the approval of the Investment Advisory Agreement between the Trust and the Adviser, the Investment Sub-Advisory Agreement among the Trust, the Adviser, and Boston Partners Global Investors, Inc. (“Boston Partners”), and the Investment Sub-Advisory Agreement among the Trust, the Adviser, and Incline Global Management, LLC (“Incline”), in accordance with Section 15(c) of the 1940 Act. In renewing and approving the Investment Advisory Agreement and the Investment Sub-Advisory Agreements, the Trustees, including the Independent Trustees, considered the following factors with respect to the Highland Fund:
Investment Advisory and Sub-Advisory Fee Rates: The Trustees reviewed and considered the contractual annual advisory fee paid by the Trust, on behalf of the Highland Fund, to Highland of 1.50% of the Highland Fund’s daily average net assets, in light of the extent and quality of the advisory services provided by Highland to the Highland Fund. The Trustees also reviewed and considered the contractual sub-advisory fee rates paid by Highland to Boston Partners of 1.25% of the Highland Fund’s daily average net assets allocated to Boston Partners for the first $50 million, and 1.00% of the Highland Fund’s daily average net assets allocated to Boston Partners above $50 million, in light of the extent and quality of the advisory services provided by Boston Partners to the Highland Fund. The Trustees also reviewed and considered the contractual annual sub-advisory fee paid by Highland to Incline of 1.25% of the Highland Fund’s daily average net assets allocated to Incline.
The Board received and considered information including a comparison of the Highland Fund’s contractual and actual advisory fees and overall expenses with those of funds in the peer group and universe of funds provided by an independent third party provider of investment company data (the “Data Provider”). The Trustees noted that the Highland Fund’s contractual advisory fee rate was above its Data Provider peer group median contractual advisory fee rate.
Total Expense Ratios: Based on such information, the Trustees further reviewed and considered the total expense ratio (after waivers) of 0.73% for the Highland Fund. The Trustees noted that the total expense ratio (after waivers) for the Highland Fund was below the Data Provider peer group median total expense ratio (after waivers).
Nature, Extent, and Quality of the Services under the Investment Advisory and Sub-Advisory Agreements: The Trustees received and considered information regarding the nature, extent, and quality of services to be provided to the Highland Fund under the Investment Advisory and Sub-Advisory Agreements. The Trustees reviewed certain background materials supplied by Highland, Boston Partners, and Incline in their presentations, including their Forms ADV.
The Trustees reviewed and considered Highland’s, Boston Partners’, and Incline’s investment advisory personnel, their history as asset managers and their performance and the amount of assets currently under management by Highland, Boston Partners, and Incline and their affiliated entities. The Trustees also reviewed the research and decision-making processes utilized by Highland, Boston Partners, and Incline, including the methods adopted to seek to achieve compliance with the investment objectives, policies, and restrictions of the Highland Fund.
The Trustees considered the background and experience of Highland’s, Boston Partners’, and Incline’s management in connection with the Highland Fund, including reviewing the qualifications, backgrounds, and responsibilities of the management team primarily responsible for the day-to-day portfolio management of the Highland Fund and the extent of the resources devoted to research and analysis of actual and potential investments.
The Trustees also reviewed, among other things, Highland’s, Boston Partners’, and Incline’s insider trading policies and procedures and their Codes of Ethics.
Performance: The Trustees reviewed performance information for the Highland Fund for the 3-month, 1-year, 3-year, 5-year and since inception periods ended September 30, 2017. That review included a comparison of the Highland Fund’s performance to the performance of a group of comparable funds selected by the Data Provider. The Trustees noted that the performance of the Highland Fund was above its Data Provider universe median for each period. The Trustees also considered Highland’s, Boston Partners’, and Incline’s discussion of the Highland Fund’s underlying portfolio diversification categories, its top contributors and top detractors, as well as Highland’s, Boston Partners’, and Incline’s performance and reputation generally and their investment techniques, risk management controls, and decision-making processes.
Comparable Accounts: The Trustees noted certain information provided by Highland, Boston Partners, and Incline regarding fees charged to its other clients utilizing a strategy similar to that employed by the Highland Fund.
Profitability: The Trustees received and considered retrospective and projected profitability analyses prepared by Highland, Boston Partners, and Incline based on the fees payable under the Investment Advisory Agreement with Highland and the Sub-Advisory Agreements with each of Boston Partners and Incline, with respect to the Highland Fund. The Trustees considered the profits, if any, anticipated to be realized by Highland, Boston Partners, and Incline in connection with the operation of the Highland Fund. The Board then reviewed Highland’s unaudited balance sheet as of September 30, 2017 and 2016 and Profit and Loss for October 2016 through September 2017 and for October 2015 through September 2016 in
42
| Highland Resolute Fund | Disclosure Regarding Approval of Fund Advisory Agreements |
April 30, 2018 (Unaudited)
order to analyze the financial condition and stability and profitability of Highland. The Board also reviewed the financial statements for the year ended December 31, 2016 of Boston Partners parent company, and Incline’s financial statements for the year ended December 31, 2016 in order to analyze the financial condition and stability and profitability of Boston Partners and Incline.
Economies of Scale: The Trustees considered whether economies of scale in the provision of services to the Highland Fund will be passed along to the shareholders under the agreements.
Other Benefits to the Adviser: The Trustees reviewed and considered any other incidental benefits derived or to be derived by Highland from its relationship with the Highland Fund, including whether soft dollar arrangements were used.
In renewing Highland as the investment adviser of the Highland Fund, Boston Partners and Incline as sub-advisers of the Highland Fund, and the fees charged under the Investment Advisory and Sub-Advisory Agreements, the Trustees concluded that no single factor reviewed by the Trustees was identified by the Trustees to be determinative as the principal factor in whether to renew the Investment Advisory and Sub-Advisory Agreements. Further, the Independent Trustees were advised by separate independent legal counsel throughout the process. The Trustees, including all of the Independent Trustees, concluded that:
| ● | the contractual advisory fee rate was above the Data Provider peer group median for the Highland Fund; |
| ● | Boston Partners’ and Incline’s fees under their respective sub-advisory agreements are paid directly by Highland; |
| ● | the total expense ratio (after waivers) for the Highland Fund was below the Data Provider peer group median total expense ratio (after waivers); |
| ● | the nature, extent, and quality of services rendered by Highland, Boston Partners, and Incline under the Investment Advisory and Sub-Advisory Agreements, respectively, with respect to the Highland Fund were adequate; |
| ● | the performance of the Highland Fund was above its Data Provider universe median for the 3-month, 1-year, 3-year, 5-year and since inception periods ended September 30, 2017; |
| ● | bearing in mind the limitations of comparing different types of managed accounts and the different levels of service typically associated with such accounts, the fee structures applicable to Highland’s, Boston Partners’, and Incline’s other clients employing a comparable strategy to the Highland Fund were not indicative of any unreasonableness with respect to the advisory and sub-advisory fees payable by the Highland Fund; |
| ● | the profit, if any, realized by Highland, Boston Partners, and Incline in connection with the operation of the Highland Fund is not unreasonable to the Fund; and |
| ● | there were no material economies of scale or other incidental benefits accruing to Highland, Boston Partners, and Incline in connection with their relationship with the Highland Fund. |
Based on the Trustees’ deliberations and their evaluation of the information described above, the Trustees, including all of the Independent Trustees, concluded that Highland’s, Boston Partners’, and Incline’s compensation for investment advisory and sub-advisory services is consistent with the best interests of the Highland Fund and its shareholders.
On December 12, 2017, the Trustees met in person to discuss, among other things, the approval of the Investment Sub-Advisory Agreement among the Trust, the Adviser, and Logan Circle Partners L.P. (“Logan Circle”), in accordance with Section 15(c) of the 1940 Act. In renewing and approving the Investment Sub-Advisory Agreement, the Trustees, including the Independent Trustees, considered the following factors with respect to the Highland Fund:
Investment Sub-Advisory Fee Rate: The Trustees reviewed and considered the contractual annual sub-advisory fee to be paid by Highland, on behalf of the Highland Fund, to Logan Circle of 0.75% of the Highland Fund’s daily average net assets allocated to Logan Circle, in light of the extent and quality of the advisory services to be provided by Logan to the Highland Fund. The Board also received and considered information provided by Logan Circle with respect its operating expense structure.
The Board received and considered information including a comparison of the Highland Fund’s contractual and actual advisory fees and overall expenses with those of funds in the peer group and universe of funds provided by the Data Provider. The Trustees noted that the contractual advisory fee rate for the Highland Fund was above the Data Provider peer group median contractual advisory fee.
Total Expense Ratios: Based on such information, the Trustees further reviewed and considered the total expense ratio (after waivers) of 0.73% for the Highland Fund. The Trustees noted that the Highland Fund’s total expense ratio (after waivers) was below the Data Provider peer group median total expense ratio (after waivers).
| Annual Report | April 30, 2018 | 43 |
| Highland Resolute Fund | Disclosure Regarding Approval of Fund Advisory Agreements |
April 30, 2018 (Unaudited)
Nature, Extent, and Quality of the Services under the Investment Sub-Advisory Agreement: The Trustees received and considered information regarding the nature, extent, and quality of services to be provided to the Highland Fund under the Investment Sub-Advisory Agreement with Logan Circle. The Trustees also reviewed certain background materials supplied by Logan Circle in its presentation, including its Form ADV.
The Trustees reviewed and considered Logan Circle’s investment sub-advisory personnel, its history as an asset manager and its performance and the amount of assets currently under management by Logan Circle and its affiliated entities. The Trustees also reviewed the research and decision-making processes utilized by Logan Circle, including the methods adopted to seek to achieve compliance with the investment objectives, policies, and restrictions of the Highland Fund.
The Trustees considered the background and experience of Logan Circle’s management in connection with the Highland Fund, including reviewing the qualifications, backgrounds, and responsibilities of the management team primarily responsible for the day-to-day portfolio management of the Highland Fund and the extent of the resources devoted to research and analysis of actual and potential investments.
The Trustees also reviewed, among other things, Logan Circle’s insider trading policies and procedures and its Code of Ethics.
Performance: The Trustees noted that since Logan Circle had not yet begun to manage its portion of the Highland Fund, there is no fund performance to be reviewed or analyzed at this time. The Trustees also considered Logan Circle’s discussion of its reputation generally and its investment techniques, risk management controls, and decision-making processes.
Comparable Accounts: The Trustees noted that Logan Circle reported no comparable clients managed in accordance with the guidelines for the Highland Fund.
Profitability: The Trustees received and considered Logan Circle’s statements regarding projected profitability based on the fees payable under the Investment Sub-Advisory Agreement. The Trustees considered the profits, if any, anticipated to be realized by Logan Circle with respect to the Highland Fund. The Board then reviewed certain financial statements of Logan Circle’s parent company.
Economies of Scale: The Trustees considered whether economies of scale in the provision of services to the Highland Fund will be passed along to the shareholders under the proposed agreements.
Other Benefits to the Sub-Adviser: The Trustees reviewed and considered any other incidental benefits derived or to be derived by Logan Circle from its relationship with the Highland Fund, including whether soft dollar arrangements would be used.
In approving Logan Circle as an investment sub-adviser for the Highland Fund and approving the Investment Sub-Advisory Agreement and the fees paid to Logan Circle by Highland under the Investment Sub-Advisory Agreement, the Trustees concluded that no single factor reviewed by the Trustees was identified by the Trustees to be determinative as the principal factor in whether to approve the Investment Sub-Advisory Agreement. Further, the Independent Trustees were advised by separate independent legal counsel throughout the process. The Trustees, including all of the Independent Trustees, concluded that:
| ● | the investment sub-advisory fee to be paid to Logan Circle by Highland was fair and competitive when considered in light of particular services to be provided by Logan Circle to the Highland Fund; |
| ● | the nature, extent, and quality of services to be rendered by Logan Circle under the Investment Sub-Advisory Agreement with respect to the Highland Fund were adequate; |
| ● | since Logan Circle had not yet begun to manage its portion of the Highland Fund, there is no fund performance to be reviewed or analyzed at this time; |
| ● | Logan Circle had no clients with investment mandates directly comparable to that of the Highland Fund; |
| ● | the profit, if any, anticipated to be realized by Logan Circle in connection with the operation of its portion of the Highland Fund is not unreasonable to the Highland Fund; and |
| ● | there were no material economies of scale or other incidental benefits accruing to Logan Circle in connection with its relationship with the Highland Fund. |
Based on the Trustees’ deliberations and their evaluation of the information described above, the Trustees, including all of the Independent Trustees, concluded that Logan Circle’s compensation for investment sub-advisory services is consistent with the best interests of the Highland Fund and its shareholders.
44
| Highland Resolute Fund | Additional Information |
April 30, 2018 (Unaudited)
1. FUND HOLDINGS
The Fund files its complete schedule of portfolio holdings with the Securities and Exchange Commission (the “SEC”) for the first and third quarters of each fiscal year on Form N-Q within 60 days after the end of the period. Copies of the Fund’s Form N-Q are available without charge on the SEC website at http:// www.sec.gov. You may also review and copy the Form N-Q at the SEC’s Public Reference Room in Washington, D.C. For more information about the operation of the Public Reference Room, please call the SEC at 1-800-SEC-0330.
2. FUND PROXY VOTING POLICIES, PROCEDURES AND SUMMARIES
Fund policies and procedures used in determining how to vote proxies and information regarding how each of the Funds voted proxies relating to portfolio securities during the most recent prior 12-month period ending June 30 are available without charge, (1) upon request, by calling (toll-free) (866) 759-5679 and (2) on the SEC’s website at http://www.sec.gov.
TAX INFORMATION (UNAUDITED)
The Fund designates the following for federal income tax purposes for distributions made during the calendar year ended December 31, 2017:
| | QDI | DRD |
| Highland Resolute Fund | 6.99 % | 5.40 % |
In early 2018, if applicable, shareholders of record received this information for the distribution paid to them by the Fund during the calendar year 2017 via Form 1099. The Fund will notify shareholders in early 2019 of amounts paid to them by the Funds, if any, during the calendar year 2018.
Pursuant to Section 852(b)(3) of the Internal Revenue Code, Highland Resolute Fund designates $6,351,925 as long-term capital gain distributions.
| Annual Report | April 30, 2018 | 45 |
| Highland Resolute Fund | Trustees & Officers |
April 30, 2018 (Unaudited)
Additional information regarding the Fund’s trustees is included in the Statement of Additional Information, which can be obtained without charge by calling 855-268-2242.
INDEPENDENT TRUSTEES
Name,
Address*
& Year
of Birth | Position(s)
Held with
Fund | Term of Office**
and Length of
Time Served | Principal Occupation(s)
During Past 5 Years*** | Number of
Funds in
Fund
Complex
Overseen
by Trustee**** | Other Directorships Held
by Trustee During
Past 5 Years*** |
Mary K.
Anstine,
1940 | Trustee and Chairman | Ms. Anstine was elected at a special meeting of shareholders held on March 21, 1997 and re-elected at a special meeting of shareholders held on August 7, 2009. Ms. Anstine was appointed Chairman of the Board at the June 6, 2017 meeting of the Board of Trustees. | Ms. Anstine was formerly an Executive Vice President of First Interstate Bank of Denver until 1994, President/Chief Executive Officer of HealthONE Alliance, Denver, Colorado, from 1994 to 2004, and has been retired since 2004. Ms. Anstine is also Trustee/Director of AV Hunter Trust and Colorado Uplift Board. Ms. Anstine was formerly a Director of the Trust Bank of Colorado (later purchased and now known as Northern Trust Bank), HealthONE and Denver Area Council of the Boy Scouts of America, and a member of the American Bankers Association Trust Executive Committee. | 32 | Ms. Anstine is a Trustee of ALPS ETF Trust (21 funds); ALPS Variable Investment Trust (9 funds); Reaves Utility Income Fund (1 fund); and Westcore Trust (14 funds). |
Jeremy W.
Deems,
1976 | Trustee | Mr. Deems was appointed as a Trustee at the March 11, 2008 meeting of the Board of Trustees and elected at a special meeting of shareholders held on August 7, 2009. | Mr. Deems is the Co-Founder, Chief Operations Officer and Chief Financial Officer of Green Alpha Advisors, LLC, a registered investment advisor, and Co-Portfolio Manager of the Shelton Green Alpha Fund. Prior to joining Green Alpha Advisors, Mr. Deems was CFO and Treasurer of Forward Management, LLC, ReFlow Management Co., LLC, ReFlow Fund, LLC, a private investment fund, and Sutton Place Management, LLC, an administrative services company, from 1998 to June 2007. From 2004 to 2005, Mr Deems also served as Treasurer of the Forward Funds and the Sierra Club Funds. | 32 | Mr. Deems is a Trustee of ALPS ETF Trust (21 funds); ALPS Variable Investment Trust (9 funds); Clough Funds Trust (1 fund); and Reaves Utility Income Fund (1 fund). |
46
| Highland Resolute Fund | Trustees & Officers |
April 30, 2018 (Unaudited)
INDEPENDENT TRUSTEES
Name,
Address*
& Year
of Birth | Position(s)
Held with
Fund | Term of Office**
and Length of
Time Served | Principal Occupation(s)
During Past 5 Years*** | Number of
Funds in
Fund
Complex
Overseen
by Trustee**** | Other Directorships Held
by Trustee During
Past 5 Years*** |
Jerry G.
Rutledge,
1944 | Trustee | Mr. Rutledge was elected at a special meeting of shareholders held on August 7, 2009. | Mr. Rutledge is the President and owner of Rutledge’s Inc., a retail clothing business. He served as Director of University of Colorado Hospital from 2008 to 2016. He was from 1994 to 2007 a Regent of the University of Colorado. | 32 | Mr. Rutledge is a Trustee of Principal Real Estate Fund (1 fund), Clough Global Dividend and Income Fund (1 fund), Clough Global Equity Fund (1 fund) and Clough Global Opportunities Fund (1 fund). |
Michael
“Ross” Shell,
1970 | Trustee | Mr. Shell was elected at a special meeting of shareholders held on August 7, 2009. | Mr. Shell is Founder and CEO of Red Idea, LLC, a strategic consulting/early stage venture firm (since June 2008). From 1999 to 2009, he was a part-owner and Director of Tesser, Inc., a brand agency. From December 2005 to May 2008, he was Director, Marketing and Investor Relations, of Woodbourne, a REIT/real estate hedge fund and private equity firm. Prior to this, from May 2004 to November 2005, he worked as a business strategy consultant; from June 2003 to April 2004, he was on the Global Client Services team of IDEO, a product design/innovation firm; and from 1999 to 2003, he was President of Tesser, Inc. Mr. Shell graduated with honors from Stanford University with a degree in Political Science. | 32 | None. |
| Annual Report | April 30, 2018 | 47 |
| Highland Resolute Fund | Trustees & Officers |
April 30, 2018 (Unaudited)
INTERESTED TRUSTEE
Name,
Address*
& Year
of Birth | Position(s)
Held with
Fund | Term of Office**
and Length of
Time Served | Principal Occupation(s)
During Past 5 Years*** | Number of
Funds in
Fund
Complex
Overseen by
Trustee**** | Other Directorships Held
by Trustee During
Past 5 Years*** |
Edmund J.
Burke,
1961 | Trustee and President | Mr. Burke was elected as Trustee at a special meeting of shareholders held on August 7, 2009. Mr. Burke was elected President of the Trust at the December 17, 2002 meeting of the Board of Trustees. | Mr. Burke is President and a Director of ALPS Holdings, Inc. (“AHI”) and ALPS Advisors, Inc. (“AAI”), and Director of Boston Financial Data Services, Inc. (“BFDS”), ALPS Distributors, Inc. (“ADI”), ALPS Fund Services, Inc. (“AFS”) and ALPS Portfolio Solutions Distributor, Inc. (“APSD”). Because of his positions with AHI, BFDS, AAI, ADI, AFS and APSD, Mr. Burke is deemed an affiliate of the Trust as defined under the 1940 Act. | 32 | Mr. Burke is a Trustee of Clough Global Dividend and Income Fund (1 fund); Clough Global Equity Fund (1 fund); Clough Global Opportunities Fund (1 fund); Clough Funds Trust (1 fund); Liberty All-Star Equity Fund (1 fund); Director of the Liberty All-Star Growth Fund, Inc. (1 fund); Trustee of ALPS ETF Trust (21 funds). |
48
| Highland Resolute Fund | Trustees & Officers |
April 30, 2018 (Unaudited)
OFFICERS
Name, Address*
& Year of Birth | Position(s) Held
with Fund | Term of Office** and
Length of Time Served | Principal Occupation(s)
During Past 5 Years*** |
Kimberly R. Storms,
1972 | Treasurer | Ms. Storms was elected Treasurer of the Trust at the March 12, 2013 meeting of the Board of Trustees. | Ms. Storms is Senior Vice President - Director of Fund Administration of ALPS. Because of her position with ALPS, Ms. Storms is deemed an affiliate of the Trust as defined under the 1940 Act. Ms. Storms is also Treasurer of Liberty All-Star Equity Fund, Liberty All-Star Growth Fund, Inc., ALPS Series Trust and Elevation ETF Trust. Ms. Storms also serves as a Board member and Treasurer of The Center for Trauma & Resilience, a nonprofit agency. |
Karen S. Gilomen,
1970 | Secretary | Ms. Gilomen was elected Secretary of the Trust at the December 13, 2016 meeting of the Board of Trustees. | Ms. Gilomen joined ALPS in August 2016 as Vice President and Senior Counsel. Prior to joining ALPS, Ms. Gilomen was Vice President - General Counsel & CCO of Monticello Associates, Inc. from 2010 to 2016. Because of her position with ALPS, Ms. Gilomen is deemed an affiliate of the Trust, as defined under the 1940 Act. Ms. Gilomen is also the Secretary of Clough Funds Trust, Clough Global Dividend and Income Fund, Clough Global Equity Fund, Clough Global Opportunities Fund, Reaves Utility Income Fund, and the Assistant Secretary of the WesMark Funds. |
Ted Uhl,
1974 | Chief Compliance Officer (“CCO”) | Mr. Uhl was appointed CCO of the Trust at the June 8, 2010 meeting of the Board of Trustees. | Mr. Uhl joined ALPS in October 2006, and is currently Deputy Compliance Officer of ALPS. Prior to his current role, Mr. Uhl served as Senior Risk Manager for ALPS from October 2006 until June 2010. Before joining ALPS, Mr. Uhl served a Sr. Analyst with Enenbach and Associates (RIA), and a Sr. Financial Analyst at Sprint. Because of his position with ALPS, Mr. Uhl is deemed an affiliate of the Trust as defined under the 1940 Act. Mr. Uhl is also CCO of the Boulder Growth & Income Fund, Inc., Centre Funds, Elevation ETF Trust, Index Funds, Reality Shares ETF Trust and Reaves Utility Income Fund. |
Jennell Panella,
1974 | Assistant Treasurer | Ms. Panella was elected Assistant Treasurer of the Trust at the September 15, 2015 meeting of the Board of Trustees. | Ms. Panella joined ALPS in June 2012 and is currently Fund Controller of ALPS Fund Services, Inc. Prior to joining ALPS, Ms. Panella served as Financial Reporting Manager for Parker Global Strategies, LLC (2009-2012). Because of her position with ALPS, Ms. Panella is deemed an affiliate of the Trust as defined under the 1940 Act. Ms. Panella also serves as Assistant Treasurer of James Advantage Funds. |
Alan Gattis,
1980 | Assistant Treasurer | Mr. Gattis was elected Assistant Treasurer of the Trust at the September 13, 2016 meeting of the Board of Trustees. | Mr. Gattis joined ALPS in 2011 and is currently Vice President and Fund Controller of ALPS. Prior to joining ALPS, Mr. Gattis was an Auditor at Spicer Jeffries LLP (2009 through 2011) and an Auditor at PricewaterhouseCoopers LLP (2004 - 2009). Because of his position with ALPS, Mr. Gattis is deemed an affiliate of the Trust as defined under the 1940 Act. Mr. Gattis is also Assistant Treasurer of ALPS Series Trust and Elevation ETF Trust. |
| Annual Report | April 30, 2018 | 49 |
| Highland Resolute Fund | Trustees & Officers |
April 30, 2018 (Unaudited)
OFFICERS
Name, Address*
& Year of Birth | Position(s) Held
with Fund | Term of Office** and
Length of Time Served | Principal Occupation(s)
During Past 5 Years*** |
Sharon Akselrod,
1974 | Assistant Secretary | Ms. Akselrod was elected Assistant Secretary of the Trust at the September 15, 2015 meeting of the Board of Trustees. | Ms. Akselrod joined ALPS in August 2014 and is currently Senior Investment Company Act Paralegal of ALPS Fund Services, Inc. Prior to joining ALPS, Ms. Akselrod served as Corporate Governance and Regulatory Associate for Nordstrom fsb (2013-2014) and Senior Legal Assistant - Legal Manager for AXA Equitable Life Insurance Company (2008-2013). Because of her position with ALPS, Ms. Akselrod is deemed an affiliate of the Trust as defined under the 1940 Act. Ms. Akselrod is also Assistant Secretary of ALPS ETF Trust and Principal Real Estate Fund. |
Jennifer Craig
1973 | Assistant Secretary | Ms. Craig was elected Assistant Secretary of the Trust at the June 8, 2016 meeting of the Board of Trustees. | Ms. Craig joined ALPS in 2007 and is currently Assistant Vice President and Paralegal Manager of ALPS. Prior to joining ALPS, Ms. Craig was Legal Manager at Janus Capital Management LLC and served as Assistant Secretary of Janus Investment Fund, Janus Adviser Series and Janus Aspen Series. Because of her position with ALPS, Ms. Craig is deemed an affiliate of the Trust as defined under the 1940 Act. Ms. Craig is also Assistant Secretary of Clough Global Dividend and Income Fund, Clough Global Equity Fund, Clough Global Opportunities Fund, Clough Funds Trust, Liberty All-Star Equity Fund, Liberty All-Star Growth Fund, Inc. and ALPS Series Trust. |
Sareena Khwaja-Dixon,
1980 | Assistant Secretary | Ms. Khwaja-Dixon was elected Assistant Secretary of the Trust at the December 12, 2017 meeting of the Board of Trustees. | Ms. Khwaja-Dixon joined ALPS in August 2015 and is currently Senior Counsel and Vice President of ALPS Fund Services, Inc. Prior to joining ALPS, Ms. Khwaja-Dixon served as a Senior Paralegal/Paralegal for Russell Investments (2011 - 2015). Ms. Khwaja-Dixon is also Secretary of Liberty All-Star Equity Fund and Liberty All-Star Growth Fund, Inc., and Assistant Secretary of Clough Funds Trust, Clough Dividend and Income Fund, Clough Global Opportunities Fund, and Clough Global Equity Fund. |
| * | All communications to Trustees and Officers may be directed to Financial Investors Trust c/o 1290 Broadway, Suite 1100, Denver, CO 80203. |
| ** | This is the period for which the Trustee or Officer began serving the Trust. Each Trustee serves an indefinite term, until his successor is elected. Officers are elected on an annual basis. |
| *** | Except as otherwise indicated, each individual has held the office shown or other offices in the same company for the last five years. |
| **** | The Fund Complex includes all series of the Trust (currently 32) and any other investment companies for which any Trustee serves as trustee for and which Highland Associates, Inc., Robeco Investment Management, Inc., Pinebridge Investment LLC, Incline Global Management, LLC and/or Chatham Asset Management LLC provides investment advisory services (currently none). |
50
| Highland Resolute Fund | Privacy Policy |
April 30, 2018 (Unaudited)
| Who We Are | |
| Who is providing this notice? | Redmont Resolute Fund |
| What We Do | |
| How does the Fund protect my personal information? | To protect your personal information from unauthorized access and use, we use security measures that comply with federal law. These measures include computer safeguards and secured files and buildings. |
| How does the Fund collect my personal information? | We collect your personal information, for example, when you ● open an account ● provide account information or give us your contact information ● make a wire transfer or deposit money |
| Why can't I limit all sharing? | Federal law gives you the right to limit only ● sharing for affiliates’ everyday business purposes-information about your creditworthiness ● affiliates from using your information to market to you ● sharing for non-affiliates to market to you State laws and individual companies may give you additional rights to limit sharing. |
| Definitions | |
| Affiliates | Companies related by common ownership or control. They can be financial and nonfinancial companies. |
| Non-affiliates | Companies not related by common ownership or control. They can be financial and nonfinancial companies. ● The Fund does not share with non-affiliates so they can market to you. |
| Joint marketing | A formal agreement between non-affiliated financial companies that together market financial products or services to you. ● The Fund does not jointly market. |
| Other Important Information |
| California Residents | If your account has a California home address, your personal information will not be disclosed to nonaffiliated third parties except as permitted by applicable California law, and we will limit sharing such personal information with our affiliates to comply with California privacy laws that apply to us. |
| Vermont Residents | The State of Vermont requires financial institutions to obtain your consent prior to sharing personal information that they collect about you with affiliated companies and nonaffiliated third parties other than in certain limited circumstances. Except as permitted by law, we will not share personal information we collect about you with nonaffiliated third parties or other affiliated companies unless you provide us with your written consent to share such information. |
| Annual Report | April 30, 2018 | 51 |
| Highland Resolute Fund | Privacy Policy |
April 30, 2018 (Unaudited)
| FACTS | WHAT DOES THE FUND DO WITH YOUR PERSONAL INFORMATION? |
| Why? | Financial companies choose how they share your personal information. Federal law gives consumers the right to limit some but not all sharing. Federal law also requires us to tell you how we collect, share, and protect your personal information. Please read this notice carefully to understand what we do. |
| What? | The types of personal information we collect and share depend on the product or service you have with us. This information can include: ● Social Security number and account transactions ● Account balances and transaction history ● Wire transfer instructions |
| How? | All financial companies need to share customers’ personal information to run their everyday business. In the section below, we list the reasons financial companies can share their customers’ personal information; the reasons the Fund chooses to share; and whether you can limit this sharing. |
| Reasons we can share your personal information | Does the Fund share: | Can you limit this sharing? |
| For our everyday business purposes — such as to process your transactions, maintain your account(s), respond to court orders and legal investigations, or report to credit bureaus | Yes | No |
| For our marketing purposes — to offer our products and services to you | No | We do not share. |
| For joint marketing with other financial companies | No | We do not share. |
| For our affiliates’ everyday business purposes — information about your transactions and experiences | Yes | No |
| For our affiliates’ everyday business purposes — information about your creditworthiness | No | We do not share. |
| For nonaffiliates to market to you | No | We do not share. |
52

 | TABLE OF CONTENTS |
| Shareholder Letter | 1 |
| Performance Update | 3 |
| Disclosure of Fund Expenses | 9 |
| Portfolio of Investments | |
| Rondure New World Fund | 10 |
| Rondure Overseas Fund | 13 |
| Statements of Assets and Liabilities | 16 |
| Statements of Operations | 17 |
| Statement of Changes in Net Assets | |
| Rondure New World Fund | 18 |
| Rondure Overseas Fund | 19 |
| Financial Highlights | |
| Rondure New World Fund | 20 |
| Rondure Overseas Fund | 22 |
| Notes to Financial Statements | 24 |
| Report of Independent Registered Public Accounting Firm | 31 |
| Additional Information | 32 |
| Trustees and Officers | 33 |
| Privacy Policy | 38 |
| Rondure Funds | Shareholder Letter |
| | April 30, 2018 (Unaudited) |
Dear Fellow Shareholders,
It was a tale of two markets our first year. We launched the Rondure Funds on May 1, 2017—conservative investors in a strong market year. We stuck to a disciplined process that is very simple: We look for high-quality companies that we believe have a durable competitive advantage for the long term. This January opened on a frenetic pace. We lagged the torrid moves that month, and Rondure Overseas was impacted by a short-term factor I will detail later. As volatility—the wind—returned to the markets in February, however, we outperformed in both strategies. I will briefly elaborate on what we believe is creating the bumps in the market, and then turn to the specifics on each strategy.
The first driver of volatility is the threat of higher interest rates and the impact that should have on stock prices—Price/Earnings(1) multiples are typically inversely correlated to interest rates. This is a real risk to the aggregate market, and the reason the S&P 500® Index(2) appears to be range bound at present. When the market hits the bottom of the range, stocks look like the better investment, and when the market hits the top of the range, expected stock returns look less appealing than just simply holding cash. This is especially evident to me when we build our five-year models—we should be in a lower return world after years of such strong stock markets. The corollary is that stocks still look like a better deal in the long-run if interest rates don’t increase by much.
The other driver of volatility is all the political theater at present. Last year it was Brazil. Then we moved to North Korea. Then China, and now Russia. There’s no wind like political wind. We are agnostic to all of this, of course, as years of focusing on emerging and frontier markets has taught me that most of it is just noise, and it passes. Political bark is usually bigger than its bite. We simply focus on picking great companies for the long haul and run diversified portfolios.
I think the real canary in the coal mine is rising interest rates in a world with a lot of debt and complacency due to Quantitative Easing(3). US personal savings as a percent of disposable income is back down to pre-2009 levels, and the yield curve(4) is flattening. All of these things signal a possible peak in the recovery (i.e. there is a lot less dry powder left to push nominal growth) and trade war banter might simply give investors a nudge to move more cash to their bank accounts, ending the market’s long rally. I have no ability to predict any of this, however I think it is important for our clients to be aware of the potential issues. I personally keep dry powder on the sidelines to be able to dollar cost average into our strategies (agnostic of the market’s cycles), and our process of investing doesn’t change in this environment. In fact, volatility—the wind—simply enables us to buy businesses we love at better prices for the long term.
Many people ask me about my personal portfolio or are embarrassed to do so. Hence for total transparency, I will just put it in writing for all. I have always followed Benjamin Graham’s advice and run a defensive investment portfolio. It means I always have 50% in stocks and 50% in bonds and cash (all short-term cash at present). Whichever asset class goes down, I reallocate to the beaten up asset class to return to the 50/50 balance. This means I have rainy day funds available to support the Rondure business for many years and also add to the funds themselves. It also means I will never capture all of the upside in the markets, but I will also likely avoid a good deal of the downside as well. The method enables me to deploy capital (buy) into fear and sell into greed. That is my simple allocation strategy. This should not be construed as investment advice—as everyone’s situation and financial goals are different. I share this detail simply because I am often asked.
Rondure Overseas
As of April 30th, the Fund was up +15.88% since our inception a year ago (ROSIX). Full returns can be viewed on page 6. We slightly outperformed the benchmark which returned 14.75% for the year despite expecting it to be tough for our investment style to keep up in strong bull markets. Our steady, quality companies are likely to lag in such an environment.
I think we did a nice job with our stock picking across most sectors and geographies this year. The strongest contribution to the Fund came from being overweight consumer discretionary. We lagged a bit in the materials sector, and our more conservative sector tilt hurt us. An overweight in consumer staples and the cash drag of launching into a strong bull market also worked against us for the year. Another negative impact came from not owning any energy stocks in the Fund. We simply didn’t find the balance sheet quality we wanted, and perhaps we were too punitive in waiting on entry prices for quality companies.
Rondure New World
The Fund was up +12.78% since our inception a year ago (RNWIX). Full returns can be viewed on page 3. We underperformed the benchmark’s 21.92% return for the year, which doesn’t surprise us in a strong bull market. We remain active, bottom up investors, and we are focused on margins of safety(5) given our belief that we need to be cautious at this point in the cycle.
Past performance does not guarantee future results.
| Annual Report | April 30, 2018 | 1 |
| Rondure Funds | Shareholder Letter |
| | April 30, 2018 (Unaudited) |
I feel pretty good about our stock picking in the Fund this year. We've had very solid picks in the consumer spaces—both staples and discretionary stocks. Our relative performance was weaker in the Industrials and Technology sectors. The Tech sector was on a tear this year, and we were underweight Tech. Cash was a significant drag as we took in flows during a bull run in the market, and our overweight to more conservative spaces hurt as well.
Conclusion
We continue to focus on companies with great balance sheets and high returns on capital that we believe we can hold for the long run—regardless of the macro landscape. We call them “compounding innovators.” We like companies that do the heavy lifting for us, so we can minimize trading and taxes. Remember, I’m in this with you as a fellow investor and I manage the portfolio accordingly. We do not believe we have a competitive advantage in trading, but we do have a culture of “skin in the game” and no bureaucratic pressure that allows us to focus on what we believe are the best companies for the long term. We can go where we believe the market is truly inefficient (how many sell side estimates actually go beyond 3 years)? This is how we are building the New World and Overseas strategies—brick by brick with a long-term view and high tracking error to be expected.
Rondure Business Update
The Rondure Funds reached their 1-year mark on May 1st 2018 and Zach Larkin joined Rondure Global Advisors on January 1st from our partner firm, Grandeur Peak, to co-lead efforts in frontier markets and complement our efforts in developing nations generally.
Thank you for investing with us. Thank you for your trust.
Sincerely,
Laura Geritz, CFA
CEO, Founder, and Portfolio Manager
Rondure Global Advisors LLC
| 1 | Price/Earning is the stock’s current Price divided by its Earnings (usually the earnings over the last twelve months). |
| 2 | The S&P 500® Index is an unmanaged index of 500 common stocks chosen for market size, liquidity and industry group representation. It is a market-value weighted index. The Index is not actively managed and does not reflect any deductions for fees, expenses or taxes. An investor may not invest directly in the Index. |
| 3 | Quantitative easing is an unconventional monetary policy in which a central bank purchases government securities or other securities from the market in order to lower interest rates and increase the money supply. |
| 4 | A yield curve is a line that plots the interest rates, at a set point in time, of bonds having equal credit quality but differing maturity dates. The most frequently reported yield curve compares the three-month, two-year, five-year and 30-year U.S. Treasury debt. |
| 5 | Margin of safety refers to any conservative allowance used by value investors in effort to protect their capital and portfolios from downside risk. |
The objective of all Rondure Funds is long-term growth of capital.
RISKS: Mutual fund investing involves risks and loss of principal is possible. Investing in small and micro-cap funds will be more volatile and loss of principal could be greater than investing in large cap or more diversified funds. Investing in foreign securities entails special risks, such as currency fluctuations and political uncertainties, which are described in more detail in the prospectus. Investments in emerging markets are subject to the same risks as other foreign securities and may be subject to greater risks than investments in foreign countries with more established economies and securities markets.
An investor should consider investment objectives, risks, charges, and expenses carefully before investing. To obtain a Rondure Funds prospectus, containing this and other information, visit www.rondureglobal.com or call 1-855-775-3337. Please read it carefully before investing.
The views and information discussed in this commentary are as of the date of publication, are subject to change, and may not reflect the writer's current views. The views expressed represent an assessment of market conditions at a specific point in time, are opinions only and should not be relied upon as investment advice regarding a particular investment or markets in general. Such information does not constitute a recommendation to buy or sell specific securities or investment vehicles. It should not be assumed that any investment will be profitable or will equal the performance of the Funds or any securities or any sectors mentioned herein. The subject matter contained herein has been derived from several sources believed to be reliable and accurate at the time of compilation. The Funds do not accept any liability for losses either direct or consequential caused by the use of this information.
Past performance does not guarantee future results.
CFA® is trademark owned by CFA Institute.
ALPS Distributors, Inc. is the Distributor for the Rondure Funds.
| 2 | 1.855.775.3337 | www.rondureglobal.com |
| Rondure New World Fund | Performance Update |
| | April 30, 2018 (Unaudited) |
Annualized Total Return Performance for the periods ended April 30, 2018
| | | | Expense Ratio(b) |
| | 6 Months | Since Inception(a) | Gross | Net(c) |
| Rondure New World Fund – Institutional (RNWIX) | 4.53% | 12.78% | 2.38% | 1.10% |
| Rondure New World Fund – Investor (RNWOX) | 4.48% | 12.53% | 2.63% | 1.35% |
| MSCI EM (Emerging Markets) TR USD Index(d) | 4.93% | 21.92% | | |
Performance data quoted represents past performance. Past performance does not guarantee future results. Investment return and principal value of an investment will fluctuate so that an investor’s shares, when sold or redeemed, may be worth more or less than the original cost. The Fund imposes a 2.00% redemption fee on shares held for less than 60 days. Current performance data may be higher or lower than actual data quoted. For the most current month-end performance data, please call 1-855-775-3337.
The table does not reflect the deduction of taxes a shareholder would pay on Fund distributions or redemption of Fund shares.
Subject to investment risks, including possible loss of the principal amount invested.
Returns for periods less than 1 year are cumulative.
| (a) | Fund inception date of May 1, 2017. |
| (b) | Ratios as of the Prospectus dated August 31, 2017 and may differ from the ratios presented in the Financial Highlights. |
| (c) | Rondure Global Advisors, LLC (the “Advisor”), has agreed to waive and/or reimburse fees or expenses in order to limit Total Annual Fund Operating Expenses After Fee Waiver/ Expense Reimbursement (excluding acquired fund fees and expenses, brokerage expenses, interest expenses, taxes and extraordinary expenses) to 1.35% and 1.10% of the Fund’s average daily net assets for the Fund’s Investor Class Shares and Institutional Class Shares, respectively. This agreement (the “Expense Agreement”) is in effect through August 31, 2018. The Advisor will be permitted to recover, on a class-by-class basis, expenses it has borne through the Expense Agreement to the extent that a Fund’s expenses in later periods fall below the expense cap in effect at the time of waiver or reimbursement. However, such recapture payments may not cause the Fund’s expense ratio (after recapture) to exceed the lesser of (i) the expense cap in effect at the time of the waiver and (ii) the expense cap in effect at the time of the recapture. Notwithstanding the foregoing, the Fund will not be obligated to pay any such deferred fees and expenses more than three years after the date of the waiver or reimbursement. The Expense Agreement may not be terminated or modified by the Advisor prior to August 31, 2018, except with the approval of the Fund’s Board of Trustees. |
| (d) | The MSCI Emerging Markets Total Return USD Index is an unmanaged total return index, reported in U.S. Dollars, based on share prices and reinvested dividends of approximately 800 companies from 24 emerging market countries. The Index is not actively managed and does not reflect any deductions for fees, expense, or taxes. An investor may not invest directly in the Index. |
| Annual Report | April 30, 2018 | 3 |
| Rondure New World Fund | Performance Update |
| | April 30, 2018 (Unaudited) |
Growth of $10,000 for the period ended April 30, 2018
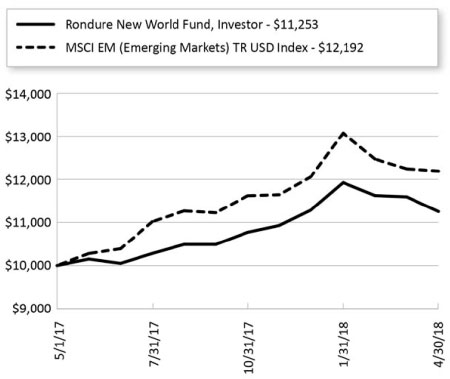
The chart shown above represent a hypothetical investment of $10,000 in the Fund’s Investor Class shares for the period from inception to April 30, 2018. All returns reflect reinvested dividends, but do not reflect the deduction of taxes that an investor would pay on distributions or redemptions.
Investing in the Fund is subject to investment risks, including possible loss of the principal amount invested.
The Fund also offers Institutional Class shares, performance for which is not reflected in the graphs above. The performance of Institutional Class shares may be higher or lower than the performance of the Investor Class shares shown in the graphs above based upon differences in fees paid by shareholders investing in the Investor Class shares and Institutional Class shares.
| 4 | 1.855.775.3337 | www.rondureglobal.com |
| Rondure New World Fund | Performance Update |
| | April 30, 2018 (Unaudited) |
| Regional Allocation (as a % of Net Assets)* |
| Asia ex Japan | 56.6% |
| North America | 12.7% |
| Africa/Middle East | 10.0% |
| Europe | 9.6% |
| Latin America | 8.9% |
| Japan | 0.7% |
| Cash, Cash Equivalents, & Other Net Assets | 1.5% |
| Total | 100.0% |
| | |
| Industry Sector Allocation (as a % of Net Assets)* | |
| Consumer | 58.9% |
| Industrials | 13.6% |
| Technology | 12.5% |
| Energy & Materials | 6.7% |
| Health Care | 3.9% |
| Financials | 2.9% |
| Cash, Cash Equivalents, & Other Net Assets | 1.5% |
| Total | 100.0% |
| | |
| Top 10 Holdings (as a % of Net Assets)* | |
| Yum China Holdings, Inc. | 2.5% |
| Sinotrans, Ltd. | 2.4% |
| TOA Paint Thailand PCL | 2.4% |
| Alibaba Group Holding, Ltd. | 2.4% |
| Philippine Seven Corp. | 2.3% |
| TravelSky Technology, Ltd. | 2.2% |
| China Machinery Engineering Corp. | 2.2% |
| Carnival Corp. | 2.2% |
| Haier Electronics Group Co., Ltd. | 2.2% |
| Vietnam Dairy Products JSC | 2.2% |
| Total | 23.0% |
| * | Holdings are subject to change, and may not reflect the current or future position of the portfolio. |
| Annual Report | April 30, 2018 | 5 |
| Rondure Overseas Fund | Performance Update |
| April 30, 2018 (Unaudited) |
Annualized Total Return Performance for the periods ended April 30, 2018
| | | | Expense Ratio(b) |
| 6 Months | Since Inception(a) | Gross | Net(c) |
| Rondure Overseas Fund – Institutional (ROSIX) | 3.83% | 15.88% | 2.25% | 0.85% |
| Rondure Overseas Fund – Investor (ROSOX) | 3.70% | 15.63% | 2.50% | 1.10% |
| MSCI EAFE TR USD Index(d) | 3.67% | 14.75% | | |
Performance data quoted represents past performance. Past performance does not guarantee future results. Investment return and principal value of an investment will fluctuate so that an investor’s shares, when sold or redeemed, may be worth more or less than the original cost. The Fund imposes a 2.00% redemption fee on shares held for less than 60 days. Current performance data may be higher or lower than actual data quoted. For the most current month-end performance data, please call 1-855-775-3337.
The table does not reflect the deduction of taxes a shareholder would pay on Fund distributions or redemption of Fund shares.
Subject to investment risks, including possible loss of the principal amount invested.
Returns for periods less than 1 year are cumulative.
| (a) | Fund inception date of May 1, 2017. |
| (b) | Ratios as of the Prospectus dated August 31, 2017 and may differ from the ratios presented in the Financial Highlights. |
| (c) | Rondure Global Advisors, LLC (the “Advisor”), has agreed to waive and/or reimburse fees or expenses in order to limit Total Annual Fund Operating Expenses After Fee Waiver/ Expense Reimbursement (excluding acquired fund fees and expenses, brokerage expenses, interest expenses, taxes and extraordinary expenses) to 1.10% and 0.85% of the Fund’s average daily net assets for the Fund’s Investor Class Shares and Institutional Class Shares, respectively. This agreement (the “Expense Agreement”) is in effect through August 31, 2018. The Advisor will be permitted to recover, on a class-by-class basis, expenses it has borne through the Expense Agreement to the extent that a Fund’s expenses in later periods fall below the expense cap in effect at the time of waiver or reimbursement. However, such recapture payments may not cause the Fund’s expense ratio (after recapture) to exceed the lesser of (i) the expense cap in effect at the time of the waiver and (ii) the expense cap in effect at the time of the recapture. Notwithstanding the foregoing, the Fund will not be obligated to pay any such deferred fees and expenses more than three years after the date of the waiver or reimbursement. The Expense Agreement may not be terminated or modified by the Advisor prior to August 31, 2018, except with the approval of the Fund’s Board of Trustees. |
| (d) | The MSCI EAFE Total Return USD Index is an unmanaged total return index, reported in U.S. dollars, based on share prices and reinvested net dividends of approximately 1,100 companies from 22 developed market countries excluding the US and Canada. The Index is not actively managed and does not reflect any deductions for fees, expense, or taxes. An investor may not invest directly in the Index. |
| 6 | 1.855.775.3337 | www.rondureglobal.com |
| Rondure Overseas Fund | Performance Update |
| April 30, 2018 (Unaudited) |
Growth of $10,000 for the period ended April 30, 2018
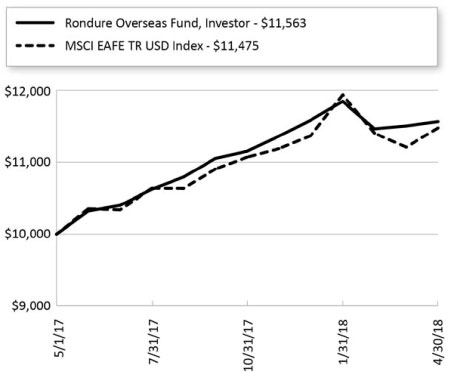
The chart shown above represent a hypothetical investment of $10,000 in the Fund’s Investor Class shares for the period from inception to April 30, 2018. All returns reflect reinvested dividends, but do not reflect the deduction of taxes that an investor would pay on distributions or redemptions.
Investing in the Fund is subject to investment risks, including possible loss of the principal amount invested.
The Fund also offers Institutional Class shares, performance for which is not reflected in the graphs above. The performance of Institutional Class shares may be higher or lower than the performance of the Investor Class shares shown in the graphs above based upon differences in fees paid by shareholders investing in the Investor Class shares and Institutional Class shares.
| Annual Report | April 30, 2018 | 7 |
| Rondure Overseas Fund | Performance Update |
| April 30, 2018 (Unaudited) |
| Regional Allocation (as a % of Net Assets)* |
| Europe | 40.3% |
| Japan | 30.6% |
| North America | 11.6% |
| Australia/New Zealand | 8.3% |
| Asia ex Japan | 4.9% |
| Africa/Middle East | 0.2% |
| Cash, Cash Equivalents, & Other Net Assets | 4.1% |
| Total | 100.0% |
| | |
| Industry Sector Allocation (as a % of Net Assets)* | |
| Consumer | 56.9% |
| Industrials | 19.6% |
| Technology | 7.8% |
| Energy & Materials | 5.0% |
| Health Care | 3.5% |
| Financials | 3.1% |
| Cash, Cash Equivalents, & Other Net Assets | 4.1% |
| Total | 100.0% |
| | |
| Top 10 Holdings (as a % of Net Assets)* | |
| WH Smith PLC | 2.6% |
| Deutsche Post AG | 2.5% |
| Create SD Holdings Co., Ltd. | 2.5% |
| Suzuki Motor Corp. | 2.3% |
| Alimentation Couche-Tard, Inc. | 2.2% |
| Lululemon Athletica, Inc. | 2.1% |
| J D Wetherspoon PLC | 2.1% |
| Yaskawa Electric Corp. | 2.0% |
| Amadeus IT Group SA | 2.0% |
| Lintec Corp. | 1.9% |
| Total | 22.2% |
| * | Holdings are subject to change, and may not reflect the current or future position of the portfolio. |
| 8 | 1.855.775.3337 | www.rondureglobal.com |
| Rondure Funds | Disclosure of Fund Expenses |
| | April 30, 2018 (Unaudited) |
As a shareholder of a Fund, you incur two types of costs: (1) transaction costs, including sales charges (loads) on purchase payments, reinvested dividends, or other distributions; redemption fees; and exchange fees; and (2) ongoing costs, including management fees; distribution and/or service (12b-1) fees; and other Fund expenses. This example is intended to help you understand your ongoing costs (in dollars) of investing in the Fund and to compare these costs with the ongoing costs of investing in other mutual funds.
This example is based on an investment of $1,000 invested at the beginning of the period and held for the entire six-month period of November 1, 2017 through of April 30, 2018.
Actual Expenses The first line of the table provides information about actual account values and actual expenses. You may use the information in this line, together with the amount you invested, to estimate the expenses that you paid over the period. Simply divide your account value by $1,000 (for example, an $8,600 account value divided by $1,000 = 8.6), then multiply the result by the number in the first line under the heading “Expenses Paid During Period” to estimate the expenses you paid on your account during this period.
Hypothetical Example for Comparison Purposes The second line of the table provides information about hypothetical account values and hypothetical expenses based on the Fund’s actual expense ratio and an assumed rate of return of 5% per year before expenses, which is not the Fund’s actual return. The hypothetical account values and expenses may not be used to estimate the actual ending account balance or expenses you paid for the period. You may use this information to compare the ongoing costs of investing in the Fund and other mutual funds. To do so, compare this 5% hypothetical example with the 5% hypothetical examples that appear in the shareholder reports of the other funds. Please note that the expenses shown in the table are meant to highlight your ongoing costs only and do not reflect any transactional costs, such as redemption fees or exchange fees. Therefore, the second line of the table is useful in comparing ongoing costs only and will not help you determine the relative total costs of owning different funds. In addition, if these transactional costs were included, your costs would have been higher.
| | Beginning
Account Value
November 1, 2017 | Ending
Account Value
April 30, 2018 | Expense
Ratio(a) | Expenses Paid
During Period
November 1, 2017 -
April 30, 2018(b) |
| Rondure New World Fund | | | | |
| Institutional Class | | | | |
| Actual | $1,000.00 | $1,045.30 | 1.10% | $5.58 |
| Hypothetical (5% return before expenses) | $1,000.00 | $1,019.34 | 1.10% | $5.51 |
| Investor Class | | | | |
| Actual | $1,000.00 | $1,043.80 | 1.35% | $6.84 |
| Hypothetical (5% return before expenses) | $1,000.00 | $1,018.10 | 1.35% | $6.76 |
| Rondure Overseas Fund | | | | |
| Institutional Class | | | | |
| Actual | $1,000.00 | $1,037.40 | 0.85% | $4.29 |
| Hypothetical (5% return before expenses) | $1,000.00 | $1,020.58 | 0.85% | $4.26 |
| Investor Class | | | | |
| Actual | $1,000.00 | $1,037.00 | 1.10% | $5.56 |
| Hypothetical (5% return before expenses) | $1,000.00 | $1,019.34 | 1.10% | $5.51 |
| (a) | The Fund's expense ratios have been annualized based on the Fund's most recent fiscal half-year expenses. |
| (b) | Expenses are equal to the Fund's annualized expense ratio multiplied by the average account value over the period, multiplied by the number of days in the most recent fiscal half-year 181/365 (to reflect the half-year period). |
| Annual Report | April 30, 2018 | 9 |
| Rondure New World Fund | Portfolio of Investments |
April 30, 2018
| | | | Shares | | | | Value
(Note 2) | |
| COMMON STOCKS (98.51%) | | | | | | | | |
| Argentina (2.58%) | | | | | | | | |
| Banco Macro SA, ADR | | | 15,950 | | | $ | 1,545,874 | |
| Despegar.com Corp.(a) | | | 39,975 | | | | 1,173,666 | |
| MercadoLibre, Inc. | | | 1,500 | | | | 509,415 | |
| | | | | | | | 3,228,955 | |
| | | | | | | | | |
| Bangladesh (0.54%) | | | | | | | | |
| GrameenPhone, Ltd. | | | 21,919 | | | | 123,977 | |
| Square Pharmaceuticals, Ltd. | | | 147,843 | | | | 546,498 | |
| | | | | | | | 670,475 | |
| | | | | | | | | |
| Brazil (3.69%) | | | | | | | | |
| Ambev SA | | | 71,600 | | | | 476,625 | |
| Hypermarcas SA | | | 228,200 | | | | 2,047,364 | |
| M Dias Branco SA | | | 114,700 | | | | 1,439,971 | |
| Raia Drogasil SA | | | 33,300 | | | | 653,224 | |
| | | | | | | | 4,617,184 | |
| | | | | | | | | |
| China (24.59%) | | | | | | | | |
| Alibaba Group Holding, Ltd., Sponsored ADR(a) | | | 16,650 | | | | 2,972,691 | |
| ANTA Sports Products, Ltd. | | | 291,000 | | | | 1,674,001 | |
| Baidu, Inc., Sponsored ADR(a) | | | 9,375 | | | | 2,352,188 | |
| China Machinery Engineering Corp., Class H | | | 4,677,000 | | | | 2,729,216 | |
| China Medical System Holdings, Ltd. | | | 299,000 | | | | 737,533 | |
| China Resources Beer Holdings Co., Ltd. | | | 560,000 | | | | 2,422,327 | |
| Haier Electronics Group Co., Ltd. | | | 778,000 | | | | 2,706,122 | |
| Haitian International Holdings, Ltd. | | | 531,000 | | | | 1,413,988 | |
| Hengan International Group Co., Ltd. | | | 194,000 | | | | 1,730,234 | |
| JD.com, Inc., ADR(a) | | | 38,500 | | | | 1,405,635 | |
| Sinotrans, Ltd., Class H | | | 5,301,000 | | | | 3,059,575 | |
| TravelSky Technology, Ltd., Class H | | | 938,000 | | | | 2,760,704 | |
| Tsingtao Brewery Co., Ltd., Class H | | | 211,000 | | | | 1,096,851 | |
| Want Want China Holdings, Ltd. | | | 590,000 | | | | 523,950 | |
| | | Shares | | | Value
(Note 2) | |
| China (continued) | | | | | | | | |
| Yum China Holdings, Inc. | | | 73,700 | | | $ | 3,151,412 | |
| | | | | | | | 30,736,427 | |
| | | | | | | | | |
| Colombia (0.05%) | | | | | | | | |
| Grupo Nutresa SA | | | 6,962 | | | | 66,573 | |
| | | | | | | | | |
| Germany (0.18%) | | | | | | | | |
| KUKA AG | | | 2,100 | | | | 227,729 | |
| | | | | | | | | |
| Greece (1.69%) | | | | | | | | |
| JUMBO SA | | | 115,656 | | | | 2,117,340 | |
| | | | | | | | | |
| Hong Kong (1.55%) | | | | | | | | |
| Vitasoy International Holdings, Ltd. | | | 729,000 | | | | 1,936,594 | |
| | | | | | | | | |
| India (5.45%) | | | | | | | | |
| Asian Paints, Ltd. | | | 17,244 | | | | 310,490 | |
| Bharat Electronics, Ltd. | | | 981,551 | | | | 1,929,570 | |
| Britannia Industries, Ltd. | | | 7,311 | | | | 603,941 | |
| Castrol India, Ltd. | | | 200,000 | | | | 583,908 | |
| Colgate-Palmolive India, Ltd. | | | 4,704 | | | | 79,166 | |
| Dabur India, Ltd. | | | 117,500 | | | | 650,352 | |
| Eicher Motors, Ltd. | | | 1,400 | | | | 654,241 | |
| Godrej Consumer Products, Ltd. | | | 5,302 | | | | 88,741 | |
| Hindustan Unilever, Ltd. | | | 4,635 | | | | 104,791 | |
| Marico, Ltd. | | | 14,900 | | | | 74,243 | |
| Maruti Suzuki India, Ltd. | | | 6,070 | | | | 801,719 | |
| Nestle India, Ltd. | | | 718 | | | | 101,090 | |
| Pidilite Industries, Ltd. | | | 6,385 | | | | 103,916 | |
| Radico Khaitan, Ltd. | | | 110,500 | | | | 693,481 | |
| Vakrangee, Ltd. | | | 18,980 | | | | 28,425 | |
| | | | | | | | 6,808,074 | |
| | | | | | | | | |
| Indonesia (1.11%) | | | | | | | | |
| Indofood CBP Sukses Makmur Tbk PT | | | 2,049,500 | | | | 1,277,945 | |
| Kalbe Farma Tbk PT | | | 1,014,000 | | | | 109,691 | |
| | | | | | | | 1,387,636 | |
| | | | | | | | | |
| Japan (0.71%) | | | | | | | | |
| Suzuki Motor Corp. | | | 16,400 | | | | 883,758 | |
See Notes to Financial Statements.
| 10 | 1.855.775.3337 | www.rondureglobal.com |
| Rondure New World Fund | Portfolio of Investments |
April 30, 2018
| | | Shares | | | Value
(Note 2) | |
| Kenya (2.63%) | | | | | | |
| East African Breweries, Ltd. | | | 387,200 | | | $ | 965,105 | |
| Safaricom, Ltd. | | | 8,236,600 | | | | 2,319,880 | |
| | | | | | | | 3,284,985 | |
| | | | | | | | | |
| Malaysia (0.39%) | | | | | | | | |
| Heineken Malaysia Bhd | | | 94,000 | | | | 490,664 | |
| | | | | | | | | |
| Mexico (4.76%) | | | | | | | | |
| Alsea SAB de CV | | | 16,300 | | | | 60,512 | |
| Arca Continental SAB de CV | | | 16,200 | | | | 111,638 | |
| Becle SAB de CV(a) | | | 1,564,600 | | | | 2,661,202 | |
| Corp Moctezuma SAB de CV | | | 90,700 | | | | 368,580 | |
| Gruma SAB de CV, Class B | | | 118,200 | | | | 1,445,295 | |
| Wal-Mart de Mexico SAB de CV | | | 467,300 | | | | 1,299,301 | |
| | | | | | | | 5,946,528 | |
| | | | | | | | | |
| Pakistan (0.40%) | | | | | | | | |
| Nestle Pakistan, Ltd. | | | 4,578 | | | | 499,116 | |
| | | | | | | | | |
| Peru (2.00%) | | | | | | | | |
| Alicorp SAA | | | 550,225 | | | | 2,021,269 | |
| InRetail Peru Corp.(b)(c) | | | 20,196 | | | | 482,685 | |
| | | | | | | | 2,503,954 | |
| | | | | | | | | |
| Philippines (4.39%) | | | | | | | | |
| International Container Terminal Services, Inc. | | | 601,000 | | | | 982,514 | |
| Jollibee Foods Corp. | | | 55,000 | | | | 302,901 | |
| Philippine Seven Corp. | | | 1,187,057 | | | | 2,933,837 | |
| Puregold Price Club, Inc. | | | 1,288,000 | | | | 1,179,745 | |
| Universal Robina Corp. | | | 33,000 | | | | 89,595 | |
| | | | | | | | 5,488,592 | |
| | | | | | | | | |
| Poland (2.01%) | | | | | | | | |
| AmRest Holdings SE(a) | | | 9,400 | | | | 1,234,640 | |
| Dino Polska SA(a)(b)(c) | | | 47,000 | | | | 1,272,134 | |
| | | | | | | | 2,506,774 | |
| | | | | | | | | |
| Russia (5.68%) | | | | | | | | |
| Alrosa PJSC | | | 1,599,600 | | | | 2,276,234 | |
| LUKOIL PJSC, Sponsored ADR | | | 25,100 | | | | 1,676,680 | |
| Mail.Ru Group, Ltd., GDR(a)(c) | | | 18,600 | | | | 587,760 | |
| | | Shares | | | Value
(Note 2) | |
| Russia (continued) | | | | | | | | |
| Sberbank of Russia PJSC, | | | | | | | | |
| Sponsored ADR | | | 137,600 | | | $ | 2,050,240 | |
| Yandex NV, Class A(a) | | | 15,425 | | | | 514,578 | |
| | | | | | | | 7,105,492 | |
| | | | | | | | | |
| South Africa (4.20%) | | | | | | | | |
| Clicks Group, Ltd. | | | 115,400 | | | | 1,978,233 | |
| Distell Group, Ltd. | | | 40,100 | | | | 428,441 | |
| Shoprite Holdings, Ltd. | | | 126,000 | | | | 2,516,967 | |
| Tiger Brands, Ltd. | | | 10,400 | | | | 324,557 | |
| | | | | | | | 5,248,198 | |
| | | | | | | | | |
| South Korea (4.50%) | | | | | | | | |
| BGF Retail Co., Ltd. | | | 7,632 | | | | 1,364,835 | |
| LG Household & Health Care, Ltd. | | | 650 | | | | 833,762 | |
| Medy-Tox, Inc. | | | 2,167 | | | | 1,415,382 | |
| NAVER Corp. | | | 828 | | | | 555,075 | |
| S-1 Corp. | | | 4,000 | | | | 367,399 | |
| Samsung Electronics Co., Ltd. | | | 437 | | | | 1,084,266 | |
| | | | | | | | 5,620,719 | |
| | | | | | | | | |
| Sri Lanka (0.57%) | | | | | | | | |
| Lion Brewery Ceylon PLC | | | 204,656 | | | | 707,277 | |
| | | | | | | | | |
| Taiwan (3.39%) | | | | | | | | |
| President Chain Store Corp. | | | 245,000 | | | | 2,422,135 | |
| Taiwan Semiconductor Manufacturing Co., Ltd. | | | 237,000 | | | | 1,818,363 | |
| | | | | | | | 4,240,498 | |
| | | | | | | | | |
| Tanzania (0.19%) | | | | | | | | |
| Tanzania Breweries, Ltd. | | | 34,234 | | | | 239,923 | |
| | | | | | | | | |
| Thailand (2.86%) | | | | | | | | |
| CP ALL PCL | | | 129,000 | | | | 355,608 | |
| Thai Beverage PCL | | | 307,000 | | | | 197,953 | |
| TOA Paint Thailand PCL(a) | | | 2,494,000 | | | | 3,022,671 | |
| | | | | | | | 3,576,232 | |
| | | | | | | | | |
| Turkey (3.30%) | | | | | | | | |
| Aselsan Elektronik Sanayi Ve Ticaret AS | | | 244,800 | | | | 1,518,662 | |
| BIM Birlesik Magazalar AS | | | 94,000 | | | | 1,595,554 | |
See Notes to Financial Statements.
| Annual Report | April 30, 2018 | 11 |
| Rondure New World Fund | Portfolio of Investments |
April 30, 2018
| | | Shares | | | Value
(Note 2) | |
| Turkey (continued) | | | | | | | | |
| Ulker Biskuvi Sanayi AS | | | 192,800 | | | $ | 1,010,965 | |
| | | | | | | | 4,125,181 | |
| | | | | | | | | |
| United Arab Emirates (2.60%) | | | | | | | | |
| Aramex PJSC | | | 2,408,978 | | | | 2,656,129 | |
| DP World, Ltd. | | | 26,720 | | | | 594,520 | |
| | | | | | | | 3,250,649 | |
| | | | | | | | | |
| United States (7.91%) | | | | | | | | |
| Carnival Corp. | | | 43,250 | | | | 2,727,345 | |
| Kansas City Southern | | | 8,325 | | | | 887,694 | |
| Lululemon Athletica, Inc.(a) | | | 19,300 | | | | 1,926,140 | |
| PriceSmart, Inc. | | | 5,875 | | | | 514,650 | |
| Royal Caribbean Cruises, Ltd. | | | 18,825 | | | | 2,036,677 | |
| Starbucks Corp. | | | 31,100 | | | | 1,790,427 | |
| | | | | | | | 9,882,933 | |
| | | | | | | | | |
| Uruguay (0.57%) | | | | | | | | |
| Arcos Dorados Holdings, Inc., Class A | | | 77,600 | | | | 706,160 | |
| | | | | | | | | |
| Vietnam (4.02%) | | | | | | | | |
| Saigon Beer Alcohol Beverage Corp. | | | 249,320 | | | | 2,332,908 | |
| Vietnam Dairy Products JSC | | | 330,760 | | | | 2,688,102 | |
| | | | | | | | 5,021,010 | |
| | | | | | | | | |
| TOTAL COMMON STOCKS | | | | | | | | |
| (Cost $115,064,871) | | | | | | | 123,125,630 | |
| | | | | | | | | |
| TOTAL INVESTMENTS (98.51%) | | | | | | | | |
| (Cost $115,064,871) | | | | | | $ | 123,125,630 | |
| | | | | | | | | |
| Other Assets In Excess Of Liabilities (1.49%) | | | | 1,867,431 | |
| | | | | | | | | |
| NET ASSETS (100.00%) | | | | | | $ | 124,993,061 | |
| (a) | Non-Income Producing Security. |
| (b) | Security exempt from registration under Rule 144A of the Securities Act of 1933. These securities may be resold in the ordinary course of business in transactions exempt from registration, normally to qualified institutional buyers. As of April 30, 2018, these securities had a total aggregate market value of $1,754,819 representing 1.40% of net assets. |
| (c) | Security was purchased pursuant to Regulation S under the Securities Act of 1933, which exempts securities offered and sold outside of the United States from registration. Such security cannot be sold in the United States without either an effective registration statement filed pursuant to the Securities Act of 1933, or pursuant to an exemption from registration. The security has been deemed liquid under guidelines approved by the Fund's Board of Trustees. As of April 30, 2018, the aggregate market value of those securities was $2,342,579, representing 1.87% of net assets. |
See Notes to Financial Statements.
| 12 | 1.855.775.3337 | www.rondureglobal.com |
| Rondure Overseas Fund | Portfolio of Investments |
April 30, 2018
| | | Shares | | | Value
(Note 2) | |
| COMMON STOCKS (95.57%) | | | | | | | | |
| Australia (5.18%) | | | | | | | | |
| carsales.com, Ltd. | | | 7,308 | | | $ | 78,896 | |
| Coca-Cola Amatil, Ltd. | | | 23,700 | | | | 165,757 | |
| Domino's Pizza Enterprises, Ltd. | | | 3,059 | | | | 97,116 | |
| DuluxGroup, Ltd. | | | 62,708 | | | | 366,348 | |
| REA Group, Ltd. | | | 2,546 | | | | 154,989 | |
| SEEK, Ltd. | | | 10,000 | | | | 146,279 | |
| | | | | | | | 1,009,385 | |
| | | | | | | | | |
| Belgium (0.77%) | | | | | | | | |
| Anheuser-Busch InBev SA | | | 865 | | | | 86,407 | |
| Lotus Bakeries | | | 22 | | | | 62,433 | |
| | | | | | | | 148,840 | |
| | | | | | | | | |
| Britain (14.65%) | | | | | | | | |
| Abcam PLC | | | 12,000 | | | | 201,714 | |
| Auto Trader Group PLC(a)(b) | | | 8,900 | | | | 43,252 | |
| B&M European Value Retail SA | | | 48,000 | | | | 267,829 | |
| BAE Systems PLC | | | 17,900 | | | | 150,568 | |
| Compass Group PLC | | | 4,696 | | | | 100,854 | |
| Dechra Pharmaceuticals PLC | | | 2,100 | | | | 79,273 | |
| Diploma PLC | | | 8,700 | | | | 144,446 | |
| Domino's Pizza Group PLC | | | 56,400 | | | | 282,088 | |
| easyJet PLC | | | 8,500 | | | | 186,061 | |
| Intertek Group PLC | | | 2,400 | | | | 161,933 | |
| J D Wetherspoon PLC | | | 24,988 | | | | 400,427 | |
| Just Eat PLC(c) | | | 8,100 | | | | 86,289 | |
| Rightmove PLC | | | 700 | | | | 43,992 | |
| Sanne Group PLC | | | 9,000 | | | | 76,944 | |
| Unilever NV | | | 1,950 | | | | 111,736 | |
| WH Smith PLC | | | 19,187 | | | | 515,352 | |
| | | | | | | | 2,852,758 | |
| | | | | | | | | |
| Canada (3.54%) | | | | | | | | |
| Alimentation Couche-Tard, Inc., Class B | | | 10,000 | | | | 432,338 | |
| Dollarama, Inc. | | | 700 | | | | 80,579 | |
| Ritchie Bros Auctioneers, Inc. | | | 5,400 | | | | 176,474 | |
| | | | | | | | 689,391 | |
| | | Shares | | | Value
(Note 2) | |
| China (1.32%) | | | | | | |
| Yum China Holdings, Inc. | | | 6,025 | | | $ | 257,629 | |
| | | | | | | | | |
| Denmark (1.51%) | | | | | | | | |
| Novo Nordisk A/S, Class B | | | 1,301 | | | | 61,532 | |
| Novozymes A/S, Class B | | | 1,488 | | | | 70,304 | |
| Royal Unibrew A/S | | | 2,440 | | | | 162,147 | |
| | | | | | | | 293,983 | |
| | | | | | | | | |
| Finland (1.36%) | | | | | | | | |
| Olvi OYJ, Class A | | | 7,905 | | | | 265,381 | |
| | | | | | | | | |
| France (1.47%) | | | | | | | | |
| Bureau Veritas SA | | | 6,000 | | | | 156,867 | |
| Laurent-Perrier | | | 550 | | | | 69,407 | |
| Sodexo SA | | | 600 | | | | 59,487 | |
| | | | | | | | 285,761 | |
| | | | | | | | | |
| Germany (9.52%) | | | | | | | | |
| adidas AG | | | 730 | | | | 179,748 | |
| CTS Eventim AG & Co., KGaA | | | 3,745 | | | | 175,653 | |
| Deutsche Lufthansa AG | | | 8,057 | | | | 235,165 | |
| Deutsche Post AG | | | 11,005 | | | | 479,756 | |
| Fresenius Medical Care AG & Co. KGaA | | | 544 | | | | 55,366 | |
| Krones AG | | | 2,645 | | | | 339,853 | |
| KUKA AG | | | 299 | | | | 32,424 | |
| Puma SE | | | 540 | | | | 263,776 | |
| Rational AG | | | 30 | | | | 18,820 | |
| XING SE | | | 235 | | | | 73,075 | |
| | | | | | | | 1,853,636 | |
| | | | | | | | | |
| Hong Kong (0.98%) | | | | | | | | |
| Vitasoy International Holdings, Ltd. | | | 72,000 | | | | 191,269 | |
| | | | | | | | | |
| Ireland (0.27%) | | | | | | | | |
| Glanbia PLC | | | 3,075 | | | | 52,024 | |
| | | | | | | | | |
| Israel (0.24%) | | | | | | | | |
| Elbit Systems, Ltd. | | | 404 | | | | 46,754 | |
| | | | | | | | | |
| Italy (3.43%) | | | | | | | | |
| Brembo SpA | | | 5,959 | | | | 88,152 | |
| Davide Campari-Milano SpA | | | 4,498 | | | | 33,786 | |
| De' Longhi SpA | | | 6,016 | | | | 180,170 | |
See Notes to Financial Statements.
| Annual Report | April 30, 2018 | 13 |
| Rondure Overseas Fund | Portfolio of Investments |
April 30, 2018
| | | Shares | | | Value
(Note 2) | |
| Italy (continued) | | | | | | | | |
| DiaSorin SpA | | | 383 | | | $ | 36,238 | |
| Moncler SpA | | | 7,304 | | | | 330,232 | |
| | | | | | | | 668,578 | |
| | | | | | | | | |
| Japan (30.63%) | | | | | | | | |
| ABC-Mart, Inc. | | | 3,000 | | | | 197,860 | |
| Aeon Delight Co., Ltd. | | | 7,000 | | | | 245,563 | |
| Calbee, Inc. | | | 6,800 | | | | 229,528 | |
| Cosmos Pharmaceutical Corp. | | | 1,300 | | | | 292,655 | |
| Create SD Holdings Co., Ltd. | | | 16,500 | | | | 478,458 | |
| Dip Corp. | | | 3,000 | | | | 72,942 | |
| Ezaki Glico Co., Ltd. | | | 5,400 | | | | 291,932 | |
| Kirin Holdings Co., Ltd. | | | 5,100 | | | | 143,362 | |
| Kusuri no Aoki Holdings Co., Ltd. | | | 2,500 | | | | 171,744 | |
| Kyushu Railway Co. | | | 6,400 | | | | 205,488 | |
| Lintec Corp. | | | 12,700 | | | | 367,687 | |
| Matsumotokiyoshi Holdings Co., Ltd. | | | 6,600 | | | | 294,923 | |
| McDonald's Holdings Co. Japan, Ltd. | | | 1,800 | | | | 84,303 | |
| MEIJI Holdings Co., Ltd. | | | 800 | | | | 64,252 | |
| MISUMI Group, Inc. | | | 4,900 | | | | 135,812 | |
| MonotaRO Co., Ltd. | | | 4,400 | | | | 153,952 | |
| Morinaga & Co., Ltd. | | | 3,900 | | | | 190,148 | |
| Pigeon Corp. | | | 1,800 | | | | 84,468 | |
| Ryohin Keikaku Co., Ltd. | | | 600 | | | | 206,092 | |
| Seria Co., Ltd. | | | 6,500 | | | | 318,697 | |
| Seven & i Holdings Co., Ltd. | | | 5,800 | | | | 254,930 | |
| SK Kaken Co., Ltd. | | | 870 | | | | 88,735 | |
| Sundrug Co., Ltd. | | | 2,500 | | | | 128,750 | |
| Suzuki Motor Corp. | | | 8,400 | | | | 452,656 | |
| TOTO, Ltd. | | | 1,600 | | | | 90,889 | |
| Tsuruha Holdings, Inc. | | | 900 | | | | 129,501 | |
| Unicharm Corp. | | | 6,800 | | | | 191,273 | |
| Yaskawa Electric Corp. | | | 9,700 | | | | 396,625 | |
| | | | | | | | 5,963,225 | |
| | | | | | | | | |
| Netherlands (1.57%) | | | | | | | | |
| Euronext NV(a)(b) | | | 4,250 | | | | 304,859 | |
| | | | | | | | | |
| New Zealand (3.11%) | | | | | | | | |
| Air New Zealand, Ltd. | | | 107,302 | | | | 246,878 | |
| Mainfreight, Ltd. | | | 13,931 | | | | 242,596 | |
| | | Shares | | | Value
(Note 2) | |
| New Zealand (continued) | | | | | | | | |
| Trade Me Group, Ltd. | | | 35,498 | | | $ | 116,140 | |
| | | | | | | | 605,614 | |
| | | | | | | | | |
| South Korea (1.21%) | | | | | | | | |
| S-1 Corp. | | | 600 | | | | 55,110 | |
| Samsung Electronics Co., Ltd. | | | 73 | | | | 181,124 | |
| | | | | | | | 236,234 | |
| | | | | | | | | |
| Spain (2.10%) | | | | | | | | |
| Amadeus IT Group SA | | | 5,257 | | | | 385,345 | |
| Industria de Diseno Textil SA | | | 747 | | | | 23,256 | |
| | | | | | | | 408,601 | |
| | | | | | | | | |
| Sweden (0.94%) | | | | | | | | |
| Axfood AB | | | 4,544 | | | | 84,558 | |
| Indutrade AB | | | 1,260 | | | | 29,843 | |
| Loomis AB, Class B | | | 1,882 | | | | 68,818 | |
| | | | | | | | 183,219 | |
| | | | | | | | | |
| Switzerland (2.24%) | | | | | | | | |
| ABB, Ltd. | | | 3,000 | | | | 70,353 | |
| Nestle SA | | | 1,800 | | | | 139,822 | |
| UBS Group AG | | | 13,400 | | | | 226,759 | |
| | | | | | | | 436,934 | |
| | | | | | | | | |
| Taiwan (1.42%) | | | | | | | | |
| President Chain Store Corp. | | | 28,000 | | | | 276,815 | |
| | | | | | | | | |
| United States (8.11%) | | | | | | | | |
| Carnival Corp. | | | 4,450 | | | | 280,617 | |
| Johnson & Johnson | | | 2,000 | | | | 252,980 | |
| Lululemon Athletica, Inc.(c) | | | 4,175 | | | | 416,665 | |
| Royal Caribbean Cruises, Ltd. | | | 1,700 | | | | 183,923 | |
| Starbucks Corp. | | | 4,325 | | | | 248,990 | |
| The Walt Disney Co. | | | 150 | | | | 15,049 | |
| Yum! Brands, Inc. | | | 2,075 | | | | 180,733 | |
| | | | | | | | 1,578,957 | |
| | | | | | | | | |
| TOTAL COMMON STOCKS | | | | | | | | |
| (Cost $17,342,231) | | | | | | | 18,609,847 | |
See Notes to Financial Statements.
| 14 | 1.855.775.3337 | www.rondureglobal.com |
| Rondure Overseas Fund | Portfolio of Investments |
April 30, 2018
| | | Shares | | | Value
(Note 2) | |
| PREFERRED STOCKS (0.37%) | | | | | | | | |
| Germany (0.37%) | | | | | | | | |
| FUCHS PETROLUB SE | | | 1,351 | | | $ | 72,666 | |
| | | | | | | | | |
| TOTAL PREFERRED STOCKS | | | | | | | | |
| (Cost $73,715) | | | | | | | 72,666 | |
| | | | | | | | | |
| TOTAL INVESTMENTS (95.94%) | | | | | | | | |
| (Cost $17,415,946) | | | | | | $ | 18,682,513 | |
| | | | | | | | | |
| Other Assets In Excess Of Liabilities (4.06%) | | | | 789,866 | |
| | | | | | | | | |
| NET ASSETS (100.00%) | | | | | | $ | 19,472,379 | |
| (a) | Security exempt from registration under Rule 144A of the Securities Act of 1933. These securities may be resold in the ordinary course of business in transactions exempt from registration, normally to qualified institutional buyers. As of April 30, 2018, these securities had a total aggregate market value of $348,111 representing 1.79% of net assets. |
| (b) | Security was purchased pursuant to Regulation S under the Securities Act of 1933, which exempts securities offered and sold outside of the United States from registration. Such security cannot be sold in the United States without either an effective registration statement filed pursuant to the Securities Act of 1933, or pursuant to an exemption from registration. The security has been deemed liquid under guidelines approved by the Fund's Board of Trustees. As of April 30, 2018, the aggregate market value of those securities was $348,111, representing 1.79% of net assets. |
| (c) | Non-Income Producing Security. |
See Notes to Financial Statements.
| Annual Report | April 30, 2018 | 15 |
| Rondure Funds | Statements of Assets and Liabilities |
April 30, 2018
| | | Rondure New World Fund | | | Rondure Overseas Fund | |
| ASSETS | | | | | | |
| Investments, at value (Cost - see below) | | $ | 123,125,630 | | | $ | 18,682,513 | |
| Foreign cash, at value (Cost $141,107 and $18,425, respectively) | | | 140,992 | | | | 18,357 | |
| Cash | | | 2,048,655 | | | | 800,626 | |
| Dividends and interest receivable | | | 117,417 | | | | 45,726 | |
| Receivable for fund shares subscribed | | | 185,897 | | | | 1,958 | |
| Receivable due from advisor | | | 64,165 | | | | 23,863 | |
| Prepaid and other assets | | | 16,041 | | | | 16,348 | |
| Total assets | | | 125,698,797 | | | | 19,589,391 | |
| | | | | | | | | |
| LIABILITIES | | | | | | | | |
| Payable for investments purchased | | | 366,748 | | | | 55,046 | |
| Foreign capital gains tax | | | 85,198 | | | | – | |
| Payable for fund shares redeemed | | | 38,862 | | | | 2,489 | |
| Advisory fees payable | | | 86,898 | | | | 10,930 | |
| Administration fees payable | | | 23,892 | | | | 11,346 | |
| Custodian fees payable | | | 25,746 | | | | 2,863 | |
| Payable for professional fees | | | 20,359 | | | | 20,173 | |
| Payable for trustee fees and expenses | | | 1,225 | | | | 185 | |
| Payable for chief compliance officer fee | | | 2,246 | | | | 339 | |
| Payable for principal financial officer fees | | | 724 | | | | 109 | |
| Distribution and service fees payable - Investor Class | | | 4,920 | | | | 982 | |
| Payable for transfer agency fees | | | 29,010 | | | | 8,995 | |
| Accrued expenses and other liabilities | | | 19,908 | | | | 3,555 | |
| Total liabilities | | | 705,736 | | | | 117,012 | |
| NET ASSETS | | $ | 124,993,061 | | | $ | 19,472,379 | |
| | | | | | | | | |
| NET ASSETS CONSISTS OF | | | | | | | | |
| Paid-in capital (Note 5) | | $ | 117,089,382 | | | $ | 18,102,527 | |
| Accumulated net investment income | | | 118,506 | | | | 104,048 | |
| Accumulated net realized loss | | | (189,219 | ) | | | (3 | ) |
| Net unrealized appreciation | | | 7,974,392 | | | | 1,265,807 | |
| NET ASSETS | | $ | 124,993,061 | | | $ | 19,472,379 | |
| | | | | | | | | |
| INVESTMENTS, AT COST | | $ | 115,064,871 | | | $ | 17,415,946 | |
| | | | | | | | | |
| PRICING OF SHARES | | | | | | | | |
| Institutional Class | | | | | | | | |
| Net Assets | | $ | 100,760,126 | | | $ | 14,283,242 | |
| Net Asset Value, offering and redemption price per share | | $ | 11.25 | | | $ | 11.46 | |
| Shares of beneficial interest outstanding | | | 8,952,664 | | | | 1,246,347 | |
| Investor Class | | | | | | | | |
| Net Assets | | $ | 24,232,935 | | | $ | 5,189,137 | |
| Net Asset Value, offering and redemption price per share | | $ | 11.24 | | | $ | 11.48 | |
| Shares of beneficial interest outstanding | | | 2,155,578 | | | | 452,037 | |
See Notes to Financial Statements.
| 16 | 1.855.775.3337 | www.rondureglobal.com |
| Rondure Funds | Statements of Operations |
For the Period Ended April 30, 2018
| | | Rondure New World Fund(a) | | | Rondure Overseas Fund(a) | |
| INVESTMENT INCOME | | | | | | |
| Dividends | | $ | 1,425,044 | | | $ | 251,393 | |
| Foreign taxes withheld | | | (114,799 | ) | | | (18,463 | ) |
| Other Income | | | 17,503 | | | | 6,713 | |
| Total investment income | | | 1,327,748 | | | | 239,643 | |
| EXPENSES | | | | | | | | |
| Investment advisor fees (Note 6) | | | 728,171 | | | | 92,969 | |
| Administrative fees | | | 219,633 | | | | 52,152 | |
| Distribution and service fees - Investor Class | | | 40,071 | | | | 6,132 | |
| Transfer agent fees | | | 136,302 | | | | 53,595 | |
| Professional fees | | | 25,702 | | | | 22,210 | |
| Printing fees | | | 18,445 | | | | 2,675 | |
| Registration fees | | | 21,928 | | | | 12,364 | |
| Custodian fees | | | 122,548 | | | | 21,611 | |
| Trustee fees and expenses | | | 2,033 | | | | 313 | |
| Chief compliance officer fees | | | 25,940 | | | | 4,065 | |
| Principal financial officer fees | | | 8,622 | | | | 1,351 | |
| Offering costs | | | 76,213 | | | | 63,591 | |
| Other expenses | | | 17,287 | | | | 6,266 | |
| Total expenses | | | 1,442,895 | | | | 339,294 | |
| Less fees waived/reimbursed by investment advisor (Note 6) | | | (457,148 | ) | | | (219,892 | ) |
| Total net expenses | | | 985,747 | | | | 119,402 | |
| NET INVESTMENT INCOME | | | 342,001 | | | | 120,241 | |
| REALIZED AND UNREALIZED GAIN/(LOSS) ON INVESTMENTS | | | | | | | | |
| Net realized gain/(loss) on investments | | | (207,148 | ) | | | 115,578 | |
| Net realized gain/(loss) on foreign currency transactions | | | (73,154 | ) | | | 3,489 | |
| Net realized gain/(loss) | | | (280,302 | ) | | | 119,067 | |
| Net change in unrealized appreciation on investments (net of change in foreign capital gains tax of $85,198 and $0, respectively) | | | 7,975,561 | | | | 1,266,567 | |
| Net change in unrealized depreciation on translation of assets and liabilities in foreign currencies | | | (1,169 | ) | | | (760 | ) |
| Net change in unrealized appreciation | | | 7,974,392 | | | | 1,265,807 | |
| NET REALIZED AND UNREALIZED GAIN ON INVESTMENTS AND FOREIGN CURRENCY TRANSACTIONS | | | 7,694,090 | | | | 1,384,874 | |
| NET INCREASE IN NET ASSETS RESULTING FROM OPERATIONS | | $ | 8,036,091 | | | $ | 1,505,115 | |
| (a) | Represents the period May 2, 2017 (Commencement of Operations) to April 30, 2018. |
See Notes to Financial Statements.
| Annual Report | April 30, 2018 | 17 |
| Rondure New World Fund | Statement of Changes in Net Assets |
| | | For the Period
May 2, 2017
(Commencement
of Operations) to
April 30, 2018 | |
| OPERATIONS | | | |
| Net investment income | | $ | 342,001 | |
| Net realized loss | | | (280,302 | ) |
| Net change in unrealized appreciation | | | 7,974,392 | |
| Net increase in net assets resulting from operations | | | 8,036,091 | |
| DISTRIBUTIONS TO SHAREHOLDERS (NOTE 3) | | | | |
| Net investment income | | | | |
| Institutional Class | | | (186,642 | ) |
| Investor Class | | | (18,344 | ) |
| Net realized gains on investments | | | | |
| Institutional Class | | | (9,291 | ) |
| Investor Class | | | (2,191 | ) |
| Net decrease in net assets from distributions | | | (216,468 | ) |
| CAPITAL SHARE TRANSACTIONS (NOTE 5) | | | | |
| Institutional Class | | | | |
| Proceeds from sales of shares | | | 98,740,607 | |
| Distributions reinvested | | | 185,431 | |
| Cost of shares redeemed | | | (4,530,207 | ) |
| Redemption fees | | | 6,598 | |
| Net increase from capital shares transactions | | | 94,402,429 | |
| Investor Class | | | | |
| Proceeds from sales of shares | | | 25,295,273 | |
| Distributions reinvested | | | 20,535 | |
| Cost of shares redeemed | | | (2,546,642 | ) |
| Redemption fees | | | 1,843 | |
| Net increase from capital shares transactions | | | 22,771,009 | |
| Net increase in net assets | | | 124,993,061 | |
| | | | | |
| NET ASSETS | | | | |
| Beginning of period | | | – | |
| End of period* | | $ | 124,993,061 | |
| | | | | |
| *Including accumulated net investment income of: | | $ | 118,506 | |
| OTHER INFORMATION | | | | |
| Shares Transactions | | | | |
| Institutional Class | | | | |
| Issued | | | 9,350,867 | |
| Issued to shareholders in reinvestment of distributions | | | 16,542 | |
| Redeemed | | | (414,745 | ) |
| Net increase in share transactions | | | 8,952,664 | |
| Investor Class | | | | |
| Issued | | | 2,383,360 | |
| Issued to shareholders in reinvestment of distributions | | | 1,832 | |
| Redeemed | | | (229,614 | ) |
| Net increase in share transactions | | | 2,155,578 | |
See Notes to Financial Statements.
| 18 | 1.855.775.3337 | www.rondureglobal.com |
| Rondure Overseas Fund | Statement of Changes in Net Assets |
| | | For the Period
May 2, 2017
(Commencement
of Operations) to
April 30, 2018 | |
| OPERATIONS | | | |
| Net investment income | | $ | 120,241 | |
| Net realized gain | | | 119,067 | |
| Net change in unrealized appreciation | | | 1,265,807 | |
| Net increase in net assets resulting from operations | | | 1,505,115 | |
| DISTRIBUTIONS TO SHAREHOLDERS (NOTE 3) | | | | |
| Net investment income | | | | |
| Institutional Class | | | (49,002 | ) |
| Investor Class | | | – | |
| Net realized gains on investments | | | | |
| Institutional Class | | | (91,952 | ) |
| Investor Class | | | (25,519 | ) |
| Net decrease in net assets from distributions | | | (166,473 | ) |
| CAPITAL SHARE TRANSACTIONS (NOTE 5) | | | | |
| Institutional Class | | | | |
| Proceeds from sales of shares | | | 14,305,962 | |
| Distributions reinvested | | | 139,017 | |
| Cost of shares redeemed | | | (1,341,389 | ) |
| Redemption fees | | | 2,060 | |
| Net increase from capital shares transactions | | | 13,105,650 | |
| Investor Class | | | | |
| Proceeds from sales of shares | | | 5,925,966 | |
| Distributions reinvested | | | 25,519 | |
| Cost of shares redeemed | | | (924,780 | ) |
| Redemption fees | | | 1,382 | |
| Net increase from capital shares transactions | | | 5,028,087 | |
| Net increase in net assets | | | 19,472,379 | |
| | | | | |
| NET ASSETS | | | | |
| Beginning of period | | | – | |
| End of period* | | $ | 19,472,379 | |
| | | | | |
| *Including accumulated net investment income of: | | $ | 104,048 | |
| OTHER INFORMATION | | | | |
| Shares Transactions | | | | |
| Institutional Class | | | | |
| Issued | | | 1,355,282 | |
| Issued to shareholders in reinvestment of distributions | | | 12,162 | |
| Redeemed | | | (121,097 | ) |
| Net increase in share transactions | | | 1,246,347 | |
| Investor Class | | | | |
| Issued | | | 531,797 | |
| Issued to shareholders in reinvestment of distributions | | | 2,227 | |
| Redeemed | | | (81,987 | ) |
| Net increase in share transactions | | | 452,037 | |
See Notes to Financial Statements.
| Annual Report | April 30, 2018 | 19 |
| Rondure New World Fund - Institutional Class | Financial Highlights |
For a Share Outstanding Throughout the Period Presented
| Institutional Class | | For the Period
May 2, 2017
(Commencement
of Operations) to
April 30, 2018 | |
| NET ASSET VALUE, BEGINNING OF PERIOD | | $ | 10.00 | |
| | | | | |
| INCOME FROM INVESTMENT OPERATIONS | | | | |
| Net investment income(a) | | | 0.05 | |
| Net realized and unrealized gain on investments | | | 1.23 | |
| Total income from investment operations | | | 1.28 | |
| | | | | |
| DISTRIBUTIONS | | | | |
| From net investment income | | | (0.03 | ) |
| From net realized gain on investments | | | (0.00 | )(b) |
| Total distributions | | | (0.03 | ) |
| | | | | |
| REDEMPTION FEES ADDED TO PAID-IN CAPITAL | | | 0.00 | (b) |
| | | | | |
| INCREASE IN NET ASSET VALUE | | | 1.25 | |
| NET ASSET VALUE, END OF PERIOD | | $ | 11.25 | |
| | | | | |
| TOTAL RETURN | | | 12.78 | %(c) |
| | | | | |
| RATIOS AND SUPPLEMENTAL DATA | | | | |
| Net assets, end of period (in 000s) | | $ | 100,760 | |
| | | | | |
| RATIOS TO AVERAGE NET ASSETS | | | | |
| Expenses (excluding fees waived/ reimbursed by investment advisor) | | | 1.62 | %(d) |
| Expenses (including fees waived/ reimbursed by investment advisor) | | | 1.10 | %(d) |
| Net investment income | | | 0.43 | %(d) |
| | | | | |
| PORTFOLIO TURNOVER RATE | | | 13 | %(c) |
| (a) | Per share numbers have been calculated using the average shares method. |
| (b) | Less than $0.005 or ($0.005) per share. |
See Notes to Financial Statements.
| 20 | 1.855.775.3337 | www.rondureglobal.com |
| Rondure New World Fund – Investor Class | Financial Highlights |
For a Share Outstanding Throughout the Period Presented
| Investor Class | | For the Period
May 2, 2017
(Commencement
of Operations) to
April 30, 2018 | |
| NET ASSET VALUE, BEGINNING OF PERIOD | | $ | 10.00 | |
| | | | | |
| INCOME FROM INVESTMENT OPERATIONS | | | | |
| Net investment income(a) | | | 0.03 | |
| Net realized and unrealized gain on investments | | | 1.22 | |
| Total income from investment operations | | | 1.25 | |
| | | | | |
| DISTRIBUTIONS | | | | |
| From net investment income | | | (0.01 | ) |
| From net realized gain on investments | | | (0.00 | )(b) |
| Total distributions | | | (0.01 | ) |
| | | | | |
| REDEMPTION FEES ADDED TO PAID-IN CAPITAL | | | 0.00 | (b) |
| | | | | |
| INCREASE IN NET ASSET VALUE | | | 1.24 | |
| NET ASSET VALUE, END OF PERIOD | | $ | 11.24 | |
| | | | | |
| TOTAL RETURN | | | 12.53 | %(c) |
| | | | | |
| RATIOS AND SUPPLEMENTAL DATA | | | | |
| Net assets, end of period (in 000s) | | $ | 24,233 | |
| | | | | |
| RATIOS TO AVERAGE NET ASSETS | | | | |
| Expenses (excluding fees waived/ reimbursed by investment advisor) | | | 1.91 | %(d) |
| Expenses (including fees waived/ reimbursed by investment advisor) | | | 1.35 | %(d) |
| Net investment income | | | 0.24 | %(d) |
| | | | | |
| PORTFOLIO TURNOVER RATE | | | 13 | %(c) |
| (a) | Per share numbers have been calculated using the average shares method. |
| (b) | Less than $0.005 or ($0.005) per share. |
See Notes to Financial Statements.
| Annual Report | April 30, 2018 | 21 |
| Rondure Overseas Fund - Institutional Class | Financial Highlights |
For a Share Outstanding Throughout the Period Presented
| Institutional Class | | For the Period
May 2, 2017
(Commencement
of Operations) to
April 30, 2018 | |
| NET ASSET VALUE, BEGINNING OF PERIOD | | $ | 10.00 | |
| | | | | |
| INCOME FROM INVESTMENT OPERATIONS | | | | |
| Net investment income(a) | | | 0.10 | |
| Net realized and unrealized gain on investments | | | 1.48 | |
| Total income from investment operations | | | 1.58 | |
| | | | | |
| DISTRIBUTIONS | | | | |
| From net investment income | | | (0.04 | ) |
| From net realized gain on investments | | | (0.08 | ) |
| Total distributions | | | (0.12 | ) |
| | | | | |
| REDEMPTION FEES ADDED TO PAID-IN CAPITAL | | | 0.00 | (b) |
| | | | | |
| INCREASE IN NET ASSET VALUE | | | 1.46 | |
| NET ASSET VALUE, END OF PERIOD | | $ | 11.46 | |
| | | | | |
| TOTAL RETURN | | | 15.88 | %(c) |
| | | | | |
| RATIOS AND SUPPLEMENTAL DATA | | | | |
| Net assets, end of period (in 000s) | | $ | 14,283 | |
| | | | | |
| RATIOS TO AVERAGE NET ASSETS | | | | |
| Expenses (excluding fees waived/ reimbursed by investment advisor) | | | 2.57 | %(d) |
| Expenses (including fees waived/ reimbursed by investment advisor) | | | 0.85 | %(d) |
| Net investment income | | | 0.92 | %(d) |
| | | | | |
| PORTFOLIO TURNOVER RATE | | | 14 | %(c) |
| (a) | Per share numbers have been calculated using the average shares method. |
| (b) | Less than $0.005 or ($0.005) per share. |
See Notes to Financial Statements.
| 22 | 1.855.775.3337 | www.rondureglobal.com |
| Rondure Overseas Fund - Investor Class | Financial Highlights |
For a Share Outstanding Throughout the Period Presented
| Investor Class | | For the Period
May 2, 2017
(Commencement
of Operations) to
April 30, 2018 | |
| NET ASSET VALUE, BEGINNING OF PERIOD | | $ | 10.00 | |
| | | | | |
| INCOME FROM INVESTMENT OPERATIONS | | | | |
| Net investment income(a) | | | 0.09 | |
| Net realized and unrealized gain on investments | | | 1.46 | |
| Total income from investment operations | | | 1.55 | |
| | | | | |
| DISTRIBUTIONS | | | | |
| From net realized gain on investments | | | (0.08 | ) |
| Total distributions | | | (0.08 | ) |
| | | | | |
| REDEMPTION FEES ADDED TO PAID-IN CAPITAL | | | 0.01 | |
| | | | | |
| INCREASE IN NET ASSET VALUE | | | 1.48 | |
| NET ASSET VALUE, END OF PERIOD | | $ | 11.48 | |
| | | | | |
| TOTAL RETURN | | | 15.63 | %(b) |
| | | | | |
| RATIOS AND SUPPLEMENTAL DATA | | | | |
| Net assets, end of period (in 000s) | | $ | 5,189 | |
| | | | | |
| RATIOS TO AVERAGE NET ASSETS | | | | |
| Expenses (excluding fees waived/ reimbursed by investment advisor) | | | 2.45 | %(c) |
| Expenses (including fees waived/ reimbursed by investment advisor) | | | 1.10 | %(c) |
| Net investment income | | | 0.82 | %(c) |
| | | | | |
| PORTFOLIO TURNOVER RATE | | | 14 | %(b) |
| (a) | Per share numbers have been calculated using the average shares method. |
See Notes to Financial Statements.
| Annual Report | April 30, 2018 | 23 |
| Rondure Funds | Notes to Financial Statements |
April 30, 2018
1. ORGANIZATION
Financial Investors Trust (the “Trust”), a Delaware statutory trust, is an open-end management investment company registered under the Investment Company Act of 1940, as amended (“1940 Act”). As of April 30, 2018, the Trust consists of multiple separate portfolios or series. This annual report describes the Rondure New World Fund and the Rondure Overseas Fund (individually a “Fund” and collectively, the “Funds”). The Funds seek long-term growth of capital. The Funds offer Investor Class and Institutional Class shares.
2. SIGNIFICANT ACCOUNTING POLICIES
The accompanying financial statements were prepared in accordance with accounting principles generally accepted in the United States of America (“U.S. GAAP”). The preparation of financial statements in conformity with U.S. GAAP requires management to make certain estimates and assumptions that affect the reported amounts of assets and liabilities and disclosures of contingent assets and liabilities at the date of the financial statements and the reported amounts of revenue and expenses during the period. Actual results could differ from those estimates. The Funds are considered an investment company for financial reporting purposes under U.S. GAAP and follows the accounting and reporting guidance applicable to investment companies in the Financial Accounting Standards Board Accounting Standards Codification Topic 946. The following is a summary of significant accounting policies consistently followed by the Funds in preparation of its financial statements.
Investment Valuation: The Funds generally value their securities based on market prices determined at the close of regular trading on the New York Stock Exchange (“NYSE”), normally 4:00 p.m. Eastern Time, on each day the NYSE is open for trading.
For equity securities and mutual funds that are traded on an exchange, the market price is usually the closing sale or official closing price on that exchange. In the case of equity securities not traded on an exchange, or if such closing prices are not otherwise available, the securities are valued at the mean of the most recent bid and ask prices on such day. Redeemable securities issued by open-end registered investment companies are valued at the investment company’s applicable net asset value, with the exception of exchange-traded open-end investment companies, which are priced as equity securities.
Equity securities that are primarily traded on foreign securities exchanges are valued at the closing values of such securities on their respective foreign exchanges, except when an event occurs subsequent to the close of the foreign exchange and the close of the NYSE that was likely to have changed such value. In such an event, the fair value of those securities are determined in good faith through consideration of other factors in accordance with procedures established by and under the general supervision of the Board of Trustees (the “Board”). The Funds will use a fair valuation model provided by an independent pricing service, which is intended to reflect fair value when a security’s value or a meaningful portion of each Fund’s portfolio is believed to have been materially affected by a valuation event that has occurred between the close of the exchange or market on which the security is traded and the close of the regular trading day on the NYSE. The Funds’ valuation procedures set forth certain triggers which instruct when to use the fair valuation model.
Forward currency exchange contracts have a fair value determined by the prevailing foreign currency exchange daily rates and current foreign currency exchange forward rates. The foreign currency exchange forward rates are calculated using an automated system that estimates rates on the basis of the current day foreign currency exchange rates and forward foreign currency exchange rates supplied by a pricing service.
When such prices or quotations are not available, or when Rondure Global Advisors, LLC (the “Advisor”) believes that they are unreliable, securities may be priced using fair value procedures approved by the Board.
Fair Value Measurements: The Funds disclose the classification of their fair value measurements following a three-tier hierarchy based on the inputs used to measure fair value. Inputs refer broadly to the assumptions that market participants would use in pricing the asset or liability, including assumptions about risk. Inputs may be observable or unobservable. Observable inputs reflect the assumptions market participants would use in pricing the asset or liability that are developed based on market data obtained from sources independent of the reporting entity. Unobservable inputs reflect the reporting entity’s own assumptions about the assumptions market participants would use in pricing the asset or liability that are developed based on the best information available.
Various inputs are used in determining the value of the Funds’ investments as of the end of the reporting period. When inputs used fall into different levels of the fair value hierarchy, the level in the hierarchy within which the fair value measurement falls is determined based on the lowest level input that is significant to the fair value measurement in its entirety. The designated input levels are not necessarily an indication of the risk or liquidity associated with these investments. These inputs are categorized in the following hierarchy under applicable financial accounting standards:
| 24 | 1.855.775.3337 | www.rondureglobal.com |
| Rondure Funds | Notes to Financial Statements |
April 30, 2018
Level 1 - Unadjusted quoted prices in active markets for identical investments, unrestricted assets or liabilities that the Funds have the ability to access at the measurement date;
Level 2 - Quoted prices which are not active, quoted prices for similar assets or liabilities in active markets or inputs other than quoted prices that are observable (either directly or indirectly) for substantially the full term of the asset or liability; and
Level 3 - Significant unobservable prices or inputs (including the Funds’ own assumptions in determining the fair value of investments) where there is little or no market activity for the asset or liability at the measurement date.
The following is a summary of each Fund’s investments in the fair value hierarchy as of April 30, 2018:
| Investments in Securities at Value | | Level 1 -
Quoted and
Unadjusted
Prices | | | Level 2 -
Other
Significant
Observable
Inputs | | | Level 3 -
Significant
Unobservable
Inputs | | | Total | |
| Rondure New World Fund | | | | | | | | | | | | | | | | |
| Common Stocks | | | | | | | | | | | | | | | | |
| Pakistan | | $ | – | | | $ | 499,116 | | | $ | – | | | $ | 499,116 | |
| South Korea | | | 4,536,453 | | | | 1,084,266 | | | | – | | | | 5,620,719 | |
| Tanzania | | | – | | | | 239,923 | | | | – | | | | 239,923 | |
| Other* | | | 116,765,872 | | | | – | | | | – | | | | 116,765,872 | |
| Total | | $ | 121,302,325 | | | $ | 1,823,305 | | | $ | – | | | $ | 123,125,630 | |
| Investments in Securities at Value | | Level 1 -
Quoted and
Unadjusted
Prices | | | Level 2 -
Other
Significant
Observable
Inputs | | | Level 3 -
Significant
Unobservable
Inputs | | | Total | |
| Rondure Overseas Fund | | | | | | | | | | | | |
| Common Stocks | | | | | | | | | | | | | | | | |
| South Korea | | $ | 55,110 | | | $ | 181,124 | | | $ | – | | | $ | 236,234 | |
| Other* | | | 18,373,613 | | | | – | | | | – | | | | 18,373,613 | |
| Preferred Stocks* | | $ | 72,666 | | | $ | – | | | $ | – | | | $ | 72,666 | |
| Total | | $ | 18,501,389 | | | $ | 181,124 | | | $ | – | | | $ | 18,682,513 | |
| * | For a detailed country breakdown, see the accompanying Portfolio of Investments. |
For the period ended April 30, 2018, the Funds did not have any transfers in/(out) of Level 1 and Level 2 securities.
The Funds recognize transfers between levels as of the end of the period. For the period ended April 30, 2018, the Funds did not have any securities that used significant unobservable inputs (Level 3) in determining fair value.
Investment Transactions and Investment Income: Investment transactions are accounted for on the date the investments are purchased or sold (trade date). Realized gains and losses from investment transactions are reported on an identified cost which is the same basis the Fund uses for federal income tax purposes. Interest income, which includes accretion of discounts and amortization of premiums, is accrued and recorded as earned. Dividend income is recognized on the ex-dividend date or for certain foreign securities, as soon as information is available to the Funds. All of the realized and unrealized gains and losses and net investment income, are allocated daily to each class in proportion to its average daily net assets.
Cash Management Transactions: The Funds subscribe to the Brown Brothers Harriman & Co. (“BBH”) Cash Management Service (“CMS”), whereby cash balances are automatically swept into overnight offshore demand deposits with either the BBH Grand Cayman branch or a branch of a pre-approved commercial bank. This fully automated program allows the Funds to earn interest on cash balances. Excess cash with deposit institutions domiciled outside of the U.S. are subject to sovereign actions in the jurisdiction of the deposit institution including, but not limited to,
| Annual Report | April 30, 2018 | 25 |
| Rondure Funds | Notes to Financial Statements |
April 30, 2018
freeze, seizure or diminution. Cash balances in the BBH CMS are included on the Statements of Assets and Liabilities under Cash and Foreign Cash, at Value. As of April 30, 2018, the Funds had the following cash balances participating in the BBH CMS:
| Fund | | | |
| Rondure New World Fund | | $ | 2,047,218 | |
| Rondure Overseas Fund | | | 800,076 | |
As of April 30, 2018, the Funds had the following foreign cash balances participating in the BBH CMS (cost and value of foreign cash balances are equal):
| Fund | | | |
| Rondure New World Fund | | $ | 10 | |
| Rondure Overseas Fund | | | 18,332 | |
Foreign Securities: The Funds may directly purchase securities of foreign issuers. Investing in securities of foreign issuers involves special risks not typically associated with investing in securities of U.S. issuers. The risks include possible reevaluation of currencies, the inability to repatriate foreign currency, less complete financial information about companies and possible future adverse political and economic developments. Moreover, securities of many foreign issuers and their markets may be less liquid and their prices more volatile than those of securities of comparable U.S. issuers.
Foreign Currency Translation: The books and records of the Funds are maintained in U.S. dollars. Investment valuations and other assets and liabilities initially expressed in foreign currencies are converted each business day into U.S. dollars based upon current exchange rates. Prevailing foreign exchange rates may generally be obtained at the close of the NYSE (normally, 4:00 p.m. Eastern Time). The portion of realized and unrealized gains or losses on investments due to fluctuations in foreign currency exchange rates are separately disclosed.
Foreign Currency Spot Contracts: The Funds may enter into foreign currency spot contracts to facilitate transactions in foreign securities or to convert foreign currency receipts into U.S. dollars. A foreign currency spot contract is an agreement between two parties to buy and sell currencies at the current market rate, for settlement generally within two business days. The U.S. dollar value of the contracts is determined using current currency exchange rates supplied by a pricing service.
The contract is marked-to-market daily for settlements beyond one day and any change in market value is recorded as an unrealized gain or loss. When the contract is closed, a realized gain or loss is recorded equal to the difference between the value on the open and close date. Losses may arise from changes in the value of the foreign currency, or if the counterparties do not perform under the contract’s terms. The maximum potential loss from such contracts is the aggregate face value in U.S. dollars at the time the contract was opened.
Trust Expenses: Some expenses of the Trust can be directly attributed to the Funds. Expenses which cannot be directly attributed to the Funds are apportioned among all funds in the Trust based on average net assets of each fund.
Fund and Class Expenses: Expenses that are specific to a Fund or class of shares of a Fund, including distribution fees (Rule 12b-1 fees), are charged directly to that Fund or share class. Expenses that are common to all Funds generally are allocated among the Funds in proportion to their average daily net assets.
Offering Costs: Offering costs, including costs of printing initial prospectuses, legal and registration fees, are being amortized over twelve months from the inception date of the Funds. Amounts amortized during the period ended April 30, 2018 for Funds are shown on the Statements of Operations.
Federal Income Taxes: The Funds comply with the requirements under Subchapter M of the Internal Revenue Code of 1986, as amended, applicable to regulated investment companies and intend to distribute substantially all of their net taxable income and net capital gains, if any, each year so that it will not be subject to excise tax on undistributed income and gains. The Funds are not subject to income taxes to the extent such distributions are made.
Distributions to Shareholders: Each Fund normally pays dividends and distributes capital gains, if any, on an annual basis. Income dividend distributions are derived from dividends and other income each Fund receives from their investments, including short term capital gains. Long term capital gain distributions are derived from gains realized when each Fund sells a security it has owned for more than a year. Each Fund may make
| 26 | 1.855.775.3337 | www.rondureglobal.com |
| Rondure Funds | Notes to Financial Statements |
additional distributions and dividends at other times if the portfolio manager believes doing so may be necessary for each Fund to avoid or reduce taxes. The Funds intend to pass through foreign tax credits to shareholders.
3. TAX BASIS INFORMATION
Reclassifications: As of April 30, 2018, permanent differences in book and tax accounting were reclassified. These differences had no effect on net assets and are primarily attributed to the differing book/tax treatment of foreign currency transactions, non-deductible expenses, PFIC investments, equalization book/tax distribution differences and certain other investments. The reclassifications were as follows:
| Fund | | Paid-in Capital | | | Accumulated Net Investment Income/(Loss) | | | Accumulated Net Realized Gain/(Loss) on Investments | |
| Rondure New World Fund | | $ | (84,056 | ) | | $ | (18,509 | ) | | $ | 102,565 | |
| Rondure Overseas Fund | | | (31,210 | ) | | | 32,809 | | | | (1,599 | ) |
Tax Basis of Investments: As of April 30, 2018, the aggregate cost of investments, gross unrealized appreciation/(depreciation) and net unrealized appreciation for Federal tax purposes was as follows:
| Fund | | Gross Appreciation (excess of value over tax cost) | | | Gross Depreciation (excess of tax cost over value) | | | Net Depreciation of Foreign Currency | | | Net Unrealized Appreciation | | | Cost of Investments for Income Tax Purposes | |
| Rondure New World Fund | | $ | 12,908,335 | | | $ | (4,847,577 | ) | | $ | (86,367 | ) | | $ | 7,974,391 | | | $ | 115,064,872 | |
| Rondure Overseas Fund | | | 1,832,095 | | | | (565,531 | ) | | | (760 | ) | | | 1,265,804 | | | | 17,415,949 | |
Components of Earnings: As of April 30, 2018, components of distributable earnings on a tax basis were as follows:
| Fund | | Undistributed Ordinary Income | | | Accumulated Capital Losses | | | Other Accumulated Gain/(Loss) | | | Net Unrealized Appreciation on Investments and Foreign Currency | | | Total Distributable Earnings | |
| Rondure New World Fund | | $ | 118,625 | | | $ | (189,218 | ) | | $ | (119 | ) | | $ | 7,974,391 | | | $ | 7,903,679 | |
| Rondure Overseas Fund | | | 104,033 | | | | – | | | | 15 | | | | 1,265,804 | | | | 1,369,852 | |
Rondure New World Fund elects to defer to the period ending April 30, 2019, capital losses recognized during the period November 1, 2017 to April 30, 2018 in the amount of $189,218.
Tax Basis of Distributions to Shareholders: The character of distributions made during the period from net investment income or net realized gains may differ from its ultimate characterization for federal income tax purposes. Also, due to the timing of dividend distributions, the fiscal year in which amounts are distributed may differ from the fiscal year in which the income or realized gain were recorded by the Funds.
The tax character of distributions paid by the Funds for the period ended April 30, 2018 were as follows:
| Fund | | Ordinary
Income | | | Long-Term
Capital Gain | |
| Rondure New World Fund | | $ | 216,468 | | | $ | – | |
| Rondure Overseas Fund | | | 166,473 | | | | – | |
| Annual Report | April 30, 2018 | 27 |
| Rondure Funds | Notes to Financial Statements |
4. SECURITIES TRANSACTIONS
The cost of purchases and proceeds from sales of securities (excluding short term securities) during the period ended April 30, 2018 were as follows:
| Fund | | Purchases of
Securities | | | Proceeds From
Sales of Securities | |
| Rondure New World Fund | | $ | 125,785,661 | | | $ | 10,529,289 | |
| Rondure Overseas Fund | | | 19,024,022 | | | | 1,723,486 | |
5. SHARES OF BENEFICIAL INTEREST
The capitalization of the Trust consists of an unlimited number of shares of beneficial interest with no par value per share. Holders of the shares of the Funds of the Trust have one vote for each share held and a proportionate fraction of a vote for each fractional share. All shares issued and outstanding are fully paid and are transferable and redeemable at the option of the shareholder. Purchasers of the share do not have any obligation to make payments to the Trust or its creditors solely by reason of the purchasers’ ownership of the shares. Shares have no pre-emptive rights.
Shares redeemed within 60 days of purchase may incur a 2% short-term redemption fee deducted from the redemption amount. For the period ended April 30, 2018, the redemption fees charged by the Funds are presented in the Statement of Changes in Net Assets.
6. MANAGEMENT AND RELATED-PARTY TRANSACTIONS
The Advisor, subject to the authority of the Board, is responsible for the overall management and administration of the Funds’ business affairs. The Advisor manages the investments of the Funds in accordance with the Funds’ investment objective, policies and limitations and investment guidelines established jointly by the Advisor and the Trustees. Pursuant to the Advisory Agreement, (the “Advisory Agreement”), each Fund pays the Advisor an annual management fee based on each Fund’s average daily net assets. The management fee is paid on a monthly basis. The following table reflects the Funds’ advisory fee rates.
| Fund | Advisory Fee |
| Rondure New World Fund | 0.85% |
| Rondure Overseas Fund | 0.70% |
The Advisor has contractually agreed to limit certain of each Fund’s expenses (excluding acquired fund fees and expenses, brokerage expenses, interest expense, taxes and extraordinary expenses). The following table reflects the Funds’ expense cap.
| Fund | Expense Cap | Term of Expense Limit Agreements |
| Rondure New World Fund | | |
| Institutional Class | 1.10% | |
| Investor Class | 1.35% | March 23, 2017 – August 31, 2018 |
| Rondure Overseas Fund | | |
| Institutional Class | 0.85% | |
| Investor Class | 1.10% | March 23, 2017 – August 31, 2018 |
Pursuant to these agreements, the Advisor may seek reimbursement from a Fund for any previous fee waivers and expense reimbursements made by the Advisor, provided that any such reimbursements made by the Funds to the Advisor will not cause the Funds’ expense limitation to exceed expense limitations in existence at the time the expense was incurred, or at the time of the reimbursement, whichever is lower, and the reimbursement is made within three years after the expenses were incurred. Fees waived/reimbursed by Advisor for the period ended April 30, 2018 are disclosed in the Statements of Operations.
| 28 | 1.855.775.3337 | www.rondureglobal.com |
| Rondure Funds | Notes to Financial Statements |
For the period ended April 30, 2018, the fee waivers/reimbursements and/or recoupments were as follows:
| Fund | | Fees Waived/
Reimbursed By
Advisor | |
| Rondure New World Fund | | | | |
| Institutional Class | | $ | 366,501 | |
| Investor Class | | | 90,647 | |
| Rondure Overseas Fund | | | | |
| Institutional Class | | $ | 186,581 | |
| Investor Class | | | 33,311 | |
| Fund | | Expires 2021 | | Total | |
| Rondure New World Fund | | | | | | | |
| Institutional Class | | $ | 366,501 | | $ | 366,501 | |
| Investor Class | | | 90,647 | | | 90,647 | |
| Rondure Overseas Fund | | | | | | | |
| Institutional Class | | $ | 186,581 | | $ | 186,581 | |
| Investor Class | | | 33,311 | | | 33,311 | |
Administrator Fees and Expenses
ALPS Fund Services, Inc. (“ALPS”) serves as administrator to the Funds and the Funds have agreed to pay expenses incurred in connection with their administrative activities. Pursuant to an Administration Agreement, ALPS provides operational services to the Funds including, but not limited to, fund accounting and fund administration and generally assists in the Funds’ operations. Officers of the Trust are employees of ALPS. The Funds’ administration fee is accrued on a daily basis and paid monthly. Administration fees paid by the Funds for the period ended April 30, 2018 are disclosed in the Statements of Operations.
ALPS is reimbursed by the Fund for certain out-of-pocket expenses.
Transfer Agent
ALPS serves as transfer, dividend paying and shareholder servicing agent for the Funds. ALPS receives an annual minimum fee, a fee based upon the number of shareholder accounts, and is also reimbursed by the Funds for certain out-of-pocket expenses. Transfer agent fees paid by the Funds for the period ended April 30, 2018 are disclosed in the Statements of Operations.
Compliance Services
ALPS provides services that assist the Trust’s chief compliance officer in monitoring and testing the policies and procedures of the Trust in conjunction with requirements under Rule 38a-1 under the 1940 Act and receives an annual base fee. ALPS is reimbursed for certain out-of-pocket expenses by the Funds. Compliance service fees paid by the Funds for the period ended April 30, 2018 are disclosed in the Statements of Operations.
Principal Financial Officer
ALPS receives an annual fee for providing principal financial officer services to the Funds. Principal financial officer fees paid by the Fund for period ended April 30, 2018 are disclosed in the Statements of Operations.
Distributor: ALPS Distributors, Inc. (“ADI” or the “Distributor”) (an affiliate of ALPS) acts as the distributor of the Funds’ shares pursuant to a Distribution Agreement with the Trust. Shares are sold on a continuous basis by ADI as agent for the Funds, and ADI has agreed to use its best efforts to solicit orders for the sale of each Fund’s shares, although it is not obliged to sell any particular amount of shares. ADI is not entitled to any compensation for its services as Distributor. ADI is registered as a broker-dealer with the U.S. Securities and Exchange Commission.
Each Fund has adopted a Distribution and Services (Rule 12b-1) Plan pursuant to Rule 12b-1 of the 1940 Act (the “Plan”) for its Investor Class shares. The Plan allows the Funds to use Investor Class assets to pay fees in connection with the distribution and marketing of Investor Class shares and/or the provision of shareholder services to Investor Class shareholders. The Plan permits payment for services in connection with the administration of plans or programs that use Investor Class shares of each Fund as their funding medium and for related expenses. The recipients of
| Annual Report | April 30, 2018 | 29 |
| Rondure Funds | Notes to Financial Statements |
such payments may include the Distributor, other affiliates of the Advisor, broker-dealers, financial institutions, plan sponsors and administrators and other financial intermediaries through which investors may purchase shares of the Fund. The Plan permits the Funds to make total payments at an annual rate of up to 0.25% of each Fund’s average daily net assets attributable to its Investor Class shares. The expenses of the Plan are reflected as distribution and service fees in the Statements of Operations.
7. INDEMNIFICATIONS
Under the Trust’s organizational documents, its officers and Trustees are indemnified against certain liability arising out of the performance of their duties to the Trust. Additionally, in the normal course of business, the Trust enters into contracts with service providers that may contain general indemnification clauses, which may permit indemnification to the extent permissible under applicable law. The Trust’s maximum exposure under these arrangements is unknown, as this would involve future claims that may be made against the Trust that have not yet occurred.
| 30 | 1.855.775.3337 | www.rondureglobal.com |
| Rondure Funds | Report of Independent Registered Public Accounting Firm |
To the shareholders and the Board of Trustees of Financial Investors Trust
Opinion on the Financial Statements and Financial Highlights
We have audited the accompanying statements of assets and liabilities, including the portfolios of investments, of Rondure New World Fund and Rondure Overseas Fund (the "Funds"), two of the funds constituting the Financial Investors Trust, as of April 30, 2018, the related statements of operations, statements of changes in net assets, and the financial highlights for the year May 2, 2017 (commencement of investment operations) to April 30, 2018, and the related notes. In our opinion, the financial statements and financial highlights present fairly, in all material respects, the financial position of each of the funds listed above constituting the Financial Investors Trust as of April 30, 2018, and the results of their operations, changes in their net assets, and the financial highlights for the year May 2, 2017 (commencement of investment operations) to April 30, 2018 in conformity with accounting principles generally accepted in the United States of America.
Basis for Opinion
These financial statements and financial highlights are the responsibility of the Funds’ management. Our responsibility is to express an opinion on the Funds’ financial statements and financial highlights based on our audits. We are a public accounting firm registered with the Public Company Accounting Oversight Board (United States) (PCAOB) and are required to be independent with respect to the Funds in accordance with the U.S. federal securities laws and the applicable rules and regulations of the Securities and Exchange Commission and the PCAOB.
We conducted our audits in accordance with the standards of the PCAOB. Those standards require that we plan and perform the audit to obtain reasonable assurance about whether the financial statements and financial highlights are free of material misstatement, whether due to error or fraud. The Funds are not required to have, nor were we engaged to perform, an audit of their internal control over financial reporting. As part of our audits we are required to obtain an understanding of internal control over financial reporting but not for the purpose of expressing an opinion on the effectiveness of the Funds’ internal control over financial reporting. Accordingly, we express no such opinion.
Our audits included performing procedures to assess the risks of material misstatement of the financial statements and financial highlights, whether due to error or fraud, and performing procedures that respond to those risks. Such procedures included examining, on a test basis, evidence regarding the amounts and disclosures in the financial statements and financial highlights. Our audits also included evaluating the accounting principles used and significant estimates made by management, as well as evaluating the overall presentation of the financial statements and financial highlights. Our procedures included confirmation of securities owned as of April 30, 2018, by correspondence with the custodian and brokers; when replies were not received from brokers, we performed other auditing procedures. We believe that our audits provide a reasonable basis for our opinion.
DELOITTE & TOUCHE LLP
Denver, Colorado
June 26, 2018
We have served as the auditor of one or more investment companies advised by Rondure Global Advisors, LLC since 2018.
| Annual Report | April 30, 2018 | 31 |
| Rondure Funds | Additional Information |
| | April 30, 2018 (Unaudited) |
1. FUND HOLDINGS
The Funds file their complete schedule of portfolio holdings with the Securities and Exchange Commission (the “SEC”) for the first and third quarters of each fiscal year on Form N-Q within 60 days after the end of the period. Copies of the Funds’ Form N-Q are available without charge on the SEC website at http://www.sec.gov. You may also review and copy the Form N-Q at the SEC’s Public Reference Room in Washington, DC. For more information about the operation of the Public Reference Room, please call the SEC at 1-800-SEC-0330.
2. FUND PROXY VOTING POLICIES, PROCEDURES AND SUMMARIES
The Funds’ policies and procedures used in determining how to vote proxies and information regarding how the Funds voted proxies relating to portfolio securities during the most recent prior 12-month period ending June 30 are available without charge, (1) upon request, by calling (toll-free) 1-855-775-3337 and (2) on the SEC’s website at http://www.sec.gov.
3. TAX DESIGNATIONS
The Funds designate the following amounts for federal income tax purposes for the fiscal year ended April 30, 2018:
| | | Foreign Taxes
Paid | | | Foreign Source
Income | |
| Rondure Overseas Fund | | $ | 14,239 | | | $ | 206,228 | |
| Rondure New World Fund | | $ | 81,233 | | | $ | 1,238,453 | |
Of the distributions paid by the Funds from ordinary income for the calendar year ended December 31, 2017, the following percentages met the requirements to be treated as qualifying for the corporate dividends received deduction and qualified dividend income:
| | Dividend Received
Deduction | Qualified Dividend
Income |
| Rondure Overseas Fund | 4.77% | 43.56% |
| Rondure New World Fund | 34.38% | 100.00% |
In early 2018, if applicable, shareholders of record received this information for the distributions paid to them by the Funds during the calendar year 2017 via Form 1099. The Funds will notify shareholders in early 2019 of amounts paid to them by the Funds, if any, during the calendar year 2018.
| 32 | 1.855.775.3337 | www.rondureglobal.com |
| Rondure Funds | Trustees and Officers |
| | April 30, 2018 (Unaudited) |
Additional information regarding the Fund’s trustees is included in the Statement of Additional Information, which can be obtained without charge by calling 855-775-3337.
| INDEPENDENT TRUSTEES |
Name,
Address*
& Year
of Birth | Position(s)
Held with
Fund | Term of Office**
and Length of
Time Served | Principal Occupation(s)
During Past 5 Years*** | Number of
Funds in
Fund
Complex
Overseen by
Trustee**** | Other Directorships
Held by Trustee During
Past 5 Years*** |
| Mary K. Anstine, 1940 | Trustee and Chairman | Ms. Anstine was elected at a special meeting of shareholders held on March 21, 1997 and re-elected at a special meeting of shareholders held on August 7, 2009. Ms. Anstine was appointed Chairman of the Board at the June 6, 2017 meeting of the Board of Trustees. | Ms. Anstine was formerly an Executive Vice President of First Interstate Bank of Denver until 1994, President/Chief Executive Officer of HealthONE Alliance, Denver, Colorado, from 1994 to 2004, and has been retired since 2004. Ms. Anstine is also Trustee/Director of AV Hunter Trust and Colorado Uplift Board. Ms. Anstine was formerly a Director of the Trust Bank of Colorado (later purchased and now known as Northern Trust Bank), HealthONE and Denver Area Council of the Boy Scouts of America, and a member of the American Bankers Association Trust Executive Committee. | 32 | Ms. Anstine is a Trustee of ALPS ETF Trust (21 funds); ALPS Variable Investment Trust (9 funds); Reaves Utility Income Fund (1 fund); and Westcore Trust (14 funds). |
| Jeremy W. Deems, 1976 | Trustee | Mr. Deems was appointed as a Trustee at the March 11, 2008 meeting of the Board of Trustees and elected at a special meeting of shareholders held on August 7, 2009. | Mr. Deems is the Co-Founder, Chief Operations Officer and Chief Financial Officer of Green Alpha Advisors, LLC, a registered investment advisor, and Co-Portfolio Manager of the Shelton Green Alpha Fund. Prior to joining Green Alpha Advisors, Mr. Deems was CFO and Treasurer of Forward Management, LLC, ReFlow Management Co., LLC, ReFlow Fund, LLC, a private investment fund, and Sutton Place Management, LLC, an administrative services company, from 1998 to June 2007. From 2004 to 2005, Mr Deems also served as Treasurer of the Forward Funds and the Sierra Club Funds. | 32 | Mr. Deems is a Trustee of ALPS ETF Trust (21 funds); ALPS Variable Investment Trust (9 funds); Clough Funds Trust (1 fund); and Reaves Utility Income Fund (1 fund). |
| Annual Report | April 30, 2018 | 33 |
| Rondure Funds | Trustees and Officers |
| | April 30, 2018 (Unaudited) |
| INDEPENDENT TRUSTEES |
Name,
Address*
& Year
of Birth | Position(s)
Held with
Fund | Term of Office**
and Length of
Time Served | Principal Occupation(s)
During Past 5 Years*** | Number of
Funds in
Fund
Complex
Overseen by
Trustee**** | Other Directorships
Held by Trustee During
Past 5 Years*** |
| Jerry G. Rutledge, 1944 | Trustee | Mr. Rutledge was elected at a special meeting of shareholders held on August 7, 2009. | Mr. Rutledge is the President and owner of Rutledge’s Inc., a retail clothing business. He served as Director of University of Colorado Hospital from 2008 to 2016. He was from 1994 to 2007 a Regent of the University of Colorado. | 32 | Mr. Rutledge is a Trustee of Principal Real Estate Fund (1 fund), Clough Global Dividend and Income Fund (1 fund), Clough Global Equity Fund (1 fund) and Clough Global Opportunities Fund (1 fund). |
| Michael “Ross” Shell, 1970 | Trustee | Mr. Shell was elected at a special meeting of shareholders held on August 7, 2009. | Mr. Shell is Founder and CEO of Red Idea, LLC, a strategic consulting/early stage venture firm (since June 2008). From 1999 to 2009, he was a part-owner and Director of Tesser, Inc., a brand agency. From December 2005 to May 2008, he was Director, Marketing and Investor Relations, of Woodbourne, a REIT/real estate hedge fund and private equity firm. Prior to this, from May 2004 to November 2005, he worked as a business strategy consultant; from June 2003 to April 2004, he was on the Global Client Services team of IDEO, a product design/innovation firm; and from 1999 to 2003, he was President of Tesser, Inc. Mr. Shell graduated with honors from Stanford University with a degree in Political Science. | 32 | None. |
| 34 | 1.855.775.3337 | www.rondureglobal.com |
| Rondure Funds | Trustees and Officers |
| | April 30, 2018 (Unaudited) |
| INTERESTED TRUSTEE |
Name,
Address*
& Year
of Birth | Position(s)
Held with Fund | Term of Office**
and Length of
Time Served | Principal Occupation(s)
During Past 5 Years*** | Number of
Funds in
Fund
Complex
Overseen by
Trustee**** | Other Directorships
Held by Trustee During
Past 5 Years*** |
| Edmund J. Burke, 1961 | Trustee and President | Mr. Burke was elected as Trustee at a special meeting of shareholders held on August 7, 2009. Mr. Burke was elected President of the Trust at the December 17, 2002 meeting of the Board of Trustees. | Mr. Burke is President and a Director of ALPS Holdings, Inc. (“AHI”) and ALPS Advisors, Inc. (“AAI”), and Director of Boston Financial Data Services, Inc. (“BFDS”), ALPS Distributors, Inc. (“ADI”), ALPS Fund Services, Inc. (“AFS”) and ALPS Portfolio Solutions Distributor, Inc. (“APSD”). Because of his positions with AHI, BFDS, AAI, ADI, AFS and APSD, Mr. Burke is deemed an affiliate of the Trust as defined under the 1940 Act. | 32 | Mr. Burke is a Trustee of Clough Global Dividend and Income Fund (1 fund); Clough Global Equity Fund (1 fund); Clough Global Opportunities Fund (1 fund); Clough Funds Trust (1 fund); Liberty All-Star Equity Fund (1 fund); Director of the Liberty All-Star Growth Fund, Inc. (1 fund); Trustee of ALPS ETF Trust (21 funds). |
| Annual Report | April 30, 2018 | 35 |
| Rondure Funds | Trustees and Officers |
| | April 30, 2018 (Unaudited) |
| OFFICERS |
Name, Address*
& Year of Birth | Position(s) Held
with Fund | Term of Office** and
Length of Time Served | Principal Occupation(s)
During Past 5 Years*** |
| Kimberly R. Storms, 1972 | Treasurer | Ms. Storms was elected Treasurer of the Trust at the March 12, 2013 meeting of the Board of Trustees. | Ms. Storms is Senior Vice President - Director of Fund Administration of ALPS. Because of her position with ALPS, Ms. Storms is deemed an affiliate of the Trust as defined under the 1940 Act. Ms. Storms is also Treasurer of Liberty All-Star Equity Fund, Liberty All-Star Growth Fund, Inc., ALPS Series Trust and Elevation ETF Trust. Ms. Storms also serves as a Board member and Treasurer of The Center for Trauma & Resilience, a nonprofit agency. |
| Karen S. Gilomen, 1970 | Secretary | Ms. Gilomen was elected Secretary of the Trust at the December 13, 2016 meeting of the Board of Trustees. | Ms. Gilomen joined ALPS in August 2016 as Vice President and Senior Counsel. Prior to joining ALPS, Ms. Gilomen was Vice President - General Counsel & CCO of Monticello Associates, Inc. from 2010 to 2016. Because of her position with ALPS, Ms. Gilomen is deemed an affiliate of the Trust, as defined under the 1940 Act. Ms. Gilomen is also the Secretary of Clough Funds Trust, Clough Global Dividend and Income Fund, Clough Global Equity Fund, Clough Global Opportunities Fund, Reaves Utility Income Fund, and the Assistant Secretary of the WesMark Funds. |
| Ted Uhl, 1974 | Chief Compliance Officer (“CCO”) | Mr. Uhl was appointed CCO of the Trust at the June 8, 2010 meeting of the Board of Trustees. | Mr. Uhl joined ALPS in October 2006, and is currently Deputy Compliance Officer of ALPS. Prior to his current role, Mr. Uhl served as Senior Risk Manager for ALPS from October 2006 until June 2010. Before joining ALPS, Mr. Uhl served a Sr. Analyst with Enenbach and Associates (RIA), and a Sr. Financial Analyst at Sprint. Because of his position with ALPS, Mr. Uhl is deemed an affiliate of the Trust as defined under the 1940 Act. Mr. Uhl is also CCO of the Boulder Growth & Income Fund, Inc., Centre Funds, Elevation ETF Trust, Index Funds, Reality Shares ETF Trust and Reaves Utility Income Fund. |
| Jennell Panella, 1974 | Assistant Treasurer | Ms. Panella was elected Assistant Treasurer of the Trust at the September 15, 2015 meeting of the Board of Trustees. | Ms. Panella joined ALPS in June 2012 and is currently Fund Controller of ALPS Fund Services, Inc. Prior to joining ALPS, Ms. Panella served as Financial Reporting Manager for Parker Global Strategies, LLC (2009-2012). Because of her position with ALPS, Ms. Panella is deemed an affiliate of the Trust as defined under the 1940 Act. Ms. Panella also serves as Assistant Treasurer of James Advantage Funds. |
| Alan Gattis, 1980 | Assistant Treasurer | Mr. Gattis was elected Assistant Treasurer of the Trust at the September 13, 2016 meeting of the Board of Trustees. | Mr. Gattis joined ALPS in 2011 and is currently Vice President and Fund Controller of ALPS. Prior to joining ALPS, Mr. Gattis was an Auditor at Spicer Jeffries LLP (2009 through 2011) and an Auditor at PricewaterhouseCoopers LLP (2004 - 2009). Because of his position with ALPS, Mr. Gattis is deemed an affiliate of the Trust as defined under the 1940 Act. Mr. Gattis is also Assistant Treasurer of ALPS Series Trust and Elevation ETF Trust. |
| 36 | 1.855.775.3337 | www.rondureglobal.com |
| Rondure Funds | Trustees and Officers |
| | April 30, 2018 (Unaudited) |
| OFFICERS |
Name, Address*
& Year of Birth | Position(s) Held
with Fund | Term of Office** and
Length of Time Served | Principal Occupation(s)
During Past 5 Years*** |
| Sharon Akselrod, 1974 | Assistant Secretary | Ms. Akselrod was elected Assistant Secretary of the Trust at the September 15, 2015 meeting of the Board of Trustees. | Ms. Akselrod joined ALPS in August 2014 and is currently Senior Investment Company Act Paralegal of ALPS Fund Services, Inc. Prior to joining ALPS, Ms. Akselrod served as Corporate Governance and Regulatory Associate for Nordstrom fsb (2013-2014) and Senior Legal Assistant – Legal Manager for AXA Equitable Life Insurance Company (2008-2013). Because of her position with ALPS, Ms. Akselrod is deemed an affiliate of the Trust as defined under the 1940 Act. Ms. Akselrod is also Assistant Secretary of ALPS ETF Trust and Principal Real Estate Fund. |
| Jennifer Craig 1973 | Assistant Secretary | Ms. Craig was elected Assistant Secretary of the Trust at the June 8, 2016 meeting of the Board of Trustees. | Ms. Craig joined ALPS in 2007 and is currently Assistant Vice President and Paralegal Manager of ALPS. Prior to joining ALPS, Ms. Craig was Legal Manager at Janus Capital Management LLC and served as Assistant Secretary of Janus Investment Fund, Janus Adviser Series and Janus Aspen Series. Because of her position with ALPS, Ms. Craig is deemed an affiliate of the Trust as defined under the 1940 Act. Ms. Craig is also Assistant Secretary of Clough Global Dividend and Income Fund, Clough Global Equity Fund, Clough Global Opportunities Fund, Clough Funds Trust, Liberty All-Star Equity Fund, Liberty All-Star Growth Fund, Inc. and ALPS Series Trust. |
| Sareena Khwaja-Dixon, 1980 | Assistant Secretary | Ms. Khwaja-Dixon was elected Assistant Secretary of the Trust at the December 12, 2017 meeting of the Board of Trustees. | Ms. Khwaja-Dixon joined ALPS in August 2015 and is currently Senior Counsel and Vice President of ALPS Fund Services, Inc. Prior to joining ALPS, Ms. Khwaja-Dixon served as a Senior Paralegal/Paralegal for Russell Investments (2011 – 2015). Ms. Khwaja-Dixon is also Secretary of Liberty All-Star Equity Fund and Liberty All-Star Growth Fund, Inc., and Assistant Secretary of Clough Funds Trust, Clough Dividend and Income Fund, Clough Global Opportunities Fund, and Clough Global Equity Fund. |
| * | All communications to Trustees and Officers may be directed to Financial Investors Trust c/o 1290 Broadway, Suite 1100, Denver, CO 80203. |
| ** | This is the period for which the Trustee or Officer began serving the Trust. Each Trustee serves an indefinite term, until his successor is elected. Officers are elected on an annual basis. |
| *** | Except as otherwise indicated, each individual has held the office shown or other offices in the same company for the last five years. |
| **** | The Fund Complex includes all series of the Trust (currently 34) and any other investment companies for which any Trustee serves as trustee for and which Emerald Mutual Fund Advisers Trust provides investment advisory services (currently none). |
| Annual Report | April 30, 2018 | 37 |
| Rondure Funds | Privacy Policy |
| | April 30, 2018 (Unaudited) |
| Who We Are | |
| Who is providing this notice? | Rondure New World Fund, and Rondure Overseas Fund. |
| What We Do | |
| How do the Funds protect my personal information? | To protect your personal information from unauthorized access and use, we use security measures that comply with federal law. These measures include computer safeguards and secured files and buildings. |
| How do the Funds collect my personal information? | We collect your personal information, for example, when you ● open an account ● provide account information or give us your contact information ● make a wire transfer or deposit money |
| Why can't I limit all sharing? | Federal law gives you the right to limit only ● sharing for affiliates’ everyday business purposes-information about your creditworthiness ● affiliates from using your information to market to you ● sharing for non-affiliates to market to you State laws and individual companies may give you additional rights to limit sharing. |
| Definitions | |
| Affiliates | Companies related by common ownership or control. They can be financial and nonfinancial companies. |
| Non-affiliates | Companies not related by common ownership or control. They can be financial and nonfinancial companies. ● The Funds does not share with non-affiliates so they can market to you. |
| Joint marketing | A formal agreement between non-affiliated financial companies that together market financial products or services to you. ● The Funds does not jointly market. |
| Other Important Information |
| California Residents | If your account has a California home address, your personal information will not be disclosed to nonaffiliated third parties except as permitted by applicable California law, and we will limit sharing such personal information with our affiliates to comply with California privacy laws that apply to us. |
| Vermont Residents | The State of Vermont requires financial institutions to obtain your consent prior to sharing personal information that they collect about you with affiliated companies and nonaffiliated third parties other than in certain limited circumstances. Except as permitted by law, we will not share personal information we collect about you with nonaffiliated third parties or other affiliated companies unless you provide us with your written consent to share such information. |
| 38 | 1.855.775.3337 | www.rondureglobal.com |
| Rondure Funds | Privacy Policy |
| | April 30, 2018 (Unaudited) |
| FACTS | WHAT DO THE FUNDS DO WITH YOUR PERSONAL INFORMATION? |
| Why? | Financial companies choose how they share your personal information. Federal law gives consumers the right to limit some but not all sharing. Federal law also requires us to tell you how we collect, share, and protect your personal information. Please read this notice carefully to understand what we do. |
| What? | The types of personal information we collect and share depend on the product or service you have with us. This information can include: ● Social Security number and account transactions ● Account balances and transaction history ● Wire transfer instructions |
| How? | All financial companies need to share customers’ personal information to run their everyday business. In the section below, we list the reasons financial companies can share their customers’ personal information; the reasons the Funds choose to share; and whether you can limit this sharing. |
| Reasons we can share your personal information | Do the Funds share: | Can you limit this sharing? |
For our everyday business purposes – such as to process your transactions, maintain your account(s), respond to court orders and legal investigations, or report to credit bureaus | Yes | No |
For our marketing purposes – to offer our products and services to you | No | We do not share. |
| For joint marketing with other financial companies | No | We do not share. |
For our affiliates’ everyday business purposes – information about your transactions and experiences | Yes | No |
For our affiliates’ everyday business purposes – information about your creditworthiness | No | We do not share. |
| For nonaffiliates to market to you | No | We do not share. |
| Annual Report | April 30, 2018 | 39 |

TABLE OF CONTENTS
| Letter to Shareholders | 1 |
| Performance Review | |
| Seafarer Overseas Growth and Income Fund | 6 |
| Seafarer Overseas Value Fund | 12 |
| Disclosure of Fund Expenses | 20 |
| Portfolio of Investments | 22 |
| Statements of Assets and Liabilities | 31 |
| Statements of Operations | 32 |
| Statements of Changes in Net Assets | 34 |
| Financial Highlights | 38 |
| Notes to Financial Statements | 44 |
| Report of Independent Registered Public Accounting Firm | 55 |
| Additional Information | 56 |
| Approval of Fund Advisory Agreement | 57 |
| Trustees and Officers | 60 |
| Privacy Policy | 65 |
| Seafarer Funds | Letter to Shareholders |
April 30, 2018
LETTER TO SHAREHOLDERS
May 12, 2018
Dear Fellow Shareholders,
I am pleased to address you again on behalf of the Seafarer Funds. This report covers the Funds’ 2017-18 fiscal year (May 1, 2017 to April 30, 2018).
China: At a Crossroads in the World, and In Your Portfolio
The preceding two decades have brought considerable change and progress to the developing world. Economies have expanded, technologies have advanced, incomes have risen, capital has been created, and living standards have improved. Yet throughout such change, one fact has remained constant and essential: within the developing world, China has stood out from all other nations in terms of scale, scope and influence.
There was a time when this fact was not obvious. China’s economy was once smaller than some of its peers, and not long ago, its allocation in prevailing equity indices was approximately one fifteenth of the weight accorded Taiwan. Yet thoughtful observers knew even then that China’s scale and potential would eclipse all other countries in the developing world. China’s subsequent growth and development have made it central to the definition of the “emerging market asset class.” Its index allocation eclipses all the rest, and in coming years, its weight will increase further; its rise has re-shaped or influenced the course of events in nearly every other developing country; its success or failure will determine whether the asset class has long-term investment merit. As goes China, so go the emerging markets.
While China’s prominence has never been clearer, the country’s political and economic development has grown more complicated, and in some respects, opaquer. Last fall, in the Letter to Shareholders as of October 31, 2017, I offered a personal perspective on China’s evolution.1 The view I expressed was personal and anecdotal – not comprehensive or definitive – but my aim was to convey my concern that the Chinese political system had taken a surprising, worrisome turn.
My concern stemmed from a basic idea. I believe that China’s profound development over the past four decades was driven by the de-emphasis of central planning in favor of decentralized decision-making, as well as the opening of the economy to competition and private ownership. I believe that highly centralized economic systems induce instability, corruption, and wasted resources. Decentralized systems lack certain efficiencies; however, given the proper incentives (e.g., the incentives that spring from private ownership), they tend to be more flexible and self-correcting, thereby avoiding gross waste. I think China’s adoption of a decentralized approach was fundamental to its growth, spurring the economic might readily visible today.
The October 2017 Letter to Shareholders describes my concern that China’s political system is returning to its centralized, pre-1978 roots.1 President Xi Jinping’s government has launched a “third era” in China’s history, characterized by substantial political and economic re-organization, and emphasizing centralized government control. My colleague Nicholas Borst has recently launched a blog entitled “Prevailing Winds.” The first entry highlights some of the key transitions currently underway in China.2 I believe some aspects of Xi’s new era are welcome and warranted, but it also presents myriad challenges to investors. Chief among them: one cannot rely on China’s past progress to extrapolate its future. Past performance is no guarantee of future results.
Some investors may view such change and uncertainty with skepticism, shunning China within their portfolios. Though I share such skepticism, I believe that complete withdrawal would be a mistake. China’s growing economic scale and global prominence mean that it cannot be ignored. Though it might be an uncomfortable prospect for some, Xi has made it clear that China’s ambition is to occupy a status alongside the U.S. as a new global power, a second hegemon. Assuming China attains Xi’s goals peacefully, it will be simply too large, too important and too prosperous for investors to ignore.
China’s “Belt and Road” initiative is one visible effort where China’s global ambitions are evident.3 For those unfamiliar with the initiative: my colleague Stephanie Gan has recently written a report on Belt
| Annual Report – April 30, 2018 | 1 |
| Seafarer Funds | Letter to Shareholders |
April 30, 2018
and Road that focuses on the initiative’s financial underpinnings.4 Stephanie’s report makes clear that Belt and Road is sweeping in scale and scope; but it also suggests that much of the funding behind it is murky or problematic. My own view is that Belt and Road has the potential to establish China’s hegemony in the East, but it could also overextend the country’s financial resources along the way. China is determined to climb to the top, but it might go broke in the attempt.
So, what should investors make of this? On the one hand, China has embarked on a path intended to secure its status as a hegemon, making it far too big to be ignored. On the other hand, internal change means that its future is opaque, and success less assured.
My view is that investors must seriously consider a substantial, structural increase in their exposure to China. To enact that increase, I think investors must seek dedicated exposure to a broad array of asset classes.
U.S. investors pursue a multitude of strategies, so it is foolish to generalize. However, I suspect that most investors’ portfolios have single-digit exposure to China; for many, the effective exposure will be under 5%. I also suspect that most investors have exposure only to equities via regional funds that invest primarily on the Hong Kong stock exchange. There are many important Chinese companies listed in Hong Kong; but to invest only in Hong Kong is to omit a vast multitude of companies listed exclusively on China’s onshore, domestic markets – the “A Shares.” Lastly, I suspect very few investors have exposure to asset types beyond equities – fixed income, real estate, private equity, venture capital, etc. I believe that portfolios that have limited exposure to China (below 5%), and only via Hong Kong stocks (omitting A Shares, fixed income, real estate, etc.), are not well-positioned for China’s future rise.
I imagine that many investors will find it alien to consider a portfolio with dedicated exposure to China across an array of asset types. However, as a brief thought exercise, I encourage you to reverse your frame of reference for a moment. Imagine you reside outside the U.S., a citizen of some other country. How then would you seek to invest in the U.S.? Would you only use one fund, whether active or passive? Would you only seek exposure to equities, or would you consider bonds too? If your capital, risk tolerances and time horizons allowed, would you want exposure to U.S. real estate, U.S. private equity and U.S. venture capital? Surely you would not invest in the U.S. only via a “North America Region Equity Fund,” which by design sought to offer a blended exposure to the U.S., Canada, Mexico, and the Caribbean in one package. A regional fund would never give you sufficient exposure to the primary market, the country that you really wanted to feature in your portfolio – the U.S.
I expect that most investors would favor dedicated exposure to the U.S., and they would not rely solely on a fund built around a stylized, regionally-driven asset class. Most investors would also seek exposure across an array of assets (stocks, bonds, etc.), and use a mix of funds, highlighting strategies (active, passive) across a range of styles (growth, value, large cap, small cap, etc.) according to their preferences. They would do so because the U.S. economy is broad, deep and dynamic; its financial markets are vast and liquid; and because the U.S. as a hegemon is too big to underweight or ignore.
You might feel that China is innately different from the U.S. case, and therefore my argument is invalid. Certainly, China is not yet a global hegemon, and it does not yet enjoy all the structural characteristics that situate the U.S. economy above all others. Still, I would urge you to consider whether China’s ambitions might give it similar status over the next two decades. If so, I would argue that you should treat China no differently than the U.S. within your portfolio.
I imagine that some shareholders of the Funds expect that Seafarer will or should offer sufficient exposure to ensure that their portfolios do not “miss out” on the best aspects of China’s rise. While I hope that the Funds offer intriguing exposure to Chinese stocks, I do not think their mandates are designed to offer sufficient, dedicated, well-rounded exposure to China’s rise. At Seafarer, we are “stock pickers,” and eclectic ones at that. We are certainly aware of the changes taking place in and around China – perhaps more so than some others – but our aim is not to build structural, well-diversified exposure to the Chinese market. Rather, the Funds have focused strategies which place emphasis on balancing risk versus reward. For reasons stemming from either risk or valuation, the Funds are unlikely to own all the stocks critical to China’s emergence. Also, while the Funds enjoy a great deal of geographical freedom (and therefore could, in theory, offer elevated exposure to a single country), we
| 2 | (855) 732-9220 seafarerfunds.com |
| Seafarer Funds | Letter to Shareholders |
April 30, 2018
tend to view our strategies as best implemented across an array of countries. Put bluntly: I believe the Seafarer Funds are unlikely to ever offer sufficient exposure to the full breadth of Chinese equities, let alone other Chinese asset types.
No one should interpret my view as an urgent call to portfolio re-construction. Instead, I encourage investors to first consider several critical questions: do you believe China’s rise will be peaceful, or mired in martial conflict? (I think the probability of direct conflict is small but cannot be ruled out.) Do you believe China has the political, diplomatic, economic, technological and financial skills to emerge as a hegemon? (For the most part, I think it does, though it might overextend itself financially in pursuit of the Belt and Road initiative.) Do you think that China’s economic rise will go unmarred by a major economic or financial crisis? (I think the country’s extreme indebtedness will eventually hamper economic growth, and it might yet induce a crisis.) Most importantly: do you have the risk tolerance and long-term time horizon to sustain investment in China’s transition? (I think anyone with an investment horizon less than two decades should forgo a dramatic shift toward China.) You must have confidence in your answers before undertaking a major overhaul of your portfolio. Given the complexity that surrounds China’s future, I do not believe any intermediary – including Seafarer – can answer these questions definitively on your behalf.5
However, if you determine that your exposure to China should increase, I encourage you to develop a long-term plan to re-build your portfolio. In my view, it should emphasize diversification across asset types and strategies, and it should be suited to your risk tolerances and applicable time horizons. When you are ready to implement the plan, I would suggest you act gradually: right now, I harbor concerns that China might still experience a major economic shock or financial crisis, one that might rival historical events in other nations. Rapidly building outsized exposure to risky asset classes will almost assuredly destroy capital. Yet I do not know whether a shock will occur; postponing indefinitely may prove sub-optimal. Rather, I would suggest a measured pace of implementation – and if a crisis strikes midway, I would consider whether it afforded an opportune time to accelerate implementation, rather than abandon your plan in frustration.
China recently passed over a crossroads as a country. President Xi has changed direction, and China has embarked on a new and unfamiliar course. The country’s stated destination is clear, even if the road ahead is not. I believe your portfolio is passing over the same crossroads. Make certain that it does not miss the turn, and that you are well prepared for the next leg of the journey.
Expense Ratio Reduction and Economies of Scale
As described in the Letter to Shareholders as of April 30, 2017, Seafarer has committed to reduce expenses for the Funds, particularly as time and scale afford greater efficiency.6
I am pleased to announce that, consistent with that commitment, the Overseas Growth and Income Fund experienced a reduction in its operating expense ratios during the fiscal year ended April 30, 2018. The ratios declined to 0.87% and 0.97% for the Institutional and Investor classes, respectively. For reference, the expense ratios were 0.92% and 1.02% for the respective classes during the preceding fiscal year.7 The expense improvement can be traced to two underlying causes: Seafarer’s ongoing efforts to control costs, and the Growth and Income Fund’s substantial scale.
For the past six years, Seafarer Capital Partners (adviser to the Seafarer Funds) has worked with the Funds’ various service providers (chiefly: ALPS Fund Services, the Funds’ administrator, and Brown Brothers Harriman, the Funds’ custodian bank) to keep a careful watch over operating expenses. Seafarer sought to ensure that, if either Fund attained scale, it would realize meaningful efficiencies.
During the fiscal year ended April 30, 2018, shareholders of the Growth and Income Fund entrusted it with substantially more capital than the prior year (net assets were $3.0 billion at April 30, 2018, versus $2.4 billion at the end of the prior fiscal year). The increase in assets under management brought new economies of scale, and the Fund’s expense ratio declined in accordance with Seafarer’s long-term goals.
As for the Overseas Value Fund: its smaller scale does not yield an equivalent degree of efficiency. However, Seafarer has established the same underlying expense structure for the Value Fund. Should
| Annual Report – April 30, 2018 | 3 |
| Seafarer Funds | Letter to Shareholders |
April 30, 2018
the Fund’s assets grow over time, it is expected to achieve similar economies of scale. In the meantime, Seafarer Capital Partners continues to “cap” the Fund’s operating expenses via a contractual commitment, such that its net expense ratios remain 1.05% and 1.15% for the Institutional and Investor classes, respectively.8
Expansion of Seafarer’s Team
Seafarer continues to invest in its research and operational capacities, particularly through additions to the team. In the past six months, three individuals have joined Seafarer.
Nicholas Borst joined the firm as Vice President and Director of China Research. As Vice President, Nicholas is a leader in the management of the firm, with a focus on fund administration, firm-wide technology, and human resources. As Director of China Research, he analyzes financial and economic developments in Greater China. Previously, Nicholas conducted research on China’s economic development at the Federal Reserve Bank of San Francisco, the Peterson Institute for International Economics, and the World Bank.
Brent Clayton joined Seafarer as a research analyst on the investment team. Brent assists Paul Espinosa in the management of the Value strategy. Brent’s experience spans a wide number of overseas markets, with a particular emphasis on investment in “frontier” countries.
Meredith Sellers joined the firm as Director of Communications. At Seafarer we are committed to delivering insights to clients directly from the individuals who manage the Funds, and Meredith plays a key role in facilitating this communication. Her career has focused on marketing and client services in the financial services industry.
I am pleased to welcome these individuals to Seafarer. I am excited by the depth and breadth of talent they bring to our organization.
We appreciate the trust and patience that you have extend to our firm, and we are honored to serve as your investment adviser in the emerging markets.
Andrew Foster
Chief Investment Officer
Seafarer Capital Partners, LLC
Information on the Seafarer website is provided for textual reference only, and is not incorporated by reference into this report.
The views and information discussed in this commentary are as of the date of publication, are subject to change, and may not reflect Seafarer’s current views. The views expressed represent an assessment of market conditions at a specific point in time, are opinions only and should not be relied upon as investment advice regarding a particular investment or markets in general. Such information does not constitute a recommendation to buy or sell specific securities or investment vehicles. It should not be assumed that any investment will be profitable or will equal the performance of the portfolios or any securities or any sectors mentioned herein. The subject matter contained herein has been derived from several sources believed to be reliable and accurate at the time of compilation. Seafarer does not accept any liability for losses either direct or consequential caused by the use of this information.
| 1 | The Letter to Shareholders as of October 31, 2017 is available at: |
www.seafarerfunds.com/letters-to-shareholders/2017/10/semi-annual
| 2 | The Prevailing Winds post is available at: |
www.seafarerfunds.com/prevailing-winds/2018/04/forty-years-later-china-in-a-new-era
| 3 | The Belt and Road Initiative is an international program to spur investment and trade links between China, central Asia, and Europe. The initiative was announced by China’s President Xi Jinping in 2013. The official name for the initiative is the “Silk Road Economic Belt and the 21st Century Maritime Silk Road.” |
| 4 | (855) 732-9220 seafarerfunds.com |
| Seafarer Funds | Letter to Shareholders |
April 30, 2018
| 4 | The report titled One Belt, One Road – Many Motives is available at: |
www.seafarerfunds.com/obor-white-paper
| 5 | For shareholders interested in reading another perspective on China, please refer to: Martin Wolf, "How the West Should Judge a Rising China," Financial Times, 15 May 2018. |
| 6 | The Letter to Shareholders as of April 30, 2017 is available at: |
www.seafarerfunds.com/letters-to-shareholders/2017/04/annual
| 7 | The Growth and Income Fund’s Prospectus (dated August 31, 2017) states that the Fund expenses are 0.92% and 1.02% for the Institutional and Investor classes, respectively. |
| 8 | Seafarer Capital Partners, LLC has agreed contractually to waive and/or reimburse fees or expenses in order to limit Total Annual Fund Operating Expenses After Fee Waiver/Expense Reimbursements (excluding brokerage expenses, interest expenses, taxes and extraordinary expenses) to 1.15% and 1.05% of each Fund’s average daily net assets for the Investor and Institutional share classes, respectively. This agreement is in effect through August 31, 2018. |
| Annual Report – April 30, 2018 | 5 |
| Seafarer Overseas Growth and Income Fund | Performance Review |
April 30, 2018
SEAFARER OVERSEAS GROWTH AND INCOME FUND
PERFORMANCE REVIEW
May 15, 2018
This report addresses the Seafarer Overseas Growth and Income Fund’s 2017-18 fiscal year (May 1, 2017 to April 30, 2018).
During the fiscal year, the Fund returned 8.08%, while the Fund’s benchmark, the MSCI Emerging Markets Total Return Index, rose 22.14%.1 By way of broader comparison, the S&P 500 Index increased 13.27%.
From the Fund’s inception (February 15, 2012) through the end of the fiscal year (April 30, 2018), the Fund generated an annualized rate of return of 7.10%.2 The benchmark index rose at an annualized rate of 4.38% over the same period.
The Fund began the fiscal year with a net asset value of $12.54 per share. During the ensuing twelve months, the Fund paid three distributions: $0.107 per share in June 2017 and two distributions totaling $0.303 per share in December 2017. Those payments brought the cumulative distribution per share, as measured from the Fund’s inception to the end of the fiscal year, to $1.781. The Fund finished the fiscal year with a value of $13.14 per share.3
* * * * *
During the Fund’s fiscal year ended April 30, 2018, the benchmark index produced a second consecutive year of robust performance, rising slightly above 22% (for reference, the index gained just shy of 20% during the preceding fiscal year). The Fund’s performance was considerably less strong, rising only 8%, and it again trailed its benchmark, this year by approximately 12% (the gap was about 8% in the preceding year). The absolute returns from the Fund were attractive in my view, and in keeping with the Fund’s objectives of balancing risk with return. However, in relative terms, the performance was unsatisfactory. Though the Fund’s returns since inception still surpass that of the benchmark, the past two years have been lackluster and disappointing.
For those deeply interested, I will provide a brief discussion below of what the index did well during the fiscal year, and what the Fund did not do well, thereby creating the gap in performance. Frankly, though, if you want to know the truth of the matter, it is far simpler than any detailed reckoning can reveal: I did not get China right in the Fund. When measured in terms of contribution to performance, the index had a greater China allocation than did the Fund, and that larger allocation also performed better, at least over the short timeframe that the fiscal year affords. The index’s China exposure accounted for 7.9% of its outperformance during the fiscal year – essentially all of the gap. To sum up the year: the index’s allocation to China stocks thrashed the Fund’s exposure; and by comparison, every other aspect of performance was just noise.
What’s going on in China, and why has the Fund’s China exposure caused a performance shortfall? For the past twenty years, my research and analysis on China have led me to a nearly unshakable view that it would one day emerge as an economic superpower. This view was challenged many times over the years, often by ill-informed critics. Yet now that China is well on its way to such a status, its economic and political evolution has never concerned me more. I have become cautious – deeply so – about China, even as it seems most investors are “maximum bullish.”
I was wrong to be so cautious, at least so far. I write “so far,” but obviously I do not know what the future holds. My cautious stance on China may never prove warranted. For a more complete view of my thoughts on the country, I urge you to re-read the Letter to Shareholders in the Semi-annual Report as of October 31, 2017, and subsequently the Letter to Shareholders in this Annual Report.4
In the interest of a bit more granularity, all sectors contributed positively to the benchmark’s performance during the past twelve months. Technology and financial stocks led the way (returns for both sectors were dominated by Chinese stocks). Commodities and real estate made material contributions to performance (the former spurred by China’s short-term cyclical recovery, and the latter
| 6 | (855) 732-9220 seafarerfunds.com |
| Seafarer Overseas Growth and Income Fund | Performance Review |
April 30, 2018
due to China). Energy stocks also drove the index’s gains – and in this case, Chinese stocks, Russian stocks and Brazilian stocks contributed equally to the sector’s rise.
The Fund did not produce gains in every sector in which it invested: its exposure to industrials and consumer stocks (mainly automotive companies) created a small drag on performance. During a fiscal year in which the index rises 22%, a small negative drag becomes a sea anchor of underperformance, because of the opportunity foregone. However, the real story of the Fund’s underperformance lies in what it did not own, as opposed to what it did: it did not invest in China internet stocks, China property developers, China banks, China insurance, energy stocks, and almost no material stocks. These six omissions cost the Fund over ten percentage points of gross performance during the fiscal year. In general, I did not think companies in those sectors represented the best way to invest in the emergence of the developing world; I did not find stocks that fit the Fund’s growth and income strategy to my satisfaction.
We appreciate your interest, your patience, and your willingness to entrust your capital with Seafarer for the long-term.
Andrew Foster
Lead Portfolio Manager, Seafarer Overseas Growth and Income Fund
Seafarer Capital Partners, LLC
The MSCI Emerging Markets Total Return Index, Standard (Large+Mid Cap) Core, Gross (dividends reinvested), USD is a free float-adjusted market capitalization index designed to measure equity market performance of emerging markets. Index code: GDUEEGF.
The S&P 500 Total Return Index is a stock market index based on the market capitalizations of 500 large companies with common stock listed on the NYSE or NASDAQ.
It is not possible to invest directly in an index.
The Fund is subject to investment risks, including possible loss of the principal amount invested and therefore is not suitable for all investors. The Fund may not achieve its objectives. Diversification does not ensure a profit or guarantee against loss.
Information on the Seafarer website is provided for textual reference only, and is not incorporated by reference into this report.
The views and information discussed in this commentary are as of the date of publication, are subject to change, and may not reflect Seafarer’s current views. The views expressed represent an assessment of market conditions at a specific point in time, are opinions only and should not be relied upon as investment advice regarding a particular investment or markets in general. Such information does not constitute a recommendation to buy or sell specific securities or investment vehicles. It should not be assumed that any investment will be profitable or will equal the performance of the portfolios or any securities or any sectors mentioned herein. The subject matter contained herein has been derived from several sources believed to be reliable and accurate at the time of compilation. Seafarer does not accept any liability for losses either direct or consequential caused by the use of this information.
| 1 | References to the “Fund” pertain to the Fund’s Institutional share class (ticker: SIGIX). The Investor share class (ticker: SFGIX) gained 8.03% during the fiscal year. Includes adjustments in accordance with accounting principles generally accepted in the U.S. (“U.S. GAAP”) and as such, the total return for shareholder transactions reported to the market may differ from the total return for financial reporting purposes. As a result, the total return decreased from 8.12% to 8.03%. |
| 2 | The Fund’s Investor share class generated an annualized rate of return of 6.98% from the Fund’s inception through the end of the fiscal year. |
| Annual Report – April 30, 2018 | 7 |
| Seafarer Overseas Growth and Income Fund | Performance Review |
April 30, 2018
| 3 | The Fund’s Investor share class began the fiscal year with a net asset value of $12.51 per share (adjustments in accordance with U.S. GAAP were applied during the financial statement preparation and increased the net asset value from $12.50 to $12.51). The Fund paid three distributions: $0.105 per share in June 2017 and two distributions totaling $0.296 per share in December 2017. The Fund finished the fiscal year with a value of $13.11 per share. |
| 4 | The Letter to Shareholders for the period ended October 31, 2017 is available at:
www.seafarerfunds.com/letters-to-shareholders/2017/10/semi-annual |
| 8 | (855) 732-9220 seafarerfunds.com |
| Seafarer Overseas Growth and Income Fund | Performance Review |
April 30, 2018
Total Returns
| As of April 30, 2018 | 1 Year | 3 Years | 5 Years | Since Inception Annualized(1) | Gross Expense Ratio(2) |
| Investor Class (SFGIX) | 8.03%(3) | 3.25% | 4.78% | 6.98% | 1.02% |
| Institutional Class (SIGIX) | 8.08% | 3.34% | 4.91% | 7.10% | 0.92% |
| MSCI Emerging Markets Total Return Index(4) | 22.14% | 6.39% | 5.11% | 4.38% | |
All performance is in U.S. dollars with gross (pre-tax) dividends and/or distributions reinvested. The performance data quoted represents past performance and does not guarantee future results. Future returns may be lower or higher. The investment return and principal value will fluctuate so that an investor's shares, when redeemed, may be worth more or less than the original cost. Prior to August 31, 2016, shares of the Fund redeemed or exchanged within 90 days of purchase were subject to a 2% redemption fee. Performance does not reflect this fee, which if deducted would reduce an individual's return. To obtain the Fund’s most recent month-end performance, visit seafarerfunds.com or call (855) 732-9220.
| 1 | Inception Date: February 15, 2012. |
| 2 | Ratios as of Prospectus dated August 31, 2017. Seafarer Capital Partners, LLC has agreed contractually to waive and/or reimburse fees or expenses in order to limit Total Annual Fund Operating Expenses After Fee Waiver/Expense Reimbursements (excluding brokerage expenses, interest expenses, taxes and extraordinary expenses) to 1.15% and 1.05% of the Fund’s average daily net assets for the Investor and Institutional share classes, respectively. This agreement is in effect through August 31, 2018. |
| 3 | Includes adjustments in accordance with U.S. GAAP and as such, the total return for shareholder transactions reported to the market may differ from the total return for financial reporting purposes. As a result, the total return decreased from 8.12% to 8.03%. |
| 4 | The MSCI Emerging Markets Total Return Index, Standard (Large+Mid Cap) Core, Gross (dividends reinvested), USD is a free float-adjusted market capitalization index designed to measure equity market performance of emerging markets. Index code: GDUEEGF. The index is not actively managed and does not reflect any deductions for fees, expense or taxes. An investor may not invest directly in an index. |
| Annual Report - April 30, 2018 | 9 |
| Seafarer Overseas Growth and Income Fund | Performance Review |
April 30, 2018
Performance of a $10,000 Investment Since Inception
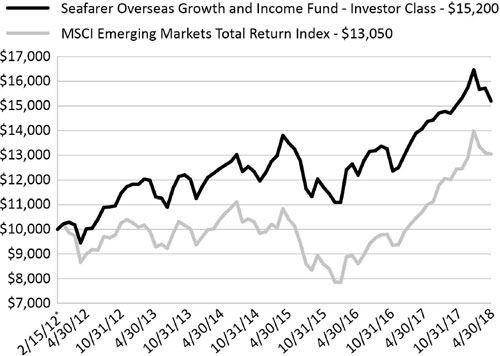
| * | Inception Date: February 15, 2012. |
The chart shown above represents historical performance of a hypothetical investment of $10,000 in the Fund’s Investor Class shares for the period from inception to April 30, 2018. All returns reflect reinvested dividends and/or distributions, but do not reflect the deduction of taxes that an investor would pay on distributions or redemptions.
The Fund also offers Institutional Class shares, performance for which is not reflected in the chart above. The performance of Institutional Class shares may be higher or lower than the performance of the Investor Class shares shown above based upon differences in fees paid by shareholders investing in the Investor Class shares and Institutional Class shares.
Investment Objective
The Fund seeks to provide long-term capital appreciation along with some current income. The Fund seeks to mitigate adverse volatility in returns as a secondary objective.
Strategy
The Fund invests primarily in the securities of companies located in developing countries. The Fund invests in several asset classes including dividend-paying common stocks, preferred stocks, convertible bonds, and fixed-income securities.
The Fund seeks to offer investors a relatively stable means of participating in a portion of developing countries’ growth prospects, while providing some downside protection compared to a portfolio that invests only in the common stocks of those countries.
| 10 | (855) 732-9220 seafarerfunds.com |
| Seafarer Overseas Growth and Income Fund | Performance Review |
April 30, 2018
| Portfolio Composition by Region | % Net Assets |
| East & South Asia | 69.6% |
| Emerging Europe | 6.4% |
| Latin America | 11.2% |
| Middle East & Africa | 3.5% |
| Cash & Other Assets, Less Liabilities | 6.9% |
| Government Bond, Short-term - USD and Foreign Currency | 2.6% |
| Total | 100.0% |
| Portfolio Composition by Sector | % Net Assets |
| Consumer Discretionary | 22.1% |
| Consumer Staples | 7.6% |
| Financials | 8.7% |
| Government | 1.9% |
| Health Care | 10.4% |
| Industrials | 1.2% |
| Information Technology | 21.7% |
| Materials | 0.8% |
| Real Estate | 3.9% |
| Telecommunication Services | 9.4% |
| Utilities | 2.9% |
| Cash & Other Assets, Less Liabilities | 6.9% |
| Government Bond, Short-term - USD and Foreign Currency | 2.6% |
| Total | 100.0% |
| Top 10 Holdings | % Net Assets |
| Hyundai Mobis Co., Ltd. | 6.6% |
| Singapore Telecommunications, Ltd. | 4.8% |
| Infosys, Ltd. | 4.7% |
| Richter Gedeon Nyrt | 3.8% |
| Hang Lung Properties, Ltd. | 3.6% |
| Astra International Tbk PT | 3.5% |
| Orion Corp/Republic Of Korea | 3.5% |
| Sanlam, Ltd. | 3.5% |
| Samsung Electronics Co., Ltd. | 3.4% |
| China Telecom Corp., Ltd. | 3.4% |
| Total | 40.6% |
| | |
| Total Number of Holdings | 491 |
Holdings are subject to change, and may not reflect the current or future position of the portfolio.
Source: ALPS Fund Services, Inc.
| 1 | Excludes short-term government bonds; includes medium- and long-term government bonds. |
| Annual Report – April 30, 2018 | 11 |
| Seafarer Overseas Value Fund | Performance Review |
April 30, 2018
SEAFARER OVERSEAS VALUE FUND
PERFORMANCE REVIEW
May 8, 2018
This report addresses the Seafarer Overseas Value Fund’s 2017-18 fiscal year (May 1, 2017 to April 30, 2018).
During the fiscal year, the Fund gained 9.74%, while the Fund’s benchmark, the MSCI Emerging Markets Total Return Index, rose 22.14%.1 By way of broader comparison, the S&P 500 Index returned 13.27%.
From the Fund’s inception (May 31, 2016) through the end of the fiscal year (April 30, 2018), the Fund generated an annualized rate of return of 12.50%.2 The benchmark index rose at an annualized rate of 24.30% over the same period.
The Fund began the fiscal year with a net asset value (NAV) of $11.28 per share.3 The Fund paid a distribution of $0.412 per share in December 2017. That payment brought the cumulative distribution per share, as measured from the Fund’s inception to the end of the fiscal year, to $0.537. The Fund finished the fiscal year with a value of $11.96 per share.4
I will anchor my review of the Value Fund’s 9.74% total return during its second fiscal year around three axes: (1) the nature of the absolute level of return, (2) the nature of the return relative to the benchmark, and (3) the nature of the fundamental drivers of total return.
I consider the Value Fund’s total return of 9.74% during the past fiscal year as reasonable in absolute terms. The December 2017 distribution of $0.412 per share represents 3.65% of the NAV at the beginning of the period. This distribution consisted entirely of ordinary income and accounted for over one-third of the year’s total return, thus highlighting the often-underappreciated contribution of dividends to total return.
The Fund’s 9.74% total return meaningfully underperformed the benchmark index’s return of 22.14% over the same period. The stocks that contributed most significantly to the benchmark’s returns for the Fund’s full fiscal year were the same ones that drove the benchmark’s returns for first half of the fiscal year – Tencent, Samsung Electronics, Naspers (owner of one third of Tencent), Alibaba, and Taiwan Semiconductor Manufacturing Company (TSMC) – whereas myriad factors drove the Value Fund’s performance as detailed below.
Before discussing the specific stocks that accounted for most of the Fund’s performance, it is worth highlighting a few global developments that took place over the second half of the fiscal year. While the Value Fund’s investment strategy is rooted in fundamental, company-specific research and bottom-up portfolio construction, changes in global geopolitical and economic conditions impact specific portfolio holdings, making a discussion of macro-related issues relevant.
The first significant global event during the fiscal year took place in June of 2017 when the Gulf Cooperation Council (GCC) imposed an embargo on one of its members: Qatar.5 This action by the GCC impacted the Value Fund’s holding in Nakilat (Deleveraging category of value, as defined in the white paper On Value in the Emerging Markets), which owns and operates a fleet of ships that transport liquefied natural gas (LNG) extracted and produced by Qatar.6 I dedicated much of the Fund’s second quarter 2017 portfolio review to explaining my reasoning for adding to the Fund’s holding in the company, namely that energy exports were excluded from the embargo, that the business enjoyed extreme revenue and profit visibility backed by 20 to 25 year contracts, and that the company had a call option on growth as I expected Qatar to increase LNG production as a substitute source of U.S. dollars that GCC banks had withdrawn.7 While the stock proved to be a negative contributor to the portfolio’s total return for the fiscal year, it is important to note that the business operates on a time scale of approximately 20 years, which likely exceeds the market’s average investment time horizon. While the Fund waits for Qatar to increase LNG production and for Nakilat to eventually announce a fleet increase, the portfolio accrues an approximate 6.5% dividend yield in a currency (Qatari riyal) that is hard-pegged to the U.S. dollar.
| 12 | (855) 732-9220 seafarerfunds.com |
| Seafarer Overseas Value Fund | Performance Review |
April 30, 2018
Interestingly, June 2017 also marked a bottom in the price of Brent crude oil as it increased from $44.82 per barrel on June 21, 2017 to $75.17 per barrel on April 30, 2018. The rise in the price of oil eventually led to a significant swing in the price of another portfolio holding: Petrovietnam Technical Services or PVS (Management Change), which provides services to oil exploration and production companies. The stock price of PVS rose from VND (Vietnamese dong) 14,849.77 on October 27, 2017 to VND 31,262.67 on January 29, 2018. Visibility of the project pipeline for this company, which tends to correlate with changes in the oil price, probably led to the significant stock price appreciation. However, it is important to note that stock-specific factors related to a particular project resulted in the share price of PVS subsequently declining to VND 18,200.00 on April 27, 2018, the last trade date of the Fund’s fiscal year. Fund shareholders should note that I refrained from purchasing additional PVS shares during the stock’s meteoric price rise despite fund inflows, and that I aim to maintain the company’s proportional representation in the portfolio due to Vietnam’s strategic interest in developing its oil and gas fields, which is significantly, though not entirely, independent of the price of oil. Furthermore, 30.5% of PVS’ balance sheet assets consisted of cash and equivalents, which in turn represented 89.6% of the company’s market capitalization (the company has very little debt) as of April 27, 2018. Finally, additional reasons to continue to own the stock despite the decline in price and heightened volatility during the fiscal year include a price to book value ratio of 0.75 and a 5.6% dividend yield.8,9
Another significant change in the global economic order that impacted the portfolio is the trade dispute between the U.S. and China that erupted during the first quarter of 2018. China’s 25% tariff imposition on U.S. pork exports directly impacted the Value Fund’s holding in WH Group (Management Change) – a hog processor of Chinese origin that acquired Smithfield Foods of the U.S. in 2013. The company imports pork from the U.S. into China, where hog prices have been consistently higher than those in the U.S. for a long time. I have chosen to maintain the Fund’s position in WH Group based on the information currently available, which suggests the tariff may be temporary. Even if the tariff becomes permanent, the hit to the company’s long-term value creation is more than accounted for in the stock’s low valuation. Furthermore, WH Group can minimize the impact of tariffs on U.S. hog exports through its exposure to both the upstream and downstream segments of the business. Thus, the company can offset a decline in the profitability of raising and sourcing hogs – the upstream side of the business – as a result of the tariff, with the pricing power it enjoys in the manufacturing of consumer-branded products – or the downstream part of the business. Despite a decline in the share price of WH Group from a high of HKD (Hong Kong dollar) 9.74 per share on February 1, 2018 to HKD 8.19 per share as of April 30, 2018, the company still contributed positively to the Fund’s performance for the fiscal year.
Finally, it is worth noting that several emerging market currencies depreciated meaningfully during the last three months of the fiscal year under review. Specifically, the Brazilian real and the Russian ruble weakened by more than 10% against the U.S. dollar. The Value Fund has limited exposure to these currencies through its holding of Qualicorp (Structural Shift), a Brazilian health insurance broker; Cherkizovo (Segregated Market), a Russian meat processor; and Global Ports (Asset Productivity), the largest Russian port operator. While the Mexican peso did not depreciate as much as the real and ruble, it is a currency to watch closely given uncertainty related to the renegotiation of the North American Free Trade Agreement (NAFTA).10 The Fund has limited exposure to the Mexican peso through one holding: Credito Real (Asset Productivity), a non-bank lender to low- and middle-income segments of the population. Lastly, it is important to note that the Value Fund has avoided exposure to the most severely devaluing currencies over the past three months, such as the Argentine peso and the Turkish lira.
Given the foregoing discussion of how shifts in geopolitics and global economic relations have impacted specific Value Fund holdings over the past fiscal year, it is pertinent to emphasize that this is one of the reasons the Fund tends to hold a relatively high cash balance of 15% or less under most circumstances. It is in cases such as the ones described above that the Fund can make use of its cash resource to add to specific positions at lower prices if the case for owning the stock remains unchanged.
One aspect I value about the portfolio’s performance over the past fiscal year is that the stocks discussed in past shareholder reports did not dominate the Fund’s overall performance, despite the emergence of significant global risks over the period under review. The primary determinants of the Fund’s performance were companies that appreciated or depreciated mainly due to stock-specific drivers.
| Annual Report – April 30, 2018 | 13 |
| Seafarer Overseas Value Fund | Performance Review |
April 30, 2018
Indeed, the common thread among the top five contributors to the Fund’s return for the fiscal year was organic earnings momentum or corporate action, not global, macro-related drivers. While earnings momentum as a driver of stock return is fitting for the growth-driven bull market in emerging market equities since the beginning of 2016, it is important to differentiate between different types of growth. Melco International Development (Breakup Value), a developer, owner, and operator of casinos, was the top contributor to the Fund’s performance. The company’s earnings growth and stock price appreciation had already begun prior to the start of the Fund’s fiscal year, thus making this company an unlikely candidate to be the top contributor to performance during the period. What set Melco International Development apart from other companies was meaningful earnings revisions by sell-side analysts. The 2018 earnings per share (EPS) consensus estimate at the beginning of the 2017 calendar year was $0.61. By the end of April 2018, sell-side analysts had revised that estimate to $1.21. Melco International Development represents a case of sustained earnings momentum coupled with aggressive earnings revisions. This is a powerful combination of return drivers, especially if the stock had been purchased prior to the first acceleration in earnings, which was the case for the Value Fund.
Another of the top five contributors to performance for the fiscal year is a case of an inflection point in earnings growth, in contrast to Melco International Development’s sustained and accelerating growth. Xtep International Holdings (Balance Sheet Liquidity), a Chinese sports apparel manufacturer, appreciated from HKD 2.56 per share on October 20, 2017 to HKD 4.58 per share by April 30, 2018, despite a profit warning in December of 2017 and several subsequent rating downgrades by sell-side analysts. My interpretation of this counter-intuitive share price move is that the market largely discounted the company’s negative profit warning, which was driven primarily by the purchase of old inventory from the retail channel, and instead saw the purchase as a sign of Xtep’s operational restructuring potentially coming to an end. It is from this perspective that I see a value strategy delivering returns within an overall market rally driven by growth stocks.
The remaining three of the top five contributors to the Value Fund’s performance were cases of stock price appreciation due to corporate action. China Resources Beer (Structural Shift), a Chinese brewer, has long suffered from structurally low profitability relative to brewers globally (as the category of value implies). The company’s stock price reacted strongly to indications that it would raise prices meaningfully, thus beginning to address one of the drivers of its structurally low profit margin.
China Foods (Asset Productivity), a Chinese Coke bottler, appreciated after selling two non-core businesses, unifying the territorial integrity of its Coke franchise in the country, and paying a large extraordinary dividend that yielded 22.5% on the declaration date of August 29, 2017.
Samsung SDI (Breakup Value), a Korean lithium-ion battery manufacturer, also contributed meaningfully to the portfolio’s return after selling non-core assets and reporting lower losses in its electric vehicle battery division, which may suggest positive and growing profits in the future.
The top five detractors to the Value Fund’s performance for the fiscal year had a heterogeneous set of drivers. The largest detractor was First Pacific (Breakup Value), a conglomerate with assets in the Philippines and Indonesia. The company’s share price declined from a peak of HKD 6.30 on September 5, 2017 to HKD 4.04 as of April 30, 2018 due to underwhelming signs of market share stabilization at its Philippine mobile operator, difficulty in raising tariffs for its Philippine water treatment business, and slow progress in expected asset sales. The company traded at a price to book value of approximately 0.7 as of April 30, 2018. I plan to meet management in person in the near future.
Another important detractor to performance was Del Monte Pacific (Deleveraging and Management Change), owner of the Del Monte brand of packaged vegetables, fruit, and beverages in the U.S. and Philippines, among other geographies. The reason for the stock’s underperformance was the sharp rise in the London Interbank Offered Rate (LIBOR) coupled with the company’s high leverage and slow progress in improving profitability in its U.S. division.11 The company traded at a price to book value of approximately 0.5 as of April 30, 2018. I also plan to meet management in person in the near future.
The stock price of Texwinca (Structural Shift), a Hong Kong-based textile company, continued to depreciate over the Fund’s fiscal year after having declined the prior year as well. Even though management has a plan to return earnings to growth, it is taking time to implement it, and in the
| 14 | (855) 732-9220 seafarerfunds.com |
| Seafarer Overseas Value Fund | Performance Review |
April 30, 2018
meantime it has reduced the dividend despite having net cash on the balance sheet. In my opinion, this is a case of waiting for management’s efforts to bear fruit, while receiving a dividend yield in excess of 10% in the interim, backed by a strong balance sheet.
Like Texwinca, I also expect the next two detractors to the Fund’s performance to return to earnings growth and restore the dividend paid to shareholders. The share price of Asia Satellite Holdings (Deleveraging), an owner and operator of commercial satellites, decreased significantly during the year (reducing its price to book value ratio from 1.05 on May 1, 2017 to 0.72 on April 30, 2018), presumably due to yet another year of declining accounting earnings. What the share price and accounting earnings fail to value is that cash flow generation actually grew, that the company continues to reduce its financial leverage, and that dividends started being paid again during calendar year 2017. I expect the market will assign a higher value to the cash flow the company generates and the dividend it pays once its accounting earnings begin to grow again – after the company’s latest satellite launch begins to contribute to earnings.
Similarly, the price to book value ratio of Amvig Holdings (Structural Shift), a Chinese tobacco packaging manufacturer, declined from 0.61 on May 2, 2017 to 0.50 on April 30, 2018, presumably due to a modest revenue decline even though accounting earnings, as well as cash flow from operations, both grew meaningfully. Furthermore, the company increased its dividend after reducing it in 2016. In my opinion, the stock continues to reflect difficult tobacco market dynamics in China. Not only do I expect these dynamics to improve going forward, but even if they do not, shareholders can look forward to probable dividend increases as the company has the potential to consolidate the industry and improve efficiency. Even more importantly, this is a company with a historical track record of reducing the book value per share by paying out all excess capital to shareholders.
Thank you for entrusting us with your capital. We are honored to serve as your investment adviser in the developing world.
Paul Espinosa
Lead Portfolio Manager, Seafarer Overseas Value Fund
Seafarer Capital Partners, LLC
The MSCI Emerging Markets Total Return Index, Standard (Large+Mid Cap) Core, Gross (dividends reinvested), USD is a free float-adjusted market capitalization index designed to measure equity market performance of emerging markets. Index code: GDUEEGF.
The S&P 500 Total Return Index is a stock market index based on the market capitalizations of 500 large companies with common stock listed on the NYSE or NASDAQ.
It is not possible to invest directly in an index.
The Fund is subject to investment risks, including possible loss of the principal amount invested and therefore is not suitable for all investors. The Fund may not achieve its objectives. Diversification does not ensure a profit or guarantee against loss.
Information on the Seafarer website is provided for textual reference only, and is not incorporated by reference into this report.
The views and information discussed in this commentary are as of the date of publication, are subject to change, and may not reflect Seafarer’s current views. The views expressed represent an assessment of market conditions at a specific point in time, are opinions only and should not be relied upon as investment advice regarding a particular investment or markets in general. Such information does not constitute a recommendation to buy or sell specific securities or investment vehicles. It should not be assumed that any investment will be profitable or will equal the performance of the portfolios or any securities or any sectors mentioned herein. The subject matter contained herein has been derived from several sources believed to be reliable and accurate at the time of compilation. Seafarer does not accept any liability for losses either direct or consequential caused by the use of this information.
| Annual Report – April 30, 2018 | 15 |
| Seafarer Overseas Value Fund | Performance Review |
April 30, 2018
As of April 30, 2018, the Fund had no economic interest in Tencent, Samsung Electronics, Naspers, Alibaba, Taiwan Semiconductor Manufacturing Company (TSMC), or Smithfield Foods.
| 1 | References to the “Fund” pertain to the Fund’s Institutional share class (ticker: SIVLX). Includes adjustments in accordance with U.S. GAAP and as such, the total return for shareholder transactions reported to the market may differ from the total return for financial reporting purposes. As a result, the total return for the Institutional share class increased from 9.64% to 9.74%. The Investor share class (ticker: SFVLX) gained 9.55% during the fiscal year. |
| 2 | The Fund’s Investor share class generated an annualized rate of return of 12.38% from the Fund’s inception through the end of the fiscal year. |
| 3 | Adjustments in accordance with the U.S. GAAP were applied during the financial statement preparation and decreased the net asset value from $11.29 to $11.28. |
| 4 | The Fund’s Investor share class began the fiscal year with a net asset value of $11.30 per share; it paid an annual distribution of $0.423 in December 2017; and it finished the fiscal year with a value of $11.95 per share. |
| 5 | The Gulf Cooperation Council (GCC) is a regional political and economic union consisting of all Arab states of the Persian Gulf, except Iraq. Established in 1981, the GCC is also known as the Cooperation Council for the Arab States of the Gulf. |
| 6 | The white paper On Value in Emerging Markets is available at: www.seafarerfunds.com/value-white-paper |
| 7 | The Value Fund’s second quarter 2017 portfolio review is available at: www.seafarerfunds.com/funds/ovl/portfolio-review/2017/06/Q2 |
| 8 | Price to book value (P/BV) ratio is the market price of a company’s common shares, divided by the company’s book value per share. |
| 9 | Dividend yield is a measure of the sum of the dividends paid per share during the trailing 12 months divided by the current share price. |
| 10 | The North American Free Trade Agreement (NAFTA) is a comprehensive trade agreement established among the North American countries of Canada, Mexico, and the United States in 1994. |
| 11 | London Interbank Offered Rate (LIBOR) is the interest rate at which banks offer to lend funds (wholesale money) to one another in the international interbank market. |
| 16 | (855) 732-9220 seafarerfunds.com |
| Seafarer Overseas Value Fund | Performance Review |
April 30, 2018
Total Returns
| As of April 30, 2018 | 1 Year | Since Inception Annualized(1) | Net Expense
Ratio(2) |
| Investor Class (SFVLX) | 9.55% | 12.38% | 1.15% |
| Institutional Class (SIVLX) | 9.74%(3) | 12.50% | 1.05% |
| MSCI Emerging Markets Total Return Index(4) | 22.14% | 24.30% | |
Gross expense ratio: 3.71% for Investor Class; 3.63% for Institutional Class. Ratios as of Prospectus dated August 31, 20172
All performance is in U.S. dollars with gross (pre-tax) dividends and/or distributions reinvested. The performance data quoted represents past performance and does not guarantee future results. Future returns may be lower or higher. The investment return and principal value will fluctuate so that an investor's shares, when redeemed, may be worth more or less than the original cost. Prior to August 31, 2016, shares of the Fund redeemed or exchanged within 90 days of purchase were subject to a 2% redemption fee. Performance does not reflect this fee, which if deducted would reduce an individual's return. To obtain the Fund’s most recent month-end performance, visit seafarerfunds.com or call (855) 732-9220.
| 1 | Inception Date: May 31, 2016. |
| 2 | Ratios as of Prospectus dated August 31, 2017. Seafarer Capital Partners, LLC has agreed contractually to waive and/or reimburse fees or expenses in order to limit Total Annual Fund Operating Expenses After Fee Waiver/Expense Reimbursements (excluding brokerage expenses, interest expenses, taxes and extraordinary expenses) to 1.15% and 1.05% of the Fund’s average daily net assets for the Investor and Institutional share classes, respectively. This agreement is in effect through August 31, 2018. |
| 3 | Includes adjustments in accordance with U.S. GAAP and as such, the total return for shareholder transactions reported to the market may differ from the total return for financial reporting purposes. As a result, the total return increased from 9.64% to 9.74%. |
| 4 | The MSCI Emerging Markets Total Return Index, Standard (Large+Mid Cap) Core, Gross (dividends reinvested), USD is a free float-adjusted market capitalization index designed to measure equity market performance of emerging markets. Index code: GDUEEGF. The index is not actively managed and does not reflect any deductions for fees, expense or taxes. An investor may not invest directly in an index. |
| Annual Report – April 30, 2018 | 17 |
| Seafarer Overseas Value Fund | Performance Review |
April 30, 2018
Performance of a $10,000 Investment Since Inception
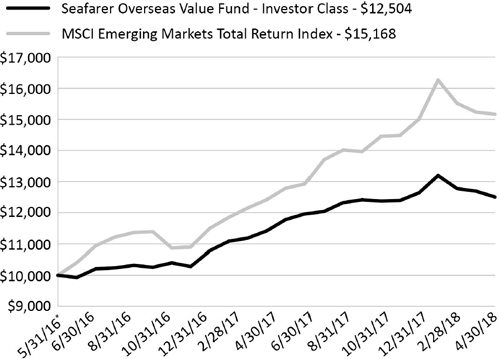
| * | Inception Date: May 31, 2016. |
The chart shown above represents historical performance of a hypothetical investment of $10,000 in the Fund’s Investor Class shares for the period from inception to April 30, 2018. All returns reflect reinvested dividends and/or distributions, but do not reflect the deduction of taxes that an investor would pay on distributions or redemptions.
The Fund also offers Institutional Class shares, performance for which is not reflected in the chart above. The performance of Institutional Class shares may be higher or lower than the performance of the Investor Class shares shown above based upon differences in fees paid by shareholders investing in the Investor Class shares and Institutional Class shares.
Investment Objective
The Fund seeks to provide long-term capital appreciation.
Strategy
The Fund invests primarily in the securities of companies located in developing countries. The Fund invests in several asset classes including common stocks, preferred stocks, and fixed-income securities.
The Fund’s portfolio is comprised of securities identified through a bottom-up security selection process based on fundamental research. The Fund seeks to produce a minimum long-term rate of return by investing in securities priced at a discount to their intrinsic value.
| 18 | | (855) 732-9220 seafarerfunds.com |
| Seafarer Overseas Value Fund | Performance Review |
April 30, 2018
| Portfolio Composition by Region | % Net Assets |
| East & South Asia | 66.3% |
| Emerging Europe | 8.1% |
| Latin America | 4.6% |
| Middle East & Africa | 6.3% |
| Cash & Other Assets, Less Liabilities | 14.7% |
| Total | 100.0% |
| Portfolio Composition by Sector | % Net Assets |
| Consumer Discretionary | 26.1% |
| Consumer Staples | 18.3% |
| Energy | 5.3% |
| Financials | 5.7% |
| Health Care | 2.3% |
| Industrials | 9.2% |
| Information Technology | 3.5% |
| Materials | 6.3% |
| Real Estate | 2.3% |
| Telecommunication Services | 3.3% |
| Utilities | 3.0% |
| Cash & Other Assets, Less Liabilities | 14.7% |
| Total | 100.0% |
| Top 10 Holdings | % Net Assets |
| Xtep International Holdings, Ltd. | 4.4% |
| Melco International Development, Ltd. | 4.0% |
| China Resources Beer Holdings Co., Ltd. | 3.8% |
| Wilmar International, Ltd. | 3.6% |
| Samsung SDI Co., Ltd. | 3.5% |
| China Foods, Ltd. | 3.4% |
| First Pacific Co., Ltd. | 3.4% |
| Genting Singapore Plc | 3.3% |
| WH Group, Ltd. | 3.3% |
| Asia Satellite Telecommunications Holdings, Ltd. | 3.3% |
| Total | 36.0% |
| | |
| Total Number of Holdings | 32 |
Holdings are subject to change, and may not reflect the current or future position of the portfolio.
Source: ALPS Fund Services, Inc.
| Annual Report – April 30, 2018 | 19 |
| Seafarer Funds | Disclosure of Fund Expenses |
April 30, 2018 (Unaudited)
DISCLOSURE OF FUND EXPENSES
As a shareholder of a Fund you will incur two types of costs: (1) transaction costs, including applicable redemption fees; and (2) ongoing costs, including management fees and other Fund expenses. The following examples are intended to help you understand your ongoing costs (in dollars) of investing in a Fund and to compare these costs with the ongoing costs of investing in other mutual funds. The examples are based on an investment of $1,000 invested on November 1, 2017 and held until April 30, 2018.
Actual Expenses. For each Fund and share class, the first line of the following table provides information about actual account values and actual expenses. You may use the information in this line, together with the amount you invested, to estimate the expenses that you paid over the period. Simply divide your account value by $1,000 (for example, an $8,600 account value divided by $1,000 = 8.6), then multiply the result by the number in the first line under the heading “Expenses Paid During Period” to estimate the expenses you paid on your account during this period.
Hypothetical Example for Comparison Purposes. For each Fund and share class, the second line of the following table provides information about hypothetical account values and hypothetical expenses based on the Fund’s actual expense ratio and an assumed rate of return of 5% per year before expenses, which is not the Fund’s actual return. The hypothetical account values and expenses may not be used to estimate the actual ending account balance or expenses you paid for the period. You may use this information to compare the ongoing costs of investing in the Fund and other mutual funds. To do so, compare this 5% hypothetical example with the 5% hypothetical examples that appear in the shareholder reports of the other mutual funds.
Please note the expenses shown in the following table are meant to highlight your ongoing costs only and do not reflect transactional costs, such as redemption fees or exchange fees. Therefore, for each Fund and share class, the second line of the following table is useful in comparing ongoing costs only, and will not help you determine the relative total costs of owning different funds. In addition, if these transactional costs were included, your costs would have been higher.
| 20 | | (855) 732-9220 seafarerfunds.com |
| Seafarer Funds | Disclosure of Fund Expenses |
April 30, 2018 (Unaudited)
| Beginning
Account Value
11/01/17 | Ending
Account Value
04/30/18 | Expense
Ratio(a) | Expenses Paid During Period 11/01/17 - 04/30/18(b) |
| SEAFARER OVERSEAS GROWTH AND INCOME FUND | | | | |
| Investor Class | | | | |
| Actual | $1,000.00 | $1,011.50 | 0.98% | $4.89 |
| Hypothetical (5% return before expenses) | $1,000.00 | $1,019.93 | 0.98% | $4.91 |
| Institutional Class | | | | |
| Actual | $1,000.00 | $1,012.10 | 0.87% | $4.34 |
| Hypothetical (5% return before expenses) | $1,000.00 | $1,020.48 | 0.87% | $4.36 |
| | | | | |
| SEAFARER OVERSEAS VALUE FUND | | | |
| Investor Class | | | | |
| Actual | $1,000.00 | $1,010.50 | 1.15% | $5.73 |
| Hypothetical (5% return before expenses) | $1,000.00 | $1,019.09 | 1.15% | $5.76 |
| Institutional Class | | | | |
| Actual | $1,000.00 | $1,011.30 | 1.05% | $5.24 |
| Hypothetical (5% return before expenses) | $1,000.00 | $1,019.59 | 1.05% | $5.26 |
| (a) | Annualized, based on the Fund's most recent fiscal half year expenses. |
| (b) | Expenses are equal to the Fund's annualized expense ratio multiplied by the average account value over the period, multiplied by the number of days in the most recent fiscal half-year (181)/365 (to reflect the half-year period). |
| Annual Report – April 30, 2018 | 21 |
| Seafarer Overseas Growth and Income Fund | Portfolio of Investments |
April 30, 2018
| | | Currency | | | Shares | | | Value | |
| COMMON STOCKS (81.9%) | | | | | | | | | | | | |
| Brazil (5.1%) | | | | | | | | | | | | |
| TOTVS SA | | | BRL | | | | 7,700,000 | | | $ | 70,093,914 | |
| Odontoprev SA | | | BRL | | | | 13,250,000 | | | | 56,847,311 | |
| Ser Educacional SA | | | BRL | | | | 5,500,000 | | | | 26,061,887 | |
| | | | | | | | | | | | | |
| Total Brazil | | | | | | | | | | | 153,003,112 | |
| | | | | | | | | | | | | |
| China / Hong Kong (19.1%) | | | | | | | | | | | | |
| Hang Lung Properties, Ltd. | | | HKD | | | | 46,620,000 | | | | 110,329,692 | |
| China Telecom Corp., Ltd., Class H | | | HKD | | | | 210,000,000 | | | | 101,793,725 | |
| China Yangtze Power Co., Ltd., Class A | | | CNY | | | | 35,099,263 | | | | 88,973,249 | |
| Hengan International Group Co., Ltd. | | | HKD | | | | 9,250,000 | | | | 82,263,408 | |
| Fuyao Glass Industry Group Co., Ltd., Class H | | | HKD | | | | 17,007,900 | | | | 58,457,431 | |
| Shandong Weigao Group Medical Polymer Co., Ltd., Class H | | | HKD | | | | 61,250,000 | | | | 37,640,510 | |
| Texwinca Holdings, Ltd. | | | HKD | | | | 56,500,000 | | | | 28,407,219 | |
| Greatview Aseptic Packaging Co., Ltd. | | | HKD | | | | 37,500,000 | | | | 24,892,816 | |
| Xinhua Winshare Publishing and Media Co., Ltd., Class H | | | HKD | | | | 31,500,000 | | | | 24,582,132 | |
| Pico Far East Holdings, Ltd. | | | HKD | | | | 52,500,000 | | | | 21,332,874 | |
| | | | | | | | | | | | | |
| Total China / Hong Kong | | | | | | | | | | | 578,673,056 | |
| | | | | | | | | | | | | |
| Hungary (3.7%) | | | | | | | | | | | | |
| Richter Gedeon Nyrt | | | HUF | | | | 5,625,000 | | | | 113,583,208 | |
| | | | | | | | | | | | | |
| Total Hungary | | | | | | | | | | | 113,583,208 | |
| | | | | | | | | | | | | |
| India (6.9%) | | | | | | | | | | | | |
| Infosys, Ltd., Sponsored ADR | | | USD | | | | 6,800,000 | | | | 120,156,000 | |
| Sun Pharma Advanced Research Co., Ltd.(a) | | | INR | | | | 8,625,000 | | | | 54,399,098 | |
| Infosys, Ltd. | | | INR | | | | 1,150,000 | | | | 20,610,648 | |
| Balkrishna Industries, Ltd. | | | INR | | | | 775,000 | | | | 14,773,613 | |
| | | | | | | | | | | | | |
| Total India | | | | | | | | | | | 209,939,359 | |
| | | | | | | | | | | | | |
| Indonesia (3.5%) | | | | | | | | | | | | |
| Astra International Tbk PT | | | IDR | | | | 206,611,100 | | | | 105,749,126 | |
| | | | | | | | | | | | | |
| Total Indonesia | | | | | | | | | | | 105,749,126 | |
| 22 | (855) 732-9220 seafarerfunds.com |
| Seafarer Overseas Growth and Income Fund | Portfolio of Investments |
April 30, 2018
| | | Currency | | | Shares | | | Value | |
| Japan (1.3%) | | | | | | | | | |
| Hisamitsu Pharmaceutical Co., Inc. | | | JPY | | | | 501,700 | | | $ | 38,995,086 | |
| | | | | | | | | | | | | |
| Total Japan | | | | | | | | | | | 38,995,086 | |
| | | | | | | | | | | | | |
| Malaysia (0.4%) | | | | | | | | | | | | |
| Hartalega Holdings Bhd | | | MYR | | | | 8,133,400 | | | | 12,104,902 | |
| | | | | | | | | | | | | |
| Total Malaysia | | | | | | | | | | | 12,104,902 | |
| | | | | | | | | | | | | |
| Mexico (1.4%) | | | | | | | | | | | | |
| Bolsa Mexicana de Valores SAB de CV | | | MXN | | | | 22,000,000 | | | | 42,489,460 | |
| | | | | | | | | | | | | |
| Total Mexico | | | | | | | | | | | 42,489,460 | |
| | | | | | | | | | | | | |
| Poland (2.6%) | | | | | | | | | | | | |
| Bank Pekao SA | | | PLN | | | | 1,400,000 | | | | 46,461,693 | |
| Asseco Poland SA | | | PLN | | | | 2,636,648 | | | | 32,920,654 | |
| | | | | | | | | | | | | |
| Total Poland | | | | | | | | | | | 79,382,347 | |
| | | | | | | | | | | | | |
| Singapore (8.0%) | | | | | | | | | | | | |
| Singapore Telecommunications, Ltd. | | | SGD | | | | 54,500,000 | | | | 144,157,720 | |
| Venture Corp., Ltd. | | | SGD | | | | 4,000,000 | | | | 62,564,259 | |
| SIA Engineering Co., Ltd. | | | SGD | | | | 14,500,000 | | | | 35,482,342 | |
| | | | | | | | | | | | | |
| Total Singapore | | | | | | | | | | | 242,204,321 | |
| | | | | | | | | | | | | |
| South Africa (3.5%) | | | | | | | | | | | | |
| Sanlam, Ltd. | | | ZAR | | | | 16,550,000 | | | | 104,546,682 | |
| | | | | | | | | | | | | |
| Total South Africa | | | | | | | | | | | 104,546,682 | |
| | | | | | | | | | | | | |
| South Korea (15.5%) | | | | | | | | | | | | |
| Hyundai Mobis Co., Ltd. | | | KRW | | | | 860,000 | | | | 199,161,904 | |
| Orion Corp/Republic Of Korea | | | KRW | | | | 903,672 | | | | 104,901,783 | |
| Coway Co., Ltd. | | | KRW | | | | 1,240,000 | | | | 101,333,210 | |
| Dongsuh Cos., Inc. | | | KRW | | | | 1,650,000 | | | | 42,434,973 | |
| Sindoh Co., Ltd. | | | KRW | | | | 400,000 | | | | 22,658,115 | |
| | | | | | | | | | | | | |
| Total South Korea | | | | | | | | | | | 470,489,985 | |
| | | | | | | | | | | | | |
| Taiwan (10.0%) | | | | | | | | | | | | |
| Pou Chen Corp. | | | TWD | | | | 71,810,000 | | | | 89,803,737 | |
| Delta Electronics, Inc. | | | TWD | | | | 24,350,000 | | | | 88,281,177 | |
| Taiwan Semiconductor Manufacturing Co., Ltd. | | | TWD | | | | 8,150,000 | | | | 62,081,341 | |
| Annual Report – April 30, 2018 | 23 |
| Seafarer Overseas Growth and Income Fund | Portfolio of Investments |
April 30, 2018
| | | Currency | | | Shares | | | Value | |
| Taiwan (continued) | | | | | | | | | | | | |
| Vanguard International Semiconductor Corp. | | | TWD | | | | 22,250,000 | | | $ | 45,101,028 | |
| Taiwan Semiconductor Manufacturing Co., Ltd., Sponsored ADR | | | USD | | | | 476,739 | | | | 18,330,614 | |
| | | | | | | | | | | | | |
| Total Taiwan | | | | | | | | | | | 303,597,897 | |
| | | | | | | | | | | | | |
| Vietnam (0.9%) | | | | | | | | | | | | |
| Bao Viet Holdings | | | VND | | | | 4,511,760 | | | | 18,167,178 | |
| Nam Long Investment Corp. | | | VND | | | | 5,190,000 | | | | 8,166,328 | |
| | | | | | | | | | | | | |
| Total Vietnam | | | | | | | | | | | 26,333,506 | |
| | | | | | | | | | | | | |
| TOTAL COMMON STOCKS | | | | | | | | | | | | |
| (Cost $2,356,010,894) | | | | | | | | | | | 2,481,092,047 | |
| | | | | | | | | | | | | |
| PREFERRED STOCKS (5.1%) | | | | | | | | | | | | |
| Brazil (1.7%) | | | | | | | | | | | | |
| Banco Bradesco SA, ADR | | | USD | | | | 5,250,000 | | | | 51,450,000 | |
| | | | | | | | | | | | | |
| Total Brazil | | | | | | | | | | | 51,450,000 | |
| | | | | | | | | | | | | |
| South Korea (3.4%) | | | | | | | | | | | | |
| Samsung Electronics Co., Ltd. | | | KRW | | | | 52,000 | | | | 103,372,209 | |
| | | | | | | | | | | | | |
| Total South Korea | | | | | | | | | | | 103,372,209 | |
| | | | | | | | | | | | | |
| TOTAL PREFERRED STOCKS | | | | | | | | | | | | |
| (Cost $87,571,513) | | | | | | | | | | | 154,822,209 | |
| | | Currency | | | Rate | | | Maturity Date | | Principal Amount | | | Value | |
| CORPORATE BOND - FOREIGN CURRENCY (1.3%) | | | | | | | | | | | |
| Mexico (1.3%) | | | | | | | | | | | | | | | | | | |
| America Movil SAB de CV | | | MXN | | | | 6.45 | % | | 12/05/22 | | | 400,000,000 | | | | 19,928,297 | |
| America Movil SAB de CV | | | MXN | | | | 7.13 | % | | 12/09/24 | | | 400,000,000 | | | | 20,116,939 | |
| | | | | | | | | | | | | | | | | | | |
| Total Mexico | | | | | | | | | | | | | | | | | 40,045,236 | |
| | | | | | | | | | | | | | | | | | | |
| TOTAL CORPORATE BOND - FOREIGN CURRENCY | | | | | | | | | | | |
| (Cost $41,791,331) | | | | | | | | | | | | | | | | | 40,045,236 | |
| 24 | | (855) 732-9220 seafarerfunds.com |
| Seafarer Overseas Growth and Income Fund | Portfolio of Investments |
April 30, 2018
| | | Currency | | | Rate | | | Maturity Date | | | Principal Amount | | | Value | |
| CORPORATE BOND - USD (0.3%) | | | | | | | | | | | | | | | | | | | | |
| Brazil (0.3%) | | | | | | | | | | | | | | | | | | | | |
| Cielo SA / Cielo USA, Inc., Series REGS | | | USD | | | | 3.75 | % | | | 11/16/22 | | | | 10,000,000 | | | $ | 9,600,000 | |
| | | | | | | | | | | | | | | | | | | | | |
| Total Brazil | | | | | | | | | | | | | | | | | | | 9,600,000 | |
| | | | | | | | | | | | | | | | | | | | | |
| TOTAL CORPORATE BOND - USD | | | | | | | | | | | | | | | | | | | | |
| (Cost $9,520,373) | | | | | | | | | | | | | | | | | | | 9,600,000 | |
| | | | | | | | | | | | | | | | | | | | | |
| GOVERNMENT BOND, MEDIUM/LONG - TERM - FOREIGN CURRENCY (1.9%) | | | | | |
| Brazil (1.4%) | | | | | | | | | | | | | | | | | | | | |
| Brazilian Government International Bond | | | BRL | | | | 10.25 | % | | | 01/10/28 | | | | 60,000,000 | | | | 19,689,769 | |
| Brazil Notas do Tesouro Nacional Serie F, Series NTNF | | | BRL | | | | 10.00 | % | | | 01/01/25 | | | | 70,000,000 | | | | 21,245,596 | |
| | | | | | | | | | | | | | | | | | | | | |
| Total Brazil | | | | | | | | | | | | | | | | | | | 40,935,365 | |
| | | | | | | | | | | | | | | | | | | | | |
| Indonesia (0.5%) | | | | | | | | | | | | | | | | | | | | |
| Indonesia Treasury Bond, Series FR70 | | | IDR | | | | 8.38 | % | | | 03/15/24 | | | | 200,000,000,000 | | | | 15,449,200 | |
| | | | | | | | | | | | | | | | | | | | | |
| Total Indonesia | | | | | | | | | | | | | | | | | | | 15,449,200 | |
| | | | | | | | | | | | | | | | | | | | | |
| TOTAL GOVERNMENT BOND, MEDIUM/LONG - TERM - FOREIGN CURRENCY | | | | | | | |
| (Cost $50,569,687) | | | | | | | | | | | | | | | | | | | 56,384,565 | |
| | | | | | | | | | | | | | | | | | | | | |
| GOVERNMENT BOND, SHORT-TERM - USD AND FOREIGN CURRENCY (2.6%) | |
| Colombia (0.2%) | | | | | | | | | | | | | | | | | | | | |
| Colombia Government International Bond | | | USD | | | | 11.75 | % | | | 02/25/20 | | | | 5,000,000 | | | | 5,752,500 | |
| | | | | | | | | | | | | | | | | | | | | |
| Total Colombia | | | | | | | | | | | | | | | | | | | 5,752,500 | |
| | | | | | | | | | | | | | | | | | | | | |
| Israel (0.3%) | | | | | | | | | | | | | | | | | | | | |
| Israel Government International Bond | | | USD | | | | 5.13 | % | | | 03/26/19 | | | | 10,000,000 | | | | 10,228,400 | |
| | | | | | | | | | | | | | | | | | | | | |
| Total Israel | | | | | | | | | | | | | | | | | | | 10,228,400 | |
| Annual Report – April 30, 2018 | 25 |
| Seafarer Overseas Growth and Income Fund | Portfolio of Investments |
April 30, 2018
| | | Currency | | | Rate | | | Maturity Date | | Principal Amount | | | Value | |
| Latvia (0.2%) | | | | | | | | | | | | | | |
| Republic of Lativa | | | | | | | | | | | | | | | | | | |
| Government International Bond, Series REGS | | | USD | | | | 2.75 | % | | 01/12/20 | | | 5,000,000 | | | $ | 4,975,185 | |
| | | | | | | | | | | | | | | | | | | |
| Total Latvia | | | | | | | | | | | | | | | | | 4,975,185 | |
| | | | | | | | | | | | | | | | | | | |
| Lithuania (0.2%) | | | | | | | | | | | | | | | | | | |
| Lithuania Government International Bond, Series REGS | | | USD | | | | 7.38 | % | | 02/11/20 | | | 5,000,000 | | | | 5,379,355 | |
| | | | | | | | | | | | | | | | | | | |
| Total Lithuania | | | | | | | | | | | | | | | | | 5,379,355 | |
| | | | | | | | | | | | | | | | | | | |
| Poland (0.3%) | | | | | | | | | | | | | | | | | | |
| Republic of Poland | | | | | | | | | | | | | | | | | | |
| Government International Bond | | | USD | | | | 6.38 | % | | 07/15/19 | | | 10,000,000 | | | | 10,426,300 | |
| | | | | | | | | | | | | | | | | | | |
| Total Poland | | | | | | | | | | | | | | | | | 10,426,300 | |
| | | | | | | | | | | | | | | | | | | |
| Singapore (0.3%) | | | | | | | | | | | | | | | | | | |
| Singapore Government Bond | | | SGD | | | | 4.00 | % | | 09/01/18 | | | 11,000,000 | | | | 8,370,519 | |
| | | | | | | | | | | | | | | | | | | |
| Total Singapore | | | | | | | | | | | | | | | | | 8,370,519 | |
| | | | | | | | | | | | | | | | | | | |
| South Africa (0.2%) | | | | | | | | | | | | | | | | | | |
| Republic of South Africa | | | | | | | | | | | | | | | | | | |
| Government International Bond | | | USD | | | | 6.88 | % | | 05/27/19 | | | 5,000,000 | | | | 5,189,040 | |
| | | | | | | | | | | | | | | | | | | |
| Total South Africa | | | | | | | | | | | | | | | | | 5,189,040 | |
| | | | | | | | | | | | | | | | | | | |
| South Korea (0.9%) | | | | | | | | | | | | | | | | | | |
| The Korea Development Bank | | | USD | | | | 2.88 | % | | 08/22/18 | | | 5,000,000 | | | | 5,000,250 | |
| Korea Treasury Bond, Series 1806 | | | KRW | | | | 1.63 | % | | 06/10/18 | | | 6,000,000,000 | | | | 5,618,411 | |
| Korea Treasury Bond, Series 1812 | | | KRW | | | | 1.75 | % | | 12/10/18 | | | 6,000,000,000 | | | | 5,619,035 | |
| The Korea Development Bank | | | USD | | | | 1.38 | % | | 09/12/19 | | | 6,000,000 | | | | 5,850,619 | |
| 26 | (855) 732-9220 seafarerfunds.com |
| Seafarer Overseas Growth and Income Fund | Portfolio of Investments |
April 30, 2018
| | | Currency | | | Rate | | | Maturity Date | | Principal Amount | | | Value | |
| South Korea (continued) | | | | | | | | | | | | | | | | | | |
| Korea International Bond | | | USD | | | | 7.13 | % | | 04/16/19 | | | 6,000,000 | | | $ | 6,258,000 | |
| | | | | | | | | | | | | | | | | | | |
| Total South Korea | | | | | | | | | | | | | | | | | 28,346,315 | |
| | | | | | | | | | | | | | | | | | | |
| TOTAL GOVERNMENT BOND, SHORT-TERM - USD AND FOREIGN CURRENCY | |
| (Cost $78,216,988) | | | | | | | | | | | | | | | | | 78,667,614 | |
| | | | | | | | | | | | | | | | | | | |
| TOTAL INVESTMENTS | | | | | | | | | | | | | | | | | | |
| (Cost $2,623,680,786) (93.1%) | | | | | | | | | | | | | | | | $ | 2,820,611,671 | |
| | | | | | | | | | | | | | | | | | | |
| Cash and Other Assets, Less Liabilities (6.9%) | | | | 207,679,648 | |
| NET ASSETS (100.0%) | | | | | | | | | | | | | | | | $ | 3,028,291,319 | |
Principal Amount is stated in local currency unless otherwise noted.
| (a) | Non-income producing security. |
| Currency Abbreviations |
| BRL | - | Brazil Real |
| CNY | - | China Yuan |
| HKD | - | Hong Kong Dollar |
| HUF | - | Hungary Forint |
| IDR | - | Indonesia Rupiah |
| INR | - | India Rupee |
| JPY | - | Japan Yen |
| KRW | - | South Korea Won |
| MXN | - | Mexico Peso |
| MYR | - | Malaysia Ringgit |
| PLN | - | Poland Zloty |
| SGD | - | Singapore Dollar |
| TWD | - | Taiwan New Dollar |
| USD | - | United States Dollar |
| VND | - | Vietnam Dong |
| ZAR | - | South Africa Rand |
For Fund compliance purposes, the Fund's geographical classifications refer to any one or more of the sub-classifications used by one or more widely recognized market indexes or ratings group indexes, and/or as defined by Fund management. This definition may not apply for purposes of this report, which may combine sub-classifications for reporting ease. Geographical regions are shown as a percentage of net assets.
See accompanying Notes to Financial Statements.
| Annual Report – April 30, 2018 | 27 |
| Seafarer Overseas Value Fund | Portfolio of Investments |
April 30, 2018
| | | Currency | | | Shares | | | Value | |
| COMMON STOCKS (85.3%) | | | | | | | | | | | | |
| Brazil (2.3%) | | | | | | | | | | | | |
| Qualicorp SA | | | BRL | | | | 86,000 | | | $ | 595,313 | |
| | | | | | | | | | | | | |
| Total Brazil | | | | | | | | | | | 595,313 | |
| | | | | | | | | | | | | |
| China / Hong Kong (45.1%) | | | | | | | | | | | | |
| Xtep International Holdings, Ltd. | | | HKD | | | | 1,924,000 | | | | 1,117,791 | |
| Melco International Development, Ltd. | | | HKD | | | | 274,000 | | | | 1,014,441 | |
| China Resources Beer Holdings Co., Ltd. | | | HKD | | | | 224,000 | | | | 964,752 | |
| China Foods, Ltd. | | | HKD | | | | 1,920,000 | | | | 881,379 | |
| First Pacific Co., Ltd. | | | HKD | | | | 1,692,000 | | | | 866,422 | |
| WH Group, Ltd. | | | HKD | | | | 825,000 | | | | 854,102 | |
| Asia Satellite Telecommunications Holdings, Ltd. | | | HKD | | | | 1,078,000 | | | | 848,813 | |
| China Yangtze Power Co., Ltd., Class A | | | CNY | | | | 301,990 | | | | 765,516 | |
| Texwinca Holdings, Ltd. | | | HKD | | | | 1,470,000 | | | | 739,090 | |
| AMVIG Holdings, Ltd. | | | HKD | | | | 2,854,000 | | | | 734,532 | |
| Shangri-La Asia, Ltd. | | | HKD | | | | 374,000 | | | | 727,847 | |
| Giordano International, Ltd. | | | HKD | | | | 958,000 | | | | 585,410 | |
| Hang Lung Properties, Ltd. | | | HKD | | | | 247,000 | | | | 584,544 | |
| Greatview Aseptic Packaging Co., Ltd. | | | HKD | | | | 520,000 | | | | 345,180 | |
| Pacific Basin Shipping, Ltd.(a) | | | HKD | | | | 1,130,000 | | | | 300,461 | |
| Pico Far East Holdings, Ltd. | | | HKD | | | | 538,000 | | | | 218,611 | |
| | | | | | | | | | | | | |
| Total China / Hong Kong | | | | | | | | | | | 11,548,891 | |
| | | | | | | | | | | | | |
| Czech Republic (4.4%) | | | | | | | | | | | | |
| Pegas Nonwovens SA | | | CZK | | | | 19,000 | | | | 803,225 | |
| Philip Morris CR AS | | | CZK | | | | 430 | | | | 329,481 | |
| | | | | | | | | | | | | |
| Total Czech Republic | | | | | | | | | | | 1,132,706 | |
| | | | | | | | | | | | | |
| Mexico (2.3%) | | | | | | | | | | | | |
| Credito Real SAB de CV SOFOM ER(a) | | | MXN | | | | 404,609 | | | | 589,323 | |
| | | | | | | | | | | | | |
| Total Mexico | | | | | | | | | | | 589,323 | |
| | | | | | | | | | | | | |
| Philippines (1.4%) | | | | | | | | | | | | |
| Del Monte Pacific, Ltd. | | | SGD | | | | 2,350,000 | | | | 347,818 | |
| | | | | | | | | | | | | |
| Total Philippines | | | | | | | | | | | 347,818 | |
| 28 | (855) 732-9220 seafarerfunds.com |
| Seafarer Overseas Value Fund | Portfolio of Investments |
April 30, 2018
| | | Currency | | | Shares | | | Value | |
| Qatar (3.1%) | | | | | | | | | |
| Qatar Gas Transport Co., Ltd. | | | QAR | | | | 194,000 | | | $ | 782,714 | |
| | | | | | | | | | | | | |
| Total Qatar | | | | | | | | | | | 782,714 | |
| | | | | | | | | | | | | |
| Russia (3.7%) | | | | | | | | | | | | |
| Global Ports Investments PLC, GDR(a) | | | USD | | | | 157,000 | | | | 540,080 | |
| Cherkizovo Group PJSC | | | RUB | | | | 22,332 | | | | 398,960 | |
| | | | | | | | | | | | | |
| Total Russia | | | | | | | | | | | 939,040 | |
| | | | | | | | | | | | | |
| Singapore (9.5%) | | | | | | | | | | | | |
| Wilmar International, Ltd. | | | SGD | | | | 376,000 | | | | 919,856 | |
| Genting Singapore Plc | | | SGD | | | | 975,000 | | | | 854,213 | |
| SIA Engineering Co., Ltd. | | | SGD | | | | 273,000 | | | | 668,047 | |
| | | | | | | | | | | | | |
| Total Singapore | | | | | | | | | | | 2,442,116 | |
| | | | | | | | | | | | | |
| South Korea (3.5%) | | | | | | | | | | | | |
| Samsung SDI Co., Ltd. | | | KRW | | | | 5,300 | | | | 902,483 | |
| | | | | | | | | | | | | |
| Total South Korea | | | | | | | | | | | 902,483 | |
| | | | | | | | | | | | | |
| Taiwan (2.4%) | | | | | | | | | | | | |
| Pou Chen Corp. | | | TWD | | | | 498,000 | | | | 622,786 | |
| | | | | | | | | | | | | |
| Total Taiwan | | | | | | | | | | | 622,786 | |
| | | | | | | | | | | | | |
| United Arab Emirates (3.3%) | | | | | | | | | | | | |
| National Central Cooling Co. PJSC | | | AED | | | | 1,752,000 | | | | 835,431 | |
| | | | | | | | | | | | | |
| Total United Arab Emirates | | | | | | | | | | | 835,431 | |
| | | | | | | | | | | | | |
| Vietnam (4.3%) | | | | | | | | | | | | |
| PetroVietnam Technical Services Corp. | | | VND | | | | 724,000 | | | | 577,159 | |
| Petrovietnam Fertilizer & Chemicals JSC | | | VND | | | | 622,000 | | | | 520,969 | |
| | | | | | | | | | | | | |
| Total Vietnam | | | | | | | | | | | 1,098,128 | |
| | | | | | | | | | | | | |
| TOTAL COMMON STOCKS | | | | | | | | | | | | |
| (Cost $20,637,865) | | | | | | | | | | | 21,836,749 | |
| Annual Report – April 30, 2018 | 29 |
| Seafarer Overseas Value Fund | Portfolio of Investments |
April 30, 2018
| | | Currency | | | Shares | | | Value | |
| TOTAL INVESTMENTS | | | | | | | | | | | |
| (Cost $20,637,865) (85.3%) | | | | | | | | | $ | 21,836,749 | |
| | | | | | | | | | | | |
| Cash and Other Assets, Less Liabilities (14.7%) | | | | | | | | | | 3,765,332 | |
| NET ASSETS (100.0%) | | | | | | | | | $ | 25,602,081 | |
| (a) | Non-income producing security. |
| Currency Abbreviations |
| AED | - | United Arab Emirates Dirham |
| BRL | - | Brazil Real |
| CNY | - | China Yuan |
| CZK | - | Czech Koruna |
| HKD | - | Hong Kong Dollar |
| KRW | - | South Korea Won |
| MXN | - | Mexico Peso |
| QAR | - | Qatar Riyal |
| RUB | - | Russian Ruble |
| SGD | - | Singapore Dollar |
| TWD | - | Taiwan New Dollar |
| USD | - | United States Dollar |
| VND | - | Vietnam Dong |
For Fund compliance purposes, the Fund's geographical classifications refer to any one or more of the sub-classifications used by one or more widely recognized market indexes or ratings group indexes, and/or as defined by Fund management. This definition may not apply for purposes of this report, which may combine sub-classifications for reporting ease. Geographical regions are shown as a percentage of net assets.
See accompanying Notes to Financial Statements.
| 30 | (855) 732-9220 seafarerfunds.com |
| Seafarer Funds | Statements of Assets and Liabilities |
April 30, 2018
| | | Seafarer
Overseas Growth and Income Fund | | | Seafarer
Overseas Value Fund | |
| ASSETS: | | | | | | |
| Investments, at value | | $ | 2,820,611,671 | | | $ | 21,836,749 | |
| Cash | | | 210,535,159 | | | | 3,596,577 | |
| Foreign currency, at value (Cost $376,354 and $210,100) | | | 376,832 | | | | 210,079 | |
| Receivable for investments sold | | | – | | | | 204 | |
| Receivable for shares sold | | | 1,464,482 | | | | 36,328 | |
| Interest and dividends receivable | | | 9,336,207 | | | | 60,499 | |
| Prepaid expenses and other assets | | | 31,969 | | | | 837 | |
| Total Assets | | | 3,042,356,320 | | | | 25,741,273 | |
| LIABILITIES: | | | | | | | | |
| Payable for investments purchased | | | 8,424,326 | | | | 96,747 | |
| Foreign capital gains tax | | | 985,452 | | | | – | |
| Administrative fees payable | | | 56,426 | | | | 3,651 | |
| Shareholder service plan fees payable | | | 443,961 | | | | 2,931 | |
| Payable for shares redeemed | | | 1,843,247 | | | | – | |
| Investment advisory fees payable | | | 1,840,061 | | | | 225 | |
| Payable for chief compliance officer fee | | | 1,847 | | | | 1,847 | |
| Trustee fees and expenses payable | | | 32,726 | | | | 255 | |
| Payable for principal financial officer fees | | | 417 | | | | 417 | |
| Audit and tax fees payable | | | 24,647 | | | | 20,650 | |
| Accrued expenses and other liabilities | | | 411,891 | | | | 12,469 | |
| Total Liabilities | | | 14,065,001 | | | | 139,192 | |
| NET ASSETS | | $ | 3,028,291,319 | | | $ | 25,602,081 | |
| NET ASSETS CONSIST OF: | | | | | | | | |
| Paid-in capital (Note 5) | | $ | 2,723,700,936 | | | $ | 24,444,530 | |
| Accumulated net investment loss | | | (19,844,339 | ) | | | (121,252 | ) |
| Accumulated net realized gain | | | 128,591,161 | | | | 80,366 | |
| Net unrealized appreciation | | | 195,843,561 | | | | 1,198,437 | |
| NET ASSETS | | $ | 3,028,291,319 | | | $ | 25,602,081 | |
| INVESTMENTS, AT COST | | $ | 2,623,680,786 | | | $ | 20,637,865 | |
| PRICING OF SHARES | | | | | | | | |
| Investor Class: | | | | | | | | |
| Net Asset Value, offering and redemption price per share | | $ | 13.11 | | | $ | 11.95 | |
| Net Assets | | $ | 894,240,597 | | | $ | 311,432 | |
| Shares of beneficial interest outstanding | | | 68,227,140 | | | | 26,055 | |
| Institutional Class: | | | | | | | | |
| Net Asset Value, offering and redemption price per share | | $ | 13.14 | | | $ | 11.96 | |
| Net Assets | | $ | 2,134,050,722 | | | $ | 25,290,649 | |
| Shares of beneficial interest outstanding | | | 162,354,669 | | | | 2,114,386 | |
See accompanying Notes to Financial Statements.
| Annual Report – April 30, 2018 | 31 |
| Seafarer Funds | Statements of Operations |
Year Ended April 30, 2018
| | | Seafarer
Overseas Growth and Income Fund | | | Seafarer
Overseas Value Fund | |
| INVESTMENT INCOME: | | | | | | | | |
| Dividends | | $ | 81,988,141 | | | $ | 714,957 | |
| Foreign taxes withheld | | | (7,148,845 | ) | | | (35,038 | ) |
| Interest and other income | | | 11,095,465 | | | | 17,623 | |
| Total investment income | | | 85,934,761 | | | | 697,542 | |
| | | | | | | | | |
| EXPENSES: | | | | | | | | |
| Investment advisory fees (Note 6) | | | 20,747,919 | | | | 127,648 | |
| Administrative and transfer agency fees | | | 728,990 | | | | 44,199 | |
| Trustee fees and expenses | | | 63,668 | | | | 438 | |
| Registration/filing fees | | | 122,830 | | | | 37,770 | |
| Shareholder service plan fees | | | | | | | | |
| Investor Class | | | 1,399,374 | | | | – | |
| Institutional Class | | | 898,331 | | | | 5,988 | |
| Legal fees | | | 25,134 | | | | 151 | |
| Audit fees | | | 34,063 | | | | 16,959 | |
| Reports to shareholders and printing fees | | | 134,517 | | | | 946 | |
| Custody fees | | | 1,698,899 | | | | 40,223 | |
| Offering costs (Note 2) | | | – | | | | 5,362 | |
| Chief compliance officer fees | | | 21,495 | | | | 21,499 | |
| Principal financial officer fees | | | 5,000 | | | | 5,000 | |
| Miscellaneous | | | 31,374 | | | | 4,766 | |
| Total expenses | | | 25,911,594 | | | | 310,949 | |
| Less fees waived/reimbursed by investment adviser (Note 6) | | | | | | | | |
| Investor Class | | | – | | | | (2,019 | ) |
| Institutional Class | | | – | | | | (123,476 | ) |
| Total net expenses | | | 25,911,594 | | | | 185,454 | |
| NET INVESTMENT INCOME: | | | 60,023,167 | | | | 512,088 | |
| Net realized gain on investments | | | 155,821,034 | | | | 80,370 | |
| Net realized loss on foreign currency transactions | | | (24,725 | ) | | | (947 | ) |
| Net realized gain | | | 155,796,309 | | | | 79,423 | |
| Net change in unrealized appreciation/(depreciation) on investments (net of foreign capital gains tax of ($985,452) and $–) | | | (12,888,991 | ) | | | 424,043 | |
| Net change in unrealized depreciation on translation of assets and liabilities in foreign currency transactions | | | (158,590 | ) | | | (693 | ) |
| Net unrealized appreciation/(depreciation) | | | (13,047,581 | ) | | | 423,350 | |
| 32 | (855) 732-9220 seafarerfunds.com |
| Seafarer Funds | Statements of Operations |
Year Ended April 30, 2018
| | | Seafarer
Overseas Growth and Income Fund | | | Seafarer
Overseas Value Fund | |
| NET REALIZED AND UNREALIZED GAIN ON INVESTMENTS AND FOREIGN CURRENCY TRANSLATIONS | | | 142,748,728 | | | | 502,773 | |
| NET INCREASE IN NET ASSETS RESULTING FROM OPERATIONS | | $ | 202,771,895 | | | $ | 1,014,861 | |
See accompanying Notes to Financial Statements.
| Annual Report – April 30, 2018 | 33 |
| Seafarer Overseas Growth and Income Fund | Statements of Changes in Net Assets |
| | | Year Ended
April 30, 2018 | | | Year Ended
April 30, 2017 | |
| OPERATIONS: | | | | | | |
| Net investment income | | $ | 60,023,167 | | | $ | 32,247,036 | |
| Net realized gain/(loss) | | | 155,796,309 | | | | (10,282,431 | ) |
| Net change in unrealized appreciation/(depreciation) | | | (13,047,581 | ) | | | 174,008,053 | |
| Net increase in net assets resulting from operations | | | 202,771,895 | | | | 195,972,658 | |
| DISTRIBUTIONS TO SHAREHOLDERS (NOTE 3): | | | | | | | | |
| From net investment income | | | | | | | | |
| Investor Class | | $ | (26,380,990 | ) | | $ | (11,816,708 | ) |
| Institutional Class | | | (54,571,396 | ) | | | (15,268,463 | ) |
| From net realized gains on investments | | | | | | | | |
| Investor Class | | | (2,037,570 | ) | | | – | |
| Institutional Class | | | (4,296,911 | ) | | | – | |
| Net decrease in net assets from distributions | | | (87,286,867 | ) | | | (27,085,171 | ) |
| BENEFICIAL INTEREST TRANSACTIONS (NOTE 5): | | | | | | | | |
| Shares sold | | | | | | | | |
| Investor Class | | $ | 153,357,729 | | | $ | 323,883,071 | |
| Institutional Class | | | 781,843,936 | | | | 987,397,573 | |
| Dividends reinvested | | | | | | | | |
| Investor Class | | | 27,962,467 | | | | 11,687,348 | |
| Institutional Class | | | 47,081,170 | | | | 10,058,555 | |
| Shares Redeemed, net of redemption fees | | | | | | | | |
| Investor Class | | | (209,017,564 | ) | | | (141,954,140 | ) |
| Institutional Class | | | (266,115,267 | ) | | | (201,239,879 | ) |
| Net increase in net assets derived from beneficial interest transactions | | | 535,112,471 | | | | 989,832,528 | |
| | | | | | | | | |
| Net increase in net assets | | $ | 650,597,499 | | | $ | 1,158,720,015 | |
| | | | | | | | | |
| NET ASSETS: | | | | | | | | |
| Beginning of period | | $ | 2,377,693,820 | | | $ | 1,218,973,805 | |
| End of period (including accumulated net investment income/(loss) of ($19,844,339) and $6,298,920, respectively) | | $ | 3,028,291,319 | | | $ | 2,377,693,820 | |
| 34 | (855) 732-9220 seafarerfunds.com |
| Seafarer Overseas Growth and Income Fund | Statements of Changes in Net Assets |
| | | Year Ended
April 30, 2018 | | | Year Ended
April 30, 2017 | |
| Other Information: | | | | | | | | |
| SHARE TRANSACTIONS: | | | | | | | | |
| Investor Class | | | | | | | | |
| Sold | | | 11,678,351 | | | | 27,609,055 | |
| Distributions reinvested | | | 2,137,427 | | | | 1,045,402 | |
| Redeemed | | | (15,740,189 | ) | | | (12,161,311 | ) |
| Net increase/(decrease) in shares outstanding | | | (1,924,411 | ) | | | 16,493,146 | |
| Institutional Class | | | | | | | | |
| Sold | | | 59,053,386 | | | | 83,448,584 | |
| Distributions reinvested | | | 3,579,963 | | | | 900,914 | |
| Redeemed | | | (19,939,574 | ) | | | (17,485,012 | ) |
| Net increase in shares outstanding | | | 42,693,775 | | | | 66,864,486 | |
See accompanying Notes to Financial Statements.
| Annual Report – April 30, 2018 | 35 |
| Seafarer Overseas Value Fund | Statements of Changes in Net Assets |
| | | Year Ended April 30, 2018 | | | May 31, 2016 (Inception) to
April 30, 2017 | |
| OPERATIONS: | | | | | | |
| Net investment income | | $ | 512,088 | | | $ | 68,088 | |
| Net realized gain/(loss) | | | 79,423 | | | | (2,768 | ) |
| Net change in unrealized appreciation | | | 423,350 | | | | 775,087 | |
| Net increase in net assets resulting from operations | | | 1,014,861 | | | | 840,407 | |
| DISTRIBUTIONS TO SHAREHOLDERS (NOTE 3): | | | | | | | | |
| From net investment income | | | | | | | | |
| Investor Class | | $ | (10,736 | ) | | $ | (2,017 | ) |
| Institutional Class | | | (637,490 | ) | | | (60,374 | ) |
| Net decrease in net assets from distributions | | | (648,226 | ) | | | (62,391 | ) |
| BENEFICIAL INTEREST TRANSACTIONS (NOTE 5): | | | | | | | | |
| Shares sold | | | | | | | | |
| Investor Class | | $ | 117,980 | | | $ | 253,053 | |
| Institutional Class | | | 16,887,311 | | | | 11,072,675 | |
| Dividends reinvested | | | | | | | | |
| Investor Class | | | 10,352 | | | | 2,017 | |
| Institutional Class | | | 624,682 | | | | 60,374 | |
| Shares Redeemed | | | | | | | | |
| Investor Class | | | (113,172 | ) | | | – | |
| Institutional Class | | | (2,417,257 | ) | | | (2,040,585 | ) |
| Net increase in net assets derived from beneficial interest transactions | | | 15,109,896 | | | | 9,347,534 | |
| | | | | | | | | |
| Net increase in net assets | | $ | 15,476,531 | | | $ | 10,125,550 | |
| | | | | | | | | |
| NET ASSETS: | | | | | | | | |
| Beginning of period | | $ | 10,125,550 | | | $ | – | |
| End of period (including accumulated net investment income/(loss) of ($121,252) and $23,419) | | $ | 25,602,081 | | | $ | 10,125,550 | |
| | | | | | | | | |
| Other Information: | | | | | | | | |
| SHARE TRANSACTIONS: | | | | | | | | |
| Investor Class | | | | | | | | |
| Sold | | | 9,613 | | | | 24,578 | |
| Distributions reinvested | | | 878 | | | | 198 | |
| Redeemed | | | (9,212 | ) | | | – | |
| Net increase in shares outstanding | | | 1,279 | | | | 24,776 | |
| Institutional Class | | | | | | | | |
| Sold | | | 1,388,144 | | | | 1,062,151 | |
| Distributions reinvested | | | 52,984 | | | | 5,925 | |
| Redeemed | | | (199,202 | ) | | | (195,616 | ) |
| Net increase in shares outstanding | | | 1,241,926 | | | | 872,460 | |
See accompanying Notes to Financial Statements
| 36 | (855) 732-9220 seafarerfunds.com |
Page Intentionally Left Blank
Financial Highlights
For a share outstanding through the periods presented
| Investor Class |
| NET ASSET VALUE, BEGINNING OF PERIOD |
| INCOME FROM OPERATIONS: |
| Net investment income(a) |
| Net realized and unrealized gain/(loss) on investments |
| Total from investment operations |
| LESS DISTRIBUTIONS: |
| From net investment income |
| From net realized gains on investments |
| Total distributions |
| REDEMPTION FEES ADDED TO PAID IN CAPITAL |
| NET INCREASE/(DECREASE) IN NET ASSET VALUE |
| NET ASSET VALUE, END OF PERIOD |
| TOTAL RETURN(d) |
| SUPPLEMENTAL DATA: |
| Net assets, end of period (in 000s) |
| RATIOS TO AVERAGE NET ASSETS: |
| Operating expenses excluding reimbursement/waiver |
| Operating expenses including reimbursement/waiver |
| Net investment income including reimbursement/waiver |
| PORTFOLIO TURNOVER RATE |
| (a) | Calculated using the average shares method. |
| (b) | Less than $0.005 per share. |
| (c) | In preparing the financial statements in accordance with U.S. GAAP, management made certain adjustments as required by U.S. GAAP which caused the net asset value for purposes of these financial statements to differ from the net asset value used to process shareholder transactions as of the date of these financial statements. As a result, the net asset value increased by $0.01 from $12.50 to $12.51. |
| (d) | In some periods, total returns would have been lower had certain expenses not been waived during the period. Returns shown do not reflect the deduction of taxes that a shareholder would pay on Fund distributions or the redemption of Fund shares. |
| (e) | Includes adjustments in accordance with U.S. GAAP and as such, the total return for shareholder transactions reported to the market may differ from the total return for financial reporting purposes. As a result, the total return decreased from 8.12% to 8.03%. |
| (f) | Includes adjustments in accordance with U.S. GAAP and as such, the total return for shareholder transactions reported to the market may differ from the total return for financial reporting purposes. As a result, the total return increased from 11.13% to 11.22%. |
| (g) | Effective September 1, 2015, the Adviser agreed to limit expenses to 1.15%. The Adviser agreed to limit expenses to 1.25% for the period September 1, 2014 through August 31, 2015. Prior to September 1, 2014, the Adviser agreed to limit expenses to 1.40%. (See Note 6.) |
| 38 | (855) 732-9220 seafarerfunds.com |
Seafarer Overseas Growth and Income Fund
Year Ended
April 30, 2018 | | | Year Ended
April 30, 2017 | | | Year Ended
April 30, 2016 | | | Year Ended
April 30, 2015 | | | Year Ended
April 30, 2014 | |
| $ | 12.51 | | | $ | 11.44 | | | $ | 12.64 | | | $ | 11.58 | | | $ | 11.91 | |
| | | | | | | | | | | | | | | | | | | |
| | 0.28 | | | | 0.22 | | | | 0.16 | | | | 0.14 | | | | 0.19 | |
| | 0.72 | | | | 1.04 | | | | (1.23 | ) | | | 1.26 | | | | 0.02 | |
| | 1.00 | | | | 1.26 | | | | (1.07 | ) | | | 1.40 | | | | 0.21 | |
| | | | | | | | | | | | | | | | | | | |
| | (0.37 | ) | | | (0.19 | ) | | | (0.11 | ) | | | (0.19 | ) | | | (0.26 | ) |
| | (0.03 | ) | | | – | | | | (0.02 | ) | | | (0.15 | ) | | | (0.28 | ) |
| | (0.40 | ) | | | (0.19 | ) | | | (0.13 | ) | | | (0.34 | ) | | | (0.54 | ) |
| | – | | | | 0.00 | (b) | | | 0.00 | (b) | | | 0.00 | (b) | | | 0.00 | (b) |
| | 0.60 | | | | 1.07 | | | | (1.20 | ) | | | 1.06 | | | | (0.33 | ) |
| $ | 13.11 | | | $ | 12.51 | (c) | | $ | 11.44 | | | $ | 12.64 | | | $ | 11.58 | |
| | 8.03 | %(e) | | | 11.22 | %(f) | | | (8.39 | %) | | | 12.55 | % | | | 1.93 | % |
| | | | | | | | | | | | | | | | | | | |
| $ | 894,241 | | | $ | 877,384 | | | $ | 613,795 | | | $ | 53,543 | | | $ | 27,181 | |
| | | | | | | | | | | | | | | | | | | |
| | 0.97 | % | | | 1.02 | % | | | 1.14 | % | | | 1.30 | % | | | 1.78 | % |
| | 0.97 | % | | | 1.02 | % | | | 1.14 | %(g) | | | 1.30 | %(g) | | | 1.40 | % |
| | 2.12 | % | | | 1.88 | % | | | 1.50 | % | | | 1.19 | % | | | 1.66 | % |
| | 23 | % | | | 14 | % | | | 7 | % | | | 28 | % | | | 51 | % |
See accompanying Notes to Financial Statements.
| Annual Report – April 30, 2018 | 39 |
Financial Highlights
For a share outstanding through the periods presented
| Institutional Class |
| NET ASSET VALUE, BEGINNING OF PERIOD |
| INCOME FROM OPERATIONS: |
| Net investment income(a) |
| Net realized and unrealized gain/(loss) on investments |
| Total from investment operations |
| LESS DISTRIBUTIONS: |
| From net investment income |
| From net realized gains on investments |
| Total distributions |
| REDEMPTION FEES ADDED TO PAID IN CAPITAL |
| NET INCREASE/(DECREASE) IN NET ASSET VALUE |
| NET ASSET VALUE, END OF PERIOD |
| TOTAL RETURN(c) |
| SUPPLEMENTAL DATA: |
| Net assets, end of period (in 000s) |
| RATIOS TO AVERAGE NET ASSETS: |
| Operating expenses excluding reimbursement/waiver |
| Operating expenses including reimbursement/waiver |
| Net investment income including reimbursement/waiver |
| PORTFOLIO TURNOVER RATE |
| (a) | Calculated using the average shares method. |
| (b) | Less than $0.005 per share. |
| (c) | In some periods, total returns would have been lower had certain expenses not been waived during the period. Returns shown do not reflect the deduction of taxes that a shareholder would pay on Fund distributions or the redemption of Fund shares. |
| (d) | Effective September 1, 2014, the Adviser agreed to limit expenses to 1.05%. Prior to September 1, 2014, the Adviser agreed to limit expenses to 1.25%. (See Note 6.) |
| 40 | (855) 732-9220 seafarerfunds.com |
Seafarer Overseas Growth and Income Fund
Year Ended
April 30, 2018 | | | Year Ended
April 30, 2017 | | | Year Ended
April 30, 2016 | | | Year Ended
April 30, 2015 | | | Year Ended
April 30, 2014 | |
| $ | 12.54 | | | $ | 11.46 | | | $ | 12.66 | | | $ | 11.59 | | | $ | 11.91 | |
| | | | | | | | | | | | | | | | | | | |
| | 0.28 | | | | 0.21 | | | | 0.19 | | | | 0.15 | | | | 0.21 | |
| | 0.73 | | | | 1.07 | | | | (1.26 | ) | | | 1.28 | | | | 0.02 | |
| | 1.01 | | | | 1.28 | | | | (1.07 | ) | | | 1.43 | | | | 0.23 | |
| | | | | | | | | | | | | | | | | | | |
| | (0.38 | ) | | | (0.20 | ) | | | (0.12 | ) | | | (0.21 | ) | | | (0.27 | ) |
| | (0.03 | ) | | | – | | | | (0.02 | ) | | | (0.15 | ) | | | (0.28 | ) |
| | (0.41 | ) | | | (0.20 | ) | | | (0.14 | ) | | | (0.36 | ) | | | (0.55 | ) |
| | – | | | | 0.00 | (b) | | | 0.01 | | | | 0.00 | (b) | | | 0.00 | (b) |
| | 0.60 | | | | 1.08 | | | | (1.20 | ) | | | 1.07 | | | | (0.32 | ) |
| $ | 13.14 | | | $ | 12.54 | | | $ | 11.46 | | | $ | 12.66 | | | $ | 11.59 | |
| | 8.08 | % | | | 11.37 | % | | | (8.32 | %) | | | 12.76 | % | | | 2.12 | % |
| | | | | | | | | | | | | | | | | | | |
| $ | 2,134,051 | | | $ | 1,500,310 | | | $ | 605,178 | | | $ | 129,714 | | | $ | 46,624 | |
| | | | | | | | | | | | | | | | | | | |
| | 0.87 | % | | | 0.92 | % | | | 1.03 | % | | | 1.18 | % | | | 1.61 | % |
| | 0.87 | % | | | 0.92 | % | | | 1.03 | % | | | 1.10 | %(d) | | | 1.25 | % |
| | 2.09 | % | | | 1.82 | % | | | 1.72 | % | | | 1.30 | % | | | 1.89 | % |
| | 23 | % | | | 14 | % | | | 7 | % | | | 28 | % | | | 51 | % |
See accompanying Notes to Financial Statements.
| Annual Report – April 30, 2018 | 41 |
| Financial Highlights | Seafarer Overseas Value Fund |
For a share outstanding through the period presented
| Investor Class | | Year Ended
April 30, 2018 | | | May 31, 2016 (Inception)
to April 30, 2017 | |
| NET ASSET VALUE, BEGINNING OF PERIOD | | $ | 11.30 | | | $ | 10.00 | |
| INCOME FROM OPERATIONS: | | | | | | | | |
| Net investment income(a) | | | 0.35 | | | | 0.12 | |
| Net realized and unrealized gain on investments | | | 0.72 | | | | 1.28 | |
| Total from investment operations | | | 1.07 | | | | 1.40 | |
| LESS DISTRIBUTIONS: | | | | | | | | |
| From net investment income | | | (0.42 | ) | | | (0.10 | ) |
| Total distributions | | | (0.42 | ) | | | (0.10 | ) |
| NET INCREASE IN NET ASSET VALUE | | | 0.65 | | | | 1.30 | |
| NET ASSET VALUE, END OF PERIOD | | $ | 11.95 | | | $ | 11.30 | |
| TOTAL RETURN(b) | | | 9.55 | % | | | 14.15 | % |
| SUPPLEMENTAL DATA: | | | | | | | | |
| Net assets, end of period (in 000s) | | $ | 311 | | | $ | 280 | |
| RATIOS TO AVERAGE NET ASSETS: | | | | | | | | |
| Operating expenses excluding reimbursement/waiver | | | 1.80 | % | | | 3.71 | %(c) |
| Operating expenses including reimbursement/waiver | | | 1.15 | % | | | 1.15 | %(c) |
| Net investment income including reimbursement/waiver | | | 2.91 | % | | | 1.24 | %(c) |
| PORTFOLIO TURNOVER RATE(d) | | | 3 | % | | | 0 | % |
| (a) | Calculated using the average shares method. |
| (b) | Total returns are for the periods indicated and have not been annualized. Total returns would have been lower had certain expenses not been waived during the periods. Returns shown do not reflect the deduction of taxes that a shareholder would pay on Fund distributions or the redemption of Fund shares. |
| (d) | Portfolio turnover rate for periods less than one full year have not been annualized. |
See accompanying Notes to Financial Statements.
| 42 | (855) 732-9220 seafarerfunds.com |
| Financial Highlights | Seafarer Overseas Value Fund |
For a share outstanding through the period presented
| Institutional Class | | Year Ended
April 30, 2018 | | | May 31, 2016 (Inception)
to April 30, 2017 | |
| NET ASSET VALUE, BEGINNING OF PERIOD | | $ | 11.28 | | | $ | 10.00 | |
| INCOME FROM OPERATIONS: | | | | | | | | |
| Net investment income(a) | | | 0.35 | | | | 0.13 | |
| Net realized and unrealized gain on investments | | | 0.74 | | | | 1.28 | |
| Total from investment operations | | | 1.09 | | | | 1.41 | |
| LESS DISTRIBUTIONS: | | | | | | | | |
| From net investment income | | | (0.41 | ) | | | (0.13 | ) |
| Total distributions | | | (0.41 | ) | | | (0.13 | ) |
| NET INCREASE IN NET ASSET VALUE | | | 0.68 | | | | 1.28 | |
| NET ASSET VALUE, END OF PERIOD | | $ | 11.96 | | | $ | 11.28 | (b) |
| TOTAL RETURN(c) | | | 9.74 | %(d) | | | 14.18 | %(e) |
| SUPPLEMENTAL DATA: | | | | | | | | |
| Net assets, end of period (in 000s) | | $ | 25,291 | | | $ | 9,846 | |
| RATIOS TO AVERAGE NET ASSETS: | | | | | | | | |
| Operating expenses excluding reimbursement/waiver | | | 1.76 | % | | | 3.63 | %(f) |
| Operating expenses including reimbursement/waiver | | | 1.05 | % | | | 1.05 | %(f) |
| Net investment income including reimbursement/waiver | | | 2.90 | % | | | 1.36 | %(f) |
| PORTFOLIO TURNOVER RATE(g) | | | 3 | % | | | 0 | % |
| (a) | Calculated using the average shares method. |
| (b) | In preparing the financial statements in accordance with U.S. GAAP, management made certain adjustments as required by U.S. GAAP which caused the net asset value for purposes of these financial statements to differ from the net asset value used to process shareholder transactions as of the date of these financial statements. As a result, the net asset value decreased by $0.01 from $11.29 to $11.28. |
| (c) | Total returns are for the periods indicated and have not been annualized. Total returns would have been lower had certain expenses not been waived during the periods. Returns shown do not reflect the deduction of taxes that a shareholder would pay on Fund distributions or the redemption of Fund shares. |
| (d) | Includes adjustments in accordance with U.S. GAAP and as such, the total return for shareholder transactions reported to the market may differ from the total return for financial reporting purposes. As a result, the total return increased from 9.64% to 9.74%. |
| (e) | Includes adjustments in accordance with U.S. GAAP and as such, the total return for shareholder transactions reported to the market may differ from the total return for financial reporting purposes. As a result, the total return decreased from 14.29% to 14.18%. |
| (g) | Portfolio turnover rate for periods less than one full year have not been annualized. |
See accompanying Notes to Financial Statements.
| Annual Report – April 30, 2018 | 43 |
| Seafarer Funds | Notes to Financial Statements |
April 30, 2018
NOTES TO FINANCIAL STATEMENTS
1. Organization
Financial Investors Trust (the “Trust”), a Delaware statutory trust, is an open-end management investment company registered under the Investment Company Act of 1940, as amended (“1940 Act”). The Trust consists of multiple separate portfolios or series. This annual report describes the Seafarer Overseas Growth and Income Fund and the Seafarer Overseas Value Fund (individually a “Fund” and collectively, the “Funds”). The Seafarer Overseas Growth and Income Fund seeks to provide long-term capital appreciation along with some current income; it also seeks to mitigate adverse volatility in returns as a secondary objective. The Seafarer Overseas Value Fund seeks to provide long-term capital appreciation. The Funds each offer Investor Class and Institutional Class shares.
2. Significant Accounting Policies
The accompanying financial statements were prepared in accordance with accounting principles generally accepted in the United States of America (“U.S. GAAP”). The preparation of financial statements in conformity with U.S. GAAP requires management to make certain estimates and assumptions that affect the reported amounts of assets and liabilities and disclosures of contingent assets and liabilities at the date of the financial statements and the reported amounts of revenue and expenses during the period. Actual results could differ from those estimates. The Funds are considered an investment company for financial reporting purposes under U.S. GAAP and follow the accounting and reporting guidance applicable to investment companies in the Financial Accounting Standards Board Accounting Standards Codification Topic 946.The following is a summary of significant accounting policies consistently followed by the Funds in preparation of their financial statements.
Investment Valuation
Each Fund generally values its securities based on market prices determined at the close of regular trading on the New York Stock Exchange (“NYSE”), normally 4:00 p.m. Eastern Time, on each day the NYSE is open for trading.
For equity securities and exchange traded funds, the market price is usually the closing sale or official closing price on that exchange. In the case of equity securities not traded on an exchange, or if such closing prices are not otherwise available, the securities are valued at the mean of the most recent bid and ask prices on such day. Redeemable securities issued by open-end registered investment companies are valued at the investment company’s applicable net asset value, with the exception of exchange-traded open-end investment companies, which are priced as equity securities.
Equity securities that are primarily traded on foreign securities exchanges are valued at the closing values of such securities on their respective foreign exchanges, except when an event occurs subsequent to the close of the foreign exchange but before the close of the NYSE, such that the securities’ value would likely change. In such an event, the fair values of those securities are determined in good faith through consideration of other factors in accordance with procedures established by and under the general supervision of the Board of Trustees (the “Board”). Each Fund uses a fair valuation model provided by an independent pricing service, which is intended to reflect fair value when a security’s value or a meaningful portion of the Fund’s portfolio is believed to have been materially affected by a valuation event that has occurred between the close of the exchange or market on which the security is traded and the close of the regular trading day on the NYSE. The Funds’ valuation procedures set forth certain triggers that inform each Fund when to use the fair valuation model.
The market price for debt obligations is generally the price supplied by an independent third-party pricing service approved by the Board, which may use a matrix, formula or other objective method that takes into consideration quotations from dealers, market transactions in comparable investments, market indices and yield curves. If vendors are unable to supply a price, or if the price supplied is deemed to be unreliable, the market price may be determined using quotations received from one or more broker-dealers that make a market in the security. Corporate bonds and convertible bonds are valued using market models that
| 44 | (855) 732-9220 seafarerfunds.com |
| Seafarer Funds | Notes to Financial Statements |
April 30, 2018
consider trade data, quotations from dealers and active market makers, relevant yield curve and spread data, creditworthiness, trade data or market information on comparable securities, and other relevant security specific information. Publicly traded foreign government debt securities and foreign corporate bonds are typically traded internationally in the over-the-counter market and are valued at the mean between the bid and asked prices as of the close of business of that market.
Forward currency exchange contracts have a market value determined by the prevailing foreign currency exchange daily rates and current foreign currency exchange forward rates. The foreign currency exchange forward rates are calculated using an automated system that estimates rates on the basis of the current day foreign currency exchange rates and forward foreign currency exchange rates supplied by a pricing service.
When such prices or quotations are not available, or when the Trust’s Valuation Committee believes that they are unreliable, securities may be priced using fair value procedures approved by the Board.
Certain foreign countries impose a tax on capital gains which is accrued by each Fund based on unrealized appreciation, if any, on affected securities. The tax is paid when the gain is realized.
Fair Value Measurements
Each Fund discloses the classification of its fair value measurements following a three-tier hierarchy based on the inputs used to measure fair value. Inputs refer broadly to the assumptions that market participants would use in pricing the asset or liability, including assumptions about risk. Inputs may be observable or unobservable. Observable inputs reflect the assumptions market participants would use in pricing the asset or liability. Such inputs are developed based on market data obtained from sources independent of the reporting entity. Unobservable inputs reflect the reporting entity’s own assumptions about the assumptions market participants would use in pricing the asset or liability, which are developed based on the information available and the reporting entity’s best efforts to interpret such information.
Various inputs are used in determining the value of the Funds’ investments as of the end of the reporting period. When inputs used fall into different levels of the fair value hierarchy, the level in the hierarchy within which the fair value measurement falls is determined based on the lowest level input that is significant to the fair value measurement in its entirety. The designated input levels are not necessarily an indication of the risk or liquidity associated with these investments. These inputs are categorized in the following hierarchy under applicable financial accounting standards:
| Level 1 – | Unadjusted quoted prices in active markets for identical investments, unrestricted assets or liabilities that the Funds have the ability to access at the measurement date; |
| Level 2 – | Quoted prices which are not active, quoted prices for similar assets or liabilities in active markets or inputs other than quoted prices that are observable (either directly or indirectly) for substantially the full term of the asset or liability; and |
| Level 3 – | Significant unobservable prices or inputs (including the Funds’ own assumptions in determining the fair value of investments) where there is little or no market activity for the asset or liability at the measurement date. |
| Annual Report – April 30, 2018 | 45 |
| Seafarer Funds | Notes to Financial Statements |
April 30, 2018
The following is a summary of the inputs used to value each Fund as of April 30, 2018:
| Investments in Securities at Value(a) | | Level 1 -
Quoted Prices | | | Level 2 -
Other Significant Observable Inputs | | | Level 3 -
Significant
Unobservable Inputs | | | Total | |
| Seafarer Overseas Growth and Income Fund | | | | | | | | | | | | | | | | |
| Common Stocks | | | | | | | | | | | | | | | | |
| China / Hong Kong | | $ | 24,892,816 | | | $ | 553,780,240 | | | $ | – | | | $ | 578,673,056 | |
| Hungary | | | – | | | | 113,583,208 | | | | – | | | | 113,583,208 | |
| India | | | 120,156,000 | | | | 89,783,359 | | | | – | | | | 209,939,359 | |
| Indonesia | | | – | | | | 105,749,126 | | | | – | | | | 105,749,126 | |
| Japan | | | – | | | | 38,995,086 | | | | – | | | | 38,995,086 | |
| Malaysia | | | – | | | | 12,104,902 | | | | – | | | | 12,104,902 | |
| Poland | | | – | | | | 79,382,347 | | | | – | | | | 79,382,347 | |
| Singapore | | | – | | | | 242,204,321 | | | | – | | | | 242,204,321 | |
| South Africa | | | – | | | | 104,546,682 | | | | – | | | | 104,546,682 | |
| South Korea | | | 22,658,115 | | | | 447,831,870 | | | | – | | | | 470,489,985 | |
| Taiwan | | | 18,330,614 | | | | 285,267,283 | | | | – | | | | 303,597,897 | |
| Vietnam | | | – | | | | 26,333,506 | | | | – | | | | 26,333,506 | |
| Other | | | 195,492,572 | | | | – | | | | – | | | | 195,492,572 | |
| Preferred Stocks | | | | | | | | | | | | | | | | |
| South Korea | | | – | | | | 103,372,209 | | | | – | | | | 103,372,209 | |
| Other | | | 51,450,000 | | | | – | | | | – | | | | 51,450,000 | |
| Corporate Bond - Foreign Currency | | $ | – | | | $ | 40,045,236 | | | $ | – | | | $ | 40,045,236 | |
| Corporate Bond - USD | | | – | | | | 9,600,000 | | | | – | | | | 9,600,000 | |
| Government Bond, Medium/Long-term - Foreign Currency | | | – | | | | 56,384,565 | | | | – | | | | 56,384,565 | |
| Government Bond, Short-term - USD and Foreign Currency | | | – | | | | 78,667,614 | | | | – | | | | 78,667,614 | |
| Total | | $ | 432,980,117 | | | $ | 2,387,631,554 | | | $ | – | | | $ | 2,820,611,671 | |
| Investments in Securities at Value(a) | | Level 1 -
Quoted Prices | | | Level 2 -
Other Significant Observable Inputs | | | Level 3 -
Significant
Unobservable
Inputs | | | Total | |
| Seafarer Overseas Value Fund | | | | | | | | | | | | |
| Common Stocks | | | | | | | | | | | | | | | | |
| China / Hong Kong | | $ | 1,928,525 | | | $ | 9,620,366 | | | $ | – | | | $ | 11,548,891 | |
| Philippines | | | – | | | | 347,818 | | | | – | | | | 347,818 | |
| Singapore | | | – | | | | 2,442,116 | | | | – | | | | 2,442,116 | |
| South Korea | | | – | | | | 902,483 | | | | – | | | | 902,483 | |
| 46 | (855) 732-9220 seafarerfunds.com |
| Seafarer Funds | Notes to Financial Statements |
April 30, 2018
| Taiwan | | | – | | | | 622,786 | | | | – | | | | 622,786 | |
| United Arab Emirates | | | – | | | | 835,431 | | | | – | | | | 835,431 | |
| Vietnam | | | – | | | | 1,098,128 | | | | – | | | | 1,098,128 | |
| Other | | | 4,039,096 | | | | – | | | | – | | | | 4,039,096 | |
| Total | | $ | 5,967,621 | | | $ | 15,869,128 | | | $ | – | | | $ | 21,836,749 | |
| (a) | For detailed descriptions of securities by country, see the accompanying Portfolio of Investments. |
The Funds recognize transfers between levels as of the end of the period. For the year ended April 30, 2018, the Funds did not have any securities that used significant unobservable inputs (Level 3) in determining fair value.
| Seafarer Overseas Growth and Income Fund | | Level 1 - Quoted and
Unadjusted Prices | | | Level 2 - Other Significant
Observable Inputs | |
| | Transfer In | | | Transfers (Out) | | | Transfer In | | | Transfers (Out) | |
| Common Stocks | | $ | – | | | $ | (1,717,217,108 | ) | | $ | 1,717,217,108 | | | $ | – | |
| Total | | $ | – | | | $ | (1,717,217,108 | ) | | $ | 1,717,217,108 | | | $ | – | |
| Seafarer Overseas Value Fund | | Level 1 - Quoted and
Unadjusted Prices | | | Level 2 - Other Significant
Observable Inputs | |
| | Transfer In | | | Transfers (Out) | | | Transfer In | | | Transfers (Out) | |
| Common Stocks | | $ | – | | | $ | (14,987,749 | ) | | $ | 14,987,749 | | | $ | – | |
| Total | | $ | – | | | $ | (14,987,749 | ) | | $ | 14,987,749 | | | $ | – | |
Each Fund utilizes a fair value evaluation service with respect to international securities with an earlier market closing than the Fund’s net asset value computation cutoff. When events trigger the use of the fair value evaluation service on a reporting period date, it results in certain securities transferring from a Level 1 to a Level 2 classification. The transfer amounts disclosed in the table above represent the value of the securities as of April 30, 2018 transferred in/(out) of Level 1 and Level 2 during the reporting year that were also held at April 30, 2017. The above transfers from Level 1 to Level 2 also include securities that were not able to obtain a closing market price due to an inactive market to trade.
Investment Transactions and Investment Income
Investment transactions are accounted for on the date the investments are purchased or sold (trade date). Realized gains and losses from investment transactions are reported on an identified cost basis. Interest income, which includes accretion of discounts and amortization of premiums, is accrued and recorded as earned. Dividend income is recognized on the ex-dividend date or for certain foreign securities, as soon as information is available to the Funds. All of the realized and unrealized gains and losses and net investment income are allocated daily to each share class in proportion to its average daily net assets.
Cash Management Transactions
Each of the Funds subscribes to the Brown Brothers Harriman & Co. (“BBH”) Cash Management Service (“CMS”), whereby cash balances are automatically swept into overnight offshore demand deposits with either the BBH Grand Cayman branch or a branch of a pre-approved commercial bank. This fully automated program allows the Funds to earn interest on cash balances. Excess cash with deposit institutions domiciled outside of the U.S. are subject to sovereign actions in the jurisdiction of the deposit institution including, but not limited to, freeze, seizure or diminution. Cash balances in the BBH CMS are included on the Statements of Assets and Liabilities under Cash and Foreign Currency, at value. As of April 30, 2018, the Funds had the following cash balances participating in the BBH CMS:
| Fund | | | |
| Seafarer Overseas Growth and Income Fund | | $ | 210,380,801 | |
| Seafarer Overseas Value Fund | | | 3,593,250 | |
| Annual Report – April 30, 2018 | 47 |
| Seafarer Funds | Notes to Financial Statements |
April 30, 2018
As of April 30, 2018, the Funds had the following foreign cash balances participating in the BBH CMS (cost and value of foreign cash balances are equal):
| Fund | | | | |
| Seafarer Overseas Growth and Income Fund | | $ | – | |
| Seafarer Overseas Value Fund | | | – | |
Foreign Securities
The Funds may directly purchase securities of foreign issuers. Investing in securities of foreign issuers involves special risks not typically associated with investing in securities of U.S. issuers. The risks include possible revaluation of currencies, the inability to repatriate foreign currency, less complete financial information about companies, and possible future adverse political and economic developments. Moreover, securities of many foreign issuers and their markets may be less liquid and their prices more volatile than those of securities of comparable U.S. issuers.
Foreign Currency Translation
The books and records of the Funds are maintained in U.S. dollars. Investment valuations and other assets and liabilities initially expressed in foreign currencies are converted each business day into U.S. dollars based upon current exchange rates. Prevailing foreign exchange rates may generally be obtained at the close of the NYSE (normally, 4:00 p.m. Eastern time). The portion of realized and unrealized gains or losses on investments due to fluctuations in foreign currency exchange rates is not separately disclosed and is included in realized and unrealized gains or losses on investments, when applicable.
Foreign Currency Spot Contracts
Each Fund may enter into foreign currency spot contracts to facilitate transactions in foreign securities or to convert foreign currency receipts into U.S. dollars. A foreign currency spot contract is an agreement between two parties to buy and sell currencies at the current market rate, for settlement generally within two business days. The U.S. dollar value of a contract is determined using current currency exchange rates supplied by a pricing service. The contract is marked-to-market daily for settlements beyond one day and any change in market value is recorded as an unrealized gain or loss. When the contract is closed, the Fund records a realized gain or loss equal to the difference between the value on the open and close date. Losses may arise from changes in the value of the foreign currency, or if the counterparties do not perform under the contract’s terms. The maximum potential loss from such contracts is the aggregate face value in U.S. dollars at the time the contract was opened.
Trust Expenses
Some expenses of the Trust can be directly attributed to the Funds. Expenses which cannot be directly attributed to the Funds are apportioned among all funds in the Trust based on the average daily net assets of each fund.
Fund and Class Expenses
Expenses that are specific to a Fund or class of shares of a Fund, including shareholder servicing fees, are charged directly to that Fund or share class. Expenses that are common to all Funds are generally allocated among the Funds in proportion to their average daily net assets.
Offering Costs
Offering costs, including costs of printing initial prospectuses, legal and registration fees, are being amortized over twelve months from the inception date of the Seafarer Overseas Value Fund. Amounts amortized during the year ended April 30, 2018 for the Seafarer Overseas Value Fund are shown on the Statements of Operations. As of April 30, 2018, all offering costs have been amortized for the Seafarer Overseas Value Fund.
| 48 | (855) 732-9220 seafarerfunds.com |
| Seafarer Funds | Notes to Financial Statements |
April 30, 2018
Federal Income Taxes
Each Fund complies with the requirements under Subchapter M of the Internal Revenue Code of 1986, as amended, applicable to regulated investment companies and intends to distribute substantially all of its net taxable income and net capital gains, if any, each year so that it will not be subject to excise tax on undistributed income and gains. The Funds are not subject to income taxes to the extent such distributions are made.
As of and during the year ended April 30, 2018, the Funds did not have a liability for any unrecognized tax benefits. The Funds file U.S. federal, state, and local tax returns as required. The Funds’ tax returns are subject to examination by the relevant tax authorities until expiration of the applicable statute of limitations, which is generally three years after the filing of the tax return for federal purposes and four years for most state returns. Tax returns for open years have incorporated no uncertain tax positions that require a provision for income taxes.
Distributions to Shareholders
In general, the Seafarer Overseas Growth and Income Fund’s policy is to distribute to its shareholders substantially all net investment income, paid out via two semi-annual dividends, in June and December. The Seafarer Overseas Value Fund’s policy is to distribute to its shareholders substantially all net investment income via one annual dividend in December. It is also each Fund’s policy to distribute annually all net realized short-term and long-term capital gains, if any, after offsetting any capital loss carryovers. Income dividend distributions are derived from dividends and other income each Fund receives from its investments, including short-term capital gains. Long-term capital gain distributions are derived from gains realized when a Fund sells a security it has owned for more than one year. Each Fund may make additional distributions if Seafarer Capital Partners, LLC (the “Adviser”) believes doing so may be necessary for the Fund to avoid or reduce taxes.
3. Tax Basis Information
Reclassifications
As of April 30, 2018, permanent differences in book and tax accounting were reclassified. These differences had no effect on net assets and were primarily attributed to organizational costs, equalization, PFICs and foreign currency. The reclassifications were as follows:
| | | Paid-in Capital | | | Accumulated Net Investment Income/(Loss) | | | Accumulated Net Realized Gain/(Loss) | |
| Seafarer Overseas Growth and Income Fund | | $ | 6,375,277 | | | $ | (5,214,040 | ) | | $ | (1,161,237 | ) |
| Seafarer Overseas Value Fund | | $ | 7,586 | | | $ | (8,533 | ) | | $ | 947 | |
| Annual Report – April 30, 2018 | 49 |
| Seafarer Funds | Notes to Financial Statements |
April 30, 2018
Tax Basis of Investments
As of April 30, 2018, the aggregate cost of investments, gross unrealized appreciation/(depreciation) and net unrealized appreciation for Federal tax purposes was as follows:
| | | Cost of Investments | | | Gross
Unrealized Appreciation | | | Gross
Unrealized Depreciation | | | Net
Appreciation/ (Depreciation)
on Foreign Currencies | | | Net Unrealized Appreciation | |
| Seafarer Overseas Growth and Income Fund | | $ | 2,648,534,245 | | | $ | 334,769,669 | | | $ | (162,692,243 | ) | | $ | (1,087,324 | ) | | $ | 170,990,102 | |
| Seafarer Overseas Value Fund | | | 20,828,984 | | | | 2,743,760 | | | | (1,735,995 | ) | | | (447 | ) | | | 1,007,318 | |
Components of Distributable Earnings
As of April 30, 2018, components of distributable earnings were as follows:
| Seafarer Overseas Growth and Income Fund | | | |
| Accumulated net investment income | | $ | 2,805,167 | |
| Accumulated net realized gain | | | 130,795,114 | |
| Net unrealized appreciation on investments | | | 170,990,102 | |
| Total distributable earnings | | $ | 304,590,383 | |
| | | | | |
| Seafarer Overseas Value Fund | | | | |
| Accumulated net investment income | | $ | 87,456 | |
| Accumulated net realized gain | | | 62,777 | |
| Net unrealized appreciation on investments | | | 1,007,318 | |
| Total distributable earnings | | $ | 1,157,551 | |
Capital Losses
Capital Loss carryovers used during the fiscal year ended April 30, 2018 were as follows:
| Fund | | Amount | |
| Seafarer Overseas Growth and Income Fund | | $ | (18,700,308 | ) |
| Seafarer Overseas Value Fund | | | (4 | ) |
Tax Basis of Distributions to Shareholders
The character of distributions made during the year from net investment income or net realized gains may differ from the ultimate characterization for federal income tax purposes. Also, due to the timing of dividend distributions, the fiscal year in which amounts are distributed may differ from the fiscal year in which the income or realized gain is recorded by a Fund.
| 50 | (855) 732-9220 seafarerfunds.com |
| Seafarer Funds | Notes to Financial Statements |
April 30, 2018
The tax character of distributions paid by the Funds for the fiscal year ended April 30, 2018 was as follows:
| | | Ordinary Income | | | Long-Term Capital Gain | |
| Seafarer Overseas Growth and Income Fund | | $ | 80,952,386 | | | $ | 6,334,481 | |
| Seafarer Overseas Value Fund | | | 648,226 | | | | – | |
The tax character of distributions paid by the Funds for the fiscal year or period ended April 30, 2017 was as follows:
| | | Ordinary Income | | | Long-Term Capital Gain | |
| Seafarer Overseas Growth and Income Fund | | $ | 27,085,171 | | | $ | – | |
| Seafarer Overseas Value Fund | | | 62,391 | | | | – | |
4. Securities Transactions
The cost of purchases and proceeds from sales of securities excluding short-term securities during the fiscal year ended April 30, 2018 were as follows:
| | | Purchases of Securities | | | Proceeds from Sales of Securities | |
| Seafarer Overseas Growth and Income Fund | | $ | 995,643,314 | | | $ | 627,703,901 | |
| Seafarer Overseas Value Fund | | | 13,543,012 | | | | 432,870 | |
5. Shares of Beneficial Interest
The capitalization of the Trust consists of an unlimited number of shares of beneficial interest with no par value per share. Holders of shares of the Funds of the Trust have one vote for each share held and a proportionate fraction of a vote for each fractional share. All shares issued and outstanding are fully paid and are transferable and redeemable at the option of the shareholder. Purchasers of the shares do not have any obligation to make payments to the Trust or its creditors solely by reason of the purchasers’ ownership of the shares. Shares have no pre-emptive rights.
Prior to August, 31, 2016, shares redeemed within 90 days of purchase may incur a 2% short-term redemption fee deducted from the redemption amount. The redemption fee is reflected in the “Shares redeemed, net of redemption fees” in the Statements of Changes in Net Assets. Effective August 31, 2016, the Funds no longer impose a redemption fee. For the year ended April 30, 2017, the Seafarer Overseas Growth and Income Fund retained redemption fees in the amount of $40,363 for the Investor Class and $49,013 for the Institutional Class. For the year ended April 30, 2018 the Funds retained no redemption fees.
6. Management and Related Party Transactions
The Adviser, subject to the authority of the Board, is responsible for the overall management and administration of the Funds’ business affairs. The Adviser manages the investments of the Funds in accordance with the Funds’ investment objectives, policies, limitations and investment guidelines established jointly by the Adviser and the Trustees. Pursuant to the investment advisory agreement, the Funds, in the aggregate, pay the Adviser an annual management fee of 0.75% of the aggregate average daily net assets of the Funds up to $1.5 billion and 0.70% of the aggregate average daily net assets of the Funds over $1.5 billion. Each Fund pays the Adviser a monthly fee at the annual rate using the applicable management fee calculated based on the Fund’s pro rata share of the Funds’ combined average daily net assets. Prior to August 31, 2016, the Funds paid the Adviser an annual management
| Annual Report – April 30, 2018 | 51 |
| Seafarer Funds | Notes to Financial Statements |
April 30, 2018
fee of 0.75% of the aggregate average daily net assets of the Funds. The management fee is paid on a monthly basis.
Effective September 1, 2014, the Adviser contractually agreed to limit certain Fund expenses (excluding brokerage expenses, interest expenses, taxes and extraordinary expenses) to 1.25% and 1.05% of the Funds’ average daily net assets in the Investor and Institutional share classes, respectively, through August 31, 2015. Effective September 1, 2015, the Adviser contractually agreed to waive and/or reimburse fees or expenses in order to limit Total Annual Fund Operating Expenses After Fee Waiver / Expense Reimbursements (excluding brokerage expenses, interest expenses, taxes and extraordinary expenses) to 1.15% and 1.05% of the Funds’ average daily net assets for the Investor and Institutional share classes respectively. This agreement (the “Expense Agreement”) is in effect through August 31, 2018. The Adviser will be permitted to recover, on a class-by-class basis, expenses it has borne through the Expense Agreement to the extent that the Funds’ expenses in later periods fall below the expense cap in effect at the time of waiver or reimbursement. The Funds will not be obligated to pay any such deferred fees and expenses more than three years after the date of the waiver. This agreement may not be terminated or modified prior to August 31, 2018, except with the approval of the Funds’ Board. During the year ended April 30, 2018, the Adviser agreed that it will only seek to recoup waived management fees and will not recoup any reimbursed expenses. As of April 30, 2018, the Adviser has recouped all available waived management fees from the Seafarer Overseas Growth and Income Fund.
For the year ended April 30, 2018, the fee waivers and/or reimbursements were as follows for the Seafarer Overseas Value Fund:
| Fund | | Fees Waived/ Reimbursed By Adviser | |
| Seafarer Overseas Value Fund | | | |
| Investor Class | | $ | 2,019 | |
| Institutional Class | | | 123,476 | |
As of April 30, 2018, the balances of recoupable expenses for each class were as follows for the Funds:
| Fund | | Expires 2020 | | | Expires 2021 | | | Total | |
| Seafarer Overseas Growth and Income Fund | | | | | | | | | | | | |
| Investor Class | | $ | – | | | $ | – | | | $ | – | |
| Institutional Class | | | – | | | | – | | | | – | |
| Seafarer Overseas Value Fund | | | | | | | | | | | | |
| Investor Class | | $ | 1,168 | | | | 1,723 | | | $ | 2,891 | |
| Institutional Class | | | 34,396 | | | | 108,082 | | | | 142,478 | |
Fund Administrator
ALPS Fund Services, Inc. (“ALPS” and the “Administrator”) (an affiliate of ALPS Distributors, Inc.) provides administrative, fund accounting and other services to the Funds under the Administration, Bookkeeping and Pricing Services Agreement with the Trust.
The Funds’ administrative fee is accrued on a daily basis and paid monthly. The Administrator is also reimbursed by the Funds for certain out-of-pocket expenses. Administration fees paid by the Funds for the year ended April 30, 2018 are disclosed in the Statements of Operations.
| 52 | (855) 732-9220 seafarerfunds.com |
| Seafarer Funds | Notes to Financial Statements |
April 30, 2018
Transfer Agent
ALPS serves as transfer, dividend paying and shareholder servicing agent for the Funds (“Transfer Agent”). ALPS is paid an annual base fee per Fund and a fee based on the number of shareholder accounts. The Transfer Agent is also reimbursed by the Funds for certain out-of-pocket expenses. Transfer agent fees paid by the Funds for the year ended April 30, 2018 are disclosed in the Statements of Operations.
Compliance Services
ALPS provides compliance services to the Funds under the Chief Compliance Officer Services Agreement with the Trust. ALPS provides services that assist the Trust’s chief compliance officer in monitoring and testing the policies and procedures of the Trust in accordance with the requirements of Rule 38a-1 under the 1940 Act. ALPS is paid an annual base fee and is reimbursed for certain out-of-pocket expenses. Compliance service fees paid by the Funds for the year ended April 30, 2018 are disclosed in the Statements of Operations.
Principal Financial Officer
ALPS provides principal financial officer services to the Funds under the Principal Financial Officer Services Agreement with the Trust. Under this Agreement, ALPS is paid an annual base fee and is reimbursed for certain out-of-pocket expenses. Principal financial officer fees paid by the Funds for the year ended April 30, 2018 are disclosed in the Statements of Operations.
Distributor
ALPS Distributors, Inc. (“ADI” or the “Distributor”) (an affiliate of ALPS) acts as the distributor of the Funds’ shares pursuant to the Distribution Agreement with the Trust. Under a side letter agreement, the Adviser pays ADI an annual base fee of $12,000 per Fund for the distribution services. The Adviser also reimburses ADI for certain out-of-pocket expenses. Shares are sold on a continuous basis by ADI as agent for the Funds, and ADI has agreed to use its best efforts to solicit orders for the sale of the Funds’ shares, although it is not obliged to sell any particular amount of shares. ADI is registered as a broker-dealer with the U.S. Securities and Exchange Commission.
Shareholder Service Plan for Investor Class and Institutional Class Shares
Each Fund has adopted a Shareholder Services Plan (a “Services Plan”) for each of its share classes. Under the Services Plan, each Fund is authorized to enter into shareholder service agreements with investment advisers, financial institutions and other service providers (“Participating Organizations”) to maintain and provide certain administrative and servicing functions in relation to the accounts of shareholders. Shareholder service arrangements typically include processing orders for shares, generating account and confirmation statements, sub-accounting, account maintenance, tax reporting, and disbursing cash dividends as well as other investment or administrative services required for the particular Participating Organizations’ products, programs, platform and accounts. The Services Plan will cause each Fund to pay an aggregate fee, not to exceed on an annual basis 0.15% and 0.05% of the average daily net asset value of the Investor and Institutional share classes, respectively. Such payments will be made on assets attributable to or held in the name of a Participating Organization, on behalf of its clients as compensation for providing service activities pursuant to an agreement with the Participating Organization. Any amount of such payment not paid to a Participating Organization during a Fund’s fiscal year for such service activities shall be reimbursed to the Fund as soon as practicable, after the end of the fiscal year. Shareholder service plan fees paid by the Funds for the year ended April 30, 2018 are disclosed in the Statements of Operations.
| Annual Report – April 30, 2018 | 53 |
| Seafarer Funds | Notes to Financial Statements |
April 30, 2018
7. Indemnifications
Under the Trust’s organizational documents, its officers and Trustees are indemnified against certain liability arising out of the performance of their duties to the Trust. Additionally, in the normal course of business, the Trust enters into contracts with service providers that may contain general indemnification clauses, which may permit indemnification to the extent permissible under the applicable law. The Trust’s maximum exposure under these arrangements is unknown, as this would involve future claims that may be made against the Trust that have not yet occurred.
| 54 | (855) 732-9220 seafarerfunds.com |
| Seafarer Funds | Report of Independent Registered Public Accounting Firm |
April 30, 2018
To the Shareholders and the Board of Trustees of Financial Investors Trust:
Opinion on the Financial Statements and Financial Highlights
We have audited the accompanying statements of assets and liabilities, including the portfolios of investments, of Seafarer Overseas Growth and Income Fund and Seafarer Overseas Value Fund (the “Funds”), two of the funds constituting the Financial Investors Trust, as of April 30, 2018; the related statement of operations for the year then ended, the statements of changes in net assets for each of the two years in the period then ended, the financial highlights for each of the five years in the period then ended for Seafarer Overseas Growth and Income Fund; the related statement of operations for the year ended April 30, 2018, and the statements of changes in net assets and financial highlights for the year ended April 30, 2018, and for the period from May 31, 2016 (commencement of operations) through April 30, 2017 for Seafarer Overseas Value Fund; and the related notes.
In our opinion, the financial statements and financial highlights present fairly, in all material respects, the financial position of Seafarer Overseas Growth and Income Fund as of April 30, 2018, and the results of its operations for the year then ended, the changes in its net assets for each of the two years in the period then ended, and the financial highlights for each of the five years in the period then ended in conformity with accounting principles generally accepted in the United States of America. Also, in our opinion, the financial statements and financial highlights present fairly, in all material respects, the financial position of Seafarer Overseas Value Fund as of April 30, 2018, and the results of its operations for the year then ended, and the changes in its net assets and financial highlights for the year ended April 30, 2018 and for the period from May 31, 2016 (commencement of operations) through April 30, 2017 in conformity with accounting principles generally accepted in the United States of America.
Basis for Opinion
These financial statements and financial highlights are the responsibility of the Funds’ management. Our responsibility is to express an opinion on the Funds’ financial statements and financial highlights based on our audits. We are a public accounting firm registered with the Public Company Accounting Oversight Board (United States) (PCAOB) and are required to be independent with respect to the Funds in accordance with the U.S. federal securities laws and the applicable rules and regulations of the Securities and Exchange Commission and the PCAOB.
We conducted our audits in accordance with the standards of the PCAOB. Those standards require that we plan and perform the audit to obtain reasonable assurance about whether the financial statements and financial highlights are free of material misstatement, whether due to error or fraud. The Funds are not required to have, nor were we engaged to perform, an audit of their internal control over financial reporting. As part of our audits we are required to obtain an understanding of internal control over financial reporting but not for the purpose of expressing an opinion on the effectiveness of the Funds’ internal control over financial reporting. Accordingly, we express no such opinion.
Our audits included performing procedures to assess the risks of material misstatement of the financial statements and financial highlights, whether due to error or fraud, and performing procedures that respond to those risks. Such procedures included examining, on a test basis, evidence regarding the amounts and disclosures in the financial statements and financial highlights. Our audits also included evaluating the accounting principles used and significant estimates made by management, as well as evaluating the overall presentation of the financial statements and financial highlights. Our procedures included confirmation of securities owned as of April 30, 2018, by correspondence with the custodian and brokers; when replies were not received from brokers, we performed other auditing procedures. We believe that our audits provide a reasonable basis for our opinion.
DELOITTE & TOUCHE LLP
Denver, Colorado
June 26, 2018
We have served as the auditor of one or more investment companies advised by Seafarer Capital Partners, LLC since 2012.
| Annual Report – April 30, 2018 | 55 |
| Seafarer Funds | Additional Information |
April 30, 2018 (Unaudited)
ADDITIONAL INFORMATION
1. Fund Holdings
Each Fund files its complete schedule of portfolio holdings with the Securities and Exchange Commission (the “SEC”) for the first and third quarters of each fiscal year on Form N-Q within 60 days after the end of the period. Copies of the Funds’ Form N-Q are available without charge on the SEC website at http://www.sec.gov. You may also review and copy the Form N-Q at the SEC’s Public Reference Room in Washington, D.C. For more information about the operation of the Public Reference Room, please call the SEC at 1-800-SEC-0330.
2. Fund Proxy Voting Policies, Procedures and Summaries
The Funds’ policies and procedures used in determining how to vote proxies and information regarding how the Funds voted proxies relating to portfolio securities during the most recent prior 12-month period ending June 30 are available without charge, (1) upon request, by calling toll-free (855) 732-9220 and (2) on the SEC’s website at http://www.sec.gov.
3. Tax Designations (Unaudited)
The Funds designate the following as a percentage of taxable ordinary income distributions, or up to the maximum amount allowable, for the calendar year ended December 31, 2017:
| | Dividends Received Deduction | Qualified Dividend Income |
| Seafarer Overseas Growth and Income Fund | 0.00% | 42.13% |
| Seafarer Overseas Value Fund | 0.00% | 9.52% |
In early 2018, if applicable, shareholders of record received this information for the distributions paid to them by the Funds during the calendar year 2017 via Form 1099. The Funds will notify shareholders in early 2019 of amounts paid to them by the Funds, if any, during the calendar year 2018.
The Funds hereby designate the following numbers as long-term capital gain distributions:
| | Long Term Capital Gain Distributions |
| Seafarer Overseas Growth and Income Fund | $6,334,481 |
| Seafarer Overseas Value Fund | $0 |
Please consult a tax advisor if you have questions about federal or state income tax laws, or how to prepare your tax returns.
| 56 | (855) 732-9220 seafarerfunds.com |
| Seafarer Funds | Approval of Fund Advisory Agreement |
April 30, 2018 (Unaudited)
DISCLOSURE REGARDING APPROVAL OF FUND ADVISORY AGREEMENT
On December 12, 2017, the Trustees met in person to discuss, among other things, the approval of the investment advisory agreement between the Trust and the Adviser (“Seafarer Capital Partners” or “Seafarer”), in accordance with Section 15(c) of the Investment Company Act of 1940, as amended. In renewing and approving the Investment Advisory Agreement, the Trustees, including the Independent Trustees, considered the following factors with respect to the Seafarer Funds:
Investment Advisory Fee Rate
The Trustees reviewed and considered the contractual annual advisory fee paid by the Trust, on behalf of the Seafarer Overseas Growth and Income Fund (the “Growth and Income Fund”) and the Seafarer Overseas Value Fund (the “Value Fund”), to Seafarer of 0.75% of the aggregate average daily net assets of the Funds up to $1.5 billion and 0.70% of the aggregate average daily net assets of the Funds over $1.5 billion, in light of the extent and quality of the advisory services provided by Seafarer to the Funds.
The Board received and considered information including a comparison of each Fund’s contractual and actual management fees and overall expenses with those of funds in the expense group and universe of funds provided by an independent provider of investment company data (the “Data Provider”). The Trustees noted that the contractual and actual management fee rate for the Institutional Class shares of each Seafarer Fund was below the average and median contractual and actual management fee rates of the Data Provider’s peer group median.
Total Expense Ratios
Based on such information, the Trustees further reviewed and considered the total expense ratio (after waivers) of 0.929% for the Institutional Class of the Growth and Income Fund and 1.050% for the Institutional Class of the Value Fund. The Trustees noted that each Fund’s total expense ratio (after waivers) was below the total expense ratios of the Data Provider’s universe average (after waivers).
Nature, Extent, and Quality of the Services under the Investment Advisory Agreement
The Trustees received and considered information regarding the nature, extent, and quality of services provided to the Growth and Income Fund and the Value Fund under the Investment Advisory Agreement. The Trustees reviewed certain background materials supplied by Seafarer in its presentation, including its Form ADV.
The Trustees reviewed and considered Seafarer’s investment advisory personnel, its history as an asset manager, and its performance and the amount of assets currently under management by Seafarer. The Trustees also reviewed the research and decision-making processes utilized by Seafarer, including the methods adopted to seek to achieve compliance with the investment objectives, policies and restrictions of each Fund.
The Trustees considered the background and experience of Seafarer’s management in connection with each Fund, including reviewing the qualifications, backgrounds, and responsibilities of the management team primarily responsible for the day-to-day portfolio management of each Fund and the extent of the resources devoted to research and analysis of actual and potential investments.
The Trustees also reviewed, among other things, Seafarer’s insider trading policies and procedures and its Code of Ethics.
Performance
The Trustees reviewed performance information for the Institutional Classes of the Seafarer Funds for the 1-year, 2-year, 3-year, 4-year, 5-year and since inception periods ended September 30, 2017, as applicable. That review included a comparison of each Fund’s performance to the performance universe average of a group of funds selected by the Data Provider. The Trustees noted the performance of the Growth and Income Fund was below the universe average for the 1-year and 2-year
| Annual Report – April 30, 2018 | 57 |
| Seafarer Funds | Approval of Fund Advisory Agreement |
April 30, 2018 (Unaudited)
periods ended September 30, 2017 and above the universe average for the 3-year, 4-year, 5-year and since inception periods ended September 30, 2017. The Trustees also noted that the performance of the Value Fund was above the universe average for the 1-year and since inception periods ended September 30, 2017. The Trustees also considered Seafarer’s discussion of each Fund’s underlying portfolio diversification categories, its top contributors and top detractors, as well as Seafarer’s performance and reputation generally and its investment techniques, risk management controls, and decision-making processes.
Comparable Accounts
The Trustees noted certain information provided by Seafarer regarding fees charged to other Seafarer clients and considered Seafarer’s statements indicating that there were no clients with investment mandates directly comparable to Seafarer Funds.
Profitability
The Trustees received and considered a retrospective and projected profitability analysis prepared by Seafarer based on the fees payable under the Investment Advisory Agreement with respect to the Seafarer Funds. The Trustees considered the profits, if any, anticipated to be realized by Seafarer in connection with the operation of the Seafarer Funds. The Board then reviewed Seafarer’s unaudited financial statements, including income statements for the year ended December 31, 2016 and the 6-month period ended June 30, 2017 and balance sheets for the same periods in order to analyze the financial condition and stability and profitability of Seafarer.
Economies of Scale
The Trustees considered whether economies of scale in the provision of services to the Seafarer Funds will be passed along to the shareholders under the proposed agreements.
Other Benefits to the Adviser
The Trustees reviewed and considered any other incidental benefits derived or to be derived by Seafarer from its relationship with the Seafarer Funds, including whether soft dollar arrangements were used.
In renewing Seafarer as the investment adviser to the Seafarer Funds and renewing the Investment Advisory Agreement and the fees charged under the Investment Advisory Agreement, the Trustees concluded that no single factor reviewed by the Trustees was identified by the Trustees to be determinative as the principal factor in whether to renew the Investment Advisory Agreement. Further, the Independent Trustees were advised by separate independent legal counsel throughout the process. The Trustees, including all of the Independent Trustees, concluded that:
| ● | the contractual and actual management fee rate for the Institutional Class shares of each Seafarer Fund was below the average and median contractual and actual management fee rates of the Data Provider’s peer group median; |
| ● | the total expense ratios (after waivers) of 0.929% for the Institutional Class of the Growth and Income Fund and 1.050% for the Institutional Class of the Value Fund were below the total expense ratios of the Data Provider’s universe average (after waivers); |
| ● | the nature, extent, and quality of services rendered by Seafarer under the Investment Advisory Agreement with respect to the Seafarer Funds were adequate; |
| ● | the performance of the Institutional Class of the Growth and Income Fund was below the universe average for the 1-year and 2-year periods ended September 30, 2017 and above the universe average for the 3-year, 4-year, 5-year and since inception periods ended September 30, 2017; and the performance of the Institutional Class of the Value Fund was above the universe average for the 1-year and since inception periods ended September 30, 2017; |
| ● | bearing in mind the limitations of comparing different types of managed accounts and the different levels of service typically associated with such accounts, the fee structures applicable |
| 58 | (855) 732-9220 seafarerfunds.com |
| Seafarer Funds | Approval of Fund Advisory Agreement |
April 30, 2018 (Unaudited)
to Seafarer’s other clients were not indicative of any unreasonableness with respect to the advisory fees payable by the Seafarer Funds;
| ● | the profit, if any, realized by Seafarer in connection with the operation of the Seafarer Funds is not unreasonable to the Funds; and |
| ● | there were no material economies of scale or other incidental benefits accruing to Seafarer in connection with its relationship with the Seafarer Funds. |
Based on the Trustees’ deliberations and their evaluation of the information described above, the Trustees, including all of the Independent Trustees, concluded that Seafarer’s compensation for investment advisory services is consistent with the best interests of each Seafarer Fund and its shareholders.
| Annual Report – April 30, 2018 | 59 |
| Seafarer Funds | Trustees and Officers |
April 30, 2018 (Unaudited)
Additional information regarding the Fund’s trustees is included in the Statement of Additional Information, which can be obtained without charge by calling 855-732-9220.
INDEPENDENT TRUSTEES
Name,
Address*
& Year
of Birth | Position(s) Held with Fund | Term of
Office** and Length of
Time Served | Principal Occupation(s)
During Past 5 Years*** | Number of Funds in
Fund
Complex Overseen by Trustee**** | Other Directorships
Held by Trustee
During Past
5 Years*** |
Mary K. Anstine,
1940 | Trustee and Chairman | Ms. Anstine was elected at a special meeting of shareholders held on March 21, 1997 and re-elected at a special meeting of shareholders held on August 7, 2009. Ms. Anstine was appointed Chairman of the Board at the June 6, 2017 meeting of the Board of Trustees. | Ms. Anstine was formerly an Executive Vice President of First Interstate Bank of Denver until 1994, President/Chief Executive Officer of HealthONE Alliance, Denver, Colorado, from 1994 to 2004, and has been retired since 2004. Ms. Anstine is also Trustee/Director of AV Hunter Trust and Colorado Uplift Board. Ms. Anstine was formerly a Director of the Trust Bank of Colorado (later purchased and now known as Northern Trust Bank), HealthONE and Denver Area Council of the Boy Scouts of America, and a member of the American Bankers Association Trust Executive Committee. | 32 | Ms. Anstine is a Trustee of ALPS ETF Trust (21 funds); ALPS Variable Investment Trust (9 funds); Reaves Utility Income Fund (1 fund); and Westcore Trust (14 funds). |
Jeremy W. Deems,
1976 | Trustee | Mr. Deems was appointed as a Trustee at the March 11, 2008 meeting of the Board of Trustees and elected at a special meeting of shareholders held on August 7, 2009. | Mr. Deems is the Co-Founder, Chief Operations Officer and Chief Financial Officer of Green Alpha Advisors, LLC, a registered investment advisor, and Co- Portfolio Manager of the Shelton Green Alpha Fund. Prior to joining Green Alpha Advisors, Mr. Deems was CFO and Treasurer of Forward Management, LLC, ReFlow Management Co., LLC, ReFlow Fund, LLC, a private investment fund, and Sutton Place Management, LLC, an administrative services company, from 1998 to June 2007. From 2004 to 2005, Mr Deems also served as Treasurer of the Forward Funds and the Sierra Club Funds. | 32 | Mr. Deems is a Trustee of ALPS ETF Trust (21 funds); ALPS Variable Investment Trust (9 funds); Clough Funds Trust (1 fund); and Reaves Utility Income Fund (1 fund). |
| 60 | (855) 732-9220 seafarerfunds.com |
| Seafarer Funds | Trustees and Officers |
April 30, 2018 (Unaudited)
INDEPENDENT TRUSTEES (continued)
Name,
Address*
& Year
of Birth | Position(s) Held with Fund | Term of
Office** and Length of
Time Served | Principal Occupation(s)
During Past 5 Years*** | Number of Funds in Fund Complex Overseen by Trustee**** | Other Directorships
Held by Trustee
During Past
5 Years*** |
Jerry G. Rutledge,
1944 | Trustee | Mr. Rutledge was elected at a special meeting of shareholders held on August 7, 2009. | Mr. Rutledge is the President and owner of Rutledge’s Inc., a retail clothing business. He served as Director of University of Colorado Hospital from 2008 to 2016. He was from 1994 to 2007 a Regent of the University of Colorado. | 32 | Mr. Rutledge is a Trustee of Principal Real Estate Fund (1 fund), Clough Global Dividend and Income Fund (1 fund), Clough Global Equity Fund (1 fund) and Clough Global Opportunities Fund (1 fund). |
| Michael “Ross” Shell, 1970 | Trustee | Mr. Shell was elected at a special meeting of shareholders held on August 7, 2009. | Mr. Shell is Founder and CEO of Red Idea, LLC, a strategic consulting/early stage venture firm (since June 2008). From 1999 to 2009, he was a part-owner and Director of Tesser, Inc., a brand agency. From December 2005 to May 2008, he was Director, Marketing and Investor Relations, of Woodbourne, a REIT/real estate hedge fund and private equity firm. Prior to this, from May 2004 to November 2005, he worked as a business strategy consultant; from June 2003 to April 2004, he was on the Global Client Services team of IDEO, a product design/innovation firm; and from 1999 to 2003, he was President of Tesser, Inc. Mr. Shell graduated with honors from Stanford University with a degree in Political Science. | 32 | None. |
| Annual Report – April 30, 2018 | 61 |
| Seafarer Funds | Trustees and Officers |
April 30, 2018 (Unaudited)
INTERESTED TRUSTEE
Name,
Address*
& Year
of Birth | Position(s) Held with Fund | Term of
Office** and Length of
Time Served | Principal Occupation(s)
During Past 5 Years*** | Number of Funds in Fund Complex Overseen by Trustee**** | Other Directorships
Held by Trustee
During Past
5 Years*** |
Edmund J. Burke, 1961 | Trustee and President | Mr. Burke was elected as Trustee at a special meeting of shareholders held on August 7, 2009. Mr. Burke was elected President of the Trust at the December 17, 2002 meeting of the Board of Trustees. | Mr. Burke is President and a Director of ALPS Holdings, Inc. (“AHI”) and ALPS Advisors, Inc. (“AAI”), and Director of Boston Financial Data Services, Inc. (“BFDS”), ALPS Distributors, Inc. (“ADI”), ALPS Fund Services, Inc. (“AFS”) and ALPS Portfolio Solutions Distributor, Inc. (“APSD”). Because of his positions with AHI, BFDS, AAI, ADI, AFS and APSD, Mr. Burke is deemed an affiliate of the Trust as defined under the 1940 Act. | 32 | Mr. Burke is a Trustee of Clough Global Dividend and Income Fund (1 fund); Clough Global Equity Fund (1 fund); Clough Global Opportunities Fund (1 fund); Clough Funds Trust (1 fund); Liberty All-Star Equity Fund (1 fund); Director of the Liberty All- Star Growth Fund, Inc. (1 fund); Trustee of ALPS ETF Trust (21 funds). |
| 62 | (855) 732-9220 seafarerfunds.com |
| Seafarer Funds | Trustees and Officers |
April 30, 2018 (Unaudited)
OFFICERS
Name,
Address*
& Year
of Birth | Position(s)
Held with
Fund | Term of Office** and Length of
Time Served | Principal Occupation(s) During Past 5 Years*** |
Kimberly R. Storms, 1972 | Treasurer | Ms. Storms was elected Treasurer of the Trust at the March 12, 2013 meeting of the Board of Trustees. | Ms. Storms is Senior Vice President - Director of Fund Administration of ALPS. Because of her position with ALPS, Ms. Storms is deemed an affiliate of the Trust as defined under the 1940 Act. Ms. Storms is also Treasurer of Liberty All-Star Equity Fund, Liberty All-Star Growth Fund, Inc., ALPS Series Trust and Elevation ETF Trust. Ms. Storms also serves as a Board member and Treasurer of The Center for Trauma & Resilience, a nonprofit agency. |
Karen S. Gilomen, 1970 | Secretary | Ms. Gilomen was elected Secretary of the Trust at the December 13, 2016 meeting of the Board of Trustees. | Ms. Gilomen joined ALPS in August 2016 as Vice President and Senior Counsel. Prior to joining ALPS, Ms. Gilomen was Vice President - General Counsel & CCO of Monticello Associates, Inc. from 2010 to 2016. Because of her position with ALPS, Ms. Gilomen is deemed an affiliate of the Trust, as defined under the 1940 Act. Ms. Gilomen is also the Secretary of Clough Funds Trust, Clough Global Dividend and Income Fund, Clough Global Equity Fund, Clough Global Opportunities Fund, Reaves Utility Income Fund, and the Assistant Secretary of the WesMark Funds. |
Ted Uhl, 1974 | Chief Compliance Officer (“CCO”) | Mr. Uhl was appointed CCO of the Trust at the June 8, 2010 meeting of the Board of Trustees. | Mr. Uhl joined ALPS in October 2006, and is currently Deputy Compliance Officer of ALPS. Prior to his current role, Mr. Uhl served as Senior Risk Manager for ALPS from October 2006 until June 2010. Before joining ALPS, Mr. Uhl served a Sr. Analyst with Enenbach and Associates (RIA), and a Sr. Financial Analyst at Sprint. Because of his position with ALPS, Mr. Uhl is deemed an affiliate of the Trust as defined under the 1940 Act. Mr. Uhl is also CCO of the Boulder Growth & Income Fund, Inc., Centre Funds, Elevation ETF Trust, Index Funds, Reality Shares ETF Trust and Reaves Utility Income Fund. |
Jennell Panella, 1974 | Assistant Treasurer | Ms. Panella was elected Assistant Treasurer of the Trust at the September 15, 2015 meeting of the Board of Trustees | Ms. Panella joined ALPS in June 2012 and is currently Fund Controller of ALPS Fund Services, Inc. Prior to joining ALPS, Ms. Panella served as Financial Reporting Manager for Parker Global Strategies, LLC (2009-2012). Because of her position with ALPS, Ms. Panella is deemed an affiliate of the Trust as defined under the 1940 Act. Ms. Panella also serves as Assistant Treasurer of James Advantage Funds. |
| Annual Report – April 30, 2018 | 63 |
| Seafarer Funds | Trustees and Officers |
April 30, 2018 (Unaudited)
OFFICERS (continued)
Name,
Address*
& Year
of Birth | Position(s) Held with Fund | Term of Office** and Length of
Time Served | Principal Occupation(s) During Past 5 Years*** |
Alan Gattis, 1980 | Assistant Treasurer | Mr. Gattis was elected Assistant Treasurer of the Trust at the September 13, 2016 meeting of the Board of Trustees | Mr. Gattis joined ALPS in 2011 and is currently Vice President and Fund Controller of ALPS. Prior to joining ALPS, Mr. Gattis was an Auditor at Spicer Jeffries LLP (2009 through 2011) and an Auditor at PricewaterhouseCoopers LLP (2004 - 2009). Because of his position with ALPS, Mr. Gattis is deemed an affiliate of the Trust as defined under the 1940 Act. Mr. Gattis is also Assistant Treasurer of ALPS Series Trust and Elevation ETF Trust. |
Sharon Akselrod, 1974 | Assistant Secretary | Ms. Akselrod was elected Assistant Secretary of the Trust at the September 15, 2015 meeting of the Board of Trustees. | Ms. Akselrod joined ALPS in August 2014 and is currently Senior Investment Company Act Paralegal of ALPS Fund Services, Inc. Prior to joining ALPS, Ms. Akselrod served as Corporate Governance and Regulatory Associate for Nordstrom fsb (2013-2014) and Senior Legal Assistant – Legal Manager for AXA Equitable Life Insurance Company (2008- 2013). Because of her position with ALPS, Ms. Akselrod is deemed an affiliate of the Trust as defined under the 1940 Act. Ms. Akselrod is also Assistant Secretary of ALPS ETF Trust and Principal Real Estate Fund. |
Jennifer Craig, 1973 | Assistant Secretary | Ms. Craig was elected Assistant Secretary of the Trust at the June 8, 2016 meeting of the Board of Trustees. | Ms. Craig joined ALPS in 2007 and is currently Assistant Vice President and Paralegal Manager of ALPS. Prior to joining ALPS, Ms. Craig was Legal Manager at Janus Capital Management LLC and served as Assistant Secretary of Janus Investment Fund, Janus Adviser Series and Janus Aspen Series. Because of her position with ALPS, Ms. Craig is deemed an affiliate of the Trust as defined under the 1940 Act. Ms. Craig is also Assistant Secretary of Clough Global Dividend and Income Fund, Clough Global Equity Fund, Clough Global Opportunities Fund, Clough Funds Trust, Liberty All-Star Equity Fund, Liberty All-Star Growth Fund, Inc. and ALPS Series Trust. |
Sareena Khwaja- Dixon, 1980 | Assistant Secretary | Ms. Khwaja- Dixon was elected Assistant Secretary of the Trust at the December 12, 2017 meeting of the Board of Trustees. | Ms. Khwaja-Dixon joined ALPS in August 2015 and is currently Senior Counsel and Vice President of ALPS Fund Services, Inc. Prior to joining ALPS, Ms. Khwaja-Dixon served as a Senior Paralegal/Paralegal for Russell Investments (2011 – 2015). Ms. Khwaja-Dixon is also Secretary of Liberty All-Star Equity Fund and Liberty All-Star Growth Fund, Inc., and Assistant Secretary of Clough Funds Trust, Clough Dividend and Income Fund, Clough Global Opportunities Fund and Clough Global Equity Fund. |
| * | All communications to Trustees and Officers may be directed to Financial Investors Trust c/o 1290 Broadway, Suite 1100, Denver, CO 80203. |
| ** | This is the period for which the Trustee or Officer began serving the Trust. Each Trustee serves an indefinite term, until his successor is elected. Officers are elected on an annual basis. |
| *** | Except as otherwise indicated, each individual has held the office shown or other offices in the same company for the last five years. |
| **** | The Fund Complex includes all series of the Trust (currently 32) and any other investment companies for which any Trustee serves as trustee for and which Seafarer Capital Partners, LLC provides investment advisory services (currently none). |
| 64 | (855) 732-9220 seafarerfunds.com |
Seafarer Funds | Privacy Policy |
| | April 30, 2018 (Unaudited) |
| FACTS | WHAT DO THE FUNDS DO WITH YOUR PERSONAL INFORMATION? |
| Why? | Financial companies choose how they share your personal information. Federal law gives consumers the right to limit some but not all sharing. Federal law also requires us to tell you how we collect, share, and protect your personal information. Please read this notice carefully to understand what we do. |
| What? | The types of personal information we collect and share depend on the product or service you have with us. This information can include: |
| | |
| | ● | Social Security number and account transactions |
| | ● | Account balances and transaction history |
| | ● | Wire transfer instructions |
| How? | All financial companies need to share customers’ personal information to run their everyday business. In the section below, we list the reasons financial companies can share their customers’ personal information; the reasons the Funds choose to share; and whether you can limit this sharing. |
| Reasons we can share your personal information | Do we share: | Can you limit this sharing? |
For our everyday business purposes – such as to process your transactions, maintain your account(s), respond to court orders and legal investigations, or report to credit bureaus | Yes | No |
For our marketing purposes – to offer our products and services to you | No | We do not share. |
| For joint marketing with other financial companies | No | We do not share. |
For our affiliates’ everyday business purposes – information about your transactions and experiences | Yes | No |
For our affiliates’ everyday business purposes – information about your creditworthiness | No | We do not share. |
| For nonaffiliates to market to you | No | We do not share. |
| Annual Report – April 30, 2018 | 65 |
Seafarer Funds | Privacy Policy |
| | April 30, 2018 (Unaudited) |
| Who We Are | | |
| Who is providing this notice? | Seafarer Overseas Growth and Income Fund and Seafarer Overseas Value Fund. |
| | |
| What We Do | |
| How do the Funds protect my personal information? | To protect your personal information from unauthorized access and use, we use security measures that comply with federal law. These measures include computer safeguards and secured files and buildings. |
| How do the Funds collect my personal information? | We collect your personal information, for example, when you |
| | ● | open an account |
| | ● | provide account information or give us your contact information |
| | ● | make a wire transfer or deposit money |
| Why can't I limit all sharing? | Federal law gives you the right to limit only |
| | |
| | ● | sharing for affiliates’ everyday business purposes-information about your creditworthiness |
| | ● | affiliates from using your information to market to you |
| | ● | sharing for non-affiliates to market to you |
| | | |
| | State laws and individual companies may give you additional rights to limit sharing. |
| | |
| Definitions | |
| Affiliates | Companies related by common ownership or control. They can be financial and nonfinancial companies. |
| Non-affiliates | Companies not related by common ownership or control. They can be financial and nonfinancial companies. |
| | |
| | ● | The Funds do not share with non-affiliates so they can market to you. |
| Joint marketing | A formal agreement between non-affiliated financial companies that together market financial products or services to you. |
| | |
| | ● | The Funds do not jointly market. |
| | | |
| Other Important Information | |
| California Residents | If your account has a California home address, your personal information will not be disclosed to nonaffiliated third parties except as permitted by applicable California law, and we will limit sharing such personal information with our affiliates to comply with California privacy laws that apply to us. |
| Vermont Residents | The State of Vermont requires financial institutions to obtain your consent prior to sharing personal information that they collect about you with affiliated companies and nonaffiliated third parties other than in certain limited circumstances. Except as permitted by law, we will not share personal information we collect about you with nonaffiliated third parties or other affiliated companies unless you provide us with your written consent to share such information. |
| 66 | (855) 732-9220 seafarerfunds.com |
Page Intentionally Left Blank
Table of Contents
| CONTENTS | PAGE |
| Shareholder Letter | 1 |
| Fund Overview | |
| Vulcan Value Partners Fund | 5 |
| Vulcan Value Partners Small Cap Fund | 8 |
| Disclosure of Fund Expenses | |
| Vulcan Value Partners Fund | 7 |
| Vulcan Value Partners Small Cap Fund | 10 |
| Statements of Investments | |
| Vulcan Value Partners Fund | 11 |
| Vulcan Value Partners Small Cap Fund | 14 |
| Statements of Assets and Liabilities | 18 |
| Statements of Operations | 19 |
| Statements of Changes in Net Assets | |
| Vulcan Value Partners Fund | 20 |
| Vulcan Value Partners Small Cap Fund | 21 |
| Financial Highlights | |
| Vulcan Value Partners Fund | 22 |
| Vulcan Value Partners Small Cap Fund | 24 |
| Notes to Financial Statements | 26 |
| Report of Independent Registered Public Accounting Firm | 35 |
| Disclosure Regarding Approval of Fund Advisory Agreements | 36 |
| Additional Information | 39 |
| Trustees and Officers | 40 |
| Privacy Policy | 45 |
| www.vulcanvaluepartners.com |
Shareholder Letter
April 30, 2018 (Unaudited)
Annual Shareholder Letter 04.30.2018
Vulcan Value Partners Fund returned 12.72% versus 7.50% for the Russell 1000 Value and 13.27% for the S&P 500 for the year ended April 30, 2018. The Vulcan Value Partners Small Cap Fund returned 3.08% versus 6.53% for the Russell 2000 Value and 11.54% for the Russell Value 2000 for the year ended April 30, 2018. As we have often said, we place no weight on short-term results, good or bad, and neither should you. In fact, we have made and will continue to make decisions that could negatively impact short-term performance when we think we can improve our long-term returns and mitigate risk. We encourage you to place more weight on our longer-term historical results and a great deal of weight on our long-term prospects.
Past performance does not guarantee future results.
The current market environment is giving us few opportunities to deploy capital with an acceptable margin of safety. We do not know how long this environment will last or if it will get worse before it gets better. While we would prefer to always be ahead of the benchmarks, we will not violate our investment discipline in order to do so. Current market conditions creating a difficult environment for us near term include record low volatility, and growth continuing its record outperformance compared to value. However, we are pleased with the solid value growth of the companies in our portfolio and welcome the recent market volatility that allowed us to redeploy capital.
We generally define material contributors and detractors as companies having a greater than 1% impact on the portfolio.
Vulcan Value Partners Large Cap Fund Review
In the discussion that follows, we highlight a few holdings in the Vulcan Value Partners Fund. Material contributors included Mastercard, Visa, Boeing and AmerisourceBergen. There were no material detractors.
Visa continues to benefit from its integration of Visa Europe and robust growth in the company’s global transaction volumes and data processing revenues. Global spending is accelerating and Visa is capturing an increased share of consumer’s wallets from cash and checks, a trend that has expanded with the growth of e-commerce. The company is at the nexus of a massive global network, and it continues to work with Mastercard to create a universal QR code-based payment system. Visa is also dominant in fraud security, which enhances the company’s value proposition for both merchants and end consumers.
Mastercard’s estimated value continues to compound, along with its stock price. It has grown steadily, and we are pleased with its performance.
We purchased Airbus SE during the period. Airbus and Boeing are a global duopoly in commercial aviation. Also, both are leaders in the defense industry. As you know, we have owned Boeing in the fund for quite some time, but we sold it during the third quarter of 2017 as its stock price reached our estimate of fair value. Airbus’ financial results remind us of where Boeing was two years ago. Both companies have approximately seven years of commercial backlog, which will keep their factories in production for years to come. However, Airbus is ramping up production
| Annual Report | April 30, 2018 | 1 |
Shareholder Letter
April 30, 2018 (Unaudited)
and making progress on bringing its cost curve down with greater economies of scale. As production increases and costs fall, Airbus’ reported earnings, and much more importantly, free cash flow should expand dramatically.
Facebook Inc., another new purchase, has been on our MVP list for many years. When it first went public, it did not have nearly the mobile presence it does now. It was unclear if Facebook was going to develop a search engine alternative to compete directly with Google or continue to focus on connections among its users. Since the initial public offering, we have watched Facebook mature into a company focused on connections, avoid direct competition with Google in search, and develop its mobile presence. We believe their network of over two billion users creates data that is a powerful asset and that it will continue to attract a large amount of advertising spending. They have generated an extremely robust free cash flow coupon that has grown significantly over the past five years to a current run-rate of well over $20 billion. Facebook has healthy returns on capital, strong and stable margins, and net cash on the balance sheet. We are pleased that the recent volatility resulting from regulatory and privacy concerns has enabled us to follow our discipline and deploy capital into this quality business at an attractive discount to our estimate of intrinsic value(1).
AmerisourceBergen is in the drug distribution and wholesale space, and along with McKesson and Cardinal Health, these companies have an oligopoly with a combined 85% market share. Their business is managing the logistics of distributing pharmaceuticals and over-the-counter products to the large pharmacy chains, independent pharmacies, hospitals, physician clinics, and nursing homes. Scale, high regulatory barriers for others to enter the space, and a robust supply chain are strong competitive advantages for these companies. The industry has enjoyed very good growth over the years, largely because of the shift to generic pharmaceuticals. These substitutions came with a higher margin for the distributors, but as the generics trend has matured, top line growth has slowed. During the period, generic deflation was stronger than expected, which drove the stock price down and allowed us to add to our position. Also, the possibility of Amazon entering the pharmacy space has weighed on the industry. We believe, however, that even if Amazon does enter the space, we have valued these companies appropriately, and we also believe that generic deflation will moderate in the future.
During the fourth quarter of 2017, CVS Health announced that it was acquiring Aetna. We believe this transaction has the potential to strengthen CVS Health’s already competitive position. The market seems to believe that the transaction is a defensive response to Amazon. While the merger would make entry for Amazon more challenging, it is an offensive move to improve health outcomes. CVS believes that they can “bend the medical cost curve” by lowering hospital readmission rates. Their thesis is that a complete medication review with patients immediately after leaving the hospital and regular follow-up calls from a local pharmacist could lower readmission rates from 20% to 10%. The merger would make them the only company with both the patient data and the pharmacist network necessary to offer this service. In our opinion, the market is penalizing CVS because of short-term earnings disruption from this acquisition and ignoring the benefits that should accrue to long-term investors. We are happy to own CVS at these prices.
| 2 | www.vulcanvaluepartners.com |
Shareholder Letter
April 30, 2018 (Unaudited)
Vulcan Value Partners Small Cap Fund Review
In the discussion that follows, we highlight a few holdings in the Vulcan Value Partners Small Cap Fund. Material contributors included Jones Lang LaSalle and Credit Acceptance Corporation. Criteo SA was a material detractor.
Jones Lang LaSalle was our top contributor over the period. Our estimated value has compounded nicely since our initial purchase. Jones Lang LaSalle’s push into property management has created more stability in profit and provided a substantial long-term growth opportunity. Slowing acquisition activity, a more rational cost structure implemented by management, and the recent passing of the Tax Cuts and Jobs Act have contributed to Jones Lang LaSalle’s higher stock price and intrinsic value. Sleep Number’s underlying business continues to be strong, free cash flow is at record levels, and management is rapidly buying back shares. Its stock price has been volatile, giving us the ability to follow our process by taking advantage of price fluctuations.
Credit Acceptance Corporation has been on our MVP list for some time, and with a recent deep dive into the business, we were excited to purchase it this period. The company provides auto loans to borrowers at the lower end of the credit spectrum distributed through a network of 10,000 dealers in the U.S. Over the past fifteen years, the company has grown earnings per share at a rate of 26% and achieved an average return on equity(2) of 28%, demonstrating its strong economics and competitive advantages. The company’s biggest competitive advantage is the unique way in which it structures loans. The structure aligns incentives with their dealer network by providing the dealers the opportunity to earn back end payments dependent on loan performance. This opportunity for future payments allows Credit Acceptance Corporation to achieve a greater margin of safety as the dealer is only advanced enough of the loan to earn a small profit at the time of sale. Credit Acceptance Corporation’s approach has led to strong underwriting results and stable performance during difficult periods in the cycle.
Ibstock, a new purchase during the period, is a U.K.-based company that manufactures clay bricks and concrete products. It mostly serves customers in the U.K. (80%), but also in the U.S. (20%), with Glen-Gery being the brand in the U.S. The three largest brick makers control 90% of the U.K. market, with Ibstock holding about half of that 90%. Moreover, it has been decades since there has been a new entrant into the U.K. market. U.K. building regulations either favor or mandate brick, so substitution risk is low and it takes years to add capacity. We like that the company has rational competition as well as solid growth and pricing. We believe the experienced management team has been disciplined with capital allocation and production, allowing them to prosper while some of their weaker competitors have floundered.
Criteo, a company we purchased and exited during the period, was a mistake. We define a potential mistake as a company whose value has not grown or has declined within two years after purchase. Following our discipline, we exited the position. Criteo is a digital marketing company specializing in digital ad placement. Its primary competitor, Conversant, was a great investment for us. At the time of purchase, we quantified the negative impact Apple’s new operating system would have on Criteo’s results, and when compared to the actual impact, it turned out to be more adverse than we or the company anticipated. As a result, Criteo’s value was less stable than we previously thought, so we exited the position.
| Annual Report | April 30, 2018 | 3 |
Shareholder Letter
April 30, 2018 (Unaudited)
Closing
We welcome the recent market volatility that allowed us to improve the margin of safety for our portfolios. We appreciate the confidence you have placed in us. Your stable capital, invested alongside our own stable capital provides a foundation that allows us to make sound, long-term investment decisions that mitigate risk and provide the opportunity to achieve superior long-term results. You, our client-partners, are one of our most important competitive advantages.
C.T. Fitzpatrick
Chief Executive Officer
Vulcan Value Partners, LLC
Past performance does not guarantee future results. The Funds’ prices fluctuate as the underlying assets have exposure to market fluctuations and other risks, as described in the Funds’ prospectus. Please call 877.421.5078 to obtain current performance information and for the current prospectus and statement of additional information. This material must be preceded or accompanied by a prospectus. Please read the prospectus carefully before investing.
The views of the Vulcan Value Partners, LLC and information discussed in this commentary are as of the date of publication, are subject to change, and may not reflect the writer's current views. The views expressed represent an assessment of market conditions at a specific point in time, are opinions only and should not be relied upon as investment advice regarding a particular investment or markets in general. Such information does not constitute a recommendation to buy or sell specific securities or investment vehicles. It should not be assumed that any investment will be profitable or will equal the performance of the Funds or any securities or any sectors mentioned in this letter. The subject matter contained in this letter has been derived from several sources believed to be reliable and accurate at the time of compilation. Neither Vulcan Value Partners, LLC nor the Funds accept any liability for losses either direct or consequential caused by the use of this information.
The Funds are distributed by ALPS Distributors, Inc.
The Funds are subject to investment risks, including possible loss of the principal amount invested and therefore is not suitable for all investors. The Funds may not achieve their objectives.
Diversification does not eliminate the risk of experiencing investment losses.
| (1) | Intrinsic value is the perceived or calculated value of a company, including tangible and intangible factors, using fundamental analysis. Also called the true value, the intrinsic value may or may not be the same as the current market value. |
| (2) | Return on equity (ROE) is the amount of net income returned as a percentage of shareholders equity. Return on equity measures a corporation's profitability by revealing how much profit a company generates with the money shareholders have invested. |
| 4 | www.vulcanvaluepartners.com |
Fund Overview
April 30, 2018 (Unaudited)
VULCAN VALUE PARTNERS FUND
Annualized Total Returns (as of 4/30/18)
| | | | | | | Expense Ratios(1) |
| | 6 Month | 1 Year | 3 Year | 5 Year | Since Inception* | Total | Net(2) |
| Vulcan Value Partners Fund | 7.70% | 12.72% | 6.27% | 11.44% | 12.70% | 1.07% | 1.07% |
| S&P 500® Total Return Index(3) | 3.82% | 13.27% | 10.57% | 12.96% | 13.14% | | |
| Russell 1000® Value Index(4) | 1.94% | 7.50% | 7.66% | 10.52% | 11.83% | | |
Performance data quoted represents past performance. Past performance does not guarantee future results. Investment return and principal value of an investment will fluctuate so that an investor’s shares, when sold or redeemed, may be worth more or less than the original cost. The Fund imposes a 2.00% redemption fee on shares held for less than 90 days. Current performance data may be higher or lower than actual data quoted. For the most current month-end performance data, please call 1-877-421-5078.
The table does not reflect the deduction of taxes that a shareholder would pay on Fund distributions or the redemption of Fund shares.
Subject to investment risks, including possible loss of the principal amount invested.
Returns for periods less than 1 year are cumulative.
| * | Fund inception date of 12/30/09. |
| (1) | Ratios as of the Prospectus dated August 31, 2017 and may differ from the ratios presented in the Financial Highlights. |
| (2) | Vulcan Value Partners, LLC (“Vulcan” or the “Adviser”) has contractually agreed to limit the Fund’s total annual fund operating expenses (exclusive of Acquired Fund Fees and Expenses, brokerage expenses, interest expense, taxes and extraordinary expenses) to 1.25% of the Fund’s average daily net assets. This agreement (the “Expense Agreement”) is in effect through August 31, 2018. The Adviser will be permitted to recover, on a class-by-class basis, expenses it has borne through the Expense Agreement to the extent that the Fund’s expenses in later periods fall below the expense cap in effect at the time of waiver or reimbursement. Notwithstanding the foregoing, the Fund will not be obligated to pay any such fees and expenses more than three years after the end of the fiscal year in which the fees or expenses were foregone or reimbursed. The Adviser may not discontinue or modify this waiver prior to August 31, 2018 without the approval by the Fund’s Board of Trustees. |
| (3) | The S&P 500® Total Return Index is an unmanaged index of 500 common stocks chosen for market size, liquidity and industry group representation. It is a market-value weighted index. The Index is not actively managed and does not reflect any deductions for fees, expenses or taxes. An investor may not invest directly in the Index. |
| (4) | The Russell 1000® Value Index is presented here as an additional index, and measures the performance of the large-cap value segment of the U.S. equity universe. It includes those Russell 1000® companies with lower price-to-book ratios and lower expected growth values. The index is not actively managed and does not reflect any deductions for fees, expense or taxes. An investor may not invest directly in an index. |
| Annual Report | April 30, 2018 | 5 |
Fund Overview
April 30, 2018 (Unaudited)
Performance of $10,000 Initial Investment (for the period ended April 30, 2018)
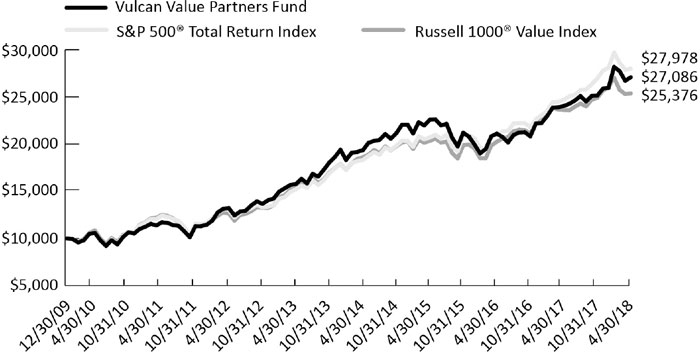
The chart above represents historical performance of a hypothetical investment of $10,000 in the Fund since inception. Past performance does not guarantee future results. This chart does not reflect the deduction of taxes that a shareholder would pay on Fund distributions or the redemption of Fund shares.
Investing in the Fund is subject to investment risks, including possible loss of the principal amount invested.
Industry Allocation (as a % of Net Assets)*
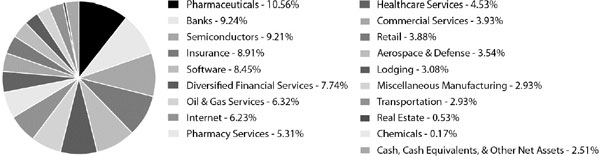
Top Ten Holdings (as a % of Net Assets)*
| Oracle Corp. | 8.45% |
| National Oilwell Varco, Inc. | 6.32% |
| CVS Health Corp. | 5.31% |
| Skyworks Solutions, Inc. | 4.85% |
| Qorvo, Inc. | 4.36% |
| McKesson Corp. | 4.02% |
| Swiss Re AG | 4.00% |
| Visa, Inc. | 3.91% |
| Mastercard, Inc. | 3.84% |
| State Street Corp. | 3.80% |
| Top Ten Holdings | 48.86% |
| * | Holdings are subject to change, and may not reflect the current or future position of the portfolio. |
| 6 | www.vulcanvaluepartners.com |
Disclosure of Fund Expenses
April 30, 2018 (Unaudited)
As a shareholder of the Vulcan Value Partners Fund (the “Fund”), you will incur two types of costs: (1) transaction costs, including applicable redemption fees; and (2) ongoing costs, including management fees and other fund operating expenses. The following examples are intended to help you understand your ongoing costs (in dollars) of investing in the Fund and to compare these costs with the ongoing costs of investing in other mutual funds. The examples are based on an investment of $1,000 invested on November 1, 2017 and held until April 30, 2018.
Actual Expenses. The first line of each table below provides information about actual account values and actual expenses. You may use the information in this line, together with the amount you invested, to estimate the expenses that you paid over the period. Simply divide your account value by $1,000 (for example, an $8,600 account value divided by $1,000 = 8.6), then multiply the result by the number in the first line under the heading “Expenses Paid During Period” to estimate the expenses you paid on your account during this period.
Hypothetical Example for Comparison Purposes. The second line of the table below provides information about hypothetical account values and hypothetical expenses based on the Fund’s actual expense ratio and an assumed rate of return of 5% per year before expenses, which is not the Fund’s actual return. The hypothetical account values and expenses may not be used to estimate the actual ending account balance or expenses you paid for the period. You may use this information to compare the ongoing costs of investing in the Fund and other mutual funds. To do so, compare this 5% hypothetical example with the 5% hypothetical examples that appear in the shareholder reports of the other mutual funds.
Please note the expenses shown in the table are meant to highlight ongoing Fund costs only and do not reflect transactional costs, such as redemption fees or exchange fees. Therefore, the second line of the table below is useful in comparing your ongoing costs only, and will not help you determine the relative total costs of owning different funds. In addition, if these transactional costs were included, your costs would have been higher.
Vulcan Value Partners Fund
| | Beginning
Account Value
11/1/17 | Ending
Account Value
4/30/18 | Expense Ratio(a) | Expenses Paid
During period
11/1/17 - 4/30/18(b) |
| Actual | $1,000.00 | $1,077.00 | 1.07% | $ 5.51 |
| Hypothetical (5% return before expenses) | $1,000.00 | $1,019.49 | 1.07% | $ 5.36 |
| (a) | The Fund's expense ratios have been annualized based on the Fund's most recent fiscal half-year expenses. |
| (b) | Expenses are equal to the Fund's annualized expense ratio multiplied by the average account value over the period, multiplied by the number of days in the most recent fiscal half-year (181)/365 (to reflect the half-year period). |
| Annual Report | April 30, 2018 | 7 |
Fund Overview
April 30, 2018 (Unaudited)
VULCAN VALUE PARTNERS SMALL CAP FUND
Annualized Total Returns (as of 4/30/18)
| | | | | | | Expense Ratios(1) |
| | 6 Month | 1 Year | 3 Year | 5 Year | Since
Inception* | Total | Net(2) |
| Vulcan Value Partners Small Cap Fund | 1.32% | 3.08% | 6.09% | 8.95% | 13.53% | 1.27% | 1.27% |
| Russell 2000® Value Index(3) | 0.94% | 6.53% | 9.27% | 10.36% | 11.62% | | |
| Russell 2000® Index(4) | 3.27% | 11.54% | 9.64% | 11.74% | 12.78% | | |
Performance data quoted represents past performance. Past performance does not guarantee future results. Investment return and principal value of an investment will fluctuate so that an investor’s shares, when sold or redeemed, may be worth more or less than the original cost. The Fund imposes a 2.00% redemption fee on shares held for less than 90 days. Current performance data may be higher or lower than actual data quoted. For the most current month-end performance data, please call 1-877-421-5078.
The table does not reflect the deduction of taxes that a shareholder would pay on Fund distributions or the redemption of Fund shares.
Subject to investment risks, including possible loss of the principal amount invested.
Returns for periods less than 1 year are cumulative.
| * | Fund inception date of 12/30/09. |
| (1) | Ratios as of the Prospectus dated August 31, 2017 and may differ from the ratios presented in the Financial Highlights. |
| (2) | Vulcan Value Partners, LLC (“Vulcan” or the “Adviser”) has contractually agreed to limit the Fund’s total annual fund operating expenses (exclusive of Acquired Fund Fees and Expenses, brokerage expenses, interest expense, taxes and extraordinary expenses) to 1.25% of the Fund’s average daily net assets. This agreement (the “Expense Agreement”) is in effect through August 31, 2018. The Adviser will be permitted to recover, on a class-by-class basis, expenses it has borne through the Expense Agreement to the extent that the Fund’s expenses in later periods fall below the expense cap in effect at the time of waiver or reimbursement. Notwithstanding the foregoing, the Fund will not be obligated to pay any such fees and expenses more than three years after the end of the fiscal year in which the fees or expenses were foregone or reimbursed. The Adviser may not discontinue or modify this waiver prior to August 31, 2018 without the approval by the Fund’s Board of Trustees. |
| (3) | The Russell 2000® Value Index is presented here as an additional index, and measures the performance of small-cap value segment of the U.S.equity universe. It includes those Russell 2000® companies with lower price-to-book ratios and lower forecasted growth values. The index is not actively managed and does not reflect any deductions for fees, expense or taxes. An investor may not invest directly in an index. |
| (4) | The Russell 2000® Index is presented here as an additional index, and measures the performance of the small-cap segment of the U.S. equity universe. The Russell 2000® Index is a subset of the Russell 3000® Index representing approximately 8% of the total market capitalization of that index. It includes approximately 2,000 of the smallest securities based on a combination of their market cap and current index membership. The index is not actively managed and does not reflect any deductions for fees, expense or taxes. An investor may not invest directly in an index. |
| 8 | www.vulcanvaluepartners.com |
Fund Overview
April 30, 2018 (Unaudited)
Performance of $10,000 Initial Investment (for the period ended April 30, 2018)
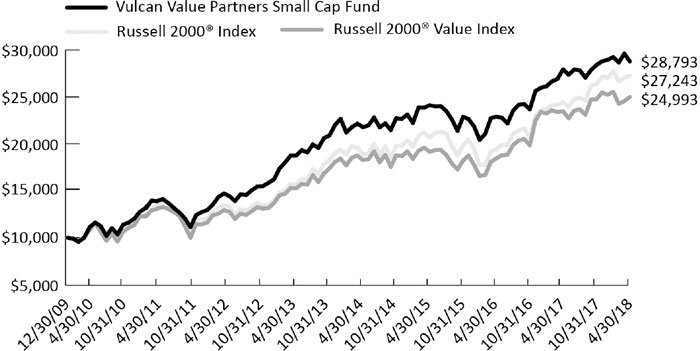
The chart above represents historical performance of a hypothetical investment of $10,000 in the Fund since inception. Past performance does not guarantee future results. This chart does not reflect the deduction of taxes that a shareholder would pay on Fund distributions or the redemption of Fund shares.
Investing in the Fund is subject to investment risks, including possible loss of the principal amount invested.
Industry Allocation (as a % of Net Assets)*
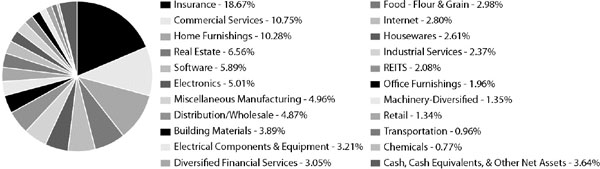
Top Ten Holdings (as a % of Net Assets)*
| Jones Lang LaSalle, Inc. | 6.56% |
| Axis Capital Holdings, Ltd. | 6.10% |
| Aspen Insurance Holdings, Ltd. | 5.69% |
| Select Comfort Corp. | 4.28% |
| Navigators Group, Inc. | 4.22% |
| ACI Worldwide, Inc. | 4.10% |
| Ibstock PLC | 3.89% |
| Howden Joinery Group PLC | 3.28% |
| Acuity Brands, Inc. | 3.21% |
| WESCO International, Inc. | 3.13% |
| Top Ten Holdings | 44.46% |
| * | Holdings are subject to change, and may not reflect the current or future position of the portfolio. |
| Annual Report | April 30, 2018 | 9 |
Disclosure of Fund Expenses
April 30, 2018 (Unaudited)
As a shareholder of the Vulcan Value Partners Small Cap Fund (the “Fund”), you will incur two types of costs: (1) transaction costs, including applicable redemption fees; and (2) ongoing costs, including management fees and other fund operating expenses. The following examples are intended to help you understand your ongoing costs (in dollars) of investing in the Fund and to compare these costs with the ongoing costs of investing in other mutual funds. The examples are based on an investment of $1,000 invested on November 1, 2017 and held until April 30, 2018.
Actual Expenses. The first line of each table below provides information about actual account values and actual expenses. You may use the information in this line, together with the amount you invested, to estimate the expenses that you paid over the period. Simply divide your account value by $1,000 (for example, an $8,600 account value divided by $1,000 = 8.6), then multiply the result by the number in the first line under the heading “Expenses Paid During Period” to estimate the expenses you paid on your account during this period.
Hypothetical Example for Comparison Purposes. The second line of the table below provides information about hypothetical account values and hypothetical expenses based on the Fund’s actual expense ratio and an assumed rate of return of 5% per year before expenses, which is not the Fund’s actual return. The hypothetical account values and expenses may not be used to estimate the actual ending account balance or expenses you paid for the period. You may use this information to compare the ongoing costs of investing in the Fund and other mutual funds. To do so, compare this 5% hypothetical example with the 5% hypothetical examples that appear in the shareholder reports of the other mutual funds.
Please note the expenses shown in the table are meant to highlight ongoing Fund costs only and do not reflect transactional costs, such as redemption fees or exchange fees. Therefore, the second line of the table below is useful in comparing your ongoing costs only, and will not help you determine the relative total costs of owning different funds. In addition, if these transactional costs were included, your costs would have been higher.
Vulcan Value Partners Small Cap Fund
| | Beginning
Account Value
11/1/17 | Ending
Account Value
4/30/18 | Expense Ratio(a) | Expenses Paid
During period
11/1/17 - 4/30/18(b) |
| Actual | $1,000.00 | $1,013.20 | 1.23% | $ 6.14 |
| Hypothetical (5% return before expenses) | $1,000.00 | $1,018.70 | 1.23% | $ 6.16 |
| (a) | The Fund's expense ratios have been annualized based on the Fund's most recent fiscal half-year expenses. |
| (b) | Expenses are equal to the Fund's annualized expense ratio multiplied by the average account value over the period, multiplied by the number of days in the most recent fiscal half-year (181)/365 (to reflect the half-year period). |
| 10 | www.vulcanvaluepartners.com |
| Vulcan Value Partners Fund | Statement of Investments |
April 30, 2018
| | | Shares | | | Value
(Note 2) | |
| COMMON STOCKS (97.49%) | | | | | | | | |
| Basic Materials (0.17%) | | | | | | | | |
| Chemicals (0.17%) | | | | | | | | |
| Axalta Coating Systems, Ltd.(a) | | | 73,727 | | | $ | 2,278,164 | |
| | | | | | | | | |
| TOTAL BASIC MATERIALS | | | | | | | 2,278,164 | |
| | | | | | | | | |
| Communications (6.23%) | | | | | | | | |
| Internet (6.23%) | | | | | | | | |
| Alphabet, Inc., Class C(a) | | | 48,656 | | | | 49,499,209 | |
| Facebook, Inc., Class A(a) | | | 188,312 | | | | 32,389,664 | |
| | | | | | | | 81,888,873 | |
| | | | | | | | | |
| TOTAL COMMUNICATIONS | | | | | | | 81,888,873 | |
| | | | | | | | | |
| Consumer, Cyclical (6.96%) | | | | | | | | |
| Lodging (3.08%) | | | | | | | | |
| Hilton Worldwide Holdings, Inc. | | | 513,846 | | | | 40,511,619 | |
| | | | | | | | | |
| Retail (3.88%) | | | | | | | | |
| AutoZone, Inc.(a) | | | 44,266 | | | | 27,645,002 | |
| O’Reilly Automotive, Inc.(a) | | | 91,051 | | | | 23,315,430 | |
| | | | | | | | 50,960,432 | |
| | | | | | | | | |
| TOTAL CONSUMER, CYCLICAL | | | | | | | 91,472,051 | |
| | | | | | | | | |
| Consumer, Non-cyclical (19.02%) | | | | | | | | |
| Commercial Services (3.93%) | | | | | | | | |
| Moody’s Corp. | | | 82,209 | | | | 13,334,300 | |
| S&P Global, Inc. | | | 136,878 | | | | 25,815,191 | |
| Sabre Corp. | | | 605,748 | | | | 12,502,638 | |
| | | | | | | | 51,652,129 | |
| | | | | | | | | |
| Healthcare Services (4.53%) | | | | | | | | |
| Aetna, Inc. | | | 234,409 | | | | 41,970,931 | |
| Anthem, Inc. | | | 74,152 | | | | 17,499,131 | |
| | | | | | | | 59,470,062 | |
| | | | | | | | | |
| Pharmaceuticals (10.56%) | | | | | | | | |
| AmerisourceBergen Corp. | | | 499,312 | | | | 45,227,681 | |
| Cardinal Health, Inc. | | | 635,212 | | | | 40,761,554 | |
| McKesson Corp. | | | 338,285 | | | | 52,843,500 | |
| | | | | | | | 138,832,735 | |
| | | | | | | | | |
| TOTAL CONSUMER, NON-CYCLICAL | | | | | | | 249,954,926 | |
| Annual Report | April 30, 2018 | 11 |
| Statement of Investments | Vulcan Value Partners Fund |
April 30, 2018
| | | Shares | | | Value
(Note 2) | |
| Energy (6.32%) | | | | | | |
| Oil & Gas Services (6.32%) | | | | | | | | |
| National Oilwell Varco, Inc. | | | 2,149,678 | | | $ | 83,128,048 | |
| | | | | | | | | |
| TOTAL ENERGY | | | | | | | 83,128,048 | |
| | | | | | | | | |
| Financial (26.42%) | | | | | | | | |
| Banks (9.24%) | | | | | | | | |
| Bank of New York Mellon Corp. | | | 712,086 | | | | 38,815,808 | |
| Northern Trust Corp. | | | 306,095 | | | | 32,675,641 | |
| State Street Corp. | | | 500,235 | | | | 49,913,448 | |
| | | | | | | | 121,404,897 | |
| | | | | | | | | |
| Diversified Financial Services (7.74%) | | | | | | | | |
| Mastercard, Inc., Class A | | | 282,928 | | | | 50,437,575 | |
| Visa, Inc., Class A | | | 404,776 | | | | 51,357,979 | |
| | | | | | | | 101,795,554 | |
| | | | | | | | | |
| Insurance (8.91%) | | | | | | | | |
| Axis Capital Holdings, Ltd. | | | 582,647 | | | | 34,201,379 | |
| Everest Re Group, Ltd. | | | 130,619 | | | | 30,391,122 | |
| Swiss Re AG | | | 550,249 | | | | 52,559,607 | |
| | | | | | | | 117,152,108 | |
| | | | | | | | | |
| Real Estate (0.53%) | | | | | | | | |
| CBRE Group, Inc., Class A(a) | | | 153,347 | | | | 6,948,153 | |
| | | | | | | | | |
| TOTAL FINANCIAL | | | | | | | 347,300,712 | |
| | | | | | | | | |
| Industrial (9.40%) | | | | | | | | |
| Aerospace & Defense (3.54%) | | | | | | | | |
| Airbus SE | | | 395,912 | | | | 46,567,280 | |
| | | | | | | | | |
| Miscellaneous Manufacturing (2.93%) | | | | | | | | |
| Parker-Hannifin Corp. | | | 234,187 | | | | 38,551,864 | |
| | | | | | | | | |
| Transportation (2.93%) | | | | | | | | |
| United Parcel Service, Inc., Class B | | | 338,659 | | | | 38,437,796 | |
| | | | | | | | | |
| TOTAL INDUSTRIAL | | | | | | | 123,556,940 | |
| | | | | | | | | |
| Pharmaceuticals (5.31%) | | | | | | | | |
| Pharmacy Services (5.31%) | | | | | | | | |
| CVS Health Corp. | | | 999,606 | | | | 69,802,487 | |
| | | | | | | | | |
| TOTAL PHARMACEUTICALS | | | | | | | 69,802,487 | |
| 12 | www.vulcanvaluepartners.com |
| Vulcan Value Partners Fund | Statement of Investments |
April 30, 2018
| | | Shares | | | Value
(Note 2) | |
| Technology (17.66%) | | | | | | |
| Semiconductors (9.21%) | | | | | | |
| Qorvo, Inc.(a) | | | 850,124 | | | $ | 57,298,358 | |
| Skyworks Solutions, Inc. | | | 734,744 | | | | 63,746,389 | |
| | | | | | | | 121,044,747 | |
| | | | | | | | | |
| Software (8.45%) | | | | | | | | |
| Oracle Corp. | | | 2,433,194 | | | | 111,123,970 | |
| | | | | | | | | |
| TOTAL TECHNOLOGY | | | | | | | 232,168,717 | |
| | | | | | | | | |
| TOTAL COMMON STOCKS | | | | | | | | |
| (Cost $1,050,911,009) | | | | | | | 1,281,550,918 | |
| | | 7-Day
Yield | | | Shares | | | Value
(Note 2) | |
| SHORT TERM INVESTMENTS (1.52%) | | | | | | | | | | | | |
| Money Market Fund (1.52%) | | | | | | | | | | | | |
| Dreyfus Treasury Prime Cash Management Fund, Institutional Shares | | | 1.537% | | | | 19,922,860 | | | | 19,922,860 | |
| | | | | | | | | | | | | |
| TOTAL SHORT TERM INVESTMENTS | | | | | | | | | | | | |
| (Cost $19,922,860) | | | | | | | | | | | 19,922,860 | |
| | | | | | | | | | | | | |
| TOTAL INVESTMENTS (99.01%) | | | | | | | | | | | | |
| (Cost $1,070,833,869) | | | | | | | | | | $ | 1,301,473,778 | |
| | | | | | | | | | | | | |
| Other Assets In Excess Of Liabilities (0.99%) | | | | | | | | | | | 13,044,810 | |
| | | | | | | | | | | | | |
| NET ASSETS (100.00%) | | | | | | | | | | $ | 1,314,518,588 | |
| (a) | Non-Income Producing Security. |
For Fund compliance purposes, the Fund’s industry classifications refer to any one or more of the industry sub-classifications used by one or more widely recognized market indexes or ratings group indexes, and/or as defined by Fund management. This definition may not apply for purposes of this report, which may combine industry sub-classifications for reporting ease. Industries are shown as a percentage of net assets.
See Accompanying Notes to Financial Statements.
| Annual Report | April 30, 2018 | 13 |
| Statement of Investments | Vulcan Value Partners Small Cap Fund |
April 30, 2018
| | | Shares | | | Value
(Note 2) | |
| COMMON STOCKS (96.36%) | | | | | | | | |
| Basic Materials (0.77%) | | | | | | | | |
| Chemicals (0.77%) | | | | | | | | |
| Versum Materials, Inc. | | | 262,750 | | | $ | 9,243,545 | |
| | | | | | | | | |
| TOTAL BASIC MATERIALS | | | | | | | 9,243,545 | |
| | | | | | | | | |
| Communications (2.80%) | | | | | | | | |
| Internet (2.80%) | | | | | | | | |
| Despegar.com Corp.(a) | | | 1,141,406 | | | | 33,511,680 | |
| | | | | | | | | |
| TOTAL COMMUNICATIONS | | | | | | | 33,511,680 | |
| | | | | | | | | |
| Consumer, Cyclical (21.06%) | | | | | | | | |
| Distribution/Wholesale (4.87%) | | | | | | | | |
| Ahlsell AB | | | 3,483,156 | | | | 20,843,288 | |
| WESCO International, Inc.(a) | | | 627,676 | | | | 37,378,106 | |
| | | | | | | | 58,221,394 | |
| | | | | | | | | |
| Home Furnishings (10.28%) | | | | | | | | |
| Howden Joinery Group PLC | | | 5,979,364 | | | | 39,240,954 | |
| Select Comfort Corp.(a) | | | 1,806,550 | | | | 51,197,627 | |
| Tempur Sealy International, Inc.(a) | | | 728,271 | | | | 32,590,127 | |
| | | | | | | | 123,028,708 | |
| | | | | | | | | |
| Housewares (2.61%) | | | | | | | | |
| Tupperware Brands Corp. | | | 700,800 | | | | 31,227,648 | |
| | | | | | | | | |
| Office Furnishings (1.96%) | | | | | | | | |
| Herman Miller, Inc. | | | 765,099 | | | | 23,488,539 | |
| | | | | | | | | |
| Retail (1.34%) | | | | | | | | |
| Halfords Group PLC | | | 3,072,283 | | | | 16,021,774 | |
| | | | | | | | | |
| TOTAL CONSUMER, CYCLICAL | | | | | | | 251,988,063 | |
| | | | | | | | | |
| Consumer, Non-cyclical (13.73%) | | | | | | | | |
| Commercial Services (10.75%) | | | | | | | | |
| Sabre Corp. | | | 1,747,231 | | | | 36,062,848 | |
| Savills PLC | | | 2,638,132 | | | | 35,683,586 | |
| ServiceMaster Global Holdings, Inc.(a) | | | 476,904 | | | | 24,131,342 | |
| Sotheby’s(a) | | | 621,074 | | | | 32,792,707 | |
| | | | | | | | 128,670,483 | |
| 14 | www.vulcanvaluepartners.com |
| Vulcan Value Partners Small Cap Fund | Statement of Investments |
April 30, 2018
| | | Shares | | | Value
(Note 2) | |
| Consumer, Non-cyclical (continued) | | | | | | | | |
| Food - Flour & Grain (2.98%) | | | | | | | | |
| Ebro Foods SA, ADR | | | 1,482,378 | | | $ | 35,606,720 | |
| | | | | | | | | |
| TOTAL CONSUMER, NON-CYCLICAL | | | | | | | 164,277,203 | |
| | | | | | | | | |
| Financial (30.36%) | | | | | | | | |
| Diversified Financial Services (3.05%) | | | | | | | | |
| Credit Acceptance Corp.(a) | | | 58,064 | | | | 19,209,894 | |
| Virtus Investment Partners, Inc. | | | 149,889 | | | | 17,289,696 | |
| | | | | | | | 36,499,590 | |
| | | | | | | | | |
| Insurance (18.67%) | | | | | | | | |
| Aspen Insurance Holdings, Ltd. | | | 1,605,154 | | | | 68,138,787 | |
| Axis Capital Holdings, Ltd. | | | 1,242,782 | | | | 72,951,303 | |
| Everest Re Group, Ltd. | | | 136,405 | | | | 31,737,351 | |
| Navigators Group, Inc. | | | 894,387 | | | | 50,532,866 | |
| | | | | | | | 223,360,307 | |
| | | | | | | | | |
| Real Estate (6.56%) | | | | | | | | |
| Jones Lang LaSalle, Inc. | | | 463,060 | | | | 78,493,301 | |
| | | | | | | | | |
| REITS (2.08%) | | | | | | | | |
| Outfront Media, Inc. | | | 1,324,991 | | | | 24,843,581 | |
| | | | | | | | | |
| TOTAL FINANCIAL | | | | | | | 363,196,779 | |
| | | | | | | | | |
| Industrial (19.38%) | | | | | | | | |
| Building Materials (3.89%) | | | | | | | | |
| Ibstock PLC | | | 11,360,200 | | | | 46,512,143 | |
| | | | | | | | | |
| Electrical Components & Equipment (3.21%) | | | | | | | | |
| Acuity Brands, Inc. | | | 320,609 | | | | 38,399,340 | |
| | | | | | | | | |
| Electronics (5.01%) | | | | | | | | |
| Ituran Location and Control, Ltd. | | | 1,159,109 | | | | 36,338,067 | |
| Woodward, Inc. | | | 328,122 | | | | 23,605,097 | |
| | | | | | | | 59,943,164 | |
| | | | | | | | | |
| Machinery-Diversified (1.35%) | | | | | | | | |
| Concentric AB | | | 760,342 | | | | 12,451,456 | |
| Lindsay Corp. | | | 42,788 | | | | 3,759,354 | |
| | | | | | | | 16,210,810 | |
| | | | | | | | | |
| Miscellaneous Manufacturing (4.96%) | | | | | | | | |
| Actuant Corp., Class A | | | 440,879 | | | | 10,382,700 | |
| Carlisle Cos., Inc. | | | 280,602 | | | | 30,229,253 | |
| Annual Report | April 30, 2018 | 15 |
| Statement of Investments | Vulcan Value Partners Small Cap Fund |
April 30, 2018
| | | Shares | | | Value
(Note 2) | |
| Industrial (continued) | | | | | | | | |
| Miscellaneous Manufacturing (continued) | | | | | | | | |
| Crane Co. | | | 207,930 | | | $ | 17,391,265 | |
| Donaldson Co., Inc. | | | 29,975 | | | | 1,326,694 | |
| | | | | | | | 59,329,912 | |
| | | | | | | | | |
| Transportation (0.96%) | | | | | | | | |
| Forward Air Corp. | | | 212,586 | | | | 11,477,518 | |
| | | | | | | | | |
| TOTAL INDUSTRIAL | | | | | | | 231,872,887 | |
| | | | | | | | | |
| Retail (2.37%) | | | | | | | | |
| Industrial Services (2.37%) | | | | | | | | |
| MSC Industrial Direct Co., Inc., Class A | | | 328,190 | | | | 28,368,744 | |
| | | | | | | | | |
| TOTAL RETAIL | | | | | | | 28,368,744 | |
| | | | | | | | | |
| Technology (5.89%) | | | | | | | | |
| Software (5.89%) | | | | | | | | |
| ACI Worldwide, Inc.(a) | | | 2,109,079 | | | | 49,036,087 | |
| Lectra | | | 822,650 | | | | 21,458,141 | |
| | | | | | | | 70,494,228 | |
| | | | | | | | | |
| TOTAL TECHNOLOGY | | | | | | | 70,494,228 | |
| | | | | | | | | |
| TOTAL COMMON STOCKS | | | | | | | | |
| (Cost $980,367,329) | | | | | | | 1,152,953,129 | |
| | | 7-Day
Yield | | | Shares | | | Value
(Note 2) | |
| SHORT TERM INVESTMENTS (4.70%) | | | | | | | | | | | | |
| Money Market Fund (4.70%) | | | | | | | | | | | | |
| Dreyfus Treasury Prime Cash Management Fund, Institutional Shares | | | 1.537% | | | | 56,265,228 | | | | 56,265,228 | |
| | | | | | | | | | | | | |
| TOTAL SHORT TERM INVESTMENTS | | | | | | | | | | | | |
| (Cost $56,265,228) | | | | | | | | | | | 56,265,228 | |
| | | | | | | | | | | | | |
| TOTAL INVESTMENTS (101.06%) | | | | | | | | | | | | |
| (Cost $1,036,632,557) | | | | | | | | | | $ | 1,209,218,357 | |
| | | | | | | | | | | | | |
| Liabilities In Excess Of Other Assets (-1.06%) | | | | | | | | | | | (12,660,113 | ) |
| | | | | | | | | | | | | |
| NET ASSETS (100.00%) | | | | | | | | | | $ | 1,196,558,244 | |
| (a) | Non-Income Producing Security. |
| 16 | www.vulcanvaluepartners.com |
| Vulcan Value Partners Small Cap Fund | Statement of Investments |
April 30, 2018
For Fund compliance purposes, the Fund’s industry classifications refer to any one or more of the industry sub-classifications used by one or more widely recognized market indexes or ratings group indexes, and/or as defined by Fund management. This definition may not apply for purposes of this report, which may combine industry sub-classifications for reporting ease. Industries are shown as a percentage of net assets.
See Accompanying Notes to Financial Statements.
| Annual Report | April 30, 2018 | 17 |
Statements of Assets and Liabilities
April 30, 2018
| | | Vulcan Value
Partners Fund | | | Vulcan Value
Partners Small
Cap Fund | |
| ASSETS: | | | | | | |
| Investments, at value | | $ | 1,301,473,778 | | | $ | 1,209,218,357 | |
| Receivable for investments sold | | | 18,778,691 | | | | – | |
| Receivable for shares sold | | | 910,548 | | | | 581,652 | |
| Dividends receivable | | | 3,422,734 | | | | 1,393,698 | |
| Other assets | | | 16,662 | | | | 21,677 | |
| Total assets | | | 1,324,602,413 | | | | 1,211,215,384 | |
| | | | | | | | | |
| LIABILITIES: | | | | | | | | |
| Payable for investments purchased | | | 8,338,416 | | | | 12,442,047 | |
| Payable for shares redeemed | | | 468,097 | | | | 851,109 | |
| Payable to adviser | | | 1,069,309 | | | | 1,156,277 | |
| Payable for administration fees | | | 62,639 | | | | 58,640 | |
| Payable for transfer agency fees | | | 16,934 | | | | 15,290 | |
| Payable for delegated transfer agent equivalent services fees | | | 22,938 | | | | 38,214 | |
| Payable for professional fees | | | 26,202 | | | | 25,765 | |
| Payable for trustee fees and expenses | | | 14,076 | | | | 12,964 | |
| Payable for principal financial officer fees | | | 434 | | | | 400 | |
| Accrued expenses and other liabilities | | | 64,780 | | | | 56,434 | |
| Total liabilities | | | 10,083,825 | | | | 14,657,140 | |
| NET ASSETS | | $ | 1,314,518,588 | | | $ | 1,196,558,244 | |
| | | | | | | | | |
| NET ASSETS CONSIST OF: | | | | | | | | |
| | | | | | | | | |
| Paid-in capital (Note 5) | | $ | 1,043,428,482 | | | $ | 1,009,065,147 | |
| Accumulated net investment income | | | 3,600,850 | | | | – | |
| Accumulated net realized gain | | | 36,865,122 | | | | 14,938,670 | |
| Net unrealized appreciation | | | 230,624,134 | | | | 172,554,427 | |
| NET ASSETS | | $ | 1,314,518,588 | | | $ | 1,196,558,244 | |
| | | | | | | | | |
| INVESTMENTS, AT COST | | $ | 1,070,833,869 | | | $ | 1,036,632,557 | |
| | | | | | | | | |
| PRICING OF SHARES: | | | | | | | | |
| Net Asset Value, offering and redemption price per share | | $ | 21.39 | | | $ | 19.52 | |
| Shares of beneficial interest outstanding (unlimited number of shares, no par value common stock authorized) | | | 61,452,002 | | | | 61,298,863 | |
See Accompanying Notes to Financial Statements.
| 18 | www.vulcanvaluepartners.com |
Statements of Operations
For the Year Ended April 30, 2018
| | | Vulcan Value
Partners Fund | | | Vulcan Value
Partners Small
Cap Fund | |
| INVESTMENT INCOME: | | | | | | | | |
| Dividends | | $ | 20,972,184 | | | $ | 16,193,997 | |
| Foreign taxes withheld | | | (552,340 | ) | | | (422,948 | ) |
| Total investment income | | | 20,419,844 | | | | 15,771,049 | |
| | | | | | | | | |
| EXPENSES: | | | | | | | | |
| Investment advisory fees (Note 6) | | | 13,287,056 | | | | 13,769,170 | |
| Administrative fees | | | 373,320 | | | | 337,410 | |
| Transfer agency fees | | | 121,848 | | | | 105,749 | |
| Delegated transfer agent equivalent services fees | | | 139,770 | | | | 236,801 | |
| Professional fees | | | 38,701 | | | | 37,737 | |
| Custodian fees | | | 199,886 | | | | 174,836 | |
| Principal financial officer fees | | | 5,264 | | | | 4,736 | |
| Trustee fees and expenses | | | 29,416 | | | | 26,849 | |
| Recoupment of previously waived fees | | | – | | | | 59,895 | |
| ReFlow Fees (Note 2) | | | 77,082 | | | | – | |
| Other | | | 69,899 | | | | 73,939 | |
| Total net expenses | | | 14,342,242 | | | | 14,827,122 | |
| NET INVESTMENT INCOME | | | 6,077,602 | | | | 943,927 | |
| | | | | | | | | |
| Net realized gain on investments | | | 70,410,507 | (a) | | | 15,781,063 | |
| Net realized gain on foreign currency transactions | | | 28,896 | | | | 21,979 | |
| Net realized gain | | | 70,439,403 | | | | 15,803,042 | |
| Net change in unrealized appreciation of investments | | | 84,057,602 | | | | 18,428,897 | |
| Net change in unrealized depreciation on translation of assets and liabilities denominated in foreign currencies | | | (40,843 | ) | | | (61,841 | ) |
| Net change in unrealized appreciation | | | 84,016,759 | | | | 18,367,056 | |
| NET REALIZED AND UNREALIZED GAIN ON INVESTMENTS | | | 154,456,162 | | | | 34,170,098 | |
| NET INCREASE IN NET ASSETS RESULTING FROM OPERATIONS | | $ | 160,533,764 | | | $ | 35,114,025 | |
| (a) | See Note 2 for gain/(loss) on In-Kind transactions. |
See Accompanying Notes to Financial Statements.
| Annual Report | April 30, 2018 | 19 |
| Statements of Changes in Net Assets | Vulcan Value Partners Fund |
| | | For the
Year Ended
April 30, 2018 | | | For the
Year Ended
April 30, 2017 | |
| OPERATIONS: | | | | | | |
| Net investment income | | $ | 6,077,602 | | | $ | 13,943,068 | |
| Net realized gain | | | 70,439,403 | | | | 89,567,315 | |
| Net change in unrealized appreciation | | | 84,016,759 | | | | 69,313,571 | |
| Net increase in net assets resulting from operations | | | 160,533,764 | | | | 172,823,954 | |
| | | | | | | | | |
| DISTRIBUTIONS TO SHAREHOLDERS (Note 3): | | | | | | | | |
| From net investment income | | | (7,670,305 | ) | | | (17,969,116 | ) |
| From net realized gains on investments | | | (14,527,436 | ) | | | – | |
| Net decrease in net assets from distributions | | | (22,197,741 | ) | | | (17,969,116 | ) |
| | | | | | | | | |
| SHARE TRANSACTIONS (Note 5): | | | | | | | | |
| Proceeds from sales of shares | | | 160,766,374 | | | | 162,065,966 | |
| Issued to shareholders in reinvestment of distributions | | | 17,693,956 | | | | 13,362,586 | |
| Cost of shares redeemed, net of redemption fees | | | (286,946,421 | ) | | | (573,695,164 | ) |
| Net decrease from share transactions | | | (108,486,091 | ) | | | (398,266,612 | ) |
| | | | | | | | | |
| Net increase/(decrease) in net assets | | | 29,849,932 | | | | (243,411,774 | ) |
| | | | | | | | | |
| NET ASSETS: | | | | | | | | |
| Beginning of year | | | 1,284,668,656 | | | | 1,528,080,430 | |
| End of year* | | $ | 1,314,518,588 | | | $ | 1,284,668,656 | |
| | | | | | | | | |
| *Includes accumulated net investment income of: | | $ | 3,600,850 | | | $ | 5,164,657 | |
See Accompanying Notes to Financial Statements.
| 20 | www.vulcanvaluepartners.com |
| Vulcan Value Partners Small Cap Fund | Statements of Changes in Net Assets |
| | | For the
Year Ended
April 30, 2018 | | | For the
Year Ended
April 30, 2017 | |
| OPERATIONS: | | | | | | |
| Net investment income | | $ | 943,927 | | | $ | 2,130,748 | |
| Net realized gain | | | 15,803,042 | | | | 114,144,015 | |
| Net change in unrealized appreciation | | | 18,367,056 | | | | 123,772,371 | |
| Net increase in net assets resulting from operations | | | 35,114,025 | | | | 240,047,134 | |
| | | | | | | | | |
| DISTRIBUTIONS TO SHAREHOLDERS (Note 3): | | | | | | | | |
| From net investment income | | | (2,029,542 | ) | | | (3,924,578 | ) |
| From net realized gains on investments | | | (70,565,783 | ) | | | – | |
| Net decrease in net assets from distributions | | | (72,595,325 | ) | | | (3,924,578 | ) |
| | | | | | | | | |
| SHARE TRANSACTIONS (Note 5): | | | | | | | | |
| Proceeds from sales of shares | | | 245,328,871 | | | | 274,573,708 | |
| Issued to shareholders in reinvestment of distributions | | | 58,614,533 | | | | 2,400,082 | |
| Cost of shares redeemed, net of redemption fees | | | (325,509,690 | ) | | | (404,497,434 | ) |
| Net decrease from share transactions | | | (21,566,286 | ) | | | (127,523,644 | ) |
| | | | | | | | | |
| Net increase/(decrease) in net assets | | | (59,047,586 | ) | | | 108,598,912 | |
| | | | | | | | | |
| NET ASSETS: | | | | | | | | |
| Beginning of year | | | 1,255,605,830 | | | | 1,147,006,918 | |
| End of year* | | $ | 1,196,558,244 | | | $ | 1,255,605,830 | |
| | | | | | | | | |
| *Includes accumulated net investment income/(loss) of: | | $ | – | | | $ | 1,029,011 | |
See Accompanying Notes to Financial Statements.
| Annual Report | April 30, 2018 | 21 |
Financial Highlights
For a share outstanding throughout the years presented.
| NET ASSET VALUE, BEGINNING OF PERIOD |
| INCOME/(LOSS) FROM OPERATIONS: |
| Net investment income(a) |
| Net realized and unrealized gain/(loss) on investments |
| Total from investment operations |
| |
| LESS DISTRIBUTIONS TO SHAREHOLDERS: |
| From net investment income |
| From net realized gains on investments |
| Total distributions |
| |
| Redemption fees added to paid-in capital |
| Increase/(decrease) in net asset value |
| NET ASSET VALUE, END OF YEAR |
| |
| Total return |
| |
| RATIOS AND SUPPLEMENTAL DATA: |
| Net assets, end of year (000's) |
| |
| Ratio of expenses to average net assets without fee waivers/reimbursements |
| Ratio of expenses to average net assets including fee waivers/reimbursements |
| Net investment income to average net assets including fee waivers/reimbursements |
| |
| Portfolio turnover rate |
| (a) | Per share numbers have been calculated using the average shares method. |
| (b) | Less than $0.005 per share. |
See Accompanying Notes to Financial Statements.
| 22 | www.vulcanvaluepartners.com |
Vulcan Value Partners Fund
For the Year
Ended April 30,
2018 | | | For the Year
Ended April 30,
2017 | | | For the Year
Ended April 30,
2016 | | | For the Year
Ended April 30,
2015 | | | For the Year
Ended April 30,
2014 | |
| $ | 19.30 | | | $ | 17.17 | | | $ | 19.97 | | | $ | 18.20 | | | $ | 15.28 | |
| | | | | | | | | | | | | | | | | | | |
| | 0.09 | | | | 0.18 | | | | 0.20 | | | | 0.22 | | | | 0.14 | |
| | 2.35 | | | | 2.18 | | | | (1.51 | ) | | | 2.77 | | | | 3.33 | |
| | 2.44 | | | | 2.36 | | | | (1.31 | ) | | | 2.99 | | | | 3.47 | |
| | | | | | | | | | | | | | | | | | | |
| | (0.12 | ) | | | (0.23 | ) | | | (0.13 | ) | | | (0.17 | ) | | | (0.11 | ) |
| | (0.23 | ) | | | – | | | | (1.36 | ) | | | (1.05 | ) | | | (0.44 | ) |
| | (0.35 | ) | | | (0.23 | ) | | | (1.49 | ) | | | (1.22 | ) | | | (0.55 | ) |
| | | | | | | | | | | | | | | | | | | |
| | 0.00 | (b) | | | 0.00 | (b) | | | 0.00 | (b) | | | 0.00 | (b) | | | 0.00 | (b) |
| | 2.09 | | | | 2.13 | | | | (2.80 | ) | | | 1.77 | | | | 2.92 | |
| $ | 21.39 | | | $ | 19.30 | | | $ | 17.17 | | | $ | 19.97 | | | $ | 18.20 | |
| | | | | | | | | | | | | | | | | | | |
| | 12.72 | % | | | 13.85 | % | | | (6.49 | %) | | | 16.61 | % | | | 22.84 | % |
| | | | | | | | | | | | | | | | | | | |
| $ | 1,314,519 | | | $ | 1,284,669 | | | $ | 1,528,080 | | | $ | 1,770,104 | | | $ | 929,829 | |
| | | | | | | | | | | | | | | | | | | |
| | 1.08 | % | | | 1.07 | % | | | 1.08 | % | | | 1.08 | % | | | 1.09 | % |
| | 1.08 | % | | | 1.07 | % | | | 1.08 | % | | | 1.08 | % | | | 1.09 | % |
| | 0.46 | % | | | 1.01 | % | | | 1.10 | % | | | 1.12 | % | | | 0.80 | % |
| | | | | | | | | | | | | | | | | | | |
| | 50 | % | | | 49 | % | | | 85 | % | | | 64 | % | | | 56 | % |
| Annual Report | April 30, 2018 | 23 |
Financial Highlights
For a share outstanding throughout the years presented.
| NET ASSET VALUE, BEGINNING OF PERIOD |
| INCOME/(LOSS) FROM OPERATIONS: |
| Net investment income/(loss)(a) |
| Net realized and unrealized gain/(loss) on investments |
| Total from investment operations |
| |
| LESS DISTRIBUTIONS TO SHAREHOLDERS: |
| From net investment income |
| From net realized gains on investments |
| Total distributions |
| |
| Redemption fees added to paid-in capital |
| Increase/(decrease) in net asset value |
| NET ASSET VALUE, END OF YEAR |
| |
| Total return |
| |
| RATIOS AND SUPPLEMENTAL DATA: |
| Net assets, end of year (000's) |
| |
| Ratio of expenses to average net assets without fee waivers/reimbursements |
| Ratio of expenses to average net assets including fee waivers/reimbursements |
| |
| Net investment income/(loss) to average net assets including fee waivers/reimbursements |
| |
| Portfolio turnover rate |
| (a) | Per share numbers have been calculated using the average shares method. |
| (b) | Less than $0.005 per share. |
See Accompanying Notes to Financial Statements.
| 24 | www.vulcanvaluepartners.com |
Vulcan Value Partners Small Cap Fund
For the Year
Ended April 30,
2018 | | | For the Year
Ended April 30,
2017 | | | For the Year
Ended April 30,
2016 | | | For the Year
Ended April 30,
2015 | | | For the Year
Ended April 30,
2014 | |
| $ | 20.16 | | | $ | 16.58 | | | $ | 18.61 | | | $ | 18.74 | | | $ | 16.97 | |
| | | | | | | | | | | | | | | | | | | |
| | 0.02 | | | | 0.03 | | | | 0.10 | | | | 0.10 | | | | (0.01 | ) |
| | 0.59 | | | | 3.61 | | | | (1.05 | ) | | | 1.77 | | | | 2.76 | |
| | 0.61 | | | | 3.64 | | | | (0.95 | ) | | | 1.87 | | | | 2.75 | |
| | | | | | | | | | | | | | | | | | | |
| | (0.03 | ) | | | (0.06 | ) | | | (0.06 | ) | | | (0.11 | ) | | | – | |
| | (1.22 | ) | | | – | | | | (1.02 | ) | | | (1.89 | ) | | | (0.98 | ) |
| | (1.25 | ) | | | (0.06 | ) | | | (1.08 | ) | | | (2.00 | ) | | | (0.98 | ) |
| | | | | | | | | | | | | | | | | | | |
| | 0.00 | (b) | | | 0.00 | (b) | | | 0.00 | (b) | | | 0.00 | (b) | | | 0.00 | (b) |
| | (0.64 | ) | | | 3.58 | | | | (2.03 | ) | | | (0.13 | ) | | | 1.77 | |
| $ | 19.52 | | | $ | 20.16 | | | $ | 16.58 | | | $ | 18.61 | | | $ | 18.74 | |
| | | | | | | | | | | | | | | | | | | |
| | 3.08 | % | | | 21.97 | % | | | (5.04 | %) | | | 10.74 | % | | | 16.11 | % |
| | | | | | | | | | | | | | | | | | | |
| $ | 1,196,558 | | | $ | 1,255,606 | | | $ | 1,147,007 | | | $ | 1,133,122 | | | $ | 1,066,246 | |
| | | | | | | | | | | | | | | | | | | |
| | 1.24 | % | | | 1.25 | % | | | 1.25 | % | | | 1.26 | % | | | 1.30 | % |
| | 1.24 | % | | | 1.25 | % | | | 1.25 | % | | | 1.25 | % | | | 1.25 | % |
| | | | | | | | | | | | | | | | | | | |
| | 0.08 | % | | | 0.18 | % | | | 0.61 | % | | | 0.56 | % | | | (0.05 | %) |
| | | | | | | | | | | | | | | | | | | |
| | 68 | % | | | 52 | % | | | 80 | % | | | 73 | % | | | 70 | % |
| Annual Report | April 30, 2018 | 25 |
Notes to Financial Statements
April 30, 2018
1. ORGANIZATION
Financial Investors Trust (the “Trust”) is organized as a Delaware statutory trust and is registered as an open-end management investment company under the Investment Company Act of 1940, as amended (“1940 Act”). The Trust consists of multiple separate portfolios or series. This annual report describes the Vulcan Value Partners Fund and Vulcan Value Partners Small Cap Fund (each a “Fund” and collectively, the “Funds”). The Funds seek to achieve long-term capital appreciation.
2. SIGNIFICANT ACCOUNTING POLICIES
The accompanying financial statements were prepared in accordance with accounting principles generally accepted in the United States of America (“U.S. GAAP”), including policies specific to investment companies. The preparation of financial statements in conformity with U.S. GAAP requires management to make certain estimates and assumptions that affect the reported amounts of assets and liabilities and disclosures of contingent assets and liabilities at the date of the financial statements and the reported amounts of revenue and expenses during the period. Actual results could differ from those estimates. The Funds are considered an investment company for financial reporting purposes under U.S. GAAP and follows the accounting and reporting guidance applicable to investment companies in the Financial Accounting Standards Board Accounting Standards Codification Topic 946. The following is a summary of significant accounting policies consistently followed by the Funds in preparation of their financial statements.
Investment Valuation: The Funds generally value their securities based on market prices determined at the close of regular trading on the New York Stock Exchange (“NYSE”), normally 4:00 p.m. Eastern Time, on each day the NYSE is open for trading.
For equity securities and mutual funds that are traded on an exchange, the market price is usually the closing sale or official closing price on that exchange. In the case of equity securities not traded on an exchange, or if such closing prices are not otherwise available, the securities are valued at the mean of the most recent bid and ask prices on such day. Redeemable securities issued by open-end registered investment companies are valued at the investment company’s applicable net asset value, with the exception of exchange-traded open-end investment companies, which are priced as equity securities.
The market price for debt obligations is generally the quote supplied by an independent third-party pricing service approved by the Board of Trustees (the “Board”), which may use a matrix, formula or other objective method that takes into consideration quotations from dealers, market transactions in comparable investments, market indices and yield curves. If vendors are unable to supply a quote, or if the quote supplied is deemed to be unreliable, the market price may be determined using quotations received from one or more broker–dealers that make a market in the security.
Equity securities that are primarily traded on foreign securities exchanges are valued at the preceding closing values of such securities on their respective exchanges, except when an occurrence subsequent to the time a value was so established is likely to have changed such value. In such an event, the fair values of those securities are determined in good faith through consideration of other factors in accordance with procedures established by and under the general supervision of the Board.
| 26 | www.vulcanvaluepartners.com |
Notes to Financial Statements
April 30, 2018
When such prices or quotations are not available, or when Vulcan Value Partners, LLC (the “Adviser”) believes that they are unreliable, securities may be priced using fair value procedures approved by the Board.
Fair Value Measurements: A three-tier hierarchy has been established to classify fair value measurements for disclosure purposes. Inputs refer broadly to the assumptions that market participants would use in pricing the asset or liability, including assumptions about risk. Inputs may be observable or unobservable. Observable inputs are inputs that reflect the assumptions market participants would use in pricing the asset or liability that are developed based on market data obtained from sources independent of the reporting entity. Unobservable inputs are inputs that reflect the reporting entity’s own assumptions about the assumptions market participants would use in pricing the asset or liability that are developed based on the best information available. Various inputs are used in determining the value of each Fund’s investments as of the reporting period end. The designated input levels are not necessarily an indication of the risk or liquidity associated with these investments. These inputs are categorized in the following hierarchy under applicable financial accounting standards:
| Level 1 – | Unadjusted quoted prices in active markets for identical investments, unrestricted assets or liabilities that the Funds have the ability to access at the measurement date; |
| Level 2 – | Quoted prices which are not active, quoted prices for similar assets or liabilities in active markets or inputs other than quoted prices that are observable (either directly or indirectly) for substantially the full term of the asset or liability; and |
| Level 3 – | Significant unobservable prices or inputs (including the Funds’ own assumptions in determining the fair value of investments) where there is little or no market activity for the asset or liability at the measurement date. |
The following is a summary of each input used to value each Fund’s investments as of April 30, 2018:
Vulcan Value Partners Fund:
| Investments in Securities at Value | | Level 1 -
Unadjusted
Quoted Prices | | | Level 2 -
Other Significant
Observable Inputs | | | Level 3 -
Significant
Unobservable
Inputs | | | Total | |
| Common Stocks(a) | | $ | 1,281,550,918 | | | $ | – | | | $ | – | | | $ | 1,281,550,918 | |
| Short Term Investments | | | 19,922,860 | | | | – | | | | – | | | | 19,922,860 | |
| TOTAL | | $ | 1,301,473,778 | | | $ | – | | | $ | – | | | $ | 1,301,473,778 | |
Vulcan Value Partners Small Cap Fund:
| Investments in Securities at Value | | Level 1 -
Unadjusted
Quoted Prices | | | Level 2 -
Other Significant
Observable Inputs | | | Level 3 -
Significant
Unobservable
Inputs | | | Total | |
| Common Stocks(a) | | $ | 1,152,953,129 | | | $ | – | | | $ | – | | | $ | 1,152,953,129 | |
| Short Term Investments | | | 56,265,228 | | | | – | | | | – | | | | 56,265,228 | |
| TOTAL | | $ | 1,209,218,357 | | | $ | – | | | $ | – | | | $ | 1,209,218,357 | |
| (a) | For detailed descriptions, see the accompanying Statements of Investments. |
| Annual Report | April 30, 2018 | 27 |
Notes to Financial Statements
April 30, 2018
The Funds recognize transfers between levels as of the end of period. For the year ended April 30, 2018, the Funds did not have any transfers between Level 1 and Level 2. For the year ended April 30, 2018, the Funds did not have any securities that used significant unobservable inputs (Level 3) in determining fair value.
Investment Transactions and Investment Income: Investment transactions are accounted for on the date the investments are purchased or sold (trade date). Realized gains and losses from investment transactions are reported on an identified cost basis, which is the same basis the Funds use for federal income tax purposes. Interest income, which includes accretion of discounts and amortization of premiums, is accrued and recorded as earned. Dividend income is recognized on the ex-dividend date or for certain foreign securities, as soon as information is available to the Funds. All of the realized and unrealized gains and losses and net investment income, are allocated daily to each class in proportion to its average daily net assets.
ReFlow Liquidity Program: Each Fund may participate in the ReFlow liquidity program, which is designed to provide an alternative liquidity source for mutual funds experiencing net redemptions of their shares. Pursuant to the program, ReFlow Fund, LLC (“ReFlow”) provides participating mutual funds with a source of cash to meet net shareholder redemptions by standing ready each business day to purchase fund shares up to the value of the net shares redeemed by other shareholders that are to settle the next business day. ReFlow will purchase shares of the Fund at net asset value and will not be subject to any investment minimums. Following purchases of Fund shares, ReFlow then generally redeems those shares when the Fund experiences net subscriptions, at the end of a maximum holding period determined by ReFlow (currently 28 days), or at other times as the Fund may request. ReFlow may choose to redeem its position in the Fund with an in-kind transfer of securities, instead of cash, enabling the Fund to avoid a realization of capital gains on the securities it transfers. ReFlow will not be subject to any short-term redemption fees. While ReFlow holds Fund shares, it will have the same rights and privileges with respect to those shares as any other shareholder. For use of the ReFlow service, a Fund pays a fee to ReFlow each time it purchases Fund shares, calculated by applying to the purchase amount a fee rate determined through an automated daily auction among participating mutual funds. The current minimum fee rate is 0.20% of the value of the Fund shares purchased by ReFlow although the Fund may submit a bid at a higher fee rate if it determines that doing so is in the best interest of Fund shareholders. In accordance with federal securities laws, ReFlow is prohibited from acquiring more than 3% of the outstanding voting securities of a Fund. There is no assurance that ReFlow will have sufficient funds available to meet the Funds’ liquidity needs on a particular day. During the fiscal year ended April 30, 2018, the Funds participated in ReFlow. Fees associated with ReFlow are disclosed in the Statements of Operations.
Real Estate Investment Trusts (“REITs”): The Funds may invest a portion of their assets in REITs and are subject to certain risks associated with direct investment in REITs. REITs may be affected by changes in the value of their underlying properties and by defaults by borrowers or tenants. REITs depend generally on their ability to generate cash flow to make distributions to shareowners, and certain REITs have self-liquidation provisions by which mortgages held may be paid in full and distributions of capital returns may be made at any time. In addition, the performance of a REIT may be affected by its failure to qualify for tax -free pass-through of income under the Internal Revenue Code of 1986, as amended (the “Code”), or its failure to maintain exemption from registration under the 1940 Act. A Fund’s investments in REITs may result in such Fund’s receipt of cash in excess of the REITs’ earnings. If the Fund receives such distributions all or
| 28 | www.vulcanvaluepartners.com |
Notes to Financial Statements
April 30, 2018
a portion of these distributions will constitute a return of capital to such Fund. Receiving a return of capital distribution from REITs will reduce the amount of income available to be distributed to Fund shareholders. Income from REITs generally will not be eligible for treatment as qualified dividend income. As the final character of the distributions is not known until reported by the REITs on their 1099s, the Funds utilize an average of the prior year’s reallocation information as an estimate for the current year character of distributions.
Foreign Securities: The Funds may directly purchase securities of foreign issuers. Investing in securities of foreign issuers involves special risks not typically associated with investing in securities of U.S. issuers. The risks include possible reevaluation of currencies, the inability to repatriate foreign currency, less complete financial information about companies and possible future adverse political and economic developments. Moreover, securities of many foreign issuers and their markets may be less liquid and their prices more volatile than those of securities of comparable U.S. issuers.
Foreign Currency Translation: The books and records of the Funds are maintained in U.S. dollars. Investment valuations and other assets and liabilities initially expressed in foreign currencies are converted each business day into U.S. dollars based upon current exchange rates. Prevailing foreign exchange rates may generally be obtained at the close of the NYSE (normally, 4:00 p.m. Eastern Time). The portion of realized and unrealized gains or losses on investments due to fluctuations in foreign currency exchange rates is not separately disclosed and is included in realized and unrealized gains or losses on investments, when applicable.
In-Kind Redemptions: On October 30, 2017, the Vulcan Value Partners Fund distributed portfolio securities rather than cash as payment for certain redemptions of fund shares (in-kind redemptions) in the amount of $37,345,537, and represented 2.84% of the Fund’s net assets on October 30, 2017. For financial reporting purposes, the Fund recognized gains on the in-kind redemptions in the amount of $18,903,352. For tax purposes, the gains are not recognized.
Trust Expenses: Some expenses of the Trust can be directly attributed to the Funds. Expenses which cannot be directly attributed are apportioned among all funds in the Trust based on average net assets of each fund.
Fund Expenses: Expenses that are specific to a Fund are charged directly to that Fund.
Federal Income Taxes: Each Fund complies with the requirements under Subchapter M of the Internal Revenue Code of 1986, as amended, applicable to regulated investment companies and intends to distribute substantially all of its net taxable income and net capital gains, if any, each year so that it will not be subject to excise tax on undistributed income and gains. The Funds are not subject to income taxes to the extent such distributions are made.
As of and during the year ended April 30, 2018, the Funds did not have a liability for any unrecognized tax benefits. The Funds file U.S. federal, state, and local tax returns as required. The Fund’s tax returns are subject to examination by the relevant tax authorities until expiration of the applicable statute of limitations, which is generally three years after the filing of the tax return for federal purposes and four years for most state returns. Tax returns for open years have incorporated no uncertain tax positions that require a provision for income taxes.
| Annual Report | April 30, 2018 | 29 |
Notes to Financial Statements
April 30, 2018
Distributions to Shareholders: Each Fund normally pays dividends and distributes capital gains, if any, on an annual basis. Income dividend distributions are derived from dividends and other income each Fund receives from its investments, including short-term capital gains. Long term capital gain distributions are derived from gains realized when each Fund sells a security it has owned for more than a year. Each Fund may make additional distributions and dividends at other times if the portfolio manager believes doing so may be necessary for each Fund to avoid or reduce taxes.
3. TAX BASIS INFORMATION
Reclassifications: As of April 30, 2018 permanent differences in book and tax accounting were reclassified. These differences had no effect on net assets and were primarily attributed to foreign currency transactions, book to tax distribution differences and in-kind redemptions. The reclassifications were as follows:
| Fund | | Paid-in
Capital | | | Accumulated
Net Investment
Income/(Loss) | | | Accumulated
Net Realized
Gain/(Loss) on
Investments | |
| Vulcan Value Partners Fund | | $ | 18,903,352 | | | $ | 28,896 | | | $ | (18,932,248 | ) |
| Vulcan Value Partners Small Cap Fund | | | – | | | | 56,604 | | | | (56,604 | ) |
Tax Basis of Investments: As of April 30, 2018, the aggregate cost of investments, gross unrealized appreciation/ (depreciation) and net unrealized appreciation for federal tax purposes was as follows:
| | | Vulcan Value
Partners Fund | | | Vulcan Value Partners
Small Cap Fund | |
| Gross appreciation (excess of value over tax cost) | | $ | 257,490,424 | | | $ | 201,336,622 | |
| Gross depreciation (excess of tax cost over value) | | | (36,592,834 | ) | | | (29,376,429 | ) |
| Net appreciation of foreign currency | | | (15,775 | ) | | | (31,373 | ) |
| Net unrealized appreciation | | $ | 220,881,815 | | | $ | 171,928,820 | |
| Cost of investments for income tax purposes | | $ | 1,080,576,188 | | | $ | 1,037,258,164 | |
Components of Earnings: As of April 30, 2018, components of distributable earnings were as follows:
| | | Vulcan Value
Partners Fund | | | Vulcan Value Partners
Small Cap Fund | |
| Undistributed ordinary income | | $ | 39,554,855 | | | $ | 6,601,307 | |
| Accumulated capital gains | | | 10,653,436 | | | | 8,962,970 | |
| Net unrealized appreciation on investments | | | 220,881,815 | | | | 171,928,820 | |
| Total | | $ | 271,090,106 | | | $ | 187,493,097 | |
| 30 | www.vulcanvaluepartners.com |
Notes to Financial Statements
April 30, 2018
Tax Basis of Distributions to Shareholders: The character of distributions made during the year from net investment income or net realized gains may differ from its ultimate characterization for federal income tax purposes. Also, due to the timing of dividend distributions, the fiscal year in which amounts are distributed may differ from the fiscal year in which the income or realized gain were recorded by each Fund.
The tax character of distributions paid by the Funds for the fiscal year ended April 30, 2018 and April 30, 2017 were as follows:
| | | Ordinary Income | | | Long-Term
Capital Gain | |
| 2018 | | | | | | |
| Vulcan Value Partners Fund | | $ | 22,197,741 | | | $ | – | |
| Vulcan Value Partners Small Cap Fund | | | 59,551,178 | | | | 13,044,147 | |
| | | Ordinary Income | | | Long-Term
Capital Gain | |
| 2017 | | | | | | |
| Vulcan Value Partners Fund | | $ | 17,969,116 | | | $ | – | |
| Vulcan Value Partners Small Cap Fund | | | 3,924,578 | | | | – | |
4. SECURITIES TRANSACTIONS
The cost of purchases and proceeds from sales of securities (excluding short-term securities and redemptions In-Kind) during the year ended April 30, 2018 were as follows:
| Fund | | Purchases of
Securities | | | Proceeds From
Sales of Securities | |
| Vulcan Value Partners Fund | | $ | 629,521,821 | | | $ | 710,720,312 | |
| Vulcan Value Partners Small Cap Fund | | | 733,038,113 | | | | 670,197,865 | |
5. SHARES OF BENEFICIAL INTEREST
The capitalization of the Trust consists of an unlimited number of shares of beneficial interest with no par value per share. Holders of the shares of the Funds of the Trust have one vote for each share held and a proportionate fraction of a vote for each fractional share. All shares issued and outstanding are fully paid and are transferable and redeemable at the option of the shareholder. Purchasers of the shares do not have any obligation to make payments to the Trust or its creditors solely by reason of the purchasers’ ownership of the shares. Shares have no pre-emptive rights.
Shares redeemed within 90 days of purchase may incur a 2% short-term redemption fee deducted from the redemption amount. The Vulcan Value Partners Fund and the Vulcan Value Partners Small Cap Fund retained $3,889 and $11,246, respectively, for the year ended April 30, 2018, and $34,938 and $32,740, respectively, for the year ended April 30, 2017, which is reflected in the “Cost of shares redeemed, net of redemption fees” in the Statements of Changes in Net Assets.
| Annual Report | April 30, 2018 | 31 |
Notes to Financial Statements
April 30, 2018
Transactions in shares of capital stock for the dates listed below were as follows:
Vulcan Value Partners Fund
| | | For the
Year Ended
April 30, 2018 | | | For the
Year Ended
April 30, 2017 | |
| Shares Sold | | | 7,896,160 | | | | 9,220,974 | |
| Shares Issued in Reinvestment of Dividends | | | 870,263 | | | | 737,043 | |
| Less Shares Redeemed | | | (13,886,874 | ) | | | (32,359,605 | ) |
| Net Decrease | | | (5,120,451 | ) | | | (22,401,588 | ) |
Vulcan Value Partners Small Cap Fund
| | | For the
Year Ended
April 30, 2018 | | | For the
Year Ended
April 30, 2017 | |
| Shares Sold | | | 12,345,631 | | | | 15,271,480 | |
| Shares Issued in Reinvestment of Dividends | | | 3,018,064 | | | | 125,989 | |
| Less Shares Redeemed | | | (16,352,775 | ) | | | (22,299,640 | ) |
| Net Decrease | | | (989,080 | ) | | | (6,902,171 | ) |
6. MANAGEMENT AND RELATED-PARTY TRANSACTIONS
The Adviser, subject to the authority of the Board, is responsible for the overall management and administration of the Funds’ business affairs. The Adviser manages the investments of the Funds in accordance with each Fund’s investment objective, policies and limitations and investment guidelines established jointly by the Adviser and the Board. Pursuant to the Investment Advisory Agreement (the “Advisory Agreement”), the Funds pay the Adviser an annual management fee of 1.00% and 1.15% for Vulcan Value Partners Fund and Vulcan Value Partners Small Cap Fund, respectively, based on each Fund’s average daily net assets. The management fee is paid on a monthly basis.
The Adviser has contractually agreed to limit each of Fund’s total annual fund operating expenses (exclusive of acquired fund fees and expenses, brokerage expenses, interest expense, taxes and extraordinary expenses) to 1.25% of each Fund’s average daily net assets. This agreement (the “Expense Agreement”) is in effect from September 1, 2017 through August 31, 2018. The prior Expense Agreement was in effect from September 1, 2016 through August 31, 2017. The Adviser will be permitted to recover, on a class-by-class basis, expenses it has borne through the Expense Agreement to the extent that a Fund’s expenses in later periods fall below the expense cap in effect at the time of waiver or reimbursement. Notwithstanding the foregoing, the Funds will not be obligated to pay any such fees and expenses more than three years after the date of the waiver or reimbursement. The Adviser may not discontinue or modify this waiver prior to August 31, 2018 without the approval by the Funds’ Board.
| 32 | www.vulcanvaluepartners.com |
Notes to Financial Statements
April 30, 2018
For the year ended April 30, 2018, the fee waivers and/or reimbursements and recoupment amounts were as follows:
| Fund | | Fees
Waived/Reimbursed
By Adviser | | | Recoupment of
Previously Waived
Fees by Adviser | |
| Vulcan Value Partners Fund | | $ | – | | | $ | – | |
| Vulcan Value Partners Small Cap Fund | | | – | | | | 59,895 | |
As of April 30, 2018, there are no recoupable expenses due to the Funds.
Fund Administrator Fees and Expenses: ALPS Fund Services, Inc. (“ALPS”) serves as administrator to the Funds and the Funds have agreed to pay expenses incurred in connection with their administrative activities. Pursuant to an Administration Agreement, ALPS provides operational services to the Funds including, but not limited to fund accounting and fund administration and generally assist in each Fund’s operations. Officers of the Trust are employees of ALPS. The Funds’ administration fee is accrued on a daily basis and paid monthly. Administration fees paid by the Funds for the year ended April 30, 2018 are disclosed in the Statements of Operations.
ALPS is reimbursed by the Funds for certain out-of-pocket expenses.
Transfer Agent: ALPS serves as transfer, dividend paying and shareholder servicing agent for the Funds. ALPS receives an annual minimum fee, a fee based upon the number of shareholder accounts, and is also reimbursed by the Funds for certain out-of-pocket expenses. Transfer agent fees paid by the Funds for the year ended April 30, 2018 are disclosed in the Statements of Operations.
Compliance Services: ALPS provides services that assist the Trust’s chief compliance officer in monitoring and testing the policies and procedures of the Trust in conjunction with requirements under Rule 38a-1 under the 1940 Act and receives an annual base fee. ALPS is reimbursed for certain out-of-pocket expenses by the Funds. Vulcan pays this fee on behalf of the Funds.
Principal Financial Officer: ALPS Fund Services, Inc. (“ALPS” and the “Administrator”) (an affiliate of ADI) receives an annual fee for providing principal financial officer services to the Funds. Principal financial officer fees paid by the Fund for the year ended April 30, 2018 are disclosed in the Statements of Operations.
Distributor: ALPS Distributors, Inc. (“ADI” or the “Distributor”) (an affiliate of ALPS Fund Services, Inc.) acts as the distributor of each Fund’s shares pursuant to a Distribution Agreement with the Trust. Shares are sold on a continuous basis by ADI as agent for the Funds, and ADI has agreed to use its best efforts to solicit orders for the sale of each Fund’s shares, although it is not obliged to sell any particular amount of shares. ADI is not entitled to any compensation for its services as Distributor. ADI is registered as a broker-dealer with the U.S. Securities and Exchange Commission. Certain intermediaries may charge networking, omnibus account or other administrative fees with respect to transactions in shares of the Funds. Transactions may be processed through the National Securities Clearing Corporation (“NSCC”) or similar systems or processed on a manual basis. These fees are paid by the Funds to the Distributor, which uses such fees to reimburse intermediaries. In the event an intermediary receiving payments from the Distributor on behalf of
| Annual Report | April 30, 2018 | 33 |
Notes to Financial Statements
April 30, 2018
the Funds converts from a networking structure to an omnibus account structure or otherwise experiences increased costs, fees borne by the Funds may increase. Fees are disclosed on the Statements of Operations as “Delegated transfer agent equivalent services fees”.
7. INDEMNIFICATIONS
Under the Trust’s organizational documents, its Officers and Trustees are indemnified against certain liability arising out of the performance of their duties to the Trust. Additionally, in the normal course of business, the Trust enters into contracts with service providers that may contain general indemnification clauses which may permit indemnification to the extent permissible under applicable law. The Trust’s maximum exposure under these arrangements is unknown, as this would involve future claims that may be made against the Trust that have not yet occurred.
| 34 | www.vulcanvaluepartners.com |
Report of Independent Registered Public Accounting Firm
To the shareholders and the Board of Trustees of Financial Investors Trust
Opinion on the Financial Statements and Financial Highlights
We have audited the accompanying statements of assets and liabilities, including the statements of investments, of Vulcan Value Partners Fund and Vulcan Value Partners Small Cap Fund (the "Funds"), two of the funds constituting the Financial Investors Trust, as of April 30, 2018, the related statements of operations for the year then ended, the statements of changes in net assets for each of the two years in the period then ended, the financial highlights for each of the five years in the period then ended, and the related notes. In our opinion, the financial statements and financial highlights present fairly, in all material respects, the financial position of Vulcan Value Partners Fund and Vulcan Value Partners Small Cap Fund of Financial Investors Trust as of April 30, 2018, the results of their operations for the year then ended, the changes in their net assets for each of the two years in the period then ended, and the financial highlights for each of the five years in the period then ended in conformity with accounting principles generally accepted in the United States of America.
Basis for Opinion
These financial statements and financial highlights are the responsibility of the Funds’ management. Our responsibility is to express an opinion on the Funds’ financial statements and financial highlights based on our audits. We are a public accounting firm registered with the Public Company Accounting Oversight Board (United States) (PCAOB) and are required to be independent with respect to the Funds in accordance with the U.S. federal securities laws and the applicable rules and regulations of the Securities and Exchange Commission and the PCAOB.
We conducted our audits in accordance with the standards of the PCAOB. Those standards require that we plan and perform the audit to obtain reasonable assurance about whether the financial statements and financial highlights are free of material misstatement, whether due to error or fraud. The Funds are not required to have, nor were we engaged to perform, an audit of their internal control over financial reporting. As part of our audits we are required to obtain an understanding of internal control over financial reporting but not for the purpose of expressing an opinion on the effectiveness of the Funds’ internal control over financial reporting. Accordingly, we express no such opinion.
Our audits included performing procedures to assess the risks of material misstatement of the financial statements and financial highlights, whether due to error or fraud, and performing procedures that respond to those risks. Such procedures included examining, on a test basis, evidence regarding the amounts and disclosures in the financial statements and financial highlights. Our audits also included evaluating the accounting principles used and significant estimates made by management, as well as evaluating the overall presentation of the financial statements and financial highlights. Our procedures included confirmation of securities owned as of April 30, 2018, by correspondence with the custodian and brokers; when replies were not received from brokers, we performed other auditing procedures. We believe that our audits provide a reasonable basis for our opinion.
DELOITTE & TOUCHE LLP
Denver, Colorado
June 26, 2018
We have served as the auditor of one or more investment companies advised by Vulcan Value Partners, LLC since 2010.
| Annual Report | April 30, 2018 | 35 |
Disclosure Regarding Approval of Fund Advisory Agreements
April 30, 2018 (Unaudited)
Vulcan Value Partners Fund
Vulcan Value Partners Small Cap Fund
On December 12, 2017, the Trustees met in person to discuss, among other things, the approval of the investment advisory agreement between the Trust and the Adviser, in accordance with Section 15(c) of the 1940 Act. In renewing and approving the Investment Advisory Agreement, the Trustees, including the Independent Trustees, considered the following factors with respect to the Vulcan Funds:
Investment Advisory Fee Rate: The Trustees reviewed and considered the contractual annual advisory fee paid by the Trust, on behalf of the Vulcan Funds, to Vulcan of 1.00% of the Vulcan Value Partners Fund’s daily average net assets and 1.15% of the Vulcan Value Partners Small Cap Fund’s daily average net assets, in light of the extent and quality of the advisory services provided by Vulcan to the Vulcan Funds.
The Board received and considered information including a comparison of each of the Vulcan Fund’s contractual and actual advisory fees and overall expenses with those of funds in the peer groups and universes of funds provided by an independent provider of investment company data (the “Data Provider”). The Trustees noted that the contractual advisory fee rates for both Vulcan Funds were above the respective Data Provider peer group median contractual advisory fee rates.
Total Expense Ratios: Based on such information, the Trustees further reviewed and considered the total expense ratios (after waivers) of 1.07% for the Vulcan Value Partners Fund and 1.25% for the Vulcan Value Partners Small Cap Fund. The Trustees noted that each of the Vulcan Fund’s total expense ratios (after waivers) were above the Data Provider peer group median total expense ratios (after waivers).
Nature, Extent, and Quality of the Services under the Investment Advisory Agreement: The Trustees received and considered information regarding the nature, extent, and quality of services to be provided to the Vulcan Funds under the Investment Advisory Agreement. The Trustees reviewed certain background materials supplied by Vulcan in its presentation, including its Form ADV.
The Trustees reviewed and considered Vulcan’s investment advisory personnel, its history as an asset manager, and its performance and the amount of assets currently under management by Vulcan and its affiliated entities. The Trustees also reviewed the research and decision-making processes utilized by Vulcan, including the methods adopted to seek to achieve compliance with the investment objectives, policies, and restrictions of the Vulcan Funds.
The Trustees considered the background and experience of Vulcan’s management in connection with the Vulcan Funds, including reviewing the qualifications, backgrounds, and responsibilities of the management team primarily responsible for the day-to-day portfolio management of the Vulcan Funds and the extent of the resources devoted to research and analysis of actual and potential investments.
The Trustees also reviewed, among other things, Vulcan’s insider trading policies and procedures and its Code of Ethics.
| 36 | www.vulcanvaluepartners.com |
Disclosure Regarding Approval of Fund Advisory Agreements
April 30, 2018 (Unaudited)
Performance: The Trustees reviewed performance information for each of the Vulcan Funds for the 3-month, 1-year, 3-year, 5-year, and since inception periods ended September 30, 2017. That review included a comparison of each Vulcan Fund’s performance to the performance of the Data Provider universe median. The Trustees noted that the performance of the Vulcan Value Partners Fund was above its respective Data Provider universe median performance for the 1-year, 5-year, and since inception periods ended September 30, 2017, and below its respective Data Provider universe median performance for the 3-month and 3-year periods ended September 30, 2017, and the performance of the Vulcan Value Partners Small Cap Fund was above its respective Data Provider universe median performance for the since inception period ended September 30, 2017 and below its respective Data Provider universe median performance for the 3-month, 1-year, 3-year, and 5-year periods ended September 30, 2017. The Trustees also considered Vulcan’s discussion of each Vulcan Fund’s underlying portfolio diversification categories, its top contributors and top detractors, as well as Vulcan’s performance and reputation generally and its investment techniques, risk management controls, and decision-making processes.
Comparable Accounts: The Trustees noted certain information provided by Vulcan regarding fees charged to its other clients utilizing a strategy similar to that employed by the Vulcan Funds.
Profitability: The Trustees received and considered a retrospective and projected profitability analysis prepared by Vulcan based on the fees payable under the Investment Advisory Agreement with respect to each Vulcan Fund. The Trustees considered the profits, if any, anticipated to be realized by Vulcan in connection with the operation of each Vulcan Fund. The Board then reviewed Vulcan’s audited financial statements for the years ended December 31, 2016 and 2015, provided supplementally, in order to analyze the financial condition and stability and profitability of Vulcan.
Economies of Scale: The Trustees considered whether economies of scale in the provision of services to the Vulcan Funds will be passed along to the shareholders under the proposed agreements.
Other Benefits to the Adviser: The Trustees reviewed and considered any other incidental benefits derived or to be derived by Vulcan from its relationship with the Vulcan Funds, including whether soft dollar arrangements were used.
In renewing Vulcan as the Vulcan Funds’ investment adviser and renewing the Investment Advisory Agreement and the fees charged under the Investment Advisory Agreement, the Trustees concluded that no single factor reviewed by the Trustees was identified by the Trustees to be determinative as the principal factor in whether to renew the Investment Advisory Agreement. Further, the Independent Trustees were advised by separate independent legal counsel throughout the process. The Trustees, including all of the Independent Trustees, concluded that:
| ● | each Vulcan Fund’s contractual advisory fee rate was above its Data Provider peer group median contractual advisory fee rate; |
| ● | each Vulcan Fund’s total expense ratio (after waivers) was above, but within an acceptable range of, its Data Provider peer group median total expense ratio (after waivers); |
| Annual Report | April 30, 2018 | 37 |
Disclosure Regarding Approval of Fund Advisory Agreements
April 30, 2018 (Unaudited)
| ● | the nature, extent and quality of services rendered by Vulcan under the Investment Advisory Agreement with respect to the Vulcan Funds were adequate; |
| ● | the performance of the Vulcan Value Partners Fund was above its respective Data Provider universe median performance for the 1-year, 5-year, and since inception periods ended September 30, 2017, and below its respective Data Provider universe median performance for the 3-month and 3-year periods ended September 30, 2017, and the performance of the Vulcan Value Partners Small Cap Fund was above its respective Data Provider universe median performance for the since inception period ended September 30, 2017 and below its respective Data Provider universe median performance for the 3-month, 1-year, 3-year, and 5-year periods ended September 30, 2017; |
| ● | bearing in mind the limitations of comparing different types of managed accounts and the different levels of service typically associated with such accounts, the fee structures applicable to Vulcan’s other clients employing a comparable strategy to one or more of the Vulcan Funds were not indicative of any unreasonableness with respect to the advisory fees proposed to be payable by the Vulcan Funds; |
| ● | the profit, if any, realized by Vulcan in connection with the operation of each Vulcan Fund is not unreasonable to such Vulcan Fund; and |
| ● | there were no material economies of scale or other incidental benefits accruing to Vulcan in connection with its relationship with the Vulcan Funds. |
Based on the Trustees’ deliberations and their evaluation of the information described above, the Trustees, including all of the Independent Trustees, concluded that Vulcan’s compensation for investment advisory services is consistent with the best interests of the Vulcan Funds and their shareholders.
| 38 | www.vulcanvaluepartners.com |
Additional Information
April 30, 2018 (Unaudited)
1. FUND HOLDINGS
The Funds files their complete schedule of portfolio holdings with the Securities and Exchange Commission (the “SEC”) for the first and third quarters of each fiscal year on Form N-Q within 60 days after the end of the period. Copies of the Funds’ Form N-Q are available without charge on the SEC website at http://www.sec.gov. You may also review and copy the Form N-Q at the SEC’s Public Reference Room in Washington, DC. For more information about the operation of the Public Reference Room, please call the SEC at 1-800-SEC-0330.
2. FUND PROXY VOTING POLICIES, PROCEDURES AND SUMMARIES
The Funds’ policies and procedures used in determining how to vote proxies and information regarding how the Fund voted proxies relating to portfolio securities during the most recent prior 12-month period ending June 30 are available without charge, (1) upon request, by calling (toll-free) (866)-759-5679 and (2) on the SEC’s website at http://www.sec.gov.
3. TAX DESIGNATIONS
The Funds designate the following for federal income tax purposes for the calendar year ended December 31, 2017:
| | Qualified
Dividend Income | Dividend
Received Deduction |
| Vulcan Value Partners Fund | 78.90% | 56.58% |
| Vulcan Value Partners Small Cap Fund | 16.56% | 7.10% |
In early 2018, if applicable, shareholders of record received this information for the distributions paid to them by the Funds during the calendar year 2017 via Form 1099. The Funds will notify shareholders in early 2019 of amounts paid to them by the Funds, if any, during the calendar year 2018.
Pursuant to Section 852(b)(3) of the Internal Revenue Code, the Vulcan Value Partners Small Cap Fund designated $13,044,147 as long-term capital gain dividends.
| Annual Report | April 30, 2018 | 39 |
Trustees and Officers
April 30, 2018 (Unaudited)
Additional information regarding the Fund’s trustees is included in the Statement of Additional Information, which can be obtained without charge by calling 877-421-5078.
INDEPENDENT TRUSTEES
Name,
Address*
& Year
of Birth | Position(s)
Held with
Fund | Term of
Office** and
Length of
Time Served | Principal Occupation(s) During Past 5 Years*** | Number of Funds in Fund Complex Overseen by Trustee**** | Other Directorships Held by Trustee During Past 5 Years*** |
Mary K. Anstine, 1940 | Trustee and Chairman | Ms. Anstine was elected at a special meeting of shareholders held on March 21, 1997 and re-elected at a special meeting of shareholders held on August 7, 2009. Ms. Anstine was appointed Chairman of the Board at the June 6, 2017 meeting of the Board of Trustees. | Ms. Anstine was formerly an Executive Vice President of First Interstate Bank of Denver until 1994, President/Chief Executive Officer of HealthONE Alliance, Denver, Colorado, from 1994 to 2004, and has been retired since 2004. Ms. Anstine is also Trustee/Director of AV Hunter Trust and Colorado Uplift Board. Ms. Anstine was formerly a Director of the Trust Bank of Colorado (later purchased and now known as Northern Trust Bank), HealthONE and Denver Area Council of the Boy Scouts of America, and a member of the American Bankers Association Trust Executive Committee. | 32 | Ms. Anstine is a Trustee of ALPS ETF Trust (21 funds); ALPS Variable Investment Trust (9 funds); Reaves Utility Income Fund (1 fund); and Westcore Trust (14 funds). |
Jeremy W. Deems, 1976 | Trustee | Mr. Deems was appointed as a Trustee at the March 11, 2008 meeting of the Board of Trustees and elected at a special meeting of shareholders held on August 7, 2009. | Mr. Deems is the Co-Founder, Chief Operations Officer and Chief Financial Officer of Green Alpha Advisors, LLC, a registered investment advisor, and Co-Portfolio Manager of the Shelton Green Alpha Fund. Prior to joining Green Alpha Advisors, Mr. Deems was CFO and Treasurer of Forward Management, LLC, ReFlow Management Co., LLC, ReFlow Fund, LLC, a private investment fund, and Sutton Place Management, LLC, an administrative services company, from 1998 to June 2007. From 2004 to 2005, Mr Deems also served as Treasurer of the Forward Funds and the Sierra Club Funds. | 32 | Mr. Deems is a Trustee of ALPS ETF Trust (21 funds); ALPS Variable Investment Trust (9 funds); Clough Funds Trust (1 fund); and Reaves Utility Income Fund (1 fund). |
| 40 | www.vulcanvaluepartners.com |
Trustees and Officers
April 30, 2018 (Unaudited)
INDEPENDENT TRUSTEES (continued)
Name, Address* & Year of Birth | Position(s) Held with Fund | Term of Office** and Length of Time Served | Principal Occupation(s) During Past 5 Years*** | Number of Funds in Fund Complex Overseen by Trustee**** | Other Directorships Held by Trustee During Past 5 Years*** |
Jerry G. Rutledge, 1944 | Trustee | Mr. Rutledge was elected at a special meeting of shareholders held on August 7, 2009. | Mr. Rutledge is the President and owner of Rutledge’s Inc., a retail clothing business. He served as Director of University of Colorado Hospital from 2008 to 2016. He was from 1994 to 2007 a Regent of the University of Colorado. | 32 | Mr. Rutledge is a Trustee of Principal Real Estate Fund (1 fund), Clough Global Dividend and Income Fund (1 fund), Clough Global Equity Fund (1 fund) and Clough Global Opportunities Fund (1 fund). |
Michael “Ross” Shell, 1970 | Trustee | Mr. Shell was elected at a special meeting of shareholders held on August 7, 2009. | Mr. Shell is Founder and CEO of Red Idea, LLC, a strategic consulting/early stage venture firm (since June 2008). From 1999 to 2009, he was a part-owner and Director of Tesser, Inc., a brand agency. From December 2005 to May 2008, he was Director, Marketing and Investor Relations, of Woodbourne, a REIT/real estate hedge fund and private equity firm. Prior to this, from May 2004 to November 2005, he worked as a business strategy consultant; from June 2003 to April 2004, he was on the Global Client Services team of IDEO, a product design/innovation firm; and from 1999 to 2003, he was President of Tesser, Inc. Mr. Shell graduated with honors from Stanford University with a degree in Political Science. | 32 | None. |
| Annual Report | April 30, 2018 | 41 |
Trustees and Officers
April 30, 2018 (Unaudited)
INTERESTED TRUSTEE
Name, Address* & Year of Birth | Position(s) Held with Fund | Term of Office** and Length of Time Served | Principal Occupation(s) During Past 5 Years*** | Number of Funds in Fund Complex Overseen by Trustee**** | Other Directorships Held by Trustee During Past 5 Years*** |
| Edmund J. Burke, 1961 | Trustee and President | Mr. Burke was elected as Trustee at a special meeting of shareholders held on August 7, 2009. Mr. Burke was elected President of the Trust at the December 17, 2002 meeting of the Board of Trustees. | Mr. Burke is President and a Director of ALPS Holdings, Inc. (“AHI”) and ALPS Advisors, Inc. (“AAI”), and Director of Boston Financial Data Services, Inc. (“BFDS”), ALPS Distributors, Inc. (“ADI”), ALPS Fund Services, Inc. (“AFS”) and ALPS Portfolio Solutions Distributor, Inc. (“APSD”). Because of his positions with AHI, BFDS, AAI, ADI, AFS and APSD, Mr. Burke is deemed an affiliate of the Trust as defined under the 1940 Act. | 32 | Mr. Burke is a Trustee of Clough Global Dividend and Income Fund (1 fund); Clough Global Equity Fund (1 fund); Clough Global Opportunities Fund (1 fund); Clough Funds Trust (1 fund); Liberty All-Star Equity Fund (1 fund); Director of the Liberty All-Star Growth Fund, Inc. (1 fund); Trustee of ALPS ETF Trust (21 funds). |
| 42 | www.vulcanvaluepartners.com |
Trustees and Officers
April 30, 2018 (Unaudited)
OFFICERS
Name, Address* & Year of Birth | Position(s) Held with Fund | Term of Office** and Length of Time Served | Principal Occupation(s) During Past 5 Years*** |
Kimberly R. Storms, 1972 | Treasurer | Ms. Storms was elected Treasurer of the Trust at the March 12, 2013 meeting of the Board of Trustees. | Ms. Storms is Senior Vice President - Director of Fund Administration of ALPS. Because of her position with ALPS, Ms. Storms is deemed an affiliate of the Trust as defined under the 1940 Act. Ms. Storms is also Treasurer of Liberty All-Star Equity Fund, Liberty All-Star Growth Fund, Inc., ALPS Series Trust and Elevation ETF Trust. Ms. Storms also serves as a Board member and Treasurer of The Center for Trauma & Resilience, a nonprofit agency. |
Karen S. Gilomen, 1970 | Secretary | Ms. Gilomen was elected Secretary of the Trust at the December 13, 2016 meeting of the Board of Trustees. | Ms. Gilomen joined ALPS in August 2016 as Vice President and Senior Counsel. Prior to joining ALPS, Ms. Gilomen was Vice President - General Counsel & CCO of Monticello Associates, Inc. from 2010 to 2016. Because of her position with ALPS, Ms. Gilomen is deemed an affiliate of the Trust, as defined under the 1940 Act. Ms. Gilomen is also the Secretary of Clough Funds Trust, Clough Global Dividend and Income Fund, Clough Global Equity Fund, Clough Global Opportunities Fund, Reaves Utility Income Fund, and the Assistant Secretary of the WesMark Funds. |
Ted Uhl, 1974 | Chief Compliance Officer (“CCO”) | Mr. Uhl was appointed CCO of the Trust at the June 8, 2010 meeting of the Board of Trustees. | Mr. Uhl joined ALPS in October 2006, and is currently Deputy Compliance Officer of ALPS. Prior to his current role, Mr. Uhl served as Senior Risk Manager for ALPS from October 2006 until June 2010. Before joining ALPS, Mr. Uhl served a Sr. Analyst with Enenbach and Associates (RIA), and a Sr. Financial Analyst at Sprint. Because of his position with ALPS, Mr. Uhl is deemed an affiliate of the Trust as defined under the 1940 Act. Mr. Uhl is also CCO of the Boulder Growth & Income Fund, Inc., Centre Funds, Elevation ETF Trust, Index Funds, Reality Shares ETF Trust and Reaves Utility Income Fund. |
Jennell Panella, 1974 | Assistant Treasurer | Ms. Panella was elected Assistant Treasurer of the Trust at the September 15, 2015 meeting of the Board of Trustees | Ms. Panella joined ALPS in June 2012 and is currently Fund Controller of ALPS Fund Services, Inc. Prior to joining ALPS, Ms. Panella served as Financial Reporting Manager for Parker Global Strategies, LLC (2009-2012). Because of her position with ALPS, Ms. Panella is deemed an affiliate of the Trust as defined under the 1940 Act. Ms. Panella also serves as Assistant Treasurer of James Advantage Funds. |
| Annual Report | April 30, 2018 | 43 |
Trustees and Officers
April 30, 2018 (Unaudited)
OFFICERS (continued)
Name, Address* & Year of Birth | Position(s) Held with Fund | Term of Office** and Length of Time Served | Principal Occupation(s) During Past 5 Years*** |
Alan Gattis, 1980 | Assistant Treasurer | Mr. Gattis was elected Assistant Treasurer of the Trust at the September 13, 2016 meeting of the Board of Trustees | Mr. Gattis joined ALPS in 2011 and is currently Vice President and Fund Controller of ALPS. Prior to joining ALPS, Mr. Gattis was an Auditor at Spicer Jeffries LLP (2009 through 2011) and an Auditor at PricewaterhouseCoopers LLP (2004 - 2009). Because of his position with ALPS, Mr. Gattis is deemed an affiliate of the Trust as defined under the 1940 Act. Mr. Gattis is also Assistant Treasurer of ALPS Series Trust and Elevation ETF Trust. |
Sharon Akselrod, 1974 | Assistant Secretary | Ms. Akselrod was elected Assistant Secretary of the Trust at the September 15, 2015 meeting of the Board of Trustees. | Ms. Akselrod joined ALPS in August 2014 and is currently Senior Investment Company Act Paralegal of ALPS Fund Services, Inc. Prior to joining ALPS, Ms. Akselrod served as Corporate Governance and Regulatory Associate for Nordstrom fsb (2013-2014) and Senior Legal Assistant – Legal Manager for AXA Equitable Life Insurance Company (2008-2013). Because of her position with ALPS, Ms. Akselrod is deemed an affiliate of the Trust as defined under the 1940 Act. Ms. Akselrod is also Assistant Secretary of ALPS ETF Trust and Principal Real Estate Fund. |
Jennifer Craig, 1973 | Assistant Secretary | Ms. Craig was elected Assistant Secretary of the Trust at the June 8, 2016 meeting of the Board of Trustees. | Ms. Craig joined ALPS in 2007 and is currently Assistant Vice President and Paralegal Manager of ALPS. Prior to joining ALPS, Ms. Craig was Legal Manager at Janus Capital Management LLC and served as Assistant Secretary of Janus Investment Fund, Janus Adviser Series and Janus Aspen Series. Because of her position with ALPS, Ms. Craig is deemed an affiliate of the Trust as defined under the 1940 Act. Ms. Craig is also Assistant Secretary of Clough Global Dividend and Income Fund, Clough Global Equity Fund, Clough Global Opportunities Fund, Clough Funds Trust, Liberty All-Star Equity Fund, Liberty All-Star Growth Fund, Inc. and ALPS Series Trust. |
Sareena Khwaja-Dixon, 1980 | Assistant Secretary | Ms. Khwaja-Dixon was elected Assistant Secretary of the Trust at the December 12, 2017 meeting of the Board of Trustees. | Ms. Khwaja-Dixon joined ALPS in August 2015 and is currently Senior Counsel and Vice President of ALPS Fund Services, Inc. Prior to joining ALPS, Ms. Khwaja-Dixon served as a Senior Paralegal/Paralegal for Russell Investments (2011 – 2015). Ms. Khwaja-Dixon is also Secretary of Liberty All-Star Equity Fund and Liberty All-Star Growth Fund, Inc.,and Assistant Secretary of Clough Funds Trust, Clough Dividend and Income Fund, Clough Global Opportunities Fund, and Clough Global Equity Fund. |
| * | All communications to Trustees and Officers may be directed to Financial Investors Trust c/o 1290 Broadway, Suite 1100, Denver, CO 80203. |
| ** | This is the period for which the Trustee or Officer began serving the Trust. Each Trustee serves an indefinite term, until his successor is elected. Officers are elected on an annual basis. |
| *** | Except as otherwise indicated, each individual has held the office shown or other offices in the same company for the last five years. |
| **** | The Fund Complex includes all series of the Trust (currently 32) and any other investment companies for which any Trustee serves as trustee for and which Vulcan Value Partners, LLC provides investment advisory services (currently none). |
| 44 | www.vulcanvaluepartners.com |
Privacy Policy
April 30, 2018 (Unaudited)
| Who We Are | | |
| Who is providing this notice? | Vulcan Value Partners Fund and Vulcan Value Partners Small Cap Fund. |
| What We Do | |
| How do the Funds protect my personal information? | To protect your personal information from unauthorized access and use, we use security measures that comply with federal law. These measures include computer safeguards and secured files and buildings. |
| How do the Funds collect my personal information? | We collect your personal information, for example, when you |
| | ● open an account |
| | ● provide account information or give us your contact information |
| | ● make a wire transfer or deposit money |
| Why can't I limit all sharing? | Federal law gives you the right to limit only |
| | ● sharing for affiliates’ everyday business purposes-information about your creditworthiness |
| | ● affiliates from using your information to market to you |
| | ● sharing for non-affiliates to market to you |
| | State laws and individual companies may give you additional rights to limit sharing. |
| Annual Report | April 30, 2018 | 45 |
Privacy Policy
April 30, 2018 (Unaudited)
| FACTS | WHAT DO THE FUNDS DO WITH YOUR PERSONAL INFORMATION? |
| Why? | Financial companies choose how they share your personal information. Federal law gives consumers the right to limit some but not all sharing. Federal law also requires us to tell you how we collect, share, and protect your personal information. Please read this notice carefully to understand what we do. |
| What? | The types of personal information we collect and share depend on the product or service you have with us. This information can include: |
| | ● Social Security number and account transactions |
| | ● Account balances and transaction history |
| | ● Wire transfer instructions |
| How? | All financial companies need to share customers’ personal information to run their everyday business. In the section below, we list the reasons financial companies can share their customers’ personal information; the reasons the Funds choose to share; and whether you can limit this sharing. |
| Reasons we can share your personal information | DO THE FUNDS SHARE: | Can you limit this sharing? |
For our everyday business purposes – such as to process your transactions, maintain your account(s), respond to court orders and legal investigations, or report to credit bureaus | Yes | No |
For our marketing purposes – to offer our products and services to you | No | We do not share. |
| For joint marketing with other financial companies | No | We do not share. |
For our affiliates’ everyday business purposes – information about your transactions and experiences | Yes | No |
For our affiliates’ everyday business purposes – information about your creditworthiness | No | We do not share. |
| For non–affiliates to market to you | No | We do not share. |
| 46 | www.vulcanvaluepartners.com |
Privacy Policy
April 30, 2018 (Unaudited)
| Definitions | |
| Affiliates | Companies related by common ownership or control. They can be financial and nonfinancial companies. |
| Non-affiliates | Companies not related by common ownership or control. They can be financial and nonfinancial companies. |
| | ● | The Funds do not share with non-affiliates so they can market to you. |
| Joint marketing | A formal agreement between non-affiliated financial companies that together market financial products or services to you. |
| | ● | The Funds do not jointly market. |
| Other Important Information | |
| California Residents | If your account has a California home address, your personal information will not be disclosed to nonaffiliated third parties except as permitted by applicable California law, and we will limit sharing such personal information with our affiliates to comply with California privacy laws that apply to us. |
| Vermont Residents | The State of Vermont requires financial institutions to obtain your consent prior to sharing personal information that they collect about you with affiliated companies and nonaffiliated third parties other than in certain limited circumstances. Except as permitted by law, we will not share personal information we collect about you with nonaffiliated third parties or other affiliated companies unless you provide us with your written consent to share such information. |
| Annual Report | April 30, 2018 | 47 |

Item 2. Code of Ethics.
| (a) | The Registrant, as of the end of the period covered by this report, has adopted a code of ethics that applies to the Registrant’s principal executive officer, principal financial officer, principal accounting officer or controller or any persons performing similar functions on behalf of the Registrant. |
(b) Not applicable.
| (c) | During the period covered by this report, no amendments to the provisions of the code of ethics described in Item 2(a) above were made. |
| (d) | During the period covered by this report, no implicit or explicit waivers to the provisions of the code of ethics described in Item 2(a) above were granted. |
| (f) | The Registrant’s Code of Ethics is attached as an Exhibit to this report. |
Item 3. Audit Committee Financial Expert.
The Board of Trustees of the Registrant has determined that the Registrant has at least one Audit Committee Financial Expert serving on its audit committee. The Board of Trustees of the Registrant has designated Jeremy W. Deems as the Registrant’s “Audit Committee Financial Expert.” Mr. Deems is “independent” as defined in paragraph (a)(2) of Item 3 to Form N-CSR.
Item 4. Principal Accountant Fees and Services.
| (a) | Audit Fees: For the Registrant’s fiscal years ended April 30, 2018 and April 30, 2017, the aggregate fees billed for professional services rendered by the principal accountant for the audit of the Registrant’s annual financial statements or services that are normally provided by the accountant in connection with statutory and regulatory filings or engagements for those fiscal years were $368,680 and $345,460, respectively. |
| (b) | Audit-Related Fees: For the Registrant’s fiscal years ended April 30, 2018 and April 30, 2017, the aggregate fees billed for assurance and related services by the principal accountant that were reasonably related to the performance of the audit of the Registrant’s financial statements and are not reported under paragraph (a) of this Item were $0 and $0, respectively. |
| (c) | Tax Fees: For the Registrant’s fiscal years ended April 30, 2018 and April 30, 2017, the aggregate fees billed for professional services rendered by the principal accountant for tax compliance, tax advice and tax planning were $97,875 and $105,945, respectively. The fiscal year 2017 and 2016 tax fees were for services for dividend calculation, excise tax preparation and tax return preparation. |
| (d) | All Other Fees: For the Registrant’s fiscal years ended April 30, 2018 and April 30, 2017, no fees were billed to Registrant by the principal accountant for products and services, other than the services reported in paragraphs (a) through (c) of this Item. |
| (e)(1) | Audit Committee Pre-Approval Policies and Procedures: All services to be performed by the Registrant’s principal accountant must be pre-approved by the Registrant’s Audit Committee. The Chairman of the Audit Committee may pre-approve non-audit services to be performed by the Registrant’s principal accountant on an interim basis, subject to ratification by the Audit Committee at its next regularly scheduled meeting. |
| (e)(2) | No services described in paragraphs (b) through (d) of this Item were approved by the Registrant’s Audit Committee pursuant to paragraph (c)(7)(i)(C) of Rule 2-01 of Regulation S-X. |
| (g) | The aggregate non-audit fees billed by the Registrant’s accountant to the Registrant, and rendered to the Registrant’s investment adviser (not including any sub-adviser whose role is primarily portfolio management and is subcontracted with or overseen by another investment adviser), and any entity controlling, controlled by, or under common control with the adviser that provides ongoing services to the Registrant, were $132,945 in the fiscal year ended April 30, 2018 and $136,335 in fiscal year ended April 30, 2017. These fees consisted of non-audit fees billed to (i) the Registrant of $97,875 in fiscal year ended April 30, 2018 and $105,945 in fiscal year ended April 30, 2017 as described in response to paragraph (c) above and (ii) to ALPS Fund Services, Inc. (“AFS”), an entity under common control with ALPS Advisors, Inc., the Registrant’s investment adviser, of $35,070 in fiscal year ended April 30, 2018 and $30,390 in fiscal year ended April 30, 2017. The non-audit fees billed to AFS related to SSAE 16 services and other compliance-related matters. |
| (h) | The Registrant’s audit committee has considered whether the provision of non-audit services that were rendered to the Registrant’s investment adviser (not including any sub-adviser whose role is primarily portfolio management and is subcontracted with or overseen by another investment adviser), and any entity controlling, controlled by, or under common control with the investment adviser that provides ongoing services to the Registrant that were not pre-approved pursuant to paragraph (c)(7)(ii) of Rule 2-01 of Regulation S-X, is compatible with maintaining the principal accountant’s independence. The Registrant’s audit committee determined that the provision of such non-audit services is compatible with maintaining the principal accountant’s independence. |
Item 5. Audit Committee of Listed Registrants.
Not applicable to the Registrant.
Item 6. Investments.
| (a) | Schedule of Investments is included as part of the Reports to Stockholders filed under Item 1 of this Form N-CSR. |
Item 7. Disclosure of Proxy Voting Policies and Procedures for Closed-End Management Investment Companies.
Not applicable to the Registrant.
Item 8. Portfolio Managers of Closed-End Management Investment Companies.
Not applicable to the Registrant.
Item 9. Purchases of Equity Securities by Closed-End Management Investment Company and Affiliated Purchasers.
Not applicable to the Registrant.
Item 10. Submission of Matters to a Vote of Security Holders.
There have been no material changes to the procedures by which shareholders may recommend nominees to the Registrant’s Board of Trustees, where those changes were implemented after the Registrant last provided disclosure in response to the requirements of Item 407(c)(2)(iv) of Regulation S-K, or this Item.
Item 11. Controls and Procedures.
| (a) | The Registrant’s principal executive officer and principal financial officer have concluded that the Registrant’s disclosure controls and procedures (as defined in Rule 30a-3(c) under the Investment Company Act of 1940, as amended) are effective based on their evaluation of these controls and procedures as of a date within 90 days of the filing date of this report. |
| (b) | There was no change in the Registrant’s internal control over financial reporting (as defined in Rule 30a-3(d) under the Investment Company Act of 1940, as amended) during the second fiscal quarter of the period covered by this report that has materially affected, or is reasonably likely to materially affect, the Registrant’s internal control over financial reporting. |
Item 12. Disclosure of Securities Lending Activities for Closed-End Management Investment Companies.
Not applicable to the Registrant.
Item 13. Exhibits.
| (a)(1) | Registrant’s Code of Ethics for Principal Executive and Senior Financial Officers, which is the subject of the disclosure required by Item 2 of Form N-CSR, is incorporated by reference to Exhibit 12(a)(1) to the Registrant’s Certified Shareholder Report on Form N-CSR, File No. 811-8194, filed on January 9, 2017. |
| (a)(2) | The certifications required by Rule 30a-2(a) of the Investment Company Act of 1940, as amended, and Section 302 of the Sarbanes-Oxley Act of 2002 are attached hereto as Exhibit 99.Cert. |
| (a)(4) | Not applicable to the Registrant. |
| (b) | The certifications by the Registrant’s principal executive officer and principal financial officer, as required by Rule 30a-2(b) of the Investment Company Act of 1940, as amended, and Section 906 of the Sarbanes-Oxley Act of 2002 are attached hereto as Exhibit 99.906Cert. |
SIGNATURES
Pursuant to the requirements of the Securities Exchange Act of 1934 and the Investment Company Act of 1940, the Registrant has duly caused this report to be signed on its behalf by the undersigned, thereunto duly authorized.
FINANCIAL INVESTORS TRUST
| By: | /s/ Edmund J. Burke | |
| | Edmund J. Burke (Principal Executive Officer) | |
| | President | |
| | | |
| Date: | July 9, 2018 | |
Pursuant to the requirements of the Securities Exchange Act of 1934 and the Investment Company Act of 1940, this report has been signed below by the following persons on behalf of the Registrant and in the capacities and on the dates indicated.
FINANCIAL INVESTORS TRUST
| By: | /s/ Edmund J. Burke | |
| | Edmund J. Burke (Principal Executive Officer) | |
| | President | |
| | | |
| Date: | July 9, 2018 | |
| | | |
| By: | /s/ Kimberly R. Storms | |
| | Kimberly R. Storms (Principal Financial Officer) | |
| | Treasurer | |
| | | |
| Date: | July 9, 2018 | |