UNITED STATES
SECURITIES AND EXCHANGE COMMISSION
Washington, D.C. 20549
FORM N-CSR
CERTIFIED SHAREHOLDER REPORT OF REGISTERED
MANAGEMENT INVESTMENT COMPANIES
Investment Company Act file number: 811-08194
FINANCIAL INVESTORS TRUST
(Exact name of registrant as specified in charter)
1290 Broadway, Suite 1100, Denver, Colorado 80203
(Address of principal executive offices) (Zip code)
Karen Gilomen, Esq., Secretary
Financial Investors Trust
1290 Broadway, Suite 1100
Denver, Colorado 80203
(Name and address of agent for service)
Registrant’s telephone number, including area code: 303-623-2577
Date of fiscal year end: April 30
Date of reporting period: May 1, 2016 – April 30, 2017
Item 1. Reports to Stockholders.
TABLE OF CONTENTS
| | PAGE |
| Manager Commentary | |
| Aspen Managed Futures Strategy Fund | 1 |
| Aspen Portfolio Strategy Fund | 5 |
| Performance Update | |
| Aspen Managed Futures Strategy Fund | 3 |
| Aspen Portfolio Strategy Fund | 7 |
| Consolidated Disclosure of Fund Expenses | 9 |
| Consolidated Schedule of Investments | |
| Aspen Managed Futures Strategy Fund | 10 |
| Aspen Portfolio Strategy Fund | 12 |
| Consolidated Statements of Assets & Liabilities | 14 |
| Consolidated Statements of Operations | 16 |
| Consolidated Statements of Changes in Net Assets | |
| Aspen Managed Futures Strategy Fund | 17 |
| Aspen Portfolio Strategy Fund | 18 |
| Consolidated Financial Highlights | |
| Aspen Managed Futures Strategy Fund | 19 |
| Aspen Portfolio Strategy Fund | 21 |
| Notes to Consolidated Financial Statements | 23 |
| Report of Independent Registered Public Accounting Firm | 34 |
| Disclosure Regarding Approval of Fund Advisory Agreements | 35 |
| Additional Information | 38 |
| Trustees and Officers | 39 |
| Privacy Policy | 44 |
| Aspen Managed Futures Strategy Fund | Manager Commentary |
| | April 30, 2017 (Unaudited) |
May 15, 2017
Performance Results
For the twelve‐month period ending April 30, 2017, the Class I shares of the Aspen Managed Futures Strategy Fund (the “Fund”) posted a return of ‐7.33%. Per its mandate, the Fund maintained tight correlation(1) to the Aspen Managed Futures Beta Index (“Aspen MFBI” or the “Index”)(2). The Index uses a combination of trend and counter‐trend algorithms to determine exposures to 23 futures markets. In following the Index, the Fund can take long or short positions in each of the eligible markets. A long position in a futures market may post gains (losses) if the price of the futures contract rises (falls), whereas a short position may post gains (losses) if the price of the futures contract falls (rises).
The BTOP50 Index(3), a managed futures benchmark, returned ‐6.7% over the same period. It is important to note that there are substantive differences between the Fund and this index in terms of construction. There were no significant changes to the Fund strategy during this period.
Explanation of Fund Performance
The Fund returned ‐2.45% in May. A surprise rate cut by the Reserve Bank of Australia was a factor in the monthly loss. The cut drove down the Australian dollar (“AUD”), causing losses in long AUD positions in the Index’s trend and counter‐trend exposure.
The month of June provided a gain of +3.18% for the Fund. The majority of that return happened on a single day: June 24, the day of the initial market reaction to the surprise results of the UK’s “Brexit” vote to leave European Union. The Aspen MFBI’s futures positioning around Brexit(4) arose from the crosswinds of pre‐Brexit market moves. Because the vote was a rare, point‐in‐time volatility‐inducing event that everyone could see coming in advance, volatility naturally spiked in advance over the weeks preceding the vote—which led to an increase trend and decrease in counter‐trend exposures in the Index. Risk assets, particularly European issues, declined—which led to net short risk exposures in the Trend model. However, concerns notwithstanding, at no point prior to the actual vote tally did markets predict a greater than 50% probability of a UK “Leave” vote; in particular, over the course of the actual week of the vote, the market’s movements reflected increasing confidence that the “Remain” side would win. This resulted in Index positioning that, while risk‐off overall, was not fully strongly short risk assets, but was decidedly long fixed income. In aggregate, that positioning enabled the Fund to capture a gain of about +2% on June 24. Remarkably, it took only about a week for global equity markets, including those in the UK itself, to recover their Brexit losses. Typically a “V‐bottom”(5) bounce of that nature is problematic for a trend‐following model like the one followed by the Fund, but in this case the Fund was actually able to profit during the market rebound as well as the initial market drop. The primary reason for this was the fact that the Fund’s long fixed income positions continued to post profits, as the post‐Brexit rebound was apparently at least partly driven by speculation of further easing, which benefitted sovereign bonds as well as equity markets.
After the wildness of Brexit, the markets settled into a quieter mode for the next several months. A trendless, low‐volatility backdrop created difficult conditions for the Index’s trend exposures, but it benefitted the Index’s counter‐trend exposures. Trend attribution(6) was negative and counter‐trend attribution was positive in each of the next four months—a pattern that previously had not occurred for more than two consecutive months. Because the Index is always primarily trend‐following, this pattern led to losses for the Fund in all four months (July: ‐0.50%, August: ‐0.70%, September: ‐1.01%, October: ‐1.93%). However, the boost provided by the counter‐trend sub‐model kept the losses over the entire period relatively modest—i.e., the losses over the entire four‐month period were only about 100 basis points(7) greater than the gains in June alone.
At the end of October, heading toward the U.S. presidential election, the most notable development in the Fund was the adoption of net short fixed income futures positioning for the first time all year, in response to rising global interest rates. Per its mandate, the Index does not “tilt” to the long side in fixed income, and as a consequence it is able to turn short faster than most trend‐following programs. This enabled the Fund to return +3.0% in November, when most trend following Commodity Trading Advisors (“CTA”) posted negative returns in the wake of the rising‐rate backdrop that followed the surprise election of Donald Trump to the US presidency.
The calendar year ended with a quiet 0.19% gain in December, with continued gains from “Trump rally” Trend positioning offset by a give‐back of a portion of the year’s Counter‐Trend profits.
2017 began with a series of eerily low‐volatility months in the markets, which typically creates a difficult, range‐bound backdrop for trend following. January (‐1.01%) and February (‐0.11%) exemplified this type of backdrop, with typically minor losses stemming from commodity, currency, and fixed income trends, partially offset by gains in (entirely long) equity trends and risk‐on Counter‐Trend exposure.
Currency trend trading became particularly problematic in March, when currency positioning experienced a classic “V‐bottom” bounce—a pattern where trend systems post losses in the initial leg down, turn short, and then post losses on the subsequent bounce back up. The initial decline in foreign exchange (“FX”) values was caused by a sudden increase in the markets’ expectations that the Federal Reserve would raise interest rates in their March meeting. Index trend positioning turned short after the FX decline. The Fed did indeed raise rates, but the markets were unimpressed with the hawkishness of the announcement; FX rates jumped up again in the aftermath of the announcement, causing losses for the short currency trend positions. These V‐bottom losses were a major contributor to the Fund’s ‐3.31% return in March.
| Annual Report | April 30, 2017 | 1 |
| Aspen Managed Futures Strategy Fund | Manager Commentary |
| | April 30, 2017 (Unaudited) |
Counter‐Trend reversals contributed the majority of the Fund’s ‐2.7% return in April. A prime factor was the euro relief rally following the first round of the French presidential election, when the possibility of an extreme right/extreme left runoff was eliminated. Strength in the US dollar relative to high‐yielding commodity currencies also produced losses in the Counter‐Trend model. Trend following fared little better in the ongoing low‐vol environment in April, but Trend losses were muted because trend positioning was limited in notional size and mixed in direction due to market choppiness the prior several months.
Outlook
As noted above, volatility in the financial markets is very abnormally low, both in trailing terms across asset class complexes and in prospective terms (e.g., the VIX Index(8) is near all‐time lows as of this writing). Low‐vol, range‐bound markets are historically difficult for trend‐following, though the magnitude of the losses for the Fund early in 2017 was exacerbated by a few unusual events, particularly in currency markets. Many market commentators have begun to notice that volatility levels seem inexplicably depressed, perhaps unreasonably so given geopolitical and economic risks. Moreover, there are some early indications that we may be seeing the beginnings of the (undoubtedly slow and uneven) unwind of one of the primary causes of the unusually low‐vol environment that has prevailed since the end of the Great Financial Crisis—i.e., extraordinary levels of central bank accommodationism. For example, the Federal Reserve has begun raising rates, the Bank of Japan has changed its focus from the short‐term to the long‐term end of the rate curve, and the European Central Bank (“ECB”) has begun issuing somewhat less dovish‐sounding commentary.
While the artificially imposed low‐vol environment has reduced the immediate profit potential for trend followers, it likely simultaneously increases the importance of the latent crisis mitigation potential for trend strategies. However, with rising rates in the U.S., a change from short‐term rate reduction to long‐term rate stabilization in Japan, and less dovish ECB commentary in Europe, there are signs that the slow, uneven unwind of the extraordinary post‐GFC central bank and government accommodationism may be underway. Hopefully a successful unshackling of the markets’ customary risk monitoring capabilities will occur without major incident, which in turn would increase the likelihood that trend following systems would be able to generate a reasonable profit even in the absence of a crisis. In the meantime, trend following remains an operative mitigation tool in the event that hidden risks prove too large for the financial system to handle.
Sincerely,
Bryan R. Fisher
William Ware Bush
Performance data quoted represents past performance. Past performance does not guarantee future results. Investment return and principal value of an investment will fluctuate so that an investor’s shares, when sold or redeemed, may be worth more or less than the original cost. Current performance data may be higher or lower than actual data quoted. For the most current month-end performance data please call 1-855-845-9444.
The views of Aspen Partners, Ltd. and information discussed in this commentary are as of the date of publication, are subject to change, and may not reflect the writers’ current views. The views expressed are those of the Fund’s adviser only, and represent an assessment of market conditions at a specific point in time, are opinions only and should not be relied upon as investment advice regarding a particular investment or markets in general. Such information does not constitute a recommendation to buy or sell specific securities or investment vehicles. It should not be assumed that any investment will be profitable or will equal the performance of the portfolios or any securities or any sectors mentioned in this letter. The subject matter contained in this letter has been derived from several sources believed to be reliable and accurate at the time of compilation. Neither Aspen Partners Ltd. nor the Fund accepts any liability for losses either direct or consequential caused by the use of this information.
The Aspen Managed Futures Strategy Fund is distributed by ALPS Distributors, Inc.
The Fund is subject to investment risks, including possible loss of the principal amount invested and therefore is not suitable for all investors. The Fund may not achieve its objectives.
Diversification does not eliminate the risk of experiencing investment losses.
(1) | Correlation - a statistical measure of how two securities or portfolios move in relation to each other. |
(2) | Aspen Managed Futures Beta Index (Aspen MFBI) is constructed using a quantitative, rules-based model designed to replicate the trend following and counter-trend exposure of futures markets by allocating assets to liquid futures contracts of certain financial and commodities futures markets. The Index therefore seeks to reflect the performance of strategies and exposures common to a broad universe of futures markets, i.e., managed futures beta. The Index is not actively managed and does not reflect any deduction for fees, expenses or taxes. An investor cannot invest directly in the Index. |
(3) | Barclay BTOP50 Index is an index of the largest investable CTA programs as measured by assets under management. The index is not actively managed and does not reflect any deduction for fees, expenses or taxes. An investor may not invest directly into the Index. |
(4) | Brexit is an abbreviation for "British exit," which refers to the June 23, 2016, referendum whereby British citizens voted to exit the European Union. The referendum roiled global markets, including currencies, causing the British pound to fall to its lowest level in decades. |
(5) | V-bottom - a chart formation caused by a sharp extended decline followed by a sudden upward movement. |
(6) | Attribution - The portion of overall returns attributable to a given subset of the fund portfolio. |
(7) | Basis point is a common unit of measure fir interest rates and other percentages in finance. One basis point is equal to 1/100th of 1% or 0.01%(.0001). |
(8) | VIX Index - the Chicago Board Options Exchange (CBOE) Volatility Index, which shows the market's expectation of 30-day volatility. It is constructed using the implied volatilities of a wide range of S&P 500 index options. |
2
| Aspen Managed Futures Strategy Fund | Performance Update |
| | April 30, 2017 (Unaudited) |
Cumulative Total Return Performance as of April 30, 2017
| | | | | | | Expense Ratios |
| Aspen Managed Futures Strategy Fund | Calendar Year-to-Date | 1 Year | 3 Year | 5 Year | Since Inception* | Total | Net(1) |
Aspen Managed Futures Strategy Fund ‐ Class A (NAV)(2) | ‐6.88% | ‐6.97% | 0.18% | 0.42% | ‐1.55% | 1.61% | 1.61% |
Aspen Managed Futures Strategy Fund ‐ Class A (MOP)(3) | ‐12.03% | ‐12.05% | ‐1.68% | ‐0.71% | ‐2.51% | 1.61% | 1.61% |
Aspen Managed Futures Strategy Fund ‐ Class I | ‐6.99% | ‐7.33% | 0.28% | 0.63% | ‐1.31% | 1.23% | 1.23% |
SG CTA Index(4) | ‐0.04% | ‐4.58% | 4.54% | 1.79% | 0.81% | | |
Aspen Managed Futures Beta Index(5) | ‐6.28% | ‐5.63% | 2.16% | 2.53% | 0.64% | | |
Performance data quoted represents past performance. Past performance does not guarantee future results. Investment return and principal value of an investment will fluctuate so that an investor’s shares, when sold or redeemed, may be worth more or less than the original cost. Current performance data may be higher or lower than actual data quoted. For the most current month-end performance data, please call 1-855-845-9444.
The table does not reflect the deduction of taxes that a shareholder would pay on Fund distributions or the redemption of Fund shares. Subject to investment risks, including possible loss of the principal amount invested. Returns for periods greater than 1 year are annualized.
* | Fund Inception date of August 2, 2011. |
(1) | Aspen Partners, Ltd. (the “Adviser”) has agreed to waive and/or reimburse fees or expenses in order to limit total annual Fund operating expenses after fee waiver/expense reimbursements (excluding distribution and service (12b-1) fees, shareholder services fees, acquired fund fees and expenses, brokerage expenses, interest expenses, taxes and extraordinary expenses) to 1.55% of the Funds’ average daily net assets. This agreement (the “Expense Agreement”) is in effect through August 31, 2017. The Adviser will be permitted to recover, on a class-by-class basis, expenses it has borne through the Expense Agreement to the extent that the Funds’ expenses in later periods fall below the expense cap in effect at the time of waiver or reimbursement. Notwithstanding the foregoing, the Fund will not be obligated to pay any such deferred fees and expenses more than three years after the date of the waiver or reimbursement. The Expense Agreement may not be terminated or modified prior to August 31, 2017 except with the approval of the Funds’ Board of Trustees |
(2) | Net Asset Value (NAV) is the share price without sales charges. |
(3) | Maximum Offering Price (MOP) includes sales charges. Class A returns include effects of the Funds’ maximum sales charge of 5.50%. |
(4) | The SG CTA Index (formerly, the Newedge CTA Index) provides the market with a reliable daily performance benchmark of major commodity trading advisors (CTAs). The SG CTA Index calculates the daily rate of return for a pool of CTAs selected from the larger managers that are open to new investment. Selection of the pool of qualified CTAs used in construction of the Index will be conducted annually, with re-balancing on January 1st of each year. A committee of industry professionals has been established to monitor the methodology of the index on a regular basis. The Index is not actively managed and does not reflect any deduction for fees, expenses or taxes. An investor cannot invest directly in the Index. |
(5) | Aspen Managed Futures Beta Index – The Managed Futures Beta Index is constructed using a quantitative, rules-based model designed to replicate the trend-following and counter-trend exposure of futures markets by allocating assets to liquid futures contracts of certain financial and commodities futures markets. The Index therefore seeks to reflect the performance of strategies and exposures common to a broad universe of futures markets, i.e., managed futures beta. The index is not actively managed and does not reflect any deductions for fees, expense or taxes. An investor may not invest directly in an index. |
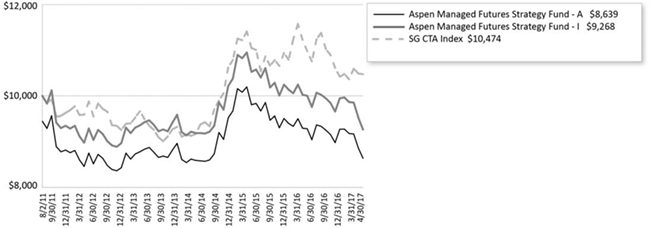
Portfolio Composition as of April 30, 2017
As a percentage of Net Assets^
^ | Holdings subject to change, and may not reflect the current or future position of the portfolio. |
| Annual Report | April 30, 2017 | 3 |
| Aspen Managed Futures Strategy Fund | Performance Update |
April 30, 2017 (Unaudited)
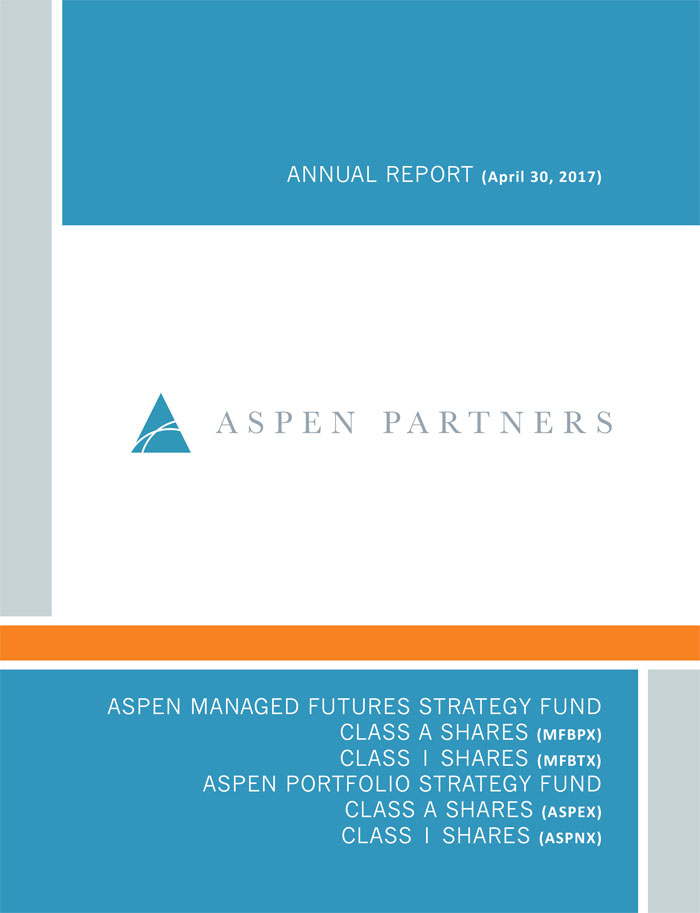
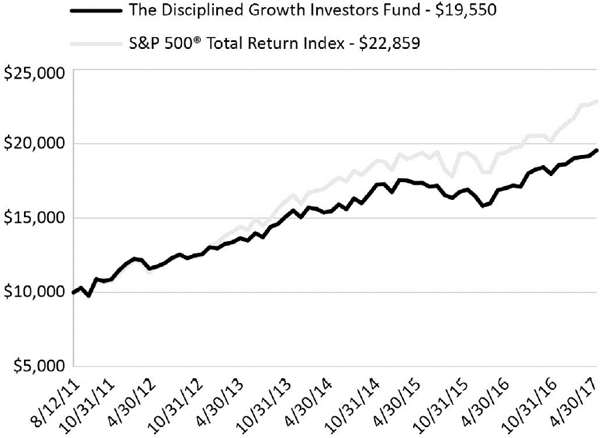
Performance of $10,000 Initial Investment (as of April 30, 2017)
Comparison of change in value of a $10,000 investment (includes applicable sales loads)
The chart above represents historical performance of a hypothetical investment of $10,000 in the Fund since inception. Past performance does not guarantee future results. This chart does not reflect the deduction of taxes that a shareholder would pay on Fund distributions or the redemption of Fund shares.
Investing in the Fund is subject to investment risks, including possible loss of the principal amount invested.
4| Aspen Portfolio Strategy Fund | Manager Commentary |
April 30, 2017 (Unaudited)
May 15, 2017
Performance Results
The Aspen Portfolio Strategy Fund (the “Fund”) launched on December 29, 2016. Performance for the first four months of 2017 for the Fund’s Class I shares was ‐1.77%. Per its mandate, the Fund traded the Aspen Portfolio Strategy, which combines full exposure to US large‐cap equities (the “Equity Strategy”) with full exposure to Aspen’s proprietary diversified trend following program (the “Futures Strategy”). To capture the Equity Strategy, the Fund can employ a variety of vehicles, including exchange‐traded funds and futures contracts. To capture the Futures Strategy, the Fund can take long or short positions in each eligible futures market. A long position in a futures market may post gains (losses) if the price of the futures contract rises (falls), whereas a short position may post gains (losses) if the price of the futures contract falls (rises).
The S&P 500 Index(1), a US large‐cap equity benchmark, returned +7.16%. See the following section for a description of the sources of the return differential between the Fund and the S&P 500.
Explanation of Fund Performance
Though the Fund launched in late December, the asset base was insufficient to start trading the Aspen Portfolio Strategy Fund until the third trading day of January. As a consequence, the Fund was unable to participate in the markets on the first two trading days in January, which were positive return days for the markets. Thus the losses for the Fund in January (‐2.25% return) were partly due to those missed days at the beginning of the month.
Beyond that, the Futures Strategy experienced losses that often accompany a very low‐volatility backdrop like what was experienced in the opening months of 2017. January and February exemplified this type of backdrop, with typically minor losses stemming from commodity, currency, and fixed income trends, partially offset by gains in (entirely long) equity trends. A strong month for the Equity Strategy enabled the Fund to post a +3.37% return in February.
After the first day of March, the US equity markets hit a lull that continued through the end of the reporting period. In the Futures Strategy, currency trend trading became particularly problematic in March, when currency positioning experienced a classic “V‐bottom”(2) bounce—a pattern where trend systems post losses in the initial leg down, turn short, and then post losses on the subsequent bounce back up. The initial decline in FX values was caused by a sudden increase in the markets’ expectations that the Federal Reserve would raise interest rates in their March meeting. Index trend positioning turned short after the FX decline. The Fed did indeed raise rates, but the markets were unimpressed with the hawkishness of the announcement; FX rates jumped up again in the aftermath of the announcement, causing losses for the short currency trend positions. These V‐bottom losses were a major contributor to the Fund’s ‐2.54% return in March.
Trend following continued to fare poorly in the ongoing low‐vol environment in April, but Trend losses were muted because trend positioning was limited in notional size and mixed in direction due to market choppiness the prior several months. Mildly positive Equity Strategy returns resulted in small losses overall, with the Fund returning ‐0.24% for the month of April.
Outlook
As noted above, volatility in the financial markets is very abnormally low, both in trailing terms across asset class complexes and in prospective terms (e.g., the VIX Index(3) is near all‐time lows as of this writing). Low‐vol, range‐bound markets are historically difficult for trend‐following, though the magnitude of the losses for the Fund early in 2017 was exacerbated by a few unusual events, particularly in currency markets. Conversely, such low‐vol backdrops are generally accretive to equity investing, as was the case for the Fund’s Equity Strategy through April. This is one of the reasons why the combination of equities and trend following, as captured in the Aspen Portfolio Strategy Fund, tends to smooth out the skewness of both equity‐ and trend‐based investing.
Many market commentators have begun to notice that volatility levels seem inexplicably depressed, perhaps unreasonably so given geopolitical and economic risks. Moreover, there are some early indications that we may be seeing the beginnings of the (undoubtedly slow and uneven) unwind of one of the primary causes of the unusually low‐vol environment that has prevailed since the end of the Great Financial Crisis (“GFC”)—i.e., extraordinary levels of central bank accommodationism. For example, the Federal Reserve has begun raising rates, the Bank of Japan has changed its focus from the short‐term to the long‐term end of the rate curve, and the ECB has begun issuing somewhat less dovish‐sounding commentary.
| Annual Report | April 30, 2017 | 5 |
| Aspen Portfolio Strategy Fund | Manager Commentary |
April 30, 2017 (Unaudited)
While the artificially imposed low‐vol environment has reduced the immediate profit potential for trend following—while simultaneously helping to produce excellent post‐crisis returns for equities—it likely simultaneously increases the importance of the latent crisis mitigation potential for trend strategies. However, with rising rates in the U.S., a change from short‐term rate reduction to long‐term rate stabilization in Japan, and less dovish ECB commentary in Europe, there are signs that the slow, uneven unwind of the extraordinary post‐GFC central bank and government accommodationism may be underway. Hopefully a successful unshackling of the markets’ customary risk monitoring capabilities will occur without major incident, which in turn would increase the likelihood that trend following systems would be able to generate a reasonable profit even in the absence of a crisis—the “Goldilocks”(4) scenario for an equity‐plus‐trend program like the Aspen Portfolio Strategy Fund. In the meantime, trend following remains an operative mitigation tool in the event that hidden risks prove too large for the financial system to handle, so that holding a sizable allocation to trend following can potentially enable lower‐risk holding of equity investments.
Sincerely,
Bryan R. Fisher
William Ware Bush
Performance data quoted represents past performance. Past performance does not guarantee future results. Investment return and principal value of an investment will fluctuate so that an investor’s shares, when sold or redeemed, may be worth more or less than the original cost. Current performance data may be higher or lower than actual data quoted. For the most current month-end performance data please call 1-855-845-9444.
The views of Aspen Partners, Ltd. and information discussed in this commentary are as of the date of publication, are subject to change, and may not reflect the writers’ current views. The views expressed are those of the Fund’s adviser only, and represent an assessment of market conditions at a specific point in time, are opinions only and should not be relied upon as investment advice regarding a particular investment or markets in general. Such information does not constitute a recommendation to buy or sell specific securities or investment vehicles. It should not be assumed that any investment will be profitable or will equal the performance of the portfolios or any securities or any sectors mentioned in this letter. The subject matter contained in this letter has been derived from several sources believed to be reliable and accurate at the time of compilation. Neither Aspen Partners Ltd. nor the Fund accepts any liability for losses either direct or consequential caused by the use of this information.
The Aspen Portfolio Strategy Funds are distributed by ALPS Distributors, Inc.
The Fund is subject to investment risks, including possible loss of the principal amount invested and therefore is not suitable for all investors.
The Fund may not achieve its objectives. The Fund is new with limited operating history.
Diversification does not eliminate the risk of experiencing investment losses.
(1) | The The S&P 500® Total Return Index is an unmanaged index of 500 common stocks chosen for market size, liquidity and industry group representation. It is a market-value weighted index. The Index is not actively managed and does not reflect any deductions for fees, expenses or taxes. An investor may not invest directly in the Index |
(2) | V-bottom - a chart formation caused by a sharp extended decline followed by a sudden upward movement. |
(3) | VIX Index - the Chicago Board Options Exchange (CBOE) Volatility Index, which shows the market's expectation of 30-day volatility. It is constructed using the implied volatilities of a wide range of S&P 500 index options. |
(4) | A scenario where markets are exhibiting neither highly elevated volatility (which on average tends to be problematic for equity investing) or extremely low volatility (which on average tends to be problematic for trend following). The name refers to Goldilocks finding the middle ground between too hot/big/hard and too cold/small/soft in the story The Three Bears. |
6| Aspen Portfolio Strategy Fund | Performance Update |
April 30, 2017 (Unaudited)
Cumulative Total Return Performance as of April 30, 2017
| | | | Expense Ratios |
| Aspen Portfolio Strategy Fund | Calendar Year-to-Date | Since Inception* | Gross | Net(1) |
Aspen Portfolio Strategy Fund ‐ Class A (NAV)(2) | ‐1.89% | ‐2.20% | 2.12% | 1.95% |
Aspen Portfolio Strategy Fund ‐ Class A (MOP)(3) | ‐7.28% | ‐7.60% | 2.12% | 1.95% |
| Aspen Portfolio Strategy Fund ‐ Class I | ‐1.77% | ‐2.08% | 1.72% | 1.55% |
| S&P 500 Total Return Index | 7.16% | 6.64% | | |
Performance data quoted represents past performance. Past performance does not guarantee future results. Investment return and principal value of an investment will fluctuate so that an investor’s shares, when sold or redeemed, may be worth more or less than the original cost. Current performance data may be higher or lower than actual data quoted. For the most current month-end performance data, please call 1-855-845-9444.
The table does not reflect the deduction of taxes that a shareholder would pay on Fund distributions or the redemption of Fund shares.
Subject to investment risks, including possible loss of the principal amount invested.
Returns for periods greater than 1 year are annualized.
* | Fund Inception date of December 28, 2016. |
(1) | Aspen Partners, Ltd. (the “Adviser”) has agreed to waive and/or reimburse fees or expenses in order to limit total annual Fund operating expenses after fee waiver/expense reimbursements (excluding distribution and service (12b-1) fees, shareholder services fees, acquired fund fees and expenses, brokerage expenses, interest expenses, taxes and extraordinary expenses) to 1.55% of the Funds’ average daily net assets. This agreement (the “Expense Agreement”) is in effect through August 31, 2018. The Adviser will be permitted to recover, on a class-by-class basis, expenses it has borne through the Expense Agreement to the extent that the Funds’ expenses in later periods fall below the expense cap in effect at the time of waiver or reimbursement. Notwithstanding the foregoing, the Fund will not be obligated to pay any such deferred fees and expenses more than three years after the date of the waiver or reimbursement. The Expense Agreement may not be terminated or modified prior to August 31, 2018 except with the approval of the Funds’ Board of Trustees |
(2) | Net Asset Value (NAV) is the share price without sales charges. |
(3) | Maximum Offering Price (MOP) includes sales charges. Class A returns include effects of the Funds’ maximum sales charge of 5.50%. |
Portfolio Composition as of April 30, 2017
As a percentage of Net Assets^
^ | Holdings subject to change, and may not reflect the current or future position of the portfolio. |
| Annual Report | April 30, 2017 | 7 |
| Aspen Portfolio Strategy Fund | Performance Update |
April 30, 2017 (Unaudited)
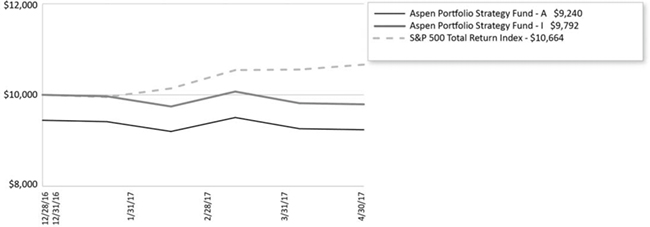
Performance of $10,000 Initial Investment (as of April 30, 2017)
Comparison of change in value of a $10,000 investment (includes applicable sales loads)
The chart above represents historical performance of a hypothetical investment of $10,000 in the Fund since inception. Past performance does not guarantee future results. This chart does not reflect the deduction of taxes that a shareholder would pay on Fund distributions or the redemption of Fund shares.
Investing in the Fund is subject to investment risks, including possible loss of the principal amount invested.
8| Aspen Funds | Consolidated Disclosure of Fund Expenses |
April 30, 2017 (Unaudited)
As a shareholder of the Fund, you incur two types of costs: transaction costs, including sales charges (loads) on purchase payments, reinvested dividends, or other distributions; redemption fees; and exchange fees; and (2) ongoing costs, including management fees; distribution and/or service (12b‐1) fees; shareholder servicing fees; and other fund operating expenses. This example is intended to help you understand your ongoing costs (in dollars), of investing in the Fund and to compare these costs with the ongoing costs of investing in other mutual funds.
This example is based on an investment of $1,000 invested at the beginning of the period and held for the entire six‐month period of November 1, 2016 through April 30, 2017.
Actual Expenses The first line of the table below provides information about actual account values and actual expenses. You may use the information in this line, together with the amount you invested, to estimate the expenses that you paid over the period. Simply divide your account value by $1,000 (for example, an $8,600 account value divided by $1,000 = 8.6), then multiply the result by the number in the first line under the heading “Expenses Paid During Period” to estimate the expenses you paid on your account during this period.
Hypothetical Example for Comparison Purposes The second line of the table below provides information about hypothetical account values and hypothetical expenses based on the Funds’ actual expense ratio and an assumed rate of return of 5% per year before expenses, which is not the Funds’ actual return. The hypothetical account values and expenses may not be used to estimate the actual ending account balance or expenses you paid for the period. You may use this information to compare the ongoing costs of investing in the Fund and other funds. To do so, compare this 5% hypothetical example with the 5% hypothetical examples that appear in the shareholder reports of other mutual funds.
Please note that the expenses shown in the table are meant to highlight your ongoing costs only and do not reflect any transactional costs, such as applicable sales charges (loads), redemption fees, or exchange fees. Therefore, the second line of the table is useful in comparing ongoing costs only and will not help you determine the relative total costs of owning different funds. In addition, if these transactional costs were included, your costs would have been higher.
| | Beginning Account Value 11/1/16 | Ending Account Value 4/30/17 | Expense Ratio(a) | Expenses Paid During period 11/1/16 - 4/30/17(b) |
| Aspen Managed Futures Strategy Fund | | | | |
| Class A | | | | |
| Actual | $1,000.00 | $961.90 | 0.97% | $4.72 |
| Hypothetical (5% return before expenses) | $1,000.00 | $1,019.98 | 0.97% | $4.86 |
| Class I | | | | |
| Actual | $1,000.00 | $959.80 | 1.33% | $6.46 |
| Hypothetical (5% return before expenses) | $1,000.00 | $1,018.20 | 1.33% | $6.66 |
| Aspen Portfolio Strategy Fund | | | | |
| Class A | | | | |
Actual(c) | $1,000.00 | $978.00 | 1.95% | $6.50 |
| Hypothetical (5% return before expenses) | $1,000.00 | $1,015.12 | 1.95% | $9.74 |
| Class I | | | | |
Actual(c) | $1,000.00 | $979.20 | 1.55% | $5.17 |
| Hypothetical (5% return before expenses) | $1,000.00 | $1,017.11 | 1.55% | $7.75 |
(a) | The Fund's expense ratios have been based on the Fund's most recent fiscal half-year expenses. |
(b) | Expenses are equal to the Fund's annualized expense ratio multiplied by the average account value over the period, multiplied by the number of days in the most recent fiscal half-year (181)/365 (to reflect the half-year period). |
(c) | The Aspen Portfolio Strategy Fund's commencement date is December 29, 2016. Actual expenses on this Fund is equal to the Fund's annualized expense ratio multiplied by the average account value of the period, multiplied by the number of days since the Fund launched (123), divided by 365. |
| Annual Report | April 30, 2017 | 9 |
| Aspen Managed Futures Strategy Fund | Consolidated Schedule of Investments |
April 30, 2017
| | | Principal Amount/ Shares | | | Value (Note 2) | |
| GOVERNMENT BONDS (27.09%) | | | | | | |
| U.S. TREASURY NOTES (27.09%) | | | | | | |
| 0.625%, 05/31/2017 | | $ | 90,000 | | | $ | 89,994 | |
| 0.625%, 06/30/2017 | | | 7,000,000 | | | | 6,998,768 | |
| 0.625%, 07/31/2017 | | | 14,823,000 | | | | 14,813,528 | |
| 0.625%, 08/31/2017 | | | 5,045,000 | | | | 5,040,369 | |
| 1.000%, 09/15/2017 | | | 5,000,000 | | | | 5,000,975 | |
| 0.625%, 09/30/2017 | | | 6,050,000 | | | | 6,041,730 | |
| 0.750%, 10/31/2017 | | | 5,229,000 | | | | 5,222,872 | |
| 0.625%, 11/30/2017 | | | 8,314,000 | | | | 8,293,705 | |
| 0.750%, 12/31/2017 | | | 3,075,000 | | | | 3,068,933 | |
| | | | | | | | | |
| TOTAL GOVERNMENT BONDS (Cost $54,618,306) | | | | | | | 54,570,874 | |
| | | | | | | | | |
| SHORT TERM INVESTMENTS (62.69%) | | | | | | | | |
| MONEY MARKET FUND (1.41%) | | | | | | | | |
| | | | | | | | | |
| Dreyfus Treasury & Agency Cash Management Fund ‐ Institutional Shares, 7‐day yield, 0.626% | | | 2,835,019 | | | | 2,835,019 | |
| | | | | | | | | |
| U.S. TREASURY BILLS (61.28%) | | | | | | | | |
0.492%, 05/25/2017(a) | | | 10,500,000 | | | | 10,495,380 | |
0.429%, 06/22/2017(a) | | | 13,350,000 | | | | 13,336,677 | |
0.402%, 07/20/2017(a) | | | 10,000,000 | | | | 9,983,140 | |
0.557%, 08/17/2017(a) | | | 14,000,000 | | | | 13,966,764 | |
0.528%, 09/14/2017(a) | | | 11,200,000 | | | | 11,163,981 | |
0.631%, 10/12/2017(a) | | | 9,400,000 | | | | 9,360,445 | |
0.507%, 11/09/2017(a) | | | 10,000,000 | | | | 9,950,130 | |
0.670%, 12/07/2017(a) | | | 13,400,000 | | | | 13,323,124 | |
0.770%, 01/04/2018(a) | | | 10,600,000 | | | | 10,529,902 | |
0.578%, 02/01/2018(a) | | | 10,400,000 | | | | 10,323,560 | |
0.898%, 03/29/2018(a) | | | 5,400,000 | | | | 5,350,261 | |
1.004%, 04/26/2018(a) | | | 5,700,000 | | | | 5,640,503 | |
| | | | | | | | 123,423,867 | |
| | | | | | | | | |
| TOTAL SHORT TERM INVESTMENTS (Cost $126,359,127) | | | | | | | 126,258,886 | |
| | | | | | | | | |
TOTAL INVESTMENTS (89.78%) (Cost $180,977,433) | | | | | | $ | 180,829,760 | |
| | | | | | | | | |
| Other Assets In Excess Of Liabilities (10.22%) | | | | | | | 20,578,397 | (b) |
| | | | | | | | | |
| NET ASSETS (100.00%) | | | | | | $ | 201,408,157 | |
| (a) | Rate shown represents the bond equivalent yield to maturity at date of purchase. |
| (b) | Includes cash which is being held as collateral for futures contracts. |
See Notes to Consolidated Financial Statements.
10
| Aspen Managed Futures Strategy Fund | Consolidated Schedule of Investments |
April 30, 2017
FUTURES CONTRACTS
At April 30, 2017, the Fund had the following outstanding futures contracts:
| Description | Position | | Contracts | | Expiration Date | | Underlying Face Amount at Value | | | Unrealized Appreciation | |
| Commodity Contracts | | | | | | | | | | | |
Copper Future(a) | Long | | | 48 | | 07/27/2017 | | $ | 3,129,000 | | | $ | 8,244 | |
Silver Future(a) | Short | | | 33 | | 07/27/2017 | | | (2,848,230 | ) | | | 28,038 | |
Soybean Future(a) | Short | | | 191 | | 07/14/2017 | | | (9,132,187 | ) | | | 1,681 | |
| Equity Contracts | | | | | | | | | | | | | | |
| Euro STOXX 50 Index Future | Long | | | 415 | | 06/16/2017 | | | 15,858,252 | | | | 565,210 | |
S&P®500 E‐Mini Future | Long | | | 133 | | 06/16/2017 | | | 15,830,325 | | | | 27,860 | |
| Foreign Currency Contracts | | | | | | | | | | | | | | |
| Canadian Dollar Currency Future | Short | | | 472 | | 06/20/2017 | | | (34,550,400 | ) | | | 468,400 | |
| Interest Rate Contracts | | | | | | | | | | | | | | |
| Canadian 10 Year Bond Future | Long | | | 109 | | 06/21/2017 | | | 11,143,943 | | | | 21,599 | |
| Long Gilt Future | Long | | | 67 | | 06/28/2017 | | | 11,131,073 | | | | 20,035 | |
| | | | | | | | | $ | 10,561,776 | | | $ | 1,141,067 | |
| Description | Position | | Contracts | | Expiration Date | | Underlying Face Amount at Value | | | Unrealized Depreciation | |
| Commodity Contracts | | | | | | | | | | | |
Corn Future(a) | Long | | | 163 | | 07/14/2017 | | $ | 2,986,975 | | | $ | (2,641 | ) |
Gold 100 Oz Future(a) | Long | | | 48 | | 06/28/2017 | | | 6,087,840 | | | | (5,196 | ) |
NY Harbor ULSD Future(a) | Long | | | 45 | | 05/31/2017 | | | 2,848,608 | | | | (65,351 | ) |
Sugar No. 11 (World) Future(a) | Short | | | 336 | | 06/30/2017 | | | (6,070,042 | ) | | | (212,033 | ) |
WTI Crude Future(a) | Long | | | 61 | | 05/22/2017 | | | 3,009,130 | | | | (255,788 | ) |
| Equity Contracts | | | | | | | | | | | | | | |
| FTSE 100 Index Future | Long | | | 58 | | 06/16/2017 | | | 5,382,466 | | | | (97,423 | ) |
| Nikkei 225 Index Future | Short | | | 54 | | 06/08/2017 | | | (5,193,450 | ) | | | (192,507 | ) |
| Foreign Currency Contracts | | | | | | | | | | | | | | |
| Australian Dollar Currency Future | Long | | | 294 | | 06/19/2017 | | | 21,979,440 | | | | (284,479 | ) |
| Euro FX Currency Future | Short | | | 245 | | 06/19/2017 | | | (33,445,563 | ) | | | (848,333 | ) |
| Japanese Yen Currency Future | Long | | | 206 | | 06/19/2017 | | | 23,159,550 | | | | (348,109 | ) |
| New Zealand Dollar Currency Future | Long | | | 654 | | 06/19/2017 | | | 44,877,480 | | | | (539,836 | ) |
| Swiss Franc Currency Future | Short | | | 360 | | 06/19/2017 | | | (45,396,000 | ) | | | (719,266 | ) |
| Interest Rate Contracts | | | | | | | | | | | | | | |
| Euro‐Bund Future | Short | | | 124 | | 06/08/2017 | | | (21,852,148 | ) | | | (70,476 | ) |
| U.S. 10 Year Treasury Note Future | Short | | | 88 | | 06/21/2017 | | | (11,063,254 | ) | | | (15,261 | ) |
| | | | | | | | | $ | (12,688,968 | ) | | $ | (3,656,699 | ) |
Common Abbreviations:
FTSE - Financial Times and the London Stock Exchange
S&P - Standard and Poor's
ULSD - Ultra Low Sulfur Diesel
| (a) | Owned by an entity that is owned by the Fund and is consolidated as described in Note 1 of the Notes to the Consolidated Financial Statements. |
For Fund compliance purposes, the Fund's industry classifications refer to any one or more of the industry sub-classifications used by one or more widely recognized market indexes or ratings group indexes, and/or as defined by Fund management. This definition may not apply for purposes of this report, which may combine industry sub-classifications for reporting ease. Industries are shown as a percentage of net assets.
See Notes to Consolidated Financial Statements.
| Annual Report | April 30, 2017 | 11 |
| Aspen Portfolio Strategy Fund | Consolidated Schedule of Investments |
April 30, 2017
| | | Shares | | | Value (Note 2) | |
| EXCHANGE TRADED FUNDS (77.93%) | | | | | | |
SPDR® S&P 500® ETF Trust | | | 141,781 | | | $ | 33,755,794 | |
| | | | | | | | | |
| TOTAL EXCHANGE TRADED FUNDS (Cost $33,131,361) | | | | | | | 33,755,794 | |
| | | | | | | | | |
| SHORT TERM INVESTMENTS (14.31%) | | | | | | | | |
| MONEY MARKET FUND (14.31%) | | | | | | | | |
| Dreyfus Treasury & Agency Cash Management Fund ‐ Institutional Shares, 7‐day yield, 0.626% | | | 6,199,164 | | | | 6,199,164 | |
| TOTAL SHORT TERM INVESTMENTS (Cost $6,199,164) | | | | | | | 6,199,164 | |
| | | | | | | | | |
TOTAL INVESTMENTS (92.24%) (Cost $39,330,525) | | | | | | $ | 39,954,958 | |
| | | | | | | | | |
| Other Assets In Excess Of Liabilities (7.76%) | | | | | | | 3,363,365 | (a) |
| | | | | | | | | |
| NET ASSETS (100.00%) | | | | | | $ | 43,318,323 | |
| (a) | Includes cash which is being held as collateral for futures contracts. |
See Notes to Consolidated Financial Statements.
12| Aspen Portfolio Strategy Fund | Consolidated Schedule of Investments |
April 30, 2017
FUTURES CONTRACTS
At April 30, 2017, the Fund had the following outstanding futures contracts:
| Description | Position | | Contracts | | Expiration Date | | Underlying Face Amount at Value | | | Unrealized Appreciation | |
| Commodity Contracts | | | | | | | | | | | |
Copper Future(a) | Long | | | 11 | | 07/27/2017 | | $ | 717,063 | | | $ | 3,265 | |
Gold 100 Oz Future(a) | Long | | | 12 | | 06/28/2017 | | | 1,521,960 | | | | 3,251 | |
Silver Future(a) | Short | | | 8 | | 07/27/2017 | | | (690,480 | ) | | | 8,294 | |
Soybean Future(a) | Short | | | 44 | | 07/14/2017 | | | (2,103,750 | ) | | | 18,537 | |
| Equity Contracts | | | | | | | | | | | | | | |
| Euro STOXX 50 Index Future | Long | | | 97 | | 06/16/2017 | | | 3,706,627 | | | | 127,555 | |
| Foreign Currency Contracts | | | | | | | | | | | | | | |
| Canadian Dollar Currency Future | Short | | | 111 | | 06/20/2017 | | | (8,125,200 | ) | | | 132,841 | |
| Euro FX Currency Future | Long | | | 20 | | 06/19/2017 | | | 2,730,250 | | | | 5,195 | |
| Interest Rate Contracts | | | | | | | | | | | | | | |
| Canadian 10 Year Bond Future | Long | | | 25 | | 06/21/2017 | | | 2,555,950 | | | | 8,336 | |
| Long Gilt Future | Long | | | 16 | | 06/28/2017 | | | 2,658,167 | | | | 5,563 | |
| | | | | | | | | $ | 2,970,587 | | | $ | 312,837 | |
| Description | Position | | Contracts | | Expiration Date | | Underlying Face Amount at Value | | | Unrealized Depreciation | |
| Commodity Contracts | | | | | | | | | | | |
Corn Future(a) | Long | | | 38 | | 07/14/2017 | | $ | 696,350 | | | $ | (13,916 | ) |
NY Harbor ULSD Future(a) | Long | | | 11 | | 05/31/2017 | | | 696,326 | | | | (16,529 | ) |
Sugar No. 11 (World) Future(a) | Short | | | 79 | | 06/30/2017 | | | (1,427,182 | ) | | | (22,513 | ) |
WTI Crude Future(a) | Long | | | 15 | | 05/22/2017 | | | 739,950 | | | | (66,029 | ) |
| Equity Contracts | | | | | | | | | | | | | | |
| FTSE 100 Index Future | Long | | | 14 | | 06/16/2017 | | | 1,299,216 | | | | (25,598 | ) |
| Nikkei 225 Index Future | Short | | | 13 | | 06/08/2017 | | | (1,250,275 | ) | | | (41,315 | ) |
S&P®500 E‐Mini Future | Long | | | 117 | | 06/16/2017 | | | 13,925,925 | | | | (1,393 | ) |
| Foreign Currency Contracts | | | | | | | | | | | | | | |
| Australian Dollar Currency Future | Short | | | 73 | | 06/19/2017 | | | (5,457,480 | ) | | | (10,161 | ) |
| Japanese Yen Currency Future | Long | | | 48 | | 06/19/2017 | | | 5,396,400 | | | | (72,582 | ) |
| Interest Rate Contracts | | | | | | | | | | | | | | |
| Euro‐Bund Future | Short | | | 29 | | 06/08/2017 | | | (5,110,583 | ) | | | (17,083 | ) |
| U.S. 10 Year Treasury Note Future | Short | | | 21 | | 06/21/2017 | | | (2,640,095 | ) | | | (6,943 | ) |
| | | | | | | | | $ | 6,868,552 | | | $ | (294,062 | ) |
Common Abbreviations:
FTSE - Financial Times and the London Stock Exchange
S&P - Standard and Poor's
ULSD - Ultra Low Sulfur Diesel
| (a) | Owned by an entity that is owned by the Fund and is consolidated as described in Note 1 of the Notes to the Consolidated Financial Statements. |
For Fund compliance purposes, the Fund's industry classifications refer to any one or more of the industry sub-classifications used by one or more widely recognized market indexes or ratings group indexes, and/or as defined by Fund management. This definition may not apply for purposes of this report, which may combine industry sub-classifications for reporting ease. Industries are shown as a percentage of net assets.
See Notes to Consolidated Financial Statements.
| Annual Report | April 30, 2017 | 13 |
| Aspen Funds | Consolidated Statements of Assets & Liabilities |
April 30, 2017
| | | Aspen Managed Futures Strategy Fund | | | Aspen Portfolio Strategy Fund | |
| ASSETS: | | | | | | |
| Investments, at value | | $ | 180,829,760 | | | $ | 39,954,958 | |
| Cash | | | 5,642,466 | | | | – | |
| Foreign currency, at value(Cost $– and $101,401) (Note 3) | | | – | | | | 103,225 | |
| Deposit with broker for futures contracts (Note 3) | | | 18,616,052 | | | | 3,377,009 | |
| Receivable for investments sold | | | 5,090,875 | | | | – | |
| Receivable for shares sold | | | 236,554 | | | | 75,506 | |
| Interest receivable | | | 85,087 | | | | 4,508 | |
| Offering costs (Note 2) | | | – | | | | 48,385 | |
| Prepaid and other assets | | | 13,733 | | | | 3,751 | |
| Total assets | | | 210,514,527 | | | | 43,567,342 | |
| | | | | | | | | |
| LIABILITIES: | | | | | | | | |
| Foreign cash due to broker for futures contracts (Cost $2,768,312 and $–) (Note 3) | | | 2,706,311 | | | | – | |
| Payable to advisor | | | 129,829 | | | | 6,141 | |
| Payable for investments purchased | | | 5,643,380 | | | | – | |
| Variation margin payable | | | 264,177 | | | | 90,558 | |
| Payable for shares redeemed | | | 213,719 | | | | 105,618 | |
| Payable for administration fees | | | 22,290 | | | | 11,652 | |
| Payable for distribution and service fees | | | | | | | | |
| Class A | | | 4,420 | | | | 2,182 | |
| Payable for transfer agency fees | | | 7,886 | | | | 3,128 | |
| Delegated transfer agent equivalent services fees | | | | | | | | |
| Class A | | | 230 | | | | – | |
| Class I | | | 30,001 | | | | 2,573 | |
| Payable for trustee fees and expenses | | | 890 | | | | 258 | |
| Payable for professional fees | | | 29,162 | | | | 23,204 | |
| Payable for chief compliance officer fees | | | 3,123 | | | | 605 | |
| Payable for principal financial officer fees | | | 406 | | | | 11 | |
| Payable for licensing fees | | | 43,276 | | | | – | |
| Accrued expenses and other liabilities | | | 7,270 | | | | 3,089 | |
| Total liabilities | | | 9,106,370 | | | | 249,019 | |
| NET ASSETS | | $ | 201,408,157 | | | $ | 43,318,323 | |
| | | | | | | | | |
| NET ASSETS CONSIST OF: | | | | | | | | |
| | | | | | | | | |
| Paid‐in capital (Note 5) | | $ | 229,634,590 | | | $ | 43,488,585 | |
| Accumulated net investment income/(loss) | | | (592,781 | ) | | | 62,516 | |
| Accumulated net realized loss | | | (25,035,605 | ) | | | (878,395 | ) |
| Net unrealized appreciation/(depreciation) | | | (2,598,047 | ) | | | 645,617 | |
| NET ASSETS | | $ | 201,408,157 | | | $ | 43,318,323 | |
| | | | | | | | | |
| INVESTMENTS, AT COST | | $ | 180,977,433 | | | $ | 39,330,525 | |
See Notes to Consolidated Financial Statements.
14
| Aspen Funds | Consolidated Statements of Assets & Liabilities |
April 30, 2017
| PRICING OF SHARES: | | | | | | |
| Class A: | | | | | | |
| Net Asset Value, offering and redemption price per share | | $ | 8.12 | | | $ | 24.45 | |
| Net Assets | | $ | 6,330,770 | | | $ | 2,196,398 | |
| Shares of beneficial interest outstanding | | | 779,627 | | | | 89,845 | |
| Maximum offering price per share (NAV/0.9450), based on maximum sales charge of 5.50% of the offering price | | $ | 8.59 | | | $ | 25.87 | |
| | | | | | | | | |
| Class I: | | | | | | | | |
| Net Asset Value, offering and redemption price per share | | $ | 8.25 | | | $ | 24.48 | |
| Net Assets | | $ | 195,077,386 | | | $ | 41,121,925 | |
| Shares of beneficial interest outstanding | | | 23,636,548 | | | | 1,679,893 | |
See Notes to Consolidated Financial Statements.
| Annual Report | April 30, 2017 | 15 |
| Aspen Funds | Consolidated Statements of Operations |
For the Year or Period Ended April 30, 2017
| | | Aspen Managed Futures Strategy Fund | | | Aspen Portfolio Strategy Fund(a) | |
| INVESTMENT INCOME: | | | | | | |
| Interest | | $ | 1,237,418 | | | $ | – | |
| Dividends | | | 5,983 | | | | 159,526 | |
| Total investment income | | | 1,243,401 | | | | 159,526 | |
| | | | | | | | | |
| EXPENSES: | | | | | | | | |
| Investment advisory fees (Note 6) | | | 1,871,444 | | | | 102,326 | |
| Investment advisory fees ‐ subsidiary (Note 6) | | | 169,945 | | | | 2,784 | |
| Administrative fees | | | 236,234 | | | | 31,446 | |
| Distribution and service fees | | | | | | | | |
| Class A | | | 21,562 | | | | 3,874 | |
| Transfer agency fees | | | 73,351 | | | | 10,315 | |
| Delegated transfer agent equivalent services fees | | | | | | | | |
| Class A | | | 1,747 | | | | – | |
| Class I | | | 180,348 | | | | 4,830 | |
| Professional fees | | | 49,069 | | | | 23,459 | |
| Offering costs | | | – | | | | 31,494 | |
| Custodian fees | | | 11,871 | | | | 3,838 | |
| Trustee fees and expenses | | | 17,983 | | | | 12,885 | |
| Principal financial officer fees | | | 4,861 | | | | 139 | |
| Chief compliance officer fees | | | 36,388 | | | | 1,755 | |
| Licensing fees | | | 623,814 | | | | – | |
| Other | | | 44,532 | | | | 5,972 | |
| Total expenses before waiver/reimbursement | | | 3,343,149 | | | | 235,117 | |
| Waiver of investment advisory fees | | | – | | | | (69,902 | ) |
| Waiver of investment advisory fees ‐ subsidiary (Note 6) | | | (169,945 | ) | | | (2,784 | ) |
| Total net expenses | | | 3,173,204 | | | | 162,431 | |
| NET INVESTMENT LOSS | | | (1,929,803 | ) | | | (2,905 | ) |
| | | | | | | | | |
| Net realized gain/(loss) on investments | | | 5,768 | | | | (218 | ) |
| Net realized loss on futures contracts | | | (7,984,165 | ) | | | (1,515,500 | ) |
| Net realized gain on foreign currency transactions | | | 316,994 | | | | 1,071 | |
| Total net realized loss | | | (7,661,403 | ) | | | (1,514,647 | ) |
| Net change in unrealized appreciation/(depreciation) of investments | | | (242,460 | ) | | | 624,433 | |
| Net change in unrealized appreciation/(depreciation) on futures contracts | | | (7,635,549 | ) | | | 18,775 | |
| Net change in unrealized appreciation on translation of assets and liabilities denominated in foreign currency transactions | | | 105,959 | | | | 2,409 | |
| Net change in unrealized appreciation/(depreciation) | | | (7,772,050 | ) | | | 645,617 | |
| NET REALIZED AND UNREALIZED LOSS ON INVESTMENTS | | | (15,433,453 | ) | | | (869,030 | ) |
| NET DECREASE IN NET ASSETS RESULTING FROM OPERATIONS | | $ | (17,363,256 | ) | | $ | (871,935 | ) |
| (a) | The Aspen Portfolio Strategy Fund is for the period from December 29, 2016 (commencement of operations) to April 30, 2017. |
See Notes to Consolidated Financial Statements.
16| Aspen Managed Futures Strategy Fund | Consolidated Statements
of Changes in Net Assets |
| | | For the Year Ended April 30, 2017 | | | For the Year Ended April 30, 2016 | |
| OPERATIONS: | | | | | | |
| Net investment loss | | $ | (1,929,803 | ) | | $ | (2,786,624 | ) |
| Net realized loss | | | (7,661,403 | ) | | | (22,047,854 | ) |
| Net change in unrealized appreciation/(depreciation) | | | (7,772,050 | ) | | | 9,897,802 | |
| Net decrease in net assets resulting from operations | | | (17,363,256 | ) | | | (14,936,676 | ) |
| | | | | | | | | |
| DISTRIBUTIONS TO SHAREHOLDERS (Note 4): | | | | | | | | |
| From net investment income | | | | | | | | |
| Class A | | | (87,401 | ) | | | (290,384 | ) |
| Class I | | | (2,130,729 | ) | | | (4,854,577 | ) |
| From net realized gains on investments | | | | | | | | |
| Class A | | | – | | | | (1,080,184 | ) |
| Class I | | | – | | | | (15,329,525 | ) |
| Net decrease in net assets from distributions | | | (2,218,130 | ) | | | (21,554,670 | ) |
| | | | | | | | | |
| SHARE TRANSACTIONS (Note 5): | | | | | | | | |
| Class A | | | | | | | | |
| Proceeds from sales of shares | | | 5,709,455 | | | | 17,757,620 | |
| Distributions reinvested | | | 77,296 | | | | 1,314,015 | |
| Cost of shares redeemed | | | (18,518,215 | ) | | | (20,727,211 | ) |
| Redemption fees | | | 2,337 | | | | 5,100 | |
| Class I | | | | | | | | |
| Proceeds from sales of shares | | | 67,326,891 | | | | 83,806,547 | |
| Distributions reinvested | | | 1,277,264 | | | | 16,756,950 | |
| Cost of shares redeemed | | | (119,175,878 | ) | | | (44,568,213 | ) |
| Redemption fees | | | 9,991 | | | | 2,041 | |
| Net increase/(decrease) from share transactions | | | (63,290,859 | ) | | | 54,346,849 | |
| | | | | | | | | |
| Net increase/(decrease) in net assets | | | (82,872,245 | ) | | | 17,855,503 | |
| | | | | | | | | |
| NET ASSETS: | | | | | | | | |
| Beginning of period | | | 284,280,402 | | | | 266,424,899 | |
| End of period* | | $ | 201,408,157 | | | $ | 284,280,402 | |
| *Includes accumulated net investment income/(loss) of: | | $ | (592,781 | ) | | $ | 2,217,954 | |
| | | | | | | | | |
| Other Information: | | | | | | | | |
| SHARE TRANSACTIONS: | | | | | | | | |
| Class A | | | | | | | | |
| Sold | | | 657,148 | | | | 1,836,531 | |
| Distributions reinvested | | | 8,695 | | | | 146,490 | |
| Redeemed | | | (2,116,176 | ) | | | (2,134,823 | ) |
| Net decrease in shares outstanding | | | (1,450,333 | ) | | | (151,802 | ) |
| | | | | | | | | |
| Class I | | | | | | | | |
| Sold | | | 7,602,448 | | | | 8,468,843 | |
| Distributions reinvested | | | 141,447 | | | | 1,837,385 | |
| Redeemed | | | (13,558,549 | ) | | | (4,699,475 | ) |
| Net increase/(decrease) in shares outstanding | | | (5,814,654 | ) | | | 5,606,753 | |
See Notes to Consolidated Financial Statements.
| Annual Report | April 30, 2017 | 17 |
| Aspen Portfolio Strategy Fund | Consolidated Statements
of Changes in Net Assets |
| | | For the Period Ended April 30, 2017(a) | |
| OPERATIONS: | | | |
| Net investment loss | | $ | (2,905 | ) |
| Net realized loss | | | (1,514,647 | ) |
| Net change in unrealized appreciation | | | 645,617 | |
| Net decrease in net assets resulting from operations | | | (871,935 | ) |
| | | | | |
| SHARE TRANSACTIONS (Note 5): | | | | |
| Class A | | | | |
| Proceeds from sales of shares | | | 4,346,888 | |
| Cost of shares redeemed | | | (2,024,348 | ) |
| Class I | | | | |
| Proceeds from sales of shares | | | 42,535,105 | |
| Cost of shares redeemed | | | (669,987 | ) |
| Redemption fees | | | 2,600 | |
| Net increase from share transactions | | | 44,190,258 | |
| | | | | |
| Net increase in net assets | | | 43,318,323 | |
| | | | | |
| NET ASSETS: | | | | |
| Beginning of period | | | – | |
| End of period* | | $ | 43,318,323 | |
| *Includes accumulated net investment income of: | | $ | 62,516 | |
| | | | | |
| Other Information: | | | | |
| SHARE TRANSACTIONS: | | | | |
| Class A | | | | |
| Sold | | | 173,467 | |
| Redeemed | | | (83,622 | ) |
| Net increase in shares outstanding | | | 89,845 | |
| | | | | |
| Class I | | | | |
| Sold | | | 1,707,193 | |
| Redeemed | | | (27,300 | ) |
| Net increase in shares outstanding | | | 1,679,893 | |
| (a) | The Aspen Portfolio Strategy Fund is for the period from December 29, 2016 (commencement of operations) to April 30, 2017. |
See Notes to Consolidated Financial Statements.
18
| Aspen Managed Futures Strategy Fund – Class A | Consolidated Financial Highlights |
For a share outstanding throughout the periods presented.
| | | For the Year Ended April 30, 2017(a) | | | For the Year Ended April 30, 2016(a) | | | For the Year Ended April 30, 2015(a) | | | For the Year Ended April 30, 2014(a) | | | For the Year Ended April 30, 2013(a) | |
| NET ASSET VALUE, BEGINNING OF PERIOD | | $ | 8.83 | | | $ | 10.01 | | | $ | 8.97 | | | $ | 9.29 | | | $ | 8.95 | |
| INCOME/(LOSS) FROM OPERATIONS: | | | | | | | | | | | | | | | | | | | | |
Net investment loss(b) | | | (0.04 | ) | | | (0.12 | ) | | | (0.14 | ) | | | (0.16 | ) | | | (0.16 | ) |
| Net realized and unrealized gain/(loss) on investments | | | (0.57 | ) | | | (0.39 | ) | | | 1.39 | | | | (0.05 | ) | | | 0.50 | |
| Total from investment operations | | | (0.61 | ) | | | (0.51 | ) | | | 1.25 | | | | (0.21 | ) | | | 0.34 | |
| LESS DISTRIBUTIONS: | | | | | | | | | | | | | | | | | | | | |
| From net investment income | | | (0.10 | ) | | | (0.14 | ) | | | – | | | | – | | | | – | |
| Distributions from net realized gain on investments | | | – | | | | (0.53 | ) | | | (0.21 | ) | | | (0.12 | ) | | | – | |
| Total distributions | | | (0.10 | ) | | | (0.67 | ) | | | (0.21 | ) | | | (0.12 | ) | | | – | |
| REDEMPTION FEES ADDED TO PAID IN CAPITAL | | | 0.00 | (c) | | | 0.00 | (c) | | | 0.00 | (c) | | | 0.01 | | | | 0.00 | (c) |
| INCREASE/(DECREASE) IN NET ASSET VALUE | | | (0.71 | ) | | | (1.18 | ) | | | 1.04 | | | | (0.32 | ) | | | 0.34 | |
| NET ASSET VALUE, END OF PERIOD | | $ | 8.12 | | | $ | 8.83 | | | $ | 10.01 | | | $ | 8.97 | | | $ | 9.29 | |
| | | | | | | | | | | | | | | | | | | | | |
TOTAL RETURN(d) | | | (6.97 | %) | | | (5.20 | %) | | | 14.00 | % | | | (2.15 | %) | | | 3.80 | % |
| | | | | | | | | | | | | | | | | | | | | |
| RATIOS AND SUPPLEMENTAL DATA: | | | | | | | | | | | | | | | | | | | | |
| Net assets, end of period (000's) | | $ | 6,331 | | | $ | 19,682 | | | $ | 23,850 | | | $ | 12,914 | | | $ | 3,350 | |
| | | | | | | | | | | | | | | | | | | | | |
| RATIOS TO AVERAGE NET ASSETS: | | | | | | | | | | | | | | | | | | | | |
| Operating expenses excluding fee waivers/reimbursements | | | 1.00 | %(e) | | | 1.56 | %(e) | | | 1.64 | % | | | 1.83 | % | | | 1.80 | % |
| Operating expenses including fee waivers/reimbursements | | | 1.00 | % | | | 1.56 | % | | | 1.64 | % | | | 1.83 | % | | | 1.80 | % |
| Net investment loss including fee waivers/reimbursements | | | (0.52 | %) | | | (1.24 | %) | | | (1.50 | %) | | | (1.72 | %) | | | (1.75 | %) |
| | | | | | | | | | | | | | | | | | | | | |
| PORTFOLIO TURNOVER RATE | | | 31 | % | | | 58 | % | | | 38 | % | | | 90 | % | | | 0 | % |
| (a) | Per share amounts and ratios to average net assets include income and expenses of the Aspen Futures Fund Ltd. (subsidiary), exclusive of the subsidiary's management fee. |
| (b) | Per share numbers have been calculated using the average shares method. |
| (c) | Less than $0.005 per share. |
| (d) | Total return does not reflect the effect of sales charges. |
| (e) | The ratio of operating expenses excluding fee waiver/reimbursements to average net assets is calculated excluding the waived Subsidiary management fee (see Note 6 for additional detail). The ratio inclusive of that fee would be 1.07% and 1.64% for the years ended April 30, 2017 and April 30, 2016, respectively. |
See Notes to Consolidated Financial Statements.
| Annual Report | April 30, 2017 | 19 |
| Aspen Managed Futures Strategy Fund – Class I | Consolidated Financial Highlights |
For a share outstanding throughout the periods presented.
| | | For the Year Ended April 30, 2017(a) | | | For the Year Ended April 30, 2016(a) | | | For the Year Ended April 30, 2015(a) | | | For the Year Ended April 30, 2014(a) | | | For the Year Ended April 30, 2013(a) | |
| NET ASSET VALUE, BEGINNING OF PERIOD | | $ | 8.98 | | | $ | 10.17 | | | $ | 9.07 | | | $ | 9.36 | | | $ | 8.98 | |
| INCOME/(LOSS) FROM OPERATIONS: | | | | | | | | | | | | | | | | | | | | |
Net investment loss(b) | | | (0.07 | ) | | | (0.09 | ) | | | (0.11 | ) | | | (0.11 | ) | | | (0.11 | ) |
| Net realized and unrealized gain/(loss) on investments | | | (0.58 | ) | | | (0.40 | ) | | | 1.42 | | | | (0.06 | ) | | | 0.49 | |
| Total from investment operations | | | (0.65 | ) | | | (0.49 | ) | | | 1.31 | | | | (0.17 | ) | | | 0.38 | |
| LESS DISTRIBUTIONS: | | | | | | | | | | | | | | | | | | | | |
| From net investment income | | | (0.08 | ) | | | (0.17 | ) | | | – | | | | – | | | | – | |
| Distributions from net realized gain on investments | | | – | | | | (0.53 | ) | | | (0.21 | ) | | | (0.12 | ) | | | – | |
| Total distributions | | | (0.08 | ) | | | (0.70 | ) | | | (0.21 | ) | | | (0.12 | ) | | | – | |
| REDEMPTION FEES ADDED TO PAID IN CAPITAL | | | 0.00 | (c) | | | 0.00 | (c) | | | 0.00 | (c) | | | 0.00 | (c) | | | 0.00 | (c) |
| INCREASE/(DECREASE) IN NET ASSET VALUE | | | (0.73 | ) | | | (1.19 | ) | | | 1.10 | | | | (0.29 | ) | | | 0.38 | |
| NET ASSET VALUE, END OF PERIOD | | $ | 8.25 | | | $ | 8.98 | | | $ | 10.17 | | | $ | 9.07 | | | $ | 9.36 | |
| | | | | | | | | | | | | | | | | | | | | |
| TOTAL RETURN | | | (7.33 | %) | | | (4.97 | %) | | | 14.51 | % | | | (1.81 | %) | | | 4.23 | % |
| | | | | | | | | | | | | | | | | | | | | |
| RATIOS AND SUPPLEMENTAL DATA: | | | | | | | | | | | | | | | | | | | | |
| Net assets, end of period (000's) | | $ | 195,077 | | | $ | 264,598 | | | $ | 242,575 | | | $ | 167,258 | | | $ | 120,769 | |
| | | | | | | | | | | | | | | | | | | | | |
| RATIOS TO AVERAGE NET ASSETS: | | | | | | | | | | | | | | | | | | | | |
| Operating expenses excluding fee waivers/reimbursements | | | 1.28 | %(d) | | | 1.22 | %(d) | | | 1.25 | % | | | 1.30 | % | | | 1.25 | % |
| Operating expenses including fee waivers/reimbursements | | | 1.28 | % | | | 1.22 | % | | | 1.25 | % | | | 1.30 | % | | | 1.25 | % |
| Net investment loss including fee waivers/reimbursements | | | (0.78 | %) | | | (0.94 | %) | | | (1.11 | %) | | | (1.20 | %) | | | (1.20 | %) |
| | | | | | | | | | | | | | | | | | | | | |
| PORTFOLIO TURNOVER RATE | | | 31 | % | | | 58 | % | | | 38 | % | | | 90 | % | | | 0 | % |
| (a) | Per share amounts and ratios to average net assets include income and expenses of the Aspen Futures Fund Ltd. (subsidiary), exclusive of the subsidiary's management fee. |
| (b) | Per share numbers have been calculated using the average shares method. |
| (c) | Less than $0.005 per share. |
| (d) | The ratio of operating expenses excluding fee waiver/reimbursements to average net assets is calculated excluding the waived Subsidiary management fee (see Note 6 for additional detail). The ratio inclusive of that fee would be 1.35% and 1.30% for the years ended April 30, 2017 and April 30, 2016, respectively. |
See Notes to Consolidated Financial Statements.
20
| Aspen Portfolio Strategy Fund – Class A | Consolidated Financial Highlights |
For a share outstanding throughout the periods presented.
| | | For the Period Ended April 30, 2017(a)(b) | |
| NET ASSET VALUE, BEGINNING OF PERIOD | | $ | 25.00 | |
| INCOME/(LOSS) FROM OPERATIONS: | | | | |
Net investment loss(c) | | | (0.03 | ) |
| Net realized and unrealized loss on investments | | | (0.52 | ) |
| Total from investment operations | | | (0.55 | ) |
| DECREASE IN NET ASSET VALUE | | | (0.55 | ) |
| NET ASSET VALUE, END OF PERIOD | | $ | 24.45 | |
| | | | | |
TOTAL RETURN(d) | | | (2.20 | %)(e) |
| | | | | |
| RATIOS AND SUPPLEMENTAL DATA: | | | | |
| Net assets, end of period (000's) | | $ | 2,196 | |
| | | | | |
| RATIOS TO AVERAGE NET ASSETS: | | | | |
| Operating expenses excluding fee waivers/reimbursements | | | 2.79 | %(f)(g) |
| Operating expenses including fee waivers/reimbursements | | | 1.95 | %(f) |
| Net investment loss including fee waivers/reimbursements | | | (0.40 | %)(f) |
| | | | | |
| PORTFOLIO TURNOVER RATE | | | 0 | %(e)(h) |
| (a) | The Aspen Portfolio Strategy Fund commenced investment operations on December 29, 2016. |
| (b) | Per share amounts and ratios to average net assets include income and expenses of the Aspen Portfolio Strategy Fund Ltd. (subsidiary), exclusive of the subsidiary's management fee. |
| (c) | Per share numbers have been calculated using the average shares method. |
| (d) | Total return does not reflect the effect of sales charges. |
| (g) | The ratio of operating expenses excluding fee waiver/reimbursements to average net assets is calculated excluding the waived Subsidiary management fee (see Note 6 for additional detail). The ratio inclusive of that fee would be 2.82% for the period ended April 30, 2017. |
See Notes to Consolidated Financial Statements.
| Annual Report | April 30, 2017 | 21 |
| Aspen Portfolio Strategy Fund – Class I | Consolidated Financial Highlights |
For a share outstanding throughout the periods presented.
| | | For the Period Ended April 30, 2017(a)(b) | |
| NET ASSET VALUE, BEGINNING OF PERIOD | | $ | 25.00 | |
| INCOME/(LOSS) FROM OPERATIONS: | | | | |
Net investment income(c) | | | 0.00 | (d)(e) |
| Net realized and unrealized loss on investments | | | (0.52 | ) |
| Total from investment operations | | | (0.52 | ) |
| REDEMPTION FEES ADDED TO PAID IN CAPITAL | | | 0.00 | (d) |
| DECREASE IN NET ASSET VALUE | | | (0.52 | ) |
| NET ASSET VALUE, END OF PERIOD | | $ | 24.48 | |
| | | | | |
| TOTAL RETURN | | | (2.08 | %)(f) |
| | | | | |
| RATIOS AND SUPPLEMENTAL DATA: | | | | |
| Net assets, end of period (000's) | | $ | 41,122 | |
| | | | | |
| RATIOS TO AVERAGE NET ASSETS: | | | | |
| Operating expenses excluding fee waivers/reimbursements | | | 2.22 | %(g)(h) |
| Operating expenses including fee waivers/reimbursements | | | 1.55 | %(g) |
| Net investment income including fee waivers/reimbursements | | | 0.01 | %(g) |
| | | | | |
| PORTFOLIO TURNOVER RATE | | | 0 | %(f)(i) |
| (a) | The Aspen Portfolio Strategy Fund commenced investment operations on December 29, 2016. |
| (b) | Per share amounts and ratios to average net assets include income and expenses of the Aspen Portfolio Strategy Fund Ltd. (subsidiary), exclusive of the subsidiary's management fee. |
| (c) | Per share numbers have been calculated using the average shares method. |
| (d) | Less than $0.005 per share. |
| (e) | The amount shown for a share outstanding throughout the period may not correlate with the Statement of Operations for the period due to the timing of sales and redemptions of Fund shares in relation to income earned and/or fluctuating market value of the investments of the Fund. |
| (h) | The ratio of operating expenses excluding fee waiver/reimbursements to average net assets is calculated excluding the waived Subsidiary management fee (see Note 6 for additional detail). The ratio inclusive of that fee would be 2.25% for the period ended April 30, 2017. |
See Notes to Consolidated Financial Statements.
22
| Aspen Funds | Notes to Consolidated Financial Statements |
1. ORGANIZATION
Financial Investors Trust (the “Trust”), a Delaware statutory trust, is an open‐end management investment company registered under the Investment Company Act of 1940, as amended (“1940 Act”). As of April 30, 2017, the Trust consists of multiple separate portfolios or series. This annual report describes the Aspen Managed Futures Strategy Fund and the Aspen Portfolio Strategy Fund (individually a “Fund” and collectively, the “Funds”). The Aspen Managed Futures Strategy Fund seeks investment results that replicate as closely as possible, before fees and expenses, the price and yield performance of the Aspen Managed Futures Beta Index (the “MFBI” or “Index”). The Aspen Portfolio Strategy Fund seeks long‐term capital appreciation. The Funds offer Class A and Class I shares. The Aspen Portfolio Strategy Fund commenced operations on December 29, 2016.
Basis of Consolidation
Aspen Futures Fund, Ltd. (the “Aspen Fund Subsidiary”), a Cayman Islands exempted company, is a wholly owned subsidiary of the Aspen Managed Futures Strategy Fund and Aspen Portfolio Strategy Fund, Ltd. (the “Aspen Portfolio Subsidiary”), a Cayman Islands exempted company, is a wholly owned subsidiary of the Aspen Portfolio Strategy Fund. The investment objective of both the Aspen Fund Subsidiary and the Aspen Portfolio Subsidiary (collectively the “Subsidiaries”) is designed to enhance the ability of the Funds to obtain exposure to equities, financial, currency and commodities markets consistent with the limits of the U.S. federal tax law requirements applicable to registered investment companies. The Subsidiaries are subject to substantially the same investment policies and investment restrictions as the Funds. The Subsidiaries act as an investment vehicle for the Funds in order to effect certain commodity‐related investments on behalf of the Funds. Investments in the Subsidiaries are expected to provide the Funds with exposure to the commodity markets within the limitations of Subchapter M of the Internal Revenue Code of 1986, as amended (the “Code”), and recent IRS revenue rulings, as discussed below under “Federal Income Taxes”. The Funds are the sole shareholder of the Subsidiaries pursuant to a subscription agreement dated as of August 2, 2011 for the Aspen Fund Subsidiary and December 16, 2016 for the Aspen Portfolio Subsidiary and it is intended that each Fund will remain the sole shareholder and will continue to control the Subsidiaries. Under the Articles of Association of the Subsidiaries, shares issued by the Subsidiaries confers upon a shareholder the right to wholly own and vote at general meetings of the Subsidiaries and certain rights in connection with any winding‐up or repayment of capital, as well as the right to participate in the profits or assets of the Subsidiaries. Each Fund may invest up to 25% of their total assets in shares of the Subsidiaries. All investments held by the Subsidiaries are disclosed in the accounts of each Fund. As a wholly owned subsidiary of the Funds, all assets and liabilities, income and expenses of the Subsidiaries are consolidated in the financial statements and financial highlights of the Funds. All investments held by the Subsidiaries are disclosed in the accounts of the Funds. As of April 30, 2017, net assets of the Aspen Managed Futures Strategy Fund were $201,408,157, of which net assets of $18,008,440 or 8.94%, represented the Fund’s ownership of all issued shares and voting rights of the Aspen Fund Subsidiary. As of April 30, 2017, net assets of the Aspen Portfolio Strategy Fund were $43,318,323, of which $993,988 or 2.29%, represented the Fund's ownership of all issued shares and voting rights of the Aspen Portfolio Subsidiary.
2. SIGNIFICANT ACCOUNTING POLICIES
The accompanying financial statements were prepared in accordance with accounting principles generally accepted in the United States of America (“U.S. GAAP”). The preparation of financial statements in conformity with U.S. GAAP requires management to make certain estimates and assumptions that affect the reported amounts of assets and liabilities and disclosures of contingent assets and liabilities at the date of the financial statements and the reported amounts of revenue and expenses during the period. Actual results could differ from those estimates. The Funds are considered an investment company for financial reporting purposes under U.S. GAAP. The following is a summary of significant accounting policies consistently followed by the Funds and Subsidiaries in preparation of the financial statements.
Investment Valuation: The Funds generally value their securities based on market prices determined at the close of regular trading on the New York Stock Exchange (“NYSE”), normally 4:00 p.m. Eastern Time, on each day the NYSE is open for trading.
For equity securities and mutual funds that are traded on an exchange, the market price is usually the closing sale or official closing price on that exchange. In the case of equity securities not traded on an exchange, or if such closing prices are not otherwise available, the securities are valued at the mean of the most recent bid and ask prices on such day. Redeemable securities issued by open‐end registered investment companies are valued at the investment company’s applicable net asset value, with the exception of exchange‐traded open‐end investment companies, which are priced as equity securities.
The market price for debt obligations is generally the price supplied by an independent third‐party pricing service approved by the Board of Trustees (the “Board”), which may use a matrix, formula or other objective method that takes into consideration quotations from dealers, market transactions in comparable investments, market indices and yield curves. If vendors are unable to supply a price, or if the price supplied is deemed to be unreliable, the market price may be determined using quotations received from one or more brokers–dealers that make a market in the security.
| Annual Report | April 30, 2017 | 23 |
| Aspen Funds | Notes to Consolidated Financial Statements |
Futures contracts that are listed or traded on a national securities exchange, commodities exchange, contract market or comparable over‐the‐counter market, and that are freely transferable, are valued at their closing settlement price on the exchange on which they are primarily traded or based upon the current settlement price for a like instrument acquired on the day on which the instrument is being valued. A settlement price may not be used if the market makes a limit move with respect to a particular commodity.
Forward currency exchange contracts have a fair value determined by the prevailing foreign currency exchange daily rates and current foreign currency exchange forward rates. The foreign currency exchange forward rates are calculated using an automated system that estimates rates on the basis of the current day foreign currency exchange rates and forward foreign currency exchange rates supplied by a pricing service.
Investment securities that are primarily traded on foreign securities exchanges are valued at the preceding closing values of such securities on their respective exchanges, except when an occurrence subsequent to the time a value was so established is likely to have changed such value. In such an event, the fair value of those securities are determined in good faith through consideration of other factors in accordance with procedures established by and under the general supervision of the Board.
When such prices or quotations are not available, or when Aspen Partners, Ltd. (the “Adviser”) believes that they are unreliable, securities may be priced using fair value procedures approved by the Board.
Fair Value Measurements: The Funds disclose the classification of their fair value measurements following a three‐tier hierarchy based on the inputs used to measure fair value. Inputs refer broadly to the assumptions that market participants would use in pricing the asset or liability, including assumptions about risk. Inputs may be observable or unobservable. Observable inputs reflect the assumptions market participants would use in pricing the asset or liability that are developed based on market data obtained from sources independent of the reporting entity. Unobservable inputs reflect the reporting entity’s own assumptions about the assumptions market participants would use in pricing the asset or liability that are developed based on the best information available.
Various inputs are used in determining the value of each of the Funds’ investments as of the end of the reporting period. When inputs used fall into different levels of the fair value hierarchy, the level in the hierarchy within which the fair value measurement falls is determined based on the lowest level input that is significant to the fair value measurement in their entirety. The designated input levels are not necessarily an indication of the risk or liquidity associated with these investments. These inputs are categorized in the following hierarchy under applicable financial accounting standards:
| Level 1 | – | Unadjusted quoted prices in active markets for identical investments, unrestricted assets or liabilities that the Funds have the ability to access at the measurement date; |
| | | |
| Level 2 | – | Quoted prices which are not active, quoted prices for similar assets or liabilities in active markets or inputs other than quoted prices that are observable (either directly or indirectly) for substantially the full term of the asset or liability; and |
| | | |
| Level 3 | – | Significant unobservable prices or inputs (including the Funds’ own assumptions in determining the fair value of investments) where there is little or no market activity for the asset or liability at the measurement date. |
24| Aspen Funds | Notes to Consolidated Financial Statements |
The following is a summary of each input used to value the Funds as of April 30, 2017:
Aspen Managed Futures Strategy Fund
| Investments in Securities at Value | | Level 1 - Quoted Prices | | | Level 2 - Other Significant Observable Inputs | | | Level 3 - Significant Unobservable Inputs | | | Total | |
| Government Bonds | | $ | – | | | $ | 54,570,874 | | | $ | – | | | $ | 54,570,874 | |
| Short Term Investments | | | | | | | | | | | | | | | | |
| Money Market Fund | | | 2,835,019 | | | | – | | | | – | | | | 2,835,019 | |
| U.S. Treasury Bills | | | – | | | | 123,423,867 | | | | – | | | | 123,423,867 | |
| TOTAL | | $ | 2,835,019 | | | $ | 177,994,741 | | | $ | – | | | $ | 180,829,760 | |
| Other Financial Instruments | | | | | | | | | | | | | | | | |
| Assets: | | | | | | | | | | | | | | | | |
| Futures Contracts | | | | | | | | | | | | | | | | |
| Commodity Contracts | | $ | 37,963 | | | $ | – | | | $ | – | | | $ | 37,963 | |
| Equity Contracts | | | 593,070 | | | | – | | | | – | | | | 593,070 | |
| Foreign Currency Contracts | | | 468,400 | | | | – | | | | – | | | | 468,400 | |
| Interest Rate Contracts | | | 41,634 | | | | – | | | | – | | | | 41,634 | |
| Liabilities: | | | | | | | | | | | | | | | | |
| Futures Contracts | | | | | | | | | | | | | | | | |
| Commodity Contracts | | | (541,009 | ) | | | – | | | | – | | | | (541,009 | ) |
| Equity Contracts | | | (289,930 | ) | | | – | | | | – | | | | (289,930 | ) |
| Foreign Currency Contracts | | | (2,740,023 | ) | | | – | | | | – | | | | (2,740,023 | ) |
| Interest Rate Contracts | | | (85,737 | ) | | | – | | | | – | | | | (85,737 | ) |
| TOTAL | | $ | (2,515,632 | ) | | $ | – | | | $ | – | | | $ | (2,515,632 | ) |
Aspen Portfolio Strategy Fund
| Investments in Securities at Value | | Level 1 - Quoted Prices | | | Level 2 - Other Significant Observable Inputs | | | Level 3 - Significant Unobservable Inputs | | | Total | |
| Exchange Traded Funds | | $ | 33,755,794 | | | $ | – | | | $ | – | | | $ | 33,755,794 | |
| Short Term Investments | | | 6,199,164 | | | | – | | | | – | | | | 6,199,164 | |
| TOTAL | | $ | 39,954,958 | | | $ | – | | | $ | – | | | $ | 39,954,958 | |
| Other Financial Instruments | | | | | | | | | | | | | | | | |
| Assets: | | | | | | | | | | | | | | | | |
| Futures Contracts | | | | | | | | | | | | | | | | |
| Commodity Contracts | | $ | 33,347 | | | $ | – | | | $ | – | | | $ | 33,347 | |
| Equity Contracts | | | 127,555 | | | | – | | | | – | | | | 127,555 | |
| Foreign Currency Contracts | | | 138,036 | | | | – | | | | – | | | | 138,036 | |
| Interest Rate Contracts | | | 13,899 | | | | – | | | | – | | | | 13,899 | |
| Liabilities: | | | | | | | | | | | | | | | | |
| Futures Contracts | | | | | | | | | | | | | | | | |
| Commodity Contracts | | | (118,987 | ) | | | – | | | | – | | | | (118,987 | ) |
| Equity Contracts | | | (68,306 | ) | | | – | | | | – | | | | (68,306 | ) |
| Foreign Currency Contracts | | | (82,743 | ) | | | – | | | | – | | | | (82,743 | ) |
| Interest Rate Contracts | | | (24,026 | ) | | | – | | | | – | | | | (24,026 | ) |
| TOTAL | | $ | 18,775 | | | $ | – | | | $ | – | | | $ | 18,775 | |
The Funds recognize transfers between levels as of the end of the period. For the year or period ended April 30, 2017, the Funds did not have any transfers between Level 1 and Level 2 securities. For the year or period ended April 30, 2017, the Funds did not have any securities that used significant unobservable inputs (Level 3) in determining fair value.
Investment Transactions and Investment Income: Investment transactions are accounted for on the date the investments are purchased or sold (trade date). Realized gains and losses from investment transactions are reported on an identified cost basis, which is the same basis the Funds use for federal income tax purposes. Interest income, which includes accretion of discounts, is accrued and recorded as earned. Dividend income is recognized on the ex‐dividend date or for certain foreign securities, as soon as information is available to the Funds. All of the realized and unrealized gains and losses and net investment income, are allocated daily to each class in proportion to their average daily net assets.
| Annual Report | April 30, 2017 | 25 |
| Aspen Funds | Notes to Consolidated Financial Statements |
Foreign Securities: The Funds may directly purchase securities of foreign issuers. Investing in securities of foreign issuers involves special risks not typically associated with investing in securities of U.S. issuers. The risks include possible reevaluation of currencies, the inability to repatriate foreign currency, less complete financial information about companies and possible future adverse political and economic developments. Moreover, securities of many foreign issuers and their markets may be less liquid and their prices more volatile than those of securities of comparable U.S. issuers.
Foreign Currency Translation: The books and records of the Funds are maintained in U.S. dollars. Investment valuations and other assets and liabilities initially expressed in foreign currencies are converted each business day into U.S. dollars based upon current exchange rates. Prevailing foreign exchange rates may generally be obtained at the close of the NYSE (normally, 4:00 p.m. Eastern Time). The portion of realized and unrealized gains or losses on investments due to fluctuations in foreign currency exchange rates is not separately disclosed and is included in realized and unrealized gains or losses on investments, when applicable.
Foreign Currency Spot Contracts: The Funds may enter into foreign currency spot contracts to facilitate transactions in foreign securities or to convert foreign currency receipts into U.S. dollars. A foreign currency spot contract is an agreement between two parties to buy and sell currencies at the current market rate, for settlement generally within two business days. The U.S. dollar value of the contracts is determined using current currency exchange rates supplied by a pricing service. The contract is marked‐to‐market daily for settlements beyond one day and any change in market value is recorded as an unrealized gain or loss. When the contract is closed, the Funds record a realized gain or loss equal to the difference between the value on the open and close date. Losses may arise from changes in the value of the foreign currency, or if the counterparties do not perform under the contract’s terms. The maximum potential loss from such contracts is the aggregate face value in U.S. dollars at the time the contract was opened.
Trust Expenses: Some expenses of the Trust can be directly attributed to each of the Funds. Expenses which cannot be directly attributed to the Funds are apportioned among all funds in the Trust based on average net assets of each fund.
Fund and Class Expenses: Expenses that are specific to a class of shares of the Funds, including distribution fees (Rule 12b‐1 fees) and shareholder servicing fees, are charged directly to that share class. All expenses of the Funds, other than class specific expenses, are allocated daily to each class in proportion to their average daily net assets.
Offering Costs: Offering costs, including costs of printing initial prospectuses, legal and registration fees, are being amortized over twelve months from the inception date of the Aspen Portfolio Strategy Fund. Amounts amortized during the period ended April 30, 2017 for the Aspen Portfolio Strategy Fund are shown on the Statements of Operations. As of April 30, 2017, $48,385, of offering costs remain to be amortized for the Aspen Portfolio Strategy Fund.
Federal Income Taxes: The Funds comply with the requirements under Subchapter M of the Internal Revenue Code of 1986, as amended, applicable to regulated investment companies and intends to distribute substantially all of their net taxable income and net capital gains, if any, each year so that it will not be subject to excise tax on distributed income and gains. The Funds are not subject to income taxes to the extent such distributions are made.
As of and during the year or period ended April 30, 2017, the Funds did not have a liability for any unrecognized tax benefits. The Funds file U.S. federal, state, and local tax returns as required. The Funds’ tax returns are subject to examination by the relevant tax authorities until expiration of the applicable statute of limitations, which is generally three years after the filing of the tax return for federal purposes and four years for most state returns. Tax returns for open years have incorporated no uncertain tax positions that require a provision for income taxes.
Distributions to Shareholders: The Funds normally pay dividends and distributes capital gains, if any, on an annual basis. Income dividend distributions are derived from interest and other income the Funds receive from their investments, including short term capital gains. Long term capital gains distributions are derived from gains realized when the Funds sell a security it has owned for more than a year. The Funds may make additional distributions and dividends at other times if the portfolio manager believes doing so may be necessary for the Funds to avoid or reduce taxes.
3. DERIVATIVE INSTRUMENTS
The Funds use derivatives (including futures) to pursue their investment objective. The Funds’ use of derivative instruments involves risks different from, or possibly greater than, the risks associated with investing directly in securities and other traditional investments. These risks may include (i) the risk that the counterparty to a derivative transaction may not fulfill their contractual obligations, (ii) risk of mispricing or improper valuation, and (iii) the risk that changes in the value of the derivative may not correlate perfectly with the underlying asset, rate or index. These risks could cause the Funds to lose more than the principal amount invested. In addition, investments in derivatives involve leverage, which means a small percentage of assets invested in derivatives can have a disproportionately large impact on the Funds.
26
| Aspen Funds | Notes to Consolidated Financial Statements |
The Funds’ use of derivatives can result in losses due to unanticipated changes in the market risk factors and the overall market. In instances where the Funds are using derivatives to decrease, or hedge, exposures to market risk factors for securities held by the Funds, there are also risks that those derivatives may not perform as expected resulting in losses for the combined or hedged positions. Derivatives may have little or no initial cash investment relative to their market value exposure and therefore can produce significant gains or losses in excess of their cost. This use of embedded leverage allows the Funds to increase their market value exposure relative to their net assets and can substantially increase the volatility of the Funds’ performance.
In addition, use of derivatives may increase or decrease exposure to the following risk factors:
| • | Equity Risk: Equity risk relates to the change in value of equity securities as they relate to increases or decreases in the general market. |
| • | Interest Rate Risk: When the Funds invest in fixed‐income securities or derivatives, the value of an investment in the Funds will fluctuate with changes in interest rates. Typically, a rise in interest rates causes a decline in the value of fixed‐income securities or derivatives owned by the Funds. In general, the market price of debt securities with longer maturities will increase or decrease more in response to changes in interest rates than shorter‐term securities. Other risk factors include credit risk (the debtor may default) and prepayment risk (the debtor may pay their obligation early, reducing the amount of interest payments). |
| • | Foreign Currency Risk: Currency trading involves significant risks, including market risk, interest rate risk, country risk, counterparty credit risk and short sale risk. Market risk results from the price movement of foreign currency values in response to shifting market supply and demand. Interest rate risk arises whenever a country changes its stated interest rate target associated with its currency. Country risk arises because virtually every country may interfer with international transactions in its currency. Counterparty credit risk arises when the counterparty will not fulfill its obligations to the Funds. Short sale risk arises from the sale of a security that is not owned, or any sale that is completed by the delivery of a security borrowed. |
| • | Commodity Risk: Exposure to the commodities markets may subject the Funds to greater volatility than investments in traditional securities. Commodity prices are influenced by unfavorable weather, animal and plant disease, geologic and environmental factors, as well as changes in government regulation such as tariffs, embargoes or burdensome production rules and restrictions. |
Futures: The Funds and the Subsidiaries may enter into futures contracts. Futures contracts are agreements between two parties to buy and sell a particular commodity, instrument or index for a specified price on a specified future date. When the Funds or the Subsidiaries enter into a futures contract, it is required to deposit with (or for the benefit of) their broker an amount of cash or short‐term high‐quality securities as “initial margin”. The margin requirements are set by the exchange on which the contract is traded and may be modified during the term of the contract. The initial margin is in the nature of a performance bond or good faith deposit on the futures contract that is returned to the Funds upon termination of the contract, assuming all contractual obligations have been satisfied. As the value of the contract changes, the value of the futures contract position increases or declines. Subsequent payments, known as “variation margin”, are made or received by the Funds or the Subsidiaries each day, depending on the price fluctuations in the fair value of the contract and the value of cash or securities on deposit with the broker. Such payments or receipts are recorded for financial statement purposes as unrealized gains or losses by the Funds. Variation margin does not represent a borrowing or loan by the Funds but is instead a settlement between the Funds and the broker of the amount one would owe the other if the futures contract expired. When the contract is closed, the Funds record a realized gain or loss equal to the difference between the value of the contract at the time it was opened and the value at the time it was closed. When the Funds or the Subsidiaries enter into a futures contract certain risks may arise, such as illiquidity in the futures market, which may limit the Funds’ or the Subsidiaries’ ability to close out a futures contract prior to settlement date, and unanticipated movements in the value of securities, commodities or interest rates. Futures contracts are exchange‐traded. Exchange‐traded futures are standardized contracts and are settled through a clearing house with fulfillment supported by the credit of the exchange. Therefore, counterparty credit risk to the Funds and the Subsidiaries are reduced. With exchange traded futures, there is minimal counterparty credit risk to the Funds since futures are exchange traded and the exchange’s clearinghouse, as a counterparty to all exchange traded futures, guarantees the futures against default.
| Annual Report | April 30, 2017 | 27 |
| Aspen Funds | Notes to Consolidated
Financial Statements |
April 30, 2017
Consolidated Statement of Assets and Liabilities – Fair Value of Derivative Instruments as of April 30, 2017:
| Risk Exposure | Asset Derivatives Statement of Assets and Liabilities Location | | Fair Value | | Liabilities Derivatives Statement of Assets and Liabilities Location | | Fair Value | |
| Aspen Managed Futures Strategy Fund | | | | | | | | |
| Futures Contracts | Unrealized appreciation on futures contracts(a) | | $ | 1,147,067 | | Unrealized depreciation on futures contracts(a) | | $ | 3,656,699 | |
| | | | $ | 1,147,067 | | | | $ | 3,656,699 | |
| | | | | | | | | | | |
| | Risk Exposure to Fund | | | | | | | | | |
| | Commodity Contracts | | $ | 37,963 | | | | $ | 541,009 | |
| | Equity Contracts | | | 593,070 | | | | | 289,930 | |
| | Foreign Currency Contracts | | | 468,400 | | | | | 2,740,023 | |
| | Interest Rate Contracts | | | 41,634 | | | | | 85,737 | |
| | | | $ | 1,147,067 | | | | $ | 3,656,699 | |
| Aspen Portfolio Strategy Fund | | | | | | | | | | |
| Futures Contracts | Unrealized appreciation on futures contracts(a) | | $ | 312,837 | | Unrealized depreciation on futures contracts(a) | | $ | 294,062 | |
| | | | $ | 312,837 | | | | $ | 294,062 | |
| | | | | | | | | | | |
| | Risk Exposure to Fund | | | | | | | | | |
| | Commodity Contracts | | $ | 33,347 | | | | $ | 118,987 | |
| | Equity Contracts | | | 127,555 | | | | | 68,306 | |
| | Foreign Currency Contracts | | | 138,036 | | | | | 82,743 | |
| | Interest Rate Contracts | | | 13,899 | | | | | 24,026 | |
| | | | $ | 312,837 | | | | $ | 294,062 | |
(a) | Represents cumulative appreciation/(depreciation) of futures contracts as reported in the Consolidated Schedule of Investments. Only the current day’s net variation margin is reported within the Consolidated Statement of Assets and Liabilities. |
28| Aspen Funds | Notes to Consolidated
Financial Statements |
April 30, 2017
Consolidated Statements of Operations – The effect of Derivative Instruments for the year or period ended April 30, 2017:
| Derivatives Instruments | Location of Gain/(Loss) on Derivatives Statement of Operations | | Realized Gain/(Loss) on Derivatives Statement of Operations | | | Change in Unrealized Appreciation/ (Depreciation) on Derivatives Statement of Operations | |
| Aspen Managed Futures Strategy Fund | | | | | | |
| Futures Contracts | Net realized loss on futures contracts/Net change in unrealized appreciation/(depreciation) on futures contracts | | $ | (7,954,165 | ) | | $ | (7,635,549 | ) |
| | | | $ | (7,984,165 | ) | | $ | (7,635,549 | ) |
| | | | | | | | | | |
| | Risk Exposure to Fund | | | | | | | | |
| | Commodity Contracts | | $ | (3,631,950 | ) | | $ | (2,014,909 | ) |
| | Equity Contracts | | | 105,920 | | | | 916,927 | |
| | Foreign Currency Contracts | | | (4,009,862 | ) | | | (7,050,595 | ) |
| | Interest Rate Contracts | | | (448,273 | ) | | | 513,028 | |
| | | | $ | (7,984,165 | ) | | $ | (7,635,549 | ) |
| Aspen Portfolio Strategy Fund | | | | | | | | | |
| Futures Contracts | Net realized loss on futures contracts/Net change in unrealized appreciation/(depreciation) on futures contracts | | $ | (1,515,500 | ) | | $ | 18,775 | |
| | | | $ | (1,515,500 | ) | | $ | 18,775 | |
| | | | | | | | | | |
| | Risk Exposure to Fund | | | | | | | | |
| | Commodity Contracts | | $ | (637,307 | ) | | $ | (85,640 | ) |
| | Equity Contracts | | | 464,552 | | | | 59,249 | |
| | Foreign Currency Contracts | | | (940,317 | ) | | | 55,293 | |
| | Interest Rate Contracts | | | (402,428 | ) | | | (10,127 | ) |
| | | | $ | (1,515,500 | ) | | | 18,775 | |
The average number of net futures contracts held by the Aspen Managed Futures Strategy Fund and the Aspen Portfolio Strategy Fund during the period was 1,197 and 207, respectively.
4. TAX BASIS INFORMATION
Reclassifications: Reclassifications to paid‐in capital relate primarily to differing book/tax treatment of foreign currency transactions and income from a controlled foreign corporation. For the year ended April 30, 2017, the following reclassifications, which had no impact on results of operations or net assets, were recorded to reflect tax character:
| Fund | | Paid-in Capital | | | Accumulated Net Investment Income/(Loss) | | | Accumulated Net Realized Gain/(Loss) | |
| Aspen Managed Futures Strategy Fund | | $ | (4,652,228 | ) | | $ | 1,337,198 | | | $ | 3,315,030 | |
| Aspen Portfolio Strategy Fund | | | (701,673 | ) | | | 65,421 | | | | 636,252 | |
Included in those amounts reclassified was a net operating loss offset to Paid‐in capital for the Aspen Managed Futures Strategy Fund in the amount of $1,029,481.
| Annual Report | April 30, 2017 | 29 |
| Aspen Funds | Notes to Consolidated
Financial Statements |
April 30, 2017
Tax Basis of Investments: As of April 30, 2017, the aggregate cost of investments, gross unrealized appreciation/(depreciation) and net unrealized depreciation for Federal tax purposes was as follows:
| | | Cost of Investments | | | Gross Appreciation (excess of value over tax cost) | | | Gross Depreciation (excess of tax cost over value) | | | Net Appreciation on Futures Contracts and Foreign Currencies | | | Net Appreciation on Investments | |
| Aspen Managed Futures Strategy Fund | | $ | 180,977,433 | | | $ | 6 | | | $ | (147,679 | ) | | $ | (2,450,374 | ) | | $ | (2,598,047 | ) |
| Aspen Portfolio Strategy Fund | | | 39,330,634 | | | | 624,324 | | | | – | | | | 21,184 | | | | 645,508 | |
Components of Distributable Earnings: At April 30, 2017, components of distributable earnings were on a tax basis as follows:
| | | Aspen Managed Futures Strategy Fund | | | Aspen Portfolio Strategy Fund | |
| Undistributed ordinary income | | $ | – | | | $ | 62,516 | |
| Accumulated net capital losses | | | (27,044,929 | ) | | | (773,285 | ) |
| Net unrealized appreciation/(depreciation) | | | (2,598,047 | ) | | | 645,508 | |
| Other cumulative effect of timing differences | | | 1,416,543 | | | | (105,001 | ) |
| Total distributable earnings | | $ | (28,226,433 | ) | | $ | (170,262 | ) |
Capital Losses: As of April 30, 2017, the Funds have available for Federal income tax purposes unused capital losses that may be used to offset future realized capital gains. The Aspen Managed Futures Strategy Fund had $9,065,416 in short‐term losses and $13,586,861 in long‐term losses that will be carried forward indefinitely to offset future realized gains.
The Aspen Managed Futures Strategy Fund and the Aspen Portfolio Strategy Fund elect to defer $4,392,652 and $773,285, respectively, to the period ending April 30, 2018, capital losses recognized during the period November 1, 2016 to April 30, 2017.
Ordinary Losses: As of April 30, 2017, Aspen Managed Futures Strategy Fund elected to defer to the period ending April 30, 2018, late year ordinary losses in the amount of $592,781.
Tax Basis of Distributions to Shareholders: Distributions are determined in accordance with federal income tax regulations, which differ from GAAP, and, therefore, may differ significantly in amount or character from net investment income and realized gains for financial reporting purposes. Financial reporting records are adjusted for permanent book/tax differences to reflect tax character but are not adjusted for temporary differences.
The tax character of distributions paid during the year ending April 30, 2017 were as follows:
| | | Ordinary Income | | | Long-Term Capital Gain | |
| Aspen Managed Futures Strategy Fund | | $ | 2,217,954 | | | $ | – | |
| Aspen Portfolio Strategy Fund | | | – | | | | – | |
The tax character of distributions paid during the year ending April 30, 2016 were as follows:
| | | Ordinary Income | | | Long-Term Capital Gain | |
| Aspen Managed Futures Strategy Fund | | $ | 13,114,807 | | | $ | 8,439,863 | |
| Aspen Portfolio Strategy Fund | | | – | | | | – | |
5. SHARES OF BENEFICIAL INTEREST
The capitalization of the Trust consists of an unlimited number of shares of beneficial interest with no par value per share. Holders of the shares of each of the Funds of the Trust have one vote for each share held and a proportionate fraction of a vote for each fractional share. All shares issued and outstanding are fully paid and are transferable and redeemable at the option of the shareholder. Purchasers of the shares do not have any obligation to make payments to the Trust or its creditors solely by reason of the purchasers’ ownership of the shares. Shares have no pre‐emptive rights.
30| Aspen Funds | Notes to Consolidated
Financial Statements |
April 30, 2017
Fund shares redeemed within 30 days of purchase may incur a 2% short‐term redemption fee deducted from the redemption amount. The amount of redemption fees received during the period are presented in the Consolidated Statement of Changes in Net Assets.
6. MANAGEMENT AND RELATED‐PARTY TRANSACTIONS
The Adviser, subject to the authority of the Board, is responsible for the overall management and administration of the Funds’ business affairs. The Adviser manages the investments of the Funds in accordance with the Funds’ investment objective, policies and limitations and investment guidelines established jointly by the Adviser and the Board. Pursuant to each Fund’s Investment Advisory Agreement, (the “Advisory Agreement”), the Aspen Managed Futures Strategy Fund will pay the Adviser an annual management fee of 0.75%, based on the Fund’s average daily net asset. The Aspen Portfolio Strategy Fund will pay the Adviser an annual management fee of 1.00%, based on the Fund’s average daily net assets. The management fee is paid on a monthly basis.
The Subsidiaries have each entered into a separate advisory agreement (collectively, the “Subsidiary Advisory Agreement”) with the Adviser for the management of each Subsidiary’s portfolio pursuant to which the Subsidiaries are obligated to pay the Adviser a management fee at the same rate that the Funds pay the Adviser for investment advisory services provided to the Funds. The Adviser has agreed to waive the advisory fee it receives from the Funds in an amount equal to the management fee paid by the Subsidiaries. This agreement may be terminated based on the terms of the Advisory Agreement. For the period or year ended April 30, 2017, this amount equaled $169,945 and $2,784 for Aspen Managed Futures Strategy Fund and the Aspen Portfolio Strategy Fund, respectively, and are disclosed in the Consolidated Statements of Operations. These waivers are not subject to reimbursement/recoupment.
The Adviser has contractually agreed to limit the Funds’ total annual fund operating expenses (exclusive of distribution and service (12b‐1) fees, shareholder services fees, acquired fund fees and expenses, brokerage expenses, interest expense, taxes and extraordinary expenses) to 1.55% of each of the Funds’ average daily net assets for each of Class A and Class I Shares. This agreement (the “Expense Agreement”) is in effect from September 1, 2016 through August 31, 2017 for the Aspen Managed Futures Strategy Fund. The prior Expense Agreement for the Aspen Managed Futures Strategy Fund was in effect from April 1, 2013 through August 31, 2016. The Expense Agreement for the Aspen Portfolio Strategy Fund is in effect from December 14, 2016 through August 31, 2018. The Adviser will be permitted to recover, on a class‐by‐class basis, expenses it has borne through the Expense Agreement to the extent that the Funds’ expenses in later periods fall below the expense cap in effect at the time of waiver or reimbursement. Notwithstanding the foregoing, the Funds will not be obligated to pay any such fees and expenses more than three years after the date of the waiver or reimbursement. The Adviser may not discontinue or modify this waiver prior to August 31, 2017 without the approval by the Funds’ Board of Trustees.
As of April 30, 2017, the fee waivers/reimbursements and recoupments of past waived fees were as follows:
| Fund | | Fees Waived/Reimbursed By Advisor | | | Recoupment of Past Waived Fees By Advisor | | | Total | |
| Aspen Managed Futures Strategy Fund ‐ Class A | | $ | – | | | $ | – | | | $ | – | |
| Aspen Managed Futures Strategy Fund ‐ Class I | | | – | | | | – | | | | – | |
| Aspen Portfolio Strategy Fund ‐ Class A | | | (8,063 | ) | | | – | | | | (8,063 | ) |
| Aspen Portfolio Strategy Fund ‐ Class I | | | (61,839 | ) | | | – | | | | (61,839 | ) |
As of April 30, 2017, the balances of recoupable expenses for each Fund were as follows:
| Fund | | Expires 2018 | | | Expires 2019 | | | Expires 2020 | | | Total | |
| Aspen Managed Futures Strategy Fund | | | | | | | | | | | | |
| Class A | | $ | – | | | $ | – | | | $ | – | | | $ | – | |
| Class I | | | – | | | | – | | | | – | | | | – | |
| Aspen Portfolio Strategy Fund | | | | | | | | | | | | | | | | |
| Class A | | | – | | | | – | | | | 8,063 | | | | 8,063 | |
| Class I | | | – | | | | – | | | | 61,839 | | | | 61,839 | |
Fund Administrator Fees and Expenses
ALPS Fund Services, Inc. (“ALPS”) serves as administrator to the Funds and the Funds have agreed to pay expenses incurred in connection with its administrative activities. Pursuant to an Administration Agreement, ALPS provides operational services to the Fund including, but not limited to, fund accounting and fund administration and generally assist in the Funds’ operations. Officers of the Trust are employees of ALPS. The Funds’ administration fee is accrued on a daily basis and paid monthly. Administration fees paid by the Funds for the year or period ended April 30, 2017 are disclosed in the Consolidated Statements of Operations.
| Annual Report | April 30, 2017 | 31 |
| Aspen Funds | Notes to Consolidated
Financial Statements |
April 30, 2017
ALPS is reimbursed by the Funds for certain out‐of‐pocket expenses.
Transfer Agent
ALPS serves as transfer, dividend paying and shareholder servicing agent for the Funds. ALPS receives an annual minimum fee, a fee based upon the number of shareholder accounts, and is also reimbursed by the Funds for certain out‐of‐pocket expenses. Transfer agent fees paid by the Funds for the year or period ended April 30, 2017 are disclosed in the Consolidated Statements of Operations.
Compliance Services
ALPS provides services that assist the Trust’s chief compliance officer in monitoring and testing the policies and procedures of the Trust in conjunction with requirements under Rule 38a‐1 under the 1940 Act and receives an annual base fee. ALPS is reimbursed for certain out‐of‐pocket expenses by the Funds. Compliance service fees paid by the Funds for the year or period ended April 30, 2017 are disclosed in the Consolidated Statements of Operations.
Principal Financial Officer
ALPS receives an annual fee for providing principal financial officer services to the Funds. Principal financial officer fees paid by the Funds for the year or period ended April 30, 2017 are disclosed in the Consolidated Statements of Operations.
Distributor
ALPS Distributors, Inc. (“ADI” or the “Distributor”) (an affiliate of ALPS) acts as the distributor of the Funds’ shares pursuant to a Distribution Agreement with the Trust. Shares are sold on a continuous basis by ADI as agent for the Funds, and ADI has agreed to use its best efforts to solicit orders for the sale of the Funds’ shares, although it is not obliged to sell any particular amount of shares. ADI is not entitled to any compensation for its services as Distributor. ADI is registered as a broker‐dealer with the U.S. Securities and Exchange Commission.
The Funds have adopted a plan of distribution for Class A shares pursuant to Rule 12b‐1 under the 1940 Act (the “Plan”). The Plan allows the Funds to use Class A assets to pay fees in connection with the distribution and marketing of Class A shares and/or the provision of shareholder services to Class A shareholders. The Plan permits payment for services in connection with the administration of plans or programs that use Class A shares as their funding medium and for related expenses. The recipients of such payments may include the Distributor, other affiliates of the Adviser, broker‐dealers, financial institutions, plan sponsors and administrators and other financial intermediaries through which investors may purchase shares of the Funds. The Plan permits the Funds to use their Class A assets to make total payments at an annual rate of up to 0.25% of the Funds’ average daily net assets attributable to their Class A shares. The expenses of the plan are reflected as distribution and service fees in the Consolidated Statements of Operations.
The Funds have adopted a shareholder service plan (a “Shareholder Services Plan”) for Class A shares. Under the Shareholder Services Plan the Funds are authorized to compensate certain financial intermediaries, including broker‐dealers and the Funds’ affiliates, which may include the Distributor, Adviser and/or the transfer agent (“Participating Organizations”), an aggregate fee in an amount not to exceed on an annual basis 0.15% for Class A shares of the average daily net asset value of the Class A shares attributable to or held in the name of a Participating Organizations for its clients as compensation for providing shareholder service activities, which do not include distribution services, pursuant to an agreement with a Participating Organizations. Any amount of such payment not paid to the Participating Organizations during the Funds’ fiscal year for such service activities shall be reimbursed to the Funds. Shareholder Services Plan fees are included with distribution and service fees on the Consolidated Statements of Operations.
Certain intermediaries may charge networking, omnibus account or other administrative fees with respect to transactions in shares of the Funds. Transactions may be processed through the National Securities Clearing Corporation (“NSCC”) or similar systems or processed on a manual basis. These fees are paid by the Funds to the Distributor, which uses such fees to reimburse intermediaries. In the event an intermediary receiving payments from the Distributor on behalf of the Funds converts from a networking structure to an omnibus account structure or otherwise experiences increased costs, fees borne by the Funds may increase. Fees paid by the Funds for the year or period ended April 30, 2017 are disclosed in the Consolidated Statements of Operations as Delegated Transfer Agent Equivalent Services.
Index Licensing Services
The Funds have adopted an Index Licensing Agreement and the Adviser pursuant to which the Fund pays the Adviser a monthly annualized licensing fee of 0.25%, based on the Funds’ average daily net assets for the right to use the Index in connection with the Fund. Fees paid by the Funds for the year or period ended April 30, 2017 are disclosed in the Consolidated Statement of Operations as Licensing fees.
32| Aspen Funds | Notes to Consolidated
Financial Statements |
April 30, 2017
7. SECURITIES TRANSACTIONS
The cost of purchases and proceeds from sales of U.S. Government securities (excluding short‐term securities) during the year ended April 30, 2017 were as follows:
| Aspen Managed Futures Strategy Fund | | | |
| Cost of Investments Purchased | | $ | 35,615,345 | |
| Proceeds from Investments Sold | | $ | 161,769,325 | |
| Aspen Portfolio Strategy Fund | | | | |
| Cost of Investments Purchased | | $ | 33,007,093 | |
| Proceeds from Investments Sold | | $ | 20,234 | |
8. INDEMNIFICATIONS
Under the Trust’s organizational documents, its officers and Trustees are indemnified against certain liability arising out of the performance of their duties to the Trust. Additionally, in the normal course of business, the Trust enters into contracts with service providers that may contain general indemnification clauses, which may permit indemnification to the extent permissible under applicable law. The Trust’s maximum exposure under these arrangements is unknown, as this would involve future claims that may be made against the Trust that have not yet occurred.
9. RECENT ACCOUNTING PRONOUNCEMENT
On October 13, 2016, the SEC amended Regulation S‐X, which will require standardized, enhanced disclosure about derivatives in investment company financial statements, as well as other amendments. The compliance date for the amendments to Regulation S‐X is August 1, 2017. Management is currently evaluating the impact to the financial statements and disclosures.
| Annual Report | April 30, 2017 | 33 |
| Aspen Managed Futures Strategy Fund | Report of Independent Registered
Public Accounting Firm |
To the Shareholders and Board of Trustees of Financial Investors Trust:
We have audited the accompanying consolidated statements of assets & liabilities, including the consolidated schedules of investments, of Aspen Managed Futures Strategy Fund and subsidiary and Aspen Portfolio Strategy Fund and subsidiary (the “Funds”), two of the portfolios constituting Financial Investors Trust, as of April 30, 2017, and as to Aspen Managed Futures Strategy Fund, the related consolidated statement of operations for the year then ended, the consolidated statements of changes in net assets for each of the two years in the period then ended, and the consolidated financial highlights for each of the five years in the period then ended, and as to Aspen Portfolio Strategy Fund and subsidiary, the related consolidated statements of operations and changes in net assets and the consolidated financial highlights for the period December 29, 2016 (commencement of operations) to April 30, 2017. These financial statements and financial highlights are the responsibility of the Funds’ management. Our responsibility is to express an opinion on these financial statements and financial highlights based on our audits.
We conducted our audits in accordance with the standards of the Public Company Accounting Oversight Board (United States). Those standards require that we plan and perform the audit to obtain reasonable assurance about whether the financial statements and financial highlights are free of material misstatement. The Funds are not required to have, nor were we engaged to perform, an audit of their internal control over financial reporting. Our audits included consideration of internal control over financial reporting as a basis for designing audit procedures that are appropriate in the circumstances, but not for the purpose of expressing an opinion on the effectiveness of the Funds’ internal control over financial reporting. Accordingly, we express no such opinion. An audit also includes examining, on a test basis, evidence supporting the amounts and disclosures in the financial statements, assessing the accounting principles used and significant estimates made by management, as well as evaluating the overall financial statement presentation. Our procedures included confirmation of securities owned as of April 30, 2017, by correspondence with the custodian and broker; when replies were not received from brokers, we performed other auditing procedures. We believe that our audits provide a reasonable basis for our opinion.
In our opinion, the consolidated financial statements and financial highlights referred to above present fairly, in all material respects, the financial position of Aspen Managed Futures Strategy Fund and subsidiary and Aspen Portfolio Strategy Fund and subsidiary of Financial Investors Trust as of April 30, 2017, and as to Aspen Managed Futures Strategy Fund, the results of its operations for the year then ended, the changes in its net assets for each of the two years in the period then ended, and the financial highlights for each of the five years in the period then ended, and as to Aspen Portfolio Strategy Fund and subsidiary, the results of its operations, changes in its net assets, and the financial highlights for the period December 29, 2016 (commencement of operations) to April 30, 2017, in conformity with accounting principles generally accepted in the United States of America.
DELOITTE & TOUCHE LLP
Denver, Colorado
June 27, 2017
34| Aspen Funds | Disclosure Regarding Approval of Fund Advisory Agreement |
April 30, 2017 (Unaudited)
ASPEN MANAGED FUTURES STRATEGY FUND
On March 14, 2017, the Trustees met in person to discuss, among other things, the approval of the investment advisory agreement between the Trust and the Adviser (the “Investment Advisory Agreement”), in accordance with Section 15(c) of the 1940 Act. In renewing and approving the Investment Advisory Agreement, the Trustees, including the Independent Trustees, considered the following factors with respect to the Fund:
Investment Advisory Fee Rate: The Trustees reviewed and considered the contractual annual advisory fee paid by the Trust, on behalf of the Fund, to the Adviser, of 0.75% of the Fund’s daily net assets, in light of the extent and quality of the advisory services provided by the Adviser to the Fund.
The Board received and considered information including a comparison of the Fund’s contractual and actual advisory fees and overall expenses with those of funds in the peer groups and universes of funds provided by an independent provider of investment company data (the “Data Provider”) and also considered the Adviser’s statements that the expense structure of the Fund had not changed significantly relative to its peers. The Trustees noted that the contractual advisory fee rate for the Fund was below each of the funds in the Data Provider peer group.
Total Expense Ratios: The Trustees further reviewed and considered the total expense ratio (after waivers) of 1.56% for the Fund’s Class A Shares and 1.22% for the Fund’s Class I Shares. The Trustees noted that the Fund’s total expense ratio (after waivers) for its Class A shares and for its Class I shares was below the Data Provider peer group median total expense ratio (after waivers).
Nature, Extent, and Quality of the Services under the Investment Advisory Agreement: The Trustees received and considered information regarding the nature, extent, and quality of services provided to the Fund under the Investment Advisory Agreement. The Trustees reviewed certain background materials supplied by the Adviser in its presentation, including its Form ADV.
The Trustees reviewed and considered the Adviser’s investment advisory personnel, its history as an asset manager, and its performance and the amount of assets currently under management by the Adviser and its affiliated entities. The Trustees also reviewed the research and decision‐making processes utilized by the Adviser, including the methods adopted to seek to achieve compliance with the investment objectives, policies, and restrictions of the Fund.
The Trustees considered the background and experience of the Adviser’s management in connection with the Fund, including reviewing the qualifications, backgrounds, and responsibilities of the management team primarily responsible for the day‐to‐day portfolio management of the Fund and the extent of the resources devoted to research and analysis of actual and potential investments.
The Trustees also reviewed, among other things, the Adviser’s insider trading policies and procedures and its Code of Ethics.
Performance: The Trustees reviewed performance information provided by the Adviser for the Fund for the annualized 3‐year and 5‐year, and year‐to‐date periods ended December 31, 2016, including a comparison of the Fund’s performance to its benchmark and the performance of a group of comparable funds selected by the Adviser. The Trustees noted that the performance of the Fund lagged slightly, but was within an acceptable range of, the Fund’s benchmark and peer fund median over the 3‐year and 5‐year periods. The Trustees also considered the Adviser’s discussion of the Fund’s underlying portfolio diversification categories, its top contributors and top detractors, as well as the Adviser’s performance and reputation generally and its investment techniques, risk management controls, and decision‐making processes.
Comparable Accounts: The Trustees noted the Adviser’s statements that it did not offer the Fund’s strategy to other investment companies or large institutional clients.
Profitability: The Trustees received and considered a retrospective and projected profitability analysis prepared by the Adviser based on the fees payable under the Investment Advisory Agreement with respect to the Fund. The Trustees considered the profits, if any, anticipated to be realized by the Adviser in connection with the operation of the Fund. The Board then reviewed the Adviser’s audited financial statements for the years ended December 31, 2015 and 2014 in order to analyze the financial condition and stability and profitability of the Adviser.
Economies of Scale: The Trustees considered whether economies of scale in the provision of services to the Fund will be passed along to the shareholders under the proposed agreements.
Other Benefits to the Adviser: The Trustees reviewed and considered any other incidental benefits derived or to be derived by the Adviser from its relationship with the Fund, including whether soft dollar arrangements were used.
In renewing the Adviser as the Fund’s investment adviser and renewing the Investment Advisory Agreement and the fees charged under the Investment Advisory Agreement, the Trustees concluded that no single factor reviewed by the Trustees was identified by the Trustees to be determinative as the principal factor in whether to renew the Investment Advisory Agreement. Further, the Independent Trustees were advised by separate independent legal counsel throughout the process. The Trustees, including all of the Independent Trustees, concluded that:
| Annual Report | April 30, 2017 | 35 |
| Aspen Funds | Disclosure Regarding Approval of Fund Advisory Agreement |
April 30, 2017 (Unaudited)
| • | the Fund’s contractual advisory fee rate remains below each of the funds in the Data Provider peer group; |
| • | the Fund’s total expense ratio (after waivers) remains below its Data Provider peer group median total expense ratio (after waivers); |
| • | the nature, extent and quality of services rendered by the Adviser under the Investment Advisory Agreement with respect to the Fund were adequate; |
| • | for the period ended December 31, 2016, the performance of the Fund lagged slightly, but was within an acceptable range of, the Fund’s benchmark and peer fund median over the 3‐year and 5‐year periods; |
| | • | there were no directly comparable accounts managed by the Adviser for the Board to consider; |
| • | the profit, if any, realized by the Adviser in connection with the operation of the Fund is not unreasonable to the Fund; and |
| • | there were no material economies of scale or other incidental benefits accruing to the Adviser in connection with its relationship with the Fund. |
Based on the Trustees’ deliberations and their evaluation of the information described above, the Trustees, including all of the Independent Trustees, concluded that the Adviser’s compensation for investment advisory services is consistent with the best interests of the Fund and its shareholders.
ASPEN PORTFOLIO STRATEGY FUND
On December 13, 2016, the Trustees met in person to discuss, among other things, the approval of the investment advisory agreement between the Trust and the Adviser (the “Investment Advisory Agreement”), in accordance with Section 15(c) of the 1940 Act. In renewing and approving the Investment Advisory Agreement, the Trustees, including the Independent Trustees, considered the following factors with respect to the Fund:
Investment Advisory Fee Rate: The Trustees reviewed and considered the contractual annual advisory fee paid by the Trust, on behalf of the Fund, to the Adviser of 1.00% of the Fund’s daily average net assets, in light of the extent and quality of the advisory services provided by the Adviser to the Fund.
The Board received and considered information including a comparison of the Fund’s contractual and actual management fees and overall expenses with those of funds in the expense group and universes of funds selected by an independent provider of investment company data (the “Data Provider”). The Trustees noted that the contractual management fee rate for the Fund was below the average and median contractual management fee rates of the Data Provider expense group.
Total Expense Ratios: Based on such information, the Trustees further reviewed and considered the projected total expense ratios (after waivers) of 1.95% for the Fund’s Class A Shares and 1.55% of the Fund’s Class I Shares. The Trustees noted that the Fund’s total expense ratio (after waivers) for its Class A shares was above the median total expense ratio (after waivers) for its Data Provider expense group and for its Class I shares was below the median total expense ratio (after waivers) for its Data Provider expense group.
Nature, Extent, and Quality of the Services under the Investment Advisory Agreement: The Trustees received and considered information regarding the nature, extent, and quality of services to be provided to the Fund under the Investment Advisory Agreement. The Trustees reviewed certain background materials supplied by the Adviser in its presentation, including its Form ADV.
The Trustees reviewed and considered the Adviser’s investment advisory personnel, its history as an asset manager, and its performance and the amount of assets currently under management by the Adviser and its affiliated entities. The Trustees also reviewed the research and decision‐making processes utilized by the Adviser, including the methods adopted to seek to achieve compliance with the investment objectives, policies, and restrictions of the Fund.
The Trustees considered the background and experience of the Adviser’s management in connection with the Fund, including reviewing the qualifications, backgrounds, and responsibilities of the management team primarily responsible for the day‐to‐day portfolio management of the Fund and the extent of the resources devoted to research and analysis of actual and potential investments.
The Trustees also reviewed, among other things, the Adviser’s insider trading policies and procedures and its Code of Ethics.
Performance: The Trustees noted that since the Fund has not yet begun operations, there is no performance of the Fund to be reviewed or analyzed at this time. The Trustees further considered the Adviser’s reputation generally and its investment techniques, risk management controls, and decision‐making processes.
36
| Aspen Funds | Disclosure Regarding Approval of Fund Advisory Agreement |
April 30, 2017 (Unaudited)
Comparable Accounts: The Trustees noted the Adviser’s statements indicating that there were no clients with investment mandates directly comparable to that of the Fund.
Profitability: The Trustees received and considered a projected profitability analysis through September 30, 2016 prepared by the Adviser based on the fees to be payable under the Investment Advisory Agreement with respect to the Fund. The Trustees considered the profits, if any, anticipated to be realized by the Adviser in connection with the operation of the Fund. The Board then reviewed the Adviser’s audited financial statements for years ended December 31, 2015 and 2014 in order to analyze the financial condition and stability and profitability of the Adviser.
Economies of Scale: The Trustees considered whether economies of scale in the provision of services to the Fund will be passed along to the shareholders under the proposed agreements.
Other Benefits to the Adviser: The Trustees reviewed and considered any other incidental benefits to be derived by the Adviser from its relationship with the Fund, including whether soft dollar arrangements would be used.
In approving the Adviser as the Fund’s investment adviser and approving the Investment Advisory Agreement and the fees charged under the Investment Advisory Agreement, the Trustees concluded that no single factor reviewed by the Trustees was identified by the Trustees to be determinative as the principal factor in whether to approve the Investment Advisory Agreement. Further, the Independent Trustees were advised by separate independent legal counsel throughout the process. The Trustees, including all of the Independent Trustees, concluded that:
| • | the Fund’s contractual advisory fee rate was below its Data Provider peer group median contractual advisory fee rate; |
| • | the total expense ratio (after waivers) for the Fund was above its Data Provider peer group median total expense ratios (after waivers); |
| • | the nature, extent, and quality of services to be rendered by the Adviser under the Investment Advisory Agreement with respect to the Fund were adequate; |
| • | since the Fund has not yet begun operations, there is no performance of the Fund to be reviewed or analyzed at this time; |
| • | there were no directly comparable accounts managed by the Adviser for the Board to consider; |
| • | the profit, if any, to be realized by the Adviser in connection with the operation of the Fund is not unreasonable to the Fund; and |
| • | there were no material economies of scale or other incidental benefits accruing to the Adviser in connection with its relationship with the Fund. |
Based on the Trustees’ deliberations and their evaluation of the information described above, the Trustees, including all of the Independent Trustees, concluded that the Adviser’s compensation for investment advisory services is consistent with the best interests of the Fund and its shareholders.
| Annual Report | April 30, 2017 | 37 |
| Aspen Managed Futures Strategy Fund | Additional Information |
April 30, 2017 (Unaudited)
1. FUND HOLDINGS
The Fund files its complete schedule of portfolio holdings with the Securities and Exchange Commission (the “SEC”) for the first and third quarters of each fiscal year on Form N-Q within 60 days after the end of the period. Copies of the Funds’ Form N-Q are available without charge on the SEC website at http://www.sec.gov. You may also review and copy the Form N-Q at the SEC’s Public Reference Room in Washington, DC. For more information about the operation of the Public Reference Room, please call the SEC at 1-800-SEC-0330.
2. FUND PROXY VOTING POLICIES, PROCEDURES AND SUMMARIES
The Funds’ policies and procedures used in determining how to vote proxies and information regarding how the Fund voted proxies relating to portfolio securities during the most recent prior 12-month period ending June 30 are available without charge, (1) upon request, by calling (toll‐free) 855‐845‐9444 and (2) on the SEC’s website at http://www.sec.gov.
3. TAX INFORMATION (UNAUDITED)
The Funds designated the following for federal income tax purposes for distributions made during the calendar year ended December 31, 2016:
| | QDI | DRD |
| Aspen Managed Futures Strategy Fund | 0.00 % | 0.00 % |
| Aspen Portfolio Strategy Fund | 0.00 % | 0.00 % |
In early 2017, if applicable, shareholders of record received this information for the distribution paid to them by the Funds during the calendar year 2016 via Form 1099. The Funds will notify shareholders in early 2018 of amounts paid to them by the Funds, if any, during the calendar year 2017.
38
| Aspen Funds | Trustees and Officers |
April 30, 2017 (Unaudited)
Additional information regarding the Fund’s trustees is included in the Statement of Additional Information, which can be obtained without charge by calling 855‐845‐9444.
INDEPENDENT TRUSTEES
Name, Address* & Year of Birth | Position(s) Held with Fund | Term of Office** and Length of Time Served | Principal Occupation(s) During Past 5 Years*** | Number of Funds in Fund Complex Overseen by Trustee**** | Other Directorships Held by Trustee During Past 5 Years*** |
Mary K. Anstine,
1940 | Trustee and Chairman | Ms. Anstine was elected at a special meeting of shareholders held on March 21, 1997 and re‐elected at a special meeting of shareholders held on August 7, 2009. Ms. Anstine was appointed Chairman of the Board at the June 6, 2017 meeting of the Board of Trustees. | Ms. Anstine was formerly an Executive Vice President of First Interstate Bank of Denver until 1994, President/Chief Executive Officer of HealthONE Alliance, Denver, Colorado, from 1994 to 2004, and has been retired since 2004. Ms. Anstine is also Trustee/Director of AV Hunter Trust and Colorado Uplift Board. Ms. Anstine was formerly a Director of the Trust Bank of Colorado (later purchased and now known as Northern Trust Bank), HealthONE and Denver Area Council of the Boy Scouts of America, and a member of the American Bankers Association Trust Executive Committee. | 34 | Ms. Anstine is a Trustee of ALPS ETF Trust (20 funds); ALPS Variable Investment Trust (9 funds); Reaves Utility Income Fund (1 fund); and Westcore Trust (14 funds). |
Jeremy W. Deems,
1976 | Trustee | Mr. Deems was appointed as a Trustee at the March 11, 2008 meeting of the Board of Trustees and elected at a special meeting of shareholders held on August 7, 2009. | Mr. Deems is the Co‐Founder, Chief Operations Officer and Chief Financial Officer of Green Alpha Advisors, LLC, a registered investment advisor, and Co‐Portfolio Manager of the Shelton Green Alpha Fund. Prior to joining Green Alpha Advisors, Mr. Deems was CFO and Treasurer of Forward Management, LLC, ReFlow Management Co., LLC, ReFlow Fund, LLC, a private investment fund, and Sutton Place Management, LLC, an administrative services company, from 1998 to June 2007. From 2004 to 2005, Mr. Deems also served as Treasurer of the Forward Funds and the Sierra Club Funds. | 34 | Mr. Deems is a Trustee of ALPS ETF Trust (20 funds); ALPS Variable Investment Trust (9 funds); Clough Funds Trust (1 fund); Elevation ETF Trust (1 fund); and Reaves Utility Income Fund (1 fund). |
| Annual Report | April 30, 2017 | 39 |
| Aspen Funds | Trustees and Officers |
April 30, 2017 (Unaudited)
Name, Address* & Year of Birth | Position(s) Held with Fund | Term of Office** and Length of Time Served | Principal Occupation(s) During Past 5 Years*** | Number of Funds in Fund Complex Overseen by Trustee**** | Other Directorships Held by Trustee During Past 5 Years*** |
Jerry G. Rutledge,
1944 | Trustee | Mr. Rutledge was elected at a special meeting of shareholders held on August 7, 2009. | Mr. Rutledge is the President and owner of Rutledge’s Inc., a retail clothing business. Mr. Rutledge is currently Director of the American National Bank. He was from 1994 to 2007 a Regent of the University of Colorado. | 34 | Mr. Rutledge is a Trustee of Principal Real Estate Income Fund (1 fund), Clough Global Dividend and Income Fund (1 fund), Clough Global Equity Fund (1 fund) and Clough Global Opportunities Fund (1 fund). |
Michael “Ross” Shell,
1970 | Trustee | Mr. Shell was elected at a special meeting of shareholders held on August 7, 2009. | Mr. Shell is Founder and CEO of Red Idea, LLC, a strategic consulting/early stage venture firm (since June 2008). From 1999 to 2009, he was a part‐ owner and Director of Tesser, Inc., a brand agency. From December 2005 to May 2008, he was Director, Marketing and Investor Relations, of Woodbourne, a REIT/real estate hedge fund and private equity firm. Prior to this, from May 2004 to November 2005, he worked as a business strategy consultant; from June 2003 to April 2004, he was on the Global Client Services team of IDEO, a product design/innovation firm; and from 1999 to 2003, he was President of Tesser, Inc. Mr. Shell graduated with honors from Stanford University with a degree in Political Science. | 34 | None. |
40
| Aspen Funds | Trustees and Officers |
April 30, 2017 (Unaudited)
INTERESTED TRUSTEE
Name, Address* & Year of Birth | Position(s) Held with Fund | Term of Office** and Length of Time Served | Principal Occupation(s) During Past 5 Years*** | Number of Funds in Fund Complex Overseen by Trustee**** | Other Directorships Held by Trustee During Past 5 Years*** |
Edmund J. Burke,
1961 | Trustee and President | Mr. Burke was elected as Trustee at a special meeting of shareholders held on August 7, 2009. Mr. Burke was elected President of the Trust at the December 17, 2002 meeting of the Board of Trustees. | Mr. Burke is President and a Director of ALPS Holdings, Inc. (“AHI”) (since 2005) and Director of Boston Financial Data Services, Inc. (“BFDS”), ALPS Advisors, Inc. (“AAI”), ALPS Distributors, Inc. (“ADI”), ALPS Fund Services, Inc. (“AFS”) and ALPS Portfolio Solutions Distributor, Inc. (“APSD”) and from 2001‐2008, was President of AAI, ADI, AFS and APSD. Because of his positions with AHI, BFDS, AAI, ADI, AFS and APSD, Mr. Burke is deemed an affiliate of the Trust as defined under the 1940 Act. | 34 | Mr. Burke is a Trustee of Clough Global Dividend and Income Fund (1 fund); Clough Global Equity Fund (1 fund); Clough Global Opportunities Fund (1 fund); Clough Funds Trust (1 fund); Liberty All‐Star Equity Fund (1 fund); and Director of the Liberty All‐Star Growth Fund, Inc. (1 fund). |
| Annual Report | April 30, 2017 | 41 |
| Aspen Funds | Trustees and Officers |
April 30, 2017 (Unaudited)| OFFICERS | | | |
Name, Address* & Year of Birth | Position(s) Held with Fund | Term of Office** and Length of Time Served | Principal Occupation(s) During Past 5 Years*** |
Kimberly R. Storms,
1972 | Treasurer | Ms. Storms was elected Treasurer of the Trust at the March 12, 2013 meeting of the Board of Trustees. | Ms. Storms is Senior Vice President ‐ Director of Fund Administration of ALPS. Because of her position with ALPS, Ms. Storms is deemed an affiliate of the Trust as defined under the 1940 Act. Ms. Storms is also Treasurer of Liberty All‐Star Equity Fund, Liberty All‐Star Growth Fund, Inc., ALPS Series Trust and Elevation ETF Trust. Ms. Storms also serves as a Board member and Treasurer of The Center for Trauma & Resilience, a nonprofit agency. |
Karen S. Gilomen,
1970 | Secretary | Ms. Gilomen was elected Secretary of the Trust at the December 13, 2016 meeting of the Board of Trustees. | Ms. Gilomen joined ALPS in August 2016 as Vice President and Senior Counsel. Prior to joining ALPS, Ms. Gilomen was Vice President ‐ General Counsel & CCO of Monticello Associates, Inc. from 2010 to 2016. Because of her position with ALPS, Ms. Gilomen is deemed an affiliate of the Trust, as defined under the 1940 Act. Ms. Gilomen is also the Secretary of Oak Associates Funds and Reaves Utility Income Fund, and the Assistant Secretary of the WesMark Funds. |
Ted Uhl,
1974 | Chief Compliance Officer (“CCO”) | Mr. Uhl was appointed CCO of the Trust at the June 8, 2010 meeting of the Board of Trustees. | Mr. Uhl joined ALPS in October 2006, and is currently Deputy Compliance Officer of ALPS. Prior to his current role, Mr. Uhl served as Senior Risk Manager for ALPS from October 2006 until June 2010. Before joining ALPS, Mr. Uhl served a Sr. Analyst with Enenbach and Associates (RIA), and a Sr. Financial Analyst at Sprint. Because of his position with ALPS, Mr. Uhl is deemed an affiliate of the Trust as defined under the 1940 Act. Mr. Uhl is also CCO of the Boulder Growth & Income Fund, Inc., Centre Funds, Elevation ETF Trust, Index Funds, Reality Shares ETF Trust and Reaves Utility Income Fund. |
Jennell Panella,
1974 | Assistant Treasurer | Ms. Panella was elected Assistant Treasurer of the Trust at the September 15, 2015 meeting of the Board of Trustees. | Ms. Panella joined ALPS in June 2012 and is currently Fund Controller of ALPS Fund Services, Inc. Prior to joining ALPS, Ms. Panella served as Financial Reporting Manager for Parker Global Strategies, LLC (2009‐2012). Because of her position with ALPS, Ms. Panella is deemed an affiliate of the Trust as defined under the 1940 Act. Ms. Panella also serves as Assistant Treasurer of James Advantage Funds. |
Alan Gattis,
1980 | Assistant Treasurer | Mr. Gattis was elected Assistant Treasurer of the Trust at the September 13, 2016 meeting of the Board of Trustees. | Mr. Gattis joined ALPS in 2011 and is currently Vice President and Fund Controller of ALPS. Prior to joining ALPS, Mr. Gattis was an Auditor at Spicer Jeffries LLP (2009 through 2011) and an Auditor at PricewaterhouseCoopers LLP (2004 ‐ 2009). Because of his position with ALPS, Mr. Gattis is deemed an affiliate of the Trust as defined under the 1940 Act. Mr. Gattis is also Assistant Treasurer of ALPS Series Trust, Clough Funds Trust, Clough Global Opportunities Fund, Clough Global Dividend and Income Fund, Clough Global Equity and Griffin Institutional Access Real Estate Fund. |
42
| Aspen Funds | Trustees and Officers |
April 30, 2017 (Unaudited)| OFFICERS | | | |
Name, Address* & Year of Birth | Position(s) Held with Fund | Term of Office** and Length of Time Served | Principal Occupation(s) During Past 5 Years*** |
Sharon Akselrod,
1974 | Assistant Secretary | Ms. Akselrod was elected Assistant Secretary of the Trust at the September 15, 2015 meeting of the Board of Trustees. | Ms. Akselrod joined ALPS in August 2014 and is currently Senior Investment Company Act Paralegal of ALPS Fund Services, Inc. Prior to joining ALPS, Ms. Akselrod served as Corporate Governance and Regulatory Associate for Nordstrom fsb (2013‐2014) and Senior Legal Assistant – Legal Manager for AXA Equitable Life Insurance Company (2008‐2013). Because of her position with ALPS, Ms. Akselrod is deemed an affiliate of the Trust as defined under the 1940 Act. Ms. Akselrod is also Assistant Secretary of ALPS ETF Trust. |
Jennifer Craig
1973 | Assistant Secretary | Ms. Craig was elected Assistant Secretary of the Trust at the June 8, 2016 meeting of the Board of Trustees. | Ms. Craig joined ALPS in 2007 and is currently Assistant Vice President and Paralegal Manager of ALPS. Prior to joining ALPS, Ms. Craig was Legal Manager at Janus Capital Management LLC and served as Assistant Secretary of Janus Investment Fund, Janus Adviser Series and Janus Aspen Series. Because of her position with ALPS, Ms. Craig is deemed an affiliate of the Trust as defined under the 1940 Act. Ms. Craig is also Assistant Secretary of Clough Global Dividend and Income Fund, Clough Global Equity Fund, Clough Global Opportunities Fund, Clough Funds Trust and ALPS Series Trust. |
| * | All communications to Trustees and Officers may be directed to Financial Investors Trust c/o 1290 Broadway, Suite 1100, Denver, CO 80203. |
| ** | This is the period for which the Trustee or Officer began serving the Trust. Each Trustee serves an indefinite term, until his successor is elected. Officers are elected on an annual basis. |
| *** | The Fund Complex includes all series of the Trust (currently 34) and any other investment companies for which any Trustee serves as trustee for and which Aspen Partners, Ltd. provides investment advisory services (currently none). |
| Annual Report | April 30, 2017 | 43 |
| Aspen Funds | Privacy Policy |
April 30, 2017 (Unaudited)
| FACTS | WHAT DO THE FUNDS DO WITH YOUR PERSONAL INFORMATION? |
| Why? | Financial companies choose how they share your personal information. Federal law gives consumers the right to limit some but not all sharing. Federal law also requires us to tell you how we collect, share, and protect your personal information. Please read this notice carefully to understand what we do. |
| What? | The types of personal information we collect and share depend on the product or service you have with us. This information can include: |
| | ● | Social Security number and account transactions |
| | ● | Account balances and transaction history |
| | ● | Wire transfer instructions |
| How? | All financial companies need to share customers’ personal information to run their everyday business. In the section below, we list the reasons financial companies can share their customers’ personal information; the reasons the Funds choose to share; and whether you can limit this sharing. |
| Reasons we can share your personal information | Do the Funds share: | Can you limit this sharing? |
For our everyday business purposes — such as to process your transactions, maintain your account(s), respond to court orders and legal investigations, or report to credit bureaus | Yes | No |
For our marketing purposes — to offer our products and services to you | No | We do not share. |
| For joint marketing with other financial companies | No | We do not share. |
For our affiliates’ everyday business purposes — information about your transactions and experiences | Yes | No |
For our affiliates’ everyday business purposes — information about your creditworthiness | No | We do not share. |
| For non‐affiliates to market to you | No | We do not share. |
44
| Aspen Funds | Privacy Policy |
April 30, 2017 (Unaudited)| Who We Are | | |
| Who is providing this notice? | Aspen Managed Futures Strategy Fund and Aspen Portfolio Strategy Fund. |
| What We Do | | |
| How do the Funds protect my personal information? | To protect your personal information from unauthorized access and use, we use security measures that comply with federal law. These measures include computer safeguards and secured files and buildings. |
| How do the Funds collect my personal information? | We collect your personal information, for example, when you |
| | ● | open an account |
| | ● | provide account information or give us your contact information |
| | ● | make a wire transfer or deposit money |
| Why can’t I limit all sharing? | Federal law gives you the right to limit only |
| | ● | sharing for affiliates’ everyday business purposes – information about your creditworthiness |
| | ● | affiliates from using your information to market to you |
| | ● | sharing for non‐affiliates to market to you |
| | State laws and individual companies may give you additional rights to limit sharing. |
| Definitions | | |
| Affiliates | Companies related by common ownership or control. They can be financial and nonfinancial companies. |
| Non-affiliates | Companies not related by common ownership or control. They can be financial and nonfinancial companies. |
| | ● | The Funds do not share with non‐affiliates so they can market to you. |
| Joint marketing | A formal agreement between non‐affiliated financial companies that together market financial products or services to you. |
| | ● | The Funds do not jointly market. |
| Other Important Information | | |
| California Residents | If your account has a California home address, your personal information will not be disclosed to nonaffiliated third parties except as permitted by applicable California law, and we will limit sharing such personal information with our affiliates to comply with California privacy laws that apply to us. |
| Vermont Residents | The State of Vermont requires financial institutions to obtain your consent prior to sharing personal information that they collect about you with affiliated companies and nonaffiliated third parties other than in certain limited circumstances. Except as permitted by law, we will not share personal information we collect about you with nonaffiliated third parties or other affiliated companies unless you provide us with your written consent to share such information. |
| Annual Report | April 30, 2017 | 45 |
This material must be accompanied or preceded by the prospectus.
APRIL 30, 2017 / DGIFUND.COM
TABLE OF CONTENTS
ANNUAL REPORT
| SHAREHOLDER LETTER | 1 |
| PERFORMANCE UPDATE | 3 |
| DISCLOSURE OF FUND EXPENSES | 5 |
| PORTFOLIO OF INVESTMENTS | 6 |
| STATEMENT OF ASSETS AND LIABILITIES | 17 |
| STATEMENT OF OPERATIONS | 18 |
| STATEMENTS OF CHANGES IN NET ASSETS | 19 |
| FINANCIAL HIGHLIGHTS | 20 |
| NOTES TO FINANCIAL STATEMENTS | 22 |
| REPORT OF INDEPENDENT REGISTERED PUBLIC ACCOUNTING FIRM | 30 |
| ADDITIONAL INFORMATION | 31 |
| TRUSTEES AND OFFICERS | 32 |
| PRIVACY POLICY | 37 |
Disciplined Growth Investors’ goal is to communicate clearly and transparently with our clients and mutual fund shareholders. It is mutually beneficial when our shareholders understand how we invest, what we are currently thinking and forecasting, and the specific investment decisions we have made. Our views and opinions regarding the investment prospects of our portfolio holdings and the Fund are “forward looking statements” which may or may not be accurate over the long term. While we believe we have a reasonable basis for these forecasts and have confidence in our investment team’s views, actual results may differ materially from those we anticipate. Information provided in this report should not be considered a recommendation to purchase or sell any particular security.
You can identify forward looking statements as those including words such as “believe”, “expect”, “anticipate”, “forecast”, and similar statement. We cannot assure future performance. These forward-looking statements are made only as-of the date of this report. Following the publication of this report, we will not update any of the forward-looking statements included here.
This material must be preceded or accompanied by a prospectus. Please read the prospectus carefully before investing.
THE DISCIPLINED GROWTH INVESTORS FUND
APRIL 30, 2017 | DGIFUND.COM |
| The Disciplined Growth Investors Fund | Shareholder Letter |
April 30, 2017 (Unaudited)
As of April 30, 2017 The Disciplined Growth Investors Fund (The DGI Fund) had total net assets of $159.8 million.
For the fiscal year (ended April 30, 2017), the Fund appreciated 14.96%. Equities have returned 22.06% in this twelve month period while fixed income securities have returned 2.22%. The annual appreciation was broadly‐based. In the last twelve months, your Fund has owned 58 stocks. Forty‐two had a positive impact on performance over this time while 16 detracted from the Fund’s total return.
Since inception, The DGI Fund has returned 12.44% on an annualized basis (5 years, 8 months).
Portfolio Asset Mix
The portfolio currently holds 69.8% stocks and 30.2% bonds and cash. A list of holdings is included as part of this annual report and is available on the Fund’s website at www.dgifund.com.
Portfolio Activity
The DGI Fund’s turnover for the last six months was 5.1%. This is in‐line with the Fund’s historical longer term levels of turnover.
Over the past year, we have added four stocks to the equity portion of the mutual fund and sold one. Four portfolio companies were acquired.
The new stocks consist of Protolabs, Gentherm, Gigamon, and Nordstrom.
Protolabs (PRLB) is a quick‐turn manufacturer of custom parts for prototyping and short‐run manufacturing. The company's manufacturing services include CNC machining, injection molding and additive manufacturing. Its operations eliminate most of the time‐consuming and expensive labor conventionally required to quote and manufacture parts in low volumes via its proprietary software that was purposefully designed to automatically analyze part geometry, provide a final quote & generate the required tool path to manufacture the part.
Gentherm (THRM) makes and sells thermal management systems, primarily for the automotive industry. This includes actively heated and cooled seat systems and cupholders, heated and ventilated seat systems, heated steering wheels, and similar products. Disciplined Growth Investors has experience investing in Gentherm by way of our Small Cap Growth portfolio. We “graduated” Gentherm to our Mid Cap Growth portfolio (the equity portion of your mutual fund) due to the substantial progress the company has made over the past several years including: 1. completing the acquisition of W.E.T. which gave them access to new German Original Equipment Manufacturers (OEM), additional heated and ventilated products that address the lower‐end offerings, and full integration and control of manufacturing and 2. success in diversifying the business outside of Autos into remote Global Power Technology (oil and gas industry), Medical (patient temperature control), and Battery Thermal Management for near‐hybrid autos.
Nordstrom (JWM) is a fashion‐specialty retailer that provides a renowned customer experience and inspiring merchandise assortments. The company achieves margins and returns well above the department store average and many of its specialty‐store peers. It is transforming itself from a department store into the prototype apparel distributor of the future. Nordstrom is one of the few traditional department stores successfully reinventing itself and growing with an off‐price concept, full‐price expansion in under‐penetrated markets, and various e‐commerce initiatives. The company is a true multi‐channel retailer with Nordstrom department stores (121 stores), Nordstrom Rack off‐price stores (215), and Nordstrom.com & Nordstromrack.com online offerings.
| Annual Report | April 30, 2017 | 1 |
| The Disciplined Growth Investors Fund | Shareholder Letter |
April 30, 2017 (Unaudited)
Gigamon (GIMO) provides intelligent, network appliances that deliver pervasive and dynamic visibility and control of data traffic across IT networks, improving its reliability, performance, and security. The company refers to this emerging function in the network architecture as a Visibility Fabric (VF). GIMO’s broad set of VF solutions are designed to be interoperable with leading network tools/products, creating a large ecosystem of partners. As the liaison position in the network architecture, GIMO has valuable insight into data composition, network usage patterns, and potential security threats which have been leveraged to develop other products and services.
In April 2017, we sold the remaining position of E*Trade Financial (ETFC) due to, in our view, elevated business execution risk and stock valuation risk.
In June 2016, the private equity firm Thoma Bravo acquired The DGI Fund holding QLIK Technology for $3 billion in cash ($30.50 per share). TUMI Holdings was acquired in August 2016 by the luggage maker Samsonite for $1.8 billion in cash ($26.75 per share). In September 2016, ARM Holdings was acquired by Softbank for $32 billion in cash ($22.50 per share). Finally, in January 2017 portfolio holding CEB was acquired by Gartner for $2.6 billion in cash and stock. We sold the Gartner shares after the acquisition was finalized.
Sincerely,
Frederick K. Martin, CFA
Chief Investment Officer
Disciplined Growth Investors, Inc.
The views of Disciplined Growth Investors, Inc. and information discussed in this commentary are as of the date of publication, are subject to change, and may not reflect the writers’ current views. The views expressed are those of the Fund’s adviser only, and represent an assessment of market conditions at a specific point in time, are opinions only and should not be relied upon as investment advice regarding a particular investment or markets in general. Such information does not constitute a recommendation to buy or sell specific securities or investment vehicles. It should not be assumed that any investment will be profitable or will equal the performance of the portfolios or any securities or any sectors mentioned in this letter. The subject matter contained in this letter has been derived from several sources believed to be reliable and accurate at the time of compilation. Neither Disciplined Growth Investors, Inc. nor the Fund accepts any liability for losses either direct or consequential caused by the use of this information.
The Fund is distributed by ALPS Distributors, Inc.
The Fund is subject to investment risks, including possible loss of the principal amount invested and therefore is not suitable for all investors. The Fund may not achieve its objectives.
Diversification does not eliminate the risk of experiencing investment losses.
Fred Martin is a registered representative of ALPS Distributors, Inc. CFA Institute Marks are trademarks owned by the CFA Institute.
| 2 | 1-855-DGI-FUND (344-3863) | www.DGIfund.com |
| The Disciplined Growth Investors Fund | Performance Update |
April 30, 2017 (Unaudited)
Cumulative Total Return Performance (for the period ended April 30, 2017)
| | 6 month | YTD | 1 Year | 3 Year | 5 Year | Since Inception* |
| The Disciplined Growth Investors Fund | 8.78% | 4.89% | 14.96% | 8.32% | 9.95% | 12.44% |
S&P 500® Total Return Index(1) | 13.32% | 7.16% | 17.92% | 10.47% | 13.68% | 15.56% |
Performance data quoted represents past performance. Past performance does not guarantee future results. Investment return and principal value of an investment will fluctuate so that an investor’s shares, when sold or redeemed, may be worth more or less than the original cost. Current performance data may be higher or lower than actual data quoted. For the most current month-end performance data please call 1.855.DGI.FUND.
The table does not reflect the deductions of taxes a shareholder would pay on Fund distributions or redemptions of Fund shares.
Subject to investment risks, including possible loss of the principal amount invested.
Returns for periods greater than 1 year are annualized.
| * | Fund Inception date of August 12, 2011. |
(1) | The S&P 500® Total Return Index is an unmanaged index of 500 common stocks chosen for market size, liquidity and industry group representation. It is a market-value weighted index. The Index is not actively managed and does not reflect any deductions for fees, expenses or taxes. An investor may not invest directly in the Index. |
| Annual Report | April 30, 2017 | 3 |
| The Disciplined Growth Investors Fund | Performance Update |
April 30, 2017 (Unaudited)
Growth of $10,000 Investment in the Fund (for the period ended April 30, 2017)
The chart above represents historical performance of a hypothetical investment of $10,000 in the Fund since inception. Past performance does not guarantee future results. This chart does not reflect the deduction of taxes that a shareholder would pay on Fund distributions or the redemption of Fund shares.
Investing in the Fund is subject to investment risks, including possible loss of the principal amount invested.
Industry Sector Allocation
(as a % of Net Assets)*
| Technology | 27.87% |
| Consumer Discretionary | 16.07% |
| Health Care | 10.11% |
| Producer Durables | 7.77% |
| Energy | 2.62% |
| Financial Services | 2.34% |
| Industrials | 0.88% |
| Consumer, Non‐cyclical | 0.78% |
| Consumer, Cyclical | 0.75% |
| Communications | 0.66% |
| Asset/Mortgage Backed Securities | 0.01% |
| Corporate Bonds | 19.52% |
| Foreign Government Bonds | 0.25% |
| Government & Agency Obligations | 0.37% |
| Short Term Investments | 9.78% |
| Other Assets in Excess of Liabilities | 0.22% |
Top Ten Holdings
(as a % of Net Assets)*
| Edwards Lifesciences Corp. | 4.38% |
| U.S. Treasury Bill, 09/14/2017 | 3.74% |
| U.S. Treasury Bill, 12/07/2017 | 3.73% |
| Intuit, Inc. | 3.55% |
| Middleby Corp. | 3.51% |
| TJX Cos., Inc. | 3.50% |
| Open Text Corp. | 3.01% |
| Autodesk, Inc. | 2.78% |
| Plexus Corp. | 2.44% |
| Intuitive Surgical, Inc. | 2.21% |
| Top Ten Holdings | 32.85% |
| * | Holdings are subject to change, and may not reflect the current or future position of the portfolio. |
| 4 | 1-855-DGI-FUND (344-3863) | www.DGIfund.com |
| The Disciplined Growth Investors Fund | Disclosure of Fund Expenses |
April 30, 2017 (Unaudited)
As a shareholder of the Fund, you incur two types of costs: (1) transaction costs, including sales charges (loads) on purchase payments, reinvested dividends, or other distributions; redemption fees; and exchange fees; and (2) ongoing costs, including management fees; distribution and/or service (12b‐1) fees; and other fund operating expenses. This example is intended to help you understand your ongoing costs (in dollars), of investing in the Fund and to compare these costs with the ongoing costs of investing in other mutual funds.
This example is based on an investment of $1,000 invested at the beginning of the period and held for the entire six‐month period of November 1, 2016 through April 30, 2017.
Actual Expenses The first line of the table below provides information about actual account values and actual expenses. You may use the information in this line, together with the amount you invested, to estimate the expenses that you paid over the period. Simply divide your account value by $1,000 (for example, an $8,600 account value divided by $1,000 = 8.6), then multiply the result by the number in the first line under the heading “Expenses Paid During Period” to estimate the expenses you paid on your account during this period.
Hypothetical Example for Comparison Purposes The second line of the table below provides information about hypothetical account values and hypothetical expenses based on the Fund’s actual expense ratio and an assumed rate of return of 5% per year before expenses, which is not the Fund’s actual return. The hypothetical account values and expenses may not be used to estimate the actual ending account balance or expenses you paid for the period. You may use this information to compare the ongoing costs of investing in the Fund and other mutual funds. To do so, compare this 5% hypothetical example with the 5% hypothetical examples that appear in the shareholder reports of the other funds.
Please note that the expenses shown in the table are meant to highlight your ongoing costs only and do not reflect transactional costs, such as sales charges (loads), redemption fees or exchange fees. Therefore, the second line of the table is useful in comparing ongoing costs only and will not help you determine the relative total costs of owning different funds. In addition, if these transactional costs were included, your costs would have been higher.
| | Beginning Account Value 11/1/2016 | Ending Account Value 4/30/2017 | Expense Ratio(a) | Expenses Paid During period 11/1/2016 - 4/30/2017(b) |
| Actual | $1,000.00 | $1,087.80 | 0.78% | $ 4.04 |
| Hypothetical (5% return before expenses) | $1,000.00 | $1,020.93 | 0.78% | $ 3.91 |
(a) | The Fund's expense ratios have been annualized based on the Fund's most recent fiscal half-year expenses. |
(b) | Expenses are equal to the Fund's annualized expense ratio, multiplied by the average account value over the period, multiplied by the number of days in the most recent fiscal half-year (181)/365 (to reflect the half-year period). |
| Annual Report | April 30, 2017 | 5 |
| The Disciplined Growth Investors Fund | Portfolio of Investments |
April 30, 2017
| | | Shares | | | Value
(Note 2) | |
| COMMON STOCKS (69.85%) | | | | | | |
| COMMUNICATIONS (0.66%) | | | | | | |
| Telecommunications (0.66%) | | | | | | |
Gigamon, Inc.(a) | | | 33,300 | | | $ | 1,055,610 | |
| | | | | | | | | |
| TOTAL COMMUNICATIONS | | | | | | | 1,055,610 | |
| | | | | | | | | |
| CONSUMER DISCRETIONARY (16.07%) | | | | | | | | |
| Consumer Products (4.39%) | | | | | | | | |
| Ethan Allen Interiors, Inc. | | | 58,181 | | | | 1,733,794 | |
| Garmin Ltd. | | | 42,550 | | | | 2,163,242 | |
| Ralph Lauren Corp. | | | 11,518 | | | | 929,733 | |
Select Comfort Corp.(a) | | | 71,048 | | | | 2,195,383 | |
| | | | | | | | 7,022,152 | |
| | | | | | | | | |
| Electronics (1.60%) | | | | | | | | |
| Gentex Corp. | | | 123,650 | | | | 2,553,372 | |
| | | | | | | | | |
| Leisure (3.31%) | | | | | | | | |
| Cheesecake Factory, Inc. | | | 18,862 | | | | 1,210,186 | |
| Royal Caribbean Cruises Ltd. | | | 32,337 | | | | 3,447,124 | |
TripAdvisor, Inc.(a) | | | 14,087 | | | | 634,056 | |
| | | | | | | | 5,291,366 | |
| | | | | | | | | |
| Retail (6.77%) | | | | | | | | |
Cabela's, Inc.(a) | | | 28,412 | | | | 1,551,295 | |
| L Brands, Inc. | | | 58,297 | | | | 3,078,665 | |
| TJX Cos., Inc. | | | 71,100 | | | | 5,591,304 | |
Urban Outfitters, Inc.(a) | | | 25,900 | | | | 592,592 | |
| | | | | | | | 10,813,856 | |
| | | | | | | | | |
| TOTAL CONSUMER DISCRETIONARY | | | | | | | 25,680,746 | |
| | | | | | | | | |
| CONSUMER, CYCLICAL (0.75%) | | | | | | | | |
| Auto Parts & Equipment (0.75%) | | | | | | | | |
Gentherm, Inc.(a) | | | 32,100 | | | | 1,192,515 | |
| | | | | | | | | |
| TOTAL CONSUMER, CYCLICAL | | | | | | | 1,192,515 | |
| | | | | | | | | |
| CONSUMER, NON‐CYCLICAL (0.78%) | | | | | | | | |
| Commercial Services (0.60%) | | | | | | | | |
IHS Markit Ltd.(a) | | | 21,979 | | | | 953,888 | |
| 6 | 1-855-DGI-FUND (344-3863) | www.DGIfund.com |
| The Disciplined Growth Investors Fund | Portfolio of Investments |
April 30, 2017
| | | Shares | | | | |
| CONSUMER, NON‐CYCLICAL (continued) | | | | | | |
| Healthcare‐Products (0.18%) | | | | | | |
Varex Imaging Corp.(a) | | | 8,780 | | | $ | 294,657 | |
| | | | | | | | | |
| TOTAL CONSUMER, NON‐CYCLICAL | | | | | | | 1,248,545 | |
| | | | | | | | | |
| ENERGY (2.62%) | | | | | | | | |
| Crude Producers (0.61%) | | | | | | | | |
Southwestern Energy Co.(a) | | | 129,337 | | | | 971,321 | |
| | | | | | | | | |
| Oil & Gas Services (0.66%) | | | | | | | | |
| Core Laboratories NV | | | 9,587 | | | | 1,062,431 | |
| | | | | | | | | |
| Oil, Gas & Consumable Fuels (1.35%) | | | | | | | | |
Ultra Petroleum Corp.(a)(b)(c) | | | 19,213 | | | | 193,667 | |
Ultra Petroleum Corp.(a) | | | 174,726 | | | | 1,956,936 | |
| | | | | | | | 2,150,603 | |
| | | | | | | | | |
| TOTAL ENERGY | | | | | | | 4,184,355 | |
| | | | | | | | | |
| FINANCIAL SERVICES (2.34%) | | | | | | | | |
| Banks (0.54%) | | | | | | | | |
| TCF Financial Corp. | | | 51,962 | | | | 857,893 | |
| | | | | | | | | |
| Consumer Finance & Credit Services (1.80%) | | | | | | | | |
| FactSet Research Systems, Inc. | | | 17,658 | | | | 2,882,845 | |
| | | | | | | | | |
| TOTAL FINANCIAL SERVICES | | | | | | | 3,740,738 | |
| | | | | | | | | |
| HEALTH CARE (10.11%) | | | | | | | | |
| Biotechnology (0.39%) | | | | | | | | |
Myriad Genetics, Inc.(a) | | | 34,462 | | | | 633,756 | |
| | | | | | | | | |
| Medical Equipment & Services (7.84%) | | | | | | | | |
Edwards Lifesciences Corp.(a) | | | 63,850 | | | | 7,002,430 | |
Intuitive Surgical, Inc.(a) | | | 4,222 | | | | 3,529,043 | |
Varian Medical Systems, Inc.(a) | | | 21,950 | | | | 1,991,743 | |
| | | | | | | | 12,523,216 | |
| | | | | | | | | |
| Medical Specialties (1.88%) | | | | | | | | |
Align Technology, Inc.(a) | | | 22,300 | | | | 3,002,026 | |
| | | | | | | | | |
| TOTAL HEALTH CARE | | | | | | | 16,158,998 | |
| Annual Report | April 30, 2017 | 7 |
| The Disciplined Growth Investors Fund | Portfolio of Investments |
April 30, 2017
| | | Shares | | | | |
| INDUSTRIALS (0.88%) | | | | | | |
| Industrial Goods & Services (0.88%) | | | | | | |
Proto Labs, Inc.(a) | | | 24,150 | | | $ | 1,400,700 | |
| | | | | | | | | |
| TOTAL INDUSTRIALS | | | | | | | 1,400,700 | |
| | | | | | | | | |
| PRODUCER DURABLES (7.77%) | | | | | | | | |
| Machinery (3.51%) | | | | | | | | |
Middleby Corp.(a) | | | 41,166 | | | | 5,603,928 | |
| | | | | | | | | |
| Machinery‐Diversified (0.82%) | | | | | | | | |
| Graco, Inc. | | | 12,137 | | | | 1,308,976 | |
| | | | | | | | | |
| Software (0.60%) | | | | | | | | |
| Paychex, Inc. | | | 16,312 | | | | 966,975 | |
| | | | | | | | | |
| Transportation & Freight (2.84%) | | | | | | | | |
JetBlue Airways Corp.(a) | | | 100,250 | | | | 2,188,457 | |
| Landstar System, Inc. | | | 27,475 | | | | 2,347,739 | |
| | | | | | | | 4,536,196 | |
| | | | | | | | | |
| TOTAL PRODUCER DURABLES | | | | | | | 12,416,075 | |
| | | | | | | | | |
| TECHNOLOGY (27.87%) | | | | | | | | |
| Computer Technology (0.80%) | | | | | | | | |
Super Micro Computer, Inc.(a) | | | 52,200 | | | | 1,273,680 | |
| | | | | | | | | |
| Electronics (6.64%) | | | | | | | | |
| Microchip Technology, Inc. | | | 25,400 | | | | 1,919,732 | |
| Open Text Corp. | | | 138,449 | | | | 4,801,411 | |
Plexus Corp.(a) | | | 74,837 | | | | 3,890,776 | |
| | | | | | | | 10,611,919 | |
| | | | | | | | | |
| Information Technology (12.31%) | | | | | | | | |
Akamai Technologies, Inc.(a) | | | 46,412 | | | | 2,828,347 | |
Autodesk, Inc.(a) | | | 49,312 | | | | 4,441,532 | |
| Dolby Laboratories, Inc. ‐ Class A | | | 20,950 | | | | 1,104,693 | |
| Intuit, Inc. | | | 45,362 | | | | 5,679,776 | |
| Seagate Technology PLC | | | 63,876 | | | | 2,691,096 | |
Yahoo!, Inc.(a) | | | 60,475 | | | | 2,915,500 | |
| | | | | | | | 19,660,944 | |
| 8 | 1-855-DGI-FUND (344-3863) | www.DGIfund.com |
| The Disciplined Growth Investors Fund | Portfolio of Investments |
April 30, 2017
| | | Shares | | | | |
| TECHNOLOGY (continued) | | | | | | |
| Semiconductors (1.83%) | | | | | | |
| Power Integrations, Inc. | | | 31,400 | | | $ | 2,070,830 | |
Synaptics, Inc.(a) | | | 15,612 | | | | 855,069 | |
| | | | | | | | 2,925,899 | |
| | | | | | | | | |
| Software (2.67%) | | | | | | | | |
| Cognex Corp. | | | 27,700 | | | | 2,363,918 | |
Medidata Solutions, Inc.(a) | | | 3,562 | | | | 233,062 | |
RealPage, Inc.(a) | | | 45,262 | | | | 1,676,957 | |
| | | | | | | | 4,273,937 | |
| | | | | | | | | |
| Telecommunications (3.62%) | | | | | | | | |
| Plantronics, Inc. | | | 59,262 | | | | 3,235,705 | |
Ubiquiti Networks, Inc.(a) | | | 34,812 | | | | 1,793,514 | |
ViaSat, Inc.(a) | | | 11,731 | | | | 751,136 | |
| | | | | | | | 5,780,355 | |
| | | | | | | | | |
| TOTAL TECHNOLOGY | | | | | | | 44,526,734 | |
| | | | | | | | | |
| TOTAL COMMON STOCKS (Cost $73,014,045) | | | | | | | 111,605,016 | |
| | | | | | | |
| ASSET/MORTGAGE BACKED SECURITIES (0.01%) | | | | | | |
| Government National Mortgage Association, Series 2005‐93 | | | | | | |
| 5.500% 12/20/2034 | | $ | 9,646 | | | | 9,669 | |
| | | | | | | | | |
| TOTAL ASSET/MORTGAGE BACKED SECURITIES (Cost $10,189) | | | | | | | 9,669 | |
| | | | | | | | | |
| CORPORATE BONDS (19.52%) | | | | | | | | |
| BASIC MATERIALS (0.26%) | | | | | | | | |
Iron/Steel (0.26%) | | | | | | | | |
| Nucor Corp. | | | | | | | | |
| 5.750% 12/01/2017 | | | 406,000 | | | | 415,289 | |
| | | | | | | | | |
| TOTAL BASIC MATERIALS | | | | | | | 415,289 | |
| Annual Report | April 30, 2017 | 9 |
| The Disciplined Growth Investors Fund | Portfolio of Investments |
April 30, 2017
| | | Principal
Amount | | | Value
(Note 2) | |
| COMMUNICATIONS (1.99%) | | | | | | |
Media (1.34%) | | | | | | |
| 21st Century Fox America, Inc. | | | | | | |
| 6.900% 03/01/2019 | | $ | 460,000 | | | $ | 499,619 | |
| Comcast Cable Communications Holdings, Inc. | | | | | | | | |
| 9.455% 11/15/2022 | | | 307,000 | | | | 413,983 | |
| Comcast Corp. | | | | | | | | |
| 5.150% 03/01/2020 | | | 715,000 | | | | 779,691 | |
| Viacom, Inc. | | | | | | | | |
| 3.125% 06/15/2022 | | | 445,000 | | | | 445,284 | |
| | | | | | | | 2,138,577 | |
Telecommunications (0.65%) | | | | | | | | |
| AT&T, Inc. | | | | | | | | |
| 4.450% 04/01/2024 | | | 502,000 | | | | 529,123 | |
| AT&T, Inc. | | | | | | | | |
| 5.500% 02/01/2018 | | | 7,000 | | | | 7,198 | |
| Verizon Communications, Inc. | | | | | | | | |
| 5.150% 09/15/2023 | | | 455,000 | | | | 503,261 | |
| | | | | | | | 1,039,582 | |
| | | | | | | | | |
| TOTAL COMMUNICATIONS | | | | | | | 3,178,159 | |
| | | | | | | | | |
| CONSUMER, CYCLICAL (1.86%) | | | | | | | | |
Airlines (0.32%) | | | | | | | | |
| Southwest Airlines Co. | | | | | | | | |
| 3.000% 11/15/2026 | | | 525,000 | | | | 502,458 | |
| | | | | | | | | |
Auto Manufacturers (0.32%) | | | | | | | | |
| Ford Motor Company | | | | | | | | |
| 4.346% 12/08/2026 | | | 500,000 | | | | 513,195 | |
| | | | | | | | | |
Retail (1.22%) | | | | | | | | |
| Advance Auto Parts, Inc. | | | | | | | | |
| 5.750% 05/01/2020 | | | 388,000 | | | | 421,486 | |
| CVS Health Corp. | | | | | | | | |
| 5.000% 12/01/2024 | | | 450,000 | | | | 496,540 | |
| McDonald's Corp. | | | | | | | | |
| 6.300% 03/01/2038 | | | 410,000 | | | | 524,782 | |
| Wal‐Mart Stores, Inc. | | | | | | | | |
| 6.200% 04/15/2038 | | | 388,000 | | | | 510,917 | |
| | | | | | | | 1,953,725 | |
| | | | | | | | | |
| TOTAL CONSUMER, CYCLICAL | | | | | | | 2,969,378 | |
| 10 | 1-855-DGI-FUND (344-3863) | www.DGIfund.com |
| The Disciplined Growth Investors Fund | Portfolio of Investments |
April 30, 2017
| | | Principal
Amount | | | Value
(Note 2) | |
| CONSUMER, NON‐CYCLICAL (0.31%) | | | | | | |
Pharmaceuticals (0.31%) | | | | | | |
| AbbVie, Inc. | | | | | | |
| 2.500% 05/14/2020 | | $ | 500,000 | | | $ | 504,739 | |
| | | | | | | | | |
| TOTAL CONSUMER, NON‐CYCLICAL | | | | | | | 504,739 | |
| | | | | | | | | |
| CONSUMER, NON‐CYCLICAL (1.18%) | | | | | | | | |
Beverages (0.32%) | | | | | | | | |
| Anheuser‐Busch InBev Worldwide, Inc. | | | | | | | | |
| 2.500% 07/15/2022 | | | 510,000 | | | | 509,073 | |
| | | | | | | | | |
Commercial Services (0.27%) | | | | | | | | |
| Total System Services, Inc. | | | | | | | | |
| 2.375% 06/01/2018 | | | 431,000 | | | | 432,737 | |
| | | | | | | | | |
Healthcare‐Services (0.27%) | | | | | | | | |
| UnitedHealth Group, Inc. | | | | | | | | |
| 3.350% 07/15/2022 | | | 406,000 | | | | 423,762 | |
| | | | | | | | | |
Pharmaceuticals (0.32%) | | | | | | | | |
| Johnson & Johnson | | | | | | | | |
| 5.850% 07/15/2038 | | | 390,000 | | | | 515,754 | |
| | | | | | | | | |
| TOTAL CONSUMER, NON‐CYCLICAL | | | | | | | 1,881,326 | |
| | | | | | | | | |
| ENERGY (2.16%) | | | | | | | | |
Oil & Gas (0.33%) | | | | | | | | |
| Conoco Funding Co. | | | | | | | | |
| 7.250% 10/15/2031 | | | 386,000 | | | | 519,777 | |
| | | | | | | | | |
Pipelines (1.83%) | | | | | | | | |
| Boardwalk Pipelines LP | | | | | | | | |
| 3.375% 02/01/2023 | | | 520,000 | | | | 514,916 | |
| Enbridge Energy Partners LP | | | | | | | | |
| 4.200% 09/15/2021 | | | 430,000 | | | | 450,826 | |
| Enterprise Products Operating LLC | | | | | | | | |
| 3.350% 03/15/2023 | | | 495,000 | | | | 507,610 | |
| MarkWest Energy Partners LP / MarkWest Energy Finance Corp. | | | | | | | | |
| 4.500% 07/15/2023 | | | 448,000 | | | | 440,188 | |
| Annual Report | April 30, 2017 | 11 |
| The Disciplined Growth Investors Fund | Portfolio of Investments |
April 30, 2017
| | | Principal
Amount | | | Value
(Note 2) | |
| Pipelines (continued) | | | | | | |
| ONEOK Partners LP | | | | | | |
| 3.375% 10/01/2022 | | $ | 500,000 | | | $ | 504,910 | |
| TransCanada PipeLines Ltd. | | | | | | | | |
| 7.250% 08/15/2038 | | | 369,000 | | | | 506,940 | |
| | | | | | | | 2,925,390 | |
| | | | | | | | | |
| TOTAL ENERGY | | | | | | | 3,445,167 | |
| | | | | | | | | |
| FINANCIAL (3.65%) | | | | | | | | |
Banks (1.90%) | | | | | | | | |
| Bank of America Corp. | | | | | | | | |
| 5.625% 07/01/2020 | | | 459,000 | | | | 504,525 | |
| JPMorgan Chase & Co. | | | | | | | | |
| 3.375% 05/01/2023 | | | 495,000 | | | | 499,042 | |
| Northern Trust Corp. | | | | | | | | |
| 3.950% 10/30/2025 | | | 480,000 | | | | 509,491 | |
| Royal Bank of Scotland Group PLC, Series 1 | | | | | | | | |
9.118% Perpetual Maturity (d) | | | 3,000 | | | | 3,072 | |
| US Bancorp | | | | | | | | |
| 2.950% 07/15/2022 | | | 500,000 | | | | 507,759 | |
| Wachovia Corp. | | | | | | | | |
| 5.750% 06/15/2017 | | | 500,000 | | | | 502,569 | |
| Wells Fargo & Co., Series M | | | | | | | | |
| 3.450% 02/13/2023 | | | 500,000 | | | | 509,618 | |
| | | | | | | | 3,036,076 | |
Diversified Financial Services (0.86%) | | | | | | | | |
| American Express Co. | | | | | | | | |
| 7.000% 03/19/2018 | | | 414,000 | | | | 433,343 | |
| General Electric Capital Corp. | | | | | | | | |
| 5.875% 01/14/2038 | | | 396,000 | | | | 507,649 | |
| National Rural Utilities Cooperative Finance Corp. | | | | | | | | |
| 10.375% 11/01/2018 | | | 381,000 | | | | 429,403 | |
| | | | | | | | 1,370,395 | |
Insurance (0.57%) | | | | | | | | |
| American International Group, Inc. | | | | | | | | |
| 3.750% 07/10/2025 | | | 500,000 | | | | 506,132 | |
| MetLife, Inc., Series A | | | | | | | | |
| 6.817% 08/15/2018 | | | 383,000 | | | | 407,897 | |
| | | | | | | | 914,029 | |
| 12 | 1-855-DGI-FUND (344-3863) | www.DGIfund.com |
| The Disciplined Growth Investors Fund | Portfolio of Investments |
| | | Principal Amount | | | Value (Note 2) | |
Real Estate Investment Trusts (0.32%) | | | | | | |
| Welltower, Inc. | | | | | | |
| 3.750% 03/15/2023 | | $ | 490,000 | | | $ | 505,479 | |
| | | | | | | | | |
| TOTAL FINANCIAL | | | | | | | 5,825,979 | |
| | | | | | | | | |
| GOVERNMENT (0.24%) | | | | | | | | |
Multi‐National (0.24%) | | | | | | | | |
| Corporacion Andina de Fomento | | | | | | | | |
| 8.125% 06/04/2019 | | | 343,000 | | | | 384,325 | |
| | | | | | | | | |
| TOTAL GOVERNMENT | | | | | | | 384,325 | |
| | | | | | | | | |
| INDUSTRIAL (2.42%) | | | | | | | | |
Aerospace/Defense (0.32%) | | | | | | | | |
| Rockwell Collins, Inc. | | | | | | | | |
| 3.700% 12/15/2023 | | | 488,000 | | | | 507,685 | |
| | | | | | | | | |
Electrical Components & Equipment (0.31%) | | | | | | | | |
| Emerson Electric Co. | | | | | | | | |
| 5.000% 04/15/2019 | | | 465,000 | | | | 493,208 | |
| | | | | | | | | |
Electronics (0.31%) | | | | | | | | |
| Corning, Inc. | | | | | | | | |
| 6.625% 05/15/2019 | | | 457,000 | | | | 498,659 | |
| | | | | | | | | |
Engineering & Construction (0.27%) | | | | | | | | |
| Fluor Corp. | | | | | | | | |
| 3.375% 09/15/2021 | | | 416,000 | | | | 433,198 | |
| | | | | | | | | |
Environmental Control (0.31%) | | | | | | | | |
| Republic Services, Inc. | | | | | | | | |
| 5.500% 09/15/2019 | | | 455,000 | | | | 491,416 | |
| | | | | | | | | |
Miscellaneous Manufacturing (0.26%) | | | | | | | | |
| Tyco Electronics Group SA | | | | | | | | |
| 3.500% 02/03/2022 | | | 409,000 | | | | 422,940 | |
| | | | | | | | | |
Transportation (0.64%) | | | | | | | | |
| Burlington Northern Santa Fe LLC | | | | | | | | |
| 3.000% 03/15/2023 | | | 490,000 | | | | 500,381 | |
| Annual Report | April 30, 2017 | 13 |
| The Disciplined Growth Investors Fund | Portfolio of Investments |
| | | Principal Amount | | | Value (Note 2) | |
| Transportation (continued) | | | | | | |
| United Parcel Service, Inc. | | | | | | |
| 6.200% 01/15/2038 | | $ | 389,000 | | | $ | 514,395 | |
| | | | | | | | 1,014,776 | |
| | | | | | | | | |
| TOTAL INDUSTRIAL | | | | | | | 3,861,882 | |
| | | | | | | | | |
| UTILITIES (5.45%) | | | | | | | | |
Electric (4.94%) | | | | | | | | |
| Ameren Illinois Co. | | | | | | | | |
| 9.750% 11/15/2018 | | | 370,000 | | | | 413,971 | |
| Arizona Public Service Co. | | | | | | | | |
| 8.750% 03/01/2019 | | | 370,000 | | | | 415,773 | |
| CMS Energy Corp. | | | | | | | | |
| 5.050% 03/15/2022 | | | 367,000 | | | | 404,664 | |
| Commonwealth Edison Co. | | | | | | | | |
| 4.000% 08/01/2020 | | | 353,000 | | | | 372,817 | |
| Consolidated Edison Co. of New York, Inc. | | | | | | | | |
| 7.125% 12/01/2018 | | | 459,000 | | | | 496,961 | |
| Duke Energy Corp. | | | | | | | | |
| 1.800% 09/01/2021 | | | 465,000 | | | | 452,448 | |
| Edison International | | | | | | | | |
| 3.750% 09/15/2017 | | | 413,000 | | | | 416,475 | |
| Interstate Power & Light Co. | | | | | | | | |
| 3.650% 09/01/2020 | | | 370,000 | | | | 385,281 | |
| ITC Holdings Corp. | | | | | | | | |
| 4.050% 07/01/2023 | | | 485,000 | | | | 506,419 | |
| Jersey Central Power & Light Co. | | | | | | | | |
| 7.350% 02/01/2019 | | | 469,000 | | | | 509,194 | |
| Nevada Power Co. | | | | | | | | |
| 7.125% 03/15/2019 | | | 316,000 | | | | 347,130 | |
| Oncor Electric Delivery Co. LLC | | | | | | | | |
| 7.000% 09/01/2022 | | | 416,000 | | | | 504,472 | |
| PacifiCorp | | | | | | | | |
| 5.650% 07/15/2018 | | | 17,000 | | | | 17,802 | |
| PPL Capital Funding, Inc. | | | | | | | | |
| 3.500% 12/01/2022 | | | 549,000 | | | | 568,251 | |
| PSEG Power LLC | | | | | | | | |
| 5.125% 04/15/2020 | | | 387,000 | | | | 417,105 | |
| Puget Energy, Inc. | | | | | | | | |
| 5.625% 07/15/2022 | | | 362,000 | | | | 402,915 | |
| Southern Power Co., Series 15B | | | | | | | | |
| 2.375% 06/01/2020 | | | 505,000 | | | | 507,321 | |
| TECO Finance, Inc. | | | | | | | | |
| 6.572% 11/01/2017 | | | 338,000 | | | | 345,858 | |
| 14 | 1-855-DGI-FUND (344-3863) | www.DGIfund.com |
| The Disciplined Growth Investors Fund | Portfolio of Investments |
| | | Principal Amount | | | Value (Note 2) | |
| Electric (continued) | | | | | | |
| Wisconsin Electric Power Co. | | | | | | |
| 2.950% 09/15/2021 | | $ | 408,000 | | | $ | 418,731 | |
| | | | | | | | 7,903,588 | |
Gas (0.51%) | | | | | | | | |
| CenterPoint Energy Resources Corp. | | | | | | | | |
| 4.500% 01/15/2021 | | | 305,000 | | | | 322,137 | |
| Sempra Energy | | | | | | | | |
| 2.875% 10/01/2022 | | | 489,000 | | | | 491,366 | |
| | | | | | | | 813,503 | |
| | | | | | | | | |
| TOTAL UTILITIES | | | | | | | 8,717,091 | |
| | | | | | | | | |
TOTAL CORPORATE BONDS (Cost $30,923,380) | | | | | | | 31,183,335 | |
| | | | | | | | | |
| FOREIGN GOVERNMENT BONDS (0.25%) | | | | | | | | |
| Province of Quebec Canada, Series NN | | | | | | | | |
| 7.125% 02/09/2024 | | | 320,000 | | | | 401,812 | |
| | | | | | | | | |
| TOTAL FOREIGN GOVERNMENT BONDS (Cost $400,968) | | | | | | | 401,812 | |
| | | | | | | | | |
| GOVERNMENT & AGENCY OBLIGATIONS (0.37%) | | | | | | | | |
| U.S. Treasury Bonds | | | | | | | | |
| 1.500% 08/15/2026 | | | 534,000 | | | | 499,478 | |
| U.S. Treasury Bonds | | | | | | | | |
| 6.500% 11/15/2026 | | | 62,000 | | | | 84,548 | |
| | | | | | | | | |
| TOTAL GOVERNMENT & AGENCY OBLIGATIONS (Cost $577,242) | | | | | | | 584,026 | |
| | | Yield | | | Shares | | | Value (Note 2) | |
| SHORT TERM INVESTMENTS (9.78%) | | | | | | | | | |
| MONEY MARKET FUND (1.69%) | | | | | | | | | |
| Fidelity Institutional Money Market | | | | | | | | | |
| Government Portfolio ‐ Class I | | | 0.60 | %(e) | | | 2,699,083 | | | | 2,699,083 | |
| Annual Report | April 30, 2017 | 15 |
| The Disciplined Growth Investors Fund | Portfolio of Investments |
| | | Yield | | | Shares | | | (Note 2) | |
| SHORT TERM INVESTMENTS (continued) | | | | | | | | | |
| MONEY MARKET FUND (continued) | | | | | | | | | |
| U.S. TREASURY BILLS (8.09%) | | | | | | | | | |
| U.S. Treasury Bill, 07/20/2017 | | | 0.22 | %(f) | | | 1,000,000 | | | $ | 998,314 | |
| U.S. Treasury Bill, 09/14/2017 | | | 0.11 | %(f) | | | 5,990,000 | | | | 5,970,736 | |
| U.S. Treasury Bill, 12/07/2017 | | | 0.58 | %(f) | | | 6,000,000 | | | | 5,965,578 | |
| | | | | | | | | | | | 12,934,628 | |
| | | | | | | | | | | | | |
| TOTAL SHORT TERM INVESTMENTS (Cost $15,645,173) | | | | | | | | | | | 15,633,711 | |
| | | | | | | | | | | | | |
TOTAL INVESTMENTS (99.78%) (Cost $120,570,997) | | | | | | | | | | $ | 159,417,569 | |
| | | | | | | | | | | | | |
| Other Assets In Excess Of Liabilities (0.22%) | | | | | | | | | | | 356,563 | |
| | | | | | | | | | | | | |
| NET ASSETS (100.00%) | | | | | | | | | | $ | 159,774,132 | |
(a) | Non-Income Producing Security. |
(b) | Restricted security; these securities may only be resold in transactions exempt from registration under the Securities Act of 1933. |
(d) | This security has no contractual maturity date, is not redeemable and contractually pays an indefinite stream of interest. |
(e) | Represents the 7-day yield. |
(f) | Rate shown represents the bond equivalent yield to maturity at date of purchase. |
For Fund compliance purposes, the Fund's industry classifications refer to any one or more of the industry sub-classifications used by one or more widely recognized market indexes or ratings group indexes, and/or as defined by Fund management. This definition may not apply for purposes of this report, which may combine industry sub-classifications for reporting ease. Industries are shown as a percent of net assets.
See Notes to Financial Statements.
| 16 | 1-855-DGI-FUND (344-3863) | www.DGIfund.com |
| The Disciplined Growth Investors Fund | Statement of Assets and Liabilities |
| ASSETS | | | |
| Investments, at value | | $ | 159,417,569 | |
| Cash | | | 9,480 | |
| Receivable for investments sold | | | 571,304 | |
| Receivable for shares sold | | | 15,576 | |
| Dividends and interest receivable | | | 391,114 | |
| Total assets | | | 160,405,043 | |
| | | | | |
| LIABILITIES | | | | |
| Payable for investments purchased | | | 510,790 | |
| Payable for shares redeemed | | | 19,750 | |
| Payable to adviser | | | 100,371 | |
| Total liabilities | | | 630,911 | |
| NET ASSETS | | $ | 159,774,132 | |
| | | | | |
| NET ASSETS CONSIST OF | | | | |
| Paid‐in capital (Note 5) | | $ | 118,990,542 | |
| Accumulated net investment income | | | 30,658 | |
| Accumulated net realized gain | | | 1,906,360 | |
| Net unrealized appreciation | | | 38,846,572 | |
| NET ASSETS | | $ | 159,774,132 | |
| | | | | |
| INVESTMENTS, AT COST | | $ | 120,570,997 | |
| | | | | |
| PRICING OF SHARES | | | | |
| Net Asset Value, offering and redemption price per share | | $ | 18.20 | |
| Shares of beneficial interest outstanding | | | 8,777,191 | |
See Notes to Financial Statements.
| Annual Report | April 30, 2017 | 17 |
| The Disciplined Growth Investors Fund | Statement of Operations |
| | | For the Year Ended April 30, 2017 | |
| INVESTMENT INCOME | | | |
| Dividends | | $ | 926,154 | |
| Foreign taxes withheld | | | (12,799 | ) |
| Interest | | | 875,209 | |
| Total investment income | | | 1,788,564 | |
| | | | | |
| EXPENSES | | | | |
| Investment advisory fees (Note 6) | | | 1,086,455 | |
| Total expenses | | | 1,086,455 | |
| NET INVESTMENT INCOME | | | 702,109 | |
| | | | | |
| REALIZED AND UNREALIZED GAIN ON INVESTMENTS | | | | |
| Net realized gain on investments | | | 3,378,091 | |
| Net change in unrealized appreciation on investments | | | 15,325,356 | |
| NET REALIZED AND UNREALIZED GAIN ON INVESTMENTS | | | 18,703,447 | |
| NET INCREASE IN NET ASSETS RESULTING FROM OPERATIONS | | $ | 19,405,556 | |
See Notes to Financial Statements.
| 18 | 1-855-DGI-FUND (344-3863) | www.DGIfund.com |
| The Disciplined Growth Investors Fund | Statements of Changes in Net Assets |
| | | For the Year Ended April 30, 2017 | | | For the Year Ended April 30, 2016 | |
| OPERATIONS | | | | | | |
| Net investment income | | $ | 702,109 | | | $ | 671,062 | |
| Net realized gain/(loss) | | | 3,378,091 | | | | (1,044,969 | ) |
| Net change in unrealized appreciation/(depreciation) | | | 15,325,356 | | | | (1,940,103 | ) |
| Net increase/(decrease) in net assets resulting from operations | | | 19,405,556 | | | | (2,314,010 | ) |
| | | | | | | | | |
| DISTRIBUTIONS (Note 3) | | | | | | | | |
| From net investment income | | | (707,562 | ) | | | (709,053 | ) |
| From net realized gains on investments | | | (415,680 | ) | | | (2,457,710 | ) |
| Net decrease in net assets from distributions | | | (1,123,242 | ) | | | (3,166,763 | ) |
| | | | | | | | | |
| CAPITAL SHARE TRANSACTIONS (Note 5) | | | | | | | | |
| Proceeds from sales of shares | | | 40,314,153 | | | | 22,263,652 | |
| Issued to shareholders in reinvestment of distributions | | | 1,115,854 | | | | 3,149,642 | |
| Cost of shares redeemed, net of redemption fees | | | (19,795,072 | ) | | | (13,417,959 | ) |
| Net increase from capital share transactions | | | 21,634,935 | | | | 11,995,335 | |
| | | | | | | | | |
| Net increase in net assets | | | 39,917,249 | | | | 6,514,562 | |
| | | | | | | | | |
| NET ASSETS | | | | | | | | |
| Beginning of period | | | 119,856,883 | | | | 113,342,321 | |
| End of period* | | $ | 159,774,132 | | | $ | 119,856,883 | |
| | | | | | | | | |
| *Including accumulated net investment income of: | | $ | 30,658 | | | $ | 31,619 | |
| | | | | | | | | |
| OTHER INFORMATION | | | | | | | | |
| Share Transactions | | | | | | | | |
| Issued | | | 2,352,037 | | | | 1,367,464 | |
| Issued to shareholders in reinvestment of distributions | | | 64,640 | | | | 202,387 | |
| Redeemed | | | (1,149,715 | ) | | | (825,064 | ) |
| Net increase in share transactions | | | 1,266,962 | | | | 744,787 | |
See Notes to Financial Statements.
| Annual Report | April 30, 2017 | 19 |
| The Disciplined Growth Investors Fund |
| |
| NET ASSET VALUE, BEGINNING OF PERIOD |
| INCOME FROM OPERATIONS |
Net investment income(a) |
| Net realized and unrealized gain/(loss) on investments |
| Total from investment operations |
| DISTRIBUTIONS |
| From net investment income |
| From net realized gain on investments |
| Total distributions |
|
| REDEMPTION FEES ADDED TO PAID‐IN CAPITAL |
| INCREASE/(DECREASE) IN NET ASSET VALUE |
| NET ASSET VALUE, END OF PERIOD |
| |
| TOTAL RETURN |
| RATIOS AND SUPPLEMENTAL DATA |
| Net assets, end of period (000's) |
| RATIOS TO AVERAGE NET ASSETS |
| Expenses |
| Net investment income |
| |
| PORTFOLIO TURNOVER RATE |
(a) | Per share numbers have been calculated using the average shares method. |
See Notes to Financial Statements.
| 20 | 1-855-DGI-FUND (344-3863) | www.DGIfund.com |
| For a share outstanding during the periods presented |
For the Year Ended April 30, 2017 | | | For the Year Ended April 30, 2016 | | | For the Year Ended April 30, 2015 | | | For the Year Ended April 30, 2014 | | | For the Year Ended April 30, 2013 | |
| $ | 15.96 | | | $ | 16.75 | | | $ | 15.02 | | | $ | 13.17 | | | $ | 12.13 | |
| | | | | | | | | | | | | | | | | | | |
| | 0.09 | | | | 0.09 | | | | 0.10 | | | | 0.07 | | | | 0.11 | |
| | 2.29 | | | | (0.44 | ) | | | 1.83 | | | | 1.90 | | | | 1.09 | |
| | 2.38 | | | | (0.35 | ) | | | 1.93 | | | | 1.97 | | | | 1.20 | |
| | | | | | | | | | | | | | | | | | | |
| | (0.09 | ) | | | (0.10 | ) | | | (0.09 | ) | | | (0.07 | ) | | | (0.11 | ) |
| | (0.05 | ) | | | (0.34 | ) | | | (0.11 | ) | | | (0.05 | ) | | | (0.05 | ) |
| | (0.14 | ) | | | (0.44 | ) | | | (0.20 | ) | | | (0.12 | ) | | | (0.16 | ) |
| | | | | | | | | | | | | | | | | | | |
| | – | | | | – | | | | – | | | | – | | | | – | |
| | 2.24 | | | | (0.79 | ) | | | 1.73 | | | | 1.85 | | | | 1.04 | |
| $ | 18.20 | | | $ | 15.96 | | | $ | 16.75 | | | $ | 15.02 | | | $ | 13.17 | |
| | | | | | | | | | | | | | | | | | | |
| | 14.96 | % | | | (2.05 | %) | | | 12.87 | % | | | 15.02 | % | | | 9.93 | % |
| | | | | | | | | | | | | | | | | | | |
| $ | 159,774 | | | $ | 119,857 | | | $ | 113,342 | | | $ | 86,741 | | | $ | 66,967 | |
| | | | | | | | | | | | | | | | | | | |
| | 0.78 | % | | | 0.78 | % | | | 0.78 | % | | | 0.78 | % | | | 0.78 | % |
| | 0.50 | % | | | 0.59 | % | | | 0.61 | % | | | 0.47 | % | | | 0.90 | % |
| | | | | | | | | | | | | | | | | | | |
| | 16 | % | | | 13 | % | | | 14 | % | | | 10 | % | | | 10 | % |
| Annual Report | April 30, 2017 | 21 |
| The Disciplined Growth Investors Fund | Notes to Financial Statements |
April 30, 2017
1. ORGANIZATION
Financial Investors Trust (the “Trust”), a Delaware statutory trust, is an open‐end management investment company registered under the Investment Company Act of 1940, as amended (“1940 Act”). The Trust consists of multiple separate portfolios or series. This annual report describes The Disciplined Growth Investors Fund (the “Fund”). The Fund seeks long‐term capital growth and as a secondary objective, modest income with reasonable risk.
2. SIGNIFICANT ACCOUNTING POLICIES
The accompanying financial statements were prepared in accordance with accounting principles generally accepted in the United States of America (“U.S. GAAP”). The preparation of financial statements in conformity with U.S. GAAP requires management to make certain estimates and assumptions that affect the reported amounts of assets and liabilities and disclosures of contingent assets and liabilities at the date of the financial statements and the reported amounts of revenue and expenses during the period. Actual results could differ from those estimates. The Fund is considered an investment company for financial reporting purposes under U.S. GAAP. The following is a summary of significant accounting policies consistently followed by the Fund in preparation of its financial statements.
Investment Valuation: The Fund generally values its securities based on market prices determined at the close of regular trading on the New York Stock Exchange (“NYSE”), normally 4:00 p.m. Eastern Time, on each day the NYSE is open for trading.
For equity securities and mutual funds that are traded on an exchange, the market price is usually the closing sale or official closing price on that exchange. In the case of equity securities not traded on an exchange, or if such closing prices are not otherwise available, the securities are valued at the mean of the most recent bid and ask prices on such day. Redeemable securities issued by open‐end registered investment companies are valued at the investment company’s applicable net asset value, with the exception of exchange‐traded open‐end investment companies, which are priced as equity securities.
The market price for debt obligations is generally the price supplied by an independent third‐party pricing service approved by the Board of Trustees (the “Board”), which may use a matrix, formula or other objective method that takes into consideration quotations from dealers, market transactions in comparable investments, market indices and yield curves. If vendors are unable to supply a price, or if the price supplied is deemed to be unreliable, the market price may be determined using quotations received from one or more broker–dealers that make a market in the security. Fixed‐income obligations, excluding municipal securities, having a remaining maturity of greater than 60 days, are typically valued at the mean between the evaluated bid and ask prices formulated by an independent pricing service. Corporate Bonds, U.S. Government & Agency, and U.S. Treasury Bonds & Notes are valued using market models that consider trade data, quotations from dealers and active market makers, relevant yield curve and spread data, creditworthiness, trade data or market information on comparable securities, and other relevant security specific information. Mortgage‐related and asset‐backed securities are valued based on models that consider trade data, prepayment and default projections, benchmark yield and spread data and estimated cash flows of each tranche of the issuer. Publicly traded foreign government debt securities are typically traded internationally in the over‐the‐counter market and are valued at the mean between the bid and asked prices as of the close of business of that market.
| 22 | 1-855-DGI-FUND (344-3863) | www.DGIfund.com |
| The Disciplined Growth Investors Fund | Notes to Financial Statements |
When such prices or quotations are not available, or when Disciplined Growth Investors, Inc. (the “Adviser”) believes that they are unreliable, securities may be priced using fair value procedures approved by the Board.
Fair Value Measurements: The Fund discloses the classification of its fair value measurements following a three‐tier hierarchy based on the inputs used to measure fair value. Inputs refer broadly to the assumptions that market participants would use in pricing the asset or liability, including assumptions about risk. Inputs may be observable or unobservable. Observable inputs reflect the assumptions market participants would use in pricing the asset or liability that are developed based on market data obtained from sources independent of the reporting entity. Unobservable inputs reflect the reporting entity’s own assumptions about the assumptions market participants would use in pricing the asset or liability that are developed based on the best information available.
Various inputs are used in determining the value of the Fund’s investments as of the end of the reporting period. When inputs used fall into different levels of the fair value hierarchy, the level in the hierarchy within which the fair value measurement falls is determined based on the lowest level input that is significant to the fair value measurement in its entirety. The designated input levels are not necessarily an indication of the risk or liquidity associated with these investments. These inputs are categorized in the following hierarchy under applicable financial accounting standards:
| Level 1 | – | Unadjusted quoted prices in active markets for identical investments, unrestricted assets or liabilities that the Fund has the ability to access at the measurement date; |
| | | |
| Level 2 | – | Quoted prices which are not active, quoted prices for similar assets or liabilities in active markets or inputs other than quoted prices that are observable (either directly or indirectly) for substantially the full term of the asset or liability; and |
| | | |
| Level 3 | – | Significant unobservable prices or inputs (including the Fund’s own assumptions in determining the fair value of investments) where there is little or no market activity for the asset or liability at the measurement date. |
| Annual Report | April 30, 2017 | 23 |
| The Disciplined Growth Investors Fund | Notes to Financial Statements |
The following is a summary of each input used to value the Fund as of April 30, 2017:
| Investments in Securities at Value | | Level 1 - Unadjusted Quoted Prices | | | Level 2 - Other Significant Observable Inputs | | | Level 3 - Significant Unobservable Inputs | | | Total | |
| Common Stocks | | | | | | | | | | | | |
| Communications | | $ | 1,055,610 | | | $ | – | | | $ | – | | | $ | 1,055,610 | |
| Consumer Discretionary | | | 25,680,746 | | | | – | | | | – | | | | 25,680,746 | |
| Consumer, Cyclical | | | 1,192,515 | | | | – | | | | – | | | | 1,192,515 | |
| Consumer, Non‐cyclical | | | 1,248,545 | | | | – | | | | – | | | | 1,248,545 | |
| Energy | | | 3,990,688 | | | | – | | | | 193,667 | | | | 4,184,355 | |
| Financial Services | | | 3,740,738 | | | | – | | | | – | | | | 3,740,738 | |
| Health Care | | | 16,158,998 | | | | – | | | | – | | | | 16,158,998 | |
| Industrials | | | 1,400,700 | | | | – | | | | – | | | | 1,400,700 | |
| Producer Durables | | | 12,416,075 | | | | – | | | | – | | | | 12,416,075 | |
| Technology | | | 44,526,734 | | | | – | | | | – | | | | 44,526,734 | |
| Asset/Mortgage Backed Securities | | | – | | | | 9,669 | | | | – | | | | 9,669 | |
| Corporate Bonds | | | – | | | | 31,183,335 | | | | – | | | | 31,183,335 | |
| Foreign Government Bonds | | | – | | | | 401,812 | | | | – | | | | 401,812 | |
| Government & Agency Obligations | | | – | | | | 584,026 | | | | – | | | | 584,026 | |
| Short Term Investments | | | | | | | | | | | | | | | | |
| Money Market Fund | | | 2,699,083 | | | | – | | | | – | | | | 2,699,083 | |
| U.S. Treasury Bills | | | – | | | | 12,934,628 | | | | – | | | | 12,934,628 | |
| TOTAL | | $ | 114,110,432 | | | $ | 45,113,470 | | | $ | 193,667 | | | $ | 159,417,569 | |
The Fund recognizes transfers between levels as of the end of the period. For the year ended April 30, 2017, the Fund did not have any transfers between Level 1 and Level 2 securities.
The following is a reconciliation of the investments in which significant unobservable inputs (Level 3) were used in determining fair value:
Investments in Securities at Value | | Balance as of 4/30/2016 | | | Return of Capital | | | Realized gain/(loss) | | | Change in unrealized appreciation/ (depreciation) | | | Purchases | | | Sales Proceeds | | | Transfer in and/or (out) of Level 3 | | | 4/30/2017 | | | Net change in unrealized appreciation/ (depreciation)attributable to Level 3 investments held at 4/30/2017 | |
| Common | | | | | | | | | | | | | | | | | | | | | | | | | | | |
| Stock | | $ | – | | | $ | – | | | $ | – | | | $ | (72,433 | ) | | $ | 266,100 | | | $ | – | | | $ | – | | | $ | 193,667 | | | $ | (72,433 | ) |
| Total | | $ | – | | | $ | – | | | $ | – | | | $ | (72,433 | ) | | $ | 266,100 | | | $ | – | | | $ | – | | | $ | 193,667 | | | $ | (72,433 | ) |
Net change in unrealized appreciation/depreciation on Level 3 securities is included on the Statement of Operations under Net change in unrealized appreciation on investments.
| 24 | 1-855-DGI-FUND (344-3863) | www.DGIfund.com |
| The Disciplined Growth Investors Fund | Notes to Financial Statements |
Investment Transactions and Investment Income: Investment transactions are accounted for on the date the investments are purchased or sold (trade date). Realized gains and losses from investment transactions are reported on an identified cost basis, which is the same basis the Fund uses for federal income tax purposes. Interest income, which includes accretion of discounts, is accrued and recorded as earned. Dividend income is recognized on the ex‐dividend date or for certain foreign securities, as soon as information is available to the Fund.
Trust Expenses: Some expenses of the Trust can be directly attributed to the Fund. Expenses which cannot be directly attributed to the Fund are apportioned among all funds in the Trust based on average net assets of each fund.
Fund Expenses: Expenses that are specific to the Fund are charged directly to the Fund.
Federal Income Taxes: The Fund complies with the requirements under Subchapter M of the Internal Revenue Code of 1986, as amended, applicable to regulated investment companies and intends to distribute substantially all of their net taxable income and net capital gains, if any, each year so that it will not be subject to excise tax on undistributed income and gains. The Fund is not subject to income taxes to the extent such distributions are made.
As of and during the year ended April 30, 2017, the Fund did not have a liability for any unrecognized tax benefits. The Fund files U.S. federal, state, and local tax returns as required. The Fund’s tax returns are subject to examination by the relevant tax authorities until expiration of the applicable statute of limitations, which is generally three years after the filing of the tax return for federal purposes and four years for most state returns. Tax returns for open years have incorporated no uncertain tax positions that require a provision for income taxes.
Distributions to Shareholders: The Fund normally pays dividends, if any, quarterly and distributes capital gains, if any, on an annual basis. Income dividend distributions are derived from dividends and other income the Fund receives from its investments, including short term capital gains. Long term capital gain distributions are derived from gains realized when the Fund sells a security it has owned for more than a year. The Fund may make additional distributions and dividends at other times if the portfolio manager believes doing so may be necessary for the Fund to avoid or reduce taxes.
3. TAX BASIS INFORMATION
Reclassifications: As of April 30, 2017, permanent differences in book and tax accounting were reclassified. These differences had no effect on net assets and were primarily attributed to minor differences between book and tax characterizations of paydown transactions.
The reclassifications as of April 30, 2017 were as follows:
| Fund | | Paid-in Capital | | | Accumulated Net Investment Income | | | Accumulated Net Realized Gain/(Loss) on Investments | |
| The Disciplined Growth Investors Fund | | $ | – | | | $ | 4,492 | | | $ | (4,492 | ) |
| Annual Report | April 30, 2017 | 25 |
| The Disciplined Growth Investors Fund | Notes to Financial Statements |
Tax Basis of Investments: As of April 30, 2017, the aggregate cost of investments, gross unrealized appreciation/ (depreciation) and net unrealized appreciation for Federal tax purposes was as follows:
| | | The Disciplined Growth Investors Fund | |
| Gross appreciation (excess of value over tax cost) | | $ | 42,846,875 | |
| Gross depreciation (excess of tax cost over value) | | | (4,000,347 | ) |
| Net depreciation of foreign currency | | | (10 | ) |
| Net unrealized appreciation | | $ | 38,846,518 | |
| Cost of investments for income tax purposes | | $ | 120,571,051 | |
Components of Earnings: As of April 30, 2017, components of distributable earnings were as follows:
| Undistributed ordinary income | | $ | 67,983 | |
| Accumulated capital gains | | | 1,869,089 | |
| Net unrealized appreciation on investments | | | 38,846,518 | |
| Total | | $ | 40,783,590 | |
Capital Losses: Capital loss carryovers used during the period ended April 30, 2017 were $145,258.
Tax Basis of Distributions to Shareholders: The character of distributions made during the year from net investment income or net realized gains may differ from its ultimate characterization for federal income tax purposes. Also, due to the timing of dividend distributions, the fiscal year in which amounts are distributed may differ from the fiscal year in which the income or realized gain was recorded by the Fund.
The tax character of distributions paid during the year ended April 30, 2017, were as follows:
| | | Ordinary Income | | | Long-Term Capital Gain | |
| The Disciplined Growth Investors Fund | | $ | 833,014 | | | $ | 290,228 | |
The tax character of distributions paid during the year ended April 30, 2016, were as follows:
| | | Ordinary Income | | | Long-Term Capital Gain | |
| The Disciplined Growth Investors Fund | | $ | 921,941 | | | $ | 2,244,822 | |
| 26 | 1-855-DGI-FUND (344-3863) | www.DGIfund.com |
| The Disciplined Growth Investors Fund | Notes to Financial Statements |
4. SECURITIES TRANSACTIONS
During the year ended April 30, 2017, equity holdings, asset/mortgage backed securities, fixed income securities and U.S. Treasury Bonds were transferred in‐kind into the Fund. The intent of the transfers was to save on equity transaction costs both for the new shareholders at the institution they transferred from and for the Fund on the addition of assets. The assets of four separate accounts were transferred‐in‐kind into the Fund in the amount of $14,197,026.
The cost of purchases and proceeds from sales of securities (excluding short‐term securities, transfers‐in‐kind, and U.S. Government Obligations) during the year ended April 30, 2017, were as follows:
| Fund | | Purchases of Securities | | | Proceeds From Sales of Securities | |
| The Disciplined Growth Investors Fund | | $ | 33,687,134 | | | $ | 20,426,761 | |
Investment transactions in U.S. Government Obligations (excluding transfers‐in‐kind) during the year ended April 30, 2017 were as follows:
| Fund | | Purchases of Securities | | | Proceeds From Sales of Securities | |
| The Disciplined Growth Investors Fund | | $ | 563,402 | | | $ | 1,000 | |
5. SHARES OF BENEFICIAL INTEREST
The capitalization of the Trust consists of an unlimited number of shares of beneficial interest with no par value per share. Holders of the shares of the Fund of the Trust have one vote for each share held and a proportionate fraction of a vote for each fractional share. All shares issued and outstanding are fully paid and are transferable and redeemable at the option of the shareholder. Purchasers of the shares do not have any obligation to make payments to the Trust or its creditors (other than the purchase price for the shares or make contributions to the Trust or its creditors solely by reason of the purchasers’ ownership of the shares. Shares have no pre‐emptive rights.
Prior to September 1, 2015, shares redeemed within 90 days of purchase may have incurred a 2% short‐term redemption fee deducted from the redemption amount. Effective September 1, 2015, the Fund no longer imposes redemption fees. For the year ended April 30, 2016, the Fund did not receive any redemption fees.
6. MANAGEMENT AND RELATED‐PARTY TRANSACTIONS
The Adviser, subject to the authority of the Board, is responsible for the overall management and administration of the Fund’s business affairs. The Adviser manages the investments of the Fund in accordance with the Fund’s investment objective, policies and limitations and investment guidelines established jointly by the Adviser and the Trustees. Pursuant to the Advisory Agreement, the Fund pays the Adviser a unitary management fee for the services and facilities it provides payable on a monthly basis at the annual rate of 0.78% of the Fund’s average daily net assets. The management fee is paid on a monthly basis.
| Annual Report | April 30, 2017 | 27 |
| The Disciplined Growth Investors Fund | Notes to Financial Statements |
Out of the unitary management fee, the Adviser pays substantially all expenses of the Fund, including the cost of transfer agency, custody, fund administration, bookkeeping and pricing services, legal, audit and other services, except for interest expenses, brokerage expenses, taxes and extraordinary expenses not incurred in the ordinary course of the Fund’s business. Also included are Trustee fees which were $2,935 for the year ended April 30, 2017.
Fund Administrator Fees and Expenses
ALPS Fund Services, Inc. (“ALPS”) serves as administrator to the Fund. Pursuant to an Administration Agreement, ALPS provides operational services to the Fund including, but not limited to, fund accounting and fund administration and generally assists in the Fund’s operations. Officers of the Trust are employees of ALPS. The Fund’s administration fee is accrued on a daily basis and paid monthly. The Administrator is also reimbursed for certain out‐of‐pocket expenses. The administrative fee and out‐of‐pocket expenses are included in the unitary management fee paid to the Adviser.
Transfer Agent
ALPS serves as transfer, dividend paying and shareholder servicing agent for the Fund. ALPS receives an annual minimum fee, a fee based upon the number of shareholder accounts, and is also reimbursed for certain out‐of‐pocket expenses. The fee and out‐of‐pocket expenses are included in the unitary management fee paid to the Adviser.
Compliance Services
ALPS provides services that assist the Trust’s chief compliance officer in monitoring and testing the policies and procedures of the Trust in conjunction with requirements under Rule 38a‐1 under the 1940 Act and receives an annual base fee. ALPS is reimbursed for certain out‐of‐pocket expenses. The fee and out‐of‐pocket expenses are included in the unitary management fee paid to the Adviser.
Principal Financial Officer
ALPS receives an annual fee for providing principal financial officer services to the Fund. The fee is included in the unitary management fee paid to the Adviser.
Distributor
ALPS Distributors, Inc. (“ADI” or the “Distributor”) (an affiliate of ALPS) acts as the distributor of the Fund’s shares pursuant to a Distribution Agreement with the Trust. Shares are sold on a continuous basis by ADI as agent for the Fund, and ADI has agreed to use its best efforts to solicit orders for the sale of the Fund’s shares, although it is not obliged to sell any particular amount of shares. ADI is not entitled to any compensation for its services as Distributor. ADI is registered as a broker‐dealer with the Securities and Exchange Commission.
| 28 | 1-855-DGI-FUND (344-3863) | www.DGIfund.com |
| The Disciplined Growth Investors Fund | Notes to Financial Statements |
7. INDEMNIFICATIONS
Under the Trust’s organizational documents, its officers and Trustees are indemnified against certain liability arising out of the performance of their duties to the Trust. Additionally, in the normal course of business, the Trust enters into contracts with service providers that may contain general indemnification clauses, which may permit indemnification to the extent permissible under applicable law. The Trust’s maximum exposure under these arrangements is unknown, as this would involve future claims that may be made against the Trust that have not yet occurred.
8. RECENT ACCOUNTING PRONOUNCEMENT
On October 13, 2016, the SEC amended Regulation S‐X, which will require standardized, enhanced disclosure about derivatives in investment company financial statements, as well as other amendments. The compliance date for the amendments to Regulation S‐X is August 1, 2017. Management is currently evaluating the impact to the financial statements and disclosures.
| Annual Report | April 30, 2017 | 29 |
| The Disciplined Growth Investors Fund | Report of Independent Registered Public Accounting Firm |
To the Shareholders and Board of Trustees of Financial Investors Trust:
We have audited the accompanying statement of assets and liabilities, including the portfolio of investments, of The Disciplined Growth Investors Fund (the “Fund”), one of the portfolios constituting Financial Investors Trust, as of April 30, 2017, and the related statement of operations for the year then ended, the statements of changes in net assets for each of the two years in the period then ended, and the financial highlights for each of the five years in the period then ended. These financial statements and financial highlights are the responsibility of the Fund's management. Our responsibility is to express an opinion on these financial statements and financial highlights based on our audits.
We conducted our audits in accordance with the standards of the Public Company Accounting Oversight Board (United States). Those standards require that we plan and perform the audit to obtain reasonable assurance about whether the financial statements and financial highlights are free of material misstatement. The Fund is not required to have, nor were we engaged to perform, an audit of its internal control over financial reporting. Our audits included consideration of internal control over financial reporting as a basis for designing audit procedures that are appropriate in the circumstances, but not for the purpose of expressing an opinion on the effectiveness of the Fund’s internal control over financial reporting. Accordingly, we express no such opinion. An audit also includes examining, on a test basis, evidence supporting the amounts and disclosures in the financial statements, assessing the accounting principles used and significant estimates made by management, as well as evaluating the overall financial statement presentation. Our procedures included confirmation of securities owned as of April 30, 2017, by correspondence with the custodian and brokers; when replies were not received from brokers, we performed other auditing procedures. We believe that our audits provide a reasonable basis for our opinion.
In our opinion, the financial statements and financial highlights referred to above present fairly, in all material respects, the financial position of The Disciplined Growth Investors Fund of Financial Investors Trust as of April 30, 2017, the results of its operations for the year then ended, the changes in its net assets for each of the two years in the period then ended, and the financial highlights for each of the five years in the period then ended, in conformity with accounting principles generally accepted in the United States of America.
DELOITTE & TOUCHE LLP
Denver, Colorado
June 27, 2017
| 30 | 1-855-DGI-FUND (344-3863) | www.DGIfund.com |
| The Disciplined Growth Investors Fund | Additional Information |
| | April 30, 2017 (Unaudited) |
1. FUND HOLDINGS
The Fund files its complete schedule of portfolio holdings with the Securities and Exchange Commission (the “SEC”) for the first and third quarters of each fiscal year on Form N-Q within 60 days after the end of the period. Copies of the Fund’s Form N-Q are available without charge on the SEC website at http://www.sec.gov. You may also review and copy the Form N-Q at the SEC’s Public Reference Room in Washington, DC. For more information about the operation of the Public Reference Room, please call the SEC at 1- 800-SEC-0330.
2. FUND PROXY VOTING POLICIES, PROCEDURES AND SUMMARIES
The Fund’s policies and procedures used in determining how to vote proxies and information regarding how the Fund voted proxies relating to portfolio securities during the most recent prior 12-month period ending June 30 are available without charge, (1) upon request, by calling (toll‐free) 855‐DGI‐Fund and (2) on the SEC’s website at http://www.sec.gov.
3. TAX DESIGNATIONS
The Fund designates the following for federal income tax purposes for distributions made during the calendar year ended December 31, 2016:
| Dividend Received Deduction | 66.94% |
| Qualified Dividend Income | 100.00% |
Pursuant to Section 852(b)(3) of the Internal Revenue Code, the Disciplined Growth Investors Fund designated $290,228 as long‐term capital gain dividends.
In early 2017, if applicable, shareholders of record received this information for the distributions paid to them by the Fund during the calendar year 2016 via Form 1099. The Fund will notify shareholders in early 2018 of amounts paid to them by the Fund, if any, during the calendar year 2017.
| Annual Report | April 30, 2017 | 31 |
| The Disciplined Growth Investors Fund | Trustees and Officers |
April 30, 2017 (Unaudited)
Additional information regarding the Fund’s trustees is included in the Statement of Additional Information, which can be obtained without charge by calling 855‐344‐3863.
INDEPENDENT TRUSTEES
Name, Address* & Year of Birth | Position(s) Held with Fund | Term of Office** and Length of Time Served | Principal Occupation(s) During Past 5 Years*** | Number of Funds in Fund Complex Overseen by Trustee**** | Other Directorships Held by Trustee During Past 5 Years*** |
Mary K. Anstine, 1940 | Trustee and Chairman | Ms. Anstine was elected at a special meeting of shareholders held on March 21, 1997 and re‐ elected at a special meeting of shareholders held on August 7, 2009. Ms. Anstine was appointed Chairman of the Board at the June 6, 2017 meeting of the Board of Trustees. | Ms. Anstine was formerly an Executive Vice President of First Interstate Bank of Denver until 1994, President/Chief Executive Officer of HealthONE Alliance, Denver, Colorado, from 1994 to 2004, and has been retired since 2004. Ms. Anstine is also Trustee/Director of AV Hunter Trust and Colorado Uplift Board. Ms. Anstine was formerly a Director of the Trust Bank of Colorado (later purchased and now known as Northern Trust Bank), HealthONE and Denver Area Council of the Boy Scouts of America, and a member of the American Bankers Association Trust Executive Committee. | 34 | Ms. Anstine is a Trustee of ALPS ETF Trust (20 funds); ALPS Variable Investment Trust (9 funds); Reaves Utility Income Fund (1 fund); and Westcore Trust (14 funds). |
Jeremy W. Deems, 1976 | Trustee | Mr. Deems was appointed as a Trustee at the March 11, 2008 meeting of the Board of Trustees and elected at a special meeting of shareholders held on August 7, 2009. | Mr. Deems is the Co‐Founder, Chief Operations Officer and Chief Financial Officer of Green Alpha Advisors, LLC, a registered investment advisor, and Co‐Portfolio Manager of the Shelton Green Alpha Fund. Prior to joining Green Alpha Advisors, Mr. Deems was CFO and Treasurer of Forward Management, LLC, ReFlow Management Co., LLC, ReFlow Fund, LLC, a private investment fund, and Sutton Place Management, LLC, an administrative services company, from 1998 to June 2007. From 2004 to 2005, Mr Deems also served as Treasurer of the Forward Funds and the Sierra Club Funds. | 34 | Mr. Deems is a Trustee of ALPS ETF Trust (20 funds); ALPS Variable Investment Trust (9 funds); Clough Funds Trust (1 fund); Elevation ETF Trust (1 fund); and Reaves Utility Income Fund (1 fund). |
| 32 | 1-855-DGI-FUND (344-3863) | www.DGIfund.com |
| The Disciplined Growth Investors Fund | Trustees and Officers |
April 30, 2017 (Unaudited)
INDEPENDENT TRUSTEES (continued)
Name, Address* & Year of Birth | Position(s) Held with Fund | Term of Office** and Length of Time Served | Principal Occupation(s) During Past 5 Years*** | Number of Funds in Fund Complex Overseen by Trustee**** | Other Directorships Held by Trustee During Past 5 Years*** |
Jerry G. Rutledge, 1944 | Trustee | Mr. Rutledge was elected at a special meeting of shareholders held on August 7, 2009. | Mr. Rutledge is the President and owner of Rutledge’s Inc., a retail clothing business. Mr. Rutledge is currently Director of the American National Bank. He was from 1994 to 2007 a Regent of the University of Colorado. | 34 | Mr. Rutledge is a Trustee of Principal Real Estate Income Fund (1 fund), Clough Global Dividend and Income Fund (1 fund), Clough Global Equity Fund (1 fund) and Clough Global Opportunities Fund (1 fund). |
Michael “Ross” Shell, 1970 | Trustee | Mr. Shell was elected at a special meeting of shareholders held on August 7, 2009. | Mr. Shell is Founder and CEO of Red Idea, LLC, a strategic consulting/early stage venture firm (since June 2008). From 1999 to 2009, he was a part‐owner and Director of Tesser, Inc., a brand agency. From December 2005 to May 2008, he was Director, Marketing and Investor Relations, of Woodbourne, a REIT/real estate hedge fund and private equity firm. Prior to this, from May 2004 to November 2005, he worked as a business strategy consultant; from June 2003 to April 2004, he was on the Global Client Services team of IDEO, a product design/innovation firm; and from 1999 to 2003, he was President of Tesser, Inc. Mr. Shell graduated with honors from Stanford University with a degree in Political Science. | 34 | None. |
| Annual Report | April 30, 2017 | 33 |
| The Disciplined Growth Investors Fund | Trustees and Officers |
April 30, 2017 (Unaudited)
INTERESTED TRUSTEE
Name, Address* & Year of Birth | Position(s) Held with Fund | Term of Office** and Length of Time Served | Principal Occupation(s) During Past 5 Years*** | Number of Funds in Fund Complex Overseen by Trustee**** | Other Directorships Held by Trustee During Past 5 Years*** |
Edmund J. Burke, 1961 | Trustee and President | Mr. Burke was elected as Trustee at a special meeting of shareholders held on August 7, 2009. Mr. Burke was elected President of the Trust at the December 17, 2002 meeting of the Board of Trustees. | Mr. Burke is President and a Director of ALPS Holdings, Inc. (“AHI”) (since 2005) and Director of Boston Financial Data Services, Inc. (“BFDS”), ALPS Advisors, Inc. (“AAI”), ALPS Distributors, Inc. (“ADI”), ALPS Fund Services, Inc. (“AFS”) and ALPS Portfolio Solutions Distributor, Inc. (“APSD”) and from 2001‐2008, was President of AAI, ADI, AFS and APSD. Because of his positions with AHI, BFDS, AAI, ADI, AFS and APSD, Mr. Burke is deemed an affiliate of the Trust as defined under the 1940 Act. | 34 | Mr. Burke is a Trustee of Clough Global Dividend and Income Fund (1 fund); Clough Global Equity Fund (1 fund); Clough Global Opportunities Fund (1 fund); Clough Funds Trust (1 fund); Liberty All‐Star Equity Fund (1 fund); and Director of the Liberty All‐Star Growth Fund, Inc. (1 fund). |
| 34 | 1-855-DGI-FUND (344-3863) | www.DGIfund.com |
| The Disciplined Growth Investors Fund | Trustees and Officers |
April 30, 2017 (Unaudited)
OFFICERS
Name, Address* & Year of Birth | Position(s) Held with Fund | Term of Office** and Length of Time Served | Principal Occupation(s) During Past 5 Years*** |
Kimberly R. Storms, 1972 | Treasurer | Ms. Storms was elected Treasurer of the Trust at the March 12, 2013 meeting of the Board of Trustees. | Ms. Storms is Senior Vice President ‐ Director of Fund Administration of ALPS. Because of her position with ALPS, Ms. Storms is deemed an affiliate of the Trust as defined under the 1940 Act. Ms. Storms is also Treasurer of Liberty All‐Star Equity Fund, Liberty All‐Star Growth Fund, Inc., ALPS Series Trust and Elevation ETF Trust. Ms. Storms also serves as a Board member and Treasurer of The Center for Trauma & Resilience, a nonprofit agency. |
Karen S. Gilomen, 1970 | Secretary | Ms. Gilomen was elected Secretary of the Trust at the December 13, 2016 meeting of the Board of Trustees. | Ms. Gilomen joined ALPS in August 2016 as Vice President and Senior Counsel. Prior to joining ALPS, Ms. Gilomen was Vice President ‐ General Counsel & CCO of Monticello Associates, Inc. from 2010 to 2016. Because of her position with ALPS, Ms. Gilomen is deemed an affiliate of the Trust, as defined under the 1940 Act. Ms. Gilomen is also the Secretary of Oak Associates Funds and Reaves Utility Income Fund, and the Assistant Secretary of the WesMark Funds. |
Ted Uhl, 1974 | Chief Compliance Officer (“CCO”) | Mr. Uhl was appointed CCO of the Trust at the June 8, 2010 meeting of the Board of Trustees. | Mr. Uhl joined ALPS in October 2006, and is currently Deputy Compliance Officer of ALPS. Prior to his current role, Mr. Uhl served as Senior Risk Manager for ALPS from October 2006 until June 2010. Before joining ALPS, Mr. Uhl served a Sr. Analyst with Enenbach and Associates (RIA), and a Sr. Financial Analyst at Sprint. Because of his position with ALPS, Mr. Uhl is deemed an affiliate of the Trust as defined under the 1940 Act. Mr. Uhl is also CCO of the Boulder Growth & Income Fund, Inc., Centre Funds, Elevation ETF Trust, Index Funds, Reality Shares ETF Trust and Reaves Utility Income Fund. |
Jennell Panella, 1974 | Assistant Treasurer | Ms. Panella was elected Assistant Treasurer of the Trust at the September 15, 2015 meeting of the Board of Trustees. | Ms. Panella joined ALPS in June 2012 and is currently Fund Controller of ALPS Fund Services, Inc. Prior to joining ALPS, Ms. Panella served as Financial Reporting Manager for Parker Global Strategies, LLC (2009‐2012). Because of her position with ALPS, Ms. Panella is deemed an affiliate of the Trust as defined under the 1940 Act. Ms. Panella also serves as Assistant Treasurer of James Advantage Funds. |
| Annual Report | April 30, 2017 | 35 |
| The Disciplined Growth Investors Fund | Trustees and Officers |
April 30, 2017 (Unaudited)
OFFICERS (continued)
Name, Address* & Year of Birth | Position(s) Held with Fund | Term of Office** and Length of Time Served | Principal Occupation(s) During Past 5 Years*** |
Alan Gattis, 1980 | Assistant Treasurer | Mr. Gattis was elected Assistant Treasurer of the Trust at the September 13, 2016 meeting of the Board of Trustees. | Mr. Gattis joined ALPS in 2011 and is currently Vice President and Fund Controller of ALPS. Prior to joining ALPS, Mr. Gattis was an Auditor at Spicer Jeffries LLP (2009 through 2011) and an Auditor at PricewaterhouseCoopers LLP (2004 ‐ 2009). Because of his position with ALPS, Mr. Gattis is deemed an affiliate of the Trust as defined under the 1940 Act. Mr. Gattis is also Assistant Treasurer of ALPS Series Trust, Clough Funds Trust, Clough Global Opportunities Fund, Clough Global Dividend and Income Fund, Clough Global Equity, and Griffin Institutional Access Real Estate Fund. |
Sharon Akselrod, 1974 | Assistant Secretary | Ms. Akselrod was elected Assistant Secretary of the Trust at the September 15, 2015 meeting of the Board of Trustees. | Ms. Akselrod joined ALPS in August 2014 and is currently Senior Investment Company Act Paralegal of ALPS Fund Services, Inc. Prior to joining ALPS, Ms. Akselrod served as Corporate Governance and Regulatory Associate for Nordstrom fsb (2013‐2014) and Senior Legal Assistant – Legal Manager for AXA Equitable Life Insurance Company (2008‐2013). Because of her position with ALPS, Ms. Akselrod is deemed an affiliate of the Trust as defined under the 1940 Act. Ms. Akselrod is also Assistant Secretary of ALPS ETF Trust. |
Jennifer Craig, 1973 | Assistant Secretary | Ms. Craig was elected Assistant Secretary of the Trust at the June 8, 2016 meeting of the Board of Trustees. | Ms. Craig joined ALPS in 2007 and is currently Assistant Vice President and Paralegal Manager of ALPS. Prior to joining ALPS, Ms. Craig was Legal Manager at Janus Capital Management LLC and served as Assistant Secretary of Janus Investment Fund, Janus Adviser Series and Janus Aspen Series. Because of her position with ALPS, Ms. Craig is deemed an affiliate of the Trust as defined under the 1940 Act. Ms. Craig is also Assistant Secretary of Clough Global Dividend and Income Fund, Clough Global Equity Fund, Clough Global Opportunities Fund, Clough Funds Trust and ALPS Series Trust. |
| * | All communications to Trustees and Officers may be directed to Financial Investors Trust c/o 1290 Broadway, Suite 1100, Denver, CO 80203. |
| ** | This is the period for which the Trustee or Officer began serving the Trust. Each Trustee serves an indefinite term, until his successor is elected. Officers are elected on an annual basis. |
| *** | The Fund Complex includes all series of the Trust (currently 34) and any other investment companies for which any Trustee serves as trustee for and which Disciplined Growth Investors, Inc. provides investment advisory services (currently none). |
| 36 | 1-855-DGI-FUND (344-3863) | www.DGIfund.com |
| The Disciplined Growth Investors Fund | Privacy Policy |
| FACTS | WHAT DOES THE FUND DO WITH YOUR PERSONAL INFORMATION? |
| WHY? | Financial companies choose how they share your personal information. Federal law gives consumers the right to limit some but not all sharing. Federal law also requires us to tell you how we collect, share, and protect your personal information. Please read this notice carefully to understand what we do. |
| WHAT? | The types of personal information we collect and share depend on the product or service you have with us. This information can include: |
| | • Social Security number and account transactions |
| | • Account balances and transaction history |
| | • Wire transfer instructions |
| HOW? | All financial companies need to share customers’ personal information to run their everyday business. In the section below, we list the reasons financial companies can share their customers’ personal information; the reasons the Fund chooses to share; and whether you can limit this sharing. |
REASONS WE CAN SHARE YOUR PERSONAL INFORMATION | DOES THE FUND SHARE: | CAN YOU LIMIT THIS SHARING? |
For our everyday business purposes – such as to process your transactions, maintain your account(s), respond to court orders and legal investigations, or report to credit bureaus | Yes | No |
For our marketing purposes – to offer our products and services to you | No | We do not share. |
| For joint marketing with other financial companies | No | We do not share. |
For our affiliates’ everyday business purposes – information about your transactions and experiences | Yes | No |
For our affiliates’ everyday business purposes – information about your creditworthiness | No | We do not share. |
| For non‐affiliates to market to you | No | We do not share. |
| Annual Report | April 30, 2017 | 37 |
| The Disciplined Growth Investors Fund | Privacy Policy |
| WHO WE ARE | | | |
| Who is providing this notice? | The Disciplined Growth Investors Fund |
| WHAT WE DO | |
| How does the Fund protect my personal information? | To protect your personal information from unauthorized access and use, we use security measures that comply with federal law. These measures include computer safeguards and secured files and buildings. |
| | We collect your personal information, for example, when you |
| How does the Fund collect my personal information? | | ● | open an account |
| | ● | provide account information or give us your contact information |
| | | ● | make a wire transfer or deposit money |
| | Federal law gives you the right to limit only |
| Why can’t I limit all sharing? | | ● | sharing for affiliates’ everyday business purposes information about your creditworthiness |
| | | ● | affiliates from using your information to market to you |
| | | ● | sharing for non-affiliates to market to you |
| | State laws and individual companies may give you additional rights to limit sharing. |
| DEFINITIONS | | | |
| Affiliates | Companies related by common ownership or control. They can be financial and nonfinancial companies. |
| Non-affiliates | Companies not related by common ownership or control. They can be financial and nonfinancial companies. |
| | | ● | The Fund does not share with non‐affiliates so they can market to you. |
| Joint marketing | A formal agreement between non‐affiliated financial companies that together market financial products or services to you. |
| | | ● | The Fund does not jointly market. |
| 38 | 1-855-DGI-FUND (344-3863) | www.DGIfund.com |
| The Disciplined Growth Investors Fund | Privacy Policy |
| OTHER IMPORTANT INFORMATION | |
| California Residents | If your account has a California home address, your personal information will not be disclosed to nonaffiliated third parties except as permitted by applicable California law, and we will limit sharing such personal information with our affiliates to comply with California privacy laws that apply to us. |
| Vermont Residents | The State of Vermont requires financial institutions to obtain your consent prior to sharing personal information that they collect about you with affiliated companies and nonaffiliated third parties other than in certain limited circumstances. Except as permitted by law, we will not share personal information we collect about you with nonaffiliated third parties or other affiliated companies unless you provide us with your written consent to share such information. |
| Annual Report | April 30, 2017 | 39 |
THIS MATERIAL MUST BE PRECEDED OR ACCOMPANIED BY A PROSPECTUS.
THE DISCIPLINED GROWTH INVESTORS FUND IS DISTRIBUTED BY ALPS DISTRIBUTORS, INC.
DGI000231 / 0618
TABLE OF CONTENTS
| Manager Commentary | |
| Emerald Growth Fund | 1 |
| Emerald Small Cap Value Fund | 6 |
| Emerald Insights Fund | 11 |
| Emerald Banking and Finance Fund | 15 |
| Disclosure of Fund Expenses | 21 |
| Schedule of Investments | |
| Emerald Growth Fund | 23 |
| Emerald Small Cap Value Fund | 25 |
| Emerald Insights Fund | 27 |
| Emerald Banking and Finance Fund | 29 |
| Statements of Assets and Liabilities | 31 |
| Statements of Operations | 32 |
| Statements of Changes of Net Assets | |
| Emerald Growth Fund | 33 |
| Emerald Small Cap Value Fund | 35 |
| Emerald Insights Fund | 37 |
| Emerald Banking and Finance Fund | 38 |
| Financial Highlights | |
| Emerald Growth Fund | 39 |
| Emerald Small Cap Value Fund | 43 |
| Emerald Insights Fund | 47 |
| Emerald Banking and Finance Fund | 51 |
| Notes to Financial Statements | 55 |
| Report of Independent Registered Public Accounting Firm | 64 |
| Disclosure Regarding Approval of Fund Advisory Agreements | 65 |
| Additional Information | 67 |
| Trustees & Officers | 68 |
| Privacy Policy | 73 |
| Emerald Growth Fund | Manager Commentary |
April 30, 2017 (Unaudited)April 2017
Dear Shareholders:
Investment Results
The performance of the Emerald Growth Fund’s Class A shares (without sales load), for the twelve months ended April 30, 2017, advanced by 24.60% outperforming the Russell 2000® Growth Index(1) which appreciated by 24.06%.
What a difference a year makes. After a concerning start to 2016 with recession fears driving the direction of the market, the improbable victory of President Donald Trump and a Republican sweep of Congress propelled the market to new highs as the prospect of less regulation, tax reform, accelerating infrastructure and defense spending led to broad based optimism that economic growth and corporate profits are poised to reaccelerate in 2017 and beyond. Small capitalization stocks were the largest beneficiary of this shift in sentiment, with the Russell 2000® Index(2) surging 25.63% during the year, substantially outpacing the Russell 1000® Index(3) which appreciated by 18.03%. Gains in small capitalization stocks were tilted toward the “Value” component of the Russell 2000® Index driven by outsized gains in the technology, materials, financial services, and producer durables sectors. These gains propelled the Russell 2000® Value Index(4) to appreciate by 27.18% over the trailing twelve months, outpacing the Russell 2000® Growth Index which gained 24.06%.
Investment Analysis
On a relative basis, the portfolio outpaced the benchmark for the trailing period as the positive contribution to return achieved in the consumer discretionary, healthcare and utilities sectors offset relative underperformance within producer durables and financial services sectors.
The consumer discretionary sector was the largest source of relative outperformance for the trailing period driven by stock selection within the specialty retail, consumer services, hotel, leisure, diversified retail, and radio and TV broadcaster industries.
The healthcare sector also contributed positively to return driven by a combination of the portfolio’s relative underweight position and stock selection within the biotechnology, pharmaceutical and services industries. Performance within the utilities sector also contributed positively to relative performance as a result of the relative outperformance of holdings within the telecommunications services industries.
Relative outperformance in the aforementioned was partially offset by relative underperformance within the producer durables and financial services sectors. Performance within the producer durables sector was the largest detractor to return. The portfolio’s relative underweight position and stock selection within the back office support industry weighed on relative performance.
Performance within the financial services sector also detracted to return for the period largely as a result of the portfolio’s relative overweight position and stock selection within the securities, real estate investment trust, and insurance industries.
Exiting April 2016, the portfolio held the largest active exposures to the technology, utilities and materials sectors. Thoughts on those sectors and other areas of notable opportunity/ portfolio exposure are highlighted below:
The technology sector represents the portfolio’s largest overweight position. Looking forward within networking and communications, Emerald believes that the strategic imperative from both telecom service providers and datacenter operators to deliver high‐speed bandwidth will drive continued demand for optical components, modules, and systems. Additionally, spending on telecommunication infrastructure across China remains a significant driver of optical component demand, and although spending in this geography is currently in a state of flux, we believe China will ultimately remain a significant growth driver for the optical industry. Security spending continues to be a priority for enterprises and as such an attractive theme within the software industry. Additionally, Emerald also remains interested in the capital/consumer spending cycles associated with DOCSIS 3.1, Intel’s Purley/Skylake processor, Apple’s 10‐year anniversary iPhone 8, and next‐gen gaming consoles (both VR (virtual reality) and standard).
The portfolio also maintains an overweight position to the utilities sectors. Within the utilities sector, Emerald continues to believe that adoption of unified communications among mid‐market and enterprise customers is in the very early stages and that the segment will continue to expand, shifting market leadership from traditional telephony equipment providers to a new group of software/network centric companies.
The portfolio’s exposure to the materials sector has grown as Emerald has become increasingly confident regarding the durability of the recovery in the residential and commercial construction markets, as well as the broadening opportunity set resulting from potential increases in infrastructure and construction spending that we expect to come to fruition under the new administration.
| Annual Report | April 30, 2017 | 1 |
| Emerald Growth Fund | Manager Commentary |
April 30, 2017 (Unaudited)Market Outlook:
As we look to the balance of the 2017, we believe there are several encouraging signs to support a reacceleration in domestic economic growth. First and foremost earnings in the first quarter have been stronger than expected. According to the May 12th Earnings Insight report from FactSet, earnings growth for the S&P 500,(5) with more than 400 of the companies having reported, is tracking to 14% which was significantly better than the 9% expected coming into reporting season and notably the best earnings growth posted by the S&P 500 since the third quarter of 2011. The strong earnings reporting season stands in stark contrast to the weak first quarter Gross Domestic Product (GDP) growth, and would appear to be supportive of a future reacceleration in growth. Survey data has also generally remained supportive of this reacceleration, as has the outlook for employment with the April unemployment rate of 4.4% representing the lowest level since May of 2007. These factors, among others, are translating into greater confidence regarding the outlook for second quarter growth. The Atlanta Fed GDPNow forecast which accurately depicted the weakness in the first quarter, is currently projecting second quarter domestic GDP growth of 3.6%.
From a fiscal policy standpoint, while we believe the market will continue to monitor the happenings inside of the beltway we do not believe there is the same level of embedded expectations regarding the magnitude and timeframe for achieving reform as was the case earlier in the year and therefore expect the volatility emanating from the reform initiatives to be much more muted in the near‐term.
If economic growth remains intact, as we believe it will, Emerald believes small capitalization growth stocks remain relatively well positioned as growth and valuation relative to their value counterpart remains particularly attractive. At the close of April the portfolio held the largest relative overweight positions in the technology, utilities, and materials sectors. The portfolio had the most significant underweight positions within the healthcare, producer durables and consumer staples sectors. Please note that as a fundamental bottom‐up manager the aforementioned sector weights are a fall‐out of the stock selection process.
Top Contributors: | Top Detractors: | |
| Veeva Systems Inc. | Opus Bank | |
| Installed Building Products Inc. | Red Robin Gourmet Burgers Inc. | |
| Nutrisystem Inc. | Acadia Healthcare Company Inc. | |
| Tutor Perini Corporation | NantHealth Inc. | |
| Applied Optoelectronics Inc. | Kona Grill Inc. | |
| | | |
| Kenneth G. Mertz II, CFA | Stacey L. Sears | Joseph W. Garner |
| Chief Investment Officer | Portfolio Manager | Portfolio Manager |
| Portfolio Manager | | |
Emerald Mutual Fund Advisers Trust
Past performance does not guarantee future results. Fund prices fluctuate as the underlying assets have exposure to market fluctuations and other risks, as described in the Fund’s prospectus. Please visit www.emeraldmutualfunds.com to obtain current performance information and for the current prospectus and statement of additional information. This material must be preceded or accompanied by a prospectus. Please read the prospectus carefully before investing.
The views of Emerald Mutual Fund Advisers Trust and information discussed in this commentary are as of the date of publication, are subject to change, and may not reflect the writer's current views. The views expressed are those of the author only, and represent an assessment of market conditions at a specific point in time, are opinions only and should not be relied upon as investment advice regarding a particular investment or markets in general. Such information does not constitute a recommendation to buy or sell specific securities or investment vehicles. It should not be assumed that any investment will be profitable or will equal the performance of the Fund or any securities or any sectors mentioned in this letter. The subject matter contained in this letter has been derived from several sources believed to be reliable and accurate at the time of compilation. Neither Emerald Mutual Fund Advisers Trust nor the Fund accepts any liability for losses either direct or consequential caused by the use of this information.
The Emerald Growth Fund is distributed by ALPS Distributors, Inc.
The Fund is subject to investment risks, including possible loss of the principal amount invested and therefore is not suitable for all investors. The Fund may not achieve its objectives.
Diversification does not eliminate the risk of experiencing investment losses.
| 2 | www.emeraldmutualfunds.com |
| Emerald Growth Fund | Manager Commentary |
April 30, 2017 (Unaudited)
(1) | The Russell 2000® Growth Index measures the performance of the small-cap growth segment of the U.S. equity universe. It includes those Russell 2000® Index companies with higher price-to-value ratios and higher forecasted growth values. The Index is not actively managed and does not reflect any deductions for fees, expenses or taxes. An investor may not invest directly into the Index. |
(2) | The Russell 2000® Index measures the performance of the small-cap segment of the U.S. equity universe. The Russell 2000® Index is a subset of the Russell 3000® Index representing approximately 8% of the total market capitalization of that index. It includes approximately 2000 of the smallest securities based on a combination of their market cap and current index membership. The Index is not actively managed and does not reflect any deduction of fees, expenses or taxes. An investor may not invest directly into the Index. |
(3) | The Russell 1000® Index is a stock market index that represents the highest-ranking 1,000 stocks in the Russell 3000® Index, which represents about 90% of the total market capitalization of that index. The Russell 1000® Index has a weighted average market capitalization of $81 billion; the median market capitalization is approximately $4.6 billion. The Index is not actively managed and does not reflect any deductions for fees, expenses or taxes. An investor may not invest directly into the Index. |
(4) | The Russell 2000® Value Index measures the performance of small-cap value segment of the U.S. equity universe. It includes those Russell 2000 companies with lower price-to-book ratios and lower forecasted growth values. The Index is not actively managed and does not reflect any deductions for fees, expenses or taxes. An investor may not invest directly into the Index. |
(5) | The S&P 500, is an American stock market index based on the market capitalizations of 500 large companies having common stock listed on the NYSE or NASDAQ. The S&P 500 index components and their weightings are determined by S&P Dow Jones Indices. |
| Annual Report | April 30, 2017 | 3 |
| Emerald Growth Fund | Manager Commentary |
April 30, 2017 (Unaudited)
| Veeva Systems, Inc., Class A | 2.77% |
| Installed Building Products, Inc. | 2.29% |
| Bank of the Ozarks, Inc. | 1.99% |
| LendingTree, Inc. | 1.98% |
| Apogee Enterprises, Inc. | 1.91% |
| Microsemi Corp. | 1.80% |
| Trex Co., Inc. | 1.78% |
| 8x8, Inc. | 1.71% |
| EPAM Systems, Inc. | 1.63% |
| MicroStrategy, Inc., Class A | 1.57% |
| Top Ten Holdings | 19.43% |
INDUSTRY SECTOR ALLOCATION
(as a % of Net Assets)
| Technology | 25.54% |
| Consumer Discretionary | 16.45% |
| Health Care | 14.86% |
| Financial Services | 13.09% |
| Materials & Processing | 11.52% |
| Producer Durables | 10.50% |
| Utilities | 4.42% |
| Energy | 1.21% |
| Consumer Staples | 0.92% |
| Cash, Cash Equivalents, & Other Net Assets | 1.49% |
| * | Holdings are subject to change, and may not reflect the current or future position of the portfolio. |
AVERAGE ANNUAL TOTAL RETURN (for the period ended April 30, 2017)
| | | | | | Since | Expense Ratio |
| | 1 Year | 3 Year | 5 Year | 10 Year | Inception(1) | Gross(2) | Net(2) |
| Class A (NAV) | 24.60% | 9.79% | 12.72% | 8.48% | 11.09% | 1.16% | 1.16% |
| Class A (MOP) | 18.71% | 8.03% | 11.63% | 7.95% | 10.87% | 1.16% | 1.16% |
Russell 2000® Growth Index† | 24.06% | 9.27% | 12.89% | 7.97% | 8.16% | | |
| Class C (NAV) | 23.84% | 9.08% | 11.99% | 7.79% | 5.75% | 1.82% | 1.82% |
| Class C (CDSC) | 22.84% | 9.08% | 11.99% | 7.79% | 5.75% | 1.82% | 1.82% |
Russell 2000® Growth Index† | 24.06% | 9.27% | 12.89% | 7.97% | 4.80% | | |
| Investor Class | 24.57% | 9.75% | 12.68% | – | 10.98% | 1.23% | 1.23% |
Russell 2000® Growth Index† | 24.06% | 9.27% | 12.89% | – | 10.05% | | |
| Institutional Class | 24.99%(3) | 10.15% | 13.07% | – | 15.32% | 0.86% | 0.86% |
Russell 2000® Growth Index† | 24.06% | 9.27% | 12.89% | – | 14.59% | | |
Performance quoted represents past performance, does not guarantee future results and current performance may be lower or higher than the data quoted. The investment return and principal value of an investment will fluctuate so that shares, when redeemed, may be worth more or less than their original cost. Performance data current to the most recent month end may be obtained at www.emeraldmutualfunds.com.
Performance shown for periods prior to March 16, 2012, reflects the performance of the Forward Growth Fund, a series of Forward Funds (as a result of a reorganization of the Forward Growth Fund into the Emerald Growth Fund).
The table does not reflect the deduction of taxes that a shareholder would pay on Fund distributions or the redemption of Fund shares.
Subject to investment risks, including possible loss of the principal amount invested.
Maximum Offering Price (MOP) for Class A shares includes the Fund's maximum sales charge of 4.75%. Performance shown at NAV does not include these sales charges and would have been lower had it been taken into account.
A Contingent Deferred Sales Charge (CDSC) of 1.00% may apply to Class C shares redeemed within the first 12 months after a purchase.
(1) | Inception Dates - Class A: 10/01/1992, Class C: 07/01/2000, Class Institutional: 10/21/2008, Class Investor: 05/01/2011 |
(2) | Emerald Mutual Fund Advisers Trust ("Emerald" or the "Adviser") has agreed contractually to waive a portion of its fees and reimburse other expenses until August 31, 2017 in amounts necessary to limit the Fund's operating expenses (exclusive of Acquired Fund Fees and Expenses, brokerage expenses, interest expenses, taxes and extraordinary expense) for Class A, Class C, Institutional Class, and Investor Class shares to an annual rate (as percentage of the Fund's average daily net assets) of 1.29%, 1.94%, 0.99% and 1.34% respectively. The Adviser will be permitted to recover, on a class-by-class basis, expenses it has borne through the agreement described above to the extent that the Fund's expenses in later periods fall below the annual rates set forth in the relevant agreement. The Fund will not be obligated to pay any such deferred fees and expenses more than three years after the year(s) in which the fees and expense were incurred. The Adviser may not discontinue this waiver prior to August 31, 2017, without the approval by the Fund's Board of Trustees. Ratios as of the Prospectus dated August 31, 2017 and may differ from the ratios presented in the Financial Highlights. |
(3) | Excludes adjustments in accordance with accounting principles generally accepted in the United States of America and as such, the net asset value and total return for shareholder transactions reported to the market may differ from the net asset value for financial reporting purposes. |
† | The Russell 2000® Growth Index measures the performance of the small-cap growth segment of the U.S. equity universe. It includes those Russell 2000® Index companies with higher price-to-value ratios and higher forecasted growth values. The Index is not actively managed and does not reflect any deduction for fees, expenses or taxes. An investor may not invest directly into the Index. |
| 4 | www.emeraldmutualfunds.com |
| Emerald Growth Fund | Manager Commentary |
April 30, 2017 (Unaudited)
GROWTH OF $10,000 INVESTMENT IN THE FUND (for the period ended April 30, 2017)
Comparison of change in value of a $10,000 investment (includes applicable sales loads)
The chart represents historical performance of a hypothetical investment of $10,000 in the Fund since inception. Past performance does not guarantee future results. This chart does not reflect the deduction of taxes that a shareholder would pay on Fund distributions or the redemption of Fund shares.
Investing in the Fund is subject to investment risks, including possible loss of the principal amount invested.
| Annual Report | April 30, 2017 | 5 |
| Emerald Small Cap Value Fund | Manager Commentary |
April 30, 2017 (Unaudited)
April 30, 2017
Dear Shareholders:
Investment Results
The performance of the Emerald Small Cap Value Fund Investor Class, for the twelve months ended April 30, 2017, reflected a gain of 25.27% (without sales load) lagging the Russell 2000® Value Index(1) which was up 27.18%.
The small cap value asset class had a stellar performance in 2016, finishing the year well ahead of all other US equity asset classes. The US election results, improving domestic economic data, and benign news from overseas, help rekindle investors’ animal spirits.
The particularly strong rally in small cap equities during the 4th quarter of 2016 was aided by massive Exchange Traded Funds (ETFs) flows, that boosted the performance of sectors and industries that we believe should benefit most by President Trump's policies. Small cap ETFs took in $17.5 billion for the year and over $12 billion in 4Q alone(2). However, year to date, the rally in small cap equities has stalled. This could be attributed to domestic political uncertainty, flattening yield curve, and stretched valuations post‐election rally. In addition, passive small cap strategies continued to see meaningful inflows at the expense of active managers. Whereas, passive strategies as a percentage of total small caps investing stands at 40% today, versus 23% just ten years ago(3).
Investment Analysis
The Emerald Small Cap Value Fund (without sales load) underperformed its benchmark for the 12‐month period ended April 30, 2017. At the sector level, relative outperformance was driven by stock selection within the producer durables, utilities, and financial services sectors, and a relative overweight to the benchmark’s technology sector. Relative underperformance was experienced within the technology sector.
Negative stock selection in the technology sector weighed on relative performance as holdings within the semiconductor and software industries were impacted by enterprise spending slowdown, partially due to economic and political uncertainties.
The Fund’s outperformance in the financial services sector was due to strong stock selection within our bank holdings versus the benchmark. The prospect of lower corporate tax rates and infrastructure spending could produce stronger Gross Domestic Product (GDP) growth rates in 2017. In anticipation of increased economic growth rates and inflationary pressure, banks are already benefiting from higher interest rates which will likely lead to higher net interest margins for most banks in 2017. We remain bullish on banks as we believe that the banking sector will continue to outperform the market as investors anticipate superior earnings growth supported by reduced corporate taxes, lower regulatory expenses and several rate increases by the Fed in 2017.
Historically, the Fund’s portfolio had a higher exposure to the Financials sector than its peers, which has significantly expanded since the beginning of 2017. We believe it is a differentiating factor, and has contributed significant alpha to our performance since inception.
In addition, we continued to reduce our overweight in the technology sector, in accordance to our sell discipline.
With increasing uncertainty in the market, and expectations for higher interest rates, the portfolio management team is comfortable with being overweight the Financials sector, and investing in companies that generate prodigious amounts of free cash flow.
Market Outlook
Early stumbles in passing key legislation due to disunity within the Republican Party put into question President Trumps’ ability to move forward in a timely manner with the rest of his ambitious agenda. Infrastructure spending, tax reform, and reduction in regulations, will probably take much longer to materialize than previously expected. Small caps, which benefit greatly by pro‐growth domestic policy, have lagged the market recently. Credit Suisse noted that the “broad market performance has been closely tied to trends in Trump’s favorability since the election. Within US equities, small caps and value have also tended to outperform large cap and growth when Trump’s favorability rises and underperform when Trump’s favorability falls.”(4)
While we still believe that the US business cycle is maturing, current market conditions are supportive of further growth and margin expansion in domestic companies. ISM (Institute for Supply Management) Manufacturing and Non‐Manufacturing PMIs (Purchasing Managers Index) have been strong year to date, signaling rapid growth. NFIB (National Federation of Independent Business) Small Business Optimism Index has been at lofty levels since the election, with the last data point at 104.5. Also, it seems that labor slack is diminishing and wages continues to rise. The latest reading of the unemployment rate as of April 2017, was 4.4%, and the U6 underemployment rate fell to 8.6%, both lowest in almost a decade and indicative of full employment(5).
| 6 | www.emeraldmutualfunds.com |
| Emerald Small Cap Value Fund | Manager Commentary |
April 30, 2017 (Unaudited)
Barring any geopolitical shocks (US in direct military conflict with Russia over Syria, North Korea, additional exits from the EU, etc.) the US economy should continue to grow at a faster pace than recent history. And, in this environment small cap companies should do well on a relative basis.
We will continue to seek attractive investment opportunities for our clients by focusing on high‐quality companies identified and evaluated by our fundamental research and active portfolio management.
Top Contributors | Top Detractors |
| MasTec, Inc. | MDC Partners Inc. Class A |
| First Merchants Corporation | Opus Bank |
| SVB Financial Group | Synaptics Incorporated |
| Viad Corp | Perficient, Inc. |
| Ducommun Incorporated | Real Industry, Inc. |
| | |
| Sincerely, | |
| | |
| Ori Elan | Steven E. Russell, Esq. |
| Vice President | Vice President |
| Portfolio Manager | Portfolio Manager |
Past performance does not guarantee future results. Fund prices fluctuate as the underlying assets have exposure to market fluctuations and other risks, as described in the Fund’s prospectus. Please visit www.emeraldmutualfunds.com to obtain current performance information and for the current prospectus and statement of additional information. This material must be preceded or accompanied by a prospectus. Please read the prospectus carefully before investing.
The views of Emerald Mutual Fund Advisers Trust and information discussed in this commentary are as of the date of publication, are subject to change, and may not reflect the writer's current views. The views expressed are those of the author only, and represent an assessment of market conditions at a specific point in time, are opinions only and should not be relied upon as investment advice regarding a particular investment or markets in general. Such information does not constitute a recommendation to buy or sell specific securities or investment vehicles. It should not be assumed that any investment will be profitable or will equal the performance of the Fund or any securities or any sectors mentioned in this letter. The subject matter contained in this letter has been derived from several sources believed to be reliable and accurate at the time of compilation. Neither Emerald Mutual Fund Advisers Trust nor the Fund accepts any liability for losses either direct or consequential caused by the use of this information.
The Emerald Small Cap Value Fund is distributed by ALPS Distributors, Inc.
The Fund is subject to investment risks, including possible loss of the principal amount invested and therefore is not suitable for all investors. The Fund may not achieve its objectives.
Diversification does not eliminate the risk of experiencing investment losses.
(1) | The Russell 2000® Value Index measures the performance of small-cap value segment of the U.S. equity universe. It includes those Russell 2000 companies with lower price-to-book ratios and lower forecasted growth values. The Index is not actively managed and does not reflect any deductions for fees, expenses or taxes. An investor may not invest directly into the Index. |
(2) | Jefferies, Strategy Note, 02 January, 2017. |
(3) | Jefferies, Equity Strategy Note, 04 April, 2017. |
(4) | Credit Suisse, US Equity Strategy Stat Pack, 04 April, 2017. |
(5) | MKM Partners, Macrostrategy, 07 April, 2017. |
| Annual Report | April 30, 2017 | 7 |
| Emerald Small Cap Value Fund | Manager Commentary |
April 30, 2017 (Unaudited)
TOP TEN HOLDINGS
(as a % of Net Assets)*
| ILG, Inc. | 2.27% |
| Builders FirstSource, Inc. | 2.17% |
| Cubic Corp. | 2.15% |
| Gray Television, Inc. | 2.11% |
| MasTec, Inc. | 2.06% |
| Viad Corp. | 2.06% |
| Microsemi Corp. | 1.97% |
| Rudolph Technologies, Inc. | 1.95% |
| ZAGG, Inc. | 1.92% |
| Generac Holdings, Inc. | 1.81% |
| Top Ten Holdings | 20.47% |
INDUSTRY SECTOR ALLOCATION
(as a % of Net Assets)
| Financial Services | 48.96% |
| Technology | 13.24% |
| Consumer Discretionary | 12.35% |
| Producer Durables | 10.98% |
| Materials & Processing | 7.62% |
| Utilities | 3.54% |
| Energy | 2.39% |
| Cash, Cash Equivalents, & Other Net Assets | 0.92% |
| * | Holdings are subject to change, and may not reflect the current or future position of the portfolio. |
AVERAGE ANNUAL TOTAL RETURN (for the period ended April 30, 2017)(1),(2)
| | | | Since | Expense Ratio |
| | 1 Year | 3 Years | Inception(2) | Gross(3)(4) | Net(3)(4) |
| Class A (NAV) | 25.15% | 8.53% | 13.27% | 2.12% | 1.36% |
| Class A (MOP) | 19.19% | 6.78% | 12.06% | 2.12% | 1.36% |
Russell 2000® Value Index(5) | 27.18% | 8.71% | 13.59% | | |
| Class C (NAV) | 24.32%(6) | 7.82% | 12.53% | 2.77% | 2.01% |
| Class C (CDSC) | 23.32% | 7.82% | 12.53% | 2.77% | 2.01% |
Russell 2000® Value Index(5) | 27.18% | 8.71% | 13.59% | | |
| Investor Class | 25.27% | 8.68% | 13.43% | 2.02% | 1.26% |
Russell 2000® Value Index(5) | 27.18% | 8.71% | 13.59% | | |
| Institutional Class | 25.58% | 8.89% | 13.65% | 1.77% | 1.01% |
Russell 2000® Value Index(5) | 27.18% | 8.71% | 13.59% | | |
Performance quoted represents past performance, does not guarantee future results and current performance may be lower or higher than the data quoted. The investment return and principal value of an investment will fluctuate so that shares, when redeemed, may be worth more or less than their original cost. Performance data current to the most recent month end may be obtained at www.emeraldmutualfunds.com.
The table does not reflect the deduction of taxes that a shareholder would pay on Fund distributions or the redemption of Fund shares.
Subject to investment risks, including possible loss of the principal amount invested.
Maximum Offering Price (MOP) for Class A shares includes the Fund's maximum sales charge of 4.75%. Performance shown at NAV does not include these sales charges and would have been lower had it been taken into account.
A Contingent Deferred Sales Charge (CDSC) of 1.00% may apply to Class C shares redeemed within the first 12 months after a purchase.
(1) | As of June 26, 2015, the Emerald Small Cap Value Fund was reorganized as a successor to the Elessar Small Cap Value Fund (the Predecessor Fund), a series of Elessar Investment Trust. The performance shown for periods prior to June 26, 2015 reflects the performance of the Predecessor Fund's Institutional Class and Investor Class shares. The Predecessor Fund did not offer Class A or Class C shares. The performance shown for Class A and C shares prior to June 30, 2015 reflect the historical performance of the Predecessor Fund’s Institutional and Investor Shares since inception on October 15, 2012, calculated using the fees and expenses of Class A and C shares, respectively. |
(2) | Commencement Dates - Class A: 06/30/2015, Class C: 06/30/2015, Class Institutional: 10/15/2012, Class Investor:10/15/2012 |
(3) | Emerald Mutual Fund Advisers Trust (“Emerald” or the “Adviser”) has agreed contractually to waive a portion of its fees and reimburse other expenses until August 31, 2017 in amounts necessary to limit the Fund’s operating expenses (exclusive of Acquired Fund Fees and Expenses, brokerage expenses, interest expenses, taxes and extraordinary expense) for Class A, Class C, Institutional Class, and Investor Class shares to an annual rate (as percentage of the Fund’s average daily net assets) of 1.35%, 2.00%, 1.00% and 1.25% respectively. The Adviser will be permitted to recover, on a class-by-class basis, expenses it has borne through the agreement described above to the extent that the Fund's expenses in later periods fall below the annual rates set forth in the relevant agreement. The Fund will not be obligated to pay any such deferred fees and expenses more than three years after the year(s) in which the fees and expense were incurred. The Adviser may not discontinue this waiver prior to August 31, 2017, without the approval by the Fund's Board of Trustees. Ratios as of the Prospectus dated August 31, 2017 and may differ from the ratios presented in the Financial Highlights. |
| 8 | www.emeraldmutualfunds.com |
| Emerald Small Cap Value Fund | Manager Commentary |
April 30, 2017 (Unaudited)
(4) | The total annual fund operating expenses shown is as stated in the fund’s prospectus current as of the date of this report. The prospectus may vary from the expense ratio shown elsewhere in this report as the ratio’s per the prospectus are based on estimated future expenses as of the date of the prospectus. |
(5) | The Russell 2000® Value Index measures the performance of small-cap value segment of the U.S. equity universe. It includes those Russell 2000 companies with lower price-to-book ratios and lower forecasted growth values. The Index is not actively managed and does not reflect any deductions for fees, expenses or taxes. An investor may not invest directly into the Index. |
(6) | Excludes adjustments in accordance with accounting principles generally accepted in the United States of America and as such, the net asset value and total return for shareholder transactions reported to the market may differ from the net asset value for financial reporting purposes. |
Important Risks
Investing in smaller companies generally will present greater investment risks, including: greater price volatility, greater sensitivity to changing economic conditions and less liquidity than the securities of larger, more mature companies.
| Annual Report | April 30, 2017 | 9 |
| Emerald Small Cap Value Fund | Manager Commentary |
April 30, 2017 (Unaudited)
GROWTH OF $10,000 INVESTMENT IN THE FUND (for the period ended April 30, 2017)
Comparison of change in value of a $10,000 investment (includes applicable sales loads)
The chart represents historical performance of a hypothetical investment of $10,000 in the Fund since inception. Past performance does not guarantee future results. This chart does not reflect the deduction of taxes that a shareholder would pay on Fund distributions or the redemption of Fund shares.
Investing in the Fund is subject to investment risks, including possible loss of the principal amount invested.
| 10 | www.emeraldmutualfunds.com |
| Emerald Insights Fund | Manager Commentary |
April 30, 2017 (Unaudited)
April 30, 2017
Dear Shareholder:
Investment Results:
The performance of the Emerald Insights Fund’s Class A shares (without sales load), for the prior 12 months reflected a gain of 16.92%, outperforming the Russell MidCap® Growth Index(1) benchmark of 15.83% by 1.09%. Performance for the period was driven by outperformance in healthcare, technology, and consumer; with underperformance in producer durables and materials.
Investment Analysis:
The past year saw financial markets generally return to valuing fundamental performance rather than 2014/2015 where markets were largely dominated by macroeconomic concerns; and risk, either real or perceived, was demonized. Overall, midcap growth stocks continued their move higher off the February 2015 lows as global growth concerns abated and the appetite for risk increased. During the final quarter of the reporting period, growth stocks outperformed both value and core, and larger names led in all size segments. In the Russell MidCap Growth Index benchmark, higher quality names outperformed, as did companies with a larger percentage of foreign sales due to improved international activity and some evidence of global exchange rate stabilization.
Although domestic economic growth remained lackluster, economic indicators remained generally positive throughout the year, with consumer and business sentiment continuing to improve as a result of optimism on the implementation of a pro‐business Trump agenda. On the negative side, first quarter 2017 Gross Domestic Product (GDP) growth forecasts continued to be weak, with many economists attributing the weakness to measurement of first quarter seasonality. Loan growth, retail sales and auto sales were also weak with anemic loan growth, in particular, being a worrisome harbinger of potential future economic weakness.
Market Outlook:
We fundamentally believe that growth in earnings and revenues drives stock prices. Valuations continue to be favorable for the Emerald’s Insights Portfolio which still exhibits stronger forecasted earnings growth rates than the benchmark at discounted valuations multiples, giving us confidence in our portfolio positioning. M&A (Mergers and Acquisitions) remains robust with extremely low interest rates; ISM (Institute for Supply Management) and non‐manufacturing indicators continue to show strength; and business and consumer sentiment is near recent highs. In addition, jobless claims are at very low levels and all employment measures remain positive.
While we are generally positive on both the economy and the markets, we expect to capitalize on increased volatility by investing in quality companies that have company‐specific catalysts for growth. From a positioning perspective, we remain overweight Technology, Materials, Energy, and specific pockets of growth in both the Consumer Discretionary and Healthcare segments. We remain confident in our ability to identify growth companies with strong management teams and competitive advantages not properly valued or researched by the Street.
Our key premise when we started the Emerald Mid Cap Growth Strategy over eleven years ago was that mid‐caps offer better performance than large with less risk than small. We continue to believe that Emerald’s fundamental, bottom‐up research applied to mid‐cap equities should provide a compelling opportunity to produce attractive returns while mitigating some of the risks and volatility that can commonly be associated with small‐cap investing.
Top 5 Contributors: | Top 5 Detractors: | |
| Veeva Systems Inc Class A | Fitbit, Inc. Class A | |
| Incyte Corporation | Under Armour, Inc. Class A | |
| SVB Financial Group | Palo Alto Networks, Inc. | |
| NVIDIA Corporation | SM Energy Company | |
| Cepheid | Acuity Brands, Inc. | |
| | | |
| David A. Volpe, CFA | Stephen L. Amsterdam | Joseph Hovorka |
| Deputy Chief Investment Officer | Associate Portfolio Manager | Associate Portfolio Manager |
| Portfolio Manager | Portfolio Manager | |
| | | |
| Emerald Mutual Fund Advisers Trust | | |
| Annual Report | April 30, 2017 | 11 |
| Emerald Insights Fund | Manager Commentary |
April 30, 2017 (Unaudited)
Past performance does not guarantee future results. Fund prices fluctuate as the underlying assets have exposure to market fluctuations and other risks, as described in the Fund’s prospectus. Please visit www.emeraldmutualfunds.com to obtain current performance information and for the current prospectus and statement of additional information. This material must be preceded or accompanied by a prospectus. Please read the prospectus carefully before investing.
The views of Emerald Mutual Fund Advisers Trust and information discussed in this commentary are as of the date of publication, are subject to change, and may not reflect the writer's current views. The views expressed are those of the author only, and represent an assessment of market conditions at a specific point in time, are opinions only and should not be relied upon as investment advice regarding a particular investment or markets in general. Such information does not constitute a recommendation to buy or sell specific securities or investment vehicles. It should not be assumed that any investment will be profitable or will equal the performance of the Fund or any securities or any sectors mentioned in this letter. The subject matter contained in this letter has been derived from several sources believed to be reliable and accurate at the time of compilation. Neither Emerald Mutual Fund Advisers Trust nor the Fund accepts any liability for losses either direct or consequential caused by the use of this information.
Diversification does not eliminate the risk of experiencing investment losses.
The Emerald Insights Fund is distributed by ALPS Distributors, Inc.
The Fund is subject to investment risks, including possible loss of the principal amount invested and therefore is not suitable for all investors. The Fund may not achieve its objectives.
(1) | The Russell MidCap® Growth Index measures the performance of the mid-cap growth segment of the U.S. equity universe. It includes those Russell MidCap Index companies with higher price-to-book ratios and higher forecasted growth values. The Index is not actively managed and does not reflect any deductions for fees, expenses or taxes. An investor may not invest directly into the Index. |
| 12 | www.emeraldmutualfunds.com |
| Emerald Insights Fund | Manager Commentary |
April 30, 2017 (Unaudited)
TOP TEN HOLDINGS
(as a % of Net Assets)*
| MGM Resorts International | 2.48% |
| Affiliated Managers Group, Inc. | 2.06% |
| Wabtec Corp. | 2.04% |
| Dycom Industries, Inc. | 2.03% |
| Cinemark Holdings, Inc. | 2.02% |
| Broadcom Ltd. | 1.90% |
SBA Communications Corp., Class A | 1.89% |
| Acadia Healthcare Co., Inc. | 1.85% |
| Berry Global Group, Inc. | 1.82% |
| Six Flags Entertainment Corp. | 1.78% |
| Top Ten Holdings | 19.87% |
INDUSTRY SECTOR ALLOCATION
(as a % of Net Assets)
| Consumer Discretionary | 23.85% |
| Technology | 21.42% |
| Health Care | 13.74% |
| Financial Services | 11.23% |
| Producer Durables | 10.44% |
| Materials & Processing | 10.12% |
| Consumer Staples | 4.33% |
| Energy | 4.24% |
| Cash, Cash Equivalents, & Other Net Assets | 0.63% |
| * | Holdings are subject to change, and may not reflect the current or future position of the portfolio. |
AVERAGE ANNUAL TOTAL RETURN (for the period ended April 30, 2017)
| | | Since | Expense Ratio |
| | 1 Year | Inception(1) | Gross(2) | Net(2) |
| Class A (NAV) | 16.92% | 4.65% | 2.03% | 1.36% |
| Class A (MOP) | 11.41% | 2.81% | 2.03% | 1.36% |
Russell MidCap® Growth Index† | 15.83% | 8.79% | | |
| Class C (NAV) | 16.21% | 3.91% | 2.68% | 2.07% |
| Class C (CDSC) | 15.21% | 3.91% | 2.68% | 2.07% |
Russell MidCap® Growth Index† | 15.83% | 8.79% | | |
| Investor Class | 16.75% | 4.52% | 2.08% | 1.41% |
Russell MidCap® Growth Index† | 15.83% | 8.79% | | |
| Institutional Class | 17.27% | 4.92% | 1.73% | 1.06% |
Russell MidCap® Growth Index† | 15.83% | 8.79% | | |
The performance quoted represents past performance, does not guarantee future results and current performance may be lower or higher than the data quoted. The investment return and principal value of an investment will fluctuate so that shares, when redeemed, may be worth more or less than their original cost. Performance data current to the most recent month end may be obtained at www.emeraldmutualfunds.com.
The table does not reflect the deduction of taxes that a shareholder would pay on Fund distributions or the redemption of Fund shares.
Subject to investment risks, including possible loss of the principal amount invested.
Maximum Offering Price (MOP) for Class A shares includes the Fund's maximum sales charge of 4.75%. Performance shown at NAV does not include these sales charges and would have been lower had it been taken into account.
A Contingent Deferred Sales Charge (CDSC) of 1.00% may apply to Class C shares redeemed within the first 12 months after a purchase.
(1) | Inception Date – August 1, 2014. |
(2) | Emerald Mutual Fund Advisers Trust ("Emerald" or the "Adviser") has agreed contractually to waive a portion of its fees and reimburse other expenses until August 31, 2017 in amounts necessary to limit the Fund's operating expenses (exclusive of Acquired Fund Fees and Expenses, brokerage expenses, interest expenses, taxes and extraordinary expense) for Class A, Class C, Institutional Class, and Investor Class shares to an annual rate (as percentage of the Fund's average daily net assets) of 1.35%, 2.00%, 1.05% and 1.40% respectively. The Adviser will be permitted to recover, on a class-by-class basis, expenses it has borne through the agreement described above to the extent that the Fund's expenses in later periods fall below the annual rates set forth in the relevant agreement. The Fund will not be obligated to pay any such deferred fees and expenses more than three years after the year(s) in which the fees and expense were incurred. The Adviser may not discontinue this waiver prior to August 31, 2017, without the approval by the Fund's Board of Trustees. Ratios as of the Prospectus dated August 31, 2017 and may differ from the ratios presented in the Financial Highlights. |
| † | The Russell MidCap® Growth Index measures the performance of the mid-cap growth segment of the U.S. equity universe. It includes those Russell Midcap Index companies with higher price-to-book ratios and higher forecasted growth values. The Index is not actively managed and does not reflect any deductions for fees, expenses or taxes. An investor may not invest directly into the Index. |
Important Risks
Investing in smaller companies generally will present greater investment risks, including: greater price volatility, greater sensitivity to changing economic conditions and less liquidity than the securities of larger, more mature companies.
| Annual Report | April 30, 2017 | 13 |
| Emerald Insights Fund | Manager Commentary |
April 30, 2017 (Unaudited)
GROWTH OF $10,000 INVESTMENT IN THE FUND (for the period ended April 30, 2017)
Comparison of change in value of a $10,000 investment (includes applicable sales loads)
The chart represents historical performance of a hypothetical investment of $10,000 in the Fund since inception. Past performance does not guarantee future results. This chart does not reflect the deduction of taxes that a shareholder would pay on Fund distributions or the redemption of Fund shares.
Investing in the Fund is subject to investment risks, including possible loss of the principal amount invested.
| 14 | www.emeraldmutualfunds.com |
| Emerald Banking and Finance Fund | Manager Commentary |
| | April 30, 2017 (Unaudited) |
April 30, 2017
Dear Shareholder:
Investment Results
The Emerald Banking & Finance Fund outperformed the Russell 2000 Index(1) for the twelve months ended April 30, 2017, with the Fund’s A shares at no-load returning 33.10% vs. 25.63% for the Index. During the twelve months ended April 30, 2017, the Russell 2000 Financial Services Index(2) returned 27.87%; the SNL Small Cap U.S. Bank & Thrift Index(3) gained 37.30% versus a 17.92% gain delivered by the Standard & Poor’s 500 Index(4) and a gain of 27.18% for the Russell 2000® Value Index(5).
What a year it has been! Over the past twelve months bank stocks have had volatile moves and if an investor was not fully invested at all times he or she probably missed out on the impressive move by bank stocks in the fourth quarter of 2016. Banks spent the first three months of the fiscal year essentially trading flat as investors debated the strength of the U.S. economy and whether the Federal Reserve would raise rates at all in 2016. During the first half of the fiscal year short term rates held steady and asset sensitive banks, which benefit from increases in short term rates, fell out of favor. As a result, our portfolio, which is over-weighted in asset sensitive banks underperformed. The Fund’s performance also suffered from our decision not to invest in banks with energy exposure in their loan portfolio until we felt more certain that we had seen the peak of loan defaults that resulted from lower energy prices. We obviously showed an abundance of caution, in regard to energy exposed banks, and the market did not agree with us as banks with substantial energy loans were some of the best performing banks in the second and third calendar quarters of 2016. Our caution, while warranted, contributed to our underperformance of the SNL Small Cap U.S. Bank and Thrift Index(6) over the last twelve months.
Finally in September 2016, it became apparent that the Federal Reserve was more likely to raise rates in December 2016 and bank stocks began to climb. Enthusiasm for banks and a possible rate increase was muted however by the looming Presidential election and the uncertainty surrounding the election.
Upon President Trump’s win there appeared to be no more uncertainty in the market and the SNL Small Cap Bank and Thrift Index was up 22.53% from the election through the end of 2016. Investors bought small cap bank stock with the hopes of the banks benefitting from deregulation, lower corporate tax rates, increased interest rates and a strong economy. Bank investors finished calendar 2016 with high hopes. But so far bank stocks have not delivered in 2017 with the SNL Small Cap Bank and Thrift index down 1.12% through the end of the fiscal year as investors’ euphoria over the potential for tax cuts, regulatory roll backs and economic growth has faded.
We continue to have an overweight in asset sensitive banks, which is the result of being invested in banks that focus on commercial lending. Our position in these banks are not a play on trying to time interest rate increases but instead our preference for banks that have more of a commercial loan focus as they tend to be more growth oriented.
Investment Analysis
In the first quarter of 2017 most publicly traded community banks have reported improved efficiency ratios and return on average assets on a year over year basis. According to SNL: Data Dispatch, among major exchange traded banks and thrifts with less than $10 billion in assets, the median efficiency ratio fell to 63.90% for the first quarter, down from 65.49% in the year ago quarter. Meanwhile, the median return on average assets improved year over year to 0.90%, up from 0.87% over the same time frame. However, while most community banks are reporting increased profitability, net interest margin has slipped year over year. Median net interest margins for the same group of exchange traded banks with assets less than $10 billion fell to 3.51% compared to 3.55% a year ago. We believe the lower net interest margin is the result of slower loan growth in the first quarter of 2017, thus creating more cash sitting idle rather than being deployed into loans.
There is no doubt that slowing loan growth raises concerns about the durability of the economic recovery. The last six months have offered banks greater opportunities to put liquidity to work in their securities portfolios at more attractive yields than were available throughout much of 2016. The pickup in yield was welcome with loan growth remaining relatively weak over the last two quarters, despite improving customer and business sentiment in the aftermath of the U.S. presidential election.
It seems that stronger loan growth failed to materialize in the remaining months of the first quarter of 2017. The Federal Reserve's latest H.8 release, which tracks commercial bank balances through March 28, shows that loans have grown by 0.4% since Sept. 28, two days before the end of the third quarter, while securities have grown 1.1% during the same time frame. Over the last year, loans have grown by 3.8% and securities have increased by 6.8%, according to the Fed data.
As securities have continued to grow, banks have seen their securities portfolios move underwater due to rising long-term rates. Long-term rates have risen considerably off lows reported in the summer of 2016, when the U.K.'s decision to leave the European Union sparked a flight to quality in the markets and sent the yield on the 10-year Treasury down to 1.37%. However, since then, long-term rates have increased by more than 120 basis points at one point, primarily driven by Donald Trump's surprise victory in the U.S. presidential election. We believe rates surged as the market weighed the prospect of stronger economic growth coming from fiscal stimulus as well as a higher deficit stemming from increased infrastructure spending coupled with tax cuts.
| Annual Report | April 30, 2017 | | 15 |
| Emerald Banking and Finance Fund | Manager Commentary |
| | April 30, 2017 (Unaudited) |
Since then, major U.S. policy changes have not come to pass. The administration and Republican controlled Congress have struggled to unify over such issues such as healthcare reform and geopolitical risk and uncertainty have also come back into market discussions.
Market Outlook
The Federal Reserve has continued to move forward with its tightening bias, raising the federal funds rate in December 2016 and March 2017. We believe that investors continue to expect additional rate increases later in 2017 and many financial institutions have positioned their balance sheets to benefit from higher interest rates. We believe that banks will likely see higher yields on newly originated loans and should see yields on variable rate loans move higher.
The fund has a number of bank holdings with loan portfolios that are tied to benchmark rates such as the London Interbank Offered Rate or LIBOR, which has risen considerably over much of the last year. While LIBOR moved higher ahead of the Fed’s rate increase in December 2015, it decoupled from the fed funds rate in the summer of 2016 and rose further in the months leading up to planned money market reform in October 2016. That regulation required prime institutional money market funds’ asset values to float, which spurred significant outflows in prime money market funds and into government money market funds thus pushing LIBOR higher. Since July 2016, three month LIBOR raised more than 50 basis points or nearly in line with the two rate hikes by the Federal Reserve in December 2016 and March 2017.
We believe the increase in short term rates helped drive net interest income higher for community banks in the first calendar quarter of 2017. We believe that where bank stocks go next may depend on two factors, how quickly short term interest rates rise and how rapidly loan growth can stabilize and return to previous levels.
Our focus remains on seeking companies capable of producing above average organic growth, relatively stable net interest margins, and improving earnings power aided by lower efficiency ratios, with potential for accretive mergers & acquisitions activity, as we deploy Emerald’s 10-Step research process to seek out companies in this market environment that are poised for the potential of higher short-term interest rates.
Top Five Contributors to Return Included | Top Five Detractors to Return Included |
| SVB Financial Group | Opus Bank |
| Meta Financial Group, Inc. | Baylake Corp. |
| ServisFirst Bancshares Inc | First NBC Bank Holding Co. |
| National Commerce Corp. (Alabama) | BankUnited, Inc. |
| Ameris Bancorp | Virtu Financial, Inc. Class A |
| | |
| Kenneth G. Mertz II, CFA | Steven E. Russell, Esq. |
| Chief Investment Officer | Portfolio Manager |
| Portfolio Manager | |
| | |
| Emerald Mutual Fund Advisers Trust | |
Past performance does not guarantee future results. Fund prices fluctuate as the underlying assets have exposure to market fluctuations and other risks, as described in the Fund’s prospectus. Please visit www.emeraldmutualfunds.com to obtain current performance information and for the current prospectus and statement of additional information.
The views of Emerald Mutual Fund Advisers Trust and information discussed in this commentary are as of the date of publication, are subject to change, and may not reflect the writer's current views. The views expressed are those of the author only, and represent an assessment of market conditions at a specific point in time, are opinions only and should not be relied upon as investment advice regarding a particular investment or markets in general. Such information does not constitute a recommendation to buy or sell specific securities or investment vehicles. It should not be assumed that any investment will be profitable or will equal the performance of the Fund or any securities or any sectors mentioned in this letter. The subject matter contained in this letter has been derived from several sources believed to be reliable and accurate at the time of compilation. Neither Emerald Mutual Fund Advisers Trust nor the Fund accepts any liability for losses either direct or consequential caused by the use of this information.
| 16 | www.emeraldmutualfunds.com | |
| Emerald Banking and Finance Fund | Manager Commentary |
| | April 30, 2017 (Unaudited) |
Diversification does not eliminate the risk of experiencing investment losses.
The Emerald Banking and Finance Fund is distributed by ALPS Distributors, Inc.
The Fund is subject to investment risks, including possible loss of the principal amount invested and therefore is not suitable for all investors. The Fund may not achieve its objectives.
(1) | The Russell 2000® Index measures the performance of the small-cap segment of the U.S. equity universe. The Russell 2000® Index is a subset of the Russell 3000® Index representing approximately 10% of the total market capitalization of that index. It includes approximately 2000 of the smallest securities based on a combination of their market cap and current index membership. The Index is not actively managed and does not reflect any deduction of fees, expenses or taxes. An investor may not invest directly into the Index. |
(2) | The Russell 2000® Financial Services TR Index – is comprised of the smallest financial services companies in the Russell 3000 Index. The Index is not actively managed and does not reflect any deductions for fees, expense, or taxes. An investor may not invest directly in the Index. |
(3) | SNL Small Cap Bank & Thrift Index: Includes all publicly traded (NYSE, NYSE Amex, NASDAQ, OTC BB, Pink Sheets) Banks and Thrifts in SNL's coverage universe with $250M to $1B Total Common Market Capitalization as of most recent pricing data. Source: SNL Financial, data as of April 30, 2016. |
(4) | The Standard & Poor’s 500® Index is an unmanaged index of 500 common stocks chosen for the market size, liquidity and industry group representation. It is a market-value weighted index. The Index is not actively managed and does not reflect any deduction for fees, expenses or taxes. An investor may not invest directly into the Index. |
(5) | The Russell 2000® Value Index measures the performance of small-cap value segment of the U.S. equity universe. It includes those Russell 2000 companies with lower price-to-book ratios and lower forecasted growth values. The Index is not actively managed and does not reflect any deductions for fees, expenses or taxes. An investor may not invest directly into the Index. |
(6) | SNL Small Cap Bank & Thrift Index: Includes all publicly traded Banks and Thrifts in SNL's coverage universe with $250M to $1B Total Common Market Capitalization as of most recent pricing data. Source: SNL Financial, data as of April 30, 2017. |
| Annual Report | April 30, 2017 | 17 |
| Emerald Banking and Finance Fund | Manager Commentary |
| | April 30, 2017 (Unaudited) |
TOP TEN HOLDINGS (as a % of Net Assets)* | |
| Bank of the Ozarks, Inc. | 3.19% |
| Meta Financial Group, Inc. | 2.80% |
| SVB Financial Group | 2.77% |
| Home BancShares, Inc. | 2.40% |
| Eagle Bancorp, Inc. | 2.15% |
| Ameris Bancorp | 2.08% |
| ServisFirst Bancshares, Inc. | 2.07% |
| LendingTree, Inc. | 2.00% |
| National Commerce Corp. | 1.98% |
| Customers Bancorp, Inc. | 1.93% |
| Top Ten Holdings | 23.37% |
INDUSTRY SECTOR ALLOCATION
(as a % of Net Assets)
| Banks: Diversified | 78.50% |
| Banks: Savings, Thrift & Mortgage Lending | 10.60% |
| Insurance: Property-Casualty | 2.09% |
| Consumer Lending | 2.00% |
| Diversified Financial Services | 1.85% |
| Real Estate Investment Trusts (REITs) | 1.37% |
| Asset Management & Custodian | 0.94% |
| Computer Service Software & Systems | 0.53% |
| Insurance: Multi Line | 0.47% |
| Cash, Cash Equivalents, & Other Net Assets | 1.65% |
| * | Holdings are subject to change, and may not reflect the current or future position of the portfolio. |
| AVERAGE ANNUAL TOTAL RETURN (for the period ended April 30, 2017) |
| | 1 Year | 3 Year | 5 Year | 10 Year | Since | Expense Ratio |
| | Inception(1) | Gross(2) | Net(2) |
| Class A (NAV) | 33.10%(3) | 16.81% | 19.67% | 5.90% | 9.53% | 1.49% | 1.49% |
| Class A (MOP) | 26.77% | 14.94% | 18.50% | 5.39% | 9.27% | 1.49% | 1.49% |
Russell 2000® Index† | 25.63% | 9.04% | 12.95% | 7.05% | 8.23% | | |
Russell 2000® Financial Services TR Index†† | 27.87% | 13.36% | 15.31% | 5.61% | 8.94% | | |
| Class C (NAV) | 32.23% | 16.05% | 18.89% | 5.22% | 9.81% | 2.14% | 2.14% |
| Class C (CDSC) | 31.23% | 16.05% | 18.89% | 5.22% | 9.81% | 2.14% | 2.14% |
Russell 2000® Index† | 25.63% | 9.04% | 12.95% | 7.05% | 7.53% | | |
Russell 2000® Financial Services TR Index†† | 27.87% | 13.36% | 15.31% | 5.61% | 10.01% | | |
| Investor Class | 33.09% | 16.81% | 19.66% | – | 14.87% | 1.54% | 1.54% |
Russell 2000® Index† | 25.63% | 9.04% | 12.95% | – | 12.20% | | |
Russell 2000® Financial Services TR Index†† | 27.87% | 13.36% | 15.31% | – | 13.18% | | |
| Institutional Class | 33.51%(3) | 17.19% | 20.06% | – | 19.72% | 1.19% | 1.19% |
Russell 2000® Index† | 25.63% | 9.04% | 12.95% | – | 12.12% | | |
Russell 2000® Financial Services TR Index†† | 27.87% | 13.36% | 15.31% | – | 14.88% | | |
The performance quoted represents past performance, does not guarantee future results and current performance may be lower or higher than the data quoted. The investment return and principal value of an investment will fluctuate so that shares, when redeemed, may be worth more or less than their original cost. Performance data current to the most recent month end may be obtained at www.emeraldmutualfunds.com.
Performance shown for periods prior to March 16, 2012, reflects the performance of the Forward Banking & Finance Fund, a series of Forward Funds (as a result of a reorganization of the Forward Banking & Finance Fund into the Emerald Banking & Finance Fund).
The table does not reflect the deduction of taxes that a shareholder would pay on Fund distributions or the redemption of Fund shares.
Subject to investment risks, including possible loss of the principal amount invested.
Maximum Offering Price (MOP) for Class A shares includes the Fund's maximum sales charge of 4.75%. Performance shown at NAV does not include these sales charges and would have been lower had it been taken into account.
A Contingent Deferred Sales Charge (CDSC) of 1.00% may apply to Class C shares redeemed within the first 12 months after a purchase.
(1) | Inception Dates - Class A: 02/18/1997, Class C: 07/01/2000, Class Institutional: 03/19/2012, Class Investor: 03/16/2010 |
(2) | Emerald Mutual Fund Advisers Trust ("Emerald" or the "Adviser") has agreed contractually to waive a portion of its fees and reimburse other expenses until August 31, 2017 in amounts necessary to limit the Fund's operating expenses (exclusive of Acquired Fund Fees and Expenses, brokerage expenses, interest expenses, taxes and extraordinary expense) for Class A, Class C, Institutional Class, and Investor Class shares to an annual rate (as percentage of the Fund's average daily net assets) of 1.84%, 2.49%, 1.54% and 1.89% respectively. The Adviser will be permitted to recover, on a class-by-class basis, expenses it has borne through the agreement described above to the extent that the Fund's expenses in later periods fall below the annual rates set forth in the relevant agreement. The Fund will not be obligated to pay any such deferred fees and expenses more than three years after the year(s) in which the fees and expense were incurred. The Adviser may not discontinue this waiver prior to August 31, 2017, without the approval by the Fund's Board of Trustees. Ratios as of the Prospectus dated August 31, 2017 and may differ from the ratios presented in the Financial Highlights. |
| 18 | www.emeraldmutualfunds.com |
| Emerald Banking and Finance Fund | Manager Commentary |
| | April 30, 2017 (Unaudited) |
(3) | Excludes adjustments in accordance with accounting principles generally accepted in the United States of America and as such, the net asset value and total return for shareholder transactions reported to the market may differ from the net asset value for financial reporting purposes. |
| † | The Russell 2000® Index measures the performance of the small-cap segment of the U.S. equity universe. The Russell 2000® is a subset of the Russell 3000® Index representing approximately 8% of the total market capitalization of that index. It includes approximately 2000 of the smallest securities based on a combination of their market cap and current index membership. The index is not actively managed and does not reflect any deductions for fees, expenses or taxes. An investor may not invest directly into an index. |
| †† | The Russell 2000® Financial Services TR Index is comprised of the smallest financial services companies in the Russell 3000 Index. The Index is not actively managed and does not reflect any deductions for fees, expense, or taxes. An investor may not invest directly in the Index. |
Important Risks
A fund that concentrates in a particular industry will involve a greater degree of risk than a fund with a more diversified portfolio. Investing in smaller companies generally will present greater investment risks, including: greater price volatility, greater sensitivity to changing economic conditions and less liquidity than the securities of larger, more mature companies.
| Annual Report | April 30, 2017 | 19 |
| Emerald Banking and Finance Fund | Manager Commentary |
| | April 30, 2017 (Unaudited) |
GROWTH OF $10,000 INVESTMENT IN THE FUND (for the period ended April 30, 2017) |
| Comparison of change in value of a $10,000 investment (includes applicable sales loads) |
The chart represents historical performance of a hypothetical investment of $10,000 in the Fund since inception. Past performance does not guarantee future results. This chart does not reflect the deduction of taxes that a shareholder would pay on Fund distributions or the redemption of Fund shares.
Investing in the Fund is subject to investment risks, including possible loss of the principal amount invested.
| 20 | www.emeraldmutualfunds.com |
| Emerald Funds | Disclosure of Fund Expenses |
| | April 30, 2017 (Unaudited) |
As a shareholder of the Funds, you incur two types of costs: (1) transaction costs, including applicable sales charges (loads); and (2) ongoing costs, including management fees, distribution and service (12b-1) fees, shareholder services fees and other Fund expenses. This example is intended to help you understand your ongoing costs (in dollars) of investing in the Funds and to compare these costs with the ongoing costs of investing in other mutual funds. The example is based on an investment of $1,000 invested at the beginning of the (six-month) period and held for the entire period November 1, 2016 through April 30, 2017.
Actual Expenses
The first line for each share class of the Fund in the table below provides information about actual account values and actual expenses. You may use this information, together with the amount you invested, to estimate the expenses that you paid over the period. Simply divide your account value by $1,000 (for example, an $8,600 account value divided by $1,000 = 8.6), then multiply the result by the number in the applicable line under the heading titled “Expenses Paid During Period” to estimate the expenses you paid on your account during this period.
Hypothetical Example For Comparison Purposes
The second line for each share class of each Fund in the table below provides information about hypothetical account values and hypothetical expenses based on the Fund’s actual expense ratio and an assumed rate of return of 5% per year before expenses, which is not the Fund’s actual return. The hypothetical account values and expenses may not be used to estimate the actual ending account balance or expenses you paid for the period. You may use this information to compare the ongoing costs of investing in the Funds and other funds. To do so, compare this 5% hypothetical example with the 5% hypothetical examples that appear in the shareholder reports of other mutual funds.
Please note that the expenses shown in the table below are meant to highlight your ongoing costs only and do not reflect any transactional costs, such as sales charges (loads), redemption fees or exchange fees. Therefore, the second line for each share class of the Fund within the table is useful in comparing ongoing costs only, and will not help you determine the relative total costs of owning different funds. If these transactional costs were included, your costs would have been higher.
| Emerald Growth Fund | Beginning Account Value 11/01/16 | Ending Account Value 04/30/17 | Expense Ratio(a) | Expense Paid During Period 11/01/16 - 4/30/17(b) |
| Class A | | | | |
| Actual | $1,000.00 | $1,177.50 | 1.06% | $5.72 |
| Hypothetical (5% return before expenses) | $1,000.00 | $1,019.54 | 1.06% | $5.31 |
| Class C | | | | |
| Actual | $1,000.00 | $1,173.30 | 1.71% | $9.21 |
| Hypothetical (5% return before expenses) | $1,000.00 | $1,016.31 | 1.71% | $8.55 |
| Institutional Class | | | | |
| Actual | $1,000.00 | $1,179.30 | 0.74% | $4.00 |
| Hypothetical (5% return before expenses) | $1,000.00 | $1,021.12 | 0.74% | $3.71 |
| Investor Class | | | | |
| Actual | $1,000.00 | $1,176.90 | 1.09% | $5.88 |
| Hypothetical (5% return before expenses) | $1,000.00 | $1,019.39 | 1.09% | $5.46 |
| | | | | |
| Emerald Small Cap Value Fund | | | | |
| Class A | | | | |
| Actual | $1,000.00 | $1,213.30 | 1.35% | $7.41 |
| Hypothetical (5% return before expenses) | $1,000.00 | $1,018.10 | 1.35% | $6.76 |
| Class C | | | | |
| Actual | $1,000.00 | $1,210.50 | 2.00% | $10.96 |
| Hypothetical (5% return before expenses) | $1,000.00 | $1,014.88 | 2.00% | $9.99 |
| Institutional Class | | | | |
| Actual | $1,000.00 | $1,215.60 | 1.00% | $5.49 |
| Hypothetical (5% return before expenses) | $1,000.00 | $1,019.84 | 1.00% | $5.01 |
| Investor Class | | | | |
| Actual | $1,000.00 | $1,214.30 | 1.25% | $6.86 |
| Hypothetical (5% return before expenses) | $1,000.00 | $1,018.60 | 1.25% | $6.26 |
| Annual Report | April 30, 2017 | 21 |
| Emerald Funds | Disclosure of Fund Expenses |
| | April 30, 2017 (Unaudited) |
| Emerald Insights Fund | Beginning Account Value 11/01/16 | Ending Account Value 04/30/17 | Expense Ratio(a) | Expense Paid During Period 11/01/16 - 4/30/17(b) |
| Class A | | | | |
| Actual | $1,000.00 | $1,133.00 | 1.35% | $7.14 |
| Hypothetical (5% return before expenses) | $1,000.00 | $1,018.10 | 1.35% | $6.76 |
| Class C | | | | |
| Actual | $1,000.00 | $1,129.10 | 2.00% | $10.56 |
| Hypothetical (5% return before expenses) | $1,000.00 | $1,014.88 | 2.00% | $9.99 |
| Institutional Class | | | | |
| Actual | $1,000.00 | $1,134.20 | 1.05% | $5.56 |
| Hypothetical (5% return before expenses) | $1,000.00 | $1,019.59 | 1.05% | $5.26 |
| Investor Class | | | | |
| Actual | $1,000.00 | $1,131.30 | 1.40% | $7.40 |
| Hypothetical (5% return before expenses) | $1,000.00 | $1,017.85 | 1.40% | $7.00 |
| | | | | |
| Emerald Banking and Finance Fund | | | | |
| Class A | | | | |
| Actual | $1,000.00 | $1,285.10 | 1.41% | $7.99 |
| Hypothetical (5% return before expenses) | $1,000.00 | $1,017.80 | 1.41% | $7.05 |
| Class C | | | | |
| Actual | $1,000.00 | $1,281.00 | 2.06% | $11.65 |
| Hypothetical (5% return before expenses) | $1,000.00 | $1,014.58 | 2.06% | $10.29 |
| Institutional Class | | | | |
| Actual | $1,000.00 | $1,287.30 | 1.06% | $6.01 |
| Hypothetical (5% return before expenses) | $1,000.00 | $1,019.54 | 1.06% | $5.31 |
| Investor Class | | | | |
| Actual | $1,000.00 | $1,285.80 | 1.37% | $7.76 |
| Hypothetical (5% return before expenses) | $1,000.00 | $1,018.00 | 1.37% | $6.85 |
(a) | The Fund's expense ratios have been based on the Fund's most recent fiscal half-year expenses. |
(b) | Expenses are equal to the Fund's annualized expense ratio multiplied by the average account value over the period, multiplied by the number of days in the most recent fiscal half-year (181)/365 (to reflect the half-year period). |
| 22 | www.emeraldmutualfunds.com |
| Emerald Growth Fund | Schedule of Investments |
April 30, 2017
| Shares | | | | Value
(Note 2) | |
| COMMON STOCKS: 98.51% | | | | |
| Consumer Discretionary: 16.45% | | | | |
| | 335,870 | | American Eagle Outfitters, Inc. | | $ | 4,732,408 | |
| | 109,372 | | Burlington Stores, Inc.(a) | | | 10,819,078 | |
| | 111,468 | | Camping World Holdings, Inc., Class A | | | 3,446,591 | |
| | 1,299,906 | | Chegg, Inc.(a) | | | 11,712,153 | |
| | 30,227 | | Churchill Downs, Inc. | | | 5,041,864 | |
| | 170,299 | | Chuy's Holdings, Inc.(a) | | | 5,074,910 | |
| | 58,972 | | Dave & Buster's Entertainment, Inc.(a) | | | 3,774,798 | |
| | 223,492 | | Five Below, Inc.(a) | | | 10,977,927 | |
| | 97,994 | | Jack in the Box, Inc. | | | 9,992,448 | |
| | 185,501 | | Kate Spade & Co.(a) | | | 3,227,718 | |
| | 400,659 | | Kona Grill, Inc.(a) | | | 2,283,756 | |
| | 120,709 | | Leaf Group Ltd.(a) | | | 1,007,920 | |
| | 274,130 | | Marcus Corp. | | | 9,265,594 | |
| | 123,144 | | Matthews International Corp., Class A | | | 8,441,521 | |
| | 56,926 | | Meritage Homes Corp.(a) | | | 2,217,268 | |
| | 220,609 | | Nexstar Broadcasting Group, Inc., Class A | | | 15,222,021 | |
| | 282,212 | | NutriSystem, Inc. | | | 15,084,231 | |
| | 286,182 | | Ollie's Bargain Outlet Holdings, Inc.(a) | | | 10,960,771 | |
| | 141,833 | | Penn National Gaming, Inc.(a) | | | 2,621,074 | |
| | 328,673 | | Planet Fitness, Inc., Class A | | | 6,836,398 | |
| | 24,136 | | Red Robin Gourmet Burgers, Inc.(a) | | | 1,417,990 | |
| | 642,736 | | Sequential Brands Group, Inc.(a) | | | 2,166,020 | |
| | 192,044 | | Steven Madden Ltd.(a) | | | 7,307,274 | |
| | 460,803 | | Tile Shop Holdings, Inc. | | | 9,838,144 | |
| | 374,058 | | Tilly's, Inc., Class A | | | 3,575,995 | |
| | | | | | | 167,045,872 | |
| | | | | | | | |
| Consumer Staples: 0.92% | | | | |
| | 207,709 | | Freshpet, Inc.(a) | | | 2,440,581 | |
| | 403,374 | | Hostess Brands, Inc.(a) | | | 6,913,830 | |
| | | | | | | 9,354,411 | |
| | | | | | | | |
| Energy: 1.21% | | | | |
| | 650,503 | | Callon Petroleum Co.(a) | | | 7,701,955 | |
| | 268,600 | | Enphase Energy, Inc.(a) | | | 319,634 | |
| | 305,796 | | Keane Group, Inc.(a) | | | 4,226,101 | |
| | | | | | | 12,247,690 | |
| | | | | | | | |
| Financial Services: 13.09% | | | | |
| | 425,431 | | Bank of the Ozarks, Inc. | | | 20,195,210 | |
| | 596,416 | | Bofl Holding, Inc.(a) | | | 14,248,378 | |
| | 499,417 | | CareTrust REIT, Inc., REIT | | | 8,500,077 | |
| | 203,274 | | Customers Bancorp, Inc.(a) | | | 6,287,265 | |
| | 231,851 | | FCB Financial Holdings, Inc., Class A(a) | | | 10,954,960 | |
| | 122,502 | | First Choice Bank | | | 2,495,978 | |
| Shares | | | | Value
(Note 2) | |
| Financial Services (continued) | | | | |
| | 201,223 | | Health Insurance Innovations, Inc., Class A(a) | | $ | 3,370,485 | |
| | 148,203 | | Howard Bancorp, Inc.(a) | | | 2,778,806 | |
| | 142,835 | | LendingTree, Inc.(a) | | | 20,125,452 | |
| | 59,675 | | MedEquities Realty Trust, Inc., REIT | | | 705,359 | |
| | 214,690 | | Moelis & Co., Class A | | | 7,879,123 | |
| | 144,926 | | National Commerce Corp.(a) | | | 5,608,636 | |
| | 98,594 | | Opus Bank | | | 2,223,295 | |
| | 278,556 | | Pacific Premier Bancorp, Inc.(a) | | | 10,181,222 | |
| | 227,198 | | QTS Realty Trust, Inc., REIT, Class A | | | 12,141,461 | |
| | 74,313 | | Wintrust Financial Corp. | | | 5,265,819 | |
| | | | | | | 132,961,526 | |
| | | | | | | | |
| Health Care: 14.86% | | | | |
| | 345,958 | | Adamas Pharmaceuticals, Inc.(a) | | | 5,666,792 | |
| | 269,802 | | Aimmune Therapeutics, Inc.(a) | | | 5,244,951 | |
| | 276,046 | | Albany Molecular Research, Inc.(a) | | | 4,419,496 | |
| | 235,523 | | Alder Biopharmaceuticals, Inc.(a) | | | 4,722,236 | |
| | 280,917 | | AtriCure, Inc.(a) | | | 5,758,798 | |
| | 165,807 | | AxoGen, Inc.(a) | | | 2,022,845 | |
| | 24,184 | | Bluebird Bio, Inc.(a) | | | 2,151,167 | |
| | 500,000 | | Bovie Medical Corp.(a) | | | 1,350,000 | |
| | 59,880 | | Clovis Oncology, Inc.(a) | | | 3,466,453 | |
| | 283,359 | | Exelixis, Inc.(a) | | | 6,347,242 | |
| | 603,545 | | Insmed, Inc.(a) | | | 11,135,405 | |
| | 159,196 | | Integer Holdings Corp.(a) | | | 5,850,453 | |
| | 545,268 | | K2M Group Holdings, Inc.(a) | | | 12,077,686 | |
| | 198,252 | | MacroGenics, Inc.(a) | | | 4,284,226 | |
| | 227,337 | | NantHealth, Inc.(a) | | | 707,018 | |
| | 495,249 | | NeoGenomics, Inc.(a) | | | 3,739,130 | |
| | 47,851 | | Neurocrine Biosciences, Inc.(a) | | | 2,555,243 | |
| | 33,353 | | Obalon Therapeutics, Inc.(a) | | | 354,209 | |
| | 119,246 | | Portola Pharmaceuticals, Inc.(a) | | | 4,768,648 | |
| | 115,611 | | Puma Biotechnology, Inc.(a) | | | 4,693,807 | |
| | 161,398 | | Reata Pharmaceuticals, Inc., Class A(a) | | | 3,347,395 | |
| | 76,839 | | Sage Therapeutics, Inc.(a) | | | 5,455,569 | |
| | 379,884 | | Sarepta Therapeutics, Inc.(a) | | | 13,774,594 | |
| | 129,090 | | Tabula Rasa HealthCare, Inc.(a) | | | 1,740,133 | |
| | 285,399 | | Teladoc, Inc.(a) | | | 7,077,895 | |
| | 525,437 | | Veeva Systems, Inc., Class A(a) | | | 28,173,932 | |
| | | | | | | 150,885,323 | |
| | | | | | | | |
| Materials & Processing: 11.52% | | | | |
| | 356,650 | | Apogee Enterprises, Inc. | | | 19,437,425 | |
| | 738,410 | | Cliffs Natural Resources, Inc.(a) | | | 4,962,115 | |
| | 302,530 | | GMS, Inc.(a) | | | 10,939,485 | |
| | 70,919 | | Innospec, Inc. | | | 4,680,654 | |
| | 435,435 | | Installed Building Products, Inc.(a) | | | 23,230,457 | |
| | 167,977 | | Masonite International Corp.(a) | | | 13,975,686 | |
| | 364,238 | | TimkenSteel Corp.(a) | | | 5,492,709 | |
| | 247,598 | | Trex Co., Inc.(a) | | | 18,121,698 | |
| | 175,344 | | US Concrete, Inc.(a) | | | 10,871,328 | |
| Annual Report | April 30, 2017 | 23 |
| Emerald Growth Fund | Schedule of Investments |
April 30, 2017
| Shares | | | | Value
(Note 2) | |
| Materials & Processing (continued) | | | | |
| | 127,880 | | US Silica Holdings, Inc. | | $ | 5,307,020 | |
| | | | | | | 117,018,577 | |
| | | | | | | | |
| Producer Durables: 10.50% | | | | |
| | 47,752 | | Blue Bird Corp.(a) | | | 888,187 | |
| | 139,909 | | Dycom Industries, Inc.(a) | | | 14,782,785 | |
| | 41,211 | | Generac Holdings, Inc.(a) | | | 1,449,391 | |
| | 204,195 | | Kennametal, Inc. | | | 8,490,428 | |
| | 234,253 | | KLX, Inc.(a) | | | 11,080,167 | |
| | 44,340 | | Knoll, Inc. | | | 1,062,386 | |
| | 958,052 | | Kratos Defense & Security Solutions, Inc.(a) | | | 7,300,356 | |
| | 27,318 | | NV5 Global, Inc.(a) | | | 1,057,207 | |
| | 408,542 | | Primoris Services Corp. | | | 9,384,210 | |
| | 267,780 | | Spirit Airlines, Inc.(a) | | | 15,335,761 | |
| | 101,381 | | Tennant Co. | | | 7,426,158 | |
| | 260,264 | | Tetra Tech, Inc. | | | 11,438,603 | |
| | 637,544 | | The Manitowoc Co. Inc(a) | | | 3,806,138 | |
| | 427,612 | | Tutor Perini Corp.(a) | | | 13,191,830 | |
| | | | | | | 106,693,607 | |
| | | | | | | | |
| Technology: 25.54% | | | | |
| | 223,006 | | Alarm.com Holdings, Inc.(a) | | | 7,272,226 | |
| | 113,352 | | Applied Optoelectronics, Inc.(a) | | | 5,598,455 | |
| | 213,462 | | Cavium, Inc.(a) | | | 14,696,859 | |
| | 266,359 | | ChannelAdvisor Corp.(a) | | | 3,143,036 | |
| | 490,502 | | Ciena Corp.(a) | | | 11,237,401 | |
| | 69,170 | | Cirrus Logic, Inc.(a) | | | 4,451,090 | |
| | 67,320 | | Cloudera, Inc.(a) | | | 1,218,492 | |
| | 46,218 | | Coherent, Inc.(a) | | | 9,964,601 | |
| | 43,217 | | Ellie Mae, Inc.(a) | | | 4,397,762 | |
| | 215,379 | | EPAM Systems, Inc.(a) | | | 16,584,183 | |
| | 459,324 | | GTT Communications, Inc.(a) | | | 12,631,410 | |
| | 148,119 | | Guidewire Software, Inc.(a) | | | 9,107,837 | |
| | 271,739 | | Imperva, Inc.(a) | | | 12,078,799 | |
| | 50,834 | | Inphi Corp.(a) | | | 2,105,544 | |
| | 75,635 | | IPG Photonics Corp.(a) | | | 9,554,213 | |
| | 279,668 | | Lumentum Holdings, Inc.(a) | | | 11,955,807 | |
| | 170,268 | | MACOM Technology Solutions
Holdings, Inc.(a) | | | 8,322,700 | |
| | 201,580 | | MaxLinear, Inc., Class A(a) | | | 5,609,972 | |
| | 317,635 | | Mercury Systems, Inc.(a) | | | 11,873,196 | |
| | 390,000 | | Microsemi Corp.(a) | | | 18,306,600 | |
| | 83,938 | | MicroStrategy, Inc., Class A(a) | | | 15,962,490 | |
| | 311,360 | | Model N, Inc.(a) | | | 3,331,552 | |
| | 125,000 | | MuleSoft, Inc., Class A(a) | | | 2,880,000 | |
| | 803,234 | | Oclaro, Inc.(a) | | | 6,433,904 | |
| | 184,820 | | Proofpoint, Inc.(a) | | | 13,929,883 | |
| | 130,010 | | Quantenna Communications, Inc.(a) | | | 2,392,184 | |
| | 221,026 | | Reis, Inc. | | | 4,155,289 | |
| | 239,119 | | Take‐Two Interactive Software,
Inc.(a) | | | 15,028,629 | |
| | 330,261 | | Varonis Systems, Inc.(a) | | | 10,370,195 | |
| Shares | | | | | Value
(Note 2) | |
| Technology (continued) | | | | |
| | 371,984 | | Xactly Corp.(a) | | $ | 4,315,014 | |
| | 30,000 | | Yext, Inc.(a) | | | 445,200 | |
| | | | | | | 259,354,523 | |
| | | | | | | | |
| Utilities: 4.42% | | | | |
| | 1,192,146 | | 8x8, Inc.(a) | | | 17,345,724 | |
| | 261,288 | | Cogent Communications Holdings, Inc. | | | 11,757,960 | |
| | 2,361,265 | | Vonage Holdings Corp.(a) | | | 15,844,088 | |
| | | | | | | 44,947,772 | |
| | | | | | | | |
| | | | Total Common Stocks
(Cost $771,694,594) | | | 1,000,509,301 | |
| | | | | | | | |
| SHORT TERM INVESTMENTS: 2.02% | | | | |
| | 20,498,543 | | Dreyfus Government Cash Management Fund ‐ Institutional Class 0.683% (7‐Day Yield) | | | 20,498,543 | |
| | | | | | | | |
| | | | Total Short Term Investments
(Cost $20,498,543) | | | 20,498,543 | |
| | | | | | | | |
Total Investments: 100.53%
(Cost $792,193,137) | | | 1,021,007,844 | |
| | | | | | | | |
| Liabilities In Excess Of Other Assets: (0.53)% | | | (5,393,621 | ) |
| Net Assets: 100.00% | | $ | 1,015,614,223 | |
(a) | Non-income producing security. |
For Fund compliance purposes, the Fund's industry classifications refer to any one or more of the industry sub-classifications used by one or more widely recognized market indexes or ratings group indexes, and/or as defined by Fund management. This definition may not apply for purposes of this report, which may combine industry sub-classifications for reporting ease. Industries are shown as a percentage of net assets.
See Notes to Financial Statements.
| 24 | www.emeraldmutualfunds.com |
| Emerald Small Cap Value Fund | Schedule of Investments |
April 30, 2017
| Shares | | | | Value
(Note 2) | |
| COMMON STOCKS: 99.08% | | | | |
| Consumer Discretionary: 12.35% | | | | |
| | 4,615 | | Carriage Services, Inc. | | $ | 126,220 | |
| | 11,127 | | Gray Television, Inc.(a) | | | 163,011 | |
| | 7,261 | | ILG, Inc. | | | 175,063 | |
| | 13,711 | | MDC Partners, Inc., Class A | | | 122,713 | |
| | 1,241 | | Penske Automotive Group, Inc. | | | 59,208 | |
| | 3,527 | | Viad Corp. | | | 159,420 | |
| | 20,838 | | ZAGG, Inc.(a) | | | 147,950 | |
| | | | | | | 953,585 | |
| | | | | | | | |
| Energy: 2.39% | | | | |
| | 19,142 | | Jones Energy, Inc., Class A(a) | | | 38,284 | |
| | 3,183 | | Mammoth Energy Services, Inc.(a) | | | 61,432 | |
| | 4,848 | | SRC Energy, Inc.(a) | | | 36,554 | |
| | 3,975 | | Superior Energy Services, Inc.(a) | | | 48,018 | |
| | | | | | | 184,288 | |
| | | | | | | | |
| Financial Services: 48.96% | | | | |
| | 2,830 | | Allegiance Bancshares, Inc.(a) | | | 110,511 | |
| | 3,518 | | Banc of California, Inc. | | | 76,341 | |
| | 2,554 | | Bankwell Financial Group, Inc. | | | 92,302 | |
| | 2,988 | | Bofl Holding, Inc.(a) | | | 71,383 | |
| | 1,224 | | Cass Information Systems, Inc. | | | 81,360 | |
| | 5,030 | | Clifton Bancorp, Inc. | | | 84,001 | |
| | 3,400 | | CNB Financial Corp. | | | 81,226 | |
| | 3,008 | | CoreCivic, Inc., REIT | | | 103,626 | |
| | 1,697 | | CorEnergy Infrastructure Trust, Inc., REIT | | | 61,907 | |
| | 2,478 | | Customers Bancorp, Inc.(a) | | | 76,645 | |
| | 1,741 | | CyrusOne, Inc., REIT | | | 95,128 | |
| | 1,630 | | DuPont Fabros Technology, Inc., REIT | | | 84,027 | |
| | 2,071 | | Employers Holdings, Inc. | | | 82,840 | |
| | 3,290 | | Entegra Financial Corp.(a) | | | 77,809 | |
| | 1,778 | | Enterprise Financial Services Corp. | | | 75,121 | |
| | 9,904 | | Everi Holdings, Inc.(a) | | | 62,890 | |
| | 2,898 | | First Financial Bancorp | | | 80,130 | |
| | 1,993 | | First Merchants Corp. | | | 82,470 | |
| | 3,269 | | Four Corners Property Trust, Inc., REIT | | | 76,266 | |
| | 3,168 | | Franklin Financial Network, Inc.(a) | | | 128,461 | |
| | 1,892 | | FS Bancorp, Inc. | | | 83,002 | |
| | 1,468 | | Getty Realty Corp., REIT | | | 37,581 | |
| | 1,956 | | Great Western Bancorp, Inc. | | | 80,587 | |
| | 2,190 | | HomeStreet, Inc.(a) | | | 56,940 | |
| | 3,654 | | InfraREIT, Inc., REIT(a) | | | 69,791 | |
| | 3,670 | | Investar Holding Corp. | | | 81,658 | |
| | 5,498 | | Live Oak Bancshares, Inc. | | | 132,776 | |
| | 1,330 | | Meta Financial Group, Inc. | | | 112,917 | |
| | 2,533 | | Midland States Bancorp, Inc. | | | 87,389 | |
| | 1,825 | | Moelis & Co., Class A | | | 66,978 | |
| | 5,122 | | Monmouth Real Estate Investment Corp., REIT | | | 76,830 | |
| | 3,107 | | Northeast Bancorp | | | 52,042 | |
| | 1,420 | | Northrim BanCorp, Inc. | | | 45,440 | |
| | 2,893 | | OceanFirst Financial Corp. | | | 79,991 | |
| Shares | | | | | Value
(Note 2) | |
| Financial Services (continued) | | | | |
| | 2,924 | | People's Utah Bancorp | | $ | 77,194 | |
| | 1,457 | | Preferred Bank | | | 77,206 | |
| | 1,220 | | QTS Realty Trust, Inc., REIT, Class A | | | 65,197 | |
| | 3,600 | | Rexford Industrial Realty, Inc., REIT | | | 89,784 | |
| | 3,010 | | State Bank Financial Corp. | | | 80,849 | |
| | 3,650 | | Summit Financial Group, Inc. | | | 79,826 | |
| | 3,267 | | The GEO Group, Inc., REIT | | | 108,855 | |
| | 1,740 | | Timberland Bancorp, Inc. | | | 38,576 | |
| | 4,360 | | TriState Capital Holdings, Inc.(a) | | | 108,563 | |
| | 3,850 | | United Insurance Holdings Corp. | | | 58,751 | |
| | 5,300 | | Virtu Financial, Inc., Class A | | | 81,620 | |
| | 1,976 | | WesBanco, Inc. | | | 78,665 | |
| | 8,410 | | Western New England Bancorp, Inc. | | | 88,305 | |
| | | | | | | 3,781,757 | |
| | | | | | | | |
| Materials & Processing: 7.62% | | | | |
| | 10,464 | | Builders FirstSource, Inc.(a) | | | 167,528 | |
| | 2,899 | | Koppers Holdings, Inc.(a) | | | 123,063 | |
| | 11,203 | | Mercer International, Inc. | | | 136,677 | |
| | 2,113 | | PolyOne Corp. | | | 82,851 | |
| | 825 | | Universal Forest Products, Inc. | | | 78,614 | |
| | | | | | | 588,733 | |
| | | | | | | | |
| Producer Durables: 10.98% | | | | |
| | 3,486 | | Blue Bird Corp.(a) | | | 64,840 | |
| | 3,195 | | Cubic Corp. | | | 165,820 | |
| | 1,257 | | EMCOR Group, Inc. | | | 82,635 | |
| | 3,974 | | Generac Holdings, Inc.(a) | | | 139,766 | |
| | 2,560 | | ICF International, Inc.(a) | | | 113,024 | |
| | 3,612 | | MasTec, Inc.(a) | | | 159,470 | |
| | 3,968 | | Tutor Perini Corp.(a) | | | 122,412 | |
| | | | | | | 847,967 | |
| | | | | | | | |
| Technology: 13.24% | | | | |
| | 4,984 | | ARRIS International PLC(a) | | | 129,534 | |
| | 3,242 | | Microsemi Corp.(a) | | | 152,179 | |
| | 17,745 | | Mitel Networks Corp.(a) | | | 125,280 | �� |
| | 7,197 | | Perficient, Inc.(a) | | | 125,372 | |
| | 5,000 | | Presidio, Inc.(a) | | | 73,750 | |
| | 6,151 | | Rudolph Technologies, Inc.(a) | | | 150,700 | |
| | 13,574 | | Xcerra Corp.(a) | | | 133,025 | |
| | 3,949 | | Xperi Corp. | | | 132,686 | |
| | | | | | | 1,022,526 | |
| | | | | | | | |
| Utilities: 3.54% | | | | |
| | 19,993 | | Vonage Holdings Corp.(a) | | | 134,153 | |
| | 5,216 | | West Corp. | | | 139,215 | |
| | | | | | | 273,368 | |
| | | | | | | | |
| | | | Total Common Stocks
(Cost $6,326,616) | | | 7,652,224 | |
| Annual Report | April 30, 2017 | 25 |
| Emerald Small Cap Value Fund | Schedule of Investments |
April 30, 2017
| Shares | | | | Value
(Note 2) | |
| SHORT TERM INVESTMENTS: 4.01% | | | | |
| | 309,846 | | Dreyfus Government Cash Management Fund ‐ Institutional Class 0.683% (7‐Day Yield) | | $ | 309,846 | |
| | | | | | | | |
| | | | Total Short Term Investments
(Cost $309,846) | | | 309,846 | |
| | | | | | | | |
Total Investments: 103.09%
(Cost $6,636,462) | | | 7,962,070 | |
| | | | | | | | |
| Liabilities In Excess Of Other Assets: (3.09)% | | | (238,500) | |
| Net Assets: 100.00% | | $ | 7,723,570 | |
(a) | Non-income producing security. |
For Fund compliance purposes, the Fund's industry classifications refer to any one or more of the industry sub-classifications used by one or more widely recognized market indexes or ratings group indexes, and/or as defined by Fund management. This definition may not apply for purposes of this report, which may combine industry sub-classifications for reporting ease. Industries are shown as a percentage of net assets.
See Notes to Financial Statements.
| 26 | www.emeraldmutualfunds.com |
| Emerald Insights Fund | Schedule of Investments |
April 30, 2017
| Shares | | | | Value
(Note 2) | |
| COMMON STOCKS: 98.46% | | | | |
| Consumer Discretionary: 23.85% | | | | |
| | 239 | | AutoZone, Inc.(a) | | $ | 165,434 | |
| | 2,501 | | BorgWarner, Inc. | | | 105,742 | |
| | 1,243 | | Brunswick Corp. | | | 70,540 | |
| | 884 | | Burlington Stores, Inc.(a) | | | 87,445 | |
| | 5,307 | | Cinemark Holdings, Inc. | | | 229,263 | |
| | 1,321 | | Delphi Automotive PLC | | | 106,208 | |
| | 2,637 | | Dick's Sporting Goods, Inc. | | | 133,300 | |
| | 2,126 | | Five Below, Inc.(a) | | | 104,429 | |
| | 2,207 | | Foot Locker, Inc. | | | 170,689 | |
| | 691 | | Jack in the Box, Inc. | | | 70,461 | |
| | 4,926 | | Kate Spade & Co.(a) | | | 85,713 | |
| | 9,168 | | MGM Resorts International | | | 281,549 | |
| | 218 | | O'Reilly Automotive, Inc.(a) | | | 54,097 | |
| | 865 | | Ross Stores, Inc. | | | 56,225 | |
| | 1,546 | | Royal Caribbean Cruises Ltd. | | | 164,804 | |
| | 1,411 | | Sinclair Broadcast Group, Inc., Class A | | | 55,664 | |
| | 3,225 | | Six Flags Entertainment Corp. | | | 201,917 | |
| | 1,590 | | Thor Industries, Inc. | | | 152,926 | |
| | 3,448 | | Toll Brothers, Inc. | | | 124,094 | |
| | 559 | | Ulta Beauty, Inc.(a) | | | 157,325 | |
| | 1,097 | | Wynn Resorts Ltd. | | | 134,942 | |
| | | | | | | 2,712,767 | |
| | | | | | | | |
| Consumer Staples: 4.33% | | | | |
| | 1,209 | | Conagra Brands, Inc. | | | 46,885 | |
| | 3,707 | | Hain Celestial Group, Inc.(a) | | | 137,122 | |
| | 1,389 | | Monster Beverage Corp.(a) | | | 63,033 | |
| | 651 | | National Beverage Corp. | | | 57,672 | |
| | 6,342 | | The Kroger Co. | | | 188,040 | |
| | | | | | | 492,752 | |
| | | | | | | | |
| Energy: 4.24% | | | | |
| | 1,699 | | Diamondback Energy, Inc.(a) | | | 169,628 | |
| | 4,080 | | Patterson‐UTI Energy, Inc. | | | 88,312 | |
| | 585 | | PDC Energy, Inc.(a) | | | 32,309 | |
| | 511 | | Pioneer Natural Resources Co. | | | 88,398 | |
| | 1,837 | | Rice Energy, Inc.(a) | | | 39,110 | |
| | 2,859 | | SM Energy Co. | | | 64,585 | |
| | | | | | | 482,342 | |
| | | | | | | | |
| Financial Services: 10.32% | | | | |
| | 1,413 | | Affiliated Managers Group, Inc. | | | 233,979 | |
| | 745 | | Alliance Data Systems Corp. | | | 185,974 | |
| | 2,869 | | Bank of the Ozarks, Inc. | | | 136,192 | |
| | 3,059 | | CubeSmart, REIT | | | 77,515 | |
| | 282 | | Equinix, Inc., REIT | | | 117,791 | |
| | 684 | | Mid‐America Apartment Communities, Inc., REIT | | | 67,860 | |
| | 1,566 | | PacWest Bancorp | | | 77,345 | |
| | 1,258 | | S&P Global, Inc. | | | 168,811 | |
| Shares | | | | | Value
(Note 2) | |
| Financial Services (continued) | | | | |
| | 613 | | SVB Financial Group(a) | | $ | 107,851 | |
| | | | | | | 1,173,318 | |
| | | | | | | | |
| Health Care: 13.74% | | | | |
| | 1,511 | | Abbott Laboratories | | | 65,940 | |
| | 4,816 | | Acadia Healthcare Co., Inc.(a) | | | 209,881 | |
| | 932 | | Alexion Pharmaceuticals, Inc.(a) | | | 119,091 | |
| | 2,081 | | Alnylam Pharmaceuticals, Inc.(a) | | | 111,542 | |
| | 609 | | Bluebird Bio, Inc.(a) | | | 54,170 | |
| | 6,129 | | Catalent, Inc.(a) | | | 179,457 | |
| | 1,349 | | Clovis Oncology, Inc.(a) | | | 78,094 | |
| | 925 | | DENTSPLY SIRONA, Inc. | | | 58,497 | |
| | 575 | | Edwards Lifesciences Corp.(a) | | | 63,060 | |
| | 982 | | Incyte Corp. Ltd.(a) | | | 122,043 | |
| | 2,296 | | Integer Holdings Corp.(a) | | | 84,378 | |
| | 2,037 | | Intrexon Corp.(a) | | | 42,451 | |
| | 2,817 | | Sarepta Therapeutics, Inc.(a) | | | 102,144 | |
| | 2,926 | | Veeva Systems, Inc., Class A(a) | | | 156,892 | |
| | 754 | | West Pharmaceutical Services, Inc. | | | 69,391 | |
| | 386 | | Zimmer Biomet Holdings, Inc. | | | 46,185 | |
| | | | | | | 1,563,216 | |
| | | | | | | | |
| Materials & Processing: 10.12% | | | | |
| | 562 | | Acuity Brands, Inc. | | | 98,968 | |
| | 4,381 | | Axalta Coating Systems Ltd.(a) | | | 137,432 | |
| | 4,144 | | Berry Global Group, Inc.(a) | | | 207,200 | |
| | 2,936 | | Crown Holdings, Inc.(a) | | | 164,680 | |
| | 5,140 | | Masco Corp. | | | 190,283 | |
| | 2,482 | | Steel Dynamics, Inc. | | | 89,700 | |
| | 1,770 | | US Silica Holdings, Inc. | | | 73,455 | |
| | 1,565 | | Vulcan Materials Co. | | | 189,177 | |
| | | | | | | 1,150,895 | |
| | | | | | | | |
| Producer Durables: 10.44% | | | | |
| | 2,190 | | Dycom Industries, Inc.(a) | | | 231,395 | |
| | 1,568 | | Kennametal, Inc. | | | 65,198 | |
| | 2,550 | | Korn/Ferry International | | | 82,620 | |
| | 868 | | Middleby Corp.(a) | | | 118,161 | |
| | 972 | | Snap‐on, Inc. | | | 162,839 | |
| | 2,241 | | Southwest Airlines Co. | | | 125,989 | |
| | 2,955 | | Spirit Airlines, Inc.(a) | | | 169,233 | |
| | 2,762 | | Wabtec Corp. | | | 231,704 | |
| | | | | | | 1,187,139 | |
| | | | | | | | |
| Technology: 21.42% | | | | |
| | 1,491 | | Activision Blizzard, Inc. | | | 77,905 | |
| | 2,982 | | ARRIS International PLC(a) | | | 77,502 | |
| | 979 | | Broadcom Ltd. | | | 216,173 | |
| | 2,493 | | Cavium, Inc.(a) | | | 171,643 | |
| | 543 | | Citrix Systems, Inc.(a) | | | 43,950 | |
| | 1,264 | | Electronic Arts, Inc.(a) | | | 119,852 | |
| | 3,718 | | Fortinet, Inc.(a) | | | 145,002 | |
| | 737 | | Intuit, Inc. | | | 92,280 | |
| Annual Report | April 30, 2017 | 27 |
| Emerald Insights Fund | Schedule of Investments |
April 30, 2017
| Shares | | | | Value
(Note 2) | |
| Technology (continued) | | | | |
| | 1,146 | | IPG Photonics Corp.(a) | | $ | 144,763 | |
| | 2,062 | | Micron Technology, Inc.(a) | | | 57,056 | |
| | 1,577 | | NVIDIA Corp. | | | 164,481 | |
| | 11,098 | | ON Semiconductor Corp.(a) | | | 157,370 | |
| | 769 | | Palo Alto Networks, Inc.(a) | | | 83,367 | |
| | 1,780 | | Proofpoint, Inc.(a) | | | 134,159 | |
| | 1,090 | | PTC, Inc.(a) | | | 58,914 | |
| | 1,695 | | SBA Communications Corp., Class A,
REIT(a) | | | 214,401 | |
| | 1,958 | | ServiceNow, Inc.(a) | | | 184,992 | |
| | 1,895 | | Skyworks Solutions, Inc. | | | 189,007 | |
| | 5,600 | | VeriFone Systems, Inc.(a) | | | 103,824 | |
| | | | | | | 2,436,641 | |
| | | | | | | | |
| | | | Total Common Stocks
(Cost $9,318,743) | | | 11,199,070 | |
| | | | | | | | |
| MASTER LIMITED PARTNERSHIPS: 0.91% | | | | |
| Financial Services: 0.91% | | | | |
| | 2,410 | | Lazard Ltd., Class A | | | 103,485 | |
| | | | | | | | |
| | | | Total Master Limited Partnerships
(Cost $78,736) | | | 103,485 | |
| | | | | | | | |
| SHORT TERM INVESTMENTS: 1.12% | | | | |
| | 127,019 | | Dreyfus Government Cash Management Fund ‐ Institutional Class 0.683% (7‐Day Yield) | | | 127,019 | |
| | | | | | | | |
| | | | Total Short Term Investments
(Cost $127,019) | | | 127,019 | |
| | | | | | | | |
Total Investments: 100.49%
(Cost $9,524,498) | | | 11,429,574 | |
| | | | | | | | |
| Liabilities In Excess Of Other Assets: (0.49)% | | | (55,992 | ) |
| Net Assets: 100.00% | | $ | 11,373,582 | |
(a) | Non-income producing security. |
For Fund compliance purposes, the Fund's industry classifications refer to any one or more of the industry sub-classifications used by one or more widely recognized market indexes or ratings group indexes, and/or as defined by Fund management. This definition may not apply for purposes of this report, which may combine industry sub-classifications for reporting ease. Industries are shown as a percentage of net assets.
See Notes to Financial Statements.
| 28 | www.emeraldmutualfunds.com |
| Emerald Banking and Finance Fund | Schedule of Investments |
April 30, 2017
| Shares | | | | Value
(Note 2) | |
| COMMON STOCKS: 98.35% | | | |
| Financial Services: 97.82% | | | |
| Asset Management & Custodian: 0.94% | | | |
| 234,260 | | Hamilton Lane, Inc., Class A(a) | | $ | 4,385,347 | |
| | | | | | | |
| Banks: Diversified: 78.50% | | | | |
| 75,856 | | 1st Constitution Bancorp | | | 1,357,822 | |
| 100,000 | | 1st Source Corp. | | | 4,831,000 | |
| 55,280 | | Access National Corp. | | | 1,566,082 | |
| 53,798 | | American Business Bank(a) | | | 2,219,167 | |
| 80,000 | | American Riviera Bank(a) | | | 1,336,000 | |
| 206,237 | | Ameris Bancorp | | | 9,713,763 | |
| 225,594 | | Atlantic Coast Financial Corp.(a) | | | 1,752,865 | |
| 314,286 | | Bank of the Ozarks, Inc. | | | 14,919,156 | |
| 171,605 | | BNC Bancorp | | | 5,740,187 | |
| 225,409 | | Bridge Bancorp, Inc. | | | 8,171,076 | |
| 125,000 | | Capstar Financial Holdings, Inc.(a) | | | 2,205,000 | |
| 75,000 | | Carolina Financial Corp. | | | 2,314,500 | |
| 278,923 | | CenterState Banks, Inc. | | | 7,037,227 | |
| 121,319 | | Civista Bancshares, Inc. | | | 2,636,262 | |
| 150,002 | | CNB Financial Corp. | | | 3,583,548 | |
| 17,052 | | Commerce Union Bancshares, Inc. | | | 369,005 | |
| 176,261 | | ConnectOne Bancorp, Inc. | | | 3,912,994 | |
| 35,869 | | County Bancorp, Inc. | | | 984,604 | |
| 32,124 | | CU Bancorp(a) | | | 1,197,422 | |
| 292,328 | | Customers Bancorp, Inc.(a) | | | 9,041,705 | |
| 167,748 | | Eagle Bancorp, Inc.(a) | | | 10,048,105 | |
| 162,663 | | East West Bancorp, Inc. | | | 8,827,721 | |
| 228,773 | | Equity Bancshares, Inc., Class A(a) | | | 7,222,364 | |
| 86,853 | | Farmers National Banc Corp. | | | 1,241,998 | |
| 191,017 | | FCB Financial Holdings, Inc., Class A(a) | | | 9,025,553 | |
| 188,963 | | First Bank | | | 2,456,519 | |
| 36,040 | | First Busey Corp. | | | 1,079,398 | |
| 119,800 | | First Business Financial Services, Inc. | | | 3,183,086 | |
| 163,498 | | First Choice Bank | | | 3,331,272 | |
| 20,280 | | First Financial Bankshares, Inc. | | | 810,186 | |
| 441,604 | | First Foundation, Inc.(a) | | | 6,933,183 | |
| 58,449 | | First of Long Island Corp. | | | 1,589,813 | |
| 125,475 | | First Resource Bank(a) | | | 1,154,370 | |
| 186,772 | | Franklin Financial Network, Inc.(a) | | | 7,573,605 | |
| 246,394 | | Freedom Bank of Virginia(a) | | | 3,079,925 | |
| 67,853 | | FVC Bankcorp, Inc.(a) | | | 1,275,636 | |
| 11,889 | | German American Bancorp, Inc. | | | 390,910 | |
| 169,868 | | Gold Coast Bank(a) | | | 3,057,624 | |
| 61,496 | | Green Bancorp, Inc.(a) | | | 1,106,928 | |
| 177,886 | | Guaranty Bancorp | | | 4,473,833 | |
| 138,670 | | Heritage Commerce Corp. | | | 1,980,208 | |
| 440,592 | | Home BancShares, Inc. | | | 11,213,066 | |
| 18,520 | | Home Federal Bancorp, Inc. | | | 549,859 | |
| 16,003 | | HopFed Bancorp, Inc. | | | 236,044 | |
| 264,296 | | Howard Bancorp, Inc.(a) | | | 4,955,550 | |
| 15,250 | | Independent Bank Corp. | | | 965,325 | |
| 50,000 | | Independent Bank Corporation | | | 1,115,000 | |
| 15,731 | | Independent Bank Group, Inc. | | | 946,220 | |
| Shares | | | | Value
(Note 2) | |
| Banks: Diversified (continued) | | | |
| 254,042 | | Investar Holding Corp. | | $ | 5,652,435 | |
| 60,120 | | John Marshall Bank(a) | | | 1,253,502 | |
| 65,781 | | Lakeland Bancorp, Inc. | | | 1,279,440 | |
| 46,615 | | Lakeland Financial Corp. | | | 2,128,441 | |
| 220,060 | | Live Oak Bancshares, Inc. | | | 5,314,449 | |
| 44,420 | | MainSource Financial Group, Inc. | | | 1,519,164 | |
| 259,003 | | Malvern Bancorp, Inc.(a) | | | 5,659,216 | |
| 30 | | Mechanics Bank(a) | | | 990,000 | |
| 87,881 | | Mercantile Bank Corp. | | | 2,955,438 | |
| 45,870 | | Meridian Bancorp, Inc. | | | 805,019 | |
| 15,773 | | Mid Penn Bancorp, Inc. | | | 436,123 | |
| 51,013 | | Midland States Bancorp, Inc. | | | 1,759,949 | |
| 239,209 | | National Commerce Corp.(a) | | | 9,257,388 | |
| 48,060 | | Nicolet Bankshares, Inc.(a) | | | 2,369,358 | |
| 224 | | Oak Valley Bancorp | | | 3,147 | |
| 87,388 | | Old Line Bancshares, Inc. | | | 2,425,891 | |
| 599,284 | | Pacific Mercantile Bancorp(a) | | | 4,644,451 | |
| 169,325 | | Pacific Premier Bancorp, Inc.(a) | | | 6,188,829 | |
| 151,362 | | PacWest Bancorp | | | 7,475,769 | |
| 75,493 | | Paragon Commercial Corp.(a) | | | 4,149,850 | |
| 212,884 | | People's Utah Bancorp | | | 5,620,138 | |
| 133,412 | | Pinnacle Financial Partners, Inc. | | | 8,538,368 | |
| 240,584 | | Professional Holding Corp.(a) | | | 3,488,468 | |
| 114,430 | | Puget Sound Bancorp, Inc.(a) | | | 2,769,092 | |
| 93,253 | | QCR Holdings, Inc. | | | 4,252,337 | |
| 45,042 | | Renasant Corp. | | | 1,909,781 | |
| 747,663 | | Republic First Bancorp, Inc.(a) | | | 6,429,902 | |
| 481,505 | | Royal Bancshares of Pennsylvania, Inc., Class A(a) | | | 2,060,841 | |
| 62,200 | | Seacoast Commerce Banc Holdings | | | 1,141,059 | |
| 256,130 | | ServisFirst Bancshares, Inc. | | | 9,681,714 | |
| 66,236 | | Simmons First National Corp., Class A | | | 3,619,797 | |
| 100,000 | | SmartFinancial, Inc.(a) | | | 2,213,000 | |
| 71,032 | | Southern First Bancshares, Inc.(a) | | | 2,393,778 | |
| 20,598 | | Southern National Bancorp of Virginia, Inc. | | | 375,090 | |
| 300,000 | | Stewardship Financial Corp. | | | 2,700,000 | |
| 129,815 | | Stonegate Bank | | | 5,958,509 | |
| 103,767 | | Sunshine Bancorp, Inc.(a) | | | 2,229,953 | |
| 34,173 | | Sussex Bancorp | | | 881,663 | |
| 73,776 | | SVB Financial Group(a) | | | 12,980,149 | |
| 105,959 | | Texas Capital Bancshares, Inc.(a) | | | 8,063,480 | |
| 1,716 | | The National Capital Bank of Washington | | | 315,735 | |
| 39,610 | | Triumph Bancorp, Inc.(a) | | | 887,264 | |
| 101,784 | | United Community Banks, Inc. | | | 2,783,792 | |
| 168,750 | | Unity Bancorp, Inc. | | | 2,759,063 | |
| 60,517 | | Veritex Holdings, Inc.(a) | | | 1,630,328 | |
| 197,058 | | WashingtonFirst Bankshares, Inc. | | | 5,543,242 | |
| 109,942 | | West Town Bank & Trust(a) | | | 2,715,567 | |
| 186,834 | | Western Alliance Bancorp(a) | | | 8,949,349 | |
| 123,783 | | Xenith Bankshares, Inc.(a) | | | 3,344,617 | |
| | | | | | 367,216,621 | |
| Annual Report | April 30, 2017 | 29 |
| Emerald Banking and Finance Fund | Schedule of Investments |
April 30, 2017
| Shares | | | | Value
(Note 2) | |
| Banks: Savings, Thrift & Mortgage Lending: 10.60% | |
| 320,240 | | Bofl Holding, Inc.(a) | | $ | 7,650,534 | |
| 113,440 | | Cadence BanCorp(a) | | | 2,550,131 | |
| 82,750 | | Flushing Financial Corp. | | | 2,439,470 | |
| 103,401 | | Heritage Financial Corp. | | | 2,729,786 | |
| 11,680 | | Home Bancorp, Inc. | | | 433,795 | |
| 67,200 | | LegacyTexas Financial Group, Inc. | | | 2,540,832 | |
| 154,343 | | Meta Financial Group, Inc. | | | 13,103,721 | |
| 182,919 | | OceanFirst Financial Corp. | | | 5,057,710 | |
| 185,283 | | Sterling Bancorp | | | 4,307,830 | |
| 40,000 | | Waterstone Financial, Inc. | | | 760,000 | |
| 169,608 | | WSFS Financial Corp. | | | 8,005,498 | |
| | | | | | 49,579,307 | |
| | | | | | | |
| Consumer Lending: 2.00% | | | | |
| 66,381 | | LendingTree, Inc.(a) | | | 9,353,083 | |
| | | | | | | |
| Diversified Financial Services: 1.85% | | | | |
| 150,908 | | MidWestOne Financial Group, Inc. | | | 5,236,508 | |
| 93,230 | | Moelis & Co., Class A | | | 3,421,541 | |
| | | | | | 8,658,049 | |
| | | | | | | |
| Insurance: Multi Line: 0.47% | | | | |
| 50,000 | | James River Group Holdings Ltd. | | | 2,178,000 | |
| | | | | | | |
| Insurance: Property‐Casualty: 2.09% | | | | |
| 40,000 | | Federated National Holdings Co. | | | 643,200 | |
| 197,732 | | Health Insurance Innovations, Inc., Class A(a) | | | 3,312,011 | |
| 185,000 | | Kingstone Cos., Inc. | | | 2,765,750 | |
| 47,570 | | Kinsale Capital Group, Inc. | | | 1,720,131 | |
| 75,340 | | NMI Holdings, Inc., Class A(a) | | | 873,944 | |
| 31,441 | | United Insurance Holdings Corp. | | | 479,790 | |
| | | | | | 9,794,826 | |
| | | | | | | |
| Real Estate Investment Trusts (REITs): 1.37% | | | | |
| 250,000 | | City Office REIT, Inc. | | | 3,137,500 | |
| 92,800 | | Independence Realty Trust, Inc., REIT | | | 853,760 | |
| 205,053 | | MedEquities Realty Trust, Inc., REIT | | | 2,423,726 | |
| | | | | | 6,414,986 | |
| | | | | | | |
| Technology: 0.53% | | | | |
| Computer Service Software & Systems: 0.53% | | | | |
| 64,716 | | Q2 Holdings, Inc.(a) | | | 2,468,916 | |
| | Total Common Stocks | | | | |
| | (Cost $321,162,487) | | | 460,049,135 | |
| Shares | | | | Value
(Note 2) | |
| SHORT TERM INVESTMENTS: 1.91% | | | |
| 8,933,798 | | Dreyfus Government Cash Management Fund ‐ Institutional Class 0.683% (7‐Day Yield) | | $ | 8,933,798 | |
| | | | | | | |
| | | Total Short Term Investments | | | | |
| | | (Cost $8,933,798) | | | 8,933,798 | |
| | | | | | | |
| Total Investments: 100.26% | | | | |
| (Cost $330,096,285) | | | 468,982,933 | |
| | | | | | | |
| Liabilities In Excess Of Other Assets: (0.26)% | | | (1,220,691 | ) |
| Net Assets: 100.00% | $ | 467,762,242 | |
(a) | Non-income producing security. |
For Fund compliance purposes, the Fund's industry classifications refer to any one or more of the industry sub-classifications used by one or more widely recognized market indexes or ratings group indexes, and/or as defined by Fund management. This definition may not apply for purposes of this report, which may combine industry sub-classifications for reporting ease. Industries are shown as a percentage of net assets.
See Notes to Financial Statements.
| 30 | www.emeraldmutualfunds.com |
| Emerald Funds | Statements of Assets and Liabilities |
April 30, 2017
| | | Emerald Growth Fund | | | Emerald Small Cap Value Fund | | | Emerald Insights Fund | | | Emerald Banking and Finance Fund | |
| ASSETS: | | | | | | | | | | | | |
| Investments, at value | | $ | 1,021,007,844 | | | $ | 7,962,070 | | | $ | 11,429,574 | | | $ | 468,982,933 | |
| Cash | | | 6,280 | | | | 167 | | | | 97 | | | | 5,324 | |
| Receivable for investments sold | | | 937,471 | | | | 334,525 | | | | 142,803 | | | | – | |
| Receivable for shares sold | | | 2,461,076 | | | | 85,586 | | | | – | | | | 30,919,369 | |
| Receivable due from advisor | | | – | | | | 3,869 | | | | – | | | | – | |
| Interest and dividends receivable | | | 44,361 | | | | 6 | | | | 1,920 | | | | 125,062 | |
| Other assets | | | 25,502 | | | | 12,362 | | | | 12,223 | | | | 27,857 | |
| Total Assets | | | 1,024,482,534 | | | | 8,398,585 | | | | 11,586,617 | | | | 500,060,545 | |
| LIABILITIES: | | | | | | | | | | | | | | | | |
| Payable for investments purchased | | | 5,169,875 | | | | 475,172 | | | | 186,004 | | | | 825,084 | |
| Payable for shares redeemed | | | 2,789,852 | | | | 176,457 | | | | – | | | | 30,795,531 | |
| Investment advisory fees payable | | | 491,865 | | | | – | | | | 107 | | | | 345,851 | |
| Payable to fund accounting and administration | | | 37,157 | | | | 936 | | | | 1,414 | | | | 17,837 | |
| Payable for distribution and service fees | | | 258,775 | | | | 1,035 | | | | 3,513 | | | | 245,635 | |
| Payable for trustee fees and expenses | | | 5,053 | | | | 42 | | | | 58 | | | | 2,198 | |
| Payable for transfer agency fees | | | 27,186 | | | | 2,355 | | | | 2,677 | | | | 16,621 | |
| Payable for chief compliance officer fee | | | 3,510 | | | | 26 | | | | 40 | | | | 1,564 | |
| Payable for principal financial officer fee | | | 569 | | | | 4 | | | | 6 | | | | 254 | |
| Payable for professional fees | | | 27,154 | | | | 16,809 | | | | 16,828 | | | | 23,346 | |
| Accrued expenses and other liabilities | | | 57,315 | | | | 2,179 | | | | 2,388 | | | | 24,382 | |
| Total Liabilities | | | 8,868,311 | | | | 675,015 | | | | 213,035 | | | | 32,298,303 | |
| NET ASSETS | | $ | 1,015,614,223 | | | $ | 7,723,570 | | | $ | 11,373,582 | | | $ | 467,762,242 | |
| NET ASSETS CONSIST OF: | | | | | | | | | | | | | | | | |
| Paid‐in capital (Note 5) | | $ | 847,415,476 | | | $ | 3,074,895 | | | $ | 10,494,521 | | | $ | 337,341,410 | |
| Accumulated net investment loss | | | (1,696,980 | ) | | | – | | | | (22,262 | ) | | | (877,904 | ) |
| Accumulated net realized gain/(loss) | | | (58,918,980 | ) | | | 3,323,067 | | | | (1,003,753 | ) | | | (7,587,912 | ) |
| Net unrealized appreciation | | | 228,814,707 | | | | 1,325,608 | | | | 1,905,076 | | | | 138,886,648 | |
| NET ASSETS | | $ | 1,015,614,223 | | | $ | 7,723,570 | | | $ | 11,373,582 | | | $ | 467,762,242 | |
| INVESTMENTS, AT COST | | $ | 792,193,137 | | | $ | 6,636,462 | | | $ | 9,524,498 | | | $ | 330,096,285 | |
| PRICING OF SHARES | | | | | | | | | | | | | | | | |
Class A: (a) | | | | | | | | | | | | | | | | |
| Net Asset Value, offering and redemption price per share | | $ | 21.83 | | | $ | 16.27 | | | $ | 11.33 | | | $ | 41.61 | |
| Net Assets | | $ | 270,388,831 | | | $ | 1,909,159 | | | $ | 10,126,511 | | | $ | 172,106,071 | |
| Shares of beneficial interest outstanding | | | 12,385,535 | | | | 117,378 | | | | 894,138 | | | | 4,135,961 | |
| Maximum offering price per share (NAV/.9525, based on maximum sales charge of 4.75% of the offering price) | | $ | 22.92 | | | $ | 17.08 | | | $ | 11.90 | | | $ | 43.69 | |
Class C: (a) | | | | | | | | | | | | | | | | |
| Net Asset Value, offering and redemption price per share | | $ | 18.75 | | | $ | 16.10 | | | $ | 11.11 | | | $ | 37.29 | |
| Net Assets | | $ | 34,642,384 | | | $ | 210,782 | | | $ | 111,608 | | | $ | 76,072,380 | |
| Shares of beneficial interest outstanding | | | 1,847,440 | | | | 13,095 | | | | 10,048 | | | | 2,040,071 | |
Institutional Class: | | | | | | | | | | | | | | | | |
| Net Asset Value, offering and redemption price per share | | $ | 22.56 | | | $ | 16.35 | | | $ | 11.41 | | | $ | 42.30 | |
| Net Assets | | $ | 596,550,021 | | | $ | 4,989,468 | | | $ | 1,047,836 | | | $ | 134,026,556 | |
| Shares of beneficial interest outstanding | | | 26,442,589 | | | | 305,215 | | | | 91,874 | | | | 3,168,207 | |
Investor Class: | | | | | | | | | | | | | | | | |
| Net Asset Value, offering and redemption price per share | | $ | 21.75 | | | $ | 16.26 | | | $ | 11.29 | | | $ | 39.86 | |
| Net Assets | | $ | 114,032,987 | | | $ | 614,161 | | | $ | 87,627 | | | $ | 85,557,235 | |
| Shares of beneficial interest outstanding | | | 5,242,406 | | | | 37,768 | | | | 7,760 | | | | 2,146,633 | |
(a) | Redemption price per share may be reduced for any applicable contingent deferred sales charge. For a description of a possible sales charge, please see the Funds' Prospectus. |
See Notes to Financial Statements
| Annual Report | April 30, 2017 | 31 |
| Emerald Funds | Statements of Operations |
For the Year Ended April 30, 2017
| | | Emerald Growth Fund | | | Emerald Small Cap Value Fund | | | Emerald Insights Fund | | | Emerald Banking and Finance Fund | |
| INVESTMENT INCOME: | | | | | | | | | | | | |
| Dividends | | | 4,967,478 | | | | 168,808 | | | | 94,967 | | | | 3,482,399 | |
| Foreign taxes withheld | | | – | | | | (2,945 | ) | | | (58 | ) | | | – | |
| Total Investment Income | | | 4,967,478 | | | | 165,863 | | | | 94,909 | | | | 3,482,399 | |
| | | | | | | | | | | | | | | | | |
| EXPENSES: | | | | | | | | | | | | | | | | |
| Investment advisory fee (Note 6) | | | 5,901,025 | | | | 111,917 | | | | 91,817 | | | | 3,316,622 | |
| Recoupment of previously waived fees (Note 6) | | | – | | | | – | | | | 912 | | | | – | |
| Administration fee | | | 431,979 | | | | 8,448 | | | | 9,378 | | | | 161,403 | |
| Custodian fee | | | 90,036 | | | | 5,000 | | | | 5,000 | | | | 39,039 | |
| Professional fees | | | 46,827 | | | | 18,275 | | | | 17,831 | | | | 32,759 | |
| Transfer agent fee | | | 288,023 | | | | 29,240 | | | | 32,894 | | | | 158,095 | |
| Trustee fees and expenses | | | 21,796 | | | | 337 | | | | 270 | | | | 8,274 | |
| Registration/filing fees | | | 157,171 | | | | 52,742 | | | | 46,935 | | | | 89,117 | |
| Reports to shareholder and printing fees | | | 99,445 | | | | 4,306 | | | | 2,108 | | | | 34,746 | |
| Distribution and service fees | | | | | | | | | | | | | | | | |
| Class A | | | 1,086,652 | | | | 2,512 | | | | 37,509 | | | | 435,885 | |
| Class C | | | 393,328 | | | | 6,312 | | | | 1,047 | | | | 616,913 | |
| Institutional Class | | | 201,510 | | | | – | | | | 485 | | | | 18,141 | |
| Investor Class | | | 437,073 | | | | 3,553 | | | | 224 | | | | 328,895 | |
| Chief compliance officer fee | | | 43,342 | | | | 669 | | | | 544 | | | | 15,585 | |
| Principal financial officer fee | | | 7,208 | | | | 111 | | | | 91 | | | | 2,590 | |
| Other | | | 36,094 | | | | 4,604 | | | | 6,545 | | | | 17,292 | |
| Total expenses before waiver | | | 9,241,509 | | | | 248,026 | | | | 253,590 | | | | 5,275,356 | |
| Less fees waived/reimbursed by investment | | | | | | | | | | | | | | | | |
| advisor (Note 6) | | | – | | | | (86,667 | ) | | | (91,653 | ) | | | – | |
| Total Net Expenses | | | 9,241,509 | | | | 161,359 | | | | 161,937 | | | | 5,275,356 | |
| NET INVESTMENT INCOME/(LOSS): | | | (4,274,031 | ) | | | 4,504 | | | | (67,028 | ) | | | (1,792,957 | ) |
| | | | | | | | | | | | | | | | | |
| REALIZED AND UNREALIZED GAIN/(LOSS) | | | | | | | | | | | | | | | | |
| Net realized gain/(loss) | | | (12,296,303 | ) | | | 4,115,975 | | | | 126,174 | | | | 4,322,806 | |
| Net change in unrealized appreciation/(depreciation) | | | 231,448,346 | | | | (52,528 | ) | | | 1,844,247 | | | | 93,673,078 | |
| NET REALIZED AND UNREALIZED GAIN | | | 219,152,043 | | | | 4,063,447 | | | | 1,970,421 | | | | 97,995,884 | |
| NET INCREASE IN NET ASSETS RESULTING FROM OPERATIONS | | $ | 214,878,012 | | | $ | 4,067,951 | | | $ | 1,903,393 | | | $ | 96,202,927 | |
See Notes to Financial Statements.
| 32 | www.emeraldmutualfunds.com |
| Emerald Growth Fund | Statements of Changes in Net Assets |
| | | Year Ended April 30, 2017 | | | Year Ended April 30, 2016 | |
| OPERATIONS: | | | | | | |
| Net investment loss | | $ | (4,274,031 | ) | | $ | (5,189,508 | ) |
| Net realized loss | | | (12,296,303 | ) | | | (45,883,891 | ) |
| Net change in unrealized appreciation/(depreciation) | | | 231,448,346 | | | | (70,373,366 | ) |
| Net increase/(decrease) in net assets resulting from operations | | | 214,878,012 | | | | (121,446,765 | ) |
| | | | | | | | | |
| DISTRIBUTIONS TO SHAREHOLDERS (NOTE 3): | | | | | | | | |
| From net realized gains | | | | | | | | |
| Class A | | | – | | | | (8,925,260 | ) |
| Class C | | | – | | | | (1,239,080 | ) |
| Institutional Class | | | – | | | | (9,080,768 | ) |
| Investor Class | | | – | | | | (3,291,011 | ) |
| Net decrease in net assets from distributions | | | – | | | | (22,536,119 | ) |
| SHARE TRANSACTIONS (NOTE 5): | | | | | | | | |
| Class A | | | | | | | | |
| Proceeds from sale of shares | | | 49,638,686 | | | | 381,182,773 | |
| Issued to shareholders in reinvestment of distributions | | | – | | | | 8,212,776 | |
| Cost of shares redeemed | | | (171,619,113 | ) | | | (133,632,331 | ) |
| Net increase/(decrease) from share transactions | | | (121,980,427 | ) | | | 255,763,218 | |
| Class C | | | | | | | | |
| Proceeds from sale of shares | | | 816,759 | | | | 38,113,416 | |
| Issued to shareholders in reinvestment of distributions | | | – | | | | 1,010,353 | |
| Cost of shares redeemed | | | (16,701,281 | ) | | | (4,668,547 | ) |
| Net increase/(decrease) from share transactions | | | (15,884,522 | ) | | | 34,455,222 | |
Institutional Class | | | | | | | | |
| Proceeds from sale of shares | | | 156,854,187 | | | | 461,582,646 | |
| Issued to shareholders in reinvestment of distributions | | | – | | | | 8,228,820 | |
| Cost of shares redeemed | | | (126,583,340 | ) | | | (133,394,758 | ) |
| Net increase from share transactions | | | 30,270,847 | | | | 336,416,708 | |
Investor Class | | | | | | | | |
| Proceeds from sale of shares | | | 33,837,835 | | | | 171,962,946 | |
| Issued to shareholders in reinvestment of distributions | | | – | | | | 2,169,384 | |
| Cost of shares redeemed | | | (56,901,183 | ) | | | (62,270,391 | ) |
| Net increase/(decrease) from share transactions | | | (23,063,348 | ) | | | 111,861,939 | |
| Net increase in net assets | | $ | 84,220,562 | | | $ | 594,514,203 | |
| NET ASSETS: | | | | | | | | |
| Beginning of period | | | 931,393,661 | | | | 336,879,458 | |
| End of period (including accumulated net investment loss of $(1,696,980) and $(1,937,256)) | | $ | 1,015,614,223 | | | $ | 931,393,661 | |
| Annual Report | April 30, 2017 | 33 |
| Emerald Growth Fund | Statements of Changes in Net Assets |
| | | Year Ended April 30, 2017 | | | Year Ended April 30, 2016 | |
| Other Information: | | | | | | |
| SHARE TRANSACTIONS: | | | | | | |
| Class A | | | | | | |
| Sold | | | 2,527,651 | | | | 19,174,156 | |
| Distributions reinvested | | | – | | | | 443,454 | |
| Redeemed | | | (8,617,707 | ) | | | (7,327,683 | ) |
| Net increase/(decrease) in shares outstanding | | | (6,090,056 | ) | | | 12,289,927 | |
| Class C | | | | | | | | |
| Sold | | | 47,529 | | | | 2,128,222 | |
| Distributions reinvested | | | – | | | | 62,950 | |
| Redeemed | | | (978,592 | ) | | | (295,110 | ) |
| Net increase/(decrease) in shares outstanding | | | (931,063 | ) | | | 1,896,062 | |
Institutional Class | | | | | | | | |
| Sold | | | 7,655,150 | | | | 23,158,775 | |
| Distributions reinvested | | | – | | | | 431,732 | |
| Redeemed | | | (6,327,481 | ) | | | (6,952,343 | ) |
| Net increase in shares outstanding | | | 1,327,669 | | | | 16,638,164 | |
Investor Class | | | | | | | | |
| Sold | | | 1,717,976 | | | | 8,581,157 | |
| Distributions reinvested | | | – | | | | 117,518 | |
| Redeemed | | | (2,920,705 | ) | | | (3,431,264 | ) |
| Net increase/(decrease) in shares outstanding | | | (1,202,729 | ) | | | 5,267,411 | |
See Notes to Financial Statements.
| 34 | www.emeraldmutualfunds.com |
| Emerald Small Cap Value Fund | Statements of Changes in Net Assets |
| | | Year Ended April 30, 2017 | | | For the Period October 1, 2015 to April 30, 2016(a) | | | Year Ended September 30, 2015 | |
| OPERATIONS: | | | | | | | | | |
| Net investment income/(loss) | | $ | 4,504 | | | $ | (9,086 | ) | | $ | 81,815 | |
| Net realized gain/(loss) | | | 4,115,975 | | | | 205,540 | | | | (997,104 | ) |
| Net change in unrealized appreciation/(depreciation) | | | (52,528 | ) | | | 243,735 | | | | 1,168,742 | |
| Net increase in net assets resulting from operations | | | 4,067,951 | | | | 440,189 | | | | 253,453 | |
| | | | | | | | | | | | | |
| DISTRIBUTIONS TO SHAREHOLDERS (NOTE 3): | | | | | | | | | | | | |
| From net investment income | | | | | | | | | | | | |
| Class A | | | – | | | | (55 | ) | | | – | |
| Class C | | | – | | | | (31 | ) | | | – | |
| Institutional Class | | | – | | | | (78,137 | ) | | | (76,689 | ) |
| Investor Class | | | – | | | | (3,585 | ) | | | (1,619 | ) |
| From net realized gains | | | | | | | | | | | | |
| Class A | | | – | | | | – | | | | (405 | ) |
| Class C | | | – | | | | – | | | | (405 | ) |
| Institutional Class | | | – | | | | – | | | | (505,155 | ) |
| Investor Class | | | – | | | | – | | | | (11,254 | ) |
| Net decrease in net assets from distributions | | | – | | | | (81,808 | ) | | | (595,527 | ) |
| SHARE TRANSACTIONS (NOTE 5): | | | | | | | | | | | | |
Class A (b) | | | | | | | | | | | | |
| Proceeds from sale of shares | | | 1,560,733 | | | | 327,544 | | | | 15,000 | |
| Issued to shareholders in reinvestment of distributions | | | – | | | | 55 | | | | 405 | |
| Cost of shares redeemed | | | (134,941 | ) | | | – | | | | – | |
| Net increase from share transactions | | | 1,425,792 | | | | 327,599 | | | | 15,405 | |
Class C (c) | | | | | | | | | | | | |
| Proceeds from sale of shares | | | 45,700 | | | | 554,859 | | | | 15,000 | |
| Issued to shareholders in reinvestment of distributions | | | – | | | | 31 | | | | 405 | |
| Cost of shares redeemed | | | (542,424 | ) | | | – | | | | – | |
| Net increase/(decrease) from share transactions | | | (496,724 | ) | | | 554,890 | | | | 15,405 | |
Institutional Class | | | | | | | | | | | | |
| Proceeds from sale of shares | | | 1,392,366 | | | | 631,324 | | | | 3,861,703 | |
| Issued to shareholders in reinvestment of distributions | | | – | | | | 64,940 | | | | 483,048 | |
| Cost of shares redeemed | | | (13,535,683 | ) | | | (3,833,338 | ) | | | (11,838,177 | ) |
| Net decrease from share transactions | | | (12,143,317 | ) | | | (3,137,074 | ) | | | (7,493,426 | ) |
Investor Class | | | | | | | | | | | | |
| Proceeds from sale of shares | | | 208,364 | | | | 1,660,183 | | | | 83,181 | |
| Issued to shareholders in reinvestment of distributions | | | – | | | | 3,585 | | | | 12,813 | |
| Cost of shares redeemed | | | (1,881,505 | ) | | | (158,757 | ) | | | (173,977 | ) |
| Net increase/(decrease) from share transactions | | | (1,673,141 | ) | | | 1,505,011 | | | | (77,983 | ) |
| Net decrease in net assets | | $ | (8,819,439 | ) | | $ | (391,193 | ) | | $ | (7,882,673 | ) |
| NET ASSETS: | | | | | | | | | | | | |
| Beginning of period | | | 16,543,009 | | | | 16,934,202 | | | | 24,816,875 | |
| End of period (including accumulated net investment income/(loss) of $‐, $(5,849) and $81,801) | | $ | 7,723,570 | | | $ | 16,543,009 | | | $ | 16,934,202 | |
| Annual Report | April 30, 2017 | 35 |
| Emerald Small Cap Value Fund | Statements of Changes in Net Assets |
| | | Year Ended April 30, 2017 | | | For the Period October 1, 2015 to April 30, 2016(a) | | | Year Ended September 30, 2015 | |
| Other Information: | | | | | | | | | |
| SHARE TRANSACTIONS: | | | | | | | | | |
Class A (b) | | | | | | | | | |
| Sold | | | 100,045 | | | | 25,051 | | | | 1,063 | |
| Distributions reinvested | | | – | | | | 4 | | | | 30 | |
| Redeemed | | | (8,816 | ) | | | – | | | | – | |
| Net increase in shares outstanding | | | 91,229 | | | | 25,055 | | | | 1,093 | |
Class C (c) | | | | | | | | | | | | |
| Sold | | | 3,424 | | | | 42,635 | | | | 1,063 | |
| Distributions reinvested | | | – | | | | 2 | | | | 30 | |
| Redeemed | | | (34,059 | ) | | | – | | | | – | |
| Net increase/(decrease) in shares outstanding | | | (30,635 | ) | | | 42,637 | | | | 1,093 | |
Institutional Class | | | | | | | | | | | | |
| Sold | | | 93,538 | | | | 49,075 | | | | 289,259 | |
| Distributions reinvested | | | – | | | | 5,138 | | | | 36,038 | |
| Redeemed | | | (839,700 | ) | | | (301,180 | ) | | | (934,159 | ) |
| Net decrease in shares outstanding | | | (746,162 | ) | | | (246,967 | ) | | | (608,862 | ) |
Investor Class | | | | | | | | | | | | |
| Sold | | | 15,147 | | | | 132,087 | | | | 6,169 | |
| Distributions reinvested | | | – | | | | 284 | | | | 959 | |
| Redeemed | | | (127,290 | ) | | | (13,942 | ) | | | (12,883 | ) |
| Net increase/(decrease) in shares outstanding | | | (112,143 | ) | | | 118,429 | | | | (5,755 | ) |
(a) | Effective March 3, 2015 the Board approved changing the fiscal year-end of the Fund from September 30 to April 30. |
(b) | Class A commenced operations on June 30, 2015. |
(c) | Class C commenced operations on June 30, 2015. |
See Notes to Financial Statements.
| 36 | www.emeraldmutualfunds.com |
| Emerald Insights Fund | Statements of Changes in Net Assets |
| | | Year Ended April 30, 2017 | | | Year Ended April 30, 2016 | |
| OPERATIONS: | | | | | | |
| Net investment loss | | $ | (67,028 | ) | | $ | (60,421 | ) |
| Net realized gain/(loss) | | | 126,174 | | | | (991,477 | ) |
| Net change in unrealized appreciation/(depreciation) on investments | | | 1,844,247 | | | | (608,622 | ) |
| Net increase/(decrease) in net assets resulting from operations | | | 1,903,393 | | | | (1,660,520 | ) |
| SHARE TRANSACTIONS (NOTE 5): | | | | | | | | |
| Class A | | | | | | | | |
| Proceeds from sale of shares | | | 462,283 | | | | 7,019,638 | |
| Cost of shares redeemed | | | (3,391,810 | ) | | | (644,531 | ) |
| Net increase/(decrease) from share transactions | | | (2,929,527 | ) | | | 6,375,107 | |
| Class C | | | | | | | | |
| Proceeds from sale of shares | | | 1,539 | | | | 90,586 | |
| Cost of shares redeemed | | | (6,433 | ) | | | (7,964 | ) |
| Net increase/(decrease) from share transactions | | | (4,894 | ) | | | 82,622 | |
Institutional Class | | | | | | | | |
| Proceeds from sale of shares | | | 155,403 | | | | 1,476,544 | |
| Cost of shares redeemed | | | (1,042,010 | ) | | | (108,493 | ) |
| Net increase/(decrease) from share transactions | | | (886,607 | ) | | | 1,368,051 | |
Investor Class | | | | | | | | |
| Proceeds from sale of shares | | | 20,000 | | | | 980,954 | |
| Cost of shares redeemed | | | (31,991 | ) | | | (1,089,191 | ) |
| Net decrease from share transactions | | | (11,991 | ) | | | (108,237 | ) |
| Net increase/(decrease) in net assets | | $ | (1,929,626 | ) | | $ | 6,057,023 | |
| NET ASSETS: | | | | | | | | |
| Beginning of period | | | 13,303,208 | | | | 7,246,185 | |
| End of period (including accumulated net investment loss of $(22,262) and $(19,899)) | | $ | 11,373,582 | | | $ | 13,303,208 | |
| Other Information: | | | | | | | | |
| SHARE TRANSACTIONS: | | | | | | | | |
| Class A | | | | | | | | |
| Sold | | | 44,012 | | | | 648,075 | |
| Redeemed | | | (325,340 | ) | | | (63,986 | ) |
| Net increase/(decrease) in shares outstanding | | | (281,328 | ) | | | 584,089 | |
| Class C | | | | | | | | |
| Sold | | | 156 | | | | 8,833 | |
| Redeemed | | | (621 | ) | | | (777 | ) |
| Net increase/(decrease) in shares outstanding | | | (465 | ) | | | 8,056 | |
Institutional Class | | | | | | | | |
| Sold | | | 14,591 | | | | 163,820 | |
| Redeemed | | | (100,431 | ) | | | (11,482 | ) |
| Net increase/(decrease) in shares outstanding | | | (85,840 | ) | | | 152,338 | |
Investor Class | | | | | | | | |
| Sold | | | 1,928 | | | | 89,665 | |
| Redeemed | | | (3,068 | ) | | | (121,592 | ) |
| Net decrease in shares outstanding | | | (1,140 | ) | | | (31,927 | ) |
See Notes to Financial Statements.
| Annual Report | April 30, 2017 | 37 |
| Emerald Banking and Finance Fund | Statements of Changes in Net Assets |
| | | Year Ended April 30, 2017 | | | Year Ended April 30, 2016 | |
| OPERATIONS: | | | | | | |
| Net investment loss | | $ | (1,792,957 | ) | | $ | (703,999 | ) |
| Net realized gain/(loss) | | | 4,322,806 | | | | (9,446,349 | ) |
| Net change in unrealized appreciation | | | 93,673,078 | | | | 9,022,785 | |
| Net increase/(decrease) in net assets resulting from operations | | | 96,202,927 | | | | (1,127,563 | ) |
| | | | | | | | | |
| SHARE TRANSACTIONS (NOTE 5): | | | | | | | | |
| Class A | | | | | | | | |
| Proceeds from sale of shares | | | 82,950,236 | | | | 139,134,278 | |
| Cost of shares redeemed | | | (54,060,196 | ) | | | (75,700,736 | ) |
| Net increase from share transactions | | | 28,890,040 | | | | 63,433,542 | |
| Class C | | | | | | | | |
| Proceeds from sale of shares | | | 19,290,062 | | | | 23,271,396 | |
| Cost of shares redeemed | | | (12,226,940 | ) | | | (4,636,338 | ) |
| Net increase from share transactions | | | 7,063,122 | | | | 18,635,058 | |
Institutional Class | | | | | | | | |
| Proceeds from sale of shares | | | 67,765,563 | | | | 56,443,883 | |
| Cost of shares redeemed | | | (15,914,560 | ) | | | (19,778,965 | ) |
| Net increase from share transactions | | | 51,851,003 | | | | 36,664,918 | |
Investor Class | | | | | | | | |
| Proceeds from sale of shares | | | 70,741,101 | | | | 112,489,510 | |
| Cost of shares redeemed | | | (92,011,035 | ) | | | (56,677,531 | ) |
| Net increase/(decrease) from share transactions | | | (21,269,934 | ) | | | 55,811,979 | |
| Net increase in net assets | | $ | 162,737,158 | | | $ | 173,417,934 | |
| NET ASSETS: | | | | | | | | |
| Beginning of period | | | 305,025,084 | | | | 131,607,150 | |
| End of period (including accumulated net investment loss of $(877,904) and $(305,212)) | | $ | 467,762,242 | | | $ | 305,025,084 | |
| | | | | | | | | |
| Other Information: | | | | | | | | |
| SHARE TRANSACTIONS: | | | | | | | | |
| Class A | | | | | | | | |
| Sold | | | 2,115,853 | | | | 4,379,264 | |
| Redeemed | | | (1,517,305 | ) | | | (2,525,433 | ) |
| Net increase in shares outstanding | | | 598,548 | | | | 1,853,831 | |
| Class C | | | | | | | | |
| Sold | | | 562,255 | | | | 809,825 | |
| Redeemed | | | (378,982 | ) | | | (169,473 | ) |
| Net increase in shares outstanding | | | 183,273 | | | | 640,352 | |
Institutional Class | | | | | | | | |
| Sold | | | 1,678,568 | | | | 1,770,911 | |
| Redeemed | | | (456,066 | ) | | | (639,328 | ) |
| Net increase in shares outstanding | | | 1,222,502 | | | | 1,131,583 | |
Investor Class | | | | | | | | |
| Sold | | | 1,995,462 | | | | 3,679,872 | |
| Redeemed | | | (2,533,701 | ) | | | (1,987,638 | ) |
| Net increase/(decrease) in shares outstanding | | | (538,239 | ) | | | 1,692,234 | |
See Notes to Financial Statements.
| 38 | www.emeraldmutualfunds.com |
| Emerald Growth Fund | Financial Highlights |
For a share outstanding throughout the periods presented
| | | CLASS A |
| | | Year Ended April 30, 2017 | | | Year Ended April 30, 2016 | | | Year Ended April 30, 2015 | | | Year Ended April 30, 2014 | | | Year Ended April 30, 2013 | |
| NET ASSET VALUE, BEGINNING OF PERIOD | | $ | 17.52 | | | $ | 20.02 | | | $ | 18.11 | | | $ | 15.60 | | | $ | 16.20 | |
| INCOME/(LOSS) FROM OPERATIONS: | | | | | | | | | | | | | | | | | | | | |
Net investment loss(a) | | | (0.11 | ) | | | (0.15 | ) | | | (0.18 | ) | | | (0.21 | ) | | | (0.15 | ) |
| Net realized and unrealized gain/(loss) on investments | | | 4.42 | | | | (1.88 | ) | | | 3.43 | | | | 4.33 | | | | 1.40 | |
| Total from Investment Operations | | | 4.31 | | | | (2.03 | ) | | | 3.25 | | | | 4.12 | | | | 1.25 | |
| | | | | | | | | | | | | | | | | | | | | |
| LESS DISTRIBUTIONS: | | | | | | | | | | | | | | | | | | | | |
| From capital gains | | | – | | | | (0.47 | ) | | | (1.34 | ) | | | (1.61 | ) | | | (1.85 | ) |
| Total Distributions | | | – | | | | (0.47 | ) | | | (1.34 | ) | | | (1.61 | ) | | | (1.85 | ) |
| NET INCREASE/(DECREASE) IN NET ASSET VALUE | | | 4.31 | | | | (2.50 | ) | | | 1.91 | | | | 2.51 | | | | (0.60 | ) |
| NET ASSET VALUE, END OF PERIOD | | $ | 21.83 | | | $ | 17.52 | | | $ | 20.02 | | | $ | 18.11 | | | $ | 15.60 | |
| | | | | | | | | | | | | | | | | | | | | |
TOTAL RETURN(b) | | | 24.60 | % | | | (10.28 | )% | | | 18.38 | % | | | 26.01 | % | | | 9.14 | % |
| RATIOS/SUPPLEMENTAL DATA: | | | | | | | | | | | | | | | | | | | | |
| Net Assets, End of Period (000s) | | $ | 270,389 | | | $ | 323,603 | | | $ | 123,828 | | | $ | 77,900 | | | $ | 46,605 | |
| RATIOS TO AVERAGE NET ASSETS: | | | | | | | | | | | | | | | | | | | | |
| Net Investment loss | | | (0.57 | )% | | | (0.81 | )% | | | (0.93 | )% | | | (1.12 | )% | | | (1.01 | )% |
| Operating expenses excluding reimbursement/waiver | | | 1.08 | % | | | 1.17 | % | | | 1.29 | % | | | 1.31 | % | | | 1.38 | % |
| Operating expenses including reimbursement/waiver | | | 1.08 | % | | | 1.17 | % | | | 1.29 | % | | | 1.29 | % | | | 1.29 | % |
| PORTFOLIO TURNOVER RATE | | | 54 | % | | | 45 | % | | | 68 | % | | | 70 | % | | | 78 | % |
(a) | Per share amounts are based upon average shares outstanding. |
(b) | Total return does not reflect the effect of sales charges. |
See Notes to Financial Statements.
| Annual Report | April 30, 2017 | 39 |
| Emerald Growth Fund | Financial Highlights |
For a share outstanding throughout the periods presented
| | | CLASS C | |
| | | Year Ended April 30, 2017 | | | Year Ended April 30, 2016 | | | Year Ended April 30, 2015 | | | Year Ended April 30, 2014 | | | Year Ended April 30, 2013 | |
| NET ASSET VALUE, BEGINNING OF PERIOD | | $ | 15.14 | | | $ | 17.48 | | | $ | 16.07 | | | $ | 14.07 | | | $ | 14.89 | |
| INCOME/(LOSS) FROM OPERATIONS: | | | | | | | | | | | | | | | | | | | | |
Net investment loss(a) | | | (0.21 | ) | | | (0.24 | ) | | | (0.27 | ) | | | (0.30 | ) | | | (0.23 | ) |
| Net realized and unrealized gain/(loss) on investments | | | 3.82 | | | | (1.63 | ) | | | 3.02 | | | | 3.91 | | | | 1.26 | |
| Total from Investment Operations | | | 3.61 | | | | (1.87 | ) | | | 2.75 | | | | 3.61 | | | | 1.03 | |
| | | | | | | | | | | | | | | | | | | | | |
| LESS DISTRIBUTIONS: | | | | | | | | | | | | | | | | | | | | �� |
| From capital gains | | | – | | | | (0.47 | ) | | | (1.34 | ) | | | (1.61 | ) | | | (1.85 | ) |
| Total Distributions | | | – | | | | (0.47 | ) | | | (1.34 | ) | | | (1.61 | ) | | | (1.85 | ) |
| NET INCREASE/(DECREASE) IN NET ASSET VALUE | | | 3.61 | | | | (2.34 | ) | | | 1.41 | | | | 2.00 | | | | (0.82 | ) |
| NET ASSET VALUE, END OF PERIOD | | $ | 18.75 | | | $ | 15.14 | | | $ | 17.48 | | | $ | 16.07 | | | $ | 14.07 | |
| | | | | | | | | | | | | | | | | | | | | |
TOTAL RETURN(b) | | | 23.84 | % | | | (10.87 | )% | | | 17.58 | % | | | 25.19 | % | | | 8.43 | % |
| RATIOS/SUPPLEMENTAL DATA: | | | | | | | | | | | | | | | | | | | | |
| Net Assets, End of Period (000s) | | $ | 34,642 | | | $ | 42,075 | | | $ | 15,427 | | | $ | 11,645 | | | $ | 4,946 | |
| RATIOS TO AVERAGE NET ASSETS: | | | | | | | | | | | | | | | | | | | | |
| Net Investment loss | | | (1.22 | )% | | | (1.46 | )% | | | (1.58 | )% | | | (1.77 | )% | | | (1.65 | )% |
| Operating expenses excluding reimbursement/waiver | | | 1.73 | % | | | 1.81 | % | | | 1.94 | % | | | 1.96 | % | | | 2.03 | % |
| Operating expenses including reimbursement/waiver | | | 1.73 | % | | | 1.81 | % | | | 1.94 | % | | | 1.94 | % | | | 1.94 | % |
| PORTFOLIO TURNOVER RATE | | | 54 | % | | | 45 | % | | | 68 | % | | | 70 | % | | | 78 | % |
(a) | Per share amounts are based upon average shares outstanding. |
(b) | Total return does not reflect the effect of sales charges. |
See Notes to Financial Statements.
| 40 | www.emeraldmutualfunds.com |
| Emerald Growth Fund | Financial Highlights |
For a share outstanding throughout the periods presented
| | | INSTITUTIONAL CLASS |
| | | Year Ended April 30, 2017 | | | Year Ended April 30, 2016 | | | Year Ended April 30, 2015 | | | Year Ended April 30, 2014 | | | Year Ended April 30, 2013 | |
| NET ASSET VALUE, BEGINNING OF PERIOD | | $ | 18.04 | | | $ | 20.54 | | | $ | 18.49 | | | $ | 15.86 | | | $ | 16.39 | |
| INCOME/(LOSS) FROM OPERATIONS: | | | | | | | | | | | | | | | | | | | | |
Net investment loss(a) | | | (0.05 | ) | | | (0.10 | ) | | | (0.12 | ) | | | (0.16 | ) | | | (0.11 | ) |
| Net realized and unrealized gain/(loss) on investments | | | 4.57 | | | | (1.93 | ) | | | 3.51 | | | | 4.40 | | | | 1.43 | |
| Total from Investment Operations | | | 4.52 | | | | (2.03 | ) | | | 3.39 | | | | 4.24 | | | | 1.32 | |
| | | | | | | | | | | | | | | | | | | | | |
| LESS DISTRIBUTIONS: | | | | | | | | | | | | | | | | | | | | |
| From capital gains | | | – | | | | (0.47 | ) | | | (1.34 | ) | | | (1.61 | ) | | | (1.85 | ) |
| Total Distributions | | | – | | | | (0.47 | ) | | | (1.34 | ) | | | (1.61 | ) | | | (1.85 | ) |
| NET INCREASE/(DECREASE) IN NET ASSET VALUE | | | 4.52 | | | | (2.50 | ) | | | 2.05 | | | | 2.63 | | | | (0.53 | ) |
| NET ASSET VALUE, END OF PERIOD | | $ | 22.56 | | | $ | 18.04 | | | $ | 20.54 | | | $ | 18.49 | | | $ | 15.86 | |
| | | | | | | | | | | | | | | | | | | | | |
| TOTAL RETURN | | | 25.06 | % | | | (9.97 | )% | | | 18.77 | % | | | 26.35 | % | | | 9.47 | % |
| RATIOS/SUPPLEMENTAL DATA: | | | | | | | | | | | | | | | | | | | | |
| Net Assets, End of Period (000s) | | $ | 596,550 | | | $ | 453,190 | | | $ | 174,107 | | | $ | 134,440 | | | $ | 86,238 | |
| RATIOS TO AVERAGE NET ASSETS: | | | | | | | | | | | | | | | | | | | | |
| Net Investment loss | | | (0.26 | )% | | | (0.51 | )% | | | (0.63 | )% | | | (0.82 | )% | | | (0.71 | )% |
| Operating expenses excluding reimbursement/waiver | | | 0.77 | % | | | 0.87 | % | | | 0.99 | % | | | 1.00 | % | | | 1.08 | % |
| Operating expenses including reimbursement/waiver | | | 0.77 | % | | | 0.87 | % | | | 0.99 | % | | | 0.99 | % | | | 0.99 | % |
| PORTFOLIO TURNOVER RATE | | | 54 | % | | | 45 | % | | | 68 | % | | | 70 | % | | | 78 | % |
(a) | Per share amounts are based upon average shares outstanding. |
See Notes to Financial Statements.
| Annual Report | April 30, 2017 | 41 |
| Emerald Growth Fund | Financial Highlights |
For a share outstanding throughout the periods presented
| | | INVESTOR CLASS | |
| | | Year Ended April 30, 2017 | | | Year Ended April 30, 2016 | | | Year Ended April 30, 2015 | | | Year Ended April 30, 2014 | | | Year Ended April 30, 2013 | |
| NET ASSET VALUE, BEGINNING OF PERIOD | | $ | 17.46 | | | $ | 19.97 | | | $ | 18.06 | | | $ | 15.57 | | | $ | 16.18 | |
| INCOME/(LOSS) FROM OPERATIONS: | | | | | | | | | | | | | | | | | | | | |
Net investment loss(a) | | | (0.12 | ) | | | (0.16 | ) | | | (0.17 | ) | | | (0.23 | ) | | | (0.16 | ) |
| Net realized and unrealized gain/(loss) on investments | | | 4.41 | | | | (1.88 | ) | | | 3.42 | | | | 4.33 | | | | 1.40 | |
| Total from Investment Operations | | | 4.29 | | | | (2.04 | ) | | | 3.25 | | | | 4.10 | | | | 1.24 | |
| | | | | | | | | | | | | | | | | | | | | |
| LESS DISTRIBUTIONS: | | | | | | | | | | | | | | | | | | | | |
| From capital gains | | | – | | | | (0.47 | ) | | | (1.34 | ) | | | (1.61 | ) | | | (1.85 | ) |
| Total Distributions | | | – | | | | (0.47 | ) | | | (1.34 | ) | | | (1.61 | ) | | | (1.85 | ) |
| NET INCREASE/(DECREASE) IN NET ASSET VALUE | | | 4.29 | | | | (2.51 | ) | | | 1.91 | | | | 2.49 | | | | (0.61 | ) |
| NET ASSET VALUE, END OF PERIOD | | $ | 21.75 | | | $ | 17.46 | | | $ | 19.97 | | | $ | 18.06 | | | $ | 15.57 | |
| | | | | | | | | | | | | | | | | | | | | |
| TOTAL RETURN | | | 24.57 | % | | | (10.36 | )% | | | 18.44 | % | | | 25.93 | % | | | 9.08 | % |
| RATIOS/SUPPLEMENTAL DATA: | | | | | | | | | | | | | | | | | | | | |
| Net Assets, End of Period (000s) | | $ | 114,033 | | | $ | 112,526 | | | $ | 23,517 | | | $ | 15,870 | | | $ | 1,842 | |
| RATIOS TO AVERAGE NET ASSETS: | | | | | | | | | | | | | | | | | | | | |
| Net Investment loss | | | (0.61 | )% | | | (0.84 | )% | | | (0.91 | )% | | | (1.18 | )% | | | (1.05 | )% |
| Operating expenses excluding reimbursement/waiver | | | 1.12 | % | | | 1.19 | % | | | 1.27 | % | | | 1.34 | % | | | 1.43 | % |
| Operating expenses including reimbursement/waiver | | | 1.12 | % | | | 1.19 | % | | | 1.27 | % | | | 1.34 | % | | | 1.34 | % |
| PORTFOLIO TURNOVER RATE | | | 54 | % | | | 45 | % | | | 68 | % | | | 70 | % | | | 78 | % |
(a) | Per share amounts are based upon average shares outstanding. |
See Notes to Financial Statements.
| 42 | www.emeraldmutualfunds.com |
| Emerald Small Cap Value Fund | Financial Highlights |
For a share outstanding throughout the periods presented
| | | CLASS A | |
| | | Year Ended April 30, 2017 | | | For the Period October 1, 2015 to April 30, 2016(a) | | | Period Ended September 30, 2015(b) | |
| NET ASSET VALUE, BEGINNING OF PERIOD | | $ | 13.00 | | | $ | 12.70 | | | $ | 14.12 | |
| INCOME/(LOSS) FROM OPERATIONS: | | | | | | | | | | | | |
Net investment loss(c) | | | (0.07 | )(d) | | | (0.09 | ) | | | (0.01 | ) |
| Net realized and unrealized gain/(loss) on investments | | | 3.34 | | | | 0.44 | | | | (1.03 | ) |
| Total from Investment Operations | | | 3.27 | | | | 0.35 | | | | (1.04 | ) |
| | | | | | | | | | | | | |
| LESS DISTRIBUTIONS: | | | | | | | | | | | | |
| From investment income | | | – | | | | (0.05 | ) | | | – | |
| From capital gains | | | – | | | | – | | | | (0.38 | ) |
| Total Distributions | | | – | | | | (0.05 | ) | | | (0.38 | ) |
| NET INCREASE/(DECREASE) IN NET ASSET VALUE | | | 3.27 | | | | 0.30 | | | | (1.42 | ) |
| NET ASSET VALUE, END OF PERIOD | | $ | 16.27 | | | $ | 13.00 | | | $ | 12.70 | |
| | | | | | | | | | | | | |
| TOTAL RETURN | | | 25.15 | % | | | 2.77 | %(e) | | | (7.49 | )%(e) |
| RATIOS/SUPPLEMENTAL DATA: | | | | | | | | | | | | |
| Net Assets, End of Period (000s) | | $ | 1,909 | | | $ | 340 | | | $ | 14 | |
| RATIOS TO AVERAGE NET ASSETS: | | | | | | | | | | | | |
| Net Investment loss | | | (0.46 | )% | | | (1.13 | )%(f) | | | (0.24 | )%(f) |
| Operating expenses excluding reimbursement/waiver | | | 2.26 | % | | | 2.69 | %(f) | | | 2.16 | %(f) |
| Operating expenses including reimbursement/waiver | | | 1.35 | % | | | 1.35 | %(f) | | | 1.35 | %(f) |
| PORTFOLIO TURNOVER RATE | | | 66 | % | | | 31 | %(e) | | | 69 | %(e)(g) |
(a) | Effective March 3, 2015 the Board approved changing the fiscal year-end of the Fund from September 30 to April 30. |
(b) | Class A commenced operations on June 30, 2015. |
(c) | Per share amounts are based upon average shares outstanding. |
(d) | The amount shown for a share outstanding throughout the period may not correlate with the Statement of Operations for the period due to the timing of sales and redemptions of Fund shares in relation to income earned and/or fluctuating market value of the investments of the Fund. |
(g) | Portfolio turnover rate is calculated at the Fund level and represents the year ended September 30, 2015. |
See Notes to Financial Statements.
| Annual Report | April 30, 2017 | 43 |
| Emerald Small Cap Value Fund | Financial Highlights |
For a share outstanding throughout the periods presented
| | | CLASS C | |
| | | Year Ended April 30, 2017 | | | For the Period October 1, 2015 to April 30, 2016(a) | | | Period Ended September 30, 2015(b) | |
| NET ASSET VALUE, BEGINNING OF PERIOD | | $ | 12.94 | | | $ | 12.68 | | | $ | 14.12 | |
| INCOME/(LOSS) FROM OPERATIONS: | | | | | | | | | | | | |
Net investment loss(c) | | | (0.13 | )(d) | | | (0.14 | ) | | | (0.03 | ) |
| Net realized and unrealized gain/(loss) on investments | | | 3.29 | | | | 0.43 | | | | (1.03 | ) |
| Total from Investment Operations | | | 3.16 | | | | 0.29 | | | | (1.06 | ) |
| | | | | | | | | | | | | |
| LESS DISTRIBUTIONS: | | | | | | | | | | | | |
| From investment income | | | – | | | | (0.03 | ) | | | – | |
| From capital gains | | | – | | | | – | | | | (0.38 | ) |
| Total Distributions | | | – | | | | (0.03 | ) | | | (0.38 | ) |
| NET INCREASE/(DECREASE) IN NET ASSET VALUE | | | 3.16 | | | | 0.26 | | | | (1.44 | ) |
| NET ASSET VALUE, END OF PERIOD | | $ | 16.10 | | | $ | 12.94 | | | $ | 12.68 | |
| | | | | | | | | | | | | |
| TOTAL RETURN | | | 24.42 | % | | | 2.28 | %(e) | | | (7.63 | )%(e) |
| RATIOS/SUPPLEMENTAL DATA: | | | | | | | | | | | | |
| Net Assets, End of Period (000s) | | $ | 211 | | | $ | 566 | | | $ | 14 | |
| RATIOS TO AVERAGE NET ASSETS: | | | | | | | | | | | | |
| Net Investment loss | | | (0.93 | )% | | | (2.06 | )%(f) | | | (0.89 | )%(f) |
| Operating expenses excluding reimbursement/waiver | | | 2.70 | % | | | 3.37 | %(f) | | | 2.81 | %(f) |
| Operating expenses including reimbursement/waiver | | | 2.00 | % | | | 2.00 | %(f) | | | 2.00 | %(f) |
| PORTFOLIO TURNOVER RATE | | | 66 | % | | | 31 | %(e) | | | 69 | %(e)(g) |
(a) | Effective March 3, 2015 the Board approved changing the fiscal year-end of the Fund from September 30 to April 30. |
(b) | Class C commenced operations on June 30, 2015. |
(c) | Per share amounts are based upon average shares outstanding. |
(d) | The amount shown for a share outstanding throughout the period may not correlate with the Statement of Operations for the period due to the timing of sales and redemptions of Fund shares in relation to income earned and/or fluctuating market value of the investments of the Fund. |
(g) | Portfolio turnover rate is calculated at the Fund level and represents the year ended September 30, 2015. |
See Notes to Financial Statements.
| 44 | www.emeraldmutualfunds.com |
| Emerald Small Cap Value Fund | Financial Highlights |
For a share outstanding throughout the periods presented
| | | INSTITUTIONAL CLASS |
| | | Year Ended April 30, 2017 | | | For the Period October 1, 2015 to April 30, 2016(a) | | | Year Ended September 30, 2015(b) | | | Year Ended September 30, 2014 | | | Period Ended September 30, 2013(c) | |
| NET ASSET VALUE, BEGINNING OF PERIOD | | $ | 13.02 | | | $ | 12.71 | | | $ | 12.76 | | | $ | 12.56 | | | $ | 10.00 | |
| INCOME FROM OPERATIONS: | | | | | | | | | | | | | | | | | | | | |
Net investment income/(loss)(d) | | | 0.02 | | | | (0.01 | ) | | | 0.06 | | | | 0.09 | | | | 0.05 | |
| Net realized and unrealized gain on investments | | | 3.31 | | | | 0.38 | | | | 0.33 | | | | 0.76 | | | | 2.54 | |
| Total from Investment Operations | | | 3.33 | | | | 0.37 | | | | 0.39 | | | | 0.85 | | | | 2.59 | |
| | | | | | | | | | | | | | | | | | | | | |
| LESS DISTRIBUTIONS: | | | | | | | | | | | | | | | | | | | | |
| From investment income | | | – | | | | (0.06 | ) | | | (0.06 | ) | | | (0.01 | ) | | | (0.03 | ) |
| From capital gains | | | – | | | | – | | | | (0.38 | ) | | | (0.64 | ) | | | – | |
| Total Distributions | | | – | | | | (0.06 | ) | | | (0.44 | ) | | | (0.65 | ) | | | (0.03 | ) |
| NET INCREASE/(DECREASE) IN NET ASSET VALUE | | | 3.33 | | | | 0.31 | | | | (0.05 | ) | | | 0.20 | | | | 2.56 | |
| NET ASSET VALUE, END OF PERIOD | | $ | 16.35 | | | $ | 13.02 | | | $ | 12.71 | | | $ | 12.76 | | | $ | 12.56 | |
| | | | | | | | | | | | | | | | | | | | | |
| TOTAL RETURN | | | 25.58 | % | | | 2.94 | %(e) | | | 2.93 | % | | | 6.64 | % | | | 25.99 | %(e) |
| SUPPLEMENTAL DATA: | | | | | | | | | | | | | | | | | | | | |
| Net Assets, End of Period (000s) | | $ | 4,989 | | | $ | 13,691 | | | $ | 16,507 | | | $ | 24,343 | | | $ | 8,442 | |
| RATIOS TO AVERAGE NET ASSETS: | | | | | | | | | | | | | | | | | | | | |
| Net Investment income/(loss) | | | 0.13 | % | | | (0.07 | )%(f) | | | 0.45 | % | | | 0.65 | % | | | 0.48 | %(f) |
| Operating expenses excluding reimbursement/waiver | | | 1.56 | % | | | 1.75 | %(f) | | | 1.43 | % | | | 1.29 | % | | | 1.95 | %(f) |
| Operating expenses including reimbursement/waiver | | | 1.00 | % | | | 1.00 | %(f) | | | 1.00 | % | | | 1.00 | % | | | 1.00 | %(f) |
| PORTFOLIO TURNOVER RATE | | | 66 | % | | | 31 | %(e) | | | 69 | % | | | 49 | % | | | 67 | %(e) |
(a) | Effective March 3, 2015 the Board approved changing the fiscal year-end of the Fund from September 30 to April 30. |
(b) | Prior to its June 26, 2015 reorganization with and into the Emerald Small Cap Value Fund, the Fund was known as the Elessar Small Cap Value Fund. |
(c) | For the period October 15, 2012 (commencement of investment operations) through September 30, 2013. |
(d) | Per share amounts are based upon average shares outstanding. |
See Notes to Financial Statements.
| Annual Report | April 30, 2017 | 45 |
| Emerald Small Cap Value Fund | Financial Highlights |
For a share outstanding throughout the periods presented
| | | INVESTOR CLASS | |
| | Year Ended April 30, 2017 | | | For the Period October 1, 2015 to April 30, 2016(a) | | | Year Ended September 30, 2015(b) | | | Year Ended September 30, 2014 | | | Period Ended September 30, 2013(c) | |
| NET ASSET VALUE, BEGINNING OF PERIOD | | $ | 12.98 | | | $ | 12.68 | | | $ | 12.73 | | | $ | 12.54 | | | $ | 10.00 | |
| INCOME FROM OPERATIONS: | | | | | | | | | | | | | | | | | | | | |
Net investment income/(loss)(d) | | | (0.02 | )(e) | | | (0.02 | ) | | | 0.03 | | | | 0.07 | | | | 0.02 | |
| Net realized and unrealized gain on investments | | | 3.30 | | | | 0.37 | | | | 0.35 | | | | 0.76 | | | | 2.54 | |
| Total from Investment Operations | | | 3.28 | | | | 0.35 | | | | 0.38 | | | | 0.83 | | | | 2.56 | |
| | | | | | | | | | | | | | | | | | | | | |
| LESS DISTRIBUTIONS: | | | | | | | | | | | | | | | | | | | | |
| From investment income | | | – | | | | (0.05 | ) | | | (0.05 | ) | | | – | | | | (0.02 | ) |
| From capital gains | | | – | | | | – | | | | (0.38 | ) | | | (0.64 | ) | | | – | |
| Total Distributions | | | – | | | | (0.05 | ) | | | (0.43 | ) | | | (0.64 | ) | | | (0.02 | ) |
| NET INCREASE/(DECREASE) IN NET ASSET VALUE | | | 3.28 | | | | 0.30 | | | | (0.05 | ) | | | 0.19 | | | | 2.54 | |
| NET ASSET VALUE, END OF PERIOD | | $ | 16.26 | | | $ | 12.98 | | | $ | 12.68 | | | $ | 12.73 | | | $ | 12.54 | |
| | | | | | | | | | | | | | | | | | | | | |
| TOTAL RETURN | | | 25.27 | % | | | 2.80 | %(f) | | | 2.82 | % | | | 6.46 | % | | | 25.69 | %(f) |
| SUPPLEMENTAL DATA: | | | | | | | | | | | | | | | | | | | | |
| Net Assets, End of Period (000s) | | $ | 614 | | | $ | 1,946 | | | $ | 399 | | | $ | 474 | | | $ | 271 | |
| RATIOS TO AVERAGE NET ASSETS: | | | | | | | | | | | | | | | | | | | | |
| Net Investment income/(loss) | | | (0.11 | )% | | | (0.25 | )%(g) | | | 0.22 | % | | | 0.52 | % | | | 0.16 | %(g) |
| Operating expenses excluding reimbursement/waiver | | | 1.83 | % | | | 2.14 | %(g) | | | 1.67 | % | | | 1.56 | % | | | 2.49 | %(g) |
| Operating expenses including reimbursement/waiver | | | 1.25 | % | | | 1.25 | %(g) | | | 1.25 | % | | | 1.25 | % | | | 1.25 | %(g) |
| PORTFOLIO TURNOVER RATE | | | 66 | % | | | 31 | %(f) | | | 69 | % | | | 49 | % | | | 67 | %(f) |
(a) | Effective March 3, 2015 the Board approved changing the fiscal year-end of the Fund from September 30 to April 30. |
(b) | Prior to its June 26, 2015 reorganization with and into the Emerald Small Cap Value Fund, the Fund was known as the Elessar Small Cap Value Fund. |
(c) | For the period October 15, 2012 (commencement of investment operations) through September 30, 2013. |
(d) | Per share amounts are based upon average shares outstanding. |
(e) | The amount shown for a share outstanding throughout the period may not correlate with the Statement of Operations for the period due to the timing of sales and redemptions of Fund shares in relation to income earned and/or fluctuating market value of the investments of the Fund. |
See Notes to Financial Statements.
| 46 | www.emeraldmutualfunds.com |
| Emerald Insights Fund | Financial Highlights |
For a share outstanding throughout the period presented
| | | CLASS A | |
| | | Year Ended April 30, 2017 | | | Year Ended April 30, 2016 | | | For the Period August 1, 2014 (Inception) to April 30, 2015 | |
| NET ASSET VALUE, BEGINNING OF PERIOD | | $ | 9.69 | | | $ | 10.98 | | | $ | 10.00 | |
| INCOME/(LOSS) FROM OPERATIONS: | | | | | | | | | | | | |
Net investment loss(a) | | | (0.06 | ) | | | (0.05 | ) | | | (0.05 | ) |
| Net realized and unrealized gain/(loss) on investments | | | 1.70 | | | | (1.24 | ) | | | 1.03 | |
| Total from Investment Operations | | | 1.64 | | | | (1.29 | ) | | | 0.98 | |
| | | | | | | | | | | | | |
| NET INCREASE/(DECREASE) IN NET ASSET VALUE | | | 1.64 | | | | (1.29 | ) | | | 0.98 | |
| NET ASSET VALUE, END OF PERIOD | | $ | 11.33 | | | $ | 9.69 | | | $ | 10.98 | |
| | | | | | | | | | | | | |
TOTAL RETURN(b) | | | 16.92 | % | | | (11.75 | %) | | | 9.80 | %(c) |
| RATIOS/SUPPLEMENTAL DATA: | | | | | | | | | | | | |
| Net Assets, End of Period (000s) | | $ | 10,127 | | | $ | 11,388 | | | $ | 6,493 | |
| RATIOS TO AVERAGE NET ASSETS: | | | | | | | | | | | | |
| Net Investment loss | | | (0.57 | %) | | | (0.54 | %) | | | (0.66 | %)(d) |
| Operating expenses excluding reimbursement/waiver | | | 2.10 | % | | | 2.01 | % | | | 2.57 | %(d)(e) |
| Operating expenses including reimbursement/waiver | | | 1.35 | % | | | 1.35 | % | | | 1.35 | %(d)(e) |
| PORTFOLIO TURNOVER RATE | | | 75 | % | | | 99 | % | | | 88 | %(c) |
(a) | Per share amounts are based upon average shares outstanding. |
(b) | Total return does not reflect the effect of sales charges. |
(e) | Expense ratios before reductions for startup costs may not be representative of longer term operating periods. |
See Notes to Financial Statements.
| Annual Report | April 30, 2017 | 47 |
| Emerald Insights Fund | Financial Highlights |
For a share outstanding throughout the period presented
| | | CLASS C | |
| | | Year Ended April 30, 2017 | | | Year Ended April 30, 2016 | | | For the Period August 1, 2014 (Inception) to April 30, 2015 | |
| NET ASSET VALUE, BEGINNING OF PERIOD | | $ | 9.56 | | | $ | 10.92 | | | $ | 10.00 | |
| INCOME/(LOSS) FROM OPERATIONS: | | | | | | | | | | | | |
Net investment loss(a) | | | (0.13 | ) | | | (0.11 | ) | | | (0.10 | ) |
| Net realized and unrealized gain/(loss) on investments | | | 1.68 | | | | (1.25 | ) | | | 1.02 | |
| Total from Investment Operations | | | 1.55 | | | | (1.36 | ) | | | 0.92 | |
| | | | | | | | | | | | | |
| NET INCREASE/(DECREASE) IN NET ASSET VALUE | | | 1.55 | | | | (1.36 | ) | | | 0.92 | |
| NET ASSET VALUE, END OF PERIOD | | $ | 11.11 | | | $ | 9.56 | | | $ | 10.92 | |
| | | | | | | | | | | | | |
TOTAL RETURN(b) | | | 16.21 | % | | | (12.45 | %) | | | 9.20 | %(c) |
| RATIOS/SUPPLEMENTAL DATA: | | | | | | | | | | | | |
| Net Assets, End of Period (000s) | | $ | 112 | | | $ | 101 | | | $ | 27 | |
| RATIOS TO AVERAGE NET ASSETS: | | | | | | | | | | | | |
| Net Investment loss | | | (1.22 | %) | | | (1.17 | %) | | | (1.34 | %)(d) |
| Operating expenses excluding reimbursement/waiver | | | 2.76 | % | | | 2.70 | % | | | 7.25 | %(d)(e) |
| Operating expenses including reimbursement/waiver | | | 2.00 | % | | | 2.00 | % | | | 2.00 | %(d)(e) |
| PORTFOLIO TURNOVER RATE | | | 75 | % | | | 99 | % | | | 88 | %(c) |
(a) | Per share amounts are based upon average shares outstanding. |
(b) | Total return does not reflect the effect of sales charges. |
(e) | Expense ratios before reductions for startup costs may not be representative of longer term operating periods. |
See Notes to Financial Statements.
| 48 | www.emeraldmutualfunds.com |
| Emerald Insights Fund | Financial Highlights |
For a share outstanding throughout the period presented
| | | INSTITUTIONAL CLASS | |
| | | Year Ended April 30, 2017 | | | Year Ended April 30, 2016 | | | For the Period August 1, 2014 (Inception) to April 30, 2015 | |
| NET ASSET VALUE, BEGINNING OF PERIOD | | $ | 9.73 | | | $ | 10.99 | | | $ | 10.00 | |
| INCOME/(LOSS) FROM OPERATIONS: | | | | | | | | | | | | |
Net investment loss(a) | | | (0.03 | ) | | | (0.00 | )(b) | | | (0.03 | ) |
| Net realized and unrealized gain/(loss) on investments | | | 1.71 | | | | (1.26 | ) | | | 1.02 | |
| Total from Investment Operations | | | 1.68 | | | | (1.26 | ) | | | 0.99 | |
| | | | | | | | | | | | | |
| NET INCREASE/(DECREASE) IN NET ASSET VALUE | | | 1.68 | | | | (1.26 | ) | | | 0.99 | |
| NET ASSET VALUE, END OF PERIOD | | $ | 11.41 | | | $ | 9.73 | | | $ | 10.99 | |
| | | | | | | | | | | | | |
| TOTAL RETURN | | | 17.27 | % | | | (11.46 | %) | | | 9.90 | %(c) |
| RATIOS/SUPPLEMENTAL DATA: | | | | | | | | | | | | |
| Net Assets, End of Period (000s) | | $ | 1,048 | | | $ | 1,729 | | | $ | 279 | |
| RATIOS TO AVERAGE NET ASSETS: | | | | | | | | | | | | |
| Net Investment loss | | | (0.28 | %) | | | (0.05 | %) | | | (0.34 | %)(d) |
| Operating expenses excluding reimbursement/waiver | | | 1.78 | % | | | 1.90 | % | | | 4.66 | %(d)(e) |
| Operating expenses including reimbursement/waiver | | | 1.05 | % | | | 1.05 | % | | | 1.05 | %(d)(e) |
| PORTFOLIO TURNOVER RATE | | | 75 | % | | | 99 | % | | | 88 | %(c) |
(a) | Per share amounts are based upon average shares outstanding. |
(b) | Less than $0.005 per share. |
(e) | Expense ratios before reductions for startup costs may not be representative of longer term operating periods. |
See Notes to Financial Statements.
| Annual Report | April 30, 2017 | 49 |
| Emerald Insights Fund | Financial Highlights |
For a share outstanding throughout the period presented
| | | INVESTOR CLASS | |
| | | Year Ended April 30, 2017 | | | Year Ended April 30, 2016 | | | For the Period August 1, 2014 (Inception) to April 30, 2015 | |
| NET ASSET VALUE, BEGINNING OF PERIOD | | $ | 9.67 | | | $ | 10.96 | | | $ | 10.00 | |
| INCOME/(LOSS) FROM OPERATIONS: | | | | | | | | | | | | |
Net investment loss(a) | | | (0.07 | ) | | | (0.08 | ) | | | (0.05 | ) |
| Net realized and unrealized gain/(loss) on investments | | | 1.69 | | | | (1.21 | ) | | | 1.01 | |
| Total from Investment Operations | | | 1.62 | | | | (1.29 | ) | | | 0.96 | |
| | | | | | | | | | | | | |
| NET INCREASE/(DECREASE) IN NET ASSET VALUE | | | 1.62 | | | | (1.29 | ) | | | 0.96 | |
| NET ASSET VALUE, END OF PERIOD | | $ | 11.29 | | | $ | 9.67 | | | $ | 10.96 | |
| | | | | | | | | | | | | |
| TOTAL RETURN | | | 16.75 | % | | | (11.77 | %) | | | 9.60 | %(b) |
| RATIOS/SUPPLEMENTAL DATA: | | | | | | | | | | | | |
| Net Assets, End of Period (000s) | | $ | 88 | | | $ | 86 | | | $ | 448 | |
| RATIOS TO AVERAGE NET ASSETS: | | | | | | | | | | | | |
| Net Investment loss | | | (0.63 | %) | | | (0.72 | %) | | | (0.67 | %)(c) |
| Operating expenses excluding reimbursement/waiver | | | 2.09 | % | | | 1.91 | % | | | 2.96 | %(c)(d) |
| Operating expenses including reimbursement/waiver | | | 1.40 | % | | | 1.40 | % | | | 1.40 | %(c)(d) |
| PORTFOLIO TURNOVER RATE | | | 75 | % | | | 99 | % | | | 88 | %(b) |
(a) | Per share amounts are based upon average shares outstanding. |
(d) | Expense ratios before reductions for startup costs may not be representative of longer term operating periods. |
See Notes to Financial Statements.
| 50 | www.emeraldmutualfunds.com |
| Emerald Banking and Finance Fund | Financial Highlights |
For a share outstanding throughout the periods presented
| | | CLASS A | |
| | | Year Ended April 30, 2017 | | | Year Ended April 30, 2016 | | | Year Ended April 30, 2015 | | | Year Ended April 30, 2014 | | | Year Ended April 30, 2013 | |
| NET ASSET VALUE, BEGINNING OF PERIOD | | $ | 31.27 | | | $ | 28.85 | | | $ | 26.11 | | | $ | 20.08 | | | $ | 16.96 | |
INCOME/(LOSS) FROM OPERATIONS:(a) | | | | | | | | | | | | | | | | | | | | |
Net investment loss(b) | | | (0.17 | ) | | | (0.06 | ) | | | (0.16 | ) | | | (0.13 | ) | | | (0.01 | ) |
| Net realized and unrealized gain on investments | | | 10.51 | | | | 2.48 | | | | 2.90 | | | | 6.16 | | | | 3.13 | |
| Total from Investment Operations | | | 10.34 | | | | 2.42 | | | | 2.74 | | | | 6.03 | | | | 3.12 | |
| | | | | | | | | | | | | | | | | | | | | |
| NET INCREASE IN NET ASSET VALUE | | | 10.34 | | | | 2.42 | | | | 2.74 | | | | 6.03 | | | | 3.12 | |
| NET ASSET VALUE, END OF PERIOD | | $ | 41.61 | | | $ | 31.27 | | | $ | 28.85 | | | $ | 26.11 | | | $ | 20.08 | |
| | | | | | | | | | | | | | | | | | | | | |
TOTAL RETURN(c) | | | 33.07 | % | | | 8.39 | % | | | 10.49 | % | | | 30.03 | % | | | 18.40 | % |
| RATIOS/SUPPLEMENTAL DATA: | | | | | | | | | | | | | | | | | | | | |
| Net Assets, End of Period (000s) | | $ | 172,106 | | | $ | 110,601 | | | $ | 48,575 | | | $ | 48,622 | | | $ | 25,496 | |
| RATIOS TO AVERAGE NET ASSETS: | | | | | | | | | | | | | | | | | | | | |
| Net Investment loss | | | (0.46 | )% | | | (0.21 | )% | | | (0.58 | )% | | | (0.53 | )% | | | (0.06 | )% |
| Operating expenses excluding reimbursement/waiver | | | 1.43 | % | | | 1.48 | % | | | 1.60 | % | | | 1.72 | % | | | 1.88 | % |
| Operating expenses including reimbursement/waiver | | | 1.43 | % | | | 1.48 | % | | | 1.60 | % | | | 1.72 | % | | | 1.84 | % |
| PORTFOLIO TURNOVER RATE | | | 36 | % | | | 30 | % | | | 33 | % | | | 34 | % | | | 53 | % |
(a) | The amount shown for a share outstanding throughout the period may not correlate with the Statement of Operations for the period due to the timing of sales and redemptions of Fund shares in relation to income earned and/or fluctuating market value of the investments of the Fund. |
(b) | Per share amounts are based upon average shares outstanding. |
(c) | Total return does not reflect the effect of sales charges. |
See Notes to Financial Statements.
| Annual Report | April 30, 2017 | 51 |
| Emerald Banking and Finance Fund | Financial Highlights |
For a share outstanding throughout the periods presented
| | | CLASS C | |
| | | Year Ended April 30, 2017 | | | Year Ended April 30, 2016 | | | Year Ended April 30, 2015 | | | Year Ended April 30, 2014 | | | Year Ended April 30, 2013 | |
| NET ASSET VALUE, BEGINNING OF PERIOD | | $ | 28.20 | | | $ | 26.19 | | | $ | 23.86 | | | $ | 18.46 | | | $ | 15.70 | |
INCOME/(LOSS) FROM OPERATIONS:(a) | | | | | | | | | | | | | | | | | | | | |
Net investment loss(b) | | | (0.36 | ) | | | (0.24 | ) | | | (0.30 | ) | | | (0.26 | ) | | | (0.11 | ) |
| Net realized and unrealized gain on investments | | | 9.45 | | | | 2.25 | | | | 2.63 | | | | 5.66 | | | | 2.87 | |
| Total from Investment Operations | | | 9.09 | | | | 2.01 | | | | 2.33 | | | | 5.40 | | | | 2.76 | |
| | | | | | | | | | | | | | | | | | | | | |
| NET INCREASE IN NET ASSET VALUE | | | 9.09 | | | | 2.01 | | | | 2.33 | | | | 5.40 | | | | 2.76 | |
| NET ASSET VALUE, END OF PERIOD | | $ | 37.29 | | | $ | 28.20 | | | $ | 26.19 | | | $ | 23.86 | | | $ | 18.46 | |
| | | | | | | | | | | | | | | | | | | | | |
TOTAL RETURN(c) | | | 32.23 | % | | | 7.67 | % | | | 9.77 | % | | | 29.25 | % | | | 17.58 | % |
| RATIOS/SUPPLEMENTAL DATA: | | | | | | | | | | | | | | | | | | | | |
| Net Assets, End of Period (000s) | | $ | 76,072 | | | $ | 52,366 | | | $ | 31,862 | | | $ | 28,222 | | | $ | 17,705 | |
| RATIOS TO AVERAGE NET ASSETS: | | | | | | | | | | | | | | | | | | | | |
| Net Investment loss | | | (1.11 | )% | | | (0.87 | )% | | | (1.23 | )% | | | (1.18 | )% | | | (0.68 | )% |
| Operating expenses excluding reimbursement/waiver | | | 2.08 | % | | | 2.13 | % | | | 2.25 | % | | | 2.38 | % | | | 2.54 | % |
| Operating expenses including reimbursement/waiver | | | 2.08 | % | | | 2.13 | % | | | 2.25 | % | | | 2.38 | % | | | 2.49 | % |
| PORTFOLIO TURNOVER RATE | | | 36 | % | | | 30 | % | | | 33 | % | | | 34 | % | | | 53 | % |
(a) | The amount shown for a share outstanding throughout the period may not correlate with the Statement of Operations for the period due to the timing of sales and redemptions of Fund shares in relation to income earned and/or fluctuating market value of the investments of the Fund. |
(b) | Per share amounts are based upon average shares outstanding. |
(c) | Total return does not reflect the effect of sales charges. |
See Notes to Financial Statements.
| 52 | www.emeraldmutualfunds.com |
| Emerald Banking and Finance Fund | Financial Highlights |
For a share outstanding throughout the periods presented
| | | INSTITUTIONAL CLASS | |
| | | Year Ended April 30, 2017 | | | Year Ended April 30, 2016 | | | Year Ended April 30, 2015 | | | Year Ended April 30, 2014 | | | Year Ended April 30, 2013 | |
| NET ASSET VALUE, BEGINNING OF PERIOD | | $ | 31.69 | | | $ | 29.15 | | | $ | 26.29 | | | $ | 20.15 | | | $ | 16.96 | |
| INCOME/(LOSS) FROM OPERATIONS: | | | | | | | | | | | | | | | | | | | | |
Net investment income/(loss)(a) | | | (0.05 | ) | | | 0.03 | | | | (0.07 | ) | | | (0.06 | ) | | | 0.01 | |
| Net realized and unrealized gain on investments | | | 10.66 | | | | 2.51 | | | | 2.93 | | | | 6.20 | | | | 3.18 | |
| Total from Investment Operations | | | 10.61 | | | | 2.54 | | | | 2.86 | | | | 6.14 | | | | 3.19 | |
| | | | | | | | | | | | | | | | | | | | | |
| NET INCREASE IN NET ASSET VALUE | | | 10.61 | | | | 2.54 | | | | 2.86 | | | | 6.14 | | | | 3.19 | |
| NET ASSET VALUE, END OF PERIOD | | $ | 42.30 | | | $ | 31.69 | | | $ | 29.15 | | | $ | 26.29 | | | $ | 20.15 | |
| | | | | | | | | | | | | | | | | | | | | |
| TOTAL RETURN | | | 33.48 | % | | | 8.71 | % | | | 10.88 | % | | | 30.47 | % | | | 18.81 | % |
| RATIOS/SUPPLEMENTAL DATA: | | | | | | | | | | | | | | | | | | | | |
| Net Assets, End of Period (000s) | | $ | 134,027 | | | $ | 61,654 | | | $ | 23,730 | | | $ | 22,062 | | | $ | 4,321 | |
| RATIOS TO AVERAGE NET ASSETS: | | | | | | | | | | | | | | | | | | | | |
| Net Investment income/(loss) | | | (0.14 | )% | | | 0.11 | % | | | (0.25 | )% | | | (0.23 | )% | | | 0.06 | % |
| Operating expenses excluding reimbursement/waiver | | | 1.11 | % | | | 1.15 | % | | | 1.27 | % | | | 1.37 | % | | | 1.62 | % |
| Operating expenses including reimbursement/waiver | | | 1.11 | % | | | 1.15 | % | | | 1.27 | % | | | 1.37 | % | | | 1.54 | % |
| PORTFOLIO TURNOVER RATE | | | 36 | % | | | 30 | % | | | 33 | % | | | 34 | % | | | 53 | % |
(a) | Per share amounts are based upon average shares outstanding. |
See Notes to Financial Statements.
| Annual Report | April 30, 2017 | 53 |
| Emerald Banking and Finance Fund | Financial Highlights |
For a share outstanding throughout the periods presented
| | | INVESTOR CLASS | |
| | | Year Ended April 30, 2017 | | | Year Ended April 30, 2016 | | | Year Ended April 30, 2015 | | | Year Ended April 30, 2014 | | | Year Ended April 30, 2013 | |
| NET ASSET VALUE, BEGINNING OF PERIOD | | $ | 29.95 | | | $ | 27.64 | | | $ | 25.01 | | | $ | 19.23 | | | $ | 16.25 | |
INCOME/(LOSS) FROM OPERATIONS:(a) | | | | | | | | | | | | | | | | | | | | |
Net investment loss(b) | | | (0.16 | ) | | | (0.07 | ) | | | (0.15 | ) | | | (0.12 | ) | | | (0.01 | ) |
| Net realized and unrealized gain on investments | | | 10.07 | | | | 2.38 | | | | 2.78 | | | | 5.90 | | | | 2.99 | |
| Total from Investment Operations | | | 9.91 | | | | 2.31 | | | | 2.63 | | | | 5.78 | | | | 2.98 | |
| | | | | | | | | | | | | | | | | | | | | |
| NET INCREASE IN NET ASSET VALUE | | | 9.91 | | | | 2.31 | | | | 2.63 | | | | 5.78 | | | | 2.98 | |
| NET ASSET VALUE, END OF PERIOD | | $ | 39.86 | | | $ | 29.95 | | | $ | 27.64 | | | $ | 25.01 | | | $ | 19.23 | |
| | | | | | | | | | | | | | | | | | | | | |
| TOTAL RETURN | | | 33.09 | % | | | 8.36 | % | | | 10.52 | % | | | 30.06 | % | | | 18.34 | % |
| RATIOS/SUPPLEMENTAL DATA: | | | | | | | | | | | | | | | | | | | | |
| Net Assets, End of Period (000s) | | $ | 85,557 | | | $ | 80,404 | | | $ | 27,440 | | | $ | 19,235 | | | $ | 6,255 | |
| RATIOS TO AVERAGE NET ASSETS: | | | | | | | | | | | | | | | | | | | | |
| Net Investment loss | | | (0.46 | )% | | | (0.23 | )% | | | (0.56 | )% | | | (0.53 | )% | | | (0.08 | )% |
| Operating expenses excluding reimbursement/waiver | | | 1.43 | % | | | 1.48 | % | | | 1.58 | % | | | 1.69 | % | | | 1.94 | % |
| Operating expenses including reimbursement/waiver | | | 1.43 | % | | | 1.48 | % | | | 1.58 | % | | | 1.69 | % | | | 1.89 | % |
| PORTFOLIO TURNOVER RATE | | | 36 | % | | | 30 | % | | | 33 | % | | | 34 | % | | | 53 | % |
(a) | The amount shown for a share outstanding throughout the period may not correlate with the Statement of Operations for the period due to the timing of sales and redemptions of Fund shares in relation to income earned and/or fluctuating market value of the investments of the Fund. |
(b) | Per share amounts are based upon average shares outstanding. |
See Notes to Financial Statements.
| 54 | www.emeraldmutualfunds.com |
Emerald Funds | Notes to Financial Statements |
April 30, 2017
1. ORGANIZATION
Financial Investors Trust (the “Trust”), a Delaware statutory trust, is an open‐end management investment company registered under the Investment Company Act of 1940, as amended (the “1940 Act”). The Trust consists of multiple separate portfolios or series. This annual report describes the Emerald Growth Fund, Emerald Small Cap Value Fund, Emerald Insights Fund, and Emerald Banking and Finance Fund (each a “Fund” and collectively, the “Funds”). The Emerald Small Cap Value Fund is a successor to a previously operational fund which was a series of Elessar Funds Investment Trust, a Delaware statutory trust, and was organized into a series of the Trust effective as of the close of business on June 26, 2015. Effective March 3, 2015, the Board approved changing the fiscal year end of the Emerald Small Cap Value Fund from September 30 to April 30.
The Emerald Growth Fund and Emerald Insights Fund seek to achieve long‐term growth through capital appreciation. The Emerald Small Cap Value Fund seeks long‐term capital appreciation. The Emerald Banking and Finance Fund seeks to achieve long term growth through capital appreciation with income as a secondary objective.
2. SIGNIFICANT ACCOUNTING POLICIES
The accompanying financial statements were prepared in accordance with accounting principles generally accepted in the United States of America (“U.S. GAAP”). The preparation of financial statements in conformity with U.S. GAAP requires management to make certain estimates and assumptions that affect the reported amounts of assets and liabilities and disclosures of contingent assets and liabilities at the date of the financial statements and the reported amounts of revenue and expenses during the period. Actual results could differ from those estimates. The Funds are considered an investment company for financial reporting purposes under U.S. GAAP. The following is a summary of significant accounting policies consistently followed by the Funds in preparation of their financial statements.
Investment Valuation: The Funds generally value their securities based on market prices determined at the close of regular trading on the New York Stock Exchange (“NYSE”), normally, 4:00 p.m. Eastern time, on each business day the NYSE is open for trading.
For equity securities and mutual funds that are traded on an exchange, the market price is usually the closing sale or official closing price on that exchange. In the case of equity securities not traded on an exchange, or if such closing prices are not otherwise available, the securities are valued at the mean of the most recent bid and ask prices on such day. Redeemable securities issued by open‐end registered investment companies are valued at the investment company’s applicable net asset value, with the exception of exchange‐traded open‐end investment companies, which are priced as equity securities.
The market price for debt obligations is generally the price supplied by an independent third‐party pricing service approved by the Board of Trustees (the “Board”), which may use a matrix, formula or other objective method that takes into consideration quotations from dealers, market transactions in comparable investments, market indices and yield curves. If vendors are unable to supply a price, or if the price supplied is deemed to be unreliable, the market price may be determined using quotations received from one or more brokers–dealers that make a market in the security.
Equity securities that are primarily traded on foreign securities exchanges are valued at the preceding closing values of such securities on their respective exchanges, except when an occurrence subsequent to the time a value was so established is likely to have changed such value. In such an event, the fair values of those securities are determined in good faith through consideration of other factors in accordance with procedures established by and under the general supervision of the Board.
When such prices or quotations are not available, or when Emerald Mutual Fund Advisers Trust, (the “Adviser”), believes that they are unreliable, securities may be priced using fair value procedures approved by the Board.
Fair Value Measurements: A three‐tier hierarchy has been established to classify fair value measurements for disclosure purposes. Inputs refer broadly to the assumptions that market participants would use in pricing the asset or liability, including assumptions about risk. Inputs may be observable or unobservable. Observable inputs are inputs that reflect the assumptions market participants would use in pricing the asset or liability that are developed based on market data obtained from sources independent of the reporting entity. Unobservable inputs are inputs that reflect the reporting entity’s own assumptions about the assumptions market participants would use in pricing the asset or liability that are developed based on the best information available. Various inputs are used in determining the value of each Fund’s investments as of the reporting period end. The designated input levels are not necessarily an indication of the risk or liquidity associated with these investments.
Annual Report | April 30, 2017 | 55 |
Emerald Funds | Notes to Financial Statements |
April 30, 2017
These inputs are categorized in the following hierarchy under applicable financial accounting standards:
| | Level 1 – | Unadjusted quoted prices in active markets for identical investments, unrestricted assets or liabilities that the Funds have the ability to access at the measurement date; |
| | Level 2 – | Quoted prices which are not active, quoted prices for similar assets or liabilities in active markets or inputs other than quoted prices that are observable (either directly or indirectly) for substantially the full term of the asset or liability; and |
| | Level 3 – | Significant unobservable prices or inputs (including the Funds’ own assumptions in determining the fair value of investments) where there is little or no market activity for the asset or liability at the measurement date. |
The following is a summary of each input used to value the Funds as of April 30, 2017:
| Investments in Securities at Value | | Level 1 - Quoted Prices | | | Level 2 - Other Significant Observable Inputs | | | Level 3 - Significant Unobservable Inputs | | | Total | |
| Emerald Growth Fund | | | | | | | | | | | | |
| Common Stocks | | | | | | | | | | | | |
| Financial Services | | $ | 130,465,548 | | | $ | 2,495,978 | | | $ | – | | | $ | 132,961,526 | |
Other(a) | | | 867,547,775 | | | | – | | | | – | | | | 867,547,775 | |
| Short Term Investments | | | 20,498,543 | | | | – | | | | – | | | | 20,498,543 | |
| TOTAL | | $ | 1,018,511,866 | | | $ | 2,495,978 | | | $ | – | | | $ | 1,021,007,844 | |
| Investments in Securities at Value | | Level 1 - Quoted Prices | | | Level 2 - Other Significant Observable Inputs | | | Level 3 - Significant Unobservable Inputs | | | Total | |
| Emerald Small Cap Value Fund | | | | | | | | | | | | |
Common Stocks(a) | | $ | 7,652,224 | | | $ | – | | | $ | – | | | $ | 7,652,224 | |
| Short Term Investments | | | 309,846 | | | | – | | | | – | | | | 309,846 | |
| TOTAL | | $ | 7,962,070 | | | $ | – | | | $ | – | | | $ | 7,962,070 | |
| Investments in Securities at Value | | Level 1 - Quoted Prices | | | Level 2 - Other Significant Observable Inputs | | | Level 3 - Significant Unobservable Inputs | | | Total | |
| Emerald Insights Fund | | | | | | | | | | | | |
Common Stocks(a) | | $ | 11,199,070 | | | $ | – | | | $ | – | | | $ | 11,199,070 | |
Master Limited Partnerships(a) | | | 103,485 | | | | – | | | | – | | | | 103,485 | |
| Short Term Investments | | | 127,019 | | | | – | | | | – | | | | 127,019 | |
| TOTAL | | $ | 11,429,574 | | | $ | – | | | $ | – | | | $ | 11,429,574 | |
| Investments in Securities at Value | | Level 1 - Quoted Prices | | | Level 2 - Other Significant Observable Inputs | | | Level 3 - Significant Unobservable Inputs | | | Total | |
| Emerald Banking and Finance Fund | | | | | | | | | | | | |
| Common Stocks | | | | | | | | | | | | |
| Banks: Diversified | | $ | 356,696,585 | | | $ | 10,520,036 | | | $ | – | | | $ | 367,216,621 | |
Other(a) | | | 92,832,514 | | | | – | | | | – | | | | 92,832,514 | |
| Short Term Investments | | | 8,933,798 | | | | – | | | | – | | | | 8,933,798 | |
| TOTAL | | $ | 458,462,897 | | | $ | 10,520,036 | | | $ | – | | | $ | 468,982,933 | |
(a) | For detailed descriptions of sector and industry, see the accompanying Schedule of Investments. |
56 | www.emeraldmutualfunds.com |
Emerald Funds | Notes to Financial Statements |
April 30, 2017
The Funds recognize transfers between levels as of the end of the period. For the year ended April 30, 2017, the Funds had the following transfers between Level 1 and Level 2 securities.
| | | Level 1 | | | Level 2 | |
| Emerald Growth Fund | | Transfer In | | | Transfers (Out) | | | Transfer In | | | Transfers (Out) | |
| Common Stocks | | $ | – | | | $ | (2,495,978 | ) | | $ | 2,495,978 | | | $ | – | |
| Total | | $ | – | | | $ | (2,495,978 | ) | | $ | 2,495,978 | | | $ | – | |
| | | Level 1 | | | Level 2 | |
| Emerald Banking and Finance Fund | | Transfer In | | | Transfers (Out) | | | Transfer In | | | Transfers (Out) | |
| Common Stocks | | $ | 3,079,925 | | | $ | (5,725,833 | ) | | $ | 5,725,833 | | | $ | (3,079,925 | ) |
| Total | | $ | 3,079,925 | | | $ | (5,725,833 | ) | | $ | 5,725,833 | | | $ | (3,079,925 | ) |
The transfer amounts disclosed in the table above represent the value of the securities as of April 30, 2017 transferred in/(out) of Level 1 and Level 2 during the reporting period that were also held at April 30, 2016. The above transfers from Level 2 to Level 1 were due to the ability to obtain a closing market price within an active market for a security that previously had no market to trade. Additionally, the above transfers from Level 1 to Level 2 were due to the inability to obtain a closing market price due to an inactive market to trade. For the year ended April 30, 2017, the Emerald Small Cap Value Fund and Emerald Insights Fund did not have any transfers between Level 1 and Level 2 securities.
For the year ended April 30, 2017, the Funds did not have any securities that used significant unobservable inputs (Level 3) in determining fair value.
Investment Transactions and Investment Income: Investment transactions are accounted for on the date the investments are purchased or sold (trade date). Realized gains and losses from investment transactions are reported on an identified cost basis, which is the same basis the Funds use for federal income tax purposes. Interest income, which includes accretion of discounts, is accrued and recorded as earned. Dividend income is recognized on the ex-dividend date or for certain foreign securities, as soon as information is available to the Funds. All of the realized and unrealized gains and losses and net investment income, are allocated daily to each class in proportion to its average daily net assets.
Real Estate Investment Trusts (“REITs”): The Funds may invest a portion of their assets in REITs and are subject to certain risks associated with direct investment in REITs. REITs may be affected by changes in the value of their underlying properties and by defaults by borrowers or tenants. REITs depend generally on their ability to generate cash flow to make distributions to shareowners, and certain REITs have self liquidation provisions by which mortgages held may be paid in full and distributions of capital returns may be made at any time. In addition, the performance of a REIT may be affected by its failure to qualify for tax free pass through of income under the Internal Revenue Code of 1986, as amended (the “Code”), or its failure to maintain exemption from registration under the 1940 Act. A Fund’s investments in REITs may result in such Fund’s receipt of cash in excess of the REITs’ earnings. If the Fund receives such distributions all or a portion of these distributions will constitute a return of capital to such Fund. Receiving a return of capital distribution from REITs will reduce the amount of income available to be distributed to Fund shareholders. Income from REITs generally will not be eligible for treatment as qualified dividend income. As the final character of the distributions is not known until reported by the REITs on their 1099s, the Funds utilize an average of the prior year’s reallocation information as an estimate for the current year character of distributions.
Trust Expenses: Some expenses of the Trust can be directly attributed to the Funds. Expenses which cannot be directly attributed to the Funds are apportioned among all funds in the Trust based on average net assets of each fund.
Fund and Class Expenses: Expenses that are specific to a Fund or class of shares of a Fund, including distribution fees (Rule 12b‐1 fees) and shareholder servicing fees, are charged directly to that Fund or share class. All expenses of a Fund, other than class specific expenses, are allocated daily to each class in proportion to its average daily net assets. Expenses that are common to the Funds generally are allocated among the Funds in proportion to their average daily net assets.
Federal Income Taxes: Each Fund complies with the requirements under Subchapter M of the Internal Revenue Code of 1986, as amended, applicable to regulated investment companies and intends to distribute substantially all of its net taxable income and net capital gains, if any, each year so that the Funds will not be subject to excise tax on undistributed income and gains. The Funds are not subject to income taxes to the extent such distributions are made.
As of and during the year ended April 30, 2017, the Funds did not have a liability for any unrecognized tax benefits. The Funds file U.S. federal, state, and local tax returns as required. The Funds’ tax returns are subject to examination by the relevant tax authorities until expiration of the applicable statute of limitations, which is generally three years after the filing of the tax return for federal purposes and four years for most state returns. Tax returns for open years have incorporated no uncertain tax positions that require a provision for income taxes.
Annual Report | April 30, 2017 | 57 |
Emerald Funds | Notes to Financial Statements |
April 30, 2017
Distributions to Shareholders: Each Fund normally pays dividends and distributes capital gains, if any, on an annual basis. Income dividend distributions are derived from dividends and other income each Fund receives from its investments, including short‐term capital gains. Long term capital gain distributions are derived from gains realized when each Fund sells a security it has owned for more than a year. Each Fund may make additional distributions and dividends at other times if the portfolio manager believes doing so may be necessary for each Fund to avoid or reduce taxes.
3. TAX BASIS INFORMATION
Reclassifications: As of April 30, 2017, permanent differences on book and tax accounting were reclassified. These differences had no effect on net assets and were primarily attributed to treatment of Passive Foreign Investment Companies, partnerships, net investment losses and expiration of capital losses. These reclassifications were as follows:
| | | Undistributed Net Investment Income/(Loss) | | | Accumulated Net Realized Gain/(Loss) on Investments | | | Paid-in Capital | |
| Emerald Growth Fund | | $ | 4,514,307 | | | $ | (63,075 | ) | | $ | (4,451,232 | ) |
| Emerald Small Cap Value Fund | | | 1,345 | | | | (1,344 | ) | | | (1 | ) |
| Emerald Insights Fund | | | 64,665 | | | | (8,395 | ) | | | (56,270 | ) |
| Emerald Banking and Finance Fund | | | 1,220,265 | | | | 839,270 | | | | (2,059,535 | ) |
Included in those amounts reclassified was a net operating loss offset to Paid‐in capital for the Emerald Growth Fund, the Emerald Insights Fund, and the Emerald Banking and Finance Fund in the amount of $4,451,232, $56,271, and $1,220,265 respectively.
Tax Basis of Investments: As of April 30, 2017, the aggregate cost of investments, gross unrealized appreciation/(depreciation) and net unrealized appreciation/(depreciation) for Federal tax purposes was as follows:
| | | Gross Appreciation (excess of value over tax cost) | | | Gross Depreciation (excess of tax cost over value) | | | Net Unrealized Appreciation/(Depreciation) | | | Cost of Investments for Income Tax Purposes | |
| Emerald Growth Fund | | $ | 260,077,120 | | | $ | (34,161,328 | ) | | $ | 225,915,792 | | | $ | 795,092,052 | |
| Emerald Small Cap Value Fund | | | 1,453,340 | | | | (138,471 | ) | | | 1,314,869 | | | | 6,647,201 | |
| Emerald Insights Fund | | | 2,048,206 | | | | (342,358 | ) | | | 1,705,848 | | | | 9,723,726 | |
| Emerald Banking and Finance Fund | | | 140,267,386 | | | | (1,584,932 | ) | | | 138,682,454 | | | | 330,300,479 | |
Components of Distributable Earnings: As of April 30, 2017, components of distributable earnings were as follows:
| | | Emerald Growth Fund | | | Emerald Small Cap Value Fund | | | Emerald Insights Fund | | | Emerald Banking and Finance Fund | |
| Undistributed ordinary income | | $ | – | | | $ | 513,893 | | | $ | – | | | $ | – | |
| Accumulated capital gains/(losses) | | | (56,020,065 | ) | | | 2,819,913 | | | | (804,525 | ) | | | (7,383,718 | ) |
| Net unrealized appreciation on investments | | | 225,915,792 | | | | 1,314,869 | | | | 1,705,848 | | | | 138,682,454 | |
| Other cumulative effect of timing differences | | | (1,696,980 | ) | | | – | | | | (22,262 | ) | | | (877,904 | ) |
| Total | | $ | 168,198,747 | | | $ | 4,648,675 | | | $ | 879,061 | | | $ | 130,420,832 | |
Capital Losses: As of April 30, 2017, the Funds had capital loss carryforwards which may reduce the Funds’ taxable income arising from future net realized gains on investments, if any, to the extent permitted by the Code and thus may reduce the amount of the distributions to shareholders which would otherwise be necessary to relieve the Funds of any liability for federal tax. Pursuant to the Code, such capital loss carryforwards will expire as follows:
| | Expiring in 2017 | | Expiring in 2018 | |
| Emerald Banking and Finance Fund | | $ | – | | | $ | 1,370,886 | |
During the year ended April 30, 2017, $283,893 of capital loss carryforwards were utilized by the Emerald Small Cap Value Fund.
| 58 | www.emeraldmutualfunds.com |
Emerald Funds | Notes to Financial Statements |
April 30, 2017
As of April 30, 2017, the following Funds had available for Federal income tax purposes unused capital losses that may be used to offset future realized capital gains. The following losses will be carried forward indefinitely to offset future realized gains:
| | | Short-Term | | | Long-Term | |
| Emerald Growth Fund | | $ | 48,614,165 | | | $ | 7,045,781 | |
| Emerald Small Cap Value Fund | | | – | | | | – | |
| Emerald Insights Fund | | | 517,717 | | | | 192,557 | |
| Emerald Banking and Finance Fund | | | 4,542,900 | | | | – | |
The Emerald Growth Fund, Emerald Insights Fund and the Emerald Banking and Finance Fund elected to defer to the period ending April 30, 2018 capital losses recognized during the period November 1, 2016 to April 30, 2017 in the amount of $360,119, $94,251 and $1,469,932 respectively.
Ordinary Losses: As of April 30, 2017, Emerald Growth Fund, Emerald Insights Fund, and Emerald Banking and Finance Fund elected to defer to the period ending April 30, 2018, late year ordinary losses in the amount of $1,696,980, $22,262 and $877,904, respectively.
Tax Basis of Distributions to Shareholders: The character of distributions made during the year from net investment income or net realized gains may differ from its ultimate characterization for federal income tax purposes. Also, due to the timing of dividend distributions, the fiscal year in which amounts are distributed may differ from the fiscal year in which the income or realized gain were recorded by each Fund.
For the fiscal year ended April 30, 2017, the Funds did not pay any distributions.
The tax character of distributions paid by the Funds for the fiscal year or period ended April 30, 2016, were as follows:
| | | Ordinary Income | | | Long-Term Capital Gain | |
| Emerald Growth Fund | | $ | – | | | $ | 22,536,119 | |
| Emerald Small Cap Value Fund | | | 81,808 | | | | – | |
| Emerald Insights Fund | | | – | | | | – | |
| Emerald Banking and Finance Fund | | | – | | | | – | |
4. SECURITIES TRANSACTIONS
The cost of purchases and proceeds from sales of securities (excluding short‐term securities) during the year or period ended April 30, 2017 was as follows:
| Funds | | Cost of Investments Purchased | | | Proceeds from Investments Sold | |
| Emerald Growth Fund | | $ | 517,854,245 | | | $ | 645,111,297 | |
| Emerald Small Cap Value Fund | | | 9,314,539 | | | | 21,428,368 | |
| Emerald Insights Fund | | | 8,992,627 | | | | 12,819,047 | |
| Emerald Banking and Finance Fund | | | 185,310,707 | | | | 126,679,806 | |
5. SHARES OF BENEFICIAL INTEREST
The capitalization of the Trust consists of an unlimited number of shares of beneficial interest with no par value per share. Holders of the shares of the Funds of the Trust have one vote for each share held and a proportionate fraction of a vote for each fractional share. All shares issued and outstanding are fully paid and are transferable and redeemable at the option of the shareholder. Purchasers of the shares do not have any obligation to make payments to the Trust or its creditors (other than the purchase price for the shares) or make contributions to the Trust or its creditors solely by reason of the purchaser’s ownership of the shares. Shares have no pre‐emptive rights.
6. MANAGEMENT AND RELATED‐PARTY TRANSACTIONS
The Adviser, subject to the authority of the Board, is responsible for the overall management and administration of the Funds’ business affairs. The Adviser manages the investments of the Funds in accordance with the Funds’ investment objective, policies and limitations and investment guidelines established jointly by the Adviser and the Trustees. Pursuant to the Advisory Agreement, the Funds pay the Adviser fees for the services and facilities it provides payable on a monthly basis at the annual rate set forth below of the Funds’ average daily net assets. The management fee is paid on a monthly basis.
Annual Report | April 30, 2017 | 59 |
Emerald Funds | Notes to Financial Statements |
April 30, 2017
| Emerald Growth Fund | |
| Average Total Net Assets | Contractual Fee |
| Up to and including $250M | 0.75% |
| Over $250M and including $500M | 0.65% |
| Over $500M and including $750M | 0.55% |
| Over $750M | 0.45% |
| Emerald Small Cap Value Fund | |
| Average Total Net Assets | Contractual Fee |
| Up to and including $250M | 0.75% |
| Over $250M and including $500M | 0.65% |
| Over $500M and including $750M | 0.55% |
| Over $750M | 0.45% |
| Emerald Insights Fund | |
| Average Total Net Assets | Contractual Fee |
| Up to and including $250M | 0.75% |
| Over $250M and including $500M | 0.65% |
| Over $500M and including $750M | 0.55% |
| Over $750M | 0.45% |
| Emerald Banking and Finance Fund | |
| Average Total Net Assets | Contractual Fee |
| Up to and including $100M | 1.00% |
| Over $100M | 0.90% |
The Adviser has contractually agreed to limit each Fund’s total annual operating expenses (exclusive of acquired fund fees and expenses, brokerage expenses, interest expenses, taxes and extraordinary expense) set forth in the preceding table for Class A, Class C, Institutional Class, and Investor Class shares to the annual rates (as percentages of a Fund’s average daily net assets). This agreement (the “Expense Agreement”) is in effect from September 1, 2016 through August 31, 2017 for all Funds except the Emerald Small Cap Value Fund. The Emerald Small Cap Value Fund’s agreement is in effect from June 26, 2015 through August 31, 2017. The prior Expense Agreement was in effect from September 1, 2015 through August 31, 2016 for all Funds except the Emerald Small Cap Value Fund. The Adviser will be permitted to recover, on a class‐by‐class basis, expenses it has borne through the expense agreement to the extent that a Fund’s expenses in later periods fall below the expense cap in effect at the time of the waiver or reimbursement. Notwithstanding the foregoing, the Funds will not be obligated to pay any such fees and expenses more than three years after the end of the fiscal year in which the fees or expenses were foregone or reimbursed. The Adviser may not discontinue this waiver, prior to August 31, 2017, without the approval by the Fund’s Board. Fees waived/reimbursed by the Adviser for the year ended April 30, 2017 are disclosed in the Statements of Operations.
60 | www.emeraldmutualfunds.com |
Emerald Funds | Notes to Financial Statements |
April 30, 2017
| Emerald Growth Fund | | | |
| Class A | Class C | Institutional Class | Investor Class |
| 1.29% | 1.94% | 0.99% | 1.34% |
| | | | |
| Emerald Small Cap Value Fund | | | |
| Class A | Class C | Institutional Class | Investor Class |
| 1.35% | 2.00% | 1.00% | 1.25% |
| | | | |
| Emerald Insights Fund | | | |
| Class A | Class C | Institutional Class | Investor Class |
| 1.35% | 2.00% | 1.05% | 1.40% |
| | | | |
| Emerald Banking and Finance Fund | | |
| Class A | Class C | Institutional Class | Investor Class |
| 1.84% | 2.49% | 1.54% | 1.89% |
For the year ended April 30, 2017, the fee waivers/reimbursements and recoupments of past waived fees were as follows:
| Fund | | Fees Waived/ Reimbursed By Adviser | | | Recoupment of Past Waived Fees By Adviser | |
| Emerald Growth Fund | | | | | | |
| Class A | | $ | – | | | $ | – | |
| Class C | | | – | | | | – | |
| Institutional Class | | | – | | | | – | |
| Investor Class | | | – | | | | – | |
| Emerald Small Cap Value Fund | | | | | | | | |
| Class A | | $ | 6,552 | | | $ | – | |
| Class C | | | 4,441 | | | | – | |
| Institutional Class | | | 67,420 | | | | – | |
| Investor Class | | | 8,254 | | | | – | |
| Emerald Insights Fund | | | | | | | | |
| Class A | | $ | 80,509 | | | $ | – | |
| Class C | | | 792 | | | | – | |
| Institutional Class | | | 9,737 | | | | – | |
| Investor Class | | | 615 | | | | 912 | |
| Emerald Banking and Finance Fund | | | | | | | | |
| Class A | | $ | – | | | $ | – | |
| Class C | | | – | | | | – | |
| Institutional Class | | | – | | | | – | |
| Investor Class | | | – | | | | – | |
Annual Report | April 30, 2017 | 61 |
| Emerald Funds | Notes to Financial Statements |
As of April 30, 2017, the balances of recoupable expenses for each Fund were as follows:
| Fund | | Expires 2018 | | | Expires 2019 | | | Expires 2020 | | | Total | |
| Emerald Growth Fund | | | | | | | | | | | | |
| Class A | | $ | – | | | $ | – | | | $ | – | | | $ | – | |
| Class C | | | – | | | | – | | | | – | | | | – | |
| Institutional Class | | | – | | | | – | | | | – | | | | – | |
| Investor Class | | | – | | | | – | | | | – | | | | – | |
| Emerald Small Cap Value Fund | | | | | | | | | | | | | | | | |
| Class A | | $ | 30 | | | $ | 256 | | | $ | 6,552 | | | $ | 6,838 | |
| Class C | | | 30 | | | | 617 | | | | 4,441 | | | | 5,088 | |
| Institutional Class | | | 37,563 | | | | 64,181 | | | | 67,420 | | | | 169,164 | |
| Investor Class | | | 852 | | | | 5,731 | | | | 8,254 | | | | 14,837 | |
| Emerald Insights Fund | | | | | | | | | | | | | | | | |
| Class A | | $ | 41,382 | | | $ | 67,047 | | | $ | 80,509 | | | $ | 188,938 | |
| Class C | | | 921 | | | | 467 | | | | 792 | | | | 2,180 | |
| Institutional Class | | | 3,464 | | | | 5,690 | | | | 9,737 | | | | 18,891 | |
| Investor Class | | | 960 | | | | 3,372 | | | | 615 | | | | 4,947 | |
| Emerald Banking and Finance Fund | | | | | | | | | | | | | | | | |
| Class A | | $ | – | | | $ | – | | | $ | – | | | $ | – | |
| Class C | | | – | | | | – | | | | – | | | | – | |
| Institutional Class | | | – | | | | – | | | | – | | | | – | |
| Investor Class | | | – | | | | – | | | | – | | | | – | |
Fund Administrator Fees and Expenses: ALPS Fund Services, Inc. (“ALPS”) serves as administrator to the Funds and the Funds have agreed to pay expenses incurred in connection with their administrative activities. Pursuant to an Administration Agreement, ALPS provides operational services to the Funds including, but not limited to, fund accounting and fund administration and generally assist in the Funds’ operations. Officers of the Trust are employees of ALPS. The Funds’ administration fee is accrued on a daily basis and paid monthly. Administration fees paid by the Funds for the year ended April 30, 2017 are disclosed in the Statements of Operations.
The Administrator is also reimbursed by the Funds for certain out‐of‐pocket expenses.
Transfer Agent: ALPS serves as transfer, dividend paying and shareholder servicing agent for the Funds. ALPS receives an annual minimum fee, a fee based upon the number of shareholder accounts, and is also reimbursed by the Funds for certain out‐of‐pocket expenses. Transfer agent fees paid by the Funds for the year ended April 30, 2017 are disclosed in the Statements of Operations.
Compliance Services: ALPS provides services that assist the Trust’s chief compliance officer in monitoring and testing the policies and procedures of the Trust in conjunction with requirements under Rule 38a‐1 under the 1940 Act and receives an annual base fee. ALPS is reimbursed for certain out‐of‐pocket expenses by the Funds. Compliance service fees paid by the Funds for the year ended April 30, 2017 are disclosed in the Statements of Operations.
Principal Financial Officer: ALPS receives an annual fee for providing principal financial officer services to the Funds. Principal financial officer fees paid by the Funds for the year ended April 30, 2017 are disclosed in the Statements of Operations.
Distributor: ALPS Distributors, Inc. (“ADI” or the “Distributor”) (an affiliate of ALPS Fund Services Inc. (“ALPS”)) acts as the distributor of the Funds’ shares pursuant to a Distribution Agreement with the Trust. Shares are sold on a continuous basis by ADI as agent for the Funds, and ADI has agreed to use its best efforts to solicit orders for the sale of Funds’ shares, although it is not obliged to sell any particular amount of shares. ADI is not entitled to any compensation for its services as Distributor. ADI is registered as a broker‐dealer with the U.S. Securities and Exchange Commission.
Each Fund has adopted a separate Distribution and Services Plan (each a “Plan” and collectively, the “Plans”) pursuant to Rule 12b‐1 of the 1940 Act. The Plans allow each Fund, as applicable, to use each Fund’s assets to pay fees in connection with the distribution and marketing of the Funds’ shares and/or the provision of shareholder services to the Funds’ shareholders. The Plan permits payment for services in connection with the administration of plans or programs that use shares of each Fund as their funding medium and for related expenses. The recipients of such payments may include other affiliates of the Adviser, broker‐dealers, financial institutions, plan sponsors and administrators and other financial intermediaries through which investors may purchase shares of the Fund. The Plans permit each Fund to make total payments at an annual rate of up to 0.35%, 0.75% and 0.25% of the average daily net asset value of Class A, Class C and Investor Class, respectively. Because these fees are paid out of the Funds’ assets on an ongoing basis, over time they will increase the cost of an investment in the Funds, and Plan fees may cost an investor more than other types of sales charges.
| 62 | www.emeraldmutualfunds.com |
| Emerald Funds | Notes to Financial Statements |
Each Fund, except the Emerald Small Cap Value Fund, has adopted a Shareholder Services Plan (a “Shareholder Services Plan”) with respect to its Class C, Institutional Class and Investor Class shares. Under the Shareholder Services Plan, a Fund is authorized to compensate certain financial intermediaries, including broker‐dealers and Fund affiliates which may include the Distributor, Adviser and/or the transfer agent (the “Participating Organizations”), an aggregate fee in an amount not to exceed on an annual basis 0.25%, 0.05% and 0.15% of the average daily net asset value of Class C, Institutional Class and Investor Class, respectively, of the Funds attributable to or held in the name of the Participating Organizations pursuant to an agreement with such Participating Organizations (the “Agreement”). Each Agreement will set forth the non‐distribution related shareholder services to be performed by the Participating Organizations for the benefit of a Fund’s shareholders who have elected to have such Participating Organizations service their accounts. Any amount of such payment not paid to Participating Organizations during a Fund’s fiscal year for such service activities shall be reimbursed to the Fund as soon as practicable. Fees recaptured pursuant to the Shareholder Services Plan and Shareholder Services Plan fees are included as an offset in distribution and service fees in the Statements of Operations.
The Emerald Small Cap Value Fund has adopted a Shareholder Services Plan (the “Services Plan”) with respect to its Class C shares. Under the Plan, the Fund is authorized to pay banks and its affiliates and other institutions, including broker‐dealers and Fund affiliates which may include the Distributor, Adviser and/or the transfer agent (“Class C Participating Organizations”), an aggregate fee in an amount not to exceed on an annual basis 0.25% of the average daily net asset value of Class C shares of the Fund attributable to or held in the name of the Participating Organizations for its clients as compensation for providing shareholder service activities, which do not include distribution services pursuant to an agreement with Participating Organizations. Any amount of such payment not paid to the Participating Organizations during the Fund’s fiscal year for such service activities shall be reimbursed to the Fund as soon as practicable. Fees recaptured pursuant to the Services Plan and Services Plan fees are included as an offset in distribution and service fees in the Statements of Operations.
7. INDEMNIFICATIONS
Under the Trust’s organizational documents, its officers and Trustees are indemnified against certain liability arising out of the performance of their duties to the Trust. Additionally, in the normal course of business, the Trust enters into contracts with service providers that may contain general indemnification clauses, which may permit indemnification to the extent permissible under applicable law. The Trust’s maximum exposure under these arrangements is unknown, as this would involve future claims that may be made against the Trust that have not yet occurred.
8. RECENT ACCOUNTING PRONOUNCEMENT
On October 13, 2016, the SEC amended Regulation S‐X, which will require standardized, enhanced disclosure about derivatives in investment company financial statements, as well as other amendments. The compliance date for the amendments to Regulation S‐X is August 1, 2017. Management is currently evaluating the impact to the financial statements and disclosures.
| Annual Report | April 30, 2017 | 63 |
| Emerald Funds | Report of Independent Registered Public Accounting Firm |
To the Shareholders and Board of Trustees of Financial Investors Trust:
We have audited the accompanying statements of assets and liabilities, including the schedules of investments, of Emerald Growth Fund, Emerald Small Cap Value Fund, Emerald Insights Fund, and Emerald Banking and Finance Fund (the “Funds”), four of the portfolios of Financial Investors Trust, as of April 30, 2017, and the related statements of operations for the year then ended, the statements of changes in net assets for each of the two years in the period then ended (as to the Emerald Small Cap Value Fund, for the year ended April 30, 2017, the period from October 1, 2015 to April 30, 2016, and for the year ended September 30, 2015), and the financial highlights for each of the five years in the period then ended (as to the Emerald Small Cap Value Fund, for the year ended April 30, 2017, the period from October 1, 2015 to April 30, 2016, and for the year ended September 30, 2015; and as to the Emerald Insights Fund, for each of the two years in the period ended April 30, 2017 and for the period from August 1, 2014 (inception) to April 30, 2015). These financial statements and financial highlights are the responsibility of the Funds’ management. Our responsibility is to express an opinion on these financial statements and financial highlights based on our audits. The financial highlights for the Emerald Small Cap Value Fund for the year ended September 30, 2014 and for the period from October 15, 2012 (commencement of investment operations) to September 30, 2013 were audited by other auditors whose report, dated November 24, 2014, expressed an unqualified opinion on such financial highlights.
We conducted our audits in accordance with the standards of the Public Company Accounting Oversight Board (United States). Those standards require that we plan and perform the audit to obtain reasonable assurance about whether the financial statements and financial highlights are free of material misstatement. The Funds are not required to have, nor were we engaged to perform, an audit of their internal control over financial reporting. Our audits included consideration of internal control over financial reporting as a basis for designing audit procedures that are appropriate in the circumstances, but not for the purpose of expressing an opinion on the effectiveness of the Funds’ internal control over financial reporting. Accordingly, we express no such opinion. An audit also includes examining, on a test basis, evidence supporting the amounts and disclosures in the financial statements, assessing the accounting principles used and significant estimates made by management, as well as evaluating the overall financial statement presentation. Our procedures included confirmation of securities owned as of April 30, 2017, by correspondence with the custodian and brokers; when replies were not received from brokers, we performed other auditing procedures. We believe that our audits provide a reasonable basis for our opinion.
In our opinion, the financial statements and financial highlights referred to above present fairly, in all material respects, the financial position of Emerald Growth Fund, Emerald Small Cap Value Fund, Emerald Insights Fund, and Emerald Banking and Finance Fund of Financial Investors Trust as of April 30, 2017, the results of their operations for the year then ended, the changes in their net assets for each of the two years in the period then ended (as to the Emerald Small Cap Value Fund, for the year ended April 30, 2017, for the period from October 1, 2015 to April 30, 2016, and for the year ended September 30, 2015), and the financial highlights for each of the five years in the period then ended (as to the Emerald Small Cap Value Fund, for the year ended April 30, 2017, for the period from October 1, 2015 to April 30, 2016, and for the year ended September 30, 2015; and as to the Emerald Insights Fund, for each of the two years in the period ended April 30, 2017 and for the period from August 1, 2014 (inception) to April 30, 2015), in conformity with accounting principles generally accepted in the United States of America.
DELOITTE & TOUCHE LLP
Denver, Colorado
June 27, 2017
| 64 | www.emeraldmutualfunds.com |
| Emerald Funds | Disclosure Regarding Approval of Fund Advisory Agreements |
| | April 30, 2017 (Unaudited) |
Emerald Banking and Finance Fund
Emerald Growth Fund
Emerald Insights Fund
Emerald Small Cap Value Fund
On December 13, 2016, the Trustees met in person to discuss, among other things, the approval of the investment advisory agreement between the Trust and the Adviser (the “Investment Advisory Agreement”), in accordance with Section 15(c) of the 1940 Act. In renewing and approving the Investment Advisory Agreement, the Trustees, including the Independent Trustees, considered the following factors with respect to the Funds:
Investment Advisory Fee Rate: The Trustees reviewed and considered the contractual annual advisory fee paid by the Trust, on behalf of the Funds, to the Adviser of 0.94% of the Emerald Banking and Finance Fund’s, 0.64% of the Emerald Growth Fund’s, and 0.75% of each of the Emerald Insights Fund’s and Emerald Small Cap Value Fund’s daily average net assets, in light of the extent and quality of the advisory services provided by the Adviser to the Funds.
The Board received and considered information including a comparison of each of the Fund’s contractual advisory fees and total expenses (net of waivers) with those of funds in the expense groups and universes of funds provided by an independent provider of investment company data (the “Data Provider”). The Trustees noted that the Emerald Banking and Finance Fund’s contractual advisory fee rate was above its Data Provider peer group median contractual advisory fee rate. The Trustees further noted that each of the Emerald Growth Fund’s, the Emerald Insights Fund’s, and the Emerald Small Cap Value Fund’s contractual advisory fee rates were below their respective Data Provider peer group median contractual advisory fee rates.
Total Expense Ratios: Based on such information, the Trustees further reviewed and considered the total expense ratios (after waivers) of 1.48% for Class A, 2.13% for Class C, 1.15% for Institutional Class, and 1.48% for Investor Class of the Emerald Banking and Finance Fund; 1.17% for Class A, 1.81% for Class C, 0.87% for Institutional Class, and 1.19% for Investor Class of the Emerald Growth Fund; 1.35% for Class A, 2.00% for Class C, 1.05% for Institutional Class, and 1.40% for Investor Class of the Emerald Insights Fund; and 1.35% for Class A, 2.00% for Class C, 1.00% for Institutional Class, and 1.25% for Investor Class of the Emerald Small Cap Value Fund.
The Trustees noted that the total expense ratios (after waivers) for the Emerald Banking and Finance Fund’s Class A and Institutional Class shares were above the Data Provider peer group median. They further noted that the total expense ratios (after waivers) for all classes of the Emerald Growth Fund, Emerald Insights Fund, and Emerald Small Cap Value Fund were below the applicable Data Provider median total expense ratios.
Nature, Extent, and Quality of the Services under the Investment Advisory Agreement: The Trustees received and considered information regarding the nature, extent, and quality of services to be provided to the Funds under the Investment Advisory Agreement. The Trustees reviewed certain background materials supplied by the Adviser in its presentation, including its Form ADV.
The Trustees reviewed and considered the Adviser’s investment advisory personnel, its history as an asset manager, and its performance and the amount of assets currently under management by the Adviser and its affiliated entities. The Trustees also reviewed the research and decision‐making processes utilized by the Adviser, including the methods adopted to seek to achieve compliance with the investment objectives, policies, and restrictions of the Funds.
The Trustees considered the background and experience of the Adviser’s management in connection with the Funds, including reviewing the qualifications, backgrounds, and responsibilities of the management team primarily responsible for the day‐to‐day portfolio management of the Funds and the extent of the resources devoted to research and analysis of actual and potential investments.
The Trustees also reviewed, among other things, the Adviser’s insider trading policies and procedures and its Code of Ethics.
Performance: The Trustees reviewed performance information for each of the Funds for the 3‐month, 1‐year, 3‐year, 5‐year, and 10‐year, if applicable, periods ended September 30, 2016. That review included a comparison of each Fund’s performance to the performance of the group of comparable funds selected by the Data Provider. The Trustees noted that the performance of all of the share classes of each of the Funds for the 1‐year period ended September 30, 2016 was below their respective Data Provider peer group median. They further noted that performance of all of the share classes of each of the Emerald Banking and Finance Fund, the Emerald Growth Fund, and the Emerald Small Cap Value Fund for the 3‐year, 5‐year, and 10 year periods, if applicable, ended September 30, 2016 were above their respective Data Provider peer group median. They further noted that the performance of all of the share classes of each of the Emerald Growth Fund, Emerald Insights Fund, and Emerald Small Cap Value Fund was above their respective Data Provider peer group median for the 3‐month period ended September 30, 2016, and the performance of each of the share classes of the Emerald Banking and Finance Fund was below its Data Provider peer group median for the same period.
| Annual Report | April 30, 2017 | 65 |
| Emerald Funds | Disclosure Regarding Approval of Fund Advisory Agreements |
| | April 30, 2017 (Unaudited) |
The Trustees also considered the Adviser’s discussion of each Fund’s underlying portfolio diversification categories, its top contributors and top detractors, as well as the Adviser’s performance and reputation generally and its investment techniques, risk management controls, and decision‐making processes.
Comparable Accounts: The Trustees noted certain information provided by the Adviser regarding fees charged to its other clients utilizing a strategy similar to that employed by the Funds.
Profitability: The Trustees received and considered a retrospective and projected profitability analysis prepared by the Adviser based on the fees payable under the Investment Advisory Agreement with respect to each Fund. The Trustees considered the profits, if any, anticipated to be realized by the Adviser in connection with the operation of each Fund. The Board then reviewed the Adviser’s audited financial statements for the years ended September 30, 2015 and 2014 in order to analyze the financial condition and stability and profitability of the Adviser.
Economies of Scale: The Trustees considered whether economies of scale in the provision of services to the Funds are or will be passed along to the shareholders under the proposed agreements.
Other Benefits to the Adviser: The Trustees reviewed and considered any other incidental benefits derived or to be derived by the Adviser from its relationship with the Funds, including whether soft dollar arrangements were used.
In renewing the Adviser as the Funds’ investment adviser and renewing the Investment Advisory Agreement and the fees charged under the Investment Advisory Agreement, the Trustees concluded that no single factor reviewed by the Trustees was identified by the Trustees to be determinative as the principal factor in whether to renew the Investment Advisory Agreement. Further, the Independent Trustees were advised by separate independent legal counsel throughout the process. The Trustees, including all of the Independent Trustees, concluded that:
| • | the Emerald Banking and Finance Fund’s contractual advisory fee rate was above its Data Provider peer group median contractual advisory fee rate; |
| • | the Emerald Growth Fund’s, the Emerald Insights Fund’s, and the Emerald Small Cap Value Fund’s contractual advisory fee rates were below their respective Data Provider peer group median contractual advisory fee rates; |
| • | total expense ratios (after waivers) for the Emerald Banking and Finance Fund’s Class A and Institutional Class shares were above, but within an acceptable range of, the Data Provider peer group median total expense ratios (after waivers); and total expense ratios (after waivers) for all classes of the Emerald Growth Fund, Emerald Insights Fund, and Emerald Small Cap Value Fund were below their respective Data Provider median total expense ratios (after waivers); |
| • | the nature, extent, and quality of services rendered by the Adviser under the Investment Advisory Agreement with respect to the Funds were adequate; |
| • | performance of all of the share classes of each of the Funds for the 1‐year period ended September 30, 2016 was below their respective Data Provider peer group median; performance of all of the share classes of each of the Emerald Banking and Finance Fund, the Emerald Growth Fund, and the Emerald Small Cap Value Fund for the 3‐year, 5‐year, and 10 year periods, if applicable, ended September 30, 2016 were above their respective Data Provider peer group median; and performance of all of the share classes of each of the Emerald Growth Fund, Emerald Insights Fund, and Emerald Small Cap Value Fund were above their respective Data Provider peer group median for the 3‐month period ended September 30, 2016, and the performance of each of the classes of the Emerald Banking and Finance Fund was below its Data Provider peer group median for the same period; |
| • | bearing in mind the limitations of comparing different types of managed accounts and the different levels of service typically associated with such accounts, the fee structures applicable to the Adviser’s other clients employing a comparable strategy to one or more of the Funds were not indicative of any unreasonableness with respect to the advisory fees proposed to be payable by the Funds; |
| • | the profit, if any, realized by the Adviser in connection with the operation of the Funds is not unreasonable to the Funds; and |
| • | there were no material economies of scale or other incidental benefits accruing to the Adviser in connection with its relationship with the Funds. |
Based on the Trustees’ deliberations and their evaluation of the information described above, the Trustees, including all of the Independent Trustees, concluded that the Adviser’s compensation for investment advisory services is consistent with the best interests of the Funds and their shareholders.
| 66 | www.emeraldmutualfunds.com |
| Emerald Funds | Additional Information |
| | April 30, 2017 (Unaudited) |
1. FUND HOLDINGS
The Funds file their complete schedule of portfolio holdings with the Securities and Exchange Commission (the “SEC”) for the first and third quarters of each fiscal year on Form N‐Q within 60 days after the end of the period. Copies of the Funds’ Form N‐Q are available without charge on the SEC website at http://www.sec.gov. You may also review and copy the Form N‐Q at the SEC’s Public Reference Room in Washington, DC. For more information about the operation of the Public Reference Room, please call the SEC at 1‐800‐SEC‐0330.
2. FUND PROXY VOTING POLICIES, PROCEDURES AND SUMMARIES
Each Fund’s policies and procedures used in determining how to vote proxies and information regarding how the Funds voted proxies relating to portfolio securities during the most recent prior 12‐month period ending June 30 are available without charge, (1) upon request, by calling (toll‐free) (855) 828‐9909 and (2) on the SEC’s website at http://www.sec.gov.
3. TAX INFORMATION (UNAUDITED)
The Funds designate the following for federal income tax purposes for distributions made during the calendar year ended December 31, 2016:
| | QDI | DRD |
| Emerald Banking and Finance Fund | 0.00% | 0.00% |
| Emerald Growth Fund | 0.00% | 0.00% |
| Emerald Insights Fund | 0.00% | 0.00% |
| Emerald Small‐Cap Value Fund | 0.00% | 0.00% |
In early 2017, if applicable, shareholders of record received this information for the distribution paid to them by the Funds during the calendar year 2016 via Form 1099. The Funds will notify shareholders in early 2018 of amounts paid to them by the Funds, if any, during the calendar year 2017.
| Annual Report | April 30, 2017 | 67 |
| Emerald Funds | Trustees and Officers |
| | April 30, 2017 (Unaudited) |
Additional information regarding the Fund’s trustees is included in the Statement of Additional Information, which can be obtained without charge by calling 855‐828‐9909.
INDEPENDENT TRUSTEES
Name, Address* & Yearof Birth | Position(s) Held with Fund | Term of Office** and Length of Time Served | Principal Occupation(s) During Past 5 Years*** | Number of Funds in Fund Complex Overseen by Trustee**** | Other Directorships Held by Trustee During Past 5 Years*** |
Mary K. Anstine,
1940 | Trustee and Chairman | Ms. Anstine was elected at a special meeting of shareholders held on March 21, 1997 and re‐elected at a special meeting of shareholders held on August 7, 2009. Ms. Anstine was appointed Chairman of the Board at the June 6, 2017 meeting of the Board of Trustees. | Ms. Anstine was formerly an Executive Vice President of First Interstate Bank of Denver until 1994, President/Chief Executive Officer of HealthONE Alliance, Denver, Colorado, from 1994 to 2004, and has been retired since 2004. Ms. Anstine is also Trustee/Director of AV Hunter Trust and Colorado Uplift Board. Ms. Anstine was formerly a Director of the Trust Bank of Colorado (later purchased and now known as Northern Trust Bank), HealthONE and Denver Area Council of the Boy Scouts of America, and a member of the American Bankers Association Trust Executive Committee. | 34 | Ms. Anstine is a Trustee of ALPS ETF Trust (20 funds); ALPS Variable Investment Trust (9 funds); Reaves Utility Income Fund (1 fund); and Westcore Trust (14 funds). |
Jeremy W. Deems, 1976 | Trustee | Mr. Deems was appointed as a Trustee at the March 11, 2008 meeting of the Board of Trustees and elected at a special meeting of shareholders held on August 7, 2009. | Mr. Deems is the Co‐Founder, Chief Operations Officer and Chief Financial Officer of Green Alpha Advisors, LLC, a registered investment advisor, and Co‐Portfolio Manager of the Shelton Green Alpha Fund. Prior to joining Green Alpha Advisors, Mr. Deems was CFO and Treasurer of Forward Management, LLC, ReFlow Management Co., LLC, ReFlow Fund, LLC, a private investment fund, and Sutton Place Management, LLC, an administrative services company, from 1998 to June 2007. From 2004 to 2005, Mr. Deems also served as Treasurer of the Forward Funds and the Sierra Club Funds. | 34 | Mr. Deems is a Trustee of ALPS ETF Trust (20 funds); ALPS Variable Investment Trust (9 funds); Clough Funds Trust (1 fund); Elevation ETF Trust (2 funds); and Reaves Utility Income Fund (1 fund). |
| 68 | www.emeraldmutualfunds.com |
| Emerald Funds | Trustees and Officers |
| | April 30, 2017 (Unaudited) |
INDEPENDENT TRUSTEES
Name, Address* & Year of Birth | Position(s) Held with Fund | Term of Office** and Length of Time Served | Principal Occupation(s) During Past 5 Years*** | Number of Funds in Fund Complex Overseen by Trustee**** | Other Directorships Held by Trustee During Past 5 Years*** |
Jerry G. Rutledge, 1944 | Trustee | Mr. Rutledge was elected at a special meeting of shareholders held on August 7, 2009. | Mr. Rutledge is the President and owner of Rutledge’s Inc., a retail clothing business. Mr. Rutledge is currently Director of the American National Bank. He was from 1994 to 2007 a Regent of the University of Colorado. | 34 | Mr. Rutledge is a Trustee Of Principal Real Estate Income Fund (1 fund), Clough Global Dividend and Income Fund (1 fund), Clough Global Equity Fund (1 fund) and Clough Global Opportunities Fund (1 fund). |
Michael “Ross” Shell,
1970 | Trustee | Mr. Shell was elected at a special meeting of shareholders held on August 7, 2009. | Mr. Shell is Founder and CEO of Red Idea, LLC, a strategic consulting/early stage venture firm (since June 2008). From 1999 to 2009, he was a part‐ owner and Director of Tesser, Inc., a brand agency. From December 2005 to May 2008, he was Director, Marketing and Investor Relations, of Woodbourne, a REIT/real estate hedge fund and private equity firm. Prior to this, from May 2004 to November 2005, he worked as a business strategy consultant; from June 2003 to April 2004, he was on the Global Client Services team of IDEO, a product design/innovation firm; and from 1999 to 2003, he was President of Tesser, Inc. Mr. Shell graduated with honors from Stanford University with a degree in Political Science. | 34 | None. |
| Annual Report | April 30, 2017 | 69 |
| Emerald Funds | Trustees and Officers |
| | April 30, 2017 (Unaudited) |
INTERESTED TRUSTEE
Name, Address* & Year of Birth | Position(s) Held with Fund | Term of Office** and Length of Time Served | Principal Occupation(s) During Past 5 Years*** | Number of Funds in Fund Complex Overseen by Trustee**** | Other Directorships Held by Trustee During Past 5 Years*** |
Edmund J. Burke, 1961 | Trustee and President | Mr. Burke was elected as Trustee at a special meeting of shareholders held on August 7, 2009. Mr. Burke was elected President of the Trust at the December 17, 2002 meeting of the Board of Trustees. | Mr. Burke is President and a Director of ALPS Holdings, Inc. (“AHI”) (since 2005) and Director of Boston Financial Data Services, Inc. (“BFDS”), ALPS Advisors, Inc. (“AAI”), ALPS Distributors, Inc. (“ADI”), ALPS Fund Services, Inc. (“AFS”) and ALPS Portfolio Solutions Distributor, Inc. (“APSD”) and from 2001‐2008, was President of AAI, ADI, AFS and APSD. Because of his positions with AHI, BFDS, AAI, ADI, AFS and APSD, Mr. Burke is deemed an affiliate of the Trust as defined under the 1940 Act. | 34 | Mr. Burke is a Trustee of Clough Global Dividend and Income Fund (1 fund); Clough Global Equity Fund (1 fund); Clough Global Opportunities Fund (1 fund); Clough Funds Trust (1 fund); Liberty All‐Star Equity Fund (1 fund); and Director of the Liberty All‐Star Growth Fund, Inc. (1 fund). |
| 70 | www.emeraldmutualfunds.com |
| Emerald Funds | Trustees and Officers |
| | April 30, 2017 (Unaudited) |
OFFICERS
Name, Address* & Year of Birth | Position(s) Held with Fund | Term of Office** and Length of Time Served | Principal Occupation(s) During Past 5 Years*** |
Kimberly R. Storms, 1972 | Treasurer | Ms. Storms was elected Treasurer of the Trust at the March 12, 2013 meeting of the Board of Trustees. | Ms. Storms is Senior Vice President ‐ Director of Fund Administration of ALPS. Because of her position with ALPS, Ms. Storms is deemed an affiliate of the Trust as defined under the 1940 Act. Ms. Storms is also Treasurer of Liberty All‐Star Equity Fund, Liberty All‐Star Growth Fund, Inc., ALPS Series Trust and Elevation ETF Trust. Ms. Storms also serves as a Board member and Treasurer of The Center for Trauma & Resilience, a nonprofit agency. |
Karen S. Gilomen, 1970 | Secretary | Ms. Gilomen was elected Secretary of the Trust at the December 13, 2016 meeting of the Board of Trustees. | Ms. Gilomen joined ALPS in August 2016 as Vice President and Senior Counsel. Prior to joining ALPS, Ms. Gilomen was Vice President ‐ General Counsel & CCO of Monticello Associates, Inc. from 2010 to 2016. Because of her position with ALPS, Ms. Gilomen is deemed an affiliate of the Trust, as defined under the 1940 Act. Ms. Gilomen is also the Secretary of Oak Associates Funds and Reaves Utility Income Fund, and the Assistant Secretary of the WesMark Funds. |
Ted Uhl, 1974 | Chief Compliance Officer (“CCO”) | Mr. Uhl was appointed CCO of the Trust at the June 8, 2010 meeting of the Board of Trustees. | Mr. Uhl joined ALPS in October 2006, and is currently Deputy Compliance Officer of ALPS. Prior to his current role, Mr. Uhl served as Senior Risk Manager for ALPS from October 2006 until June 2010. Before joining ALPS, Mr. Uhl served a Sr. Analyst with Enenbach and Associates (RIA), and a Sr. Financial Analyst at Sprint. Because of his position with ALPS, Mr. Uhl is deemed an affiliate of the Trust as defined under the 1940 Act. Mr. Uhl is also CCO of the Boulder Growth & Income Fund, Inc., Centre Funds, Elevation ETF Trust, Index Funds, Reality Shares ETF Trust and Reaves Utility Income Fund. |
Jennell Panella, 1974 | Assistant Treasurer | Ms. Panella was elected Assistant Treasurer of the Trust at the September 15, 2015 meeting of the Board of Trustees. | Ms. Panella joined ALPS in June 2012 and is currently Fund Controller of ALPS Fund Services, Inc. Prior to joining ALPS, Ms. Panella served as Financial Reporting Manager for Parker Global Strategies, LLC (2009‐2012). Because of her position with ALPS, Ms. Panella is deemed an affiliate of the Trust as defined under the 1940 Act. Ms. Panella also serves as Assistant Treasurer of James Advantage Funds. |
Alan Gattis, 1980 | Assistant Treasurer | Mr. Gattis was elected Assistant Treasurer of the Trust at the September 13, 2016 meeting of the Board of Trustees. | Mr. Gattis joined ALPS in 2011 and is currently Vice President and Fund Controller of ALPS. Prior to joining ALPS, Mr. Gattis was an Auditor at Spicer Jeffries LLP (2009 through 2011) and an Auditor at PricewaterhouseCoopers LLP (2004 ‐ 2009). Because of his position with ALPS, Mr. Gattis is deemed an affiliate of the Trust as defined under the 1940 Act. Mr. Gattis is also Assistant Treasurer of ALPS Series Trust, Clough Funds Trust, Clough Global Opportunities Fund, Clough Global Dividend and Income Fund, Clough Global Equity and Griffin Institutional Access Real Estate Fund. |
| Annual Report | April 30, 2017 | 71 |
| Emerald Funds | Trustees and Officers |
| | April 30, 2017 (Unaudited) |
OFFICERS
Name, Address* & Year of Birth | Position(s) Held with Fund | Term of Office** and Length of Time Served | Principal Occupation(s) During Past 5 Years*** |
|
Sharon Akselrod, 1974 | Assistant Secretary | Ms. Akselrod was elected Assistant Secretary of the Trust at the September 15, 2015 meeting of the Board of Trustees. | Ms. Akselrod joined ALPS in August 2014 and is currently Senior Investment Company Act Paralegal of ALPS Fund Services, Inc. Prior to joining ALPS, Ms. Akselrod served as Corporate Governance and Regulatory Associate for Nordstrom fsb (2013‐2014) and Senior Legal Assistant – Legal Manager for AXA Equitable Life Insurance Company (2008‐2013). Because of her position with ALPS, Ms. Akselrod is deemed an affiliate of the Trust as defined under the 1940 Act. Ms. Akselrod is also Assistant Secretary of ALPS ETF Trust. |
|
|
|
|
|
|
|
|
Jennifer Craig 1973 | Assistant Secretary | Ms. Craig was elected Assistant Secretary of the Trust at the June 8, 2016 meeting of the Board of Trustees. | Ms. Craig joined ALPS in 2007 and is currently Assistant Vice President and Paralegal Manager of ALPS. Prior to joining ALPS, Ms. Craig was Legal Manager at Janus Capital Management LLC and served as Assistant Secretary of Janus Investment Fund, Janus Adviser Series and Janus Aspen Series. Because of her position with ALPS, Ms. Craig is deemed an affiliate of the Trust as defined under the 1940 Act. Ms. Craig is also Assistant Secretary of Clough Global Dividend and Income Fund, Clough Global Equity Fund, Clough Global Opportunities Fund, Clough Funds Trust and ALPS Series Trust. |
|
|
|
|
|
|
|
|
|
|
| * | All communications to Trustees and Officers may be directed to Financial Investors Trust c/o 1290 Broadway, Suite 1100, Denver, CO 80203. |
| ** | This is the period for which the Trustee or Officer began serving the Trust. Each Trustee serves an indefinite term, until his successor is elected. Officers are elected on an annual basis. |
| *** | The Fund Complex includes all series of the Trust (currently 34) and any other investment companies for which any Trustee serves as trustee for and which Emerald Mutual Fund Advisers Trust provides investment advisory services (currently none). |
| 72 | www.emeraldmutualfunds.com |
| Emerald Funds | Privacy Policy |
| FACTS | WHAT DO THE FUNDS DO WITH YOUR PERSONAL INFORMATION? |
| WHY? | Financial companies choose how they share your personal information. Federal law gives consumers the right to limit some but not all sharing. Federal law also requires us to tell you how we collect, share, and protect your personal information. Please read this notice carefully to understand what we do. |
| WHAT? | The types of personal information we collect and share depend on the product or service you have with us. This information can include: |
| | • Social Security number and account transactions |
| | • Account balances and transaction history |
| | • Wire transfer instructions |
| HOW? | All financial companies need to share customers’ personal information to run their everyday business. In the section below, we list the reasons financial companies can share their customers’ personal information; the reasons the Funds choose to share; and whether you can limit this sharing. |
| Reasons we can share your personal information | Do the funds share: | Can you limit this sharing? |
For our everyday business purposes – such as to process your transactions, maintain your account(s), respond to court orders and legal investigations, or report to credit bureaus | Yes | No |
For our marketing purposes – to offer our products and services to you | No | We do not share. |
| For joint marketing with other financial companies | No | We do not share. |
For our affiliates’ everyday business purposes – information about your transactions and experiences | Yes | No |
For our affiliates’ everyday business purposes – information about your creditworthiness | No | We do not share. |
| For non-affiliates to market to you | No | We do not share. |
| Annual Report | April 30, 2017 | 73 |
| Emerald Funds | Privacy Policy |
| Who We Are | |
| Who is providing this notice? | Emerald Banking and Finance Fund, Emerald Growth Fund, Emerald Insights Fund and Emerald Small Cap Value Fund |
| What We Do | |
| How do the Funds protect my personal information? | To protect your personal information from unauthorized access and use, we use security measures that comply with federal law. These measures include computer safeguards and secured files and buildings. |
| How do the Funds collect my personal information? | We collect your personal information, for example, when you |
| | • open an account |
| | • provide account information or give us your contact information |
| | • make a wire transfer or deposit money |
| Why can’t I limit all sharing? | Federal law gives you the right to limit only |
| | • sharing for affiliates’ everyday business purposes-information about your creditworthiness |
| | • affiliates from using your information to market to you |
| | • sharing for non-affiliates to market to you |
| | State laws and individual companies may give you additional rights to limit sharing. |
| Definitions | |
| Affiliates | Companies related by common ownership or control. They can be financial and nonfinancial companies. |
| Non-affiliates | Companies not related by common ownership or control. They can be financial and nonfinancial companies. |
| | • The Funds do not share with non-affiliates so they can market to you. |
| Joint marketing | A formal agreement between non-affiliated financial companies that together market financial products or services to you. |
| | • The Funds do not jointly market. |
| Other Important Information | |
| California residents | If your account has a California home address, your personal information will not be disclosed to nonaffiliated third parties except as permitted by applicable California law, and we will limit sharing such personal information with our affiliates to comply with California privacy laws that apply to us. |
| Vermont residents | The State of Vermont requires financial institutions to obtain your consent prior to sharing personal information that they collect about you with affiliated companies and nonaffiliated third parties other than in certain limited circumstances. Except as permitted by law, we will not share personal information we collect about you with nonaffiliated third parties or other affiliated companies unless you provide us with your written consent to share such information. |
| 74 | www.emeraldmutualfunds.com |
Intentionally Left Blank

TABLE OF CONTENTS
| Shareholder Letter | 1 |
| Performance Update | 5 |
| Disclosure of Fund Expenses | 26 |
| Portfolio of Investments | |
| Grandeur Peak Emerging Markets Opportunities Fund | 28 |
| Grandeur Peak Global Micro Cap Fund | 32 |
| Grandeur Peak Global Opportunities Fund | 36 |
| Grandeur Peak Global Reach Fund | 41 |
| Grandeur Peak Global Stalwarts Fund | 47 |
| Grandeur Peak International Opportunities Fund | 50 |
| Grandeur Peak International Stalwarts Fund | 54 |
| Statements of Assets and Liabilities | 57 |
| Statements of Operations | 59 |
| Statements of Changes in Net Assets | |
| Grandeur Peak Emerging Markets Opportunities Fund | 61 |
| Grandeur Peak Global Micro Cap Fund | 62 |
| Grandeur Peak Global Opportunities Fund | 63 |
| Grandeur Peak Global Reach Fund | 64 |
| Grandeur Peak Global Stalwarts Fund | 65 |
| Grandeur Peak International Opportunities Fund | 66 |
| Grandeur Peak International Stalwarts Fund | 67 |
| Financial Highlights | |
| Grandeur Peak Emerging Markets Opportunities Fund | 68 |
| Grandeur Peak Global Micro Cap Fund | 70 |
| Grandeur Peak Global Opportunities Fund | 71 |
| Grandeur Peak Global Reach Fund | 73 |
| Grandeur Peak Global Stalwarts Fund | 75 |
| Grandeur Peak International Opportunities Fund | 77 |
| Grandeur Peak International Stalwarts Fund | 79 |
| Notes to Financial Statements | 81 |
| Report of Independent Registered Public Accounting Firm | 94 |
| Disclosure Regarding Approval of Fund Advisory Agreement | 95 |
| Additional Information | 98 |
| Trustees and Officers | 99 |
| Privacy Policy | 104 |
Grandeur Peak Funds® | Shareholder Letter |
April 30, 2017 (Unaudited)
Dear Fellow Shareholders,
If you’ve been reading our quarterly letters you’re likely aware that we’ve been in an uncomfortable market the last few years. We look for high Quality companies, with great business Momentum, trading at attractive Valuations. When we launched the firm in 2011, global equity markets were still recovering from the huge sell‐off in the Global Financial Crisis, and the global economy was starting to pick up. We were like kids in a candy store, picking up high Quality companies, with decent and improving Momentum, at very attractive Valuations.
Fast forward to 2014 when there was a slowdown in company fundamentals (Momentum) and a significant expansion of Valuations, especially for high Quality companies. As we’ve mentioned in previous letters, it became tougher for us to keep balance in the portfolios across our QVM (Quality/Value/Momentum) matrix, and with the benefit of hindsight we probably focused too much on value at the expense of business momentum over the short term.
We spent 2015 getting the portfolios back into balance and went into 2016 feeling better about our portfolios. It seemed to have paid off, as we feel very good about this past year’s performance. Our funds finished the fiscal year with very nice absolute returns. In comparison to their benchmark indices, four of our funds outperformed (Global Stalwarts, International Stalwarts, International Opportunities, & Emerging Markets), one essentially tied (Global Reach), and two slightly underperformed (Global Micro & Global Opportunities), but we feel better about the year than this record suggests because we faced some tough macro headwinds (e.g. currency, commodity prices, and sector moves in sectors where we are typically underweight), while feeling like we performed well for the right reasons‐‐good stock picking. We know that macro cycles will be a headwind at times, and at other times they will be a tailwind, so we stick to our process and keep investing bottom‐up using our QVM matrix to help determine position sizes.
Fund Performance & Attribution
See full performance included in the Performance Update section. For more in‐depth analysis of each Fund, please see the latest quarterly letter and/or individual Fund pages on our website at www.grandeurpeakglobal.com.
Emerging Markets Opportunities: For the year, the Institutional share class returned 18.42% vs 14.77% for the benchmark. Sectors of particular strength in the Fund were Healthcare, Technology, Financials, and Consumer, while portfolio detractors were Real Estate, Utilities, and Energy. The Fund did quite well in Asia, but underperformed in the rebounding South America. A significant detractor from performance was the Fund’s higher‐than‐normal cash position. In some holdings with strong performance we’ve trimmed back, but we have not always had an immediate replacement name at a compelling valuation, so we have been slow to re‐deploy the cash. Our team is committed to finding good opportunities to put this cash to work.
Global Micro Cap: For the year, the Fund returned 16.81% vs 18.32% for the benchmark. Sectors of particular strength in the Fund were Financials, Healthcare, and Technology, while portfolio detractors included Industrials, Materials, and Consumer. Consumer was a surprising weakness, as we saw growing concern over the future of brick & mortar retailers hit a variety of consumer companies. The real driver of the Fund’s underperformance was our very significant underweight in the U.S., while the domestic bull market continued. We simply aren’t finding that many U.S. micro‐cap companies at interesting long‐term valuations.
Global Opportunities: For the year, the Institutional share class returned 17.81% vs 18.32% for the benchmark. The big contributing sectors were Technology and Financials, with negative contribution from Materials, Consumer, and Real Estate. The real driver of the Fund’s underperformance was our significant underweight in the U.S., as the domestic bull market continued. We simply aren’t finding that many U.S. companies at compelling long‐term valuations.
Global Reach: For the year, the Institutional share class returned 18.36% vs 18.32% for the benchmark. Sectors of particular strength in the Fund were Technology, Healthcare, and Financials, while portfolio detractors were Materials, Consumer, and Real Estate. As in our other global funds, the big detractor for the year was our significant underweight in the strong U.S. market. The Reach Fund saw this counterbalanced by particular stock picking success in Western Europe and the Africa/Middle East regions.
Global Stalwarts: For the year, the Institutional share class returned 18.01% vs 15.72% for the benchmark. The big contributing sectors were Technology, Consumer, Industrials, and Financials, with negative contribution from Materials, Real Estate, and Utilities. The most significant regional success was in Asia, which more than compensated for the headwind of being underweight in the strong U.S. market.
International Opportunities: For the year, the Institutional share class returned 17.59% vs 13.36% for the benchmark. The Technology, Financials, and Health Care sectors were big contributors for the year, while negative contributions came from the Materials and Consumer sectors. We had strong performance in Asia, but lagged slightly in the South America rebound.
| Annual Report | April 30, 2017 | 1 |
Grandeur Peak Funds® | Shareholder Letter |
April 30, 2017 (Unaudited)
International Stalwarts: For the year, the Institutional share class returned 18.96% vs 13.15% for the benchmark. The big contributing sectors were Consumer, Technology, and Industrials, and Financials. The Materials sector was the most significant negative contributor for the year, as we were very underweight the sector. The Fund saw positive contribution from all seven geographic regions, with the greatest contribution coming from Asia.
Notes from the Road
The following are Tyler Glauser’s notes from his Q1 trip to South Africa. Tyler is a research analyst on the Consumer team who has been working with us for the past three and half years while studying Accounting at the University of Utah. He has just graduated and will be joining our analyst team full time:
South Africa, especially Cape Town, is a beautiful place. The Dutch arrived in 1622 and began to develop Cape Town. It was all a part of developing a faster shipping route to get goods (especially silk and spices) to Western Europe from Asia and the Middle East. They tried to get local villagers to cooperate with them in building up port cities, but as can be easily imagined, the locals weren’t too happy about them being there in the first place so they would not help. Upon seeing this, the Dutch began to bring in slave laborers from other places. Soon, South Africa was full of Dutch speakers, native language speakers, as well as slaves speaking languages from 5 other places, including India. Afrikaans emerged as a Dutch‐based language that was a mixture of all of the above. It is a uniquely expressive language as it came out of the best ways to phrase things in each of the different languages around at the time. In 1802, the British arrived and basically took Cape Town and South Africa from the Dutch. Today, there are 11 official state languages in South Africa, as well as another seven that are commonly spoken. The most prominent of these are English and Afrikaans. Cape Town has a heritage in wine and fruit production and today is largely driven by tourism from various parts of Europe and Asia. The city is set on all sides of the enormous Table Mountain. Durban, in contrast, is home to beautiful rolling hills, full of green sugar cane, giving it the appearance of something you might see in southern Italy. The city is spread out quite a bit as the old city center was on the opposite side of the city from where the new airport was built for the World Cup a few years ago. Development has focused near the airport since then, creating decentralized urban sprawl. Johannesburg has more of a history in gold and mining that prevails in today’s economy. It certainly has a different feel than the other two major South African cities, with worse traffic and more intense population centers, where litter, abandoned buildings, pollution and, automatic weapons are typical elements of the scenery.
The unfortunate reality for the whole country is that political uncertainty and structural unemployment have given rise to a wide array of crime. Overall, Cape Town is probably a safer place than Johannesburg, but has gang issues. Certain communities experience an average of 250 murders annually per 100k people. Think about it! It’s like two of your Facebook friends being murdered every year. What a sobering, scary reality. It’s truly a peculiar thing to juxtapose this reality against some of the nicer communities. We went running one morning in Cape Town with Gary Davidson, the CEO of KayDav Group. He took us to his neighborhood and we ran on a beautiful boardwalk with Lion’s Head Mountain to the East and the Atlantic Ocean to the West. It was beautiful. The sun just started coming up over the city as we were finishing the run and it was stunning. As we ran I was baffled by the number of fit‐looking people we encountered who politely greeted us and Gary in a friendly way. He knew all of them, neighbors in the Jewish community in their own little pocket of Cape Town. Gary referenced a sort of exodus of his community as many people have been leaving Cape Town and moving to Australia and other places where it is safer—a sad strain to see on what is a really incredible place.
Durban is relatively safe compared to the other cities, but Johannesburg is the worst by far. The bulk of the violent crimes (muggings, home invasions, etc.) take place in Johannesburg. In all three cities, the remnants of apartheid are apparent as all the executives we met with were white, and all the drivers, assistants, janitors, etc. were black. Although the inequality is apparent and there is still a lot of public discontent, the black middle class has experienced real progress in the last few years. Locals talk about LSM, Life Style Measure, on a scale of 1‐10, with 10 being the uber‐wealthy and 1 the impoverished. Five years ago, the bulk of the black population was in LSMs 1 ‐ 4, but today that has shifted upwards, with the majority today living closer to LSM levels 3 ‐ 5. Hopefully this trend will continue. The point is that as the middle class continues to rise, there will be more social equality, more consumers spending more money, and unemployment will decrease as the 26% of people without jobs become more educated and develop more employable skills. In a stable political environment, I think this will likely provide a big tailwind to the economy.
The consumer credit outlook in South Africa is grim. There are 35 million adults in South Africa, and 24 million of them are credit active. There are 10.7 million consumers with at least one retail apparel credit account, 8.3 million with unsecured loan accounts, and 5.2 million people with at least one credit card. Of these, 10 million consumers are more than 3 months late on payments in at least one account. The percentage of non‐compliant loans for houses and cars in South Africa is around 5%, but goes up to over 40% for apparel retailers. The regulatory limit for short term interest rates is 35%. Truworths, for example (apparel retailer who makes 70% of sales on credit) said its average interest rate is 25%. In reviewing the apparel retailers, it becomes clear that retailers are likely the last place a customer will pay when under financial stress. I really liked the Transaction Capital meeting we had, largely for this reason. They provide services and support to the taxi drivers in order to ensure they are utilizing the purchased asset well and making money in order to pay it off. The apparel guys basically just don’t let consumers shop anymore until they pay their current debts. So, the country is in a highly levered scenario causing regulators to step in. Last September, regulators issued new requirements for offering credit which have hurt a lot of the credit‐dependent businesses. I do expect that these changes will be good in the long run.
| 2 | 1.855.377.7325 | www.GrandeurPeakGlobal.com |
Grandeur Peak Funds® | Shareholder Letter |
April 30, 2017 (Unaudited)
Nearly every company we spoke with during our trip referenced some sort of pan‐African growth story. There are massive underdeveloped markets with high population growths waiting to be tapped for their potential. The middle class is just starting to emerge in many of these places and in the next ten years, we will likely see massive growth pick up. The problem has been and will likely continue to be issues with monetary and fiscal policy and commodity‐dependent economies that experience massive cyclicality. Recent years with low oil prices have been bad for many of the countries, especially in Eastern Africa. Western and Central Africa have had more issues with war and conflict that have created uncertain business conditions as well. Yet many companies we met with have been able to establish some growth. Shoprite, for example, has a small base of stores in several other African countries. The brand has gained some great traction and in Nigeria, the word “Shoprite” is used to describe an entire shopping center, that may include a Shoprite and a bunch of other stores. It feels to me like things in South Africa are very difficult still, but there is a lot of low hanging fruit starting to show itself, which could make things take off in a big way once a turn comes. The companies here are positioned ideally to take advantage of development across the entire African continent. President Zuma has had a presidency marked by corruption scandals and lack of effective economic stimulation. The next African National Congress (ANC) elections are this year, and the national elections are in 2019, and many of the managers mentioned that they thought if a new, competent president were elected and things go smoothly in the transition, the economy would really take off. From a 15‐20 year perspective, I expect the South African economy to emerge with massive growth and the businesses there to flood the rest of the African Continent.
Latest Business Update
In November we announced that we were launching a joint venture with Laura Geritz, a very talented fund manager with whom a lot of our team members had previously worked. Laura and her analysts are sharing our offices in Salt Lake City. The new firm, Rondure Global Advisors, launched operations on May 1, 2017:
We are extremely happy about the research synergies with Laura and her team. Our joint research effort has been working very well; we have been traveling together, sharing ideas, and utilizing each other’s expertise.
We believe we are a stronger team with Laura and Rondure on board. As always, feel free to reach out with any questions or concerns. We appreciate our relationship with you and continue to work hard on your behalf.
Sincerely,
Robert Gardiner, CFA
Chairman & Portfolio Manager
Blake Walker
CEO & Portfolio Manager
Randy Pearce, CFA, MBA
CIO & Portfolio Manager
An investor should consider investment objectives, risks, charges, and expenses carefully before investing. To obtain a Grandeur Peak Funds prospectus, containing this and other information, visit www.grandeurpeakglobal.com or call 1-855-377-PEAK (7325). Please read it carefully before investing.
Performance data quoted represents past performance. Past performance does not guarantee future results. Investment return and principal value of an investment will fluctuate so that an investor’s shares, when sold or redeemed, may be worth more or less than the original cost. The Fund imposes a 2.00% redemption fee on shares held for less than 60 days. Current performance data may be higher or lower than actual data quoted. For the most current month-end performance data, please call 1-855-377-PEAK (7325).
The views of Grandeur Peak Global Advisors, LLC. and information discussed in this commentary are as of the date of publication, are subject to change, and may not reflect the writers’ current views. The views expressed are those of the Fund’s adviser only, and represent an assessment of market conditions at a specific point in time, are opinions only and should not be relied upon as investment advice regarding a particular investment or markets in general. Such information does not constitute a recommendation to buy or sell specific securities or investment vehicles. It should not be assumed that any investment will be profitable or will equal the performance of the portfolios or any securities or any sectors mentioned in this letter. The subject matter contained in this letter has been derived from several sources believed to be reliable and accurate at the time of compilation. Neither Grandeur Peak Global Advisors, LLC nor the Funds accept any liability for losses either direct or consequential caused by the use of this information.
The Funds are distributed by ALPS Distributors, Inc.
| Annual Report | April 30, 2017 | 3 |
Grandeur Peak Funds® | Shareholder Letter |
April 30, 2017 (Unaudited)
The Funds are subject to investment risks, including possible loss of the principal amount invested and therefore is not suitable for all investors. The Fund may not achieve its objectives.
Diversification does not eliminate the risk of experiencing investment losses.
CFA is a trademark owned by the CFA Institute.
| 4 | 1.855.377.7325 | www.GrandeurPeakGlobal.com |
| Grandeur Peak Emerging Markets Opportunities Fund | Performance Update |
April 30, 2017 (Unaudited)
Cumulative Total Return Performance for the periods ended April 30, 2017
| | | | | | Expense Ratio(b) |
| | 6 Months | 1 Year | 3 Year | Since Inception(a) | Gross | Net(c) |
Grandeur Peak Emerging Markets Opportunities Fund – Investor (GPEOX) | 7.17% | 18.08% | 5.35% | 6.37% | 1.81% | 1.81% |
Grandeur Peak Emerging Markets Opportunities Fund – Institutional (GPEIX) | 7.31% | 18.42% | 5.58% | 6.60% | 1.56% | 1.56% |
Russell Emerging Markets Small Cap Index(d) | 8.75% | 14.77% | 1.58% | 2.88% | | |
Performance data quoted represents past performance. Past performance does not guarantee future results. Investment return and principal value of an investment will fluctuate so that an investor’s shares, when sold or redeemed, may be worth more or less than the original cost. The Fund imposes a 2.00% redemption fee on shares held for less than 60 days. Current performance data may be higher or lower than actual data quoted. For the most current month-end performance data, please call 1-855-377-PEAK (7325).
The table does not reflect the deduction of taxes a shareholder would pay on Fund distributions or redemption of Fund shares.
Subject to investment risks, including possible loss of the principal amount invested.
Returns for periods greater than 1 year are annualized.
(a) | Fund inception date of December 16, 2013. |
(b) | Ratios as of the Prospectus dated August 31, 2016 and may differ from the ratios presented in the Financial Highlights. |
(c) | Grandeur Peak Global Advisors, LLC (the “Adviser”) has agreed to waive and/or reimburse fees or expenses in order to limit Total Annual Fund Operating Expenses After Fee Waiver/Expense Reimbursement (excluding acquired fund fees and expenses, brokerage expenses, interest expenses, taxes and extraordinary expenses) to 1.95% and 1.70% of the Fund’s average daily net assets for the Fund’s Investor Class Shares and Institutional Class Shares, respectively. This agreement (the “Expense Agreement”) is in effect through August 31, 2017. The Adviser will be permitted to recover, on a class- by-class basis, expenses it has borne through the Expense Agreement to the extent that a Fund’s expenses in later periods fall below the expense cap in effect at the time of waiver or reimbursement. Notwithstanding the foregoing, the Fund will not be obligated to pay any such deferred fees and expenses more than three years after the end of the fiscal year in which the fee and expenses was deferred. The Expense Agreement may not be terminated or modified prior to August 31, 2017 except with the approval of the Fund’s Board of Trustees. |
(d) | The Russell Emerging Markets Small Cap Index seeks to measure the performance of the small-cap equity universe of emerging countries. The Index is not actively managed and does not reflect any deductions for fees, expense, or taxes. An investor may not invest directly in the Index. |
| Annual Report | April 30, 2017 | 5 |
| Grandeur Peak Emerging Markets Opportunities Fund | Performance Update |
April 30, 2017 (Unaudited)
Growth of $10,000 for the period ended April 30, 2017
The chart shown above represent a hypothetical investment of $10,000 in the Fund’s Investor Class shares for the period from inception to April 30, 2017. All returns reflect reinvested dividends, but do not reflect the deduction of taxes that an investor would pay on distributions or redemptions.
Investing in the Fund is subject to investment risks, including possible loss of the principal amount invested.
The Fund also offers Institutional Class shares, performance for which is not reflected in the graphs above. The performance of Institutional Class shares may be higher or lower than the performance of the Investor Class shares shown in the graphs above based upon differences in fees paid by shareholders investing in the Investor Class shares and Institutional Class shares.
| 6 | 1.855.377.7325 | www.GrandeurPeakGlobal.com |
| Grandeur Peak Emerging Markets Opportunities Fund | Performance Update |
April 30, 2017 (Unaudited)
| Regional Allocation (as a % of Net Assets)* | |
| Asia ex Japan | 69.7% |
| Africa/Middle East | 9.8% |
| Europe | 6.2% |
| Latin America | 5.8% |
| North America | 3.0% |
| Cash, Cash Equivalents, & Other Net Assets | 5.5% |
| Total | 100.0% |
| Industry Sector Allocation (as a % of Net Assets)* | |
| Financials | 23.4% |
| Consumer | 21.1% |
| Technology | 17.8% |
| Industrials | 16.2% |
| Health Care | 10.2% |
| Energy & Materials | 5.8% |
| Cash, Cash Equivalents, & Other Net Assets | 5.5% |
| Total | 100.0% |
| Top 10 Holdings (as a % of Net Assets)* | |
| Man Wah Holdings, Ltd. | 2.6% |
| China Medical System Holdings, Ltd. | 2.3% |
| BGEO Group PLC | 2.2% |
| Yes Bank, Ltd. | 1.8% |
| Value Partners Group, Ltd. | 1.7% |
| Security Bank Corp. | 1.6% |
| Time Technoplast, Ltd. | 1.6% |
| Silergy Corp. | 1.5% |
| Sporton International, Inc. | 1.5% |
| Alkem Laboratories, Ltd. | 1.3% |
| Total | 18.1% |
| * | Holdings are subject to change, and may not reflect the current or future position of the portfolio. |
| Annual Report | April 30, 2017 | 7 |
| Grandeur Peak Global Micro Cap Fund | Performance Update |
April 30, 2017 (Unaudited)
Cumulative Total Return Performance for the periods ended April 30, 2017
| | | | | Expense Ratio(b) |
| | 6 Months | 1 Year | Since Inception(a) | Gross | Net(c) |
| Grandeur Peak Global MicroCap – Institutional (GPMCX) | 9.63% | 16.81% | 13.43% | 2.30% | 2.00% |
Russell Global Small Cap Index(d) | 13.33% | 18.32% | 12.29% | | |
Performance data quoted represents past performance. Past performance does not guarantee future results. Investment return and principal value of an investment will fluctuate so that an investor’s shares, when sold or redeemed, may be worth more or less than the original cost. The Fund imposes a 2.00% redemption fee on shares held for less than 60 days. Current performance data may be higher or lower than actual data quoted. For the most current month-end performance data, please call 1-855-377-PEAK (7325).
The table does not reflect the deduction of taxes a shareholder would pay on Fund distributions or redemption of Fund shares.
Subject to investment risks, including possible loss of the principal amount invested.
Returns for periods greater than 1 year are annualized.
(a) | Fund inception date of October 20, 2015. |
(b) | Ratios as of the Prospectus dated August 31, 2016 and may differ from the ratios presented in the Financial Highlights. |
(c) | Grandeur Peak Global Advisors, LLC (the “Adviser”) has agreed to waive and/or reimburse fees or expenses in order to limit Total Annual Fund Operating Expenses After Fee Waiver/Expense Reimbursement (excluding acquired fund fees and expenses, brokerage expenses, interest expenses, taxes and extraordinary expenses) to 2.00% of the Fund’s average daily net assets for the Fund’s Institutional Class Shares. This agreement is in effect through August 31, 2017. The Adviser will be permitted to recover, on a class-by-class basis, expenses it has borne through this agreement to the extent that a Fund’s expenses in later periods fall below the annual rates set forth in this agreement or in previous agreements. Notwithstanding the foregoing, the Fund will not be obligated to pay any such deferred fees and expenses more than three years after the end of the fiscal year in which the fee and expenses was deferred. This agreement may not be terminated or modified prior to August 31, 2017 except with the approval of the Fund’s Board of Trustees. |
(d) | The Russell Global Small Cap Index seeks to measure the performance of the small-cap segment of the global equity universe. The Index is not actively managed and does not reflect any deductions for fees, expenses, or taxes. An investor may not invest directly in the Index. |
| 8 | 1.855.377.7325 | www.GrandeurPeakGlobal.com |
| Grandeur Peak Global Micro Cap Fund | Performance Update |
April 30, 2017 (Unaudited)
Growth of $10,000 for the period ended April 30, 2017
The chart shown above represent a hypothetical investment of $10,000 in the Fund’s Institutional Class shares for the period from inception to April 30, 2017. All returns reflect reinvested dividends, but do not reflect the deduction of taxes that an investor would pay on distributions or redemptions.
Investing in the Fund is subject to investment risks, including possible loss of the principal amount invested.
| Annual Report | April 30, 2017 | 9 |
| Grandeur Peak Global Micro Cap Fund | Performance Update |
April 30, 2017 (Unaudited)
| Regional Allocation (as a % of Net Assets)* | |
| Asia ex Japan | 34.3% |
| Europe | 26.5% |
| North America | 14.5% |
| Japan | 11.1% |
| Australia/New Zealand | 7.2% |
| Latin America | 2.2% |
| Africa/Middle East | 1.8% |
| Cash, Cash Equivalents, & Other Net Assets | 2.4% |
| Total | 100.0% |
| Industry Sector Allocation (as a % of Net Assets)* | |
| Financials | 25.9% |
| Consumer | 22.0% |
| Technology | 16.2% |
| Industrials | 16.2% |
| Health Care | 12.5% |
| Energy & Materials | 4.8% |
| Cash, Cash Equivalents, & Other Net Assets | 2.4% |
| Total | 100.0% |
| Top 10 Holdings (as a % of Net Assets)* | |
| Syuppin Co., Ltd. | 1.8% |
| The Byke Hospitality, Ltd. | 1.8% |
| M&A Capital Partners Co., Ltd. | 1.7% |
| Ananda Development PCL | 1.6% |
| Skandiabanken ASA | 1.5% |
| Time Technoplast, Ltd. | 1.3% |
| Hingham Institution for Savings | 1.3% |
| Hard Off Corp. Co., Ltd. | 1.2% |
| Kovai Medical Center and Hospital | 1.1% |
| Prestige International, Inc. | 1.1% |
| Total | 14.4% |
| * | Holdings are subject to change, and may not reflect the current or future position of the portfolio. |
| 10 | 1.855.377.7325 | www.GrandeurPeakGlobal.com |
| Grandeur Peak Global Opportunities Fund | Performance Update |
April 30, 2017 (Unaudited)
Cumulative Total Return Performance for the periods ended April 30, 2017
| | | | | | | Expense Ratio(b) |
| | 6 Months | 1 Year | 3 Years | 5 Years | Since Inception(a) | Gross | Net(c) |
| Grandeur Peak Global Opportunities Fund – Investor (GPGOX) | 11.88% | 17.09% | 7.30% | 13.44% | 15.02% | 1.63% | 1.63% |
| Grandeur Peak Global Opportunities Fund – Institutional (GPGIX) | 12.25% | 17.81% | 7.52% | 13.74% | 15.38% | 1.38% | 1.38% |
Russell Global Small Cap Index(d) | 13.33% | 18.32% | 5.82% | 9.49% | 10.78% | | |
Russell Global Index(e) | 12.40% | 16.06% | 5.99% | 9.81% | 11.08% | | |
Performance data quoted represents past performance. Past performance does not guarantee future results. Investment return and principal value of an investment will fluctuate so that an investor’s shares, when sold or redeemed, may be worth more or less than the original cost. The Fund imposes a 2.00% redemption fee on shares held for less than 60 days. Current performance data may be higher or lower than actual data quoted. For the most current month-end performance data, please call 1-855-377-PEAK (7325).
The table does not reflect the deduction of taxes a shareholder would pay on Fund distributions or redemption of Fund shares.
Subject to investment risks, including possible loss of the principal amount invested.
Returns for periods greater than 1 year are annualized.
(a) | Fund inception date of October 17, 2011. |
(b) | Ratios as of the Prospectus dated August 31, 2016 and may differ from the ratios presented in the Financial Highlights. |
(c) | Grandeur Peak Global Advisors, LLC (the “Adviser”) has agreed to waive and/or reimburse fees or expenses in order to limit Total Annual Fund Operating Expenses After Fee Waiver/Expense Reimbursement (excluding acquired fund fees and expenses, brokerage expenses, interest expenses, taxes and extraordinary expenses) to 1.75% and 1.50% of the Fund’s average daily net assets for the Fund’s Investor Class Shares and Institutional Class Shares, respectively. This agreement (the “Expense Agreement”) is in effect through August 31, 2017. The Adviser will be permitted to recover, on a class- by-class basis, expenses it has borne the Expense Agreement to the extent that a Fund’s expenses in later periods fall below the expense cap in effect at the time of waiver or reimbursement. Notwithstanding the foregoing, the Fund will not be obligated to pay any such deferred fees and expenses more than three years after the end of the fiscal year in which the fee and expenses was deferred. The Expense Agreement may not be terminated or modified prior to August 31, 2017 except with the approval of the Fund’s Board of Trustees. |
(d) | The Russell Global Small Cap Index seeks to measure the performance of the small-cap segment of the global equity universe. The Index is not actively managed and does not reflect any deductions for fees, expense, or taxes. An investor may not invest directly in the Index. |
(e) | The Russell Global Index seeks to measure the performance of the global equity universe. The Index is not actively managed and does not reflect any deductions for fees, expense, or taxes. An investor may not invest directly in the Index. |
| Annual Report | April 30, 2017 | 11 |
| Grandeur Peak Global Opportunities Fund | Performance Update |
April 30, 2017 (Unaudited)
Growth of $10,000 for the period ended April 30, 2017
The chart shown above represent a hypothetical investment of $10,000 in the Fund’s Investor Class shares for the period from inception to April 30, 2017. All returns reflect reinvested dividends, but do not reflect the deduction of taxes that an investor would pay on distributions or redemptions.
Investing in the Fund is subject to investment risks, including possible loss of the principal amount invested.
The Fund also offers Institutional Class shares, performance for which is not reflected in the graphs above. The performance of Institutional Class shares may be higher or lower than the performance of the Investor Class shares shown in the graphs above based upon differences in fees paid by shareholders investing in the Investor Class shares and Institutional Class shares.
| 12 | 1.855.377.7325 | www.GrandeurPeakGlobal.com |
| Grandeur Peak Global Opportunities Fund | Performance Update |
April 30, 2017 (Unaudited)
| Regional Allocation (as a % of Net Assets)* | |
| North America | 28.7% |
| Asia ex Japan | 28.1% |
| Europe | 27.4% |
| Japan | 8.1% |
| Australia/New Zealand | 2.9% |
| Africa/Middle East | 2.4% |
| Latin America | 2.2% |
| Cash, Cash Equivalents, & Other Net Assets | 0.3% |
| Total | 100.0% |
| Industry Sector Allocation (as a % of Net Assets)* | |
| Financials | 27.9% |
| Industrials | 20.5% |
| Technology | 18.9% |
| Consumer | 18.7% |
| Health Care | 11.4% |
| Energy & Materials | 2.3% |
| Cash, Cash Equivalents, & Other Net Assets | 0.3% |
| Total | 100.0% |
| Top 10 Holdings (as a % of Net Assets)* | |
| Man Wah Holdings, Ltd. | 2.5% |
| Clinigen Group PLC | 2.1% |
| Power Integrations, Inc. | 1.9% |
| First Republic Bank | 1.7% |
| Palfinger AG | 1.4% |
| FirstCash, Inc. | 1.3% |
| Knight Transportation, Inc. | 1.2% |
| MarketAxess Holdings, Inc. | 1.1% |
| Yes Bank, Ltd. | 1.1% |
| Skandiabanken ASA | 1.0% |
| Total | 15.3% |
| * | Holdings are subject to change, and may not reflect the current or future position of the portfolio. |
| Annual Report | April 30, 2017 | 13 |
| Grandeur Peak Global Reach Fund | Performance Update |
April 30, 2017 (Unaudited)
Cumulative Total Return Performance for the periods ended April 30, 2017
| | | | | | Expense Ratio(b) |
| | 6 Months | 1 Year | 3 Years | Since Inception(a) | Gross | Net(c) |
| Grandeur Peak Global Reach Fund – Investor (GPROX) | 12.27% | 18.11% | 7.10% | 11.79% | 1.55% | 1.55% |
| Grandeur Peak Global Reach Fund – Institutional (GPRIX) | 12.43% | 18.36% | 7.38% | 12.05% | 1.30% | 1.30% |
Russell Global Small Cap Index(d) | 13.33% | 18.32% | 5.82% | 8.33% | | |
Russell Global Index(e) | 12.40% | 16.06% | 5.99% | 8.77% | | |
Performance data quoted represents past performance. Past performance does not guarantee future results. Investment return and principal value of an investment will fluctuate so that an investor’s shares, when sold or redeemed, may be worth more or less than the original cost. The Fund imposes a 2.00% redemption fee on shares held for less than 60 days. Current performance data may be higher or lower than actual data quoted. For the most current month-end performance data, please call 1-855-377-PEAK (7325).
The table does not reflect the deduction of taxes a shareholder would pay on Fund distributions or redemption of Fund shares.
Subject to investment risks, including possible loss of the principal amount invested.
Returns for periods greater than 1 year are annualized.
(a) | Fund inception date of June 19, 2013. |
(b) | Ratios as of the Prospectus dated August 31, 2016 and may differ from the ratios presented in the Financial Highlights. |
(c) | Grandeur Peak Global Advisors, LLC (the “Adviser”), has agreed to waive and/or reimburse fees or expenses in order to limit Total Annual Fund Operating Expenses After Fee Waiver/Expense Reimbursement (excluding acquired fund fees and expenses, brokerage expenses, interest expenses, taxes and extraordinary expenses) to 1.60% and 1.35% of the Fund’s average daily net assets for the Fund’s Investor Class Shares and Institutional Class Shares, respectively. This agreement (the “Expense Agreement”) is in effect through August 31, 2017. The Adviser will be permitted to recover, on a class- by-class basis, expenses it has borne through the Expense Agreement to the extent that a Fund’s expenses in later periods fall below the expense cap in effect at the time of waiver or reimbursement. Notwithstanding the foregoing, the Fund will not be obligated to pay any such deferred fees and expenses more than three years after the end of the fiscal year in which the fee and expenses was deferred. The Expense Agreement may not be terminated or modified prior to August 31, 2017 except with the approval of the Fund’s Board of Trustees. |
(d) | The Russell Global Small Cap Index seeks to measure the performance of the small-cap segment of the global equity universe. The Index is not actively managed and does not reflect any deductions for fees, expense, or taxes. An investor may not invest directly in the Index. |
(e) | The Russell Global Index seeks to measure the performance of the global equity universe. The Index is not actively managed and does not reflect any deductions for fees, expense, or taxes. An investor may not invest directly in the Index. |
| 14 | 1.855.377.7325 | www.GrandeurPeakGlobal.com |
| Grandeur Peak Global Reach Fund | Performance Update |
April 30, 2017 (Unaudited)
Growth of $10,000 for the period ended April 30, 2017
The chart shown above represent a hypothetical investment of $10,000 in the Fund’s Investor Class shares for the period from inception to April 30, 2017. All returns reflect reinvested dividends, but do not reflect the deduction of taxes that an investor would pay on distributions or redemptions.
Investing in the Fund is subject to investment risks, including possible loss of the principal amount invested.
The Fund also offers Institutional Class shares, performance for which is not reflected in the graphs above. The performance of Institutional Class shares may be higher or lower than the performance of the Investor Class shares shown in the graphs above based upon differences in fees paid by shareholders investing in the Investor Class shares and Institutional Class shares.
| Annual Report | April 30, 2017 | 15 |
| Grandeur Peak Global Reach Fund | Performance Update |
April 30, 2017 (Unaudited)
| Regional Allocation (as a % of Net Assets)* | |
| Asia ex Japan | 30.6% |
| Europe | 26.5% |
| North America | 23.3% |
| Japan | 6.1% |
| Africa/Middle East | 4.6% |
| Australia/New Zealand | 3.7% |
| Latin America | 2.0% |
| Cash, Cash Equivalents, & Other Net Assets | 3.2% |
| Total | 100.0% |
| Industry Sector Allocation (as a % of Net Assets)* | |
| Financials | 23.4% |
| Consumer | 21.8% |
| Technology | 18.5% |
| Industrials | 17.8% |
| Health Care | 11.3% |
| Energy & Materials | 4.0% |
| Cash, Cash Equivalents, & Other Net Assets | 3.2% |
| Total | 100.0% |
| Top 10 Holdings (as a % of Net Assets)* | |
| Man Wah Holdings, Ltd. | 2.0% |
| Wix.com, Ltd. | 1.4% |
| Skandiabanken ASA | 1.2% |
| First Republic Bank | 1.2% |
| CBL Corp., Ltd. | 1.2% |
| Clinigen Group PLC | 1.1% |
| China Medical System Holdings, Ltd. | 1.0% |
| Metro Bank PLC | 0.9% |
| Selamat Sempurna Tbk PT | 0.8% |
| Inphi Corp. | 0.8% |
| Total | 11.6% |
| * | Holdings are subject to change, and may not reflect the current or future position of the portfolio. |
| 16 | 1.855.377.7325 | www.GrandeurPeakGlobal.com |
| Grandeur Peak Global Stalwarts Fund | Performance Update |
April 30, 2017 (Unaudited)Cumulative Total Return Performance for the periods ended April 30, 2017
| | | | | Expense Ratio(b) |
| | 6 Months | 1 Year | Since Inception(a) | Gross | Net(c) |
| Grandeur Peak Global Stalwarts – Investor (GGSOX) | 12.72% | 17.70% | 15.88% | 2.09% | 1.35% |
| Grandeur Peak Global Stalwarts – Institutional (GGSYX) | 12.82% | 18.01%(d) | 16.19% | 1.84% | 1.10% |
Russell Global SMID Cap Index(e) | 12.35% | 15.72% | 13.29% | | |
Russell Global Index(f) | 12.40% | 16.06% | 13.39% | | |
Performance data quoted represents past performance. Past performance does not guarantee future results. Investment return and principal value of an investment will fluctuate so that an investor’s shares, when sold or redeemed, may be worth more or less than the original cost. The Fund imposes a 2.00% redemption fee on shares held for less than 60 days. Current performance data may be higher or lower than actual data quoted. For the most current month-end performance data, please call 1-855-377-PEAK (7325).
The table does not reflect the deduction of taxes a shareholder would pay on Fund distributions or redemption of Fund shares.
Subject to investment risks, including possible loss of the principal amount invested.
Returns for periods greater than 1 year are annualized.
(a) | Fund inception date of September 1, 2015. |
(b) | Ratios as of the Prospectus dated August 31, 2016 and may differ from the ratios presented in the Financial Highlights. |
(c) | Grandeur Peak Global Advisors, LLC (the “Adviser”) has agreed to waive and/or reimburse fees or expenses in order to limit Total Annual Fund Operating Expenses After Fee Waiver/Expense Reimbursement (excluding acquired fund fees and expenses, brokerage expenses, interest expenses, taxes and extraordinary expenses) to 1.35% and 1.10% of the Fund’s average daily net assets for the Fund’s Investor Class Shares and Institutional Class Shares, respectively. This agreement is in effect through August 31, 2017. The Adviser will be permitted to recover, on a class-by-class basis, expenses it has borne through this agreement to the extent that a Fund’s expenses in later periods fall below the annual rates set forth in this agreement or in previous agreements. Notwithstanding the foregoing, the Fund will not be obligated to pay any such deferred fees and expenses more than three years after the end of the fiscal year in which the fee and expenses was deferred. This agreement may not be terminated or modified prior to August 31, 2017 except with the approval of the Fund’s Board of Trustees. |
(d) | Excludes adjustments in accordance with accounting principles generally accepted in the United States of America and as such, the net asset value and total return for shareholder transactions reported to the market may differ from the net asset value for financial reporting purposes. |
(e) | The Russell Global SMid Cap Index is designed to measure the performance of small- and mid-cap (SMid) securities and all capitalization securities respectively of issuers located in countries throughout the world representing developed and emerging markets. The Index is not actively managed and does not reflect any deductions for fees, expenses, or taxes. An investor may not invest directly in the Index. |
(f) | The Russell Global Index seeks to measure the performance of the global equity universe. The index is not actively managed and does not reflect any deductions for fees, expenses, or taxes. An investor may not invest directly in the Index. |
| Annual Report | April 30, 2017 | 17 |
| Grandeur Peak Global Stalwarts Fund | Performance Update |
April 30, 2017 (Unaudited)
Growth of $10,000 for the period ended April 30, 2017
The graphs shown above represent a hypothetical investment of $10,000 in the Fund’s Investor Class shares for the period from inception to April 30, 2017. All returns reflect reinvested dividends, but do not reflect the deduction of taxes that an investor would pay on distributions or redemptions.
Investing in the Fund is subject to investment risks, including possible loss of the principal amount invested.
The Fund also offers Institutional Class shares, performance for which is not reflected in the graphs above. The performance of Institutional Class shares may be higher or lower than the performance of the Investor Class shares shown in the graphs above based upon differences in fees paid by shareholders investing in the Investor Class shares and Institutional Class shares.
| 18 | 1.855.377.7325 | www.GrandeurPeakGlobal.com |
| Grandeur Peak Global Stalwarts Fund | Performance Update |
April 30, 2017 (Unaudited)
| Regional Allocation (as a % of Net Assets)* | |
| North America | 36.8% |
| Europe | 25.8% |
| Asia ex Japan | 22.3% |
| Japan | 8.5% |
| Latin America | 2.8% |
| Africa/Middle East | 1.4% |
| Australia/New Zealand | 0.7% |
| Cash, Cash Equivalents, & Other Net Assets | 1.7% |
| Total | 100.0% |
| Industry Sector Allocation (as a % of Net Assets)* | |
| Financials | 27.4% |
| Consumer | 23.9% |
| Industrials | 19.9% |
| Technology | 17.5% |
| Health Care | 6.8% |
| Energy & Materials | 2.8% |
| Cash, Cash Equivalents, & Other Net Assets | 1.7% |
| Total | 100.0% |
| Top 10 Holdings (as a % of Net Assets)* | |
| Nihon M&A Center, Inc. | 2.7% |
| First Republic Bank | 2.6% |
| Man Wah Holdings, Ltd. | 2.3% |
| Stantec, Inc. | 2.1% |
| Power Integrations, Inc. | 1.8% |
| B&M European Value Retail SA | 1.8% |
| Value Partners Group, Ltd. | 1.6% |
| Ritchie Bros. Auctioneers, Inc. | 1.6% |
| MEDNAX, Inc. | 1.5% |
| Knight Transportation, Inc. | 1.5% |
| Total | 19.5% |
| * | Holdings are subject to change, and may not reflect the current or future position of the portfolio. |
| Annual Report | April 30, 2017 | 19 |
| Grandeur Peak International Opportunities Fund | Performance Update |
April 30, 2017 (Unaudited)
Cumulative Total Return Performance for the periods ended April 30, 2017
| | | | | | | Expense Ratio(b) |
| | 6 Months | 1 Year | 3 Years | 5 Years | Since Inception(a) | Gross | Net(c) |
Grandeur Peak International Opportunities Fund – Investor (GPIOX) | 11.03% | 17.50% | 5.99% | 13.06% | 14.49% | 1.63% | 1.63% |
| Grandeur Peak International Opportunities Fund – Institutional (GPIIX) | 11.50% | 17.59% | 6.25% | 13.36% | 14.76% | 1.38% | 1.38% |
Russell Global ex‐U.S. Small Cap Index(d) | 9.84% | 13.36% | 3.66% | 7.30% | 8.09% | | |
Performance data quoted represents past performance. Past performance does not guarantee future results. Investment return and principal value of an investment will fluctuate so that an investor’s shares, when sold or redeemed, may be worth more or less than the original cost. The Fund imposes a 2.00% redemption fee on shares held for less than 60 days. Current performance data may be higher or lower than actual data quoted. For the most current month-end performance data, please call 1-855-377-PEAK (7325).
The table does not reflect the deduction of taxes a shareholder would pay on Fund distributions or redemption of Fund shares.
Subject to investment risks, including possible loss of the principal amount invested.
Returns for periods greater than 1 year are annualized.
| (a) | Fund inception date of October 17, 2011. |
| (b) | Ratios as of the Prospectus dated August 31, 2016 and may differ from the ratios presented in the Financial Highlights. |
| (c) | Grandeur Peak Global Advisors, LLC (the “Adviser”) has agreed to waive and/or reimburse fees or expenses in order to limit Total Annual Fund Operating Expenses After Fee Waiver/Expense Reimbursements (excluding acquired fund fees and expenses, brokerage expenses, interest expenses, taxes and extraordinary expenses) to 1.75% and 1.50% of the Fund’s average daily net assets for the Fund’s Investor Class Shares and Institutional Class Shares, respectively. This agreement (the “Expense Agreement”) is in effect through August 31, 2017. The Adviser will be permitted to recover, on a class- by-class basis, expenses it has borne through the Expense Agreement to the extent that a Fund’s expenses in later periods fall below the expense cap in effect at the time of waiver or reimbursement. Notwithstanding the foregoing, the Funds will not be obligated to pay any such deferred fees and expenses more than three years after the end of the fiscal year in which the fee and expenses was deferred. The Expense Agreement may not be terminated or modified prior to August 31, 2017 except with the approval of the Fund’s Board of Trustees. |
| (d) | The Russell Global ex-U.S. Small Cap Index seeks to measure the performance of the small-cap segment of the global equity universe, excluding companies assigned to the United States. The Index is not actively managed and does not reflect any deductions for fees, expense, or taxes. An investor may not invest directly in the Index. |
| 20 | 1.855.377.7325 | www.GrandeurPeakGlobal.com |
| Grandeur Peak International Opportunities Fund | Performance Update |
April 30, 2017 (Unaudited)
Growth of $10,000 for the period ended April 30, 2017
The chart shown above represent a hypothetical investment of $10,000 in the Fund’s Investor Class shares for the period from inception to April 30, 2017. All returns reflect reinvested dividends, but do not reflect the deduction of taxes that an investor would pay on distributions or redemptions.
Investing in the Fund is subject to investment risks, including possible loss of the principal amount invested.
The Fund also offers Institutional Class shares, performance for which is not reflected in the graphs above. The performance of Institutional Class shares may be higher or lower than the performance of the Investor Class shares shown in the graphs above based upon differences in fees paid by shareholders investing in the Investor Class shares and Institutional Class shares.
| Annual Report | April 30, 2017 | 21 |
| Grandeur Peak International Opportunities Fund | Performance Update |
April 30, 2017 (Unaudited)
| Regional Allocation (as a % of Net Assets)* | |
| Asia ex Japan | 35.6% |
| Europe | 34.3% |
| Japan | 11.0% |
| North America | 6.8% |
| Australia/New Zealand | 3.6% |
| Africa/Middle East | 3.6% |
| Latin America | 2.9% |
| Cash, Cash Equivalents, & Other Net Assets | 2.2% |
| Total | 100.0% |
| Industry Sector Allocation (as a % of Net Assets)* | |
| Financials | 26.9% |
| Industrials | 20.2% |
| Technology | 18.8% |
| Consumer | 17.5% |
| Health Care | 11.0% |
| Energy & Materials | 3.4% |
| Cash, Cash Equivalents, & Other Net Assets | 2.2% |
| Total | 100.0% |
| Top 10 Holdings (as a % of Net Assets)* | |
| Man Wah Holdings, Ltd. | 2.5% |
| Clinigen Group PLC | 2.1% |
| FirstCash, Inc. | 1.3% |
| China Medical System Holdings, Ltd. | 1.2% |
| Palfinger AG | 1.1% |
| Alkem Laboratories, Ltd. | 1.1% |
| Skandiabanken ASA | 1.1% |
| Silergy Corp. | 1.1% |
| Irish Residential Properties PLC, REIT | 1.1% |
| Sporton International, Inc. | 1.1% |
| Total | 13.7% |
| * | Holdings are subject to change, and may not reflect the current or future position of the portfolio. |
| 22 | 1.855.377.7325 | www.GrandeurPeakGlobal.com |
| Grandeur Peak International Stalwarts Fund | Performance Update |
April 30, 2017 (Unaudited)
Cumulative Total Return Performance for the periods ended April 30, 2017
| | | | | Expense Ratio(b) |
| | 6 Months | 1 Year | Since Inception(a) | Gross | Net(c) |
| Grandeur Peak International Stalwarts – Investor | 11.97% | 18.68% | 17.51% | 1.45% | 1.35% |
| Grandeur Peak International Stalwarts – Institutional | 12.15% | 18.96% | 17.77% | 1.20% | 1.10% |
Russell Global ex‐U.S. SMID Cap Index(d) | 10.55% | 13.15% | 12.68% | | |
Russell Global ex‐U.S. Small Cap Index(e) | 9.84% | 13.36% | 13.02% | | |
Performance data quoted represents past performance. Past performance does not guarantee future results. Investment return and principal value of an investment will fluctuate so that an investor’s shares, when sold or redeemed, may be worth more or less than the original cost. The Fund imposes a 2.00% redemption fee on shares held for less than 60 days. Current performance data may be higher or lower than actual data quoted. For the most current month-end performance data, please call 1-855-377-PEAK (7325).
The table does not reflect the deduction of taxes a shareholder would pay on Fund distributions or redemption of Fund shares.
Subject to investment risks, including possible loss of the principal amount invested.
Returns for periods greater than 1 year are annualized.s
| (a) | Fund inception date of September 1, 2015. |
| (b) | Ratios as of the Prospectus dated August 31, 2016 and may differ from the ratios presented in the Financial Highlights. |
| (c) | Grandeur Peak Global Advisors, LLC (the “Adviser”) has agreed to waive and/or reimburse fees or expenses in order to limit Total Annual Fund Operating Expenses After Fee Waiver/Expense Reimbursement (excluding acquired fund fees and expenses, brokerage expenses, interest expenses, taxes and extraordinary expenses) to 1.35% and 1.10% of the Fund’s average daily net assets for the Fund’s Investor Class Shares and Institutional Class Shares, respectively. This agreement is in effect through August 31, 2017. The Adviser will be permitted to recover, on a class-by-class basis, expenses it has borne through this agreement to the extent that a Fund’s expenses in later periods fall below the annual rates set forth in this agreement or in previous agreements. Notwithstanding the foregoing, the Fund will not be obligated to pay any such deferred fees and expenses more than three years after the end of the fiscal year in which the fee and expenses was deferred. This agreement may not be terminated or modified prior to August 31, 2017 except with the approval of the Fund’s Board of Trustees. |
| (d) | The Russell Global ex-US SMid Cap Index is constructed to provide a comprehensive and unbiased barometer for the small- and mid-cap (SMid) segments excluding companies assigned to the United States. The Russell Global ex-US SMid Cap Index is reconstituted annually to accurately reflect the changes in the market over time. The Index is not actively managed and does not reflect any deductions for fees, expenses, or taxes. An investor may not invest directly in the Index. |
| (e) | The Russell Global ex-U.S. Small Cap Index is designed to measure the performance of small capitalization securities outside of the U.S. The Index is not actively managed and does not reflect any deductions for fees, expenses, or taxes. An investor may not invest directly in the Index. |
| Annual Report | April 30, 2017 | 23 |
| Grandeur Peak International Stalwarts Fund | Performance Update |
April 30, 2017 (Unaudited)
Growth of $10,000 for the period ended April 30, 2017
The chart shown above represent a hypothetical investment of $10,000 in the Fund’s Investor Class shares for the period from inception to April 30, 2017. All returns reflect reinvested dividends, but do not reflect the deduction of taxes that an investor would pay on distributions or redemptions.
Investing in the Fund is subject to investment risks, including possible loss of the principal amount invested.
The Fund also offers Institutional Class shares, performance for which is not reflected in the graphs above. The performance of Institutional Class shares may be higher or lower than the performance of the Investor Class shares shown in the graphs above based upon differences in fees paid by shareholders investing in the Investor Class shares and Institutional Class shares.
| 24 | 1.855.377.7325 | www.GrandeurPeakGlobal.com |
| Grandeur Peak International Stalwarts Fund | Performance Update |
April 30, 2017 (Unaudited)
| Regional Allocation (as a % of Net Assets)* | |
| Europe | 37.3% |
| Asia ex Japan | 30.1% |
| North America | 13.7% |
| Japan | 10.4% |
| Latin America | 3.9% |
| Africa/Middle East | 2.2% |
| Australia/New Zealand | 1.1% |
| Cash, Cash Equivalents, & Other Net Assets | 1.3% |
| Total | 100.0% |
| Industry Sector Allocation (as a % of Net Assets)* | |
| Financials | 27.3% |
| Consumer | 25.4% |
| Industrials | 21.5% |
| Technology | 16.1% |
| Health Care | 6.3% |
| Energy & Materials | 2.1% |
| Cash, Cash Equivalents, & Other Net Assets | 1.3% |
| Total | 100.0% |
| Top 10 Holdings (as a % of Net Assets)* | |
| Nihon M&A Center, Inc. | 2.9% |
| Man Wah Holdings, Ltd. | 2.9% |
| Stantec, Inc. | 2.7% |
| Brembo SpA | 2.3% |
| B&M European Value Retail SA | 2.2% |
| Aalberts Industries NV | 2.1% |
| Value Partners Group, Ltd. | 2.1% |
| Ritchie Bros. Auctioneers, Inc. | 2.1% |
| Yes Bank, Ltd. | 1.8% |
| Alten SA | 1.8% |
| Total | 22.9% |
| * | Holdings are subject to change, and may not reflect the current or future position of the portfolio. |
| Annual Report | April 30, 2017 | 25 |
Grandeur Peak Funds® | Disclosure of Fund Expenses |
April 30, 2017 (Unaudited)
As a shareholder of a Fund, you incur two types of costs: (1) transaction costs, including sales charges (loads) on purchase payments, reinvested dividends, or other distributions; redemption fees; and exchange fees; and (2) ongoing costs, including management fees; distribution and/or service (12b‐1) fees; and other Fund expenses. This example is intended to help you understand your ongoing costs (in dollars) of investing in the Fund and to compare these costs with the ongoing costs of investing in other mutual funds.
This example is based on an investment of $1,000 invested at the beginning of the period and held for the entire six‐month period of May 1, 2016 through of April 30, 2017.
Actual Expenses The first line of the table provides information about actual account values and actual expenses. You may use the information in this line, together with the amount you invested, to estimate the expenses that you paid over the period. Simply divide your account value by $1,000 (for example, an $8,600 account value divided by $1,000 = 8.6), then multiply the result by the number in the first line under the heading “Expenses Paid During Period” to estimate the expenses you paid on your account during this period.
Hypothetical Example for Comparison Purposes The second line of the table provides information about hypothetical account values and hypothetical expenses based on the Fund’s actual expense ratio and an assumed rate of return of 5% per year before expenses, which is not the Fund’s actual return. The hypothetical account values and expenses may not be used to estimate the actual ending account balance or expenses you paid for the period. You may use this information to compare the ongoing costs of investing in the Fund and other mutual funds. To do so, compare this 5% hypothetical example with the 5% hypothetical examples that appear in the shareholder reports of the other funds.
Please note that the expenses shown in the table are meant to highlight your ongoing costs only and do not reflect any transactional costs, such as redemption fees or exchange fees. Therefore, the second line of the table is useful in comparing ongoing costs only and will not help you determine the relative total costs of owning different funds. In addition, if these transactional costs were included, your costs would have been higher.
| 26 | 1.855.377.7325 | www.GrandeurPeakGlobal.com |
Grandeur Peak Funds® | Disclosure of Fund Expenses |
| | April 30, 2017 (Unaudited) |
| | | Beginning Account Value November 1, 2016 | | | Ending Account Value April 30, 2017 | | | Expense Ratio(a) | | Expenses Paid During period November 1, 2016 - April 30, 2017(b) | |
| Grandeur Peak Emerging Markets Opportunities Fund | | | | | | | | | | | | |
| Investor Class | | | | | | | | | | | | |
| Actual | | $1,000.00 | | | $1,071.70 | | | 1.77 | % | | $9.09 | |
| Hypothetical (5% return before expenses) | | $1,000.00 | | | $1,016.02 | | | 1.77 | % | | $8.85 | |
| Institutional Class | | | | | | | | | | | | |
| Actual | | $1,000.00 | | | $1,073.10 | | | 1.56 | % | | $8.02 | |
| Hypothetical (5% return before expenses) | | $1,000.00 | | | $1,017.06 | | | 1.56 | % | | $7.80 | |
| Grandeur Peak Global Micro Cap Fund | | | | | | | | | | | | |
| Institutional Class | | | | | | | | | | | | |
| Actual | | $1,000.00 | | | $1,096.30 | | | 2.02 | % | | $10.50 | |
| Hypothetical (5% return before expenses) | | $1,000.00 | | | $1,014.78 | | | 2.02 | % | | $10.09 | |
| Grandeur Peak Global Opportunities Fund | | | | | | | | | | | | |
| Investor Class | | | | | | | | | | | | |
| Actual | | $1,000.00 | | | $1,118.80 | | | 1.57 | % | | $8.25 | |
| Hypothetical (5% return before expenses) | | $1,000.00 | | | $1,017.01 | | | 1.57 | % | | $7.85 | |
| Institutional Class | | | | | | | | | | | | |
| Actual | | $1,000.00 | | | $1,122.50 | | | 1.33 | % | | $7.00 | |
| Hypothetical (5% return before expenses) | | $1,000.00 | | | $1,018.20 | | | 1.33 | % | | $6.66 | |
| Grandeur Peak Global Reach Fund | | | | | | | | | | | | |
| Investor Class | | | | | | | | | | | | |
| Actual | | $1,000.00 | | | $1,122.70 | | | 1.52 | % | | $8.00 | |
| Hypothetical (5% return before expenses) | | $1,000.00 | | | $1,017.26 | | | 1.52 | % | | $7.60 | |
| Institutional Class | | | | | | | | | | | | |
| Actual | | $1,000.00 | | | $1,124.30 | | | 1.28 | % | | $6.74 | |
| Hypothetical (5% return before expenses) | | $1,000.00 | | | $1,018.45 | | | 1.28 | % | | $6.41 | |
| Grandeur Peak Global Stalwarts Fund | | | | | | | | | | | | |
| Investor Class | | | | | | | | | | | | |
| Actual | | $1,000.00 | | | $1,127.20 | | | 1.35 | % | | $7.12 | |
| Hypothetical (5% return before expenses) | | $1,000.00 | | | $1,018.10 | | | 1.35 | % | | $6.76 | |
| Institutional Class | | | | | | | | | | | | |
| Actual | | $1,000.00 | | | $1,127.40 | | | 1.10 | % | | $5.80 | |
| Hypothetical (5% return before expenses) | | $1,000.00 | | | $1,019.34 | | | 1.10 | % | | $5.51 | |
| Grandeur Peak International Opportunities Fund | | | | | | | | | | | | |
| Investor Class | | | | | | | | | | | | |
| Actual | | $1,000.00 | | | $1,110.30 | | | 1.56 | % | | $8.16 | |
| Hypothetical (5% return before expenses) | | $1,000.00 | | | $1,017.06 | | | 1.56 | % | | $7.80 | |
| Institutional Class | | | | | | | | | | | | |
| Actual | | $1,000.00 | | | $1,115.00 | | | 1.32 | % | | $6.92 | |
| Hypothetical (5% return before expenses) | | $1,000.00 | | | $1,018.25 | | | 1.32 | % | | $6.61 | |
| Grandeur Peak International Stalwarts Fund | | | | | | | | | | | | |
| Investor Class | | | | | | | | | | | | |
| Actual | | $1,000.00 | | | $1,119.70 | | | 1.23 | % | | $6.46 | |
| Hypothetical (5% return before expenses) | | $1,000.00 | | | $1,018.70 | | | 1.23 | % | | $6.16 | |
| Institutional Class | | | | | | | | | | | | |
| Actual | | $1,000.00 | | | $1,121.50 | | | 1.00 | % | | $5.26 | |
| Hypothetical (5% return before expenses) | | $1,000.00 | | | $1,019.84 | | | 1.00 | % | | $5.01 | |
(a) | The Fund's expense ratios have been annualized based on the Fund's most recent fiscal half-year expenses. |
(b) | Expenses are equal to the Fund's annualized expense ratio multiplied by the average account value over the period, multiplied by the number of days in the most recent fiscal half-year 181/365 (to reflect the half-year period). |
| Annual Report | April 30, 2017 | 27 |
| Grandeur Peak Emerging Markets Opportunities Fund | Portfolio of Investments |
| | | Shares | | | Value (Note 2) | |
| COMMON STOCKS (94.52%) | | | | | | |
| Argentina (0.72%) | | | | | | |
Globant SA(a) | | | 78,737 | | | $ | 2,983,345 | |
| | | | | | | | | |
| Bangladesh (0.68%) | | | | | | | | |
| Olympic Industries, Ltd. | | | 272,639 | | | | 883,529 | |
| Square Pharmaceuticals, Ltd. | | | 577,442 | | | | 1,966,583 | |
| | | | | | | | 2,850,112 | |
| | | | | | | | | |
| Brazil (1.93%) | | | | | | | | |
| FPC Par Corretora de | | | | | | | | |
| Seguros SA | | | 546,000 | | | | 3,235,696 | |
| Raia Drogasil SA | | | 123,300 | | | | 2,610,858 | |
| | | | | | | | | |
| Valid Solucoes e Servicos de Seguranca em Meios de Pagamento e Identificacao SA | | | 306,000 | | | | 2,189,398 | |
| | | | | | | | 8,035,952 | |
| | | | | | | | | |
| Chile (0.31%) | | | | | | | | |
| Forus SA | | | 325,019 | | | | 1,305,131 | |
| | | | | | | | | |
| China (12.59%) | | | | | | | | |
51job, Inc., ADR(a) | | | 50,125 | | | | 2,054,624 | |
BBI Life Sciences Corp.(b) | | | 9,968,500 | | | | 2,332,457 | |
| BrightKing Holdings, Ltd. | | | 556,721 | | | | 1,378,379 | |
| China Lesso Group Holdings, Ltd. | | | 2,155,000 | | | | 1,717,716 | |
| China Medical System Holdings, Ltd. | | | 5,441,000 | | | | 9,401,356 | |
| CSPC Pharmaceutical Group, Ltd. | | | 2,500,000 | | | | 3,471,173 | |
Ctrip.com International, Ltd., ADR(a) | | | 31,900 | | | | 1,611,269 | |
| Essex Bio‐technology, Ltd. | | | 4,521,000 | | | | 2,487,659 | |
Lida Holdings, Ltd.(a) | | | 446,000 | | | | 1,507,805 | |
| Man Wah Holdings, Ltd. | | | 13,183,600 | | | | 10,932,167 | |
O2Micro International, Ltd., ADR(a) | | | 462,244 | | | | 1,146,365 | |
| On‐Bright Electronics, Inc. | | | 514,080 | | | | 3,237,387 | |
Shanghai Haohai Biological Technology Co., Ltd., Class H(b)(c) | | | 455,800 | | | | 2,513,878 | |
| Silergy Corp. | | | 349,422 | | | | 6,323,437 | |
Xiabuxiabu Catering Management China Holdings Co., Ltd.(b)(c) | | | 2,780,500 | | | | 2,366,429 | |
| | | | | | | | 52,482,101 | |
| | | | | | | | | |
| Colombia (2.12%) | | | | | | | | |
Amerisur Resources PLC(a) | | | 1,466,700 | | | | 460,670 | |
| Bolsa de Valores de Colombia | | | 249,678,088 | | | | 2,036,803 | |
| | | Shares | | | Value (Note 2) | |
| Colombia (continued) | | | | | | |
Gran Tierra Energy, Inc.(a) | | | 1,124,500 | | | $ | 2,833,740 | |
Parex Resources, Inc.(a) | | | 284,131 | | | | 3,528,091 | |
| | | | | | | | 8,859,304 | |
| | | | | | | | | |
| Egypt (0.23%) | | | | | | | | |
| Integrated Diagnostics | | | | | | | | |
Holdings PLC(b)(c) | | | 320,300 | | | | 964,103 | |
| | | | | | | | | |
| Eqypt (0.74%) | | | | | | | | |
| Commercial International Bank Egypt SAE | | | 270,355 | | | | 1,106,883 | |
Juhayna Food Industries(a) | | | 3,911,275 | | | | 1,982,724 | |
| | | | | | | | 3,089,607 | |
| | | | | | | | | |
| Georgia (2.98%) | | | | | | | | |
| BGEO Group PLC | | | 196,212 | | | | 9,148,822 | |
Georgia Healthcare Group PLC(a)(b)(c) | | | 319,225 | | | | 1,467,785 | |
TBC Bank Group PLC(a) | | | 86,400 | | | | 1,818,462 | |
| | | | | | | | 12,435,069 | |
| | | | | | | | | |
| Greece (0.68%) | | | | | | | | |
| Sarantis SA | | | 223,934 | | | | 2,819,847 | |
| | | | | | | | | |
| Hong Kong (3.32%) | | | | | | | | |
| International Housewares Retail Co., Ltd. | | | 9,629,000 | | | | 2,178,745 | |
| Samsonite International SA | | | 462,000 | | | | 1,784,839 | |
| TK Group Holdings, Ltd. | | | 3,147,000 | | | | 1,051,920 | |
| Value Partners Group, Ltd. | | | 7,522,800 | | | | 6,963,451 | |
| Vitasoy International Holdings, Ltd. | | | 940,900 | | | | 1,860,425 | |
| | | | | | | | 13,839,380 | |
| | | | | | | | | |
| India (17.87%) | | | | | | | | |
Advanced Enzyme Technologies, Ltd.(a)(b) | | | 15,500 | | | | 497,504 | |
| AIA Engineering, Ltd. | | | 43,250 | | | | 1,013,178 | |
| Alkem Laboratories, Ltd. | | | 176,037 | | | | 5,394,673 | |
| Bajaj Finance, Ltd. | | | 172,000 | | | | 3,412,193 | |
| The Byke Hospitality, Ltd. | | | 981,000 | | | | 3,262,629 | |
| City Union Bank, Ltd. | | | 1,286,500 | | | | 3,295,744 | |
| Control Print, Ltd. | | | 299,000 | | | | 1,280,267 | |
| Cyient, Ltd. | | | 461,095 | | | | 3,925,364 | |
Dilip Buildcon, Ltd.(a)(b)(c) | | | 486,165 | | | | 3,192,985 | |
Eros International Media, Ltd.(a) | | | 310,000 | | | | 1,042,570 | |
| Essel Propack, Ltd. | | | 502,000 | | | | 2,003,162 | |
| Hinduja Global Solutions, Ltd. | | | 161,184 | | | | 1,388,342 | |
| Indiabulls Housing Finance, Ltd. | | | 214,500 | | | | 3,390,887 | |
| | |
| See Notes to Financial Statements. | |
| 28 | 1.855.377.7325 | www.GrandeurPeakGlobal.com |
| Grandeur Peak Emerging Markets Opportunities Fund | Portfolio of Investments |
| | | Shares | | | Value (Note 2) | |
| India (continued) | | | | | | |
Infinite Computer Solutions India, Ltd.(a) | | | 404,789 | | | $ | 1,420,505 | |
Inox Wind, Ltd.(a) | | | 589,500 | | | | 1,799,290 | |
Kellton Tech Solutions, Ltd.(a) | | | 481,753 | | | | 882,927 | |
| Kovai Medical Center and Hospital | | | 75,083 | | | | 1,418,092 | |
| KPIT Technologies, Ltd. | | | 650,858 | | | | 1,299,085 | |
| Kwality, Ltd. | | | 985,200 | | | | 2,314,830 | |
L&T Technology Services, Ltd.(b)(c) | | | 134,500 | | | | 1,606,243 | |
| Max Financial Services, Ltd. | | | 214,500 | | | | 2,187,013 | |
| MBL Infrastructures, Ltd. | | | 773,000 | | | | 495,667 | |
| MT Educare, Ltd. | | | 260,523 | | | | 326,413 | |
| Poly Medicure, Ltd. | | | 183,444 | | | | 792,034 | |
| Somany Ceramics, Ltd. | | | 132,000 | | | | 1,514,112 | |
| Time Technoplast, Ltd. | | | 3,723,524 | | | | 6,578,245 | |
Vaibhav Global, Ltd.(a) | | | 251,319 | | | | 1,839,282 | |
| Vakrangee, Ltd. | | | 444,000 | | | | 2,361,489 | |
| Vesuvius India, Ltd. | | | 111,827 | | | | 2,142,322 | |
WNS Holdings, Ltd., ADR(a) | | | 160,186 | | | | 5,129,156 | |
| Yes Bank, Ltd. | | | 288,000 | | | | 7,298,492 | |
| | | | | | | | 74,504,695 | |
| | | | | | | | | |
| Indonesia (6.36%) | | | | | | | | |
| Arwana Citramulia Tbk PT | | | 41,381,200 | | | | 1,692,006 | |
| Astra Graphia Tbk PT | | | 8,442,500 | | | | 1,200,280 | |
| Bank Rakyat Indonesia Persero Tbk PT | | | 3,203,600 | | | | 3,100,491 | |
| Bekasi Fajar Industrial Estate Tbk PT | | | 56,350,600 | | | | 1,251,390 | |
| Delfi, Ltd. | | | 866,400 | | | | 1,420,074 | |
| Hexindo Adiperkasa Tbk PT | | | 2,024,100 | | | | 668,170 | |
| Indonesia Pondasi Raya Tbk PT | | | 15,760,000 | | | | 1,477,980 | |
| Link Net Tbk PT | | | 6,266,000 | | | | 2,538,555 | |
Lippo Cikarang Tbk PT(a) | | | 3,005,000 | | | | 1,010,008 | |
| Panin Sekuritas Tbk PT | | | 7,155,500 | | | | 1,884,298 | |
Sarana Menara Nusantara PT(a) | | | 4,542,000 | | | | 1,322,152 | |
| Selamat Sempurna Tbk PT | | | 42,617,900 | | | | 3,900,806 | |
| Surya Toto Indonesia Tbk PT | | | 19,795,000 | | | | 662,358 | |
| Tempo Scan Pacific Tbk PT | | | 17,950,700 | | | | 2,787,752 | |
Ultrajaya Milk Industry & Trading Co. Tbk PT(a) | | | 5,042,900 | | | | 1,589,030 | |
| | | | | | | | 26,505,350 | |
| | | | | | | | | |
| Jordan (0.36%) | | | | | | | | |
| Hikma Pharmaceuticals PLC | | | 60,400 | | | | 1,515,318 | |
| | | | | | | | | |
| Kenya (0.50%) | | | | | | | | |
| Safaricom, Ltd. | | | 11,093,200 | | | | 2,069,226 | |
| | | Shares | | | Value (Note 2) | |
| Malaysia (2.55%) | | | | | | |
7‐Eleven Malaysia Holdings Bhd, Class B | | | 1,999,200 | | | $ | 736,862 | |
| AEON Credit Service M Bhd | | | 745,000 | | | | 2,804,262 | |
| Berjaya Food Bhd | | | 2,088,084 | | | | 836,965 | |
| CB Industrial Product Holding Bhd | | | 3,838,800 | | | | 1,821,684 | |
| My EG Services Bhd | | | 5,499,900 | | | | 2,698,638 | |
| Scicom MSC Bhd | | | 3,146,500 | | | | 1,739,599 | |
| | | | | | | | 10,638,010 | |
| | | | | | | | | |
| Mexico (1.82%) | | | | | | | | |
| Banregio Grupo Financiero SAB de CV | | | 455,000 | | | | 2,627,243 | |
| Credito Real SAB de CV SOFOM ER | | | 2,211,471 | | | | 3,101,304 | |
| Unifin Financiera SAB de CV SOFOM ENR | | | 704,700 | | | | 1,866,822 | |
| | | | | | | | 7,595,369 | |
| | | | | | | | | |
| Oman (0.64%) | | | | | | | | |
| Tethys Oil AB | | | 348,523 | | | | 2,685,547 | |
| | | | | | | | | |
| Pakistan (2.85%) | | | | | | | | |
| Abbott Laboratories Pakistan, Ltd. | | | 132,850 | | | | 1,213,107 | |
| Akzo Nobel Pakistan, Ltd. | | | 512,300 | | | | 1,298,906 | |
| Bank Al Habib, Ltd. | | | 1,609,000 | | | | 822,663 | |
| Bata Pakistan, Ltd. | | | 11,160 | | | | 433,171 | |
| DG Khan Cement Co., Ltd. | | | 263,500 | | | | 601,179 | |
| Kohinoor Textile Mills, Ltd. | | | 1,345,451 | | | | 1,451,348 | |
| Meezan Bank, Ltd. | | | 2,272,000 | | | | 1,735,096 | |
| Pak Elektron, Ltd. | | | 2,219,500 | | | | 2,444,194 | |
| Systems, Ltd. | | | 2,181,500 | | | | 1,890,057 | |
| | | | | | | | 11,889,721 | |
| | | | | | | | | |
| Peru (0.74%) | | | | | | | | |
| Credicorp, Ltd. | | | 20,175 | | | | 3,100,091 | |
| | | | | | | | | |
| Philippines (5.99%) | | | | | | | | |
| Concepcion Industrial Corp. | | | 3,390,660 | | | | 5,025,085 | |
| Holcim Philippines, Inc. | | | 3,694,500 | | | | 1,138,703 | |
| Metro Retail Stores Group, Inc. | | | 25,992,000 | | | | 1,898,745 | |
| Pepsi‐Cola Products Philippines, Inc. | | | 25,930,000 | | | | 1,920,164 | |
| Puregold Price Club, Inc. | | | 3,546,100 | | | | 2,959,519 | |
| Robinsons Land Corp. | | | 5,108,600 | | | | 2,622,548 | |
| Robinsons Retail Holdings, Inc. | | | 1,675,000 | | | | 2,661,763 | |
| Security Bank Corp. | | | 1,580,600 | | | | 6,744,400 | |
| | | | | | | | 24,970,927 | |
| | |
| See Notes to Financial Statements. | |
| Annual Report | April 30, 2017 | 29 |
| Grandeur Peak Emerging Markets Opportunities Fund | Portfolio of Investments |
| | | Shares | | | Value (Note 2) | |
| Poland (1.38%) | | | | | | |
| LiveChat Software SA | | | 135,800 | | | $ | 1,951,652 | |
| Medicalgorithmics SA | | | 12,700 | | | | 965,465 | |
| PGS Software SA | | | 269,667 | | | | 999,642 | |
| Wawel SA | | | 3,914 | | | | 1,109,868 | |
Work Service SA(a) | | | 290,745 | | | | 724,014 | |
| | | | | | | | 5,750,641 | |
| | | | | | | | | |
| Russia (0.61%) | | | | | | | | |
| MD Medical Group | | | | | | | | |
| Investments PLC, | | | | | | | | |
GDR(b) | | | 117,400 | | | | 1,220,960 | |
| Moscow Exchange MICEX‐ RTS PJSC | | | 659,160 | | | | 1,332,128 | |
| | | | | | | | 2,553,088 | |
| | | | | | | | | |
| South Africa (4.69%) | | | | | | | | |
| ARB Holdings, Ltd. | | | 1,134,108 | | | | 550,771 | |
| Blue Label Telecoms, Ltd. | | | 1,657,523 | | | | 2,101,090 | |
| Cartrack Holdings, Ltd. | | | 2,379,000 | | | | 2,082,821 | |
| Clicks Group, Ltd. | | | 145,100 | | | | 1,457,433 | |
| Comair, Ltd. | | | 1,474,566 | | | | 550,600 | |
| EOH Holdings, Ltd. | | | 372,124 | | | | 3,938,785 | |
Interwaste Holdings, Ltd.(a) | | | 15,918,682 | | | | 1,024,418 | |
| Invicta Holdings, Ltd. | | | 278,182 | | | | 1,138,644 | |
| Italtile, Ltd. | | | 1,502,579 | | | | 1,511,152 | |
| OneLogix Group, Ltd. | | | 2,142,622 | | | | 482,596 | |
Super Group, Ltd.(a) | | | 389,780 | | | | 1,072,469 | |
| Transaction Capital, Ltd. | | | 3,304,845 | | | | 3,625,407 | |
| | | | | | | | 19,536,186 | |
| | | | | | | | | |
| South Korea (5.97%) | | | | | | | | |
| Daebongls Co., Ltd. | | | 97,200 | | | | 1,106,196 | |
| Daewon Pharmaceutical Co., Ltd. | | | 59,222 | | | | 1,137,183 | |
| Hy‐Lok Corp. | | | 157,743 | | | | 3,105,232 | |
| Interpark Holdings Corp. | | | 265,500 | | | | 1,252,953 | |
| ISC Co., Ltd. | | | 191,999 | | | | 3,425,239 | |
| i‐SENS, Inc. | | | 75,500 | | | | 1,957,334 | |
| Koh Young Technology, Inc. | | | 32,744 | | | | 1,545,261 | |
| Kolao Holdings | | | 181,000 | | | | 1,064,144 | |
| LG Household & Health | | | | | | | | |
| Care, Ltd. | | | 2,900 | | | | 2,207,048 | |
| Loen Entertainment, Inc. | | | 34,500 | | | | 2,665,041 | |
| Mando Corp. | | | 10,500 | | | | 2,122,331 | |
Vitzrocell Co., Ltd.(d) | | | 370,641 | | | | 3,306,095 | |
| | | | | | | | 24,894,057 | |
| | | | | | | | | |
| Sri Lanka (1.98%) | | | | | | | | |
| Hatton National Bank PLC | | | 1,016,059 | | | | 1,532,417 | |
| Hemas Holdings PLC | | | 3,255,526 | | | | 2,519,030 | |
| Royal Ceramics Lanka PLC | | | 3,593,775 | | | | 2,992,849 | |
| | | Shares | | | Value (Note 2) | |
| Sri Lanka (continued) | | | | | | |
| Sampath Bank PLC | | | 692,069 | | | $ | 1,233,471 | |
| | | | | | | | 8,277,767 | |
| | | | | | | | | |
| Switzerland (0.36%) | | | | | | | | |
Wizz Air Holdings PLC(a)(b)(c) | | | 64,800 | | | | 1,481,347 | |
| | | | | | | | | |
| Taiwan (8.03%) | | | | | | | | |
| ASPEED Technology, Inc. | | | 116,929 | | | | 2,271,068 | |
| Cub Elecparts, Inc. | | | 182,073 | | | | 1,906,966 | |
| Dr. Wu Skincare Co., Ltd. | | | 382,000 | | | | 2,646,183 | |
| I Yuan Precision Ind. Co., Ltd. | | | 381,000 | | | | 1,603,759 | |
| Materials Analysis Technology, Inc. | | | 650,000 | | | | 2,240,562 | |
| Novatek Microelectronics Corp. | | | 361,000 | | | | 1,387,955 | |
| Sinmag Equipment Corp. | | | 1,039,133 | | | | 4,787,362 | |
| Sitronix Technology Corp. | | | 1,406,000 | | | | 4,222,054 | |
| Solidwizard Technology Co., Ltd. | | | 333,000 | | | | 1,006,582 | |
| Sporton International, Inc. | | | 1,033,978 | | | | 6,117,301 | |
| Test Research, Inc. | | | 1,990,000 | | | | 2,648,189 | |
| Topoint Technology Co., Ltd. | | | 1,579,000 | | | | 1,399,962 | |
| TSC Auto ID Technology Co., Ltd. | | | 171,000 | | | | 1,258,228 | |
| | | | | | | | 33,496,171 | |
| | | | | | | | | |
| Thailand (1.96%) | | | | | | | | |
| Ananda Development PCL | | | 27,500,800 | | | | 3,927,550 | |
| Premier Marketing PCL | | | 4,566,900 | | | | 1,201,468 | |
| Srisawad Power 1979 PCL | | | 1,722,240 | | | | 2,203,213 | |
| Thaire Life Assurance PCL | | | 3,562,000 | | | | 844,417 | |
| | | | | | | | 8,176,648 | |
| | | | | | | | | |
| Turkey (0.40%) | | | | | | | | |
| Anadolu Hayat Emeklilik AS | | | 577,500 | | | | 879,594 | |
| AvivaSA Emeklilik ve Hayat AS | | | 140,700 | | | | 777,981 | |
| | | | | | | | 1,657,575 | |
| | | | | | | | | |
| United Arab Emirates (0.35%) | | | | | | | | |
| Aramex PJSC | | | 1,018,125 | | | | 1,463,572 | |
| | | | | | | | | |
| United States (1.16%) | | | | | | | | |
| FirstCash, Inc. | | | 93,070 | | | | 4,834,986 | |
| | | | | | | | | |
| Vietnam (1.65%) | | | | | | | | |
| DHG Pharmaceutical JSC | | | 79,810 | | | | 508,825 | |
| FPT Corp. | | | 377,250 | | | | 770,473 | |
| Lix Detergent JSC | | | 379,010 | | | | 809,897 | |
| Nui Nho Stone JSC | | | 359,200 | | | | 1,254,006 | |
| | |
| See Notes to Financial Statements. | |
| 30 | 1.855.377.7325 | www.GrandeurPeakGlobal.com |
| Grandeur Peak Emerging Markets Opportunities Fund | Portfolio of Investments |
| | | Shares | | | Value (Note 2) | |
| United States (continued) | | | | | | |
| Vietnam Dairy Products JSC | | | 541,136 | | | $ | 3,521,363 | |
| | | | | | | | 6,864,564 | |
| | | | | | | | | |
TOTAL COMMON STOCKS (Cost $340,871,129) | | | | | | | 394,124,807 | |
| | | | | | | | | |
TOTAL INVESTMENTS (94.52%) (Cost $340,871,129) | | | | | | $ | 394,124,807 | |
| | | | | | | | | |
| Other Assets In Excess Of Liabilities (5.48%) | | | | 22,840,627 | |
| | | | | | | | | |
| NET ASSETS (100.00%) | | | | | | $ | 416,965,434 | |
(a) | Non-Income Producing Security. |
(b) | Security was purchased pursuant to Regulation S under the Securities Act of 1933, which exempts securities offered and sold outside of the United States from registration. Such security cannot be sold in the United States without either an effective registration statement filed pursuant to the Securities Act of 1933, or pursuant to an exemption from registration. The security has been deemed liquid under guidelines approved by the Fund's Board of Trustees. As of April 30, 2017, the aggregate market value of those securities was $17,643,690, representing 4.23% of net assets. |
(c) | Security exempt from registration under Rule 144A of the Securities Act of 1933. These securities may be resold in the ordinary course of business in transactions exempt from registration, normally to qualified institutional buyers. As of April 30, 2017, these securities had a total aggregate market value of $13,592,770 representing 3.26% of net assets. |
(d) | Fair valued security under the procedures approved by the Fund's Board of Trustees. |
For Fund compliance purposes, the Fund's geographical classifications refer to any one or more of the country sub-classifications used by one or more widely recognized market indexes or ratings group indexes, and/or as defined by Fund management. This definition may not apply for purposes of this report, which may combine sub-classifications for reporting ease. Geographical regions are shown as a percentage of net assets.
| See Notes to Financial Statements. | |
| Annual Report | April 30, 2017 | 31 |
| Grandeur Peak Global Micro Cap Fund | Portfolio of Investments |
| | | Shares | | | Value (Note 2) | |
| COMMON STOCKS (97.60%) | | | | | | |
| Australia (4.63%) | | | | | | |
| Beacon Lighting Group, Ltd. | | | 79,100 | | | $ | 106,614 | |
| Blue Sky Alternative Investments, Ltd. | | | 45,500 | | | | 272,563 | |
| CTI Logistics, Ltd. | | | 158,141 | | | | 85,259 | |
| Fiducian Group, Ltd. | | | 39,615 | | | | 124,588 | |
| Greencross, Ltd. | | | 46,500 | | | | 236,771 | |
| Lycopodium, Ltd. | | | 109,426 | | | | 263,841 | |
| Medical Developments International, Ltd. | | | 15,057 | | | | 55,810 | |
Mitula Group, Ltd.(a) | | | 275,952 | | | | 190,102 | |
| Monash IVF Group, Ltd. | | | 79,900 | | | | 119,060 | |
| National Storage REIT | | | 154,000 | | | | 171,820 | |
| Reject Shop, Ltd. | | | 21,835 | | | | 69,488 | |
| | | | | | | | 1,695,916 | |
| | | | | | | | | |
| Brazil (0.72%) | | | | | | | | |
| FPC Par Corretora de | | | | | | | | |
| Seguros SA | | | 44,700 | | | | 264,900 | |
| | | | | | | | | |
| Britain (9.54%) | | | | | | | | |
| AB Dynamics PLC | | | 25,374 | | | | 192,585 | |
| Arrow Global Group PLC | | | 45,919 | | | | 217,825 | |
| Bioventix PLC | | | 7,799 | | | | 180,560 | |
| City of London Investment Group PLC | | | 18,777 | | | | 90,835 | |
| Clinigen Group PLC | | | 18,900 | | | | 214,194 | |
| dotdigital group PLC | | | 187,400 | | | | 162,623 | |
| IDOX PLC | | | 92,000 | | | | 84,900 | |
LoopUp Group PLC(a) | | | 17,000 | | | | 34,018 | |
| Morses Club PLC | | | 64,438 | | | | 111,002 | |
Motorpoint Group PLC(b) | | | 36,651 | | | | 77,258 | |
On the Beach Group PLC(b)(c) | | | 51,200 | | | | 222,484 | |
Oxford Immunotec Global PLC(a) | | | 25,394 | | | | 390,814 | |
| Premier Asset Management Group PLC | | | 114,000 | | | | 208,929 | |
| Premier Technical Services Group PLC | | | 178,100 | | | | 268,737 | |
| River & Mercantile Group PLC | | | 61,300 | | | | 219,728 | |
| S&U PLC | | | 3,000 | | | | 79,888 | |
| Sanne Group PLC | | | 45,337 | | | | 382,564 | |
| Softcat PLC | | | 46,500 | | | | 248,135 | |
| Tracsis PLC | | | 19,300 | | | | 106,864 | |
| | | | | | | | 3,493,943 | |
| | | | | | | | | |
| Canada (1.73%) | | | | | | | | |
Biosyent, Inc.(a) | | | 41,993 | | | | 239,336 | |
Cipher Pharmaceuticals, Inc.(a) | | | 55,300 | | | | 180,275 | |
DIRTT Environmental Solutions(a) | | | 24,500 | | | | 118,816 | |
| | | Shares | | | Value (Note 2) | |
| Canada (continued) | | | | | | |
| Sandvine Corp. | | | 41,200 | | | $ | 95,979 | |
| | | | | | | | 634,406 | |
| | | | | | | | | |
| China (3.83%) | | | | | | | | |
BBI Life Sciences Corp.(b) | | | 1,555,000 | | | | 363,843 | |
| BrightKing Holdings, Ltd. | | | 60,332 | | | | 149,375 | |
| Essex Bio‐technology, Ltd. | | | 220,000 | | | | 121,054 | |
O2Micro International, Ltd., ADR(a) | | | 92,225 | | | | 228,718 | |
| On‐Bright Electronics, Inc. | | | 48,600 | | | | 306,055 | |
Xiabuxiabu Catering Management China Holdings Co., Ltd.(b)(c) | | | 274,500 | | | | 233,622 | |
| | | | | | | | 1,402,667 | |
| | | | | | | | | |
| Colombia (1.48%) | | | | | | | | |
Amerisur Resources PLC(a) | | | 771,600 | | | | 242,349 | |
| Bolsa de Valores de Colombia | | | 20,370,422 | | | | 166,176 | |
Gran Tierra Energy, Inc.(a) | | | 52,375 | | | | 131,985 | |
| | | | | | | | 540,510 | |
| | | | | | | | | |
| France (2.81%) | | | | | | | | |
| Esker SA | | | 4,200 | | | | 217,224 | |
| Infotel SA | | | 3,700 | | | | 177,338 | |
Medicrea International(a) | | | 16,100 | | | | 99,264 | |
MGI Digital Graphic Technology(a) | | | 2,000 | | | | 91,414 | |
| Neurones | | | 4,800 | | | | 130,716 | |
| Tessi SA | | | 850 | | | | 135,367 | |
| Thermador Groupe | | | 714 | | | | 71,857 | |
| Wavestone | | | 1,157 | | | | 103,977 | |
| | | | | | | | 1,027,157 | |
| | | | | | | | | |
| Georgia (1.22%) | | | | | | | | |
Georgia Healthcare Group PLC(a)(b)(c) | | | 40,300 | | | | 185,298 | |
TBC Bank Group PLC(a) | | | 12,500 | | | | 263,088 | |
| | | | | | | | 448,386 | |
| | | | | | | | | |
| Germany (1.26%) | | | | | | | | |
| Nexus AG | | | 6,200 | | | | 149,256 | |
publity AG(a) | | | 6,900 | | | | 313,048 | |
| | | | | | | | 462,304 | |
| | | | | | | | | |
| Greece (0.92%) | | | | | | | | |
| Sarantis SA | | | 26,700 | | | | 336,215 | |
| | | | | | | | | |
| Greenland (0.37%) | | | | | | | | |
| GronlandsBANKEN A/S | | | 1,552 | | | | 136,375 | |
| See Notes to Financial Statements. | |
| 32 | 1.855.377.7325 | www.GrandeurPeakGlobal.com |
| Grandeur Peak Global Micro Cap Fund | Portfolio of Investments |
| | | Shares | | | Value (Note 2) | |
| Hong Kong (1.40%) | | | | | | |
| International Housewares Retail Co., Ltd. | | | 1,210,000 | | | $ | 273,786 | |
| TK Group Holdings, Ltd. | | | 718,000 | | | | 239,999 | |
| | | | | | | | 513,785 | |
| | | | | | | | | |
| India (9.65%) | | | | | | | | |
| The Byke Hospitality, Ltd. | | | 196,779 | | | | 654,452 | |
| City Union Bank, Ltd. | | | 117,500 | | | | 301,010 | |
| Cyient, Ltd. | | | 23,640 | | | | 201,251 | |
Eros International Media, Ltd.(a) | | | 30,500 | | | | 102,575 | |
| Essel Propack, Ltd. | | | 31,522 | | | | 125,784 | |
| Igarashi Motors India, Ltd. | | | 18,000 | | | | 226,826 | |
Kellton Tech Solutions, Ltd.(a) | | | 49,232 | | | | 90,229 | |
| Kovai Medical Center and Hospital | | | 21,967 | | | | 414,890 | |
| KPIT Technologies, Ltd. | | | 36,000 | | | | 71,854 | |
| Kwality, Ltd. | | | 41,500 | | | | 97,509 | |
| MBL Infrastructures, Ltd. | | | 54,500 | | | | 34,947 | |
| Mold‐Tek Packaging, Ltd. | | | 30,926 | | | | 132,444 | |
| MT Educare, Ltd. | | | 30,000 | | | | 37,587 | |
| Persistent Systems, Ltd. | | | 10,500 | | | | 95,598 | |
| Poly Medicure, Ltd. | | | 25,146 | | | | 108,570 | |
| Somany Ceramics, Ltd. | | | 13,033 | | | | 149,496 | |
Tata Investment Corp., Ltd.(a) | | | 2,045 | | | | 21,385 | |
| Time Technoplast, Ltd. | | | 278,015 | | | | 491,161 | |
Vaibhav Global, Ltd.(a) | | | 1,792 | | | | 13,115 | |
| Vesuvius India, Ltd. | | | 8,570 | | | | 164,180 | |
| | | | | | | | 3,534,863 | |
| | | | | | | | | |
| Indonesia (4.02%) | | | | | | | | |
| Arwana Citramulia Tbk PT | | | 7,920,100 | | | | 323,839 | |
| Astra Graphia Tbk PT | | | 1,179,700 | | | | 167,719 | |
| Bekasi Fajar Industrial Estate Tbk PT | | | 2,910,700 | | | | 64,639 | |
| BFI Finance Indonesia Tbk PT | | | 746,000 | | | | 296,631 | |
| Hexindo Adiperkasa Tbk PT | | | 634,500 | | | | 209,453 | |
Lippo Cikarang Tbk PT(a) | | | 102,300 | | | | 34,384 | |
| Panin Sekuritas Tbk PT | | | 272,700 | | | | 71,812 | |
| Selamat Sempurna Tbk PT | | | 2,450,400 | | | | 224,285 | |
| Surya Toto Indonesia Tbk PT | | | 2,358,300 | | | | 78,911 | |
| | | | | | | | 1,471,673 | |
| | | | | | | | |
| Ireland (1.07%) | | | | | | | | |
| Irish Residential Properties PLC, REIT | | | 275,700 | | | | 393,419 | |
| | | | | | | | | |
| Italy (0.45%) | | | | | | | | |
Banca Sistema SpA(b)(c) | | | 60,510 | | | | 164,784 | |
| | | Shares | | | Value (Note 2) | |
| Japan (11.05%) | | | | | | |
| AIT Corp. | | | 18,900 | | | $ | 172,936 | |
| Amiyaki Tei Co., Ltd. | | | 6,100 | | | | 228,733 | |
| Anest Iwata Corp. | | | 13,900 | | | | 122,198 | |
| Anshin Guarantor Service Co., Ltd. | | | 11,700 | | | | 64,128 | |
| ARCLAND SERVICE Co., Ltd. | | | 4,000 | | | | 110,339 | |
| Central Automotive Products, Ltd. | | | 16,500 | | | | 170,957 | |
| Encourage Technologies Co., Ltd. | | | 4,000 | | | | 68,428 | |
| Future Corp. | | | 22,700 | | | | 176,142 | |
| GCA Corp. | | | 25,400 | | | | 205,296 | |
| Hard Off Corp. Co., Ltd. | | | 44,400 | | | | 422,591 | |
| Interworks, Inc. | | | 10,900 | | | | 107,264 | |
M&A Capital Partners Co., Ltd.(a) | | | 14,200 | | | | 638,188 | |
| Monogatari Corp. | | | 1,300 | | | | 58,426 | |
| Naigai Trans Line, Ltd. | | | 10,800 | | | | 108,509 | |
| Prestige International, Inc. | | | 44,000 | | | | 395,102 | |
| Quick Co., Ltd. | | | 15,300 | | | | 171,838 | |
Synchro Food Co., Ltd.(a) | | | 1,300 | | | | 14,356 | |
| Syuppin Co., Ltd. | | | 43,700 | | | | 675,836 | |
| Trancom Co., Ltd. | | | 2,700 | | | | 135,636 | |
| | | | | | | | 4,046,903 | |
| | | | | | | | | |
| Malaysia (1.14%) | | | | | | | | |
| AEON Credit Service M Bhd | | | 52,800 | | | | 198,745 | |
| Berjaya Food Bhd | | | 201,300 | | | | 80,687 | |
| Scicom MSC Bhd | | | 251,600 | | | | 139,102 | |
| | | | | | | | 418,534 | |
| | | | | | | | | |
| Mexico (0.41%) | | | | | | | | |
| Credito Real SAB de CV SOFOM ER | | | 107,930 | | | | 151,358 | |
| | | | | | | | | |
| Netherlands (0.26%) | | | | | | | | |
Shop Apotheke Europe NV(a)(c) | | | 3,100 | | | | 95,581 | |
| | | | | | | | | |
| New Zealand (2.59%) | | | | | | | | |
| CBL Corp., Ltd. | | | 159,993 | | | | 382,282 | |
| Restaurant Brands New Zealand, Ltd. | | | 54,264 | | | | 198,211 | |
| Trilogy International, Ltd. | | | 204,522 | | | | 369,318 | |
| | | | | | | | 949,811 | |
| | | | | | | | | |
| Norway (2.99%) | | | | | | | | |
| Medistim ASA | | | 25,862 | | | | 222,896 | |
Multiconsult ASA(b)(c) | | | 19,400 | | | | 208,438 | |
Nordic Semiconductor ASA(a) | | | 29,100 | | | | 116,590 | |
| | |
| See Notes to Financial Statements. | |
| Annual Report | April 30, 2017 | 33 |
| Grandeur Peak Global Micro Cap Fund | Portfolio of Investments |
| | | Shares | | | Value (Note 2) | |
| Norway (continued) | | | | | | |
Skandiabanken ASA(a)(b)(c) | | | 61,100 | | | $ | 546,171 | |
| | | | | | | | 1,094,095 | |
| | | | | | | | | |
| Oman (0.36%) | | | | | | | | |
| Tethys Oil AB | | | 16,900 | | | | 130,223 | |
| | | | | | | | | |
| Pakistan (0.44%) | | | | | | | | |
| Kohinoor Textile Mills, Ltd. | | | 150,000 | | | | 161,806 | |
| | | | | | | | | |
| Philippines (1.38%) | | | | | | | | |
| Concepcion Industrial Corp. | | | 165,900 | | | | 245,870 | |
| Metro Retail Stores Group, Inc. | | | 1,105,000 | | | | 80,722 | |
| Pepsi‐Cola Products Philippines, Inc. | | | 1,166,000 | | | | 86,344 | |
Pryce Corp.(a) | | | 831,000 | | | | 91,474 | |
| | | | | | | | 504,410 | |
| | | | | | | | | |
| Poland (1.06%) | | | | | | | | |
| LiveChat Software SA | | | 13,800 | | | | 198,327 | |
| PGS Software SA | | | 51,047 | | | | 189,229 | |
| | | | | | | | 387,556 | |
| | | | | | | | | |
| Singapore (0.82%) | | | | | | | | |
| CSE Global, Ltd. | | | 171,600 | | | | 63,867 | |
| Riverstone Holdings, Ltd. | | | 372,800 | | | | 236,144 | |
| | | | | | | | 300,011 | |
| | | | | | | | | |
| South Africa (0.96%) | | | | | | | | |
| ARB Holdings, Ltd. | | | 400,143 | | | | 194,326 | |
| Cartrack Holdings, Ltd. | | | 178,400 | | | | 156,190 | |
| | | | | | | | 350,516 | |
| | | | | | | | | |
| South Korea (2.19%) | | | | | | | | |
| Daebongls Co., Ltd. | | | 11,100 | | | | 126,325 | |
| Daewon Pharmaceutical Co., Ltd. | | | 3,450 | | | | 66,247 | |
| Hy‐Lok Corp. | | | 10,550 | | | | 207,681 | |
| ISC Co., Ltd. | | | 12,447 | | | | 222,053 | |
| Koh Young Technology, Inc. | | | 2,010 | | | | 94,856 | |
Vitzrocell Co., Ltd.(d) | | | 9,317 | | | | 83,107 | |
| | | | | | | | 800,269 | |
| | | | | | | | | |
| Sri Lanka (1.02%) | | | | | | | | |
| Royal Ceramics Lanka PLC | | | 267,000 | | | | 222,354 | |
| Sampath Bank PLC | | | 84,605 | | | | 150,791 | |
| | | | | | | | 373,145 | |
| | | | | | | | | |
| Sweden (3.55%) | | | | | | | | |
| Bufab Holding AB | | | 10,821 | | | | 129,806 | |
| HIQ International AB | | | 26,600 | | | | 181,692 | |
Moberg Pharma AB(a) | | | 20,900 | | | | 121,521 | |
| | | Shares | | | Value (Note 2) | |
| Sweden (continued) | | | | | | |
| Odd Molly International AB | | | 37,826 | | | $ | 203,708 | |
Polygiene AB(a) | | | 84,518 | | | | 129,774 | |
SwedenCare AB(a) | | | 43,800 | | | | 122,143 | |
TF Bank AB(a)(b) | | | 11,400 | | | | 121,950 | |
| Vitec Software Group AB, Class B | | | 35,500 | | | | 287,574 | |
| | | | | | | | 1,298,168 | |
| | | | | | | | | |
| Taiwan (5.78%) | | | | | | | | |
| ASPEED Technology, Inc. | | | 10,000 | | | | 194,226 | |
| Dr. Wu Skincare Co., Ltd. | | | 56,100 | | | | 388,615 | |
| I Yuan Precision Ind. Co., Ltd. | | | 29,000 | | | | 122,071 | |
| Materials Analysis Technology, Inc. | | | 48,045 | | | | 165,612 | |
| Sinmag Equipment Corp. | | | 34,000 | | | | 156,640 | |
| Sitronix Technology Corp. | | | 66,000 | | | | 198,190 | |
| Solidwizard Technology Co., Ltd. | | | 36,000 | | | | 108,820 | |
| Sporton International, Inc. | | | 24,239 | | | | 143,405 | |
| Tehmag Foods Corp. | | | 23,000 | | | | 188,293 | |
| TSC Auto ID Technology Co., Ltd. | | | 27,000 | | | | 198,668 | |
| TTFB Co., Ltd. | | | 24,000 | | | | 182,957 | |
| Tung Thih Electronic Co., Ltd. | | | 10,000 | | | | 68,609 | |
| | | | | | | | 2,116,106 | |
| | | | | | | | | |
| Thailand (1.60%) | | | | | | | | |
| Ananda Development PCL | | | 4,112,000 | | | | 587,259 | |
| | | | | | | | | |
| United States (13.30%) | | | | | | | | |
Aratana Therapeutics, Inc.(a) | | | 16,775 | | | | 104,005 | |
| Bank of Marin Bancorp | | | 2,975 | | | | 187,871 | |
| BG Staffing, Inc. | | | 15,025 | | | | 234,390 | |
BioDelivery Sciences International, Inc.(a) | | | 42,375 | | | | 77,334 | |
| Diamond Hill Investment Group, Inc. | | | 800 | | | | 161,720 | |
Entellus Medical, Inc.(a) | | | 13,159 | | | | 187,121 | |
ePlus, Inc.(a) | | | 2,164 | | | | 154,185 | |
| Escalade, Inc. | | | 9,392 | | | | 125,383 | |
| First of Long Island Corp. | | | 10,100 | | | | 274,720 | |
GBGI, Ltd.(a) | | | 192,500 | | | | 354,043 | |
| Hennessy Advisors, Inc. | | | 5,826 | | | | 99,100 | |
| Hingham Institution for Savings | | | 2,715 | | | | 487,315 | |
Inphi Corp.(a) | | | 3,600 | | | | 149,112 | |
K2M Group Holdings, Inc.(a) | | | 5,450 | | | | 120,718 | |
| Kinsale Capital Group, Inc. | | | 5,450 | | | | 197,072 | |
| LeMaitre Vascular, Inc. | | | 8,225 | | | | 244,694 | |
LGI Homes, Inc.(a) | | | 3,600 | | | | 114,588 | |
Malibu Boats, Inc., Class A(a) | | | 4,686 | | | | 107,966 | |
| | |
| See Notes to Financial Statements. | |
| 34 | 1.855.377.7325 | www.GrandeurPeakGlobal.com |
| Grandeur Peak Global Micro Cap Fund | Portfolio of Investments |
| | | Shares | | | Value (Note 2) | |
| United States (continued) | | | | | | |
NV5 Global, Inc.(a) | | | 4,350 | | | $ | 168,345 | |
| Reis, Inc. | | | 4,375 | | | | 82,250 | |
| Seacoast Commerce Banc Holdings | | | 15,325 | | | | 281,137 | |
Sportsman's Warehouse Holdings, Inc.(a) | | | 40,985 | | | | 167,629 | |
STAAR Surgical Co.(a) | | | 15,175 | | | | 157,820 | |
Transcat, Inc.(a) | | | 15,166 | | | | 185,025 | |
Trecora Resources(a) | | | 13,258 | | | | 146,501 | |
TriMas Corp.(a) | | | 5,900 | | | | 135,405 | |
Veracyte, Inc.(a) | | | 19,333 | | | | 163,751 | |
| | | | | | | | 4,869,200 | |
| | | | | | | | | |
| Vietnam (1.60%) | | | | | | | | |
| DHG Pharmaceutical JSC | | | 40,000 | | | | 255,018 | |
| Lix Detergent JSC | | | 78,680 | | | | 168,129 | |
| Traphaco JSC | | | 29,500 | | | | 160,837 | |
| | | | | | | | 583,984 | |
| | | | | | | | | |
TOTAL COMMON STOCKS (Cost $30,316,892) | | | | | | | 35,740,238 | |
| | | | | | | | | |
TOTAL INVESTMENTS (97.60%) (Cost $30,316,892) | | | | | | $ | 35,740,238 | |
| | | | | | | | | |
| Other Assets In Excess Of Liabilities (2.40%) | | | | | | | 879,407 | |
| | | | | | | | | |
| NET ASSETS (100.00%) | | | | | | $ | 36,619,645 | |
(a) | Non-Income Producing Security. |
(b) | Security was purchased pursuant to Regulation S under the Securities Act of 1933, which exempts securities offered and sold outside of the United States from registration. Such security cannot be sold in the United States without either an effective registration statement filed pursuant to the Securities Act of 1933, or pursuant to an exemption from registration. The security has been deemed liquid under guidelines approved by the Fund's Board of Trustees. As of April 30, 2017, the aggregate market value of those securities was $2,123,848, representing 5.80% of net assets. |
(c) | Security exempt from registration under Rule 144A of the Securities Act of 1933. These securities may be resold in the ordinary course of business in transactions exempt from registration, normally to qualified institutional buyers. As of April 30, 2017, these securities had a total aggregate market value of $1,656,378 representing 4.52% of net assets. |
(d) | Fair valued security under the procedures approved by the Fund's Board of Trustees. |
For Fund compliance purposes, the Fund's geographical classifications refer to any one or more of the country sub-classifications used by one or more widely recognized market indexes or ratings group indexes, and/or as defined by Fund management. This definition may not apply for purposes of this report, which may combine sub-classifications for reporting ease. Geographical regions are shown as a percentage of net assets.
| See Notes to Financial Statements. | |
| Annual Report | April 30, 2017 | 35 |
| Grandeur Peak Global Opportunities Fund | Portfolio of Investments |
April 30, 2017
| | | Shares | | | Value
(Note 2) | |
| COMMON STOCKS (99.71%) | | | | | | |
| Argentina (0.59%) | | | | | | |
Globant SA(a) | | | 109,450 | | | $ | 4,147,060 | |
| | | | | | | | | |
| Australia (1.68%) | | | | | | | | |
| Blue Sky Alternative Investments, Ltd. | | | 291,700 | | | | 1,747,401 | |
| CTI Logistics, Ltd. | | | 1,458,977 | | | | 786,587 | |
| Greencross, Ltd. | | | 544,716 | | | | 2,773,608 | |
| Magellan Financial Group, Ltd. | | | 205,364 | | | | 3,626,053 | |
| National Storage REIT | | | 1,561,490 | | | | 1,742,174 | |
| Reject Shop, Ltd. | | | 346,971 | | | | 1,104,201 | |
| | | | | | | | 11,780,024 | |
| | | | | | | | | |
| Austria (1.42%) | | | | | | | | |
| Palfinger AG | | | 243,083 | | | | 9,926,991 | |
| | | | | | | | | |
| Belgium (0.87%) | | | | | | | | |
| Melexis NV | | | 73,093 | | | | 6,091,744 | |
| | | | | | | | | |
| Brazil (0.57%) | | | | | | | | |
| FPC Par Corretora de Seguros SA | | | 440,200 | | | | 2,608,705 | |
| Valid Solucoes e Servicos de Seguranca em Meios de Pagamento e Identificacao SA | | | 190,100 | | | | 1,360,146 | |
| | | | | | | | 3,968,851 | |
| | | | | | | | | |
| Britain (10.53%) | | | | | | | | |
| Abcam PLC | | | 213,853 | | | | 2,373,741 | |
| Alliance Pharma PLC | | | 631,130 | | | | 388,284 | |
| Arrow Global Group PLC | | | 851,517 | | | | 4,039,319 | |
| Ascential PLC | | | 664,100 | | | | 3,034,584 | |
| B&M European Value Retail SA | | | 635,600 | | | | 2,774,284 | |
| Clinigen Group PLC | | | 1,278,776 | | | | 14,492,378 | |
| Close Brothers Group PLC | | | 87,500 | | | | 1,917,545 | |
| Diploma PLC | | | 175,800 | | | | 2,525,152 | |
| EMIS Group PLC | | | 371,617 | | | | 4,519,582 | |
| Intertek Group PLC | | | 52,700 | | | | 2,775,333 | |
Metro Bank PLC(a) | | | 75,800 | | | | 3,464,639 | |
Motorpoint Group PLC(b) | | | 747,358 | | | | 1,575,386 | |
On the Beach Group PLC(b)(c) | | | 608,300 | | | | 2,643,306 | |
Oxford Immunotec Global PLC(a) | | | 246,554 | | | | 3,794,466 | |
| River & Mercantile Group PLC | | | 477,200 | | | | 1,710,508 | |
| RPS Group PLC | | | 1,508,839 | | | | 4,968,680 | |
| Sanne Group PLC | | | 618,914 | | | | 5,222,541 | |
| Secure Trust Bank PLC | | | 100,316 | | | | 3,132,597 | |
| Ted Baker PLC | | | 30,857 | | | | 1,117,050 | |
| | | Shares | | | Value
(Note 2) | |
| Britain (continued) | | | | | | |
| Ultra Electronics Holdings PLC | | | 130,550 | | | $ | 3,537,331 | |
| WS Atkins PLC | | | 130,400 | | | | 3,626,159 | |
| | | | | | | | 73,632,865 | |
| | | | | | | | | |
| Canada (2.47%) | | | | | | | | |
Biosyent, Inc.(a) | | | 238,700 | | | | 1,360,453 | |
Cipher Pharmaceuticals, Inc.(a) | | | 704,800 | | | | 2,297,615 | |
DIRTT Environmental Solutions(a) | | | 177,900 | | | | 862,751 | |
| Richelieu Hardware, Ltd. | | | 197,365 | | | | 4,392,476 | |
Spartan Energy Corp.(a) | | | 1,021,000 | | | | 1,705,344 | |
| Stantec, Inc. | | | 259,512 | | | | 6,659,613 | |
| | | | | | | | 17,278,252 | |
| | | | | | | | | |
| China (6.65%) | | | | | | | | |
BBI Life Sciences Corp.(b) | | | 12,969,000 | | | | 3,034,523 | |
| China Medical System Holdings, Ltd. | | | 3,077,000 | | | | 5,316,665 | |
| CSPC Pharmaceutical Group, Ltd. | | | 2,960,000 | | | | 4,109,869 | |
| Man Wah Holdings, Ltd. | | | 21,337,800 | | | | 17,693,831 | |
O2Micro International, Ltd., ADR(a) | | | 868,986 | | | | 2,155,085 | |
| On‐Bright Electronics, Inc. | | | 761,080 | | | | 4,792,854 | |
| Silergy Corp. | | | 353,852 | | | | 6,403,606 | |
Xiabuxiabu Catering Management China Holdings Co., Ltd.(b)(c) | | | 3,551,000 | | | | 3,022,186 | |
| | | | | | | | 46,528,619 | |
| | | | | | | | | |
| Colombia (0.85%) | | | | | | | | |
Amerisur Resources PLC(a) | | | 3,109,700 | | | | 976,714 | |
Gran Tierra Energy, Inc.(a) | | | 775,950 | | | | 1,955,394 | |
Parex Resources, Inc.(a) | | | 244,100 | | | | 3,031,021 | |
| | | | | | | | 5,963,129 | |
| | | | | | | | | |
| Egypt (0.06%) | | | | | | | | |
Integrated Diagnostics Holdings PLC(b)(c) | | | 131,600 | | | | 396,116 | |
| | | | | | | | | |
| France (1.67%) | | | | | | | | |
| Alten SA | | | 17,853 | | | | 1,512,998 | |
| Bureau Veritas SA | | | 81,100 | | | | 1,878,598 | |
| Esker SA | | | 30,047 | | | | 1,554,030 | |
| Infotel SA | | | 20,320 | | | | 973,922 | |
Medicrea International(a) | | | 150,185 | | | | 925,957 | |
| Neurones | | | 39,608 | | | | 1,078,625 | |
| Tessi SA | | | 8,710 | | | | 1,387,117 | |
| Thermador Groupe | | | 13,432 | | | | 1,351,803 | |
See Notes to Financial Statements.
| 36 | 1.855.377.7325 | www.GrandeurPeakGlobal.com |
| Grandeur Peak Global Opportunities Fund | Portfolio of Investments |
April 30, 2017
| | | Shares | | | Value
(Note 2) | |
| France (continued) | | | | | | |
| Wavestone | | | 11,021 | | | $ | 990,427 | |
| | | | | | | | 11,653,477 | |
| | | | | | | | | |
| Georgia (1.14%) | | | | | | | | |
| BGEO Group PLC | | | 123,000 | | | | 5,735,150 | |
TBC Bank Group PLC(a) | | | 105,500 | | | | 2,220,460 | |
| | | | | | | | 7,955,610 | |
| | | | | | | | | |
| Germany (3.42%) | | | | | | | | |
| Aroundtown Property Holdings PLC | | | 734,200 | | | | 3,814,876 | |
| GRENKE AG | | | 4,400 | | | | 876,625 | |
| Nexus AG | | | 129,290 | | | | 3,112,467 | |
| Norma Group SE | | | 76,768 | | | | 4,118,453 | |
PATRIZIA Immobilien AG(a) | | | 170,194 | | | | 3,357,456 | |
publity AG(a) | | | 83,400 | | | | 3,783,804 | |
| Softing AG | | | 83,442 | | | | 963,470 | |
| Wirecard AG | | | 65,685 | | | | 3,878,763 | |
| | | | | | | | 23,905,914 | |
| | | | | | | | | |
| Hong Kong (1.93%) | | | | | | | | |
| International Housewares Retail Co., Ltd. | | | 12,296,000 | | | | 2,782,204 | |
| Samsonite International SA | | | 834,000 | | | | 3,221,982 | |
| Value Partners Group, Ltd. | | | 5,650,000 | | | | 5,229,901 | |
| Vitasoy International Holdings, Ltd. | | | 1,135,483 | | | | 2,245,171 | |
| | | | | | | | 13,479,258 | |
| | | | | | | | | |
| India (8.38%) | | | | | | | | |
| AIA Engineering, Ltd. | | | 38,400 | | | | 899,562 | |
| Alkem Laboratories, Ltd. | | | 220,631 | | | | 6,761,261 | |
| Bajaj Finance, Ltd. | | | 294,750 | | | | 5,847,349 | |
| The Byke Hospitality, Ltd. | | | 869,500 | | | | 2,891,800 | |
| City Union Bank, Ltd. | | | 1,302,267 | | | | 3,336,136 | |
| Cyient, Ltd. | | | 413,616 | | | | 3,521,169 | |
| Essel Propack, Ltd. | | | 186,695 | | | | 744,981 | |
| Hinduja Global Solutions, Ltd. | | | 212,100 | | | | 1,826,902 | |
| Indiabulls Housing Finance, Ltd. | | | 361,500 | | | | 5,714,712 | |
Kellton Tech Solutions, Ltd.(a) | | | 457,767 | | | | 838,967 | |
| Kovai Medical Center and Hospital | | | 24,501 | | | | 462,750 | |
| KPIT Technologies, Ltd. | | | 645,850 | | | | 1,289,090 | |
| MBL Infrastructures, Ltd. | | | 470,500 | | | | 301,696 | |
| MT Educare, Ltd. | | | 325,189 | | | | 407,434 | |
| Persistent Systems, Ltd. | | | 127,700 | | | | 1,162,659 | |
| Poly Medicure, Ltd. | | | 89,274 | | | | 385,448 | |
Tata Investment Corp., Ltd.(a) | | | 52,597 | | | | 550,008 | |
| Time Technoplast, Ltd. | | | 1,804,205 | | | | 3,187,438 | |
| | | Shares | | | Value
(Note 2) | |
| India (continued) | | | | | | |
Vaibhav Global, Ltd.(a) | | | 158,363 | | | $ | 1,158,982 | |
| Vakrangee, Ltd. | | | 633,000 | | | | 3,366,718 | |
| Vesuvius India, Ltd. | | | 53,365 | | | | 1,022,338 | |
WNS Holdings, Ltd., ADR(a) | | | 169,400 | | | | 5,424,188 | |
| Yes Bank, Ltd. | | | 295,500 | | | | 7,488,557 | |
| | | | | | | | 58,590,145 | |
| | | | | | | | | |
| Indonesia (2.66%) | | | | | | | | |
| Arwana Citramulia Tbk PT | | | 59,516,800 | | | | 2,433,540 | |
| Astra Graphia Tbk PT | | | 8,201,900 | | | | 1,166,074 | |
| Bank Rakyat Indonesia Persero Tbk PT | | | 2,251,000 | | | | 2,178,550 | |
| Delfi, Ltd. | | | 1,572,400 | | | | 2,577,244 | |
| Panin Sekuritas Tbk PT | | | 4,960,800 | | | | 1,306,355 | |
| Selamat Sempurna Tbk PT | | | 59,713,000 | | | | 5,465,516 | |
| Tempo Scan Pacific Tbk PT | | | 15,553,000 | | | | 2,415,388 | |
Ultrajaya Milk Industry & Trading Co. Tbk PT(a) | | | 3,254,500 | | | | 1,025,501 | |
| | | | | | | | 18,568,168 | |
| | | | | | | | | |
| Ireland (0.32%) | | | | | | | | |
| Irish Residential Properties PLC, REIT | | | 1,553,046 | | | | 2,216,171 | |
| | | | | | | | | |
| Israel (0.72%) | | | | | | | | |
Wix.com, Ltd.(a) | | | 61,450 | | | | 5,066,553 | |
| | | | | | | | | |
| Italy (0.41%) | | | | | | | | |
| Brembo SpA | | | 36,540 | | | | 2,871,789 | |
| | | | | | | | | |
| Japan (8.06%) | | | | | | | | |
| AIT Corp. | | | 327,500 | | | | 2,996,636 | |
| Amiyaki Tei Co., Ltd. | | | 66,300 | | | | 2,486,064 | |
| Anest Iwata Corp. | | | 241,000 | | | | 2,118,681 | |
| ARCLAND SERVICE Co., Ltd. | | | 72,200 | | | | 1,991,613 | |
| Century Tokyo Leasing Corp. | | | 42,100 | | | | 1,450,227 | |
| CMIC Holdings Co., Ltd. | | | 9,220 | | | | 119,101 | |
| CyberAgent, Inc. | | | 90,800 | | | | 2,818,282 | |
| eGuarantee, Inc. | | | 63,500 | | | | 1,388,199 | |
| Future Corp. | | | 266,900 | | | | 2,071,034 | |
| GCA Corp. | | | 389,000 | | | | 3,144,104 | |
| Hard Off Corp. Co., Ltd. | | | 264,700 | | | | 2,519,369 | |
| Japan Lifeline Co. Ltd. | | | 99,400 | | | | 1,994,688 | |
M&A Capital Partners Co., Ltd.(a) | | | 90,800 | | | | 4,080,807 | |
Macromill, Inc.(a) | | | 96,100 | | | | 1,684,498 | |
| MISUMI Group, Inc. | | | 136,600 | | | | 2,586,792 | |
| Monogatari Corp. | | | 28,200 | | | | 1,267,387 | |
| Naigai Trans Line, Ltd. | | | 55,300 | | | | 555,605 | |
| Nihon M&A Center, Inc. | | | 125,500 | | | | 4,289,347 | |
| Prestige International, Inc. | | | 555,800 | | | | 4,990,857 | |
| SK Kaken Co., Ltd. | | | 16,000 | | | | 1,521,417 | |
| Suruga Bank, Ltd. | | | 67,500 | | | | 1,410,249 | |
See Notes to Financial Statements.
| Annual Report | April 30, 2017 | 37 |
| Grandeur Peak Global Opportunities Fund | Portfolio of Investments |
April 30, 2017
| | | Shares | | | Value
(Note 2) | |
| Japan (continued) | | | | | | |
Synchro Food Co., Ltd.(a) | | | 13,300 | | | $ | 146,870 | |
| Syuppin Co., Ltd. | | | 197,500 | | | | 3,054,407 | |
| Trancom Co., Ltd. | | | 113,370 | | | | 5,695,196 | |
| | | | | | | | 56,381,430 | |
| | | | | | | | | |
| Luxembourg (0.88%) | | | | | | | | |
| Grand City Properties SA | | | 116,300 | | | | 2,208,764 | |
| L’Occitane International SA | | | 1,897,753 | | | | 3,976,855 | |
| | | | | | | | 6,185,619 | |
| | | | | | | | | |
| Malaysia (0.75%) | | | | | | | | |
| AEON Credit Service M Bhd | | | 559,480 | | | | 2,105,944 | |
| My EG Services Bhd | | | 6,426,600 | | | | 3,153,342 | |
| | | | | | | | 5,259,286 | |
| | | | | | | | | |
| Mexico (0.66%) | | | | | | | | |
| Banregio Grupo Financiero SAB de CV | | | 383,034 | | | | 2,211,700 | |
| Credito Real SAB de CV SOFOM ER | | | 1,688,349 | | | | 2,367,693 | |
| | | | | | | | 4,579,393 | |
| | | | | | | | | |
| Netherlands (0.52%) | | | | | | | | |
| Aalberts Industries NV | | | 90,722 | | | | 3,599,152 | |
| | | | | | | | | |
| New Zealand (1.20%) | | | | | | | | |
| CBL Corp., Ltd. | | | 1,107,672 | | | | 2,646,637 | |
| Restaurant Brands New Zealand, Ltd. | | | 1,021,020 | | | | 3,729,494 | |
| Trilogy International, Ltd. | | | 1,115,098 | | | | 2,013,598 | |
| | | | | | | | 8,389,729 | |
| | | | | | | | | |
| Norway (1.90%) | | | | | | | | |
| Medistim ASA | | | 152,700 | | | | 1,316,073 | |
Multiconsult ASA(b)(c) | | | 113,000 | | | | 1,214,099 | |
Nordic Semiconductor ASA(a) | | | 456,211 | | | | 1,827,819 | |
Norwegian Finans Holding ASA(a) | | | 270,067 | | | | 2,146,759 | |
Skandiabanken ASA(a)(b)(c) | | | 761,300 | | | | 6,805,238 | |
| | | | | | | | 13,309,988 | |
| | | | | | | | | |
| Oman (0.24%) | | | | | | | | |
| Tethys Oil AB | | | 218,000 | | | | 1,679,801 | |
| | | | | | | | | |
| Peru (0.23%) | | | | | | | | |
| Credicorp, Ltd. | | | 10,625 | | | | 1,632,637 | |
| | | | | | | | | |
| Philippines (2.32%) | | | | | | | | |
| Concepcion Industrial Corp. | | | 1,158,460 | | | | 1,716,881 | |
| Metro Retail Stores Group, Inc. | | | 15,321,000 | | | | 1,119,216 | |
| | | Shares | | | Value
(Note 2) | |
| Philippines (continued) | | | | | | |
| Pepsi‐Cola Products Philippines, Inc. | | | 26,716,900 | | | $ | 1,978,436 | |
| Puregold Price Club, Inc. | | | 5,230,000 | | | | 4,364,875 | |
| Robinsons Retail Holdings, Inc. | | | 1,096,000 | | | | 1,741,667 | |
| Security Bank Corp. | | | 1,244,640 | | | | 5,310,863 | |
| | | | | | | | 16,231,938 | |
| | | | | | | | | |
| Poland (0.19%) | | | | | | | | |
| PGS Software SA | | | 58,355 | | | | 216,319 | |
| Wawel SA | | | 3,856 | | | | 1,093,421 | |
| | | | | | | | 1,309,740 | |
| | | | | | | | | |
| Singapore (0.53%) | | | | | | | | |
| CSE Global, Ltd. | | | 3,525,250 | | | | 1,312,049 | |
| Riverstone Holdings, Ltd. | | | 3,729,200 | | | | 2,362,196 | |
| | | | | | | | 3,674,245 | |
| | | | | | | | | |
| South Africa (1.17%) | | | | | | | | |
| Cartrack Holdings, Ltd. | | | 3,982,200 | | | | 3,486,427 | |
| Clicks Group, Ltd. | | | 173,649 | | | | 1,744,189 | |
| EOH Holdings, Ltd. | | | 167,000 | | | | 1,767,629 | |
| Italtile, Ltd. | | | 1,177,166 | | | | 1,183,882 | |
| | | | | | | | 8,182,127 | |
| | | | | | | | | |
| South Korea (1.88%) | | | | | | | | |
| Daewon Pharmaceutical Co., Ltd. | | | 70,135 | | | | 1,346,735 | |
| Hy‐Lok Corp. | | | 242,907 | | | | 4,781,718 | |
| ISC Co., Ltd. | | | 151,308 | | | | 2,699,316 | |
| Koh Young Technology, Inc. | | | 39,781 | | | | 1,877,353 | |
| Loen Entertainment, Inc. | | | 31,500 | | | | 2,433,298 | |
| | | | | | | | 13,138,420 | |
| | | | | | | | | |
| Sweden (2.76%) | | | | | | | | |
| AddTech AB, Class B | | | 182,127 | | | | 3,279,697 | |
| Beijer Alma AB | | | 85,931 | | | | 2,439,981 | |
| Bufab Holding AB | | | 324,110 | | | | 3,887,944 | |
| HIQ International AB | | | 203,792 | | | | 1,392,006 | |
| Indutrade AB | | | 154,800 | | | | 3,657,959 | |
Moberg Pharma AB(a) | | | 255,657 | | | | 1,486,495 | |
| Nibe Industrier AB, Class B | | | 352,000 | | | | 3,119,687 | |
| | | | | | | | 19,263,769 | |
| | | | | | | | | |
| Switzerland (1.30%) | | | | | | | | |
Luxoft Holding, Inc.(a) | | | 44,200 | | | | 2,724,930 | |
| VZ Holding AG | | | 19,175 | | | | 5,333,348 | |
Wizz Air Holdings PLC(a)(b)(c) | | | 43,700 | | | | 998,995 | |
| | | | | | | | 9,057,273 | |
| | | | | | | | | |
| Taiwan (1.84%) | | | | | | | | |
| ASPEED Technology, Inc. | | | 108,237 | | | | 2,102,247 | |
| Cub Elecparts, Inc. | | | 292,473 | | | | 3,063,255 | |
See Notes to Financial Statements.
| 38 | 1.855.377.7325 | www.GrandeurPeakGlobal.com |
| Grandeur Peak Global Opportunities Fund | Portfolio of Investments |
April 30, 2017
| | | Shares | | | Value
(Note 2) | |
| Taiwan (continued) | | | | | | |
| Dr. Wu Skincare Co., Ltd. | | | 139,500 | | | $ | 966,342 | |
| Sinmag Equipment Corp. | | | 330,842 | | | | 1,524,213 | |
| Sporton International, Inc. | | | 725,990 | | | | 4,295,158 | |
| TSC Auto ID Technology Co., Ltd. | | | 125,000 | | | | 919,757 | |
| | | | | | | | 12,870,972 | |
| | | | | | | | | |
| Thailand (0.71%) | | | | | | | | |
| Ananda Development PCL | | | 23,099,000 | | | | 3,298,903 | |
| Premier Marketing PCL | | | 6,383,700 | | | | 1,679,436 | |
| | | | | | | | 4,978,339 | |
| | | | | | | | | |
| United Arab Emirates (0.24%) | | | | | | | | |
| Aramex PJSC | | | 1,162,100 | | | | 1,670,539 | |
| | | | | | | | | |
| United States (25.57%) | | | | | | | | |
| AmTrust Financial Services, Inc. | | | 61,275 | | | | 983,464 | |
Aratana Therapeutics, Inc.(a) | | | 196,550 | | | | 1,218,610 | |
| Bank of the Ozarks, Inc. | | | 56,275 | | | | 2,671,374 | |
| BG Staffing, Inc. | | | 52,149 | | | | 813,524 | |
BioDelivery Sciences International, Inc.(a) | | | 543,200 | | | | 991,340 | |
BofI Holding, Inc.(a) | | | 113,000 | | | | 2,699,570 | |
| Diamond Hill Investment Group, Inc. | | | 18,925 | | | | 3,825,689 | |
Dril‐Quip, Inc.(a) | | | 26,450 | | | | 1,363,497 | |
Entellus Medical, Inc.(a) | | | 128,291 | | | | 1,824,298 | |
EPAM Systems, Inc.(a) | | | 75,850 | | | | 5,840,450 | |
ExlService Holdings, Inc.(a) | | | 56,050 | | | | 2,674,145 | |
| Fastenal Co. | | | 99,200 | | | | 4,432,256 | |
| First Republic Bank | | | 130,600 | | | | 12,075,276 | |
| FirstCash, Inc. | | | 176,713 | | | | 9,180,240 | |
| Genpact, Ltd. | | | 89,025 | | | | 2,173,991 | |
| Gentex Corp. | | | 220,250 | | | | 4,548,162 | |
Hibbett Sports, Inc.(a) | | | 57,750 | | | | 1,501,500 | |
| Hingham Institution for Savings | | | 17,900 | | | | 3,212,871 | |
| Home BancShares, Inc. | | | 173,800 | | | | 4,423,210 | |
| IDEX Corp. | | | 36,450 | | | | 3,818,502 | |
Inphi Corp.(a) | | | 123,600 | | | | 5,119,512 | |
| Kinsale Capital Group, Inc. | | | 51,325 | | | | 1,855,912 | |
| Knight Transportation, Inc. | | | 236,620 | | | | 8,116,066 | |
| LeMaitre Vascular, Inc. | | | 104,033 | | | | 3,094,982 | |
LGI Homes, Inc.(a) | | | 80,351 | | | | 2,557,572 | |
| Littelfuse, Inc. | | | 13,950 | | | | 2,150,393 | |
LKQ Corp.(a) | | | 55,850 | | | | 1,744,754 | |
Malibu Boats, Inc., Class A(a) | | | 75,925 | | | | 1,749,312 | |
| MarketAxess Holdings, Inc. | | | 39,900 | | | | 7,681,548 | |
MEDNAX, Inc.(a) | | | 88,375 | | | | 5,334,315 | |
| Microchip Technology, Inc. | | | 60,045 | | | | 4,538,201 | |
MSC Industrial Direct Co., Inc., Class A | | | 55,725 | | | | 4,989,059 | |
| | | Shares | | | Value
(Note 2) | |
| United States (continued) | | | | | | |
MuleSoft, Inc., Class A(a) | | | 23,500 | | | $ | 541,440 | |
NV5 Global, Inc.(a) | | | 57,800 | | | | 2,236,860 | |
Paycom Software, Inc.(a) | | | 61,800 | | | | 3,723,450 | |
| Power Integrations, Inc. | | | 198,500 | | | | 13,091,075 | |
PRA Group, Inc.(a) | | | 149,525 | | | | 4,814,705 | |
Signature Bank(a) | | | 27,400 | | | | 3,793,530 | |
Silicon Laboratories, Inc.(a) | | | 75,140 | | | | 5,346,211 | |
Spirit Airlines, Inc.(a) | | | 55,075 | | | | 3,154,145 | |
Sportsman’s Warehouse Holdings, Inc.(a) | | | 776,200 | | | | 3,174,658 | |
Sprouts Farmers Market, Inc.(a) | | | 175,350 | | | | 3,912,059 | |
STAAR Surgical Co.(a) | | | 255,420 | | | | 2,656,368 | |
SVB Financial Group(a) | | | 18,775 | | | | 3,303,274 | |
TriMas Corp.(a) | | | 145,225 | | | | 3,332,914 | |
| Universal Logistics Holdings, Inc. | | | 274,107 | | | | 3,823,793 | |
Veracyte, Inc.(a) | | | 147,402 | | | | 1,248,495 | |
Virtusa Corp.(a) | | | 47,425 | | | | 1,469,227 | |
| | | | | | | | 178,825,799 | |
| | | | | | | | | |
| Vietnam (0.42%) | | | | | | | | |
| DHG Pharmaceutical JSC | | | 99,020 | | | | 631,297 | |
| Vietnam Dairy Products JSC | | | 358,800 | | | | 2,334,838 | |
| | | | | | | | 2,966,135 | |
| | | | | | | | | |
TOTAL COMMON STOCKS
(Cost $530,323,879) | | | | | | | 697,207,067 | |
| | | | | | | | | |
TOTAL INVESTMENTS (99.71%)
(Cost $530,323,879) | | | | | | $ | 697,207,067 | |
| | | | | | | | | |
| Other Assets In Excess Of Liabilities (0.29%) | | | | 2,022,210 | |
| | | | | | | | | |
| NET ASSETS (100.00%) | | | | | | $ | 699,229,277 | |
| (a) | Non-Income Producing Security. |
| (b) | Security was purchased pursuant to Regulation S under the Securities Act of 1933, which exempts securities offered and sold outside of the United States from registration. Such security cannot be sold in the United States without either an effective registration statement filed pursuant to the Securities Act of 1933, or pursuant to an exemption from registration. The security has been deemed liquid under guidelines approved by the Fund’s Board of Trustees. As of April 30, 2017, the aggregate market value of those securities was $19,689,849, representing 2.81% of net assets. |
| (c) | Security exempt from registration under Rule 144A of the Securities Act of 1933. These securities may be resold in the ordinary course of business in transactions exempt from registration, normally to qualified institutional buyers. As of April 30, 2017, these securities had a total aggregate market value of $15,079,940 representing 2.16% of net assets. |
See Notes to Financial Statements.
| Annual Report | April 30, 2017 | 39 |
| Grandeur Peak Global Opportunities Fund | Portfolio of Investments |
April 30, 2017
For Fund compliance purposes, the Fund’s geographical classifications refer to any one or more of the country sub-classifications used by one or more widely recognized market indexes or ratings group indexes, and/or as defined by Fund management. This definition may not apply for purposes of this report, which may combine sub-classifications for reporting ease. Geographical regions are shown as a percentage of net assets.
See Notes to Financial Statements.
| 40 | 1.855.377.7325 | www.GrandeurPeakGlobal.com |
| Grandeur Peak Global Reach Fund | Portfolio of Investments |
April 30, 2017
| | | Shares | | | Value
(Note 2) | |
| COMMON STOCKS (96.61%) | | | | | | |
| Argentina (0.48%) | | | | | | |
Globant SA(a) | | | 41,163 | | | $ | 1,559,666 | |
| | | | | | | | | |
| Australia (1.40%) | | | | | | | | |
| Beacon Lighting Group, Ltd. | | | 477,900 | | | | 644,133 | |
| Blue Sky Alternative Investments, Ltd. | | | 108,000 | | | | 646,963 | |
| CTI Logistics, Ltd. | | | 323,146 | | | | 174,220 | |
| Greencross, Ltd. | | | 196,400 | | | | 1,000,038 | |
Mitula Group, Ltd.(a) | | | 984,973 | | | | 678,544 | |
| Monash IVF Group, Ltd. | | | 206,100 | | | | 307,112 | |
| National Storage REIT | | | 420,789 | | | | 469,480 | |
| Reject Shop, Ltd. | | | 204,953 | | | | 652,243 | |
| | | | | | | | 4,572,733 | |
| | | | | | | | | |
| Austria (0.48%) | | | | | | | | |
| Palfinger AG | | | 38,148 | | | | 1,557,883 | |
| | | | | | | | | |
| Bangladesh (0.10%) | | | | | | | | |
| Square Pharmaceuticals, Ltd. | | | 96,918 | | | | 330,072 | |
| | | | | | | | | |
| Belgium (0.29%) | | | | | | | | |
| Melexis NV | | | 11,185 | | | | 932,184 | |
| | | | | | | | | |
| Brazil (0.16%) | | | | | | | | |
| FPC Par Corretora de Seguros SA | | | 53,600 | | | | 317,643 | |
| Valid Solucoes e Servicos de Seguranca em Meios de Pagamento e Identificacao SA | | | 30,100 | | | | 215,363 | |
| | | | | | | | 533,006 | |
| | | | | | | | | |
| Britain (9.72%) | | | | | | | | |
| AB Dynamics PLC | | | 103,406 | | | | 784,839 | |
| Abcam PLC | | | 66,289 | | | | 735,799 | |
| Arrow Global Group PLC | | | 235,351 | | | | 1,116,428 | |
| Ascential PLC | | | 414,900 | | | | 1,895,873 | |
| B&M European Value Retail SA | | | 241,600 | | | | 1,054,542 | |
| Bioventix PLC | | | 15,800 | | | | 365,797 | |
| Burford Capital, Ltd. | | | 51,500 | | | | 520,282 | |
| Clinigen Group PLC | | | 327,730 | | | | 3,714,167 | |
| Close Brothers Group PLC | | | 45,319 | | | | 993,157 | |
| Diploma PLC | | | 68,800 | | | | 988,228 | |
| dotdigital group PLC | | | 1,335,656 | | | | 1,159,062 | |
| EMIS Group PLC | | | 53,596 | | | | 651,831 | |
| Exova Group PLC | | | 128,000 | | | | 395,399 | |
Horizon Discovery Group PLC(a) | | | 155,300 | | | | 416,369 | |
| IDOX PLC | | | 550,000 | | | | 507,557 | |
| Intertek Group PLC | | | 17,900 | | | | 942,665 | |
| | | Shares | | | Value
(Note 2) | |
| Britain (continued) | | | | | | |
Metro Bank PLC(a) | | | 65,000 | | | $ | 2,970,997 | |
| Morses Club PLC | | | 428,000 | | | | 737,280 | |
Motorpoint Group PLC(b) | | | 172,653 | | | | 363,942 | |
On the Beach Group PLC(b)(c) | | | 327,200 | | | | 1,421,815 | |
Oxford Immunotec Global PLC(a) | | | 68,850 | | | | 1,059,601 | |
| Premier Technical Services Group PLC | | | 609,600 | | | | 919,831 | |
Purplebricks Group PLC(a) | | | 154,100 | | | | 589,291 | |
| River & Mercantile Group PLC | | | 84,200 | | | | 301,812 | |
| RPS Group PLC | | | 147,899 | | | | 487,038 | |
| S&U PLC | | | 18,000 | | | | 479,328 | |
| Sanne Group PLC | | | 292,973 | | | | 2,472,175 | |
| Secure Trust Bank PLC | | | 24,000 | | | | 749,455 | |
| Softcat PLC | | | 169,365 | | | | 903,770 | |
| Topps Tiles PLC | | | 430,895 | | | | 579,024 | |
| Ultra Electronics Holdings PLC | | | 29,650 | | | | 803,385 | |
WANdisco PLC(a) | | | 100,245 | | | | 631,010 | |
| | | | | | | | 31,711,749 | |
| | | | | | | | | |
| Canada (2.33%) | | | | | | | | |
Biosyent, Inc.(a) | | | 113,100 | | | | 644,605 | |
| Birchcliff Energy, Ltd. | | | 93,200 | | | | 478,614 | |
Cipher Pharmaceuticals, Inc.(a) | | | 205,100 | | | | 668,617 | |
DIRTT Environmental Solutions(a) | | | 234,400 | | | | 1,136,755 | |
| Equitable Group, Inc. | | | 7,000 | | | | 187,121 | |
| Ritchie Bros. Auctioneers, Inc. | | | 31,950 | | | | 1,046,682 | |
| Sandvine Corp. | | | 182,900 | | | | 426,081 | |
Spartan Energy Corp.(a) | | | 480,300 | | | | 802,230 | |
| Stantec, Inc. | | | 54,120 | | | | 1,388,831 | |
| TFI International, Inc. | | | 37,196 | | | | 809,835 | |
| | | | | | | | 7,589,371 | |
| | | | | | | | | |
| China (6.63%) | | | | | | | | |
BBI Life Sciences Corp.(b) | | | 6,405,500 | | | | 1,498,777 | |
| BrightKing Holdings, Ltd. | | | 295,312 | | | | 731,159 | |
| China Medical System Holdings, Ltd. | | | 1,860,000 | | | | 3,213,843 | |
| CSPC Pharmaceutical Group, Ltd. | | | 1,004,000 | | | | 1,394,023 | |
| Essex Bio‐technology, Ltd. | | | 1,321,000 | | | | 726,874 | |
Lida Holdings, Ltd.(a) | | | 220,000 | | | | 743,761 | |
| Man Wah Holdings, Ltd. | | | 7,861,800 | | | | 6,519,199 | |
O2Micro International, Ltd., ADR(a) | | | 292,039 | | | | 724,257 | |
| On‐Bright Electronics, Inc. | | | 206,400 | | | | 1,299,791 | |
See Notes to Financial Statements.
| Annual Report | April 30, 2017 | 41 |
| Grandeur Peak Global Reach Fund | Portfolio of Investments |
April 30, 2017
| | | Shares | | | Value
(Note 2) | |
| China (continued) | | | | | | |
Shanghai Haohai Biological Technology Co., Ltd., Class H(b)(c) | | | 171,700 | | | $ | 946,978 | |
| Silergy Corp. | | | 124,925 | | | | 2,260,749 | |
Xiabuxiabu Catering Management China Holdings Co., Ltd.(b)(c) | | | 1,831,000 | | | | 1,558,328 | |
| | | | | | | | 21,617,739 | |
| | | | | | | | | |
| Colombia (1.03%) | | | | | | | | |
Amerisur Resources PLC(a) | | | 3,286,500 | | | | 1,032,244 | |
Gran Tierra Energy, Inc.(a) | | | 386,195 | | | | 973,212 | |
Parex Resources, Inc.(a) | | | 108,361 | | | | 1,345,532 | |
| | | | | | | | 3,350,988 | |
| | | | | | | | | |
| Egypt (0.19%) | | | | | | | | |
Integrated Diagnostics Holdings PLC(b)(c) | | | 201,400 | | | | 606,214 | |
| | | | | | | | | |
| Eqypt (0.21%) | | | | | | | | |
| Commercial International Bank Egypt SAE | | | 164,610 | | | | 673,943 | |
| | | | | | | | | |
| Finland (0.49%) | | | | | | | | |
Ferratum OYJ(b) | | | 33,400 | | | | 714,919 | |
| Metso OYJ | | | 24,600 | | | | 882,418 | |
| | | | | | | | 1,597,337 | |
| | | | | | | | | |
| France (1.52%) | | | | | | | | |
| Alten SA | | | 10,400 | | | | 881,374 | |
| Esker SA | | | 24,409 | | | | 1,262,433 | |
| Infotel SA | | | 19,060 | | | | 913,531 | |
Medicrea International(a) | | | 86,569 | | | | 533,736 | |
| Neurones | | | 17,282 | | | | 470,632 | |
| Thermador Groupe | | | 4,167 | | | | 419,369 | |
| Wavestone | | | 5,269 | | | | 473,511 | |
| | | | | | | | 4,954,586 | |
| | | | | | | | | |
| Georgia (1.10%) | | | | | | | | |
| BGEO Group PLC | | | 33,200 | | | | 1,548,024 | |
Georgia Healthcare Group PLC(a)(b)(c) | | | 124,748 | | | | 573,587 | |
TBC Bank Group PLC(a) | | | 69,300 | | | | 1,458,558 | |
| | | | | | | | 3,580,169 | |
| | | | | | | | | |
| Germany (2.99%) | | | | | | | | |
| Aroundtown Property Holdings PLC | | | 144,177 | | | | 749,138 | |
| CANCOM SE | | | 11,400 | | | | 674,547 | |
| GRENKE AG | | | 8,600 | | | | 1,713,404 | |
| Nexus AG | | | 42,185 | | | | 1,015,542 | |
| Norma Group SE | | | 42,460 | | | | 2,277,896 | |
PATRIZIA Immobilien AG(a) | | | 38,731 | | | | 764,055 | |
| | | Shares | | | Value
(Note 2) | |
| Germany (continued) | | | | | | |
publity AG(a) | | | 15,300 | | | $ | 694,151 | |
| Wirecard AG | | | 31,496 | | | | 1,859,870 | |
| | | | | | | | 9,748,603 | |
| | | | | | | | | |
| Greece (0.46%) | | | | | | | | |
| Sarantis SA | | | 119,670 | | | | 1,506,922 | |
| | | | | | | | | |
| Hong Kong (1.97%) | | | | | | | | |
| International Housewares Retail Co., Ltd. | | | 8,915,000 | | | | 2,017,189 | |
| Samsonite International SA | | | 361,800 | | | | 1,397,737 | |
| TK Group Holdings, Ltd. | | | 2,093,000 | | | | 699,608 | |
| Value Partners Group, Ltd. | | | 696,000 | | | | 644,250 | |
| Vitasoy International Holdings, Ltd. | | | 847,000 | | | | 1,674,759 | |
| | | | | | | | 6,433,543 | |
| | | | | | | | | |
| India (7.57%) | | | | | | | | |
Advanced Enzyme Technologies, Ltd.(a)(b) | | | 15,000 | | | | 481,455 | |
| AIA Engineering, Ltd. | | | 27,000 | | | | 632,504 | |
| Alkem Laboratories, Ltd. | | | 33,482 | | | | 1,026,060 | |
Avenue Supermarts, Ltd.(a)(b)(c) | | | 876 | | | | 10,029 | |
| Bajaj Finance, Ltd. | | | 71,500 | | | | 1,418,441 | |
| The Byke Hospitality, Ltd. | | | 756,500 | | | | 2,515,983 | |
| City Union Bank, Ltd. | | | 275,400 | | | | 705,517 | |
| Control Print, Ltd. | | | 146,500 | | | | 627,288 | |
| Cyient, Ltd. | | | 181,100 | | | | 1,541,729 | |
| Essel Propack, Ltd. | | | 212,042 | | | | 846,124 | |
| Hinduja Global Solutions, Ltd. | | | 68,789 | | | | 592,507 | |
| Igarashi Motors India, Ltd. | | | 70,087 | | | | 883,196 | |
| Indiabulls Housing Finance, Ltd. | | | 21,000 | | | | 331,975 | |
Inox Wind, Ltd.(a) | | | 194,698 | | | | 594,263 | |
Kellton Tech Solutions, Ltd.(a) | | | 222,481 | | | | 407,749 | |
| Kovai Medical Center and Hospital | | | 18,322 | | | | 346,047 | |
| Kwality, Ltd. | | | 180,814 | | | | 424,841 | |
L&T Technology Services, Ltd.(b)(c) | | | 78,000 | | | | 931,502 | |
| MBL Infrastructures, Ltd. | | | 329,406 | | | | 211,223 | |
| Mold‐Tek Packaging, Ltd. | | | 61,473 | | | | 263,265 | |
| MT Educare, Ltd. | | | 224,917 | | | | 281,802 | |
| Persistent Systems, Ltd. | | | 25,132 | | | | 228,817 | |
| Poly Medicure, Ltd. | | | 190,208 | | | | 821,238 | |
| Somany Ceramics, Ltd. | | | 104,500 | | | | 1,198,672 | |
| Time Technoplast, Ltd. | | | 673,285 | | | | 1,189,474 | |
Vaibhav Global, Ltd.(a) | | | 102,142 | | | | 747,528 | |
| Vakrangee, Ltd. | | | 116,000 | | | | 616,966 | |
| Vesuvius India, Ltd. | | | 34,043 | | | | 652,178 | |
See Notes to Financial Statements.
| 42 | 1.855.377.7325 | www.GrandeurPeakGlobal.com |
| Grandeur Peak Global Reach Fund | Portfolio of Investments |
April 30, 2017
| | | Shares | | | Value
(Note 2) | |
| India (continued) | | | | | | |
WNS Holdings, Ltd., ADR(a) | | | 77,225 | | | $ | 2,472,745 | |
| Yes Bank, Ltd. | | | 67,000 | | | | 1,697,913 | |
| | | | | | | | 24,699,031 | |
| | | | | | | | | |
| Indonesia (2.63%) | | | | | | | | |
| Astra Graphia Tbk PT | | | 1,942,500 | | | | 276,168 | |
| Bank Rakyat Indonesia Persero Tbk PT | | | 345,000 | | | | 333,896 | |
| Delfi, Ltd. | | | 1,017,500 | | | | 1,667,734 | |
| Hexindo Adiperkasa Tbk PT | | | 1,406,900 | | | | 464,428 | |
| Indonesia Pondasi Raya Tbk PT | | | 4,594,000 | | | | 430,827 | |
| Panin Sekuritas Tbk PT | | | 2,165,000 | | | | 570,121 | |
| Sarana Menara Nusantara PT | | | 1,302,500 | | | | 379,151 | |
| Selamat Sempurna Tbk PT | | | 29,693,300 | | | | 2,717,820 | |
| Surya Toto Indonesia Tbk PT | | | 12,250,000 | | | | 409,896 | |
| Tempo Scan Pacific Tbk PT | | | 5,739,800 | | | | 891,394 | |
Ultrajaya Milk Industry & Trading Co. Tbk PT(a) | | | 1,368,700 | | | | 431,281 | |
| | | | | | | | 8,572,716 | |
| | | | | | | | | |
| Ireland (0.42%) | | | | | | | | |
| Irish Residential Properties PLC, REIT | | | 962,077 | | | | 1,372,868 | |
| | | | | | | | | |
| Israel (1.96%) | | | | | | | | |
| IDI Insurance Co., Ltd. | | | 6,162 | | | | 328,363 | |
Kornit Digital, Ltd.(a) | | | 74,385 | | | | 1,495,138 | |
Wix.com, Ltd.(a) | | | 55,650 | | | | 4,588,343 | |
| | | | | | | | 6,411,844 | |
| | | | | | | | | |
| Italy (0.83%) | | | | | | | | |
Banca Sistema SpA(b)(c) | | | 134,028 | | | | 364,992 | |
| Brembo SpA | | | 21,750 | | | | 1,709,398 | |
| Telit Communications PLC | | | 133,100 | | | | 640,864 | |
| | | | | | | | 2,715,254 | |
| | | | | | | | | |
| Japan (6.08%) | | | | | | | | |
| AIT Corp. | | | 70,200 | | | | 642,332 | |
| Amiyaki Tei Co., Ltd. | | | 30,200 | | | | 1,132,415 | |
| Anest Iwata Corp. | | | 72,700 | | | | 639,121 | |
| Anshin Guarantor Service Co., Ltd. | | | 110,500 | | | | 605,656 | |
| ARCLAND SERVICE Co., Ltd. | | | 22,800 | | | | 628,930 | |
| CMIC Holdings Co., Ltd. | | | 10,900 | | | | 140,803 | |
| CyberAgent, Inc. | | | 17,000 | | | | 527,652 | |
| Dip Corp. | | | 14,800 | | | | 327,001 | |
| Encourage Technologies Co., Ltd. | | | 23,400 | | | | 400,303 | |
| Future Corp. | | | 77,800 | | | | 603,696 | |
| Hard Off Corp. Co., Ltd. | | | 213,000 | | | | 2,027,298 | |
| Japan Lifeline Co. Ltd. | | | 26,100 | | | | 523,756 | |
| | | Shares | | | Value
(Note 2) | |
| Japan (continued) | | | | | | |
M&A Capital Partners Co., Ltd.(a) | | | 31,100 | | | $ | 1,397,721 | |
Macromill, Inc.(a) | | | 24,600 | | | | 431,203 | |
| MISUMI Group, Inc. | | | 67,800 | | | | 1,283,927 | |
| Nihon M&A Center, Inc. | | | 65,200 | | | | 2,228,410 | |
| Prestige International, Inc. | | | 97,800 | | | | 878,204 | |
| Quick Co., Ltd. | | | 58,700 | | | | 659,273 | |
| Sawai Pharmaceutical Co., Ltd. | | | 16,600 | | | | 906,876 | |
| SK Kaken Co., Ltd. | | | 3,000 | | | | 285,266 | |
Synchro Food Co., Ltd.(a) | | | 4,500 | | | | 49,693 | |
| Syuppin Co., Ltd. | | | 129,400 | | | | 2,001,216 | |
| Trancom Co., Ltd. | | | 9,300 | | | | 467,190 | |
| Trust Tech, Inc. | | | 42,000 | | | | 732,057 | |
| Zenkoku Hosho Co., Ltd. | | | 9,000 | | | | 325,364 | |
| | | | | | | | 19,845,363 | |
| | | | | | | | | |
| Jordan (0.25%) | | | | | | | | |
| Hikma Pharmaceuticals PLC | | | 33,100 | | | | 830,414 | |
| | | | | | | | | |
| Luxembourg (0.47%) | | | | | | | | |
| Grand City Properties SA | | | 34,400 | | | | 653,323 | |
| L’Occitane International SA | | | 419,000 | | | | 878,040 | |
| | | | | | | | 1,531,363 | |
| | | | | | | | | |
| Malaysia (0.61%) | | | | | | | | |
| AEON Credit Service M Bhd | | | 161,600 | | | | 608,280 | |
| Berjaya Food Bhd | | | 1,084,300 | | | | 434,619 | |
| CB Industrial Product Holding Bhd | | | 876,633 | | | | 416,002 | |
| Scicom MSC Bhd | | | 934,000 | | | | 516,379 | |
| | | | | | | | 1,975,280 | |
| | | | | | | | | |
| Mexico (0.44%) | | | | | | | | |
| Banregio Grupo Financiero SAB de CV | | | 161,657 | | | | 933,433 | |
| Unifin Financiera SAB de CV SOFOM ENR | | | 195,650 | | | | 518,297 | |
| | | | | | | | 1,451,730 | |
| | | | | | | | | |
| Netherlands (0.92%) | | | | | | | | |
| Aalberts Industries NV | | | 61,382 | | | | 2,435,166 | |
Shop Apotheke Europe NV(a)(c) | | | 18,700 | | | | 576,571 | |
| | | | | | | | 3,011,737 | |
| | | | | | | | | |
| New Zealand (2.31%) | | | | | | | | |
| CBL Corp., Ltd. | | | 1,590,836 | | | | 3,801,094 | |
| Fisher & Paykel Healthcare Corp., Ltd. | | | 46,872 | | | | 324,076 | |
| Restaurant Brands New Zealand, Ltd. | | | 367,658 | | | | 1,342,949 | |
See Notes to Financial Statements.
| Annual Report | April 30, 2017 | 43 |
| Grandeur Peak Global Reach Fund | Portfolio of Investments |
April 30, 2017
| | | Shares | | | Value
(Note 2) | |
| New Zealand (continued) | | | | | | |
| Trilogy International, Ltd. | | | 1,145,563 | | | $ | 2,068,611 | |
| | | | | | | | 7,536,730 | |
| | | | | | | | | |
| Norway (1.99%) | | | | | | | | |
| Medistim ASA | | | 75,150 | | | | 647,694 | |
Multiconsult ASA(b)(c) | | | 63,000 | | | | 676,887 | |
Nordic Semiconductor ASA(a) | | | 139,000 | | | | 556,907 | |
Norwegian Finans Holding ASA(a) | | | 69,100 | | | | 549,275 | |
Skandiabanken ASA(a)(b)(c) | | | 454,100 | | | | 4,059,186 | |
| | | | | | | | 6,489,949 | |
| | | | | | | | | |
| Oman (0.33%) | | | | | | | | |
| Tethys Oil AB | | | 137,900 | | | | 1,062,590 | |
| | | | | | | | | |
| Pakistan (0.19%) | | | | | | | | |
| Akzo Nobel Pakistan, Ltd. | | | 108,400 | | | | 274,842 | |
| Meezan Bank, Ltd. | | | 466,000 | | | | 355,878 | |
| | | | | | | | 630,720 | |
| | | | | | | | | |
| Peru (0.17%) | | | | | | | | |
| Credicorp, Ltd. | | | 3,700 | | | | 568,542 | |
| | | | | | | | | |
| Philippines (1.95%) | | | | | | | | |
| Concepcion Industrial Corp. | | | 956,600 | | | | 1,417,717 | |
| Holcim Philippines, Inc. | | | 2,549,400 | | | | 785,765 | |
| Metro Retail Stores Group, Inc. | | | 7,129,000 | | | | 520,782 | |
| Pepsi‐Cola Products Philippines, Inc. | | | 13,782,100 | | | | 1,020,590 | |
Pryce Corp.(a) | | | 3,000 | | | | 330 | |
| Puregold Price Club, Inc. | | | 860,700 | | | | 718,327 | |
| Robinsons Land Corp. | | | 616,300 | | | | 316,383 | |
| Security Bank Corp. | | | 369,700 | | | | 1,577,505 | |
| | | | | | | | 6,357,399 | |
| | | | | | | | | |
| Poland (0.54%) | | | | | | | | |
| LiveChat Software SA | | | 50,150 | | | | 720,732 | |
| PGS Software SA | | | 89,487 | | | | 331,724 | |
| Wawel SA | | | 2,541 | | | | 720,535 | |
| | | | | | | | 1,772,991 | |
| | | | | | | | | |
| Russia (0.16%) | | | | | | | | |
MD Medical Group Investments PLC, GDR(b) | | | 14,755 | | | | 153,452 | |
TCS Group Holding PLC, GDR(b) | | | 33,000 | | | | 363,000 | |
| | | | | | | | 516,452 | |
| | | | | | | | | |
| Singapore (0.30%) | | | | | | | | |
| CSE Global, Ltd. | | | 1,303,300 | | | | 485,070 | |
| | | Shares | | | Value
(Note 2) | |
| Singapore (continued) | | | | | | |
| Riverstone Holdings, Ltd. | | | 765,800 | | | $ | 485,083 | |
| | | | | | | | 970,153 | |
| | | | | | | | | |
| South Africa (1.93%) | | | | | | | | |
| ARB Holdings, Ltd. | | | 2,093,266 | | | | 1,016,578 | |
| Blue Label Telecoms, Ltd. | | | 564,502 | | | | 715,567 | |
| Capitec Bank Holdings, Ltd. | | | 4,800 | | | | 273,890 | |
| Cartrack Holdings, Ltd. | | | 1,471,000 | | | | 1,287,865 | |
| Clicks Group, Ltd. | | | 81,600 | | | | 819,618 | |
| Clientele, Ltd. | | | 255,417 | | | | 314,403 | |
| EOH Holdings, Ltd. | | | 58,000 | | | | 613,907 | |
Interwaste Holdings, Ltd.(a) | | | 5,043,434 | | | | 324,561 | |
| Italtile, Ltd. | | | 921,472 | | | | 926,730 | |
| | | | | | | | 6,293,119 | |
| | | | | | | | | |
| South Korea (2.44%) | | | | | | | | |
| Daebongls Co., Ltd. | | | 28,400 | | | | 323,209 | |
| Daewon Pharmaceutical Co., Ltd. | | | 26,500 | | | | 508,854 | |
| Hanssem Co., Ltd. | | | 3,300 | | | | 638,017 | |
| Hy‐Lok Corp. | | | 46,840 | | | | 922,064 | |
| Interpark Holdings Corp. | | | 96,500 | | | | 455,405 | |
| ISC Co., Ltd. | | | 79,830 | | | | 1,424,158 | |
| i‐SENS, Inc. | | | 8,450 | | | | 219,066 | |
| Koh Young Technology, Inc. | | | 14,143 | | | | 667,439 | |
| Loen Entertainment, Inc. | | | 16,000 | | | | 1,235,961 | |
| Mando Corp. | | | 4,500 | | | | 909,570 | |
Vitzrocell Co., Ltd.(d) | | | 73,780 | | | | 658,113 | |
| | | | | | | | 7,961,856 | |
| | | | | | | | | |
Spain (0.00%)(e) | | | | | | | | |
Let’s GOWEX SA(a)(d)(f) | | | 10,700 | | | | 12 | |
| | | | | | | | | |
| Sri Lanka (0.59%) | | | | | | | | |
| Hemas Holdings PLC | | | 1,037,261 | | | | 802,602 | |
| Royal Ceramics Lanka PLC | | | 1,352,145 | | | | 1,126,048 | |
| | | | | | | | 1,928,650 | |
| | | | | | | | | |
| Sweden (2.41%) | | | | | | | | |
| Avanza Bank Holding | | | 7,200 | | | | 289,063 | |
| Bufab Holding AB | | | 74,698 | | | | 896,059 | |
Collector AB(a) | | | 26,800 | | | | 295,767 | |
| HIQ International AB | | | 90,026 | | | | 614,925 | |
Hoist Finance AB(b)(c) | | | 71,100 | | | | 668,271 | |
| Indutrade AB | | | 36,300 | | | | 857,777 | |
Moberg Pharma AB(a) | | | 111,100 | | | | 645,981 | |
Polygiene AB(a) | | | 216,595 | | | | 332,572 | |
| Svenska Handelsbanken AB, Class A | | | 21,600 | | | | 306,540 | |
| Sweco AB, Class B | | | 54,500 | | | | 1,351,840 | |
SwedenCare AB(a) | | | 107,900 | | | | 300,897 | |
TF Bank AB(a)(b) | | | 69,600 | | | | 744,538 | |
See Notes to Financial Statements.
| 44 | 1.855.377.7325 | www.GrandeurPeakGlobal.com |
| Grandeur Peak Global Reach Fund | Portfolio of Investments |
April 30, 2017
| | | | Shares | | | Value
(Note 2) | |
| Sweden (continued) | | | | | | |
| Vitec Software Group AB, Class B | | | 67,500 | | | $ | 546,795 | |
| | | | | | | | 7,851,025 | |
| | | | | | | | | |
| Switzerland (0.90%) | | | | | | | | |
Luxoft Holding, Inc.(a) | | | 21,100 | | | | 1,300,815 | |
| VZ Holding AG | | | 1,550 | | | | 431,118 | |
Wizz Air Holdings PLC(a)(b)(c) | | | 53,400 | | | | 1,220,740 | |
| | | | | | | | 2,952,673 | |
| | | | | | | | | |
| Taiwan (3.62%) | | | | | | | | |
| ASPEED Technology, Inc. | | | 56,771 | | | | 1,102,642 | |
| Bioteque Corp. | | | 82,000 | | | | 261,728 | |
| Cub Elecparts, Inc. | | | 129,944 | | | | 1,360,986 | |
| Dr. Wu Skincare Co., Ltd. | | | 374,000 | | | | 2,590,766 | |
| I Yuan Precision Ind. Co., Ltd. | | | 132,000 | | | | 555,633 | |
| Sinmag Equipment Corp. | | | 169,371 | | | | 780,304 | |
| Sitronix Technology Corp. | | | 312,000 | | | | 936,900 | |
| Sporton International, Inc. | | | 274,346 | | | | 1,623,107 | |
| Test Research, Inc. | | | 488,440 | | | | 649,990 | |
| TSC Auto ID Technology Co., Ltd. | | | 57,600 | | | | 423,824 | |
| TTFB Co., Ltd. | | | 148,000 | | | | 1,128,236 | |
| Tung Thih Electronic Co., Ltd. | | | 59,000 | | | | 404,793 | |
| | | | | | | | 11,818,909 | |
| | | | | | | | | |
| Thailand (0.73%) | | | | | | | | |
| Ananda Development PCL | | | 6,517,100 | | | | 930,745 | |
| Premier Marketing PCL | | | 2,698,100 | | | | 709,821 | |
| Srisawad Power 1979 PCL | | | 570,960 | | | | 730,413 | |
| | | | | | | | 2,370,979 | |
| | | | | | | | | |
| Turkey (0.19%) | | | | | | | | |
| Anadolu Hayat Emeklilik AS | | | 213,300 | | | | 324,879 | |
| AvivaSA Emeklilik ve Hayat AS | | | 53,534 | | | | 296,008 | |
| | | | | | | | 620,887 | |
| | | | | | | | | |
| United States (20.89%) | | | | | | | | |
Acacia Communications, Inc.(a) | | | 8,475 | | | | 388,494 | |
| AmTrust Financial Services, Inc. | | | 26,700 | | | | 428,535 | |
Aratana Therapeutics, Inc.(a) | | | 98,525 | | | | 610,855 | |
Athene Holding, Ltd., Class A(a) | | | 6,075 | | | | 323,858 | |
Axalta Coating Systems, Ltd.(a) | | | 44,125 | | | | 1,384,201 | |
| Bank of the Ozarks, Inc. | | | 38,075 | | | | 1,807,420 | |
| BG Staffing, Inc. | | | 38,025 | | | | 593,190 | |
| | | | Shares | | | Value
(Note 2) | |
| United States (continued) | | | | | | |
BioDelivery Sciences International, Inc.(a) | | | 363,775 | | | $ | 663,889 | |
BofI Holding, Inc.(a) | | | 33,000 | | | | 788,370 | |
Dril‐Quip, Inc.(a) | | | 9,225 | | | | 475,549 | |
Edwards Lifesciences Corp.(a) | | | 6,825 | | | | 748,498 | |
Entellus Medical, Inc.(a) | | | 23,898 | | | | 339,830 | |
EPAM Systems, Inc.(a) | | | 22,550 | | | | 1,736,350 | |
ePlus, Inc.(a) | | | 15,042 | | | | 1,071,742 | |
| Escalade, Inc. | | | 71,167 | | | | 950,079 | |
Etsy, Inc.(a) | | | 62,000 | | | | 667,120 | |
Evolent Health, Inc., Class A(a) | | | 18,075 | | | | 420,244 | |
ExlService Holdings, Inc.(a) | | | 17,325 | | | | 826,576 | |
| Fastenal Co. | | | 33,875 | | | | 1,513,535 | |
| First of Long Island Corp. | | | 23,775 | | | | 646,680 | |
| First Republic Bank | | | 42,350 | | | | 3,915,681 | |
| FirstCash, Inc. | | | 27,575 | | | | 1,432,521 | |
GBGI, Ltd.(a) | | | 692,460 | | | | 1,273,562 | |
| Genpact, Ltd. | | | 23,575 | | | | 575,702 | |
| Gentex Corp. | | | 80,850 | | | | 1,669,552 | |
| Hennessy Advisors, Inc. | | | 6,403 | | | | 108,915 | |
| Hingham Institution for Savings | | | 9,250 | | | | 1,660,282 | |
| Home BancShares, Inc. | | | 37,950 | | | | 965,827 | |
Inphi Corp.(a) | | | 64,275 | | | | 2,662,270 | |
K2M Group Holdings, Inc.(a) | | | 21,800 | | | | 482,870 | |
| Kinsale Capital Group, Inc. | | | 65,975 | | | | 2,385,656 | |
| Knight Transportation, Inc. | | | 32,575 | | | | 1,117,322 | |
| LeMaitre Vascular, Inc. | | | 17,343 | | | | 515,954 | |
LGI Homes, Inc.(a) | | | 21,650 | | | | 689,119 | |
| Littelfuse, Inc. | | | 4,800 | | | | 739,920 | |
| MarketAxess Holdings, Inc. | | | 8,655 | | | | 1,666,261 | |
MEDNAX, Inc.(a) | | | 42,175 | | | | 2,545,683 | |
| Microchip Technology, Inc. | | | 14,250 | | | | 1,077,015 | |
MSC Industrial Direct Co., Inc., Class A | | | 15,650 | | | | 1,401,145 | |
MuleSoft, Inc., Class A(a) | | | 13,500 | | | | 311,040 | |
NV5 Global, Inc.(a) | | | 22,650 | | | | 876,555 | |
NxStage Medical, Inc.(a) | | | 27,250 | | | | 814,503 | |
Palo Alto Networks, Inc.(a) | | | 4,175 | | | | 452,612 | |
Patrick Industries, Inc.(a) | | | 7,625 | | | | 541,756 | |
Paycom Software, Inc.(a) | | | 24,225 | | | | 1,459,556 | |
| Power Integrations, Inc. | | | 31,890 | | | | 2,103,146 | |
PRA Group, Inc.(a) | | | 15,275 | | | | 491,855 | |
Proto Labs, Inc.(a) | | | 27,950 | | | | 1,621,100 | |
Qualys, Inc.(a) | | | 23,825 | | | | 914,880 | |
| Seacoast Commerce Banc Holdings | | | 44,700 | | | | 820,022 | |
| ServisFirst Bancshares, Inc. | | | 17,400 | | | | 657,720 | |
Signature Bank(a) | | | 6,850 | | | | 948,383 | |
Silicon Laboratories, Inc.(a) | | | 20,175 | | | | 1,435,451 | |
Spirit Airlines, Inc.(a) | | | 20,325 | | | | 1,164,013 | |
See Notes to Financial Statements.
| Annual Report | April 30, 2017 | 45 |
| Grandeur Peak Global Reach Fund | Portfolio of Investments |
April 30, 2017
| | | | Shares | | | Value
(Note 2) | |
| United States (continued) | | | | | | |
Sportsman’s Warehouse Holdings, Inc.(a) | | | 219,350 | | | $ | 897,142 | |
Sprouts Farmers Market, Inc.(a) | | | 45,525 | | | | 1,015,663 | |
STAAR Surgical Co.(a) | | | 44,536 | | | | 463,174 | |
SVB Financial Group(a) | | | 9,275 | | | | 1,631,844 | |
Synaptics, Inc.(a) | | | 11,825 | | | | 647,655 | |
Transcat, Inc.(a) | | | 119,952 | | | | 1,463,414 | |
Trecora Resources(a) | | | 43,561 | | | | 481,349 | |
TriMas Corp.(a) | | | 63,025 | | | | 1,446,424 | |
Under Armour, Inc., Class A(a) | | | 35,300 | | | | 758,597 | |
Veracyte, Inc.(a) | | | 116,829 | | | | 989,542 | |
Virtusa Corp.(a) | | | 15,725 | | | | 487,161 | |
| | | | | | | | 68,164,829 | |
| | | | | | | | | |
| Vietnam (1.24%) | | | | | | | | |
| DHG Pharmaceutical JSC | | | 101,666 | | | | 648,166 | |
| Lix Detergent JSC | | | 557,280 | | | | 1,190,837 | |
| Nui Nho Stone JSC | | | 99,930 | | | | 348,867 | |
| Traphaco JSC | | | 78,380 | | | | 427,336 | |
| Vietnam Dairy Products JSC | | | 222,291 | | | | 1,446,526 | |
| | | | | | | | 4,061,732 | |
| | | | | | | | | |
TOTAL COMMON STOCKS
(Cost $258,558,376) | | | | | | | 315,204,505 | |
| | | | | | | | | |
| PREFERRED STOCKS (0.19%) | | | | | | | | |
| Brazil (0.19%) | | | | | | | | |
| Itau Unibanco Holding SA | | | 50,410 | | | | 623,206 | |
| | | | | | | | | |
TOTAL PREFERRED STOCKS
(Cost $314,358) | | | | | | | 623,206 | |
| | | | | | | | | |
TOTAL INVESTMENTS (96.80%)
(Cost $258,872,734) | | | | | | $ | 315,827,711 | |
| | | | | | | | | |
| Other Assets In Excess Of Liabilities (3.20%) | | | | 10,428,708 | |
| | | | | | | | | |
| NET ASSETS (100.00%) | | | | | | $ | 326,256,419 | |
| (a) | Non-Income Producing Security. |
| (b) | Security was purchased pursuant to Regulation S under the Securities Act of 1933, which exempts securities offered and sold outside of the United States from registration. Such security cannot be sold in the United States without either an effective registration statement filed pursuant to the Securities Act of 1933, or pursuant to an exemption from registration. The security has been deemed liquid under guidelines approved by the Fund’s Board of Trustees. As of April 30, 2017, the aggregate market value of those securities was $17,358,612, representing 5.32% of net assets. |
| (c) | Security exempt from registration under Rule 144A of the Securities Act of 1933. These securities may be resold in the ordinary course of business in transactions exempt from registration, normally to qualified institutional buyers. As of April 30, 2017, these securities had a total aggregate market value of $13,615,100 representing 4.17% of net assets. |
| (d) | Fair valued security under the procedures approved by the Fund’s Board of Trustees. |
| (f) | Security determined to be illiquid under the procedures approved by the Fund’s Board of Trustees. |
For Fund compliance purposes, the Fund’s geographical classifications refer to any one or more of the country sub-classifications used by one or more widely recognized market indexes or ratings group indexes, and/or as defined by Fund management. This definition may not apply for purposes of this report, which may combine sub-classifications for reporting ease. Geographical regions are shown as a percentage of net assets.
See Notes to Financial Statements.
| 46 | 1.855.377.7325 | www.GrandeurPeakGlobal.com |
| Grandeur Peak Global Stalwarts Fund | Portfolio of Investments |
| | | Shares | | | Value
(Note 2) | |
| COMMON STOCKS (97.19%) | | | | | | |
| Argentina (0.56%) | | | | | | |
Globant SA(a) | | | 16,000 | | | $ | 606,240 | |
| | | | | | | | | |
| Australia (0.39%) | | | | | | | | |
| Magellan Financial Group, Ltd. | | | 23,885 | | | | 421,731 | |
| | | | | | | | | |
| Belgium (0.74%) | | | | | | | | |
| Melexis NV | | | 9,634 | | | | 802,920 | |
| | | | | | | | | |
| Brazil (0.54%) | | | | | | | | |
| Raia Drogasil SA | | | 28,000 | | | | 592,895 | |
| | | | | | | | | |
| Britain (7.84%) | | | | | | | | |
| Abcam PLC | | | 54,525 | | | | 605,220 | |
| Ascential PLC | | | 128,900 | | | | 589,004 | |
| B&M European Value Retail SA | | | 449,800 | | | | 1,963,299 | |
| Close Brothers Group PLC | | | 25,591 | | | | 560,822 | |
| Diploma PLC | | | 98,950 | | | | 1,421,296 | |
| Intertek Group PLC | | | 18,000 | | | | 947,932 | |
Metro Bank PLC(a) | | | 18,600 | | | | 850,162 | |
| Ted Baker PLC | | | 14,427 | | | | 522,270 | |
| Ultra Electronics Holdings PLC | | | 40,175 | | | | 1,088,566 | |
| | | | | | | | 8,548,571 | |
| | | | | | | | | |
| Canada (6.21%) | | | | | | | | |
| Birchcliff Energy, Ltd. | | | 57,500 | | | | 295,282 | |
| Crescent Point Energy Corp. | | | 40,789 | | | | 403,692 | |
| Gildan Activewear, Inc. | | | 29,179 | | | | 818,051 | |
lululemon athletica, Inc.(a) | | | 7,300 | | | | 379,600 | |
| Ritchie Bros. Auctioneers, Inc. | | | 52,950 | | | | 1,734,642 | |
| Stantec, Inc. | | | 89,157 | | | | 2,287,952 | |
| TFI International, Inc. | | | 39,026 | | | | 849,678 | |
| | | | | | | | 6,768,897 | |
| | | | | | | | | |
| China (6.80%) | | | | | | | | |
| China Medical System Holdings, Ltd. | | | 820,000 | | | | 1,416,856 | |
| CSPC Pharmaceutical Group, Ltd. | | | 485,000 | | | | 673,407 | |
Ctrip.com International, Ltd., ADR(a) | | | 11,100 | | | | 560,661 | |
| Man Wah Holdings, Ltd. | | | 2,975,800 | | | | 2,467,607 | |
| Silergy Corp. | | | 72,000 | | | | 1,302,973 | |
| Tencent Holdings, Ltd. | | | 19,600 | | | | 613,323 | |
Yum China Holdings, Inc.(a) | | | 11,025 | | | | 376,173 | |
| | | | | | | | 7,411,000 | |
| | | Shares | | | Value
(Note 2) | |
| Colombia (0.61%) | | | | | | |
Parex Resources, Inc.(a) | | | 53,443 | | | $ | 663,609 | |
| | | | | | | | | |
| Finland (0.54%) | | | | | | | | |
| Metso OYJ | | | 16,286 | | | | 584,190 | |
| | | | | | | | | |
| France (1.98%) | | | | | | | | |
| Alten SA | | | 15,343 | | | | 1,300,282 | |
| BioMerieux | | | 2,150 | | | | 429,873 | |
| Bureau Veritas SA | | | 18,600 | | | | 430,850 | |
| | | | | | | | 2,161,005 | |
| | | | | | | | | |
| Georgia (0.78%) | | | | | | | | |
| BGEO Group PLC | | | 18,200 | | | | 848,616 | |
| | | | | | | | | |
| Germany (4.66%) | | | | | | | | |
| Aroundtown Property Holdings PLC | | | 114,654 | | | | 595,738 | |
| CTS Eventim AG & Co. KGaA | | | 9,700 | | | | 373,674 | |
| GRENKE AG | | | 5,700 | | | | 1,135,628 | |
| Norma Group SE | | | 23,190 | | | | 1,244,098 | |
PATRIZIA Immobilien AG(a) | | | 42,286 | | | | 834,186 | |
| Wirecard AG | | | 15,250 | | | | 900,527 | |
| | | | | | | | 5,083,851 | |
| | | | | | | | | |
| Hong Kong (3.73%) | | | | | | | | |
| Samsonite International SA | | | 293,500 | | | | 1,133,875 | |
| Value Partners Group, Ltd. | | | 1,896,900 | | | | 1,755,858 | |
| Vitasoy International Holdings, Ltd. | | | 593,500 | | | | 1,173,518 | |
| | | | | | | | 4,063,251 | |
| | | | | | | | | |
| India (4.94%) | | | | | | | | |
| AIA Engineering, Ltd. | | | 21,743 | | | | 509,353 | |
| Alkem Laboratories, Ltd. | | | 27,024 | | | | 828,153 | |
Avenue Supermarts, Ltd.(a)(b)(c) | | | 1,399 | | | | 16,017 | |
| Bajaj Finance, Ltd. | | | 34,700 | | | | 688,390 | |
| Crisil, Ltd. | | | 12,500 | | | | 382,219 | |
| Indiabulls Housing Finance, Ltd. | | | 42,200 | | | | 667,112 | |
WNS Holdings, Ltd., ADR(a) | | | 31,075 | | | | 995,021 | |
| Yes Bank, Ltd. | | | 51,200 | | | | 1,297,510 | |
| | | | | | | | 5,383,775 | |
| | | | | | | | | |
| Indonesia (0.69%) | | | | | | | | |
| Bank Rakyat Indonesia Persero Tbk PT | | | 423,100 | | | | 409,483 | |
| Delfi, Ltd. | | | 212,600 | | | | 348,462 | |
| | | | | | | | 757,945 | |
| | | | | | | | | |
| Israel (0.80%) | | | | | | | | |
Wix.com, Ltd.(a) | | | 10,575 | | | | 871,909 | |
| See Notes to Financial Statements. | |
| Annual Report | April 30, 2017 | 47 |
| Grandeur Peak Global Stalwarts Fund | Portfolio of Investments |
| | | Shares | | | Value
(Note 2) | |
| Italy (1.79%) | | | | | | |
| Brembo SpA | | | 19,572 | | | $ | 1,538,222 | |
| DiaSorin SpA | | | 5,473 | | | | 410,168 | |
| | | | | | | | 1,948,390 | |
| | | | | | | | | |
| Japan (8.46%) | | | | | | | | |
| Century Tokyo Leasing Corp. | | | 16,300 | | | | 561,489 | |
| Create SD Holdings Co., Ltd. | | | 27,800 | | | | 652,886 | |
| CyberAgent, Inc. | | | 19,200 | | | | 595,936 | |
| Dip Corp. | | | 37,100 | | | | 819,711 | |
| Ezaki Glico Co. Ltd. | | | 10,500 | | | | 552,904 | |
| MISUMI Group, Inc. | | | 74,700 | | | | 1,414,593 | |
| MonotaRO Co., Ltd. | | | 11,500 | | | | 373,963 | |
| Nihon M&A Center, Inc. | | | 85,200 | | | | 2,911,971 | |
| Seria Co., Ltd. | | | 17,800 | | | | 798,385 | |
| Suruga Bank, Ltd. | | | 26,100 | | | | 545,296 | |
| | | | | | | | 9,227,134 | |
| | | | | | | | | |
| Jordan (0.37%) | | | | | | | | |
| Hikma Pharmaceuticals PLC | | | 16,000 | | | | 401,409 | |
| | | | | | | | | |
| Luxembourg (1.23%) | | | | | | | | |
| Grand City Properties SA | | | 42,600 | | | | 809,057 | |
| L'Occitane International SA | | | 254,400 | | | | 533,111 | |
| | | | | | | | 1,342,168 | |
| | | | | | | | | |
| Mexico (0.58%) | | | | | | | | |
Banregio Grupo Financiero
SAB de CV | | | 109,800 | | | | 634,003 | |
| | | | | | | | | |
| Netherlands (1.40%) | | | | | | | | |
| Aalberts Industries NV | | | 38,548 | | | | 1,529,288 | |
| | | | | | | | | |
| New Zealand (0.35%) | | | | | | | | |
| Fisher & Paykel Healthcare Corp., Ltd. | | | 55,577 | | | | 384,263 | |
| | | | | | | | | |
| Norway (0.36%) | | | | | | | | |
Norwegian Finans Holding ASA(a) | | | 49,600 | | | | 394,270 | |
| | | | | | | | | |
| Peru (0.50%) | | | | | | | | |
| Credicorp, Ltd. | | | 3,525 | | | | 541,651 | |
| | | | | | | | | |
| Philippines (2.89%) | | | | | | | | |
| Puregold Price Club, Inc. | | | 898,000 | | | | 749,456 | |
| Robinsons Land Corp. | | | 773,000 | | | | 396,827 | |
| Robinsons Retail Holdings, Inc. | | | 477,900 | | | | 759,437 | |
| Security Bank Corp. | | | 291,300 | | | | 1,242,973 | |
| | | | | | | | 3,148,693 | |
| | | Shares | | | Value
(Note 2) | |
| Poland (0.35%) | | | | | | |
AmRest Holdings SE(a) | | | 4,000 | | | $ | 378,944 | |
| | | | | | | | | |
| South Africa (0.65%) | | | | | | | | |
| EOH Holdings, Ltd. | | | 66,650 | | | | 705,464 | |
| | | | | | | | | |
| South Korea (1.57%) | | | | | | | | |
| BGF Retail Co., Ltd. | | | 3,500 | | | | 336,805 | |
| LG Household & Health Care, Ltd. | | | 850 | | | | 646,893 | |
| Loen Entertainment, Inc. | | | 4,401 | | | | 339,967 | |
| Mando Corp. | | | 1,950 | | | | 394,147 | |
| | | | | | | | 1,717,812 | |
| | | | | | | | | |
| Sweden (1.74%) | | | | | | | | |
| Indutrade AB | | | 40,325 | | | | 952,889 | |
| Nibe Industrier AB, Class B | | | 47,208 | | | | 418,392 | |
| Sweco AB, Class B | | | 21,400 | | | | 530,814 | |
| | | | | | | | 1,902,095 | |
| | | | | | | | | |
| Switzerland (1.49%) | | | | | | | | |
Luxoft Holding, Inc.(a) | | | 8,775 | | | | 540,979 | |
| VZ Holding AG | | | 2,290 | | | | 636,942 | |
Wizz Air Holdings PLC(a)(b)(c) | | | 19,500 | | | | 445,776 | |
| | | | | | | | 1,623,697 | |
| | | | | | | | | |
| Taiwan (0.76%) | | | | | | | | |
| Largan Precision Co., Ltd. | | | 5,000 | | | | 831,096 | |
| | | | | | | | | |
| Thailand (0.41%) | | | | | | | | |
| Srisawad Power 1979 PCL | | | 346,320 | | | | 443,037 | |
| | | | | | | | | |
| United States (29.68%) | | | | | | | | |
Amazon.com, Inc.(a) | | | 950 | | | | 878,740 | |
| AmTrust Financial Services, Inc. | | | 14,400 | | | | 231,120 | |
Axalta Coating Systems, Ltd.(a) | | | 24,875 | | | | 780,329 | |
| Bank of the Ozarks, Inc. | | | 12,000 | | | | 569,640 | |
BofI Holding, Inc.(a) | | | 14,525 | | | | 347,002 | |
| Carter's, Inc. | | | 5,375 | | | | 494,715 | |
Dollar Tree, Inc.(a) | | | 11,375 | | | | 941,509 | |
Dril‐Quip, Inc.(a) | | | 6,150 | | | | 317,032 | |
Edwards Lifesciences Corp.(a) | | | 6,025 | | | | 660,762 | |
EPAM Systems, Inc.(a) | | | 15,975 | | | | 1,230,075 | |
Etsy, Inc.(a) | | | 39,000 | | | | 419,640 | |
| Fastenal Co. | | | 18,300 | | | | 817,644 | |
| First Republic Bank | | | 30,850 | | | | 2,852,391 | |
| FirstCash, Inc. | | | 28,278 | | | | 1,469,042 | |
| Genpact, Ltd. | | | 21,025 | | | | 513,431 | |
| Gentex Corp. | | | 47,975 | | | | 990,684 | |
| Home BancShares, Inc. | | | 16,237 | | | | 413,232 | |
| IDEX Corp. | | | 5,525 | | | | 578,799 | |
| See Notes to Financial Statements. | |
| 48 | 1.855.377.7325 | www.GrandeurPeakGlobal.com |
| Grandeur Peak Global Stalwarts Fund | Portfolio of Investments |
| | | Shares | | | Value
(Note 2) | |
| United States (continued) | | | | | | |
Inphi Corp.(a) | | | 10,975 | | | $ | 454,584 | |
| Knight Transportation, Inc. | | | 46,675 | | | | 1,600,952 | |
| Littelfuse, Inc. | | | 4,650 | | | | 716,797 | |
LKQ Corp.(a) | | | 31,500 | | | | 984,060 | |
| MarketAxess Holdings, Inc. | | | 6,075 | | | | 1,169,559 | |
MEDNAX, Inc.(a) | | | 27,425 | | | | 1,655,373 | |
| Microchip Technology, Inc. | | | 11,875 | | | | 897,512 | |
MSC Industrial Direct Co., Inc., Class A | | | 7,550 | | | | 675,951 | |
MuleSoft, Inc., Class A(a) | | | 9,350 | | | | 215,424 | |
Palo Alto Networks, Inc.(a) | | | 3,700 | | | | 401,117 | |
Paycom Software, Inc.(a) | | | 12,050 | | | | 726,012 | |
| Power Integrations, Inc. | | | 30,550 | | | | 2,014,773 | |
PRA Group, Inc.(a) | | | 27,700 | | | | 891,940 | |
Proto Labs, Inc.(a) | | | 14,625 | | | | 848,250 | |
| SEI Investments Co. | | | 9,000 | | | | 456,390 | |
Signature Bank(a) | | | 5,050 | | | | 699,173 | |
Silicon Laboratories, Inc.(a) | | | 10,850 | | | | 771,978 | |
Spirit Airlines, Inc.(a) | | | 6,875 | | | | 393,731 | |
Sprouts Farmers Market, Inc.(a) | | | 26,450 | | | | 590,100 | |
SVB Financial Group(a) | | | 3,200 | | | | 563,008 | |
Tyler Technologies, Inc.(a) | | | 3,025 | | | | 494,860 | |
Under Armour, Inc., Class A(a) | | | 11,950 | | | | 256,806 | |
Virtusa Corp.(a) | | | 11,958 | | | | 370,459 | |
| | | | | | | | 32,354,596 | |
| | | | | | | | | |
| Vietnam (0.80%) | | | | | | | | |
| Vietnam Dairy Products JSC | | | 134,924 | | | | 877,998 | |
| | | | | | | | | |
TOTAL COMMON STOCKS (Cost $91,429,378) | | | | | | | 105,956,413 | |
| | | | | | | | | |
| PREFERRED STOCKS (1.09%) | | | | | | | | |
| Brazil (0.60%) | | | | | | | | |
| Itau Unibanco Holding SA | | | 52,745 | | | | 652,074 | |
| | | | | | | | | |
| Germany (0.49%) | | | | | | | | |
| Fuchs Petrolub SE | | | 10,500 | | | | 541,630 | |
| | | | | | | | | |
TOTAL PREFERRED STOCKS (Cost $1,010,364) | | | | | | | 1,193,704 | |
| | | | | | | | | |
TOTAL INVESTMENTS (98.28%) (Cost $92,439,742) | | | | | | $ | 107,150,117 | |
| | | | | | | | | |
| Other Assets In Excess Of Liabilities(1.72%) | | | | 1,872,060 | |
| | | | | | | | | |
| NET ASSETS (100.00%) | | | | | | $ | 109,022,177 | |
(a) | Non-Income Producing Security. |
(b) | Security exempt from registration under Rule 144A of the Securities Act of 1933. These securities may be resold in the ordinary course of business in transactions exempt from registration, normally to qualified institutional buyers. As of April 30, 2017, these securities had a total aggregate market value of $461,793 representing 0.42% of net assets. |
(c) | Security was purchased pursuant to Regulation S under the Securities Act of 1933, which exempts securities offered and sold outside of the United States from registration. Such security cannot be sold in the United States without either an effective registration statement filed pursuant to the Securities Act of 1933, or pursuant to an exemption from registration. The security has been deemed liquid under guidelines approved by the Fund's Board of Trustees. As of April 30, 2017, the aggregate market value of those securities was $461,793, representing 0.43% of net assets. |
For Fund compliance purposes, the Fund's geographical classifications refer to any one or more of the country sub-classifications used by one or more widely recognized market indexes or ratings group indexes, and/or as defined by Fund management. This definition may not apply for purposes of this report, which may combine sub-classifications for reporting ease. Geographical regions are shown as a percentage of net assets.
| See Notes to Financial Statements. | |
| Annual Report | April 30, 2017 | 49 |
| Grandeur Peak International Opportunities Fund | Portfolio of Investments |
| | | Shares | | | Value
(Note 2) | |
| COMMON STOCKS (97.76%) | | | | | | |
| Argentina (0.59%) | | | | | | |
Globant SA(a) | | | 120,850 | | | $ | 4,579,007 | |
| | | | | | | | | |
| Australia (2.28%) | | | | | | | | |
| Blue Sky Alternative Investments, Ltd. | | | 446,139 | | | | 2,672,552 | |
| CTI Logistics, Ltd. | | | 1,533,161 | | | | 826,583 | |
| Greencross, Ltd. | | | 983,600 | | | | 5,008,336 | |
| Magellan Financial Group, Ltd. | | | 220,800 | | | | 3,898,602 | |
| Medical Developments International, Ltd. | | | 520,709 | | | | 1,930,040 | |
| National Storage REIT | | | 2,411,818 | | | | 2,690,895 | |
| Reject Shop, Ltd. | | | 222,431 | | | | 707,865 | |
| | | | | | | | 17,734,873 | |
| | | | | | | | | |
| Austria (1.15%) | | | | | | | | |
| Palfinger AG | | | 218,040 | | | | 8,904,289 | |
| | | | | | | | | |
| Belgium (0.80%) | | | | | | | | |
| Melexis NV | | | 74,492 | | | | 6,208,340 | |
| | | | | | | | | |
| Brazil (0.99%) | | | | | | | | |
| FPC Par Corretora de Seguros SA | | | 883,200 | | | | 5,234,004 | |
Valid Solucoes e Servicos de
Seguranca em Meios
de Pagamento e
Identificacao SA | | | 347,700 | | | | 2,487,758 | |
| | | | | | | | 7,721,762 | |
| | | | | | | | | |
| Britain (11.95%) | | | | | | | | |
| Abcam PLC | | | 294,566 | | | | 3,269,645 | |
| Alliance Pharma PLC | | | 3,193,134 | | | | 1,964,481 | |
| Arrow Global Group PLC | | | 1,445,501 | | | | 6,856,984 | |
| Ascential PLC | | | 1,043,100 | | | | 4,766,413 | |
| B&M European Value Retail SA | | | 998,100 | | | | 4,356,534 | |
| Clinigen Group PLC | | | 1,414,873 | | | | 16,034,767 | |
| Close Brothers Group PLC | | | 97,100 | | | | 2,127,927 | |
| Diploma PLC | | | 224,500 | | | | 3,224,668 | |
| EMIS Group PLC | | | 404,800 | | | | 4,923,152 | |
| Exova Group PLC | | | 587,400 | | | | 1,814,510 | |
| Intertek Group PLC | | | 82,800 | | | | 4,360,485 | |
Metro Bank PLC(a) | | | 108,800 | | | | 4,972,991 | |
Motorpoint Group PLC(b) | | | 850,495 | | | | 1,792,792 | |
On the Beach Group PLC(b)(c) | | | 958,750 | | | | 4,166,151 | |
Oxford Immunotec Global PLC(a) | | | 271,830 | | | | 4,183,464 | |
Purplebricks Group PLC(a) | | | 932,200 | | | | 3,564,808 | |
| River & Mercantile Group PLC | | | 625,400 | | | | 2,241,727 | |
| RPS Group PLC | | | 1,169,811 | | | | 3,852,244 | |
| | | Shares | | | Value
(Note 2) | |
| Britain (continued) | | | | | | |
| Sanne Group PLC | | | 697,166 | | | $ | 5,882,850 | |
| Secure Trust Bank PLC | | | 112,792 | | | | 3,522,189 | |
| Tracsis PLC | | | 190,900 | | | | 1,057,010 | |
| Ultra Electronics Holdings PLC | | | 143,700 | | | | 3,893,638 | |
| | | | | | | | 92,829,430 | |
| | | | | | | | | |
| Canada (3.52%) | | | | | | | | |
Biosyent, Inc.(a) | | | 374,000 | | | | 2,131,585 | |
Cipher Pharmaceuticals, Inc.(a) | | | 887,400 | | | | 2,892,883 | |
DIRTT Environmental Solutions(a) | | | 552,900 | | | | 2,681,366 | |
| Richelieu Hardware, Ltd. | | | 229,350 | | | | 5,104,321 | |
| Sandvine Corp. | | | 857,700 | | | | 1,998,085 | |
Spartan Energy Corp.(a) | | | 1,126,200 | | | | 1,881,056 | |
| Stantec, Inc. | | | 291,710 | | | | 7,485,881 | |
| TFI International, Inc. | | | 145,200 | | | | 3,161,308 | |
| | | | | | | | 27,336,485 | |
| | | | | | | | | |
| China (7.16%) | | | | | | | | |
BBI Life Sciences Corp.(b) | | | 14,481,500 | | | | 3,388,422 | |
| BrightKing Holdings, Ltd. | | | 530,291 | | | | 1,312,941 | |
| China Medical System Holdings, Ltd. | | | 5,319,000 | | | | 9,190,556 | |
| CSPC Pharmaceutical Group, Ltd. | | | 3,206,000 | | | | 4,451,432 | |
| Man Wah Holdings, Ltd. | | | 23,158,200 | | | | 19,203,352 | |
O2Micro International, Ltd., ADR(a) | | | 950,233 | | | | 2,356,578 | |
| On‐Bright Electronics, Inc. | | | 636,000 | | | | 4,005,170 | |
| Silergy Corp. | | | 463,199 | | | | 8,382,442 | |
Xiabuxiabu Catering
Management China
Holdings Co., Ltd.(b)(c) | | | 3,907,500 | | | | 3,325,596 | |
| | | | | | | | 55,616,489 | |
| | | | | | | | | |
| Colombia (1.00%) | | | | | | | | |
Gran Tierra Energy, Inc.(a) | | | 1,178,037 | | | | 2,968,653 | |
Parex Resources, Inc.(a) | | | 388,975 | | | | 4,829,952 | |
| | | | | | | | 7,798,605 | |
| | | | | | | | | |
| Denmark (0.43%) | | | | | | | | |
| Ringkjoebing Landbobank A/S | | | 13,763 | | | | 3,321,704 | |
| | | | | | | | | |
| Egypt (0.06%) | | | | | | | | |
Integrated Diagnostics Holdings PLC(b)(c) | | | 154,200 | | | | 464,142 | |
| | | | | | | | | |
| Finland (0.19%) | | | | | | | | |
Ferratum OYJ(b) | | | 69,000 | | | | 1,476,928 | |
| See Notes to Financial Statements. | |
| 50 | 1.855.377.7325 | www.GrandeurPeakGlobal.com |
| Grandeur Peak International Opportunities Fund | Portfolio of Investments |
| | | Shares | | | Value
(Note 2) | |
| France (2.97%) | | | | | | |
| Alten SA | | | 51,300 | | | $ | 4,347,550 | |
| Bureau Veritas SA | | | 124,800 | | | | 2,890,864 | |
| Esker SA | | | 97,543 | | | | 5,044,922 | |
| Infotel SA | | | 37,200 | | | | 1,782,967 | |
Medicrea International(a) | | | 167,441 | | | | 1,032,347 | |
MGI Digital Graphic Technology(a) | | | 40,813 | | | | 1,865,441 | |
| Neurones | | | 57,747 | | | | 1,572,596 | |
| Tessi SA | | | 12,400 | | | | 1,974,771 | |
| Thermador Groupe | | | 14,854 | | | | 1,494,913 | |
| Wavestone | | | 12,077 | | | | 1,085,327 | |
| | | | | | | | 23,091,698 | |
| | | | | | | | | |
| Georgia (1.27%) | | | | | | | | |
| BGEO Group PLC | | | 159,611 | | | | 7,442,219 | |
TBC Bank Group PLC(a) | | | 113,800 | | | | 2,395,150 | |
| | | | | | | | 9,837,369 | |
| | | | | | | | | |
| Germany (4.70%) | | | | | | | | |
| Aroundtown Property Holdings PLC | | | 805,600 | | | | 4,185,867 | |
| CANCOM SE | | | 47,100 | | | | 2,786,944 | |
| GRENKE AG | | | 6,900 | | | | 1,374,708 | |
| Nexus AG | | | 278,516 | | | | 6,704,865 | |
| Norma Group SE | | | 93,303 | | | | 5,005,523 | |
PATRIZIA Immobilien AG(a) | | | 169,904 | | | | 3,351,735 | |
publity AG(a) | | | 115,200 | | | | 5,226,550 | |
| Softing AG | | | 89,920 | | | | 1,038,269 | |
| Wirecard AG | | | 115,711 | | | | 6,832,847 | |
| | | | | | | | 36,507,308 | |
| | | | | | | | | |
| Hong Kong (2.30%) | | | | | | | | |
| International Housewares Retail Co., Ltd. | | | 13,447,000 | | | | 3,042,640 | |
| Samsonite International SA | | | 1,151,200 | | | | 4,447,416 | |
| Value Partners Group, Ltd. | | | 7,372,000 | | | | 6,823,864 | |
| Vitasoy International Holdings, Ltd. | | | 1,797,338 | | | | 3,553,846 | |
| | | | | | | | 17,867,766 | |
| | | | | | | | | |
| India (9.01%) | | | | | | | | |
| AIA Engineering, Ltd. | | | 131,924 | | | | 3,090,463 | |
| Alkem Laboratories, Ltd. | | | 288,843 | | | | 8,851,626 | |
| Bajaj Finance, Ltd. | | | 297,260 | | | | 5,897,143 | |
| The Byke Hospitality, Ltd. | | | 959,500 | | | | 3,191,124 | |
| City Union Bank, Ltd. | | | 1,907,065 | | | | 4,885,502 | |
| Cyient, Ltd. | | | 453,767 | | | | 3,862,980 | |
| Essel Propack, Ltd. | | | 729,500 | | | | 2,910,969 | |
| Hinduja Global Solutions, Ltd. | | | 303,026 | | | | 2,610,084 | |
| Indiabulls Housing Finance, Ltd. | | | 399,500 | | | | 6,315,429 | |
| | | Shares | | | Value
(Note 2) | |
| India (continued) | | | | | | |
Kellton Tech Solutions, Ltd.(a) | | | 506,730 | | | $ | 928,703 | |
| KPIT Technologies, Ltd. | | | 640,821 | | | | 1,279,052 | |
| MBL Infrastructures, Ltd. | | | 580,500 | | | | 372,231 | |
| Time Technoplast, Ltd. | | | 4,093,734 | | | | 7,232,285 | |
Vaibhav Global, Ltd.(a) | | | 258,200 | | | | 1,889,640 | |
| Vakrangee, Ltd. | | | 921,000 | | | | 4,898,494 | |
WNS Holdings, Ltd., ADR(a) | | | 194,875 | | | | 6,239,897 | |
| Yes Bank, Ltd. | | | 217,500 | | | | 5,511,882 | |
| | | | | | | | 69,967,504 | |
| | | | | | | | | |
| Indonesia (3.45%) | | | | | | | | |
| Arwana Citramulia Tbk PT | | | 75,956,500 | | | | 3,105,731 | |
| Astra Graphia Tbk PT | | | 10,792,000 | | | | 1,534,312 | |
| Bekasi Fajar Industrial Estate Tbk PT | | | 65,215,500 | | | | 1,448,255 | |
| Delfi, Ltd. | | | 1,445,600 | | | | 2,369,412 | |
| Indonesia Pondasi Raya Tbk PT | | | 19,353,900 | | | | 1,815,018 | |
| Link Net Tbk PT | | | 5,792,700 | | | | 2,346,806 | |
Lippo Cikarang Tbk PT(a) | | | 2,189,000 | | | | 735,743 | |
| Panin Sekuritas Tbk PT | | | 8,494,000 | | | | 2,236,773 | |
| Selamat Sempurna Tbk PT | | | 69,686,300 | | | | 6,378,369 | |
| Tempo Scan Pacific Tbk PT | | | 19,383,500 | | | | 3,010,267 | |
Ultrajaya Milk Industry &
Trading Co. Tbk PT(a) | | | 5,739,500 | | | | 1,808,530 | |
| | | | | | | | 26,789,216 | |
| | | | | | | | | |
| Ireland (1.08%) | | | | | | | | |
| Irish Residential Properties PLC, REIT | | | 5,867,176 | | | | 8,372,363 | |
| | | | | | | | | |
| Israel (0.96%) | | | | | | | | |
| Sarine Technologies, Ltd. | | | 1,358,600 | | | | 1,867,024 | |
Wix.com, Ltd.(a) | | | 67,950 | | | | 5,602,477 | |
| | | | | | | | 7,469,501 | |
| | | | | | | | | |
| Italy (0.84%) | | | | | | | | |
Banca Sistema SpA(b)(c) | | | 1,071,907 | | | | 2,919,072 | |
| Brembo SpA | | | 45,535 | | | | 3,578,733 | |
| | | | | | | | 6,497,805 | |
| | | | | | | | | |
| Japan (11.00%) | | | | | | | | |
| AIT Corp. | | | 465,700 | | | | 4,261,171 | |
| Amiyaki Tei Co., Ltd. | | | 75,600 | | | | 2,834,788 | |
| Anest Iwata Corp. | | | 329,000 | | | | 2,892,308 | |
| Anshin Guarantor Service Co., Ltd. | | | 375,000 | | | | 2,055,393 | |
| ARCLAND SERVICE Co., Ltd. | | | 66,700 | | | | 1,839,897 | |
| Century Tokyo Leasing Corp. | | | 104,500 | | | | 3,599,731 | |
| CMIC Holdings Co., Ltd. | | | 39,655 | | | | 512,251 | |
| Create SD Holdings Co., Ltd. | | | 111,500 | | | | 2,618,587 | |
| CyberAgent, Inc. | | | 184,200 | | | | 5,717,264 | |
| See Notes to Financial Statements. | |
| Annual Report | April 30, 2017 | 51 |
| Grandeur Peak International Opportunities Fund | Portfolio of Investments |
April 30, 2017
| | | Shares | | | Value (Note 2) | |
| Japan (continued) | | | | | | |
| eGuarantee, Inc. | | | 94,600 | | | $ | 2,068,089 | |
| Future Corp. | | | 493,800 | | | | 3,831,684 | |
| GCA Corp. | | | 616,400 | | | | 4,982,071 | |
| Hard Off Corp. Co., Ltd. | | | 289,300 | | | | 2,753,508 | |
| Japan Lifeline Co. Ltd. | | | 110,500 | | | | 2,217,434 | |
M&A Capital Partners Co., Ltd.(a) | | | 146,800 | | | | 6,597,605 | |
Macromill, Inc.(a) | | | 106,200 | | | | 1,861,537 | |
| MISUMI Group, Inc. | | | 223,700 | | | | 4,236,203 | |
| Monogatari Corp. | | | 31,200 | | | | 1,402,216 | |
| Nihon M&A Center, Inc. | | | 136,000 | | | | 4,648,217 | |
| Prestige International, Inc. | | | 794,800 | | | | 7,136,979 | |
| Quick Co., Ltd. | | | 278,400 | | | | 3,126,771 | |
| SK Kaken Co., Ltd. | | | 21,000 | | | | 1,996,860 | |
Synchro Food Co., Ltd.(a) | | | 14,000 | | | | 154,600 | |
| Syuppin Co., Ltd. | | | 253,600 | | | | 3,922,013 | |
| Trancom Co., Ltd. | | | 104,590 | | | | 5,254,129 | |
| Trust Tech, Inc. | | | 168,600 | | | | 2,938,684 | |
| | | | | | | | 85,459,990 | |
| | | | | | | | | |
| Luxembourg (0.79%) | | | | | | | | |
| Grand City Properties SA | | | 187,800 | | | | 3,566,688 | |
| L'Occitane International SA | | | 1,238,712 | | | | 2,595,796 | |
| | | | | | | | 6,162,484 | |
| | | | | | | | | |
| Malaysia (1.77%) | | | | | | | | |
| 7-Eleven Malaysia Holdings Bhd, Class B | | | 3,575,000 | | | | 1,317,669 | |
| AEON Credit Service M Bhd | | | 745,040 | | | | 2,804,412 | |
| Berjaya Food Bhd | | | 2,056,016 | | | | 824,112 | |
| CB Industrial Product Holding Bhd | | | 3,120,200 | | | | 1,480,675 | |
| My EG Services Bhd | | | 10,721,400 | | | | 5,260,673 | |
| Scicom MSC Bhd | | | 3,754,500 | | | | 2,075,743 | |
| | | | | | | | 13,763,284 | |
| | | | | | | | | |
| Mexico (1.11%) | | | | | | | | |
| Banregio Grupo Financiero SAB de CV | | | 560,065 | | | | 3,233,905 | |
| Credito Real SAB de CV SOFOM ER | | | 3,841,140 | | | | 5,386,706 | |
| | | | | | | | 8,620,611 | |
| | | | | | | | | |
| Netherlands (0.66%) | | | | | | | | |
| Aalberts Industries NV | | | 128,397 | | | | 5,093,806 | |
| | | | | | | | | |
| New Zealand (1.35%) | | | | | | | | |
| CBL Corp., Ltd. | | | 1,542,256 | | | | 3,685,018 | |
| Restaurant Brands New Zealand, Ltd. | | | 1,240,800 | | | | 4,532,287 | |
| Trilogy International, Ltd. | | | 1,257,385 | | | | 2,270,534 | |
| | | | | | | | 10,487,839 | |
| | | Shares | | | Value (Note 2) | |
| Norway (2.46%) | | | | | | |
| Medistim ASA | | | 420,559 | | | $ | 3,624,664 | |
Multiconsult ASA(b)(c) | | | 147,000 | | | | 1,579,403 | |
Nordic Semiconductor ASA(a) | | | 742,300 | | | | 2,974,041 | |
Norwegian Finans Holding ASA(a) | | | 275,300 | | | | 2,188,356 | |
Skandiabanken ASA(a)(b)(c) | | | 979,400 | | | | 8,754,828 | |
| | | | | | | | 19,121,292 | |
| | | | | | | | | |
| Oman (0.49%) | | | | | | | | |
| Tethys Oil AB | | | 496,508 | | | | 3,825,847 | |
| | | | | | | | | |
| Peru (0.33%) | | | | | | | | |
| Credicorp, Ltd. | | | 16,850 | | | | 2,589,171 | |
| | | | | | | | | |
| Philippines (3.37%) | | | | | | | | |
| Concepcion Industrial Corp. | | | 3,109,000 | | | | 4,607,654 | |
| Holcim Philippines, Inc. | | | 2,303,300 | | | | 709,913 | |
| Metro Retail Stores Group, Inc. | | | 26,829,000 | | | | 1,959,889 | |
| Pepsi-Cola Products Philippines, Inc. | | | 32,632,500 | | | | 2,416,496 | |
| Puregold Price Club, Inc. | | | 6,696,000 | | | | 5,588,376 | |
| Robinsons Retail Holdings, Inc. | | | 1,696,000 | | | | 2,695,135 | |
| Security Bank Corp. | | | 1,931,760 | | | | 8,242,795 | |
| | | | | | | | 26,220,258 | |
| | | | | | | | | |
| Poland (0.03%) | | | | | | | | |
| PGS Software SA | | | 52,400 | | | | 194,244 | |
| | | | | | | | | |
| Singapore (0.70%) | | | | | | | | |
| CSE Global, Ltd. | | | 4,878,055 | | | | 1,815,545 | |
| Riverstone Holdings, Ltd. | | | 5,677,000 | | | | 3,595,995 | |
| | | | | | | | 5,411,540 | |
| | | | | | | | | |
| South Africa (1.80%) | | | | | | | | |
| Blue Label Telecoms, Ltd. | | | 1,526,900 | | | | 1,935,511 | |
| Cartrack Holdings, Ltd. | | | 4,359,900 | | | | 3,817,105 | |
| EOH Holdings, Ltd. | | | 349,156 | | | | 3,695,678 | |
| Italtile, Ltd. | | | 3,988,625 | | | | 4,011,383 | |
| OneLogix Group, Ltd. | | | 2,450,980 | | | | 552,049 | |
| | | | | | | | 14,011,726 | |
| | | | | | | | | |
| South Korea (2.85%) | | | | | | | | |
| Daewon Pharmaceutical Co., Ltd. | | | 77,325 | | | | 1,484,798 | |
| Hy-Lok Corp. | | | 286,501 | | | | 5,639,883 | |
| ISC Co., Ltd. | | | 286,949 | | | | 5,119,136 | |
| Koh Young Technology, Inc. | | | 44,883 | | | | 2,118,127 | |
| Kolao Holdings | | | 173,500 | | | | 1,020,050 | |
| Loen Entertainment, Inc. | | | 49,909 | | | | 3,855,348 | |
See Notes to Financial Statements.
| 52 | 1.855.377.7325 | www.GrandeurPeakGlobal.com |
| Grandeur Peak International Opportunities Fund | Portfolio of Investments |
April 30, 2017
| | | Shares | | | Value (Note 2) | |
| South Korea (continued) | | | | | | |
Vitzrocell Co., Ltd.(d) | | | 325,737 | | | $ | 2,905,555 | |
| | | | | | | | 22,142,897 | |
| | | | | | | | | |
| Sweden (3.41%) | | | | | | | | |
| AddTech AB, Class B | | | 343,608 | | | | 6,187,605 | |
| Bufab Holding AB | | | 445,900 | | | | 5,348,907 | |
| HIQ International AB | | | 227,896 | | | | 1,556,649 | |
Hoist Finance AB(b)(c) | | | 414,200 | | | | 3,893,077 | |
| Indutrade AB | | | 173,750 | | | | 4,105,752 | |
Moberg Pharma AB(a) | | | 334,194 | | | | 1,943,142 | |
| Odd Molly International AB | | | 72,938 | | | | 392,799 | |
| Opus Group AB | | | 3,810,268 | | | | 3,032,797 | |
| | | | | | | | 26,460,728 | |
| | | | | | | | | |
| Switzerland (1.23%) | | | | | | | | |
Luxoft Holding, Inc.(a) | | | 50,225 | | | | 3,096,371 | |
| VZ Holding AG | | | 23,280 | | | | 6,475,116 | |
| | | | | | | | 9,571,487 | |
| | | | | | | | | |
| Taiwan (4.00%) | | | | | | | | |
| ASPEED Technology, Inc. | | | 166,958 | | | | 3,242,763 | |
| Cub Elecparts, Inc. | | | 195,732 | | | | 2,050,025 | |
| Dr. Wu Skincare Co., Ltd. | | | 190,000 | | | | 1,316,165 | |
| Materials Analysis Technology, Inc. | | | 1,032,000 | | | | 3,557,323 | |
| Novatek Microelectronics Corp. | | | 479,000 | | | | 1,841,636 | |
| Sinmag Equipment Corp. | | | 952,810 | | | | 4,389,665 | |
| Sitronix Technology Corp. | | | 841,000 | | | | 2,525,425 | |
| Sporton International, Inc. | | | 1,410,650 | | | | 8,345,796 | |
| Test Research, Inc. | | | 2,114,252 | | | | 2,813,537 | |
| TSC Auto ID Technology Co., Ltd. | | | 138,000 | | | | 1,015,412 | |
| | | | | | | | 31,097,747 | |
| | | | | | | | | |
| Thailand (0.77%) | | | | | | | | |
| Ananda Development PCL | | | 26,514,800 | | | | 3,786,733 | |
| Premier Marketing PCL | | | 8,478,400 | | | | 2,230,513 | |
| | | | | | | | 6,017,246 | |
| | | | | | | | | |
| United Arab Emirates (0.34%) | | | | | | | | |
| Aramex PJSC | | | 1,855,000 | | | | 2,666,594 | |
| | | | | | | | | |
| United States (2.48%) | | | | | | | | |
EPAM Systems, Inc.(a) | | | 83,750 | | | | 6,448,750 | |
| FirstCash, Inc. | | | 196,248 | | | | 10,195,083 | |
GBGI, Ltd.(a) | | | 1,426,215 | | | | 2,623,074 | |
| | | | | | | | 19,266,907 | |
| | | Shares | | | Value (Note 2) | |
| Vietnam (0.12%) | | | | | | |
| DHG Pharmaceutical JSC | | | 146,000 | | | $ | 930,815 | |
| | | | | | | | | |
| TOTAL COMMON STOCKS | | | | | | | | |
| (Cost $586,240,467) | | | | | | | 759,509,097 | |
| | | | | | | | | |
| TOTAL INVESTMENTS (97.76%) | | | | | | | | |
| (Cost $586,240,467) | | | | | | $ | 759,509,097 | |
| | | | | | | | | |
| Other Assets In Excess Of Liabilities (2.24%) | | | | 17,398,260 | |
| | | | | | | | | |
| NET ASSETS (100.00%) | | | | | | $ | 776,907,357 | |
(a) | Non-Income Producing Security. |
(b) | Security was purchased pursuant to Regulation S under the Securities Act of 1933, which exempts securities offered and sold outside of the United States from registration. Such security cannot be sold in the United States without either an effective registration statement filed pursuant to the Securities Act of 1933, or pursuant to an exemption from registration. The security has been deemed liquid under guidelines approved by the Fund's Board of Trustees. As of April 30, 2017, the aggregate market value of those securities was $31,760,411, representing 4.08% of net assets. |
(c) | Security exempt from registration under Rule 144A of the Securities Act of 1933. These securities may be resold in the ordinary course of business in transactions exempt from registration, normally to qualified institutional buyers. As of April 30, 2017, these securities had a total aggregate market value of $25,102,269 representing 3.23% of net assets. |
(d) | Fair valued security under the procedures approved by the Fund's Board of Trustees. |
For Fund compliance purposes, the Fund's geographical classifications refer to any one or more of the country sub-classifications used by one or more widely recognized market indexes or ratings group indexes, and/or as defined by Fund management. This definition may not apply for purposes of this report, which may combine sub-classifications for reporting ease. Geographical regions are shown as a percentage of net assets.
See Notes to Financial Statements.
| Annual Report | April 30, 2017 | 53 |
| Grandeur Peak International Stalwarts Fund | Portfolio of Investments |
April 30, 2017
| | | Shares | | | Value
(Note 2) | |
| COMMON STOCKS (97.31%) | |
| Argentina (0.78%) | | | | | | |
Globant SA(a) | | | 61,250 | | | $ | 2,320,763 | |
| | | | | | | | | |
| Australia (0.57%) | | | | | | | | |
| Magellan Financial Group, Ltd. | | | 95,009 | | | | 1,677,547 | |
| | | | | | | | | |
| Belgium (1.25%) | | | | | | | | |
| Melexis NV | | | 44,339 | | | | 3,695,317 | |
| | | | | | | | | |
| Brazil (0.69%) | | | | | | | | |
| Raia Drogasil SA | | | 97,100 | | | | 2,056,077 | |
| | | | | | | | | |
| Britain (10.55%) | | | | | | | | |
| Abcam PLC | | | 203,650 | | | | 2,260,489 | |
| Ascential PLC | | | 467,800 | | | | 2,137,597 | |
| B&M European Value Retail SA | | | 1,494,500 | | | | 6,523,234 | |
| Close Brothers Group PLC | | | 95,199 | | | | 2,086,267 | |
| Diploma PLC | | | 339,600 | | | | 4,877,939 | |
| Intertek Group PLC | | | 74,100 | | | | 3,902,319 | |
Metro Bank PLC(a) | | | 76,200 | | | | 3,482,922 | |
| Ted Baker PLC | | | 42,801 | | | | 1,549,433 | |
| Ultra Electronics Holdings PLC | | | 164,450 | | | | 4,455,872 | |
| | | | | | | | 31,276,072 | |
| | | | | | | | | |
| Canada (8.21%) | | | | | | | | |
| Birchcliff Energy, Ltd. | | | 196,500 | | | | 1,009,095 | |
| Crescent Point Energy Corp. | | | 150,228 | | | | 1,486,818 | |
| Gildan Activewear, Inc. | | | 108,975 | | | | 3,055,180 | |
lululemon athletica, Inc.(a) | | | 27,725 | | | | 1,441,700 | |
| Ritchie Bros. Auctioneers, Inc. | | | 188,325 | | | | 6,169,527 | |
| Stantec, Inc. | | | 312,736 | | | | 8,025,451 | |
| TFI International, Inc. | | | 144,411 | | | | 3,144,130 | |
| | | | | | | | 24,331,901 | |
| | | | | | | | | |
| China (8.82%) | | | | | | | | |
| China Medical System Holdings, Ltd. | | | 2,975,600 | | | | 5,141,458 | |
| CSPC Pharmaceutical Group, Ltd. | | | 1,687,000 | | | | 2,342,348 | |
Ctrip.com International, Ltd., ADR(a) | | | 38,325 | | | | 1,935,796 | |
| Man Wah Holdings, Ltd. | | | 10,338,800 | | | | 8,573,188 | |
| Silergy Corp. | | | 263,000 | | | | 4,759,471 | |
| Tencent Holdings, Ltd. | | | 62,000 | | | | 1,940,103 | |
Yum China Holdings, Inc.(a) | | | 42,725 | | | | 1,457,777 | |
| | | | | | | | 26,150,141 | |
| | | Shares | | | | |
| Colombia (0.79%) | | | | | | |
Parex Resources, Inc.(a) | | | 189,633 | | | $ | 2,354,697 | |
| | | | | | | | | |
| Finland (0.73%) | | | | | | | | |
| Metso OYJ | | | 60,326 | | | | 2,163,933 | |
| | | | | | | | | |
| France (2.85%) | | | | | | | | |
| Alten SA | | | 61,299 | | | | 5,194,941 | |
| BioMerieux | | | 8,750 | | | | 1,749,484 | |
| Bureau Veritas SA | | | 64,700 | | | | 1,498,709 | |
| | | | | | | | 8,443,134 | |
| | | | | | | | | |
| Georgia (0.94%) | | | | | | | | |
| BGEO Group PLC | | | 59,700 | | | | 2,783,646 | |
| | | | | | | | | |
| Germany (6.63%) | | | | | | | | |
| Aroundtown Property Holdings PLC | | | 529,737 | | | | 2,752,494 | |
| CTS Eventim AG & Co. KGaA | | | 42,150 | | | | 1,623,749 | |
| GRENKE AG | | | 19,450 | | | | 3,875,082 | |
| Norma Group SE | | | 80,450 | | | | 4,315,985 | |
PATRIZIA Immobilien AG(a) | | | 158,200 | | | | 3,120,847 | |
| Wirecard AG | | | 67,050 | | | | 3,959,367 | |
| | | | | | | | 19,647,524 | |
| | | | | | | | | |
| Hong Kong (4.79%) | | | | | | | | |
| Samsonite International SA | | | 997,560 | | | | 3,853,861 | |
| Value Partners Group, Ltd. | | | 6,791,000 | | | | 6,286,063 | |
| Vitasoy International Holdings, Ltd. | | | 2,057,000 | | | | 4,067,271 | |
| | | | | | | | 14,207,195 | |
| | | | | | | | | |
| India (6.99%) | | | | | | | | |
| AIA Engineering, Ltd. | | | 103,900 | | | | 2,433,970 | |
| Alkem Laboratories, Ltd. | | | 82,174 | | | | 2,518,231 | |
Avenue Supermarts, Ltd.(a)(b)(c) | | | 3,884 | | | | 44,467 | |
| Bajaj Finance, Ltd. | | | 128,750 | | | | 2,554,186 | |
| Crisil, Ltd. | | | 48,500 | | | | 1,483,008 | |
| Indiabulls Housing Finance, Ltd. | | | 134,000 | | | | 2,118,317 | |
WNS Holdings, Ltd., ADR(a) | | | 135,195 | | | | 4,328,944 | |
| Yes Bank, Ltd. | | | 206,950 | | | | 5,244,524 | |
| | | | | | | | 20,725,647 | |
| | | | | | | | | |
| Indonesia (1.07%) | | | | | | | | |
| Bank Rakyat Indonesia Persero Tbk PT | | | 1,763,000 | | | | 1,706,257 | |
| Delfi, Ltd. | | | 893,700 | | | | 1,464,820 | |
| | | | | | | | 3,171,077 | |
| | | | | | | | | |
| Israel (1.19%) | | | | | | | | |
Wix.com, Ltd.(a) | | | 42,800 | | | | 3,528,860 | |
See Notes to Financial Statements.
| 54 | 1.855.377.7325 | www.GrandeurPeakGlobal.com |
| Grandeur Peak International Stalwarts Fund | Portfolio of Investments |
April 30, 2017
| | | Shares | | | | |
| Italy (2.86%) | | | | | | |
| Brembo SpA | | | 86,747 | | | $ | 6,817,708 | |
| DiaSorin SpA | | | 22,290 | | | | 1,670,499 | |
| | | | | | | | 8,488,207 | |
| | | | | | | | | |
| Japan (10.44%) | | | | | | | | |
| Century Tokyo Leasing Corp. | | | 54,600 | | | | 1,880,816 | |
| Create SD Holdings Co., Ltd. | | | 112,400 | | | | 2,639,724 | |
| CyberAgent, Inc. | | | 67,600 | | | | 2,098,192 | |
| Dip Corp. | | | 111,000 | | | | 2,452,505 | |
| Ezaki Glico Co. Ltd. | | | 36,500 | | | | 1,922,000 | |
| MISUMI Group, Inc. | | | 269,000 | | | | 5,094,048 | |
| MonotaRO Co., Ltd. | | | 35,700 | | | | 1,160,911 | |
| Nihon M&A Center, Inc. | | | 254,300 | | | | 8,691,482 | |
| Seria Co., Ltd. | | | 63,000 | | | | 2,825,746 | |
| Suruga Bank, Ltd. | | | 104,600 | | | | 2,185,364 | |
| | | | | | | | 30,950,788 | |
| | | | | | | | | |
| Jordan (0.52%) | | | | | | | | |
| Hikma Pharmaceuticals PLC | | | 61,000 | | | | 1,530,371 | |
| | | | | | | | | |
| Luxembourg (2.14%) | | | | | | | | |
| Grand City Properties SA | | | 206,100 | | | | 3,914,241 | |
| L'Occitane International SA | | | 1,157,250 | | | | 2,425,087 | |
| | | | | | | | 6,339,328 | |
| | | | | | | | | |
| Mexico (1.05%) | | | | | | | | |
| Banregio Grupo Financiero SAB de CV | | | 540,950 | | | | 3,123,532 | |
| | | | | | | | | |
| Netherlands (2.14%) | | | | | | | | |
| Aalberts Industries NV | | | 159,833 | | | | 6,340,945 | |
| | | | | | | | | |
| New Zealand (0.51%) | | | | | | | | |
| Fisher & Paykel Healthcare Corp., Ltd. | | | 217,383 | | | | 1,503,000 | |
| | | | | | | | | |
| Norway (0.62%) | | | | | | | | |
Norwegian Finans Holding ASA(a) | | | 231,238 | | | | 1,838,108 | |
| | | | | | | | | |
| Peru (0.68%) | | | | | | | | |
| Credicorp, Ltd. | | | 13,125 | | | | 2,016,788 | |
| | | | | | | | | |
| Philippines (3.96%) | | | | | | | | |
| Puregold Price Club, Inc. | | | 3,566,200 | | | | 2,976,294 | |
| Robinsons Land Corp. | | | 3,044,000 | | | | 1,562,666 | |
| Robinsons Retail Holdings, Inc. | | | 1,811,320 | | | | 2,878,391 | |
| Security Bank Corp. | | | 1,015,200 | | | | 4,331,845 | |
| | | | | | | | 11,749,196 | |
| | | Shares | | | Value
(Note 2) | |
| Poland (0.49%) | | | | | | |
AmRest Holdings SE(a) | | | 15,500 | | | $ | 1,468,408 | |
| | | | | | | | | |
| South Africa (1.03%) | | | | | | | | |
| EOH Holdings, Ltd. | | | 287,300 | | | | 3,040,957 | |
| | | | | | | | | |
| South Korea (2.19%) | | | | | | | | |
| BGF Retail Co., Ltd. | | | 13,500 | | | | 1,299,103 | |
| LG Household & Health Care, Ltd. | | | 2,900 | | | | 2,207,048 | |
| Loen Entertainment, Inc. | | | 19,000 | | | | 1,467,704 | |
| Mando Corp. | | | 7,550 | | | | 1,526,057 | |
| | | | | | | | 6,499,912 | |
| | | | | | | | | |
| Sweden (2.95%) | | | | | | | | |
| Indutrade AB | | | 181,050 | | | | 4,278,253 | |
| Nibe Industrier AB, Class B | | | 269,600 | | | | 2,389,396 | |
| Sweco AB, Class B | | | 83,200 | | | | 2,063,726 | |
| | | | | | | | 8,731,375 | |
| | | | | | | | | |
| Switzerland (2.16%) | | | | | | | | |
Luxoft Holding, Inc.(a) | | | 35,250 | | | | 2,173,162 | |
| VZ Holding AG | | | 9,810 | | | | 2,728,560 | |
Wizz Air Holdings PLC(a)(b)(c) | | | 66,000 | | | | 1,508,780 | |
| | | | | | | | 6,410,502 | |
| | | | | | | | | |
| Taiwan (1.12%) | | | | | | | | |
| Largan Precision Co., Ltd. | | | 20,000 | | | | 3,324,384 | |
| | | | | | | | | |
| Thailand (0.62%) | | | | | | | | |
| Srisawad Power 1979 PCL | | | 1,427,920 | | | | 1,826,697 | |
| | | | | | | | | |
| United States (3.93%) | | | | | | | | |
EPAM Systems, Inc.(a) | | | 56,650 | | | | 4,362,050 | |
| FirstCash, Inc. | | | 89,462 | | | | 4,647,551 | |
| Genpact, Ltd. | | | 107,750 | | | | 2,631,255 | |
| | | | | | | | 11,640,856 | |
| | | | | | | | | |
| Vietnam (1.05%) | | | | | | | | |
| Vietnam Dairy Products JSC | | | 476,874 | | | | 3,103,188 | |
| | | | | | | | | |
TOTAL COMMON STOCKS
(Cost $244,959,134) | | | | | | | 288,460,073 | |
| | | | | | | | | |
| PREFERRED STOCKS (1.40%) | |
| Brazil (0.91%) | | | | | | | | |
| Itau Unibanco Holding SA | | | 216,830 | | | | 2,680,616 | |
See Notes to Financial Statements.
| Annual Report | April 30, 2017 | 55 |
| Grandeur Peak International Stalwarts Fund | Portfolio of Investments |
April 30, 2017
| | | Shares | | | Value
(Note 2) | |
| Germany (0.49%) | | | | | | |
| Fuchs Petrolub SE | | | 28,400 | | | $ | 1,464,980 | |
| | | | | | | | |
TOTAL PREFERRED STOCKS
(Cost $3,027,416) | | | | 4,145,596 | |
| | | | | | | | |
TOTAL INVESTMENTS (98.71%)
(Cost $247,986,550) | | | $ | 292,605,669 |
| | | | | | | | | |
| Other Assets In Excess Of Liabilities (1.29%) | | | | 3,833,208 | |
| | | | | | | | | |
| NET ASSETS (100.00%) | | | | | | $ | 296,438,877 |
(a) | Non-Income Producing Security. |
(b) | Security exempt from registration under Rule 144A of the Securities Act of 1933. These securities may be resold in the ordinary course of business in transactions exempt from registration, normally to qualified institutional buyers. As of April 30, 2017, these securities had a total aggregate market value of $1,553,247 representing 0.52% of net assets. |
(c) | Security was purchased pursuant to Regulation S under the Securities Act of 1933, which exempts securities offered and sold outside of the United States from registration. Such security cannot be sold in the United States without either an effective registration statement filed pursuant to the Securities Act of 1933, or pursuant to an exemption from registration. The security has been deemed liquid under guidelines approved by the Fund's Board of Trustees. As of April 30, 2017, the aggregate market value of those securities was $1,553,247, representing 0.53% of net assets. |
For Fund compliance purposes, the Fund's geographical classifications refer to any one or more of the country sub-classifications used by one or more widely recognized market indexes or ratings group indexes, and/or as defined by Fund management. This definition may not apply for purposes of this report, which may combine sub-classifications for reporting ease. Geographical regions are shown as a percentage of net assets.
See Notes to Financial Statements.
| 56 | 1.855.377.7325 | www.GrandeurPeakGlobal.com |
Grandeur Peak Funds® | Statements of Assets and Liabilities |
April 30, 2017
| | | Grandeur Peak Emerging Markets Opportunities Fund | | | Grandeur Peak Global Micro Cap Fund | | | Grandeur Peak Global Opportunities Fund | | | Grandeur Peak Global Reach Fund | |
| ASSETS | | | | | | | | | | | | |
| Investments, at value (Cost ‐ see below) | | $ | 394,124,807 | | | $ | 35,740,238 | | | $ | 697,207,067 | | | $ | 315,827,711 | |
| Cash | | | 25,727,452 | | | | 921,454 | | | | 3,774,600 | | | | 10,767,795 | |
| Foreign cash, at value (Cost $667,924, $13,808, $297,606 and $25,662, respectively) | | | 668,666 | | | | 13,787 | | | | 297,980 | | | | 25,744 | |
| Dividends and interest receivable | | | 571,345 | | | | 84,109 | | | | 1,588,136 | | | | 610,152 | |
| Receivable for investments sold | | | 182,970 | | | | 207,332 | | | | 364,827 | | | | 348,560 | |
| Receivable for fund shares subscribed | | | 43,011 | | | | 5,680 | | | | 453,377 | | | | 389,392 | |
| Prepaid and other assets | | | 12,775 | | | | 4,574 | | | | 10,799 | | | | 3,513 | |
| Total assets | | | 421,331,026 | | | | 36,977,174 | | | | 703,696,786 | | | | 327,972,867 | |
| | | | | | | | | | | | | | | | | |
| LIABILITIES | | | | | | | | | | | | | | | | |
| Payable for investments purchased | | | 1,683,964 | | | | 219,814 | | | | 2,755,281 | | | | 541,133 | |
| Foreign capital gains tax | | | 1,885,895 | | | | 39,816 | | | | 527,943 | | | | 311,736 | |
| Payable for fund shares redeemed | | | 102,086 | | | | – | | | | 261,759 | | | | 401,262 | |
| Advisory fees payable | | | 457,922 | | | | 40,111 | | | | 681,019 | | | | 288,664 | |
| Administration fees payable | | | 33,022 | | | | 9,113 | | | | 47,357 | | | | 30,239 | |
| Custodian fees payable | | | 148,548 | | | | 19,796 | | | | 87,886 | | | | 69,033 | |
| Payable for trustee fees and expenses | | | 3,613 | | | | 316 | | | | 6,045 | | | | 2,800 | |
| Payable for chief compliance officer fee | | | 1,471 | | | | 129 | | | | 2,461 | | | | 1,140 | |
| Payable for principal financial officer fees | | | 264 | | | | 23 | | | | 441 | | | | 204 | |
| Distribution and service fees payable | | | 3,698 | | | | – | | | | 33,495 | | | | 13,731 | |
| Payable for transfer agency fees | | | 6,594 | | | | 6,717 | | | | 14,413 | | | | 11,499 | |
| Accrued expenses and other liabilities | | | 38,515 | | | | 21,694 | | | | 49,409 | | | | 45,007 | |
| Total liabilities | | | 4,365,592 | | | | 357,529 | | | | 4,467,509 | | | | 1,716,448 | |
| NET ASSETS | | $ | 416,965,434 | | | $ | 36,619,645 | | | $ | 699,229,277 | | | $ | 326,256,419 | |
| | | | | | | | | | | | | | | | | |
| NET ASSETS CONSISTS OF | | | | | | | | | | | | | | | | |
| Paid‐in capital (Note 5) | | $ | 377,820,779 | | | $ | 30,468,106 | | | $ | 521,755,173 | | | $ | 275,773,583 | |
| Accumulated net investment loss | | | (861,542 | ) | | | (2,594 | ) | | | (725,823 | ) | | | (218,094 | ) |
| Accumulated net realized gain/(loss) | | | (11,362,541 | ) | | | 770,594 | | | | 11,854,014 | | | | (5,942,624 | ) |
| Net unrealized appreciation | | | 51,368,738 | | | | 5,383,539 | | | | 166,345,913 | | | | 56,643,554 | |
| NET ASSETS | | $ | 416,965,434 | | | $ | 36,619,645 | | | $ | 699,229,277 | | | $ | 326,256,419 | |
| | | | | | | | | | | | | | | | | |
| INVESTMENTS, AT COST | | $ | 340,871,129 | | | $ | 30,316,892 | | | $ | 530,323,879 | | | $ | 258,872,734 | |
| | | | | | | | | | | | | | | | | |
| PRICING OF SHARES | | | | | | | | | | | | | | | | |
| Investor Class | | | | | | | | | | | | | | | | |
| Net Assets | | $ | 18,074,111 | | | $ | – | | | $ | 166,283,755 | | | $ | 67,573,712 | |
| Net Asset Value, offering and redemption price per share | | $ | 11.55 | | | $ | – | | | $ | 3.52 | | | $ | 14.52 | |
| Shares of beneficial interest outstanding | | | 1,564,889 | | | | – | | | | 47,183,506 | | | | 4,653,687 | |
| Institutional Class | | | | | | | | | | | | | | | | |
| Net Assets | | $ | 398,891,323 | | | $ | 36,619,645 | | | $ | 532,945,522 | | | $ | 258,682,707 | |
| Net Asset Value, offering and redemption price per share | | $ | 11.60 | | | $ | 11.98 | | | $ | 3.56 | | | $ | 14.55 | |
| Shares of beneficial interest outstanding | | | 34,397,024 | | | | 3,057,522 | | | | 149,734,528 | | | | 17,782,219 | |
See Notes to Financial Statements.
| Annual Report | April 30, 2017 | 57 |
Grandeur Peak Funds® | Statements of Assets and Liabilities |
April 30, 2017
| | | Grandeur Peak Global Stalwarts Fund | | | Grandeur Peak International Opportunities Fund | | | Grandeur Peak International Stalwarts Fund | |
| ASSETS | | | | | | | | | |
| Investments, at value (Cost ‐ see below) | | $ | 107,150,117 | | | $ | 759,509,097 | | | $ | 292,605,669 | |
| Cash | | | 3,029,426 | | | | 13,152,455 | | | | 6,019,065 | |
| Foreign cash, at value (Cost $28,265, $343,340 and $54,279, respectively) | | | 29,330 | | | | 355,859 | | | | 55,703 | |
| Dividends and interest receivable | | | 158,929 | | | | 2,092,205 | | | | 575,467 | |
| Receivable for investments sold | | | 454,059 | | | | 4,241,248 | | | | 1,963,471 | |
| Receivable for fund shares subscribed | | | 282,801 | | | | 312,560 | | | | 824,222 | |
| Prepaid and other assets | | | 5,603 | | | | 10,794 | | | | 8,050 | |
| Total assets | | | 111,110,265 | | | | 779,674,218 | | | | 302,051,647 | |
| | | | | | | | | | | | | |
| LIABILITIES | | | | | | | | | | | | |
| Payable for investments purchased | | | 1,780,594 | | | | 521,109 | | | | 4,884,875 | |
| Foreign capital gains tax | | | 109,633 | | | | 1,109,585 | | | | 241,008 | |
| Payable for fund shares redeemed | | | 51,091 | | | | 133,670 | | | | 163,863 | |
| Advisory fees payable | | | 63,360 | | | | 748,785 | | | | 189,433 | |
| Administration fees payable | | | 9,446 | | | | 52,142 | | | | 19,747 | |
| Custodian fees payable | | | 25,369 | | | | 117,892 | | | | 54,595 | |
| Payable for trustee fees and expenses | | | 900 | | | | 6,657 | | | | 2,497 | |
| Payable for chief compliance officer fee | | | 366 | | | | 2,710 | | | | 1,017 | |
| Payable for principal financial officer fees | | | 66 | | | | 486 | | | | 182 | |
| Distribution and service fees payable | | | 12,094 | | | | 15,976 | | | | 6,154 | |
| Payable for transfer agency fees | | | 9,688 | | | | 11,044 | | | | 14,228 | |
| Accrued expenses and other liabilities | | | 25,481 | | | | 46,805 | | | | 35,171 | |
| Total liabilities | | | 2,088,088 | | | | 2,766,861 | | | | 5,612,770 | |
| NET ASSETS | | $ | 109,022,177 | | | $ | 776,907,357 | | | $ | 296,438,877 | |
| | | | | | | | | | | | | |
| NET ASSETS CONSISTS OF | | | | | | | | | | | | |
| Paid‐in capital (Note 5) | | $ | 93,925,559 | | | $ | 604,870,230 | | | $ | 251,771,757 | |
| Accumulated net investment loss | | | (1,806 | ) | | | (614,723 | ) | | | (134,092 | ) |
| Accumulated net realized gain | | | 497,047 | | | | 541,059 | | | | 422,076 | |
| Net unrealized appreciation | | | 14,601,377 | | | | 172,110,791 | | | | 44,379,136 | |
| NET ASSETS | | $ | 109,022,177 | | | $ | 776,907,357 | | | $ | 296,438,877 | |
| | | | | | | | | | | | | |
| INVESTMENTS, AT COST | | $ | 92,439,742 | | | $ | 586,240,467 | | | $ | 247,986,550 | |
| | | | | | | | | | | | | |
| PRICING OF SHARES | | | | | | | | | | | | |
| Investor Class | | | | | | | | | | | | |
| Net Assets | | $ | 61,211,588 | | | $ | 78,403,224 | | | $ | 31,045,462 | |
| Net Asset Value, offering and redemption price per share | | $ | 12.76 | | | $ | 3.55 | | | $ | 13.04 | |
| Shares of beneficial interest outstanding | | | 4,798,138 | | | | 22,057,519 | | | | 2,380,178 | |
| Institutional Class | | | | | | | | | | | | |
| Net Assets | | $ | 47,810,589 | | | $ | 698,504,133 | | | $ | 265,393,415 | |
| Net Asset Value, offering and redemption price per share | | $ | 12.79 | | | $ | 3.57 | | | $ | 13.06 | |
| Shares of beneficial interest outstanding | | | 3,736,720 | | | | 195,717,526 | | | | 20,319,276 | |
See Notes to Financial Statements.
| 58 | 1.855.377.7325 | www.GrandeurPeakGlobal.com |
Grandeur Peak Funds® | Statements of Operations |
For the Year Ended April 30, 2017
| | | Grandeur Peak Emerging Markets Opportunities Fund | | | Grandeur Peak Global Micro Cap Fund | | | Grandeur Peak Global Opportunities Fund | | | Grandeur Peak Global Reach Fund | |
| INVESTMENT INCOME | | | | | | | | | | | | |
| Dividends | | $ | 8,159,352 | | | $ | 767,194 | | | $ | 10,571,380 | | | $ | 5,043,356 | |
| Interest | | | 1,697 | | | | 75 | | | | 215 | | | | 358 | |
| Foreign taxes withheld | | | (806,910 | ) | | | (75,660 | ) | | | (779,972 | ) | | | (400,769 | ) |
| Total investment income | | | 7,354,139 | | | | 691,609 | | | | 9,791,623 | | | | 4,642,945 | |
| | | | | | | | | | | | | | | | | |
| EXPENSES | | | | | | | | | | | | | | | | |
| Investment advisor fees (Note 6) | | | 5,220,054 | | | | 491,586 | | | | 8,004,135 | | | | 3,241,364 | |
| Administrative fees | | | 155,407 | | | | 27,530 | | | | 243,342 | | | | 125,873 | |
| Distribution and service fees ‐ Investor Class | | | 39,204 | | | | – | | | | 401,634 | | | | 152,855 | |
| Transfer agent fees | | | 37,654 | | | | 37,715 | | | | 77,504 | | | | 61,911 | |
| Professional fees | | | 42,603 | | | | 30,660 | | | | 49,378 | | | | 49,737 | |
| Printing fees | | | 14,032 | | | | 3,756 | | | | 38,232 | | | | 24,509 | |
| Registration fees | | | 35,101 | | | | 18,208 | | | | 36,329 | | | | 34,189 | |
| Custodian fees | | | 459,589 | | | | 65,467 | | | | 281,767 | | | | 223,676 | |
| Trustee fees and expenses | | | 8,321 | | | | 715 | | | | 13,764 | | | | 6,293 | |
| Chief compliance officer fees | | | 9,096 | | | | 771 | | | | 15,057 | | | | 6,914 | |
| Principal financial officer fees | | | 1,650 | | | | 140 | | | | 2,732 | | | | 1,254 | |
| Offering costs | | | – | | | | 28,369 | | | | – | | | | – | |
| Other expenses | | | 18,470 | | | | 5,323 | | | | 25,338 | | | | 16,879 | |
| Total expenses | | | 6,041,181 | | | | 710,240 | | | | 9,189,212 | | | | 3,945,454 | |
| Waiver of investment advisory fees | | | – | | | | – | | | | (149,794 | ) | | | – | |
| Less fees waived/reimbursed by investment advisor (Note 6) | | | – | | | | (54,685 | ) | | | – | | | | – | |
| Total net expenses | | | 6,041,181 | | | | 655,555 | | | | 9,039,418 | | | | 3,945,454 | |
| NET INVESTMENT INCOME | | | 1,312,958 | | | | 36,054 | | | | 752,205 | | | | 697,491 | |
| | | | | | | | | | | | | | | | | |
| REALIZED AND UNREALIZED GAIN/(LOSS) ON INVESTMENTS | | | | | | | | | | | | | | | | |
| Net realized gain on investments | | | 1,232,012 | | | | 1,202,161 | | | | 13,124,441 | | | | 7,239,075 | |
| Net realized loss on foreign currency transactions | | | (186,927 | ) | | | (6,218 | ) | | | (8,627 | ) | | | (146,548 | ) |
| Net change in unrealized appreciation on investments (net of change in foreign capital gains tax of $1,818,794, $39,816, $527,943 and $311,736, respectively) | | | 63,077,707 | | | | 3,992,221 | | | | 91,462,351 | | | | 42,807,727 | |
| Net change in unrealized depreciation on translation of assets and liabilities in foreign currencies | | | (15,926 | ) | | | (4,337 | ) | | | (19,641 | ) | | | (12,319 | ) |
| NET REALIZED AND UNREALIZED GAIN ON INVESTMENTS AND FOREIGN CURRENCY TRANSACTIONS | | | 64,106,866 | | | | 5,183,827 | | | | 104,558,524 | | | | 49,887,935 | |
| NET INCREASE IN NET ASSETS RESULTING FROM OPERATIONS | | $ | 65,419,824 | | | $ | 5,219,881 | | | $ | 105,310,729 | | | $ | 50,585,426 | |
See Notes to Financial Statements.
| Annual Report | April 30, 2017 | 59 |
Grandeur Peak Funds® | Statements of Operations |
For the Year Ended April 30, 2017
| | | Grandeur Peak Global Stalwarts Fund | | | Grandeur Peak International Opportunities Fund | | | Grandeur Peak International Stalwarts Fund | |
| INVESTMENT INCOME | | | | | | | | | |
| Dividends | | $ | 865,843 | | | $ | 13,931,646 | | | $ | 3,155,229 | |
| Interest | | | 548 | | | | 943 | | | | 219 | |
| Foreign taxes withheld | | | (62,838 | ) | | | (1,297,180 | ) | | | (274,325 | ) |
| Total investment income | | | 803,553 | | | | 12,635,409 | | | | 2,881,123 | |
| EXPENSES | | | | | | | | | | | | |
| Investment advisor fees (Note 6) | | | 566,716 | | | | 8,965,975 | | | | 1,647,792 | |
| Recoupment of previously waived fees (Note 6) | | | – | | | | – | | | | 51,467 | |
| Administrative fees | | | 31,565 | | | | 272,333 | | | | 79,546 | |
| Distribution and service fees ‐ Investor Class | | | 97,775 | | | | 181,551 | | | | 62,505 | |
| Transfer agent fees | | | 49,416 | | | | 60,703 | | | | 58,345 | |
| Professional fees | | | 30,810 | | | | 46,788 | | | | 41,469 | |
| Printing fees | | | 6,810 | | | | 26,192 | | | | 9,560 | |
| Registration fees | | | 31,393 | | | | 34,936 | | | | 34,074 | |
| Custodian fees | | | 76,848 | | | | 387,800 | | | | 145,510 | |
| Trustee fees and expenses | | | 1,746 | | | | 15,245 | | | | 4,803 | |
| Chief compliance officer fees | | | 1,644 | | | | 16,848 | | | | 4,797 | |
| Principal financial officer fees | | | 298 | | | | 3,056 | | | | 870 | |
| Offering costs | | | 22,792 | | | | – | | | | 23,592 | |
| Other expenses | | | 7,730 | | | | 27,470 | | | | 9,784 | |
| Total expenses | | | 925,543 | | | | 10,038,897 | | | | 2,174,114 | |
| Waiver of investment advisory fees | | | – | | | | (220,688 | ) | | | – | |
| Less fees waived/reimbursed by investment advisor (Note 6) | | | (45,295 | ) | | | – | | | | – | |
| Total net expenses | | | 880,248 | | | | 9,818,209 | | | | 2,174,114 | |
| NET INVESTMENT INCOME/(LOSS) | | | (76,695 | ) | | | 2,817,200 | | | | 707,009 | |
| | | | | | | | | | | | | |
| REALIZED AND UNREALIZED GAIN/(LOSS) ON INVESTMENTS | | | | | | | | | | | | |
| Net realized gain on investments | | | 1,013,794 | | | | 13,736,267 | | | | 2,172,295 | |
| Net realized gain/(loss) on foreign currency transactions | | | (76,012 | ) | | | 1,418,423 | | | | (379,466 | ) |
| Net change in unrealized appreciation on investments (net of change in foreign capital gains tax of $85,617, $1,109,585 and $108,526, respectively) | | | 12,319,031 | | | | 101,731,481 | | | | 37,633,261 | |
| Net change in unrealized depreciation on translation of assets and liabilities in foreign currencies | | | (2,475 | ) | | | (102,584 | ) | | | (17,421 | ) |
| NET REALIZED AND UNREALIZED GAIN ON INVESTMENTS AND FOREIGN CURRENCY TRANSACTIONS | | | 13,254,338 | | | | 116,783,587 | | | | 39,408,669 | |
| NET INCREASE IN NET ASSETS RESULTING FROM OPERATIONS | | $ | 13,177,643 | | | $ | 119,600,787 | | | $ | 40,115,678 | |
See Notes to Financial Statements.
| 60 | 1.855.377.7325 | www.GrandeurPeakGlobal.com |
| Grandeur Peak Emerging Markets Opportunities Fund | Statements of Changes in Net Assets |
| | | For the Year Ended April 30, 2017 | | | For the Year Ended April 30, 2016 | |
| OPERATIONS | | | | | | |
| Net investment income | | $ | 1,312,958 | | | $ | 2,937,123 | |
| Net realized gain/(loss) | | | 1,045,085 | | | | (6,742,695 | ) |
| Net change in unrealized appreciation/(depreciation) | | | 63,061,781 | | | | (50,774,647 | ) |
| Net increase/(decrease) in net assets resulting from operations | | | 65,419,824 | | | | (54,580,219 | ) |
| | | | | | | | | |
| DISTRIBUTIONS TO SHAREHOLDERS (NOTE 3) | | | | | | | | |
| Net investment income | | | | | | | | |
| Investor Class | | | (66,810 | ) | | | – | |
| Institutional Class | | | (1,961,876 | ) | | | – | |
| Net realized gains on investments | | | | | | | | |
| Investor Class | | | – | | | | (784,769 | ) |
| Institutional Class | | | – | | | | (12,306,838 | ) |
| Net decrease in net assets from distributions | | | (2,028,686 | ) | | | (13,091,607 | ) |
| | | | | | | | | |
| CAPITAL SHARE TRANSACTIONS (NOTE 5) | | | | | | | | |
| Investor Class | | | | | | | | |
| Proceeds from sales of shares | | | 490,678 | | | | 1,471,368 | |
| Distributions reinvested | | | 65,088 | | | | 766,668 | |
| Cost of shares redeemed | | | (6,113,284 | ) | | | (16,030,060 | ) |
| Redemption fees | | | 130 | | | | 2,624 | |
| Net decrease from capital shares transactions | | | (5,557,388 | ) | | | (13,789,400 | ) |
| | | | | | | | | |
| Institutional Class | | | | | | | | |
| Proceeds from sales of shares | | | 15,112,959 | | | | 11,860,125 | |
| Distributions reinvested | | | 1,775,141 | | | | 11,059,498 | |
| Cost of shares redeemed | | | (27,797,275 | ) | | | (39,363,942 | ) |
| Redemption fees | | | 110 | | | | 1,324 | |
| Net decrease from capital shares transactions | | | (10,909,065 | ) | | | (16,442,995 | ) |
| | | | | | | | | |
| Net increase/(decrease) in net assets | | | 46,924,685 | | | | (97,904,221 | ) |
| | | | | | | | | |
| NET ASSETS | | | | | | | | |
| Beginning of year | | | 370,040,749 | | | | 467,944,970 | |
| End of year* | | $ | 416,965,434 | | | $ | 370,040,749 | |
| | | | | | | | | |
| *Including accumulated net investment income/(loss) of: | | $ | (861,542 | ) | | $ | 895,515 | |
| | | | | | | | | |
| OTHER INFORMATION | | | | | | | | |
| Shares Transactions | | | | | | | | |
| Investor Class | | | | | | | | |
| Issued | | | 46,050 | | | | 144,484 | |
| Issued to shareholders in reinvestment of distributions | | | 6,419 | | | | 79,530 | |
| Redeemed | | | (580,153 | ) | | | (1,598,285 | ) |
| Net decrease in share transactions | | | (527,684 | ) | | | (1,374,271 | ) |
| | | | | | | | | |
| Institutional Class | | | | | | | | |
| Issued | | | 1,431,423 | | | | 1,186,242 | |
| Issued to shareholders in reinvestment of distributions | | | 174,375 | | | | 1,143,692 | |
| Redeemed | | | (2,673,849 | ) | | | (4,011,166 | ) |
| Net decrease in share transactions | | | (1,068,051 | ) | | | (1,681,232 | ) |
See Notes to Financial Statements.
| Annual Report | April 30, 2017 | 61 |
| Grandeur Peak Global Micro Cap Fund | Statements of Changes in Net Assets |
| | | For the Year Ended April 30, 2017 | | | For the Period October 21, 2015 (Commencement of Operations) to April 30, 2016 | |
| OPERATIONS | | | | | | |
| Net investment income/(loss) | | $ | 36,054 | | | $ | (59,607 | ) |
| Net realized gain/(loss) | | | 1,195,943 | | | | (97,724 | ) |
| Net change in unrealized appreciation | | | 3,987,884 | | | | 1,395,655 | |
| Net increase in net assets resulting from operations | | | 5,219,881 | | | | 1,238,324 | |
| | | | | | | | | |
| DISTRIBUTIONS TO SHAREHOLDERS (NOTE 3) | | | | | | | | |
| Net investment income | | | | | | | | |
| Institutional Class | | | (72,387 | ) | | | – | |
| Net realized gains on investments | | | | | | | | |
| Institutional Class | | | (318,826 | ) | | | – | |
| Net decrease in net assets from distributions | | | (391,213 | ) | | | – | |
| | | | | | | | | |
| CAPITAL SHARE TRANSACTIONS (NOTE 5) | | | | | | | | |
| Institutional Class | | | | | | | | |
| Proceeds from sales of shares | | | 2,802,634 | | | | 31,071,815 | |
| Distributions reinvested | | | 378,056 | | | | – | |
| Cost of shares redeemed | | | (2,125,169 | ) | | | (1,575,834 | ) |
| Redemption fees | | | 2 | | | | 1,149 | |
| Net increase from capital shares transactions | | | 1,055,523 | | | | 29,497,130 | |
| | | | | | | | | |
| Net increase in net assets | | | 5,884,191 | | | | 30,735,454 | |
| | | | | | | | | |
| NET ASSETS | | | | | | | | |
| Beginning of year | | | 30,735,454 | | | | – | |
| End of year* | | $ | 36,619,645 | | | $ | 30,735,454 | |
| *Including accumulated net investment loss of: | | $ | (2,594 | ) | | $ | (13,704 | ) |
| | | | | | | | | |
| OTHER INFORMATION | | | | | | | | |
| Shares Transactions | | | | | | | | |
| Institutional Class | | | | | | | | |
| Issued | | | 257,322 | | | | 3,118,442 | |
| Issued to shareholders in reinvestment of distributions | | | 34,940 | | | | – | |
| Redeemed | | | (194,608 | ) | | | (158,574 | ) |
| Net increase in share transactions | | | 97,654 | | | | 2,959,868 | |
See Notes to Financial Statements.
| 62 | 1.855.377.7325 | www.GrandeurPeakGlobal.com |
| Grandeur Peak Global Opportunities Fund | Statements of Changes in Net Assets |
| | | For the Year Ended April 30, 2017 | | | For the Year Ended April 30, 2016 | |
| OPERATIONS | | | | | | |
| Net investment income | | $ | 752,205 | | | $ | 1,497,876 | |
| Net realized gain | | | 13,115,814 | | | | 16,758,288 | |
| Net change in unrealized appreciation/(depreciation) | | | 91,442,710 | | | | (56,974,221 | ) |
| Net increase/(decrease) in net assets resulting from operations | | | 105,310,729 | | | | (38,718,057 | ) |
| | | | | | | | | |
| DISTRIBUTIONS TO SHAREHOLDERS (NOTE 3) | | | | | | | | |
| Net investment income | | | | | | | | |
| Investor Class | | | – | | | | (109,124 | ) |
| Institutional Class | | | (682,795 | ) | | | (1,035,196 | ) |
| Net realized gains on investments | | | | | | | | |
| Investor Class | | | (208,741 | ) | | | (13,697,007 | ) |
| Institutional Class | | | (563,234 | ) | | | (34,852,047 | ) |
| Net decrease in net assets from distributions | | | (1,454,770 | ) | | | (49,693,374 | ) |
| | | | | | | | | |
| CAPITAL SHARE TRANSACTIONS (NOTE 5) | | | | | | | | |
| Investor Class | | | | | | | | |
| Proceeds from sales of shares | | | 16,005,788 | | | | 16,451,459 | |
| Distributions reinvested | | | 199,029 | | | | 13,160,455 | |
| Cost of shares redeemed | | | (50,076,349 | ) | | | (33,495,791 | ) |
| Redemption fees | | | 1,088 | | | | 981 | |
| Net decrease from capital shares transactions | | | (33,870,444 | ) | | | (3,882,896 | ) |
| | | | | | | | | |
| Institutional Class | | | | | | | | |
| Proceeds from sales of shares | | | 55,465,734 | | | | 21,799,233 | |
| Distributions reinvested | | | 1,194,887 | | | | 34,499,590 | |
| Cost of shares redeemed | | | (52,607,866 | ) | | | (66,675,634 | ) |
| Redemption fees | | | 4,876 | | | | 663 | |
| Net increase/(decrease) from capital shares transactions | | | 4,057,631 | | | | (10,376,148 | ) |
| | | | | | | | | |
| Net increase/(decrease) in net assets | | | 74,043,146 | | | | (102,670,475 | ) |
| | | | | | | | | |
| NET ASSETS | | | | | | | | |
| Beginning of year | | | 625,186,131 | | | | 727,856,606 | |
| End of year* | | $ | 699,229,277 | | | $ | 625,186,131 | |
| | | | | | | | | |
| *Including accumulated net investment loss of: | | $ | (725,823 | ) | | $ | (666,687 | ) |
| | | | | | | | | |
| OTHER INFORMATION | | | | | | | | |
| Shares Transactions | | | | | | | | |
| Investor Class | | | | | | | | |
| Issued | | | 4,969,762 | | | | 5,378,903 | |
| Issued to shareholders in reinvestment of distributions | | | 62,984 | | | | 4,386,818 | |
| Redeemed | | | (15,424,679 | ) | | | (10,866,076 | ) |
| Net decrease in share transactions | | | (10,391,933 | ) | | | (1,100,355 | ) |
| | | | | | | | | |
| Institutional Class | | | | | | | | |
| Issued | | | 16,979,178 | | | | 7,034,568 | |
| Issued to shareholders in reinvestment of distributions | | | 374,573 | | | | 11,423,705 | |
| Redeemed | | | (16,596,520 | ) | | | (21,633,925 | ) |
| Net increase/(decrease) in share transactions | | | 757,231 | | | | (3,175,652 | ) |
See Notes to Financial Statements.
| Annual Report | April 30, 2017 | 63 |
| Grandeur Peak Global Reach Fund | Statements of Changes in Net Assets |
| | | For the Year Ended April 30, 2017 | | | For the Year Ended April 30, 2016 | |
| OPERATIONS | | | | | | |
| Net investment income | | $ | 697,491 | | | $ | 866,968 | |
| Net realized gain/(loss) | | | 7,092,527 | | | | (10,392,458 | ) |
| Net change in unrealized appreciation/(depreciation) | | | 42,795,408 | | | | (14,065,512 | ) |
| Net increase/(decrease) in net assets resulting from operations | | | 50,585,426 | | | | (23,591,002 | ) |
| | | | | | | | | |
| DISTRIBUTIONS TO SHAREHOLDERS (NOTE 3) | | | | | | | | |
| Net investment income | | | | | | | | |
| Investor Class | | | (84,133 | ) | | | (31,050 | ) |
| Institutional Class | | | (681,502 | ) | | | (548,683 | ) |
| Net realized gains on investments | | | | | | | | |
| Investor Class | | | – | | | | (2,531,840 | ) |
| Institutional Class | | | – | | | | (8,291,704 | ) |
| Net decrease in net assets from distributions | | | (765,635 | ) | | | (11,403,277 | ) |
| | | | | | | | | |
| CAPITAL SHARE TRANSACTIONS (NOTE 5) | | | | | | | | |
| Investor Class | | | | | | | | |
| Proceeds from sales of shares | | | 4,112,844 | | | | 8,664,894 | |
| Distributions reinvested | | | 81,122 | | | | 2,432,032 | |
| Cost of shares redeemed | | | (14,422,937 | ) | | | (22,513,189 | ) |
| Redemption fees | | | 426 | | | | 112 | |
| Net decrease from capital shares transactions | | | (10,228,545 | ) | | | (11,416,151 | ) |
| | | | | | | | | |
| Institutional Class | | | | | | | | |
| Proceeds from sales of shares | | | 24,646,538 | | | | 14,482,195 | |
| Distributions reinvested | | | 642,714 | | | | 8,452,696 | |
| Cost of shares redeemed | | | (27,368,439 | ) | | | (35,375,478 | ) |
| Redemption fees | | | 1,027 | | | | 1,064 | |
| Net decrease from capital shares transactions | | | (2,078,160 | ) | | | (12,439,523 | ) |
| | | | | | | | | |
| Net increase/(decrease) in net assets | | | 37,513,086 | | | | (58,849,953 | ) |
| | | | | | | | | |
| NET ASSETS | | | | | | | | |
| Beginning of year | | | 288,743,333 | | | | 347,593,286 | |
| End of year* | | $ | 326,256,419 | | | $ | 288,743,333 | |
| | | | | | | | | |
| *Including accumulated net investment loss of: | | $ | (218,094 | ) | | $ | (102,771 | ) |
| | | | | | | | | |
| OTHER INFORMATION | | | | | | | | |
| Shares Transactions | | | | | | | | |
| Investor Class | | | | | | | | |
| Issued | | | 318,050 | | | | 687,256 | |
| Issued to shareholders in reinvestment of distributions | | | 6,264 | | | | 199,838 | |
| Redeemed | | | (1,110,221 | ) | | | (1,845,147 | ) |
| Net decrease in share transactions | | | (785,907 | ) | | | (958,053 | ) |
| | | | | | | | | |
| Institutional Class | | | | | | | | |
| Issued | | | 1,860,022 | | | | 1,168,635 | |
| Issued to shareholders in reinvestment of distributions | | | 49,592 | | | | 694,552 | |
| Redeemed | | | (2,115,611 | ) | | | (2,925,982 | ) |
| Net decrease in share transactions | | | (205,997 | ) | | | (1,062,795 | ) |
See Notes to Financial Statements.
| 64 | 1.855.377.7325 | www.GrandeurPeakGlobal.com |
| Grandeur Peak Global Stalwarts Fund | Statements of Changes in Net Assets |
| | | For the Year Ended April 30, 2017 | | | For the Period September 2, 2015 (Commencement of Operations) to April 30, 2016 | |
| OPERATIONS | | | | | | |
| Net investment income/(loss) | | $ | (76,695 | ) | | $ | 16,435 | |
| Net realized gain/(loss) | | | 937,782 | | | | (316,587 | ) |
| Net change in unrealized appreciation | | | 12,316,556 | | | | 2,284,821 | |
| Net increase in net assets resulting from operations | | | 13,177,643 | | | | 1,984,669 | |
| | | | | | | | | |
| DISTRIBUTIONS TO SHAREHOLDERS (NOTE 3) | | | | | | | | |
| Net investment income | | | | | | | | |
| Investor Class | | | (38,237 | ) | | | (1,406 | ) |
| Institutional Class | | | (70,513 | ) | | | (1,599 | ) |
| Net realized gains on investments | | | | | | | | |
| Investor Class | | | – | | | | (5,451 | ) |
| Institutional Class | | | – | | | | (4,017 | ) |
| Net decrease in net assets from distributions | | | (108,750 | ) | | | (12,473 | ) |
| | | | | | | | | |
| CAPITAL SHARE TRANSACTIONS (NOTE 5) | | | | | | | | |
| Investor Class | | | | | | | | |
| Proceeds from sales of shares | | | 40,939,429 | | | | 19,927,627 | |
| Distributions reinvested | | | 37,612 | | | | 6,798 | |
| Cost of shares redeemed | | | (6,232,494 | ) | | | (1,840,013 | ) |
| Redemption fees | | | 1,969 | | | | 756 | |
| Net increase from capital shares transactions | | | 34,746,516 | | | | 18,095,168 | |
| | | | | | | | | |
| Institutional Class | | | | | | | | |
| Proceeds from sales of shares | | | 27,023,764 | | | | 17,799,288 | |
| Distributions reinvested | | | 66,016 | | | | 5,140 | |
| Cost of shares redeemed | | | (2,576,566 | ) | | | (1,178,526 | ) |
| Redemption fees | | | 216 | | | | 72 | |
| Net increase from capital shares transactions | | | 24,513,430 | | | | 16,625,974 | |
| | | | | | | | | |
| Net increase in net assets | | | 72,328,839 | | | | 36,693,338 | |
| | | | | | | | | |
| NET ASSETS | | | | | | | | |
| Beginning of year | | | 36,693,338 | | | | – | |
| End of year* | | $ | 109,022,177 | | | $ | 36,693,338 | |
| *Including accumulated net investment income/(loss) of: | | $ | (1,806 | ) | | $ | 108,751 | |
| | | | | | | | | |
| OTHER INFORMATION | | | | | | | | |
| Shares Transactions | | | | | | | | |
| Investor Class | | | | | | | | |
| Issued | | | 3,565,906 | | | | 1,940,844 | |
| Issued to shareholders in reinvestment of distributions | | | 3,323 | | | | 639 | |
| Redeemed | | | (533,831 | ) | | | (178,743 | ) |
| Net increase in share transactions | | | 3,035,398 | | | | 1,762,740 | |
| Institutional Class | | | | | | | | |
| Issued | | | 2,334,427 | | | | 1,727,174 | |
| Issued to shareholders in reinvestment of distributions | | | 5,816 | | | | 483 | |
| Redeemed | | | (218,942 | ) | | | (112,238 | ) |
| Net increase in share transactions | | | 2,121,301 | | | | 1,615,419 | |
See Notes to Financial Statements.
| Annual Report | April 30, 2017 | 65 |
| Grandeur Peak International Opportunities Fund | Statements of Changes in Net Assets |
| | | For the Year Ended April 30, 2017 | | | For the Year Ended April 30, 2016 | |
| OPERATIONS | | | | | | |
| Net investment income | | $ | 2,817,200 | | | $ | 4,673,044 | |
| Net realized gain/(loss) | | | 15,154,690 | | | | (1,400,622 | ) |
| Net change in unrealized appreciation/(depreciation) | | | 101,628,897 | | | | (51,653,029 | ) |
| Net increase/(decrease) in net assets resulting from operations | | | 119,600,787 | | | | (48,380,607 | ) |
| | | | | | | | | |
| DISTRIBUTIONS TO SHAREHOLDERS (NOTE 3) | | | | | | | | |
| Net investment income | | | | | | | | |
| Investor Class | | | (373,708 | ) | | | (333,339 | ) |
| Institutional Class | | | (4,194,578 | ) | | | (2,890,960 | ) |
| Net realized gains on investments | | | | | | | | |
| Investor Class | | | (1,243,840 | ) | | | (5,176,781 | ) |
| Institutional Class | | | (10,524,647 | ) | | | (25,904,418 | ) |
| Net decrease in net assets from distributions | | | (16,336,773 | ) | | | (34,305,498 | ) |
| | | | | | | | | |
| CAPITAL SHARE TRANSACTIONS (NOTE 5) | | | | | | | | |
| Investor Class | | | | | | | | |
| Proceeds from sales of shares | | | 16,040,116 | | | | 22,706,144 | |
| Distributions reinvested | | | 1,519,011 | | | | 5,342,478 | |
| Cost of shares redeemed | | | (73,177,961 | ) | | | (62,519,592 | ) |
| Redemption fees | | | 346 | | | | 5,300 | |
| Net decrease from capital shares transactions | | | (55,618,488 | ) | | | (34,465,670 | ) |
| | | | | | | | | |
| Institutional Class | | | | | | | | |
| Proceeds from sales of shares | | | 82,878,502 | | | | 25,906,118 | |
| Distributions reinvested | | | 13,246,236 | | | | 25,634,915 | |
| Cost of shares redeemed | | | (70,160,974 | ) | | | (87,311,199 | ) |
| Redemption fees | | | 5,235 | | | | 8,941 | |
| Net increase/(decrease) from capital shares transactions | | | 25,968,999 | | | | (35,761,225 | ) |
| | | | | | | | | |
| Net increase/(decrease) in net assets | | | 73,614,525 | | | | (152,913,000 | ) |
| | | | | | | | | |
| NET ASSETS | | | | | | | | |
| Beginning of year | | | 703,292,832 | | | | 856,205,832 | |
| End of year* | | $ | 776,907,357 | | | $ | 703,292,832 | |
| | | | | | | | | |
| *Including accumulated net investment income/(loss) of: | | $ | (614,723 | ) | | $ | 286,799 | |
| | | | | | | | | |
| OTHER INFORMATION | | | | | | | | |
| Shares Transactions | | | | | | | | |
| Investor Class | | | | | | | | |
| Issued | | | 5,029,639 | | | | 7,180,441 | |
| Issued to shareholders in reinvestment of distributions | | | 494,792 | | | | 1,740,221 | |
| Redeemed | | | (23,531,613 | ) | | | (19,692,604 | ) |
| Net decrease in share transactions | | | (18,007,182 | ) | | | (10,771,942 | ) |
| | | | | | | | | |
| Institutional Class | | | | | | | | |
| Issued | | | 26,474,706 | | | | 8,230,251 | |
| Issued to shareholders in reinvestment of distributions | | | 4,300,726 | | | | 8,323,024 | |
| Redeemed | | | (21,629,721 | ) | | | (28,793,205 | ) |
| Net increase/(decrease) in share transactions | | | 9,145,711 | | | | (12,239,930 | ) |
See Notes to Financial Statements.
| 66 | 1.855.377.7325 | www.GrandeurPeakGlobal.com |
| Grandeur Peak International Stalwarts Fund | Statements of Changes in Net Assets |
| | | For the Year Ended April 30, 2017 | | | For the Period September 2, 2015 (Commencement of Operations) to April 30, 2016 | |
| OPERATIONS | | | | | | |
| Net investment income | | $ | 707,009 | | | $ | 306,704 | |
| Net realized gain/(loss) | | | 1,792,829 | | | | (1,541,441 | ) |
| Net change in unrealized appreciation | | | 37,615,840 | | | | 6,763,296 | |
| Net increase in net assets resulting from operations | | | 40,115,678 | | | | 5,528,559 | |
| | | | | | | | | |
| DISTRIBUTIONS TO SHAREHOLDERS (NOTE 3) | | | | | | | | |
| Net investment income | | | | | | | | |
| Investor Class | | | (73,124 | ) | | | – | |
| Institutional Class | | | (929,880 | ) | | | (30,017 | ) |
| Net decrease in net assets from distributions | | | (1,003,004 | ) | | | (30,017 | ) |
| | | | | | | | | |
| CAPITAL SHARE TRANSACTIONS (NOTE 5) | | | | | | | | |
| Investor Class | | | | | | | | |
| Proceeds from sales of shares | | | 8,549,781 | | | | 22,223,231 | |
| Distributions reinvested | | | 22,941 | | | | – | |
| Cost of shares redeemed | | | (4,109,607 | ) | | | (1,404,112 | ) |
| Redemption fees | | | 308 | | | | 1,506 | |
| Net increase from capital shares transactions | | | 4,463,423 | | | | 20,820,625 | |
| | | | | | | | | |
| Institutional Class | | | | | | | | |
| Proceeds from sales of shares | | | 143,867,333 | | | | 122,552,744 | |
| Distributions reinvested | | | 913,917 | | | | 29,459 | |
| Cost of shares redeemed | | | (33,019,442 | ) | | | (7,803,828 | ) |
| Redemption fees | | | 3,133 | | | | 297 | |
| Net increase from capital shares transactions | | | 111,764,941 | | | | 114,778,672 | |
| | | | | | | | | |
| Net increase in net assets | | | 155,341,038 | | | | 141,097,839 | |
| | | | | | | | | |
| NET ASSETS | | | | | | | | |
| Beginning of year | | | 141,097,839 | | | | – | |
| End of year* | | $ | 296,438,877 | | | $ | 141,097,839 | |
| | | | | | | | | |
| *Including accumulated net investment income/(loss) of: | | $ | (134,092 | ) | | $ | 628,490 | |
| | | | | | | | | |
| OTHER INFORMATION | | | | | | | | |
| Shares Transactions | | | | | | | | |
| Investor Class | | | | | | | | |
| Issued | | | 728,649 | | | | 2,133,944 | |
| Issued to shareholders in reinvestment of distributions | | | 2,054 | | | | – | |
| Redeemed | | | (349,537 | ) | | | (134,932 | ) |
| Net increase in share transactions | | | 381,166 | | | | 1,999,012 | |
| Institutional Class | | | | | | | | |
| Issued | | | 12,243,757 | | | | 11,528,096 | |
| Issued to shareholders in reinvestment of distributions | | | 81,746 | | | | 2,720 | |
| Redeemed | | | (2,803,836 | ) | | | (733,207 | ) |
| Net increase in share transactions | | | 9,521,667 | | | | 10,797,609 | |
See Notes to Financial Statements.
| Annual Report | April 30, 2017 | 67 |
| Grandeur Peak Emerging Markets Opportunities Fund | Financial Highlights |
For a Share Outstanding Throughout the Periods Presented
| Investor Class | | Year Ended April 30, 2017 | | | Year Ended April 30, 2016 | | | Year Ended April 30, 2015 | | | For the Period December 16, 2013 (Inception) to April 30, 2014 | |
| NET ASSET VALUE, BEGINNING OF PERIOD | | $ | 9.82 | | | $ | 11.51 | | | $ | 10.53 | | | $ | 10.00 | |
| | | | | | | | | | | | | | | | | |
| INCOME FROM INVESTMENT OPERATIONS | | | | | | | | | | | | | | | | |
Net investment income/(loss)(a) | | | 0.02 | | | | 0.07 | | | | 0.02 | | | | (0.05 | ) |
| Net realized and unrealized gain/(loss) on investments | | | 1.75 | | | | (1.41 | ) | | | 1.22 | | | | 0.58 | |
| Total income/(loss) from investment operations | | | 1.77 | | | | (1.34 | ) | | | 1.24 | | | | 0.53 | |
| | | | | | | | | | | | | | | | | |
| DISTRIBUTIONS | | | | | | | | | | | | | | | | |
| From net investment income | | | (0.04 | ) | | | – | | | | (0.01 | ) | | | – | |
| From net realized gain on investments | | | – | | | | (0.35 | ) | | | (0.25 | ) | | | – | |
| Total distributions | | | (0.04 | ) | | | (0.35 | ) | | | (0.26 | ) | | | – | |
| | | | | | | | | | | | | | | | | |
| REDEMPTION FEES ADDED TO PAID‐IN CAPITAL | | | 0.00 | (b) | | | 0.00 | (b) | | | 0.00 | (b) | | | 0.00 | (b) |
| | | | | | | | | | | | | | | | | |
| INCREASE/DECREASE IN NET ASSET VALUE | | | 1.73 | | | | (1.69 | ) | | | 0.98 | | | | 0.53 | |
| NET ASSET VALUE, END OF PERIOD | | $ | 11.55 | | | $ | 9.82 | | | $ | 11.51 | | | $ | 10.53 | |
| | | | | | | | | | | | | | | | | |
| TOTAL RETURN | | | 18.08 | % | | | (11.62 | )% | | | 12.06 | % | | | 5.30 | %(c) |
| | | | | | | | | | | | | | | | | |
| RATIOS AND SUPPLEMENTAL DATA | | | | | | | | | | | | | | | | |
| Net assets, end of period (in 000s) | | $ | 18,074 | | | $ | 20,548 | | | $ | 39,896 | | | $ | 27,952 | |
| | | | | | | | | | | | | | | | | |
| RATIOS TO AVERAGE NET ASSETS | | | | | | | | | | | | | | | | |
| Expenses (excluding fees waived/reimbursed by investment advisor) | | | 1.76 | % | | | 1.77 | % | | | 1.82 | % | | | 2.01 | %(d)(e) |
| Expenses (including fees waived/reimbursed by investment advisor) | | | 1.76 | % | | | 1.77 | % | | | 1.82 | % | | | 1.95 | %(d)(e) |
| Net investment income/(loss) | | | 0.21 | % | | | 0.69 | % | | | 0.22 | % | | | (0.55 | )%(d) |
| | | | | | | | | | | | | | | | | |
| PORTFOLIO TURNOVER RATE | | | 42 | % | | | 40 | % | | | 53 | % | | | 26 | %(c) |
(a) | Per share numbers have been calculated using the average shares method. |
(b) | Less than $0.005 or ($0.005) per share. |
(e) | Expense ratios during startup periods may not be representative of longer term operating periods. |
See Notes to Financial Statements.
| 68 | 1.855.377.7325 | www.GrandeurPeakGlobal.com |
| Grandeur Peak Emerging Markets Opportunities Fund | Financial Highlights |
For a Share Outstanding Throughout the Periods Presented
| Institutional Class | | Year Ended April 30, 2017 | | | Year Ended April 30, 2016 | | | Year Ended April 30, 2015 | | | For the Period December 16, 2013 (Inception) to April 30, 2014 | |
| NET ASSET VALUE, BEGINNING OF PERIOD | | $ | 9.85 | | | $ | 11.52 | | | $ | 10.54 | | | $ | 10.00 | |
| | | | | | | | | | | | | | | | | |
| INCOME FROM INVESTMENT OPERATIONS | | | | | | | | | | | | | | | | |
Net investment income/(loss)(a) | | | 0.04 | | | | 0.08 | | | | 0.05 | | | | (0.03 | ) |
| Net realized and unrealized gain/(loss) on investments | | | 1.77 | | | | (1.40 | ) | | | 1.21 | | | | 0.57 | |
| Total income/(loss) from investment operations | | | 1.81 | | | | (1.32 | ) | | | 1.26 | | | | 0.54 | |
| | | | | | | | | | | | | | | | | |
| DISTRIBUTIONS | | | | | | | | | | | | | | | | |
| From net investment income | | | (0.06 | ) | | | – | | | | (0.03 | ) | | | – | |
| From net realized gain on investments | | | – | | | | (0.35 | ) | | | (0.25 | ) | | | – | |
| Total distributions | | | (0.06 | ) | | | (0.35 | ) | | | (0.28 | ) | | | – | |
| | | | | | | | | | | | | | | | | |
| REDEMPTION FEES ADDED TO PAID‐IN CAPITAL | | | 0.00 | (b) | | | 0.00 | (b) | | | 0.00 | (b) | | | 0.00 | (b) |
| | | | | | | | | | | | | | | | | |
| INCREASE/DECREASE IN NET ASSET VALUE | | | 1.75 | | | | (1.67 | ) | | | 0.98 | | | | 0.54 | |
| NET ASSET VALUE, END OF PERIOD | | $ | 11.60 | | | $ | 9.85 | | | $ | 11.52 | | | $ | 10.54 | |
| | | | | | | | | | | | | | | | | |
| TOTAL RETURN | | | 18.42 | % | | | (11.44 | )% | | | 12.22 | % | | | 5.40 | %(c) |
| | | | | | | | | | | | | | | | | |
| RATIOS AND SUPPLEMENTAL DATA | | | | | | | | | | | | | | | | |
| Net assets, end of period (in 000s) | | $ | 398,891 | | | $ | 349,493 | | | $ | 428,048 | | | $ | 255,819 | |
| | | | | | | | | | | | | | | | | |
| RATIOS TO AVERAGE NET ASSETS | | | | | | | | | | | | | | | | |
| Expenses (excluding fees waived/reimbursed by investment advisor) | | | 1.55 | % | | | 1.55 | % | | | 1.58 | % | | | 1.76 | %(d)(e) |
| Expenses (including fees waived/reimbursed by investment advisor) | | | 1.55 | % | | | 1.55 | % | | | 1.58 | % | | | 1.70 | %(d)(e) |
| Net investment income/(loss) | | | 0.35 | % | | | 0.75 | % | | | 0.43 | % | | | (0.37 | )%(d) |
| | | | | | | | | | | | | | | | | |
| PORTFOLIO TURNOVER RATE | | | 42 | % | | | 40 | % | | | 53 | % | | | 26 | %(c) |
(a) | Per share numbers have been calculated using the average shares method. |
(b) | Less than $0.005 or ($0.005) per share. |
(e) | Expense ratios during startup periods may not be representative of longer term operating periods. |
See Notes to Financial Statements.
| Annual Report | April 30, 2017 | 69 |
| Grandeur Peak Global Micro Cap Fund | Financial Highlights |
For a Share Outstanding Throughout the Periods Presented
| Institutional Class | | Year Ended April 30, 2017 | | | For the Period October 21, 2015 (Commencement of Operations) to April 30, 2016 | |
| NET ASSET VALUE, BEGINNING OF PERIOD | | $ | 10.38 | | | $ | 10.00 | |
| | | | | | | | | |
| INCOME FROM INVESTMENT OPERATIONS | | | | | | | | |
Net investment income/(loss)(a) | | | 0.01 | | | | (0.02 | ) |
| Net realized and unrealized gain on investments | | | 1.72 | | | | 0.40 | |
| Total income from investment operations | | | 1.73 | | | | 0.38 | |
| | | | | | | | | |
| DISTRIBUTIONS | | | | | | | | |
| From net investment income | | | (0.02 | ) | | | – | |
| From net realized gain on investments | | | (0.11 | ) | | | – | |
| Total distributions | | | (0.13 | ) | | | – | |
| | | | | | | | | |
| REDEMPTION FEES ADDED TO PAID‐IN CAPITAL | | | 0.00 | (b) | | | 0.00 | (b) |
| | | | | | | | | |
| INCREASE IN NET ASSET VALUE | | | 1.60 | | | | 0.38 | |
| NET ASSET VALUE, END OF PERIOD | | $ | 11.98 | | | $ | 10.38 | |
| | | | | | | | | |
| TOTAL RETURN | | | 16.81 | % | | | 3.80 | %(c) |
| | | | | | | | | |
| RATIOS AND SUPPLEMENTAL DATA | | | | | | | | |
| Net assets, end of period (in 000s) | | $ | 36,620 | | | $ | 30,735 | |
| | | | | | | | | |
| RATIOS TO AVERAGE NET ASSETS | | | | | | | | |
| Expenses (excluding fees waived/ reimbursed by investment advisor) | | | 2.17 | % | | | 2.30 | %(d)(e) |
| Expenses (including fees waived/ reimbursed by investment advisor) | | | 2.00 | % | | | 2.00 | %(d)(e) |
| Net investment income/(loss) | | | 0.11 | % | | | (0.41 | )%(d) |
| | | | | | | | | |
| PORTFOLIO TURNOVER RATE | | | 37 | % | | | 8 | %(c) |
(a) | Per share numbers have been calculated using the average shares method. |
(b) | Less than $0.005 or ($0.005) per share. |
(e) | Expense ratios during startup periods may not be representative of longer term operating periods. |
See Notes to Financial Statements.
| 70 | 1.855.377.7325 | www.GrandeurPeakGlobal.com |
| Grandeur Peak Global Opportunities Fund | Financial Highlights |
For a Share Outstanding Throughout the Periods Presented
| Investor Class | | Year Ended April 30, 2017 | | | Year Ended April 30, 2016 | | | Year Ended April 30, 2015 | | | Year Ended April 30, 2014 | | | Year Ended April 30, 2013 | |
| NET ASSET VALUE, BEGINNING OF PERIOD | | $ | 3.01 | | | $ | 3.43 | | | $ | 3.31 | | | $ | 2.77 | | | $ | 2.31 | |
| | | | | | | | | | | | | | | | | | | | | |
| INCOME FROM INVESTMENT OPERATIONS | | | | | | | | | | | | | | | | | | | | |
Net investment income/(loss)(a) | | | (0.00 | )(b)(c) | | | 0.00 | (b) | | | 0.00 | (b) | | | (0.00 | )(b) | | | 0.00 | (b) |
| Net realized and unrealized gain/(loss) on investments | | | 0.51 | | | | (0.18 | ) | | | 0.35 | | | | 0.67 | | | | 0.51 | |
| Total income/(loss) from investment operations | | | 0.51 | | | | (0.18 | ) | | | 0.35 | | | | 0.67 | | | | 0.51 | |
| | | | | | | | | | | | | | | | | | | | | |
| DISTRIBUTIONS | | | | | | | | | | | | | | | | | | | | |
| From net investment income | | | – | | | | (0.00 | )(b) | | | (0.01 | ) | | | – | | | | (0.01 | ) |
| From net realized gain on investments | | | (0.00 | )(b) | | | (0.24 | ) | | | (0.22 | ) | | | (0.13 | ) | | | (0.04 | ) |
| Total distributions | | | (0.00 | )(b) | | | (0.24 | ) | | | (0.23 | ) | | | (0.13 | ) | | | (0.05 | ) |
| | | | | | | | | | | | | | | | | | | | | |
REDEMPTION FEES ADDED TO PAID-IN CAPITAL | | | 0.00 | (b) | | | 0.00 | (b) | | | 0.00 | (b) | | | 0.00 | (b) | | | 0.00 | (b) |
| | | | | | | | | | | | | | | | | | | | | |
| INCREASE/DECREASE IN NET ASSET VALUE | | | 0.51 | | | | (0.42 | ) | | | 0.12 | | | | 0.54 | | | | 0.46 | |
| NET ASSET VALUE, END OF PERIOD | | $ | 3.52 | | | $ | 3.01 | | | $ | 3.43 | | | $ | 3.31 | | | $ | 2.77 | |
| | | | | | | | | | | | | | | | | | | | | |
| TOTAL RETURN | | | 17.09 | % | | | (5.03 | )% | | | 11.09 | % | | | 24.31 | % | | | 22.34 | % |
| | | | | | | | | | | | | | | | | | | | | |
| RATIOS AND SUPPLEMENTAL DATA | | | | | | | | | | | | | | | | | | | | |
| Net assets, end of period (in 000s) | | $ | 166,284 | | | $ | 173,156 | | | $ | 201,462 | | | $ | 216,247 | | | $ | 132,384 | |
| | | | | | | | | | | | | | | | | | | | | |
| RATIOS TO AVERAGE NET ASSETS | | | | | | | | | | | | | | | | | | | | |
| Expenses (excluding fees waived/ reimbursed by investment advisor) | | | 1.61 | % | | | 1.62 | % | | | 1.62 | % | | | 1.68 | % | | | 1.76 | % |
| Expenses (including fees waived/ reimbursed by investment advisor) | | | 1.59 | % | | | 1.62 | % | | | 1.62 | % | | | 1.68 | % | | | 1.75 | % |
| Net investment income/(loss) | | | (0.06 | )% | | | 0.06 | % | | | 0.12 | % | | | (0.15 | )% | | | 0.19 | % |
| | | | | | | | | | | | | | | | | | | | | |
| PORTFOLIO TURNOVER RATE | | | 30 | % | | | 32 | % | | | 37 | % | | | 38 | % | | | 35 | % |
(a) | Per share numbers have been calculated using the average shares method. |
(b) | Less than $0.005 or ($0.005) per share. |
(c) | The per share amount does not correspond to activity reflected in the Statement of Operations due to class specific expenses during the period. |
See Notes to Financial Statements.
| Annual Report | April 30, 2017 | 71 |
| Grandeur Peak Global Opportunities Fund | Financial Highlights |
For a Share Outstanding Throughout the Periods Presented
| Institutional Class | | Year Ended April 30, 2017 | | Year Ended April 30, 2016 | | Year Ended April 30, 2015 | | Year Ended April 30, 2014 | | Year Ended April 30, 2013 | |
| NET ASSET VALUE, BEGINNING OF PERIOD | | $ | 3.03 | | $ | 3.46 | | $ | 3.34 | | $ | 2.79 | | $ | 2.32 | |
| | | | | | | | | | | | | | | | | |
| INCOME FROM INVESTMENT OPERATIONS | | | | | | | | | | | | | | | | |
Net investment income(a) | | | 0.01 | | | 0.01 | | | 0.01 | | | 0.00 | (b) | | 0.01 | |
| Net realized and unrealized gain/(loss) on investments | | | 0.52 | | | (0.19 | ) | | 0.34 | | | 0.68 | | | 0.52 | |
| Total income/(loss) from investment operations | | | 0.53 | | | (0.18 | ) | | 0.35 | | | 0.68 | | | 0.53 | |
| | | | | | | | | | | | | | | | | |
| DISTRIBUTIONS | | | | | | | | | | | | | | | | |
| From net investment income | | | (0.00) | (b) | | (0.01 | ) | | (0.01 | ) | | (0.00 | )(b) | | (0.02 | ) |
| From net realized gain on investments | | | (0.00) | (b) | | (0.24 | ) | | (0.22 | ) | | (0.13 | ) | | (0.04 | ) |
| Total distributions | | | (0.00) | (b) | | (0.25 | ) | | (0.23 | ) | | (0.13 | ) | | (0.06 | ) |
| | | | | | | | | | | | | | | | | |
| REDEMPTION FEES ADDED TO PAID-IN CAPITAL | | | 0.00 | (b) | | 0.00 | (b) | | 0.00 | (b) | | 0.00 | (b) | | 0.00 | (b) |
| | | | | | | | | | | | | | | | | |
| INCREASE/DECREASE IN NET ASSET VALUE | | | 0.53 | | | (0.43 | ) | | 0.12 | | | 0.55 | | | 0.47 | |
| NET ASSET VALUE, END OF PERIOD | | $ | 3.56 | | $ | 3.03 | | $ | 3.46 | | $ | 3.34 | | $ | 2.79 | |
| | | | | | | | | | | | | | | | | |
| TOTAL RETURN | | | 17.81 | % | | (5.12 | )% | | 11.20 | % | | 24.67 | % | | 22.86 | % |
| | | | | | | | | | | | | | | | | |
| RATIOS AND SUPPLEMENTAL DATA | | | | | | | | | | | | | | | | |
| Net assets, end of period (in 000s) | | $ | 532,946 | | $ | 452,030 | | $ | 526,394 | | $ | 492,869 | | $ | 217,953 | |
| | | | | | | | | | | | | | | | | |
| RATIOS TO AVERAGE NET ASSETS | | | | | | | | | | | | | | | | |
| Expenses (excluding fees waived/ reimbursed by investment advisor) | | | 1.37 | % | | 1.38 | % | | 1.38 | % | | 1.44 | % | | 1.51 | % |
| Expenses (including fees waived/reimbursed by investment advisor) | | | 1.35 | % | | 1.38 | % | | 1.38 | % | | 1.44 | % | | 1.50 | % |
| Net investment income | | | 0.18 | % | | 0.30 | % | | 0.35 | % | | 0.08 | % | | 0.37 | % |
| | | | | | | | | | | | | | | | | |
| PORTFOLIO TURNOVER RATE | | | 30 | % | | 32 | % | | 37 | % | | 38 | % | | 35 | % |
| (a) | Per share numbers have been calculated using the average shares method. |
(b) | Less than $0.005 or ($0.005) per share. |
See Notes to Financial Statements.
| 72 | 1.855.377.7325 | www.GrandeurPeakGlobal.com |
| Grandeur Peak Global Reach Fund | Financial Highlights |
For a Share Outstanding Throughout the Periods Presented
| Investor Class | | Year Ended April 30, 2017 | | Year Ended April 30, 2016 | | Year Ended April 30, 2015 | | For the Period June 19, 2013 (Inception) to April 30, 2014 | |
| NET ASSET VALUE, BEGINNING OF PERIOD | | $ | 12.31 | | $ | 13.65 | | $ | 12.43 | | $ | 10.00 | |
| | | | | | | | | | | | | | |
| INCOME FROM INVESTMENT OPERATIONS | | | | | | | | | | | | | |
Net investment income/(loss)(a) | | | 0.01 | | | 0.01 | | | 0.00 | (b) | | (0.02 | ) |
| Net realized and unrealized gain/(loss) on investments | | | 2.22 | | | (0.89 | ) | | 1.37 | | | 2.54 | |
| Total income/(loss) from investment operations | | | 2.23 | | | (0.88 | ) | | 1.37 | | | 2.52 | |
| | | | | | | | | | | | | | |
| DISTRIBUTIONS | | | | | | | | | | | | | |
| From net investment income | | | (0.02 | ) | | (0.01 | ) | | (0.01 | ) | | (0.02 | ) |
| From net realized gain on investments | | | – | | | (0.45 | ) | | (0.14 | ) | | (0.08 | ) |
| Total distributions | | | (0.02 | ) | | (0.46 | ) | | (0.15 | ) | | (0.10 | ) |
| | | | | | | | | | | | | | |
| REDEMPTION FEES ADDED TO PAID‐IN CAPITAL | | | 0.00 | (b) | | 0.00 | (b) | | 0.00 | (b) | | 0.01 | |
| | | | | | | | | | | | | | |
| INCREASE/DECREASE IN NET ASSET VALUE | | | 2.21 | | | (1.34 | ) | | 1.22 | | | 2.43 | |
| NET ASSET VALUE, END OF PERIOD | | $ | 14.52 | | $ | 12.31 | | $ | 13.65 | | $ | 12.43 | |
| | | | | | | | | | | | | | |
| TOTAL RETURN | | | 18.11 | % | | (6.45 | )% | | 11.09 | % | | 25.31 | %(c) |
| | | | | | | | | | | | | | |
| RATIOS AND SUPPLEMENTAL DATA | | | | | | | | | | | | | |
| Net assets, end of period (in 000s) | | $ | 67,574 | | $ | 66,984 | | $ | 87,354 | | $ | 46,163 | |
| | | | | | | | | | | | | | |
| RATIOS TO AVERAGE NET ASSETS | | | | | | | | | | | | | |
| Expenses (excluding fees waived/reimbursed by investment advisor) | | | 1.52 | % | | 1.60 | % | | 1.60 | % | | 1.91 | %(d)(e) |
| Expenses (including fees waived/reimbursed by investment advisor) | | | 1.52 | % | | 1.60 | % | | 1.60 | % | | 1.60 | %(d)(e) |
| Net investment income/(loss) | | | 0.07 | % | | 0.10 | % | | 0.03 | % | | (0.17 | )%(d) |
| | | | | | | | | | | | | | |
| PORTFOLIO TURNOVER RATE | | | 42 | % | | 46 | % | | 46 | % | | 39 | %(c) |
| (a) | Per share numbers have been calculated using the average shares method. |
| (b) | Less than $0.005 or ($0.005) per share. |
(e) | Expense ratios during startup periods may not be representative of longer term operating periods. |
See Notes to Financial Statements.
| Annual Report | April 30, 2017 | 73 |
| Grandeur Peak Global Reach Fund | Financial Highlights |
For a Share Outstanding Throughout the Periods Presented
| Institutional Class | | Year Ended April 30, 2017 | | Year Ended April 30, 2016 | | Year Ended April 30, 2015 | | For the Period June 19, 2013 (Inception) to April 30, 2014 | |
| NET ASSET VALUE, BEGINNING OF PERIOD | | $ | 12.33 | | $ | 13.66 | | $ | 12.42 | | $ | 10.00 | |
| | | | | | | | | | | | | | |
| INCOME FROM INVESTMENT OPERATIONS | | | | | | | | | | | | | |
Net investment income(a) | | | 0.04 | | | 0.04 | | | 0.03 | | | 0.02 | |
| Net realized and unrealized gain/(loss) on investments | | | 2.22 | | | (0.89 | ) | | 1.37 | | | 2.52 | |
| Total income/(loss) from investment operations | | | 2.26 | | | (0.85 | ) | | 1.40 | | | 2.54 | |
| | | | | | | | | | | | | | |
| DISTRIBUTIONS | | | | | | | | | | | | | |
| From net investment income | | | (0.04 | ) | | (0.03 | ) | | (0.02 | ) | | (0.04 | ) |
| From net realized gain on investments | | | – | | | (0.45 | ) | | (0.14 | ) | | (0.08 | ) |
| Total distributions | | | (0.04 | ) | | (0.48 | ) | | (0.16 | ) | | (0.12 | ) |
| | | | | | | | | | | | | | |
| REDEMPTION FEES ADDED TO PAID‐IN CAPITAL | | | 0.00 | (b) | | 0.00 | (b) | | 0.00 | (b) | | 0.00 | (b) |
| | | | | | | | | | | | | | |
| INCREASE/DECREASE IN NET ASSET VALUE | | | 2.22 | | | (1.33 | ) | | 1.24 | | | 2.42 | |
| NET ASSET VALUE, END OF PERIOD | | $ | 14.55 | | $ | 12.33 | | $ | 13.66 | | $ | 12.42 | |
| | | | | | | | | | | | | | |
| TOTAL RETURN | | | 18.36 | % | | (6.18) | % | | 11.41 | % | | 25.45 | %(c) |
| | | | | | | | | | | | | | |
| RATIOS AND SUPPLEMENTAL DATA | | | | | | | | | | | | | |
| Net assets, end of period (in 000s) | | $ | 258,683 | | $ | 221,759 | | $ | 260,239 | | $ | 88,311 | |
| | | | | | | | | | | | | | |
| RATIOS TO AVERAGE NET ASSETS | | | | | | | | | | | | | |
| | | | | | | | | | | | | | |
| Expenses (excluding fees waived/reimbursed by investment advisor) | | | 1.29 | % | | 1.35 | % | | 1.35 | % | | 1.75 | %(d)(e) |
| Expenses (including fees waived/reimbursed by investment advisor) | | | 1.29 | % | | 1.35 | % | | 1.35 | % | | 1.35 | %(d)(e) |
| Net investment income | | | 0.28 | % | | 0.34 | % | | 0.23 | % | | 0.21 | %(d) |
| | | | | | | | | | | | | | |
| PORTFOLIO TURNOVER RATE | | | 42 | % | | 46 | % | | 46 | % | | 39 | %(c) |
| (a) | Per share numbers have been calculated using the average shares method. |
| (b) | Less than $0.005 or ($0.005) per share. |
(e) | Expense ratios during startup periods may not be representative of longer term operating periods. |
See Notes to Financial Statements.
| 74 | 1.855.377.7325 | www.GrandeurPeakGlobal.com |
| Grandeur Peak Global Stalwarts Fund | Financial Highlights |
For a Share Outstanding Throughout the Periods Presented
| Investor Class | | Year Ended April 30, 2017 | | For the Period September 2, 2015 (Commencement of Operations) to April 30, 2016 | |
| NET ASSET VALUE, BEGINNING OF PERIOD | | $ | 10.85 | | $ | 10.00 | |
| | | | | | | | |
| INCOME FROM INVESTMENT OPERATIONS | | | | | | | |
Net investment income/(loss)(a) | | | (0.03 | ) | | 0.00 | (b) |
| Net realized and unrealized gain on investments | | | 1.95 | | | 0.85 | |
| Total income from investment operations | | | 1.92 | | | 0.85 | |
| | | | | | | | |
| DISTRIBUTIONS | | | | | | | |
| From net investment income | | | (0.01 | ) | | (0.00 | )(b) |
| From net realized gain on investments | | | – | | | (0.00 | )(b) |
| Total distributions | | | (0.01 | ) | | (0.00 | )(a) |
| | | | | | | | |
| REDEMPTION FEES ADDED TO PAID‐IN CAPITAL | | | 0.00 | (b) | | 0.00 | (b) |
| | | | | | | | |
| INCREASE IN NET ASSET VALUE | | | 1.91 | | | 0.85 | |
| NET ASSET VALUE, END OF PERIOD | | $ | 12.76 | | $ | 10.85 | |
| | | | | | | | |
| TOTAL RETURN | | | 17.70 | % | | 8.55 | %(c) |
| | | | | | | | |
| RATIOS AND SUPPLEMENTAL DATA | | | | | | | |
| Net assets, end of period (in 000s) | | $ | 61,212 | | $ | 19,131 | |
| | | | | | | | |
| RATIOS TO AVERAGE NET ASSETS | | | | | | | |
| Expenses (excluding fees waived/ reimbursed by investment advisor) | | | 1.41 | % | | 2.06 | %(d)(e) |
| Expenses (including fees waived/ reimbursed by investment advisor) | | | 1.35 | % | | 1.35 | %(d)(e) |
| Net investment loss | | | (0.23 | )% | | 0.00 | %(d)(f) |
| | | | | | | | |
| PORTFOLIO TURNOVER RATE | | | 32 | % | | 24 | %(c) |
| (a) | Per share numbers have been calculated using the average shares method. |
| (b) | Less than $0.005 or ($0.005) per share. |
| (e) | Expense ratios during startup periods may not be representative of longer term operating periods. |
(f) | Less than 0.005% of average net assets. |
See Notes to Financial Statements.
| Annual Report | April 30, 2017 | 75 |
| Grandeur Peak Global Stalwarts Fund | Financial Highlights |
For a Share Outstanding Throughout the Periods Presented
| Institutional Class | | Year Ended April 30, 2017 | | For the Period September 2, 2015 (Commencement of Operations) to April 30, 2016 | |
| NET ASSET VALUE, BEGINNING OF PERIOD | | $ | 10.87 | | $ | 10.00 | |
| | | | | | | | |
| INCOME FROM INVESTMENT OPERATIONS | | | | | | | |
Net investment income(a) | | | 0.01 | (b) | | 0.02 | |
| Net realized and unrealized gain on investments | | | 1.93 | | | 0.85 | |
| Total income from investment operations | | | 1.94 | | | 0.87 | |
| | | | | | | | |
| DISTRIBUTIONS | | | | | | | |
| From net investment income | | | (0.02 | ) | | (0.00 | )(c) |
| From net realized gain on investments | | | – | | | (0.00 | )(c) |
| Total distributions | | | (0.02 | ) | | (0.00 | )(a) |
| | | | | | | | |
| REDEMPTION FEES ADDED TO PAID‐IN CAPITAL | | | 0.00 | (c) | | 0.00 | (c) |
| | | | | | | | |
| INCREASE IN NET ASSET VALUE | | | 1.92 | | | 0.87 | |
| NET ASSET VALUE, END OF PERIOD | | $ | 12.79 | | $ | 10.87 | |
| | | | | | | | |
| TOTAL RETURN | | | 17.92 | % | | 8.76 | %(d) |
| | | | | | | | |
| RATIOS AND SUPPLEMENTAL DATA | | | | | | | |
| Net assets, end of period (in 000s) | | $ | 47,811 | | $ | 17,562 | |
| | | | | | | | |
| RATIOS TO AVERAGE NET ASSETS | | | | | | | |
| Expenses (excluding fees waived/ reimbursed by investment advisor) | | | 1.17 | % | | 1.86 | %(e)(f) |
| Expenses (including fees waived/ reimbursed by investment advisor) | | | 1.10 | % | | 1.10 | %(e)(f) |
| Net investment income | | | 0.05 | % | | 0.22 | %(e) |
| | | | | | | | |
| PORTFOLIO TURNOVER RATE | | | 32 | % | | 24 | %(d) |
| (a) | Per share numbers have been calculated using the average shares method. |
| (b) | The per share amount does not correspond to activity reflected in the Statement of Operations due to class specific expenses during the period. |
| (c) | Less than $0.005 or ($0.005) per share. |
| (f) | Expense ratios during startup periods may not be representative of longer term operating periods. |
See Notes to Financial Statements.
| 76 | 1.855.377.7325 | www.GrandeurPeakGlobal.com |
| Grandeur Peak International Opportunities Fund | Financial Highlights |
For a Share Outstanding Throughout the Periods Presented
| Investor Class | | Year Ended April 30, 2017 | | | Year Ended April 30, 2016 | | | Year Ended April 30, 2015 | | | Year Ended April 30, 2014 | | | Year Ended April 30, 2013 | |
| NET ASSET VALUE, BEGINNING OF PERIOD | | $ | 3.09 | | | $ | 3.42 | | | $ | 3.41 | | | $ | 2.83 | | | $ | 2.29 | |
| | | | | | | | | | | | | | | | | | | | | |
| INCOME FROM INVESTMENT OPERATIONS | | | | | | | | | | | | | | | | | | | | |
| Net investment income(a) | | | 0.01 | | | | 0.01 | | | | 0.01 | | | | 0.01 | | | | 0.01 | |
| Net realized and unrealized gain/(loss) on investments | | | 0.52 | | | | (0.20 | ) | | | 0.21 | | | | 0.68 | | | | 0.55 | |
| Total income/(loss) from investment operations | | | 0.53 | | | | (0.19 | ) | | | 0.22 | | | | 0.69 | | | | 0.56 | |
| | | | | | | | | | | | | | | | | | | | | |
| DISTRIBUTIONS | | | | | | | | | | | | | | | | | | | | |
| From net investment income | | | (0.02 | ) | | | (0.01 | ) | | | (0.01 | ) | | | (0.02 | ) | | | (0.01 | ) |
| From net realized gain on investments | | | (0.05 | ) | | | (0.13 | ) | | | (0.20 | ) | | | (0.09 | ) | | | (0.01 | ) |
| Total distributions | | | (0.07 | ) | | | (0.14 | ) | | | (0.21 | ) | | | (0.11 | ) | | | (0.02 | ) |
| | | | | | | | | | | | | | | | | | | | | |
| REDEMPTION FEES ADDED TO PAID-IN CAPITAL | | | 0.00 | (b) | | | 0.00 | (b) | | | 0.00 | (b) | | | 0.00 | (b) | | | 0.00 | (b) |
| | | | | | | | | | | | | | | | | | | | | |
| INCREASE/DECREASE IN NET ASSET VALUE | | | 0.46 | | | | (0.33 | ) | | | 0.01 | | | | 0.58 | | | | 0.54 | |
| NET ASSET VALUE, END OF PERIOD | | $ | 3.55 | | | $ | 3.09 | | | $ | 3.42 | | | $ | 3.41 | | | $ | 2.83 | |
| | | | | | | | | | | | | | | | | | | | | |
| TOTAL RETURN | | | 17.50 | % | | | (5.53 | )% | | | 7.25 | % | | | 24.59 | % | | | 24.57 | % |
| | | | | | | | | | | | | | | | | | | | | |
| RATIOS AND SUPPLEMENTAL DATA | | | | | | | | | | | | | | | | | | | | |
| Net assets, end of period (in 000s) | | $ | 78,403 | | | $ | 123,922 | | | $ | 173,842 | | | $ | 153,296 | | | $ | 96,550 | |
| | | | | | | | | | | | | | | | | | | | | |
| RATIOS TO AVERAGE NET ASSETS | | | | | | | | | | | | | | | | | | | | |
| Expenses (excluding fees waived/ reimbursed by investment advisor) | | | 1.61 | % | | | 1.62 | % | | | 1.62 | % | | | 1.73 | % | | | 1.88 | % |
| Expenses (including fees waived/ reimbursed by investment advisor) | | | 1.58 | % | | | 1.62 | % | | | 1.62 | % | | | 1.73 | % | | | 1.75 | % |
| Net investment income | | | 0.16 | % | | | 0.45 | % | | | 0.37 | % | | | 0.20 | % | | | 0.26 | % |
| | | | | | | | | | | | | | | | | | | | | |
| PORTFOLIO TURNOVER RATE | | | 30 | % | | | 34 | % | | | 36 | % | | | 37 | % | | | 52 | % |
| (a) | Per share numbers have been calculated using the average shares method. |
| (b) | Less than $0.005 or ($0.005) per share. |
See Notes to Financial Statements.
| Annual Report | April 30, 2017 | 77 |
| Grandeur Peak International Opportunities Fund | Financial Highlights |
For a Share Outstanding Throughout the Periods Presented
| Institutional Class | | Year Ended April 30, 2017 | | | Year Ended April 30, 2016 | | | Year Ended April 30, 2015 | | | Year Ended April 30, 2014 | | | Year Ended April 30, 2013 | |
| NET ASSET VALUE, BEGINNING OF PERIOD | | $ | 3.11 | | | $ | 3.43 | | | $ | 3.42 | | | $ | 2.84 | | | $ | 2.29 | |
| | | | | | | | | | | | | | | | | | | | | |
| INCOME FROM INVESTMENT OPERATIONS | | | | | | | | | | | | | | | | | | | | |
| Net investment income(a) | | | 0.01 | | | | 0.02 | | | | 0.02 | | | | 0.01 | | | | 0.01 | |
| Net realized and unrealized gain/(loss) on investments | | | 0.52 | | | | (0.20 | ) | | | 0.21 | | | | 0.69 | | | | 0.57 | |
| Total income/(loss) from investment operations | | | 0.53 | | | | (0.18 | ) | | | 0.23 | | | | 0.70 | | | | 0.58 | |
| | | | | | | | | | | | | | | | | | | | | |
| DISTRIBUTIONS | | | | | | | | | | | | | | | | | | | | |
| From net investment income | | | (0.02 | ) | | | (0.01 | ) | | | (0.02 | ) | | | (0.03 | ) | | | (0.02 | ) |
| From net realized gain on investments | | | (0.05 | ) | | | (0.13 | ) | | | (0.20 | ) | | | (0.09 | ) | | | (0.01 | ) |
| Total distributions | | | (0.07 | ) | | | (0.14 | ) | | | (0.22 | ) | | | (0.12 | ) | | | (0.03 | ) |
| | | | | | | | | | | | | | | | | | | | | |
| REDEMPTION FEES ADDED TO PAID-IN CAPITAL | | | 0.00 | (b) | | | 0.00 | (b) | | | 0.00 | (b) | | | 0.00 | (b) | | | 0.00 | (b) |
| | | | | | | | | | | | | | | | | | | | | |
| INCREASE/DECREASE IN NET ASSET VALUE | | | 0.46 | | | | (0.32 | ) | | | 0.01 | | | | 0.58 | | | | 0.55 | |
| NET ASSET VALUE, END OF PERIOD | | $ | 3.57 | | | $ | 3.11 | | | $ | 3.43 | | | $ | 3.42 | | | $ | 2.84 | |
| | | | | | | | | | | | | | | | | | | | | |
| TOTAL RETURN | | | 17.59 | % | | | (5.02 | )% | | | 7.41 | % | | | 24.70 | % | | | 25.11 | % |
| | | | | | | | | | | | | | | | | | | | | |
| RATIOS AND SUPPLEMENTAL DATA | | | | | | | | | | | | | | | | | | | | |
| Net assets, end of period (in 000s) | | $ | 698,504 | | | $ | 579,371 | | | $ | 682,364 | | | $ | 658,127 | | | $ | 250,962 | |
| | | | | | | | | | | | | | | | | | | | | |
| RATIOS TO AVERAGE NET ASSETS | | | | | | | | | | | | | | | | | | | | |
| Expenses (excluding fees waived/reimbursed by investment advisor) | | | 1.37 | % | | | 1.38 | % | | | 1.38 | % | | | 1.46 | % | | | 1.59 | % |
| Expenses (including fees waived/reimbursed by investment advisor) | | | 1.34 | % | | | 1.38 | % | | | 1.38 | % | | | 1.46 | % | | | 1.50 | % |
| Net investment income | | | 0.42 | % | | | 0.65 | % | | | 0.61 | % | | | 0.42 | % | | | 0.51 | % |
| | | | | | | | | | | | | | | | | | | | | |
| PORTFOLIO TURNOVER RATE | | | 30 | % | | | 34 | % | | | 36 | % | | | 37 | % | | | 52 | % |
| (a) | Per share numbers have been calculated using the average shares method. |
| (b) | Less than $0.005 or ($0.005) per share. |
See Notes to Financial Statements.
| 78 | 1.855.377.7325 | www.GrandeurPeakGlobal.com |
| Grandeur Peak International Stalwarts Fund | Financial Highlights |
For a Share Outstanding Throughout the Periods Presented
| Investor Class | | Year Ended April 30, 2017 | | | For the Period September 2, 2015 (Commencement of Operations) to April 30, 2016 | |
| NET ASSET VALUE, BEGINNING OF PERIOD | | $ | 11.02 | | | $ | 10.00 | |
| | | | | | | | | |
| INCOME FROM INVESTMENT OPERATIONS | | | | | | | | |
Net investment income(a) | | | 0.02 | | | | 0.03 | |
| Net realized and unrealized gain on investments | | | 2.03 | | | | 0.99 | |
| Total income from investment operations | | | 2.05 | | | | 1.02 | |
| | | | | | | | | |
| DISTRIBUTIONS | | | | | | | | |
| From net investment income | | | (0.03 | ) | | | – | |
| Total distributions | | | (0.03 | ) | | | – | |
| | | | | | | | | |
| REDEMPTION FEES ADDED TO PAID-IN CAPITAL | | | 0.00 | (b) | | | 0.00 | (b) |
| | | | | | | | | |
| INCREASE IN NET ASSET VALUE | | | 2.02 | | | | 1.02 | |
| NET ASSET VALUE, END OF PERIOD | | $ | 13.04 | | | $ | 11.02 | |
| | | | | | | | | |
| TOTAL RETURN | | | 18.68 | % | | | 10.20 | %(c) |
| | | | | | | | | |
| RATIOS AND SUPPLEMENTAL DATA | | | | | | | | |
| Net assets, end of period (in 000s) | | $ | 31,045 | | | $ | 22,028 | |
| | | | | | | | | |
| RATIOS TO AVERAGE NET ASSETS | | | | | | | | |
| Expenses (excluding fees waived/ reimbursed by investment advisor) | | | 1.27 | % | | | 1.45 | %(d)(e) |
| Expenses (including fees waived/ reimbursed by investment advisor) | | | 1.27 | % | | | 1.35 | %(d)(e) |
| Net investment income | | | 0.19 | % | | | 0.44 | %(d) |
| | | | | | | | | |
| PORTFOLIO TURNOVER RATE | | | 37 | % | | | 59 | %(c) |
| (a) | Per share numbers have been calculated using the average shares method. |
| (b) | Less than $0.005 or ($0.005) per share. |
| (e) | Expense ratios during startup periods may not be representative of longer term operating periods. |
See Notes to Financial Statements.
| Annual Report | April 30, 2017 | 79 |
| Grandeur Peak International Stalwarts Fund | Financial Highlights |
For a Share Outstanding Throughout the Periods Presented
| Institutional Class | | Year Ended April 30, 2017 | | | For the Period September 2, 2015 (Commencement of Operations) to April 30, 2016 | |
| NET ASSET VALUE, BEGINNING OF PERIOD | | $ | 11.03 | | | $ | 10.00 | |
| | | | | | | | | |
| INCOME FROM INVESTMENT OPERATIONS | | | | | | | | |
| Net investment income(a) | | | 0.04 | | | | 0.04 | |
| Net realized and unrealized gain on investments | | | 2.04 | | | | 0.99 | |
| Total income from investment operations | | | 2.08 | | | | 1.03 | |
| | | | | | | | | |
| DISTRIBUTIONS | | | | | | | | |
| From net investment income | | | (0.05 | ) | | | (0.00 | )(b) |
| Total distributions | | | (0.05 | ) | | | (0.00 | )(b) |
| | | | | | | | | |
| REDEMPTION FEES ADDED TO PAID-IN CAPITAL | | | 0.00 | (b) | | | 0.00 | (b) |
| | | | | | | | | |
| INCREASE IN NET ASSET VALUE | | | 2.03 | | | | 1.03 | |
| NET ASSET VALUE, END OF PERIOD | | $ | 13.06 | | | $ | 11.03 | |
| | | | | | | | | |
| TOTAL RETURN | | | 18.96 | % | | | 10.34 | %(c) |
| | | | | | | | | |
| RATIOS AND SUPPLEMENTAL DATA | | | | | | | | |
| Net assets, end of period (in 000s) | | $ | 265,393 | | | $ | 119,070 | |
| | | | | | | | | |
| RATIOS TO AVERAGE NET ASSETS | | | | | | | | |
| Expenses (excluding fees waived/ reimbursed by investment advisor) | | | 1.02 | % | | | 1.20 | %(d)(e) |
| Expenses (including fees waived/ reimbursed by investment advisor) | | | 1.02 | % | | | 1.10 | %(d)(e) |
| Net investment income | | | 0.37 | % | | | 0.60 | %(d) |
| | | | | | | | | |
| PORTFOLIO TURNOVER RATE | | | 37 | % | | | 59 | %(c) |
| (a) | Per share numbers have been calculated using the average shares method. |
| (b) | Less than $0.005 or ($0.005) per share. |
| (e) | Expense ratios during startup periods may not be representative of longer term operating periods. |
See Notes to Financial Statements.
| 80 | 1.855.377.7325 | www.GrandeurPeakGlobal.com |
Grandeur Peak Funds® | Notes to Financial Statements |
April 30, 2017
1. ORGANIZATION
Financial Investors Trust (the “Trust”), a Delaware statutory trust, is an open-end management investment company registered under the Investment Company Act of 1940, as amended (“1940 Act”). As of April 30, 2017, the Trust consists of multiple separate portfolios or series. This annual report describes the Grandeur Peak Emerging Markets Opportunities Fund, Grandeur Peak Global Micro Cap Fund, Grandeur Peak Global Opportunities Fund, Grandeur Peak Global Reach Fund, Grandeur Peak Global Stalwarts Fund, Grandeur Peak International Opportunities Fund, and Grandeur Peak International Stalwarts Fund (individually a “Fund” and collectively, the “Funds”). The Funds seek long-term growth of capital. The Funds offer Investor Class (except the Grandeur Peak Global Micro Cap Fund) and Institutional Class shares.
2. SIGNIFICANT ACCOUNTING POLICIES
The accompanying financial statements were prepared in accordance with accounting principles generally accepted in the United States of America (“U.S. GAAP”). The preparation of financial statements in conformity with U.S. GAAP requires management to make certain estimates and assumptions that affect the reported amounts of assets and liabilities and disclosures of contingent assets and liabilities at the date of the financial statements and the reported amounts of revenue and expenses during the period. Actual results could differ from those estimates. The Funds are considered an investment company for financial reporting purposes under U.S. GAAP. The following is a summary of significant accounting policies consistently followed by the Funds in preparation of their financial statements.
Investment Valuation: The Funds generally value their securities based on market prices determined at the close of regular trading on the New York Stock Exchange (“NYSE”), normally 4:00 p.m. Eastern Time, on each day the NYSE is open for trading.
For equity securities and mutual funds that are traded on an exchange, the market price is usually the closing sale or official closing price on that exchange. In the case of equity securities not traded on an exchange, or if such closing prices are not otherwise available, the securities are valued at the mean of the most recent bid and ask prices on such day. Redeemable securities issued by open-end registered investment companies are valued at the investment company’s applicable net asset value, with the exception of exchange-traded open-end investment companies, which are priced as equity securities.
Equity securities that are primarily traded on foreign securities exchanges are valued at the closing values of such securities on their respective foreign exchanges, except when an event occurs subsequent to the close of the foreign exchange and the close of the NYSE that was likely to have changed such value. In such an event, the fair value of those securities are determined in good faith through consideration of other factors in accordance with procedures established by and under the general supervision of the Board of Trustees (the “Board”). The Funds will use a fair valuation model provided by an independent pricing service, which is intended to reflect fair value when a security’s value or a meaningful portion of each Fund’s portfolio is believed to have been materially affected by a valuation event that has occurred between the close of the exchange or market on which the security is traded and the close of the regular trading day on the NYSE. The Funds’ valuation procedures set forth certain triggers which instruct when to use the fair valuation model.
Forward currency exchange contracts have a fair value determined by the prevailing foreign currency exchange daily rates and current foreign currency exchange forward rates. The foreign currency exchange forward rates are calculated using an automated system that estimates rates on the basis of the current day foreign currency exchange rates and forward foreign currency exchange rates supplied by a pricing service.
When such prices or quotations are not available, or when Grandeur Peak Global Advisors, LLC (the “Adviser”) believes that they are unreliable, securities may be priced using fair value procedures approved by the Board.
| Annual Report | April 30, 2017 | 81 |
Grandeur Peak Funds® | Notes to Financial Statements |
April 30, 2017
Fair Value Measurements: The Funds disclose the classification of their fair value measurements following a three-tier hierarchy based on the inputs used to measure fair value. Inputs refer broadly to the assumptions that market participants would use in pricing the asset or liability, including assumptions about risk. Inputs may be observable or unobservable. Observable inputs reflect the assumptions market participants would use in pricing the asset or liability that are developed based on market data obtained from sources independent of the reporting entity. Unobservable inputs reflect the reporting entity’s own assumptions about the assumptions market participants would use in pricing the asset or liability that are developed based on the best information available.
Various inputs are used in determining the value of the Funds’ investments as of the end of the reporting period. When inputs used fall into different levels of the fair value hierarchy, the level in the hierarchy within which the fair value measurement falls is determined based on the lowest level input that is significant to the fair value measurement in its entirety. The designated input levels are not necessarily an indication of the risk or liquidity associated with these investments. These inputs are categorized in the following hierarchy under applicable financial accounting standards:
Level 1 – Unadjusted quoted prices in active markets for identical investments, unrestricted assets or liabilities that the Funds have the ability to access at the measurement date;
Level 2 – Quoted prices which are not active, quoted prices for similar assets or liabilities in active markets or inputs other than quoted prices that are observable (either directly or indirectly) for substantially the full term of the asset or liability; and
Level 3 – Significant unobservable prices or inputs (including the Funds’ own assumptions in determining the fair value of investments) where there is little or no market activity for the asset or liability at the measurement date.
The following is a summary of each Fund’s investments in the fair value hierarchy as of April 30, 2017:
| Investments in Securities at Value | | Level 1 - Quoted and Unadjusted Prices | | | Level 2 - Other Significant Observable Inputs | | | Level 3 - Significant Unobservable Inputs | | | Total | |
| Grandeur Peak Emerging Markets Opportunities Fund | | | | | | | | | | | | |
| Common Stocks | | | | | | | | | | | | |
| Indonesia | | $ | 25,027,370 | | | $ | 1,477,980 | | | $ | – | | | $ | 26,505,350 | |
| Pakistan | | | 11,456,550 | | | | 433,171 | | | | – | | | | 11,889,721 | |
| South Korea | | | 21,587,962 | | | | – | | | | 3,306,095 | | | | 24,894,057 | |
Other* | | | 330,835,679 | | | | – | | | | – | | | | 330,835,679 | |
| Total | | $ | 388,907,561 | | | $ | 1,911,151 | | | $ | 3,306,095 | | | $ | 394,124,807 | |
| Investments in Securities at Value | | Level 1 - Quoted and Unadjusted Prices | | | Level 2 - Other Significant Observable Inputs | | | Level 3 - Significant Unobservable Inputs | | | Total | |
| Grandeur Peak Global Micro Cap Fund | | | | | | | | | | | | |
| Common Stocks | | | | | | | | | | | | |
| Australia | | $ | 1,610,657 | | | $ | 85,259 | | | $ | – | | | $ | 1,695,916 | |
| South Korea | | | 717,162 | | | | – | | | | 83,107 | | | | 800,269 | |
| United States | | | 4,588,063 | | | | 281,137 | | | | – | | | | 4,869,200 | |
Other* | | | 28,374,853 | | | | – | | | | – | | | | 28,374,853 | |
| Total | | $ | 35,290,735 | | | $ | 366,396 | | | $ | 83,107 | | | $ | 35,740,238 | |
| Investments in Securities at Value | | Level 1 - Quoted and Unadjusted Prices | | | Level 2 - Other Significant Observable Inputs | | | Level 3 - Significant Unobservable Inputs | | | Total | |
| Grandeur Peak Global Opportunities Fund | | | | | | | | | | | | |
| Common Stocks | | | | | | | | | | | | |
| Australia | | $ | 10,993,437 | | | $ | 786,587 | | | $ | – | | | $ | 11,780,024 | |
Other* | | | 685,427,043 | | | | – | | | | – | | | | 685,427,043 | |
| Total | | $ | 696,420,480 | | | $ | 786,587 | | | $ | – | | | $ | 697,207,067 | |
| 82 | 1.855.377.7325 | www.GrandeurPeakGlobal.com |
Grandeur Peak Funds® | Notes to Financial Statements |
April 30, 2017
| Investments in Securities at Value | | Level 1 - Quoted and Unadjusted Prices | | | Level 2 - Other Significant Observable Inputs | | | Level 3 - Significant Unobservable Inputs | | | Total | |
| Grandeur Peak Global Reach Fund | | | | | | | | | | | | |
| Common Stocks | | | | | | | | | | | | |
| Australia | | $ | 4,398,513 | | | $ | 174,220 | | | $ | – | | | $ | 4,572,733 | |
| Indonesia | | | 8,141,889 | | | | 430,827 | | | | – | | | | 8,572,716 | |
| South Korea | | | 7,303,743 | | | | – | | | | 658,113 | | | | 7,961,856 | |
| Spain | | | – | | | | – | | | | 12 | | | | 12 | |
| United States | | | 67,344,807 | | | | 820,022 | | | | – | | | | 68,164,829 | |
Other* | | | 225,932,359 | | | | – | | | | – | | | | 225,932,359 | |
Preferred Stocks* | | $ | 623,206 | | | $ | – | | | $ | – | | | $ | 623,206 | |
| Total | | $ | 313,744,517 | | | $ | 1,425,069 | | | $ | 658,125 | | | $ | 315,827,711 | |
| | | | | | | | | | | | | | | | | |
| Investments in Securities at Value | | Level 1 - Quoted and Unadjusted Prices | | | Level 2 - Other Significant Observable Inputs | | | Level 3 - Significant Unobservable Inputs | | | Total | |
| Grandeur Peak Global Stalwarts Fund | | | | | | | | | | | | | | | | |
Common Stocks* | | $ | 105,956,413 | | | $ | – | | | $ | – | | | $ | 105,956,413 | |
Preferred Stocks* | | | 1,193,704 | | | | – | | | | – | | | | 1,193,704 | |
| Total | | $ | 107,150,117 | | | $ | – | | | $ | – | | | $ | 107,150,117 | |
| | | | | | | | | | | | | | | | | |
| Investments in Securities at Value | | Level 1 - Quoted and Unadjusted Prices | | | Level 2 - Other Significant Observable Inputs | | | Level 3 - Significant Unobservable Inputs | | | Total | |
| Grandeur Peak International Opportunities Fund | | | | | | | | | | | | | | | | |
| Common Stocks | | | | | | | | | | | | | | | | |
| Australia | | $ | 16,908,290 | | | $ | 826,583 | | | $ | – | | | $ | 17,734,873 | |
| Indonesia | | | 24,974,198 | | | | 1,815,018 | | | | – | | | | 26,789,216 | |
| South Korea | | | 19,237,342 | | | | – | | | | 2,905,555 | | | | 22,142,897 | |
Other* | | | 692,842,111 | | | | – | | | | – | | | | 692,842,111 | |
| Total | | $ | 753,961,941 | | | $ | 2,641,601 | | | $ | 2,905,555 | | | $ | 759,509,097 | |
| | | | | | | | | | | | | | | | | |
| Investments in Securities at Value | | Level 1 - Quoted and Unadjusted Prices | | | Level 2 - Other Significant Observable Inputs | | | Level 3 - Significant Unobservable Inputs | | | Total | |
| Grandeur Peak International Stalwarts Fund | | | | | | | | | | | | | | | | |
Common Stocks* | | $ | 288,460,073 | | | $ | – | | | $ | – | | | $ | 288,460,073 | |
Preferred Stocks* | | | 4,145,596 | | | | – | | | | – | | | | 4,145,596 | |
| Total | | $ | 292,605,669 | | | $ | – | | | $ | – | | | $ | 292,605,669 | |
| * | For a detailed country breakdown, see the accompanying Portfolio of Investments. |
The Funds had the following transfers between levels 1 and 2 during the year ended April 30, 2017:
| | | Level 1 - Quoted and Unadjusted Prices | | | Level 2 - Other Significant Observable Inputs | |
| | | Transfers In | | | Transfers (Out) | | | Transfers In | | | Transfers (Out) | |
| Grandeur Peak Emerging Markets Opportunities Fund | | | | | | | | | | | | |
| Common Stocks | | $ | – | | | $ | (1,911,151 | ) | | $ | 1,911,151 | | | $ | – | |
| Total | | $ | – | | | $ | (1,911,151 | ) | | $ | 1,911,151 | | | $ | – | |
| | | | | | | | | | | | | | | | | |
| | | Level 1 - Quoted and Unadjusted Prices | | | Level 2 - Other Significant Observable Inputs | |
| | | Transfers In | | | Transfers (Out) | | | Transfers In | | | Transfers (Out) | |
| Grandeur Peak Global Micro Cap Fund | | | | | | | | | | | | | | | | |
| Common Stocks | | $ | 111,002 | | | $ | (85,259 | ) | | $ | 85,259 | | | $ | (111,002 | ) |
| Total | | $ | – | | | $ | (85,259 | ) | | $ | 85,259 | | | $ | – | |
| Annual Report | April 30, 2017 | 83 |
Grandeur Peak Funds® | Notes to Financial Statements |
April 30, 2017
| | | Level 1 - Quoted and Unadjusted Prices | | | Level 2 - Other Significant Observable Inputs | |
| | | Transfers In | | | Transfers (Out) | | | Transfers In | | | Transfers (Out) | |
| Grandeur Peak Global Opportunities Fund | | | | | | | | | | | | |
| Common Stocks | | $ | – | | | $ | (786,587 | ) | | $ | 786,587 | | | $ | – | |
| Total | | $ | – | | | $ | (786,587 | ) | | $ | 786,587 | | | $ | – | |
| | | | | | | | | | | | | | | | | |
| | | Level 1 - Quoted and Unadjusted Prices | | | Level 2 - Other Significant Observable Inputs | |
| | | Transfers In | | | Transfers (Out) | | | Transfers In | | | Transfers (Out) | |
| Grandeur Peak Global Reach Fund | | | | | | | | | | | | | | | | |
| Common Stocks | | $ | 737,280 | | | $ | (605,047 | ) | | $ | 605,047 | | | $ | (737,280 | ) |
| Total | | $ | – | | | $ | (605,047 | ) | | $ | 605,047 | | | $ | – | |
| | | | | | | | | | | | | | | | | |
| | | Level 1 - Quoted and Unadjusted Prices | | | Level 2 - Other Significant Observable Inputs | |
| | | Transfers In | | | Transfers (Out) | | | Transfers In | | | Transfers (Out) | |
| Grandeur Peak International Opportunities Fund | | | | | | | | | | | | | | | | |
| Common Stocks | | $ | – | | | $ | (2,641,601 | ) | | $ | 2,641,601 | | | $ | – | |
| Total | | $ | – | | | $ | (2,641,601 | ) | | $ | 2,641,601 | | | $ | – | |
The transfer amounts disclosed in the table above represent the value of the securities as of April 30, 2017 transferred in/(out) of Level 1 and Level 2 during the reporting period that were also held at April 30, 2016. The above transfers from Level 2 to Level 1 were due to the ability to obtain a closing market price within an active market for a security that previously had no market to trade. Additionally, the above transfers from Level 1 to Level 2 were due to the inability to obtain a closing market price due to an inactive market to trade. For the year ended April 30, 2017, the Grandeur Peak Global Stalwarts Fund and Grandeur Peak International Stalwarts Fund did not have any transfers in/(out) of Level 1 and Level 2 securities.
The following is a reconciliation of the investments in which significant unobservable inputs (Level 3) were used in determining fair value:
| Grandeur Peak Emerging Markets Opportunities Fund | | Common Stocks | | | Total | |
| Balance as of April 30, 2016 | | $ | – | | | $ | – | |
| Accrued Discount/Premium | | | – | | | | – | |
| Return of Capital | | | – | | | | – | |
| Realized Gain/(Loss) | | | – | | | | – | |
| Change in Unrealized Appreciation/(Depreciation) | | | – | | | | – | |
| Purchases | | | – | | | | – | |
| Sales Proceeds | | | – | | | | – | |
| Transfer into Level 3 | | | 3,306,095 | | | | 3,306,095 | |
| Transfer out of Level 3 | | | – | | | | – | |
| Balance as of April 30, 2017 | | $ | 3,306,095 | | | $ | 3,306,095 | |
| Net change in unrealized Appreciation/(Depreciation) included in the Statement of Operations attributable to Level 3 investments held at April 30, 2017 | | $ | – | | | $ | – | |
| | | | | | | | | |
| Grandeur Peak Global Micro Cap Fund | | Common Stocks | | | Total | |
| Balance as of April 30, 2016 | | $ | – | | | $ | – | |
| Accrued Discount/Premium | | | – | | | | – | |
| Return of Capital | | | – | | | | – | |
| Realized Gain/(Loss) | | | – | | | | – | |
| Change in Unrealized Appreciation/(Depreciation) | | | – | | | | – | |
| Purchases | | | – | | | | – | |
| Sales Proceeds | | | – | | | | – | |
| Transfer into Level 3 | | | 83,107 | | | | 83,107 | |
| Transfer out of Level 3 | | | – | | | | – | |
| Balance as of April 30, 2017 | | $ | 83,107 | | | $ | 83,107 | |
| Net change in unrealized Appreciation/(Depreciation) included in the Statement of Operations attributable to Level 3 investments held at April 30, 2017 | | $ | – | | | $ | – | |
| 84 | 1.855.377.7325 | www.GrandeurPeakGlobal.com |
Grandeur Peak Funds® | Notes to Financial Statements |
April 30, 2017
| Grandeur Peak Global Reach Fund | | Common Stocks | | | Total | |
| Balance as of April 30, 2016 | | $ | 1 | | | $ | 1 | |
| Accrued Discount/Premium | | | – | | | | – | |
| Return of Capital | | | – | | | | – | |
| Realized Gain/(Loss) | | | – | | | | – | |
| Change in Unrealized Appreciation/(Depreciation) | | | 11 | | | | 11 | |
| Purchases | | | – | | | | – | |
| Sales Proceeds | | | – | | | | – | |
| Transfer into Level 3 | | | 658,113 | | | | 658,113 | |
| Transfer out of Level 3 | | | – | | | | – | |
| Balance as of April 30, 2017 | | $ | 658,125 | | | $ | 658,125 | |
| Net change in unrealized Appreciation/(Depreciation) included in the Statement of Operations attributable to Level 3 investments held at April 30, 2017 | | $ | 11 | | | $ | 11 | |
| | | | | | | | | |
| Grandeur Peak International Opportunities Fund | | Common Stocks | | | Total | |
| Balance as of April 30, 2016 | | $ | – | | | $ | – | |
| Accrued Discount/Premium | | | – | | | | – | |
| Return of Capital | | | – | | | | – | |
| Realized Gain/(Loss) | | | – | | | | – | |
| Change in Unrealized Appreciation/(Depreciation) | | | – | | | | – | |
| Purchases | | | – | | | | – | |
| Sales Proceeds | | | – | | | | – | |
| Transfer into Level 3 | | | 2,905,555 | | | | 2,905,555 | |
| Transfer out of Level 3 | | | – | | | | – | |
| Balance as of April 30, 2017 | | $ | 2,905,555 | | | $ | 2,905,555 | |
| Net change in unrealized Appreciation/(Depreciation) included in the Statement of Operations attributable to Level 3 investments held at April 30, 2017 | | $ | – | | | $ | – | |
Change in unrealized appreciation/depreciation on Level 3 securities is included on the Statements of Operations under Net change in unrealized appreciation/(depreciation) on investments. Realized gain (loss) on Level 3 securities is included on the Statements of Operations under Net realized gain/(loss) on investments.
The table below provided additional information about the Level 3 Fair Value Measurements as of April 30, 2017:
Quantitative Information about Level 3 Fair Value Measurements
Grandeur Peak Emerging Markets Opportunities Fund
| Asset Class | | Fair Value (USD) at 4/30/17 | | Valuation Technique | | Unobservable Inputs(a) | | Value | |
| Foreign Common Stock | | $ | 3,306,095 | | Discount on last quoted exchange price due to factory production halt | | Discount | | | 30% | |
Grandeur Peak Global Micro Cap Fund
| Asset Class | | Fair Value (USD) at 4/30/17 | | Valuation Technique | | Unobservable Inputs(a) | | Value | |
| Foreign Common Stock | | $ | 83,107 | | Discount on last quoted exchange price due to factory production halt | | Discount | | | 30% | |
Grandeur Peak Global Reach Fund
| Asset Class | | Fair Value (USD) at 4/30/17 | | Valuation Technique | | Unobservable Inputs(a) | | Value | |
| Foreign Common Stock | | $ | 658,125 | | Discount on last quoted exchange price due to factory production halt | | Discount | | | 30% | |
| Annual Report | April 30, 2017 | 85 |
Grandeur Peak Funds® | Notes to Financial Statements |
April 30, 2017
Grandeur Peak International Opportunities Fund
| Asset Class | | Fair Value (USD) at 4/30/17 | | Valuation Technique | | Unobservable Inputs(a) | | Value | |
| Foreign Common Stock | | $ | 2,905,555 | | Discount on last quoted exchange price due to factory production halt | | Discount | | | 30% | |
| (a) | A change to the unobservable input may result in a significant change to the value of the investment as follows: |
| Unobservable Input | Impact to Value if Input Increases | Impact to Value if Input Decreases |
| Discount | Decrease | Increase |
Investment Transactions and Investment Income: Investment transactions are accounted for on the date the investments are purchased or sold (trade date). Realized gains and losses from investment transactions are reported on an identified cost which is the same basis the Fund uses for federal income tax purposes. Interest income, which includes accretion of discounts and amortization of premiums, is accrued and recorded as earned. Dividend income is recognized on the ex-dividend date or for certain foreign securities, as soon as information is available to the Funds. All of the realized and unrealized gains and losses and net investment income, are allocated daily to each class in proportion to its average daily net assets.
Cash Management Transactions: The Funds subscribe to the Brown Brothers Harriman & Co. (“BBH”) Cash Management Service (“CMS”), whereby cash balances are automatically swept into overnight offshore demand deposits with either the BBH Grand Cayman branch or a branch of a pre-approved commercial bank. This fully automated program allows the Funds to earn interest on cash balances. Excess cash with deposit institutions domiciled outside of the U.S. are subject to sovereign actions in the jurisdiction of the deposit institution including, but not limited to, freeze, seizure or diminution. Cash balances in the BBH CMS are included on the Statements of Assets and Liabilities under Cash and Foreign Cash, at Value. As of April 30, 2017, the Funds had the following cash balances participating in the BBH CMS:
| Fund | | | |
| Grandeur Peak Emerging Markets Opportunities Fund | | $ | 25,727,452 | |
| Grandeur Peak Global Micro Cap Fund | | | 921,454 | |
| Grandeur Peak Global Opportunities Fund | | | 3,774,600 | |
| Grandeur Peak Global Reach Fund | | | 10,767,795 | |
| Grandeur Peak Global Stalwarts Fund | | | 3,029,426 | |
| Grandeur Peak International Opportunities Fund | | | 13,152,455 | |
| Grandeur Peak International Stalwarts Fund | | | 6,019,065 | |
As of April 30, 2017, the Funds had the following foreign cash balances participating in the BBH CMS (cost and value of foreign cash balances are equal):
| Fund | | | |
| Grandeur Peak Emerging Markets Opportunities Fund | | $ | 8 | |
| Grandeur Peak Global Micro Cap Fund | | | 1,755 | |
| Grandeur Peak Global Opportunities Fund | | | 39,071 | |
| Grandeur Peak Global Reach Fund | | | 5,994 | |
| Grandeur Peak Global Stalwarts Fund | | | 5,143 | |
| Grandeur Peak International Opportunities Fund | | | 39,779 | |
| Grandeur Peak International Stalwarts Fund | | | 23,671 | |
| 86 | 1.855.377.7325 | www.GrandeurPeakGlobal.com |
Grandeur Peak Funds® | Notes to Financial Statements |
April 30, 2017
Foreign Securities: The Funds may directly purchase securities of foreign issuers. Investing in securities of foreign issuers involves special risks not typically associated with investing in securities of U.S. issuers. The risks include possible reevaluation of currencies, the inability to repatriate foreign currency, less complete financial information about companies and possible future adverse political and economic developments. Moreover, securities of many foreign issuers and their markets may be less liquid and their prices more volatile than those of securities of comparable U.S. issuers.
Foreign Currency Translation: The books and records of the Funds are maintained in U.S. dollars. Investment valuations and other assets and liabilities initially expressed in foreign currencies are converted each business day into U.S. dollars based upon current exchange rates. Prevailing foreign exchange rates may generally be obtained at the close of the NYSE (normally, 4:00 p.m. Eastern Time). The portion of realized and unrealized gains or losses on investments due to fluctuations in foreign currency exchange rates is not separately disclosed and is included in realized and unrealized gains or losses on investments, when applicable.
Foreign Currency Spot Contracts: The Funds may enter into foreign currency spot contracts to facilitate transactions in foreign securities or to convert foreign currency receipts into U.S. dollars. A foreign currency spot contract is an agreement between two parties to buy and sell currencies at the current market rate, for settlement generally within two business days. The U.S. dollar value of the contracts is determined using current currency exchange rates supplied by a pricing service.
The contract is marked‐to‐market daily for settlements beyond one day and any change in market value is recorded as an unrealized gain or loss. When the contract is closed, a realized gain or loss is recorded equal to the difference between the value on the open and close date. Losses may arise from changes in the value of the foreign currency, or if the counterparties do not perform under the contract’s terms. The maximum potential loss from such contracts is the aggregate face value in U.S. dollars at the time the contract was opened.
Trust Expenses: Some expenses of the Trust can be directly attributed to the Funds. Expenses which cannot be directly attributed to the Funds are apportioned among all funds in the Trust based on average net assets of each fund.
Fund and Class Expenses: Expenses that are specific to a Fund or class of shares of a Fund, including distribution fees (Rule 12b‐1 fees), are charged directly to that Fund or share class. Expenses that are common to all Funds generally are allocated among the Funds in proportion to their average daily net assets.
Offering Costs: Offering costs, including costs of printing initial prospectuses, legal and registration fees, are being amortized over twelve months from the inception date of the Funds. Amounts amortized during the period ended April 30, 2017 for the Grandeur Peak Micro Cap Fund, Grandeur Peak Global Stalwarts Fund, and Grandeur Peak International Stalwarts Fund are shown on the Statements of Operations.
Federal Income Taxes: The Funds comply with the requirements under Subchapter M of the Internal Revenue Code of 1986, as amended, applicable to regulated investment companies and intend to distribute substantially all of their net taxable income and net capital gains, if any, each year so that it will not be subject to excise tax on undistributed income and gains. The Funds are not subject to income taxes to the extent such distributions are made.
As of and during the period ended April 30, 2017, the Funds had a liability for unrecognized capital gains tax. These amounts are disclosed as Foreign Capital Gains Tax on the Statements of Assets and Liabilities. The Funds file U.S. federal, state, and local tax returns as required. The Funds’ tax returns are subject to examination by the relevant tax authorities until expiration of the applicable statute of limitations, which is generally three years after the filing of the tax return for federal purposes and four years for most state returns. Tax returns for open years have incorporated no uncertain tax positions that require a provision for income taxes.
Distributions to Shareholders: Each Fund normally pays dividends and distributes capital gains, if any, on an annual basis. Income dividend distributions are derived from dividends and other income each Fund receives from their investments, including short term capital gains. Long term capital gain distributions are derived from gains realized when each Fund sells a security it has owned for more than a year. Each Fund may make additional distributions and dividends at other times if the portfolio manager believes doing so may be necessary for each Fund to avoid or reduce taxes. The Funds intend to pass through foreign tax credits to shareholders.
Annual Report | April 30, 2017 | 87 |
Grandeur Peak Funds® | Notes to Financial Statements |
April 30, 2017
3. TAX BASIS INFORMATION
Reclassifications: As of April 30, 2017, permanent differences in book and tax accounting were reclassified. These differences had no effect on net assets and are primarily attributed to the differing book/tax treatment of foreign currency transactions, non‐deductible expenses, PFIC investments, equalization book/tax distribution differences and certain other investments. The reclassifications were as follows:
| Fund | | Paid-in Capital | | | Accumulated Net Investment Income/(Loss) | | | Accumulated Net Realized Gain/(Loss) on Investments | |
| Grandeur Peak Emerging Markets Opportunities Fund | | $ | – | | | $ | (1,041,329 | ) | | $ | 1,041,329 | |
| Grandeur Peak Global Micro Cap Fund | | | (28,906 | ) | | | 47,443 | | | | (18,537 | ) |
| Grandeur Peak Global Opportunities Fund | | | 499,280 | | | | (128,546 | ) | | | (370,734 | ) |
| Grandeur Peak Global Reach Fund | | | (82,955 | ) | | | (47,179 | ) | | | 130,134 | |
| Grandeur Peak Global Stalwarts Fund | | | (22,792 | ) | | | 74,888 | | | | (52,096 | ) |
| Grandeur Peak International Opportunities Fund | | | 761,165 | | | | 849,564 | | | | (1,610,729 | ) |
| Grandeur Peak International Stalwarts Fund | | | (23,591 | ) | | | (466,587 | ) | | | 490,178 | |
Tax Basis of Investments: As of April 30, 2017, the aggregate cost of investments, gross unrealized appreciation/(depreciation) and net unrealized appreciation for Federal tax purposes was as follows:
| Fund | | Gross Appreciation (excess of value over tax cost) | | | Gross Depreciation (excess of tax cost over value) | | | Net Appreciation/(Depreciation) of Foreign Currency | | | Net Unrealized Appreciation/(Depreciation) | | | Cost of Investments for Income Tax Purposes | |
Grandeur Peak Emerging Markets Opportunities Fund | | $ | 83,840,897 | | | $ | (31,145,544 | ) | | $ | (1,884,940 | ) | | $ | 50,810,413 | | | $ | 341,429,454 | |
Grandeur Peak Global Micro Cap Fund | | | 7,177,859 | | | | (1,864,656 | ) | | | (39,807 | ) | | | 5,273,396 | | | | 30,427,035 | |
Grandeur Peak Global Opportunities Fund | | | 209,572,244 | | | | (43,590,623 | ) | | | (537,275 | ) | | | 165,444,346 | | | | 531,225,446 | |
Grandeur Peak Global Reach Fund | | | 76,125,182 | | | | (19,450,846 | ) | | | (311,423 | ) | | | 56,362,913 | | | | 259,153,375 | |
Grandeur Peak Global Stalwarts Fund | | | 16,633,527 | | | | (2,036,373 | ) | | | (108,998 | ) | | | 14,488,156 | | | | 92,552,963 | |
Grandeur Peak International Opportunities Fund | | | 213,235,736 | | | | (40,798,801 | ) | | | (1,157,839 | ) | | | 171,279,096 | | | | 587,072,162 | |
Grandeur Peak International Stalwarts Fund | | | 48,654,830 | | | | (4,400,058 | ) | | | (239,983 | ) | | | 44,014,789 | | | | 248,350,897 | |
Components of Earnings: As of April 30, 2017, components of distributable earnings on a tax basis were as follows:
| Fund | | Undistributed Ordinary Income | | | Accumulated Capital Gains/(Losses) | | | Other Accumulated Gain/(Loss) | | | Net Unrealized Appreciation/(Depreciation) on Investments and Foreign Currency | | | Total Distributable Earnings | |
Grandeur Peak Emerging Markets Opportunities Fund | | $ | – | | | $ | (10,822,309 | ) | | $ | (843,449 | ) | | $ | 50,810,413 | | | $ | 39,144,655 | |
Grandeur Peak Global Micro Cap Fund | | | 354,672 | | | | 523,471 | | | | – | | | | 5,273,396 | | | | 6,151,539 | |
Grandeur Peak Global Opportunities Fund | | | – | | | | 12,029,758 | | | | – | | | | 165,444,346 | | | | 177,474,104 | |
Grandeur Peak Global Reach Fund | | | – | | | | (5,696,933 | ) | | | (183,144 | ) | | | 56,362,913 | | | | 50,482,836 | |
Grandeur Peak Global Stalwarts Fund | | | – | | | | 610,268 | | | | (1,806 | ) | | | 14,488,156 | | | | 15,096,618 | |
Grandeur Peak International Opportunities Fund | | | 125,618 | | | | 632,413 | | | | – | | | | 171,279,096 | | | | 172,037,127 | |
Grandeur Peak International Stalwarts Fund | | | – | | | | 786,423 | | | | (134,092 | ) | | | 44,014,789 | | | | 44,667,120 | |
Tax Basis of Distributions to Shareholders: The character of distributions made during the year from net investment income or net realized gains may differ from its ultimate characterization for federal income tax purposes. Also, due to the timing of dividend distributions, the fiscal year in which amounts are distributed may differ from the fiscal year in which the income or realized gain were recorded by the Funds.
| 88 | 1.855.377.7325 | www.GrandeurPeakGlobal.com |
Grandeur Peak Funds® | Notes to Financial Statements |
April 30, 2017
The tax character of distributions paid by the Funds for the fiscal year and or period ended April 30, 2017 were as follows:
| Fund | | Ordinary Income | | | Long-Term Capital Gain | |
| Grandeur Peak Emerging Markets Opportunities Fund | | $ | 2,028,686 | | | $ | – | |
| Grandeur Peak Global Micro Cap Fund | | | 380,816 | | | | 10,397 | |
| Grandeur Peak Global Opportunities Fund | | | 682,795 | | | | 771,975 | |
| Grandeur Peak Global Reach Fund | | | 765,635 | | | | – | |
| Grandeur Peak Global Stalwarts Fund | | | 108,750 | | | | – | |
| Grandeur Peak International Opportunities Fund | | | 4,568,286 | | | | 11,768,487 | |
| Grandeur Peak International Stalwarts Fund | | | 1,003,004 | | | | – | |
The tax character of distributions paid by the Funds for the fiscal year and or period ended April 30, 2016 were as follows:
| Fund | | Ordinary Income | | | Long-Term Capital Gain | |
| Grandeur Peak Emerging Markets Opportunities Fund | | $ | 37 | | | $ | 13,091,570 | |
| Grandeur Peak Global Micro Cap Fund | | | – | | | | – | |
| Grandeur Peak Global Opportunities Fund | | | 4,220,786 | | | | 45,472,588 | |
| Grandeur Peak Global Reach Fund | | | 4,111,213 | | | | 7,292,064 | |
| Grandeur Peak Global Stalwarts Fund | | | 12,473 | | | | – | |
| Grandeur Peak International Opportunities Fund | | | 5,508,633 | | | | 28,796,865 | |
| Grandeur Peak International Stalwarts Fund | | | 30,017 | | | | – | |
As of April 30, 2017, the following Funds had available for Federal income tax purposes unused capital losses that may be used to offset future realized capital gains. The following losses will be carried forward indefinitely to offset future realized gains:
| Fund | | Short-Term | | | Long-Term | |
| Grandeur Peak Emerging Markets Opportunities Fund | | $ | 6,261,205 | | | $ | – | |
| Grandeur Peak Global Reach Fund | | | 735,246 | | | | 4,961,687 |
The following Fund elects to defer to the period ending April 30, 2018, capital losses recognized during the period November 1, 2016 to April 30, 2017 in the amount of:
| Fund | Capital Losses Recognized | |
| Grandeur Peak Emerging Markets Opportunities Fund | | $ | 4,561,104 | |
The Grandeur Peak International Opportunities Fund and the Grandeur Peak International Stalwarts Fund used capital loss carryovers during the period ended December 31, 2017 in the amounts of $161,958 and $8,620, respectively.
The following Funds elects to defer to the period ending April 30, 2018, late year ordinary losses in the amount of:
| Fund | | Ordinary Losses Recognized | |
| Grandeur Peak Emerging Markets Opportunities Fund | | $ | 843,449 | |
| Grandeur Peak Global Reach Fund | | | 183,144 | |
| Grandeur Peak Global Stalwarts Fund | | | 1,806 | |
| Grandeur Peak International Stalwarts Fund | | | 134,092 | |
Annual Report | April 30, 2017 | 89 |
Grandeur Peak Funds® | Notes to Financial Statements |
April 30, 2017
4. SECURITIES TRANSACTIONS
The cost of purchases and proceeds from sales of securities (excluding short term securities) during the year ended April 30, 2017 were as follows:
| Fund | | Purchases of Securities | | | Proceeds From Sales of Securities | |
| Grandeur Peak Emerging Markets Opportunities Fund | | $ | 150,251,166 | | | $ | 163,154,042 | |
| Grandeur Peak Global Micro Cap Fund | | | 12,081,786 | | | | 11,795,754 | |
| Grandeur Peak Global Opportunities Fund | | | 191,189,271 | | | | 211,202,419 | |
| Grandeur Peak Global Reach Fund | | | 121,704,831 | | | | 139,063,867 | |
| Grandeur Peak Global Stalwarts Fund | | | 81,151,570 | | | | 21,673,837 | |
| Grandeur Peak International Opportunities Fund | | | 207,089,151 | | | | 230,789,471 | |
| Grandeur Peak International Stalwarts Fund | | | 194,109,255 | | | | 72,760,159 | |
5. SHARES OF BENEFICIAL INTEREST
The capitalization of the Trust consists of an unlimited number of shares of beneficial interest with no par value per share. Holders of the shares of the Funds of the Trust have one vote for each share held and a proportionate fraction of a vote for each fractional share. All shares issued and outstanding are fully paid and are transferable and redeemable at the option of the shareholder. Purchasers of the share do not have any obligation to make payments to the Trust or its creditors solely by reason of the purchasers’ ownership of the shares. Shares have no pre‐emptive rights.
Shares redeemed within 60 days of purchase may incur a 2% short‐term redemption fee deducted from the redemption amount. For the year ended April 30, 2017 and the year ended April 30, 2016, the redemption fees charged by the Funds are presented in the Statements of Changes in Net Assets.
6. MANAGEMENT AND RELATED‐PARTY TRANSACTIONS
The Adviser, subject to the authority of the Board, is responsible for the overall management and administration of the Funds’ business affairs. The Adviser manages the investments of the Funds in accordance with the Funds’ investment objective, policies and limitations and investment guidelines established jointly by the Adviser and the Trustees. Pursuant to the Advisory Agreement, (the “Advisory Agreement”), each Fund pays the Adviser an annual management fee based on each Fund’s average daily net assets. The management fee is paid on a monthly basis. The following table reflects the Funds’ advisory fee rates.
| Fund | Advisory Fee |
| Grandeur Peak Emerging Markets Opportunities Fund | 1.35% |
| Grandeur Peak Global Micro Cap Fund | 1.50% |
| Grandeur Peak Global Opportunities Fund | 1.25% |
| Grandeur Peak Global Reach Fund | 1.10% |
| Grandeur Peak Global Stalwarts Fund | 0.80% |
| Grandeur Peak International Opportunities Fund | 1.25% |
| Grandeur Peak International Stalwarts Fund | 0.80% |
| 90 | 1.855.377.7325 | www.GrandeurPeakGlobal.com |
Grandeur Peak Funds® | Notes to Financial Statements |
April 30, 2017
The Adviser has contractually agreed to limit certain of each Fund’s expenses. The following table reflects the Funds’ expense cap.
| Fund | Expense Cap | Term of Expense Limit Agreements |
| Grandeur Peak Emerging Markets Opportunities Fund | | |
| Investor Class | 1.95% | September 1, 2015 – August 31, 2016 / |
| Institutional Class | 1.70% | September 1, 2016 – August 31, 2017 |
| Grandeur Peak Global Micro Cap Fund | | |
| Institutional Class | 2.00% | June 29, 2015 – August 31, 2016 / |
| | | September 1, 2016 – August 31, 2017 |
| Grandeur Peak Global Opportunities Fund | | |
| Investor Class | 1.75% | September 1, 2015 – August 31, 2016 / |
| Institutional Class | 1.50% | September 1, 2016 – August 31, 2017 |
| Grandeur Peak Global Reach Fund | | |
| Investor Class | 1.60% | September 1, 2015 – August 31, 2016 / |
| Institutional Class | 1.35% | September 1, 2016 – August 31, 2017 |
| Grandeur Peak Global Stalwarts Fund | | |
| Investor Class | 1.35% | June 29, 2015 – August 31, 2016 / |
| Institutional Class | 1.10% | September 1, 2016 – August 31, 2017 |
| Grandeur Peak International Opportunities Fund | | |
| Investor Class | 1.75% | September 1, 2015 – August 31, 2016 / |
| Institutional Class | 1.50% | September 1, 2016 – August 31, 2017 |
| Grandeur Peak International Stalwarts Fund | | |
| Investor Class | 1.35% | June 29, 2015 – August 31, 2016 / |
| Institutional Class | 1.10% | September 1, 2016 – August 31, 2017 |
Pursuant to these agreements, each Fund will reimburse the Adviser for any previous fee waivers and expense reimbursements made by the Adviser, provided that any such reimbursements made by the Funds to the Adviser will not cause the Funds’ expense limitation to exceed expense limitations in existence at the time the expense was incurred, or at the time of the reimbursement, whichever is lower, and the reimbursement is made within three years after the expenses were incurred. Fees waived/reimbursed by adviser for the year ended April 30, 2017 are disclosed in the Statements of Operations.
In addition to the foregoing contractual arrangements, the Adviser has voluntarily agreed, effective September 1, 2016, to waive, with respect to the Grandeur Peak Global Opportunities Fund and the Grandeur Peak International Opportunities Fund only, annual management fees to the extent such fees exceed 1.10% on assets above $500 million in such Fund. This voluntary arrangement is not entitled to recoupment and may be terminated at any time by the Adviser.
| Annual Report | April 30, 2017 | 91 |
Grandeur Peak Funds® | Notes to Financial Statements |
April 30, 2017
For the year ended April 30, 2017, the fee waivers/reimbursements and/or recoupments were as follows:
| Fund | | Fees Waived/Reimbursed By Adviser | | | Recoupment of Previously Waived Fees By Adviser | |
| Grandeur Peak Emerging Markets Opportunities Fund | | | | | | |
| Investor Class | | $ | – | | | $ | – | |
| Institutional Class | | | – | | | | – | |
| Grandeur Peak Global Micro Cap Fund | | | | | | | | |
| Institutional Class | | | 54,685 | | | | – | |
| Grandeur Peak Global Opportunities Fund | | | | | | | | |
| Investor Class | | $ | – | | | $ | – | |
| Institutional Class | | | – | | | | – | |
| Grandeur Peak Global Reach Fund | | | | | | | | |
| Investor Class | | $ | – | | | $ | – | |
| Institutional Class | | | – | | | | – | |
| Grandeur Peak Global Stalwarts Fund | | | | | | | | |
| Investor Class | | $ | 23,105 | | | $ | – | |
| Institutional Class | | | 22,190 | | | | – | |
| Grandeur Peak International Opportunities Fund | | | | | | | | |
| Investor Class | | $ | – | | | $ | – | |
| Institutional Class | | | – | | | | – | |
| Grandeur Peak International Stalwarts Fund | | | | | | | | |
| Investor Class | | $ | – | | | $ | 7,314 | |
| Institutional Class | | | – | | | | 44,153 | |
As of April 30, 2017, the balances of recoupable expenses for each Fund were as follows:
| Fund | | Expires 2019 | | | Expires 2020 | | | Total | |
| Grandeur Peak Emerging Markets Opportunities Fund | | | | | | | | | |
| Investor Class | | $ | – | | | $ | – | | | $ | – | |
| Institutional Class | | | – | | | | – | | | | – | |
| Grandeur Peak Global Micro Cap Fund | | | | | | | | | | | | |
| Institutional Class | | $ | 44,561 | | | $ | 54,685 | | | $ | 99,246 | |
| Grandeur Peak Global Opportunities Fund | | | | | | | | | | | | |
| Investor Class | | $ | – | | | $ | – | | | $ | – | |
| Institutional Class | | | – | | | | – | | | | – | |
| Grandeur Peak Global Reach Fund | | | | | | | | | | | | |
| Investor Class | | $ | – | | | $ | – | | | $ | – | |
| Institutional Class | | | – | | | | – | | | | – | |
| Grandeur Peak Global Stalwarts Fund | | | | | | | | | | | | |
| Investor Class | | $ | 56,762 | | | $ | 23,105 | | | $ | 79,867 | |
| Institutional Class | | | 55,389 | | | | 22,190 | | | | 77,579 | |
| Grandeur Peak International Opportunities Fund | | | | | | | | | | | | |
| Investor Class | | $ | – | | | $ | – | | | $ | – | |
| Institutional Class | | | – | | | | – | | | | – | |
| Grandeur Peak International Stalwarts Fund | | | | | | | | | | | | |
| Investor Class | | $ | – | | | $ | – | | | $ | – | |
| Institutional Class | | | – | | | | – | | | | – | |
| 92 | 1.855.377.7325 | www.GrandeurPeakGlobal.com |
Grandeur Peak Funds® | Notes to Financial Statements |
April 30, 2017
Administrator Fees and Expenses
ALPS Fund Services, Inc. (“ALPS”) serves as administrator to the Funds and the Funds have agreed to pay expenses incurred in connection with their administrative activities. Pursuant to an Administration Agreement, ALPS provides operational services to the Funds including, but not limited to, fund accounting and fund administration and generally assists in the Funds’ operations. Officers of the Trust are employees of ALPS. The Funds’ administration fee is accrued on a daily basis and paid monthly. Administration fees paid by the Funds for the year ended April 30, 2017 are disclosed in the Statements of Operations.
ALPS is reimbursed by the Fund for certain out‐of‐pocket expenses.
Transfer Agent
ALPS serves as transfer, dividend paying and shareholder servicing agent for the Funds. ALPS receives an annual minimum fee, a fee based upon the number of shareholder accounts, and is also reimbursed by the Funds for certain out‐of‐pocket expenses. Transfer agent fees paid by the Funds for the year ended April 30, 2017 are disclosed in the Statements of Operations.
Compliance Services
ALPS provides services that assist the Trust’s chief compliance officer in monitoring and testing the policies and procedures of the Trust in conjunction with requirements under Rule 38a‐1 under the 1940 Act and receives an annual base fee. ALPS is reimbursed for certain out‐of‐pocket expenses by the Funds. Compliance service fees paid by the Funds for the year ended April 30, 2017 are disclosed in the Statements of Operations.
Principal Financial Officer
ALPS receives an annual fee for providing principal financial officer services to the Funds. Principal financial officer fees paid by the Fund for the year ended April 30, 2017 are disclosed in the Statements of Operations.
Distributor: ALPS Distributors, Inc. (“ADI” or the “Distributor”) (an affiliate of ALPS) acts as the distributor of the Funds’ shares pursuant to a Distribution Agreement with the Trust. Shares are sold on a continuous basis by ADI as agent for the Funds, and ADI has agreed to use its best efforts to solicit orders for the sale of each Fund’s shares, although it is not obliged to sell any particular amount of shares. ADI is not entitled to any compensation for its services as Distributor. ADI is registered as a broker‐dealer with the U.S. Securities and Exchange Commission.
Each Fund has adopted a Distribution and Services (Rule 12b‐1) Plan pursuant to Rule 12b‐1 of the 1940 Act (the “Plan”) for its Investor Class shares. The Plan allows the Funds to use Investor Class assets to pay fees in connection with the distribution and marketing of Investor Class shares and/or the provision of shareholder services to Investor Class shareholders. The Plan permits payment for services in connection with the administration of plans or programs that use Investor Class shares of each Fund as their funding medium and for related expenses. The recipients of such payments may include the Distributor, other affiliates of the Adviser, broker‐dealers, financial institutions, plan sponsors and administrators and other financial intermediaries through which investors may purchase shares of the Fund. The Plan permits the Funds to make total payments at an annual rate of up to 0.25% of each Fund’s average daily net assets attributable to its Investor Class shares. The expenses of the Plan are reflected as distribution and service fees in the Statements of Operations.
7. INDEMNIFICATIONS
Under the Trust’s organizational documents, its officers and Trustees are indemnified against certain liability arising out of the performance of their duties to the Trust. Additionally, in the normal course of business, the Trust enters into contracts with service providers that may contain general indemnification clauses, which may permit indemnification to the extent permissible under applicable law. The Trust’s maximum exposure under these arrangements is unknown, as this would involve future claims that may be made against the Trust that have not yet occurred.
8. RECENT ACCOUNTING PRONOUNCEMENT
On October 13, 2016, the SEC amended Regulation S‐X, which will require standardized, enhanced disclosure about derivatives in investment company financial statements, as well as other amendments. The compliance date for the amendments to Regulation S‐X is August 1, 2017. Management is currently evaluating the impact to the financial statements and disclosures.
Annual Report | April 30, 2017 | 93 |
Grandeur Peak Funds® | Report of Independent Registered Public Accounting Firm |
To the Shareholders and Board of Trustees of Financial Investors Trust:
We have audited the accompanying statements of assets and liabilities, including the portfolios of investments, of Grandeur Peak Emerging Markets Opportunities Fund, Grandeur Peak Global Micro Cap Fund, Grandeur Peak Global Opportunities Fund, Grandeur Peak Global Reach Fund, Grandeur Peak Global Stalwarts Fund, Grandeur Peak International Opportunities Fund, and Grandeur Peak International Stalwarts Fund, seven of the portfolios constituting Financial Investors Trust, as of April 30, 2017, and the related statements of operations for the year then ended, the statements of changes in net assets for each of the two years in the period then ended (as to Grandeur Peak Global Micro Cap Fund, for the year then ended and for the period October 21, 2015 (commencement of operations) to April 30, 2016; and as to Grandeur Peak Global Stalwarts Fund and Grandeur Peak International Stalwarts Fund, for the year then ended and for the period September 2, 2015 (commencement of operations) to April 30, 2016), and the financial highlights for each of the periods presented. These financial statements and financial highlights are the responsibility of the Funds’ management. Our responsibility is to express an opinion on these financial statements and financial highlights based on our audits.
We conducted our audits in accordance with the standards of the Public Company Accounting Oversight Board (United States). Those standards require that we plan and perform the audit to obtain reasonable assurance about whether the financial statements and financial highlights are free of material misstatement. The Funds are not required to have, nor were we engaged to perform, an audit of their internal control over financial reporting. Our audits included consideration of internal control over financial reporting as a basis for designing audit procedures that are appropriate in the circumstances, but not for the purpose of expressing an opinion on the effectiveness of the Funds’ internal control over financial reporting. Accordingly, we express no such opinion. An audit also includes examining, on a test basis, evidence supporting the amounts and disclosures in the financial statements, assessing the accounting principles used and significant estimates made by management, as well as evaluating the overall financial statement presentation. Our procedures included confirmation of securities owned as of April 30, 2017, by correspondence with the custodian and brokers; when replies were not received from brokers, we performed other auditing procedures. We believe that our audits provide a reasonable basis for our opinion.
In our opinion, the financial statements and financial highlights referred to above present fairly, in all material respects, the financial position of Grandeur Peak Emerging Markets Opportunities Fund, Grandeur Peak Global Micro Cap Fund, Grandeur Peak Global Opportunities Fund, Grandeur Peak Global Reach Fund, Grandeur Peak Global Stalwarts Fund, Grandeur Peak International Opportunities Fund, and Grandeur Peak International Stalwarts Fund of Financial Investors Trust as of April 30, 2017, the results of their operations for the year then ended, and the changes in their net assets and the financial highlights for each of the periods presented, in conformity with accounting principles generally accepted in the United States of America.
DELOITTE & TOUCHE LLP
Denver, Colorado
June 27, 2017
| 94 | 1.855.377.7325 | www.GrandeurPeakGlobal.com |
Grandeur Peak Funds® | Disclosure Regarding Approval of Fund Advisory Agreement |
April 30, 2017 (Unaudited)
On September 13, 2016, the Trustees met in person to discuss, among other things, the renewal of the investment advisory agreement between the Trust and Grandeur Peak (the “Investment Advisory Agreement”), in accordance with Section 15(c) of the 1940 Act. The Independent Trustees met with independent legal counsel during executive session and discussed the Investment Advisory Agreement and other related materials. In renewing and approving the Investment Advisory Agreement with Grandeur Peak, the Trustees, including the Independent Trustees, considered the following factors with respect to the Grandeur Peak Global Opportunities Fund (“Global Opportunities Fund”), Grandeur Peak International Opportunities Fund (“Global International Fund”), Grandeur Peak Global Reach Fund (“Global Reach Fund”), Grandeur Peak Emerging Markets Opportunities Fund (“Emerging Markets Opportunities Fund”), Grandeur Peak Global Stalwarts Fund (“Global Stalwart Fund”), Grandeur Peak International Stalwarts Fund (“International Stalwart Fund”), and Grandeur Peak Global Micro Cap Fund (“Micro Cap Fund”) (collectively, the “Grandeur Peak Funds”):
Investment Advisory Fee Rate: The Trustees reviewed and considered the contractual annual advisory fee to be paid by the Trust, on behalf of the Grandeur Peak Funds to Grandeur Peak of 1.25% of each of the Global Opportunities Fund and Global International Fund daily average net assets, 1.10% of the Global Reach Fund daily average net assets, 1.35% of the Emerging Markets Opportunities Fund daily average net assets, 0.80% of each of the Global Stalwart Fund and International Stalwart Fund daily average net assets and 1.50% of the Micro Cap Fund daily average net assets, in light of the extent and quality of the advisory services provided by Grandeur Peak to the Grandeur Peak Funds.
The Board received and considered information including a comparison of the net and gross management fees and the gross advisory fee of each of the Grandeur Peak Funds with those of funds in the peer group and universe of funds provided by an independent provider of investment company data (the “Data Provider”). The Trustees noted that the net and gross management fees of the Investor Class, as applicable, and Institutional Class of each Grandeur Peak Fund was above its respective peer group and universe median, except for the Global Stalwart and International Stalwart Funds, which were below their respective peer group and universe median. The Trustees also noted that the gross advisory fee of the Investor Class, as applicable, and Institutional Class of each Grandeur Peak Fund was above its respective peer group average and median, except for the Institutional Class of the Micro Cap Fund and the Investor Class and the Institutional Class of the Global Stalwarts and International Stalwarts Funds, which were below their respective peer group average and median.
Total Expense Ratios: The Trustees further reviewed and considered the total net expense ratios (after waivers, subject to certain exclusions) of 1.38% for the Institutional Class and 1.62% for the Investor Class of each of the International Opportunities Fund and the Global Opportunities Fund, 1.55% for the Institutional Class and 1.77% for the Investor Class of the Emerging Markets Opportunities Fund, 1.35% for the Institutional Class and 1.60% for the Investor Class of the Global Reach Fund, 2.00% for the Institutional Class of the Micro Cap Fund and 1.35% for the Investor Class and 1.10% for the Institutional Class of each of the Global Stalwarts and International Stalwarts Funds. The Trustees noted that the total expense ratio (after waivers) of the Investor Class, as applicable, and Institutional Class of each Grandeur Peak Fund was generally above (and in some cases significantly above) the peer group median and average total expense ratios (after waivers), except that the total expense ratio (after waivers) of the Investor Class of the Emerging Markets Opportunities Fund and the International Stalwarts Fund were below the peer group median and average total expense ratios (after waivers).
Nature, Extent and Quality of the Services under the Investment Advisory Agreement: The Trustees received and considered information regarding the nature, extent and quality of services to be provided to the Grandeur Peak Funds under the Investment Advisory Agreement. The Trustees reviewed certain background materials supplied by Grandeur Peak in its presentation, including its Form ADV.
The Trustees reviewed and considered Grandeur Peak’s investment advisory personnel, its history as an asset manager and its performance and the amount of assets currently under management by Grandeur Peak and its affiliated entities. The Trustees also reviewed the research and decision‐making processes utilized by Grandeur Peak, including the methods adopted to seek to achieve compliance with the investment objectives, policies and restrictions of the Grandeur Peak Funds.
The Trustees considered the background and experience of Grandeur Peak’s management in connection with the Grandeur Peak Funds, including reviewing the qualifications, backgrounds and responsibilities of the management team primarily responsible for the day‐to‐day portfolio management of the Grandeur Peak Funds and the extent of the resources devoted to research and analysis of actual and potential investments.
The Trustees also reviewed, among other things, Grandeur Peak’s insider trading policies and procedures and its Code of Ethics.
Performance: The Trustees reviewed performance information for each of the Grandeur Peak Funds for the three‐month, 1‐year and 3–year periods, if applicable, ended June 30, 2016. That review included a comparison of each Grandeur Peak Fund’s performance to the performance of a group of comparable funds selected by the Data Provider. The Trustees noted that the performance of Investor Class, as applicable, and Institutional Class of each Grandeur Peak Fund was above the median performance of the funds in its respective peer performance universe for the most recent 3‐month, 1‐year and 3‐year period and since inception, as applicable, except that the Investor Class and Institutional Class of the Global Stalwarts Fund was below its respective peer performance universe for the most recent 3‐month period. The Trustees noted that the since inception performance of each of the Grandeur Peak Funds ranked in the top three of its respective peer performance universe, except the Investor Class of the Emerging Markets Opportunities Fund which ranked fourth in its peer performance universe.
| Annual Report | April 30, 2017 | 95 |
Grandeur Peak Funds® | Disclosure Regarding Approval of Fund Advisory Agreement |
April 30, 2017 (Unaudited)
The Trustees also considered Grandeur Peak’s discussion of each Grandeur Peak Fund’s underlying portfolio diversification categories, its top contributors and top detractors, as well as Grandeur Peak’s performance and reputation generally and its investment techniques, risk management controls and decision‐making processes.
Comparable Accounts: The Trustees considered certain information provided by Grandeur Peak regarding fees charged to its limited partnerships and separately managed accounts utilizing strategies similar to those employed by the Global Opportunities Fund and the Global International Fund, noting Grandeur Peak’s statements in the Grandeur Peak Book regarding differences in how often the accounts are priced, number of clientele, turnover of client assets, and operational structure.
Profitability: The Trustees received and considered a retrospective and projected profitability analysis prepared by Grandeur Peak based on the fees payable under the Investment Advisory Agreement with respect to each Grandeur Peak Fund. The Trustees considered the profits, if any, anticipated to be realized by Grandeur Peak in connection with the operation of each Grandeur Peak Fund. The Board then reviewed Grandeur Peak’s Income Statement and Balance Sheet for the calendar years 2011‐2015 and projections for 2016 in order to analyze the financial condition and stability and profitability of Grandeur Peak.
Economies of Scale: The Trustees considered whether economies of scale in the provision of services to the Grandeur Peak Funds will be passed along to the shareholders under the proposed agreements.
Other Benefits to the Adviser: The Trustees reviewed and considered any other incidental benefits derived or to be derived by Grandeur Peak from its relationship with the Grandeur Peak Funds, including whether soft dollar arrangements were used.
In renewing Grandeur Peak as the Grandeur Peak Funds’ investment adviser and renewing the Investment Advisory Agreement and the fees charged under the Investment Advisory Agreement, the Trustees concluded that no single factor reviewed by the Trustees was identified by the Trustees to be determinative as the principal factor in whether to renew the Investment Advisory Agreement. Further, the Independent Trustees were advised by separate independent legal counsel throughout the process. The Trustees, including all of the Independent Trustees, concluded that:
| | • | the net and gross management fees of the Investor Class, as applicable, and Institutional Class of each Grandeur Peak Fund was above its respective peer group and universe median, except for the Global Stalwart and International Stalwart Funds, which were below their respective peer group and universe median; and the gross advisory fee of the Investor Class, as applicable, and Institutional Class of each Grandeur Peak Fund was above its respective peer group average and median, except for the Institutional Class of the Micro Cap Fund and the Investor Class and the Institutional Class of the Global Stalwarts and International Stalwarts Funds, which were below their respective peer group average and median; |
| | • | the total expense ratios (after waivers) of the Investor Class, as applicable, and Institutional Class of each Grandeur Peak Fund was generally above (and in some cases significantly above) the peer group median and average total expense ratios (after waivers), except that the total expense ratio (after waivers) of the Investor Class of the Emerging Markets Opportunities Fund and the International Stalwarts Fund were below the peer group median and average total expense ratios (after waivers); |
| | • | the nature, extent and quality of services to be rendered by Grandeur Peak under the Investment Advisory Agreement with respect to the Grandeur Peak Funds were adequate; |
| | • | the performance of Investor Class, as applicable, and Institutional Class of each Grandeur Peak Fund was above the median performance of the funds in its respective peer performance universe for the most recent 3‐month, 1‐year and 3‐year period and since inception, as applicable, (except that the Investor Class and Institutional Class of the Global Stalwarts Fund was below its respective peer performance universe for the most recent 3‐month period) and the since inception performance of each of the Grandeur Peak Funds ranked in the top three of its respective peer performance universe, (except the Investor Class of the Emerging Markets Opportunities Fund which ranked fourth in its peer performance universe); |
| | • | bearing in mind the limitations of comparing different types of managed accounts and the different levels of service typically associated with such accounts, the fee structures applicable to Grandeur Peak’s other clients employing a comparable strategy to one or more of the Grandeur Peak Funds were not indicative of any unreasonableness with respect to the advisory fees proposed to be payable by the Grandeur Peak Funds; |
| | • | the profit, if any, realized by Grandeur Peak in connection with the operation of the Grandeur Peak Funds is not unreasonable to the Grandeur Peak Funds; and |
| | • | there were no material economies of scale or other incidental benefits accruing to Grandeur Peak in connection with its relationship with the Grandeur Peak Funds. |
| 96 | 1.855.377.7325 | www.GrandeurPeakGlobal.com |
Grandeur Peak Funds® | Disclosure Regarding Approval of Fund Advisory Agreement |
April 30, 2017 (Unaudited)
During the review process, the Trustees noted certain instances where clarification or follow‐up was appropriate and others where the Trustees determined that further clarification or follow‐up was not necessary. In those instances where clarification or follow‐up was requested, the Board determined that in each case either information responsive to its requests had been provided, or where any request was outstanding in whole or in part, given the totality of the information provided with respect to the Investment Advisory Agreement, the Board had received sufficient information to approve the Investment Advisory Agreement.
Based on the Trustees’ deliberations and their evaluation of the information described above, the Trustees, including all of the Independent Trustees, concluded that Grandeur Peak’s compensation for investment advisory services is consistent with the best interests of the Grandeur Peak Funds and their shareholders.
Annual Report | April 30, 2017 | 97 |
Grandeur Peak Funds® | Additional Information |
April 30, 2017 (Unaudited)
1. FUND HOLDINGS
The Funds file their complete schedule of portfolio holdings with the Securities and Exchange Commission (the “SEC”) for the first and third quarters of each fiscal year on Form N-Q within 60 days after the end of the period. Copies of the Funds’ Form N-Q are available without charge on the SEC website at http://www.sec.gov. You may also review and copy the Form N-Q at the SEC’s Public Reference Room in Washington, DC. For more information about the operation of the Public Reference Room, please call the SEC at 1-800-SEC-0330.
2. FUND PROXY VOTING POLICIES, PROCEDURES AND SUMMARIES
The Funds’ policies and procedures used in determining how to vote proxies and information regarding how the Funds voted proxies relating to portfolio securities during the most recent prior 12-month period ending June 30 are available without charge, (1) upon request, by calling (toll‐free) 855‐377‐PEAK(7325) and (2) on the SEC’s website at http://www.sec.gov.
3. TAX DESIGNATIONS
The Funds designate the following for federal income tax purposes for distributions made during the fiscal year ended April 30, 2017, if any:
| | | Foreign Taxes Paid | | | Foreign Source Income | |
| Global Opportunities Fund | | $ | 779,972 | | | $ | 7,897,413 | |
| International Opportunities Fund | | $ | 1,297,180 | | | $ | 11,729,873 | |
| Global Reach Fund | | $ | 400,769 | | | $ | 4,284,561 | |
| Emerging Markets Opportunities Fund | | $ | 679,673 | | | $ | 7,042,550 | |
| Global Micro Cap Fund | | $ | 70,496 | | | $ | 583,044 | |
| Global Stalwarts Fund | | $ | 62,838 | | | $ | 571,998 | |
| International Stalwarts Fund | | $ | 274,325 | | | $ | 2,593,643 | |
Of the distributions paid by the Funds from ordinary income for the calendar year ended December 31, 2016, the following percentages met the requirements to be treated as qualifying for the corporate dividends received deduction and qualified dividend income:
| | Dividend Received Deduction | Qualified Dividend Income |
| Global Opportunities Fund | 100.00% | 100.00% |
| International Opportunities Fund | 0.50% | 85.76% |
| Global Reach Fund | 50.56% | 100.00% |
| Emerging Markets Opportunities Fund | 0.96% | 82.72% |
| Global Micro Cap Fund | 24.73% | 95.32% |
| Global Stalwarts Fund | 54.91% | 73.32% |
| International Stalwarts Fund | 0.82% | 92.56% |
In early 2017, if applicable, shareholders of record received this information for the distributions paid to them by the Funds during the calendar year 2016 via Form 1099. The Funds will notify shareholders in early 2018 of amounts paid to them by the Funds, if any, during the calendar year 2017.
Pursuant to Section 852(b)(3) of the Internal Revenue Code, the Funds designated the following as long‐term capital gain dividends:
| | | Long-term Capital Gain | |
| Global Opportunities Fund | | $ | 771,975 | |
| International Opportunities Fund | | $ | 11,768,487 | |
| Global Reach Fund | | | – | |
| Emerging Markets Opportunities Fund | | | – | |
| Global Micro Cap Fund | | $ | 10,397 | |
| Global Stalwarts Fund | | | – | |
| International Stalwarts Fund | | | – | |
The amounts above include $481,599 of earnings and profits distributed to shareholders on redemptions for the Global Opportunities Fund and $215,680 for International Opportunities. All other funds did not include redemptions to shareholders as distributions of earnings and profit.
| 98 | 1.855.377.7325 | www.GrandeurPeakGlobal.com |
Grandeur Peak Funds® | Trustees and Officers |
April 30, 2017 (Unaudited)
Additional information regarding the Fund’s trustees is included in the Statement of Additional Information, which can be obtained without charge by calling 855‐377‐7325.
INDEPENDENT TRUSTEES
Name, Address* & Year of Birth | Position(s) Held with Fund | Term of Office** and Length of Time Served | Principal Occupation(s) During Past 5 Years*** | Number of Funds in Fund Complex Overseen by Trustee**** | Other Directorships Held by Trustee During Past 5 Years*** |
Mary K. Anstine, 1940 | Trustee and Chairman | Ms. Anstine was elected at a special meeting of shareholders held on March 21, 1997 and re‐elected at a special meeting of shareholders held on August 7, 2009. Ms. Anstine was appointed Chairman of the Board at the June 6, 2017 meeting of the Board of Trustees. | Ms. Anstine was formerly an Executive Vice President of First Interstate Bank of Denver until 1994, President/Chief Executive Officer of HealthONE Alliance, Denver, Colorado, from 1994 to 2004, and has been retired since 2004. Ms. Anstine is also Trustee/Director of AV Hunter Trust and Colorado Uplift Board. Ms. Anstine was formerly a Director of the Trust Bank of Colorado (later purchased and now known as Northern Trust Bank), HealthONE and Denver Area Council of the Boy Scouts of America, and a member of the American Bankers Association Trust Executive Committee. | 34 | Ms. Anstine is a Trustee of ALPS ETF Trust (20 funds); ALPS Variable Investment Trust (9 funds); Reaves Utility Income Fund (1 fund); and Westcore Trust (14 funds). |
Jeremy W. Deems, 1976 | Trustee | Mr. Deems was appointed as a Trustee at the March 11, 2008 meeting of the Board of Trustees and elected at a special meeting of shareholders held on August 7, 2009. | Mr. Deems is the Co‐Founder, Chief Operations Officer and Chief Financial Officer of Green Alpha Advisors, LLC, a registered investment advisor, and Co‐Portfolio Manager of the Shelton Green Alpha Fund. Prior to joining Green Alpha Advisors, Mr. Deems was CFO and Treasurer of Forward Management, LLC, ReFlow Management Co., LLC, ReFlow Fund, LLC, a private investment fund, and Sutton Place Management, LLC, an administrative services company, from 1998 to June 2007. From 2004 to 2005, Mr. Deems also served as Treasurer of the Forward Funds and the Sierra Club Funds. | 34 | Mr. Deems is a Trustee of ALPS ETF Trust (20 funds); ALPS Variable Investment Trust (9 funds); Clough Funds Trust (1 fund); Elevation ETF Trust (1 fund); and Reaves Utility Income Fund (1 fund). |
| Annual Report | April 30, 2017 | 99 |
Grandeur Peak Funds® | Trustees and Officers |
April 30, 2017 (Unaudited)
INDEPENDENT TRUSTEES
Name, Address* & Year of Birth | Position(s) Held with Fund | Term of Office** and Length of Time Served | Principal Occupation(s) During Past 5 Years*** | Number of Funds in Fund Complex Overseen by Trustee**** | Other Directorships Held by Trustee During Past 5 Years*** |
Jerry G. Rutledge, 1944 | Trustee | Mr. Rutledge was elected at a special meeting of shareholders held on August 7, 2009. | Mr. Rutledge is the President and owner of Rutledge’s Inc., a retail clothing business. Mr. Rutledge is currently Director of the American National Bank. He was from 1994 to 2007 a Regent of the University of Colorado. | 34 | Mr. Rutledge is a Trustee of Principal Real Estate Income Fund (1 fund), Clough Global Dividend and Income Fund (1 fund), Clough Global Equity Fund (1 fund) and Clough Global Opportunities Fund (1 fund). |
Michael “Ross” Shell, 1970 | Trustee | Mr. Shell was elected at a special meeting of shareholders held on August 7, 2009. | Mr. Shell is Founder and CEO of Red Idea, LLC, a strategic consulting/early stage venture firm (since June 2008). From 1999 to 2009, he was a part‐owner and Director of Tesser, Inc., a brand agency. From December 2005 to May 2008, he was Director, Marketing and Investor Relations, of Woodbourne, a REIT/real estate hedge fund and private equity firm. Prior to this, from May 2004 to November 2005, he worked as a business strategy consultant; from June 2003 to April 2004, he was on the Global Client Services team of IDEO, a product design/innovation firm; and from 1999 to 2003, he was President of Tesser, Inc. Mr. Shell graduated with honors from Stanford University with a degree in Political Science. | 34 | None. |
| 100 | 1.855.377.7325 | www.GrandeurPeakGlobal.com |
Grandeur Peak Funds® | Trustees and Officers |
April 30, 2017 (Unaudited)
INTERESTED TRUSTEE
Name, Address* & Year of Birth | Position(s) Held with Fund | Term of Office** and Length of Time Served | Principal Occupation(s) During Past 5 Years*** | Number of Funds in Fund Complex Overseen by Trustee**** | Other Directorships Held by Trustee During Past 5 Years*** |
Edmund J. Burke, 1961 | Trustee and President | Mr. Burke was elected as Trustee at a special meeting of shareholders held on August 7, 2009. Mr. Burke was elected President of the Trust at the December 17, 2002 meeting of the Board of Trustees. | Mr. Burke is President and a Director of ALPS Holdings, Inc. (“AHI”) (since 2005) and Director of Boston Financial Data Services, Inc. (“BFDS”), ALPS Advisors, Inc. (“AAI”), ALPS Distributors, Inc. (“ADI”), ALPS Fund Services, Inc. (“AFS”) and ALPS Portfolio Solutions Distributor, Inc. (“APSD”) and from 2001‐2008, was President of AAI, ADI, AFS and APSD. Because of his positions with AHI, BFDS, AAI, ADI, AFS and APSD, Mr. Burke is deemed an affiliate of the Trust as defined under the 1940 Act. | 34 | Mr. Burke is a Trustee of Clough Global Dividend and Income Fund (1 fund); Clough Global Equity Fund (1 fund); Clough Global Opportunities Fund (1 fund); Clough Funds Trust (1 fund); Liberty All‐Star Equity Fund (1 fund); and Director of the Liberty All‐Star Growth Fund, Inc. (1 fund). |
| Annual Report | April 30, 2017 | 101 |
Grandeur Peak Funds® | Trustees and Officers |
April 30, 2017 (Unaudited)
OFFICERS
Name, Address* & Year of Birth | Position(s) Held with Fund | Term of Office** and Length of Time Served | Principal Occupation(s) During Past 5 Years*** |
Kimberly R. Storms, 1972 | Treasurer | Ms. Storms was elected Treasurer of the Trust at the March 12, 2013 meeting of the Board of Trustees. | Ms. Storms is Senior Vice President ‐ Director of Fund Administration of ALPS. Because of her position with ALPS, Ms. Storms is deemed an affiliate of the Trust as defined under the 1940 Act. Ms. Storms is also Treasurer of Liberty All‐Star Equity Fund, Liberty All‐Star Growth Fund, Inc., ALPS Series Trust and Elevation ETF Trust. Ms. Storms also serves as a Board member and Treasurer of The Center for Trauma & Resilience, a nonprofit agency. |
Karen S. Gilomen, 1970 | Secretary | Ms. Gilomen was elected Secretary of the Trust at the December 13, 2016 meeting of the Board of Trustees. | Ms. Gilomen joined ALPS in August 2016 as Vice President and Senior Counsel. Prior to joining ALPS, Ms. Gilomen was Vice President ‐ General Counsel & CCO of Monticello Associates, Inc. from 2010 to 2016. Because of her position with ALPS, Ms. Gilomen is deemed an affiliate of the Trust, as defined under the 1940 Act. Ms. Gilomen is also the Secretary of Oak Associates Funds and Reaves Utility Income Fund, and the Assistant Secretary of the WesMark Funds. |
Ted Uhl, 1974 | Chief Compliance Officer (“CCO”) | Mr. Uhl was appointed CCO of the Trust at the June 8, 2010 meeting of the Board of Trustees. | Mr. Uhl joined ALPS in October 2006, and is currently Deputy Compliance Officer of ALPS. Prior to his current role, Mr. Uhl served as Senior Risk Manager for ALPS from October 2006 until June 2010. Before joining ALPS, Mr. Uhl served a Sr. Analyst with Enenbach and Associates (RIA), and a Sr. Financial Analyst at Sprint. Because of his position with ALPS, Mr. Uhl is deemed an affiliate of the Trust as defined under the 1940 Act. Mr. Uhl is also CCO of the Boulder Growth & Income Fund, Inc., Centre Funds, Elevation ETF Trust, Index Funds, Reality Shares ETF Trust and Reaves Utility Income Fund. |
Jennell Panella, 1974 | Assistant Treasurer | Ms. Panella was elected Assistant Treasurer of the Trust at the September 15, 2015 meeting of the Board of Trustees. | Ms. Panella joined ALPS in June 2012 and is currently Fund Controller of ALPS Fund Services, Inc. Prior to joining ALPS, Ms. Panella served as Financial Reporting Manager for Parker Global Strategies, LLC (2009‐2012). Because of her position with ALPS, Ms. Panella is deemed an affiliate of the Trust as defined under the 1940 Act. Ms. Panella also serves as Assistant Treasurer of James Advantage Funds. |
Alan Gattis, 1980 | Assistant Treasurer | Mr. Gattis was elected Assistant Treasurer of the Trust at the September 13, 2016 meeting of the Board of Trustees. | Mr. Gattis joined ALPS in 2011 and is currently Vice President and Fund Controller of ALPS. Prior to joining ALPS, Mr. Gattis was an Auditor at Spicer Jeffries LLP (2009 through 2011) and an Auditor at PricewaterhouseCoopers LLP (2004 ‐ 2009). Because of his position with ALPS, Mr. Gattis is deemed an affiliate of the Trust as defined under the 1940 Act. Mr. Gattis is also Assistant Treasurer of ALPS Series Trust, Clough Funds Trust, Clough Global Opportunities Fund, Clough Global Dividend and Income Fund, Clough Global Equity and Griffin Institutional Access Real Estate Fund. |
| 102 | 1.855.377.7325 | www.GrandeurPeakGlobal.com |
Grandeur Peak Funds® | Trustees and Officers |
April 30, 2017 (Unaudited)
OFFICERS
Name, Address* & Year of Birth | Position(s) Held with Fund | Term of Office** and Length of Time Served | Principal Occupation(s) During Past 5 Years*** |
Sharon Akselrod, 1974 | Assistant Secretary | Ms. Akselrod was elected Assistant Secretary of the Trust at the September 15, 2015 meeting of the Board of Trustees. | Ms. Akselrod joined ALPS in August 2014 and is currently Senior Investment Company Act Paralegal of ALPS Fund Services, Inc. Prior to joining ALPS, Ms. Akselrod served as Corporate Governance and Regulatory Associate for Nordstrom fsb (2013‐2014) and Senior Legal Assistant – Legal Manager for AXA Equitable Life Insurance Company (2008‐2013). Because of her position with ALPS, Ms. Akselrod is deemed an affiliate of the Trust as defined under the 1940 Act. Ms. Akselrod is also Assistant Secretary of ALPS ETF Trust. |
Jennifer Craig 1973 | Assistant Secretary | Ms. Craig was elected Assistant Secretary of the Trust at the June 8, 2016 meeting of the Board of Trustees. | Ms. Craig joined ALPS in 2007 and is currently Assistant Vice President and Paralegal Manager of ALPS. Prior to joining ALPS, Ms. Craig was Legal Manager at Janus Capital Management LLC and served as Assistant Secretary of Janus Investment Fund, Janus Adviser Series and Janus Aspen Series. Because of her position with ALPS, Ms. Craig is deemed an affiliate of the Trust as defined under the 1940 Act. Ms. Craig is also Assistant Secretary of Clough Global Dividend and Income Fund, Clough Global Equity Fund, Clough Global Opportunities Fund, Clough Funds Trust and ALPS Series Trust. |
| * | All communications to Trustees and Officers may be directed to Financial Investors Trust c/o 1290 Broadway, Suite 1100, Denver, CO 80203. |
| ** | This is the period for which the Trustee or Officer began serving the Trust. Each Trustee and/or Officer serves an indefinite term, until his successor is elected. Officers are elected on an annual basis. |
| *** | Except as otherwise indicated, each individual has held the office shown or other offices in the same company for the last five years. |
| **** | The Fund Complex includes all series of the Trust (currently 34) and any other investment companies for which Grandeur Peak Global Advisors LLC provides investment advisory services (currently none). |
| Annual Report | April 30, 2017 | 103 |
Grandeur Peak Funds® | Privacy Policy |
April 30, 2017 (Unaudited)
| FACTS | WHAT DO THE FUNDS DO WITH YOUR PERSONAL INFORMATION? |
| Why? | Financial companies choose how they share your personal information. Federal law gives consumers the right to limit some but not all sharing. Federal law also requires us to tell you how we collect, share, and protect your personal information. Please read this notice carefully to understand what we do. |
| What? | The types of personal information we collect and share depend on the product or service you have with us. This information can include: |
| | | ● | Social Security number and account transactions |
| | | ● | Account balances and transaction history |
| | | ● | Wire transfer instructions |
| How? | All financial companies need to share customers’ personal information to run their everyday business. In the section below, we list the reasons financial companies can share their customers’ personal information; the reasons the Funds choose to share; and whether you can limit this sharing. |
| Reasons we can share your personal information | Do the Funds share: | Can you limit this sharing? |
For our everyday business purposes — such as to process your transactions, maintain your account(s), respond to court orders and legal investigations, or report to credit bureaus | Yes | No |
For our marketing purposes — to offer our products and services to you | No | We do not share. |
| For joint marketing with other financial companies | No | We do not share. |
For our affiliates’ everyday business purposes — information about your transactions and experiences | Yes | No |
For our affiliates’ everyday business purposes — information about your creditworthiness | No | We do not share. |
| For nonaffiliates to market to you | No | We do not share. |
| 104 | 1.855.377.7325 | www.GrandeurPeakGlobal.com |
Grandeur Peak Funds® | Privacy Policy |
April 30, 2017 (Unaudited)
| Who We Are | | | |
| Who is providing this notice? | Grandeur Peak Global Opportunities Fund, Grandeur Peak International Opportunities Fund, Grandeur Peak Global Reach Fund, Grandeur Peak Emerging Markets Opportunities Fund, Grandeur Peak Global Micro Cap Fund, Grandeur Peak Global Stalwarts Fund, and Grandeur Peak International Stalwarts Fund. |
| What We Do | |
| How does the Fund protect my personal information? | To protect your personal information from unauthorized access and use, we use security measures that comply with federal law. These measures include computer safeguards and secured files and buildings. |
How does the Fund collect my personal information? | We collect your personal information, for example, when you |
| | ● | open an account |
| | | ● | provide account information or give us your contact information |
| | | ● | make a wire transfer or deposit money |
| Why can’t I limit all sharing? | Federal law gives you the right to limit only |
| | | ● | sharing for affiliates’ everyday business purposes‐information about your creditworthiness |
| | | ● | affiliates from using your information to market to you |
| | | ● | sharing for non‐affiliates to market to you |
| | State laws and individual companies may give you additional rights to limit sharing. |
| Definitions | | | |
| Affiliates | Companies related by common ownership or control. They can be financial and nonfinancial companies. |
| Non-affiliates | Companies not related by common ownership or control. They can be financial and nonfinancial companies. |
| | | ● | The Funds does not share with non‐affiliates so they can market to you. |
| Joint marketing | A formal agreement between non‐affiliated financial companies that together market financial products or services to you. |
| | | ● | The Funds does not jointly market. |
| Other Important Information | |
| California Residents | If your account has a California home address, your personal information will not be disclosed to nonaffiliated third parties except as permitted by applicable California law, and we will limit sharing such personal information with our affiliates to comply with California privacy laws that apply to us. |
| Vermont Residents | The State of Vermont requires financial institutions to obtain your consent prior to sharing personal information that they collect about you with affiliated companies and nonaffiliated third parties other than in certain limited circumstances. Except as permitted by law, we will not share personal information we collect about you with nonaffiliated third parties or other affiliated companies unless you provide us with your written consent to share such information. |
| Annual Report | April 30, 2017 | 105 |
Contact Us
Mail: | Grandeur Peak Funds, P.O. Box 13664, Denver, CO 80201 | E-Mail: | grandeurpeakglobal@alpsinc.com |
| Phone: | 1.855.377.PEAK (7325) | Web: | www.GrandeurPeakGlobal.com |
Table of Contents
| | PAGE |
| Shareholder Letter | 1 |
| Performance Update | 5 |
| Consolidated Disclosure of Fund Expenses | 7 |
| Consolidated Schedule of Investments | 8 |
| Consolidated Statement of Assets and Liabilities | 24 |
| Consolidated Statement of Operations | 25 |
| Consolidated Statements of Changes in Net Assets | 26 |
| Consolidated Financial Highlights | 27 |
| Notes to Consolidated Financial Statements | 28 |
| Report of Independent Registered Accounting Firm | 39 |
| Disclosure Regarding Approval of Fund Advisory Agreements | 40 |
| Additional Information | 45 |
| Trustees & Officers | 46 |
| Privacy Policy | 51 |
| Redmont Resolute Fund | Shareholder Letter |
April 30, 2017 (Unaudited)
PERFORMANCE:
April 30, 2017
The Fund underperformed the HFRX Global Index by approximately 100 basis points(1) over the twelve months ending April 30, 2017. Relative underperformance has been mainly due to relative value and event driven strategies, and macro managers lagging their respective style benchmarks. Strong long/short equity allocations continue to benefit. The Fund historically has strong up market capture with down market capture in line with the index. Since inception, the Fund has outperformed the HFRX Global Index by over 200 basis points annualized. This is due primarily to a higher level of net equity exposure than the benchmark to be able to keep up with strong equity markets.
When compared to the peer group (Morningstar MultiAlternative Universe)(2), the Fund has outperformed the Universe over all time periods – by over 170 basis points during the past twelve months and 235 basis points annualized since inception. As with the HFRX Global Index, the Universe is very diverse and contains many market‐neutral and other low net equity strategies that cause the average net equity exposure for the Universe to be considerably less than our Fund. Therefore, we anticipate outperforming the Universe in up markets and underperforming in down markets ‐ recent performance has been consistent with our expectations.
Long/Short Managers – Long/Short equity managers were top overall contributors to the fund, performing well relative to the HFRX Equity Hedge Index. Impala and Boston Partners Research Long/Short posted positive returns for the period.
Macro – Our systematic macro manager was a relative detractor during the past 12 months due to poor performance in currency and interest rate strategies. This sector is a small allocation and is held as a hedge during down markets.
Credit/GTAA – Our tactical manager was a contributor to performance over its last year in the fund as global growth prospects improved helping global bond and emerging market positions. This allocation will be credit‐focused going forward. Our long/short equity strategy has contributed to performance during its first quarter in the fund.
Relative Value – Performance lagged the HFRX Relative Value benchmark. Weiss Alpha Balance Risk failed to keep pace with the relative value peer group but was a positive absolute contributor to performance. Market neutral, equity relative value strategy Clinton lagged because of value and quality factors underperforming.
Event Driven – The absolute return oriented manager AQR Multi‐Strategy lagged the broader event driven space but was a positive absolute contributor. Event driven dedicated manager PSAM has been additive since its addition to the fund in the second half of 2016.
Past performance does not guarantee future results.
| Annual Report | April 30, 2017 | 1 |
| Redmont Resolute Fund | Shareholder Letter |
April 30, 2017 (Unaudited)
REDMONT RESOLUTE FUND
Table 1 notes the performance for the Fund as of quarter end under standard reporting (since inception) as well as of April 30th.
Table 1 (2)(3)(4)(5)
Performance (amounts greater than one year are annualized)
| | Standardized Performance Data as of March 31, 2017 | Standardized Performance Data as of April 30, 2017 |
| | YTD | 1-Year | 3-Year | 5-Year | Since Inception (12/30/11) | YTD | 1-Year | 3-Year | 5-Year | Since Inception (12/30/11) |
| Redmont Resolute Fund ‐ I Class | 2.39% | 5.82% | 2.34% | 3.53% | 3.98% | 2.39% | 5.04% | 2.34% | 3.49% | 3.91% |
| Morningstar Multi‐ Alternative Universe | 1.62% | 3.13% | 1.14% | 1.08% | 1.52% | 1.97% | 3.34% | 0.50% | 1.17% | 1.56% |
| HFRX Global Index | 1.66% | 6.19% | ‐0.42% | 1.35% | 1.85% | 2.09% | 6.21% | ‐0.04% | 1.41% | 1.93% |
S&P 500® Index | 6.07% | 17.17% | 10.37% | 13.30% | 14.95% | 7.16% | 17.92% | 10.47% | 13.68% | 15.17% |
| | Gross Expense Ratio | Less Expense Waivers | Net Expense Ratio | Net Ratio ex Dividend & Short Expense |
| Redmont Resolute Fund ‐ I Class | 2.40% | ‐1.27% | 1.13% | 1.05% |
Performance data quoted represents past performance. Past performance does not guarantee future results. Investment return and principal value of an investment will fluctuate so that an investor’s shares, when sold or redeemed, may be worth more or less than the original cost. Current performance data may be higher or lower than actual data quoted. For the most current month-end performance data please call 1-855-268-2242.
The Fund has a redemption fee of 2.00% for shares redeemed within the first 90 days of purchase. Performance shown at NAV does not include these sales charges and would have been lower had it been taken into account.
The Adviser has agreed to waive the portion of its 1.50% Management Fee in excess of any sub-advisory fees paid by the Adviser to sub-advisors in connection with the Fund (“Sub-Advisory Fees”). This agreement (the “Expense Agreement”) is in effect through August 31, 2017. The Adviser may not discontinue this agreement to waive fees prior to August 31, 2017 without the approval by the Fund’s Board of Trustees.
Net Ratio ex Dividend & Short Expense is the Net Expense Ratio less any Dividend and Interest Expense on Securities Sold Short
Portfolio Changes:
In 2016, the overall allocation was adjusted to more closely reflect the asset allocation breakdown of the HFRX Global Hedge Fund Index and categorize investments with more specificity. In the past six months, the credit allocation of our portfolio shifted to a credit‐only manager removing more Global Tactical Asset Allocation (GTAA) style strategies from Redmont. FPA Crescent and Pinebridge GDAA were removed with proceeds funding the Chatham investment. Chatham employs a long/short credit strategy which seeks to exploit mispricings in high‐yield credit created by market inefficiencies.
Closing:
We continue to add value both in our allocation and manager selection decisions. The changes outlined above should continue to provide additional value going forward. We appreciate your investment in our Redmont Resolute Fund, please feel free to contact us with any questions
Sincerely,
R. Scott Graham, CFA & Michael T. Lytle, CFA
Portfolio Managers(6)
2
| Redmont Resolute Fund | Shareholder Letter |
April 30, 2017 (Unaudited)
Underlying Allocation Weights & Performance:
The current allocation was modified during the last year to reflect additional sub‐asset classes. Opportunistic was broken out into relative value and event driven. Tactical was split into macro and credit. Long/short equity remains unchanged. This allocation change more closely aligns with the construction of the HFRX Global Hedge Fund index. Figure 1 lists the long‐term target asset allocation for the Fund as well as the allocation as of April 30, 2017.
Figure 1
Holdings and allocations subject to change and may not reflect the current or future position of the portfolio.
| Annual Report | April 30, 2017 | 3 |
| Redmont Resolute Fund | Shareholder Letter |
April 30, 2017 (Unaudited)
IMPORTANT NOTES AND DISCLOSURES
Past performance does not guarantee future results.
Fund prices fluctuate as the underlying assets have exposure to market fluctuations and other risks, as described in the Fund’s prospectus. Please call 1-855-268-2242 to obtain current performance information and for the current prospectus and statement of additional information. This material must be preceded or accompanied by a prospectus. Please read the prospectus carefully before investing.
The views of Highland Associates, Inc. and the information discussed in this commentary are as of the date of publication, are subject to change, and may not reflect the writers’ current views. The views expressed are those of the Fund’s adviser only, and represent an assessment of market conditions at a specific point in time, are opinions only and should not be relied upon as investment advice regarding a particular investment or markets in general. Such information does not constitute a recommendation to buy or sell specific securities or investment vehicles. It should not be assumed that any investment will be profitable or will equal the performance of the portfolios or any securities or any sectors mentioned in this letter. The subject matter contained in this letter has been derived from several sources believed to be reliable and accurate at the time of compilation. Neither Highland Associates, Inc. nor the Fund accepts any liability for losses either direct or consequential caused by the use of this information. The Redmont Resolute Fund is distributed by ALPS Distributors, Inc. The Fund is subject to investment risks, including possible loss of the principal amount invested and therefore is not suitable for all investors. The Fund may not achieve its objectives. Diversification does not eliminate the risk of experiencing investment losses.
RISKS:
The Fund is structured with an Underlying Investment Strategy. This strategy adopts the risks of investments in Other Investment Companies. These risks include, but are not limited to higher expenses, allocation risk, underlying fund risk, transparency risk, and underlying fund managed portfolio risk. Investments which focus on alternative strategies are subject to increased risk and loss of principal and are not suitable for all investors. Swap Risk involves swap agreements and are subject to counterparty default risk and may not perform as intended. Derivatives Risk involves the exercise of skill and judgment. Derivatives may expire worthless or not perform as expected. Equity risk may cause the value of the securities held by the Fund to fall due to general market and economic conditions, perceptions regarding the industries in which the issuers of securities held by the Fund participate, or factors relating to specific companies in which the Fund invest.
The Fund’s investments in non‐U.S. issuers may be even more volatile and may present more risks than investments in U.S. issuers.
Commodity Risk may subject the Funds to greater volatility than traditional investments because of global supply and demand, changes in interest rates, commodity index volatility, and factors affecting a particular industry or commodity. Commodity‐linked investments may not move in the same direction and to the same extent as the underlying commodities.
(1) | Basis point is a common unit of measure for interest rates and other percentages in finance. One basis point is equal to 1/100th of 1% or 0.01%(.0001). |
(2) | The Morningstar Multi-Alternative Universe is designed to represent the exposure to alternative investment tactics. Funds in this category have the majority of their assets exposed to alternative strategies. An investor’s exposure to different tactics may change slightly over time in response to market movements. Funds in this category include both funds with static allocations to alternative strategies and funds tactically allocating among alternative strategies and asset classes. The gross short exposure is greater than 20%. |
(3) | The S&P 500® Index is an unmanaged index of 500 common stocks chosen for market size, liquidity, and industry group representation. It is a market value weighted index. The S&P 500® Index figures do not reflect any fees, expenses, or taxes. Investors cannot invest directly in this index. |
(4) | The HFRX Global Index is designed to be representative of the overall composition of the hedge fund universe, and includes convertible arbitrage, distressed securities, equity hedge, equity market neutral, event driven, macro, merger arbitrage, and relative value strategies. The index returns are updated periodically and are subject to change. The returns were accurate as of the date of this publication. Investors cannot invest directly in an index. |
(5) | Highland Associates, Inc. has agreed to waive the portion of its 1.50% Management Fee in excess of any sub-advisory fees paid by the Adviser to sub-advisors in connection with the Redmont Resolute Fund. This agreement is in effect through August 31, 2017. The Adviser may not discontinue this agreement to waive fees without the approval by the Fund’s Board of Trustees. |
(6) | R. Scott Graham and Michael T. Lytle are registered representatives of ALPS Distributors, Inc. CFA Institute Marks are trademarks owned by the CFA Institute. |
4
| Redmont Resolute Fund | Performance Update |
April 30, 2017 (Unaudited)
Performance (for the period ended April 30, 2017)
Redmont Resolute Fund
Cumulative Total Return (for the period ended April 30, 2017) | Year-to-Date | 1 Year | 3 Year | 5 Year | Since Inception* | Gross Ratio(a) | Net Ratio(a) |
| Redmont Resolute Fund ‐ Class I ‐ NAV | 2.39% | 5.04% | 2.34% | 3.49% | 3.91% | 2.40% | 1.13% |
S&P 500® Index(b) | 7.16% | 17.92% | 10.47% | 13.68% | 15.16% | | |
Dow Jones U.S Select Dividend Index(c) | 4.42% | 15.60% | 10.91% | 14.19% | 14.59% | | |
HFRX Global Hedge Fund Index(d) | 2.09% | 6.21% | ‐0.04% | 1.41% | 1.93% | | |
Performance data quoted represents past performance. Past performance does not guarantee future results. Investment return and principal value of an investment will fluctuate so that an investor’s shares, when sold or redeemed, may be worth more or less than the original cost. Current performance data may be higher or lower than actual data quoted. For the most current month-end performance data please call 1-855-268-2242.
The Fund has a redemption fee of 2.00% for shares redeemed within the first 90 days of purchase. Performance shown at NAV does not include these sales charges and would have been lower had it been taken into account.
The Adviser has agreed to waive the portion of its 1.50% Management Fee in excess of any sub-advisory fees paid by the Adviser to sub-advisors in connection with the Fund (“Sub-Advisory Fees”). This agreement (the “Expense Agreement”) is in effect through August 31, 2017. The Adviser may not discontinue this agreement to waive fees prior to August 31, 2017 without the approval by the Fund’s Board of Trustees.
| * | Fund inception date of 12/30/11. |
(a) | Ratios as of the Prospectus dated August 31, 2016 and may differ from the ratios presented in the Financial Highlights. |
(b) | The S&P 500® Index is the Standard & Poor's composite index of 500 stocks, a widely recognized, unmanaged index of common stock prices. The index is not actively managed and does not reflect any deduction of fees, expenses or taxes. An investor may not invest directly in an index. |
(c) | The Dow Jones U.S. Select Dividend Index represents the country’s top stocks by dividend yield, selected annually and subject to screening and buffering criteria. The index is not actively managed and does not reflect any deductions of fees, expenses or taxes. An investor may not invest directly in an index. |
(d) | The HFRX Global Hedge Fund Index is designed to be representative of the overall composition of the hedge fund universe and includes convertible arbitrage, distressed securities, equity hedge, equity market neutral, event driven, macro, merger arbitrage and relative value strategies. The index returns are updated periodically and are subject to change. The returns were accurate as of the date of this publication. The index is not actively managed and does not reflect any deduction of fees, expenses or taxes. An investor may not invest directly in an index. |
The table does not reflect the deduction of taxes that a shareholder would pay on Fund distributions or the redemption of Fund shares.
Top Ten Holdings**
(for the period ended April 30, 2017)
| As a percentage of Net Assets | |
| PIMCO Short‐Term Fund, Institutional Class | 23.30% |
| AQR Multi Strategy Alternative Fund, Class I | 14.11% |
| Redmont Cayman Hldgs MFACT ID: 1772 | 4.95% |
| American Media, Inc. | 1.78% |
| Resolute Forest 5/15/23, 5.875% | 1.12% |
| Frontier Comm. 09/15/2022, 10.5% | 0.88% |
| Everi Payments Inc 01/15/2022, 10.00% | 0.81% |
| California Resource 12/15/22, 8.0% 144A | 0.65% |
| Opal Acquisition Inc 12/15/21, 8.875% 144A | 0.64% |
| Navistar International Corp. | 0.60% |
| Top Ten Holdings | |
| ** | Holdings are subject to change, and may not reflect the current or future position of the portfolio. |
| Annual Report | April 30, 2017 | 5 |
| Redmont Resolute Fund | Performance Update |
April 30, 2017 (Unaudited)
Performance of $10,000 Initial Investment (for the period ended April 30, 2017)
Comparison of change in value of a $10,000 investment
The chart represents historical performance of a hypothetical investment of $10,000 in the Fund since inception. Past performance does not guarantee future results. This chart does not reflect the deduction of taxes that a shareholder would pay on Fund distributions or the redemption of Fund shares.
Investing in the Fund is subject to investment risks, including possible loss of the principal amount invested.
6| Redmont Resolute Fund | Consolidated Disclosure of Fund Expenses |
April 30, 2017 (Unaudited)
As a shareholder of the Fund, you incur two types of costs: (1) transaction costs, including applicable sales charges (loads), redemption fees; and (2) ongoing costs, including management fees, distribution and service (12b‐1) fees, shareholder services fees and other Fund operating expenses. This example is intended to help you understand your ongoing costs (in dollars) of investing in the Fund and to compare these costs with the ongoing costs of investing in other mutual funds.
This example is based on an investment of $1,000 invested at the beginning of the period and held for the six‐month period of November 1, 2016 to April 30, 2017.
Actual Expenses. The first line of the table below provides information about actual account values and actual expenses. You may use the information in this line, together with the amount you invested to estimate the expenses that you paid over the period. Simply divide your account value by $1,000 (for example, an $8,600 account value divided by $1,000 = 8.6), then multiply the result by the number in the first line of the table below under the heading titled “Expenses Paid During Period” to estimate the expenses you paid on your account during this period.
Hypothetical Example for Comparison Purposes. The second line of the table below provides information about hypothetical account values and hypothetical expenses based on the Fund’s actual expense ratio and an assumed rate of return of 5% per year before expenses, which is not the Fund’s actual return. The hypothetical account values and expenses may not be used to estimate the actual ending account balance or expenses you paid for the period. You may use this information to compare the ongoing costs of investing in the Fund and other mutual funds. To do so, compare this 5% hypothetical example with the 5% hypothetical examples that appear in the shareholder reports of the other funds.
Please note that the expenses shown in the table below are meant to highlight your ongoing costs only and do not reflect any transactional costs, such as applicable sales charges (loads), redemption fees, or exchange fees. Therefore, the second line of the table below is useful in comparing ongoing costs only and will not help you determine the relative total costs of owning different funds. In addition, if these transactional costs were included, your costs would have been higher.
| | BEGINNING ACCOUNT VALUE 11/01/16 | ENDING ACCOUNT VALUE 04/30/17 | EXPENSE RATIO(a) | EXPENSES PAID, and DURING PERIOD 11/01/16-04/30/17(b) |
| Redmont Resolute Fund | | | | |
| Class I | | | | |
| Actual | $ 1,000.00 | $ 1,034.00 | 0.70% | $3.53 |
| Hypothetical (5% return before expenses) | $ 1,000.00 | $ 1,021.32 | 0.70% | $3.51 |
(a) | Annualized, based on the Fund's most recent fiscal half year expenses. |
(b) | Expenses are equal to the Fund's annualized expense ratio multiplied by the average account value over the period, multiplied by the number of days in the most recent fiscal half-year (181)/365 (to reflect the half-year period). |
| Annual Report | April 30, 2017 | 7 |
| Redmont Resolute Fund | Consolidated Schedule of Investments |
April 30, 2017
| | | | | | Value | |
| Description | | Shares | | | (Note 2) | |
| COMMON STOCKS (15.62%) | | | | | | |
ADVERTISING (0.08%) | | | | | | |
Omnicom Group, Inc.(a) | | | 2,209 | | | $ | 181,403 | |
| The Interpublic Group of Companies, Inc. | | | 9,060 | | | | 213,544 | |
| | | | | | | | 394,947 | |
| | | | | | | | | |
AEROSPACE & DEFENSE (0.44%) | | | | | | | | |
General Dynamics Corp.(a) | | | 2,014 | | | | 390,293 | |
Harris Corp.(a) | | | 4,172 | | | | 466,805 | |
| L‐3 Communications Holdings, Inc. | | | 810 | | | | 139,134 | |
Lockheed Martin Corp.(a) | | | 1,267 | | | | 341,393 | |
Northrop Grumman Corp.(a) | | | 853 | | | | 209,804 | |
Raytheon Co.(a) | | | 2,313 | | | | 359,001 | |
United Technologies Corp.(a) | | | 2,233 | | | | 265,704 | |
| | | | | | | | 2,172,134 | |
| | | | | | | | | |
AGRICULTURE (0.04%) | | | | | | | | |
| Altria Group, Inc. | | | 2,889 | | | | 207,372 | |
| | | | | | | | | |
AIRLINES (0.04%) | | | | | | | | |
Delta Air Lines, Inc.(a) | | | 2,259 | | | | 102,649 | |
United Continental Holdings, Inc.(a)(b) | | | 1,552 | | | | 108,966 | |
| | | | | | | | 211,615 | |
| | | | | | | | | |
AUTO PARTS & EQUIPMENT (0.05%) | | | | | | | | |
| BorgWarner, Inc. | | | 2,693 | | | | 113,860 | |
WABCO Holdings, Inc.(b) | | | 1,008 | | | | 119,821 | |
| | | | | | | | 233,681 | |
| | | | | | | | | |
BANKS (0.79%) | | | | | | | | |
Bank of America Corp.(a) | | | 22,044 | | | | 514,507 | |
BB&T Corp.(a) | | | 3,325 | | | | 143,573 | |
Capital One Financial Corp.(a) | | | 2,986 | | | | 240,015 | |
Citigroup, Inc.(a) | | | 7,916 | | | | 467,994 | |
| Citizens Financial Group, Inc. | | | 2,729 | | | | 100,182 | |
| East West Bancorp, Inc. | | | 3,522 | | | | 191,139 | |
Fifth Third Bancorp(a) | | | 6,894 | | | | 168,420 | |
Huntington Bancshares, Inc.(a) | | | 18,840 | | | | 242,282 | |
| ICICI Bank, Ltd., Sponsored ADR | | | 12,383 | | | | 106,122 | |
JPMorgan Chase & Co.(a) | | | 4,906 | | | | 426,822 | |
| Lloyds Banking Group PLC, ADR | | | 51,716 | | | | 189,281 | |
| Morgan Stanley | | | 1,269 | | | | 55,037 | |
State Street Corp.(a) | | | 2,664 | | | | 223,510 | |
SunTrust Banks, Inc.(a) | | | 2,709 | | | | 153,898 | |
The Goldman Sachs Group, Inc.(a) | | | 717 | | | | 160,465 | |
| U.S. Bancorp | | | 2,864 | | | | 146,866 | |
Wells Fargo & Co.(a) | | | 7,017 | | | | 377,795 | |
| | | | | | | | 3,907,908 | |
| | | | | | | | | |
BEVERAGES (0.05%) | | | | | | | | |
| Coca‐Cola European Partners PLC | | | 6,346 | | | | 245,083 | |
See Notes to Financial Statements.
| Redmont Resolute Fund | Consolidated Schedule of Investments |
April 30, 2017
| | | | | | Value | |
| Description | | Shares | | | (Note 2) | |
BIOTECHNOLOGY (0.07%) | | | | | | |
Celgene Corp.(b) | | | 1,139 | | | $ | 141,293 | |
Gilead Sciences, Inc.(a) | | | 3,145 | | | | 215,590 | |
| | | | | | | | 356,883 | |
| | | | | | | | | |
BUILDING MATERIALS (0.07%) | | | | | | | | |
| CRH PLC, Sponsored ADR | | | 2,256 | | | | 81,938 | |
Masco Corp.(a) | | | 7,677 | | | | 284,202 | |
| | | | | | | | 366,140 | |
| | | | | | | | | |
CHEMICALS (0.66%) | | | | | | | | |
| Celanese Corp., Class A | | | 1,269 | | | | 110,454 | |
Ferro Corp.(b) | | | 4,146 | | | | 74,296 | |
| FMC Corp. | | | 1,418 | | | | 103,840 | |
PPG Industries, Inc.(a) | | | 2,432 | | | | 267,131 | |
| The Sherwin‐Williams Co. | | | 7,608 | | | | 2,546,246 | |
| Versum Materials, Inc. | | | 3,815 | | | | 122,156 | |
| | | | | | | | 3,224,123 | |
| | | | | | | | | |
COAL (0.02%) | | | | | | | | |
SunCoke Energy, Inc.(b) | | | 9,885 | | | | 90,645 | |
| | | | | | | | | |
COMMERCIAL SERVICES (1.07%) | | | | | | | | |
| EVERTEC, Inc. | | | 4,647 | | | | 73,655 | |
| Kar Auction Services, Inc. | | | 59,453 | | | | 2,593,340 | |
| Nielsen Holdings PLC | | | 6,331 | | | | 260,394 | |
Paypal Holdings, Inc.(b) | | | 1,857 | | | | 88,616 | |
Robert Half International, Inc.(a) | | | 2,768 | | | | 127,466 | |
ServiceMaster Global Holdings, Inc.(b) | | | 55,637 | | | | 2,119,770 | |
| | | | | | | | 5,263,241 | |
| | | | | | | | | |
COMPUTERS (0.40%) | | | | | | | | |
Amdocs, Ltd.(a) | | | 4,395 | | | | 269,150 | |
Apple, Inc.(a) | | | 1,685 | | | | 242,050 | |
| Brocade Communications Systems, Inc. | | | 18,309 | | | | 230,144 | |
Dell Technologies, Inc., Class V(a)(b) | | | 1,199 | | | | 80,465 | |
DXC Technology Co.(a)(b) | | | 6,210 | | | | 467,861 | |
| Hewlett‐Packard Co. | | | 4,129 | | | | 77,708 | |
Hewlett‐Packard Enterprise Co.(a) | | | 20,798 | | | | 387,467 | |
Leidos Holdings, Inc.(a) | | | 4,363 | | | | 229,756 | |
| | | | | | | | 1,984,601 | |
| | | | | | | | | |
CONTAINERS & PACKAGING (0.05%) | | | | | | | | |
WestRock Co.(a) | | | 4,154 | | | | 222,488 | |
| | | | | | | | | |
DISTRIBUTION & WHOLESALE (0.56%) | | | | | | | | |
Arrow Electronics, Inc.(a)(b) | | | 3,818 | | | | 269,169 | |
LKQ Corp.(b) | | | 80,246 | | | | 2,506,885 | |
| | | | | | | | 2,776,054 | |
| | | | | | | | | |
DIVERSIFIED FINANCIAL SERVICES (0.56%) | | | | | | | | |
| Air Lease Corp. | | | 1,919 | | | | 73,191 | |
See Notes to Financial Statements.
| Annual Report | April 30, 2017 | 9 |
| Redmont Resolute Fund | Consolidated Schedule of Investments |
April 30, 2017
| | | | | | Value | |
| Description | | Shares | | | (Note 2) | |
DIVERSIFIED FINANCIAL SERVICES (0.56%) (continued) | | | | | | |
| Alliance Data Systems Corp. | | | 360 | | | $ | 89,867 | |
| CBOE Holdings, Inc. | | | 7,445 | | | | 613,542 | |
Discover Financial Services(a) | | | 6,179 | | | | 386,744 | |
| Intercontinental Exchange, Inc. | | | 3,300 | | | | 198,836 | |
Navient Corp.(a) | | | 14,507 | | | | 220,506 | |
Raymond James Financial, Inc.(a) | | | 2,385 | | | | 177,730 | |
SLM Corp.(a)(b) | | | 26,827 | | | | 336,411 | |
Synchrony Financial(a) | | | 9,726 | | | | 270,383 | |
TD Ameritrade Holding Corp.(a) | | | 4,431 | | | | 169,574 | |
The Charles Schwab Corp.(a) | | | 5,957 | | | | 231,429 | |
| | | | | | | | 2,768,213 | |
| | | | | | | | | |
ELECTRIC (0.04%) | | | | | | | | |
| AES Corp. | | | 15,895 | | | | 179,772 | |
| | | | | | | | | |
ELECTRICAL COMPONENTS & EQUIPMENT (0.05%) | | | | | | | | |
AMETEK, Inc.(a) | | | 3,633 | | | | 207,808 | |
| EnerSys | | | 673 | | | | 55,933 | |
| | | | | | | | 263,741 | |
| | | | | | | | | |
ELECTRONICS (0.25%) | | | | | | | | |
Avnet, Inc.(a) | | | 1,817 | | | | 70,300 | |
Flextronics International, Ltd.(a)(b) | | | 24,501 | | | | 378,786 | |
Honeywell International, Inc.(a) | | | 1,823 | | | | 239,068 | |
Jabil Circuit, Inc.(a) | | | 6,005 | | | | 174,265 | |
| TE Connectivity, Ltd. | | | 3,229 | | | | 249,828 | |
Waters Corp.(b) | | | 587 | | | | 99,725 | |
| | | | | | | | 1,211,972 | |
| | | | | | | | | |
ENGINEERING & CONSTRUCTION (0.02%) | | | | | | | | |
Tutor Perini Corp.(b) | | | 3,219 | | | | 99,306 | |
| | | | | | | | | |
ENTERTAINMENT (0.04%) | | | | | | | | |
Six Flags Entertainment Corp.(a) | | | 2,864 | | | | 179,315 | |
| | | | | | | | | |
FOOD (0.04%) | | | | | | | | |
Nomad Foods, Ltd.(b) | | | 17,009 | | | | 200,706 | |
| | | | | | | | | |
HAND & MACHINE TOOLS (0.05%) | | | | | | | | |
Stanley Black & Decker, Inc.(a) | | | 1,908 | | | | 259,774 | |
| | | | | | | | | |
HEALTHCARE ‐ PRODUCTS (0.02%) | | | | | | | | |
| Zimmer Biomet Holdings, Inc. | | | 930 | | | | 111,275 | |
| | | | | | | | | |
HEALTHCARE ‐ SERVICES (0.33%) | | | | | | | | |
Anthem, Inc.(a) | | | 1,816 | | | | 323,048 | |
| Cigna Corp. | | | 1,852 | | | | 289,597 | |
See Notes to Financial Statements.
| Redmont Resolute Fund | Consolidated Schedule of Investments |
April 30, 2017
| | | | | | Value | |
| Description | | Shares | | | (Note 2) | |
HEALTHCARE ‐ SERVICES (0.33%) (continued) | | | | | | |
DaVita, Inc.(a)(b) | | | 3,567 | | | $ | 246,159 | |
Laboratory Corp. of America Holdings(a)(b) | | | 1,506 | | | | 211,066 | |
| Quest Diagnostics, Inc. | | | 1,622 | | | | 171,137 | |
| UnitedHealth Group, Inc. | | | 1,174 | | | | 205,309 | |
| Universal Health Services, Inc., Class B | | | 1,598 | | | | 192,975 | |
| | | | | | | | 1,639,291 | |
| | | | | | | | | |
HOLDING COMPANIES ‐ DIVERSIFIED (0.55%) | | | | | | | | |
HRG Group, Inc.(b) | | | 126,472 | | | | 2,530,705 | |
Silver Run Acquisition Corp. II(b) | | | 15,735 | | | | 162,542 | |
| | | | | | | | 2,693,247 | |
| | | | | | | | | |
HOUSEWARES (0.52%) | | | | | | | | |
| Newell Brands, Inc. | | | 53,211 | | | | 2,540,293 | |
| | | | | | | | | |
INSURANCE (0.36%) | | | | | | | | |
Alleghany Corp.(b) | | | 282 | | | | 172,217 | |
| Aon PLC | | | 2,302 | | | | 275,872 | |
Berkshire Hathaway, Inc., Class B(a)(b) | | | 1,317 | | | | 217,581 | |
Chubb, Ltd.(a) | | | 1,275 | | | | 174,994 | |
| Marsh & McLennan Cos., Inc. | | | 2,120 | | | | 157,156 | |
MetLife, Inc.(a) | | | 3,365 | | | | 174,341 | |
The Allstate Corp.(a) | | | 3,114 | | | | 253,137 | |
| The Travelers Companies, Inc. | | | 1,015 | | | | 123,485 | |
Unum Group(a) | | | 4,279 | | | | 198,246 | |
| | | | | | | | 1,747,029 | |
| | | | | | | | | |
INTERNET (0.94%) | | | | | | | | |
Alibaba Group Holding, Ltd., Sponsored ADR(b) | | | 2,224 | | | | 256,872 | |
Alphabet, Inc., Class A(a)(b) | | | 816 | | | | 754,408 | |
Baidu, Inc., Sponsored ADR(a)(b) | | | 1,100 | | | | 198,253 | |
CDW Corp.(a) | | | 3,073 | | | | 181,584 | |
eBay, Inc.(a)(b) | | | 11,220 | | | | 374,860 | |
The Priceline Group, Inc.(b) | | | 55 | | | | 101,575 | |
VeriSign, Inc.(b) | | | 793 | | | | 70,514 | |
Vipshop Holdings, Ltd., ADR(b) | | | 6,737 | | | | 93,442 | |
Yahoo!, Inc.(b) | | | 48,085 | | | | 2,318,178 | |
Yandex NV, Class A(b) | | | 3,259 | | | | 88,840 | |
YY, Inc., ADR(b) | | | 3,362 | | | | 164,637 | |
| | | | | | | | 4,603,163 | |
| | | | | | | | | |
INVESTMENT COMPANIES (0.00%)(c) | | | | | | | | |
| Prospect Capital Corp. | | | 10 | | | | 93 | |
| | | | | | | | | |
IRON & STEEL (0.03%) | | | | | | | | |
| Steel Dynamics, Inc. | | | 3,774 | | | | 136,392 | |
See Notes to Financial Statements.
| Annual Report | April 30, 2017 | 11 |
| Redmont Resolute Fund | Consolidated Schedule of Investments |
April 30, 2017
| | | | | | Value | |
| Description | | Shares | | | (Note 2) | |
LEISURE TIME (0.05%) | | | | | | |
| Brunswick Corp. | | | 4,094 | | | $ | 232,335 | |
| | | | | | | | | |
MACHINERY ‐ DIVERSIFIED (0.01%) | | | | | | | | |
| Hollysys Automation Technologies, Ltd. | | | 3,508 | | | | 56,268 | |
| | | | | | | | | |
MEDIA (0.79%) | | | | | | | | |
CBS Corp., Class B(a) | | | 3,935 | | | | 261,914 | |
Comcast Corp., Class A(a) | | | 11,776 | | | | 461,501 | |
| ITV PLC | | | 621,117 | | | | 1,689,390 | |
Liberty Broadband Corp., Class C(a)(b) | | | 842 | | | | 76,757 | |
Liberty Global PLC LiLAC, Class C(b) | | | 3,498 | | | | 76,396 | |
Liberty Global PLC, Class C(a)(b) | | | 12,015 | | | | 415,839 | |
| Scripps Networks Interactive, Inc., Class A | | | 3,272 | | | | 244,484 | |
| Time Warner, Inc. | | | 3,789 | | | | 376,134 | |
| Twenty‐First Century Fox, Inc., Class A | | | 9,676 | | | | 295,505 | |
| | | | | | | | 3,897,920 | |
| | | | | | | | | |
MISCELLANEOUS MANUFACTURING (0.25%) | | | | | | | | |
| Carlisle Cos., Inc. | | | 1,854 | | | | 187,977 | |
Danaher Corp.(a) | | | 2,536 | | | | 211,325 | |
| Eaton Corp PLC | | | 2,402 | | | | 181,687 | |
| Illinois Tool Works, Inc. | | | 1,270 | | | | 175,374 | |
Ingersoll‐Rand PLC(a) | | | 1,370 | | | | 121,588 | |
Textron, Inc.(a) | | | 7,265 | | | | 338,985 | |
| | | | | | | | 1,216,936 | |
| | | | | | | | | |
OIL & GAS (1.38%) | | | | | | | | |
| Cimarex Energy Co. | | | 1,713 | | | | 199,873 | |
Diamondback Energy, Inc.(b) | | | 3,614 | | | | 360,822 | |
Energen Corp.(b) | | | 4,449 | | | | 231,303 | |
| Enerplus Corp. | | | 18,947 | | | | 136,608 | |
Gulfport Energy Corp.(a)(b) | | | 6,519 | | | | 103,522 | |
Halcon Resources Corp.(b)(d)(e) | | | 20,000 | | | | 107,200 | |
Jagged Peak Energy, Inc.(b) | | | 9,377 | | | | 104,460 | |
Kosmos Energy, Ltd.(b) | | | 17,916 | | | | 107,675 | |
| Marathon Petroleum Corp. | | | 51,664 | | | | 2,631,764 | |
Parsley Energy, Inc., Class A(a)(b) | | | 7,370 | | | | 219,552 | |
| Pioneer Natural Resources Co. | | | 789 | | | | 136,489 | |
QEP Resources, Inc.(b) | | | 14,127 | | | | 166,840 | |
RSP Permian, Inc.(b) | | | 2,899 | | | | 110,307 | |
| Tesoro Corp. | | | 25,977 | | | | 2,070,627 | |
WildHorse Resource Development Corp.(b) | | | 7,530 | | | | 82,152 | |
| | | | | | | | 6,769,194 | |
| | | | | | | | | |
OIL & GAS SERVICES (0.02%) | | | | | | | | |
| NCS Multistage Holdings, Inc. | | | 5,391 | | | | 98,459 | |
| | | | | | | | | |
PACKAGING & CONTAINERS (0.18%) | | | | | | | | |
Berry Plastics Group, Inc.(a)(b) | | | 5,949 | | | | 297,450 | |
Crown Holdings, Inc.(a)(b) | | | 4,108 | | | | 230,418 | |
See Notes to Financial Statements.
| Redmont Resolute Fund | Consolidated Schedule of Investments |
April 30, 2017
| | | | | | Value | |
| Description | | Shares | | | (Note 2) | |
PACKAGING & CONTAINERS (0.18%) (continued) | | | | | | |
Graphic Packaging Holding Co.(a) | | | 16,535 | | | $ | 224,545 | |
Sealed Air Corp.(a) | | | 3,416 | | | | 150,372 | |
| | | | | | | | 902,785 | |
| | | | | | | | | |
PHARMACEUTICALS (0.25%) | | | | | | | | |
Cardinal Health, Inc.(a) | | | 2,019 | | | | 146,559 | |
Express Scripts Holding Co.(b) | | | 1,823 | | | | 111,823 | |
Johnson & Johnson(a) | | | 2,692 | | | | 332,381 | |
Merck & Co., Inc.(a) | | | 5,776 | | | | 360,018 | |
| Pfizer, Inc. | | | 5,075 | | | | 172,144 | |
| Sanofi, ADR | | | 2,108 | | | | 99,709 | |
| | | | | | | | 1,222,634 | |
| | | | | | | | | |
PIPELINES (0.63%) | | | | | | | | |
| Boardwalk Pipeline MLP | | | 15,574 | | | | 282,512 | |
| Enterprise Products Partners LP MLP | | | 4,430 | | | | 121,028 | |
| MPLX LP | | | 12,949 | | | | 456,193 | |
| Tesoro Logistics LP | | | 40,387 | | | | 2,215,631 | |
| | | | | | | | 3,075,364 | |
| | | | | | | | | |
RETAIL (1.65%) | | | | | | | | |
| Alimentation Couche‐Tard, Inc., Class B | | | 48,906 | | | | 2,249,235 | |
| CVS Health Corp. | | | 1,583 | | | | 130,503 | |
| Dollar General Corp. | | | 28,799 | | | | 2,093,975 | |
| Dunkin' Brands Group, Inc. | | | 10,928 | | | | 610,438 | |
Lowe's Cos., Inc.(a) | | | 32,212 | | | | 2,734,155 | |
| The Home Depot, Inc. | | | 1,000 | | | | 156,100 | |
| The TJX Companies, Inc. | | | 1,806 | | | | 142,024 | |
| | | | | | | | 8,116,430 | |
| | | | | | | | | |
SEMICONDUCTORS (0.35%) | | | | | | | | |
Avago Technologies, Ltd.(a) | | | 1,816 | | | | 400,991 | |
| KLA‐Tencor Corp. | | | 2,327 | | | | 228,558 | |
| Marvell Technology Group, Ltd. | | | 16,697 | | | | 250,789 | |
ON Semiconductor Corp.(a)(b) | | | 26,217 | | | | 371,757 | |
Qorvo, Inc.(b) | | | 1,937 | | | | 131,774 | |
Texas Instruments, Inc.(a) | | | 4,385 | | | | 347,204 | |
| | | | | | | | 1,731,073 | |
| | | | | | | | | |
SHIPBUILDING (0.04%) | | | | | | | | |
| Huntington Ingalls Industries, Inc. | | | 977 | | | | 196,270 | |
| | | | | | | | | |
SOFTWARE (1.22%) | | | | | | | | |
| Activision Blizzard, Inc. | | | 2,036 | | | | 106,381 | |
Electronic Arts, Inc.(b) | | | 2,420 | | | | 229,464 | |
| Fidelity National Information Services, Inc. | | | 24,301 | | | | 2,045,901 | |
Microsoft Corp.(a) | | | 6,221 | | | | 425,890 | |
NetEase, Inc., ADR(a) | | | 1,549 | | | | 411,089 | |
Oracle Corp.(a) | | | 9,694 | | | | 435,842 | |
| SS&C Technologies Holdings, Inc. | | | 63,724 | | | | 2,341,220 | |
| | | | | | | | 5,995,787 | |
See Notes to Financial Statements.
| Annual Report | April 30, 2017 | 13 |
| Redmont Resolute Fund | Consolidated Schedule of Investments |
April 30, 2017
| Description | | Shares | | | Value (Note 2) | |
SPECIAL CHEMICALS (0.02%) | | | | | | |
| Valvoline, Inc. | | | 4,620 | | | $ | 102,795 | |
| | | | | | | | | |
TELECOMMUNICATIONS (0.11%) | | | | | | | | |
Cisco Systems, Inc.(a) | | | 7,447 | | | | 253,719 | |
CommScope Holding Co., Inc.(b) | | | 2,913 | | | | 122,463 | |
| Verizon Communications, Inc. | | | 4,009 | | | | 184,053 | |
| | | | | | | | 560,235 | |
| | | | | | | | | |
TEXTILES (0.46%) | | | | | | | | |
Mohawk Industries, Inc.(b) | | | 9,540 | | | | 2,239,897 | |
| | | | | | | | | |
TOYS, GAMES & HOBBIES (0.02%) | | | | | | | | |
| Hasbro, Inc. | | | 933 | | | | 92,470 | |
| | | | | | | | | |
| TOTAL COMMON STOCKS (Cost $65,391,458) | | | | | | | 76,797,349 | |
| | | | | | | | | |
| LIMITED PARTNERSHIPS (0.03%) | | | | | | | | |
OIL & GAS (0.03%) | | | | | | | | |
| Viper Energy Partners LP | | | 8,192 | | | | 138,855 | |
| | | | | | | | | |
| TOTAL LIMITED PARTNERSHIPS (Cost $139,009) | | | | | | | 138,855 | |
| | | | | | | | | |
| OPEN‐END MUTUAL FUNDS (37.41%) | | | | | | | | |
| AQR Multi Strategy Alternative Fund, Class I | | | 7,288,648 | | | | 69,387,930 | |
| PIMCO Short‐Term Fund, Institutional Class | | | 11,655,837 | | | | 114,576,875 | |
| | | | | | | | 183,964,805 | |
| | | | | | | | | |
| TOTAL OPEN‐END MUTUAL FUNDS (Cost $183,754,756) | | | | | | | 183,964,805 | |
| | Exercise Date | Exercise Price | | Contracts | | | Value (Note 2) | |
| PURCHASED PUT OPTIONS (0.03%) | | | | | | | | | | |
| S&P 500 Index | 05/22/2017 | $ 2,225 | | | 93 | | | | 17,019 | |
| S&P 500 Index | 05/31/2017 | 2,275 | | | 239 | | | | 135,035 | |
| S&P 500 Index | 06/01/2017 | 2,225 | | | 31 | | | | 10,695 | |
| | | | | | | | | | 162,749 | |
| | | | | | | | | | | |
| TOTAL PURCHASED OPTIONS (Cost $241,729) | | | | | | | | | 162,749 | |
See Notes to Financial Statements.
| Redmont Resolute Fund | Consolidated Schedule of Investments |
April 30, 2017
| Description | | | | Principal Amount | | | Value (Note 2) | |
| CORPORATE BONDS (11.74%) | | | | | | |
| CASINOS & GAMING (0.18%) | | | | | | |
| Jack Ohio Financial LLC | | | | | | |
| 10.25%, | | 11/15/2022(f) | | $ | 825,000 | | | $ | 896,156 | |
| | | | | | | | | | | |
| COMMERCIAL SERVICES (0.72%) | | | | | | | | |
| iPayment, Inc. | | | | | | | | |
| 10.75%, | | 04/15/2024(f) | | | 1,381,000 | | | | 1,494,933 | |
| RR Donnelley & Sons Co. | | | | | | | | |
| 6.00%, | | 04/01/2024 | | | 903,000 | | | | 852,206 | |
| 6.50%, | | 11/15/2023 | | | 477,000 | | | | 468,056 | |
| 6.63%, | | 04/15/2029 | | | 112,000 | | | | 100,240 | |
| 7.00%, | | 02/15/2022 | | | 607,000 | | | | 625,210 | |
| | | | | | | | | | 3,540,645 | |
| | | | | | | | | | | |
| COMPUTERS (1.42%) | | | | | | | | |
| Everi Payments, Inc. | | | | | | | | |
| 10.00%, | | 01/15/2022 | | | 3,698,000 | | | | 3,989,217 | |
| Harland Clarke Holdings Corp. | | | | | | | | |
| 8.38%, | | 08/15/2022(f) | | | 442,000 | | | | 456,365 | |
| 9.25%, | | 03/01/2021(f) | | | 2,610,000 | | | | 2,525,175 | |
| | | | | | | | | | 6,970,757 | |
| | | | | | | | | | | |
| FOOD (0.05%) | | | | | | | | | | |
| Chobani LLC/Chobani Finance Corp., Inc. | | | | | | | | |
| 7.50%, | | 04/15/2025(f) | | | 165,000 | | | | 170,775 | |
| Clearwater Seafoods, Inc. | | | | | | | | |
| 6.88%, | | 05/01/2025(f) | | | 83,000 | | | | 86,112 | |
| | | | | | | | | | 256,887 | |
| | | | | | | | | | | |
| FOREST PRODUCTS & PAPER (1.12%) | | | | | | | | |
| Resolute Forest Products, Inc. | | | | | | | | |
| 5.88%, | | 05/15/2023(a) | | | 5,740,000 | | | | 5,510,400 | |
| | | | | | | | | | | |
| HEALTH CARE FACILITIES & SERVICES (0.59%) | | | | | | | | |
| Kindred Healthcare, Inc. | | | | | | | | |
| 8.75%, | | 01/15/2023 | | | 2,810,000 | | | | 2,894,300 | |
| | | | | | | | | | | |
| HOLDING COMPANIES ‐ DIVERSIFIED (0.64%) | | | | | | | | |
| Opal Acquisition, Inc. | | | | | | | | |
| 8.88%, | | 12/15/2021(f) | | | 3,423,000 | | | | 3,157,718 | |
| | | | | | | | | | | |
| IRON & STEEL (0.59%) | | | | | | | | |
| AK Steel Corp. | | | | | | | | |
| 7.63%, | | 10/01/2021 | | | 2,720,000 | | | | 2,842,400 | |
| 8.38%, | | 04/01/2022 | | | 77,000 | | | | 80,032 | |
| | | | | | | | | | 2,922,432 | |
See Notes to Financial Statements.
| Annual Report | April 30, 2017 | 15 |
| Redmont Resolute Fund | Consolidated Schedule of Investments |
April 30, 2017
| Description | | | | Principal Amount | | | Value (Note 2) | |
| LEISURE TIME (0.32%) | | | | | | |
| Viking Cruises, Ltd. | | | | | | |
| 6.25%, | | 05/15/2025(f) | | $ | 724,000 | | | $ | 700,470 | |
| 8.50%, | | 10/15/2022(f) | | | 854,000 | | | | 894,565 | |
| | | | | | | | | | 1,595,035 | |
| | | | | | | | | | | |
| LODGING (0.03%) | | | | | | | | |
| Sugarhouse HSP Gaming Prop Mezz LP/Sugarhouse HSP Gaming Finance Corp. | | | | | | | | |
| 5.88%, | | 05/15/2025(f) | | | 165,000 | | | | 165,619 | |
| | | | | | | | | | | |
| MEDIA (0.84%) | | | | | | | | | | |
| Lee Enterprises, Inc. | | | | | | | | |
| 9.50%, | | 03/15/2022(f) | | | 1,270,000 | | | | 1,343,025 | |
| Time, Inc. | | | | | | | | | | |
| 5.75%, | | 04/15/2022(a)(f) | | | 2,691,000 | | | | 2,765,002 | |
| | | | | | | | | | 4,108,027 | |
| | | | | | | | | | | |
| OIL & GAS (1.35%) | | | | | | | | | |
| California Resource | | | | | | | | |
| 8.00%, | | 12/15/2022(f) | | | 4,144,000 | | | | 3,206,420 | |
| Comstock Resources, Inc., PIK Notes | | | | | | | | |
10.00 (or 12.25% PIK)%, | | 03/15/2020 | | | 2,393,000 | | | | 2,464,790 | |
| EP Energy LLC/Everest Acquisition Finance, Inc. | | | | | | | | |
| 9.38%, | | 05/01/2020 | | | 997,000 | | | | 949,642 | |
| | | | | | | | | | 6,620,852 | |
| | | | | | | | | | | |
| OIL & GAS SERVICES (0.19%) | | | | | | | | |
| McDermott International, Inc. | | | | | | | | |
| 8.00%, | | 05/01/2021(f) | | | 893,000 | | | | 933,632 | |
| | | | | | | | | | | |
| PUBLISHING & BROADCASTING (2.21%) | | | | | | | | |
| American Media, Inc. | | | | | | | | |
| 0.00%, | | 03/01/2022(f)(g) | | | 9,200,000 | | | | 7,507,200 | |
| 5.50%, | | 09/01/2021(f) | | | 1,200,000 | | | | 1,236,000 | |
| McClatchy Co. | | | | | | | | | | |
| 6.88%, | | 03/15/2029 | | | 1,270,000 | | | | 1,057,275 | |
| 7.15%, | | 11/01/2027 | | | 565,000 | | | | 531,100 | |
| 9.00%, | | 12/15/2022 | | | 516,000 | | | | 539,220 | |
| | | | | | | | | | 10,870,795 | |
| | | | | | | | | | | |
| TELECOMMUNICATIONS (0.88%) | | | | | | | | |
| Frontier Communications Corp. | | | | | | | | |
| 10.50%, | | 09/15/2022 | | | 4,276,000 | | | | 4,324,105 | |
See Notes to Financial Statements.
| Redmont Resolute Fund | Consolidated Schedule of Investments |
April 30, 2017
| Description | Principal Amount | | | Value (Note 2) | |
| TRANSPORTATION & LOGISTICS (0.61%) | | | | | | |
| Navistar International Corp. | | | | | | |
8.25%, 11/01/2021(a) | | $ | 2,923,000 | | | $ | 2,974,153 | |
| | | | | | | | | |
| TOTAL CORPORATE BONDS | | | | | | | | |
| (Cost $56,274,059) | | | | | | | 57,741,513 | |
| Description | | Principal Amount/Shares | | | Value (Note 2) | |
| SHORT TERM INVESTMENTS (18.92%) | | | | | | | | |
| MONEY MARKET FUNDS (18.92%) | | | | | | | | |
Dreyfus Treasury Cash Management Fund, Institutional Class, 7‐day yield, 0.628%(a) | | | 93,070,053 | | | | 93,070,053 | |
| | | | | | | | | |
| TOTAL SHORT TERM INVESTMENTS | | | | | | | | |
| (Cost $93,070,053) | | | | | | | 93,070,053 | |
| | | | | | | | | |
| TOTAL INVESTMENTS (83.75%) | | | | | | | | |
| (Cost $398,871,064) | | | | | | $ | 411,875,324 | |
| | | | | | | | | |
SEGREGATED CASH WITH BROKERS (25.30%)(h) | | | | | | | 124,433,592 | |
| | | | | | | | | |
| SECURITIES SOLD SHORT (‐7.59%) | | | | | | | | |
| (Proceeds $35,771,403) | | | | | | $ | (37,352,272 | ) |
| | | | | | | | | |
| LIABILITIES IN EXCESS OF OTHER ASSETS (‐1.46%) | | | | | | | (7,145,294 | ) |
| NET ASSETS (100.00%) | | | | | | $ | 491,811,350 | |
| SCHEDULE OF SECURITIES SOLD SHORT | | | | | | | | |
| | | | | | | Value (Note 2) | |
| Description | | Shares | | | |
| COMMON STOCKS (‐3.66%) | | | | | | | | |
| APPAREL (‐0.07%) | | | | | | | | |
| Columbia Sportswear Co. | | | (1,717 | ) | | $ | (97,217 | ) |
| Gildan Activewear, Inc. | | | (5,139 | ) | | | (144,098 | ) |
| Under Armour, Inc., Class A | | | (5,362 | ) | | | (115,101 | ) |
| | | | | | | | (356,416 | ) |
| AUTO MANUFACTURERS (‐0.05%) | | | | | | | | |
| Ferrari NV | | | (835 | ) | | | (62,792 | ) |
| Tesla Motors, Inc. | | | (603 | ) | | | (189,384 | ) |
| | | | | | | | (252,176 | ) |
| AUTO PARTS & EQUIPMENT (‐0.03%) | | | | | | | | |
| Autoliv, Inc. | | | (1,433 | ) | | | (143,572 | ) |
| | | | | | | | | |
| BANKS (‐0.40%) | | | | | | | | |
| BancorpSouth, Inc. | | | (3,280 | ) | | | (99,876 | ) |
| BOK Financial Corp. | | | (1,054 | ) | | | (88,842 | ) |
| Community Bank System, Inc. | | | (2,429 | ) | | | (135,903 | ) |
| Cullen/Frost Bankers, Inc. | | | (916 | ) | | | (86,461 | ) |
| CVB Financial Corp. | | | (5,351 | ) | | | (115,261 | ) |
| First Financial Bankshares, Inc. | | | (5,737 | ) | | | (229,193 | ) |
| Glacier Bancorp, Inc. | | | (3,019 | ) | | | (101,982 | ) |
See Notes to Financial Statements.
| Annual Report | April 30, 2017 | 17 |
| Redmont Resolute Fund | Consolidated Schedule of Investments |
April 30, 2017
| Description | | Shares | | | Value
(Note 2) | |
| BANKS (‐0.40%) (continued) | | | | | | |
| Home BancShares, Inc. | | | (3,086 | ) | | $ | (78,539 | ) |
| M&T Bank Corp. | | | (510 | ) | | | (79,259 | ) |
| MB Financial, Inc. | | | (2,453 | ) | | | (104,277 | ) |
| Prosperity Bancshares, Inc. | | | (1,386 | ) | | | (93,139 | ) |
| Trustmark Corp. | | | (3,391 | ) | | | (112,649 | ) |
| UMB Financial Corp. | | | (1,289 | ) | | | (93,440 | ) |
| United Bankshares, Inc. | | | (4,943 | ) | | | (197,226 | ) |
| Valley National Bancorp | | | (7,004 | ) | | | (82,367 | ) |
| Westamerica Bancorporation | | | (3,498 | ) | | | (192,460 | ) |
| | | | | | | | (1,890,874 | ) |
| BEVERAGES (‐0.02%) | | | | | | | | |
| The Boston Beer Co., Inc., Class A | | | (821 | ) | | | (118,511 | ) |
| | | | | | | | | |
| BIOTECHNOLOGY (‐0.04%) | | | | | | | | |
| Illumina, Inc. | | | (567 | ) | | | (104,816 | ) |
| Juno Therapeutics, Inc. | | | (3,938 | ) | | | (98,214 | ) |
| | | | | | | | (203,030 | ) |
| BUILDING MATERIALS (‐0.01%) | | | | | | | | |
| Trex Co., Inc. | | | (429 | ) | | | (31,399 | ) |
| | | | | | | | | |
| CHEMICALS (‐0.09%) | | | | | | | | |
| Balchem Corp. | | | (1,458 | ) | | | (118,331 | ) |
| HB Fuller Co. | | | (1,777 | ) | | | (93,879 | ) |
| Ingevity Corp. | | | (1,682 | ) | | | (106,353 | ) |
| NewMarket Corp. | | | (344 | ) | | | (161,921 | ) |
| | | | | | | | (480,484 | ) |
| COMMERCIAL SERVICES (‐0.12%) | | | | | | | | |
| Cimpress NV | | | (2,086 | ) | | | (171,219 | ) |
| CoStar Group, Inc. | | | (499 | ) | | | (120,204 | ) |
| Monro Muffler Brake, Inc. | | | (1,955 | ) | | | (101,367 | ) |
| Multi‐Color Corp. | | | (1,550 | ) | | | (119,040 | ) |
| Rollins, Inc. | | | (2,087 | ) | | | (81,038 | ) |
| | | | | | | | (592,868 | ) |
| COMPUTERS (‐0.09%) | | | | | | | | |
| Electronics for Imaging, Inc. | | | (3,626 | ) | | | (165,998 | ) |
| Infosys, Ltd., Sponsored ADR | | | (7,895 | ) | | | (114,951 | ) |
| Wipro, Ltd., ADR | | | (22,167 | ) | | | (218,345 | ) |
| | | | | | | | (499,294 | ) |
| COSMETICS & PERSONAL CARE (‐0.05%) | | | | | | | | |
| Colgate‐Palmolive Co. | | | (999 | ) | | | (71,968 | ) |
| Coty, Inc., Class A | | | (6,805 | ) | | | (121,469 | ) |
| | | | | | | | (193,437 | ) |
| DIVERSIFIED FINANCIAL SERVICES (‐0.08%) | | | | | | | | |
| Eaton Vance Corp. | | | (4,183 | ) | | | (179,576 | ) |
| Financial Engines, Inc. | | | (3,088 | ) | | | (131,240 | ) |
| WisdomTree Investments, Inc. | | | (7,744 | ) | | | (64,662 | ) |
| | | | | | | | (375,478 | ) |
| ELECTRIC (‐0.02%) | | | | | | | | |
| Ormat Technologies, Inc. | | | (1,798 | ) | | | (106,190 | ) |
| | | | | | | | | |
| ELECTRONICS (‐0.11%) | | | | | | | | |
| Itron, Inc. | | | (3,250 | ) | | | (210,763 | ) |
See Notes to Financial Statements.
18
| Redmont Resolute Fund | Consolidated Schedule of Investments |
April 30, 2017
| Description | | Shares | | | Value
(Note 2) | |
| ELECTRONICS (‐0.11%) (continued) | | | | | | |
| National Instruments Corp. | | | (9,795 | ) | | $ | (341,943 | ) |
| | | | | | | | (552,706 | ) |
| ENTERTAINMENT (‐0.03%) | | | | | | | | |
| SeaWorld Entertainment, Inc. | | | (8,870 | ) | | | (155,491 | ) |
| | | | | | | | | |
| FOOD (‐0.12%) | | | | | | | | |
| B&G Foods, Inc. | | | (3,814 | ) | | | (160,188 | ) |
| McCormick & Co., Inc. | | | (1,365 | ) | | | (136,364 | ) |
| Snyder's‐Lance, Inc. | | | (1,516 | ) | | | (53,454 | ) |
| TreeHouse Foods, Inc. | | | (1,671 | ) | | | (146,380 | ) |
| Whole Foods Market, Inc. | | | (2,858 | ) | | | (103,945 | ) |
| | | | | | | | (600,331 | ) |
| HEALTHCARE ‐ PRODUCTS (‐0.13%) | | | | | | | | |
| Henry Schein, Inc. | | | (428 | ) | | | (74,386 | ) |
| IDEXX Laboratories, Inc. | | | (686 | ) | | | (115,063 | ) |
| Intuitive Surgical, Inc. | | | (203 | ) | | | (169,682 | ) |
| West Pharmaceutical Services, Inc. | | | (1,715 | ) | | | (157,831 | ) |
| Wright Medical Group NV | | | (3,749 | ) | | | (113,932 | ) |
| | | | | | | | (630,894 | ) |
| HOME BUILDERS (‐0.02%) | | | | | | | | |
| Thor Industries, Inc. | | | (1,240 | ) | | | (119,263 | ) |
| | | | | | | | | |
| HOUSEWARES (‐0.02%) | | | | | | | | |
| The Toro Co. | | | (1,796 | ) | | | (116,596 | ) |
| | | | | | | | | |
| INSURANCE (‐0.07%) | | | | | | | | |
| Cincinnati Financial Corp. | | | (1,650 | ) | | | (118,948 | ) |
| Mercury Gen Corp. | | | (2,151 | ) | | | (132,265 | ) |
| RLI Corp. | | | (1,970 | ) | | | (112,723 | ) |
| | | | | | | | (363,936 | ) |
| INTERNET (‐0.19%) | | | | | | | | |
| 58.com, Inc., ADR | | | (2,292 | ) | | | (90,717 | ) |
| Cogent Communications Holdings, Inc. | | | (4,601 | ) | | | (207,045 | ) |
| F5 Networks, Inc. | | | (551 | ) | | | (71,151 | ) |
| Netflix, Inc. | | | (1,069 | ) | | | (162,702 | ) |
| Proofpoint, Inc. | | | (2,082 | ) | | | (156,920 | ) |
| Snap, Inc., Class A | | | (3,379 | ) | | | (76,196 | ) |
| Wayfair, Inc., Class A | | | (3,121 | ) | | | (142,661 | ) |
| | | | | | | | (907,392 | ) |
| LEISURE TIME (‐0.03%) | | | | | | | | |
| Harley‐Davidson, Inc. | | | (2,199 | ) | | | (124,925 | ) |
| | | | | | | | | |
| MACHINERY ‐ DIVERSIFIED (‐0.12%) | | | | | | | | |
| Cognex Corp. | | | (1,983 | ) | | | (169,229 | ) |
| Deere & Co. | | | (1,222 | ) | | | (136,387 | ) |
| Flowserve Corp. | | | (962 | ) | | | (48,937 | ) |
| The Middleby Corp. | | | (1,145 | ) | | | (155,869 | ) |
| Wabtec Corp. | | | (958 | ) | | | (80,367 | ) |
| | | | | | | | (590,789 | ) |
| MEDIA (‐0.06%) | | | | | | | | |
| EW Scripps Co., Class A | | | (5,634 | ) | | | (125,526 | ) |
| Factset Research Systems, Inc. | | | (836 | ) | | | (136,485 | ) |
| | | | | | | | (262,011 | ) |
See Notes to Financial Statements.
| Annual Report | April 30, 2017 | 19 |
| Redmont Resolute Fund | Consolidated Schedule of Investments |
April 30, 2017
| Description | | Shares | | | Value
(Note 2) | |
| METAL FABRICATE & HARDWARE (‐0.02%) | | | | | | |
| Sun Hydraulics Corp. | | | (2,260 | ) | | $ | (87,778 | ) |
| | | | | | | | | |
| MINING (‐0.02%) | | | | | | | | |
| Kinross Gold Corp. | | | (23,861 | ) | | | (83,275 | ) |
| | | | | | | | | |
| MISCELLANEOUS MANUFACTURING (‐0.06%) | | | | | | | | |
| Actuant Corp., Class A | | | (5,479 | ) | | | (149,577 | ) |
| AptarGroup, Inc. | | | (1,982 | ) | | | (159,155 | ) |
| | | | | | | | (308,732 | ) |
| OIL & GAS (‐0.26%) | | | | | | | | |
| Apache Corp. | | | (2,945 | ) | | | (143,245 | ) |
| Carrizo Oil & Gas, Inc. | | | (4,636 | ) | | | (116,595 | ) |
| EP Energy Corp., Class A | | | (10,941 | ) | | | (49,453 | ) |
| Hess Corp. | | | (3,198 | ) | | | (156,158 | ) |
| HollyFrontier Corp. | | | (6,470 | ) | | | (182,066 | ) |
| Laredo Petroleum, Inc. | | | (11,079 | ) | | | (142,476 | ) |
| Matador Resources Co. | | | (6,433 | ) | | | (139,467 | ) |
| Murphy Oil Corp. | | | (2,702 | ) | | | (70,738 | ) |
| Transocean, Ltd. | | | (10,786 | ) | | | (118,970 | ) |
| Ultra Petroleum Corp. | | | (8,673 | ) | | | (97,138 | ) |
| Whiting Petroleum Corp. | | | (14,361 | ) | | | (119,196 | ) |
| | | | | | | | (1,335,502 | ) |
| OIL & GAS SERVICES (‐0.03%) | | | | | | | | |
| National Oilwell Varco, Inc. | | | (4,044 | ) | | | (141,419 | ) |
| | | | | | | | | |
| PACKAGING & CONTAINERS (‐0.08%) | | | | | | | | |
| Ball Corp. | | | (2,416 | ) | | | (185,766 | ) |
| Bemis Co., Inc. | | | (1,576 | ) | | | (70,810 | ) |
| Sonoco Products Co. | | | (2,848 | ) | | | (148,979 | ) |
| | | | | | | | (405,555 | ) |
| PHARMACEUTICALS (‐0.10%) | | | | | | | | |
| AmerisourceBergen Corp. | | | (1,293 | ) | | | (106,091 | ) |
| Bristol‐Meyers Squibb Co. | | | (2,826 | ) | | | (158,397 | ) |
| Eli Lilly & Co. | | | (1,867 | ) | | | (153,206 | ) |
| TESARO, Inc. | | | (511 | ) | | | (75,418 | ) |
| | | | | | | | (493,112 | ) |
| PIPELINES (‐0.02%) | | | | | | | | |
| Tallgrass Energy GP LP | | | (3,172 | ) | | | (85,485 | ) |
| | | | | | | | | |
| REAL ESTATE INVESTMENT TRUSTS (‐0.06%) | | | | | | | | |
| Equinix, Inc. | | | (474 | ) | | | (197,990 | ) |
| Pebblebrook Hotel Trust | | | (3,043 | ) | | | (90,560 | ) |
| | | | | | | | (288,550 | ) |
| RETAIL (‐0.26%) | | | | | | | | |
| Buffalo Wild Wings, Inc. | | | (855 | ) | | | (134,705 | ) |
| CarMax, Inc. | | | (2,741 | ) | | | (160,349 | ) |
| Casey's General Stores, Inc. | | | (1,088 | ) | | | (121,932 | ) |
| Chipotle Mexican Grill, Inc. | | | (301 | ) | | | (142,815 | ) |
| Cracker Barrel Old Country Store, Inc. | | | (763 | ) | | | (122,225 | ) |
| Dollar General Corp. | | | (1,644 | ) | | | (119,535 | ) |
| Dunkin' Brands Group, Inc. | | | (2,091 | ) | | | (116,803 | ) |
| PriceSmart, Inc. | | | (1,280 | ) | | | (111,296 | ) |
| Texas Roadhouse, Inc. | | | (1,935 | ) | | | (90,713 | ) |
See Notes to Financial Statements.
20| Redmont Resolute Fund | Consolidated Schedule of Investments |
April 30, 2017
| Description | | Shares | | | Value
(Note 2) | |
| RETAIL (‐0.26%) (continued) | | | | | | |
| The Cheesecake Factory, Inc. | | | (2,558 | ) | | $ | (164,121 | ) |
| | | | | | | | (1,284,494 | ) |
| SAVINGS & LOANS (‐0.04%) | | | | | | | | |
| New York Community Bancorp, Inc. | | | (6,473 | ) | | | (86,026 | ) |
| People's United Financial, Inc. | | | (5,878 | ) | | | (102,689 | ) |
| | | | | | | | (188,715 | ) |
| SEMICONDUCTORS (‐0.05%) | | | | | | | | |
| Cavium, Inc. | | | (1,612 | ) | | | (110,986 | ) |
| United Microelectronics Corp., Sponsored ADR | | | (62,595 | ) | | | (121,434 | ) |
| | | | | | | | (232,420 | ) |
| SOFTWARE (‐0.45%) | | | | | | | | |
| 2U, Inc. | | | (2,979 | ) | | | (135,247 | ) |
| ACI Worldwide, Inc. | | | (11,248 | ) | | | (241,720 | ) |
| Acxiom Corp. | | | (3,455 | ) | | | (99,849 | ) |
| athenahealth, Inc. | | | (1,006 | ) | | | (98,598 | ) |
| Blackbaud, Inc. | | | (3,495 | ) | | | (281,033 | ) |
| Guidewire Software, Inc. | | | (3,424 | ) | | | (210,542 | ) |
| Medidata Solutions, Inc. | | | (4,740 | ) | | | (310,138 | ) |
| salesforce.com, Inc. | | | (2,041 | ) | | | (175,771 | ) |
| The Ultimate Software Group, Inc. | | | (997 | ) | | | (202,062 | ) |
| Veeva Systems, Inc., Class A | | | (4,077 | ) | | | (218,609 | ) |
| Workday, Inc., Class A | | | (2,747 | ) | | | (240,088 | ) |
| | | | | | | | (2,213,657 | ) |
| STORAGE & WAREHOUSING (‐0.02%) | | | | | | | | |
| Mobile Mini, Inc. | | | (3,626 | ) | | | (104,066 | ) |
| | | | | | | | | |
| TELECOMMUNICATIONS (‐0.13%) | | | | | | | | |
| Arista Networks, Inc. | | | (1,641 | ) | | | (229,149 | ) |
| Frontier Communications Corp. | | | (22,619 | ) | | | (42,524 | ) |
| Sprint Corp. | | | (23,044 | ) | | | (208,087 | ) |
| Telefonica SA, Sponsored ADR | | | (7,021 | ) | | | (77,933 | ) |
| ViaSat, Inc. | | | (1,028 | ) | | | (65,823 | ) |
| | | | | | | | (623,516 | ) |
| TOYS, GAMES & HOBBIES (‐0.03%) | | | | | | | | |
| Mattel, Inc. | | | (6,237 | ) | | | (139,834 | ) |
| | | | | | | | | |
| TRANSPORTATION (‐0.06%) | | | | | | | | |
| Heartland Express, Inc. | | | (5,059 | ) | | | (101,787 | ) |
| JB Hunt Transport Services, Inc. | | | (1,142 | ) | | | (102,392 | ) |
| Old Dominion Freight Line, Inc. | | | (1,198 | ) | | | (106,047 | ) |
| | | | | | | | (310,226 | ) |
| | | | | | | | | |
| TOTAL COMMON STOCKS (Proceeds $16,698,279) | | | | | | | (17,994,399 | ) |
| Description | | Principal | | | Value
(Note 2) | |
| CORPORATE BONDS (‐2.00%) | | | | | | |
| CHEMICALS (‐0.38%) | | | | | | |
| CVR Partners | | | | | | |
9.25%, 6/15/2023(f) | | $ | (1,827,000 | ) | | $ | (1,872,675 | ) |
See Notes to Financial Statements.
| Annual Report | April 30, 2017 | 21 |
| Redmont Resolute Fund | Consolidated Schedule of Investments |
April 30, 2017
| Description | | Principal | | | Value
(Note 2) | |
| MISCELLANEOUS MANUFACTURING (‐0.38%) | | | | | | |
| Bombardier, Inc. | | | | | | |
8.75%, 12/1/2021(f) | | $ | (853,000 | ) | | $ | (951,095 | ) |
| Bombardier, Inc. | | | | | | | | |
7.50%, 3/15/2025(f) | | | (913,000 | ) | | | (951,802 | ) |
| | | | | | | | (1,902,897 | ) |
| PHARMACEUTICALS (‐0.93%) | | | | | | | | |
| Teva Pharmaceuticals | | | | | | | | |
| 3.15%, 10/1/2026 | | | (2,149,000 | ) | | | (2,004,867 | ) |
| Valeant Pharmaceuticals International, Inc. | | | | | | | | |
7.00%, 3/15/2024(f) | | | (581,000 | ) | | | (594,073 | ) |
| VRX Escrow Corp. | | | | | | | | |
6.13%, 4/15/2025(f) | | | (2,647,000 | ) | | | (1,964,074 | ) |
| | | | | | | | (4,563,014 | ) |
| TELECOMMUNICATIONS (‐0.31%) | | | | | | | | |
| T‐Mobile USA, Inc. | | | | | | | | |
| 6.50%, 1/15/2026 | | | (1,357,000 | ) | | | (1,507,966 | ) |
| | | | | | | | | |
| TOTAL CORPORATE BONDS (Proceeds $9,905,585) | | | | | | | (9,846,552 | ) |
| Description | | Shares | | | Value
(Note 2) | |
| EXCHANGE TRADED FUNDS (‐1.93%) | | | | | | |
Consumer Discretionary Select Sector SPDR® Fund | | | (20,253 | ) | | | (1,823,985 | ) |
Consumer Staples Select Sector SPDR® Fund | | | (17,470 | ) | | | (963,995 | ) |
Health Care Select Sector SPDR® Fund | | | (14,639 | ) | | | (1,105,244 | ) |
iShares® 20+ Year Treasury Bond ETF | | | (12,886 | ) | | | (1,576,602 | ) |
iShares® 7‐10 Year Treasury Bond ETF | | | (7,080 | ) | | | (754,728 | ) |
iShares® Euro Government 10.5+ Year ETF | | | (5,377 | ) | | | (823,166 | ) |
iShares® Euro Government 7‐10 Year ETF | | | (7,476 | ) | | | (1,691,915 | ) |
| Vanguard REIT ETF | | | (9,321 | ) | | | (771,686 | ) |
| | | | | | | | (9,511,321 | ) |
| TOTAL EXCHANGE TRADED FUNDS (‐1.93%) (Proceeds $9,167,539) | | | | | | | (9,511,321 | ) |
| | | | | | | | |
| TOTAL SECURITIES SOLD SHORT (Proceeds $35,771,403) | | | | | | $ | (37,352,272 | ) |
(a) | Security position either entirely or partially held in a segregated account as collateral for securities sold short and total return swaps. Aggregate total fair value of $25,441,356. |
(b) | Non-income producing security. |
(d) | Restricted security; these securities may only be resold in transactions exempt from registration under the Securities Act of 1933. |
(f) | Security exempt from registration under rule 144A of the securities act of 1933. This security may be resold in transactions exempt from registration, normally to qualified institutional buyers. At period end, the fair value of those securities held in long positions was $27,539,167 which represents 5.60% of net assets and the value of the securites held in short positions was $(6,333,719) which represents (1.29%) of the Fund’s net assets. |
(g) | Issued with a zero coupon. Income is recognized through the accretion of discount. |
(h) | Includes cash which is being held as collateral for securities sold short and total return swap contracts. |
See Notes to Financial Statements.
22
| Redmont Resolute Fund | Consolidated Schedule of Investments |
April 30, 2017
TOTAL RETURN SWAP CONTRACTS*
| Counterparty | Reference Obligation | | Notional Amount | | Rate Paid by the Fund | | Termination Date | | Unrealized Appreciation/(Depreciation) | |
| Morgan Stanley | BHDG Systematic Trading Segregated Portfolio(a) | | $ | 24,617,109 | | 1‐Month LIBOR BBA | | 09/13/2018 | | $ | 43,295 | |
| Morgan Stanley | Clinton Segregated Portfolio(b) | | | 18,959,466 | | 1‐Month LIBOR BBA | | 09/13/2018 | | | (10,154 | ) |
| Morgan Stanley | iBoxx HY Index | | | (4,250,000 | ) | 3‐Month LIBOR | | 06/20/2017 | | | (30,512 | ) |
| Morgan Stanley | iBoxx IG Index | | | (6,000,000 | ) | 3‐Month LIBOR | | 06/20/2017 | | | (15,615 | ) |
| Morgan Stanley | iBoxx IG Index | | | (790,000 | ) | 3‐Month LIBOR | | 06/20/2017 | | | (112,838 | ) |
| Morgan Stanley | iBoxx IG Index | | | (2,090,000 | ) | 3‐Month LIBOR | | 06/20/2017 | | | (40,107 | ) |
| Morgan Stanley | Impala Segregated Portfolio(c) | | | 41,592,028 | | 1‐Month LIBOR BBA | | 03/20/2019 | | | (295,731 | ) |
| Morgan Stanley | Melchior Segregated Portfolio(d) | | | 41,736,083 | | 1‐Month LIBOR BBA | | 03/20/2019 | | | (189,521 | ) |
| Morgan Stanley | PSAM Highland(e) | | | 43,883,488 | | 1‐Month EURIBOR | | 06/03/2021 | | | 10,587 | |
| Morgan Stanley | WABR Cayman Company Limited(f) | | | 53,268,427 | | 1‐Month LIBOR BBA | | 09/01/2020 | | | 36,494 | |
| | | | $ | 210,926,601 | | | | | | $ | (604,102 | ) |
* | For the long positions, the Fund receives payments based on any positive return of the Reference Obligation less the rate paid by the Fund. The Fund makes payments on any negative return of such Reference Obligation plus the rate paid by the Fund. For short positions, the Fund receives payments based on any negative return of the Reference Obligation less the rate paid by the fund. The Fund makes payments on any positive return of such Reference obligation plus the rate paid by the Fund. |
(a) | BHDG Systematic Trading Segregated Portfolio is a quantitative trend following strategy that uses futures. BHDG will employ some short, medium, and long term signals. Interest rate, commodity, equity, and sovereign debt futures will be used. Any asset class may have net long or short exposure, and exposures in aggregate may be net long or short. |
(b) | Clinton Segregated Portfolio is a global, quantitative equity market neutral strategy. The Portfolio will invest in large, mid, and small cap stocks in developed and some emerging markets. The strategy will also attempt to minimize net exposure to any given country or sector. The strategy attempts to generate returns primarily through trading value, momentum, and mean reversion models. |
(c) | Impala Segregated Portfolio is a European equity long/short strategy that employs a flexible, low-net strategy (0% to 50%), and long exposure will vary between 60% and 100%. The portfolio is primarily comprised of large and mid-cap stocks listed on European exchanges. |
(d) | Melchior Segregated Portfolio is a global equity long/short strategy that uses a long-biased strategy that is focused on cyclical sectors. The strategy has a net exposure that ranges between 50% and 80%, and long exposure varies between 80% and 100%. The strategy is comprised of large cap stocks listed on exchanges of developed and emerging market countries. |
(e) | PSAM Highland employs an event driven strategy. The fund will primarily make investments in equity special situations and merger arbitrage. The strategy will also opportunistically allocate to liquid high yield credit positions when trading at stressed levels. The strategy will employ gross long exposure of up to 120%, and net exposure will typically vary from 40% to 80%. |
(f) | Weiss Alpha Balanced Risk ("WABR") Cayman Company Limited incorporates an absolute return oriented approach within a risk parity framework. Active absolute return strategies include fundamental long/short equity, credit relative value, discretionary macro, and equity market neutral strategies. The strategy also maintains a passive risk weighted allocation to equities and fixed income, but each of the three allocations is equally risk weighted subject to a 40% limit on the absolute return allocation. Gross equity long exposure will typically be 140% or less, and net equity exposure will vary between 5% and 35%. |
Common Abbreviations:
AQR - AQR Capital Management LLC.
BBA - British Bankers Association.
EURIBOR - Euro Interbank Offered Rate.
LIBOR - London Interbank Offered Rate.
PIK - Payment in-kind
PIMCO - Pacific Investment Management Company.
S&P - Standard & Poor's.
SPDR - Standard & Poor's Depositary Receipt.
See Notes to Financial Statements.
| Annual Report | April 30, 2017 | 23 |
| Redmont Resolute Fund | Consolidated Statement of Assets and Liabilities |
April 30, 2017
| | | Redmont Resolute Fund | |
| ASSETS | | | |
| Investments, at value | | $ | 411,875,324 | |
| Unrealized appreciation on total return swap contracts | | | 90,376 | |
| Deposits with brokers for securities sold short | | | 35,307,515 | |
| Deposits with brokers for total return swap contracts | | | 89,126,077 | |
| Receivable for investments sold | | | 1,658,367 | |
| Dividends receivable | | | 228,293 | |
| Interest receivable | | | 990,043 | |
| Receivable for total return swap reset | | | 1,686,182 | |
| Prepaid offering costs (Note 2) | | | 14,865 | |
| Other assets | | | 17,777 | |
| Total assets | | | 540,994,819 | |
| LIABILITIES | | | | |
| Securities sold short (Proceeds $35,771,403) | | | 37,352,272 | |
| Unrealized depreciation on total return swap contracts | | | 694,478 | |
| Payable to custodian due to overdraft (Cost $2,886,639) | | | 2,883,526 | |
| Investment advisory fees payable | | | 377,983 | |
| Payable for dividend expense on securities sold short | | | 11,872 | |
| Payable for interest expense on total return swap contracts | | | 14,809 | |
| Payable for investments purchased | | | 7,656,274 | |
| Trustee fees and expenses payable | | | 5,992 | |
| Chief compliance officer fee payable | | | 4,164 | |
| Principal financial officer fees payable | | | 833 | |
| Administration fees payable | | | 90,536 | |
| Transfer agent fees payable | | | 8,756 | |
| Professional fees payable | | | 36,371 | |
| Custody fees payable | | | 43,947 | |
| Accrued expenses and other liabilities | | | 1,656 | |
| Total liabilities | | | 49,183,469 | |
| NET ASSETS | | $ | 491,811,350 | |
| NET ASSETS CONSIST OF | | | | |
| Paid‐in capital (Note 6) | | $ | 465,818,951 | |
| Accumulated net income | | | 10,952,159 | |
| Accumulated net realized gain | | | 4,218,367 | |
| Net unrealized appreciation | | | 10,821,873 | |
| NET ASSETS | | $ | 491,811,350 | |
| INVESTMENTS, AT COST | | $ | 398,871,064 | |
| PRICING OF SHARES | | | | |
Class I: | | | | |
| Net Asset Value, offering and redemption price per share | | $ | 11.14 | |
| Net Assets | | $ | 491,811,350 | |
| Shares of beneficial interest outstanding (unlimited number of shares, no par value common stock authorized) | | | 44,145,034 | |
See Notes to Financial Statements.
24| Redmont Resolute Fund | Consolidated Statement of Operations |
For the Year Ended April 30, 2017
| | | Redmont Resolute Fund(a) | |
| INVESTMENT INCOME | | | |
| Dividends | | $ | 6,313,291 | |
| Interest | | | 1,918,181 | |
| Foreign taxes withheld | | | (95,187 | ) |
| Total investment income | | | 8,136,285 | |
| | | | | |
| EXPENSES | | | | |
| Investment advisory fees (Note 7) | | | 8,819,140 | |
| Investment sub‐advisory fee | | | 234,205 | |
| Broker fees and charges on securities sold short | | | 132,397 | |
| Administration fees | | | 496,488 | |
| Transfer agency fees | | | 61,756 | |
| Professional fees | | | 106,472 | |
| Custody fees | | | 220,874 | |
| Reports to shareholders and printing fees | | | 10,226 | |
| Trustee fees and expenses | | | 28,318 | |
| Registration/filing fees | | | 3,259 | |
| Chief compliance officer fees | | | 48,725 | |
| Principal financial officer fees | | | 10,000 | |
| Offering costs | | | 13,074 | |
| Dividend expense on securities sold short | | | 477,402 | |
| Other | | | 23,527 | |
| Total expenses before waivers | | | 10,685,863 | |
| Less fees waived/reimbursed by investment adviser (Note 7) | | | | |
| Class I | | | (7,367,626 | ) |
| Waiver of investment advisory fees ‐ subsidiary (Note 7) | | | (234,205 | ) |
| Total net expenses | | | 3,084,032 | |
| NET INVESTMENT INCOME | | | 5,052,253 | |
| Net realized gain on investments (net of foreign capital gains tax of $82,844) | | | 13,802,712 | |
| Net realized loss on securities sold short | | | (5,085,048 | ) |
| Net realized gain on written options | | | 31,511 | |
| Net realized gain on futures contracts | | | 539,124 | |
| Net realized gain on total return swap contracts | | | 8,499,142 | |
| Net realized loss on foreign currency transactions | | | (921,695 | ) |
| Total net realized gain | | | 16,865,746 | |
| Net realized capital gain distributions from other investment companies | | | 2,574,206 | |
| | | | | |
| Net change in unrealized appreciation on investments | | | 4,506,662 | |
| Net change in unrealized depreciation on securities sold short | | | (227,462 | ) |
| Net change in unrealized appreciation on written options | | | 217,149 | |
| Net change in unrealized depreciation on futures contracts | | | (56,806 | ) |
| Net change in unrealized depreciation on total return swap contracts | | | (1,311,049 | ) |
| Net change in unrealized appreciation on translation of assets and liabilities in foreign currency transactions | | | 1,030,960 | |
| Total net change in unrealized appreciation | | | 4,159,454 | |
| NET REALIZED AND UNREALIZED GAIN ON INVESTMENTS | | | 23,599,406 | |
| NET INCREASE IN NET ASSETS RESULTING FROM OPERATIONS | | $ | 28,651,659 | |
(a) | Prior to August 31, 2016 the Redmont Resolute Fund was known as the Redmont Resolute Fund II. |
See Notes to Financial Statements.
| Annual Report | April 30, 2017 | 25 |
| Redmont Resolute Fund | Consolidated Statements of Changes in Net Assets |
| | | Redmont Resolute Fund | |
| | | For the Year Ended April 30, 2017(a) | | | For the Year Ended April 30, 2016 | |
| OPERATIONS | | | | | | |
| Net investment income | | $ | 5,052,253 | | | $ | 10,201,232 | |
| Net realized gain/(loss) | | | 16,865,746 | | | | (9,636,394 | ) |
| Net realized gain distributions from other investment companies | | | 2,574,206 | | | | 5,483,000 | |
| Net change in unrealized appreciation/(depreciation) | | | 4,159,454 | | | | (19,989,835 | ) |
| Net increase/(decrease) in net assets resulting from operations | | | 28,651,659 | | | | (13,941,997 | ) |
| DISTRIBUTIONS (NOTE 4) | | | | | | | | |
| Net investment income | | | | | | | | |
| Class I | | | (6,470,084 | ) | | | (11,108,106 | ) |
| Net realized gains on investments | | | | | | | | |
| Class I | | | (778,253 | ) | | | (10,242,050 | ) |
| Net decrease in net assets from distributions | | | (7,248,337 | ) | | | (21,350,156 | ) |
| BENEFICIAL INTEREST TRANSACTIONS (NOTE 6) | | | | | | | | |
| Shares sold | | | | | | | | |
| Class I | | | 139,235,368 | | | | 49,423,534 | |
| Dividends reinvested | | | | | | | | |
| Class I | | | 7,248,336 | | | | 21,244,058 | |
| Shares redeemed, net of redemption fees | | | | | | | | |
| Class I | | | (362,734,552 | ) | | | (37,982,086 | ) |
| Net increase/(decrease) in net assets derived from beneficial interest transactions | | | (216,250,848 | ) | | | 32,685,506 | |
| Net decrease in Net Assets | | | (194,847,526 | ) | | | (2,606,647 | ) |
| NET ASSETS: | | | | | | | | |
| Beginning of period | | | 686,658,876 | | | | 689,265,523 | |
| End of period* | | $ | 491,811,350 | | | $ | 686,658,876 | |
| * Includes accumulated net investment income/(loss) of: | | $ | 10,952,159 | | | $ | (826,971 | ) |
(a) | Prior to August 31, 2016 the Redmont Resolute Fund was known as the Redmont Resolute Fund II. |
See Notes to Financial Statements.
26
| Redmont Resolute Fund | Consolidated Financial Highlights |
For a share outstanding throughout the periods presented
| | | Class I | |
| | | For the Year Ended April 30, 2017(a) | | | For the Year Ended April 30, 2016 | | | For the Year Ended April 30, 2015 | | | For the Year Ended April 30, 2014 | | | For the Year Ended April 30, 2013 | |
| | | | | | | | | | | | | | | | |
| NET ASSET VALUE, BEGINNING OF PERIOD | | $ | 10.75 | | | $ | 11.32 | | | $ | 11.18 | | | $ | 11.05 | | | $ | 10.34 | |
| INCOME/(LOSS) FROM OPERATIONS | | | | | | | | | | | | | | | | | | | | |
Net investment income(b) | | | 0.09 | | | | 0.16 | | | | 0.20 | | | | 0.13 | | | | 0.11 | |
| Net realized and unrealized gain/(loss) on investments | | | 0.45 | | | | (0.39 | ) | | | 0.26 | | | | 0.19 | | | | 0.68 | |
| Total from Investment Operations | | | 0.54 | | | | (0.23 | ) | | | 0.46 | | | | 0.32 | | | | 0.79 | |
| | | | | | | | | | | | | | | | | | | | | |
| LESS DISTRIBUTIONS | | | | | | | | | | | | | | | | | | | | |
| Net investment income | | | (0.13 | ) | | | (0.18 | ) | | | (0.24 | ) | | | (0.11 | ) | | | (0.08 | ) |
| Net realized gain on investments | | | (0.02 | ) | | | (0.16 | ) | | | (0.08 | ) | | | (0.08 | ) | | | – | |
| Total Distributions | | | (0.15 | ) | | | (0.34 | ) | | | (0.32 | ) | | | (0.19 | ) | | | (0.08 | ) |
| NET INCREASE/(DECREASE) IN NET ASSET VALUE | | | 0.39 | | | | (0.57 | ) | | | 0.14 | | | | 0.13 | | | | 0.71 | |
| NET ASSET VALUE, END OF PERIOD | | $ | 11.14 | | | $ | 10.75 | | | $ | 11.32 | | | $ | 11.18 | | | $ | 11.05 | |
TOTAL RETURN(c) | | | 5.04 | % | | | (2.02 | )% | | | 4.16 | % | | | 2.85 | % | | | 7.65 | % |
| | | | | | | | | | | | | | | | | | | | | |
| RATIOS/SUPPLEMENTAL DATA | | | | | | | | | | | | | | | | | | | | |
| Net assets, End of Period (000s) | | $ | 491,811 | | | $ | 686,659 | | | $ | 689,266 | | | $ | 604,949 | | | $ | 446,319 | |
| RATIOS TO AVERAGE NET ASSETS: | | | | | | | | | | | | | | | | | | | | |
Operating expenses excluding reimbursement/waiver(d) | | | 1.77 | %(e)(f) | | | 1.69 | %(e) | | | 1.68 | %(e) | | | 1.69 | %(e) | | | 1.32 | % |
Operating expenses including reimbursement/waiver(d) | | | 0.52 | %(e) | | | 0.35 | %(e) | | | 0.33 | %(e) | | | 0.29 | %(e) | | | 0.22 | % |
Net investment income including reimbursement/waiver(d) | | | 0.86 | % | | | 1.49 | % | | | 1.79 | % | | | 1.19 | % | | | 1.08 | % |
| PORTFOLIO TURNOVER RATE | | | 94 | % | | | 27 | % | | | 54 | % | | | 114 | % | | | 51 | % |
(a) | Prior to August 31, 2016 the Redmont Resolute Fund was known as the Redmont Resolute Fund II. |
(b) | Calculated using the average shares method. |
(c) | Total investment return is calculated assuming a purchase of a common share at the opening of the first day and a sale at closing on the last day of each period reported. Dividends and distributions, if any, are assumed for purposes of this calculation to be reinvested at prices obtained under the Fund's dividend reinvestment plan. Total returns would have been lower had certain expenses not been waived during the period. Total investment returns do not reflect brokerage commissions, if any, and are not annualized. |
(d) | The ratios exclude the impact of expenses of the underlying funds in which the Fund invests as represented in the Schedule of Investments. |
(e) | Dividend and interest expense on securities sold short totaled 0.10%, 0.08%, 0.10%, and 0.08% of average net assets for the years ended April 30, 2017, 2016, 2015, and 2014, respectively. |
(f) | The ratio of operating expenses excluding fee waiver/reimbursements to average net assets is calculated excluding the waived Subsidiary management fee (See Note 7 for additional detail). The ratio inclusive of that fee would be 1.81% for the year ended April 30, 2017. |
See Notes to Financial Statements.
| Annual Report | April 30, 2017 | 27 |
| Redmont Resolute Fund | Notes to Consolidated Financial Statements |
1. ORGANIZATION
Financial Investors Trust (the “Trust”), a Delaware statutory trust, is an open‐end management investment company registered under the Investment Company Act of 1940, as amended (“1940 Act”). The Trust consists of multiple separate portfolios or series. This annual report describes the Redmont Resolute Fund (the “Fund”). The Fund seeks to provide long‐term total return with reduced volatility and reduced correlation to the conventional stock and bond markets. The Fund offers Class I shares.
Basis of Consolidation: Redmont Resolute Cayman (the “Subsidiary”), a Cayman Islands exempted company, is a wholly owned subsidiary of the Fund. The Subsidiary’s investment objective is designed to enhance the ability of the Fund to obtain exposure to equities, financial, currency and commodities markets consistent with the limits of the U.S. federal tax law requirements applicable to registered investment companies. The Subsidiary is subject to substantially the same investment policies and investment restrictions as the Fund. The Subsidiary acts as an investment vehicle for the Fund in order to effect certain commodity‐related investments on behalf of the Fund. Investments in the Subsidiary are expected to provide the Fund with exposure to the commodity markets within the limitations of Subchapter M of the Internal Revenue Code of 1986, as amended (the “Code”), and recent IRS revenue rulings, as discussed below under “Federal Income Taxes”. The Fund is the sole shareholder of the Subsidiary pursuant to a subscription agreement, and it is intended that the Fund will remain the sole shareholder and will continue to control the Subsidiary. Under the Articles of Association of the Subsidiary, shares issued by the Subsidiary confer upon a shareholder the right to wholly own and vote at general meetings of the Subsidiary and certain rights in connection with any winding‐up or repayment of capital, as well as the right to participate in the profits or assets of the Subsidiary. The Fund may invest up to 25% of its total assets in shares of the Subsidiary. As a wholly owned subsidiary of the Fund, all assets and liabilities, income and expenses of the Subsidiary are consolidated in the financial statements and financial highlights of the Fund. All investments held by the Subsidiary are disclosed in the accounts of the Fund. As of April 30, 2017, net assets of the Fund were $491,811,350, of which $24,342,904 or 4.95%, represented the Fund’s ownership of all issued shares and voting rights of the Subsidiary.
2. SIGNIFICANT ACCOUNTING POLICIES
The accompanying financial statements were prepared in accordance with accounting principles generally accepted in the United States of America (“U.S. GAAP”). The preparation of financial statements in conformity with U.S. GAAP requires management to make certain estimates and assumptions that affect the reported amounts of assets and liabilities and disclosures of contingent assets and liabilities at the date of the financial statements and the reported amounts of revenue and expenses during the period. Actual results could differ from those estimates. The Fund is considered an investment company for financial reporting purposes under U.S. GAAP. The following is a summary of significant accounting policies consistently followed by the Fund and Subsidiary in preparation of the financial statements.
Investment Valuation: The Fund generally values its securities based on market prices determined at the close of regular trading on the New York Stock Exchange (“NYSE”), normally 4:00 p.m. Eastern Time, on each day the NYSE is open for trading.
For equity securities and mutual funds that are traded on an exchange, the market price is usually the closing sale or official closing price on that exchange. In the case of equity securities not traded on an exchange, or if such closing prices are not otherwise available, the securities are valued at the mean of the most recent bid and ask prices on such day. Redeemable securities issued by open‐end registered investment companies are valued at the investment company’s applicable net asset value, with the exception of exchange‐traded open‐end investment companies, which are priced as equity securities.
The market price for debt obligations is generally the price supplied by an independent third‐party pricing service approved by the Board of Trustees (the “Board”), which may use a matrix, formula or other objective method that takes into consideration quotations from dealers, market transactions in comparable investments, market indices and yield curves. If vendors are unable to supply a price, or if the price supplied is deemed to be unreliable, the market price may be determined using quotations received from one or more brokers–dealers that make a market in the security. Municipal securities having a remaining maturity of greater than 60 days, are typically valued at the evaluated bid price formulated by an independent pricing service. Corporate Bonds, U.S. Government & Agency, and U.S. Treasury Bonds & Notes are valued using market models that consider trade data, quotations from dealers and active market makers, relevant yield curve and spread data, creditworthiness, trade data or market information on comparable securities, and other relevant security specific information. Mortgage‐related and asset‐backed securities are valued based on models that consider trade data, prepayment and default projections, benchmark yield and spread data and estimated cash flows of each tranche of the issuer. Publicly traded foreign government debt securities are typically traded internationally in the over‐the‐counter market and are valued at the mean between the bid and asked prices as of the close of business of that market.
| Redmont Resolute Fund | Notes to Consolidated Financial Statements |
Futures contracts that are listed or traded on a national securities exchange, commodities exchange, contract market or comparable over the counter market, and that are freely transferrable, are valued at their closing settlement price on the exchange on which they are primarily traded or based upon the current settlement price for a like instrument acquired on the day on which the instrument is being valued. A settlement price may not be used if the market makes a limit move with respect to a particular commodity. Over‐the‐counter swap contracts for which market quotations are readily available are valued based on quotes received from independent pricing services or one or more dealers that make markets in such securities. Options contracts listed for trading on a securities exchange or board of trade are valued at the last quoted sales price or, in the absence of a sale at the mean of the last bid and asked price.
Forward currency exchange contracts have a fair value determined by the current foreign currency exchange forward rates. The foreign currency exchange forward rates are calculated using an automated system that estimates rates on the basis of the current day foreign currency exchange rates and forward foreign currency exchange rates supplied by a pricing service. Foreign exchange rates and forward foreign currency exchange rates may generally be obtained at the close of the NYSE, normally 4:00 p.m. Eastern Time.
When such prices or quotations are not available, or when Highland Associates, Inc. (the “Adviser”) believes that they are unreliable, securities may be priced using fair value procedures approved by the Board.
Fair Value Measurements: The Fund discloses the classification of its fair value measurements following a three‐tier hierarchy based on the inputs used to measure fair value. Inputs refer broadly to the assumptions that market participants would use in pricing the asset or liability, including assumptions about risk. Inputs may be observable or unobservable. Observable inputs reflect the assumptions market participants would use in pricing the asset or liability that are developed based on market data obtained from sources independent of the reporting entity. Unobservable inputs reflect the reporting entity’s own assumptions about the assumptions market participants would use in pricing the asset or liability that are developed based on the best information available.
Various inputs are used in determining the value of the Fund’s investments as of the end of the reporting period. When inputs used fall into different levels of the fair value hierarchy, the level in the hierarchy within which the fair value measurement falls is determined based on the lowest level input that is significant to the fair value measurement in its entirety. The designated input levels are not necessarily an indication of the risk or liquidity associated with these investments. These inputs are categorized in the following hierarchy under applicable financial accounting standards:
| Level 1 – | Unadjusted quoted prices in active markets for identical investments, unrestricted assets or liabilities that the Fund has the ability to access at the measurement date; |
| Level 2 – | Quoted prices which are not active, quoted prices for similar assets or liabilities in active markets or inputs other than quoted prices that are observable (either directly or indirectly) for substantially the full term of the asset or liability; and |
| Level 3 – | Significant unobservable prices or inputs (including the Fund’s own assumptions in determining the fair value of investments) where there is little or no market activity for the asset or liability at the measurement date. |
| Annual Report | April 30, 2017 | 29 |
| Redmont Resolute Fund | Notes to Consolidated Financial Statements |
The following is a summary of the inputs used to value the Fund’s investments as of April 30, 2017:
Redmont Resolute Fund
| Investments in Securities at Value | | Level 1 - Quoted Prices | | | Level 2 - Other Significant Observable Inputs | | | Level 3 - Significant Unobservable Inputs | | | Total | |
| Common Stocks | | | | | | | | | | | | |
| Oil & Gas | | $ | 6,661,994 | | | $ | – | | | $ | 107,200 | | | $ | 6,769,194 | |
Other(*) | | | 70,028,155 | | | | – | | | | – | | | | 70,028,155 | |
| Limited Partnerships | | $ | 138,855 | | | $ | – | | | $ | – | | | $ | 138,855 | |
| Open‐End Mutual Funds | | | 183,964,805 | | | | – | | | | – | | | | 183,964,805 | |
| Purchased Options | | | 162,749 | | | | – | | | | – | | | | 162,749 | |
| Corporate Bonds | | | – | | | | 57,741,513 | | | | – | | | | 57,741,513 | |
| Short Term Investments Money Market Funds | | | 93,070,053 | | | | – | | | | – | | | | 93,070,053 | |
| Total | | $ | 354,026,611 | | | $ | 57,741,513 | | | $ | 107,200 | | | $ | 411,875,324 | |
| | | | | | | | | | | | | | | | | |
Other Financial Instruments** | | | | | | | | | | | | | | | | |
| Assets: | | | | | | | | | | | | | | | | |
| Total Return Swap Contracts | | $ | – | | | $ | 90,376 | | | $ | – | | | $ | 90,376 | |
| Liabilities: | | | | | | | | | | | | | | | | |
Common Stocks Sold Short(*) | | | (17,994,399 | ) | | | – | | | | – | | | | (17,994,399 | ) |
| Corporate Bonds ‐ Shold Short | | | – | | | | (9,846,552 | ) | | | – | | | | (9,846,552 | ) |
| Exchange Traded Funds Sold Short | | | (9,511,321 | ) | | | – | | | | – | | | | (9,511,321 | ) |
| Total Return Swap Contracts | | | – | | | | (694,478 | ) | | | – | | | | (694,478 | ) |
| Total | | $ | (27,505,720 | ) | | $ | (10,450,654 | ) | | $ | – | | | $ | (37,956,374 | ) |
| * | For detailed descriptions, see the accompanying Schedule of Investments. |
| ** | Other financial instruments are derivative instruments reflected in the Schedule of Investments. The derivatives shown in the table are reported at their unrealized appreciation/(depreciation) at measurement date, which represents the change in the contract’s value from trade date. |
For liabilities arising from overdrafts in the custody account, the carrying amount approximates fair value due to the relatively short‐term maturity of these financial instruments. As of April 30, 2017, the liabilities related to custody overdrafts used level 2 inputs.
The Fund recognizes transfers between levels as of the end of the period. For the year ended April 30, 2017, the Fund did not have any transfers between Level 1 and Level 2 securities. The following is a reconciliation of assets in which significant unobservable inputs (Level 3) were used in determining fair value:
| Investments in Securities at Value | | | Balance as of 4/30/2016 | | | Return of Capital | | | Realized gain/(loss) | | | Change in unrealized appreciation/ (depreciation) | | | | Purchases | | | | Sales Proceeds | | | Transfer in and/or (out)of Level 3 | | | 4/30/2017 | | | Net change in unrealized appreciation/ (depreciation)attributable to Level 3 investments held at 4/30/2017 | |
| Common Stock | | $ | ‐ | | $ | ‐ | | $ | ‐ | | $ | (37,800 | ) | | $ | 145,000 | | | $ | ‐ | | $ | ‐ | | $ | 107,200 | | $ | (37,800 | ) |
| Total | | $ | ‐ | | $ | ‐ | | $ | ‐ | | $ | (37,800 | ) | | $ | 145,000 | | | $ | ‐ | | $ | ‐ | | $ | 107,200 | | $ | (37,800 | ) |
Trust Expenses: Some expenses of the Trust can be directly attributed to the Fund. Expenses which cannot be directly attributed to the Fund are apportioned among all funds in the Trust based on average net assets of the Fund.
Offering Costs: Offering costs, including costs of printing initial prospectuses, legal and registration fees, are being amortized over twelve months from the date the Subsidiary was established. Amounts amortized during the period ended April 30, 2017 for the Fund are shown on the Statements of Operations. As of April 30, 2017, $14,865, of offering costs remain to be amortized for the Fund.
| Redmont Resolute Fund | Notes to Consolidated Financial Statements |
Federal Income Taxes: The Fund complies with the requirements under Subchapter M of the Internal Revenue Code of 1986, as amended, applicable to regulated investment companies and intend to distribute substantially all of their net taxable income and net capital gains, if any, each year so that the Fund will not be subject to excise tax on undistributed income and gains. The Fund is not subject to income taxes to the extent such distributions are made.
As of and during the year ended April 30, 2017, the Fund did not have a liability for any unrecognized tax benefits. The Fund files U.S. federal, state, and local tax returns as required. The Fund’s tax returns are subject to examination by the relevant tax authorities until expiration of the applicable statute of limitations, which is generally three years after the filing of the tax return for federal purposes and four years for most state returns. Tax returns for open years have incorporated no uncertain tax positions that require a provision for income taxes.
Investment Transactions and Investment Income: Investment transactions are accounted for on the date the investments are purchased or sold (trade date basis). Net realized gains and losses from investment transactions are reported on an identified cost basis. Interest income, which includes accretion of discounts and amortization of premiums, is accrued and recorded as earned. Dividend income is recognized on the ex‐dividend date or for certain foreign securities, as soon as information is available to the Fund. All of the realized and unrealized gains and losses and net investment income, are allocated daily to each class in proportion its average daily net assets.
Short Sales: The Fund may make short sales of securities consistent with its strategies. A short sale is a transaction in which a Fund sells a security it does not own in anticipation that the market price of that security will decline.
When a Fund makes a short sale, it must borrow the security sold short and deliver it to the broker dealer through which it made the short sale as collateral for its obligation to deliver the security upon conclusion of the sale. The Fund may have to pay a fee to borrow particular securities and is often obligated to pay over any accrued interest and dividends on such borrowed securities.
If the price of the security sold short increases between the time of the short sale and the time that a Fund replaces the borrowed security, the Fund will incur a loss; conversely, if the price declines, the Fund will realize a capital gain. Any gain will be decreased, and any loss increased, by the transaction costs described above. The successful use of short selling may be adversely affected by imperfect correlation between movements in the price of the security sold short and the securities being hedged.
To the extent that a Fund engages in short sales, it will provide collateral to the broker‐dealer and (except in the case of short sales “against the box”) will maintain additional asset coverage in the form of segregated or “earmarked” assets determined to be liquid in accordance with procedures established by the Board and that is equal to the current market value of the securities sold short, or will ensure that such positions are covered by “offsetting” positions, until the Fund replaces the borrowed security. A short sale is “against the box” to the extent that the Fund contemporaneously owns, or has the right to obtain at no added cost, securities identical to those sold short. The Fund may engage in short selling to the extent permitted by the federal securities laws and rules and interpretations thereunder. To the extent a Fund engages in short selling in foreign (non‐U.S.) jurisdictions, the Fund will do so to the extent permitted by the laws and regulations of such jurisdiction.
Distributions to Shareholders: The Fund normally pays dividends and distributes capital gains, if any, on an annual basis. Income dividend distributions are derived from interest and dividends and other income the Fund receives from their investments, including distributions of short term capital gains. Capital gain distributions are derived from gains realized when the Fund sells a security it has owned for more than a year. The Fund may make additional distributions and dividends at other times if its portfolio manager or managers believe doing so may be necessary for the Fund to avoid or reduce taxes.
3. DERIVATIVE INSTRUMENTS
Swap Contracts: The Fund may enter into swap transactions for hedging purposes or to seek to increase total return. At the present time, the Fund primarily enters into swap transactions for the purpose of increasing total return. Risks may arise as a result of the failure of the counterparty to the swap contract to comply with the terms of the swap contract. The loss incurred by the failure of a counterparty is generally limited to the net payment to be received by the Fund and/or the termination value at the end of the contract.
Therefore, the Fund considers the creditworthiness of each counterparty to a contract in evaluating potential credit risk. Additionally, risks may arise from unanticipated movements in interest rates or in the value of the underlying reference asset or index. Entering into these agreements involves, to varying degrees, market risk, liquidity risk and elements of credit, legal and documentation risk that are not directly reflected in the amounts recognized in the Statements of Assets and Liabilities.
The Fund invests in total return swaps to obtain exposure to a security or market without owning such security or investing directly in that market or to transfer the risk/return of one market (e.g., fixed income) to another market (e.g., equity) (equity risk and/or interest rate risk). Total return swaps are agreements in which there is an exchange of cash flows whereby one party commits to make payments based on the total return (coupons plus capital gains/losses) of an underlying instrument in exchange for fixed or floating rate interest payments. To the extent the total return of the instrument or index underlying the transaction exceeds or falls short of the offsetting interest rate obligation, the Fund will receive a payment from or make a payment to the counterparty. The Fund may pay or receive cash as collateral on these contracts which may be recorded as an asset and/or liability. The Fund must set aside liquid assets, or engage in other appropriate measures, to cover its obligations under these contracts. Swaps are marked to market daily using either pricing vendor quotations, counterparty prices or model prices and the change in value, if any, is recorded as an unrealized gain or loss. Upfront payments made and/or received by the Fund are recorded as an asset and/or liability and realized gains or losses are recognized ratably over the contract’s term/event, with the exception of forward starting interest rate swaps, whose realized gains or losses are recognized ratably from the effective start date. Periodic payments received or made on swap contracts are recorded as realized gains or losses. Gains or losses are realized upon termination of a swap contract and are recorded on the Statement of Operations. Swap agreements held at April 30, 2017 are disclosed in the Schedule of Investments.
| Annual Report | April 30, 2017 | 31 |
| Redmont Resolute Fund | Notes to Consolidated Financial Statements |
International Swaps and Derivatives Association, Inc. Master Agreements (“ISDA Master Agreements”) govern OTC financial derivative transactions entered into by the Fund and those counterparties. The ISDA Master Agreements maintain provisions for general obligations, representations, agreements, collateral and events of default or termination. Events of termination include conditions that may entitle counterparties to elect to terminate early and cause settlement of all outstanding transactions under the applicable ISDA Master Agreement. Any election to early terminate could be material to the financial statements.
Option Contracts: The Fund may enter into options transactions for hedging purposes and for non‐hedging purposes such as seeking to enhance return. The Fund may write covered put and call options on any stocks or stock indices, currencies traded on domestic and foreign securities exchanges, or futures contracts on stock indices, interest rates and currencies traded on domestic and, to the extent permitted by the CFTC, foreign exchanges. A call option on an asset written by a Fund obligates the Fund to sell the specified asset to the holder (purchaser) at a stated price (the exercise price) if the option is exercised before a specified date (the expiration date). A put option on an asset written by a Fund obligates the Fund to buy the specified asset from the purchaser at the exercise price if the option is exercised before the expiration date. Premiums received when writing options are recorded as liabilities and are subsequently adjusted to the current value of the options written. Premiums received from writing options that expire are treated as realized gains. Premiums received from writing options, which are either exercised or closed, are offset against the proceeds received or amount paid on the transaction to determine realized gains or losses which are recorded on the Statement of Operations.
Written option activity for the year ended April 30, 2017 was as follows:
Redmont Resolute Fund
| | | Written Call Options | |
| | | Contracts | | | | Premiums | |
| Outstanding, April 30, 2016 | | | (281 | ) | | | $ | 135,671 | |
| Written | | | (77 | ) | | | | 32,366 | |
| Covered | | | 62 | | | | | (19,478 | ) |
| Exercised | | | 225 | | | | | (120,003 | ) |
| Expired | | | 71 | | | | | (28,556 | ) |
| Outstanding, April 30, 2017 | | | ‐ | | | | $ | ‐ | |
Futures: The Fund may enter into futures contracts for hedging purposes. A futures contract represents a commitment for the future purchase or sale of an asset at a specified price on a specified date. Upon entering into a futures contract, the Fund is required to deposit an initial margin with the broker in an amount equal to a certain percentage of the contract amount. The Fund receives from or pays to the broker, on a daily basis, an amount of cash equal to the daily fluctuation in value of the contract. Such receipts or payments are known as “variation margin,” and are recorded by the Fund as unrealized gains or losses. When the futures contract is closed, the Fund records a gain or loss equal to the difference between the value of the contract at the time it was opened and the value at the time it was closed.
A Fund’s potential losses from the use of futures extend beyond its initial investment in such contracts. The use of futures contracts involves, to varying degrees, elements of market risk in excess of the amount recognized in the Statements of Assets and Liabilities. The predominant risk is that the movement of a futures contract’s price may result in a loss, which could render a Fund’s hedging strategy unsuccessful. There is minimal counterparty credit risk since futures contracts are exchange traded and the exchange’s clearinghouse, as counterparty to all exchange traded futures, guarantees the futures against default.
| Redmont Resolute Fund | Notes to Consolidated Financial Statements |
Risk Exposure: The following tables disclose the amounts related to the Fund’s use of derivative instruments.
The effect of derivatives instruments on the Statements of Assets and Liabilities as of April 30, 2017 was as follows:
| Risk Exposure | Asset Derivatives Statements of Assets and Liabilities Location | | Fair Value | | | Liability Derivatives Statements of Assets and Liabilities Location | | | Fair Value | |
| Redmont Resolute Fund | | | | | | | | | | |
| Equity Contracts (Total Return Swap Contracts) | Unrealized appreciation on total return swap contracts | | $ | 90,376 | | | Unrealized depreciation on total return swap contracts | | | $ | 495,406 | |
| Interest Rate Contracts (Total Return Swap Contracts) | Unrealized appreciation on total return swap contracts | | | – | | | Unrealized depreciation on total return swap contracts | | | | 199,072 | |
| Equity Contracts (Purchased Options) | Investments, at value | | | 162,749 | | | N/A | | | | N/A | |
| Total | | | $ | 253,125 | | | | | | $ | 694,478 | |
The effect of derivatives instruments on the Statements of Operations for the year ended April 30, 2017 was as follows:
| Risk Exposure | Statement of Operations Location | | Realized Gain/ (Loss) on Derivatives Recognized in Income | | | Change in Unrealized Appreciation/ (Depreciation) on Derivatives Recognized in Income | |
| Redmont Resolute Fund | | | | | | | |
| Equity Contracts (Total Return Swap Contracts) | Net realized gain on total return swap contracts/Net change in unrealized depreciation on total return swap contracts | | $ | 8,774,543 | | | $ | (1,111,977 | ) |
| Interest Rate Contracts (Total Return Swap Contracts) | Net realized gain on total return swap contracts/Net change in unrealized depreciation on total return swap contracts | | | (275,401 | ) | | | (199,072 | ) |
| Equity Contracts (Purchased Options) | Net realized loss on investments/Net change in unrealized depreciation on investments | | | (374,371 | ) | | | (78,980 | ) |
| Equity Contracts (Written Options) | Net realized gain on written options/Net change in unrealized appreciation on written options | | | 31,511 | | | | 217,149 | |
| Foreign Currency Contracts (Forward Currency Contracts) | Net realized loss on foreign currency transactions/Net change in unrealized appreciation on translation of assets and liabilities in foreign currency transactions | | | (828,586 | ) | | | 1,034,399 | |
| Futures Contracts* | Net realized gain on futures contracts/Net change in unrealized depreciation on futures contracts | | | 539,124 | | | | (56,806 | ) |
| Total | | | $ | 7,866,820 | | | $ | (195,287 | ) |
| | | | | | | | | | |
| | *Risk Exposure to Fund | | | | | | | | |
| | Commodity Contracts | | $ | 161,987 | | | $ | (107,121 | ) |
| | Equity Contracts | | | 153,312 | | | | 108,598 | |
| | Interest Rate Contracts | | | 223,825 | | | | (58,283 | ) |
| | | | $ | 539,124 | | | $ | (56,806 | ) |
| Annual Report | April 30, 2017 | 33 |
| Redmont Resolute Fund | Notes to Consolidated Financial Statements |
Volume of Derivative Instruments for the Fund during the year ended April 30, 2017 was as follows:
| Derivative Type | Unit of Measurement | Monthly Average |
| Redmont Resolute Fund | | |
| Total Return Swap Contracts | Notional Quantity | 521,478 |
| Forward Currency Contracts | Notional Quantity | 265,757,175 |
| Futures Contracts | Contracts | 302 |
| Written Option Contracts | Contracts | 56 |
| Purchased Options Contracts | Contracts | 83 |
Certain derivative contracts and repurchase agreements are executed under either standardized netting agreements or, for exchange‐traded derivatives, the relevant contracts for a particular exchange which contain enforceable netting provisions. A derivative netting arrangement creates an enforceable right of set‐off that becomes effective, and affects the realization of settlement on individual assets, liabilities and collateral amounts, only following a specified event of default or early termination. Default events may include the failure to make payments or deliver securities timely, material adverse changes in financial condition or insolvency, the breach of minimum regulatory capital requirements, or loss of license, charter or other legal authorization necessary to perform under the contract.
The following table presents financial instruments that are subject to enforceable netting arrangements or other similar agreements as of April 30, 2017:
Redmont Resolute Fund
Offsetting of Derivatives Assets
| | | | | | | | | | | | Gross Amounts Not Offset in the Statement of Assets and Liabilities | |
| | | Gross Amounts of Recognized Assets | | | Gross Amounts Offset in the Statement of Assets and Liabilities | | | Net Amounts Presented in the Statement of Assets and Liabilities | | | Financial Instruments Available for Offset(a) | | | Cash Collateral Received(a) | | | Net Receivable Amount | |
| Total Return Swap Contracts | | $ | 90,376 | | | $ | – | | | $ | 90,376 | | | $ | (90,376 | ) | | $ | – | | | $ | – | |
| Total | | $ | 90,376 | | | $ | – | | | $ | 90,376 | | | $ | (90,376 | ) | | $ | – | | | $ | – | |
Redmont Resolute Fund
Offsetting of Derivatives Liabilities
| | | | | | | | | | | | Gross Amounts Not Offset in the Statement of Assets and Liabilities | |
| | | Gross Amounts of Recognized Liabilities | | | Gross Amounts Offset in the Statement of Financial Position | | | Net Amounts Presented in the Statement of Financial Position | | | Financial Instruments Available for Offset (a) | | | P Cash Collateral ledged(a) | | | Net Payable Amount | |
| Total Return Swap Contracts | | $ | 694,478 | | | $ | – | | | $ | 694,478 | | | $ | (90,376 | ) | | $ | (604,102 | ) | | $ | – | |
| Total | | $ | 694,478 | | | $ | – | | | $ | 694,478 | | | $ | (90,376 | ) | | $ | (604,102 | ) | | $ | – | |
(a) | These amounts are limited to the derivative asset/liability balance and, accordingly, do not include excess collateral received/pledged. |
| Redmont Resolute Fund | Notes to Consolidated Financial Statements |
April 30, 20174. TAX BASIS INFORMATION
Reclassifications: As of April 30, 2017, permanent differences in book and tax accounting were reclassified. These differences had no effect on net assets and were primarily attributed to differing book and tax treatment of investments in swaps and foreign currency. The reclassifications were as follows:
| | | Undistributed Net Investment Income/(Loss) | | | Accumulated Net Realized Gain/(Loss) on Investments | | | Paid-in Capital | |
| Redmont Resolute Fund | | $ | 13,196,961 | | | $ | (12,405,711 | ) | | $ | (791,250 | ) |
Tax Basis of Investments: As of April 30, 2017, the aggregate cost of investments, gross unrealized appreciation/(depreciation) and net unrealized appreciation for Federal tax purposes were as follows:
| | | Gross Appreciation (excess of value over tax cost) | | | Gross Depreciation (excess of tax cost over value) | | | Net Depreciation of Derivatives and Foreign Currency | | | Net Unrealized Appreciation | | | Cost of Investments for Income Tax Purposes | |
| Redmont Resolute Fund | | $ | 13,998,073 | | | $ | (3,179,331 | ) | | $ | (2,182,387 | ) | | $ | 8,636,355 | | | $ | 401,056,582 | |
Components of Earnings: As of April 30, 2017, components of distributable earnings were as follows:
| | | Accumulated Capital Gains | | | Undistributed Ordinary Income | | | Net Unrealized Appreciation | | | Other Cumulative Effect of Timing Differences | |
| Redmont Resolute Fund | | $ | 6,351,790 | | | $ | 10,359,784 | | | $ | 8,636,355 | | | $ | 644,470 | |
Tax Basis of Distributions to Shareholders: The character of distributions made during the year from net investment income or net realized gains may differ from its ultimate characterization for federal income tax purposes. Also, due to the timing of dividend distributions, the fiscal year in which amounts are distributed may differ from the fiscal year in which the income or realized gain were recorded by the Fund.
The tax character of distributions paid by the Fund for the fiscal year ended April 30, 2017, were as follows:
| | | Ordinary Income | | Long-Term Capital Gains | |
| Redmont Resolute Fund | | $ | 6,470,084 | | | $ | 778,253 | |
The tax character of distributions paid by the Fund for the fiscal year ended April 30, 2016, were as follows:
| | | Ordinary Income | | Long-Term Capital Gains | |
| Redmont Resolute Fund | | $ | 11,135,675 | | | $ | 10,214,481 | |
5. SECURITIES TRANSACTIONS
Purchases and sales of securities, excluding short‐term securities and U.S. Government Obligations during the year ended April 30, 2017 were as follows:
| Fund | | Purchases of Securities | | | Proceeds From Sales of Securities | |
| Redmont Resolute Fund | | $ | 392,244,409 | | | $ | 643,687,057 | |
Purchases and sales of U.S. Government Obligations during the year ended April 30, 2017 were as follows:
| Fund | | Purchases of Securities | | | Proceeds From Sales of Securities | |
| Redmont Resolute Fund | | $ | 15,679,295 | | | $ | 20,620,127 | |
| Annual Report | April 30, 2017 | 35 |
| Redmont Resolute Fund | Notes to Consolidated Financial Statements |
6. BENEFICIAL SHARE TRANSACTIONS
The capitalization of the Trust consists of an unlimited number of shares of beneficial interest with no par value per share. Holders of the shares of the Fund of the Trust have one vote for each share held and a proportionate fraction of a vote for each fractional share. All shares issued and outstanding are fully paid and are transferable and redeemable at the option of the shareholder. Purchasers of the shares do not have any obligation to make payments to the Trust or its creditors solely by reason of the purchasers’ ownership of the shares. Shares have no pre‐emptive rights.
Transactions in common shares were as follows:
Redmont Resolute Fund
| Class I: | | For the Year Ended April 30, 2017 | | | For the Year Ended April 30, 2016 | |
| Common Shares Outstanding ‐ Beginning of Period | | | 63,881,394 | | | | 60,903,896 | |
| Common Shares Sold | | | 12,752,236 | | | | 4,465,406 | |
| Common Shares Issued as Reinvestment of Dividends | | | 666,208 | | | | 1,981,722 | |
| Common Shares Redeemed | | | (33,154,804 | ) | | | (3,469,630 | ) |
| Common Shares Outstanding ‐ End of Period | | | 44,145,034 | | | | 63,881,394 | |
Shares redeemed within 30 days of purchase may incur a 2% short‐term redemption fee deducted from the redemption amount. Redemption fees are reflected in the “Shares redeemed, net of redemption fees” in the Statements of Changes in Net Assets. For the year ended April 30, 2017 and the year ended April 30, 2016, the Fund retained fees as follows:
| Fund | | For the Year Ended April 30, 2017 | | | For the Year Ended April 30, 2016 | |
| Redmont Resolute Fund | | $ | – | | | $ | – | |
7. MANAGEMENT AND RELATED PARTY TRANSACTIONS
Investment Advisory
The Adviser, subject to the authority of the Board, is responsible for the overall management and administration of the Fund’s business affairs. Pursuant to the Investment Advisory Agreement (the “Advisory Agreement”), the Adviser is entitled to an investment advisory fee, computed daily and payable monthly of 1.50% of the average daily net assets for the Fund. The management fee is paid on a monthly basis.
The Subsidiary has entered into a separate advisory agreement (the “Subsidiary Advisory Agreement”) with the Adviser for the management of the Subsidiary’s portfolio pursuant to which the Subsidiary is obligated to pay the Adviser a management fee at the same rate that the Fund pays the Adviser for investment advisory services provided to the Fund. The Adviser has agreed to waive the advisory fee it receives from the Fund in an amount equal to the management fee paid by the Subsidiary. This waiver may not be terminated or modified without the consent of the Board. This agreement may not be terminated or modified prior to this date except with the approval of the Board. For the period ended April 30, 2017, this amount equaled $234,205 and is disclosed in the Consolidated Statement of Operations.
The Adviser entered into an Investment Sub‐Advisory Agreement with Boston Partners, Pinebridge Investments LLC (“Pinebridge”), Incline Global Management, LLC. (“Incline”) and Chatham Asset Management, LLC (“Chatham”). The Investment Sub‐Advisory Agreements are in accordance with the Fund’s investment objective, policies and limitations and investment guidelines established jointly by the Adviser and the Board. The Adviser determines the allocation of the Fund’s assets among Boston Partners, Pinebridge, Incline and Chatham (collectively the “Sub‐Advisers”) and other open‐end investment companies. The Fund is not required to invest with any minimum number of sub‐advisers or open‐end investment companies, and does not have minimum or maximum limitations with respect to allocations of assets to the Sub‐Advisers, investment strategy or market sector. Highland may change the allocation of the Fund’s assets among the available investment options, and may add or remove sub‐advisers, at any time. Each Sub‐Adviser is responsible for the day‐to‐day management of its allocated portion of Fund assets. Highland has ultimate responsibility, subject to the oversight of the Board of the Fund, to oversee the Sub‐Advisers, and to recommend their hiring, termination and replacement.
| Redmont Resolute Fund | Notes to Consolidated Financial Statements |
Pursuant to each Investment Sub‐Advisory Agreement, the Adviser pays the Sub‐Advisers an annual sub‐advisory management fee which is based on the Fund’s average quarterly market value of the assets managed by the Sub‐Advisers. The Adviser is required to pay all fees due to Sub‐Advisers out of the management fee the Adviser receives from the Fund. The following table reflects the Fund’s contractual sub‐advisory fee rates.
| Sub-Advisers | Average Daily Market Value of the Fund | Contractual Sub-Advisory Fee |
| Pinebridge Investments LLC | First $50 Million Over $50 Million | 0.55% 0.50% |
| Boston Partners | First $50 Million Over $50 Million | 1.25% 1.00% |
| Incline Global Management, LLC | | 1.25% |
| Chatham Asset Management, LLC | | 1.00% |
The Adviser has agreed, with respect to the Fund’s Class I shares, to waive the portion of its 1.50% management fee in excess of any sub‐advisory fees paid by the Adviser to Sub‐Adviser in connection with the Fund. This agreement is in effect August 31, 2013 through August 31, 2017. The Adviser may not discontinue this agreement to waive fees prior to August 31, 2017 without the approval of the Fund’s Board of Trustees. The Adviser is not permitted to recoup any amounts waived or reimbursed to the extent actual fees and expenses for a fiscal period are less than the expense limitation cap. Fees waived/reimbursed by adviser for the year ended April 30, 2017 are disclosed in the Consolidated Statement of Operations.
For the year ended April 30, 2017, the fee waivers and/or reimbursements were as follows:
| | | Fees Waived/ Reimbursed By Adviser | |
| Redmont Resolute Fund ‐ Class I | | $ | (7,367,626 | ) |
Administrator Fees and Expenses
ALPS Fund Services, Inc. (“ALPS”) serves as administrator to the Fund, and the Fund has agreed to pay expenses incurred in connection with its administrative activities. Pursuant to an Administration Agreement, ALPS provides operational services to the Fund including, but not limited to, fund accounting and fund administration and generally assists in the Fund’s operations. Officers of the Trust are employees of ALPS. The Fund’s administration fee is accrued on a daily basis and paid monthly. Administration fees paid by the Fund for the year ended April 30, 2017 are disclosed in the Consolidated Statement of Operations.
ALPS is reimbursed by the Fund for certain out‐of‐pocket expenses.
Transfer Agent
ALPS serves as transfer, dividend paying and shareholder servicing agent for the Fund. ALPS receives an annual minimum fee, a fee based upon the number of shareholder accounts and is also reimbursed by the Fund for certain out‐of‐pocket expenses. Transfer agent fees paid by the Fund for the year ended April 30, 2017 are disclosed in the Consolidated Statement of Operations.
Compliance Services
ALPS provides services that assist the Fund’s chief compliance officer in monitoring and testing the policies and procedures of the Fund in conjunction with requirements under Rule 38a‐1 under the 1940 Act and receives an annual base fee. ALPS is reimbursed for certain out‐of‐pocket expenses by the Fund. Compliance service fees paid by the Fund for the year ended April 30, 2017 are disclosed in the Consolidated Statement of Operations.
Principal Financial Officer
ALPS receives an annual fee for providing principal financial officer services to the Fund. Principal financial officer fees paid by the Fund for the year ended April 30, 2017 are disclosed in the Consolidated Statement of Operations.
Distributor
ALPS Distributors, Inc. (“ADI” or the “Distributor”) (an affiliate of ALPS) acts as the distributor of the Fund’s shares pursuant to a Distribution Agreement with the Trust on behalf of the Fund. Shares are sold on a continuous basis by ADI as agent for the Fund, and ADI has agreed to use its best efforts to solicit orders for the sale of Fund’s shares, although it is not obliged to sell any particular amount of shares. ADI is not entitled to any compensation for its services as Distributor. ADI is registered as a broker‐dealer with the U.S. Securities and Exchange Commission.
| Annual Report | April 30, 2017 | 37 |
| Redmont Resolute Fund | Notes to Consolidated Financial Statements |
8. INDEMNIFICATIONS
Under the Trust’s organizational documents, its officers and Trustees are indemnified against certain liability arising out of the performance of their duties to the Trust. Additionally, in the normal course of business, the Trust enters into contracts with service providers that may contain general indemnification clauses which may permit indemnification to the extent permissible under applicable law. The Trust’s maximum exposure under these arrangements is unknown, as this would involve future claims that may be made against the Trust that have not yet occurred.
9. RECENT ACCOUNTING PRONOUNCEMENT
On October 13, 2016, the SEC amended Regulation S‐X, which will require standardized, enhanced disclosure about derivatives in investment company financial statements, as well as other amendments. The compliance date for the amendments to Regulation S‐X is August 1, 2017. Management is currently evaluating the impact to the financial statements and disclosures.
| Redmont Resolute Fund | Report of Independent Registered Accounting Firm |
To the Shareholders and Board of Trustees of Financial Investors Trust:
We have audited the accompanying consolidated statement of assets and liabilities, including the consolidated schedule of investments, of Redmont Resolute Fund and subsidiary (formerly, the Redmont Resolute Fund II) (the “Fund”), one of the portfolios constituting Financial Investors Trust, as of April 30, 2017, and the related consolidated statement of operations for the year then ended, the consolidated statements of changes in net assets for each of the two years in the period then ended, and the consolidated financial highlights for each of the five years in the period then ended. These financial statements and financial highlights are the responsibility of the Fund’s management. Our responsibility is to express an opinion on these financial statements and financial highlights based on our audits.
We conducted our audits in accordance with the standards of the Public Company Accounting Oversight Board (United States). Those standards require that we plan and perform the audit to obtain reasonable assurance about whether the financial statements and financial highlights are free of material misstatement. The Fund is not required to have, nor were we engaged to perform, an audit of its internal control over financial reporting. Our audits included consideration of internal control over financial reporting as a basis for designing audit procedures that are appropriate in the circumstances, but not for the purpose of expressing an opinion on the effectiveness of the Fund’s internal control over financial reporting. Accordingly, we express no such opinion. An audit also includes examining, on a test basis, evidence supporting the amounts and disclosures in the financial statements, assessing the accounting principles used and significant estimates made by management, as well as evaluating the overall financial statement presentation. Our procedures included confirmation of securities owned as of April 30, 2017, by correspondence with the custodian and brokers; when replies were not received from brokers, we performed other auditing procedures. We believe that our audits provide a reasonable basis for our opinion.
In our opinion, the consolidated financial statements and financial highlights referred to above present fairly, in all material respects, the financial position of Redmont Resolute Fund and subsidiary of Financial Investors Trust as of April 30, 2017, the results of its operations for the year then ended, the changes in its net assets for each of the two years in the period then ended, and the financial highlights for each of the five years in the period then ended, in conformity with accounting principles generally accepted in the United States of America.
DELOITTE & TOUCHE LLP
Denver, Colorado
June 27, 2017
| Annual Report | April 30, 2017 | 39 |
| Redmont Resolute Fund | Disclosure Regarding Approval of Fund Advisory Agreements |
April 30, 2017 (Unaudited)
On December 13, 2016, the Trustees met in person to discuss, among other things, the approval of the Investment Advisory Agreement between the Trust and the Adviser (the “Investment Advisory Agreement”), the Investment Sub-Advisory Agreement among the Trust, the Adviser, and Robeco Investment Management, Inc. (“Robeco”) and the Investment Sub-Advisory Agreement among the Trust, the Adviser, and PineBridge Investments LLC (“PineBridge”), in accordance with Section 15(c) of the 1940 Act. In renewing and approving the Investment Advisory Agreement with the Adviser and the Investment Sub-Advisory Agreements with each of Robeco and PineBridge, the Trustees, including the Independent Trustees, considered the following factors with respect to the Fund:
Investment Advisory and Sub-Advisory Fee Rate: The Trustees reviewed and considered the contractual annual advisory fee paid by the Trust, on behalf of the Fund, to the Adviser of 1.50% of the Fund’s daily average net assets, in light of the extent and quality of the advisory services provided by the Adviser to the Fund. The Trustees also reviewed and considered the contractual sub-advisory fee rates paid by the Adviser to Robeco of 1.25% of the Fund’s daily average net assets allocated to Robeco for the first $50 million, and 1.00% of the Fund’s daily average net assets allocated to Robeco above $50 million, in light of the extent and quality of the advisory services provided by Robeco to the Fund. The Trustees also reviewed and considered the contractual annual sub-advisory fee paid by the Adviser to PineBridge of 0.55% of the Fund’s daily average net assets allocated to PineBridge for the first $50 million, and 0.50% of the balance of each of the Fund’s daily average net assets allocated to PineBridge above $50 million, in light of the extent and quality of the advisory services provided by it to the Fund.
The Board received and considered information including a comparison of the Fund’s contractual and actual advisory fees and overall expenses with those of funds in the peer group and universe of funds provided by an independent provider of investment company data (the “Data Provider”). The Trustees noted that the Fund’s contractual advisory fee rate was above its Data Provider peer group median contractual advisory fee rate.
Total Expense Ratios: Based on such information, the Trustees further reviewed and considered the total expense ratio (after waivers) of 0.53% for the Fund. The Trustees noted that the total expense ratio (after waivers) for the Fund was below the Data Provider peer group median total expense ratio (after waivers).
Nature, Extent, and Quality of the Services under the Investment Advisory and Investment Sub-Advisory Agreements: The Trustees received and considered information regarding the nature, extent, and quality of services to be provided to the Fund under the Investment Advisory Agreement with the Adviser and the Investment Sub-Advisory Agreements with Robeco and PineBridge. The Trustees reviewed certain background materials supplied by the Adviser, Robeco, and PineBridge in their presentations, including their Forms ADV.
The Trustees reviewed and considered the Adviser’s, Robeco’s, and PineBridge’s investment advisory personnel, their history as asset managers and their performance and the amount of assets currently under management by the Adviser, Robeco, and PineBridge and their affiliated entities. The Trustees also reviewed the research and decision-making processes utilized by the Adviser, Robeco, and PineBridge, including the methods adopted to seek to achieve compliance with the investment objectives, policies, and restrictions of the Fund.
The Trustees considered the background and experience of the Adviser’s, Robeco’s, and PineBridge’s management in connection with the Fund, including reviewing the qualifications, backgrounds, and responsibilities of the management team primarily responsible for the day-to-day portfolio management of the Fund and the extent of the resources devoted to research and analysis of actual and potential investments.
The Trustees also reviewed, among other things, the Adviser’s, Robeco’s, and PineBridge’s insider trading policies and procedures and their Codes of Ethics.
Performance: The Trustees reviewed performance information for the Fund for the 3-month, 1-year, and 3-year periods ended September 30, 2016. That review included a comparison of the Fund’s performance to the performance of a group of comparable funds selected by the Data Provider. The Trustees noted that the performance of the Fund was above its Data Provider peer group median for each period. The Trustees also considered the Adviser’s, Robeco’s, and PineBridge’s discussion of the Fund’s underlying portfolio diversification categories, its top contributors and top detractors, as well as the Adviser’s, Robeco’s, and PineBridge’s performance and reputation generally and their investment techniques, risk management controls, and decision-making processes.
Comparable Accounts: The Trustees noted certain information provided by the Adviser, Robeco, and PineBridge regarding fees charged to its other clients utilizing a strategy similar to that employed by the Fund.
Profitability: The Trustees received and considered retrospective and projected profitability analyses prepared by the Adviser, Robeco, and PineBridge based on the fees payable under the Investment Advisory Agreement with the Adviser and the Investment Sub-Advisory Agreements with Robeco and PineBridge, with respect to the Fund. The Trustees considered the profits, if any, anticipated to be realized by the Adviser, Robeco, and PineBridge in connection with the operation of the Fund. The Board then reviewed the Adviser’s unaudited balance sheet as of September 30, 2016 and Profit and Loss for October 2015 through September 2016 in order to analyze the financial condition and stability and profitability of the Adviser. The Board also reviewed Robeco’s financial statements for the years ended December 31, 2015 and 2014 and PineBridge’s financial statements for the year ended December 31, 2015 in order to analyze the financial condition and stability and profitability of Robeco and PineBridge.
| Redmont Resolute Fund | Disclosure Regarding Approval of Fund Advisory Agreements |
April 30, 2017 (Unaudited)
Economies of Scale: The Trustees considered whether economies of scale in the provision of services to the Fund will be passed along to the shareholders under the agreements.
Other Benefits to the Adviser: The Trustees reviewed and considered any other incidental benefits derived or to be derived by the Adviser from its relationship with the Fund, including whether soft dollar arrangements were used.
In renewing the Adviser as the investment adviser of the Fund, Robeco and PineBridge as sub-advisers of the Fund, and the fees charged under the Investment Advisory Agreement with the Adviser and Investment Sub-Advisory Agreements with Robeco and PineBridge, the Trustees concluded that no single factor reviewed by the Trustees was identified by the Trustees to be determinative as the principal factor in whether to renew the Investment Advisory and Investment Sub-Advisory Agreements. Further, the Independent Trustees were advised by separate independent legal counsel throughout the process. The Trustees, including all of the Independent Trustees, concluded that:
| ● | the contractual advisory fee rate was above the Data Provider peer group median for the Fund; |
| ● | Robeco’s and PineBridge’s fees under their respective sub-advisory agreements are paid directly by the Adviser; |
| ● | the total expense ratio (after waivers) for the Fund was below the Data Provider peer group median total expense ratio (after waivers); |
| ● | the nature, extent, and quality of services rendered by the Adviser, Robeco, and PineBridge under the Investment Advisory and Investment Sub-Advisory Agreements, respectively, with respect to the Fund were adequate; |
| ● | the performance of the Fund was above its Data Provider peer group median for the 3-month, 1-year, and 3-year periods ended September 30, 2016; |
| ● | bearing in mind the limitations of comparing different types of managed accounts and the different levels of service typically associated with such accounts, the fee structures applicable to the Adviser’s, Robeco’s, and PineBridge’s other clients employing a comparable strategy to the Fund were not indicative of any unreasonableness with respect to the advisory and sub-advisory fees payable by the Fund; |
| ● | the profit, if any, realized by the Adviser, Robeco, and PineBridge in connection with the operation of the Fund is not unreasonable to the Fund; and |
| ● | there were no material economies of scale or other incidental benefits accruing to the Adviser, Robeco, and PineBridge in connection with their relationship with the Fund. |
Based on the Trustees’ deliberations and their evaluation of the information described above, the Trustees, including all of the Independent Trustees, concluded that the Adviser’s, Robeco’s, and PineBridge’s compensation for investment advisory and sub-advisory services is consistent with the best interests of the Fund and its shareholders.
On December 13, 2016, the Trustees met in person to discuss, among other things, the approval of a new Investment Sub-Advisory Agreement among the Trust, the Adviser, and Chatham Asset Management, LLC (“Chatham”), in accordance with Section 15(c) of the 1940 Act. In approving the Investment Sub-Advisory Agreement with Chatham, the Trustees, including the Independent Trustees, considered the following factors with respect to the Fund:
Investment Sub-Advisory Fee Rate: The Trustees reviewed and considered the contractual annual sub-advisory fee to be paid by the Adviser, on behalf of the Fund, to Chatham of 1.00% of the Fund’s daily average net assets allocated to Chatham, in light of the extent and quality of the advisory services to be provided by Chatham to the Fund. The Board also received and considered information provided by Chatham with respect its operating expense structure.
The Board received and considered information including a comparison of the Fund’s contractual and actual advisory fees and overall expenses with those of funds in the peer group and universe of funds provided by the Data Provider. The Trustees noted that the contractual advisory fee rate for the Fund was above the Data Provider peer group median contractual advisory fee.
Total Expense Ratios: Based on such information, the Trustees further reviewed and considered the total expense ratio (after waivers) of 0.53% for the Fund. The Trustees noted that the Fund’s total expense ratio (after waivers) was below the Data Provider peer group median total expense ratio (after waivers).
Annual Report | April 30, 2017 | 41 |
| Redmont Resolute Fund | Disclosure Regarding Approval of Fund Advisory Agreements |
April 30, 2017 (Unaudited)
Nature, Extent, and Quality of the Services under the Investment Sub-Advisory Agreement: The Trustees received and considered information regarding the nature, extent, and quality of services to be provided to the Fund under the Investment Sub-Advisory Agreement with Chatham. The Trustees also reviewed certain background materials supplied by Chatham in its presentation, including its Form ADV.
The Trustees reviewed and considered Chatham’s investment sub-advisory personnel, its history as an asset manager and its performance and the amount of assets currently under management by Chatham and its affiliated entities. The Trustees also reviewed the research and decision-making processes utilized by Chatham, including the methods adopted to seek to achieve compliance with the investment objectives, policies, and restrictions of the Fund.
The Trustees considered the background and experience of Chatham’s management in connection with the Fund, including reviewing the qualifications, backgrounds, and responsibilities of the management team primarily responsible for the day-to-day portfolio management of the Fund and the extent of the resources devoted to research and analysis of actual and potential investments.
The Trustees also reviewed, among other things, Chatham’s insider trading policies and procedures and its Code of Ethics.
Performance: The Trustees noted that since Chatham had not yet begun to manage its portion of the Fund, there is no fund performance to be reviewed or analyzed at this time. The Trustees also considered the limitations on the comparability of performance information for certain related funds and accounts. The Trustees also considered Chatham’s discussion of its reputation generally and its investment techniques, risk management controls, and decision-making processes.
Comparable Accounts: The Trustees noted certain information provided by Chatham regarding fees charged to its other portfolios following an investment strategy similar to that employed for its portfolio by the Fund.
Profitability: The Trustees received and considered Chatham’s statements regarding projected profitability based on the fees payable under the Investment Sub-Advisory Agreement with Chatham. The Trustees considered the profits, if any, anticipated to be realized by Chatham with respect to the Fund. The Board then reviewed Chatham’s financial condition, stability and profitability.
Economies of Scale: The Trustees considered whether economies of scale in the provision of services to the Fund will be passed along to the shareholders under the proposed agreements.
Other Benefits to the Sub-Adviser: The Trustees reviewed and considered any other incidental benefits derived or to be derived by Chatham from its relationship with the Fund, including whether soft dollar arrangements would be used.
In approving Chatham as an investment sub-adviser for the Fund and approving the Investment Sub-Advisory Agreement with Chatham and the fees paid to Chatham by the Adviser under the Sub-Advisory Agreement, the Trustees concluded that no single factor reviewed by the Trustees was identified by the Trustees to be determinative as the principal factor in whether to approve the Investment Sub-Advisory Agreement. Further, the Independent Trustees were advised by separate independent legal counsel throughout the process. The Trustees, including all of the Independent Trustees, concluded that:
| ● | the investment sub-advisory fee to be paid to Chatham by the Adviser was fair and competitive when considered in light of particular services to be provided by Chatham to the Fund; |
| ● | the nature, extent, and quality of services to be rendered by Chatham under the Investment Sub-Advisory Agreement with respect to the Fund were adequate; |
| ● | since Chatham had not yet begun to manage its portion of the Fund, there is no fund performance to be reviewed or analyzed at this time; |
| ● | bearing in mind the limitations of comparing different types of managed accounts and the different levels of service typically associated with such accounts, the fee structures applicable to Chatham’s other clients employing a comparable strategy to the Fund were not indicative of any unreasonableness with respect to the sub-advisory fees proposed to be payable by the Adviser to Chatham; |
| ● | the profit, if any, anticipated to be realized by Chatham in connection with the operation of its portion of the Fund is not unreasonable to the Fund; and |
| ● | there were no material economies of scale or other incidental benefits accruing to Chatham in connection with its relationship with the Fund. |
Based on the Trustees’ deliberations and their evaluation of the information described above, the Trustees, including all of the Independent Trustees, concluded that Chatham’s compensation for investment sub-advisory services is consistent with the best interests of the Fund and its shareholders.
| Redmont Resolute Fund | Disclosure Regarding Approval of Fund Advisory Agreements |
April 30, 2017 (Unaudited)
On March 14, 2017, the Trustees met in person to discuss, among other things, the approval of a new Investment Sub-Advisory Agreement among the Trust, the Adviser, and Solus Alternative Asset Management LP (“Solus”), in accordance with Section 15(c) of the 1940 Act. In approving the Investment Sub-Advisory Agreement with Solus, the Trustees, including the Independent Trustees, considered the following factors with respect to the Fund:
Investment Sub-Advisory Fee Rate: The Trustees reviewed and considered the contractual annual sub-advisory fee to be paid by the Adviser, on behalf of the Fund, to Solus of 1.50% of the Fund’s daily average net assets allocated to Solus, in light of the extent and quality of the advisory services to be provided by Solus to the Fund. The Board also received and considered information provided by Solus with respect to its operating expense structure.
The Board received and considered information including a comparison of the Fund’s contractual and actual advisory fees and overall expenses with those of funds in the peer group and universe of funds provided by the Data Provider. The Trustees noted that the contractual advisory fee rate for the Fund was above the Data Provider peer group median contractual advisory fee.
Total Expense Ratios: The Trustees further reviewed and considered the total expense ratio (after waivers) of 0.70% for the Fund. The Trustees noted that the Fund’s total expense ratio (after waivers) was below the Data Provider peer group median total expense ratio (after waivers).
Nature, Extent, and Quality of the Services under the Investment Sub-Advisory Agreement: The Trustees received and considered information regarding the nature, extent, and quality of services to be provided to the Fund under the Investment Sub-Advisory Agreement with Solus. The Trustees also reviewed certain background materials supplied by Solus in its presentation, including its Form ADV.
The Trustees reviewed and considered Solus’ investment sub-advisory personnel, its history as an asset manager and its performance and the amount of assets currently under management by Solus and its affiliated entities. The Trustees also reviewed the research and decision-making processes utilized by Solus, including the methods adopted to seek to achieve compliance with the investment objectives, policies, and restrictions of the Fund.
The Trustees considered the background and experience of Solus’ management in connection with the Fund, including reviewing the qualifications, backgrounds, and responsibilities of the management team primarily responsible for the day-to-day portfolio management of the Fund and the extent of the resources devoted to research and analysis of actual and potential investments.
The Trustees also reviewed, among other things, Solus’ insider trading policies and procedures and its Code of Ethics.
Performance: The Trustees noted that since Solus had not yet begun to manage its portion of the Fund, there is no fund-related performance to be reviewed or analyzed at this time. The Trustees also considered Solus’ discussion of its reputation generally and its investment techniques, risk management controls, and decision-making processes.
Comparable Accounts: The Trustees noted certain information provided by Solus regarding fees charged to its other portfolios following an investment strategy similar to that employed for its portfolio by the Fund.
Profitability: The Trustees received and considered Solus’ statements regarding historical overall operating margins and profitability. The Board then reviewed Solus’ financial condition, stability and profitability.
Economies of Scale: The Trustees considered whether economies of scale in the provision of services to the Fund will be passed along to the shareholders under the proposed agreements.
Other Benefits to the Sub-Adviser: The Trustees reviewed and considered any other incidental benefits derived or to be derived by Solus from its relationship with the Fund, including whether soft dollar arrangements would be used.
In approving Solus as an investment sub-adviser for the Fund and approving the Investment Sub-Advisory Agreement with Solus and the fees paid to Solus by the Adviser under the Investment Sub-Advisory Agreement, the Trustees concluded that no single factor reviewed by the Trustees was identified by the Trustees to be determinative as the principal factor in whether to approve the Investment Sub-Advisory Agreement. Further, the Independent Trustees were advised by separate independent legal counsel throughout the process. The Trustees, including all of the Independent Trustees, concluded that:
| ● | the investment sub-advisory fee to be paid to Solus by the Adviser was fair and competitive when considered in light of particular services to be provided by Solus to the Fund; |
| Annual Report | April 30, 2017 | 43 |
| Redmont Resolute Fund | Disclosure Regarding Approval of Fund Advisory Agreements |
April 30, 2017 (Unaudited)
| ● | the nature, extent, and quality of services to be rendered by Solus under the Investment Sub-Advisory Agreement with respect to the Fund were adequate; |
| ● | since Solus had not yet begun to manage its portion of the Fund, there is no fund performance to be reviewed or analyzed at this time; |
| ● | bearing in mind the limitations of comparing different types of managed accounts and the different levels of service typically associated with such accounts, the fee structures applicable to Solus’ other clients employing a comparable strategy to the Fund were not indicative of any unreasonableness with respect to the sub-advisory fees proposed to be payable by the Adviser to Solus; |
| ● | bearing in mind that Solus’ investment sub-advisory fee would be paid by the Adviser and not by the Fund, the profit, if any, anticipated to be realized by Solus in connection with the operation of its portion of the Fund is not unreasonable to the Fund; and |
| ● | there were no material economies of scale or other incidental benefits accruing to Solus in connection with its relationship with the Fund. |
Based on the Trustees’ deliberations and their evaluation of the information described above, the Trustees, including all of the Independent Trustees, concluded that Solus’ compensation for investment sub-advisory services is consistent with the best interests of the Fund and its shareholders.
| Redmont Resolute Fund | Additional Information |
April 30, 2017 (Unaudited)
1. FUND HOLDINGS
The Fund files its complete schedule of portfolio holdings with the Securities and Exchange Commission (the “SEC”) for the first and third quarters of each fiscal year on Form N-Q within 60 days after the end of the period. Copies of the Fund’s Form N-Q are available without charge on the SEC website at http:// www.sec.gov. You may also review and copy the Form N-Q at the SEC’s Public Reference Room in Washington, D.C. For more information about the operation of the Public Reference Room, please call the SEC at 1-800-SEC-0330.
2. FUND PROXY VOTING POLICIES, PROCEDURES AND SUMMARIES
Fund policies and procedures used in determining how to vote proxies and information regarding how each of the Funds voted proxies relating to portfolio securities during the most recent prior 12-month period ending June 30 are available without charge, (1) upon request, by calling (toll-free) (866) 759-5679 and (2) on the SEC’s website at http://www.sec.gov.
3. TAX DESIGNATIONS
The Fund designates the following for federal income tax purposes for distributions made during the calendar year ended December 31, 2016:
| QDI | DRD |
Redmont Resolute Fund | 27.88% | 16.36% |
In early 2017, if applicable, shareholders of record received this information for the distribution paid to them by the Fund during the calendar year 2016 via Form 1099. The Fund will notify shareholders in early 2018 of amounts paid to them by the Fund, if any, during the calendar year 2017.
Pursuant to Section 852(b)(3) of the Internal Revenue Code, Redmont Resolute Fund designates $778,253 as long-term capital gain distributions.
| Annual Report | April 30, 2017 | 45 |
| Redmont Resolute Fund | Trustees & Officers |
April 30, 2017 (Unaudited)
Additional information regarding the Fund’s trustees is included in the Statement of Additional Information, which can be obtained without charge by calling 855-268-2242.
INDEPENDENT TRUSTEES
Name, Address* & Year of Birth | Position(s) Held with Fund | Term of Office** and Length of Time Served | Principal Occupation(s) During Past 5 Years*** | Number of Funds in Fund Complex Overseen by Trustee**** | Other Directorships Held by Trustee During Past 5 Years*** |
Mary K. Anstine,
1940 | Trustee
and
Chairman | Ms. Anstine was elected at a special meeting of shareholders held on March 21, 1997 and re elected at a special meeting of shareholders held on August 7, 2009. Ms. Anstine was appointed Chairman of the Board at the June 6, 2017 meeting of the Board of Trustees. | Ms. Anstine was formerly an Executive Vice President of First Interstate Bank of Denver until 1994, President/Chief Executive Officer of HealthONE Alliance, Denver, Colorado, from 1994 to 2004, and has been retired since 2004. Ms. Anstine is also Trustee/Director of AV Hunter Trust and Colorado Uplift Board. Ms. Anstine was formerly a Director of the Trust Bank of Colorado (later purchased and now known as Northern Trust Bank), HealthONE and Denver Area Council of the Boy Scouts of America, and a member of the American Bankers Association Trust Executive Committee. | 34 | Ms. Anstine is a Trustee of ALPS ETF Trust (20 funds); ALPS Variable Investment Trust (9 funds); Reaves Utility Income Fund (1 fund); and Westcore Trust (14 funds). |
Jeremy W. Deems,
1976 | Trustee | Mr. Deems was appointed as a Trustee at the March 11, 2008 meeting of the Board of Trustees and elected at a special meeting of shareholders held on August 7, 2009. | Mr. Deems is the Co-Founder, Chief Operations Officer and Chief Financial Officer of Green Alpha Advisors, LLC, a registered investment advisor, and Co-Portfolio Manager of the Shelton Green Alpha Fund. Prior to joining Green Alpha Advisors, Mr. Deems was CFO and Treasurer of Forward Management, LLC, ReFlow Management Co., LLC, ReFlow Fund, LLC, a private investment fund, and Sutton Place Management, LLC, an administrative services company, from 1998 to June 2007. From 2004 to 2005, Mr. Deems also served as Treasurer of the Forward Funds and the Sierra Club Funds. | 34 | Mr. Deems is a Trustee of ALPS ETF Trust (20 funds); ALPS Variable Investment Trust (9 funds); Clough Funds Trust (1 fund); Elevation ETF Trust (1 fund); and Reaves Utility Income Fund (1 fund). |
| Redmont Resolute Fund | Trustees & Officers |
April 30, 2017 (Unaudited)
INDEPENDENT TRUSTEES
Name, Address* & Year of Birth | Position(s) Held with Fund | Term of Office** and Length of Time Served | Principal Occupation(s) During Past 5 Years*** | Number of Funds in Fund Complex Overseen by Trustee**** | Other Directorships Held by Trustee During Past 5 Years*** |
Jerry G. Rutledge,
1944 | Trustee | Mr. Rutledge was elected at a special meeting of shareholders held on August 7, 2009. | Mr. Rutledge is the President and owner of Rutledge’s Inc., a retail clothing business. Mr. Rutledge is currently Director of the American National Bank. He was from 1994 to 2007 a Regent of the University of Colorado. | 34 | Mr. Rutledge is a Trustee of Principal Real Estate Income Fund (1 fund), Clough Global Dividend and Income Fund (1 fund), Clough Global Equity Fund (1 fund) and Clough Global Opportunities Fund (1 fund). |
Michael “Ross” Shell,
1970 | Trustee | Mr. Shell was elected at a special meeting of shareholders held on August 7, 2009. | Mr. Shell is Founder and CEO of Red Idea, LLC, a strategic consulting/early stage venture firm (since June 2008). From 1999 to 2009, he was a part-owner and Director of Tesser, Inc., a brand agency. From December 2005 to May 2008, he was Director, Marketing and Investor Relations, of Woodbourne, a REIT/real estate hedge fund and private equity firm. Prior to this, from May 2004 to November 2005, he worked as a business strategy consultant; from June 2003 to April 2004, he was on the Global Client Services team of IDEO, a product design/innovation firm; and from 1999 to 2003, he was President of Tesser, Inc. Mr. Shell graduated with honors from Stanford University with a degree in Political Science. | 34 | None. |
| Annual Report | April 30, 2017 | 47 |
| Redmont Resolute Fund | Trustees & Officers |
April 30, 2017 (Unaudited)
INTERESTED TRUSTEE
Name, Address* & Year of Birth | Position(s) Held with Fund | Term of Office** and Length of Time Served | Principal Occupation(s) During Past 5 Years*** | Number of Funds in Fund Complex Overseen by Trustee**** | Other Directorships Held by Trustee During Past 5 Years*** |
Edmund J. Burke,
1961 | Trustee and President | Mr. Burke was elected as Trustee at a special meeting of shareholders held on August 7, 2009. Mr. Burke was elected President of the Trust at the December 17, 2002 meeting of the Board of Trustees. | Mr. Burke is President and a Director of ALPS Holdings, Inc. (“AHI”) (since 2005) and Director of Boston Financial Data Services, Inc. (“BFDS”), ALPS Advisors, Inc. (“AAI”), ALPS Distributors, Inc. (“ADI”), ALPS Fund Services, Inc. (“AFS”) and ALPS Portfolio Solutions Distributor, Inc. (“APSD”) and from 2001-2008, was President of AAI, ADI, AFS and APSD. Because of his positions with AHI, BFDS, AAI, ADI, AFS and APSD, Mr. Burke is deemed an affiliate of the Trust as defined under the 1940 Act. | 34 | Mr. Burke is a Trustee of Clough Global Dividend and Income Fund (1 fund); Clough Global Equity Fund (1 fund); Clough Global Opportunities Fund (1 fund); Clough Funds Trust (1 fund); Liberty All-Star Equity Fund (1 fund); and Director of the Liberty All-Star Growth Fund, Inc. (1 fund). |
| Redmont Resolute Fund | Trustees & Officers |
April 30, 2017 (Unaudited)
OFFICERS
Name, Address* & Year of Birth | Position(s) Held with Fund | Term of Office** and Length of Time Served | Principal Occupation(s) During Past 5 Years*** |
Kimberly R. Storms,
1972 | Treasurer | Ms. Storms was elected Treasurer of the Trust at the March 12, 2013 meeting of the Board of Trustees. | Ms. Storms is Senior Vice President - Director of Fund Administration of ALPS. Because of her position with ALPS, Ms. Storms is deemed an affiliate of the Trust as defined under the 1940 Act. Ms. Storms is also Treasurer of Liberty All-Star Equity Fund, Liberty All-Star Growth Fund, Inc., ALPS Series Trust and Elevation ETF Trust. Ms. Storms also serves as a Board member and Treasurer of The Center for Trauma & Resilience, a nonprofit agency. |
Karen S. Gilomen,
1970 | Secretary | Ms. Gilomen was elected Secretary of the Trust at the December 13, 2016 meeting of the Board of Trustees. | Ms. Gilomen joined ALPS in August 2016 as Vice President and Senior Counsel. Prior to joining ALPS, Ms. Gilomen was Vice President - General Counsel & CCO of Monticello Associates, Inc. from 2010 to 2016. Because of her position with ALPS, Ms. Gilomen is deemed an affiliate of the Trust, as defined under the 1940 Act. Ms. Gilomen is also the Secretary of Oak Associates Funds and Reaves Utility Income Fund, and the Assistant Secretary of the WesMark Funds. |
| Ted Uhl, 1974 | Chief Compliance Officer (“CCO”) | Mr. Uhl was appointed CCO of the Trust at the June 8, 2010 meeting of the Board of Trustees. | Mr. Uhl joined ALPS in October 2006, and is currently Deputy Compliance Officer of ALPS. Prior to his current role, Mr. Uhl served as Senior Risk Manager for ALPS from October 2006 until June 2010. Before joining ALPS, Mr. Uhl served a Sr. Analyst with Enenbach and Associates (RIA), and a Sr. Financial Analyst at Sprint. Because of his position with ALPS, Mr. Uhl is deemed an affiliate of the Trust as defined under the 1940 Act. Mr. Uhl is also CCO of the Boulder Growth & Income Fund, Inc., Centre Funds, Elevation ETF Trust, Index Funds, Reality Shares ETF Trust and Reaves Utility Income Fund. |
Jennell Panella,
1974 | Assistant Treasurer | Ms. Panella was elected Assistant Treasurer of the Trust at the September 15, 2015 meeting of the Board of Trustees. | Ms. Panella joined ALPS in June 2012 and is currently Fund Controller of ALPS Fund Services, Inc. Prior to joining ALPS, Ms. Panella served as Financial Reporting Manager for Parker Global Strategies, LLC (2009-2012). Because of her position with ALPS, Ms. Panella is deemed an affiliate of the Trust as defined under the 1940 Act. Ms. Panella also serves as Assistant Treasurer of James Advantage Funds. |
Alan Gattis,
1980 | Assistant Treasurer | Mr. Gattis was elected Assistant Treasurer of the Trust at the September 13, 2016 meeting of the Board of Trustees. | Mr. Gattis joined ALPS in 2011 and is currently Vice President and Fund Controller of ALPS. Prior to joining ALPS, Mr. Gattis was an Auditor at Spicer Jeffries LLP (2009 through 2011) and an Auditor at PricewaterhouseCoopers LLP (2004 - 2009). Because of his position with ALPS, Mr. Gattis is deemed an affiliate of the Trust as defined under the 1940 Act. Mr. Gattis is also Assistant Treasurer of ALPS Series Trust, Clough Funds Trust, Clough Global Opportunities Fund, Clough Global Dividend and Income Fund, Clough Global Equity and Griffin Institutional Access Real Estate Fund. |
| Annual Report | April 30, 2017 | 49 |
| Redmont Resolute Fund | Trustees & Officers |
April 30, 2017 (Unaudited)
OFFICERS
Name, Address* & Year of Birth | Position(s) Held with Fund | Term of Office** and Length of Time Served | Principal Occupation(s) During Past 5 Years*** |
Sharon Akselrod, 1974 | Assistant Secretary | Ms. Akselrod was elected Assistant Secretary of the Trust at the September 15, 2015 meeting of the Board of Trustees. | Ms. Akselrod joined ALPS in August 2014 and is currently Senior Investment Company Act Paralegal of ALPS Fund Services, Inc. Prior to joining ALPS, Ms. Akselrod served as Corporate Governance and Regulatory Associate for Nordstrom fsb (2013-2014) and Senior Legal Assistant – Legal Manager for AXA Equitable Life Insurance Company (2008-2013). Because of her position with ALPS, Ms. Akselrod is deemed an affiliate of the Trust as defined under the 1940 Act. Ms. Akselrod is also Assistant Secretary of ALPS ETF Trust. |
Jennifer Craig, 1973 | Assistant Secretary | Ms. Craig was elected Assistant Secretary of the Trust at the June 8, 2016 meeting of the Board of Trustees. | Ms. Craig joined ALPS in 2007 and is currently Assistant Vice President and Paralegal Manager of ALPS. Prior to joining ALPS, Ms. Craig was Legal Manager at Janus Capital Management LLC and served as Assistant Secretary of Janus Investment Fund, Janus Adviser Series and Janus Aspen Series. Because of her position with ALPS, Ms. Craig is deemed an affiliate of the Trust as defined under the 1940 Act. Ms. Craig is also Assistant Secretary of Clough Global Dividend and Income Fund, Clough Global Equity Fund, Clough Global Opportunities Fund, Clough Funds Trust and ALPS Series Trust. |
| * | All communications to Trustees and Officers may be directed to Financial Investors Trust c/o 1290 Broadway, Suite 1100, Denver, CO 80203. |
| ** | This is the period for which the Trustee or Officer began serving the Trust. Each Trustee serves an indefinite term, until his successor is elected. Officers are elected on an annual basis. |
| *** | The Fund Complex includes all series of the Trust (currently 34) and any other investment companies for which any Trustee serves as trustee for and which Highland Associates, Inc., Robeco Investment Management, Inc., Pinebridge Investment LLC, Incline Global Management, LLC and/or Chatham Asset Management LLC provides investment advisory services (currently none). |
| Redmont Resolute Fund | Privacy Policy |
April 30, 2017 (Unaudited)
| FACTS | WHAT DOES THE FUND DO WITH YOUR PERSONAL INFORMATION? |
| Why? | Financial companies choose how they share your personal information. Federal law gives consumers the right to limit some but not all sharing. Federal law also requires us to tell you how we collect, share, and protect your personal information. Please read this notice carefully to understand what we do. |
| What? | The types of personal information we collect and share depend on the product or service you have with us. This information can include: |
| | ● Social Security number and account transactions |
| | ● Account balances and transaction history |
| | ● Wire transfer instructions |
| How? | All financial companies need to share customers’ personal information to run their everyday business. In the section below, we list the reasons financial companies can share their customers’ personal information; the reasons the Fund chooses to share; and whether you can limit this sharing. |
| Reasons we can share your personal information | Does the Fund share: | Can you limit this sharing? |
For our everyday business purposes — such as to process your transactions, maintain your account(s), respond to court orders and legal investigations, or report to credit bureaus | Yes | No |
For our marketing purposes — to offer our products and services to you | No | We do not share. |
| For joint marketing with other financial companies | No | We do not share. |
For our affiliates’ everyday business purposes — information about your transactions and experiences | Yes | No |
For our affiliates’ everyday business purposes — information about your creditworthiness | No | We do not share. |
| For nonaffiliates to market to you | No | We do not share. |
| Annual Report | April 30, 2017 | 51 |
| Redmont Resolute Fund | Privacy Policy |
April 30, 2017 (Unaudited)
| Who We Are | |
| Who is providing this notice? | Redmont Resolute Fund |
| What We Do | |
| How does the Fund protect my personal information? | To protect your personal information from unauthorized access and use, we use security measures that comply with federal law. These measures include computer safeguards and secured files and buildings. |
How does the Fund collect my personal information? | We collect your personal information, for example, when you |
| ● open an account |
| | ● provide account information or give us your contact information |
| | ● make a wire transfer or deposit money |
| Why can't I limit all sharing? | Federal law gives you the right to limit only |
| | ● sharing for affiliates’ everyday business purposes-information about your creditworthiness |
| | ● affiliates from using your information to market to you |
| | ● sharing for non-affiliates to market to you |
| | State laws and individual companies may give you additional rights to limit sharing. |
| Definitions | |
| Affiliates | Companies related by common ownership or control. They can be financial and nonfinancial companies. |
| Non-affiliates | Companies not related by common ownership or control. They can be financial and nonfinancial companies. ● The Fund does not share with non-affiliates so they can market to you. |
| Joint marketing | A formal agreement between non-affiliated financial companies that together market financial products or services to you. ● The Fund does not jointly market. |
| Other Important Information | |
| California Residents | If your account has a California home address, your personal information will not be disclosed to nonaffiliated third parties except as permitted by applicable California law, and we will limit sharing such personal information with our affiliates to comply with California privacy laws that apply to us. |
| Vermont Residents | The State of Vermont requires financial institutions to obtain your consent prior to sharing personal information that they collect about you with affiliated companies and nonaffiliated third parties other than in certain limited circumstances. Except as permitted by law, we will not share personal information we collect about you with nonaffiliated third parties or other affiliated companies unless you provide us with your written consent to share such information. |

TABLE OF CONTENTS
| Letter to Shareholders | 1 |
| Performance Review | |
| Seafarer Overseas Growth and Income Fund | 5 |
| Seafarer Overseas Value Fund | 11 |
| Disclosure of Fund Expenses | 17 |
| Portfolio of Investments | 19 |
| Statements of Assets and Liabilities | 28 |
| Statements of Operations | 30 |
| Statements of Changes in Net Assets | 32 |
| Financial Highlights | 36 |
| Notes to Financial Statements | 42 |
| Report of Independent Registered Public Accounting Firm | 52 |
| Additional Information | 53 |
| Approval of Fund Advisory Agreement | 54 |
| Trustees and Officers | 57 |
| Privacy Policy | 62 |
| Seafarer Funds | Letter to Shareholders |
April 30, 2017
LETTER TO SHAREHOLDERS
May 15, 2017
Dear Fellow Shareholders,
I am honored to address you again on behalf of the Seafarer Funds. This report addresses the Funds’ 2016–17 fiscal year (May 1, 2016 to April 30, 2017).
Cost Reduction and Economies of Scale
At the outset of Seafarer Capital Partners in 2011, we published a number of public goals that we believed would define the long-term success of the organization. You can read more about those goals on the Seafarer website: www.seafarerfunds.com/ask-seafarer/#what-are-the-firms-goals.
One of the goals we emphasized was the importance of reducing costs, over time and with scale. I am pleased to announce to shareholders that Seafarer has made substantial progress in this regard over the past five years.
When the Seafarer Overseas Growth and Income Fund launched in February of 2012, its Institutional and Investor classes began with net expense ratios of 1.45% and 1.60%, respectively. As the Fund was then quite small, its gross expenses were in fact much higher, but Seafarer elected to subsidize the expenses via a “cap agreement” that underwrote the initial net expense levels.
Five years later, the Growth and Income Fund’s assets have expanded due to considerable support from its shareholders. I am pleased to report that with the passage of time and the achievement of such scale, the Fund has realized a substantial reduction in its expenses. For the most recent fiscal year ended April 30, 2017, the expenses charged to shareholders were reduced approximately 36% for both classes (0.92% and 1.02% for the Institutional and Investor classes, respectively), relative to those in the Fund's first fiscal year. (For reference, the Fund’s Prospectus (dated August 31, 2016) states that the Fund expenses are 0.98% and 1.08% for the Institutional and Investor classes, respectively).
Seafarer Capital Partners continues to “cap” the Growth and Income Fund’s expenses by contract; however, the Fund’s economy of scale is now sufficient to ensure that its gross expenses are considerably lower than the cap, rendering the cap moot at the present time. Seafarer has extended the same expense cap to the Seafarer Overseas Value Fund. Net expenses for the Value Fund are 1.05% and 1.15% for the Institutional and Investor classes, respectively.
We are proud that the Funds have achieved material economies of scale for shareholders, in accordance with our firm’s long-term goals.
The reduction in fees from the Growth and Income Fund’s inception to present is large enough that it is unlikely to be repeated. However, we believe that additional economies can be realized, over time and with scale, and we will continue to work on behalf of the Funds to make it so.
Expansion of Seafarer’s Team
I wish to note that Seafarer continues to invest in its internal resources, particularly its personnel. In the past six months, two individuals have joined our firm.
I am pleased to welcome Brian Stableford, a colleague and mentor of mine from a prior organization. Brian helped consult Seafarer in its earliest days; but he joined the company as Director of Investment Operations last fall. Brian brings with him a wealth of market experience and trading expertise. When not trading, his role is to ensure that the firm’s systems and processes work efficiently, even when under duress.
I am also pleased to welcome Stephanie Gan, who joined the firm as a research analyst in January of this year. She will assist me in support of the Growth and Income strategy.
| Annual Report – April 30, 2017 | 1 |
| Seafarer Funds | Letter to Shareholders |
April 30, 2017
Seafarer’s Policy on Corporate Governance (or, “ESG Policy”)
Approximately two years ago, the mutual fund rating agency Morningstar launched a new rating scheme, intended to accompany its existing star-rating scheme, fund analysis, and other reporting. The new scheme, called Sustainability Ratings, aims to measure the extent to which a given fund’s portfolio holdings exhibit certain characteristics associated with environmental stewardship, social impact, and corporate governance (known as “ESG”).1 Funds that have requisite data and performance records are awarded between one and five “globes” (in lieu of the traditional stars) to connote the extent to which the holdings display the characteristics associated with the new rating scheme.
Since the Sustainability Ratings were launched, the Seafarer Overseas Growth and Income Fund has consistently been awarded five globes. (As of the date of this letter, the Value Fund is not rated.) The Growth and Income Fund’s high rating has prompted some shareholders to question whether and how ESG criteria figure within Seafarer’s investment philosophy and process – particularly as the Fund does not have an explicit ESG mandate.
In brief: Seafarer does not explicitly utilize ESG criteria to screen or select holdings for the Fund’s portfolio. As such, Seafarer cannot assure investors that the Fund’s current rating can be sustained. Nevertheless, we believe that the Fund’s current rating is a logical reflection of Seafarer’s policies toward corporate governance and its stewardship of capital.
From the inception of Seafarer Capital Partners in 2011, the firm and its members have sought to build a “purpose-driven organization.” Our objective is to create a company that rests upon a moral foundation, along with a culture that values ethics and excellence in equal measure. Our ultimate goal is to create an organization that can sustain itself over the longest horizon, with clients that are well satisfied, and where partners and staff are pleased to work.
Seafarer’s investment philosophy places great weight on investing for the long term: only via steady effort over considerable time can meaning be discovered, can value be created, and can wealth be measured.
The firm’s investment philosophy favors organizations capable of sustaining their growth and excellence over an extended horizon. Seafarer’s research process therefore attempts to select companies that pursue steady development and progress over time.
Seafarer believes that all such companies must possess a moral purpose that extends beyond short-term material gain. We believe that well-run companies must recognize their impact on society and the natural world, and strive to improve that impact over time. Our assumption, born out by experience, is that companies that do otherwise will fail to create lasting value, and their existence will be foreshortened.
The principle that binds Seafarer’s purpose, philosophy, and process is one of enlightened self-interest, not political preference. We believe that the best way to maximize our success and that of our clients is to scrutinize the long-term merits and morals of each action, and invest in companies that do the same. The idea of enlightened self-interest forms the basis of our firm’s policy toward corporate governance and the stewardship of capital.
“ESG” stands for “environment, society and governance.” The term is in vogue within the investment community, as some hope it will convey a degree of responsibility and purpose. I do not prefer the term, as it is laden with political and faddish connotations. Still, I know very well that investors only defeat themselves if they ignore what E, S and G represent. For this reason, I have decided to codify the firm’s policy on corporate governance.
Our policy requires that we use empirical data and objective facts to assess companies’ broader impact. We eschew subjective perceptions of companies’ standards and practices, particularly those rendered by interest groups. We do so because such groups often press companies to adopt impractical or unattainable standards based on relative comparison or subjective criteria. We know that real progress is often painfully slow, and we will defer judgment as necessary. We understand that corporate standards and practices will improve with persistence and patience.
| 2 | (855) 732-9220 seafarerfunds.com |
| Seafarer Funds | Letter to Shareholders |
April 30, 2017
“Divestment” is not a staple of our approach. Those that advocate divestment as a first and best option do so primarily to garner headlines. Their intent is to gain political influence by manipulating financial capital – capital that often belongs to others. In our experience, such interest groups give little thought to the cost of divestment, nor do they consider the forgone opportunity for change and reform. By contrast, our imperative is to act as a responsible, long-term steward for the funds entrusted to us by our shareholders. We cannot abdicate that responsibility because it is politically expedient.
Instead, our obligation is to work with portfolio companies to monitor whether they deploy capital to both moral and efficient ends. This is the only way we know of to generate sustained returns; it is the only way that society achieves a measure of progress at the same time. An important adjunct is that we believe that humanity prospers via communication and the exchange of ideas. Isolation and excommunication tend to breed misunderstanding, mistrust, and enmity. The failure to share values and ideas means no scope for improvement or for reform.
Our efforts at engagement will fail at times: some errant companies may prove recalcitrant, in which case divestment may be the only moral choice. But we must first try. Divestment will be our last resort, when sustained efforts at engagement have failed.
We contrast our approach against others that may be well intended, but which lack coherence, discipline or endurance. We will hold neither our clients’ capital nor our firm’s reputation subject to the caprices of interest groups or political movements. If we did, we might win plaudits from certain corners; yet we would stand for nothing, accomplish nothing lasting, and fritter away capital and time.
Most importantly, our policy is not a marketing novelty, but rather is essential to our shareholders’ long-term success. We believe that our approach toward governance and stewardship is an innate part of our job, not unlike risk management or capital allocation. Accordingly, we will not launch funds with specialized “ESG” mandates. Instead, our governance policy is woven into our philosophy and process – it affects all our funds and everything we do, all the time.
To summarize, this is what we strive to do:
| ● | Use empirical data, facts, and objective analysis to guide our assessment of corporate governance |
| ● | Make reasonable efforts to measure each company’s broader impact on society and the natural world |
| ● | Attempt to explicitly quantify and qualify how that impact might promote or detract from the company’s value and prospect for sustained growth |
| ● | Employ a steady, patient program of communication and engagement to sway companies toward improved practices and disclosure |
| ● | Engage in constructive discussion with companies – not aggressive activism – as a natural extension of our bottom-up research process |
| ● | Measure the efficacy of such engagement over an appropriate horizon |
| ● | Quit companies only when their detriments prove material, and when sustained engagement fails to produce change |
| ● | Consider thoughtful preferences expressed by clients and shareholders. |
By contrast, this is what we refuse to do:
| ● | Include a company in our portfolios simply because it excels at “ESG” criteria |
| ● | Hold clients’ capital hostage to interest groups and political movements |
| ● | Place excessive emphasis on relative comparisons or subjective observations to measure corporate standards and practices |
| ● | Utilize “divestment” as the first or best means to exert pressure |
| ● | Exit an investment solely because it was placed on a “blacklist,” particularly when the rationale or criteria that determine the blacklist is opaque |
| ● | Churn our clients’ portfolios in order to placate third parties |
| ● | Forget that our clients’ investment objectives are defined clearly in the relevant prospectus. |
| Annual Report – April 30, 2017 | 3 |
| Seafarer Funds | Letter to Shareholders |
April 30, 2017
I am publishing this explanation of Seafarer’s policy not to denote a change in philosophy or process, but rather to publicly codify an informal approach that has existed since the firm’s inception. My aim is to ensure that our clients enjoy greater transparency to our process; to refine the firm’s understanding of its own philosophy; and to let our society know where we stand on such matters.
Some clients might object on the basis that this policy represents an unwelcome change; others may redeem their capital, either because this policy goes too far, or not far enough. It is their prerogative, but it would be a shame. This policy changes nothing at Seafarer, except that it helps us become more conscious about that which we do already – and thereby get better at it.
We appreciate the trust you afford our organization, and we are honored to serve as your investment adviser in the emerging markets.
Andrew Foster
Chief Investment Officer
Seafarer Capital Partners, LLC
Information on the Seafarer website is provided for textual reference only, and is not incorporated by reference into this report.
The views and information discussed in this commentary are as of the date of publication, are subject to change, and may not reflect the writer's current views. The views expressed represent an assessment of market conditions at a specific point in time, are opinions only and should not be relied upon as investment advice regarding a particular investment or markets in general. Such information does not constitute a recommendation to buy or sell specific securities or investment vehicles. It should not be assumed that any investment will be profitable or will equal the performance of the portfolios or any securities or any sectors mentioned herein. The subject matter contained herein has been derived from several sources believed to be reliable and accurate at the time of compilation. Seafarer does not accept any liability for losses either direct or consequential caused by the use of this information.
1 | Information on the Morningstar Sustainability Ratings is available at www.morningstar.com/company/sustainability |
| 4 | (855) 732-9220 seafarerfunds.com |
| Seafarer Overseas Growth and Income Fund | Performance Review |
April 30, 2017
SEAFARER OVERSEAS GROWTH AND INCOME FUND
PERFORMANCE REVIEW
May 15, 2017
This report addresses the Seafarer Overseas Growth and Income Fund’s 2016–17 fiscal year (May 1, 2016 to April 30, 2017).
During the fiscal year, the Fund returned 11.37%, whereas the Fund’s benchmark, the MSCI Emerging Markets Total Return Index, rose 19.58%.1 By way of broader comparison, the S&P 500 Index increased 17.92%.
From the Fund’s inception (February 15, 2012) through the end of the fiscal year (April 30, 2017), the Fund generated an annualized rate of return of 6.91%.2 The benchmark index rose at an annualized rate of 1.28% over the same period.
The Fund began the fiscal year with a net asset value of $11.46 per share. During the ensuing twelve months, the Fund paid two distributions: $0.088 per share in June 2016 and $0.110 per share in December 2016. Those payments brought the cumulative distribution per share, as measured from the Fund’s inception to the end of the fiscal year, to $1.370. The Fund finished the fiscal year with a value of $12.54 per share.3
* * * * *
At the outset of the fiscal year, both the Fund and the benchmark index declined. This decline was perhaps a counter-reaction to the sharp rally that occurred between February and April 2016, just prior to the start of the fiscal year. Emerging markets had staged a strong rebound, led by Brazilian equities and the Brazilian currency, prompted by sudden political changes in that country. The month of May saw the emerging markets retreat, ostensibly because investors thought the surge in Brazil’s financial markets had run ahead of the underlying economic reality. The Fund and the benchmark fell -3.49% and -3.71%, respectively, during that month.4
However, between the end of May and the end of October, the benchmark rose sharply once again, this time led by gains in Chinese internet companies and financial services firms. While China contributed the most to the index’s increase during the five-month period, most other developing countries also saw their equity markets advance. The gains were such that the benchmark finished the first half of the fiscal year up 9.68%, and the Fund up 4.99%.5
By early November, stock markets in the developing world were generally placid. However, on November 8 – the date of the U.S. presidential election – both the Fund and its benchmark took a different turn.
The emerging markets – stocks, bonds and especially currencies – reacted sharply, perhaps surprised by the results of the election. Most stock markets, save those of Russia and a handful of small markets in the Middle East, fell swiftly in the ensuing days. Some currencies, particularly the Mexican peso and the Brazilian real, swooned.
The Fund fared poorly in the aftermath. From the mid-point in the fiscal year (October 31, about one week before the election) to the end of the calendar year (December 31), the Fund and the index fell -5.77% and -4.32%, respectively.6
Heading into the election, I had no intention to embed any “political bet” within the portfolio’s construction, as I do not consciously invest on such premises. Elections are too capricious, the immediate after-effects are short-lived and unpredictable, and the results rarely matter to the long-term fundamental success or failure of a given company. Yet even though I would argue the Fund’s holdings in Latin America are not terribly sensitive to trade ties with the U.S., all the stocks (and the underlying currencies) plunged. At the same time, Russian stocks surged, based on hopes for warmer relations and lifted sanctions. However, the Fund had no exposure to that market, and was caught flat-footed between Mexico’s retreat and Russia’s advance. Subsequent events have reversed some of this underperformance, but I am disappointed by my failure to perceive the risk posed by the election.
| Annual Report – April 30, 2017 | 5 |
| Seafarer Overseas Growth and Income Fund | Performance Review |
April 30, 2017
However, the advent of the new year altered the direction of the markets yet again. Counter-intuitively, and despite political sentiments to the contrary, the emerging markets rose steadily in the first four months of the year. Between December 31 and the end of the fiscal year (April 30), the Fund and the index rose 12.57% and 13.95%, respectively.7
The gains in the final four months meant that, despite much see-sawing throughout the fiscal year, the Fund and its benchmark finished with strong performance for the annual period (up 11.37% and 19.58%, respectively, as reported above).
* * * * *
I believe there are three chief reasons why the performance of the emerging markets has picked up as of late.
First, and contrary to widely-held expectation, the U.S. dollar did not appreciate against a representative basket of emerging market currencies over the past 17 months. I cite the 17 month period because it was in early December 2015 that the U.S. Federal Reserve (the “Fed”) embarked on the first of a series of interest rate increases. The Fed has hiked rates three times subsequently. Most pundits and strategists proclaimed the consensus view that such increases would usher in a period of pronounced dollar strength, with corresponding weakness among emerging market currencies. The opposite occurred.
Measured against a representative basket of emerging market currencies, the dollar has declined approximately 7% since that time.8 I mention the dollar’s weakness over the past 17 months not to offer an implicit prediction of its future movements (which would be a fool’s errand). Rather, I wish to suggest that the dollar’s moderate decline over the past 17 months has acted as a benign backdrop for emerging market equities, helping to beget their recent gains.
Second, corporate profits in the emerging markets grew at a reasonable rate in 2016. Between 2011 and 2015, corporate earnings in the developing world were collectively anemic; essentially, profits did not grow when measured cumulatively over that period. Yet in 2016, earnings expanded by approximately 8% – a healthy expansion, in my opinion. That rate happened to match “consensus forecasts;” and it was the first such “match” after five years of repeated disappointment, in which analysts estimated strong growth, and reality fell far short. Ultimately, I believe that the emerging markets have recently performed better in large part because actual growth matched the forecast. (For more information on these events, please see the Fund’s portfolio reviews for the third quarter of 2016 and the first quarter of 2017.9)
Third, at the outset of 2017, average valuation levels for emerging market equities were considerably lower than valuations on equities in the developed world. The relative discount was at least 20%, and as much as 40%, depending on the metrics used to assess valuation. In my opinion, this relative “cheapness” prompted emerging market equities to respond positively to the two aforementioned factors. In other words: given that valuations in the emerging markets were relatively depressed, it did not take much to push stock prices higher. The dollar’s decline, combined with a healthy acceleration in earnings growth, was enough to spur substantial gains over the past four months.
Within the benchmark index, Chinese internet stocks dominated returns for the fiscal year. This was to the detriment of the Fund, as it has no holdings in that segment of the market (see the portfolio review for the third quarter of 2016 for context).9
As of the end of the fiscal year, there were 830 constituent securities that comprised the benchmark index. Only 12 of those operate within the Chinese internet sector, or act as holding companies within the sector – less than 1.4% of the total stocks in the benchmark. Yet this niche group enjoys an outsized capitalization: together, they represented a 12.3% weighting in the index. As a group, these stocks have for many years vastly outperformed the broader index. This was no less true in the past fiscal year: Chinese internet stocks accounted for more than 18% of the index’s gain during the period.10
| 6 | (855) 732-9220 seafarerfunds.com |
| Seafarer Overseas Growth and Income Fund | Performance Review |
April 30, 2017
The Fund’s Growth and Income strategy is intended to balance growth objectives with dividend income, with the underlying aim of balancing risk and reward. Ideally, the strategy allows shareholders to participate in some of the growth of the developing world, while also dampening the volatility that routinely disrupts the emerging markets.
In abstract, the Chinese internet sector displays some of the growth characteristics that the strategy seeks. Yet the valuation associated with this segment of stocks is speculative. Also, most of these stocks pay no dividends at all; those that do, pay minimal ones. This is a constant challenge for the Fund’s strategy: adhering to its discipline might mean that the Fund fails to capture the highest heights in the market. So long as emerging market performance is dominated by a narrow group of stocks with speculative valuations and which pay little in the way of dividends, the Fund will likely underperform its benchmark.
Yet, even as the Growth and Income strategy favors lower valuations and substantial dividend payments, it does not mean that the strategy must forgo nascent industries and higher growth companies altogether. Rather, the strategy seeks to achieve considerable exposure to nascent industries and areas of higher growth; but it aims to do so in niches that are perhaps less obvious, and where valuations are accordingly less speculative. Once found, the strategy aims to retain such holdings for as long as possible, ideally forever.
Thank you for entrusting us with your capital. We are honored to serve as your investment adviser in the emerging markets.
Andrew Foster
Lead Portfolio Manager
Seafarer Overseas Growth and Income Fund
The MSCI Emerging Markets Total Return Index, Standard (Large+Mid Cap) Core, Gross (dividends reinvested), USD is a free float-adjusted market capitalization index designed to measure equity market performance of emerging markets. Index code: GDUEEGF. It is not possible to invest directly in this or any index.
The S&P 500 Total Return Index is a stock market index based on the market capitalizations of 500 large companies with common stock listed on the NYSE or NASDAQ. It is not possible to invest directly in this or any index.
The Fund is subject to investment risks, including possible loss of the principal amount invested and therefore is not suitable for all investors. The Fund may not achieve its objectives. Diversification does not ensure a profit or guarantee against loss.
Information on the Seafarer website is provided for textual reference only, and is not incorporated by reference into this report.
The views and information discussed in this commentary are as of the date of publication, are subject to change, and may not reflect the writer's current views. The views expressed represent an assessment of market conditions at a specific point in time, are opinions only and should not be relied upon as investment advice regarding a particular investment or markets in general. Such information does not constitute a recommendation to buy or sell specific securities or investment vehicles. It should not be assumed that any investment will be profitable or will equal the performance of the portfolios or any securities or any sectors mentioned herein. The subject matter contained herein has been derived from several sources believed to be reliable and accurate at the time of compilation. Seafarer does not accept any liability for losses either direct or consequential caused by the use of this information.
1 | References to the “Fund” pertain to the Fund’s Institutional share class (ticker: SIGIX). The Investor share class (ticker: SFGIX) gained 11.22% during the fiscal year. Adjustments in accordance with accounting principles generally accepted in the U.S. (“U.S. GAAP”) were applied during the financial statement preparation and increased the Investor share class net asset value by $0.01 from $12.50 to $12.51. |
| Annual Report – April 30, 2017 | 7 |
| Seafarer Overseas Growth and Income Fund | Performance Review |
April 30, 2017
2 | The Fund’s Investor share class generated an annual rate of return of 6.78% from the Fund’s inception through the end of the fiscal year. |
3 | The Fund’s Investor share class began the fiscal year with a net asset value of $11.44 per share. The Fund paid two distributions: $0.087 per share in June 2016 and $0.104 per share in December 2016. Those payments brought the cumulative distribution per share, as measured from the Fund’s inception to the end of the fiscal year, to $1.320. The Fund finished the fiscal year with a value of $12.51 per share. Adjustments in accordance with U.S. GAAP were applied during the financial statement preparation and increased the Investor share class net asset value by $0.01 from $12.50 to $12.51. |
4 | The Fund’s Investor share class declined -3.58% in May 2016. |
5 | The Fund’s Investor share class gained 4.90% during the first half of the fiscal year. |
6 | The Fund’s Investor share class declined -5.75% between October 31, 2016 and December 31, 2016. |
7 | The Fund’s Investor share class gained 12.41% between December 31, 2016 and April 30, 2017. |
8 | Source: Bloomberg; MSCI Emerging Markets Currency Index (index code: MXEF0XC0). The Currency Index tracks the performance of emerging market currencies relative to the U.S. dollar. The Currency Index measures the total returns of the currencies of countries in the corresponding MSCI equity index (i.e. MSCI Emerging Markets Index). It is not possible to invest directly in this or any index. |
9 | The Seafarer Overseas Growth and Income Fund’s quarterly portfolio reviews are available at: www.seafarerfunds.com/archives |
| 8 | (855) 732-9220 seafarerfunds.com |
| Seafarer Overseas Growth and Income Fund | Performance Review |
April 30, 2017
| Total Returns | | | | | |
| As of April 30, 2017 | 1 Year | 3 Years | 5 Years | Since Inception Annualized(1) | Gross Expense Ratio(2) |
| Investor Class (SFGIX) | 11.22%(3) | 4.67% | 6.69% | 6.78% | 1.08% |
| Institutional Class (SIGIX) | 11.37% | 4.81% | 6.83% | 6.91% | 0.98% |
MSCI Emerging Markets Total Return Index(4) | 19.58% | 2.16% | 1.85% | 1.28% | |
All performance is in U.S. dollars with gross (pre-tax) dividends and/or distributions reinvested. The performance data quoted represents past performance and does not guarantee future results. Future returns may be lower or higher. The investment return and principal value will fluctuate so that an investor's shares, when redeemed, may be worth more or less than the original cost. Prior to August 31, 2016, shares of the Fund redeemed or exchanged within 90 days of purchase were subject to a 2% redemption fee. Performance does not reflect this fee, which if deducted would reduce an individual's return. To obtain the Fund’s most recent month-end performance, visit seafarerfunds.com or call (855) 732-9220.
1 | Inception Date: February 15, 2012. |
2 | Ratios as of Prospectus dated August 31, 2016. Seafarer Capital Partners, LLC has agreed contractually to waive and/or reimburse fees or expenses in order to limit Total Annual Fund Operating Expenses After Fee Waiver/Expense Reimbursements (excluding brokerage expenses, interest expenses, taxes and extraordinary expenses) to 1.15% and 1.05% of the Fund’s average daily net assets for the Investor and Institutional share classes, respectively. This agreement is in effect through August 31, 2017. |
3 | Includes adjustments in accordance with U.S. GAAP and as such, the total return for shareholder transactions reported to the market may differ from the total return for financial reporting purposes. As a result, the total return increased by 0.09% from 11.13% to 11.22%. |
4 | The MSCI Emerging Markets Total Return Index, Standard (Large+Mid Cap) Core, Gross (dividends reinvested), USD is a free float-adjusted market capitalization index designed to measure equity market performance of emerging markets. Index code: GDUEEGF. The index is not actively managed and does not reflect any deductions for fees, expense or taxes. An investor may not invest directly in an index. |
| Annual Report – April 30, 2017 | 9 |
| Seafarer Overseas Growth and Income Fund | Performance Review |
April 30, 2017
Performance of a $10,000 Investment Since Inception
| * | Inception Date: February 15, 2012. |
The chart shown above represents historical performance of a hypothetical investment of $10,000 in the Fund’s Investor Class shares for the period from inception to April 30, 2017. All returns reflect reinvested dividends and/or distributions, but do not reflect the deduction of taxes that an investor would pay on distributions or redemptions.
The Fund also offers Institutional Class shares, performance for which is not reflected in the chart above. The performance of Institutional Class shares may be higher or lower than the performance of the Investor Class shares shown above based upon differences in fees paid by shareholders investing in the Investor Class shares and Institutional Class shares.
Investment Objective
The Fund seeks to provide long-term capital appreciation along with some current income. The Fund seeks to mitigate adverse volatility in returns as a secondary objective.
Strategy
The Fund invests primarily in the securities of companies located in developing countries. The Fund invests in several asset classes including dividend-paying common stocks, preferred stocks, convertible bonds, and fixed-income securities.
The Fund seeks to offer investors a relatively stable means of participating in a portion of developing countries’ growth prospects, while providing some downside protection compared to a portfolio that invests only in the common stocks of those countries.
| 10 | (855) 732-9220 seafarerfunds.com |
| Seafarer Overseas Value Fund | Performance Review |
April 30, 2017
SEAFARER OVERSEAS VALUE FUND
PERFORMANCE REVIEW
May 8, 2017
This report addresses the Seafarer Overseas Value Fund’s 2016–17 fiscal year (May 1, 2016 to April 30, 2017).
The Fund launched one month into the fiscal year, on May 31, 2016, with $2.8 million in assets under management, and ended the fiscal year with $10.1 million.
During the fiscal year (as measured from inception date May 31, 2016), the Fund gained 14.18%.1 The Fund’s benchmark, the MSCI Emerging Markets Total Return Index, rose 24.19% during the same period. By way of broader comparison, the S&P 500 Index returned 15.84% during the same period.
The Fund launched with a net asset value (NAV) of $10.00 per share. The Fund paid a distribution of $0.125 per share in December 2016, and it finished the fiscal year with a value of $11.28 per share.2
The Seafarer Overseas Value Fund celebrates its first fiscal year eleven months after its inception. This first anniversary is an opportune time to engage in introspection to learn from what has worked and has not worked so far; and more importantly, to deepen the understanding of what the Value Fund is and is not.
I have repeatedly stated in quarterly portfolio reviews what the Fund prospectus makes clear: that the Value Fund does not seek to replicate the performance of a benchmark. Instead, the Fund seeks to produce a minimum rate of return. And yet, the two figures in the first paragraph of this performance review that my attention zeroes in on are the Fund’s total return of 14.18% and the MSCI Emerging Market Index’s total return of 24.19%. Not only has the index outperformed the Fund by a large margin; the path to those returns also differed meaningfully. The introspection that follows is not an excuse for the Fund’s underperformance versus the index. Put differently, I will engage in a similar exercise, without reference to or claims relative to the index, when and if the Fund outperforms the industry benchmark.
NAV stability best characterizes the Seafarer Overseas Value Fund’s first seven months of life. The Fund intentionally deployed its seed capital on a gradual basis during the first few months after launch, choosing an average price of entry for each holding over the arbitrariness of prices on May 31, 2016. Implementing this capital deployment strategy proved challenging in the context of what a posteriori became clear was the middle of an emerging market equity price rally. The Fund’s NAV proved stable not only through this rally, but also during the emerging market equity and currency sell-off that followed the election of President Trump. I had not used political considerations for the Fund’s stock selection process, and an examination of performance after the price correction in late 2016 failed to reveal any single, overriding reason for the Fund’s NAV stability. At the risk of revealing my single-mindedness, I would attribute the Fund’s performance during this period as simply a function of price. In other words, the Fund had deployed new capital into “cheap” securities that suffered from less valuation risk than the rest of the market.
The performance pattern above changed dramatically at the start of 2017. From this point onward, the Value Fund not only appreciated considerably, but progressed in lock-step with the MSCI Emerging Market Index. The drivers of said performance, however, were very different. The technology and financial sectors accounted for most of the index’s appreciation, while an eclectic selection of stocks operating in the consumer discretionary, industrial, and technology (one holding) sectors drove the performance of the Value Fund.
An examination of the top contributors and detractors to performance for the full fiscal year does not reveal a discernable pattern by industry or country either. Within the framework used by the Value Fund to identify and select securities for the portfolio (as detailed in the white paper On Value in the Emerging Markets), the list of positive and negative contributors to performance is equally diverse.3 The Fund’s best performing security, Melco International Development, falls under the category of Breakup Value. The top detractor of performance, Xtep International Holdings, is a holding the Fund values for its liquidity (Balance Sheet Liquidity category) among other attributes. Furthermore, the same category of value is present within the top five contributors and detractors of performance. For example, within the Structural Shift category of value, Samsung SDI was among the top five contributors to performance for the fiscal year, and Texwinca Holdings and AMVIG Holdings among the worst performers. Similarly, within the Deleveraging category of value, Asia Satellite Telecommunications and Qatar Gas rank among the top detractors of performance; while Melco International Development is a holding that also falls under the Deleveraging category and has performed very well this past fiscal year.
| Annual Report – April 30, 2017 | 11 |
| Seafarer Overseas Value Fund | Performance Review |
April 30, 2017
The Fund’s holdings are equally diverse within the dimension of income producing vs. non-dividend-paying securities. While I do not target a minimum income level for the portfolio – and this is one of the reasons why the Fund elects to pay a distribution only once a year – I am satisfied with the decomposition of the portfolio’s fiscal year total return of 14.18% into 1.22% income and 12.80% capital appreciation.
The more important question is whether the Fund’s appreciation has altered its valuation characteristics sufficiently to warrant recycling its holdings. Indeed, since inception, the Fund has not sold any securities, and has added four new holdings. Please refer to the Fund’s quarterly portfolio reviews for details on the new holdings.4 As of September 30, 2016, prior to the Fund’s appreciation in 2017, the portfolio traded at a harmonic average price to book value ratio (P/BV) of 1.2, a dividend yield of 4%, and a price to earnings ratio (P/E) of 13.5,6,7 After the Fund’s appreciation, it traded at a March 31, 2017 P/BV of 1.2, dividend yield of 3.8%, and a P/E of 11.
While aggregate portfolio valuation characteristics have not changed meaningfully, they have done so at the security level. However, the valuation re-rating for the top contributors to performance is not sufficient yet to justify substituting new companies for these holdings. By way of example, consider the top two positive performers for the fiscal year. Melco International Development’s P/BV actually declined from 1.3 to 1.0 after it began fully consolidating its principal subsidiary. This case is an illustration of the cautionary statement I made in Seafarer's On Value in the Emerging Markets white paper against using headline multiples to judge valuation. I still consider this valuation for Melco International to be low. The P/BV of the second-best performer, Pacific Basin, re-rated from 0.3 to 0.8 in the same time period. While the valuation appreciation is significant, and probably overstates any earnings improvement the company may report in the near term, in my opinion, this multiple still represents a low valuation relative to Pacific Basin’s normalized earnings power. As a result, the Fund continues to hold this security and may consider adding to it should the stock retreat as a result of having discounted too much, too soon.
Indeed, my response to Pacific Basin and other securities that have appreciated significantly in the portfolio during the fiscal year was to allocate new Fund inflows to other holdings that have yet to realize their potential. The price appreciation of the best-performing securities kept their representation in the steadily growing Value Fund meaningful, while simultaneously freeing up inflows for allocation to new security additions. Given that the Fund experienced subscriptions, steering incremental capital elsewhere in the portfolio – and away from stocks whose allocation had grown due to appreciation – served to control risk.
The other side of this allocation coin is the counter-cyclical allocation of Fund inflows to securities that have yet to appreciate or ones that have depreciated outright. In the latter case, the common thread that ties together the Fund’s worst performers this past fiscal year is negative earnings momentum, which in the Value Fund’s case also tend to coalesce around Chinese holdings. The portfolio did continue to add to these securities as their prices declined. In hindsight, and with the benefit of Andrew Foster’s insight that one of the reasons for the strong appreciation of emerging markets this past year is net income growth after years of an earnings famine (see the Seafarer Overseas Growth and Income Fund’s third quarter 2016 portfolio review), it made sense that stocks with negative earnings momentum would underperform.8 Nevertheless, I have been surprised in several instances at the degree to which the market prices of some stocks have declined given that they were already cheap to begin with, and even if the negative earnings momentum was not new. In my opinion, this phenomenon alone best characterizes the performance of emerging markets over the past twelve months. It has truly been a year in which earnings momentum and nothing else seemed to drive stock price performance.
| 12 | (855) 732-9220 seafarerfunds.com |
| Seafarer Overseas Value Fund | Performance Review |
April 30, 2017
While the price performance of the Value Fund and emerging markets in general has been positive, qualitative developments in the universe over the past twelve months are a case of “two steps forward, one step back.” The past year witnessed a partial undermining of the incremental economic freedom that is the foundation of economic progress in emerging markets. India’s demonetization of more than 80% of the currency in circulation is a direct violation of property rights. China’s flirtation with soft and hard capital controls during the fourth quarter of 2016, and President Trump’s stated intention to erect trade barriers in addition to the already existing ones, are two faces of the same coin. On the other hand, the past year of bottom-up research has reminded me why Seafarer invests overseas. Research work has taken me to Vietnam where I met an incredibly gifted entrepreneur, who shines not only by the sizable company he has built from scratch, but also by his humble charisma. He operates in a sector of the economy the government has left untouched, and he lacks the foreign education of many returning nationals one inevitably meets at the larger Vietnamese companies. He represents pure, raw Vietnamese talent, and embodies the reason Seafarer invests in emerging markets. I also witnessed other instances of positive incremental progress, such as Dubai’s thriving private sector, the Egyptian government’s abandonment of currency controls, and China’s continued progress toward liberalizing prices in specific industries. In summary, one could argue that even though some of the newspaper headlines over the past year have defied belief, Seafarer’s own stock-specific, on-the-ground research has balanced the view one could form by reading headlines only.
I ended the Value Fund’s first quarter 2017 portfolio review stating my preoccupation with the ever-declining productivity of debt.9 In my opinion, the impact of government policies in both China and the United States on this issue alone represents the key determinant of emerging market performance in the coming twelve months and beyond.
Paul Espinosa
Lead Portfolio Manager
Seafarer Overseas Value Fund
The MSCI Emerging Markets Total Return Index, Standard (Large+Mid Cap) Core, Gross (dividends reinvested), USD is a free float-adjusted market capitalization index designed to measure equity market performance of emerging markets. Index code: GDUEEGF. It is not possible to invest directly in this or any index.
The S&P 500 Total Return Index is a stock market index based on the market capitalizations of 500 large companies with common stock listed on the NYSE or NASDAQ. It is not possible to invest directly in this or any index.
The Fund is subject to investment risks, including possible loss of the principal amount invested and therefore is not suitable for all investors. The Fund may not achieve its objectives. Diversification does not ensure a profit or guarantee against loss.
Information on the Seafarer website is provided for textual reference only, and is not incorporated by reference into this report.
The views and information discussed in this commentary are as of the date of publication, are subject to change, and may not reflect the writer's current views. The views expressed represent an assessment of market conditions at a specific point in time, are opinions only and should not be relied upon as investment advice regarding a particular investment or markets in general. Such information does not constitute a recommendation to buy or sell specific securities or investment vehicles. It should not be assumed that any investment will be profitable or will equal the performance of the portfolios or any securities or any sectors mentioned herein. The subject matter contained herein has been derived from several sources believed to be reliable and accurate at the time of compilation. Seafarer does not accept any liability for losses either direct or consequential caused by the use of this information.
1 | References to the “Fund” pertain to the Fund’s Institutional share class (ticker: SIVLX). The Investor share class (ticker: SFVLX) gained 14.15% during the fiscal year. Adjustments in accordance with U.S. GAAP were applied during the financial statement preparation and decreased the Institutional share class net asset value by $0.01 from $11.29 to $11.28. |
| Annual Report – April 30, 2017 | 13 |
| Seafarer Overseas Value Fund | Performance Review |
April 30, 2017
2 | The Fund’s Investor share class launched on May 31, 2016 with a net asset value of $10.00 per share. The Fund paid a distribution of $0.104 per share in December 2016, and it finished the fiscal year with a value of $11.30 per share. Adjustments in accordance with U.S. GAAP were applied during the financial statement preparation and decreased the Institutional share class net asset value by $0.01 from $11.29 to $11.28. |
3 | The white paper On Value in Emerging Markets is available at: www.seafarerfunds.com/documents/on-value-in-the-emerging-markets |
4 | The Seafarer Overseas Value Fund’s quarterly portfolio reviews are available at: www.seafarerfunds.com/archives |
5 | Price to book value (P/BV) ratio is the market price of a company’s shares, divided by the company’s book value per share. |
6 | Dividend yield is a measure of the sum of the dividends paid per share during the trailing 12 months divided by the current share price. |
7 | Price to earnings (P/E) ratio is the market price of a company’s common shares divided by the earnings per common share. |
8 | The Seafarer Overseas Growth and Income Fund’s third quarter 2016 portfolio review is available at: www.seafarerfunds.com/funds/ogi/portfolio-review/2016/09/Q3 |
9 | The Seafarer Overseas Value Fund’s first quarter 2017 portfolio review is available at: www.seafarerfunds.com/funds/ovl/portfolio-review/2017/03/Q1 |
| 14 | (855) 732-9220 seafarerfunds.com |
| Seafarer Overseas Value Fund | Performance Review |
April 30, 2017
| Total Returns | | | |
| As of April 30, 2017 | 6 Month | Since Inception(1) | Net Expense Ratio(2) |
| Investor Class (SFVLX) | 11.25% | 14.15% | 1.15% |
| Institutional Class (SIVLX) | 11.18%(3) | 14.18%(3) | 1.05% |
MSCI Emerging Markets Total Return Index(4) | 9.03% | 24.19% | |
Gross expense ratio: 2.08% for Investor Class; 1.98% for Institutional Class. Ratios as of Prospectus dated August 31, 20162
All performance is in U.S. dollars with gross (pre-tax) dividends and/or distributions reinvested. The performance data quoted represents past performance and does not guarantee future results. Future returns may be lower or higher. The investment return and principal value will fluctuate so that an investor's shares, when redeemed, may be worth more or less than the original cost. Prior to August 31, 2016, shares of the Fund redeemed or exchanged within 90 days of purchase were subject to a 2% redemption fee. Performance does not reflect this fee, which if deducted would reduce an individual's return. To obtain the Fund’s most recent month-end performance, visit seafarerfunds.com or call (855) 732-9220.
1 | Inception Date: May 31, 2016. |
2 | Seafarer Capital Partners, LLC has agreed contractually to waive and/or reimburse fees or expenses in order to limit Total Annual Fund Operating Expenses After Fee Waiver/Expense Reimbursements (excluding brokerage expenses, interest expenses, taxes and extraordinary expenses) to 1.15% and 1.05% of the Fund’s average daily net assets for the Investor and Institutional share classes, respectively. This agreement is in effect through August 31, 2017. |
3 | Includes adjustments in accordance with U.S. GAAP and as such, the total return for shareholder transactions reported to the market may differ from the total return for financial reporting purposes. As a result, the total return since inception decreased by 0.11% from 14.29% to 14.18%. |
4 | The MSCI Emerging Markets Total Return Index, Standard (Large+Mid Cap) Core, Gross (dividends reinvested), USD is a free float-adjusted market capitalization index designed to measure equity market performance of emerging markets. Index code: GDUEEGF. The index is not actively managed and does not reflect any deductions for fees, expense or taxes. An investor may not invest directly in an index. |
| Annual Report – April 30, 2017 | 15 |
| Seafarer Overseas Value Fund | Performance Review |
April 30, 2017
Performance of a $10,000 Investment Since Inception
* | Inception Date: May 31, 2016. |
The chart shown above represents historical performance of a hypothetical investment of $10,000 in the Fund’s Investor Class shares for the period from inception to April 30, 2017. All returns reflect reinvested dividends and/or distributions, but do not reflect the deduction of taxes that an investor would pay on distributions or redemptions.
The Fund also offers Institutional Class shares, performance for which is not reflected in the chart above. The performance of Institutional Class shares may be higher or lower than the performance of the Investor Class shares shown above based upon differences in fees paid by shareholders investing in the Investor Class shares and Institutional Class shares.
Investment Objective
The Fund seeks to provide long-term capital appreciation.
Strategy
The Fund invests primarily in the securities of companies located in developing countries. The Fund invests in several asset classes including common stocks, preferred stocks, and fixed-income securities.
The Fund’s portfolio is comprised of securities identified through a bottom-up security selection process based on fundamental research. The Fund seeks to produce a minimum long-term rate of return by investing in securities priced at a discount to their intrinsic value.
| 16 | (855) 732-9220 seafarerfunds.com |
| Seafarer Funds | Disclosure of Fund Expenses |
April 30, 2017 (Unaudited)
DISCLOSURE OF FUND EXPENSES
As a shareholder of a Fund you will incur two types of costs: (1) transaction costs, including applicable redemption fees; and (2) ongoing costs, including management fees and other Fund expenses. The following examples are intended to help you understand your ongoing costs (in dollars) of investing in a Fund and to compare these costs with the ongoing costs of investing in other mutual funds. The examples are based on an investment of $1,000 invested on November 1, 2016 and held until April 30, 2017.
Actual Expenses. For each Fund and share class, the first line of the following table provides information about actual account values and actual expenses. You may use the information in this line, together with the amount you invested, to estimate the expenses that you paid over the period. Simply divide your account value by $1,000 (for example, an $8,600 account value divided by $1,000 = 8.6), then multiply the result by the number in the first line under the heading “Expenses Paid During Period” to estimate the expenses you paid on your account during this period.
Hypothetical Example for Comparison Purposes. For each Fund and share class, the second line of the following table provides information about hypothetical account values and hypothetical expenses based on the Fund’s actual expense ratio and an assumed rate of return of 5% per year before expenses, which is not the Fund’s actual return. The hypothetical account values and expenses may not be used to estimate the actual ending account balance or expenses you paid for the period. You may use this information to compare the ongoing costs of investing in the Fund and other mutual funds. To do so, compare this 5% hypothetical example with the 5% hypothetical examples that appear in the shareholder reports of the other mutual funds.
Please note the expenses shown in the following table are meant to highlight your ongoing costs only and do not reflect transactional costs, such as redemption fees or exchange fees. Therefore, for each Fund and share class, the second line of the following table is useful in comparing ongoing costs only, and will not help you determine the relative total costs of owning different funds. In addition, if these transactional costs were included, your costs would have been higher.
| Annual Report – April 30, 2017 | 17 |
| Seafarer Funds | Disclosure of Fund Expenses |
April 30, 2017 (Unaudited)
| | Beginning Account Value 11/01/16 | Ending Account Value 04/30/17 | Expense Ratio(a) | Expenses Paid During Period 11/01/16 - 04/30/17(b) |
| SEAFARER OVERSEAS GROWTH AND INCOME FUND | | | | |
| Investor Class | | | | |
| Actual | $1,000.00 | $1,060.30 | 1.04% | $5.31 |
| Hypothetical (5% return before expenses) | $1,000.00 | $1,019.64 | 1.04% | $5.21 |
| | | | | |
| Institutional Class | | | | |
| Actual | $1,000.00 | $1,060.70 | 0.94% | $4.80 |
| Hypothetical (5% return before expenses) | $1,000.00 | $1,020.13 | 0.94% | $4.71 |
| | | | | |
| SEAFARER OVERSEAS VALUE FUND | | | | |
| Investor Class | | | | |
| Actual | $1,000.00 | $1,112.50 | 1.15% | $6.02 |
| Hypothetical (5% return before expenses) | $1,000.00 | $1,019.09 | 1.15% | $5.76 |
| | | | | |
| Institutional Class | | | | |
| Actual | $1,000.00 | $1,111.80 | 1.05% | $5.50 |
| Hypothetical (5% return before expenses) | $1,000.00 | $1,019.59 | 1.05% | $5.26 |
| (a) | Annualized, based on the Fund's most recent fiscal half year expenses. |
| (b) | Expenses are equal to the Fund's annualized expense ratio multiplied by the average account value over the period, multiplied by the number of days in the most recent fiscal half-year (181)/365 (to reflect the half-year period). |
| 18 | (855) 732-9220 seafarerfunds.com |
| Seafarer Overseas Growth and Income Fund | Portfolio of Investments |
April 30, 2017
| | | | Currency | | | Shares | | | Value | |
| COMMON STOCKS (82.5%) | | | | | | | | | | |
| Brazil (6.1%) | | | | | | | | | | |
| TOTVS SA | | | BRL | | | 7,500,000 | | $ | 65,499,913 | |
| Odontoprev SA | | | BRL | | | 18,050,500 | | | 64,887,511 | |
| Valid Solucoes e Servicos de Seguranca em Meios de Pagamento e Identificacao SA | | | BRL | | | 1,990,000 | | | 14,238,245 | |
| | | | | | | | | | | |
| Total Brazil | | | | | | | | | 144,625,669 | |
| | | | | | | | | | | |
| China / Hong Kong (15.1%) | | | | | | | | | | |
| Hang Lung Properties, Ltd. | | | HKD | | | 33,880,000 | | | 88,855,863 | |
| China Yangtze Power Co., Ltd. | | | CNY | | | 28,499,862 | | | 57,393,088 | |
| Shandong Weigao Group Medical Polymer Co., Ltd., Class H | | | HKD | | | 73,704,000 | | | 53,726,263 | |
| Fuyao Glass Industry Group Co., Ltd., Class H | | | HKD | | | 15,164,000 | | | 53,611,627 | |
| Texwinca Holdings, Ltd. | | | HKD | | | 55,000,000 | | | 36,910,141 | |
| Xinhua Winshare Publishing and Media Co., Ltd., Class H | | | HKD | | | 29,250,000 | | | 25,984,624 | |
| Greatview Aseptic Packaging Co., Ltd. | | | HKD | | | 43,674,400 | | | 22,627,914 | |
| Pico Far East Holdings, Ltd. | | | HKD | | | 47,500,000 | | | 19,236,085 | |
| | | | | | | | | | | |
| Total China / Hong Kong | | | | | | | | | 358,345,605 | |
| | | | | | | | | | | |
| India (9.5%) | | | | | | | | | | |
| Infosys, Ltd., Sponsored ADR | | | USD | | | 8,775,000 | | | 127,764,000 | |
Sun Pharma Advanced Research Co., Ltd.(a) | | | INR | | | 7,648,846 | | | 37,732,959 | |
| Balkrishna Industries, Ltd. | | | INR | | | 1,500,000 | | | 35,514,535 | |
| Cyient, Ltd. | | | INR | | | 3,000,000 | | | 25,539,406 | |
| | | | | | | | | | | |
| Total India | | | | | | | | | 226,550,900 | |
| | | | | | | | | | | |
| Indonesia (4.1%) | | | | | | | | | | |
| Astra International Tbk PT | | | IDR | | | 144,200,000 | | | 96,825,718 | |
| | | | | | | | | | | |
| Total Indonesia | | | | | | | | | 96,825,718 | |
| | | | | | | | | | | |
| Japan (1.5%) | | | | | | | | | | |
| Hisamitsu Pharmaceutical Co., Inc. | | | JPY | | | 690,000 | | | 35,281,453 | |
| | | | | | | | | | | |
| Total Japan | | | | | | | | | 35,281,453 | |
| | | | | | | | | | | |
| Malaysia (0.6%) | | | | | | | | | | |
| Hartalega Holdings Bhd | | | MYR | | | 12,000,000 | | | 13,545,266 | |
| | | | | | | | | | | |
| Total Malaysia | | | | | | | | | 13,545,266 | |
| Annual Report – April 30, 2017 | 19 |
| Seafarer Overseas Growth and Income Fund | Portfolio of Investments |
April 30, 2017
| | | | Currency | | | Shares | | | Value | |
| Mexico (5.5%) | | | | | | | | | | |
| Grupo Financiero Banorte SAB de CV, Class O | | | MXN | | | 15,525,000 | | $ | 89,594,348 | |
| Bolsa Mexicana de Valores SAB de CV | | | MXN | | | 20,464,135 | | | 35,764,202 | |
| Grupo Herdez SAB de CV | | | MXN | | | 2,500,000 | | | 5,547,071 | |
| | | | | | | | | | | |
| Total Mexico | | | | | | | | | 130,905,621 | |
| | | | | | | | | | | |
| Poland (4.9%) | | | | | | | | | | |
| Bank Pekao SA | | | PLN | | | 2,200,000 | | | 79,709,734 | |
| Asseco Poland SA | | | PLN | | | 2,000,000 | | | 28,150,134 | |
| PGE Polska Grupa Energetyczna SA | | | PLN | | | 2,650,949 | | | 7,879,316 | |
| | | | | | | | | | | |
| Total Poland | | | | | | | | | 115,739,184 | |
| | | | | | | | | | | |
| Singapore (5.7%) | | | | | | | | | | |
| Singapore Telecommunications, Ltd. | | | SGD | | | 40,250,000 | | | 107,744,337 | |
| SIA Engineering Co., Ltd. | | | SGD | | | 10,603,400 | | | 28,384,007 | |
| | | | | | | | | | | |
| Total Singapore | | | | | | | | | 136,128,344 | |
| | | | | | | | | | | |
| South Africa (5.1%) | | | | | | | | | | |
| Sanlam, Ltd. | | | ZAR | | | 22,055,000 | | | 116,994,029 | |
| EOH Holdings, Ltd. | | | ZAR | | | 525,000 | | | 5,556,917 | |
| | | | | | | | | | | |
| Total South Africa | | | | | | | | | 122,550,946 | |
| | | | | | | | | | | |
| South Korea (11.5%) | | | | | | | | | | |
| Hyundai Mobis Co., Ltd. | | | KRW | | | 560,000 | | | 109,253,889 | |
| Coway Co., Ltd. | | | KRW | | | 1,069,084 | | | 94,422,130 | |
| Dongsuh Cos., Inc. | | | KRW | | | 1,950,000 | | | 52,867,123 | |
| Sindoh Co., Ltd. | | | KRW | | | 350,000 | | | 16,148,168 | |
| | | | | | | | | | | |
| Total South Korea | | | | | | | | | 272,691,310 | |
| | | | | | | | | | | |
| Taiwan (12.3%) | | | | | | | | | | |
| Delta Electronics, Inc. | | | TWD | | | 15,580,000 | | | 87,786,285 | |
| Pou Chen Corp. | | | TWD | | | 60,550,000 | | | 84,791,273 | |
| Taiwan Semiconductor Manufacturing Co., Ltd. | | | TWD | | | 9,340,000 | | | 60,211,130 | |
| Vanguard International Semiconductor Corp. | | | TWD | | | 23,761,000 | | | 45,362,553 | |
| Taiwan Semiconductor Manufacturing Co., Ltd., | | | | | | | | | | |
| Sponsored ADR | | | USD | | | 476,739 | | | 15,765,759 | |
| | | | | | | | | | | |
| Total Taiwan | | | | | | | | | 293,917,000 | |
| | | | | | | | | | | |
| Vietnam (0.6%) | | | | | | | | | | |
| Bao Viet Holdings | | | VND | | | 4,350,000 | | | 10,959,395 | |
| 20 | (855) 732-9220 seafarerfunds.com |
| Seafarer Overseas Growth and Income Fund | Portfolio of Investments |
April 30, 2017
| | | | Currency | | | Shares | | | Value | |
| Vietnam (continued) | | | | | | | | | | |
| Nam Long Investment Corp. | | | VND | | | 3,675,000 | | $ | 4,524,370 | |
| | | | | | | | | | | |
| Total Vietnam | | | | | | | | | 15,483,765 | |
| | | | | | | | | | | |
| TOTAL COMMON STOCKS | | | | | | | | | | |
| (Cost $1,829,222,266) | | | | | | | | | 1,962,590,781 | |
| | | | | | | | | | | |
| PREFERRED STOCKS (7.1%) | | | | | | | | | | |
| Brazil (2.6%) | | | | | | | | | | |
| Banco Bradesco SA, ADR | | | USD | | | 5,878,400 | | | 62,017,120 | |
| | | | | | | | | | | |
| Total Brazil | | | | | | | | | 62,017,120 | |
| | | | | | | | | | | |
| South Korea (4.5%) | | | | | | | | | | |
| Samsung Electronics Co., Ltd. | | | KRW | | | 68,500 | | | 105,528,166 | |
| | | | | | | | | | | |
| Total South Korea | | | | | | | | | 105,528,166 | |
| | | | | | | | | | | |
| TOTAL PREFERRED STOCKS | | | | | | | | | | |
| (Cost $98,636,043) | | | | | | | | | 167,545,286 | |
| | | | | | | | | | | |
| | | Currency | | | Rate | | Maturity Date | | | Principal Amount | | | Value | |
| CORPORATE BOND - FOREIGN CURRENCY (1.3%) | | | | | | | | | | | | | |
| Mexico (1.3%) | | | | | | | | | | | | | | | |
| America Movil SAB de CV | | MXN | | | 7.13 | % | | 12/09/24 | | | 275,000,000 | | | 13,881,874 | |
| America Movil SAB de CV | | MXN | | | 6.45 | % | | 12/05/22 | | | 350,000,000 | | | 17,434,324 | |
| | | | | | | | | | | | | | | | |
| Total Mexico | | | | | | | | | | | | | | 31,316,198 | |
| | | | | | | | | | | | | | | | |
| TOTAL CORPORATE BOND - FOREIGN CURRENCY | | | | | | | | | |
| (Cost $32,787,301) | | | | | | | | | | | | | | 31,316,198 | |
| | | | | | | | | | | | | | | | |
| CORPORATE BOND - USD (0.8%) | | | | | | | | | | | | | | | |
| Brazil (0.8%) | | | | | | | | | | | | | | | |
| Cielo SA / Cielo USA, Inc. | | USD | | | 3.75 | % | | 11/16/22 | | | 20,000,000 | | | 19,300,000 | |
| | | | | | | | | | | | | | | | |
| Total Brazil | | | | | | | | | | | | | | 19,300,000 | |
| | | | | | | | | | | | | | | | |
| TOTAL CORPORATE BOND - USD | | | | | | | | | | | | | | | |
| (Cost $18,085,353) | | | | | | | | | | | | | | 19,300,000 | |
| Annual Report – April 30, 2017 | 21 |
| Seafarer Overseas Growth and Income Fund | Portfolio of Investments |
April 30, 2017
| | | Currency | | | Rate | | Maturity Date | | | Principal Amount | | | Value | |
| MEDIUM/LONG-TERM GOVERNMENT BOND -FOREIGN CURRENCY (2.4%) | | | | |
| Brazil (1.7%) | | | | | | | | | | | | | | | |
| Brazilian Government International Bond | | BRL | | | 10.25 | % | | 01/10/28 | | | 60,000,000 | | $ | 19,375,876 | |
| Brazil Notas do Tesouro | | | | | | | | | | | | | | | |
| Nacional, Series F, Series NTNF | | BRL | | | 10.00 | % | | 01/01/25 | | | 70,000,000 | | | 22,507,667 | |
| | | | | | | | | | | | | | | | |
| Total Brazil | | | | | | | | | | | | | | 41,883,543 | |
| | | | | | | | | | | | | | | | |
| Indonesia (0.7%) | | | | | | | | | | | | | | | |
| Indonesia Treasury Bond, Series FR70 | | IDR | | | 8.38 | % | | 03/15/24 | | | 200,000,000,000 | | | 16,143,807 | |
| | | | | | | | | | | | | | | | |
| Total Indonesia | | | | | | | | | | | | | | 16,143,807 | |
| | | | | | | | | | | | | | | | |
| TOTAL MEDIUM/LONG-TERM GOVERNMENT BOND -FOREIGN CURRENCY | | | | |
| (Cost $50,359,949) | | | 58,027,350 | |
| | | | | | | | | | | | | | | | |
| SHORT-TERM GOVERNMENT BOND -USD/FOREIGN CURRENCY (3.0% ) | | | | |
| Hungary (0.3%) | | | | | | | | | | | | | | | |
| Hungary Government International Bond | | USD | | | 4.13 | % | | 02/19/18 | | | 6,000,000 | | | 6,116,448 | |
| | | | | | | | | | | | | | | | |
| Total Hungary | | | | | | | | | | | | | | 6,116,448 | |
| | | | | | | | | | | | | | | | |
| Israel (0.3%) | | | | | | | | | | | | | | | |
| Israel Government International Bond | | USD | | | 5.13 | % | | 03/26/19 | | | 6,000,000 | | | 6,387,600 | |
| | | | | | | | | | | | | | | | |
| Total Israel | | | | | | | | | | | | | | 6,387,600 | |
| | | | | | | | | | | | | | | | |
| Poland (0.3%) | | | | | | | | | | | | | | | |
| Republic of Poland Government International Bond | | USD | | | 6.38 | % | | 07/15/19 | | | 6,000,000 | | | 6,587,100 | |
| | | | | | | | | | | | | | | | |
| Total Poland | | | | | | | | | | | | | | 6,587,100 | |
| | | | | | | | | | | | | | | | |
| Singapore (0.6%) | | | | | | | | | | | | | | | |
| Singapore Government Bond | | SGD | | | 4.00 | % | | 09/01/18 | | | 9,000,000 | | | 6,692,266 | |
| 22 | (855) 732-9220 seafarerfunds.com |
| Seafarer Overseas Growth and Income Fund | Portfolio of Investments |
| | Currency | | Rate | Maturity Date | | Principal Amount | | | Value | |
| Singapore (continued) | | | | | | | | | | | |
| Singapore Government Bond | SGD | | | 0.50 | % | 04/01/18 | | | 10,000,000 | | | $ | 7,123,788 | |
| | | | | | | | | | | | | | | |
| Total Singapore | | | | | | | | | | | | | 13,816,054 | |
| | | | | | | | | | | | | | | |
| South Africa (0.2%) | | | | | | | | | | | | | | |
| Republic of South Africa Government International Bond | USD | | | 6.88 | % | 05/27/19 | | | 5,000,000 | | | | 5,422,600 | |
| | | | | | | | | | | | | | | |
| Total South Africa | | | | | | | | | | | | | 5,422,600 | |
| | | | | | | | | | | | | | | |
| South Korea (1.3%) | | | | | | | | | | | | | | |
| The Korea Development Bank | USD | | | 1.38 | % | 09/12/19 | | | 5,000,000 | | | | 4,931,623 | |
| The Korea Development Bank | USD | | | 2.88 | % | 08/22/18 | | | 5,000,000 | | | | 5,066,950 | |
| Korea Treasury Bond, Series 1806 | KRW | | | 1.63 | % | 06/10/18 | | | 6,000,000,000 | | | | 5,281,466 | |
| Korea Treasury Bond, Series 1812 | KRW | | | 1.75 | % | 12/10/18 | | | 6,000,000,000 | | | | 5,289,786 | |
| Korea International Bond | USD | | | 7.13 | % | 04/16/19 | | | 5,000,000 | | | | 5,499,500 | |
| Korea Treasury Bond, Series 1712 | KRW | | | 2.00 | % | 12/10/17 | | | 7,000,000,000 | | | | 6,174,967 | |
| | | | | | | | | | | | | | | |
| Total South Korea | | | | | | | | | | | | | 32,244,292 | |
| | | | | | | | |
| TOTAL SHORT‐TERM GOVERNMENT BOND ‐USD/FOREIGN CURRENCY (Cost $70,778,343) | | | | | | | 70,574,094 | |
| | | | | | | | | | | | | | |
| TOTAL INVESTMENTS (Cost $2,099,869,255) (97.1%) | | | | | | | | $ | 2,309,353,709 | |
| | | | | | | | | | | | | | | |
| Cash and Other Assets, Less Liabilities (2.9%) | | | | | | | | | | | | 68,340,111 | |
| NET ASSETS (100.0%) | | | | | | | | | | | | $ | 2,377,693,820 | |
| Annual Report – April 30, 2017 | 23 |
| Seafarer Overseas Growth and Income Fund | Portfolio of Investments |
April 30, 2017
Principal Amount is stated in local currency unless otherwise noted.
(a) | Non-income producing security. |
| Currency Abbreviations |
| BRL | - | Brazil Real |
| CNY | - | China Yuan |
| HKD | - | Hong Kong Dollar |
| IDR | - | Indonesia Rupiah |
| INR | - | India Rupee |
| JPY | - | Japan Yen |
| KRW | - | South Korea Won |
| MXN | - | Mexico Peso |
| MYR | - | Malaysia Ringgit |
| PLN | - | Poland Zloty |
| SGD | - | Singapore Dollar |
| TWD | - | Taiwan New Dollar |
| USD | - | United States Dollar |
| VND | - | Vietnam Dong |
| ZAR | - | South Africa Rand |
For Fund compliance purposes, the Fund's geographical classifications refer to any one or more of the sub-classifications used by one or more widely recognized market indexes or ratings group indexes, and/or as defined by Fund management. This definition may not apply for purposes of this report, which may combine sub-classifications for reporting ease. Geographical regions are shown as a percentage of net assets.
See accompanying Notes to Financial Statements.
| 24 | (855) 732-9220 seafarerfunds.com |
| Seafarer Overseas Value Fund | Portfolio of Investments |
April 30, 2017
| | Currency | | Shares | | | Value | |
| COMMON STOCKS (81.2%) | | | | | | | |
| Brazil (2.2%) | | | | | | | |
| Qualicorp SA | BRL | | | 31,000 | | | $ | 219,751 | |
| | | | | | | | | | |
| Total Brazil | | | | | | | | 219,751 | |
| | | | | | | | | | |
| China / Hong Kong (40.7%) | | | | | | | | | |
| Melco International Development, Ltd. | HKD | | | 184,000 | | | | 378,487 | |
| First Pacific Co., Ltd. | HKD | | | 486,000 | | | | 374,262 | |
| WH Group, Ltd. | HKD | | | 370,000 | | | | 330,597 | |
China Resources Beer Holdings Co., Ltd.(a) | HKD | | | 132,000 | | | | 317,682 | |
| AMVIG Holdings, Ltd. | HKD | | | 898,000 | | | | 300,166 | |
Asia Satellite Telecommunications Holdings, Ltd.(a) | HKD | | | 235,000 | | | | 285,504 | |
| Texwinca Holdings, Ltd. | HKD | | | 422,000 | | | | 283,201 | |
| Xtep International Holdings, Ltd. | HKD | | | 704,000 | | | | 280,574 | |
| China Yangtze Power Co., Ltd. | CNY | | | 124,990 | | | | 251,705 | |
| Giordano International, Ltd. | HKD | | | 446,000 | | | | 239,676 | |
| Hang Lung Properties, Ltd. | HKD | | | 91,000 | | | | 238,662 | |
| Shangri‐La Asia, Ltd. | HKD | | | 160,000 | | | | 229,149 | |
Pacific Basin Shipping, Ltd.(a) | HKD | | | 1,130,000 | | | | 225,176 | |
| Pico Far East Holdings, Ltd. | HKD | | | 538,000 | | | | 217,874 | |
| Greatview Aseptic Packaging Co., Ltd. | HKD | | | 353,000 | | | | 182,891 | |
| | | | | | | | | | |
| Total China / Hong Kong | | | | | | | | 4,135,606 | |
| | | | | | | | | | |
| Czech Republic (4.8%) | | | | | | | | | |
| Pegas Nonwovens SA | CZK | | | 7,300 | | | | 251,563 | |
| Philip Morris CR AS | CZK | | | 430 | | | | 235,756 | |
| | | | | | | | | | |
| Total Czech Republic | | | | | | | | 487,319 | |
| | | | | | | | | | |
| Mexico (2.7%) | | | | | | | | | |
| Credito Real SAB de CV SOFOM ER | MXN | | | 194,000 | | | | 272,060 | |
| | | | | | | | | | |
| Total Mexico | | | | | | | | 272,060 | |
| | | | | | | | | | |
| Philippines (3.3%) | | | | | | | | | |
| Del Monte Pacific, Ltd. | SGD | | | 1,407,000 | | | | 337,362 | |
| | | | | | | | | | |
| Total Philippines | | | | | | | | 337,362 | |
| | | | | | | | | | |
| Qatar (2.7%) | | | | | | | | | |
| Qatar Gas Transport Co., Ltd. | QAR | | | 50,000 | | | | 273,254 | |
| | | | | | | | | | |
| Total Qatar | | | | | | | | 273,254 | |
| Annual Report – April 30, 2017 | 25 |
| Seafarer Overseas Value Fund | Portfolio of Investments |
April 30, 2017
| | Currency | | Shares | | | Value | |
| Russia (5.3%) | | | | | | | |
| Cherkizovo Group PJSC, GDR | USD | | | 22,000 | | | $ | 289,300 | |
Global Ports Investments PLC, GDR(a) | USD | | | 69,000 | | | | 244,950 | |
| | | | | | | | | | |
| Total Russia | | | | | | | | 534,250 | |
| | | | | | | | | | |
| Singapore (7.1%) | | | | | | | | | |
| SIA Engineering Co., Ltd. | SGD | | | 92,000 | | | | 246,273 | |
| Wilmar International, Ltd. | SGD | | | 96,000 | | | | 243,925 | |
| Genting Singapore PLC | SGD | | | 291,000 | | | | 232,233 | |
| | | | | | | | | | |
| Total Singapore | | | | | | | | 722,431 | |
| | | | | | | | | | |
| South Korea (2.3%) | | | | | | | | | |
| Samsung SDI Co., Ltd. | KRW | | | 1,900 | | | | 229,590 | |
| | | | | | | | | | |
| Total South Korea | | | | | | | | 229,590 | |
| | | | | | | | | | |
| Taiwan (2.7%) | | | | | | | | | |
| Pou Chen Corp. | TWD | | | 192,000 | | | | 268,867 | |
| | | | | | | | | | |
| Total Taiwan | | | | | | | | 268,867 | |
| | | | | | | | | | |
| United Arab Emirates (2.0%) | | | | | | | | | |
| National Central Cooling Co. PJSC | AED | | | 385,000 | | | | 198,108 | |
| | | | | | | | | | |
| Total United Arab Emirates | | | | | | | | 198,108 | |
| | | | | | | | | | |
| Vietnam (5.4%) | | | | | | | | | |
| PetroVietnam Fertilizer & Chemicals JSC | VND | | | 267,000 | | | | 275,881 | |
| PetroVietnam Technical Services Corp. | VND | | | 354,000 | | | | 267,716 | |
| | | | | | | | | | |
| Total Vietnam | | | | | | | | 543,597 | |
| | | | | | | | | | |
| TOTAL COMMON STOCKS | | | | | | | | | |
| (Cost $7,447,354) | | | | | | | | 8,222,195 | |
| | | | | | | | | | |
| TOTAL INVESTMENTS | | | | | | | | | |
| (Cost $7,447,354) (81.2%) | | | | | | | $ | 8,222,195 | |
| | | | | | | | | | |
| Cash and Other Assets, Less Liabilities (18.8%) | | | | | | | | 1,903,355 | |
| NET ASSETS (100.0%) | | | | | | | $ | 10,125,550 | |
(a) | Non-income producing security. |
| 26 | (855) 732-9220 seafarerfunds.com |
| Seafarer Overseas Value Fund | Portfolio of Investments |
April 30, 2017
| Currency Abbreviations |
| AED | - | United Arab Emirates Dirham |
| BRL | - | Brazil Real |
| CNY | - | China Yuan |
| CZK | - | Czech Koruna |
| HKD | - | Hong Kong Dollar |
| KRW | - | South Korea Won |
| MXN | - | Mexico Peso |
| QAR | - | Qatar Rial |
| SGD | - | Singapore Dollar |
| TWD | - | Taiwan New Dollar |
| USD | - | United States Dollar |
| VND | - | Vietnam Dong |
For Fund compliance purposes, the Fund's geographical classifications refer to any one or more of the sub-classifications used by one or more widely recognized market indexes or ratings group indexes, and/or as defined by Fund management. This definition may not apply for purposes of this report, which may combine sub-classifications for reporting ease. Geographical regions are shown as a percentage of net assets.
See accompanying Notes to Financial Statements.
| Annual Report – April 30, 2017 | 27 |
| Seafarer Funds | Statements of Assets and Liabilities |
| | | Seafarer Overseas Growth and Income Fund | | | Seafarer Overseas Value Fund | |
| ASSETS: | | | | | | |
| Investments, at value | | $ | 2,309,353,709 | | | $ | 8,222,195 | |
| Cash | | | 60,285,167 | | | | 1,904,916 | |
| Foreign currency, at value (Cost $3,239,755 and $5,411) | | | 3,224,758 | | | | 5,394 | |
| Receivable for investments sold | | | 9,434,308 | | | | – | |
| Receivable for shares sold | | | 3,109,096 | | | | – | |
| Receivable due from investment adviser | | | – | | | | 6,652 | |
| Interest and dividends receivable | | | 5,207,069 | | | | 18,302 | |
| Deferred offering costs | | | – | | | | 5,362 | |
| Prepaid expenses and other assets | | | 41,033 | | | | 2,369 | |
| Total Assets | | | 2,390,655,140 | | | | 10,165,190 | |
| LIABILITIES: | | | | | | | | |
| Payable for investments purchased | | | 9,327,165 | | | | – | |
| Foreign capital gains tax | | | 650,030 | | | | – | |
| Administrative fees payable | | | 92,520 | | | | 2,526 | |
| Shareholder service plan fees payable | | | 372,393 | | | | 1,114 | |
| Payable for shares redeemed | | | 627,516 | | | | – | |
| Investment advisory fees payable | | | 1,387,965 | | | | – | |
| Payable for chief compliance officer fee | | | 7,023 | | | | 25 | |
| Trustee fees and expenses payable | | | 19,394 | | | | 69 | |
| Payable for principal financial officer fees | | | 1,661 | | | | 6 | |
| Audit and tax fees payable | | | 23,851 | | | | 22,932 | |
| Accrued expenses and other liabilities | | | 451,802 | | | | 12,968 | |
| Total Liabilities | | | 12,961,320 | | | | 39,640 | |
| NET ASSETS | | $ | 2,377,693,820 | | | $ | 10,125,550 | |
| NET ASSETS CONSIST OF: | | | | | | | | |
| Paid‐in capital (Note 5) | | $ | 2,182,213,188 | | | $ | 9,327,048 | |
| Accumulated net investment income | | | 6,298,920 | | | | 23,419 | |
| Accumulated net realized loss | | | (19,709,430 | ) | | | (4 | ) |
| Net unrealized appreciation | | | 208,891,142 | | | | 775,087 | |
| NET ASSETS | | $ | 2,377,693,820 | | | $ | 10,125,550 | |
| INVESTMENTS, AT COST | | $ | 2,099,869,255 | | | $ | 7,447,354 | |
| PRICING OF SHARES | | | | | | | | |
Investor Class: | | | | | | | | |
| Net Asset Value, offering and redemption price per share | | $ | 12.51 | (a) | | $ | 11.30 | |
| Net Assets | | $ | 877,383,754 | | | $ | 279,925 | |
| Shares of beneficial interest outstanding | | | 70,151,551 | | | | 24,776 | |
Institutional Class: | | | | | | | | |
| Net Asset Value, offering and redemption price per share | | $ | 12.54 | | | $ | 11.28 | (b) |
| Net Assets | | $ | 1,500,310,066 | | | $ | 9,845,625 | |
| Shares of beneficial interest outstanding | | | 119,660,894 | | | | 872,460 | |
| 28 | (855) 732-9220 seafarerfunds.com |
| Seafarer Funds | Statements of Assets and Liabilities |
(a) | In preparing the financial statements in accordance with accounting principles generally accepted in the United States of America (“U.S. GAAP”), management made certain adjustments as required by U.S. GAAP which caused the net asset value for purposes of these financial statements to differ from the net asset value used to process shareholder transactions as of the date of these financial statements. As a result, the net asset value increased by $0.01 from $12.50 to $12.51. |
(b) | In preparing the financial statements in accordance with U.S. GAAP, management made certain adjustments as required by U.S. GAAP which caused the net asset value for purposes of these financial statements to differ from the net asset value used to process shareholder transactions as of the date of these financial statements. As a result, the net asset value decreased by $0.01 from $11.29 to $11.28. |
See accompanying Notes to Financial Statements.
| Annual Report – April 30, 2017 | 29 |
| Seafarer Funds | Statements of Operations |
| | Year or Period Ended April 30, 2017 |
| | | Seafarer Overseas Growth and Income Fund | | | Seafarer Overseas Value Fund(a) | |
| INVESTMENT INCOME: | | | | | | |
| Dividends | | $ | 45,318,544 | | | $ | 123,786 | |
| Foreign taxes withheld | | | (4,043,862 | ) | | | (4,616 | ) |
| Interest and other income | | | 7,722,654 | | | | 1,853 | |
| Total investment income | | | 48,997,336 | | | | 121,023 | |
| | | | | | | | | |
| EXPENSES: | | | | | | | | |
| Investment advisory fees (Note 6) | | | 12,925,009 | | | | 37,097 | |
| Administrative and transfer agency fees | | | 766,803 | | | | 30,362 | |
| Trustee fees and expenses | | | 39,692 | | | | 121 | |
| Registration/filing fees | | | 97,272 | | | | 2,788 | |
| Shareholder service plan fees | | | | | | | | |
| Investor Class | | | 1,099,856 | | | | 117 | |
| Institutional Class | | | 442,753 | | | | 1,475 | |
| Legal fees | | | 31,404 | | | | 77 | |
| Audit fees | | | 39,195 | | | | 24,032 | |
| Reports to shareholders and printing fees | | | 150,645 | | | | 773 | |
| Custody fees | | | 1,079,660 | | | | 26,092 | |
| Offering costs (Note 2) | | | – | | | | 55,972 | |
| Chief compliance officer fees | | | 40,856 | | | | 112 | |
| Principal financial officer fees | | | 9,973 | | | | 27 | |
| Miscellaneous | | | 27,182 | | | | 3,473 | |
| Total expenses | | | 16,750,300 | | | | 182,518 | |
| Less fees waived/reimbursed by investment adviser (Note 6) | | | | | | | | |
| Investor Class | | | – | | | | (4,303 | ) |
| Institutional Class | | | – | | | | (125,280 | ) |
| Total net expenses | | | 16,750,300 | | | | 52,935 | |
| NET INVESTMENT INCOME: | | | 32,247,036 | | | | 68,088 | |
| Net realized loss on investments | | | (8,620,327 | ) | | | (3 | ) |
| Net realized loss on foreign currency transactions | | | (1,662,104 | ) | | | (2,765 | ) |
| Net realized loss | | | (10,282,431 | ) | | | (2,768 | ) |
| Net change in unrealized appreciation on investments (net of foreign capital gains tax of $650,030 and $–) | | | 174,013,758 | | | | 774,841 | |
| Net change in unrealized appreciation/(depreciation) on translation of assets and liabilities in foreign currency transactions | | | (5,705 | ) | | | 246 | |
| Net unrealized appreciation | | | 174,008,053 | | | | 775,087 | |
| 30 | (855) 732-9220 seafarerfunds.com |
| Seafarer Funds | Statements of Operations |
| | Year or Period Ended April 30, 2017 |
| | | Seafarer Overseas Growth and Income Fund | | | Seafarer Overseas Value Fund(a) | |
| NET REALIZED AND UNREALIZED GAIN ON INVESTMENTS AND FOREIGN CURRENCY TRANSLATIONS | | | 163,725,622 | | | | 772,319 | |
| NET INCREASE IN NET ASSETS RESULTING | | | | | | | | |
| FROM OPERATIONS | | $ | 195,972,658 | | | $ | 840,407 | |
(a) | For the period from May 31, 2016 (Fund inception) to April 30, 2017. |
See accompanying Notes to Financial Statements.
| Annual Report – April 30, 2017 | 31 |
| Seafarer Overseas Growth and Income Fund | Statements of Changes in Net Assets |
| | | Year Ended April 30, 2017 | | | Year Ended April 30, 2016 | |
| OPERATIONS: | | | | | | |
| Net investment income | | $ | 32,247,036 | | | $ | 10,446,517 | |
| Net realized loss | | | (10,282,431 | ) | | | (12,082,922 | ) |
| Net change in unrealized appreciation | | | 174,008,053 | | | | 20,391,822 | |
| Net increase in net assets resulting from operations | | | 195,972,658 | | | | 18,755,417 | |
| DISTRIBUTIONS TO SHAREHOLDERS (NOTE 3): | | | | | | | | |
| From net investment income | | | | | | | | |
| Investor Class | | $ | (11,816,708 | ) | | $ | (2,584,508 | ) |
| Institutional Class | | | (15,268,463 | ) | | | (2,856,743 | ) |
| From net realized gains on investments | | | | | | | | |
| Investor Class | | | – | | | | (883,213 | ) |
| Institutional Class | | | – | | | | (865,671 | ) |
| Net decrease in net assets from distributions | | | (27,085,171 | ) | | | (7,190,135 | ) |
| BENEFICIAL INTEREST TRANSACTIONS (NOTE 5): | | | | | | | | |
| Shares sold | | | | | | | | |
| Investor Class | | $ | 323,883,071 | | | $ | 641,922,494 | |
| Institutional Class | | | 987,397,573 | | | | 559,784,411 | |
| Dividends reinvested | | | | | | | | |
| Investor Class | | | 11,687,348 | | | | 3,453,383 | |
| Institutional Class | | | 10,058,555 | | | | 2,613,473 | |
| Shares Redeemed, net of redemption fees | | | | | | | | |
| Investor Class | | | (141,954,140 | ) | | | (95,043,203 | ) |
| Institutional Class | | | (201,239,879 | ) | | | (88,578,872 | ) |
| Net increase in net assets derived from beneficial interest transactions | | | 989,832,528 | | | | 1,024,151,686 | |
| | | | | | | | | |
| Net increase in net assets | | $ | 1,158,720,015 | | | $ | 1,035,716,968 | |
| | | | | | | | | |
| NET ASSETS: | | | | | | | | |
| Beginning of period | | $ | 1,218,973,805 | | | $ | 183,256,837 | |
| End of period (including accumulated net investment income of $6,298,920 and $3,665,408, respectively) | | $ | 2,377,693,820 | | | $ | 1,218,973,805 | |
| 32 | (855) 732-9220 seafarerfunds.com |
| Seafarer Overseas Growth and Income Fund | Statements of Changes in Net Assets |
| | | Year Ended April 30, 2017 | | | Year Ended April 30, 2016 | |
| Other Information: | | | | | | |
| SHARE TRANSACTIONS: | | | | | | |
| Investor Class | | | | | | |
| Sold | | | 27,609,055 | | | | 58,019,970 | |
| Distributions reinvested | | | 1,045,402 | | | | 324,192 | |
| Redeemed | | | (12,161,311 | ) | | | (8,922,148 | ) |
| Net increase in shares outstanding | | | 16,493,146 | | | | 49,422,014 | |
| Institutional Class | | | | | | | | |
| Sold | | | 83,448,584 | | | | 50,734,276 | |
| Distributions reinvested | | | 900,914 | | | | 243,396 | |
| Redeemed | | | (17,485,012 | ) | | | (8,430,296 | ) |
| Net increase in shares outstanding | | | 66,864,486 | | | | 42,547,376 | |
See accompanying Notes to Financial Statements.
| Annual Report – April 30, 2017 | 33 |
| Seafarer Overseas Value Fund | Statements of Changes in Net Assets |
| | | May 31, 2016 (Inception) to April 30, 2017 | |
| OPERATIONS: | | | |
| Net investment income | | $ | 68,088 | |
| Net realized loss | | | (2,768 | ) |
| Net change in unrealized appreciation | | | 775,087 | |
| Net increase in net assets resulting from operations | | | 840,407 | |
| DISTRIBUTIONS TO SHAREHOLDERS (NOTE 3): | | | | |
| From net investment income | | | | |
| Investor Class | | $ | (2,017 | ) |
| Institutional Class | | | (60,374 | ) |
| Net decrease in net assets from distributions | | | (62,391 | ) |
| BENEFICIAL INTEREST TRANSACTIONS (NOTE 5): | | | | |
| Shares sold | | | | |
| Investor Class | | $ | 253,053 | |
| Institutional Class | | | 11,072,675 | |
| Dividends reinvested | | | | |
| Investor Class | | | 2,017 | |
| Institutional Class | | | 60,374 | |
| Shares Redeemed | | | | |
| Investor Class | | | – | |
| Institutional Class | | | (2,040,585 | ) |
| Net increase in net assets derived from beneficial interest transactions | | | 9,347,534 | |
| | | | | |
| Net increase in net assets | | $ | 10,125,550 | |
| | | | | |
| NET ASSETS: | | | | |
| Beginning of period | | $ | – | |
| End of period (including accumulated net investment income of $23,419) | | $ | 10,125,550 | |
| | | | | |
| Other Information: | | | | |
| SHARE TRANSACTIONS: | | | | |
| Investor Class | | | | |
| Sold | | | 24,578 | |
| Distributions reinvested | | | 198 | |
| Net increase in shares outstanding | | | 24,776 | |
| Institutional Class | | | | |
| Sold | | | 1,062,151 | |
| Distributions reinvested | | | 5,925 | |
| Redeemed | | | (195,616 | ) |
| Net increase in shares outstanding | | | 872,460 | |
See accompanying Notes to Financial Statements.
| 34 | (855) 732-9220 seafarerfunds.com |
Page Intentionally Left Blank
| For a share outstanding through the periods presented |
| Investor Class |
| NET ASSET VALUE, BEGINNING OF PERIOD |
| INCOME FROM OPERATIONS: |
Net investment income(a) |
| Net realized and unrealized gain/(loss) on investments |
| Total from investment operations |
| LESS DISTRIBUTIONS: |
| From net investment income |
| From net realized gains on investments |
| Total distributions |
| REDEMPTION FEES ADDED TO PAID IN CAPITAL |
| NET INCREASE/(DECREASE) IN NET ASSET VALUE |
| NET ASSET VALUE, END OF PERIOD |
|
TOTAL RETURN(e) |
| SUPPLEMENTAL DATA: |
| Net assets, end of period (in 000s) |
| RATIOS TO AVERAGE NET ASSETS: |
| Operating expenses excluding reimbursement/waiver |
| Operating expenses including reimbursement/waiver |
| Net investment income including reimbursement/waiver |
| PORTFOLIO TURNOVER RATE |
(a) | Calculated using the average shares method. |
(b) | Less than $(0.005) per share. |
(c) | Less than $0.005 per share. |
(d) | In preparing the financial statements in accordance with U.S. GAAP, management made certain adjustments as required by U.S. GAAP which caused the net asset value for purposes of these financial statements to differ from the net asset value used to process shareholder transactions as of the date of these financial statements. As a result, the net asset value increased by $0.01 from $12.50 to $12.51. |
(e) | Total returns would have been lower had certain expenses not been waived during the period. Returns shown do not reflect the deduction of taxes that a shareholder would pay on Fund distributions or the redemption of Fund shares. |
(f) | Includes adjustments in accordance with U.S. GAAP and as such, the total return for shareholder transactions reported to the market may differ from the total return for financial reporting purposes. As a result, the total return increased by 0.09% from 11.13% to 11.22%. |
(g) | Effective September 1, 2015, the Adviser agreed to limit expenses to 1.15%. The Adviser agreed to limit expenses to 1.25% for the period September 1, 2014 through August 31, 2015. Prior to September 1, 2014, the Adviser agreed to limit expenses to 1.40%. (See Note 6). |
See accompanying Notes to Financial Statements.
| 36 | (855) 732-9220 seafarerfunds.com |
| Seafarer Overseas Growth and Income Fund |
Year Ended April 30, 2017 | | | Year Ended April 30, 2016 | | | Year Ended April 30, 2015 | | | Year Ended April 30, 2014 | | | Year Ended April 30, 2013 | |
| $ | 11.44 | | | $ | 12.64 | | | $ | 11.58 | | | $ | 11.91 | | | $ | 10.18 | |
| | | | | | | | | | | | | | | | | | | |
| | 0.22 | | | | 0.16 | | | | 0.14 | | | | 0.19 | | | | 0.10 | |
| | 1.04 | | | | (1.23 | ) | | | 1.26 | | | | 0.02 | | | | 1.74 | |
| | 1.26 | | | | (1.07 | ) | | | 1.40 | | | | 0.21 | | | | 1.84 | |
| | | | | | | | | | | | | | | | | | | |
| | (0.19 | ) | | | (0.11 | ) | | | (0.19 | ) | | | (0.26 | ) | | | (0.11 | ) |
| | – | | | | (0.02 | ) | | | (0.15 | ) | | | (0.28 | ) | | | (0.00 | )(b) |
| | (0.19 | ) | | | (0.13 | ) | | | (0.34 | ) | | | (0.54 | ) | | | (0.11 | ) |
| | 0.00 | (c) | | | 0.00 | (c) | | | 0.00 | (c) | | | 0.00 | (c) | | | 0.00 | (c) |
| | 1.07 | | | | (1.20 | ) | | | 1.06 | | | | (0.33 | ) | | | 1.73 | |
| $ | 12.51 | (d) | | $ | 11.44 | | | $ | 12.64 | | | $ | 11.58 | | | $ | 11.91 | |
| | | | | | | | | | | | | | | | | | | |
| | 11.22 | %(f) | | | (8.39 | %) | | | 12.55 | % | | | 1.93 | % | | | 18.24 | % |
| | | | | | | | | | | | | | | | | | | |
| $ | 877,384 | | | $ | 613,795 | | | $ | 53,543 | | | $ | 27,181 | | | $ | 26,348 | |
| | | | | | | | | | | | | | | | | | | |
| | 1.02 | % | | | 1.14 | % | | | 1.30 | % | | | 1.78 | % | | | 2.82 | % |
| | 1.02 | % | | | 1.14 | %(g) | | | 1.30 | %(g) | | | 1.40 | % | | | 1.49 | % |
| | 1.88 | % | | | 1.50 | % | | | 1.19 | % | | | 1.66 | % | | | 0.90 | % |
| | 14 | % | | | 7 | % | | | 28 | % | | | 51 | % | | | 39 | % |
See accompanying Notes to Financial Statements.
| Annual Report – April 30, 2017 | 37 |
| For a share outstanding through the periods presented |
| Institutional Class |
| NET ASSET VALUE, BEGINNING OF PERIOD |
| INCOME FROM OPERATIONS: |
Net investment income(a) |
| Net realized and unrealized gain/(loss) on investments |
| Total from investment operations |
| LESS DISTRIBUTIONS: |
| From net investment income |
| From net realized gains on investments |
| Total distributions |
| REDEMPTION FEES ADDED TO PAID IN CAPITAL |
| NET INCREASE/(DECREASE) IN NET ASSET VALUE |
| NET ASSET VALUE, END OF PERIOD |
|
TOTAL RETURN(d) |
| SUPPLEMENTAL DATA: |
| Net assets, end of period (in 000s) |
| RATIOS TO AVERAGE NET ASSETS: |
| Operating expenses excluding reimbursement/waiver |
| Operating expenses including reimbursement/waiver |
| Net investment income including reimbursement/waiver |
| PORTFOLIO TURNOVER RATE |
(a) | Calculated using the average shares method. |
(b) | Less than $(0.005) per share. |
(c) | Less than $0.005 per share. |
(d) | Total returns would have been lower had certain expenses not been waived during the period. Returns shown do not reflect the deduction of taxes that a shareholder would pay on Fund distributions or the redemption of Fund shares. |
(e) | Effective September 1, 2014, the Adviser agreed to limit expenses to 1.05%. Prior to September 1, 2014, the Adviser agreed to limit expenses to 1.25%. (See Note 6). |
See accompanying Notes to Financial Statements.
| 38 | (855) 732-9220 seafarerfunds.com |
| Seafarer Overseas Growth and Income Fund |
| For a share outstanding through the periods presented |
Year Ended April 30, 2017 | | | Year Ended April 30, 2016 | | | Year Ended April 30, 2015 | | | Year Ended April 30, 2014 | | | Year Ended April 30, 2013 | |
| $ | 11.46 | | | $ | 12.66 | | | $ | 11.59 | | | $ | 11.91 | | | $ | 10.18 | |
| | | | | | | | | | | | | | | | | | | |
| | 0.21 | | | | 0.19 | | | | 0.15 | | | | 0.21 | | | | 0.14 | |
| | 1.07 | | | | (1.26 | ) | | | 1.28 | | | | 0.02 | | | | 1.71 | |
| | 1.28 | | | | (1.07 | ) | | | 1.43 | | | | 0.23 | | | | 1.85 | |
| | | | | | | | | | | | | | | | | | | |
| | (0.20 | ) | | | (0.12 | ) | | | (0.21 | ) | | | (0.27 | ) | | | (0.12 | ) |
| | – | | | | (0.02 | ) | | | (0.15 | ) | | | (0.28 | ) | | | (0.00 | )(b) |
| | (0.20 | ) | | | (0.14 | ) | | | (0.36 | ) | | | (0.55 | ) | | | (0.12 | ) |
| | 0.00 | (c) | | | 0.01 | | | | 0.00 | (c) | | | 0.00 | (c) | | | 0.00 | (c) |
| | 1.08 | | | | (1.20 | ) | | | 1.07 | | | | (0.32 | ) | | | 1.73 | |
| $ | 12.54 | | | $ | 11.46 | | | $ | 12.66 | | | $ | 11.59 | | | $ | 11.91 | |
| | | | | | | | | | | | | | | | | | | |
| | 11.37 | % | | | (8.32 | %) | | | 12.76 | % | | | 2.12 | % | | | 18.33 | % |
| | | | | | | | | | | | | | | | | | | |
| $ | 1,500,310 | | | $ | 605,178 | | | $ | 129,714 | | | $ | 46,624 | | | $ | 11,486 | |
| | | | | | | | | | | | | | | | | | | |
| | 0.92 | % | | | 1.03 | % | | | 1.18 | % | | | 1.61 | % | | | 2.88 | % |
| | 0.92 | % | | | 1.03 | % | | | 1.10 | %(e) | | | 1.25 | % | | | 1.35 | % |
| | 1.82 | % | | | 1.72 | % | | | 1.30 | % | | | 1.89 | % | | | 1.28 | % |
| | 14 | % | | | 7 | % | | | 28 | % | | | 51 | % | | | 39 | % |
See accompanying Notes to Financial Statements.
| Annual Report – April 30, 2017 | 39 |
| Financial Highlights | Seafarer Overseas Value Fund |
| For a share outstanding through the period presented | |
| Investor Class | | May 31, 2016 (Inception) to April 30, 2017 | |
| NET ASSET VALUE, BEGINNING OF PERIOD | | $ | 10.00 | |
| INCOME FROM OPERATIONS: | | | | |
Net investment income(a) | | | 0.12 | |
| Net realized and unrealized gain on investments | | | 1.28 | |
| Total from investment operations | | | 1.40 | |
| | | | | |
| LESS DISTRIBUTIONS: | | | | |
| From net investment income | | | (0.10 | ) |
| Total distributions | | | (0.10 | ) |
| NET INCREASE IN NET ASSET VALUE | | | 1.30 | |
| NET ASSET VALUE, END OF PERIOD | | $ | 11.30 | |
| | | | | |
TOTAL RETURN(b) | | | 14.15 | % |
| SUPPLEMENTAL DATA: | | | | |
| Net assets, end of period (in 000s) | | $ | 280 | |
| RATIOS TO AVERAGE NET ASSETS: | | | | |
| Operating expenses excluding reimbursement/waiver | | | 3.71 | %(c) |
| Operating expenses including reimbursement/waiver | | | 1.15 | %(c) |
| Net investment income including reimbursement/waiver | | | 1.24 | %(c) |
PORTFOLIO TURNOVER RATE(d) | | | 0 | % |
(a) | Calculated using the average shares method. |
(b) | Total returns are for the period indicated and have not been annualized. Total returns would have been lower had certain expenses not been waived during the period. Returns shown do not reflect the deduction of taxes that a shareholder would pay on Fund distributions or the redemption of Fund shares. |
(d) | Portfolio turnover rate for periods less than one full year have not been annualized. |
See accompanying Notes to Financial Statements.
| 40 | (855) 732-9220 seafarerfunds.com |
| Financial Highlights | Seafarer Overseas Value Fund |
| For a share outstanding through the period presented |
| Institutional Class | | May 31, 2016 (Inception) to April 30, 2017 | |
| NET ASSET VALUE, BEGINNING OF PERIOD | | $ | 10.00 | |
| INCOME FROM OPERATIONS: | | | | |
Net investment income(a) | | | 0.13 | |
| Net realized and unrealized gain on investments | | | 1.28 | |
| Total from investment operations | | | 1.41 | |
| | | | | |
| LESS DISTRIBUTIONS: | | | | |
| From net investment income | | | (0.13 | ) |
| Total distributions | | | (0.13 | ) |
| NET INCREASE IN NET ASSET VALUE | | | 1.28 | |
| NET ASSET VALUE, END OF PERIOD | | $ | 11.28 | (b) |
| | | | | |
TOTAL RETURN(c) | | | 14.18 | %(d) |
| SUPPLEMENTAL DATA: | | | | |
| Net assets, end of period (in 000s) | | $ | 9,846 | |
| RATIOS TO AVERAGE NET ASSETS: | | | | |
| Operating expenses excluding reimbursement/waiver | | | 3.63 | %(e) |
| Operating expenses including reimbursement/waiver | | | 1.05 | %(e) |
| Net investment income including reimbursement/waiver | | | 1.36 | %(e) |
PORTFOLIO TURNOVER RATE(f) | | | 0 | % |
(a) | Calculated using the average shares method. |
(b) | In preparing the financial statements in accordance with U.S. GAAP, management made certain adjustments as required by U.S. GAAP which caused the net asset value for purposes of these financial statements to differ from the net asset value used to process shareholder transactions as of the date of these financial statements. As a result, the net asset value decreased by $0.01 from $11.29 to $11.28. |
(c) | Total returns are for the period indicated and have not been annualized. Total returns would have been lower had certain expenses not been waived during the period. Returns shown do not reflect the deduction of taxes that a shareholder would pay on Fund distributions or the redemption of Fund shares. |
(d) | Includes adjustments in accordance with U.S. GAAP and as such, the total return for shareholder transactions reported to the market may differ from the total return for financial reporting purposes. As a result, the total return decreased by 0.11% from 14.29% to 14.18%. |
(f) | Portfolio turnover rate for periods less than one full year have not been annualized. |
See accompanying Notes to Financial Statements.
| Annual Report – April 30, 2017 | 41 |
| Seafarer Funds | Notes to Financial Statements |
April 30, 2017
NOTES TO FINANCIAL STATEMENTS
1. Organization
Financial Investors Trust (the “Trust”), a Delaware statutory trust, is an open-end management investment company registered under the Investment Company Act of 1940, as amended (“1940 Act”). The Trust consists of multiple separate portfolios or series. This annual report describes the Seafarer Overseas Growth and Income Fund and the Seafarer Overseas Value Fund (individually a “Fund” and collectively, the “Funds”). The Seafarer Overseas Growth and Income Fund seeks to provide long-term capital appreciation along with some current income; it also seeks to mitigate adverse volatility in returns as a secondary objective. The Seafarer Overseas Value Fund seeks to provide long-term capital appreciation. The Seafarer Overseas Value Fund launched on May 31, 2016. The Funds each offer Investor Class and Institutional Class shares.
2. Significant Accounting Policies
The accompanying financial statements were prepared in accordance with accounting principles generally accepted in the United States of America (“U.S. GAAP”). The preparation of financial statements in conformity with U.S. GAAP requires management to make certain estimates and assumptions that affect the reported amounts of assets and liabilities and disclosures of contingent assets and liabilities at the date of the financial statements and the reported amounts of revenue and expenses during the period. Actual results could differ from those estimates. The Funds are considered an investment company for financial reporting purposes under U.S. GAAP. The following is a summary of significant accounting policies consistently followed by the Funds in preparation of their financial statements.
Investment Valuation
Each Fund generally values its securities based on market prices determined at the close of regular trading on the New York Stock Exchange (“NYSE”), normally 4:00 p.m. Eastern Time, on each day the NYSE is open for trading.
For equity securities and exchange traded funds, the market price is usually the closing sale or official closing price on that exchange. In the case of equity securities not traded on an exchange, or if such closing prices are not otherwise available, the securities are valued at the mean of the most recent bid and ask prices on such day. Redeemable securities issued by open-end registered investment companies are valued at the investment company’s applicable net asset value, with the exception of exchange-traded open-end investment companies, which are priced as equity securities.
Equity securities that are primarily traded on foreign securities exchanges are valued at the closing values of such securities on their respective foreign exchanges, except when an event occurs subsequent to the close of the foreign exchange but before the close of the NYSE, such that the securities’ value would likely change. In such an event, the fair values of those securities are determined in good faith through consideration of other factors in accordance with procedures established by and under the general supervision of the Board of Trustees (the “Board”). Each Fund uses a fair valuation model provided by an independent pricing service, which is intended to reflect fair value when a security’s value or a meaningful portion of the Fund’s portfolio is believed to have been materially affected by a valuation event that has occurred between the close of the exchange or market on which the security is traded and the close of the regular trading day on the NYSE. The Funds’ valuation procedures set forth certain triggers that inform each Fund when to use the fair valuation model.
The market price for debt obligations is generally the price supplied by an independent third-party pricing service approved by the Board, which may use a matrix, formula or other objective method that takes into consideration quotations from dealers, market transactions in comparable investments, market indices and yield curves. If vendors are unable to supply a price, or if the price supplied is deemed to be unreliable, the market price may be determined using quotations received from one or more broker-dealers that make a market in the security. Corporate bonds and convertible bonds are valued using market models that consider trade data, quotations from dealers and active market makers, relevant yield curve and spread data, creditworthiness, trade data or market information on comparable securities, and other relevant security specific information. Publicly traded foreign government debt securities and foreign corporate bonds are typically traded internationally in the over-the-counter market and are valued at the mean between the bid and asked prices as of the close of business of that market.
| 42 | (855) 732-9220 seafarerfunds.com |
| Seafarer Funds | Notes to Financial Statements |
April 30, 2017
Forward currency exchange contracts have a market value determined by the prevailing foreign currency exchange daily rates and current foreign currency exchange forward rates. The foreign currency exchange forward rates are calculated using an automated system that estimates rates on the basis of the current day foreign currency exchange rates and forward foreign currency exchange rates supplied by a pricing service.
When such prices or quotations are not available, or when the Trust’s Valuation Committee believes that they are unreliable, securities may be priced using fair value procedures approved by the Board.
Certain foreign countries impose a tax on capital gains which is accrued by each Fund based on unrealized appreciation, if any, on affected securities. The tax is paid when the gain is realized.
Fair Value Measurements
Each Fund discloses the classification of its fair value measurements following a three-tier hierarchy based on the inputs used to measure fair value. Inputs refer broadly to the assumptions that market participants would use in pricing the asset or liability, including assumptions about risk. Inputs may be observable or unobservable. Observable inputs reflect the assumptions market participants would use in pricing the asset or liability. Such inputs are developed based on market data obtained from sources independent of the reporting entity. Unobservable inputs reflect the reporting entity’s own assumptions about the assumptions market participants would use in pricing the asset or liability, which are developed based on the information available and the reporting entity’s best efforts to interpret such information.
Various inputs are used in determining the value of the Funds’ investments as of the end of the reporting period. When inputs used fall into different levels of the fair value hierarchy, the level in the hierarchy within which the fair value measurement falls is determined based on the lowest level input that is significant to the fair value measurement in its entirety. The designated input levels are not necessarily an indication of the risk or liquidity associated with these investments. These inputs are categorized in the following hierarchy under applicable financial accounting standards:
| Level 1 – | Unadjusted quoted prices in active markets for identical investments, unrestricted assets or liabilities that the Funds have the ability to access at the measurement date; |
| Level 2 – | Quoted prices which are not active, quoted prices for similar assets or liabilities in active markets or inputs other than quoted prices that are observable (either directly or indirectly) for substantially the full term of the asset or liability; and |
| Level 3 – | Significant unobservable prices or inputs (including the Funds’ own assumptions in determining the fair value of investments) where there is little or no market activity for the asset or liability at the measurement date. |
| Annual Report – April 30, 2017 | 43 |
| Seafarer Funds | Notes to Financial Statements |
April 30, 2017
The following is a summary of the inputs used to value each Fund as of April 30, 2017:
Investments in Securities at Value(a) | | Level 1 - Quoted Prices | | | Level 2 - Other Significant Observable Inputs | | | Level 3 - Significant Unobservable Inputs | | | Total | |
| Seafarer Overseas Growth and Income Fund | | | | | | | | | | |
| Common Stocks | | $ | 1,962,590,781 | | | $ | – | | | $ | – | | | $ | 1,962,590,781 | |
| Preferred Stocks | | | 167,545,286 | | | | – | | | | – | | | | 167,545,286 | |
| Corporate Bond ‐ Foreign Currency | | | – | | | | 31,316,198 | | | | – | | | | 31,316,198 | |
| Corporate Bond ‐ USD | | | – | | | | 19,300,000 | | | | – | | | | 19,300,000 | |
| Medium/Long‐term Government Bond ‐ Foreign Currency | | | – | | | | 58,027,350 | | | | – | | | | 58,027,350 | |
| Short‐term Government Bond ‐ USD/Foreign Currency | | | – | | | | 70,574,094 | | | | – | | | | 70,574,094 | |
| Total | | $ | 2,130,136,067 | | | $ | 179,217,642 | | | $ | – | | | $ | 2,309,353,709 | |
Investments in Securities at Value(a) | | Level 1 - Quoted Prices | | | Level 2 - Other Significant Observable Inputs | | | Level 3 - Significant Unobservable Inputs | | | Total | |
| Seafarer Overseas Value Fund | | | | | | | | | | | | |
| Common Stocks | | $ | 8,222,195 | | | $ | – | | | $ | – | | | $ | 8,222,195 | |
| Total | | $ | 8,222,195 | | | $ | – | | | $ | – | | | $ | 8,222,195 | |
(a) | For detailed descriptions of securities by country, see the accompanying Portfolio of Investments. |
The Funds recognize transfers between levels as of the end of the period. For the year or period ended April 30, 2017, the Funds did not have any securities that used significant unobservable inputs (Level 3) in determining fair value.
Each Fund utilizes a fair value evaluation service with respect to international securities with an earlier market closing than the Fund’s net asset value computation cutoff. When events trigger the use of the fair value evaluation service on a reporting period date, it results in certain securities transferring from a Level 1 to a Level 2 classification. For the period or year ended April 30, 2017, the Funds did not have any transfers between Level 1 and Level 2 securities.
Investment Transactions and Investment Income
Investment transactions are accounted for on the date the investments are purchased or sold (trade date). Realized gains and losses from investment transactions are reported on an identified cost basis. Interest income, which includes accretion of discounts and amortization of premiums, is accrued and recorded as earned. Dividend income is recognized on the ex-dividend date or for certain foreign securities, as soon as information is available to the Funds. All of the realized and unrealized gains and losses and net investment income are allocated daily to each class in proportion to its average daily net assets.
| 44 | (855) 732-9220 seafarerfunds.com |
| Seafarer Funds | Notes to Financial Statements |
April 30, 2017
Cash Management Transactions
Each of the Funds subscribes to the Brown Brothers Harriman & Co. (“BBH”) Cash Management Service (“CMS”), whereby cash balances are automatically swept into overnight offshore demand deposits with either the BBH Grand Cayman branch or a branch of a pre-approved commercial bank. This fully automated program allows the Funds to earn interest on cash balances. Excess cash with deposit institutions domiciled outside of the U.S. are subject to sovereign actions in the jurisdiction of the deposit institution including, but not limited to, freeze, seizure or diminution. Cash balances in the BBH CMS are included on the Statement of Assets and Liabilities under Cash and Foreign Currency, at value. As of April 30, 2017, the Funds had the following cash balances participating in the BBH CMS:
| Fund | | | |
| Seafarer Overseas Growth and Income Fund | | $ | 60,276,683 | |
| Seafarer Overseas Value Fund | | | 1,904,671 | |
As of April 30, 2017, the Funds had the following foreign cash balances participating in the BBH CMS (cost and value of foreign cash balances are equal):
| Fund | | | |
| Seafarer Overseas Growth and Income Fund | | $ | 1,496,962 | |
| Seafarer Overseas Value Fund | | | – | |
Foreign Securities
The Funds may directly purchase securities of foreign issuers. Investing in securities of foreign issuers involves special risks not typically associated with investing in securities of U.S. issuers. The risks include possible revaluation of currencies, the inability to repatriate foreign currency, less complete financial information about companies, and possible future adverse political and economic developments. Moreover, securities of many foreign issuers and their markets may be less liquid and their prices more volatile than those of securities of comparable U.S. issuers.
Foreign Currency Translation
The books and records of the Funds are maintained in U.S. dollars. Investment valuations and other assets and liabilities initially expressed in foreign currencies are converted each business day into U.S. dollars based upon current exchange rates. Prevailing foreign exchange rates may generally be obtained at the close of the NYSE (normally, 4:00 p.m. Eastern time). The portion of realized and unrealized gains or losses on investments due to fluctuations in foreign currency exchange rates is not separately disclosed and is included in realized and unrealized gains or losses on investments, when applicable.
Foreign Currency Spot Contracts
Each Fund may enter into foreign currency spot contracts to facilitate transactions in foreign securities or to convert foreign currency receipts into U.S. dollars. A foreign currency spot contract is an agreement between two parties to buy and sell currencies at the current market rate, for settlement generally within two business days. The U.S. dollar value of a contract is determined using current currency exchange rates supplied by a pricing service. The contract is marked-to-market daily for settlements beyond one day and any change in market value is recorded as an unrealized gain or loss. When the contract is closed, the Fund records a realized gain or loss equal to the difference between the value on the open and close date. Losses may arise from changes in the value of the foreign currency, or if the counterparties do not perform under the contract’s terms. The maximum potential loss from such contracts is the aggregate face value in U.S. dollars at the time the contract was opened.
Trust Expenses
Some expenses of the Trust can be directly attributed to the Funds. Expenses which cannot be directly attributed to the Funds are apportioned among all funds in the Trust based on the average daily net assets of each fund.
| Annual Report – April 30, 2017 | 45 |
| Seafarer Funds | Notes to Financial Statements |
April 30, 2017
Fund and Class Expenses
Expenses that are specific to a Fund or class of shares of a Fund, including shareholder servicing fees, are charged directly to that Fund or share class. Expenses that are common to all Funds are generally allocated among the Funds in proportion to their average daily net assets.
Offering Costs
Offering costs, including costs of printing initial prospectuses, legal and registration fees, are being amortized over twelve months from the inception date of the Seafarer Overseas Value Fund. Amounts amortized during the period ended April 30, 2017 for the Seafarer Overseas Value Fund are shown on the Statements of Operations. As of April 30, 2017, $5,362, of offering costs remain to be amortized for the Seafarer Overseas Value Fund.
Federal Income Taxes
Each Fund complies with the requirements under Subchapter M of the Internal Revenue Code of 1986, as amended, applicable to regulated investment companies and intends to distribute substantially all of its net taxable income and net capital gains, if any, each year so that it will not be subject to excise tax on undistributed income and gains. The Funds are not subject to income taxes to the extent such distributions are made.
As of and during the year or period ended April 30, 2017, the Funds did not have a liability for any unrecognized tax benefits. The Funds file U.S. federal, state, and local tax returns as required. The Funds’ tax returns are subject to examination by the relevant tax authorities until expiration of the applicable statute of limitations, which is generally three years after the filing of the tax return for federal purposes and four years for most state returns. Tax returns for open years have incorporated no uncertain tax positions that require a provision for income taxes.
Distributions to Shareholders
In general, the Seafarer Overseas Growth and Income Fund’s policy is to distribute to its shareholders substantially all net investment income, paid out via two semi-annual dividends, in June and December. The Seafarer Overseas Value Fund’s policy is to distribute to its shareholders substantially all net investment income via one annual dividend in December. It is also each Fund’s policy to distribute annually all net realized short-term and long-term capital gains, if any, after offsetting any capital loss carryovers. Income dividend distributions are derived from dividends and other income each Fund receives from its investments, including short-term capital gains. Long-term capital gain distributions are derived from gains realized when a Fund sells a security it has owned for more than one year. Each Fund may make additional distributions if Seafarer Capital Partners, LLC (the “Adviser”) believes doing so may be necessary for the Fund to avoid or reduce taxes.
3. Tax Basis Information
Reclassifications
As of April 30, 2017, permanent differences in book and tax accounting were reclassified. These differences had no effect on net assets and were primarily attributed to organizational costs, equalization, PFICs and foreign currency. The reclassifications were as follows:
| | | Paid-in Capital | | | Accumulated Net Investment Income/(Loss) | | | Accumulated Net Realized Gain | |
| Seafarer Overseas Growth and Income Fund | | $ | 177,704 | | | $ | (2,528,353 | ) | | $ | 2,350,649 | |
| Seafarer Overseas Value Fund | | | (20,486 | ) | | | 17,722 | | | | 2,764 | |
| 46 | (855) 732-9220 seafarerfunds.com |
| Seafarer Funds | Notes to Financial Statements |
April 30, 2017
Tax Basis of Investments
As of April 30, 2017, the aggregate cost of investments, gross unrealized appreciation/(depreciation) and net unrealized appreciation for Federal tax purposes were as follows:
| | | Cost of Investments | | | Gross Unrealized Appreciation | | | Gross Unrealized Depreciation | | | Net Appreciation/ (Depreciation) on Foreign Currencies | | | Net Unrealized Appreciation | |
| Seafarer Overseas Growth and Income Fund | | $ | 2,102,930,692 | | | $ | 284,721,774 | | | $ | (78,298,757 | ) | | $ | (593,312 | ) | | $ | 205,829,705 | |
| Seafarer Overseas Value Fund | | | 7,523,760 | | | | 924,953 | | | | (226,518 | ) | | | 246 | | | | 698,681 | |
Components of Distributable Earnings
As of April 30, 2017, components of distributable earnings were as follows:
| Seafarer Overseas Growth and Income Fund | | | |
| Accumulated net investment income | | $ | 8,351,235 | |
| Accumulated net realized loss | | | (18,700,308 | ) |
| Net unrealized appreciation on investments | | | 205,829,705 | |
| Total distributable earnings | | $ | 195,480,632 | |
| | | | | |
| Seafarer Overseas Value Fund | | | | |
| Accumulated net investment income | | $ | 99,825 | |
| Accumulated net realized loss | | | (4 | ) |
| Net unrealized appreciation on investments | | | 698,681 | |
| Total distributable earnings | | $ | 798,502 | |
Capital Losses
As of April 30, 2017, the following funds have available for Federal income tax purposes unused capital losses that may be used to offset future realized capital gains. The capital losses may be carried forward indefinitely to offset future realized gains. Capital losses carried forward were as follows:
| | | Short-Term | | | Long-Term | |
| Seafarer Overseas Growth and Income Fund | | $ | 11,984,220 | | | $ | 6,716,088 | |
| Seafarer Overseas Value Fund | | | 4 | | | | – | |
Tax Basis of Distributions to Shareholders
The character of distributions made during the year from net investment income or net realized gains may differ from the ultimate characterization for federal income tax purposes. Also, due to the timing of dividend distributions, the fiscal year in which amounts are distributed may differ from the fiscal year in which the income or realized gain is recorded by the Funds.
| Annual Report – April 30, 2017 | 47 |
| Seafarer Funds | Notes to Financial Statements |
April 30, 2017
The tax character of distributions paid by the Funds for the fiscal year or period ended April 30, 2017 was as follows:
| | | Ordinary Income | | | Long-Term Capital Gain | |
| Seafarer Overseas Growth and Income Fund | | $ | 27,085,171 | | | $ | – | |
| Seafarer Overseas Value Fund | | | 62,391 | | | | – | |
The tax character of distributions paid by the Seafarer Overseas Growth and Income Fund for the fiscal year ended April 30, 2016 was as follows:
| | | Ordinary Income | | | Long-Term Capital Gain | |
| Seafarer Overseas Growth and Income Fund | | $ | 5,441,611 | | | $ | 1,748,524 | |
4. Securities Transactions
The cost of purchases and proceeds from sales of securities excluding short term securities during the year or period ended April 30, 2017 was as follows:
| | | Purchases of Securities | | | Proceeds From Sales of Securities | |
| Seafarer Overseas Growth and Income Fund | | $ | 1,246,241,785 | | | $ | 224,446,666 | |
| Seafarer Overseas Value Fund | | | 7,447,354 | | | | – | |
5. Shares of Beneficial Interest
The capitalization of the Trust consists of an unlimited number of shares of beneficial interest with no par value per share. Holders of shares of the Funds of the Trust have one vote for each share held and a proportionate fraction of a vote for each fractional share. All shares issued and outstanding are fully paid and are transferable and redeemable at the option of the shareholder. Purchasers of the shares do not have any obligation to make payments to the Trust or its creditors solely by reason of the purchasers’ ownership of the shares. Shares have no pre-emptive rights.
Prior to August, 31, 2016, shares redeemed within 90 days of purchase may incur a 2% short-term redemption fee deducted from the redemption amount. The redemption fee is reflected in the “Shares redeemed, net of redemption fees” in the Statements of Changes in Net Assets. Effective August 31, 2016, the Funds no longer impose a redemption fee.
| 48 | (855) 732-9220 seafarerfunds.com |
| Seafarer Funds | Notes to Financial Statements |
April 30, 2017
During the year or period ended April 30, 2017, and the year ended April 30, 2016, the Funds retained the following redemption fees:
| Fund | | For the Year or period ended April 30, 2017 | | | For the Year ended April 30, 2016 | |
| Seafarer Overseas Growth and Income Fund | | | | | | |
| Investor Class | | $ | 40,363 | | | $ | 136,085 | |
| Institutional Class | | $ | 49,013 | | | $ | 152,697 | |
Seafarer Overseas Value Fund(a) | | | | | | | | |
| Investor Class | | $ | – | | | $ | – | |
| Institutional Class | | $ | – | | | $ | – | |
(a) | The Seafarer Overseas Value Fund launched on May 31, 2016. |
6. Management and Related Party Transactions
The Adviser, subject to the authority of the Board, is responsible for the overall management and administration of the Funds’ business affairs. The Adviser manages the investments of the Funds in accordance with the Funds’ investment objectives, policies, limitations and investment guidelines established jointly by the Adviser and the Trustees. Pursuant to the investment advisory agreement, the Funds, in the aggregate, pay the Adviser an annual management fee of 0.75% of the aggregate average daily net assets of the Funds up to $1.5 billion and 0.70% of the aggregate average daily net assets of the Funds over $1.5 billion. Each Fund pays the Adviser a monthly fee at the annual rate using the applicable management fee calculated based on the Fund’s pro rata share of the Funds’ combined average daily net assets. Prior to August 31, 2016, the Funds paid the Adviser an annual management fee of 0.75% of the aggregate average daily net assets of the Funds. The management fee is paid on a monthly basis.
Effective September 1, 2014, the Adviser contractually agreed to limit certain Fund expenses (excluding brokerage expenses, interest expenses, taxes and extraordinary expenses) to 1.25% and 1.05% of the Funds’ average daily net assets in the Investor and Institutional share classes, respectively, through August 31, 2015. Effective September 1, 2015, the Adviser contractually agreed to waive and/or reimburse fees or expenses in order to limit Total Annual Fund Operating Expenses After Fee Waiver / Expense Reimbursements (excluding brokerage expenses, interest expenses, taxes and extraordinary expenses) to 1.15% and 1.05% of the Funds’ average daily net assets for the Investor and Institutional share classes respectively. This agreement (the “Expense Agreement”) is in effect through August 31, 2017. The Adviser will be permitted to recover, on a class-by-class basis, expenses it has borne through the Expense Agreement to the extent that the Funds’ expenses in later periods fall below the expense cap in effect at the time of waiver or reimbursement. The Funds will not be obligated to pay any such deferred fees and expenses more than three years after the end of the fiscal year(s) in which the fees and expenses were deferred. This agreement may not be terminated or modified prior to August 31, 2017, except with the approval of the Funds’ Board. During the year or period ended April 30, 2017, the Adviser agreed that it will only seek to recoup waived management fees and will not recoup any reimbursed expenses. As of April 30, 2017, the Adviser has recouped all available waived management fees from the Seafarer Overseas Growth and Income Fund.
| Annual Report – April 30, 2017 | 49 |
| Seafarer Funds | Notes to Financial Statements |
April 30, 2017
For the period ended April 30, 2017, the fee waivers and/or reimbursements were as follows for the Seafarer Overseas Value Fund:
| Fund | | Fees Waived/Reimbursed By Adviser | |
Seafarer Overseas Value Fund(a) | | | |
| Investor Class | | $ | 4,303 | |
| Institutional Class | | | 125,280 | |
(a) | The Seafarer Overseas Value Fund launched on May 31, 2016. |
As of April 30, 2017, the balances of recoupable expenses for each class were as follows for the Funds:
| Fund | | Expires 2020 | | | Total | |
| Seafarer Overseas Growth and Income Fund | | | | | | |
| Investor Class | | $ | – | | | $ | – | |
| Institutional Class | | | – | | | | – | |
| Seafarer Overseas Value Fund | | | | | | | | |
| Investor Class | | $ | 1,168 | | | $ | 1,168 | |
| Institutional Class | | | 34,396 | | | | 34,396 | |
Fund Administrator
ALPS Fund Services, Inc. (“ALPS” and the “Administrator”) (an affiliate of ALPS Distributors, Inc.) provides administrative, fund accounting and other services to the Funds under the Administration, Bookkeeping and Pricing Services Agreement with the Trust.
The Funds’ administrative fee is accrued on a daily basis and paid monthly. The Administrator is also reimbursed by the Funds for certain out-of-pocket expenses. Administration fees paid by the Funds for the year or period ended April 30, 2017 are disclosed in the Statements of Operations.
Transfer Agent
ALPS serves as transfer, dividend paying and shareholder servicing agent for the Funds (“Transfer Agent”). ALPS is paid an annual base fee per Fund and a fee based on the number of shareholder accounts. The Transfer Agent is also reimbursed by the Funds for certain out-of-pocket expenses. Transfer agent fees paid by the Funds for the year or period ended April 30, 2017 are disclosed in the Statements of Operations.
Compliance Services
ALPS provides compliance services to the Funds under the Chief Compliance Officer Services Agreement with the Trust. ALPS provides services that assist the Trust’s chief compliance officer in monitoring and testing the policies and procedures of the Trust in accordance with the requirements of Rule 38a-1 under the 1940 Act. ALPS is paid an annual base fee and is reimbursed for certain out-of-pocket expenses. Compliance service fees paid by the Funds for the year or period ended April 30, 2017 are disclosed in the Statements of Operations.
| 50 | (855) 732-9220 seafarerfunds.com |
| Seafarer Funds | Notes to Financial Statements |
April 30, 2017
Principal Financial Officer
ALPS provides principal financial officer services to the Funds under the Principal Financial Officer Services Agreement with the Trust. Under this Agreement, ALPS is paid an annual base fee and is reimbursed for certain out-of-pocket expenses. Principal financial officer fees paid by the Funds for the year or period ended April 30, 2017 are disclosed in the Statements of Operations.
Distributor
ALPS Distributors, Inc. (“ADI” or the “Distributor”) (an affiliate of ALPS) acts as the distributor of the Funds’ shares pursuant to the Distribution Agreement with the Trust. Under a side letter agreement, the Adviser pays ADI an annual base fee of $12,000 per Fund for the distribution services. The Adviser also reimburses ADI for certain out-of-pocket expenses. Shares are sold on a continuous basis by ADI as agent for the Funds, and ADI has agreed to use its best efforts to solicit orders for the sale of the Funds’ shares, although it is not obliged to sell any particular amount of shares. ADI is registered as a broker-dealer with the U.S. Securities and Exchange Commission.
Shareholder Service Plan for Investor Class and Institutional Class Shares
Each Fund has adopted a Shareholder Services Plan (a “Services Plan”) for each of its share classes. Under the Services Plan, each Fund is authorized to enter into shareholder service agreements with investment advisers, financial institutions and other service providers (“Participating Organizations”) to maintain and provide certain administrative and servicing functions in relation to the accounts of shareholders. Shareholder service arrangements typically include processing orders for shares, generating account and confirmation statements, sub-accounting, account maintenance, tax reporting, and disbursing cash dividends as well as other investment or administrative services required for the particular Participating Organizations’ products, programs, platform and accounts. The Services Plan will cause each Fund to pay an aggregate fee, not to exceed on an annual basis 0.15% and 0.05% of the average daily net asset value of the Investor and Institutional share classes, respectively. Such payments will be made on assets attributable to or held in the name of a Participating Organization, on behalf of its clients as compensation for providing service activities pursuant to an agreement with the Participating Organization. Any amount of such payment not paid to a Participating Organization during a Fund’s fiscal year for such service activities shall be reimbursed to the Fund as soon as practicable. Fees recaptured pursuant to the Services Plan for the period or year ended April 30, 2017 are included as an offset to shareholder service plan fees as disclosed in the Statements of Operations.
7. Indemnifications
Under the Trust’s organizational documents, its officers and Trustees are indemnified against certain liability arising out of the performance of their duties to the Trust. Additionally, in the normal course of business, the Trust enters into contracts with service providers that may contain general indemnification clauses, which may permit indemnification to the extent permissible under the applicable law. The Trust’s maximum exposure under these arrangements is unknown, as this would involve future claims that may be made against the Trust that have not yet occurred.
8. Recent Accounting Pronouncement
On October 13, 2016, the SEC amended Regulation S-X, which will require standardized, enhanced disclosure about derivatives in investment company financial statements, as well as other amendments. The compliance date for the amendments to Regulation S-X is August 1, 2017. Management is currently evaluating the impact to the financial statements and disclosures.
| Annual Report – April 30, 2017 | 51 |
| Seafarer Funds | Report of Independent Registered Public Accounting Firm |
April 30, 2017
To the Shareholders and Board of Trustees of Financial Investors Trust:
We have audited the accompanying statements of assets and liabilities, including the portfolios of investments, of Seafarer Overseas Growth and Income Fund and Seafarer Overseas Value Fund (the “Funds”), two of the portfolios constituting Financial Investors Trust, as of April 30, 2017, and as to Seafarer Overseas Growth and Income Fund, the related statement of operations for the year then ended, the statements of changes in net assets for each of the two years in the period then ended, and the financial highlights for each of the five years in the period then ended, and as to Seafarer Overseas Value Fund, the related statements of operations, changes in net assets, and the financial highlights for the period May 31, 2016 (Inception) to April 30, 2017. These financial statements and financial highlights are the responsibility of the Funds’ management. Our responsibility is to express an opinion on these financial statements and financial highlights based on our audits.
We conducted our audits in accordance with the standards of the Public Company Accounting Oversight Board (United States). Those standards require that we plan and perform the audit to obtain reasonable assurance about whether the financial statements and financial highlights are free of material misstatement. The Funds are not required to have, nor were we engaged to perform, an audit of their internal control over financial reporting. Our audits included consideration of internal control over financial reporting as a basis for designing audit procedures that are appropriate in the circumstances, but not for the purpose of expressing an opinion on the effectiveness of the Funds’ internal control over financial reporting. Accordingly, we express no such opinion. An audit also includes examining, on a test basis, evidence supporting the amounts and disclosures in the financial statements, assessing the accounting principles used and significant estimates made by management, as well as evaluating the overall financial statement presentation. Our procedures included confirmation of securities owned as of April 30, 2017, by correspondence with the custodian and brokers; when replies were not received from brokers, we performed other auditing procedures. We believe that our audits provide a reasonable basis for our opinion.
In our opinion, the financial statements and financial highlights referred to above present fairly, in all material respects, the financial position of Seafarer Overseas Growth and Income Fund and Seafarer Overseas Value Fund of Financial Investors Trust as of April 30, 2017, and as to Seafarer Overseas Growth and Income Fund, the results of its operations for the year then ended, the changes in its net assets for each of the two years in the period then ended, and the financial highlights for each of the five years in the period then ended, and as to Seafarer Overseas Value Fund, the results of its operations, the changes in its net assets, and the financial highlights for the period May 31, 2016 (Inception) to April 30, 2017, in conformity with accounting principles generally accepted in the United States of America.
| DELOITTE & TOUCHE LLP |
| |
| Denver, Colorado |
| June 27, 2017 |
| 52 | (855) 732-9220 seafarerfunds.com |
| Seafarer Funds | Additional Information |
April 30, 2017 (Unaudited)
ADDITIONAL INFORMATION
1. Fund Holdings
Each Fund files its complete schedule of portfolio holdings with the Securities and Exchange Commission (the “SEC”) for the first and third quarters of each fiscal year on Form N-Q within 60 days after the end of the period. Copies of the Funds’ Form N-Q are available without charge on the SEC website at http://www.sec.gov. You may also review and copy the Form N-Q at the SEC’s Public Reference Room in Washington, D.C. For more information about the operation of the Public Reference Room, please call the SEC at 1-800-SEC-0330.
2. Fund Proxy Voting Policies, Procedures and Summaries
The Funds’ policies and procedures used in determining how to vote proxies and information regarding how the Funds voted proxies relating to portfolio securities during the most recent prior 12-month period ending June 30 are available without charge, (1) upon request, by calling toll-free (855) 732-9220 and (2) on the SEC’s website at http://www.sec.gov.
3. Tax Designations (Unaudited)
The Funds designates the following as a percentage of taxable ordinary income distributions, or up to the maximum amount allowable, for the calendar year ended December 31, 2016:
| | Dividends Received Deduction | Qualified Dividend Income |
| Seafarer Overseas Growth and Income Fund | 0.00% | 54.49% |
| Seafarer Overseas Value Fund | 0.00% | 9.22% |
In early 2017, if applicable, shareholders of record received this information for the distributions paid to them by the Funds during the calendar year 2016 via Form 1099. The Funds will notify shareholders in early 2018 of amounts paid to them by the Funds, if any, during the calendar year 2017.
The Seafarer Overseas Growth and Income Fund and the Seafarer Overseas Value Fund designate foreign taxes paid in the amount of $3,730,149 and $1,849 and foreign source income in the amount of $52,451,189 and $103,490, respectively, for federal income tax purposes for the year ended April 30, 2017.
Please consult a tax advisor if you have questions about federal or state income tax laws, or how to prepare your tax returns.
| Annual Report – April 30, 2017 | 53 |
| Seafarer Funds | Approval of Fund Advisory Agreement |
April 30, 2017 (Unaudited)
DISCLOSURE REGARDING APPROVAL OF FUND ADVISORY AGREEMENT
On December 13, 2016, the Trustees met in person to discuss, among other things, the approval of the investment advisory agreement between the Trust and the Adviser (the “Investment Advisory Agreement”), in accordance with Section 15(c) of the Investment Company Act of 1940, as amended. In renewing and approving the Investment Advisory Agreement, the Trustees, including the Independent Trustees, considered the following factors with respect to the Seafarer Overseas Growth and Income Fund (the “Growth and Income Fund”):
Investment Advisory Fee Rate
The Trustees reviewed and considered the contractual annual advisory fee paid by the Trust, on behalf of the Growth and Income Fund, to the Adviser of 0.75% of the Growth and Income Fund’s daily average net assets, in light of the extent and quality of the advisory services provided by the Adviser to the Growth and Income Fund.
The Board received and considered information including a comparison of the Growth and Income Fund’s contractual and actual management fees and overall expenses with those of funds in the expense group and universe of funds selected by an independent provider of investment company data (the “Data Provider”). The Trustees noted that the contractual management fee rate for the Institutional Class shares of the Growth and Income Fund was below the average and median contractual management fee rates of the Data Provider expense group.
Total Expense Ratios
Based on such information, the Trustees further reviewed and considered the total expense ratio (after waivers) of 1.024% for the Institutional Class of the Growth and Income Fund. The Trustees noted that the Growth and Income Fund’s total expense ratio (after waivers) was below the average and median total expense ratios of the Data Provider expense group (after waivers).
Nature, Extent, and Quality of the Services under the Investment Advisory Agreement
The Trustees received and considered information regarding the nature, extent, and quality of services provided to the Growth and Income Fund under the Investment Advisory Agreement. The Trustees reviewed certain background materials supplied by the Adviser in its presentation, including its Form ADV.
The Trustees reviewed and considered the Adviser’s investment advisory personnel, its history as an asset manager, and its performance and the amount of assets currently under management by the Adviser and its affiliated entities. The Trustees also reviewed the research and decision-making processes utilized by the Adviser, including the methods adopted to seek to achieve compliance with the investment objectives, policies and restrictions of the Growth and Income Fund.
The Trustees considered the background and experience of the Adviser’s management in connection with the Growth and Income Fund, including reviewing the qualifications, backgrounds, and responsibilities of the management team primarily responsible for the day-to-day portfolio management of the Fund and the extent of the resources devoted to research and analysis of actual and potential investments.
The Trustees also reviewed, among other things, the Adviser’s insider trading policies and procedures and its Code of Ethics.
Performance
The Trustees reviewed performance information for the Growth and Income Fund for the 1-year, 2-year, 3-year, and 4-year periods ended September 30, 2016. That review included a comparison of the Fund’s performance to the performance universe average of a group of funds selected by Data Provider. The Trustees noted the performance of the Fund was above the respective performance universe averages and above or near the benchmark for these periods. The Trustees also considered the Adviser’s discussion of the Fund’s underlying portfolio diversification categories, its top contributors and top detractors, as well as the Adviser’s performance and reputation generally and its investment techniques, risk management controls, and decision-making processes.
| 54 | (855) 732-9220seafarerfunds.com |
| Seafarer Funds | Approval of Fund Advisory Agreement |
April 30, 2017 (Unaudited)
Comparable Accounts
The Trustees noted certain information provided by the Adviser regarding fees charged to other Adviser clients and considered the Adviser’s statements indicating that there were no clients with investment mandates directly comparable to that of the Growth and Income Fund.
Profitability
The Trustees received and considered a retrospective and projected profitability analysis prepared by the Adviser based on the fees payable under the Investment Advisory Agreement with respect to the Growth and Income Fund. The Trustees considered the profits, if any, anticipated to be realized by the Adviser in connection with the operation of the Fund. The Board then reviewed the Adviser’s unaudited financial statements, including profit and loss statements for the year ended December 31, 2015 and the 6-month period ended June 30, 2016 and balance sheets for the same periods in order to analyze the financial condition and stability and profitability of the Adviser.
Economies of Scale
The Trustees considered whether economies of scale in the provision of services to the Growth and Income Fund will be passed along to the shareholders under the proposed agreements.
Other Benefits to the Adviser
The Trustees reviewed and considered any other incidental benefits derived or to be derived by the Adviser from its relationship with the Growth and Income Fund, including whether soft dollar arrangements were used.
In renewing the Adviser as the Growth and Income Fund’s investment adviser and renewing the Investment Advisory Agreement and the fees charged under the Investment Advisory Agreement, the Trustees concluded that no single factor reviewed by the Trustees was identified by the Trustees to be determinative as the principal factor in whether to renew the Investment Advisory Agreement. Further, the Independent Trustees were advised by separate independent legal counsel throughout the process. The Trustees, including all of the Independent Trustees, concluded that:
| ● | the Growth and Income Fund’s Institutional Class contractual management fee rate was below its Data Provider average and median expense group contractual management fee rate; |
| ● | the Growth and Income Fund’s Institutional Class total expense ratio (after waivers) was below its Data Provider average and median expense group total expense ratios (after waivers); |
| ● | the nature, extent, and quality of services rendered by the Adviser under the Investment Advisory Agreement with respect to the Growth and Income Fund were adequate; |
| ● | the performance of the Institutional Class of the Growth and Income Fund was above the average of the funds in its Data Provider performance universe for the 1-year, 2-year, 3-year, and 4-year periods ended September 30, 2016; |
| ● | bearing in mind the limitations of comparing different types of managed accounts and the different levels of service typically associated with such accounts, the fee structures applicable to the Adviser’s other clients were not indicative of any unreasonableness with respect to the advisory fees proposed to be payable by the Growth and Income Fund; |
| ● | the profit, if any, realized by the Adviser in connection with the operation of the Growth and Income Fund is not unreasonable to the Fund; and |
| Annual Report – April 30, 2017 | 55 |
| Seafarer Funds | Approval of Fund Advisory Agreement |
April 30, 2017 (Unaudited)
| ● | there were no material economies of scale or other incidental benefits accruing to the Adviser in connection with its relationship with the Growth and Income Fund. |
Based on the Trustees’ deliberations and their evaluation of the information described above, the Trustees, including all of the Independent Trustees, concluded that the Adviser’s compensation for investment advisory services is consistent with the best interests of the Growth and Income Fund and its shareholders.
| 56 | (855) 732-9220seafarerfunds.com |
| Seafarer Funds | Trustees and Officers |
April 30, 2017 (Unaudited)
Additional information regarding the Fund’s trustees is included in the Statement of Additional Information, which can be obtained without charge by calling 855-732-9220.
INDEPENDENT TRUSTEES
Name, Address* & Year of Birth | Position(s) Held with Fund | Term of Office** and Length of Time Served | Principal Occupation(s) During Past 5 Years*** | Number of Funds in Fund Complex Overseen by Trustee**** | Other Directorships Held by Trustee During Past 5 Years*** |
Mary K. Anstine, 1940 | Trustee and Chairman | Ms. Anstine was elected at a special meeting of shareholders held on March 21, 1997 and re-elected at a special meeting of shareholders held on August 7, 2009. Ms. Anstine was elected Chairman of the Board at the June 6, 2017, meeting of the Board of Trustees. | Ms. Anstine was formerly an Executive Vice President of First Interstate Bank of Denver until 1994, President/Chief Executive Officer of HealthONE Alliance, Denver, Colorado, from 1994 to 2004, and has been retired since 2004. Ms. Anstine is also Trustee/Director of AV Hunter Trust and Colorado Uplift Board. Ms. Anstine was formerly a Director of the Trust Bank of Colorado (later purchased and now known as Northern Trust Bank), HealthONE and Denver Area Council of the Boy Scouts of America, and a member of the American Bankers Association Trust Executive Committee. | 34 | Ms. Anstine is a Trustee of ALPS ETF Trust (20 funds); ALPS Variable Investment Trust (9 funds); Reaves Utility Income Fund (1 fund); and Westcore Trust (14 funds). |
Jeremy W. Deems, 1976 | Trustee | Mr. Deems was appointed as a Trustee at the March 11, 2008 meeting of the Board of Trustees and elected at a special meeting of shareholders held on August 7, 2009. | Mr. Deems is the Co-Founder, Chief Operations Officer and Chief Financial Officer of Green Alpha Advisors, LLC, a registered investment advisor, and Co- Portfolio Manager of the Shelton Green Alpha Fund. Prior to joining Green Alpha Advisors, Mr. Deems was CFO and Treasurer of Forward Management, LLC, ReFlow Management Co., LLC, ReFlow Fund, LLC, a private investment fund, and Sutton Place Management, LLC, an administrative services company, from 1998 to June 2007. From 2004 to 2005, Mr. Deems also served as Treasurer of the Forward Funds and the Sierra Club Funds. | 34 | Mr. Deems is a Trustee of ALPS ETF Trust (20 funds); ALPS Variable Investment Trust (9 funds); Clough Funds Trust (1 fund); Elevation ETF Trust (1 fund); and Reaves Utility Income Fund (1 fund). |
| Annual Report – April 30, 2017 | 57 |
| Seafarer Funds | Trustees and Officers |
April 30, 2017 (Unaudited)
INDEPENDENT TRUSTEES (continued)
Name, Address* & Year of Birth | Position(s) Held with Fund | Term of Office** and Length of Time Served | Principal Occupation(s) During Past 5 Years*** | Number of Funds in Fund Complex Overseen by Trustee**** | Other Directorships Held by Trustee During Past 5 Years*** |
Jerry G. Rutledge, 1944 | Trustee | Mr. Rutledge was elected at a special meeting of shareholders held on August 7, 2009. | Mr. Rutledge is the President and owner of Rutledge’s Inc., a retail clothing business. Mr. Rutledge is currently Director of the American National Bank. He was from 1994 to 2007 a Regent of the University of Colorado. | 34 | Mr. Rutledge is a Trustee of Principal Real Estate Income Fund (1 fund), Clough Global Dividend and Income Fund (1 fund), Clough Global Equity Fund (1 fund) and Clough Global Opportunities Fund (1 fund). |
Michael “Ross” Shell, 1970 | Trustee | Mr. Shell was elected at a special meeting of shareholders held on August 7, 2009. | Mr. Shell is Founder and CEO of Red Idea, LLC, a strategic consulting/early stage venture firm (since June 2008). From 1999 to 2009, he was a part-owner and Director of Tesser, Inc., a brand agency. From December 2005 to May 2008, he was Director, Marketing and Investor Relations, of Woodbourne, a REIT/real estate hedge fund and private equity firm. Prior to this, from May 2004 to November 2005, he worked as a business strategy consultant; from June 2003 to April 2004, he was on the Global Client Services team of IDEO, a product design/innovation firm; and from 1999 to 2003, he was President of Tesser, Inc. Mr. Shell graduated with honors from Stanford University with a degree in Political Science. | 34 | None. |
| 58 | (855) 732-9220 seafarerfunds.com |
| Seafarer Funds | Trustees and Officers |
April 30, 2017 (Unaudited)
INTERESTED TRUSTEE
Name, Address* & Year of Birth | Position(s) Held with Fund | Term of Office** and Length of Time Served | Principal Occupation(s) During Past 5 Years*** | Number of Funds in Fund Complex Overseen by Trustee**** | Other Directorships Held by Trustee During Past 5 Years*** |
Edmund J. Burke, 1961 | Trustee and President | Mr. Burke was elected as Trustee at a special meeting of shareholders held on August 7, 2009. Mr. Burke was elected President of the Trust at the December 17, 2002 meeting of the Board of Trustees. | Mr. Burke is President and a Director of ALPS Holdings, Inc. (“AHI”) (since 2005) and Director of Boston Financial Data Services, Inc. (“BFDS”), ALPS Advisors, Inc. (“AAI”), ALPS Distributors, Inc. (“ADI”), ALPS Fund Services, Inc. (“AFS”) and ALPS Portfolio Solutions Distributor, Inc. (“APSD”) and from 2001-2008, was President of AAI, ADI, AFS and APSD. Because of his positions with AHI, BFDS, AAI, ADI, AFS and APSD, Mr. Burke is deemed an affiliate of the Trust as defined under the 1940 Act. | 34 | Mr. Burke is a Trustee of Clough Global Dividend and Income Fund (1 fund); Clough Global Equity Fund (1 fund); Clough Global Opportunities Fund (1 fund); Clough Funds Trust (1 fund); Liberty All-Star Equity Fund (1 fund); and Director of the Liberty All-Star Growth Fund, Inc. (1 fund). |
| Annual Report – April 30, 2017 | 59 |
| Seafarer Funds | Trustees and Officers |
April 30, 2017 (Unaudited)
OFFICERS
Name, Address* & Year of Birth | Position(s) Held with Fund | Term of Office** and Length of Time Served | Principal Occupation(s) During Past 5 Years*** |
Kimberly R. Storms, 1972 | Treasurer | Ms. Storms was elected Treasurer of the Trust at the March 12, 2013 meeting of the Board of Trustees. | Ms. Storms is Senior Vice President - Director of Fund Administration of ALPS. Because of her position with ALPS, Ms. Storms is deemed an affiliate of the Trust as defined under the 1940 Act. Ms. Storms is also Treasurer of Liberty All-Star Equity Fund, Liberty All-Star Growth Fund, Inc., ALPS Series Trust and Elevation ETF Trust. Ms. Storms also serves as a Board member and Treasurer of The Center for Trauma & Resilience, a nonprofit agency. |
Karen S. Gilomen, 1970 | Secretary | Ms. Gilomen was elected Secretary of the Trust at the December 13, 2016 meeting of the Board of Trustees. | Ms. Gilomen joined ALPS in August 2016 as Vice President and Senior Counsel. Prior to joining ALPS, Ms. Gilomen was Vice President - General Counsel & CCO of Monticello Associates, Inc. from 2010 to 2016. Because of her position with ALPS, Ms. Gilomen is deemed an affiliate of the Trust, as defined under the 1940 Act. Ms. Gilomen is also the Secretary of Oak Associates Funds and Reaves Utility Income Fund, and the Assistant Secretary of the WesMark Funds. |
Ted Uhl, 1974 | Chief Compliance Officer (“CCO”) | Mr. Uhl was appointed CCO of the Trust at the June 8, 2010 meeting of the Board of Trustees. | Mr. Uhl joined ALPS in October 2006, and is currently Deputy Compliance Officer of ALPS. Prior to his current role, Mr. Uhl served as Senior Risk Manager for ALPS from October 2006 until June 2010. Before joining ALPS, Mr. Uhl served a Sr. Analyst with Enenbach and Associates (RIA), and a Sr. Financial Analyst at Sprint. Because of his position with ALPS, Mr. Uhl is deemed an affiliate of the Trust as defined under the 1940 Act. Mr. Uhl is also CCO of the Boulder Growth & Income Fund, Inc., Centre Funds, Elevation ETF Trust, Index Funds, Reality Shares ETF Trust and Reaves Utility Income Fund. |
Jennell Panella, 1974 | Assistant Treasurer | Ms. Panella was elected Assistant Treasurer of the Trust at the September 15, 2015 meeting of the Board of Trustees. | Ms. Panella joined ALPS in June 2012 and is currently Fund Controller of ALPS Fund Services, Inc. Prior to joining ALPS, Ms. Panella served as Financial Reporting Manager for Parker Global Strategies, LLC (2009-2012). Because of her position with ALPS, Ms. Panella is deemed an affiliate of the Trust as defined under the 1940 Act. Ms. Panella also serves as Assistant Treasurer of James Advantage Funds. |
| 60 | (855) 732-9220 seafarerfunds.com |
| Seafarer Funds | Trustees and Officers |
April 30, 2017 (Unaudited)
OFFICERS (continued)
Name, Address* & Year of Birth | Position(s) Held with Fund | Term of Office** and Length of Time Served | Principal Occupation(s) During Past 5 Years*** |
Alan Gattis, 1980 | Assistant Treasurer | Mr. Gattis was elected Assistant Treasurer of the Trust at the September 13, 2016 meeting of the Board of Trustees. | Mr. Gattis joined ALPS in 2011 and is currently Vice President and Fund Controller of ALPS. Prior to joining ALPS, Mr. Gattis was an Auditor at Spicer Jeffries LLP (2009 through 2011) and an Auditor at PricewaterhouseCoopers LLP (2004 - 2009). Because of his position with ALPS, Mr. Gattis is deemed an affiliate of the Trust as defined under the 1940 Act. Mr. Gattis is also Assistant Treasurer of ALPS Series Trust, Clough Funds Trust, Clough Global Opportunities Fund, Clough Global Dividend and Income Fund, Clough Global Equity and Griffin Institutional Access Real Estate Fund. |
Sharon Akselrod, 1974 | Assistant Secretary | Ms. Akselrod was elected Assistant Secretary of the Trust at the September 15, 2015 meeting of the Board of Trustees. | Ms. Akselrod joined ALPS in August 2014 and is currently Senior Investment Company Act Paralegal of ALPS Fund Services, Inc. Prior to joining ALPS, Ms. Akselrod served as Corporate Governance and Regulatory Associate for Nordstrom fsb (2013-2014) and Senior Legal Assistant – Legal Manager for AXA Equitable Life Insurance Company (2008-2013). Because of her position with ALPS, Ms. Akselrod is deemed an affiliate of the Trust as defined under the 1940 Act. Ms. Akselrod is also Assistant Secretary of ALPS ETF Trust. |
Jennifer Craig, 1973 | Assistant Secretary | Ms. Craig was elected Assistant Secretary of the Trust at the June 8, 2016 meeting of the Board of Trustees. | Ms. Craig joined ALPS in 2007 and is currently Assistant Vice President and Paralegal Manager of ALPS. Prior to joining ALPS, Ms. Craig was Legal Manager at Janus Capital Management LLC and served as Assistant Secretary of Janus Investment Fund, Janus Adviser Series and Janus Aspen Series. Because of her position with ALPS, Ms. Craig is deemed an affiliate of the Trust as defined under the 1940 Act. Ms. Craig is also Assistant Secretary of Clough Global Dividend and Income Fund, Clough Global Equity Fund, Clough Global Opportunities Fund, Clough Funds Trust and ALPS Series Trust. |
| * | All communications to Trustees and Officers may be directed to Financial Investors Trust c/o 1290 Broadway, Suite 1100, Denver, CO 80203. |
| ** | This is the period for which the Trustee or Officer began serving the Trust. Each Trustee serves an indefinite term, until his successor is elected. Officers are elected on an annual basis. |
| *** | The Fund Complex includes all series of the Trust (currently 34) and any other investment companies for which any Trustee serves as trustee for and which Seafarer Capital Partners, LLC provides investment advisory services (currently none). |
| Annual Report – April 30, 2017 | 61 |
| Seafarer Funds | Privacy Policy |
April 30, 2017 (Unaudited)
| FACTS | WHAT DO THE FUNDS DO WITH YOUR PERSONAL INFORMATION? |
| Why? | Financial companies choose how they share your personal information. Federal law gives consumers the right to limit some but not all sharing. Federal law also requires us to tell you how we collect, share, and protect your personal information. Please read this notice carefully to understand what we do. |
| What? | The types of personal information we collect and share depend on the product or service you have with us. This information can include: |
| | ● | Social Security number and account transactions |
| | ● | Account balances and transaction history |
| | ● | Wire transfer instructions |
| How? | All financial companies need to share customers’ personal information to run their everyday business. In the section below, we list the reasons financial companies can share their customers’ personal information; the reasons the Funds choose to share; and whether you can limit this sharing. |
| Reasons we can share your personal information | Do we share: | Can you limit this sharing? |
| For our everyday business purposes – such as to process your transactions, maintain your account(s), respond to court orders and legal investigations, or report to credit bureaus | Yes | No |
| For our marketing purposes – to offer our products and services to you | No | We do not share. |
| For joint marketing with other financial companies | No | We do not share. |
| For our affiliates’ everyday business purposes – information about your transactions and experiences | Yes | No |
| For our affiliates’ everyday business purposes – information about your creditworthiness | No | We do not share. |
| For nonaffiliates to market to you | No | We do not share. |
| 62 | (855) 732-9220 seafarerfunds.com |
| Seafarer Funds | Privacy Policy |
April 30, 2017 (Unaudited)
| Who We Are | |
| Who is providing this notice? | Seafarer Overseas Growth and Income Fund and Seafarer Overseas Value Fund. |
| | |
| What We Do | |
| How do the Funds protect my personal information? | To protect your personal information from unauthorized access and use, we use security measures that comply with federal law. These measures include computer safeguards and secured files and buildings. |
| How do the Funds collect my personal information? | We collect your personal information, for example, when you |
| | ● | open an account |
| | ● | provide account information or give us your contact information |
| | ● | make a wire transfer or deposit money |
| Why can’t I limit all sharing? | Federal law gives you the right to limit only |
| | ● | sharing for affiliates’ everyday business purposes-information about your creditworthiness |
| | ● | affiliates from using your information to market to you |
| | ● | sharing for non-affiliates to market to you |
| | State laws and individual companies may give you additional rights to limit sharing. |
| | |
| Definitions | |
| Affiliates | Companies related by common ownership or control. They can be financial and nonfinancial companies. |
| Non-affiliates | Companies not related by common ownership or control. They can be financial and nonfinancial companies. |
| | ● | The Funds do not share with non-affiliates so they can market to you. |
| Joint marketing | A formal agreement between non-affiliated financial companies that together market financial products or services to you. |
| | ● | The Funds do not jointly market. |
| | |
| Other Important Information | |
| California Residents | If your account has a California home address, your personal information will not be disclosed to nonaffiliated third parties except as permitted by applicable California law, and we will limit sharing such personal information with our affiliates to comply with California privacy laws that apply to us. |
| Vermont Residents | The State of Vermont requires financial institutions to obtain your consent prior to sharing personal information that they collect about you with affiliated companies and nonaffiliated third parties other than in certain limited circumstances. Except as permitted by law, we will not share personal information we collect about you with nonaffiliated third parties or other affiliated companies unless you provide us with your written consent to share such information. |
| Annual Report – April 30, 2017 | 63 |
Page Intentionally Left Blank


Table of Contents
| CONTENTS | PAGE |
| Shareholder Letter | 1 |
| Fund Overview | |
| Vulcan Value Partners Fund | 4 |
| Vulcan Value Partners Small Cap Fund | 7 |
| Disclosure of Fund Expenses | |
| Vulcan Value Partners Fund | 6 |
| Vulcan Value Partners Small Cap Fund | 9 |
| Statements of Investments | |
| Vulcan Value Partners Fund | 10 |
| Vulcan Value Partners Small Cap Fund | 13 |
| Statements of Assets and Liabilities | 16 |
| Statements of Operations | 17 |
| Statements of Changes in Net Assets | |
| Vulcan Value Partners Fund | 18 |
| Vulcan Value Partners Small Cap Fund | 19 |
| Financial Highlights | |
| Vulcan Value Partners Fund | 20 |
| Vulcan Value Partners Small Cap Fund | 22 |
| Notes to Financial Statements | 24 |
| Report of Independent Registered Public Accounting Firm | 34 |
| Disclosure Regarding Approval of Fund Advisory Agreements | 35 |
| Additional Information | 38 |
| Trustees and Officers | 39 |
| Privacy Policy | 44 |
| | www.vulcanvaluepartners.com |
Shareholder Letter
April 30, 2017 (Unaudited)
Vulcan Value Partners Fund and Vulcan Value Partners Small Cap Fund delivered double digit returns for the year ended April 30, 2017 and, more importantly, the funds have produced strong long‐term returns as both funds have outperformed their primary benchmarks inception to date. As we have often said, we place no weight on short‐term results, good or bad, and neither should you. In fact, we have made and will continue to make decisions that negatively impact short‐term performance when we think we can improve our long‐term returns and mitigate risk. We encourage you to place more weight on our longer‐term historical results and a great deal of weight on our long‐term prospects.
We are proud to announce that Vulcan celebrated its ten year anniversary as a firm during the first quarter of 2017. Between the founding of the firm in 2007 and December 30, 2009, the inception of the funds, Vulcan built sufficient staff and infrastructure to seek to ensure the firm’s ability to manage substantial client assets. Our success in providing value to clients over the firm’s ten year history confirms that the investment disciplines pioneered by the great value investors who preceded us are still relevant today. What are these disciplines that we believe in and follow?
First, it is essential to consistently execute our disciplined investment philosophy and let it take the portfolio where it is supposed to go as part of our effort to produce attractive long‐term results. Second, to achieve attractive long‐term results you must be willing and able to stand apart from the crowd and endure periods of short‐term underperformance. Third, capturing attractive long‐term results requires patience and a long‐term time horizon.
Vulcan Value Partners Large Cap Fund Review
In the discussion that follows, we highlight a few holdings in the Vulcan Value Partners Fund.
One year ago we wrote the following about Oracle, our largest holding:
“Oracle has faced a significant headwind from the strong dollar. More importantly, the company is rapidly shifting its business mix to Cloud‐based delivery of its software products. Cloud‐based revenues are more profitable over time than on‐premise software license fees. However, Oracle’s consolidated growth has slowed because Cloud sales do not have one‐time setup fees, while on‐premise sales do. Investors with shorter time horizons than ours have punished Oracle’s stock for the last couple of years because of its slowing consolidated growth. As Oracle’s Cloud business continues to grow at high double‐digit rates, the company’s consolidated growth rate should begin to accelerate sometime over the next twelve months and continue to accelerate for many years to come. As this inflection point becomes more visible to short‐term investors, they are pushing up Oracle’s stock price, and we are being rewarded for our patience.”
Fast forward to today: We could not be more pleased with Oracle’s progress. Oracle has hit its inflection point, and we expect growth to accelerate over the next several years. More importantly, the company has strengthened its competitive position by extending its reach into the Cloud.
| Annual Report | April 30, 2017 | 1 |
Shareholder Letter
April 30, 2017 (Unaudited)
Skyworks, a new purchase in the third quarter of 2016, makes radio frequency filters (RF), power amplifiers, and mixed signal semiconductors. These chipsets are critical components in modern cell phones. As telecommunications technology continues to evolve from 2G to 3G to 4G and soon to 5G, bands continue to proliferate and data usage grows exponentially. Their products are a small part of the cost of a cell phone, but the phone will not function without them. They operate in a global oligopoly (1). Only a handful of companies can produce these increasingly complex chipsets at scale. Switching costs are high and risky. As an example, think about the financial and reputational damage to Samsung from the Galaxy 7 battery debacle— and batteries are commoditized while RF chipsets are not.
We sold Franklin Resources. After compounding nicely for several years, its value has been flat for the past couple of years. As we have said in the past, part of our investment discipline is to reassess a company whose value has not grown over two years. We admire Franklin’s business model which generates large amounts of stable free cash flow and its competitive advantages such as scale and a broad and diverse product offering. However, as we look forward over our five year investment horizon, we are less certain about Franklin’s competitive advantages. Following our investment discipline, we sold our position and redeployed capital to companies that we believe have more stable values and more attractive price to value ratios.
Vulcan Value Partners Small Cap Fund Review
In the discussion that follows, we highlight a few holdings in the Vulcan Value Partners Small Cap Fund.
CEB, Inc., a new purchase in the fourth quarter of 2016, has a unique networking and database business helping executives find best practices within their industries. CEB is illustrative of our challenges in Small Cap. For us, there are few qualifying companies that are attractively priced, and the few that are selling at a discount do not stay discounted long. We were forced sellers in the first quarter of 2017 as Gartner offered to buy the company at a substantial premium to our estimate of intrinsic worth. Our gain on CEB was over 40% in the short time that we owned it.
Sotheby’s, a material contributor, gained just over 47% during the 12 month period ended April 30, 2017. We believe Sotheby’s management team is doing an excellent job operationally and in terms of allocating capital. The market is belatedly recognizing Sotheby’s improved performance which is transpiring against the backdrop of a relatively weak art market.
Select Comfort, another material contributor over this time period, is a company we have successfully owned before. Select Comfort has a unique distribution model that it uses to sell premium bedding products including mattresses. The company produces high levels of free cash flow and is benefitting from a shift to more comfortable, higher‐end mattresses among consumers. Its Sleep Number mattresses have a loyal following, which is impressive for such a long‐lasting product with infrequent sales. My wife and I personally bought a Sleep Number bed as part of our research process, and I have to say that we love it. We will never buy another brand.
CEB, Inc., a new purchase in the fourth quarter of 2016, has a unique networking and database business helping executives find best practices within their industries. CEB is illustrative of our challenges in Small Cap. For us, there are few qualifying companies that are attractively priced, and the few that are selling at a discount do not stay discounted long. We were forced sellers in the first quarter of 2017 as Gartner offered to buy the company at a substantial premium to our estimate of intrinsic worth. Our gain on CEB was over 40% in the short time that we owned it.
| 2 | www.vulcanvaluepartners.com |
Shareholder Letter
April 30, 2017 (Unaudited)
CEB is also an example of our challenges in Small Cap. We made a large gain in a short period of time and sold it above our estimate of fair value, but we have very few qualifying businesses into which we can re‐deploy capital from the sale. Consequently, our cash levels are rising. Cash is a residual decision. We demand a margin of safety to invest. We will not knowingly pay fair value or more than fair value for any business.
Closing
We are very pleased to be able to share good news with you in this letter regarding our results while we maintain our focus on long‐term investing. We appreciate the confidence you have placed in us. We would not have been able to produce our outstanding long‐term results without your stable capital. Thank you!
C.T. Fitzpatrick
Chief Executive Officer
Vulcan Value Partners, LLC
Past performance does not guarantee future results. The Fund’s prices fluctuate as the underlying assets have exposure to market fluctuations and other risks, as described in the Funds’ prospectus. Please call 877.421.5078 to obtain current performance information and for the current prospectus and statement of additional information. This material must be preceded or accompanied by a prospectus. Please read the prospectus carefully before investing.
The views of the Vulcan Value Partners, LLC and information discussed in this commentary are as of the date of publication, are subject to change, and may not reflect the writer's current views. The views expressed represent an assessment of market conditions at a specific point in time, are opinions only and should not be relied upon as investment advice regarding a particular investment or markets in general. Such information does not constitute a recommendation to buy or sell specific securities or investment vehicles. It should not be assumed that any investment will be profitable or will equal the performance of the Funds or any securities or any sectors mentioned in this letter. The subject matter contained in this letter has been derived from several sources believed to be reliable and accurate at the time of compilation. Neither Vulcan Value Partners, LLC nor the Funds accept any liability for losses either direct or consequential caused by the use of this information.
The Funds are distributed by ALPS Distributors, Inc.
The Funds are subject to investment risks, including possible loss of the principal amount invested and therefore is not suitable for all investors. The Funds may not achieve their objectives.
Diversification does not eliminate the risk of experiencing investment losses.
| (1) | Oligopoly is a market structure in which a small number of firms has the large majority of market share. An oligopoly is similar to a monopoly, except that rather than one firm, two or more firms dominate the market. |
| Annual Report | April 30, 2017 | 3 |
Fund Overview
April 30, 2017 (Unaudited)
VULCAN VALUE PARTNERS FUND
Cumulative Total Returns (as of 4/30/17)
| | | | | | | Expense Ratios |
| | 6 Month | 1 Year | 3 Year | 5 Year | | Total | Net(1) |
| Vulcan Value Partners Fund | 15.40% | 13.85% | 7.48% | 12.72% | 12.70% | 1.08% | 1.08% |
S&P 500® Total Return Index(2) | 13.32% | 17.92% | 10.47% | 13.68% | 13.13% | | |
Russell 1000® Value Index(3) | 11.69% | 16.55% | 8.26% | 13.32% | 12.43% | | |
Performance data quoted represents past performance. Past performance does not guarantee future results. Investment return and principal value of an investment will fluctuate so that an investor’s shares, when sold or redeemed, may be worth more or less than the original cost. The Fund imposes a 2.00% redemption fee on shares held for less than 90 days. Current performance data may be higher or lower than actual data quoted. For the most current month-end performance data, please call 1-877-421-5078.
The table does not reflect the deduction of taxes that a shareholder would pay on Fund distributions or the redemption of Fund shares.
Subject to investment risks, including possible loss of the principal amount invested.
Returns for periods greater than 1 year are annualized.
| * | Fund inception date of 12/30/09. |
| (1) | Vulcan Value Partners, LLC (“Vulcan” or the “Adviser”) has contractually agreed to limit the Fund’s total annual fund operating expenses (exclusive of Acquired Fund Fees and Expenses, brokerage expenses, interest expense, taxes and extraordinary expenses) to 1.25% of the Fund’s average daily net assets. This agreement (the “Expense Agreement”) is in effect through August 31, 2017. The Adviser will be permitted to recover, on a class-by-class basis, expenses it has borne through the Expense Agreement to the extent that the Fund’s expenses in later periods fall below the expense cap in effect at the time of waiver or reimbursement. Notwithstanding the foregoing, the Fund will not be obligated to pay any such fees and expenses more than three years after the end of the fiscal year in which the fees or expenses were foregone or reimbursed. The Adviser may not discontinue or modify this waiver prior to August 31, 2017 without the approval by the Fund’s Board of Trustees. |
| (2) | The S&P 500® Total Return Index is an unmanaged index of 500 common stocks chosen for market size, liquidity and industry group representation. It is a market-value weighted index. The Index is not actively managed and does not reflect any deductions for fees, expenses or taxes. An investor may not invest directly in the Index. |
| (3) | The Russell 1000® Value Index measures the performance of the large-cap value segment of the U.S.equity universe. It includes those Russell 1000® companies with lower price-to-book ratios and lower expected growth values. The index is not actively managed and does not reflect any deductions for fees, expense or taxes. An investor may not invest directly in an index. |
| 4 | www.vulcanvaluepartners.com |
Fund Overview
April 30, 2017 (Unaudited)
Performance of $10,000 Initial Investment (for the period ended April 30, 2017)
The chart above represents historical performance of a hypothetical investment of $10,000 in the Fund since inception. Past performance does not guarantee future results. This chart does not reflect the deduction of taxes that a shareholder would pay on Fund distributions or the redemption of Fund shares.
Investing in the Fund is subject to investment risks, including possible loss of the principal amount invested.
Industry Allocation (as a % of Net Assets)*
| * | Holdings are subject to change, and may not reflect the current or future position of the portfolio. |
| Annual Report | April 30, 2017 | 5 |
Disclosure of Fund Expenses
April 30, 2017 (Unaudited)
As a shareholder of the Vulcan Value Partners Fund (the “Fund”), you will incur two types of costs: (1) transaction costs, including applicable redemption fees; and (2) ongoing costs, including management fees and other fund operating expenses. The following examples are intended to help you understand your ongoing costs (in dollars) of investing in the Fund and to compare these costs with the ongoing costs of investing in other mutual funds. The examples are based on an investment of $1,000 invested on November 1, 2016 and held until April 30, 2017.
Actual Expenses. The first line of each table below provides information about actual account values and actual expenses. You may use the information in this line, together with the amount you invested, to estimate the expenses that you paid over the period. Simply divide your account value by $1,000 (for example, an $8,600 account value divided by $1,000 = 8.6), then multiply the result by the number in the first line under the heading “Expenses Paid During Period” to estimate the expenses you paid on your account during this period.
Hypothetical Example for Comparison Purposes. The second line of the table below provides information about hypothetical account values and hypothetical expenses based on the Fund’s actual expense ratio and an assumed rate of return of 5% per year before expenses, which is not the Fund’s actual return. The hypothetical account values and expenses may not be used to estimate the actual ending account balance or expenses you paid for the period. You may use this information to compare the ongoing costs of investing in the Fund and other mutual funds. To do so, compare this 5% hypothetical example with the 5% hypothetical examples that appear in the shareholder reports of the other mutual funds.
Please note the expenses shown in the table are meant to highlight ongoing Fund costs only and do not reflect transactional costs, such as redemption fees or exchange fees. Therefore, the second line of the table below is useful in comparing your ongoing costs only, and will not help you determine the relative total costs of owning different funds. In addition, if these transactional costs were included, your costs would have been higher.
Vulcan Value Partners Fund
| | Beginning Account Value
11/1/16 | Ending Account Value
4/30/17 | Expense Ratio(a) | Expenses Paid
During period
11/1/16 - 4/30/17(b) |
| Actual | $1,000.00 | $1,154.00 | 1.07% | $ 5.71 |
| Hypothetical (5% return before expenses) | $1,000.00 | $1,019.49 | 1.07% | $ 5.36 |
| (a) | The Fund's expense ratios have been annualized based on the Fund's most recent fiscal half-year expenses. |
| (b) | Expenses are equal to the Fund's annualized expense ratio multiplied by the average account value over the period, multiplied by the number of days in the most recent fiscal half-year (181)/365 (to reflect the half-year period). |
| 6 | www.vulcanvaluepartners.com |
Fund Overview
April 30, 2017 (Unaudited)
VULCAN VALUE PARTNERS SMALL CAP FUND
Cumulative Total Returns (as of 4/30/17)
| | | | | | | Expense Ratios |
| | 6 Month | 1 Year | 3 Year | 5 Year | | Total | Net(1) |
| Vulcan Value Partners Small Cap Fund | 17.99% | 21.97% | 8.65% | 14.14% | 15.04% | 1.26% | 1.26% |
Russell 2000® Value Index(2) | 18.26% | 27.18% | 8.71% | 12.96% | 12.33% | | |
Russell 2000® Index(3) | 18.37% | 25.63% | 9.04% | 12.95% | 12.95% | | |
Performance data quoted represents past performance. Past performance does not guarantee future results. Investment return and principal value of an investment will fluctuate so that an investor’s shares, when sold or redeemed, may be worth more or less than the original cost. The Fund imposes a 2.00% redemption fee on shares held for less than 90 days. Current performance data may be higher or lower than actual data quoted. For the most current month-end performance data, please call 1-877-421-5078.
The table does not reflect the deduction of taxes that a shareholder would pay on Fund distributions or the redemption of Fund shares.
Subject to investment risks, including possible loss of the principal amount invested.
Returns for periods greater than 1 year are annualized.
| * | Fund inception date of 12/30/09. |
| (1) | Vulcan Value Partners, LLC (“Vulcan” or the “Adviser”) has contractually agreed to limit the Fund’s total annual fund operating expenses (exclusive of Acquired Fund Fees and Expenses, brokerage expenses, interest expense, taxes and extraordinary expenses) to 1.25% of the Fund’s average daily net assets. This agreement (the “Expense Agreement”) is in effect through August 31, 2017. The Adviser will be permitted to recover, on a class-by-class basis, expenses it has borne through the Expense Agreement to the extent that the Fund’s expenses in later periods fall below the expense cap in effect at the time of waiver or reimbursement. Notwithstanding the foregoing, the Fund will not be obligated to pay any such fees and expenses more than three years after the end of the fiscal year in which the fees or expenses were foregone or reimbursed. The Adviser may not discontinue or modify this waiver prior to August 31, 2017 without the approval by the Fund’s Board of Trustees. |
| (2) | The Russell 2000® Value Index measures the performance of small-cap value segment of the U.S.equity universe. It includes those Russell 2000® companies with lower price-to-book ratios and lower forecasted growth values. The index is not actively managed and does not reflect any deductions for fees, expense or taxes. An investor may not invest directly in an index. |
| (3) | The Russell 2000® Index measures the performance of the small-cap segment of the U.S. equity universe. The Russell 2000® Index is a subset of the Russell 3000® Index representing approximately 8% of the total market capitalization of that index. It includes approximately 2,000 of the smallest securities based on a combination of their market cap and current index membership. The index is not actively managed and does not reflect any deductions for fees, expense or taxes. An investor may not invest directly in an index. |
| Annual Report | April 30, 2017 | 7 |
Fund Overview
April 30, 2017 (Unaudited)
Performance of $10,000 Initial Investment (for the period ended April 30, 2017)
The chart above represents historical performance of a hypothetical investment of $10,000 in the Fund since inception. Past performance does not guarantee future results. This chart does not reflect the deduction of taxes that a shareholder would pay on Fund distributions or the redemption of Fund shares.
Investing in the Fund is subject to investment risks, including possible loss of the principal amount invested.
Industry Allocation (as a % of Net Assets)*
| * | Holdings are subject to change, and may not reflect the current or future position of the portfolio. |
| 8 | www.vulcanvaluepartners.com |
Disclosure of Fund Expenses
April 30, 2017 (Unaudited)
As a shareholder of the Vulcan Value Partners Small Cap Fund (the “Fund”), you will incur two types of costs: (1) transaction costs, including applicable redemption fees; and (2) ongoing costs, including management fees and other fund operating expenses. The following examples are intended to help you understand your ongoing costs (in dollars) of investing in the Fund and to compare these costs with the ongoing costs of investing in other mutual funds. The examples are based on an investment of $1,000 invested on November 1, 2016 and held until April 30, 2017.
Actual Expenses. The first line of each table below provides information about actual account values and actual expenses. You may use the information in this line, together with the amount you invested, to estimate the expenses that you paid over the period. Simply divide your account value by $1,000 (for example, an $8,600 account value divided by $1,000 = 8.6), then multiply the result by the number in the first line under the heading “Expenses Paid During Period” to estimate the expenses you paid on your account during this period.
Hypothetical Example for Comparison Purposes. The second line of the table below provides information about hypothetical account values and hypothetical expenses based on the Fund’s actual expense ratio and an assumed rate of return of 5% per year before expenses, which is not the Fund’s actual return. The hypothetical account values and expenses may not be used to estimate the actual ending account balance or expenses you paid for the period. You may use this information to compare the ongoing costs of investing in the Fund and other mutual funds. To do so, compare this 5% hypothetical example with the 5% hypothetical examples that appear in the shareholder reports of the other mutual funds.
Please note the expenses shown in the table are meant to highlight ongoing Fund costs only and do not reflect transactional costs, such as redemption fees or exchange fees. Therefore, the second line of the table below is useful in comparing your ongoing costs only, and will not help you determine the relative total costs of owning different funds. In addition, if these transactional costs were included, your costs would have been higher.
Vulcan Value Partners Small Cap Fund
| | Beginning Account Value
11/1/16 | Ending Account Value
4/30/17 | Expense Ratio(a) | Expenses Paid
During period 11/1/16 - 4/30/17(b) |
| Actual | $1,000.00 | $1,179.90 | 1.25% | $ 6.76 |
| Hypothetical (5% return before expenses) | $1,000.00 | $1,018.60 | 1.25% | $ 6.26 |
| (a) | The Fund's expense ratios have been annualized based on the Fund's most recent fiscal half-year expenses. |
| (b) | Expenses are equal to the Fund's annualized expense ratio multiplied by the average account value over the period, multiplied by the number of days in the most recent fiscal half-year (181)/365 (to reflect the half-year period). |
| Annual Report | April 30, 2017 | 9 |
| Statement of Investments | Vulcan Value Partners Fund |
April 30, 2017
| | | Shares | | | Value
(Note 2) | |
| COMMON STOCKS (96.96%) | | | | | | |
| Communications (7.22%) | | | | | | |
| Media (6.21%) | | | | | | |
Discovery Communications, Inc., Class C(a) | | | 1,665,650 | | | $ | 46,604,887 | |
| Time Warner, Inc. | | | 132,594 | | | | 13,162,607 | |
| Walt Disney Co. | | | 173,637 | | | | 20,072,437 | |
| | | | | | | | 79,839,931 | |
| | | | | | | | | |
| Telecommunications (1.01%) | | | | | | | | |
| Cisco Systems, Inc. | | | 380,816 | | | | 12,974,401 | |
| | | | | | | | | |
| TOTAL COMMUNICATIONS | | | | | | | 92,814,332 | |
| | | | | | | | | |
| Consumer, Cyclical (15.90%) | | | | | | | | |
| Auto Parts & Equipment (4.76%) | | | | | | | | |
| GKN PLC | | | 13,165,204 | | | | 61,198,135 | |
| | | | | | | | | |
| Distribution/Wholesale (1.77%) | | | | | | | | |
Fossil Group, Inc.(a) | | | 1,317,934 | | | | 22,734,361 | |
| | | | | | | | | |
| Lodging (4.10%) | | | | | | | | |
| Hilton Worldwide Holdings, Inc. | | | 527,398 | | | | 31,100,660 | |
| Intercontinental Hotels Group PLC, ADR | | | 408,187 | | | | 21,548,192 | |
| | | | | | | | 52,648,852 | |
| | | | | | | | | |
| Retail (5.27%) | | | | | | | | |
| CVS Health Corp. | | | 820,812 | | | | 67,667,741 | |
| | | | | | | | | |
| TOTAL CONSUMER, CYCLICAL | | | | | | | 204,249,089 | |
| | | | | | | | | |
| Consumer, Non‐cyclical (22.05%) | | | | | | | | |
| Commercial Services (5.30%) | | | | | | | | |
| Moody's Corp. | | | 203,025 | | | | 24,021,918 | |
| S&P Global, Inc. | | | 158,436 | | | | 21,260,527 | |
| Sabre Corp. | | | 971,748 | | | | 22,748,621 | |
| | | | | | | | 68,031,066 | |
| | | | | | | | | |
| Healthcare‐Services (5.45%) | | | | | | | | |
| Aetna, Inc. | | | 173,096 | | | | 23,380,077 | |
| Anthem, Inc. | | | 198,288 | | | | 35,273,452 | |
| UnitedHealth Group, Inc. | | | 65,038 | | | | 11,373,845 | |
| | | | | | | | 70,027,374 | |
| | | | | | | | | |
| Pharmaceuticals (11.30%) | | | | | | | | |
| AmerisourceBergen Corp. | | | 637,209 | | | | 52,282,999 | |
| 10 | www.vulcanvaluepartners.com |
| Vulcan Value Partners Fund | Statement of Investments |
April 30, 2017
| | | Shares | | | Value (Note 2) | |
| Consumer, Non-cyclical (continued) | | | | | | |
| Pharmaceuticals (continued) | | | | | | |
| Cardinal Health, Inc. | | | 540,273 | | | $ | 39,218,417 | |
| McKesson Corp. | | | 388,384 | | | | 53,709,623 | |
| | | | | | | | 145,211,039 | |
| | | | | | | | | |
| TOTAL CONSUMER, NON-CYCLICAL | | | | | | | 283,269,479 | |
| | | | | | | | | |
| Energy (5.28%) | | | | | | | | |
| Oil & Gas Services (5.28%) | | | | | | | | |
| National Oilwell Varco, Inc. | | | 1,939,968 | | | | 67,840,681 | |
| | | | | | | | | |
| TOTAL ENERGY | | | | | | | 67,840,681 | |
| | | | | | | | | |
| Financial (28.26%) | | | | | | | | |
| Banks (7.16%) | | | | | | | | |
| Bank of New York Mellon Corp. | | | 605,004 | | | | 28,471,488 | |
| Northern Trust Corp. | | | 222,648 | | | | 20,038,320 | |
| State Street Corp. | | | 518,136 | | | | 43,471,610 | |
| | | | | | | | 91,981,418 | |
| | | | | | | | | |
| Diversified Financial Services (8.32%) | | | | | | | | |
| Mastercard, Inc., Class A | | | 462,107 | | | | 53,752,286 | |
| Visa, Inc., Class A | | | 582,630 | | | | 53,147,509 | |
| | | | | | | | 106,899,795 | |
| | | | | | | | | |
| Insurance (10.07%) | | | | | | | | |
| Axis Capital Holdings, Ltd. | | | 607,162 | | | | 40,011,976 | |
| Everest Re Group, Ltd. | | | 145,154 | | | | 36,536,713 | |
| Swiss Re AG | | | 607,249 | | | | 52,852,024 | |
| | | | | | | | 129,400,713 | |
| | | | | | | | | |
| Real Estate (2.71%) | | | | | | | | |
CBRE Group, Inc., Class A(a) | | | 971,590 | | | | 34,792,638 | |
| | | | | | | | | |
| TOTAL FINANCIAL | | | | | | | 363,074,564 | |
| | | | | | | | | |
| Industrial (5.51%) | | | | | | | | |
| Aerospace & Defense (4.04%) | | | | | | | | |
| Boeing Co. | | | 237,128 | | | | 43,828,368 | |
| United Technologies Corp. | | | 68,055 | | | | 8,097,865 | |
| | | | | | | | 51,926,233 | |
| Annual Report | April 30, 2017 | 11 |
| Statement of Investments | Vulcan Value Partners Fund |
April 30, 2017
| | | Shares | | | Value (Note 2) | |
| Industrial (continued) | | | | | | |
| Miscellaneous Manufacturing (1.47%) | | | | | | |
| Parker-Hannifin Corp. | | | 117,145 | | | $ | 18,836,916 | |
| | | | | | | | | |
| TOTAL INDUSTRIAL | | | | | | | 70,763,149 | |
| | | | | | | | | |
| Technology (12.74%) | | | | | | | | |
| Semiconductors (3.91%) | | | | | | | | |
Qorvo, Inc.(a) | | | 557,985 | | | | 37,959,720 | |
| Skyworks Solutions, Inc. | | | 123,058 | | | | 12,273,805 | |
| | | | | | | | 50,233,525 | |
| | | | | | | | | |
| Software (8.83%) | | | | | | | | |
| Oracle Corp. | | | 2,521,847 | | | | 113,382,241 | |
| | | | | | | | | |
| TOTAL TECHNOLOGY | | | | | | | 163,615,766 | |
| | | | | | | | | |
TOTAL COMMON STOCKS
(Cost $1,099,044,753) | | | | | | | 1,245,627,060 | |
| | | 7-Day Yield | | | Shares | | | Value (Note 2) | |
| SHORT TERM INVESTMENTS (2.81%) | | | | | | | | | |
| Money Market Fund (2.81%) | | | | | | | | | |
| Dreyfus Treasury Prime Cash Management Fund, Institutional Shares | | | 0.626 | % | | | 36,071,774 | | | | 36,071,774 | |
| | | | | | | | | | | | | |
TOTAL SHORT TERM INVESTMENTS
(Cost $36,071,774) | | | | | | | | | | | 36,071,774 | |
| | | | | | | | | | | | | |
TOTAL INVESTMENTS (99.77%)
(Cost $1,135,116,527) | | | | | | | | | | $ | 1,281,698,834 | |
| | | | | | | | | | | | | |
| Other Assets In Excess Of Liabilities (0.23%) | | | | | | | | | | | 2,969,822 | |
| | | | | | | | | | | | | |
| NET ASSETS (100.00%) | | | | | | | | | | $ | 1,284,668,656 | |
| (a) | Non-Income Producing Security. |
For Fund compliance purposes, the Fund's industry classifications refer to any one or more of the industry sub-classifications used by one or more widely recognized market indexes or ratings group indexes, and/or as defined by Fund management. This definition may not apply for purposes of this report, which may combine industry sub-classifications for reporting ease. Industries are shown as a percentage of net assets.
See Accompanying Notes to Financial Statements.
| 12 | www.vulcanvaluepartners.com |
| Vulcan Value Partners Small Cap Fund | Statement of Investments |
April 30, 2017
| | | Shares | | | Value (Note 2) | |
| COMMON STOCKS (84.11%) | | | | | | |
| Communications (0.96%) | | | | | | |
| Internet (0.96%) | | | | | | |
| Trade Me Group, Ltd. | | | 3,283,843 | | | $ | 11,999,640 | |
| | | | | | | | | |
| TOTAL COMMUNICATIONS | | | | | | | 11,999,640 | |
| | | | | | | | | |
| Consumer, Cyclical (20.08%) | | | | | | | | |
| Distribution/Wholesale (2.02%) | | | | | | | | |
Fossil Group, Inc.(a) | | | 1,469,127 | | | | 25,342,441 | |
| | | | | | | | | |
| Home Furnishings (6.70%) | | | | | | | | |
| Howden Joinery Group PLC | | | 1,868,689 | | | | 11,206,117 | |
Select Comfort Corp.(a) | | | 2,361,255 | | | | 72,962,780 | |
| | | | | | | | 84,168,897 | |
| | | | | | | | | |
| Housewares (2.06%) | | | | | | | | |
| Tupperware Brands Corp. | | | 360,526 | | | | 25,889,372 | |
| | | | | | | | | |
| Lodging (4.26%) | | | | | | | | |
| Choice Hotels International, Inc. | | | 335,215 | | | | 21,017,980 | |
La Quinta Holdings, Inc.(a) | | | 2,295,450 | | | | 32,388,800 | |
| | | | | | | | 53,406,780 | |
| | | | | | | | | |
| Office Furnishings (1.42%) | | | | | | | | |
| Herman Miller, Inc. | | | 538,992 | | | | 17,840,635 | |
| | | | | | | | | |
| Retail (3.62%) | | | | | | | | |
| Halfords Group PLC | | | 4,069,400 | | | | 19,701,841 | |
Sally Beauty Holdings, Inc.(a) | | | 1,355,447 | | | | 25,780,602 | |
| | | | | | | | 45,482,443 | |
| | | | | | | | | |
| TOTAL CONSUMER, CYCLICAL | | | | | | | 252,130,568 | |
| | | | | | | | | |
| Consumer, Non-cyclical (10.56%) | | | | | | | | |
| Commercial Services (10.56%) | | | | | | | | |
Navigant Consulting, Inc.(a) | | | 930,206 | | | | 22,297,038 | |
| Sabre Corp. | | | 1,716,472 | | | | 40,182,609 | |
| Savills PLC | | | 2,819,197 | | | | 33,921,752 | |
Sotheby's(a) | | | 763,596 | | | | 36,163,907 | |
| | | | | | | | 132,565,306 | |
| | | | | | | | | |
| TOTAL CONSUMER, NON-CYCLICAL | | | | | | | 132,565,306 | |
| Annual Report | April 30, 2017 | 13 |
| Statement of Investments | Vulcan Value Partners Small Cap Fund |
April 30, 2017
| | | Shares | | | Value (Note 2) | |
| Energy (1.60%) | | | | | | |
| Oil & Gas Services (1.60%) | | | | | | |
Thermon Group Holdings, Inc.(a) | | | 982,070 | | | $ | 20,132,435 | |
| | | | | | | | | |
| TOTAL ENERGY | | | | | | | 20,132,435 | |
| | | | | | | | | |
| Financial (28.57%) | | | | | | | | |
| Diversified Financial Services (4.40%) | | | | | | | | |
| Ashmore Group PLC | | | 3,352,854 | | | | 15,103,631 | |
| Virtus Investment Partners, Inc. | | | 377,111 | | | | 40,124,610 | |
| | | | | | | | 55,228,241 | |
| | | | | | | | | |
| Insurance (18.06%) | | | | | | | | |
| Aspen Insurance Holdings, Ltd. | | | 1,227,307 | | | | 64,249,522 | |
| Axis Capital Holdings, Ltd. | | | 951,141 | | | | 62,680,192 | |
| Everest Re Group, Ltd. | | | 195,386 | | | | 49,180,610 | |
| Navigators Group, Inc. | | | 937,428 | | | | 50,667,983 | |
| | | | | | | | 226,778,307 | |
| | | | | | | | | |
| Real Estate (5.26%) | | | | | | | | |
| Jones Lang LaSalle, Inc. | | | 574,448 | | | | 65,981,097 | |
| | | | | | | | | |
| REITS (0.85%) | | | | | | | | |
| Outfront Media, Inc. | | | 410,113 | | | | 10,728,556 | |
| | | | | | | | | |
| TOTAL FINANCIAL | | | | | | | 358,716,201 | |
| | | | | | | | | |
| Industrial (17.18%) | | | | | | | | |
| Electronics (6.20%) | | | | | | | | |
| Ituran Location and Control, Ltd. | | | 1,936,082 | | | | 60,599,366 | |
| Woodward, Inc. | | | 255,007 | | | | 17,256,324 | |
| | | | | | | | 77,855,690 | |
| | | | | | | | | |
| Machinery-Diversified (4.99%) | | | | | | | | |
| Concentric AB | | | 2,115,920 | | | | 34,877,933 | |
| Lindsay Corp. | | | 319,458 | | | | 27,748,122 | |
| | | | | | | | 62,626,055 | |
| | | | | | | | | |
| Miscellaneous Manufacturing (3.48%) | | | | | | | | |
| Actuant Corp., Class A | | | 901,504 | | | | 24,611,059 | |
| Crane Co. | | | 239,430 | | | | 19,132,852 | |
| | | | | | | | 43,743,911 | |
| 14 | www.vulcanvaluepartners.com |
| Vulcan Value Partners Small Cap Fund | Statement of Investments |
April 30, 2017
| | | Shares | | | Value (Note 2) | |
| Industrial (continued) | | | | | | |
| Transportation (2.51%) | | | | | | |
| Forward Air Corp. | | | 591,746 | | | $ | 31,463,135 | |
| | | | | | | | | |
| TOTAL INDUSTRIAL | | | | | | | 215,688,791 | |
| | | | | | | | | |
| Technology (5.16%) | | | | | | | | |
| Software (5.16%) | | | | | | | | |
ACI Worldwide, Inc.(a) | | | 3,016,738 | | | | 64,829,700 | |
| | | | | | | | | |
| TOTAL TECHNOLOGY | | | | | | | 64,829,700 | |
| | | | | | | | | |
| TOTAL COMMON STOCKS | | | | | | | | |
| (Cost $901,905,738) | | | | | | | 1,056,062,641 | |
| | | 7-Day Yield | | | Shares | | | Value (Note 2) | |
| SHORT TERM INVESTMENTS (17.40%) | | | | | | | | | |
| Money Market Fund (17.40%) | | | | | | | | | |
| Dreyfus Treasury Prime Cash Management Fund, Institutional Shares | | | 0.626 | % | | | 218,528,058 | | | | 218,528,058 | |
| | | | | | | | | | | | | |
| TOTAL SHORT TERM INVESTMENTS | | | | | | | | | | | | |
| (Cost $218,528,058) | | | | | | | | | | | 218,528,058 | |
| | | | | | | | | | | | | |
TOTAL INVESTMENTS (101.51%) | | | | | | | | | | | | |
| (Cost $1,120,433,796) | | | | | | | | | | $ | 1,274,590,699 | |
| | | | | | | | | | | | | |
| Liabilities In Excess Of Other Assets (-1.51%) | | | | | | | | | | | (18,984,869 | ) |
| | | | | | | | | | | | | |
| NET ASSETS (100.00%) | | | | | | | | | | $ | 1,255,605,830 | |
| (a) | Non-Income Producing Security. |
For Fund compliance purposes, the Fund's industry classifications refer to any one or more of the industry sub-classifications used by one or more widely recognized market indexes or ratings group indexes, and/or as defined by Fund management. This definition may not apply for purposes of this report, which may combine industry sub-classifications for reporting ease. Industries are shown as a percentage of net assets.
See Accompanying Notes to Financial Statements.
| Annual Report | April 30, 2017 | 15 |
Statements of Assets and Liabilities
April 30, 2017
| | | Vulcan Value Partners Fund | | | Vulcan Value Partners Small Cap Fund | |
| ASSETS: | | | | | | |
| Investments, at value | | $ | 1,281,698,834 | | | $ | 1,274,590,699 | |
| Receivable for investments sold | | | 9,671,812 | | | | 1,637,343 | |
| Receivable for shares sold | | | 113,774 | | | | 1,885,125 | |
| Dividends receivable | | | 2,850,871 | | | | 1,169,946 | |
| Other assets | | | 17,725 | | | | 15,924 | |
| Total assets | | | 1,294,353,016 | | | | 1,279,299,037 | |
| | | | | | | | | |
| LIABILITIES: | | | | | | | | |
| Payable for investments purchased | | | 8,422,429 | | | | 21,684,063 | |
| Payable for shares redeemed | | | 63,494 | | | | 678,187 | |
| Payable to adviser | | | 1,058,156 | | | | 1,155,170 | |
| Payable for administration fees | | | 29,990 | | | | 28,803 | |
| Payable for transfer agency fees | | | 14,487 | | | | 12,397 | |
| Payable for delegated transfer agent equivalent services fees | | | 22,207 | | | | 60,223 | |
| Payable for professional fees | | | 24,657 | | | | 24,019 | |
| Payable for trustee fees and expenses | | | 5,661 | | | | 5,258 | |
| Payable for principal financial officer fees | | | 428 | | | | 405 | |
| Accrued expenses and other liabilities | | | 42,851 | | | | 44,682 | |
| Total liabilities | | | 9,684,360 | | | | 23,693,207 | |
| NET ASSETS | | $ | 1,284,668,656 | | | $ | 1,255,605,830 | |
| | | | | | | | | |
| NET ASSETS CONSIST OF: | | | | | | | | |
| | | | | | | | | |
| Paid-in capital (Note 5) | | $ | 1,133,011,221 | | | $ | 1,030,631,433 | |
| Accumulated net investment income | | | 5,164,657 | | | | 1,029,011 | |
| Accumulated net realized gain/(loss) | | | (114,597 | ) | | | 69,758,015 | |
| Net unrealized appreciation | | | 146,607,375 | | | | 154,187,371 | |
| NET ASSETS | | $ | 1,284,668,656 | | | $ | 1,255,605,830 | |
| | | | | | | | | |
| INVESTMENTS, AT COST | | $ | 1,135,116,527 | | | $ | 1,120,433,796 | |
| | | | | | | | | |
| PRICING OF SHARES: | | | | | | | | |
| Net Asset Value, offering and redemption price per share | | $ | 19.30 | | | $ | 20.16 | |
| Shares of beneficial interest outstanding (unlimited number of shares, no par value common stock authorized) | | | 66,572,453 | | | | 62,287,943 | |
See Accompanying Notes to Financial Statements.
| 16 | www.vulcanvaluepartners.com |
Statements of Operations
For the Year Ended April 30, 2017
| | | Vulcan Value Partners Fund | | | Vulcan Value Partners Small Cap Fund | |
| INVESTMENT INCOME: | | | | | | |
| Dividends | | $ | 29,185,696 | | | $ | 17,680,593 | |
| Foreign taxes withheld | | | (444,865 | ) | | | (616,072 | ) |
| Total investment income | | | 28,740,831 | | | | 17,064,521 | |
| | | | | | | | | |
| EXPENSES: | | | | | | | | |
| Investment advisory fees (Note 6) | | | 13,808,728 | | | | 13,736,066 | |
| Administrative fees | | | 384,471 | | | | 334,210 | |
| Transfer agency fees | | | 139,624 | | | | 111,534 | |
| Delegated transfer agent equivalent services fees | | | 137,162 | | | | 349,405 | |
| Professional fees | | | 41,296 | | | | 38,610 | |
| Custodian fees | | | 182,760 | | | | 154,384 | |
| Principal financial officer fees | | | 5,349 | | | | 4,651 | |
| Trustee fees and expenses | | | 28,193 | | | | 25,299 | |
| Recoupment of previously waived fees | | | – | | | | 88,403 | |
| Other | | | 70,180 | | | | 94,618 | |
| Total expenses before waiver | | | 14,797,763 | | | | 14,937,180 | |
| Less fees waived/reimbursed by investment adviser (Note 6) | | | – | | | | (3,407 | ) |
| Total net expenses | | | 14,797,763 | | | | 14,933,773 | |
| NET INVESTMENT INCOME | | | 13,943,068 | | | | 2,130,748 | |
| | | | | | | | | |
| Net realized gain on investments | | | 89,828,413 | (a) | | | 113,977,593 | |
| Net realized gain/(loss) on foreign currency transactions | | | (261,098 | ) | | | 166,422 | |
| Net realized gain | | | 89,567,315 | | | | 114,144,015 | |
| Net change in unrealized appreciation of investments | | | 69,367,230 | | | | 123,753,274 | |
| Net change in unrealized appreciation/(depreciation) on translation of assets and liabilities denominated in foreign currencies | | | (53,659 | ) | | | 19,097 | |
| Net change in unrealized appreciation | | | 69,313,571 | | | | 123,772,371 | |
| NET REALIZED AND UNREALIZED GAIN ON INVESTMENTS | | | 158,880,886 | | | | 237,916,386 | |
| NET INCREASE IN NET ASSETS RESULTING FROM OPERATIONS | | $ | 172,823,954 | | | $ | 240,047,134 | |
(a) | See Note 2 for gain/(loss) on In-Kind transactions. |
See Accompanying Notes to Financial Statements.
| Annual Report | April 30, 2017 | 17 |
| Statements of Changes in Net Assets | Vulcan Value Partners Fund |
| | | For the Year Ended April 30, 2017 | | | For the Year Ended April 30, 2016 | |
| OPERATIONS: | | | | | | |
| Net investment income | | $ | 13,943,068 | | | $ | 18,348,805 | |
| Net realized gain | | | 89,567,315 | | | | 10,248,578 | |
| Net change in unrealized appreciation/(depreciation) | | | 69,313,571 | | | | (154,854,968 | ) |
| Net increase/(decrease) in net assets resulting from operations | | | 172,823,954 | | | | (126,257,585 | ) |
| | | | | | | | | |
| DISTRIBUTIONS TO SHAREHOLDERS (Note 3): | | | | | | | | |
| From net investment income | | | (17,969,116 | ) | | | (12,104,797 | ) |
| From net realized gains on investments | | | – | | | | (119,403,152 | ) |
| Net decrease in net assets from distributions | | | (17,969,116 | ) | | | (131,507,949 | ) |
| | | | | | | | | |
| SHARE TRANSACTIONS (Note 5): | | | | | | | | |
| Proceeds from sales of shares | | | 162,065,966 | | | | 572,087,701 | |
| Issued to shareholders in reinvestment of distributions | | | 13,362,586 | | | | 108,659,155 | |
| Cost of shares redeemed, net of redemption fees | | | (573,695,164 | ) | | | (665,005,259 | ) |
| Net increase/(decrease) from share transactions | | | (398,266,612 | ) | | | 15,741,597 | |
| | | | | | | | | |
| Net decrease in net assets | | | (243,411,774 | ) | | | (242,023,937 | ) |
| | | | | | | | | |
| NET ASSETS: | | | | | | | | |
| Beginning of year | | | 1,528,080,430 | | | | 1,770,104,367 | |
| End of year* | | $ | 1,284,668,656 | | | $ | 1,528,080,430 | |
| | | | | | | | | |
| *Includes accumulated net investment income of: | | $ | 5,164,657 | | | $ | 9,450,857 | |
See Accompanying Notes to Financial Statements.
| 18 | www.vulcanvaluepartners.com |
| Vulcan Value Partners Small Cap Fund | Statements of Changes in Net Assets |
| | | For the Year Ended April 30, 2017 | | | For the Year Ended April 30, 2016 | |
| OPERATIONS: | | | | | | |
| Net investment income | | $ | 2,130,748 | | | $ | 6,643,642 | |
| Net realized gain | | | 114,144,015 | | | | 2,674,138 | |
| Net change in unrealized appreciation/(depreciation) | | | 123,772,371 | | | | (62,869,159 | ) |
| Net increase/(decrease) in net assets resulting from operations | | | 240,047,134 | | | | (53,551,379 | ) |
| | | | | | | | | |
| DISTRIBUTIONS TO SHAREHOLDERS (Note 3): | | | | | | | | |
| From net investment income | | | (3,924,578 | ) | | | (3,951,718 | ) |
| From net realized gains on investments | | | – | | | | (63,400,984 | ) |
| Net decrease in net assets from distributions | | | (3,924,578 | ) | | | (67,352,702 | ) |
| | | | | | | | | |
| SHARE TRANSACTIONS (Note 5): | | | | | | | | |
| Proceeds from sales of shares | | | 274,573,708 | | | | 333,969,377 | |
| Issued to shareholders in reinvestment of distributions | | | 2,400,082 | | | | 55,331,982 | |
| Cost of shares redeemed, net of redemption fees | | | (404,497,434 | ) | | | (254,512,720 | ) |
| Net increase/(decrease) from share transactions | | | (127,523,644 | ) | | | 134,788,639 | |
| | | | | | | | | |
| Net increase in net assets | | | 108,598,912 | | | | 13,884,558 | |
| | | | | | | | | |
| NET ASSETS: | | | | | | | | |
| Beginning of year | | | 1,147,006,918 | | | | 1,133,122,360 | |
| End of year* | | $ | 1,255,605,830 | | | $ | 1,147,006,918 | |
| | | | | | | | | |
| *Includes accumulated net investment income of: | | $ | 1,029,011 | | | $ | 2,656,416 | |
See Accompanying Notes to Financial Statements.
| Annual Report | Annual Report | 19 |
Financial Highlights
For a share outstanding throughout the years presented.
| NET ASSET VALUE, BEGINNING OF PERIOD |
| INCOME/(LOSS) FROM OPERATIONS: |
Net investment income(a) |
| Net realized and unrealized gain/(loss) on investments |
| Total from investment operations |
| |
| LESS DISTRIBUTIONS TO SHAREHOLDERS: |
| From net investment income |
| From net realized gains on investments |
| Total distributions |
| |
| Redemption fees added to paid-in capital |
| Increase/(decrease) in net asset value |
| NET ASSET VALUE, END OF YEAR |
| |
| Total return |
| |
| RATIOS AND SUPPLEMENTAL DATA: |
| Net assets, end of year (000's) |
| |
| Ratio of expenses to average net assets without fee waivers/reimbursements |
| Ratio of expenses to average net assets including fee waivers/reimbursements |
| Net investment income to average net assets including fee waivers/reimbursements |
| |
| Portfolio turnover rate |
| (a) | Per share numbers have been calculated using the average shares method. |
(b) | Less than $0.005 per share. |
See Accompanying Notes to Financial Statements.
| 20 | www.vulcanvaluepartners.com |
Vulcan Value Partners Fund
| | For the Year Ended April 30, 2017 | | | For the Year Ended April 30, 2016 | | | For the Year Ended April 30, 2015 | | | For the Year Ended April 30, 2014 | | | For the Year Ended April 30, 2013 | |
| | $ | 17.17 | | | $ | 19.97 | | | $ | 18.20 | | | $ | 15.28 | | | $ | 13.03 | |
| | | | | | | | | | | | | | | | | | | | |
| | | 0.18 | | | | 0.20 | | | | 0.22 | | | | 0.14 | | | | 0.15 | |
| | | 2.18 | | | | (1.51 | ) | | | 2.77 | | | | 3.33 | | | | 2.35 | |
| | | 2.36 | | | | (1.31 | ) | | | 2.99 | | | | 3.47 | | | | 2.50 | |
| | | | | | | | | | | | | | | | | | | | |
| | | (0.23 | ) | | | (0.13 | ) | | | (0.17 | ) | | | (0.11 | ) | | | (0.12 | ) |
| | | – | | | | (1.36 | ) | | | (1.05 | ) | | | (0.44 | ) | | | (0.13 | ) |
| | | (0.23 | ) | | | (1.49 | ) | | | (1.22 | ) | | | (0.55 | ) | | | (0.25 | ) |
| | | | | | | | | | | | | | | | | | | | |
| | | 0.00 | (b) | | | 0.00 | (b) | | | 0.00 | (b) | | | 0.00 | (b) | | | 0.00 | (b) |
| | | 2.13 | | | | (2.80 | ) | | | 1.77 | | | | 2.92 | | | | 2.25 | |
| | $ | 19.30 | | | $ | 17.17 | | | $ | 19.97 | | | $ | 18.20 | | | $ | 15.28 | |
| | | | | | | | | | | | | | | | | | | | |
| | | 13.85 | % | | | (6.49 | %) | | | 16.61 | % | | | 22.84 | % | | | 19.33 | % |
| | | | | | | | | | | | | | | | | | | | |
| | $ | 1,284,669 | | | $ | 1,528,080 | | | $ | 1,770,104 | | | $ | 929,829 | | | $ | 447,297 | |
| | | | | | | | | | | | | | | | | | | | |
| | | 1.07 | % | | | 1.08 | % | | | 1.08 | % | | | 1.09 | % | | | 1.18 | % |
| | | 1.07 | % | | | 1.08 | % | | | 1.08 | % | | | 1.09 | % | | | 1.18 | % |
| | | 1.01 | % | | | 1.10 | % | | | 1.12 | % | | | 0.80 | % | | | 1.06 | % |
| | | | | | | | | | | | | | | | | | | | |
| | | 49 | % | | | 85 | % | | | 64 | % | | | 56 | % | | | 24 | % |
| Annual Report | April 30, 2017 | 21 |
Financial Highlights
For a share outstanding throughout the years presented.
| NET ASSET VALUE, BEGINNING OF PERIOD |
| INCOME/(LOSS) FROM OPERATIONS: |
Net investment income/(loss)(a) |
| Net realized and unrealized gain/(loss) on investments |
| Total from investment operations |
| |
| LESS DISTRIBUTIONS TO SHAREHOLDERS: |
| From net investment income |
| From net realized gains on investments |
| Total distributions |
| |
Redemption fees added to paid‐in capital |
| Increase/(decrease) in net asset value |
| NET ASSET VALUE, END OF YEAR |
| |
| Total return |
| |
| RATIOS AND SUPPLEMENTAL DATA: |
| Net assets, end of year (000’s) |
| |
| Ratio of expenses to average net assets without fee waivers/reimbursements |
| Ratio of expenses to average net assets including fee waivers/reimbursements |
| |
| Net investment income/(loss) to average net assets including fee waivers/reimbursements |
| |
| Portfolio turnover rate |
(a) | Per share numbers have been calculated using the average shares method. |
(b) | Less than $0.005 per share. |
See Accompanying Notes to Financial Statements.
| 22 | www.vulcanvaluepartners.com |
Vulcan Value Partners Small Cap Fund
| | For the Year Ended April 30, 2017 | | | For the Year Ended April 30, 2016 | | | For the Year Ended April 30, 2015 | | | For the Year Ended April 30, 2014 | | | For the Year Ended April 30, 2013 | |
| | $ | 16.58 | | | $ | 18.61 | | | $ | 18.74 | | | $ | 16.97 | | | $ | 13.18 | |
| | | | | | | | | | | | | | | | | | | | |
| | | 0.03 | | | | 0.10 | | | | 0.10 | | | | (0.01 | ) | | | 0.03 | |
| | | 3.61 | | | | (1.05 | ) | | | 1.77 | | | | 2.76 | | | | 3.91 | |
| | | 3.64 | | | | (0.95 | ) | | | 1.87 | | | | 2.75 | | | | 3.94 | |
| | | | | | | | | | | | | | | | | | | | |
| | | (0.06 | ) | | | (0.06 | ) | | | (0.11 | ) | | | – | | | | (0.06 | ) |
| | | – | | | | (1.02 | ) | | | (1.89 | ) | | | (0.98 | ) | | | (0.09 | ) |
| | | (0.06 | ) | | | (1.08 | ) | | | (2.00 | ) | | | (0.98 | ) | | | (0.15 | ) |
| | | | | | | | | | | | | | | | | | | | |
| | | 0.00 | (b) | | | 0.00 | (b) | | | 0.00 | (b) | | | 0.00 | (b) | | | 0.00 | (b) |
| | | 3.58 | | | | (2.03 | ) | | | (0.13 | ) | | | 1.77 | | | | 3.79 | |
| | $ | 20.16 | | | $ | 16.58 | | | $ | 18.61 | | | $ | 18.74 | | | $ | 16.97 | |
| | | | | | | | | | | | | | | | | | | | |
| | | 21.97 | % | | | (5.04 | %) | | | 10.74 | % | | | 16.11 | % | | | 30.07 | % |
| | | | | | | | | | | | | | | | | | | | |
| | $ | 1,255,606 | | | $ | 1,147,007 | | | $ | 1,133,122 | | | $ | 1,066,246 | | | $ | 425,152 | |
| | | | | | | | | | | | | | | | | | | | |
| | | 1.25 | % | | | 1.25 | % | | | 1.26 | % | | | 1.30 | % | | | 1.38 | % |
| | | 1.25 | % | | | 1.25 | % | | | 1.25 | % | | | 1.25 | % | | | 1.28 | % |
| | | | | | | | | | | | | | | | | | | | |
| | | 0.18 | % | | | 0.61 | % | | | 0.56 | % | | | (0.05 | %) | | | 0.21 | % |
| | | | | | | | | | | | | | | | | | | | |
| | | 52 | % | | | 80 | % | | | 73 | % | | | 70 | % | | | 57 | % |
| Annual Report | April 30, 2017 | 23 |
Notes to Financial Statements
April 30, 2017
1. ORGANIZATION
Financial Investors Trust (the “Trust”) is organized as a Delaware statutory trust and is registered as an open‐end management investment company under the Investment Company Act of 1940, as amended (“1940 Act”). The Trust consists of multiple separate portfolios or series. This annual report describes the Vulcan Value Partners Fund and Vulcan Value Partners Small Cap Fund (each a “Fund” and collectively, the “Funds”). The Funds seek to achieve long‐term capital appreciation.
2. SIGNIFICANT ACCOUNTING POLICIES
The accompanying financial statements were prepared in accordance with accounting principles generally accepted in the United States of America (“U.S. GAAP”), including policies specific to investment companies. The preparation of financial statements in conformity with U.S. GAAP requires management to make certain estimates and assumptions that affect the reported amounts of assets and liabilities and disclosures of contingent assets and liabilities at the date of the financial statements and the reported amounts of revenue and expenses during the period. Actual results could differ from those estimates. The Funds are considered an investment company for financial reporting purposes under U.S. GAAP. The following is a summary of significant accounting policies consistently followed by the Funds in preparation of their financial statements.
Investment Valuation: The Funds generally value their securities based on market prices determined at the close of regular trading on the New York Stock Exchange (“NYSE”), normally 4:00 p.m. Eastern Time, on each day the NYSE is open for trading.
For equity securities and mutual funds that are traded on an exchange, the market price is usually the closing sale or official closing price on that exchange. In the case of equity securities not traded on an exchange, or if such closing prices are not otherwise available, the securities are valued at the mean of the most recent bid and ask prices on such day. Redeemable securities issued by open‐end registered investment companies are valued at the investment company’s applicable net asset value, with the exception of exchange‐traded open‐end investment companies, which are priced as equity securities.
The market price for debt obligations is generally the quote supplied by an independent third‐party pricing service approved by the Board of Trustees (the “Board”), which may use a matrix, formula or other objective method that takes into consideration quotations from dealers, market transactions in comparable investments, market indices and yield curves. If vendors are unable to supply a quote, or if the quote supplied is deemed to be unreliable, the market price may be determined using quotations received from one or more broker–dealers that make a market in the security.
Equity securities that are primarily traded on foreign securities exchanges are valued at the preceding closing values of such securities on their respective exchanges, except when an occurrence subsequent to the time a value was so established is likely to have changed such value. In such an event, the fair values of those securities are determined in good faith through consideration of other factors in accordance with procedures established by and under the general supervision of the Board.
| 24 | www.vulcanvaluepartners.com |
Notes to Financial Statements
April 30, 2017
When such prices or quotations are not available, or when Vulcan Value Partners, LLC (the “Adviser”) believes that they are unreliable, securities may be priced using fair value procedures approved by the Board.
Fair Value Measurements: A three‐tier hierarchy has been established to classify fair value measurements for disclosure purposes. Inputs refer broadly to the assumptions that market participants would use in pricing the asset or liability, including assumptions about risk. Inputs may be observable or unobservable. Observable inputs are inputs that reflect the assumptions market participants would use in pricing the asset or liability that are developed based on market data obtained from sources independent of the reporting entity. Unobservable inputs are inputs that reflect the reporting entity’s own assumptions about the assumptions market participants would use in pricing the asset or liability that are developed based on the best information available. Various inputs are used in determining the value of each Fund’s investments as of the reporting period end. The designated input levels are not necessarily an indication of the risk or liquidity associated with these investments. These inputs are categorized in the following hierarchy under applicable financial accounting standards:
| Level 1 – | Unadjusted quoted prices in active markets for identical investments, unrestricted assets or liabilities that the Funds have the ability to access at the measurement date; |
| Level 2 – | Quoted prices which are not active, quoted prices for similar assets or liabilities in active markets or inputs other than quoted prices that are observable (either directly or indirectly) for substantially the full term of the asset or liability; and |
| Level 3 – | Significant unobservable prices or inputs (including the Funds’ own assumptions in determining the fair value of investments) where there is little or no market activity for the asset or liability at the measurement date. |
The following is a summary of each input used to value each Fund’s investments as of April 30, 2017.
Vulcan Value Partners Fund:
| Investments in Securities at Value | | Level 1 - Unadjusted Quoted Prices | | | Level 2 - Other Significant Observable Inputs | | | Level 3 - Significant Unobservable Inputs | | | Total | |
Common Stocks(a) | | $ | 1,245,627,060 | | | $ | – | | | $ | – | | | $ | 1,245,627,060 | |
| Short Term Investments | | | 36,071,774 | | | | – | | | | – | | | | 36,071,774 | |
| TOTAL | | $ | 1,281,698,834 | | | $ | – | | | $ | – | | | $ | 1,281,698,834 | |
Vulcan Value Partners Small Cap Fund:
| Investments in Securities at Value | | Level 1 - Unadjusted Quoted Prices | | | Level 2 - Other Significant Observable Inputs | | | Level 3 - Significant Unobservable Inputs | | | Total | |
Common Stocks(a) | | $ | 1,056,062,641 | | | $ | – | | | $ | – | | | $ | 1,056,062,641 | |
| Short Term Investments | | | 218,528,058 | | | | – | | | | – | | | | 218,528,058 | |
| TOTAL | | $ | 1,274,590,699 | | | $ | – | | | $ | – | | | $ | 1,274,590,699 | |
(a) | For detailed descriptions, see the accompanying Statements of Investments. |
| Annual Report | April 30, 2017 | 25 |
Notes to Financial Statements
April 30, 2017
The Funds recognize transfers between levels as of the end of period. For the year ended April 30, 2017, the Funds did not have any transfers between Level 1 and Level 2. For the year ended April 30, 2017, the Funds did not have any securities that used significant unobservable inputs (Level 3) in determining fair value.
Investment Transactions and Investment Income: Investment transactions are accounted for on the date the investments are purchased or sold (trade date). Realized gains and losses from investment transactions are reported on an identified cost basis, which is the same basis the Funds use for federal income tax purposes. Interest income, which includes accretion of discounts and amortization of premiums, is accrued and recorded as earned. Dividend income is recognized on the ex‐dividend date or for certain foreign securities, as soon as information is available to the Funds. All of the realized and unrealized gains and losses and net investment income, are allocated daily to each class in proportion to its average daily net assets.
ReFlow Liquidity Program: Each Fund may participate in the ReFlow liquidity program, which is designed to provide an alternative liquidity source for mutual funds experiencing net redemptions of their shares. Pursuant to the program, ReFlow Fund, LLC (“ReFlow”) provides participating mutual funds with a source of cash to meet net shareholder redemptions by standing ready each business day to purchase fund shares up to the value of the net shares redeemed by other shareholders that are to settle the next business day. ReFlow will purchase shares of the Fund at net asset value and will not be subject to any investment minimums. Following purchases of Fund shares, ReFlow then generally redeems those shares when the Fund experiences net subscriptions, at the end of a maximum holding period determined by ReFlow (currently 28 days), or at other times as the Fund may request. ReFlow may choose to redeem its position in the Fund with an in‐kind transfer of securities, instead of cash, enabling the Fund to avoid a realization of capital gains on the securities it transfers. ReFlow will not be subject to any short‐term redemption fees. While ReFlow holds Fund shares, it will have the same rights and privileges with respect to those shares as any other shareholder. For use of the ReFlow service, a Fund pays a fee to ReFlow each time it purchases Fund shares, calculated by applying to the purchase amount a fee rate determined through an automated daily auction among participating mutual funds. The current minimum fee rate is 0.20% of the value of the Fund shares purchased by ReFlow although the Fund may submit a bid at a higher fee rate if it determines that doing so is in the best interest of Fund shareholders. In accordance with federal securities laws, ReFlow is prohibited from acquiring more than 3% of the outstanding voting securities of a Fund. There is no assurance that ReFlow will have sufficient funds available to meet the Funds’ liquidity needs on a particular day. During the fiscal year ended April 30, 2017, the Funds did not participate in ReFlow.
Real Estate Investment Trusts (“REITs”): The Funds may invest a portion of their assets in REITs and are subject to certain risks associated with direct investment in REITs. REITs may be affected by changes in the value of their underlying properties and by defaults by borrowers or tenants. REITs depend generally on their ability to generate cash flow to make distributions to shareowners, and certain REITs have self‐liquidation provisions by which mortgages held may be paid in full and distributions of capital returns may be made at any time. In addition, the performance of a REIT may be affected by its failure to qualify for tax‐free pass‐through of income under the Internal Revenue Code of 1986, as amended (the “Code”), or its failure to maintain exemption from registration under the 1940 Act. A Fund’s investments in REITs may result in such Fund’s receipt of cash in excess of the REITs’ earnings. If the Fund receives such distributions all or a portion of these distributions will constitute a return of capital to such Fund. Receiving a return of capital distribution from REITs will reduce the amount of income available to be distributed to Fund shareholders. Income from REITs generally will not be eligible for treatment as qualified dividend income. As the final character of the distributions is not known until reported by the REITs on their 1099s, the Funds utilize an average of the prior year’s reallocation information as an estimate for the current year character of distributions.
| 26 | www.vulcanvaluepartners.com |
Notes to Financial Statements
April 30, 2017
Foreign Securities: The Funds may directly purchase securities of foreign issuers. Investing in securities of foreign issuers involves special risks not typically associated with investing in securities of U.S. issuers. The risks include possible reevaluation of currencies, the inability to repatriate foreign currency, less complete financial information about companies and possible future adverse political and economic developments. Moreover, securities of many foreign issuers and their markets may be less liquid and their prices more volatile than those of securities of comparable U.S. issuers.
Foreign Currency Translation: The books and records of the Funds are maintained in U.S. dollars. Investment valuations and other assets and liabilities initially expressed in foreign currencies are converted each business day into U.S. dollars based upon current exchange rates. Prevailing foreign exchange rates may generally be obtained at the close of the NYSE (normally, 4:00 p.m. Eastern Time). The portion of realized and unrealized gains or losses on investments due to fluctuations in foreign currency exchange rates is not separately disclosed and is included in realized and unrealized gains or losses on investments, when applicable.
In‐Kind Redemptions: On January 6, 2017, the Vulcan Value Partners Fund distributed portfolio securities rather than cash as payment for certain redemptions of fund shares (in‐kind redemptions). The proceeds for the in‐kind redemptions, which are included in Redemption of shares in the Statements of Changes in Net Assets, were $156,578,655 and represented 12.53% of the Fund’s net assets on January 6, 2017. For financial reporting purposes, the Fund recognized gains on the in‐kind redemptions in the amount of $40,538,262. For tax purposes, the gains are not recognized.
Trust Expenses: Some expenses of the Trust can be directly attributed to the Funds. Expenses which cannot be directly attributed are apportioned among all funds in the Trust based on average net assets of each fund.
Fund Expenses: Expenses that are specific to a Fund are charged directly to that Fund.
Federal Income Taxes: Each Fund complies with the requirements under Subchapter M of the Internal Revenue Code of 1986, as amended, applicable to regulated investment companies and intends to distribute substantially all of its net taxable income and net capital gains, if any, each year so that it will not be subject to excise tax on undistributed income and gains. The Funds are not subject to income taxes to the extent such distributions are made.
As of and during the year ended April 30, 2017, the Funds did not have a liability for any unrecognized tax benefits. The Funds file U.S. federal, state, and local tax returns as required. The Fund’s tax returns are subject to examination by the relevant tax authorities until expiration of the applicable statute of limitations, which is generally three years after the filing of the tax return for federal purposes and four years for most state returns. Tax returns for open years have incorporated no uncertain tax positions that require a provision for income taxes.
| Annual Report | April 30, 2017 | 27 |
Notes to Financial Statements
April 30, 2017
Distributions to Shareholders: Each Fund normally pays dividends and distributes capital gains, if any, on an annual basis. Income dividend distributions are derived from dividends and other income each Fund receives from its investments, including short‐term capital gains. Long term capital gain distributions are derived from gains realized when each Fund sells a security it has owned for more than a year. Each Fund may make additional distributions and dividends at other times if the portfolio manager believes doing so may be necessary for each Fund to avoid or reduce taxes.
3. TAX BASIS INFORMATION
Reclassifications: As of April 30, 2017, permanent differences in book and tax accounting were reclassified. These differences had no effect on net assets and were primarily attributed to foreign currency transactions and in‐kind redemptions. The reclassifications were as follows:
| Fund | | Paid-in Capital | | | Accumulated Net Investment Income | | | Accumulated Net Realized Gain/(Loss) on Investments | |
| Vulcan Value Partners Fund | | $ | 40,523,870 | | | $ | (260,152 | ) | | $ | (40,263,718 | ) |
| Vulcan Value Partners Small Cap Fund | | | – | | | | 166,425 | | | | (166,425 | ) |
Tax Basis of Investments: As of April 30, 2017, the aggregate cost of investments, gross unrealized appreciation/ (depreciation) and net unrealized appreciation for federal tax purposes was as follows:
| | | Vulcan Value Partners Fund | | | Vulcan Value Partners Small Cap Fund | |
| Gross appreciation | | | | | | |
| (excess of value over tax cost) | | $ | 256,298,879 | | | $ | 245,193,969 | |
| Gross depreciation | | | | | | | | |
| (excess of tax cost over value) | | | (124,358,200 | ) | | | (91,844,553 | ) |
| Net appreciation of foreign currency and | | | | | | | | |
| derivatives | | | 25,068 | | | | 30,468 | |
| Net unrealized appreciation | | $ | 131,965,747 | | | $ | 153,379,884 | |
| Cost of investments for income tax purposes | | $ | 1,149,758,155 | | | $ | 1,121,241,283 | |
| 28 | www.vulcanvaluepartners.com |
Notes to Financial Statements
April 30, 2017
Components of Earnings: As of April 30, 2017, components of distributable earnings were as follows:
| | | Vulcan Value Partners Fund | | | Vulcan Value Partners Small Cap Fund | |
| Undistributed ordinary income | | $ | 19,691,688 | | | $ | 58,550,366 | |
| Accumulated capital gains | | | – | | | | 13,044,147 | |
| Net unrealized appreciation on investments | | | 131,965,747 | | | | 153,379,884 | |
| Total | | $ | 151,657,435 | | | $ | 224,974,397 | |
Tax Basis of Distributions to Shareholders: The character of distributions made during the year from net investment income or net realized gains may differ from its ultimate characterization for federal income tax purposes. Also, due to the timing of dividend distributions, the fiscal year in which amounts are distributed may differ from the fiscal year in which the income or realized gain were recorded by each Fund.
The tax character of distributions paid by the Funds for the fiscal years ended April 30, 2017 and April 30, 2016 were as follows:
| | | Ordinary Income | | | Long-Term Capital Gain | |
| 2017 | | | | | | |
| Vulcan Value Partners Fund | | $ | 17,969,116 | | | $ | – | |
| Vulcan Value Partners Small Cap Fund | | | 3,924,578 | | | | – | |
| | | Ordinary Income | | | Long-Term Capital Gain | |
| 2016 | | | | | | |
| Vulcan Value Partners Fund | | $ | 48,548,716 | | | $ | 82,959,233 | |
| Vulcan Value Partners Small Cap Fund | | | 10,661,578 | | | | 56,691,124 | |
| Annual Report | April 30, 2017 | 29 |
Notes to Financial Statements
April 30, 2017
4. SECURITIES TRANSACTIONS
The cost of purchases and proceeds from sales of securities (excluding short‐term securities) during the year ended April 30, 2017 were as follows:
| Fund | | Purchases of Securities | | | Proceeds From Sales of Securities | |
| Vulcan Value Partners Fund | | $ | 660,550,618 | | | $ | 1,042,699,655 | |
| Vulcan Value Partners Small Cap Fund | | | 534,171,252 | | | | 621,186,058 | |
For the year ended April 30, 2017, the cost of in‐kind purchases and proceeds from in‐kind sales were as follows:
| Fund | | Purchases of Securities | | | Proceeds From Sales of Securities | |
| Vulcan Value Partners Fund | | $ | – | | | $ | 156,578,655 | |
5. CAPITAL SHARE TRANSACTIONS
The capitalization of the Trust consists of an unlimited number of shares of beneficial interest with no par value per share. Holders of the shares of the Funds of the Trust have one vote for each share held and a proportionate fraction of a vote for each fractional share. All shares issued and outstanding are fully paid and are transferable and redeemable at the option of the shareholder. Purchasers of the shares do not have any obligation to make payments to the Trust or its creditors solely by reason of the purchasers’ ownership of the shares. Shares have no pre‐emptive rights.
Shares redeemed within 90 days of purchase may incur a 2% short‐term redemption fee deducted from the redemption amount. The Vulcan Value Partners Fund and the Vulcan Value Partners Small Cap Fund retained $34,938 and $32,740, respectively, for the year ended April 30, 2017, and $100,356 and $10,334, respectively, for the year ended April 30, 2016, which is reflected in the “Cost of shares redeemed, net of redemption fees” in the Statements of Changes in Net Assets.
Transactions in shares of capital stock for the dates listed below were as follows:
Vulcan Value Partners Fund
| | | For the Year Ended April 30, 2017 | | | For the Year Ended April 30, 2016 | |
| Shares Sold | | | 9,220,974 | | | | 32,133,506 | |
| Shares Issued in Reinvestment of Dividends | | | 737,043 | | | | 6,372,007 | |
| Less Shares Redeemed | | | (32,359,605 | ) | | | (38,169,154 | ) |
| Net Increase/(Decrease) | | | (22,401,588 | ) | | | 336,359 | |
| 30 | www.vulcanvaluepartners.com |
Notes to Financial Statements
April 30, 2017
Vulcan Value Partners Small Cap Fund
| | | For the Year Ended April 30, 2017 | | | For the Year Ended April 30, 2016 | |
| Shares Sold | | | 15,271,480 | | | | 20,302,249 | |
| Shares Issued in Reinvestment of Dividends | | | 125,989 | | | | 3,358,435 | |
| Less Shares Redeemed | | | (22,299,640 | ) | | | (15,350,234 | ) |
| Net Increase/(Decrease) | | | (6,902,171 | ) | | | 8,310,450 | |
6. MANAGEMENT AND RELATED‐PARTY TRANSACTIONS
The Adviser, subject to the authority of the Board, is responsible for the overall management and administration of the Funds’ business affairs. The Adviser manages the investments of the Funds in accordance with each Fund’s investment objective, policies and limitations and investment guidelines established jointly by the Adviser and the Board. Pursuant to the Investment Advisory Agreement (the “Advisory Agreement”), the Funds pay the Adviser an annual management fee of 1.00% and 1.15% for Vulcan Value Partners Fund and Vulcan Value Partners Small Cap Fund, respectively, based on each Fund’s average daily net assets. The management fee is paid on a monthly basis.
The Adviser has contractually agreed to limit the Fund’s total annual fund operating expenses (exclusive of acquired fund fees and expenses, brokerage expenses, interest expense, taxes and extraordinary expenses) to 1.25% of each Fund’s average daily net assets. This agreement (the “Expense Agreement”) is in effect from September 1, 2016 through August 31, 2017. The prior Expense Agreement was in effect from June 10, 2015 through August 31, 2016. The Adviser will be permitted to recover, on a class‐by‐class basis, expenses it has borne through the Expense Agreement to the extent that a Fund’s expenses in later periods fall below the expense cap in effect at the time of waiver or reimbursement. Notwithstanding the foregoing, the Funds will not be obligated to pay any such fees and expenses more than three years after the end of the fiscal year in which the fees or expenses were foregone or reimbursed. The Adviser may not discontinue or modify this waiver prior to August 31, 2017 without the approval by the Funds’ Board.
For the year ended April 30, 2017, the fee waivers and/or reimbursements and recoupment amounts were as follows:
| Fund | | Fees Waived/Reimbursed By Adviser | | | Recoupment of Previously Waived Fees by Adviser | |
| Vulcan Value Partners Fund | | $ | – | | | $ | – | |
| Vulcan Value Partners Small Cap Fund | | | 3,407 | | | | 88,403 | |
As of April 30, 2017, the balances of recoupable expenses for each Fund were as follows:
| Fund | | Expires 2018 | | | Expires 2019 | | | Expires 2020 | | | Total | |
| Vulcan Value Partners Fund | | $ | – | | | $ | – | | | $ | – | | | $ | – | |
| Vulcan Value Partners Small Cap Fund | | | 79,989 | | | | – | | | | 3,407 | | | | 83,396 | |
| Annual Report | April 30, 2017 | 31 |
Notes to Financial Statements
April 30, 2017
Fund Administrator Fees and Expenses: ALPS Fund Services, Inc. (“ALPS”) serves as administrator to the Funds and the Funds have agreed to pay expenses incurred in connection with their administrative activities. Pursuant to an Administration Agreement, ALPS provides operational services to the Funds including, but not limited to fund accounting and fund administration and generally assist in each Fund’s operations. Officers of the Trust are employees of ALPS. The Funds’ administration fee is accrued on a daily basis and paid monthly. Administration fees paid by the Funds for the year ended April 30, 2017 are disclosed in the Statements of Operations.
ALPS is reimbursed by the Funds for certain out-of-pocket expenses.
Transfer Agent: ALPS serves as transfer, dividend paying and shareholder servicing agent for the Funds. ALPS receives an annual minimum fee, a fee based upon the number of shareholder accounts, and is also reimbursed by the Funds for certain out-of-pocket expenses. Transfer agent fees paid by the Funds for the year ended April 30, 2017 are disclosed in the Statements of Operations.
Compliance Services: ALPS provides services that assist the Trust’s chief compliance officer in monitoring and testing the policies and procedures of the Trust in conjunction with requirements under Rule 38a-1 under the 1940 Act and receives an annual base fee. ALPS is reimbursed for certain out-of-pocket expenses by the Funds. Vulcan pays this fee on behalf of the Funds.
Principal Financial Officer: ALPS Fund Services, Inc. (“ALPS” and the “Administrator”) (an affiliate of ADI) receives an annual fee for providing principal financial officer services to the Funds. Principal financial officer fees paid by the Fund for the year ended April 30, 2017 are disclosed in the Statements of Operations.
Distributor: ALPS Distributors, Inc. (“ADI” or the “Distributor”) (an affiliate of ALPS Fund Services, Inc.) acts as the distributor of each Fund’s shares pursuant to a Distribution Agreement with the Trust. Shares are sold on a continuous basis by ADI as agent for the Funds, and ADI has agreed to use its best efforts to solicit orders for the sale of each Fund’s shares, although it is not obliged to sell any particular amount of shares. ADI is not entitled to any compensation for its services as Distributor. ADI is registered as a broker-dealer with the U.S. Securities and Exchange Commission. Certain intermediaries may charge networking, omnibus account or other administrative fees with respect to transactions in shares of the Funds. Transactions may be processed through the National Securities Clearing Corporation (“NSCC”) or similar systems or processed on a manual basis. These fees are paid by the Funds to the Distributor, which uses such fees to reimburse intermediaries. In the event an intermediary receiving payments from the Distributor on behalf of the Funds converts from a networking structure to an omnibus account structure or otherwise experiences increased costs, fees borne by the Funds may increase. Fees are disclosed on the Statements of Operations as “Delegated transfer agent equivalent services fees”.
7. INDEMNIFICATIONS
Under the Trust’s organizational documents, its Officers and Trustees are indemnified against certain liability arising out of the performance of their duties to the Trust. Additionally, in the normal course of business, the Trust enters into contracts with service providers that may contain general indemnification clauses which may permit indemnification to the extent permissible under applicable law. The Trust’s maximum exposure under these arrangements is unknown, as this would involve future claims that may be made against the Trust that have not yet occurred.
| 32 | www.vulcanvaluepartners.com |
Notes to Financial Statements
April 30, 2017
8. RECENT ACCOUNTING PRONOUNCEMENT
On October 13, 2016, the SEC amended Regulation S-X, which will require standardized, enhanced disclosure about derivatives in investment company financial statements, as well as other amendments. The compliance date for the amendments to Regulation S-X is August 1, 2017. Management is currently evaluating the impact to the financial statements and disclosures.
| Annual Report | April 30, 2017 | 33 |
Report of Independent Registered Public Accounting Firm
To the Shareholders and Board of Trustees of Financial Investors Trust:
We have audited the accompanying statements of assets and liabilities, including the statements of investments, of Vulcan Value Partners Fund and Vulcan Value Partners Small Cap Fund (the “Funds”), two of the portfolios constituting Financial Investors Trust, as of April 30, 2017, and the related statements of operations for the year then ended, the statements of changes in net assets for each of the two years in the period then ended, and the financial highlights for each of the five years in the period then ended. These financial statements and financial highlights are the responsibility of the Funds’ management. Our responsibility is to express an opinion on these financial statements and financial highlights based on our audits.
We conducted our audits in accordance with the standards of the Public Company Accounting Oversight Board (United States). Those standards require that we plan and perform the audit to obtain reasonable assurance about whether the financial statements and financial highlights are free of material misstatement. The Funds are not required to have, nor were we engaged to perform, an audit of their internal control over financial reporting. Our audits included consideration of internal control over financial reporting as a basis for designing audit procedures that are appropriate in the circumstances, but not for the purpose of expressing an opinion on the effectiveness of the Funds’ internal control over financial reporting. Accordingly, we express no such opinion. An audit also includes examining, on a test basis, evidence supporting the amounts and disclosures in the financial statements, assessing the accounting principles used and significant estimates made by management, as well as evaluating the overall financial statement presentation. Our procedures included confirmation of securities owned as of April 30, 2017, by correspondence with the custodian and brokers; when replies were not received from brokers, we performed other auditing procedures. We believe that our audits provide a reasonable basis for our opinion.
In our opinion, the financial statements and financial highlights referred to above present fairly, in all material respects, the financial position of Vulcan Value Partners Fund and Vulcan Value Partners Small Cap Fund of Financial Investors Trust as of April 30, 2017, the results of their operations for the year then ended, the changes in their net assets for each of the two years in the period then ended, and the financial highlights for each of the five years in the period then ended, in conformity with accounting principles generally accepted in the United States of America.
DELOITTE & TOUCHE LLP
Denver, Colorado
June 27, 2017
| 34 | www.vulcanvaluepartners.com |
Disclosure Regarding Approval of Fund Advisory Agreements
April 30, 2017 (Unaudited)
Vulcan Value Partners Fund
Vulcan Value Partners Small Cap Fund
On December 13, 2016, the Trustees met in person to discuss, among other things, the approval of the investment advisory agreement between the Trust and the Adviser (the “Investment Advisory Agreement”), in accordance with Section 15(c) of the 1940 Act. In renewing and approving the Investment Advisory Agreement, the Trustees, including the Independent Trustees, considered the following factors with respect to the Funds:
Investment Advisory Fee Rate: The Trustees reviewed and considered the contractual annual advisory fee paid by the Trust, on behalf of the Funds, to the Adviser of 1.00% of the Vulcan Value Partners Fund’s daily average net assets and 1.15% of the Vulcan Value Partners Small Cap Fund’s daily average net assets, in light of the extent and quality of the advisory services provided by the Adviser to the Funds.
The Board received and considered information including a comparison of each of the Fund’s contractual and actual advisory fees and overall expenses with those of funds in the peer groups and universes of funds provided by an independent provider of investment company data (the “Data Provider”). The Trustees noted that the contractual advisory fee rates for both Funds were above the respective Data Provider peer group median contractual advisory fee rates.
Total Expense Ratios: Based on such information, the Trustees further reviewed and considered the total expense ratios (after waivers) of 1.08% for the Vulcan Value Partners Fund and 1.25% for the Vulcan Value Partners Small Cap Fund. The Trustees noted that each of the Fund’s total expense ratios (after waivers) were above the Data Provider peer group median total expense ratios (after waivers).
Nature, Extent, and Quality of the Services under the Investment Advisory Agreement: The Trustees received and considered information regarding the nature, extent, and quality of services to be provided to the Funds under the Investment Advisory Agreement. The Trustees reviewed certain background materials supplied by the Adviser in its presentation, including its Form ADV.
The Trustees reviewed and considered the Adviser’s investment advisory personnel, its history as an asset manager, and its performance and the amount of assets currently under management by the Adviser and its affiliated entities. The Trustees also reviewed the research and decision-making processes utilized by the Adviser, including the methods adopted to seek to achieve compliance with the investment objectives, policies, and restrictions of the Funds.
The Trustees considered the background and experience of the Adviser’s management in connection with the Funds, including reviewing the qualifications, backgrounds, and responsibilities of the management team primarily responsible for the day-to-day portfolio management of the Funds and the extent of the resources devoted to research and analysis of actual and potential investments.
The Trustees also reviewed, among other things, the Adviser’s insider trading policies and procedures and its Code of Ethics.
| Annual Report | April 30, 2017 | 35 |
Disclosure Regarding Approval of Fund Advisory Agreements
April 30, 2017 (Unaudited)
Performance: The Trustees reviewed performance information for each of the Funds for the 3-month, 1-year, 3-year, and 5-year periods ended September 30, 2016. That review included a comparison of each Fund’s performance to the performance of a group of comparable funds selected by the Data Provider. The Trustees noted that the performance of each Fund was above its respective Data Provider peer group median performance for the 3-month and 5-year periods ended September 30, 2016. The Trustees also considered the Adviser’s discussion of each Fund’s underlying portfolio diversification categories, its top contributors and top detractors, as well as the Adviser’s performance and reputation generally and its investment techniques, risk management controls, and decision-making processes.
Comparable Accounts: The Trustees noted certain information provided by the Adviser regarding fees charged to its other clients utilizing a strategy similar to that employed by the Funds.
Profitability: The Trustees received and considered a retrospective and projected profitability analysis prepared by the Adviser based on the fees payable under the Investment Advisory Agreement with respect to each Fund. The Trustees considered the profits, if any, anticipated to be realized by the Adviser in connection with the operation of each Fund. The Board then reviewed the Adviser’s audited financial statements for the years ended December 31, 2015 and 2014 in order to analyze the financial condition and stability and profitability of the Adviser.
Economies of Scale: The Trustees considered whether economies of scale in the provision of services to the Funds will be passed along to the shareholders under the proposed agreements.
Other Benefits to the Adviser: The Trustees reviewed and considered any other incidental benefits derived or to be derived by the Adviser from its relationship with the Funds, including whether soft dollar arrangements were used.
In renewing the Adviser as the Funds’ investment adviser and renewing the Investment Advisory Agreement and the fees charged under the Investment Advisory Agreement, the Trustees concluded that no single factor reviewed by the Trustees was identified by the Trustees to be determinative as the principal factor in whether to renew the Investment Advisory Agreement. Further, the Independent Trustees were advised by separate independent legal counsel throughout the process. The Trustees, including all of the Independent Trustees, concluded that:
| • | each Fund’s contractual advisory fee rate was above its Data Provider peer group median contractual advisory fee rate; |
| • | each Fund’s total expense ratio (after waivers) was above, but within an acceptable range of, its Data Provider peer group median total expense ratio (after waivers); |
| • | the nature, extent and quality of services rendered by the Adviser under the Investment Advisory Agreement with respect to the Funds were adequate; |
| • | the performance of each Fund was above its Data Provider median peer group performance for the 3-month and 5-year periods ended September 30, 2016; |
| • | bearing in mind the limitations of comparing different types of managed accounts and the different levels of service typically associated with such accounts, the fee structures applicable to the Adviser’s other clients employing a comparable strategy to one or more of the Funds were not indicative of any unreasonableness with respect to the advisory fees proposed to be payable by the Funds; |
| 36 | www.vulcanvaluepartners.com |
Disclosure Regarding Approval of Fund Advisory Agreements
April 30, 2017 (Unaudited)
| • | the profit, if any, realized by the Adviser in connection with the operation of each Fund is not unreasonable to such Fund; and |
| • | there were no material economies of scale or other incidental benefits accruing to the Adviser in connection with its relationship with the Funds. |
Based on the Trustees’ deliberations and their evaluation of the information described above, the Trustees, including all of the Independent Trustees, concluded that the Adviser’s compensation for investment advisory services is consistent with the best interests of the Funds and their shareholders.
| Annual Report | April 30, 2017 | 37 |
Additional Information
April 30, 2017 (Unaudited)
1. FUND HOLDINGS
The Funds files their complete schedule of portfolio holdings with the Securities and Exchange Commission (the “SEC”) for the first and third quarters of each fiscal year on Form N-Q within 60 days after the end of the period. Copies of the Funds’ Form N-Q are available without charge on the SEC website at http://www.sec.gov. You may also review and copy the Form N-Q at the SEC’s Public Reference Room in Washington, DC. For more information about the operation of the Public Reference Room, please call the SEC at 1-800-SEC-0330.
2. FUND PROXY VOTING POLICIES, PROCEDURES AND SUMMARIES
The Funds’ policies and procedures used in determining how to vote proxies and information regarding how the Fund voted proxies relating to portfolio securities during the most recent prior 12-month period ending June 30 are available without charge, (1) upon request, by calling (toll-free) (866)-759-5679 and (2) on the SEC’s website at http://www.sec.gov.
3. TAX DESIGNATIONS
The Funds designate the following for federal income tax purposes for the calendar year ended December 31, 2016:
| | Qualified Dividend Income | Dividend Received Deduction |
| Vulcan Value Partners Fund | 100.00% | 100.00% |
| Vulcan Value Partners Small Cap Fund | 100.00% | 100.00% |
In early 2017, if applicable, shareholders of record received this information for the distributions paid to them by the Fund during the calendar year 2016 via Form 1099. The Fund will notify shareholders in early 2018 of amounts paid to them by the Fund, if any, during the calendar year 2017.
| 38 | www.vulcanvaluepartners.com |
Trustees and Officers
April 30, 2017 (Unaudited)
Additional information regarding the Fund’s trustees is included in the Statement of Additional Information, which can be obtained without charge by calling 877-421-5078.
INDEPENDENT TRUSTEES
Name, Address* & Year of Birth | Position(s) Held with Fund | Term of Office** and Length of Time Served | Principal Occupation(s) During Past 5 Years*** | Number of Funds in Fund Complex Overseen by Trustee**** | Other Directorships Held by Trustee During Past 5 Years*** |
Mary K. Anstine, 1940 | Trustee and Chairman | Ms. Anstine was elected at a special meeting of shareholders held on March 21, 1997 and re- elected at a special meeting of shareholders held on August 7, 2009. Ms, Astine was appointed Chairman of the Board at the June 6, 2017 meeting of the Board of Trustees. | Ms. Anstine was formerly an Executive Vice President of First Interstate Bank of Denver until 1994, President/Chief Executive Officer of HealthONE Alliance, Denver, Colorado, from 1994 to 2004, and has been retired since 2004. Ms. Anstine is also Trustee/Director of AV Hunter Trust and Colorado Uplift Board. Ms. Anstine was formerly a Director of the Trust Bank of Colorado (later purchased and now known as Northern Trust Bank), HealthONE and Denver Area Council of the Boy Scouts of America, and a member of the American Bankers Association Trust Executive Committee. | 34 | Ms. Anstine is a Trustee of ALPS ETF Trust (20 funds); ALPS Variable Investment Trust (9 funds); Reaves Utility Income Fund (1 fund); and Westcore Trust (14 funds). |
Jeremy W. Deems, 1976 | Trustee | Mr. Deems was appointed as a Trustee at the March 11, 2008 meeting of the Board of Trustees and elected at a special meeting of shareholders held on August 7, 2009. | Mr. Deems is the Co-Founder, Chief Operations Officer and Chief Financial Officer of Green Alpha Advisors, LLC, a registered investment advisor, and Co- Portfolio Manager of the Shelton Green Alpha Fund. Prior to joining Green Alpha Advisors, Mr. Deems was CFO and Treasurer of Forward Management, LLC, ReFlow Management Co., LLC, ReFlow Fund, LLC, a private investment fund, and Sutton Place Management, LLC, an administrative services company, from 1998 to June 2007. From 2004 to 2005, Mr. Deems also served as Treasurer of the Forward Funds and the Sierra Club Funds. | 34 | Mr. Deems is a Trustee of ALPS ETF Trust (21 funds); ALPS Variable Investment Trust (10 funds); Clough Funds Trust (1 fund); Elevation ETF Trust (1 fund); and Reaves Utility Income Fund (1 fund). |
| Annual Report | April 30, 2017 | 39 |
Trustees and Officers
April 30, 2017 (Unaudited)
INDEPENDENT TRUSTEES (continued)
Name, Address* & Year of Birth | Position(s) Held with Fund | Term of Office** and Length of Time Served | Principal Occupation(s) During Past 5 Years*** | Number of Funds in Fund Complex Overseen by Trustee**** | Other Directorships Held by Trustee During Past 5 Years*** |
Jerry G. Rutledge, 1944 | Trustee | Mr. Rutledge was elected at a special meeting of shareholders held on August 7, 2009. | Mr. Rutledge is the President and owner of Rutledge’s Inc., a retail clothing business. Mr. Rutledge is currently Director of the American National Bank. He was from 1994 to 2007 a Regent of the University of Colorado. | 34 | Mr. Rutledge is a Trustee of Principal Real Estate Income Fund (1 fund) Clough Global Dividend and Income Fund (1 fund), Clough Global Equity Fund (1 fund) and Clough Global Opportunities Fund (1 fund). |
Michael “Ross” Shell, 1970 | Trustee | Mr. Shell was elected at a special meeting of shareholders held on August 7, 2009. | Mr. Shell is Founder and CEO of Red Idea, LLC, a strategic consulting/early stage venture firm (since June 2008). From 1999 to 2009, he was a part-owner and Director of Tesser, Inc., a brand agency. From December 2005 to May 2008, he was Director, Marketing and Investor Relations, of Woodbourne, a REIT/real estate hedge fund and private equity firm. Prior to this, from May 2004 to November 2005, he worked as a business strategy consultant; from June 2003 to April 2004, he was on the Global Client Services team of IDEO, a product design/innovation firm; and from 1999 to 2003, he was President of Tesser, Inc. Mr. Shell graduated with honors from Stanford University with a degree in Political Science. | 34 | None. |
| 40 | www.vulcanvaluepartners.com |
Trustees and Officers
April 30, 2017 (Unaudited)
INTERESTED TRUSTEE
Name, Address* & Year of Birth | Position(s) Held with Fund | Term of Office** and Length of Time Served | Principal Occupation(s) During Past 5 Years*** | Number of Funds in Fund Complex Overseen by Trustee**** | Other Directorships Held by Trustee During Past 5 Years*** |
Edmund J. Burke, 1961 | Trustee and President | Mr. Burke was elected as Trustee at a special meeting of shareholders held on August 7, 2009. Mr. Burke was elected President of the Trust at the December 17, 2002 meeting of the Board of Trustees. | Mr. Burke is President and a Director of ALPS Holdings, Inc. (“AHI”) (since 2005) and Director of Boston Financial Data Services, Inc. (“BFDS”), ALPS Advisors, Inc. (“AAI”), ALPS Distributors, Inc. (“ADI”), ALPS Fund Services, Inc. (“AFS”) and ALPS Portfolio Solutions Distributor, Inc. (“APSD”) and from 2001-2008, was President of AAI, ADI, AFS and APSD. Because of his positions with AHI, BFDS, AAI, ADI, AFS and APSD, Mr. Burke is deemed an affiliate of the Trust as defined under the 1940 Act. | 34 | Mr. Burke is a Trustee of Clough Global Dividend and Income Fund (1 fund); Clough Global Equity Fund (1 fund); Clough Global Opportunities Fund (1 fund); Clough Funds Trust (1 fund); Liberty All-Star Equity Fund (1 fund); and Director of the Liberty All-Star Growth Fund, Inc. (1 fund). |
| Annual Report | April 30, 2017 | 41 |
Trustees and Officers
April 30, 2017 (Unaudited)
OFFICERS
Name,
Address*
& Year
of Birth | Position(s)
Held with
Fund | Term of Office**
and Length of
Time Served | Principal Occupation(s) During Past 5 Years*** |
Kimberly R. Storms,
1972 | Treasurer | Ms. Storms was elected Treasurer of the Trust at the March 12, 2013 meeting of the Board of Trustees. | Ms. Storms is Senior Vice President ‐ Director of Fund Administration of ALPS. Because of her position with ALPS, Ms. Storms is deemed an affiliate of the Trust as defined under the 1940 Act. Ms. Storms is also Treasurer of Liberty All‐Star Equity Fund, Liberty All‐Star Growth Fund, Inc., ALPS Series Trust and Elevation ETF Trust. Ms. Storms also serves as a Board member and Treasurer of The Center for Trauma & Resilience, a nonprofit agency. |
Karen S. Gilomen,
1970 | Secretary | Ms. Gilomen was elected Secretary of the Trust at the December 13, 2016 meeting of the Board of Trustees. | Ms. Gilomen joined ALPS in August 2016 as Vice President and Senior Counsel. Prior to joining ALPS, Ms. Gilomen was Vice President ‐ General Counsel & CCO of Monticello Associates, Inc. from 2010 to 2016. Because of her position with ALPS, Ms. Gilomen is deemed an affiliate of the Trust, as defined under the 1940 Act. Ms. Gilomen is also the Secretary of Oak Associates Funds and Reaves Utility Income Fund, and the Assistant Secretary of the WesMark Funds. |
Ted Uhl,
1974 | Chief Compliance Officer (“CCO”) | Mr. Uhl was appointed CCO of the Trust at the June 8, 2010 meeting of the Board of Trustees. | Mr. Uhl joined ALPS in October 2006, and is currently Deputy Compliance Officer of ALPS. Prior to his current role, Mr. Uhl served as Senior Risk Manager for ALPS from October 2006 until June 2010. Before joining ALPS, Mr. Uhl served a Sr. Analyst with Enenbach and Associates (RIA), and a Sr. Financial Analyst at Sprint. Because of his position with ALPS, Mr. Uhl is deemed an affiliate of the Trust as defined under the 1940 Act. Mr. Uhl is also CCO of the Boulder Growth & Income Fund, Inc., Centre Funds, Elevation ETF Trust, Index Funds, Reality Shares ETF Trust and Reaves Utility Income Fund. |
Jennell Panella,
1974 | Assistant Treasurer | Ms. Panella was elected Assistant Treasurer of the Trust at the September 15, 2015 meeting of the Board of Trustees. | Ms. Panella joined ALPS in June 2012 and is currently Fund Controller of ALPS Fund Services, Inc. Prior to joining ALPS, Ms. Panella served as Financial Reporting Manager for Parker Global Strategies, LLC (2009‐2012). Because of her position with ALPS, Ms. Panella is deemed an affiliate of the Trust as defined under the 1940 Act. Ms. Panella also serves as Assistant Treasurer of James Advantage Funds. |
| 42 | www.vulcanvaluepartners.com |
Trustees and Officers
April 30, 2017 (Unaudited)
OFFICERS (continued)
Name,
Address*
& Year
of Birth | Position(s)
Held with
Fund | Term of Office**
and Length of
Time Served | Principal Occupation(s) During Past 5 Years*** |
Alan Gattis,
1980 | Assistant Treasurer | Mr. Gattis was elected Assistant Treasurer of the Trust at the September 13, 2016 meeting of the Board of Trustees. | Mr. Gattis joined ALPS in 2011 and is currently Vice President and Fund Controller of ALPS. Prior to joining ALPS, Mr. Gattis was an Auditor at Spicer Jeffries LLP (2009 through 2011) and an Auditor at PricewaterhouseCoopers LLP (2004 ‐ 2009). Because of his position with ALPS, Mr. Gattis is deemed an affiliate of the Trust as defined under the 1940 Act. Mr. Gattis is also Assistant Treasurer of ALPS Series Trust, Clough Funds Trust, Clough Global Opportunities Fund, Clough Global Dividend and Income Fund, Clough Global Equity, and Griffin Institutional Access Real Estate Fund. |
Sharon Akselrod,
1974 | Assistant Secretary | Ms. Akselrod was elected Assistant Secretary of the Trust at the September 15, 2015 meeting of the Board of Trustees. | Ms. Akselrod joined ALPS in August 2014 and is currently Senior Investment Company Act Paralegal of ALPS Fund Services, Inc. Prior to joining ALPS, Ms. Akselrod served as Corporate Governance and Regulatory Associate for Nordstrom fsb (2013‐2014) and Senior Legal Assistant – Legal Manager for AXA Equitable Life Insurance Company (2008‐2013). Because of her position with ALPS, Ms. Akselrod is deemed an affiliate of the Trust as defined under the 1940 Act. Ms. Akselrod is also Assistant Secretary of ALPS ETF Trust. |
Jennifer Craig,
1973 | Assistant Secretary | Ms. Craig was elected Assistant Secretary of the Trust at the June 8, 2016 meeting of the Board of Trustees. | Ms. Craig joined ALPS in 2007 and is currently Assistant Vice President and Paralegal Manager of ALPS. Prior to joining ALPS, Ms. Craig was Legal Manager at Janus Capital Management LLC and served as Assistant Secretary of Janus Investment Fund, Janus Adviser Series and Janus Aspen Series. Because of her position with ALPS, Ms. Craig is deemed an affiliate of the Trust as defined under the 1940 Act. Ms. Craig is also Assistant Secretary of Clough Global Dividend and Income Fund, Clough Global Equity Fund, Clough Global Opportunities Fund, Clough Funds Trust and ALPS Series Trust. |
| * | All communications to Trustees and Officers may be directed to Financial Investors Trust c/o 1290 Broadway, Suite 1100, Denver, CO 80203. |
| ** | This is the period for which the Trustee or Officer began serving the Trust. Each Trustee serves an indefinite term, until his successor is elected. Officers are elected on an annual basis. |
| *** | The Fund Complex includes all series of the Trust (currently 34) and any other investment companies for which any Trustee serves as trustee for and which Vulcan Value Partners, LLC provides investment advisory services (currently none). |
| Annual Report | April 30, 2017 | 43 |
Privacy Policy
April 30, 2017 (Unaudited)
| FACTS | WHAT DO THE FUNDS DO WITH YOUR PERSONAL INFORMATION? |
| WHY? | Financial companies choose how they share your personal information. Federal law gives consumers the right to limit some but not all sharing. Federal law also requires us to tell you how we collect, share, and protect your personal information. Please read this notice carefully to understand what we do. |
| WHAT? | The types of personal information we collect and share depend on the product or service you have with us. This information can include: • Social Security number and account transactions • Account balances and transaction history • Wire transfer instructions |
| HOW? | All financial companies need to share customers’ personal information to run their everyday business. In the section below, we list the reasons financial companies can share their customers’ personal information; the reasons the Funds choose to share; and whether you can limit this sharing. |
| REASONS WE CAN SHARE YOUR PERSONAL INFORMATION | DO THE FUNDS SHARE: | CAN YOU LIMIT THIS SHARING? |
For our everyday business purposes –
such as to process your transactions, maintain your
account(s), respond to court orders and legal investigations,
or report to credit bureaus | Yes | No |
For our marketing purposes –
to offer our products and services to you | No | We do not share. |
| For joint marketing with other financial companies | No | We do not share. |
For our affiliates’ everyday business purposes –
information about your transactions and experiences | Yes | No |
For our affiliates’ everyday business purposes –
information about your creditworthiness | No | We do not share. |
| For non-affiliates to market to you | No | We do not share. |
| 44 | www.vulcanvaluepartners.com |
Privacy Policy
April 30, 2017 (Unaudited)
| WHO WE ARE | |
| Who is providing this notice? | Vulcan Value Partners Fund and Vulcan Value Partners Small Cap Fund. |
| WHAT WE DO | |
How do the Funds protect my
personal information? | To protect your personal information from unauthorized access and use, we use security measures that comply with federal law. These measures include computer safeguards and secured files and buildings. |
How do the Funds collect
my personal information? | We collect your personal information, for example, when you
• open an account
• provide account information or give us your contact information
• make a wire transfer or deposit money |
| Why can’t I limit all sharing? | Federal law gives you the right to limit only
• sharing for affiliates’ everyday business purposes-information about your creditworthiness
• affiliates from using your information to market to you
• sharing for non-affiliates to market to you
State laws and individual companies may give you additional rights to limit sharing. |
| Annual Report | April 30, 2017 | 45 |
Privacy Policy
April 30, 2017 (Unaudited)
| DEFINITIONS | |
| Affiliates | Companies related by common ownership or control. They can be financial and nonfinancial companies. |
| Non-affiliates | Companies not related by common ownership or control. They can be financial and nonfinancial companies. • The Funds do not share with non-affiliates so they can market to you. |
| Joint marketing | A formal agreement between non-affiliated financial companies that together market financial products or services to you. • The Funds do not jointly market. |
| OTHER IMPORTANT INFORMATION |
| California Residents | If your account has a California home address, your personal information will not be disclosed to nonaffiliated third parties except as permitted by applicable California law, and we will limit sharing such personal information with our affiliates to comply with California privacy laws that apply to us. |
| Vermont Residents | The State of Vermont requires financial institutions to obtain your consent prior to sharing personal information that they collect about you with affiliated companies and nonaffiliated third parties other than in certain limited circumstances. Except as permitted by law, we will not share personal information we collect about you with nonaffiliated third parties or other affiliated companies unless you provide us with your written consent to share such information. |
| 46 | www.vulcanvaluepartners.com |
This page left intentionally blank.

Item 2. Code of Ethics.
| (a) | The Registrant, as of the end of the period covered by this report, has adopted a code of ethics that applies to the Registrant’s principal executive officer, principal financial officer, principal accounting officer or controller or any persons performing similar functions on behalf of the Registrant. |
| (c) | During the period covered by this report, no amendments to the provisions of the code of ethics described in Item 2(a) above were made. |
| (d) | During the period covered by this report, no implicit or explicit waivers to the provisions of the code of ethics described in Item 2(a) above were granted. |
| (f) | The Registrant’s Code of Ethics is attached as an Exhibit to this report. |
Item 3. Audit Committee Financial Expert.
The Board of Trustees of the Registrant has determined that the Registrant has at least one Audit Committee Financial Expert serving on its audit committee. The Board of Trustees of the Registrant has designated Jeremy W. Deems as the Registrant’s “Audit Committee Financial Expert.” Mr. Deems is “independent” as defined in paragraph (a)(2) of Item 3 to Form N-CSR.
Item 4. Principal Accountant Fees and Services.
| (a) | Audit Fees: For the Registrant’s fiscal years ended April 30, 2017 and April 30, 2016, the aggregate fees billed for professional services rendered by the principal accountant for the audit of the Registrant’s annual financial statements or services that are normally provided by the accountant in connection with statutory and regulatory filings or engagements for those fiscal years were $345,460 and $316,200, respectively. |
| (b) | Audit-Related Fees: For the Registrant’s fiscal years ended April 30, 2017 and April 30, 2016, the aggregate fees billed for assurance and related services by the principal accountant that were reasonably related to the performance of the audit of the Registrant’s financial statements and are not reported under paragraph (a) of this Item were $0 and $0, respectively. |
| (c) | Tax Fees: For the Registrant’s fiscal years ended April 30, 2017 and April 30, 2016, the aggregate fees billed for professional services rendered by the principal accountant for tax compliance, tax advice and tax planning were $61,965 and $50,850, respectively. The fiscal year 2017 and 2016 tax fees were for services for dividend calculation, excise tax preparation and tax return preparation. |
| (d) | All Other Fees: For the Registrant’s fiscal years ended April 30, 2017 and April 30, 2016, no fees were billed to Registrant by the principal accountant for products and services, other than the services reported in paragraphs (a) through (c) of this Item. |
| (e)(1) | Audit Committee Pre-Approval Policies and Procedures: All services to be performed by the Registrant’s principal accountant must be pre-approved by the Registrant’s Audit Committee. The Chairman of the Audit Committee may pre-approve non-audit services to be performed by the Registrant’s principal accountant on an interim basis, subject to ratification by the Audit Committee at its next regularly scheduled meeting. |
| (e)(2) | No services described in paragraphs (b) through (d) of this Item were approved by the Registrant’s Audit Committee pursuant to paragraph (c)(7)(i)(C) of Rule 2-01 of Regulation S-X. |
| (g) | The aggregate non-audit fees billed by the Registrant’s accountant to the Registrant, and rendered to the Registrant’s investment adviser (not including any sub-adviser whose role is primarily portfolio management and is subcontracted with or overseen by another investment adviser), and any entity controlling, controlled by, or under common control with the adviser that provides ongoing services to the Registrant, were $92,085 in fiscal year ended April 30, 2017 and $85,069 in fiscal year ended April 30, 2016. These fees consisted of non-audit fees billed to (i) the Registrant of $61,965 in fiscal year ended April 30, 2017 and $50,850 in fiscal year ended April 30, 2016 as described in response to paragraph (c) above and (ii) to ALPS Fund Services, Inc. (“AFS”), an entity under common control with ALPS Advisors, Inc., the Registrant’s investment adviser, of $30,390 in fiscal year ended April 30, 2017 and $34,219 in fiscal year ended April 30, 2016. The non-audit fees billed to AFS related to SSAE 16 services and other compliance-related matters. |
| (h) | The Registrant’s audit committee has considered whether the provision of non-audit services that were rendered to the Registrant’s investment adviser (not including any sub-adviser whose role is primarily portfolio management and is subcontracted with or overseen by another investment adviser), and any entity controlling, controlled by, or under common control with the investment adviser that provides ongoing services to the Registrant that were not pre-approved pursuant to paragraph (c)(7)(ii) of Rule 2-01 of Regulation S-X, is compatible with maintaining the principal accountant’s independence. The Registrant’s audit committee determined that the provision of such non-audit services is compatible with maintaining the principal accountant’s independence. |
Item 5. Audit Committee of Listed Registrants.
Not applicable to the Registrant.
Item 6. Investments.
| (a) | Schedule of Investments is included as part of the Reports to Stockholders filed under Item 1 of this Form N-CSR. |
Item 7. Disclosure of Proxy Voting Policies and Procedures for Closed-End Management Investment Companies.
Not applicable to the Registrant.
Item 8. Portfolio Managers of Closed-End Management Investment Companies.
Not applicable to the Registrant.
Item 9. Purchases of Equity Securities by Closed-End Management Investment Company and Affiliated Purchasers.
Not applicable to the Registrant.
Item 10. Submission of Matters to a Vote of Security Holders.
There have been no material changes to the procedures by which shareholders may recommend nominees to the Registrant’s Board of Trustees, where those changes were implemented after the Registrant last provided disclosure in response to the requirements of Item 407(c)(2)(iv) of Regulation S-K, or this Item.
Item 11. Controls and Procedures.
| (a) | The Registrant’s principal executive officer and principal financial officer have concluded that the Registrant’s disclosure controls and procedures (as defined in Rule 30a-3(c) under the Investment Company Act of 1940, as amended) are effective based on their evaluation of these controls and procedures as of a date within 90 days of the filing date of this report. |
| (b) | There was no change in the Registrant’s internal control over financial reporting (as defined in Rule 30a-3(d) under the Investment Company Act of 1940, as amended) during the second fiscal quarter of the period covered by this report that has materially affected, or is reasonably likely to materially affect, the Registrant’s internal control over financial reporting. |
Item 12. Exhibits.
| (a)(1) | Registrant’s Code of Ethics for Principal Executive and Senior Financial Officers, which is the subject of the disclosure required by Item 2 of Form N-CSR, is incorporated by reference to Exhibit 12(a)(1) to the Registrant’s Certified Shareholder Report on Form N-CSR, File No. 811-8194, filed on July 11, 2016. |
| (a)(2) | The certifications required by Rule 30a-2(a) of the Investment Company Act of 1940, as amended, and Section 302 of the Sarbanes-Oxley Act of 2002 are attached hereto as Exhibit 99.Cert. |
| (b) | The certifications by the Registrant’s principal executive officer and principal financial officer, as required by Rule 30a-2(b) of the Investment Company Act of 1940, as amended, and Section 906 of the Sarbanes-Oxley Act of 2002 are attached hereto as Exhibit 99.906Cert. |
SIGNATURES
Pursuant to the requirements of the Securities Exchange Act of 1934 and the Investment Company Act of 1940, the Registrant has duly caused this report to be signed on its behalf by the undersigned, thereunto duly authorized.
FINANCIAL INVESTORS TRUST
| By: | /s/ Edmund J. Burke | |
| | Edmund J. Burke (Principal Executive Officer) | |
| | President | |
| | | |
| Date: | July 10, 2017 | |
Pursuant to the requirements of the Securities Exchange Act of 1934 and the Investment Company Act of 1940, this report has been signed below by the following persons on behalf of the Registrant and in the capacities and on the dates indicated.
FINANCIAL INVESTORS TRUST
| By: | /s/ Edmund J. Burke | |
| | Edmund J. Burke (Principal Executive Officer) | |
| | President | |
| | | |
| Date: | July 10, 2017 | |
| By: | /s/ Kimberly R. Storms | |
| | Kimberly R. Storms (Principal Financial Officer) | |
| | Treasurer | |
| | | |
| Date: | July 10, 2017 | |