TABLE OF
CONTENTS
| Disclosure of Fund Expenses | 1 |
| ALPS | Alerian MLP Infrastructure Index Fund | |
| Management Commentary | 6 |
| Performance Update | 7 |
| Statement of Investments | 9 |
| Statement of Assets and Liabilities | 10 |
| Statement of Operations | 11 |
| Statements of Changes in Net Assets | 12 |
| Financial Highlights | 13 |
ALPS | CoreCommodity Management CompleteCommodities® Strategy Fund | |
| Management Commentary | 19 |
| Performance Update | 21 |
| Consolidated Statement of Investments | 23 |
| Consolidated Statement of Assets and Liabilities | 30 |
| Consolidated Statement of Operations | 31 |
| Consolidated Statements of Changes in Net Assets | 32 |
| Consolidated Financial Highlights | 33 |
| ALPS | Kotak India Growth Fund | |
| Management Commentary | 36 |
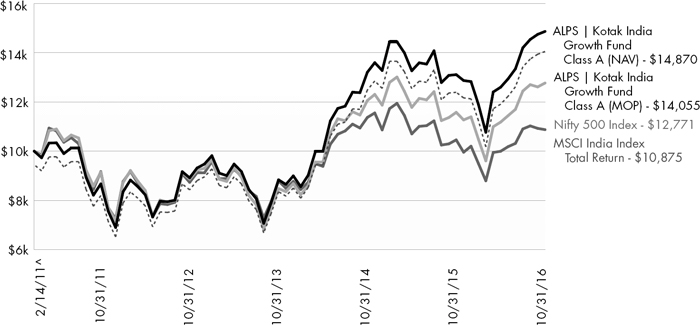
| Performance Update | 39 |
| Consolidated Statement of Investments | 41 |
| Consolidated Statement of Assets and Liabilities | 43 |
| Consolidated Statement of Operations | 44 |
| Consolidated Statements of Changes in Net Assets | 45 |
| Consolidated Financial Highlights | 46 |
| ALPS | Metis Global Micro Cap Fund | |
| Management Commentary | 49 |
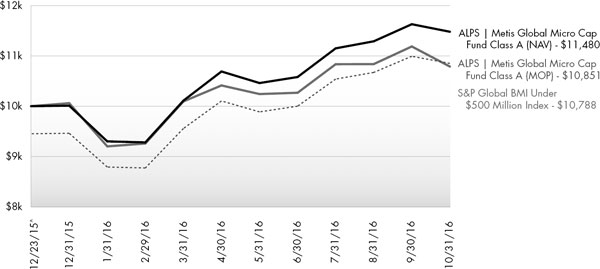
| Performance Update | 51 |
| Statement of Investments | 53 |
| Statement of Assets and Liabilities | 57 |
| Statement of Operations | 58 |
| Statement of Changes in Net Assets | 59 |
| Financial Highlights | 60 |
| ALPS | Red Rocks Listed Private Equity Fund | |
| Management Commentary | 63 |
| Performance Update | 65 |
| Statement of Investments | 68 |
| Statement of Assets and Liabilities | 70 |
| Statement of Operations | 71 |
| Statements of Changes in Net Assets | 72 |
| Financial Highlights | 73 |
| ALPS | Sterling ETF Tactical Rotation Fund | |
| Management Commentary | 77 |
| Performance Update | 78 |
| Statement of Investments | 80 |
| Statement of Assets and Liabilities | 81 |
| Statement of Operations | 82 |
| Statements of Changes in Net Assets | 83 |
| Financial Highlights | 84 |
| ALPS | WMC Research Value Fund | |
| Management Commentary | 87 |
| Performance Update | 89 |
| Statement of Investments | 91 |
| Statement of Assets and Liabilities | 95 |
| Statement of Operations | 96 |
| Statements of Changes in Net Assets | 97 |
| Financial Highlights | 98 |
| Clough China Fund | |
| Management Commentary | 101 |
| Performance Update | 104 |
| Statement of Investments | 106 |
| Statement of Assets and Liabilities | 109 |
| Statement of Operations | 110 |
| Statements of Changes in Net Assets | 111 |
| Financial Highlights | 112 |
| RiverFront Global Allocation Series | |
| Management Commentary | 115 |
| Performance Update | 118 |
| Statements of Investments | 128 |
| Statements of Assets and Liabilities | 138 |
| Statements of Operations | 140 |
| Statements of Changes in Net Assets | 141 |
| Financial Highlights | 146 |
| Notes to Financial Statements | 163 |
| Report of Independent Registered Public Accounting Firm | 197 |
| Additional Information | 198 |
| Trustees and Officers | 214 |
alpsfunds.com
Disclosure of Fund Expenses
October 31, 2016 (Unaudited)
Examples. As a shareholder of the Funds, you incur two types of costs: (1) transaction costs, including applicable sales charges (loads) and redemption fees; and (2) ongoing costs, including management fees, distribution and service (12b‐1) fees, shareholder service fees and other Fund expenses. The following examples are intended to help you understand your ongoing costs (in dollars) of investing in the Funds and to compare these costs with the ongoing costs of investing in other mutual funds. The examples are based on an investment of $1,000 invested on May 1, 2016 and held until October 31, 2016.
Actual Expenses. The first line under each class in the table below provides information about actual account values and actual expenses. You may use the information in this line, together with the amount you invested, to estimate the expenses that you paid over the period. Simply divide your account value by $1,000 (for example, an $8,600 account value divided by $1,000 = 8.6), then multiply the result by the number in the first line under the heading “Expenses Paid During Period May 1, 2016 – October 31, 2016” to estimate the expenses you paid on your account during this period.
Hypothetical Example for Comparison Purposes. The second line under each class in the table below provides information about hypothetical account values and hypothetical expenses based on the Fund’s actual expense ratio and an assumed rate of return of 5% per year before expenses, which is not the Fund’s actual return. The hypothetical account values and expenses may not be used to estimate the actual ending account balance or expenses you paid for the period. You may use this information to compare the ongoing costs of investing in the Funds and other mutual funds. To do so, compare these 5% hypothetical examples with the 5% hypothetical examples that appear in the shareholder reports of the other funds.
Please note that the expenses shown in the table are meant to highlight your ongoing costs only and do not reflect any transactional costs, such as sales charges or redemption fees. Therefore, the second line under each class in the table below is useful in comparing ongoing costs only, and will not help you determine the relative total costs of owning different funds. In addition, if these transactional costs were included, your costs would have been higher.
1 | October 31, 2016
Disclosure of Fund Expenses
October 31, 2016 (Unaudited)
| | Beginning Account Value May 1, 2016 | Ending Account Value October 31, 2016 | Expense Ratio(a) | Expenses Paid During Period May 1, 2016 - October 31, 2016(b) |
| ALPS | Alerian MLP Infrastructure Index Fund | | | | |
| Class A | | | | |
| Actual | $1,000.00 | $1,043.20 | 1.25% | $6.42 |
| Hypothetical (5% return before expenses) | $1,000.00 | $1,018.85 | 1.25% | $6.34 |
| Class C | | | | |
| Actual | $1,000.00 | $1,040.70 | 1.85% | $9.49 |
| Hypothetical (5% return before expenses) | $1,000.00 | $1,015.84 | 1.85% | $9.37 |
| Class I | | | | |
| Actual | $1,000.00 | $1,044.20 | 0.85% | $4.37 |
| Hypothetical (5% return before expenses) | $1,000.00 | $1,020.86 | 0.85% | $4.32 |
ALPS | CoreCommodity Management CompleteCommodities® Strategy Fund(c) | | | |
| Class A | | | | |
| Actual | $1,000.00 | $1,005.50 | 1.45% | $7.31 |
| Hypothetical (5% return before expenses) | $1,000.00 | $1,017.85 | 1.45% | $7.35 |
| Class C | | | | |
| Actual | $1,000.00 | $1,002.80 | 2.05% | $10.32 |
| Hypothetical (5% return before expenses) | $1,000.00 | $1,014.83 | 2.05% | $10.38 |
| Class I | | | | |
| Actual | $1,000.00 | $1,008.30 | 1.15% | $5.81 |
| Hypothetical (5% return before expenses) | $1,000.00 | $1,019.36 | 1.15% | $5.84 |
ALPS | Kotak India Growth Fund(d) | | | | |
| Class A | | | | |
| Actual | $1,000.00 | $1,180.10 | 1.69% | $9.26 |
| Hypothetical (5% return before expenses) | $1,000.00 | $1,016.64 | 1.69% | $8.57 |
| Class C | | | | |
| Actual | $1,000.00 | $1,175.60 | 2.50% | $13.67 |
| Hypothetical (5% return before expenses) | $1,000.00 | $1,012.57 | 2.50% | $12.65 |
| Class I | | | | |
| Actual | $1,000.00 | $1,181.20 | 1.50% | $8.22 |
| Hypothetical (5% return before expenses) | $1,000.00 | $1,017.60 | 1.50% | $7.61 |
| ALPS | Metis Global Micro Cap Fund | | | | |
| Class A | | | | |
| Actual | $1,000.00 | $1,073.90 | 2.10% | $10.95 |
| Hypothetical (5% return before expenses) | $1,000.00 | $1,014.58 | 2.10% | $10.63 |
| Class C | | | | |
| Actual | $1,000.00 | $1,068.40 | 2.70% | $14.04 |
| Hypothetical (5% return before expenses) | $1,000.00 | $1,011.56 | 2.70% | $13.65 |
| Class I | | | | |
| Actual | $1,000.00 | $1,074.80 | 1.70% | $8.87 |
| Hypothetical (5% return before expenses) | $1,000.00 | $1,016.59 | 1.70% | $8.62 |
2 | October 31, 2016
Disclosure of Fund Expenses
October 31, 2016 (Unaudited)
| | Beginning Account Value May 1, 2016 | Ending Account Value October 31, 2016 | Expense Ratio(a) | Expenses Paid During Period May 1, 2016 - October 31, 2016(b) |
| ALPS | Red Rocks Listed Private Equity Fund | | | | |
| Class A | | | | |
| Actual | $1,000.00 | $1,031.10 | 1.52% | $7.76 |
| Hypothetical (5% return before expenses) | $1,000.00 | $1,017.50 | 1.52% | $7.71 |
| Class C | | | | |
| Actual | $1,000.00 | $1,029.00 | 2.17% | $11.07 |
| Hypothetical (5% return before expenses) | $1,000.00 | $1,014.23 | 2.17% | $10.99 |
| Class I | | | | |
| Actual | $1,000.00 | $1,034.00 | 1.19% | $6.08 |
| Hypothetical (5% return before expenses) | $1,000.00 | $1,019.15 | 1.19% | $6.04 |
| Class R | | | | |
| Actual | $1,000.00 | $1,032.00 | 1.64% | $8.38 |
| Hypothetical (5% return before expenses) | $1,000.00 | $1,016.89 | 1.64% | $8.31 |
| ALPS | Sterling ETF Tactical Rotation Fund | | | | |
| Class A | | | | |
| Actual | $1,000.00 | $1,002.20 | 1.31% | $6.59 |
| Hypothetical (5% return before expenses) | $1,000.00 | $1,018.55 | 1.31% | $6.65 |
| Class C | | | | |
| Actual | $1,000.00 | $997.70 | 2.15% | $10.80 |
| Hypothetical (5% return before expenses) | $1,000.00 | $1,014.33 | 2.15% | $10.89 |
| Class I | | | | |
| Actual | $1,000.00 | $1,004.50 | 1.15% | $5.79 |
| Hypothetical (5% return before expenses) | $1,000.00 | $1,019.36 | 1.15% | $5.84 |
| ALPS | WMC Research Value Fund | | | | |
| Class A | | | | |
| Actual | $1,000.00 | $1,029.50 | 1.15% | $5.87 |
| Hypothetical (5% return before expenses) | $1,000.00 | $1,019.36 | 1.15% | $5.84 |
| Class C | | | | |
| Actual | $1,000.00 | $1,025.40 | 1.90% | $9.67 |
| Hypothetical (5% return before expenses) | $1,000.00 | $1,015.58 | 1.90% | $9.63 |
| Class I | | | | |
| Actual | $1,000.00 | $1,030.10 | 0.90% | $4.59 |
| Hypothetical (5% return before expenses) | $1,000.00 | $1,020.61 | 0.90% | $4.57 |
| Clough China Fund | | | | |
| Class A | | | | |
| Actual | $1,000.00 | $1,100.80 | 1.95% | $10.30 |
| Hypothetical (5% return before expenses) | $1,000.00 | $1,015.33 | 1.95% | $9.88 |
| Class C | | | | |
| Actual | $1,000.00 | $1,096.60 | 2.70% | $14.23 |
| Hypothetical (5% return before expenses) | $1,000.00 | $1,011.56 | 2.70% | $13.65 |
| Class I | | | | |
| Actual | $1,000.00 | $1,102.00 | 1.70% | $8.98 |
| Hypothetical (5% return before expenses) | $1,000.00 | $1,016.59 | 1.70% | $8.62 |
3 | October 31, 2016
Disclosure of Fund Expenses
October 31, 2016 (Unaudited)
| | Beginning Account Value May 1, 2016 | Ending Account Value October 31, 2016 | Expense Ratio(a) | Expenses Paid During Period May 1, 2016 - October 31, 2016(b) |
| RiverFront Conservative Income Builder Fund | | | | |
| Class A | | | | |
| Actual | $1,000.00 | $1,016.80 | 1.15% | $5.83 |
| Hypothetical (5% return before expenses) | $1,000.00 | $1,019.36 | 1.15% | $5.84 |
| Class C | | | | |
| Actual | $1,000.00 | $1,013.50 | 1.90% | $9.62 |
| Hypothetical (5% return before expenses) | $1,000.00 | $1,015.58 | 1.90% | $9.63 |
| Class I | | | | |
| Actual | $1,000.00 | $1,018.60 | 0.90% | $4.57 |
| Hypothetical (5% return before expenses) | $1,000.00 | $1,020.61 | 0.90% | $4.57 |
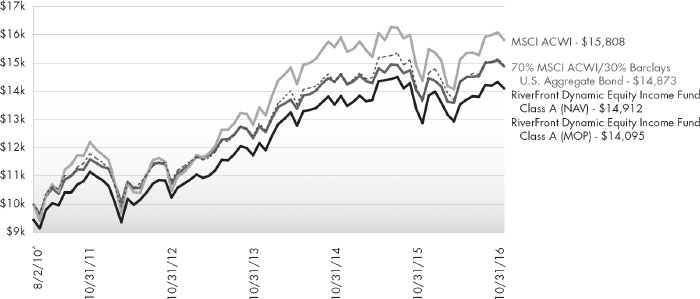
| RiverFront Dynamic Equity Income Fund | | | | |
| Class A | | | | |
| Actual | $1,000.00 | $1,029.00 | 1.15% | $5.87 |
| Hypothetical (5% return before expenses) | $1,000.00 | $1,019.36 | 1.15% | $5.84 |
| Class C | | | | |
| Actual | $1,000.00 | $1,025.10 | 1.90% | $9.67 |
| Hypothetical (5% return before expenses) | $1,000.00 | $1,015.58 | 1.90% | $9.63 |
| Class I | | | | |
| Actual | $1,000.00 | $1,029.70 | 0.90% | $4.59 |
| Hypothetical (5% return before expenses) | $1,000.00 | $1,020.61 | 0.90% | $4.57 |
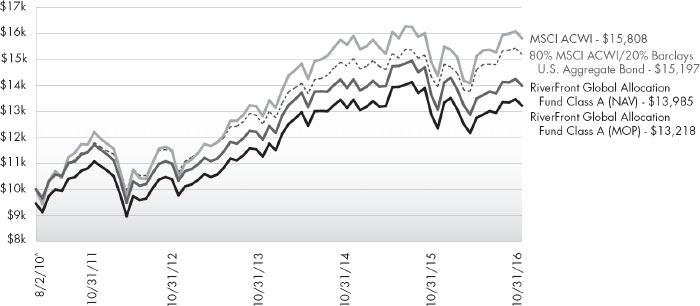
| RiverFront Global Allocation Fund | | | | |
| Class A | | | | |
| Actual | $1,000.00 | $1,027.60 | 1.15% | $5.86 |
| Hypothetical (5% return before expenses) | $1,000.00 | $1,019.36 | 1.15% | $5.84 |
| Class C | | | | |
| Actual | $1,000.00 | $1,022.90 | 1.90% | $9.66 |
| Hypothetical (5% return before expenses) | $1,000.00 | $1,015.58 | 1.90% | $9.63 |
| Class I | | | | |
| Actual | $1,000.00 | $1,028.00 | 0.90% | $4.59 |
| Hypothetical (5% return before expenses) | $1,000.00 | $1,020.61 | 0.90% | $4.57 |
| RiverFront Global Growth Fund | | | | |
| Class A | | | | |
| Actual | $1,000.00 | $1,035.20 | 1.15% | $5.88 |
| Hypothetical (5% return before expenses) | $1,000.00 | $1,019.36 | 1.15% | $5.84 |
| Class C | | | | |
| Actual | $1,000.00 | $1,030.50 | 1.90% | $9.70 |
| Hypothetical (5% return before expenses) | $1,000.00 | $1,015.58 | 1.90% | $9.63 |
| Class I | | | | |
| Actual | $1,000.00 | $1,036.40 | 0.90% | $4.61 |
| Hypothetical (5% return before expenses) | $1,000.00 | $1,020.61 | 0.90% | $4.57 |
| Class L | | | | |
| Actual | $1,000.00 | $1,035.70 | 0.90% | $4.61 |
| Hypothetical (5% return before expenses) | $1,000.00 | $1,020.61 | 0.90% | $4.57 |
| Investor Class | | | | |
| Actual | $1,000.00 | $1,035.40 | 1.15% | $5.88 |
| Hypothetical (5% return before expenses) | $1,000.00 | $1,019.36 | 1.15% | $5.84 |
4 | October 31, 2016
Disclosure of Fund Expenses
October 31, 2016 (Unaudited)
| | Beginning Account Value May 1, 2016 | Ending Account Value October 31, 2016 | Expense Ratio(a) | Expenses Paid During Period May 1, 2016 - October 31, 2016(b) |
| RiverFront Moderate Growth & Income Fund | | | | |
| Class A | | | | |
| Actual | $1,000.00 | $1,022.40 | 1.15% | $5.85 |
| Hypothetical (5% return before expenses) | $1,000.00 | $1,019.36 | 1.15% | $5.84 |
| Class C | | | | |
| Actual | $1,000.00 | $1,018.00 | 1.90% | $9.64 |
| Hypothetical (5% return before expenses) | $1,000.00 | $1,015.58 | 1.90% | $9.63 |
| Class I | | | | |
| Actual | $1,000.00 | $1,023.00 | 0.90% | $4.58 |
| Hypothetical (5% return before expenses) | $1,000.00 | $1,020.61 | 0.90% | $4.57 |
| (a) | Annualized, based on the Fund's most recent fiscal half year expenses. |
| (b) | Expenses are equal to the Fund's annualized expense ratio multiplied by the average account value over the period, multiplied by the number of days in the most recent fiscal half year (184), divided by 366. |
| (c) | Includes expenses of the CoreCommodity Management Cayman Commodity Fund Ltd. (wholly-owned subsidiary), exclusive of the subsidiary's management fee. |
| (d) | Includes expenses of the Kotak Mauritius Portfolio (wholly-owned subsidiary). |
5 | October 31, 2016
ALPS | Alerian MLP Infrastructure Index Fund
| Management Commentary | October 31, 2016 (Unaudited) |
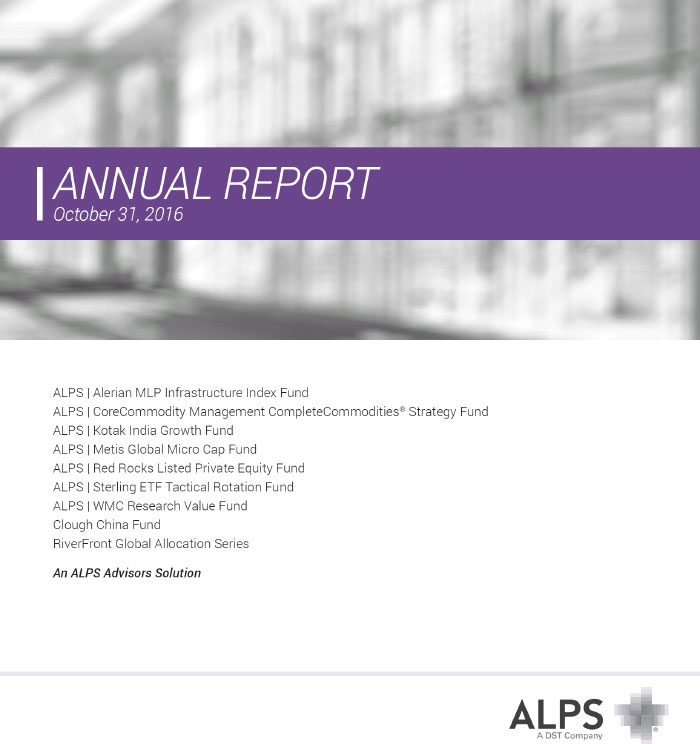
During the twelve-month period of November 1, 2015 to October 31, 2016 the Alerian MLP Infrastructure Index Fund’s (“Fund”) Class A shares delivered a net return of -0.63% at Net Asset Value. Class A delivered a net return of -6.06% at MOP, Class C was -1.94% with CDSC, and Class I was -0.48%. This compares to the Fund’s index, the Alerian MLP Infrastructure Index (“AMZI”), which fell -7.7% on a price-return and -0.1% on a total-return basis. The difference in performance between the AMZI and the Fund is primarily attributable to the Fund’s operating expenses and the impact of the Fund’s C Corporation tax election.
Top performers in the AMZI during the period include ONEOK Partners (OKS) and DCP Midstream Partners (DPM), both generating over 15% in price return. Laggards during the period include Energy Transfer Partners (ETP) and Shell Midstream Partners (SHLX), both falling over 20%.
Antero Midstream Partners (AM), Boardwalk Pipeline Partners (BWP), Phillips 66 Partners (PSXP), and Tallgrass Energy Partners (TEP) were added to the index during the period. Targa Resource Partners (NGLS) was removed during a special rebalancing due to its merger with Targa Resources Corp (TRGP).
For distributions reflecting the third calendar quarter of 2016, 14 of the 25 constituents in the AMZI increased their distribution, 10 MLPs maintained their distribution, and one MLP lowered its distribution.
After falling 40% from November 1, 2015, the index hit a near-term low on February 11, 2016. Since then, until period end on October 31, 2016, the index recovered over 54%. There has been a marked difference for MLPs over the past year. Capital markets have eased, MLPs have begun announcing organic growth projects again, and the sector even saw its first MLP IPO after a fourteen-month pause. In addition, a handful of major M&A activity has been either announced or completed. Certain areas such as the Permian in West Texas, Marcellus in the Northeast, and SCOOP/STACK plays in Oklahoma continue to see strong producer activity.
Despite the sector turning around since over a year ago, energy infrastructure MLPs and companies are facing new difficulties. While federal agencies have been supportive of the build-out of energy infrastructure, certain state regulatory agencies in the Northeast and East have made the process of securing pipeline customer commitments and/or right of way more difficult for MLPs. Not to mention, environmental protests have weighed on the ability for certain MLPs to proceed with newbuild pipeline construction. As a function of a more challenging build-out environment, not only are existing infrastructure assets now more valuable, the rights of way that come alongside pipelines also have greater value.
Relative to a year ago, the oil market is headed more in the direction towards balancing, but short term volatility is still to be expected. Uncertainty continues to be the enemy of premium valuations. As uncertainty lessens around the direction of commodity prices, MLP access to capital markets, infrastructure growth opportunities, and even the political climate, energy infrastructure MLPs may begin trading more on their fundamentals, and less on sentiment. With the long-term fundamentals for energy infrastructure MLPs to support the domestic supply of energy resources still intact, we continue to believe that MLPs represent a potentially compelling investment opportunity for investors seeking after-tax yield and access to real assets.
The views of the author and information discussed in this commentary are as of the date of publication, are subject to change, and may not reflect the writer’s current views. The views expressed are those of the author only, and represent an assessment of market conditions at a specific point in time, are opinions only and should not be relied upon as investment advice regarding a particular investment or markets in general. Such information does not constitute a recommendation to buy or sell specific securities or investment vehicles. It should not be assumed that any investment will be profitable or will equal the performance of the fund(s) or any securities or any sectors mentioned in this letter. The subject matter contained in this letter has been derived from several sources believed to be reliable and accurate at the time of compilation. Neither ALPS Advisors, Inc., Alerian, nor the Fund accept any liability for losses either direct or consequential caused by the use of this information.
Diversification cannot guarantee gain or prevent losses.
ALPS | Alerian MLP Infrastructure Index Fund (NYSE: ALERX) delivers exposure to the Alerian MLP Infrastructure Index (NYSE: AMZI), a capped, float-adjusted, capitalization-weighted composite of energy infrastructure Master Limited Partnerships that earn the majority of their cash flow from the transportation, storage, and processing of energy commodities.
ALPS | Alerian MLP Infrastructure Index Fund
| Performance Update | October 31, 2016 (Unaudited) |
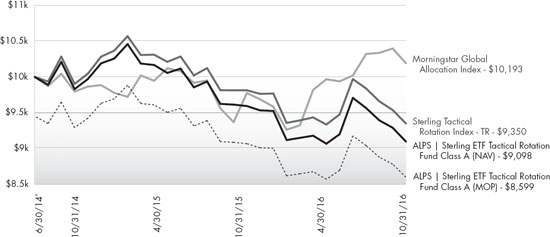
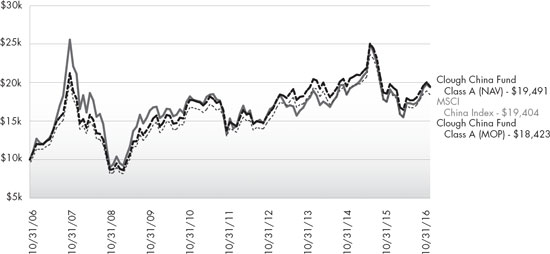
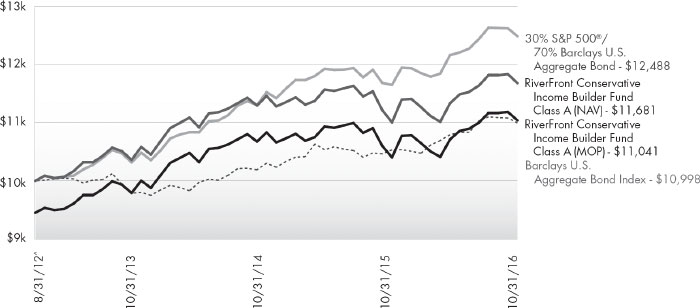
Performance of $10,000 Initial Investment (as of October 31, 2016)
Comparison of change in value of a $10,000 investment (includes maximum sales charges of 5.50%)
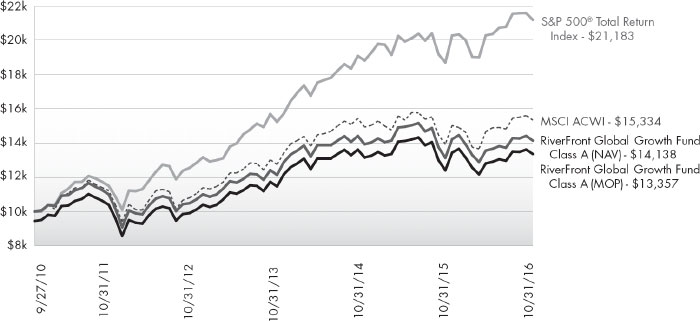
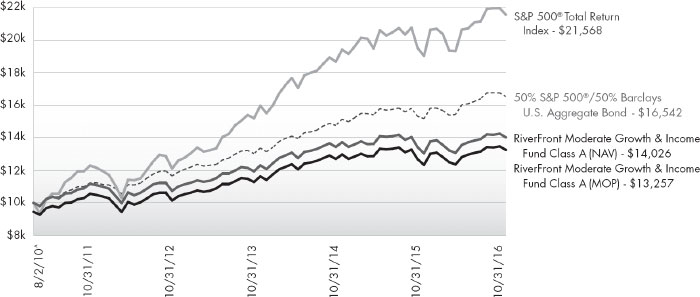
The chart above represents historical performance of a hypothetical investment of $10,000 in the Fund since inception. Past performance does not guarantee future results. This chart does not reflect the deduction of taxes that a shareholder would pay on Fund distributions or the redemption of Fund shares.
Average Annual Total Returns (as of October 31, 2016)
| | 6 Month | 1 Year | 3 Year | Since Inception^ | Total Expense Ratio | What You Pay* |
| Class A (NAV) | 4.32% | -0.63% | -7.33% | -1.99% | 1.78% | 1.25% |
| Class A (MOP) | -1.46% | -6.06% | -9.06% | -3.42% |
| Class C (NAV) | 4.07% | -1.04% | -7.55% | -2.27% | 2.38% | 1.85% |
| Class C (CDSC) | 3.08% | -1.94% | -7.55% | -2.27% |
| Class I | 4.42% | -0.48% | -7.12% | -1.77% | 1.38% | 0.85% |
Alerian MLP Infrastructure Index1 | 4.96% | -0.11% | -6.12% | 1.42% | | |
Performance data quoted represents past performance. Past performance does not guarantee future results. Investment return and principal value of an investment will fluctuate so that an investor’s shares, when sold or redeemed, may be worth more or less than the original cost. Current performance data may be higher or lower than actual data quoted. For the most current month-end performance data please call 1-866-759-5679.
Maximum Offering Price (MOP) for Class A shares includes the Fund’s maximum sales charge of 5.50%. Performance shown at NAV does not include these sales charges and would have been lower had it been taken into account. If you invest $1 million or more, either as a lump sum or through the Fund’s accumulation or letter of intent programs, you can purchase Class A shares without an initial sales charge (load). A Contingent Deferred Sales Charge (“CDSC”) of 1.00% may apply to Class C shares redeemed within the first 12 months after a purchase, and on Class A shares redeemed within the first 18 months after a purchase in excess of $1 million.
Performance less than 1 year is cumulative.
7 | October 31, 2016
ALPS | Alerian MLP Infrastructure Index Fund
| Performance Update | October 31, 2016 (Unaudited) |
| 1 | Alerian MLP Infrastructure Index is comprised of midstream energy Master Limited Partnerships. The index is not actively managed and does not reflect any deductions for fees, expenses or taxes. An investor may not invest directly in an index. |
| ^ | Fund inception date of December 31, 2012. |
| * | What You Pay reflects the Advisor’s and Sub-Advisor’s decision to contractually limit expenses through February 28, 2017. Please see the prospectus for additional information. |
Investments in securities of MLPs involve risks that differ from an investment in common stock. MLPs are controlled by their general partners, which generally have conflicts of interest and limited fiduciary duties to the MLP, which may permit the general partner to favor its own interests over the MLPs. The benefit you are expected to derive from the Fund’s investment in MLPs depends largely on the MLPs being treated as partnerships for federal income tax purposes. As a partnership, an MLP has no federal income tax liability at the entity level. Therefore, treatment of one or more MLPs as a corporation for federal income tax purposes could affect the Fund’s ability to meet its investment objective and would reduce the amount of cash available to pay or distribute to you. Legislative, judicial, or administrative changes and differing interpretations, possibly on a retroactive basis, could negatively impact the value of an investment in MLPs and therefore the value of your investment in the Fund.
The table does not reflect the deduction of taxes that a shareholder would pay on Fund distributions or the redemption of Fund shares.
This Fund is not suitable for all investors and is subject to investment risks, including possible loss of the principal amount invested.
There is no guarantee that the Fund will continue to hold any one particular security or stay invested in any one particular company. The composition of the Fund’s top holdings is subject to change. Performance figures are historical and reflect the change in share price, reinvested distributions, changes in net asset value, sales charges and capital gains distributions, if any.
Not FDIC Insured – No Bank Guarantee – May Lose Value
Top Ten Holdings (as a % of Net Assets) †
| Enterprise Products Partners LP | 9.92% |
| Magellan Midstream Partners LP | 9.92% |
| Energy Transfer Partners LP | 9.09% |
| Plains All American Pipeline LP | 8.54% |
| Williams Partners LP | 6.60% |
| MPLX LP | 6.40% |
| Buckeye Partners LP | 6.23% |
| ONEOK Partners LP | 4.65% |
| Sunoco Logistics Partners LP | 4.37% |
| Enbridge Energy Partners LP | 3.93% |
| Top Ten Holdings | 69.65% |
| † | Holdings are subject to change, and may not reflect the current or future position of the Portfolio. Table presents approximate values only. |
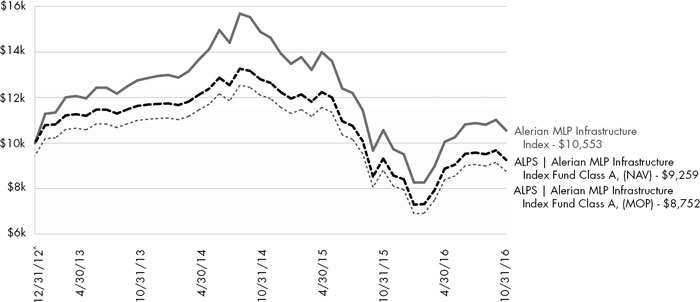
Industry Sector Allocation (as a % of Total Investments)
ALPS | Alerian MLP Infrastructure Index Fund
| Statement of Investments | October 31, 2016 |
| | | Shares | | | Value (Note 2) | |
| MASTER LIMITED PARTNERSHIPS (100.53%) | | | | |
| Gathering & Processing (26.38%) | | | | | | | |
| Oil & Gas (1.45%) | | | | | | | |
| Antero Midstream Partners LP | | | 20,194 | | | $ | 588,453 | |
| | | | | | | | | |
| Pipelines (24.93%) | | | | | | | | |
| DCP Midstream Partners LP | | | 27,247 | | | | 908,688 | |
| EnLink Midstream Partners LP | | | 45,929 | | | | 761,962 | |
| MPLX LP | | | 76,525 | | | | 2,603,381 | |
| ONEOK Partners LP | | | 47,614 | | | | 1,892,180 | |
| Western Gas Partners LP | | | 23,440 | | | | 1,292,716 | |
| Williams Partners LP | | | 75,009 | | | | 2,686,822 | |
| | | | | | | | 10,145,749 | |
| | | | | | | | | |
| TOTAL GATHERING & PROCESSING | | 10,734,202 | |
| | | | | | | | | |
Pipeline Transportation | Natural Gas (28.00%) | | | | | |
| Pipelines (continued) (28.00%) | | | | | | | | |
| Boardwalk Pipeline Partners LP | | | 37,482 | | | | 645,065 | |
| Energy Transfer Partners LP | | | 105,705 | | | | 3,697,561 | |
| Enterprise Products Partners LP | | | 159,909 | | | | 4,036,103 | |
| EQT Midstream Partners LP | | | 17,665 | | | | 1,322,578 | |
| Spectra Energy Partners LP | | | 21,670 | | | | 924,009 | |
| TC PipeLines LP | | | 14,698 | | | | 766,648 | |
| | | | | | | | 11,391,964 | |
| | | | | | | | | |
| TOTAL PIPELINE TRANSPORTATION | NATURAL GAS | | | | 11,391,964 | |
| | | | | | | | | |
| Pipeline Transportation | Petroleum (46.15%) | | | | | | | | |
| Pipelines (continued) (46.15%) | | | | | | | | |
| Buckeye Partners LP | | | 39,307 | | | | 2,536,874 | |
| Enbridge Energy Partners LP | | | 64,920 | | | | 1,600,278 | |
| Genesis Energy LP | | | 30,967 | | | | 1,081,677 | |
| Magellan Midstream Partners LP | | | 60,025 | | | | 4,035,481 | |
| NGL Energy Partners LP | | | 29,024 | | | | 516,627 | |
| NuStar Energy LP | | | 19,392 | | | | 915,109 | |
| Phillips 66 Partners LP | | | 12,922 | | | | 571,152 | |
| Plains All American Pipeline LP | | | 114,401 | | | | 3,473,214 | |
| Shell Midstream Partners LP | | | 26,578 | | | | 721,061 | |
| Sunoco Logistics Partners LP | | | 69,279 | | | | 1,776,314 | |
| Tallgrass Energy Partners LP | | | 12,717 | | | | 575,190 | |
| Tesoro Logistics LP | | | 20,498 | | | | 978,575 | |
| | | | | | | | 18,781,552 | |
| | | | | | | | | |
| TOTAL PIPELINE TRANSPORTATION | PETROLEUM | | | | 18,781,552 | |
| | | | | | | | | |
TOTAL MASTER LIMITED PARTNERSHIPS
(Cost $36,837,557) | | | | 40,907,718 | |
| | | Shares | | | Value (Note 2) | |
TOTAL INVESTMENTS (100.53%) (Cost $36,837,557) | $ | 40,907,718 | |
| | | | | | | | |
| Liabilities In Excess Of Other Assets (-0.53%) | | (214,951 | ) |
| | | | | | | | | |
| NET ASSETS (100.00%) | $ | 40,692,768 | |
For Fund compliance purposes, the Fund’s industry classifications refer to any one or more of the industry sub-classifications used by one or more widely recognized market indexes or ratings group indexes, and/or as defined by Fund management. This definition may not apply for purposes of this report, which may combine industry sub-classifications for reporting ease. Industries are shown as a percent of net assets.
See Notes to Financial Statements.
9 | October 31, 2016
ALPS | Alerian MLP Infrastructure Index Fund
| Statement of Assets and Liabilities | October 31, 2016 |
| ASSETS | | | |
| Investments, at value | | $ | 40,907,718 | |
| Receivable for investments sold | | | 323,231 | |
| Receivable for shares sold | | | 35,810 | |
| Dividends receivable | | | 313,838 | |
Deferred tax asset(a) | | | – | |
| Receivable due from advisor | | | 8,092 | |
| Income tax receivable | | | 6,904 | |
| Prepaid expenses and other assets | | | 3,719 | |
| Total Assets | | | 41,599,312 | |
| LIABILITIES | | | | |
| Franchise tax payable | | | 7,409 | |
| Payable for shares redeemed | | | 550,213 | |
| Payable due to custodian ‐ overdraft | | | 303,097 | |
| Administration and transfer agency fees payable | | | 4,282 | |
| Distribution and services fees payable | | | 16,548 | |
| Professional fees payable | | | 13,989 | |
| Accrued expenses and other liabilities | | | 11,006 | |
| Total Liabilities | | | 906,544 | |
| NET ASSETS | | $ | 40,692,768 | |
| NET ASSETS CONSIST OF | | | | |
| Paid‐in capital | | $ | 48,370,329 | |
| Accumulated net investment loss, net of deferred income taxes | | | (1,186,085 | ) |
| Accumulated net realized loss, net of deferred income taxes | | | (10,558,573 | ) |
| Net unrealized appreciation, net of deferred income taxes | | | 4,067,097 | |
| NET ASSETS | | $ | 40,692,768 | |
| INVESTMENTS, AT COST | | $ | 36,837,557 | |
| PRICING OF SHARES | | | | |
| Class A: | | | | |
| Net Asset Value, offering and redemption price per share | | $ | 6.90 | |
| Net Assets | | $ | 11,122,450 | |
| Shares of beneficial interest outstanding (unlimited number of shares, no par value common stock authorized) | | | 1,611,977 | |
| Maximum offering price per share ((NAV/0.9450), based on maximum sales charge of 5.50% of the offering price) | | $ | 7.30 | |
| Class C: | | | | |
Net Asset Value, offering and redemption price per share(b) | | $ | 6.81 | |
| Net Assets | | $ | 9,078,114 | |
| Shares of beneficial interest outstanding (unlimited number of shares, no par value common stock authorized) | | | 1,333,153 | |
| Class I: | | | | |
| Net Asset Value, offering and redemption price per share | | $ | 6.97 | |
| Net Assets | | $ | 20,492,204 | |
| Shares of beneficial interest outstanding (unlimited number of shares, no par value common stock authorized) | | | 2,939,761 | |
| (a) | Any net tax benefit was fully offset by a 100% valuation allowance recorded as of October 31, 2016. See Note 4 for additional information. |
| (b) | Redemption price per share may be reduced for any applicable contingent deferred sales charge. For a description of a possible sales charge, please see the Fund's Prospectus. |
See Notes to Financial Statements.
10 | October 31, 2016
ALPS | Alerian MLP Infrastructure Index Fund
| Statement of Operations | For the Year Ended October 31, 2016 |
| INVESTMENT INCOME | | | |
| Dividends | | $ | 720 | |
| Distributions from master limited partnerships | | | 2,640,231 | |
| Less return of capital distributions | | | (2,640,231 | ) |
| Total Investment Income | | | 720 | |
| | | | | |
| EXPENSES | | | | |
| Investment advisory fees | | | 237,589 | |
| Administrative fees | | | 35,831 | |
| Transfer agency fees | | | 940 | |
| Distribution and service fees | | | | |
| Class A | | | 33,296 | |
| Class C | | | 79,103 | |
| Professional fees | | | 96,419 | |
| Reports to shareholders and printing fees | | | 4,764 | |
| State registration fees | | | 44,780 | |
| SEC registration fees | | | 66 | |
| Insurance fees | | | 286 | |
| Franchise tax expenses | | | 5,409 | |
| Custody fees | | | 15,292 | |
| Trustees' fees and expenses | | | 898 | |
| Miscellaneous expenses | | | 20,032 | |
| Total Expenses | | | 574,705 | |
| Less fees waived/reimbursed by investment advisor (Note 8) | | | | |
| Class A | | | (46,940 | ) |
| Class C | | | (39,470 | ) |
| Class I | | | (82,786 | ) |
| Net Expenses | | | 405,509 | |
| Net Investment Loss, before deferred income taxes | | | (404,789 | ) |
| Income tax benefit | | | – | |
| Net Investment Loss, net of deferred income taxes | | | (404,789 | ) |
| | | | | |
| REALIZED AND UNREALIZED GAIN/(LOSS) | | | | |
| Net realized loss on investments, before deferred income taxes | | | (8,137,420 | ) |
| Income tax benefit | | | – | |
| Net Realized Loss on investments, net of deferred income taxes | | | (8,137,420 | ) |
| | | | | |
| Net change in unrealized appreciation on investment, before deferred income taxes | | | 8,857,590 | |
| Income tax benefit | | | – | |
| Net Change in Unrealized Appreciation on Investments, net of deferred income taxes | | | 8,857,590 | |
| NET REALIZED AND UNREALIZED GAIN ON INVESTMENTS, NET OF DEFERRED INCOME TAXES | | | 720,170 | |
| NET INCREASE IN NET ASSETS RESULTING FROM OPERATIONS | | $ | 315,381 | |
See Notes to Financial Statements.
11 | October 31, 2016
ALPS | Alerian MLP Infrastructure Index Fund
Statements of Changes in Net Assets
| | | For the Year Ended October 31, 2016 | | | For the Year Ended October 31, 2015 | |
| OPERATIONS | | | | | | |
| Net investment loss, net of deferred income taxes | | $ | (404,789 | ) | | $ | (489,210 | ) |
| Net realized loss on investments, net of deferred income taxes | | | (8,137,420 | ) | | | (2,052,229 | ) |
| Net change in unrealized appreciation/(depreciation) on investments, net of deferred income taxes | | | 8,857,590 | | | | (7,014,615 | ) |
| Net Increase/(Decrease) in Net Assets Resulting from Operations | | | 315,381 | | | | (9,556,054 | ) |
| | | | | | | | | |
| DISTRIBUTIONS | | | | | | | | |
| Distributions to shareholders from net investment income | | | | | | | | |
| Class A | | | (35,289 | ) | | | (4,150 | ) |
| Class C | | | (29,661 | ) | | | (2,627 | ) |
| Class I | | | (64,431 | ) | | | (1,614 | ) |
| Distributions to shareholders from tax return of capital | | | | | | | | |
| Class A | | | (821,410 | ) | | | (1,160,636 | ) |
| Class C | | | (690,411 | ) | | | (734,478 | ) |
| Class I | | | (1,499,725 | ) | | | (451,330 | ) |
| Net Decrease in Net Assets from Distributions | | | (3,140,927 | ) | | | (2,354,835 | ) |
| | | | | | | | | |
| BENEFICIAL INTEREST TRANSACTIONS (NOTE 6) | | | | | | | | |
| Shares sold | | | | | | | | |
| Class A | | | 9,184,684 | | | | 12,474,282 | |
| Class C | | | 4,730,039 | | | | 8,002,639 | |
| Class I | | | 19,959,806 | | | | 7,103,832 | |
| Distributions reinvested | | | | | | | | |
| Class A | | | 783,421 | | | | 1,105,212 | |
| Class C | | | 705,911 | | | | 721,890 | |
| Class I | | | 1,469,292 | | | | 448,126 | |
| Shares redeemed, net of redemption fees | | | | | | | | |
| Class A | | | (12,504,205 | ) | | | (4,057,509 | ) |
| Class C | | | (3,582,134 | ) | | | (3,615,264 | ) |
| Class I | | | (4,384,484 | ) | | | (7,165,800 | ) |
| Net Increase in Net Assets Derived from Beneficial Interest Transactions | | | 16,362,330 | | | | 15,017,408 | |
| | | | | | | | | |
| Net increase in net assets | | | 13,536,784 | | | | 3,106,519 | |
| | | | | | | | | |
| NET ASSETS | | | | | | | | |
| Beginning of year | | | 27,155,984 | | | | 24,049,465 | |
| End of year * | | $ | 40,692,768 | | | $ | 27,155,984 | |
| *Including accumulated net investment loss, net of deferred income taxes, of: | | $ | (1,186,085 | ) | | $ | (651,915 | ) |
See Notes to Financial Statements.
12 | October 31, 2016
ALPS | Alerian MLP Infrastructure Index Fund – Class A
Financial Highlights
Selected data for a share of beneficial interest outstanding throughout the periods indicated:
| | | For the Year Ended October 31, 2016 | | | For the Year Ended October 31, 2015 | | | For the Fiscal Period Ended October 31, 2014 (a) | | | For the Year Ended April 30, 2014 | | | For the Period January 2, 2013 (Commencement) to April 30, 2013 | |
| Net asset value, beginning of period | | $ | 7.60 | | | $ | 11.32 | | | $ | 11.23 | | | $ | 11.10 | | | $ | 10.00 | |
| | | | | | | | | | | | | | | | | | | | | |
| INCOME/(LOSS) FROM INVESTMENT OPERATIONS: |
Net investment loss(b) | | | (0.08 | ) | | | (0.15 | ) | | | (0.05 | ) | | | (0.09 | ) | | | (0.03 | ) |
| Net realized and unrealized gain/(loss) | | | (0.02 | ) | | | (2.83 | ) | | | 0.67 | | | | 0.90 | | | | 1.29 | |
| Total from investment operations | | | (0.10 | ) | | | (2.98 | ) | | | 0.62 | | | | 0.81 | | | | 1.26 | |
| | | | | | | | | | | | | | | | | | | | | |
| DISTRIBUTIONS: | | | | | | | | | | | | | | | | | | | | |
| From net investment income | | | (0.02 | ) | | | (0.00 | )(c) | | | (0.03 | ) | | | (0.36 | ) | | | – | |
| From tax return of capital | | | (0.58 | ) | | | (0.74 | ) | | | (0.50 | ) | | | (0.32 | ) | | | (0.16 | ) |
| Total distributions | | | (0.60 | ) | | | (0.74 | ) | | | (0.53 | ) | | | (0.68 | ) | | | (0.16 | ) |
| | | | | | | | | | | | | | | | | | | | | |
| REDEMPTION FEES ADDED TO PAID‐IN CAPITAL (NOTE 6) | | | 0.00 | (c) | | | – | | | | – | | | | – | | | | – | |
| Net increase/(decrease) in net asset value | | | (0.70 | ) | | | (3.72 | ) | | | 0.09 | | | | 0.13 | | | | 1.10 | |
| Net asset value, end of year | | $ | 6.90 | | | $ | 7.60 | | | $ | 11.32 | | | $ | 11.23 | | | $ | 11.10 | |
TOTAL RETURN(d) | | | (0.63 | )% | | | (27.23 | )% | | | 5.61 | % | | | 7.59 | % | | | 12.68 | % |
| | | | | | | | | | | | | | | | | | | | | |
| RATIOS/SUPPLEMENTAL DATA: | | | | | | | | | | | | | | | | | | | | |
| Net assets, end of year (000s) | | $ | 11,122 | | | $ | 14,393 | | | $ | 10,619 | | | $ | 8,223 | | | $ | 928 | |
| | | | | | | | | | | | | | | | | | | | | |
| Ratio of expenses to average net assets before waivers, franchise tax expense and income tax expense/benefit | | | 1.71 | % | | | 1.77 | % | | | 2.20 | %(e) | | | 3.09 | % | | | 5.51 | %(e)(f) |
| Ratio of expense waivers to average net assets | | | (0.50 | %) | | | (0.53 | %) | | | (0.97 | %)(e) | | | (1.84 | %) | | | (4.26 | %)(e)(f) |
| Ratio of expenses to average net assets net of waivers before franchise tax expense and income tax expense/benefit | | | 1.21 | %(g) | | | 1.24 | %(g) | | | 1.23 | %(e)(g) | | | 1.25 | % | | | 1.25 | %(e)(f) |
Ratio of franchise tax expense and income tax expense/(benefit) to average net assets(h) | | | (0.02 | %) | | | (4.03 | %) | | | 4.49 | %(e) | | | 5.38 | % | | | 20.55 | %(e) |
| Ratio of total expenses to average net assets | | | 1.19 | % | | | (2.79 | %) | | | 5.72 | %(e) | | | 6.63 | % | | | 21.80 | %(e) |
| | | | | | | | | | | | | | | | | | | | | |
| Ratio of investment loss to average net assets before waivers, franchise tax expense and income tax expense/benefit | | | (1.71 | %) | | | (1.77 | %) | | | (2.20 | %)(e) | | | (3.09 | %) | | | (5.51 | %)(e)(f) |
| Ratio of expense waivers to average net assets | | | (0.50 | %) | | | (0.53 | %) | | | (0.97 | %)(e) | | | (1.84 | %) | | | (4.26 | %)(e)(f) |
| Ratio of investment loss to average net assets net of waivers before franchise tax expense and income tax expense/benefit | | | (1.21 | %)(g) | | | (1.24 | %)(g) | | | (1.23 | %)(e)(g) | | | (1.25 | %) | | | (1.25 | %)(e)(f) |
Ratio of franchise tax expense and income tax (expense)/benefit to average net assets(i) | | | (0.02 | %) | | | (0.34 | %) | | | 0.43 | %(e) | | | 0.43 | % | | | 0.40 | %(e) |
| Ratio of net investment loss to average net assets | | | (1.23 | %) | | | (1.58 | %) | | | (0.80 | %)(e) | | | (0.82 | %) | | | (0.85 | %)(e) |
| | | | | | | | | | | | | | | | | | | | | |
Portfolio turnover rate(j) | | | 63 | % | | | 52 | % | | | 7 | % | | | 63 | % | | | 3 | % |
See Notes to Financial Statements.
13 | October 31, 2016
ALPS | Alerian MLP Infrastructure Index Fund – Class A
Financial Highlights
Selected data for a share of beneficial interest outstanding throughout the periods indicated:
| (a) | Effective May 1, 2014, the Board approved changing the fiscal year-end of the Funds from April 30 to October 31. |
| (b) | Calculated using the average shares method. |
| (c) | Less than $0.005 per share. |
| (d) | Total returns are for the period indicated and have not been annualized. Total returns would have been lower had certain expenses not been waived during the period. Returns shown do not reflect the deduction of taxes that a shareholder would pay on Fund distributions or the redemption of Fund shares. Returns shown exclude any applicable sales charges. |
| (f) | Expense ratios before reductions for startup periods may not be representative of longer term operating periods. |
| (g) | According to the Fund's shareholder services plan with respect to the Fund's Class A shares, any amount of such payment not paid during the Fund's fiscal year for such service activities shall be reimbursed to the Fund as soon as practical after the end of the fiscal year. Fees were reimbursed to the Fund during the period ended October 31, 2016, October 31, 2015 and October 31, 2014, for the prior fiscal year in the amount of 0.04%, 0.01% and 0.02% (annualized) of average net assets of Class A shares respectively. |
| (h) | Adjustment for income tax expense estimate for the ratio calculation is derived from the net investment loss, and realized and unrealized gains/losses. |
| (i) | Adjustment for income tax benefit for the ratio calculation is derived from net investment loss only. |
| (j) | Portfolio turnover rate for periods less than one full year have not been annualized. |
See Notes to Financial Statements.
14 | October 31, 2016
ALPS | Alerian MLP Infrastructure Index Fund – Class C
Financial Highlights
Selected data for a share of beneficial interest outstanding throughout the periods indicated:
| | | For the Year Ended October 31, 2016 | | | For the Year Ended October 31, 2015 | | | For the Fiscal Period Ended October 31, 2014(a) | | | For the Year Ended April 30, 2014 | | | For the Period January 2, 2013 (Commencement) to April 30, 2013 | |
| Net asset value, beginning of period | | $ | 7.54 | | | $ | 11.23 | | | $ | 11.17 | | | $ | 11.09 | | | $ | 10.00 | |
| | | | | | | | | | | | | | | | | | | | | |
| INCOME/(LOSS) FROM INVESTMENT OPERATIONS: |
Net investment loss(b) | | | (0.12 | ) | | | (0.22 | ) | | | (0.07 | ) | | | (0.13 | ) | | | (0.05 | ) |
| Net realized and unrealized gain/(loss) | | | (0.01 | ) | | | (2.73 | ) | | | 0.66 | | | | 0.89 | | | | 1.30 | |
| Total from investment operations | | | (0.13 | ) | | | (2.95 | ) | | | 0.59 | | | | 0.76 | | | | 1.25 | |
| | | | | | | | | | | | | | | | | | | | | |
| DISTRIBUTIONS: | | | | | | | | | | | | | | | | | | | | |
| From net investment income | | | (0.02 | ) | | | (0.00 | )(c) | | | (0.08 | ) | | | (0.35 | ) | | | – | |
| From tax return of capital | | | (0.58 | ) | | | (0.74 | ) | | | (0.45 | ) | | | (0.33 | ) | | | (0.16 | ) |
| Total distributions | | | (0.60 | ) | | | (0.74 | ) | | | (0.53 | ) | | | (0.68 | ) | | | (0.16 | ) |
| | | | | | | | | | | | | | | | | | | | | |
| Net increase/(decrease) in net asset value | | | (0.73 | ) | | | (3.69 | ) | | | 0.06 | | | | 0.08 | | | | 1.09 | |
| Net asset value, end of year | | $ | 6.81 | | | $ | 7.54 | | | $ | 11.23 | | | $ | 11.17 | | | $ | 11.09 | |
TOTAL RETURN(d) | | | (1.04 | )% | | | (27.18 | )% | | | 5.37 | % | | | 7.13 | % | | | 12.58 | % |
| | | | | | | | | | | | | | | | | | | | | |
| RATIOS/SUPPLEMENTAL DATA: | | | | | | | | | | | | | | | | | | | | |
| Net assets, end of year (000s) | | $ | 9,078 | | | $ | 8,291 | | | $ | 6,773 | | | $ | 3,429 | | | $ | 563 | |
| | | | | | | | | | | | | | | | | | | | | |
| Ratio of expenses to average net assets before waivers, franchise tax expense and income tax expense/benefit | | | 2.35 | % | | | 2.38 | % | | | 2.82 | %(e) | | | 3.71 | % | | | 7.01 | %(e)(f) |
| Ratio of expense waivers to average net assets | | | (0.50 | %) | | | (0.53 | %) | | | (0.97 | %)(e) | | | (1.86 | %) | | | (5.16 | %)(e)(f) |
| Ratio of expenses to average net assets net of waivers before franchise tax expense and income tax expense/benefit | | | 1.85 | % | | | 1.85 | % | | | 1.85 | %(e) | | | 1.85 | % | | | 1.85 | %(e)(f) |
Ratio of franchise tax expense and income tax expense/(benefit) to average net assets(g) | | | (0.02 | %) | | | (4.09 | %) | | | 4.27 | %(e) | | | 5.16 | % | | | 20.55 | %(e) |
| Ratio of total expenses to average net assets | | | 1.83 | % | | | (2.24 | %) | | | 6.12 | %(e) | | | 7.01 | % | | | 22.40 | %(e) |
| | | | | | | | | | | | | | | | | | | | | |
| Ratio of investment loss to average net assets before waivers, franchise tax expense and income tax expense/benefit | | | (2.35 | %) | | | (2.38 | %) | | | (2.82 | %)(e) | | | (3.71 | %) | | | (7.01 | %)(e)(f) |
| Ratio of expense waivers to average net assets | | | (0.50 | %) | | | (0.53 | %) | | | (0.97 | %)(e) | | | (1.86 | %) | | | (5.16 | %)(e)(f) |
| Ratio of investment loss to average net assets net of waivers before franchise tax expense and income tax expense/benefit | | | (1.85 | %) | | | (1.85 | %) | | | (1.85 | %)(e) | | | (1.85 | %) | | | (1.85 | %)(e)(f) |
Ratio of franchise tax expense and income tax (expense)/benefit to average net assets(h) | | | (0.02 | %) | | | (0.40 | %) | | | 0.65 | %(e) | | | 0.65 | % | | | 0.40 | %(e) |
| Ratio of net investment loss to average net assets | | | (1.87 | %) | | | (2.25 | %) | | | (1.20 | %)(e) | | | (1.20 | %) | | | (1.45 | %)(e) |
| | | | | | | | | | | | | | | | | | | | | |
Portfolio turnover rate(i) | | | 63 | % | | | 52 | % | | | 7 | % | | | 63 | % | | | 3 | % |
See Notes to Financial Statements.
15 | October 31, 2016
ALPS | Alerian MLP Infrastructure Index Fund – Class C
Financial Highlights
Selected data for a share of beneficial interest outstanding throughout the periods indicated:
(a) | Effective May 1, 2014, the Board approved changing the fiscal year-end of the Funds from April 30 to October 31. |
(b) | Calculated using the average shares method. |
(c) | Less than $0.005 per share. |
(d) | Total returns are for the period indicated and have not been annualized. Total returns would have been lower had certain expenses not been waived during the period. Returns shown do not reflect the deduction of taxes that a shareholder would pay on Fund distributions or the redemption of Fund shares. Returns shown exclude any applicable sales charges. |
(f) | Expense ratios before reductions for startup periods may not be representative of longer term operating periods. |
(g) | Adjustment for income tax expense estimate for the ratio calculation is derived from the net investment loss, and realized and unrealized gains/losses. |
(h) | Adjustment for income tax benefit for the ratio calculation is derived from net investment loss only. |
(i) | Portfolio turnover rate for periods less than one full year have not been annualized. |
See Notes to Financial Statements.
16 | October 31, 2016
ALPS | Alerian MLP Infrastructure Index Fund – Class I
Financial Highlights
Selected data for a share of beneficial interest outstanding throughout the periods indicated:
| | | For the Year Ended October 31, 2016 | | | For the Year Ended October 31, 2015 | | | For the Fiscal Period Ended October 31, 2014(a) | | | For the Year Ended April 30, 2014 | | | For the Period January 2, 2013 (Commencement) to April 30, 2013 | |
| Net asset value, beginning of period | | $ | 7.66 | | | $ | 11.36 | | | $ | 11.25 | | | $ | 11.11 | | | $ | 10.00 | |
| | | | | | | | | | | | | | | | | | | | | |
| INCOME/(LOSS) FROM INVESTMENT OPERATIONS: |
Net investment loss(b) | | | (0.06 | ) | | | (0.11 | ) | | | (0.03 | ) | | | (0.06 | ) | | | (0.02 | ) |
| Net realized and unrealized gain/(loss) | | | (0.03 | ) | | | (2.85 | ) | | | 0.67 | | | | 0.88 | | | | 1.29 | |
| Total from investment operations | | | (0.09 | ) | | | (2.96 | ) | | | 0.64 | | | | 0.82 | | | | 1.27 | |
| | | | | | | | | | | | | | | | | | | | | |
| DISTRIBUTIONS: | | | | | | | | | | | | | | | | | | | | |
| From net investment income | | | (0.02 | ) | | | (0.00 | )(c) | | | (0.04 | ) | | | (0.27 | ) | | | – | |
| From tax return of capital | | | (0.58 | ) | | | (0.74 | ) | | | (0.49 | ) | | | (0.41 | ) | | | (0.16 | ) |
| Total distributions | | | (0.60 | ) | | | (0.74 | ) | | | (0.53 | ) | | | (0.68 | ) | | | (0.16 | ) |
| | | | | | | | | | | | | | | | | | | | | |
| Net increase/(decrease) in net asset value | | | (0.69 | ) | | | (3.70 | ) | | | 0.11 | | | | 0.14 | | | | 1.11 | |
| Net asset value, end of year | | $ | 6.97 | | | $ | 7.66 | | | $ | 11.36 | | | $ | 11.25 | | | $ | 11.11 | |
TOTAL RETURN(d) | | | (0.48 | )% | | | (26.95 | )% | | | 5.78 | % | | | 7.68 | % | | | 12.78 | % |
| | | | | | | | | | | | | | | | | | | | | |
| RATIOS/SUPPLEMENTAL DATA: | | | | | | | | | | | | | | | | | | | | |
| Net assets, end of year (000s) | | $ | 20,492 | | | $ | 4,472 | | | $ | 6,658 | | | $ | 1,507 | | | $ | 2,256 | |
| | | | | | | | | | | | | | | | | | | | | |
| Ratio of expenses to average net assets before waivers, franchise tax expense and income tax expense/benefit | | | 1.35 | % | | | 1.38 | % | | | 1.81 | %(e) | | | 3.03 | % | | | 6.01 | %(e)(f) |
| Ratio of expense waivers to average net assets | | | (0.50 | %) | | | (0.53 | %) | | | (0.96 | %)(e) | | | (2.18 | %) | | | (5.16 | %)(e)(f) |
| Ratio of expenses to average net assets net of waivers before franchise tax expense and income tax expense/benefit | | | 0.85 | % | | | 0.85 | % | | | 0.85 | %(e) | | | 0.85 | % | | | 0.85 | %(e)(f) |
Ratio of franchise tax expense and income tax expense/(benefit) to average net assets(g) | | | (0.02 | %) | | | (3.92 | %) | | | 4.63 | %(e) | | | 5.53 | % | | | 20.55 | %(e) |
| Ratio of total expenses to average net assets | | | 0.83 | % | | | (3.07 | %) | | | 5.48 | %(e) | | | 6.38 | % | | | 21.40 | %(e) |
| | | | | | | | | | | | | | | | | | | | | |
| Ratio of investment loss to average net assets before waivers, franchise tax expense and income tax expense/benefit | | | (1.35 | %) | | | (1.38 | %) | | | (1.81 | %)(e) | | | (3.03 | %) | | | (6.01 | %)(e)(f) |
| Ratio of expense waivers to average net assets | | | (0.50 | %) | | | (0.53 | %) | | | (0.96 | %)(e) | | | (2.18 | %) | | | (5.16 | %)(e)(f) |
| Ratio of investment loss to average net assets net of waivers before franchise tax expense and income tax expense/benefit | | | (0.85 | %) | | | (0.85 | %) | | | (0.85 | %)(e) | | | (0.85 | %) | | | (0.85 | %)(e)(f) |
Ratio of franchise tax expense and income tax (expense)/benefit to average net assets(h) | | | (0.02 | %) | | | (0.23 | %) | | | 0.28 | %(e) | | | 0.29 | % | | | 0.40 | %(e) |
| Ratio of net investment loss to average net assets | | | (0.87 | %) | | | (1.08 | %) | | | (0.57 | %)(e) | | | (0.56 | %) | | | (0.45 | %)(e) |
| | | | | | | | | | | | | | | | | | | | | |
Portfolio turnover rate(i) | | | 63 | % | | | 52 | % | | | 7 | % | | | 63 | % | | | 3 | % |
See Notes to Financial Statements.
17 | October 31, 2016
ALPS | Alerian MLP Infrastructure Index Fund – Class I
Financial Highlights
Selected data for a share of beneficial interest outstanding throughout the periods indicated:
(a) | Effective May 1, 2014, the Board approved changing the fiscal year-end of the Funds from April 30 to October 31. |
(b) | Calculated using the average shares method. |
(c) | Less than $0.005 per share. |
(d) | Total returns are for the period indicated and have not been annualized. Total returns would have been lower had certain expenses not been waived during the period. Returns shown do not reflect the deduction of taxes that a shareholder would pay on Fund distributions or the redemption of Fund shares. |
(f) | Expense ratios before reductions for startup periods may not be representative of longer term operating periods. |
(g) | Adjustment for income tax expense estimate for the ratio calculation is derived from the net investment loss, and realized and unrealized gains/losses. |
(h) | Adjustment for income tax benefit for the ratio calculation is derived from net investment loss only. |
(i) | Portfolio turnover rate for periods less than one full year have not been annualized. |
See Notes to Financial Statements.
18 | October 31, 2016
ALPS | CoreCommodity Management
CompleteCommodities® Strategy Fund
| Management Commentary | October 31, 2016 (Unaudited) |
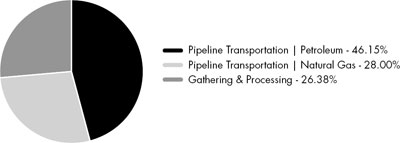
The twelve month period ending on October 31, 2016 produced modestly negative returns for commodities, as measured by the diversified Bloomberg Commodities Total Return Index, down (2.62%). On the other hand, commodity equities appreciated during the period, up 13.62% as measured by the Standard and Poor’s Global Natural Resources Net Total Return Index. Commodity equities outperformed the broader Standard & Poor’s 500 Total Return Index for the period which posted 4.51% gains. The ALPS CoreCommodity Complete Commodities Strategy Fund (JCRIX) delivered a net positive return of 2.24% (JCRAX was -3.70% at MOP and JCRCX was up +0.29% with CDSC).
The Fund outperformed its benchmark, the Bloomberg Commodity Total Return Index, by 485 basis points, net of expenses, during this period (measured against the performance of the “I” shares). The Fund employs a strategy that combines an actively managed portfolio of commodity futures related exposure (collateralized by Treasury Inflation Protected Securities – TIPS), commodity equities, and physical commodity ETF’s. At the end of October, the Fund allocated approximately 72% of its assets toward commodity futures related investments and approximately 28% of its assets in commodity equities. The Fund was more than 99% invested at the end of the period.
Commodity futures prices struggled throughout the last twelve month period. As mentioned previously, the Bloomberg Commodity Total Return Index (BCOMTR) slipped by just (2.62%) for the year ending October 30, 2016. Energy prices were amongst the most notable detractors from performance in the time frame. The corrosive effects of contango were evident in both crude oil and natural gas. Contango is defined as the variable cost of rolling futures price exposure from active month to the next contract. Costs include storage, insurance, interest charges, transportation, etc. They contribute to the changeable amount of contango the futures are subjected to. For the trailing twelve months, energy prices declined by (18.22%), as measured by the Bloomberg Commodity Index Energy Sub-Index Total Return. We observed crude oil prices bottoming in the early part of Q1 2016 as West Texas Intermediate (WTI) approached $26/barrel. Rational producer response has taken portions of crude oil production offline and more than $1.1 trillion in capital expenditures have been deferred or cancelled. Natural gas has experienced similar evaluations. We feel that the energy sector is in the early stages of what may be a more sustained price recovery.
Livestock prices also declined for the year ending in October 2016. Cattle prices fell (27.09%) while hog prices dropped (19.08%). Benign weather and nearly ideal feeding situations led to a significant decline in herd losses and increased the animal weights. More supply weighed on prices.
Grain price performance was mixed for the 12 months ending in October. Soybean prices rose 14.23%. Weather inconsistencies in South America led to higher prices. On the other hand, calmer conditions prevailed for most of the primary growing regions for corn and wheat. Yields were high and harvests exceeded expectations. Corn prices declined (7.19%) for the year and wheat fell by (20.26%).
Precious metal prices produced gains for the year. Despite a modest increase in the price of the US Dollar which can sometimes impede precious metal prices from advancing, gold rose 11.54% while silver added 14.32%. Continued geo-political tension prevailed in many parts of the world. The so-called “Brexit” vote to separate the United Kingdom from the European Union surprised many observers and provided a boost to precious metals.
Industrial metals produced a mixed result for the year. Copper prices slid by (4.85%). Lackluster global GDP growth translated into decelerating copper demand. Meanwhile, producer response in aluminum and nickel helped to support and raise prices for the 12 month period. Aluminum climbed 18.31% while nickel advanced by 4.05%. Marginal production and fabrication facilities were idled to stem losses suffered by protracted low prices.
The best performing sector within the Fund was in the “soft” commodity area. Orange juice prices led all commodities with a 59.74 percent year-over-year advance. Insect infestation and disease curtailed crops especially in Florida. Sugar prices jumped by 48.55%. Poor crops in Southeast Asia and Brazil pressured the supply side. Coffee prices benefitted from difficult conditions in Brazil and Vietnam. Coffee was up 35.72%. Cotton prices bounced from last year, up 8.75%. The only commodity in the “soft” category which did not move higher was cocoa. Ample supplies, mainly from the key growing regions of Africa, pressured cocoa prices lower, down (16.08%) for the year.
At the close of October 2016, the Fund maintained a slight overweight bias toward energy and precious metals while the agricultural sector was underweighted by similar amounts. We kept the weighting of our industrial metals at or very close to our neutral weighting within the portfolio. Roughly, we allocated 42% toward energy, 36% in agriculture, 13% in industrial metals, and 9% in precious metals.
The US Dollar strengthened modestly during the year ending in October, up 1.54% as measured by the US Dollar Index (DXY). Since most commodities are priced in Dollars, commodity prices tend to be inversely related to Dollar moves. Because of this tendency, the positive results for many commodities this year is particularly noteworthy. Our opinion is that commodity supply/demand fundamentals are becoming more important than contributing factors including the strength of the US Dollar or interest rates.
The Fund’s top equity holdings at the end of October 2016 included Yara International (YAR NO) (19.94%) YTD, Cal-Maine Foods (CALM) (14.55%) YTD, Sanderson Farms Inc (SAFM) 18.46% YTD, Monsanto (MON) 4.61% YTD, CIA Saneamento Basico De-ADR (SBS) 131.13% YTD, Marine Harvest NO (MHG NO) 31.55 % YTD, Hormel Foods Corp. (HRL) (1.55%) YTD, Inpex Corp (1605 JP) (15.12%) YTD, Sociedad Quimica Minera de Chile (SQM) 58.63% YTD, Syngenta (SYNN VX) +3.69%YTD
U.S. Treasury Inflation Protected Bonds or TIPS and nominal US Treasuries are held by the fund to invest excess cash and as collateral for commodity futures related investments held in our Cayman Island subsidiary. Nominal yields on the benchmark 10 year note were at 2.14% at the end of October 2015 and ended the twelve month period lower, 1.83%. Committee members of the FOMC, including Chair Yellen, have recently voiced their desire to begin to raise and to attempt to normalize interest rates, if certain data justifies the move. We believe we may be nearing the end of what has been a significant multi-year rally in US treasury prices. As a result, we continue to invest in TIPS with limited duration exposure. At the end of October, our weighted average maturity was approximately 0.9 years in our TIPS and nominal US Treasury portfolio.
19 | October 31, 2016
ALPS | CoreCommodity Management
CompleteCommodities® Strategy Fund
| Management Commentary | October 31, 2016 (Unaudited) |
We strongly believe that the long term fundamental drivers of commodity demand and ultimately higher prices are still in place. Population growth is likely to remain unabated regardless of the economic environment in the US and Europe. A billion more people are likely to be added to the world population over the next decade or so. The trend of wealth distribution is tipping toward the developing world as those economies grow at faster rates relative to the slow or negative growth occurring in the developed countries. The improving global quality of life is contributing to ever increasing demand for raw materials and food. Incremental gains in disposable income in the developing nations have led to competition for the commodities needed for more complex and costly lifestyles.
The recent significant decline in prices of many commodities has resulted in serious curtailment of capital expenditures of global sovereign and corporate producers. Profits for these producers have been dramatically reduced and in some cases prices do not support marginal or ongoing operations. As a result, future supplies may be negatively impacted. In a world with limited supplies of food, fuel, building materials, and other necessities of life, price may become the ultimate allocator of these commodities. Additionally, the aggressively accommodative central bank monetary policies recently announced coupled with measures already in place globally are likely to make commodities and other real assets more attractive over time as currencies, including the US Dollar, may decline in value.
Robert Hyman
Portfolio Manager
The Bloomberg Commodity Spot Index (BCOMSP) measures the price movements of commodities included in the Bloomberg CI and select subindexes. It does not account for the effects of rolling futures contracts or the costs associated with holding physical commodities.
The Standard & Poor’s Global Natural Resources Index includes 90 of the largest publicly-traded companies in natural resources and commodities businesses that meet specific investability requirements, offering investors diversified and investable equity exposure across 3 primary commodity-related sectors: agribusiness, energy, and metals & mining.
The Standard & Poor’s 500® Index is a composite index of 500 stocks, a widely recognized, unmanaged index of common stock prices which does not reflect any deduction for fees, expenses, or taxes.
An investor may not invest directly in an index.
The views of the author and information discussed in this commentary are as of the date of publication, are subject to change, and may not reflect the writer's current views. The views expressed are those of the author only, and represent an assessment of market conditions at a specific point in time, are opinions only and should not be relied upon as investment advice regarding a particular investment or markets in general. Such information does not constitute a recommendation to buy or sell specific securities or investment vehicles. It should not be assumed that any investment will be profitable or will equal the performance of the fund(s) or any securities or any sectors mentioned in this letter. The subject matter contained in this letter has been derived from several sources believed to be reliable and accurate at the time of compilation. Neither ALPS Advisors, Inc., CoreCommodity Management, LLC, nor the Fund accepts any liability for losses either direct or consequential caused by the use of this information.
Diversification cannot guarantee gain or prevent losses.
20 | October 31, 2016
ALPS | CoreCommodity Management
CompleteCommodities® Strategy Fund
| Performance Update | October 31, 2016 (Unaudited) |
Performance of $10,000 Initial Investment (as of October 31, 2016)
Comparison of change in value of a $10,000 investment (includes maximum sales charges of 5.50%)
The chart above represents historical performance of a hypothetical investment of $10,000 in the Fund since inception. Past performance does not guarantee future results. This chart does not reflect the deduction of taxes that a shareholder would pay on Fund distributions or the redemption of Fund shares.
Average Annual Total Returns (as of October 31, 2016)
| | 6 Month | 1 Year | 3 Year | 5 Year | Since Inception^ | Total Expense Ratio | What You Pay* |
| Class A (NAV) | 0.55% | 1.96% | -10.39% | -8.51% | -2.78% | 1.47% | 1.45% |
| Class A (MOP) | -4.95% | -3.70% | -12.06% | -9.55% | -3.64% |
| Class C (NAV) | 0.28% | 1.29% | -10.94% | -9.09% | -3.35% | 2.07% | 2.05% |
| Class C (CDSC) | -0.72% | 0.29% | -10.94% | -9.09% | -3.35% |
| Class I | 0.83% | 2.24% | -10.08% | -8.23% | -2.48% | 1.17% | 1.15% |
TR/CC CRB Total Return Index1 | 1.06% | -4.50% | -12.38% | -10.16% | -4.81% | | |
Bloomberg Commodity TR Index1 | -0.57% | -2.62% | -12.05% | -10.61% | -5.74% | | |
Performance data quoted represents past performance. Past performance does not guarantee future results. Investment return and principal value of an investment will fluctuate so that an investor's shares, when sold or redeemed, may be worth more or less than the original cost. Current performance data may be higher or lower than actual data quoted. For the most current month-end performance data, please call 1-866-759-5679.
Maximum Offering Price (MOP) for Class A shares includes the Fund’s maximum sales charge of 5.50%. Performance shown at NAV does not include these sales charges and would have been lower had it been taken into account. If you invest $1 million or more, either as a lump sum or through the Fund’s accumulation or letter of intent programs, you can purchase Class A shares without an initial sales charge (load). A Contingent Deferred Sales Charge (“CDSC”) of 1.00% may apply to Class C shares redeemed within the first 12 months after a purchase, and on Class A shares redeemed within the first 18 months after a purchase in excess of $1 million. The Fund imposes a 2.00% redemption fee on shares held for less than 30 days.
Performance less than 1 year is cumulative.
21 | October 31, 2016
ALPS | CoreCommodity Management
CompleteCommodities® Strategy Fund
| Performance Update | October 31, 2016 (Unaudited) |
1 | Thomson Reuters/CC CRB Total Return Index and the Bloomberg Commodity TR Index (formerly the Dow Jones-UBS Commodity Index) are unmanaged indices used as a measurement of change in commodity market conditions based on the performance of a basket of different commodities. Each index is composed of a different basket of commodities, a different weighting of the commodities in the basket, and a different re-balancing schedule. The indices are not actively managed and do not reflect any deduction for fees, expenses or taxes. An investor may not invest directly in an index. |
^ | Fund Inception date of June 29, 2010. |
| * | What You Pay reflects the Advisor’s decision to contractually limit expenses through February 28, 2017. Please see the prospectus for additional information. |
Investments in securities of MLPs involve risks that differ from an investment in common stock. MLPs are controlled by their general partners, which generally have conflicts of interest and limited fiduciary duties to the MLP, which may permit the general partner to favor its own interests over the MLPs. The benefit you are expected to derive from the Fund’s investment in MLPs depends largely on the MLPs being treated as partnerships for federal income tax purposes. As a partnership, an MLP has no federal income tax liability at the entity level. Therefore, treatment of one or more MLPs as a corporation for federal income tax purposes could affect the Fund’s ability to meet its investment objective and would reduce the amount of cash available to pay or distribute to you. Legislative, judicial, or administrative changes and differing interpretations, possibly on a retroactive basis, could negatively impact the value of an investment in MLPs and therefore the value of your investment in the Fund.
Investing in commodity-related securities involves risk and considerations not present when investing in more conventional securities. The Fund may be more susceptible to high volatility of commodity markets.
Derivatives generally are more sensitive to changes in economic or market conditions than other types of investments; this could result in losses that significantly exceed the Fund's original investment.
The table does not reflect the deduction of taxes that a shareholder would pay on Fund distributions or the redemption of Fund shares.
This Fund is not suitable for all investors, and is subject to investment risks, including possible loss of the principal amount invested.
There is no guarantee that the Fund will continue to hold any one particular security or stay invested in any one particular company. The composition of the Fund's top holdings is subject to change. Performance figures are historical and reflect the change in share price, reinvested distributions, changes in net asset value, sales charges and capital gains distributions, if any.
Not FDIC Insured – No Bank Guarantee – May Lose Value
Asset Type Allocation (as a % of Net Assets)†
| Government Bonds | 62.95% |
| Common Stocks | 27.44% |
| Master Limited Partnerships | 0.22% |
| Warrants | 0.00% |
| Short Term Investments and Other Assets | 9.39% |
| Total | 100.00% |
† | Holdings are subject to change, and may not reflect the current or future position of the portfolio. Table presents approximate values only. |
22 | October 31, 2016
ALPS | CoreCommodity Management
CompleteCommodities® Strategy Fund
| Consolidated Statement of Investments | October 31, 2016 |
| | | Shares | | | Value (Note 2) | |
| COMMON STOCKS (27.44%) | | | | | | |
| Argentina (0.17%) | | | | | | |
Adecoagro SA(a) | | | 42,714 | | | $ | 469,854 | |
| YPF SA, Sponsored ADR | | | 21,316 | | | | 378,572 | |
| | | | | | | | 848,426 | |
| | | | | | | | | |
| Australia (1.25%) | | | | | | | | |
| Alumina, Ltd. | | | 306,469 | | | | 368,347 | |
| BHP Billiton, Ltd. | | | 3,582 | | | | 62,862 | |
| BlueScope Steel, Ltd. | | | 27,028 | | | | 160,370 | |
| Fortescue Metals Group, Ltd. | | | 71,255 | | | | 298,120 | |
| GrainCorp, Ltd., Class A | | | 65,827 | | | | 420,627 | |
| Iluka Resources, Ltd. | | | 60,429 | | | | 265,237 | |
| Incitec Pivot, Ltd. | | | 199,218 | | | | 447,058 | |
| Independence Group NL | | | 77,396 | | | | 250,219 | |
| Newcrest Mining, Ltd. | | | 2,493 | | | | 42,783 | |
| Northern Star Resources, Ltd. | | | 104,622 | | | | 331,077 | |
| Nufarm, Ltd. | | | 97,624 | | | | 657,966 | |
| Oil Search, Ltd. | | | 8,556 | | | | 43,347 | |
| OZ Minerals, Ltd. | | | 79,710 | | | | 406,257 | |
| Regis Resources, Ltd. | | | 42,843 | | | | 105,920 | |
| Rio Tinto, Ltd. | | | 15,101 | | | | 622,383 | |
| South32, Ltd. | | | 276,844 | | | | 541,230 | |
St Barbara, Ltd.(a) | | | 119,176 | | | | 238,428 | |
| Woodside Petroleum, Ltd. | | | 47,197 | | | | 1,018,561 | |
| | | | | | | | 6,280,792 | |
| | | | | | | | | |
| Austria (0.15%) | | | | | | | | |
| OMV AG | | | 15,986 | | | | 499,697 | |
| Voestalpine AG | | | 6,748 | | | | 238,748 | |
| | | | | | | | 738,445 | |
| | | | | | | | | |
| Bermuda (0.10%) | | | | | | | | |
Kosmos Energy, Ltd.(a) | | | 67,844 | | | | 353,468 | |
| Nabors Industries, Ltd. | | | 11,916 | | | | 141,800 | |
| | | | | | | | 495,268 | |
| | | | | | | | | |
| Brazil (0.78%) | | | | | | | | |
| BRF SA, ADR | | | 83,747 | | | | 1,400,250 | |
| Cia de Saneamento Basico do Estado de Sao Paulo, ADR | | | 210,386 | | | | 2,213,260 | |
| Vale SA, Sponsored ADR | | | 42,979 | | | | 297,415 | |
| | | | | | | | 3,910,925 | |
| | | | | | | | | |
| Canada (4.02%) | | | | | | | | |
Advantage Oil & Gas, Ltd.(a) | | | 35,400 | | | | 238,850 | |
Agnico‐Eagle Mines, Ltd. | | | 8,624 | | | | 438,099 | |
| Agrium, Inc. | | | 3,115 | | | | 286,019 | |
| Alamos Gold, Inc., Class A | | | 25,182 | | | | 197,679 | |
| ARC Resources, Ltd. | | | 40,787 | | | | 692,403 | |
| Barrick Gold Corp. | | | 5,870 | | | | 103,253 | |
Baytex Energy Corp.(a) | | | 74,800 | | | | 287,757 | |
Birchcliff Energy, Ltd.(a) | | | 25,600 | | | | 162,994 | |
| Cameco Corp. | | | 27,826 | | | | 214,260 | |
| Canadian Natural Resources, Ltd. | | | 14,848 | | | | 470,830 | |
Canadian Solar, Inc.(a) | | | 2,763 | | | | 39,898 | |
| | | Shares | | | Value (Note 2) | |
| Canada (continued) | | | | | | |
| Cenovus Energy, Inc. | | | 83,500 | | | $ | 1,204,595 | |
| Centerra Gold, Inc. | | | 106,000 | | | | 535,809 | |
| Crescent Point Energy Corp. | | | 75,078 | | | | 893,906 | |
| Dominion Diamond Corp. | | | 21,401 | | | | 182,123 | |
Eldorado Gold Corp.(a) | | | 20,618 | | | | 65,153 | |
| Encana Corp. | | | 8,286 | | | | 79,048 | |
| Enerplus Corp. | | | 54,700 | | | | 368,255 | |
| Ensign Energy Services, Inc. | | | 27,700 | | | | 167,071 | |
First Majestic Silver Corp.(a) | | | 8,644 | | | | 69,584 | |
| First Quantum Minerals, Ltd. | | | 43,300 | | | | 411,274 | |
Franco‐Nevada Corp. | | | 506 | | | | 33,123 | |
| Freehold Royalties, Ltd. | | | 22,900 | | | | 215,120 | |
| Goldcorp, Inc. | | | 23,499 | | | | 357,185 | |
Guyana Goldfields, Inc.(a) | | | 10,300 | | | | 60,588 | |
| HudBay Minerals, Inc. | | | 38,900 | | | | 163,860 | |
Husky Energy, Inc.(a) | | | 66,913 | | | | 719,865 | |
IAMGOLD Corp.(a) | | | 77,368 | | | | 310,246 | |
| Imperial Oil, Ltd. | | | 25,700 | | | | 833,482 | |
Kirkland Lake Gold, Inc.(a) | | | 9,200 | | | | 63,789 | |
Lundin Mining Corp.(a) | | | 50,600 | | | | 198,054 | |
| Mullen Group, Ltd. | | | 20,800 | | | | 288,282 | |
New Gold, Inc.(a) | | | 47,087 | | | | 186,465 | |
| OceanaGold Corp. | | | 160,500 | | | | 490,606 | |
| Osisko Gold Royalties, Ltd. | | | 29,369 | | | | 309,170 | |
Parex Resources, Inc.(a) | | | 43,000 | | | | 494,662 | |
| Pason Systems, Inc. | | | 13,400 | | | | 152,352 | |
| Peyto Exploration & Development Corp. | | | 34,600 | | | | 888,926 | |
| Potash Corp. of Saskatchewan, Inc. | | | 5,216 | | | | 84,916 | |
| PrairieSky Royalty, Ltd. | | | 18,136 | | | | 394,416 | |
| Precision Drilling Corp. | | | 89,606 | | | | 398,747 | |
Pretium Resources, Inc.(a) | | | 28,723 | | | | 281,198 | |
Raging River Exploration, Inc.(a) | | | 83,800 | | | | 671,625 | |
| Secure Energy Services, Inc. | | | 42,200 | | | | 258,618 | |
SEMAFO, Inc.(a) | | | 124,800 | | | | 489,412 | |
Seven Generations Energy, Ltd., Class A(a) | 20,800 | | | | 443,510 | |
| ShawCor, Ltd. | | | 12,700 | | | | 317,666 | |
Silver Standard Resources, Inc.(a) | | | 7,693 | | | | 84,315 | |
| Silver Wheaton Corp. | | | 7,341 | | | | 176,992 | |
| Suncor Energy, Inc. | | | 22,430 | | | | 673,084 | |
| Tahoe Resources, Inc. | | | 1,300 | | | | 15,585 | |
| TORC Oil & Gas, Ltd. | | | 40,900 | | | | 231,440 | |
Tourmaline Oil Corp.(a) | | | 23,600 | | | | 618,460 | |
Turquoise Hill Resources, Ltd.(a) | | | 71,705 | | | | 222,286 | |
| Vermilion Energy, Inc. | | | 30,800 | | | | 1,207,842 | |
| Whitecap Resources, Inc. | | | 74,400 | | | | 594,623 | |
| Yamana Gold, Inc. | | | 16,330 | | | | 58,135 | |
| | | | | | | | 20,097,505 | |
| | | | | | | | | |
| Chile (0.34%) | | | | | | | | |
| Sociedad Quimica y Minera de Chile SA, Sponsored ADR | | | 58,982 | | | | 1,725,813 | |
23 | October 31, 2016
ALPS | CoreCommodity Management
CompleteCommodities® Strategy Fund
| Consolidated Statement of Investments | October 31, 2016 |
| | | Shares | | | Value (Note 2) | |
| China (0.40%) | | | | | | |
| China Petroleum & Chemical Corp., Class H | | | 528,358 | | | $ | 384,914 | |
| CNOOC, Ltd., Sponsored ADR | | | 10,234 | | | | 1,284,163 | |
| PetroChina Co., Ltd., ADR | | | 4,087 | | | | 276,813 | |
Trina Solar, Ltd., Sponsored ADR(a) | | | 3,830 | | | | 39,755 | |
| | | | | | | | 1,985,645 | |
| | | | | | | | | |
| Colombia (0.13%) | | | | | | | | |
Ecopetrol SA, Sponsored ADR(a) | | | 76,906 | | | | 668,313 | |
| | | | | | | | | |
| Denmark (0.05%) | | | | | | | | |
| FLSmidth & Co. A/S | | | 6,011 | | | | 218,411 | |
| Vestas Wind Systems A/S | | | 500 | | | | 40,106 | |
| | | | | | | | 258,517 | |
| | | | | | | | | |
| Finland (0.14%) | | | | | | | | |
| Kemira OYJ | | | 14,463 | | | | 172,422 | |
Outokumpu OYJ(a) | | | 47,601 | | | | 331,813 | |
Outotec OYJ(a) | | | 43,438 | | | | 189,210 | |
| | | | | | | | 693,445 | |
| | | | | | | | | |
| France (0.11%) | | | | | | | | |
| TOTAL SA, Sponsored ADR | | | 12,028 | | | | 574,217 | |
| | | | | | | | | |
| Germany (0.36%) | | | | | | | | |
| Aurubis AG | | | 2,871 | | | | 149,356 | |
| K+S AG | | | 63,862 | | | | 1,292,027 | |
| Salzgitter AG | | | 10,429 | | | | 342,308 | |
| SMA Solar Technology AG | | | 1,556 | | | | 39,918 | |
| | | | | | | | 1,823,609 | |
| | | | | | | | | |
| Great Britain (0.24%) | | | | | | | | |
| Amec Foster Wheeler PLC | | | 48,174 | | | | 263,692 | |
| Ensco PLC, Class A | | | 9,480 | | | | 74,134 | |
| John Wood Group PLC | | | 38,450 | | | | 361,912 | |
| Royal Dutch Shell PLC, Class A, Sponsored ADR | | | 5,456 | | | | 271,763 | |
| Royal Dutch Shell PLC, Class B | | | 7,957 | | | | 205,988 | |
| | | | | | | | 1,177,489 | |
| | | | | | | | | |
| Israel (0.01%) | | | | | | | | |
SolarEdge Technologies, Inc.(a) | | | 3,015 | | | | 41,306 | |
| | | | | | | | | |
| Italy (0.04%) | | | | | | | | |
| Eni SpA, Sponsored ADR | | | 6,695 | | | | 194,691 | |
| | | | | | | | | |
| Japan (2.63%) | | | | | | | | |
| Daido Steel Co., Ltd. | | | 46,000 | | | | 195,633 | |
| GS Yuasa Corp. | | | 85,000 | | | | 367,979 | |
| Hitachi Metals, Ltd. | | | 59,400 | | | | 743,137 | |
| Inpex Corp. | | | 190,433 | | | | 1,789,747 | |
| Japan Petroleum Exploration Co., Ltd. | | | 10,600 | | | | 233,186 | |
| Kubota Corp. | | | 69,800 | | | | 1,127,835 | |
| Kurita Water Industries, Ltd. | | | 55,816 | | | | 1,323,689 | |
| | | Shares | | | Value (Note 2) | |
| Japan (continued) | | | | | | |
| Maruichi Steel Tube, Ltd. | | | 7,700 | | | $ | 248,541 | |
| Megmilk Snow Brand Co., Ltd. | | | 26,200 | | | | 913,140 | |
| Mitsubishi Materials Corp. | | | 16,600 | | | | 477,248 | |
| Nihon Nohyaku Co., Ltd. | | | 171,800 | | | | 940,338 | |
| Nippon Light Metal Holdings Co., Ltd. | | | 156,900 | | | | 357,577 | |
| Nippon Steel & Sumitomo Metal Corp. | | | 33,400 | | | | 661,981 | |
| Nippon Suisan Kaisha, Ltd. | | | 161,500 | | | | 777,701 | |
| Nisshin Steel Co., Ltd. | | | 29,000 | | | | 385,763 | |
Osaka Titanium Technologies Co., Ltd.(a) | | | 8,500 | | | | 114,041 | |
| Sakata Seed Corp. | | | 8,700 | | | | 250,954 | |
| Sumitomo Forestry Co., Ltd. | | | 57,259 | | | | 799,344 | |
| Sumitomo Metal Mining Co., Ltd. | | | 53,000 | | | | 687,074 | |
| Toho Titanium Co., Ltd. | | | 16,600 | | | | 110,962 | |
| Tokyo Steel Manufacturing Co., Ltd. | | | 69,700 | | | | 483,188 | |
| Yamato Kogyo Co., Ltd. | | | 6,700 | | | | 188,919 | |
| | | | | | | | 13,177,977 | |
| | | | | | | | | |
| Jersey (0.08%) | | | | | | | | |
| Petrofac, Ltd. | | | 12,709 | | | | 125,458 | |
| Randgold Resources, Ltd., ADR | | | 2,883 | | | | 255,808 | |
| | | | | | | | 381,266 | |
| | | | | | | | | |
| Luxembourg (0.46%) | | | | | | | | |
| APERAM SA | | | 9,087 | | | | 412,926 | |
ArcelorMittal(a) | | | 82,887 | | | | 558,492 | |
Subsea 7 SA(a) | | | 41,346 | | | | 463,884 | |
| Tenaris SA, ADR | | | 14,101 | | | | 397,648 | |
| Ternium SA, Sponsored ADR | | | 20,283 | | | | 484,967 | |
| | | | | | | | 2,317,917 | |
| | | | | | | | | |
| Mexico (0.18%) | | | | | | | | |
| Grupo Lala SAB de CV | | | 286,300 | | | | 532,429 | |
| Grupo Mexico SAB de CV, Series B | | | 101,283 | | | $ | 248,639 | |
| Industrias Penoles SAB de CV | | | 4,967 | | | | 120,161 | |
| | | | | | | | 901,229 | |
| | | | | | | | | |
| Netherlands (0.51%) | | | | | | | | |
| Core Laboratories N.V. | | | 9,180 | | | | 890,184 | |
| Frank's International N.V. | | | 36,103 | | | | 406,159 | |
Fugro N.V.(a) | | | 9,795 | | | | 175,050 | |
OCI N.V.(a) | | | 56,682 | | | | 787,117 | |
| SBM Offshore N.V. | | | 21,375 | | | | 307,032 | |
| | | | | | | | 2,565,542 | |
| | | | | | | | | |
| Norway (1.92%) | | | | | | | | |
| Bakkafrost P/F | | | 16,496 | | | | 691,996 | |
DNO ASA(a) | | | 295,286 | | | | 253,030 | |
| Leroy Seafood Group ASA | | | 5,585 | | | | 295,326 | |
| Marine Harvest ASA | | | 116,099 | | | | 2,106,331 | |
| Norsk Hydro ASA | | | 142,748 | | | | 638,382 | |
| Salmar ASA | | | 7,169 | | | | 232,709 | |
24 | October 31, 2016
ALPS | CoreCommodity Management
CompleteCommodities® Strategy Fund
| Consolidated Statement of Investments | October 31, 2016 |
| | | Shares | | | Value (Note 2) | |
| Norway (continued) | | | | | | |
| Statoil ASA | | | 80,887 | | | $ | 1,325,543 | |
| TGS Nopec Geophysical Co. ASA | | | 35,976 | | | | 729,330 | |
| Yara International ASA | | | 94,184 | | | | 3,328,561 | |
| | | | | | | | 9,601,208 | |
| | | | | | | | | |
| Peru (0.01%) | | | | | | | | |
Cia de Minas Buenaventura SAA, ADR(a) | 3,634 | | | | 48,296 | |
| | | | | | | | | |
| Russia (0.03%) | | | | | | | | |
PhosAgro PJSC, GDR(b) | | | 10,953 | | | | 135,817 | |
| | | | | | | | | |
| Singapore (0.29%) | | | | | | | | |
| First Resources, Ltd. | | | 102,200 | | | | 133,696 | |
InterOil Corp.(a) | | | 7,363 | | | | 365,352 | |
| Wilmar International, Ltd. | | | 393,961 | | | | 937,294 | |
| | | | | | | | 1,436,342 | |
| | | | | | | | | |
| South Africa (0.23%) | | | | | | | | |
| Gold Fields, Ltd., Sponsored ADR | | | 9,187 | | | | 38,126 | |
| Harmony Gold Mining Co., Ltd., Sponsored ADR | | | 85,537 | | | | 271,152 | |
Impala Platinum Holdings, Ltd.(a) | | | 40,468 | | | | 162,667 | |
| Sasol, Ltd. | | | 13,813 | | | | 383,563 | |
| Sibanye Gold, Ltd., Sponsored ADR | | | 28,449 | | | | 318,629 | |
| | | | | | | | 1,174,137 | |
| | | | | | | | | |
| South Korea (0.10%) | | | | | | | | |
| POSCO, Sponsored ADR | | | 9,804 | | | | 509,318 | |
| | | | | | | | | |
| Spain (0.08%) | | | | | | | | |
| Acerinox SA | | | 32,019 | | | | 394,370 | |
| | | | | | | | | |
| Sweden (0.22%) | | | | | | | | |
| Boliden AB | | | 16,984 | | | | 393,567 | |
| Holmen AB, B Shares | | | 8,912 | | | | 305,087 | |
Lundin Petroleum AB(a) | | | 16,470 | | | | 296,316 | |
SSAB AB, A Shares(a) | | | 41,117 | | | | 130,332 | |
| | | | | | | | 1,125,302 | |
| | | | | | | | | |
| Switzerland (0.46%) | | | | | | | | |
| Noble Corp. PLC | | | 62,588 | | | | 309,185 | |
| Syngenta AG | | | 4,200 | | | | 1,679,066 | |
Transocean, Ltd.(a) | | | 23,836 | | | | 229,064 | |
Weatherford International, Ltd.(a) | | | 20,498 | | | | 98,800 | |
| | | | | | | | 2,316,115 | |
| | | | | | | | | |
| United Kingdom (0.50%) | | | | | | | | |
| Antofagasta PLC | | | 49,329 | | | | 327,857 | |
| BP PLC, Sponsored ADR | | | 21,309 | | | | 757,535 | |
| Severn Trent PLC | | | 23,599 | | | | 672,447 | |
| United Utilities Group PLC | | | 64,416 | | | | 741,145 | |
| | | | | | | | 2,498,984 | |
| | | Shares | | | Value (Note 2) | |
| United States (11.45%) | | | | | | |
| AGCO Corp. | | | 11,495 | | | $ | 587,165 | |
| Alcoa Corp. | | | 7,300 | | | | 209,656 | |
| Allegheny Technologies, Inc. | | | 21,476 | | | | 292,933 | |
| American States Water Co. | | | 16,874 | | | | 674,623 | |
| American Water Works Co., Inc. | | | 4,311 | | | | 319,186 | |
| The Andersons, Inc. | | | 13,426 | | | | 510,859 | |
Antero Resources Corp.(a) | | | 19,409 | | | | 513,756 | |
| Apache Corp. | | | 4,465 | | | | 265,578 | |
| Aqua America, Inc. | | | 20,024 | | | | 614,737 | |
Archer‐Daniels‐Midland Co. | | | 36,182 | | | | 1,576,450 | |
| Baker Hughes, Inc. | | | 11,373 | | | | 630,064 | |
| Bunge, Ltd. | | | 3,097 | | | | 192,045 | |
| Cabot Oil & Gas Corp. | | | 24,828 | | | | 518,409 | |
| Calgon Carbon Corp. | | | 32,061 | | | | 506,564 | |
| California Water Service Group | | | 17,510 | | | | 542,810 | |
Callon Petroleum Co.(a) | | | 29,600 | | | | 384,504 | |
Cal‐Maine Foods, Inc. | | | 78,193 | | | | 3,022,159 | |
| Carpenter Technology Corp. | | | 11,547 | | | | 365,001 | |
Carrizo Oil & Gas, Inc.(a) | | | 11,034 | | | | 373,280 | |
| CF Industries Holdings, Inc. | | | 25,659 | | | | 616,073 | |
| Chevron Corp. | | | 11,652 | | | | 1,220,547 | |
| Commercial Metals Co. | | | 24,641 | | | | 387,110 | |
| ConocoPhillips | | | 18,136 | | | | 788,009 | |
Continental Resources, Inc.(a) | | | 143 | | | | 6,994 | |
| CST Brands, Inc. | | | 1,278 | | | | 61,370 | |
Darling Ingredients, Inc.(a) | | | 18,472 | | | | 251,219 | |
| Deere & Co. | | | 3,889 | | | | 343,399 | |
| Devon Energy Corp. | | | 5,560 | | | | 210,668 | |
| Diamond Offshore Drilling, Inc. | | | 3,190 | | | | 52,603 | |
Diamondback Energy, Inc.(a) | | | 2,929 | | | | 267,388 | |
Dril‐Quip, Inc.(a) | | | 25,469 | | | | 1,209,778 | |
| Energen Corp. | | | 98 | | | | 4,913 | |
Energy Recovery, Inc.(a) | | | 23,275 | | | | 284,188 | |
| EOG Resources, Inc. | | | 3,824 | | | | 345,766 | |
| EQT Corp. | | | 6,352 | | | | 419,232 | |
| Exxon Mobil Corp. | | | 15,891 | | | | 1,324,038 | |
First Solar, Inc.(a) | | | 5,422 | | | | 219,537 | |
| FMC Corp. | | | 6,886 | | | | 322,885 | |
FMC Technologies, Inc.(a) | | | 41,461 | | | | 1,337,946 | |
Forum Energy Technologies, Inc.(a) | | | 46,952 | | | | 845,136 | |
| Halliburton Co. | | | 564 | | | | 25,944 | |
| Harsco Corp. | | | 20,191 | | | | 196,862 | |
Helix Energy Solutions Group, Inc.(a) | | | 17,247 | | | | 150,394 | |
| Helmerich & Payne, Inc. | | | 14,838 | | | | 936,426 | |
| HollyFrontier Corp. | | | 28,340 | | | | 707,083 | |
| Hormel Foods Corp. | | | 48,331 | | | | 1,860,744 | |
| Ingredion, Inc. | | | 6,254 | | | | 820,337 | |
| Joy Global, Inc. | | | 33,712 | | | | 938,205 | |
| Kaiser Aluminum Corp. | | | 4,013 | | | | 290,902 | |
| Kinder Morgan, Inc. | | | 5,763 | | | | 117,738 | |
Laredo Petroleum, Inc.(a) | | | 39,853 | | | | 475,048 | |
| Lindsay Corp. | | | 11,998 | | | | 939,443 | |
| Marathon Oil Corp. | | | 9,588 | | | | 126,370 | |
| Marathon Petroleum Corp. | | | 31,343 | | | | 1,366,241 | |
Matador Resources Co.(a) | | | 18,153 | | | | 395,917 | |
25 | October 31, 2016
ALPS | CoreCommodity Management
CompleteCommodities® Strategy Fund
| Consolidated Statement of Investments | October 31, 2016 |
| | | Shares | | | Value (Note 2) | |
| United States (continued) | | | | | | |
McDermott International, Inc.(a) | | | 76,972 | | | $ | 395,636 | |
| Monsanto Co. | | | 23,924 | | | | 2,410,821 | |
| The Mosaic Co. | | | 62,092 | | | | 1,461,025 | |
| Murphy Oil Corp. | | | 12,189 | | | | 315,329 | |
| National Oilwell Varco, Inc. | | | 7,643 | | | | 245,340 | |
| Newmont Mining Corp. | | | 11,892 | | | | 440,480 | |
| Noble Energy, Inc. | | | 8,741 | | | | 301,302 | |
| Nucor Corp. | | | 7,865 | | | | 384,205 | |
| Occidental Petroleum Corp. | | | 6,683 | | | | 487,258 | |
| Oceaneering International, Inc. | | | 38,357 | | | | 912,897 | |
Oil States International, Inc.(a) | | | 27,984 | | | | 818,532 | |
Parsley Energy, Inc., Class A(a) | | | 13,039 | | | | 428,983 | |
Patterson‐UTI Energy, Inc. | | | 17,623 | | | | 396,165 | |
PDC Energy, Inc.(a) | | | 11,603 | | | | 711,612 | |
| Phillips 66 | | | 10,779 | | | | 874,716 | |
| Pilgrim's Pride Corp. | | | 73,378 | | | | 1,602,576 | |
| Pioneer Natural Resources Co. | | | 1,605 | | | | 287,327 | |
| Potlatch Corp. REIT | | | 27,411 | | | | 1,052,582 | |
| QEP Resources, Inc. | | | 16,190 | | | | 260,173 | |
| Range Resources Corp. | | | 13,412 | | | | 453,191 | |
| Rayonier, Inc. REIT | | | 30,571 | | | | 819,914 | |
Rice Energy, Inc.(a) | | | 16,471 | | | | 363,844 | |
| Rowan Cos. PLC, Class A | | | 46,249 | | | | 613,724 | |
| Royal Gold, Inc. | | | 1,475 | | | | 101,510 | |
RPC, Inc.(a) | | | 39,059 | | | | 674,549 | |
RSP Permian, Inc.(a) | | | 273 | | | | 9,855 | |
| Sanderson Farms, Inc. | | | 28,858 | | | | 2,596,643 | |
| Schlumberger, Ltd. | | | 10,251 | | | | 801,936 | |
| Southern Copper Corp. | | | 32,148 | | | | 912,682 | |
Southwestern Energy Co.(a) | | | 12,696 | | | | 131,911 | |
| Steel Dynamics, Inc. | | | 21,010 | | | | 576,935 | |
Stillwater Mining Co.(a) | | | 20,552 | | | | 273,753 | |
| Superior Energy Services, Inc. | | | 13,527 | | | | 191,542 | |
Synergy Resources Corp.(a) | | | 41,496 | | | | 283,833 | |
| Tyson Foods, Inc., Class A | | | 6,327 | | | | 448,268 | |
| Valero Energy Corp. | | | 20,330 | | | | 1,204,349 | |
Walter Energy, Inc.(a) | | | 68,768 | | | | 4,126 | |
| Weyerhaeuser Co. REIT | | | 22,846 | | | | 683,781 | |
| Worthington Industries, Inc. | | | 6,412 | | | | 301,364 | |
WPX Energy, Inc.(a) | | | 3,396 | | | | 36,881 | |
| | | | | | | | 57,237,782 | |
| | | | | | | | | |
TOTAL COMMON STOCKS (Cost $138,684,817) | | | | 137,336,008 | |
| | | | | | | | | |
| | | | | | | | | |
| MASTER LIMITED PARTNERSHIPS (0.22%) | | | | | |
| United States (0.22%) | | | | | | | | |
| Alliance Resource Partners LP | | | 14,363 | | | | 359,076 | |
| Buckeye Partners LP | | | 977 | | | | 63,056 | |
| Energy Transfer Partners LP | | | 2,591 | | | | 90,633 | |
| Enterprise Products Partners LP | | | 10,676 | | | | 269,462 | |
| Magellan Midstream Partners LP | | | 2,054 | | | | 138,090 | |
| MPLX LP | | | 1,555 | | | | 52,901 | |
| Plains All American Pipeline LP | | | 3,090 | | | | 93,812 | |
| | | Shares | | | Value (Note 2) | |
| United States (continued) | | | | | | |
| Williams Partners LP | | | 1,242 | | | $ | 44,488 | |
| | | | | | | | 1,111,518 | |
| | | | | | | | | |
TOTAL MASTER LIMITED PARTNERSHIPS
(Cost $1,410,976) | | 1,111,518 | |
| | | | | | | | | |
| WARRANTS (0.00%) | | | | | | | | |
| United States (0.00%) | | | | | | | | |
Hycroft Mining Corp., Expires 10/12/2022(c) | | | 2,912 | | | | 0 | |
| | | | | | | | | |
TOTAL WARRANTS
(Cost $134,050) | | 0 | |
| | | | | | | | | |
| | | Principal Amount | | | Value (Note 2) | |
| GOVERNMENT BONDS (62.95%) | | | | | | | | |
| U.S. Treasury Bonds (62.95%) | | | | | | | | |
| United States Treasury Inflation Indexed Bonds | | | | | |
2.375%, 1/15/17(d) | | $ | 11,465,184 | | | $ | 11,544,087 | |
0.125%, 4/15/17(d) | | | 30,221,115 | | | | 30,292,920 | |
2.625%, 7/15/17(d) | | | 16,791,912 | | | | 17,272,479 | |
| 1.625%, 1/15/18 | | | 11,496,400 | | | | 11,832,371 | |
| 0.125%, 4/15/19 | | | 74,416,340 | | | | 75,626,053 | |
| United States Treasury Notes | | | | | | | | |
| 0.875%, 11/30/16 | | | 28,900,000 | | | | 28,916,011 | |
1.000%, 3/31/17(d) | | | 41,400,000 | | | | 41,501,264 | |
0.750%, 6/30/17(d) | | | 60,000,000 | | | | 60,062,100 | |
0.750%, 1/31/18(d) | | | 38,000,000 | | | | 38,004,446 | |
| | | | | | | | 315,051,731 | |
| | | | | | | | | |
TOTAL GOVERNMENT BONDS
(Cost $315,104,312) | | 315,051,731 | |
| | | 7-Day Yield | | | Shares | | | Value (Note 2) | |
| SHORT TERM INVESTMENTS (8.89%) |
| Money Market Fund (8.89%) | | | | | | | |
| Dreyfus Treasury Prime Cash Management Fund, Institutional Shares | 0.204 | % | | | 44,477,175 | | | | 44,477,175 | |
| | | | | | | | | | | | | |
TOTAL SHORT TERM INVESTMENTS
(Cost $44,477,175) | | 44,477,175 | |
| | | | | | | | | | | | | |
TOTAL INVESTMENTS (99.50%)
(Cost $499,811,330) | $ | 497,976,432 | |
| | | | | | | | | | | | | |
Other Assets In Excess Of Liabilities (0.50%)(e) | | 2,491,936 | |
NET ASSETS ‐ 100.00% | $ | 500,468,368 | |
(a) | Non-Income Producing Security. |
26 | October 31, 2016
ALPS | CoreCommodity Management
CompleteCommodities® Strategy Fund
| Consolidated Statement of Investments | October 31, 2016 |
(b) | These securities initially sold to other parties pursuant to Regulation S under the 1933 Act and subsequently resold to the Fund. At period end, the aggregate market value of those securities was $135,817, representing 0.028% of the Fund's net assets. |
(c) | Fair valued security; valued by management in accordance with the procedures approved by the Fund’s Board of Trustees. As of October 31, 2016, these securities had a total value of $0 or 0.00% of total net assets. |
(d) | Security, or portion of security, is being held as collateral for total return swap contracts and futures contracts aggregating a total market value of $49,764,645. |
(e) | Includes cash which is being held as collateral for total return swap contracts in the amount of $32,120. |
For Fund compliance purposes, the Fund's industry and geographical classifications refer to any one or more of the industry sub-classifications used by one or more widely recognized market indexes or ratings group indexes, and/or as defined by Fund management. This definition may not apply for purposes of this report, which may combine sub-classifications for reporting ease. Industries and regions are shown as a percent of net assets.
See Notes to Financial Statements.
27 | October 31, 2016
ALPS | CoreCommodity Management
CompleteCommodities® Strategy Fund
| Consolidated Statement of Investments | October 31, 2016 |
FUTURES CONTRACTS
| Description | Position | Contracts | Expiration Date | | Value (Note 2) | | | Unrealized Appreciation | |
| Lean Hogs Future | Long | 37 | 12/14/16 | | $ | 709,660 | | | $ | 6,185 | |
| LME Copper Future | Long | 27 | 01/19/17 | | | 3,275,438 | | | | 122,871 | |
| LME Nickel Future | Long | 36 | 12/22/16 | | | 2,258,388 | | | | 146,506 | |
| LME Zinc Future | Long | 9 | 12/22/16 | | | 553,050 | | | | 53,438 | |
| WTI Crude Future | Short | (399) | 11/18/16 | | | (18,697,140 | ) | | | 1,502,634 | |
| | | | | | $ | (11,900,604 | ) | | $ | 1,831,634 | |
| Description | Position | Contracts | Expiration Date | | Value (Note 2) | | | Unrealized Depreciation | |
| Brent Crude Future | Long | 889 | 11/30/16 | | $ | 43,214,290 | | | $ | (2,431,169 | ) |
| Copper Future | Short | (55) | 12/28/16 | | | (3,031,875 | ) | | | (75,162 | ) |
| Gold 100 Oz Future | Long | 65 | 12/28/16 | | | 8,275,150 | | | | (187,924 | ) |
| Platinum Future | Long | 90 | 01/27/17 | | | 4,403,700 | | | | (247,356 | ) |
| Silver Future | Long | 54 | 12/28/16 | | | 4,804,920 | | | | (220,481 | ) |
| | | | | | $ | 57,666,185 | | | $ | (3,162,092 | ) |
See Notes to Financial Statements.
28 | October 31, 2016
ALPS | CoreCommodity Management
CompleteCommodities® Strategy Fund
| Consolidated Statement of Investments | October 31, 2016 |
TOTAL RETURN SWAP CONTRACTS(a)
| Swap Counterparty | Reference Obligation | Notional Dollars | | Floating Rate/Fixed Amount Paid by Fund | Termination Date | | Unrealized Appreciation | |
| Societe Generale | CRB 3m Fwd TR Index ** | | $ | 77,477,752 | | USB3MTA + 35 bps* | 6/30/2017 | | $ | 19,103 | |
| Bank of America ‐ Merrill Lynch | ML Aluminum GA6 | | | 8,035,562 | | USB3MTA + 10 bps* | 6/30/2017 | | | 227,401 | |
| Bank of America ‐ Merrill Lynch | ML eXtra Coffee GA6 | | | 3,198,548 | | USB3MTA + 10 bps* | 6/30/2017 | | | 261,015 | |
| | | | | | | | | | $ | 507,519 | |
| Swap Counterparty | Reference Obligation | Notional Dollars | | Floating Rate/Fixed Amount Paid by Fund | Termination Date | | Unrealized Appreciation | |
| Bank of America ‐ Merrill Lynch | MLCS Copper J‐F3 | | $ | (3,653,603 | ) | USB3MTA* | 6/30/2017 | | $ | 6,377 | |
| Bank of America ‐ Merrill Lynch | MLCS Silver J‐F3 | | | (1,338,954 | ) | USB3MTA* | 6/30/2017 | | | 97,669 | |
| | | | | | | | | | $ | 104,046 | |
| | | | | | | Total Appreciation | | $ | 611,565 | |
| Swap Counterparty | Reference Obligation | Notional Dollars | | Floating Rate/Fixed Amount Paid by Fund | Termination Date | Unrealized Depreciation | |
| UBS | CRB 3m Fwd TR Index ** | | $ | 30,075,087 | | USB3MTA + 32 bps* | 11/30/2016 | | $ | (105,459 | ) |
| Citigroup | CRB 3m Fwd TR Index ** | | | 110,496,752 | | USB3MTA + 27 bps* | 9/29/2017 | | | (36,446 | ) |
| Bank of America ‐ Merrill Lynch | CRB 3m Fwd TR Index ** | | | 98,035,584 | | USB3MTA + 35 bps* | 6/30/2017 | | | (49,169 | ) |
| Bank of America ‐ Merrill Lynch | ML eXtra Copper GA6 | | | 3,685,966 | | USB3MTA + 10 bps* | 6/30/2017 | | | (11,359 | ) |
| Bank of America ‐ Merrill Lynch | ML eXtra Silver GA6 | | | 1,347,302 | | USB3MTA + 10 bps* | 6/30/2017 | | | (99,990 | ) |
| | | | | | | | | | $ | (302,423 | ) |
| Swap Counterparty | Reference Obligation | Notional Dollars | | Floating Rate/Fixed Amount Paid by Fund | Termination Date | | Unrealized Depreciation | |
| Bank of America ‐ Merrill Lynch | MLCX Aluminum J‐F3 | | $ | (7,984,175 | ) | USB3MTA* | 6/30/2017 | | $ | (242,807 | ) |
| Bank of America ‐ Merrill Lynch | MLCS Coffee J‐F3 | | $ | (3,069,420 | ) | USB3MTA* | 6/30/2017 | | | (251,598 | ) |
| | | | | | | | | | $ | (494,405 | ) |
| | | | | | | Total Depreciation | | $ | (796,828 | ) |
| (a) | For long positions in the total return swap, the Fund receives payments based on any positive return of the Reference Obligation less the rate paid by the Fund. The Fund makes payments on any negative return of such Reference Obligations plus the rate paid by the fund. For short positions in the total return swap, the Fund makes payments based on any positive return of the Reference Obligation less the rate paid by the Fund. The Fund receives payments on any negative return of such Reference Obligations plus the rate paid by the Fund. |
| * | United States Auction Results 3 Month Treasury Bill High Discount |
| ** | CRB - Commodity Research Bureau |
See Notes to Financial Statements.
29 | October 31, 2016
ALPS | CoreCommodity Management
CompleteCommodities® Strategy Fund
| Consolidated Statement of Assets and Liabilities | October 31, 2016 |
| ASSETS | | | |
| Investments, at value | | $ | 497,976,432 | |
| Foreign currency, at value (Cost $17,116) | | | 16,750 | |
| Unrealized appreciation on total return swap contracts | | | 611,565 | |
| Receivable for shares sold | | | 636,926 | |
| Cash collateral pledged for total return swap contracts (Note 3) | | | 32,120 | |
| Deposit with broker for futures | | | 3,865,829 | |
| Dividends and interest receivable | | | 900,704 | |
| Prepaid expenses and other assets | | | 21,236 | |
| Total Assets | | | 504,061,562 | |
| LIABILITIES | | | | |
| Payable for variation margin on futures contracts | | | 1,112,050 | |
| Payable due to broker for total return swap contracts | | | 165,721 | |
| Payable for shares redeemed | | | 138,865 | |
| Payable due to custodian ‐ overdraft | | | 342,050 | |
| Unrealized depreciation on total return swap contracts | | | 796,828 | |
| Investment advisory fees payable | | | 678,044 | |
| Administration and transfer agency fees payable | | | 210,378 | |
| Distribution and services fees payable | | | 44,664 | |
| Professional fees payable | | | 41,778 | |
| Accrued expenses and other liabilities | | | 62,816 | |
| Total Liabilities | | | 3,593,194 | |
| NET ASSETS | | $ | 500,468,368 | |
| NET ASSETS CONSIST OF | | | | |
| Paid‐in capital | | $ | 553,440,976 | |
| Accumulated net investment loss | | | (325,361 | ) |
| Accumulated net realized loss | | | (49,287,541 | ) |
| Net unrealized depreciation | | | (3,359,706 | ) |
| NET ASSETS | | $ | 500,468,368 | |
| INVESTMENTS, AT COST | | $ | 499,811,330 | |
| | | | |
| PRICING OF SHARES | | | | |
| Class A: | | | | |
| Net Asset Value, offering and redemption price per share | | $ | 7.29 | |
| Net Assets | | $ | 29,467,738 | |
| Shares of beneficial interest outstanding (unlimited number of shares, no par value common stock authorized) | | | 4,039,880 | |
| Maximum offering price per share ((NAV/0.9450), based on maximum sales charge of 5.50% of the offering price) | | $ | 7.71 | |
| Class C: | | | | |
Net Asset Value, offering and redemption price per share(a) | | $ | 7.07 | |
| Net Assets | | $ | 7,259,964 | |
| Shares of beneficial interest outstanding (unlimited number of shares, no par value common stock authorized) | | | 1,026,199 | |
| Class I: | | | | |
| Net Asset Value, offering and redemption price per share | | $ | 7.31 | |
| Net Assets | | $ | 463,740,666 | |
| Shares of beneficial interest outstanding (unlimited number of shares, no par value common stock authorized) | | | 63,477,332 | |
| (a) | Redemption price per share may be reduced for any applicable contingent deferred sales charge. For a description of a possible sales charge, please see the Fund's Prospectus. |
See Notes to Financial Statements.
30 | October 31, 2016
ALPS | CoreCommodity Management
CompleteCommodities® Strategy Fund
| Consolidated Statement of Operations | For the Year Ended October 31, 2016 |
| INVESTMENT INCOME | | | |
| Dividends | | $ | 3,159,639 | |
| Foreign taxes withheld on dividends | | | (213,376 | ) |
| Interest and other income, net of premium amortization and accretion of discount | | | 860,112 | |
| Total Investment Income | | | 3,806,375 | |
| | | | |
| EXPENSES | | | | |
| Investment advisory fees | | | 3,467,865 | |
| Administrative fees | | | 483,905 | |
| Transfer agency fees | | | 71,724 | |
| Distribution and service fees | | | | |
| Class A | | | 97,621 | |
| Class C | | | 75,468 | |
| Professional fees | | | 52,722 | |
| Delegated transfer agent equivalent services | | | | |
| Class I | | | 373,798 | |
| Reports to shareholders and printing fees | | | 53,702 | |
| State registration fees | | | 57,071 | |
| Insurance fees | | | 4,118 | |
| Custody fees | | | 53,480 | |
| Trustees' fees and expenses | | | 16,506 | |
| Repayment of previously waived fees | | | | |
| Class A | | | 383 | |
| Class C | | | 41 | |
| Class I | | | 9,848 | |
| Miscellaneous expenses | | | 27,461 | |
| Total Expenses | | | 4,845,713 | |
| Net Expenses | | | 4,845,713 | |
| Net Investment Loss | | | (1,039,338 | ) |
| Net realized loss on investments | | | (22,185,343 | ) |
| Net realized gain on written options | | | 273,274 | |
| Net realized gain on futures contracts | | | 1,040,426 | |
| Net realized gain on total return swap contracts | | | 3,427,372 | |
| Net realized loss on foreign currency transactions | | | (12,908 | ) |
| Net Realized Loss | | | (17,457,179 | ) |
| Net change in unrealized appreciation on investments | | | 30,602,931 | |
| Net change in unrealized appreciation on written options | | | 1,326,203 | |
| Net change in unrealized depreciation on futures contracts | | | (1,099,629 | ) |
| Net change in unrealized depreciation on total return swap contracts | | | (3,572,059 | ) |
| Net change in unrealized depreciation on translation of assets and liabilities denominated in foreign currencies | | | (3,126 | ) |
| Net Change in Unrealized Appreciation | | | 27,254,320 | |
| NET REALIZED AND UNREALIZED GAIN ON INVESTMENTS | | | 9,797,141 | |
| NET INCREASE IN NET ASSETS RESULTING FROM OPERATIONS | | $ | 8,757,803 | |
See Notes to Financial Statements.
31 | October 31, 2016
ALPS | CoreCommodity Management
CompleteCommodities® Strategy Fund
Consolidated Statements of Changes in Net Assets
| | | For the Year Ended October 31, 2016 | | | For the Year Ended October 31, 2015 | |
| OPERATIONS | | | | | | |
| Net investment loss | | $ | (1,039,338 | ) | | $ | (3,322,396 | ) |
| Net realized loss | | | (17,457,179 | ) | | | (112,467,326 | ) |
| Net change in unrealized appreciation/(depreciation) | | | 27,254,320 | | | | (7,401,774 | ) |
| Net Increase/(Decrease) in Net Assets Resulting from Operations | | | 8,757,803 | | | | (123,191,496 | ) |
| | | | | | | | | |
| DISTRIBUTIONS | | | | | | | | |
| Dividends to shareholders from net investment income | | | | | | | | |
| Class I | | | – | | | | (1,912,471 | ) |
| Net Decrease in Net Assets from Distributions | | | – | | | | (1,912,471 | ) |
| | | | | | | | | |
| BENEFICIAL INTEREST TRANSACTIONS (NOTE 6) | | | | | | | | |
| Shares sold | | | | | | | | |
| Class A | | | 14,218,147 | | | | 18,414,093 | |
| Class C | | | 1,998,098 | | | | 4,099,809 | |
| Class I | | | 266,508,024 | | | | 316,791,938 | |
| Dividends reinvested | | | | | | | | |
| Class I | | | – | | | | 1,791,360 | |
| Shares redeemed, net of redemption fees | | | | | | | | |
| Class A | | | (14,961,123 | ) | | | (17,894,431 | ) |
| Class C | | | (3,101,717 | ) | | | (5,305,252 | ) |
| Class I | | | (173,760,311 | ) | | | (238,107,077 | ) |
| Net Increase in Net Assets Derived from Beneficial Interest Transactions | | | 90,901,118 | | | | 79,790,440 | |
| | | | | | | | | |
| Net increase/(decrease) in net assets | | | 99,658,921 | | | | (45,313,527 | ) |
| | | | | | | | | |
| NET ASSETS | | | | | | | | |
| Beginning of year | | | 400,809,447 | | | | 446,122,974 | |
| End of year * | | $ | 500,468,368 | | | $ | 400,809,447 | |
| *Including accumulated net investment loss of: | | $ | (325,361 | ) | | $ | (1,662,022 | ) |
See Notes to Financial Statements.
32 | October 31, 2016
ALPS | CoreCommodity Management
CompleteCommodities® Strategy Fund – Class A
Consolidated Financial Highlights
Selected data for a share of beneficial interest outstanding throughout the periods indicated:
| | | For the Year Ended October 31, 2016 | | | For the Year Ended October 31, 2015 | | | For the Fiscal Period Ended October 31, 2014(a) | | | For the Year Ended April 30, 2014 | | | For the Year Ended April 30, 2013(b) | | | For the Year Ended April 30, 2012 | |
Net asset value, beginning of period(c) | | $ | 7.15 | | | $ | 9.56 | | | $ | 10.87 | | | $ | 10.40 | | | $ | 11.18 | | | $ | 14.28 | |
| | | | | | | | | | | | | | | | | | | | | | | | | |
| INCOME/(LOSS) FROM INVESTMENT OPERATIONS: | | | | | | | | | | | | | | | | | |
Net investment income/(loss)(d) | | | (0.03 | ) | | | (0.09 | ) | | | 0.00 | (e) | | | (0.06 | ) | | | (0.03 | ) | | | 0.04 | |
| Net realized and unrealized gain/(loss) | | | 0.17 | | | | (2.32 | ) | | | (1.31 | ) | | | 0.53 | | | | (0.69 | ) | | | (2.29 | ) |
| Total from investment operations | | | 0.14 | | | | (2.41 | ) | | | (1.31 | ) | | | 0.47 | | | | (0.72 | ) | | | (2.25 | ) |
| | | | | | | | | | | | | | | | | | | | | | | | | |
| DISTRIBUTIONS: | | | | | | | | | | | | | | | | | | | | | | | | |
| From net investment income | | | – | | | | – | | | | – | | | | – | | | | – | | | | (0.83 | ) |
| From net realized gains | | | – | | | | – | | | | – | | | | – | | | | – | | | | (0.02 | ) |
| Tax return of capital | | | – | | | | – | | | | – | | | | – | | | | (0.06 | ) | | | – | |
| Total distributions | | | – | | | | – | | | | – | | | | – | | | | (0.06 | ) | | | (0.85 | ) |
| | | | | | | | | | | | | | | | | | | | | | | | | |
| REDEMPTION FEES ADDED TO PAID‐IN CAPITAL (NOTE 6) | 0.00 | (e) | | | 0.00 | (e) | | | 0.00 | (e) | | | 0.00 | (e) | | | 0.00 | (e) | | | 0.00 | (e) |
| Net increase/(decrease) in net asset value | | | 0.14 | | | | (2.41 | ) | | | (1.31 | ) | | | 0.47 | | | | (0.78 | ) | | | (3.10 | ) |
| Net asset value, end of year | | $ | 7.29 | | | $ | 7.15 | | | $ | 9.56 | | | $ | 10.87 | | | $ | 10.40 | | | $ | 11.18 | |
TOTAL RETURN(f) | | | 1.96 | % | | | (25.21 | )% | | | (12.05 | )% | | | 4.52 | % | | | (6.44 | )% | | | (15.77 | )% |
| | | | | | | | | | | | | | | | | | | | | | | | | |
| RATIOS/SUPPLEMENTAL DATA: |
| Net assets, end of year (000s) | | $ | 29,468 | | | $ | 30,085 | | | $ | 39,971 | | | $ | 112,562 | | | $ | 104,234 | | | $ | 85,805 | |
| Ratio of expenses to average net assets excluding fee waivers and reimbursements | | | 1.41 | % | | | 1.47 | % | | | 1.46 | %(g) | | | 1.50 | % | | | 1.50 | % | | | 1.64 | % |
| Ratio of expenses to average net assets including fee waivers and reimbursements | | | 1.41 | %(h) | | | 1.45 | % | | | 1.45 | %(g) | | | 1.45 | % | | | 1.40 | %(h) | | | 1.45 | % |
| Ratio of net investment income/(loss) to average net assets | | | (0.48 | )% | | | (1.12 | )% | | | 0.09 | %(g) | | | (0.60 | )% | | | (0.30 | )% | | | 0.36 | % |
Portfolio turnover rate(i) | | | 50 | % | | | 52 | % | | | 12 | % | | | 28 | % | | | 117 | % | | | 264 | % |
(a) | Effective May 1, 2014, the Board approved changing the fiscal year-end of the Funds from April 30 to October 31. |
(b) | Prior to April 30, 2013 the ALPS | CoreCommodity Management CompleteCommodities® Strategy Fund was known as the Jefferies Asset Management Commodity Strategy Allocation Fund. |
(c) | Per share amounts and ratios to average net assets include income and expenses of the CoreCommodity Management Cayman Commodity Fund Ltd. (wholly-owned subsidiary). |
(d) | Calculated using the average shares method. |
(e) | Less than $0.005 per share. |
(f) | Total returns are for the period indicated and have not been annualized. Total returns would have been lower had certain expenses not been waived during the period. Returns shown do not reflect the deduction of taxes that a shareholder would pay on Fund distributions or the redemption of Fund shares. Returns shown exclude any applicable sales charges. |
(h) | According to the Fund's shareholder services plan with respect to the Fund's Class A shares, any amount of such payment not paid during the Fund's fiscal year for such service activities shall be reimbursed to the Fund as soon as practical after the end of the fiscal year. Fees were reimbursed to the Fund during the period ended October 31, 2016 and April 30, 2013, for the prior fiscal year in the amount of 0.04% and 0.05% of average net assets of Class A shares respectively. |
(i) | Portfolio turnover rate for periods less than one full year have not been annualized. |
See Notes to Financial Statements.
33 | October 31, 2016
ALPS | CoreCommodity Management
CompleteCommodities® Strategy Fund – Class C
Consolidated Financial Highlights
Selected data for a share of beneficial interest outstanding throughout the periods indicated:
| | | For the Year Ended October 31, 2016 | | | For the Year Ended October 31, 2015 | | | For the Fiscal Period Ended October 31, 2014(a) | | | For the Year Ended April 30, 2014 | | | For the Year Ended April 30, 2013(b) | | | For the Year Ended April 30, 2012 | |
Net asset value, beginning of period(c) | | $ | 6.98 | | | $ | 9.39 | | | $ | 10.71 | | | $ | 10.31 | | | $ | 11.15 | | | $ | 14.19 | |
| | | | | | | | | | | | | | | | | | | | | | | | | |
| INCOME/(LOSS) FROM INVESTMENT OPERATIONS: | | | | | | | | | | | | | | | | |
Net investment loss(d) | | | (0.08 | ) | | | (0.14 | ) | | | (0.04 | ) | | | (0.12 | ) | | | (0.10 | ) | | | (0.05 | ) |
| Net realized and unrealized gain/(loss) | | | 0.17 | | | | (2.27 | ) | | | (1.28 | ) | | | 0.52 | | | | (0.69 | ) | | | (2.26 | ) |
| Total from investment operations | | | 0.09 | | | | (2.41 | ) | | | (1.32 | ) | | | 0.40 | | | | (0.79 | ) | | | (2.31 | ) |
| | | | | | | | | | | | | | | | | | | | | | | | | |
| DISTRIBUTIONS: | | | | | | | | | | | | | | | | | | | | | | | | |
| From net investment income | | | – | | | | – | | | | – | | | | – | | | | – | | | | (0.71 | ) |
| From net realized gains | | | – | | | | – | | | | – | | | | – | | | | – | | | | (0.02 | ) |
| Tax return of capital | | | – | | | | – | | | | – | | | | – | | | | (0.05 | ) | | | – | |
| Total distributions | | | – | | | | – | | | | – | | | | – | | | | (0.05 | ) | | | (0.73 | ) |
| | | | | | | | | | | | | | | | | | | | | | | | | |
| REDEMPTION FEES ADDED TO PAID‐IN CAPITAL (NOTE 6) | – | | | | 0.00 | (e) | | | 0.00 | (e) | | | 0.00 | (e) | | | 0.00 | (e) | | | 0.00 | (e) |
| Net increase/(decrease) in net asset value | | | 0.09 | | | | (2.41 | ) | | | (1.32 | ) | | | 0.40 | | | | (0.84 | ) | | | (3.04 | ) |
| Net asset value, end of year | | $ | 7.07 | | | $ | 6.98 | | | $ | 9.39 | | | $ | 10.71 | | | $ | 10.31 | | | $ | 11.15 | |
TOTAL RETURN(f) | | | 1.29 | % | | | (25.67 | )% | | | (12.32 | )% | | | 3.88 | % | | | (7.10 | )% | | | (16.26 | )% |
| | | | | | | | | | | | | | | | | | | | | | | | | |
| RATIOS/SUPPLEMENTAL DATA: |
| Net assets, end of year (000s) | | $ | 7,260 | | | $ | 8,335 | | | $ | 12,534 | | | $ | 13,996 | | | $ | 19,444 | | | $ | 18,095 | |
| Ratio of expenses to average net assets excluding fee waivers and reimbursements | | | 2.05 | % | | | 2.07 | % | | | 2.07 | %(g) | | | 2.10 | % | | | 2.14 | % | | | 2.24 | % |
| Ratio of expenses to average net assets including fee waivers and reimbursements | | | 2.05 | % | | | 2.05 | % | | | 2.05 | %(g) | | | 2.05 | % | | | 2.05 | % | | | 2.05 | % |
| Ratio of net investment loss to average net assets | | | (1.13 | )% | | | (1.74 | )% | | | (0.82 | )%(g) | | | (1.16 | )% | | | (0.92 | )% | | | (0.42 | )% |
Portfolio turnover rate(h) | | | 50 | % | | | 52 | % | | | 12 | % | | | 28 | % | | | 117 | % | | | 264 | % |
(a) | Effective May 1, 2014, the Board approved changing the fiscal year-end of the Funds from April 30 to October 31. |
(b) | Prior to April 30, 2013 the ALPS | CoreCommodity Management CompleteCommodities® Strategy Fund was known as the Jefferies Asset Management Commodity Strategy Allocation Fund. |
(c) | Per share amounts and ratios to average net assets include income and expenses of the CoreCommodity Management Cayman Commodity Fund Ltd. (wholly-owned subsidiary). |
(d) | Calculated using the average shares method. |
(e) | Less than $0.005 per share. |
(f) | Total returns are for the period indicated and have not been annualized. Total returns would have been lower had certain expenses not been waived during the period. Returns shown do not reflect the deduction of taxes that a shareholder would pay on Fund distributions or the redemption of Fund shares. Returns shown exclude any applicable sales charges. |
(h) | Portfolio turnover rate for periods less than one full year have not been annualized. |
See Notes to Financial Statements.
34 | October 31, 2016
ALPS | CoreCommodity Management
CompleteCommodities® Strategy Fund – Class I
Consolidated Financial Highlights
Selected data for a share of beneficial interest outstanding throughout the periods indicated:
| | | For the Year Ended October 31, 2016 | | | For the Year Ended October 31, 2015 | | | For the Fiscal Period Ended October 31, 2014(a) | | | For the Year Ended April 30, 2014 | | | For the Year Ended April 30, 2013(b) | | | For the Year Ended April 30, 2012 | |
Net asset value, beginning of period(c) | | $ | 7.15 | | | $ | 9.57 | | | $ | 10.87 | | | $ | 10.37 | | | $ | 11.12 | | | $ | 14.25 | |
| | | | | | | | | | | | | | | | | | | | | | | | | |
| INCOME/(LOSS) FROM INVESTMENT OPERATIONS: | | | | | | | | | | | | | | | |
Net investment income/(loss)(d) | | | (0.02 | ) | | | (0.06 | ) | | | (0.01 | ) | | | (0.03 | ) | | | (0.00 | )(e) | | | 0.10 | |
| Net realized and unrealized gain/(loss) | | | 0.18 | | | | (2.31 | ) | | | (1.29 | ) | | | 0.53 | | | | (0.69 | ) | | | (2.32 | ) |
| Total from investment operations | | | 0.16 | | | | (2.37 | ) | | | (1.30 | ) | | | 0.50 | | | | (0.69 | ) | | | (2.22 | ) |
| | | | | | | | | | | | | | | | | | | | | | | | | |
| DISTRIBUTIONS: | | | | | | | | | | | | | | | | | | | | | | | | |
| From net investment income | | | – | | | | (0.05 | ) | | | – | | | | – | | | | – | | | | (0.89 | ) |
| From net realized gains | | | – | | | | – | | | | – | | | | – | | | | – | | | | (0.02 | ) |
| Tax return of capital | | | – | | | | – | | | | – | | | | – | | | | (0.06 | ) | | | – | |
| Total distributions | | | – | | | | (0.05 | ) | | | – | | | | – | | | | (0.06 | ) | | | (0.91 | ) |
| | | | | | | | | | | | | | | | | | | | | | | | | |
| REDEMPTION FEES ADDED TO PAID‐IN CAPITAL (NOTE 6) | 0.00 | (e) | | | 0.00 | (e) | | | 0.00 | (e) | | | 0.00 | (e) | | | 0.00 | (e) | | | 0.00 | (e) |
| Net increase/(decrease) in net asset value | | | 0.16 | | | | (2.42 | ) | | | (1.30 | ) | | | 0.50 | | | | (0.75 | ) | | | (3.13 | ) |
| Net asset value, end of year | | $ | 7.31 | | | $ | 7.15 | | | $ | 9.57 | | | $ | 10.87 | | | $ | 10.37 | | | $ | 11.12 | |
TOTAL RETURN(f) | | | 2.24 | % | | | (24.88 | )% | | | (11.96 | )% | | | 4.82 | % | | | (6.16 | )% | | | (15.53 | )% |
| | | | | | | | | | | | | | | | | | | | | | | | | |
| RATIOS/SUPPLEMENTAL DATA: | | | | | | | | | | | | | | | |
| Net assets, end of year (000s) | | $ | 463,741 | | | $ | 362,389 | | | $ | 393,618 | | | $ | 266,293 | | | $ | 187,146 | | | $ | 83,497 | |
| Ratio of expenses to average net assets excluding fee waivers and reimbursements | | | 1.15 | % | | | 1.17 | % | | | 1.16 | %(g) | | | 1.16 | % | | | 1.17 | % | | | 1.33 | % |
| Ratio of expenses to average net assets including fee waivers and reimbursements | | | 1.15 | % | | | 1.15 | % | | | 1.15 | %(g) | | | 1.15 | % | | | 1.15 | % | | | 1.15 | % |
| Ratio of net investment income/(loss) to average net assets | | | (0.22 | )% | | | (0.73 | )% | | | (0.12 | )%(g) | | | (0.26 | )% | | | (0.02 | )% | | | 0.82 | % |
Portfolio turnover rate(h) | | | 50 | % | | | 52 | % | | | 12 | % | | | 28 | % | | | 117 | % | | | 264 | % |
(a) | Effective May 1, 2014, the Board approved changing the fiscal year-end of the Funds from April 30 to October 31. |
(b) | Prior to April 30, 2013 the ALPS | CoreCommodity Management CompleteCommodities® Strategy Fund was known as the Jefferies Asset Management Commodity Strategy Allocation Fund. |
(c) | Per share amounts and ratios to average net assets include income and expenses of the CoreCommodity Management Cayman Commodity Fund Ltd. (wholly-owned subsidiary). |
(d) | Calculated using the average shares method. |
(e) | Less than $0.005 per share. |
(f) | Total returns are for the period indicated and have not been annualized. Total returns would have been lower had certain expenses not been waived during the period. Returns shown do not reflect the deduction of taxes that a shareholder would pay on Fund distributions or the redemption of Fund shares. |
(h) | Portfolio turnover rate for periods less than one full year have not been annualized. |
See Notes to Financial Statements.
35 | October 31, 2016
ALPS | Kotak India Growth Fund
| Management Commentary | October 31, 2016 (Unaudited) |
Performance
ALPS | Kotak India Growth Fund (the “Fund”) was launched on February 14, 2011. During the 6-month period ended 31st Oct 2016 (hereinafter also referred to as “the period”), the Fund’s Class A Shares, INDAX, delivered a total return of 18.01% at Net Asset Value, Class C, INFCX, delivered 17.44% with CDSC, and Class I, INDIX, delivered 18.12%. The fund outperformed the benchmark Nifty 500 Index (“NSE500”) which returned 13.22% during the period without taking into account sales charges for Class A and C Shares.
The period saw global macroeconomics dominated by central bank stance and actions. The US Federal Open Market Committee (FOMC), in December 2015, raised the target range for the federal funds rate by 25 basis points to 0.25%–0.5%. While the US Federal Reserve indicated then that the path of further rate hikes will be gradual and data-dependent, there has not been any follow-up tightening since then as the Federal Reserve has waited on for further improvement of macro internals in the US and expressed caution on the external shocks coming from a slowdown in China, vulnerability in emerging markets and a potential disruption in the EU upon Britain’s exit from the monetary union. Japan and the Euro-zone continued to struggle with low, moribund inflation and anaemic growth. Both the Bank of Japan (BOJ) and European Central Bank (ECB) expanded their stimulus programmes during the period. In January 2016, the Bank of Japan cut interest rates to -0.1% and the European Central Bank cut interest rates to 0% in March 2016, expanding its bond buying program. Success of China’s transition from an investment/capex economy to a consumption-led one has remained the other key imponderable even though recent data and news-flow has indicated some stabilization there. China’s GDP growth slipped to 6.7% in 1QCY16, meeting market expectations but the slowest since 1999. The high-frequency indicators suggest a mild pickup in growth momentum recently.
In the UK referendum on whether to exit the European Union (“Brexit”), Britain voted to move out of the EU with a 51.9% majority. The immediate effects were visible in the currency markets with the GBP moving to a multi-decade low against the USD and other risky asset classes taking a beating. Prime Minister Cameron resigned and passed on the responsibility of the next steps to his successor, Theresa May. Withdrawal from EU would have to follow the rules of Article 50 of EU Treaty, which would start a 2 - year window from the date of execution. As of 31 Oct 2016, there is still limited clarity in the form, structure and timeline of Britain’s exit from the EU and its medium to long term implications.
In September 2016, the Bank of Japan decided to incorporate unconventional monetary policies to stimulate the economy. BOJ declared its intention to keep the yield at or near zero and kept its inflation target unmoved at 2%. Post the decision to leave the European Union, the Bank of England (BOE) cut its interest rate to .25% from .50%. The BOE also revived a program to buy corporate and government bonds, which had been on pause since 2012.
Global commodity markets too went through large swings during the period on the back of a multitude of drivers – China slowdown, US
dollar moves and general waxing and waning of risk sentiment through the period. Crude hit a multi-year low below USD28/bbl in Feb 2016 and has rebounded since then. With an expectation of possible OPEC cut increase crude hit a high of around 51/bbl in October 2016.
In India, during the period NIFTY, NSE Midcap and NSE 500 Index returned 4.72%, 17.70% and 8.81% respectively (USD terms). On the currency side, INR depreciated 2.1% from 65.42/USD to 66.68/USD as of 31st October 2016. In comparison Brazilian Real appreciated 20.76%, Russian Ruble appreciated.85%, Chinese Yuan depreciated by 7.3%, and the South African Rand appreciated 2.58%, during the same time. India seems well positioned for future growth with an investment cycle recovery, along with signs of a potential pick in consumption demand.
The Reserve Bank of India (RBI) Governor, Raghuram Rajan, quit after his term ended in September 2016 not choosing to seek another term. The government appointed Dr. Urjit Patel as the next governor of the RBI. Dr Patel was the chairman of the committee that recommended the RBI to adopt a flexible inflation targeting framework. He previously also served as an adviser to the RBI in the development of foreign exchange markets and banking sector reforms. This appointment is encouraging as it signals continuity of monetary policy implementation at the RBI. The monetary policy decision making process has also gone through a change as the policy is now formulated by means of a consensus amongst the members of the newly appointed Monetary Policy Committee (MPC) instead of the policy being solely the prerogative of the RBI governor. The MPC will be chaired by RBI Governor, Dr Urjit Patel, and the other members will, as of now, include RBI Deputy Governor R. Gandhi (in charge of monetary policy), Executive Director Dr Michael Patra (in charge of Monetary Policy Division). Additionally, the members appointed by the government are Dr Chetan Ghate, Dr Pami Dua and Dr Ravindra Dholakia -- all esteemed academicians in areas of economics and finance. The Governor will have the deciding vote in case of a tie. On October 4th the MPC voted for a 25 basis points (bps) repo rate cut to 6.25%, following a 25bps rate cut in April 2016. The Monetary Policy statement indicated CPI inflation at 5.0% in quarter-ending Dec 2016 and 5.3% in quarter-ending Mar 2017. The October 3-4 meeting minutes outlined the dovish-to-neutral tilt of the MPC members, citing abating of near-term inflation risks amid growth slack as the rationale for 25 bps repo rate cut.
In India the monsoon this year was the best in comparison to previous three years, with only a third of districts facing deficiency as compared to 46% in 2014 and 50% in 2015. A good rainfall has traditionally been associated with the Indian economy witnessing a boost as rural demand remains largely levered to farm and agri-sector. Agriculture is a large contributor to the Indian GDP and accounted for almost 16% of the GDP in 2014-2015.
From a reforms perspective, the much-awaited Goods and Services Tax (GST) Constitutional Amendment Bill was cleared in Rajya Sabha (Upper House of Parliament) in the first week of August and was also cleared in the Lok Sabha (Lower House) subsequently. It was then passed by more than 50% of the Indian states and formally adopted. It is expected that the GST will be rolled out in the first half of 2017. In another significant development, the union cabinet accepted the 7 Central Pay Commission (7CPC) recommendations to be effective from January 1, 2016 and implemented from July 1, 2016. With the Goods and Services Tax (GST) Amendment Bill passed and the Seventh Pay Commission recommendations rolled out, we can expect the consumption demand to pick up in the coming months and a demand pickup in sectors such as automobiles, home improvement, consumer staples and durables, media and entertainment, and telecom.
36 | October 31, 2016
ALPS | Kotak India Growth Fund
| Management Commentary | October 31, 2016 (Unaudited) |
Headline Wholesale Price Inflation (WPI) averaged -2.5% from March 2015 to March 2016, while primary food inflation averaged 3.4% during the same time. As the base effect wanes, we expect WPI inflation to average 3.3% during March 2016 to March 2017. WPI finally turned positive in April 2016 after almost 17 months of consecutive contraction and came in at 3.57% in September 2016, as food inflation began to rise. CPI eased to 4.31% in September, as food prices eased, after reaching 6.07% in July. Broadly the CPI has stayed in the range of 5 - 6%, on a monthly basis. Core inflation on the other hand has risen slowly from 4.1% in October 2015 to 4.8% in September 2016. The key driver of high inflation remained the sequential pickup in food prices.
Index of Industrial Production (IIP) growth rate has declined from its peak of 9.9% in October 2015 and fell to 2.1% in January 2016. The construction sector has been a laggard and we expect this segment to underperform until public spending in infrastructure begins to become more visible on the ground. Although June IIP growth came in at 2.1%, the highest reading in eight months, industrial production continued in the contraction mode, printing a decline of 0.7% in August as against -2.4% in July.
On the trade deficit front, while sluggish export and import momentum continues to point to the underlying weakness in global and domestic demand, internals show some signs of traction. Though core import growth continues to remain muted, there are some nascent signs of pickup, primarily in capital goods imports. Also, non-oil export growth remains supported by drugs and pharmaceuticals, textiles and electronics. Trade deficit in September was at US$8.3bn, higher than US$7.7bn in August. September exports growth was at 4.6% year on year against - 0.3% in August. Imports contracted further by 2.5% year on year to US$31.2bn in September against -14.1% (US$29.2bn) in August.
Portfolio Composition
The portfolio continues to be positioned in a way as to benefit from improving macroeconomic tailwind from the four broad investment themes in India – consumption lead by favourable demographics, financial services, infrastructure and outsourcing. The fund mandate is flexible to invest across the spectrum of market capitalizations in order to take advantage of any opportunistic mispricing arising from market conditions, valuation differential, earnings growth or liquidity flows.
As of 31st Oct 2016, Financials remains the largest sector (27.52% wt.), followed by Materials (14.52%) and Consumer Discretionary (12.63%). The top 5 holdings in the portfolio are HDFC Bank, Infosys Ltd, ICICI Bank, ITC and HPCL. Large active deviations in the portfolio are in Materials (+4.98% deviation from benchmark), Industrials (+1.73% deviation), Energy (-4.54% deviation) and Utilities (-3.60%). In terms of market capitalization focus, as of 31st Oct, the fund is invested 65.52% in large caps, 27.11% in midcaps and 5.41% in small-caps.
During the period, some of the names within our favored sectors where we initiated new positions and continue to hold as of this report are Crompton Greaves Consumer, Equitas, HCG Ltd, Linde India, Max Financials and Somany Ceramics. Some of the stocks where we booked profit and exited completely include Bayer CropSciences, IL&FT Transportation, Just Dial, MBL Infra, Tata Communications and Phoenix Mills.
Outlook
After the withdrawals in the initial couple of months of the year, Foreign Institutional Investors (FIIs) have stayed net buyers of Indian equities for most of the year. Economic fundaments for the Indian economy have improved through the period with tangible improvements seen in hinging inflation expectations, curtailing the current account deficit and the lowering cost of financing for businesses. In the most recent quarter ending-Sep 2016, on an aggregate basis sales growth is at eight quarter high and profitability has seen improvement and this is despite the broader economic recovery yet to set in. Rural economy thus far has not seen any recovery and any recovery supported by better monsoon will start to reflect only from the Oct-Dec 2016. We have seen some pockets of recovery in the urban economy but it still not broad based. Weak consumer staples volumes, continued asset quality issues for corporate banking sector and weak investment cycle remains headwind for the earnings while recovery in both rural and urban economy and a combination of operating leverage and pricing power can be tailwinds for earnings.
In terms of trajectory of markets, the coming months are lined up with high impact events. The U.S Presidential elections slated for November 8th will be associated with high market volatility as markets attempt to read-across implications on US rates and fiscal and foreign policy stance of the new US President. The US Federal Reserve Federal Open Market meetings in November and December will also have a strong bearing on the short term direction of the markets. India seems well positioned for future growth with a relatively stable currency, investment cycle recovery, along with a signs of a pick in consumption demand after a satisfactory monsoon to bolster rural demand and higher pay for government employees after the implementation of the 7th Pay Commission Recommendations. As of 31st October 2016, Nifty Index is trading at close to long term average valuation multiples and any correction in the markets on the back of headline events must be used to increase exposure to Indian equities, in our view.
Mr. Nitin Tejpal Jain
Fund Manager
37 | October 31, 2016
ALPS | Kotak India Growth Fund
| Management Commentary | October 31, 2016 (Unaudited) |
Basis Point – a unit that is equal to 1/100th of 1% and is used to denote the change in a financial instrument.
PE – A valuation ratio of a company's current share price compared to its per-share earnings.
Nifty 50 is an Index computed from performance of 50 top stocks from different sectors listed on the NSE (India’s National Stock Exchange). The companies which form the Nifty 50 may vary from time to time based on many factors considered by the NSE.
NSE500 is an Index of India comprised of the top 500 companies listed on the NSE.
NSEMCAP is an index of Midcap securities listed on the NSE.
The Nifty Midcap Index is a free float capitalization-weighted index designed to represent the midcap segment of the market in India. The index was developed with a base value of 1000 as of January 1, 2003. This index replaces the old Nifty Midcap 200 Index which was discontinued effective July 18, 2005.
The views of the author and information discussed in this commentary are as of the date of publication, are subject to change, and may not reflect the writer's current views. The views expressed are those of the author only, and represent an assessment of market conditions at a specific point in time, are opinions only and should not be relied upon as investment advice regarding a particular investment or markets in general. Such information does not constitute a recommendation to buy or sell specific securities or investment vehicles. It should not be assumed that any investment will be profitable or will equal the performance of the fund or any securities or any sectors mentioned in this letter. The subject matter contained in this letter has been derived from several sources believed to be reliable and accurate at the time of compilation. Neither ALPS Advisors, Inc., Kotak Mahindra (UK) Limited, nor the Fund accepts any liability for losses either direct or consequential caused by the use of this information.
Diversification cannot guarantee gain or prevent losses.
38 | October 31, 2016
ALPS | Kotak India Growth Fund
| Performance Update | October 31, 2016 (Unaudited) |
Performance of $10,000 Initial Investment (as of October 31, 2016)
Comparison of change in value of a $10,000 investment (includes maximum sales charges of 5.50%)
The chart above represents historical performance of a hypothetical investment of $10,000 in the Fund since inception. Past performance does not guarantee future results. This chart does not reflect the deduction of taxes that a shareholder would pay on Fund distributions or the redemption of Fund shares.
Average Annual Total Returns (as of October 31, 2016)
| | 6 Month | 1 Year | 3 Year | 5 Year | Since Inception^ | Total Expense Ratio | What You Pay* |
| Class A (NAV) | 18.01% | 13.31% | 18.94% | 11.39% | 7.20% | 3.51% | 2.00% |
| Class A (MOP) | 11.49% | 7.09% | 16.74% | 10.15% | 6.14% |
| Class C (NAV) | 17.56% | 12.51% | 18.10% | 10.67% | 6.48% | 4.11% | 2.60% |
| Class C (CDSC) | 16.56% | 11.55% | 18.10% | 10.67% | 6.48% |
| Class I | 18.12% | 13.70% | 19.38% | 11.79% | 7.57% | 3.10% | 1.60% |
Nifty 500 Index1 | 14.21% | 10.31% | 14.63% | 6.91% | 4.38% | | |
MSCI India Index Total Return2 | 8.80% | 3.98% | 7.35% | 3.47% | 1.48% | | |
Performance data quoted represents past performance. Past performance does not guarantee future results. Investment return and principal value of an investment will fluctuate so that an investor’s shares, when sold or redeemed, may be worth more or less than the original cost. Current performance data may be higher or lower than actual data quoted. For the most current month-end performance data, please call 1-866-759-5679.
Maximum Offering Price (MOP) for Class A shares includes the Fund’s maximum sales charge of 5.50%. Performance shown at NAV does not include these sales charges and would have been lower had it been taken into account. If you invest $1 million or more, either as a lump sum or through the Fund’s accumulation or letter of intent programs, you can purchase Class A shares without an initial sales charge (load). A Contingent Deferred Sales Charge (“CDSC”) of 1.00% may apply to Class C shares redeemed within the first 12 months after a purchase, and on Class A shares redeemed within the first 18 months after a purchase in excess of $1 million. The Fund imposes a 2.00% redemption fee on shares held for less than 30 days.
Performance less than 1 year is cumulative.
39 | October 31, 2016
ALPS | Kotak India Growth Fund
| Performance Update | October 31, 2016 (Unaudited) |
Derivatives generally are more sensitive to changes in economic or market conditions than other types of investments; this could result in losses that significantly exceed the funds original investment.
1 | Nifty 500 Index (formerly the CNX 500 Index) - India's first broad based benchmark of the Indian capital market. The Nifty 500 companies are disaggregated into 72 industry indices. Industry weightages in the index reflect the industry weightages in the market. The index is not actively managed and does not reflect any deduction for fees, expenses or taxes. An investor may not invest directly in an index. |
2 | MSCI India Index - designed to measure the performance of the large and mid cap segments of the Indian market. With 64 constituents, the index covers approximately 85% of the Indian equity universe. |
^ | Fund inception date of February 14, 2011. |
| * | What You Pay reflects the Advisor's and Sub-Advisor’s decision to contractually limit expenses through February 28, 2017. Please see the prospectus for additional information. |
The table does not reflect the deduction of taxes that a shareholder would pay on Fund distributions or the redemption of Fund shares.
This Fund is not suitable for all investors and is subject to investment risks, including possible loss of the principal amount invested.
There is no guarantee that the Fund will continue to hold any one particular security or stay invested in any one particular company. The composition of the Fund's top holdings is subject to change. Performance figures are historical and reflect the change in share price, reinvested distributions, changes in net asset value, sales charges and capital gains distributions, if any.
Not FDIC Insured – No Bank Guarantee – May Lose Value
Investing in India involves risk and considerations not present when investing in more established securities markets. The Fund may be more susceptible to economic, market, political and local risks of the region than a fund that is more geographically diversified. Investments in India are subject to a number of risks including, but not limited to, risk of losing some or all of the capital invested, high market volatility, variable market liquidity, geopolitical risks (including political instability), exchange rate fluctuations (between the currency of the fund’s share class and the Indian Rupee), changes in tax regime and restrictions on investment activities of foreign investors.
Top Ten Holdings (as a % of Net Assets) †
| HDFC Bank, Ltd. | 5.65% |
| Infosys, Ltd. | 4.83% |
| ICICI Bank, Ltd. | 3.92% |
| ITC, Ltd. | 3.51% |
| Hindustan Petroleum Corp., Ltd. | 3.42% |
| IndusInd Bank, Ltd. | 3.30% |
| Maruti Suzuki India, Ltd. | 2.87% |
| Housing Development Finance Corp., Ltd. | 2.74% |
| Axis Bank, Ltd. | 2.65% |
| Tata Motors, Ltd., Class A | 2.52% |
| Top Ten Holdings | 35.41% |
† | Holdings are subject to change, and may not reflect the current or future position of the portfolio. Table presents approximate values only. |
Industry Sector Allocation (as a % of Net Assets)
40 | October 31, 2016
ALPS | Kotak India Growth Fund
| Consolidated Statement of Investments | October 31, 2016 |
| | | Shares | | | Value (Note 2) | |
| COMMON STOCKS (95.55%) | | | | | | |
| Consumer Discretionary (12.16%) | | | | | | |
| Auto Components (2.70%) | | | | | | |
| Motherson Sumi Systems, Ltd. | | | 26,900 | | | $ | 133,879 | |
| MRF, Ltd. | | | 469 | | | | 336,967 | |
| | | | | | | | 470,846 | |
| | | | | | | | | |
| Automobiles (6.93%) | | | | | | | | |
| Maruti Suzuki India, Ltd. | | | 5,675 | | | | 501,675 | |
| Tata Motors, Ltd., Class A | | | 85,050 | | | | 441,011 | |
| TVS Motor Co., Ltd. | | | 43,700 | | | | 268,068 | |
| | | | | | | | 1,210,754 | |
| | | | | | | | | |
| Household Durables (1.43%) | | | | | | | | |
Crompton Greaves Consumer Electricals, Ltd.(a) | | | 91,145 | | | | 250,699 | |
| | | | | | | | | |
| Media (1.10%) | | | | | | | | |
Dish TV India, Ltd.(a) | | | 128,500 | | | | 192,551 | |
| | | | | | | | | |
| TOTAL CONSUMER DISCRETIONARY | | | | 2,124,850 | |
| | | | | | | | | |
| Consumer Staples (8.80%) | | | | | | | | |
| Beverages (0.86%) | | | | | | | | |
| United Breweries, Ltd. | | | 11,550 | | | | 151,049 | |
| | | | | | | | | |
| Food Products (2.19%) | | | | | | | | |
| Britannia Industries, Ltd. | | | 7,710 | | | | 382,912 | |
| | | | | | | | | |
| Household Products (0.81%) | | | | | | | | |
| Jyothy Laboratories, Ltd. | | | 26,331 | | | | 141,694 | |
| | | | | | | | | |
| Personal Products (1.43%) | | | | | | | | |
| Colgate-Palmolive India, Ltd. | | | 17,118 | | | | 248,948 | |
| | | | | | | | | |
| Tobacco (3.51%) | | | | | | | | |
| ITC, Ltd. | | | 169,200 | | | | 612,650 | |
| | | | | | | | | |
| TOTAL CONSUMER STAPLES | | | | | | | 1,537,253 | |
| | | | | | | | | |
| Energy (4.04%) | | | | | | | | |
| Oil, Gas & Consumable Fuels (4.04%) | | | | | |
| Hindustan Petroleum Corp., Ltd. | | | 85,300 | | | | 597,898 | |
| Reliance Industries, Ltd. | | | 6,800 | | | | 107,018 | |
| | | | | | | | 704,916 | |
| | | | | | | | | |
| TOTAL ENERGY | | | | | | | 704,916 | |
| | | | | | | | | |
| Financials (27.28%) | | | | | | | | |
| Commercial Banks (19.84%) | | | | | | | | |
| Axis Bank, Ltd. | | | 63,260 | | | | 462,750 | |
Bank of Baroda(a) | | | 117,500 | | | | 274,380 | |
| HDFC Bank, Ltd. | | | 52,565 | | | | 986,264 | |
| | | Shares | | | Value (Note 2) | |
| Commercial Banks (continued) | | | | | | |
| ICICI Bank, Ltd. | | | 164,520 | | | $ | 684,311 | |
| IndusInd Bank, Ltd. | | | 32,135 | | | | 575,642 | |
| State Bank of India | | | 45,750 | | | | 176,730 | |
| Yes Bank, Ltd. | | | 16,100 | | | | 305,657 | |
| | | | | | | | 3,465,734 | |
| | | | | | | | | |
| Diversified Financial Services (3.20%) | | | | | | | | |
Bharat Financial Inclusion, Ltd.(a) | | | 21,900 | | | | 290,486 | |
Equitas Holdings, Ltd.(a)(b) | | | 34,400 | | | | 93,165 | |
| Multi Commodity Exchange of India, Ltd. | | | 9,000 | | | | 174,870 | |
| | | | | | | | 558,521 | |
| | | | | | | | | |
| Insurance (1.50%) | | | | | | | | |
| Max Financial Services, Ltd. | | | 30,993 | | | | 261,504 | |
| | | | | | | | | |
| Thrifts & Mortgage Finance (2.74%) | | | | | | | | |
| Housing Development Finance Corp., Ltd. | | | 23,200 | | | | 479,125 | |
| | | | | | | | | |
| TOTAL FINANCIALS | | | | | | | 4,764,884 | |
| | | | | | | | | |
| Health Care (6.62%) | | | | | | | | |
| Health Care Providers & Services (1.08%) | | | | | |
HealthCare Global Enterprises, Ltd.(a) | | | 51,776 | | | | 189,897 | |
| | | | | | | | | |
| Pharmaceuticals (5.54%) | | | | | | | | |
| Cadila Healthcare, Ltd. | | | 23,945 | | | | 150,273 | |
| Cipla, Ltd. | | | 25,550 | | | | 221,606 | |
| Lupin, Ltd. | | | 9,250 | | | | 210,375 | |
| Sun Pharmaceutical Industries, Ltd. | | | 34,350 | | | | 385,101 | |
| | | | | | | | 967,355 | |
| | | | | | | | | |
| TOTAL HEALTH CARE | | | | | | | 1,157,252 | |
| | | | | | | | | |
| Industrials (11.25%) | | | | | | | | |
| Building Products (1.27%) | | | | | | | | |
| Somany Ceramics, Ltd. | | | 22,350 | | | | 222,400 | |
| | | | | | | | | |
| Construction & Engineering (2.38%) | | | | | | | | |
| Larsen & Toubro, Ltd. | | | 18,800 | | | | 415,737 | |
| | | | | | | | | |
| Electrical Equipment (4.13%) | | | | | | | | |
| Amara Raja Batteries, Ltd. | | | 17,945 | | | | 275,952 | |
| Finolex Cables, Ltd. | | | 28,300 | | | | 190,552 | |
| V-Guard Industries, Ltd. | | | 80,730 | | | | 254,764 | |
| | | | | | | | 721,268 | |
| | | | | | | | | |
| Machinery (2.01%) | | | | | | | | |
| Thermax, Ltd. | | | 9,036 | | | | 116,353 | |
ALPS | Kotak India Growth Fund
| Consolidated Statement of Investments | October 31, 2016 |
| | | Shares | | | Value (Note 2) | |
| Machinery (continued) | | | | | | |
| Timken India, Ltd. | | | 26,653 | | | $ | 235,119 | |
| | | | | | | | 351,472 | |
| | | | | | | | | |
| Miscellaneous Manufacturer (0.58%) | | | | | |
| Solar Industries India, Ltd. | | | 10,125 | | | | 102,071 | |
| | | | | | | | | |
| Transportation Infrastructure (0.88%) | | | | | |
| Gateway Distriparks, Ltd. | | | 40,763 | | | | 152,803 | |
| | | | | | | | | |
| TOTAL INDUSTRIALS | | | | | | | 1,965,751 | |
| | | | | | | | | |
| Information Technology (10.14%) | | | | | | | | |
| Computers (0.39%) | | | | | | | | |
| Persistent Systems, Ltd. | | | 6,947 | | | | 68,213 | |
| | | | | | | | | |
| IT Services (9.75%) | | | | | | | | |
| HCL Technologies, Ltd. | | | 22,300 | | | | 256,459 | |
| Infosys, Ltd. | | | 56,325 | | | | 844,452 | |
| Tata Consultancy Services, Ltd. | | | 11,555 | | | | 413,787 | |
| Tech Mahindra, Ltd. | | | 28,500 | | | | 187,773 | |
| | | | | | | | 1,702,471 | |
| | | | | | | | | |
| TOTAL INFORMATION TECHNOLOGY | | | | 1,770,684 | |
| | | | | | | | | |
| Materials (15.00%) | | | | | | | | |
| Auto Parts & Equipment (0.76%) | | | | | | | | |
| Gulf Oil Lubricants India, Ltd. | | | 11,692 | | | | 132,588 | |
| | | | | | | | | |
| Chemicals (4.11%) | | | | | | | | |
| Akzo Nobel India, Ltd. | | | 9,140 | | | | 227,418 | |
| Berger Paints India, Ltd. | | | 53,749 | | | | 208,054 | |
| Linde India, Ltd. | | | 23,418 | | | | 133,512 | |
| Supreme Industries, Ltd. | | | 11,021 | | | | 149,003 | |
| | | | | | | | 717,987 | |
| | | | | | | | | |
| Construction Materials (10.13%) | | | | | | | | |
| ACC, Ltd. | | | 5,871 | | | | 133,469 | |
| Century Textiles & Industries, Ltd. | | | 15,600 | | | | 220,553 | |
| JK Cement, Ltd. | | | 17,975 | | | | 256,539 | |
| Orient Cement, Ltd. | | | 64,828 | | | | 169,917 | |
| The Ramco Cements, Ltd. | | | 42,069 | | | | 399,744 | |
| Shree Cement, Ltd. | | | 990 | | | | 250,457 | |
| Ultratech Cement, Ltd. | | | 5,720 | | | | 339,805 | |
| | | | | | | | 1,770,484 | |
| | | | | | | | | |
| TOTAL MATERIALS | | | | | | | 2,621,059 | |
| | | Shares | | | Value (Note 2) | |
| Telecommunication Services (0.26%) | | | | | | |
| Wireless Telecommunication Services (0.26%) | | | | | | |
| Idea Cellular, Ltd. | | | 40,000 | | | $ | 46,051 | |
| | | | | | | | | |
| TOTAL TELECOMMUNICATION SERVICES | | 46,051 | |
| | | | | | | | | |
TOTAL COMMON STOCKS (Cost $14,567,603) | | 16,692,700 | |
| | | 7-Day Yield | | | Shares | | | Value (Note 2) | |
| SHORT TERM INVESTMENTS (0.68%) | | | | |
| Money Market Fund (0.68%) | | | | | | | |
| Dreyfus Institutional Preferred Money Market Fund | | | 0.488 | % | | | 118,939 | | | | 118,939 | |
| | | | | | | | | | | | | |
TOTAL SHORT TERM INVESTMENTS
(Cost $118,939) | | 118,939 | |
| | | | | | | | | | | | | |
TOTAL INVESTMENTS (96.23%) (Cost $14,686,542) | $ | 16,811,639 | |
| | | | | | | | | | | | | |
| Other Assets In Excess Of Liabilities (3.77%) | | 658,046 | |
| | | | | | | | | | | | | |
| NET ASSETS (100.00%) | $ | 17,469,685 | |
(a) | Non-Income Producing Security. |
(b) | Securities were purchased pursuant to Regulation S under the Securities Act of 1933, which exempts securities offered and sold outside of the United States from registration. Such securities cannot be sold in the United States without either an effective registration statement filed pursuant to the Securities Act of 1933, or pursuant to an exemption from registration. These securities have been deemed liquid under guidelines approved by the Fund's Board of Trustees. As of October 31, 2016 the aggregate market value of those securities was $93,165 representing 0.53% of net assets. |
For Fund compliance purposes, the Fund's industry classifications refer to any one or more of the industry sub-classifications used by one or more widely recognized market indexes or ratings group indexes, and/or as defined by Fund management. This definition may not apply for purposes of this report, which may combine industry sub-classifications for reporting ease. Industries are shown as a percent of net assets.
See Notes to Financial Statements.
42 | October 31, 2016
ALPS | Kotak India Growth Fund
| Consolidated Statement of Assets and Liabilities | October 31, 2016 |
| ASSETS | | | |
| Investments, at value | | $ | 16,811,639 | |
| Cash | | | 37,110 | |
| Foreign currency, at value (Cost $334,064) | | | 334,088 | |
| Receivable for investments sold | | | 7,945 | |
| Receivable for shares sold | | | 405,416 | |
| Dividends receivable | | | 3,311 | |
| Receivable due from advisor | | | 10,009 | |
| Prepaid expenses and other assets | | | 7,061 | |
| Total Assets | | | 17,616,579 | |
| LIABILITIES | | | | |
| Payable for investments purchased | | | 47,139 | |
| Administration and transfer agency fees payable | | | 19,765 | |
| Distribution and services fees payable | | | 8,067 | |
| Trustees' fees and expenses payable | | | 1,000 | |
| Professional fees payable | | | 46,494 | |
| Accrued expenses and other liabilities | | | 24,429 | |
| Total Liabilities | | | 146,894 | |
| NET ASSETS | | $ | 17,469,685 | |
| NET ASSETS CONSIST OF | | | | |
| Paid-in capital | | $ | 15,384,960 | |
| Accumulated net investment loss | | | (149,793 | ) |
| Accumulated net realized gain | | | 109,421 | |
| Net unrealized appreciation | | | 2,125,097 | |
| NET ASSETS | | $ | 17,469,685 | |
| INVESTMENTS, AT COST | | $ | 14,686,542 | |
| PRICING OF SHARES | | | | |
| Class A: | | | | |
| Net Asset Value, offering and redemption price per share | | $ | 12.32 | |
| Net Assets | | $ | 5,772,459 | |
| Shares of beneficial interest outstanding (unlimited number of shares, no par value common stock authorized) | | | 468,502 | |
| Maximum offering price per share ((NAV/0.9450), based on maximum sales charge of 5.50% of the offering price) | | $ | 13.04 | |
| Class C: | | | | |
Net Asset Value, offering and redemption price per share(a) | | $ | 11.85 | |
| Net Assets | | $ | 1,925,256 | |
| Shares of beneficial interest outstanding (unlimited number of shares, no par value common stock authorized) | | | 162,459 | |
| Class I: | | | | |
| Net Asset Value, offering and redemption price per share | | $ | 12.58 | |
| Net Assets | | $ | 9,771,970 | |
| Shares of beneficial interest outstanding (unlimited number of shares, no par value common stock authorized) | | | 777,025 | |
(a) | Redemption price per share may be reduced for any applicable contingent deferred sales charge. For a description of a possible sales charge, please see the Fund's Prospectus. |
See Notes to Financial Statements.
ALPS | Kotak India Growth Fund
| Consolidated Statement of Operations | For the Year Ended October 31, 2016 |
| INVESTMENT INCOME | | | |
| Dividends | | $ | 163,036 | |
| Foreign taxes withheld on dividends | | | (6,207 | ) |
| Total Investment Income | | | 156,829 | |
| | | | | |
| EXPENSES | | | | |
| Investment advisory fees | | | 188,475 | |
| Administrative fees | | | 140,491 | |
| Transfer agency fees | | | 1,120 | |
| Distribution and service fees | | | | |
| Class A | | | 15,315 | |
| Class C | | | 18,649 | |
| Professional fees | | | 47,819 | |
| Delegated transfer agent equivalent services | | | | |
| Class C | | | 5 | |
| Reports to shareholders and printing fees | | | 3,170 | |
| State registration fees | | | 45,815 | |
| Insurance fees | | | 168 | |
| Custody fees | | | 75,816 | |
| Trustees' fees and expenses | | | 4,416 | |
| Miscellaneous expenses | | | 25,777 | |
| Total Expenses | | | 567,036 | |
| Less fees waived/reimbursed by investment advisor (Note 8) | | | | |
| Class A | | | (99,781 | ) |
| Class C | | | (36,083 | ) |
| Class I | | | (155,959 | ) |
| Net Expenses | | | 275,213 | |
| Net Investment Loss | | | (118,384 | ) |
| Net realized gain on investments | | | 285,189 | |
| Net realized loss on foreign currency transactions | | | (9,669 | ) |
| Net realized gain | | | 275,520 | |
| Net change in unrealized appreciation on investments | | | 1,652,345 | |
| Net change in unrealized appreciation on translation of assets and liabilities denominated in foreign currencies | | | 1,076 | |
| Net change in unrealized appreciation | | | 1,653,421 | |
| NET REALIZED AND UNREALIZED GAIN ON INVESTMENTS | | | 1,928,941 | |
| NET INCREASE IN NET ASSETS RESULTING FROM OPERATIONS | | $ | 1,810,557 | |
See Notes to Financial Statements.
ALPS | Kotak India Growth Fund
Consolidated Statements of Changes in Net Assets
| | | For the Year Ended October 31, 2016 | | | For the Year Ended October 31, 2015 | |
| OPERATIONS | | | | | | |
| Net investment loss | | $ | (118,384 | ) | | $ | (165,162 | ) |
| Net realized gain | | | 275,520 | | | | 2,432,455 | |
| Net change in unrealized appreciation/(depreciation) | | | 1,653,421 | | | | (2,669,602 | ) |
| Net Increase/(Decrease) in Net Assets Resulting from Operations | | | 1,810,557 | | | | (402,309 | ) |
| | | | | | | | | |
| DISTRIBUTIONS | | | | | | | | |
| Dividends to shareholders from net investment income | | | | | | | | |
| Class A | | | – | | | | (79,832 | ) |
| Class C | | | – | | | | (13,011 | ) |
| Class I | | | – | | | | (89,195 | ) |
| Dividends to shareholders from net realized gains | | | | | | | | |
| Class A | | | (736,575 | ) | | | (174,473 | ) |
| Class C | | | (259,740 | ) | | | (45,295 | ) |
| Class I | | | (1,091,978 | ) | | | (266,183 | ) |
| Net Decrease in Net Assets from Distributions | | | (2,088,293 | ) | | | (667,989 | ) |
| | | | | | | | | |
| BENEFICIAL INTEREST TRANSACTIONS (NOTE 6) | | | | | | | | |
| Shares sold | | | | | | | | |
| Class A | | | 1,091,860 | | | | 3,689,065 | |
| Class C | | | 61,021 | | | | 1,063,029 | |
| Class I | | | 2,297,591 | | | | 4,898,712 | |
| Dividends reinvested | | | | | | | | |
| Class A | | | 680,347 | | | | 225,433 | |
| Class C | | | 254,983 | | | | 55,484 | |
| Class I | | | 1,079,849 | | | | 348,314 | |
| Shares redeemed, net of redemption fees | | | | | | | | |
| Class A | | | (1,751,257 | ) | | | (3,230,457 | ) |
| Class C | | | (325,582 | ) | | | (551,771 | ) |
| Class I | | | (2,079,111 | ) | | | (4,977,421 | ) |
| Net Increase in Net Assets Derived from Beneficial Interest Transactions | | | 1,309,701 | | | | 1,520,388 | |
| | | | | | | | | |
| Net increase in net assets | | | 1,031,965 | | | | 450,090 | |
| | | | | | | | | |
| NET ASSETS | | | | | | | | |
| Beginning of year | | | 16,437,720 | | | | 15,987,630 | |
| End of year * | | $ | 17,469,685 | | | $ | 16,437,720 | |
| *Including accumulated net investment loss of: | | $ | (149,793 | ) | | $ | (70,722 | ) |
See Notes to Financial Statements.
ALPS | Kotak India Growth Fund – Class A
Consolidated Financial Highlights
Selected data for a share of beneficial interest outstanding throughout the periods indicated:
| | | For the Year Ended October 31, 2016 | | | For the Year Ended October 31, 2015 | | | For the Fiscal Period Ended October 31, 2014(a) | | | For the Year Ended April 30, 2014 | | | For the Year Ended April 30, 2013 | | | For the Year Ended April 30, 2012 | |
Net asset value, beginning of period(b) | | $ | 12.57 | | | $ | 13.20 | | | $ | 9.99 | | | $ | 9.47 | | | $ | 8.22 | | | $ | 10.35 | |
| | | | | | | | | | | | | | | | | | | | | | | | | |
| INCOME/(LOSS) FROM INVESTMENT OPERATIONS: |
Net investment income/(loss)(c) | | | (0.09 | ) | | | (0.14 | ) | | | 0.01 | | | | (0.02 | ) | | | (0.07 | ) | | | (0.08 | ) |
| Net realized and unrealized gain/(loss) | | | 1.45 | | | | 0.06 | | | | 3.20 | | | | 0.54 | | | | 1.32 | | | | (2.04 | ) |
| Total from investment operations | | | 1.36 | | | | (0.08 | ) | | | 3.21 | | | | 0.52 | | | | 1.25 | | | | (2.12 | ) |
| | | | | | | | | | | | | | | | | | | | | | | | | |
| DISTRIBUTIONS: | | | | | | | | | | | | | | | | | | | | | | | | |
| From net investment income | | | – | | | | (0.17 | ) | | | – | | | | – | | | | – | | | | – | |
| From net realized gains | | | (1.61 | ) | | | (0.38 | ) | | | – | | | | – | | | | – | | | | (0.01 | ) |
| Total distributions | | | (1.61 | ) | | | (0.55 | ) | | | – | | | | – | | | | – | | | | (0.01 | ) |
| | | | | | | | | | | | | | | | | | | | | | | | | |
| REDEMPTION FEES ADDED TO PAID‐IN CAPITAL (NOTE 6) | 0.00 | (d) | | | 0.00 | (d) | | | 0.00 | (d) | | | 0.00 | (d) | | | 0.00 | (d) | | | 0.00 | (d) |
| Net increase/(decrease) in net asset value | | | (0.25 | ) | | | (0.63 | ) | | | 3.21 | | | | 0.52 | | | | 1.25 | | | | (2.13 | ) |
| Net asset value, end of year | | $ | 12.32 | | | $ | 12.57 | | | $ | 13.20 | | | $ | 9.99 | | | $ | 9.47 | | | $ | 8.22 | |
TOTAL RETURN(e) | | | 13.31 | % | | | (0.65 | )% | | | 32.13 | % | | | 5.49 | % | | | 15.21 | % | | | (20.44 | )% |
| | | | | | | | | | | | | | | | | | | | | | | | | |
| RATIOS/SUPPLEMENTAL DATA: |
| Net assets, end of year (000s) | | $ | 5,772 | | | $ | 5,906 | | | $ | 5,536 | | | $ | 5,211 | | | $ | 4,681 | | | $ | 2,404 | |
| Ratio of expenses to average net assets excluding fee waivers and reimbursements | | | 3.83 | % | | | 3.51 | % | | | 4.92 | %(f) | | | 6.51 | % | | | 7.99 | % | | | 12.42 | % |
| Ratio of expenses to average net assets including fee waivers and reimbursements | | | 1.90 | %(g) | | | 1.96 | %(g) | | | 1.90 | %(f)(g) | | | 1.88 | %(g) | | | 2.00 | % | | | 2.00 | % |
| Ratio of net investment income/(loss) to average net assets | | | (0.86 | )% | | | (1.03 | )% | | | 0.19 | %(f) | | | (0.27 | )% | | | (0.82 | )% | | | (0.89 | )% |
Portfolio turnover rate(h) | | | 23 | % | | | 58 | % | | | 28 | % | | | 65 | % | | | 93 | % | | | 114 | % |
| (a) | Effective May 1, 2014, the Board approved changing the fiscal year-end of the Funds from April 30 to October 31. |
| (b) | Per share amounts and ratios to average net assets include income and expenses of the Kotak Mauritius Portfolio (wholly-owned subsidiary). |
| (c) | Calculated using the average shares method. |
| (d) | Less than $0.005 per share. |
| (e) | Total returns are for the period indicated and have not been annualized. Total returns would have been lower had certain expenses not been waived during the period. Returns shown do not reflect the deduction of taxes that a shareholder would pay on Fund distributions or the redemption of Fund shares. Returns shown exclude any applicable sales charges. |
| (g) | According to the Fund's shareholder services plan with respect to the Fund's Class A shares, any amount of such payment not paid during the Fund's fiscal year for such service activities shall be reimbursed to the Fund as soon as practical after the end of the fiscal year. Fees were reimbursed to the Fund during the period ended October 31, 2016, for the prior fiscal year in the amount of 0.10% of average net assets of Class A shares, during the period ended, October 31, 2015, for the prior fiscal year in the amount of 0.04% of average net assets of Class A shares, during the period ended, October 31, 2014, for the prior fiscal year in the amount of 0.10% (annualized) of average net assets of Class A shares and during the year ended April 30, 2014, for the prior fiscal year in the amount of 0.12% of average net assets of Class A shares. |
| (h) | Portfolio turnover rate for periods less than one full year have not been annualized. |
See Notes to Financial Statements.
46 | October 31, 2016
ALPS | Kotak India Growth Fund – Class C
Consolidated Financial Highlights
Selected data for a share of beneficial interest outstanding throughout the periods indicated:
| | | For the Year Ended October 31, 2016 | | | For the Year Ended October 31, 2015 | | | For the Fiscal Period Ended October 31, 2014(a) | | | For the Year Ended April 30, 2014 | | | For the Year Ended April 30, 2013 | | | For the Year Ended April 30, 2012 | |
Net asset value, beginning of period(b) | | $ | 12.23 | | | $ | 12.88 | | | $ | 9.77 | | | $ | 9.34 | | | $ | 8.15 | | | $ | 10.32 | |
| | | | | | | | | | | | | | | | | | | | | | | | | |
| INCOME/(LOSS) FROM INVESTMENT OPERATIONS: |
Net investment loss(c) | | | (0.16 | ) | | | (0.21 | ) | | | (0.03 | ) | | | (0.09 | ) | | | (0.12 | ) | | | (0.13 | ) |
| Net realized and unrealized gain/(loss) | | | 1.39 | | | | 0.05 | | | | 3.14 | | | | 0.52 | | | | 1.31 | | | | (2.03 | ) |
| Total from investment operations | | | 1.23 | | | | (0.16 | ) | | | 3.11 | | | | 0.43 | | | | 1.19 | | | | (2.16 | ) |
| | | | | | | | | | | | | | | | | | | | | | | | | |
| DISTRIBUTIONS: | | | | | | | | | | | | | | | | | | | | | | | | |
| From net investment income | | | – | | | | (0.11 | ) | | | – | | | | – | | | | – | | | | – | |
| From net realized gains | | | (1.61 | ) | | | (0.38 | ) | | | – | | | | – | | | | – | | | | (0.01 | ) |
| Total distributions | | | (1.61 | ) | | | (0.49 | ) | | | – | | | | – | | | | – | | | | (0.01 | ) |
| | | | | | | | | | | | | | | | | | | | | | | | | |
| REDEMPTION FEES ADDED TO PAID‐IN CAPITAL (NOTE 6) | 0.00 | (d) | | | – | | | | 0.00 | (d) | | | – | | | | – | | | | 0.00 | (d) |
| Net increase/(decrease) in net asset value | | | (0.38 | ) | | | (0.65 | ) | | | 3.11 | | | | 0.43 | | | | 1.19 | | | | (2.17 | ) |
| Net asset value, end of year | | $ | 11.85 | | | $ | 12.23 | | | $ | 12.88 | | | $ | 9.77 | | | $ | 9.34 | | | $ | 8.15 | |
TOTAL RETURN(e) | | | 12.51 | % | | | (1.34 | )% | | | 31.83 | % | | | 4.60 | % | | | 14.60 | % | | | (20.97 | )% |
| | | | | | | | | | | | | | | | | | | | | | | | | |
| RATIOS/SUPPLEMENTAL DATA: |
| Net assets, end of year (000s) | | $ | 1,925 | | | $ | 1,965 | | | $ | 1,497 | | | $ | 875 | | | $ | 924 | | | $ | 435 | |
| Ratio of expenses to average net assets excluding fee waivers and reimbursements | | | 4.54 | % | | | 4.11 | % | | | 5.57 | %(f) | | | 7.26 | % | | | 8.54 | % | | | 13.39 | % |
| Ratio of expenses to average net assets including fee waivers and reimbursements | | | 2.60 | % | | | 2.60 | % | | | 2.60 | %(f) | | | 2.60 | % | | | 2.60 | % | | | 2.60 | % |
| Ratio of net investment loss to average net assets | | | (1.56 | )% | | | (1.67 | )% | | | (0.50 | )%(f) | | | (1.00 | )% | | | (1.42 | )% | | | (1.49 | )% |
Portfolio turnover rate(g) | | | 23 | % | | | 58 | % | | | 28 | % | | | 65 | % | | | 93 | % | | | 114 | % |
| (a) | Effective May 1, 2014, the Board approved changing the fiscal year-end of the Funds from April 30 to October 31. |
| (b) | Per share amounts and ratios to average net assets include income and expenses of the Kotak Mauritius Portfolio (wholly-owned subsidiary). |
| (c) | Calculated using the average shares method. |
| (d) | Less than $0.005 per share. |
| (e) | Total returns are for the period indicated and have not been annualized. Total returns would have been lower had certain expenses not been waived during the period. Returns shown do not reflect the deduction of taxes that a shareholder would pay on Fund distributions or the redemption of Fund shares. Returns shown exclude any applicable sales charges. |
| (g) | Portfolio turnover rate for periods less than one full year have not been annualized. |
See Notes to Financial Statements.
47 | October 31, 2016
ALPS | Kotak India Growth Fund – Class I
Consolidated Financial Highlights
Selected data for a share of beneficial interest outstanding throughout the periods indicated:
| | | For the Year Ended October 31, 2016 | | | For the Year Ended October 31, 2015 | | | For the Fiscal Period Ended October 31, 2014(a) | | | For the Year Ended April 30, 2014 | | | For the Year Ended April 30, 2013 | | | For the Year Ended April 30, 2012 | |
Net asset value, beginning of period(b) | | $ | 12.76 | | | $ | 13.29 | | | $ | 10.04 | | | $ | 9.55 | | | $ | 8.25 | | | $ | 10.34 | |
| | | | | | | | | | | | | | | | | | | | | | | | | |
| INCOME/(LOSS) FROM INVESTMENT OPERATIONS: |
Net investment income/(loss)(c) | | | (0.06 | ) | | | (0.09 | ) | | | 0.03 | | | | 0.00 | (d) | | | (0.04 | ) | | | (0.04 | ) |
| Net realized and unrealized gain/(loss) | | | 1.49 | | | | 0.06 | | | | 3.22 | | | | 0.54 | | | | 1.34 | | | | (2.04 | ) |
| Total from investment operations | | | 1.43 | | | | (0.03 | ) | | | 3.25 | | | | 0.54 | | | | 1.30 | | | | (2.08 | ) |
| | | | | | | | | | | | | | | | | | | | | | | | | |
| DISTRIBUTIONS: | | | | | | | | | | | | | | | | | | | | | | | | |
| From net investment income | | | – | | | | (0.13 | ) | | | – | | | | (0.05 | ) | | | – | | | | – | |
| From net realized gains | | | (1.61 | ) | | | (0.38 | ) | | | – | | | | – | | | | – | | | | (0.01 | ) |
| Total distributions | | | (1.61 | ) | | | (0.51 | ) | | | – | | | | (0.05 | ) | | | – | | | | (0.01 | ) |
| | | | | | | | | | | | | | | | | | | | | | | | | |
| REDEMPTION FEES ADDED TO PAID‐IN CAPITAL (NOTE 6) | 0.00 | (d) | | | 0.01 | | | | 0.00 | (d) | | | – | | | | 0.00 | (d) | | | 0.00 | (d) |
| Net increase/(decrease) in net asset value | | | (0.18 | ) | | | (0.53 | ) | | | 3.25 | | | | 0.49 | | | | 1.30 | | | | (2.09 | ) |
| Net asset value, end of year | | $ | 12.58 | | | $ | 12.76 | | | $ | 13.29 | | | $ | 10.04 | | | $ | 9.55 | | | $ | 8.25 | |
TOTAL RETURN(e) | | | 13.70 | % | | | (0.23 | )% | | | 32.37 | % | | | 5.70 | % | | | 15.76 | % | | | (20.23 | )% |
| | | | | | | | | | | | | | | | | | | | | | | | | |
| RATIOS/SUPPLEMENTAL DATA: |
| Net assets, end of year (000s) | | $ | 9,772 | | | $ | 8,567 | | | $ | 8,955 | | | $ | 1,945 | | | $ | 2,149 | | | $ | 1,609 | |
| Ratio of expenses to average net assets excluding fee waivers and reimbursements | | | 3.54 | % | | | 3.10 | % | | | 4.49 | %(f) | | | 6.28 | % | | | 7.65 | % | | | 12.05 | % |
| Ratio of expenses to average net assets including fee waivers and reimbursements | | | 1.60 | % | | | 1.60 | % | | | 1.60 | %(f) | | | 1.60 | % | | | 1.60 | % | | | 1.60 | % |
| Ratio of net investment income/(loss) to average net assets | | | (0.56 | )% | | | (0.67 | )% | | | 0.50 | %(f) | | | 0.00 | %(g) | | | (0.42 | )% | | | (0.49 | )% |
Portfolio turnover rate(h) | | | 23 | % | | | 58 | % | | | 28 | % | | | 65 | % | | | 93 | % | | | 114 | % |
| (a) | Effective May 1, 2014, the Board approved changing the fiscal year-end of the Funds from April 30 to October 31. |
| (b) | Per share amounts and ratios to average net assets include income and expenses of the Kotak Mauritius Portfolio (wholly-owned subsidiary). |
| (c) | Calculated using the average shares method. |
| (d) | Less than $0.005 per share. |
| (e) | Total returns are for the period indicated and have not been annualized. Total returns would have been lower had certain expenses not been waived during the period. Returns shown do not reflect the deduction of taxes that a shareholder would pay on Fund distributions or the redemption of Fund shares. |
| (h) | Portfolio turnover rate for periods less than one full year have not been annualized. |
See Notes to Financial Statements.
48 | October 31, 2016
ALPS | Metis Global Micro Cap Fund
| Management Commentary | October 31, 2016 (Unaudited) |
Market Commentary
The S&P Global Broad Market Index of companies with less than $500 million of market capitalization (the S&P Global BMI < $500 million, hereinafter) increased 5.8% over the twelve months ended 10/31/16. The performance reflects a strong reversal from a significant downturn in the first half of the period which peaked in mid‐February with a negative 14.5% cumulative return. The major factors contributing to the decline included a shift to a more hawkish monetary policy by the US Federal Reserve; a sharp decline in the price of oil; evidence of potentially slowing growth in China; and uncertainty related to the adoption of a negative interest rate policy by the Bank of Japan, among other factors.
Mid-February marked the start of a significant rally in global markets concurrent with a ramp in commodity prices as OPEC reached agreement on a production freeze and a confluence of other factors including incremental stimulus measures in China; more dovish US Federal Reserve policy expectations; and a weaker US dollar provided additional support. By the close of the first half, the S&P Global BMI < $500 million benchmark had recovered to return 2.1%. Additionally, oil prices reversed a 40.5% decline to a near break-even return, and the prices of gold and silver increased 13.6% and 15.7%, respectively.
The global recovery was briefly interrupted in the second half of the period given downward pressure related to a referendum in the United Kingdom to exit the European Union, which passed in late June. The “Brexit” event spurred investor flight to safe haven assets such as precious metals and significant fluctuations in currency exchange rates including the British pound, which depreciated 16.4% in the second half of the period relative to the US dollar. However, stimulus initiatives by central banks in the UK and Japan, among other countries, catalyzed a strong rally which peaked in late September with a 10.1% cumulative return in the benchmark and a further increase in the price of oil on news of an OPEC agreement to curb production.
Fund Review
The ALPS/Metis Global Micro Cap Fund returned 16.64% from inception (12/31/15) through the period end date of 10/31/16. The fund outperformed the 7.24% return of the benchmark S&P Global BMI < $500 million by 940 basis points (bps). The fund capitalized on overweight positions in sectors such as Energy, Financials, and Metals & Mining that experienced sharp increases in the period. Relative performance also benefitted from strong stock selection in sectors the fund was underweight such as Information Technology and Health Care. Overall, the fund achieved positive returns in ten of the eleven sectors comprising the benchmark portfolio, with Telecommunication Services shares being the sole investments to exhibit negative returns.
A significant portion of the fund’s outperformance in the period was driven by a mean reversion of “classic” value sectors which had come under pressure in prior periods for various themes inducing fear of potential underperformance. Metals & Mining and Energy sector outperformance was driven by the increases in oil and precious metals prices mentioned above and was intertwined with top performing regions such as Australia, the US, and Canada.
The portfolio’s top five performing Metals & Mining shares averaged a 269.0% return and included Resolute Mining Limited (Australia); Gold Resource Corporation (US); Beadell Resources Ltd (Australia); Endeavour Silver Corp. (Canada); and Shougang Fushan Resources Group Limited (Hong Kong). The top five Oil & Gas related holdings returned 117.0% on average and included Ultra Petroleum Corp. (US); Denbury Resources Inc. (US); Hallador Energy Company (US); Senex Energy Limited (Australia); and REX American Resources Corporation (US).
Brazilian shares also performed exceptionally well in the period, collectively returning 126.9% as the local market recovered from a corruption scandal that culminated in a presidential impeachment and a lengthy drought that negatively impacted its hydropower dependent utility infrastructure. Brazilian banking shares were a primary contributor to Financials sector outperformance as was the Bank of Punjab in Pakistan, which returned 69.3% amidst evidence of operational improvement. Additionally, US banking and insurance shares provided incremental support to Financial sector returns.
A secondary theme supporting performance was the fund’s underweight positions in growth sectors such as Information Technology (IT) and Health Care, which have reversed in recent periods as investors’ risk appetite has exhibited volatility. As the fund was roughly half-weight and one third weight the benchmark IT and Healthcare allocation percentage, respectively, performance benefitted from relatively weaker benchmark returns in these sectors. The effect was magnified by strong stock selection, particularly in the Japanese software (Computer Engineering & Consulting Ltd.; Miroku Jyoho Service Co., Ltd.; and Fukui Computer Holdings, Inc.) and US Pharmaceutical industries (Pain Therapeutics, Inc. and SciClone Pharmaceuticals, Inc.).
Diversified Telecommunication Services were the sole area of the portfolio with a negative return, driven primarily by declines of MagicJack VocalTec Ltd. and Hawaiian Telcom Holdco, Inc. subsequent to negative earnings announcements. Real Estate sector holdings also detracted from returns due primarily to declines in Taiwan-based Real Estate Management & Developing holdings concurrent with concerns about potential macroeconomic weakness and reversal of a lengthy property market boom.
Strategy and Outlook
The fund is managed with a bottom-up investment approach with valuation being the key criteria. Once an investable opportunity set is assembled, securities are valued along two successive valuation approaches: i) valuation based on the company’s specific global industry, and ii) valuation based on the overall embedded business value of the company. Portfolio construction at Metis is a purely systematic process directly related to the security’s score: only those securities with the highest scores are considered for the portfolio. Metis optimizes the portfolio on value to maximize this score, resulting in the highest scoring stocks receiving the greatest weight. Country and industry exposures are a residual of this bottom-up process.
On a regional basis, our top overweight position is Japan, a country where we are finding deeply discounted opportunities given concerns about macroeconomic growth. Valuation metrics such as price-to-book and price-to-earnings ratios are well below historical (10 year) averages in Japan. Our portfolio holdings also have attractive dividend yields supported by high levels of on balance sheet cash and equivalents. These trends are noteworthy given that Japan’s micro-cap market is the second best performer amongst developed countries over the last five years (as of 10/31/16) and has a history of outperforming indices based on other capitalization levels.
49 | October 31, 2016
ALPS | Metis Global Micro Cap Fund
| Management Commentary | October 31, 2016 (Unaudited) |
Of further note, the value premium has been clearly demonstrated in Japan. In a Brandes Institute study (Value vs. Glamour: A Global Phenomenon) spanning the 1980-2012 period, Japan was among nine countries (Australia, Canada, France, Germany, Italy, Japan, Singapore, the UK, and the US) where the value premium was demonstrated to be most strongly evident.
The fund is also overweight positions in the US and Brazil. US holdings are primarily concentrated in cyclical industries such as Machinery; Oil, Gas, & Consumable Fuels; Energy Equipment and Services; Consumer Services; and Banking. Brazilian holdings follow a similar pattern with concentrations in Banking; Machinery; and Road & Rail shares. These patterns are consistent with market concerns about global macroeconomic growth and recent volatility in commodity prices.
Conversely, the fund is underweight shares in Europe given as operating metrics relative to corporate enterprise values appear less attractive as compared to other regions. Additionally, the fund is underweight the Asia Pacific ex Japan and Emerging Markets regions. The primary contributors to the lower allocations in these regions include underweight positions in areas such as Taiwan, Hong Kong, South Korea and China where valuations generally remain elevated, in our view.
Machel Allen, CFA
President and Chief Investment Officer
Michael Blasi, CFA
Research Analyst
The views of the authors and information discussed in this commentary are as of the date of publication, are subject to change, and may not reflect the writers’ current views. The views expressed are those of the authors only, and represent an assessment of market conditions at a specific point in time, are opinions only and should not be relied upon as investment advice regarding a particular investment or markets in general. Such information does not constitute a recommendation to buy or sell specific securities or investment vehicles. It should not be assumed that any investment will be profitable or will equal the performance of the fund(s) or any securities or any sectors mentioned in this letter. The subject matter contained in this letter has been derived from several sources believed to be reliable and accurate at the time of compilation. Neither ALPS Advisors, Inc., Metis Global Partners, LLC, nor the Fund accepts any liability for losses either direct or consequential caused by the use of this information.
Diversification cannot guarantee gain or prevent losses.
The Fund is new and has limited operating history.
50 | October 31, 2016
ALPS | Metis Global Micro Cap Fund
| Performance Update | October 31, 2016 (Unaudited) |
Performance of $10,000 Initial Investment (as of October 31, 2016)
Comparison of change in value of a $10,000 investment (includes maximum sales charges of 5.50%)
The chart above represents historical performance of a hypothetical investment of $10,000 in the Fund since inception. Past performance does not guarantee future results. This chart does not reflect the deduction of taxes that a shareholder would pay on Fund distributions or the redemption of Fund shares.
Average Annual Total Returns (as of October 31, 2016)
| | 6 Month | Since Inception^ | Total Expense Ratio | What You Pay* |
| ALPS | Metis Global Micro Cap Fund - A - NAV | 7.39% | 14.80% | 2.16% | 2.10% |
| ALPS | Metis Global Micro Cap Fund - A - MOP | 1.50% | 8.51% |
| ALPS | Metis Global Micro Cap Fund - C - NAV | 6.84% | 14.00% | 2.76% | 2.70% |
| ALPS | Metis Global Micro Cap Fund - C - CDSC | 5.84% | 13.00% |
| ALPS | Metis Global Micro Cap Fund - I - NAV | 7.48% | 15.00% | 1.76% | 1.70% |
S&P Global BMI Under $500 Million Index1 | 3.61% | 7.88% | | |
Performance data quoted represents past performance. Past performance does not guarantee future results. Investment return and principal value of an investment will fluctuate so that an investor's shares, when sold or redeemed, may be worth more or less than the original cost. Current performance data may be higher or lower than actual data quoted. For the most current month-end performance data, please call 1-866-759-5679.
Maximum Offering Price (MOP) for Class A shares includes the Fund’s maximum sales charge of 5.50%. Performance shown at NAV does not include these sales charges and would have been lower had it been taken into account. If you invest $1 million or more, either as a lump sum or through the Fund’s accumulation or letter of intent programs, you can purchase Class A shares without an initial sales charge (load). A Contingent Deferred Sales Charge (“CDSC”) of 1.00% may apply to Class C shares redeemed within the first 12 months after a purchase, and on Class A shares redeemed within the first 18 months after a purchase in excess of $1 million. The Fund imposes a 2.00% redemption fee on shares held for less than 60 days.
Performance less than 1 year is cumulative.
51 | October 31, 2016
ALPS | Metis Global Micro Cap Fund
| Performance Update | October 31, 2016 (Unaudited) |
| 1 | The S&P Global BMI Under $500 Million Index with net dividends is a comprehensive, rules-based index measuring global stock market performance of micro- and small- capitalization companies. It represents all issues in the S&P Global BMI (Broad Market Index (BMI) whose market capitalization at time of index constitution is less than $500 million. The S&P Global <$500M Index includes companies from both developed and emerging nations. An investor may not invest directly in an index. |
| ^ | Fund inception date of December 23, 2015. |
| * | What You Pay reflects the Advisor's decision to contractually limit expenses through February 28, 2017. Please see the prospectus for additional information. |
The table does not reflect the deduction of taxes that a shareholder would pay on Fund distributions or the redemption of Fund shares.
This Fund is not suitable for all investors and is subject to investment risks, including possible loss of the principal amount invested.
There is no guarantee that the Fund will continue to hold any one particular security or stay invested in any one particular company. The composition of the Fund's top holdings is subject to change. Performance figures are historical and reflect the change in share price, reinvested distributions, changes in net asset value, sales charges and capital gains distributions, if any.
The ALPS | Metis Global Micro Cap Fund is new and has limited operating history.
Not FDIC Insured – No Bank Guarantee – May Lose Value
Top Ten Holdings (as a % of Net Assets) † |
| | |
| Ultra Petroleum Corp. | 1.10% |
| Bradken, Ltd. | 0.94% |
| The Bank of Punjab | 0.58% |
| Tiangong International Co., Ltd. | 0.56% |
| JK Tyre & Industries Ltd. | 0.52% |
| Watpac, Ltd. | 0.50% |
| Assystem | 0.50% |
| Sword Group | 0.49% |
| Big 5 Sporting Goods Corp. | 0.49% |
| Honda Tsushin Kogyo Co., Ltd. | 0.49% |
| Top Ten Holdings | 6.17% |
Top Ten Country Allocation (as a % of Net Assets)† |
| | |
| Japan | 23.24% |
| United States | 20.91% |
| South Korea | 7.97% |
| Taiwan | 5.72% |
| Australia | 5.03% |
| Great Britain | 3.02% |
| Brazil | 3.01% |
| Canada | 2.82% |
| Hong Kong | 2.18% |
| India | 2.09% |
| Top Ten Country Allocation | 75.99% |
| † | Holdings are subject to change, and may not reflect the current or future position of the portfolio. Tables present indicative values only. Excludes cash & cash equivalents. |
52 | October 31, 2016
ALPS | Metis Global Micro Cap Fund
| Statement of Investments | October 31, 2016 |
| | | Shares | | | Value (Note 2) | |
| COMMON STOCKS (89.99%) | | | | | | |
| Australia (5.03%) | | | | | | |
Beadell Resources, Ltd.(a) | | | 162,844 | | | $ | 57,937 | |
Bradken, Ltd.(a) | | | 62,685 | | | | 153,242 | |
| Cabcharge Australia, Ltd. | | | 18,940 | | | | 51,774 | |
| Cedar Woods Properties, Ltd. | | | 11,880 | | | | 40,576 | |
| Monadelphous Group, Ltd. | | | 8,095 | | | | 57,205 | |
| Prime Media Group, Ltd. | | | 228,508 | | | | 48,671 | |
| Reckon, Ltd. | | | 47,702 | | | | 57,333 | |
| Regis Resources, Ltd. | | | 18,934 | | | | 47,751 | |
| Resolute Mining, Ltd. | | | 48,025 | | | | 56,730 | |
| Sandfire Resources NL | | | 11,613 | | | | 45,808 | |
| Seven West Media, Ltd. | | | 60,804 | | | | 31,332 | |
Slater & Gordon, Ltd.(a) | | | 177,093 | | | | 48,973 | |
| SMS Management & Technology, Ltd. | | | 32,948 | | | | 38,177 | |
Watpac, Ltd.(a) | | | 120,026 | | | | 81,717 | |
| | | | | | | | 817,226 | |
| | | | | | | | | |
| Brazil (1.93%) | | | | | | | | |
| Direcional Engenharia SA | | | 26,900 | | | | 46,687 | |
| Kepler Weber SA | | | 8,700 | | | | 51,568 | |
Mills Estruturas e Servicos de Engenharia SA(a) | | | 29,900 | | | | 47,211 | |
| Paranapanema SA | | | 90,500 | | | | 49,049 | |
Rumo Logistica Operadora Multimodal SA(a) | | | 29,200 | | | | 65,407 | |
Tegma Gestao Logistica SA(a) | | | 21,100 | | | | 54,006 | |
| | | | | | | | 313,928 | |
| | | | | | | | | |
| Canada (2.82%) | | | | | | | | |
| Clarke, Inc. | | | 7,511 | | | | 51,350 | |
| Essential Energy Services, Ltd. | | | 91,985 | | | | 39,776 | |
| Granite Oil Corp. | | | 8,974 | | | | 33,921 | |
| Horizon North Logistics, Inc. | | | 33,404 | | | | 45,326 | |
| Mandalay Resources Corp. | | | 60,088 | | | | 44,798 | |
| Nevsun Resources, Ltd. | | | 13,977 | | | | 40,536 | |
| Pizza Pizza Royalty Corp. | | | 4,660 | | | | 52,808 | |
| Torstar Corp., Class B | | | 44,296 | | | | 55,151 | |
| Western Energy Services Corp. | | | 21,261 | | | | 37,091 | |
Yellow Pages, Ltd.(a) | | | 3,556 | | | | 57,610 | |
| | | | | | | | 458,367 | |
| | | | | | | | | |
| Chile (0.22%) | | | | | | | | |
| PAZ Corp. SA | | | 44,751 | | | | 36,446 | |
| | | | | | | | | |
| China (0.88%) | | | | | | | | |
| Boer Power Holdings, Ltd. | | | 129,000 | | | | 51,695 | |
| Tiangong International Co., Ltd. | | | 726,000 | | | | 91,643 | |
| | | | | | | | 143,338 | |
| | | | | | | | | |
| France (1.51%) | | | | | | | | |
| Assystem | | | 2,704 | | | | 81,036 | |
EuropaCorp(a) | | | 10,269 | | | | 46,669 | |
| Neopost SA | | | 1,984 | | | | 60,088 | |
| | | Shares | | | Value (Note 2) | |
| France (continued) | | | | | | |
Solocal Group(a) | | | 16,542 | | | $ | 57,138 | |
| | | | | | | | 244,931 | |
| | | | | | | | | |
| Germany (0.72%) | | | | | | | | |
| 2G Energy AG | | | 3,078 | | | | 58,117 | |
| SHW AG | | | 1,695 | | | | 58,760 | |
| | | | | | | | 116,877 | |
| | | | | | | | | |
| Great Britain (3.02%) | | | | | | | | |
| Brammer PLC | | | 56,681 | | | | 72,152 | |
| CML Microsystems PLC | | | 6,945 | | | | 32,728 | |
| Games Workshop Group PLC | | | 7,913 | | | | 55,014 | |
| Gem Diamonds, Ltd. | | | 31,375 | | | | 44,548 | |
| Lavendon Group PLC | | | 33,536 | | | | 50,900 | |
| LSL Property Services PLC | | | 13,923 | | | | 33,146 | |
| Norcros PLC | | | 23,659 | | | | 43,076 | |
| Numis Corp. PLC | | | 21,288 | | | | 58,431 | |
| Utilitywise PLC | | | 28,139 | | | | 56,829 | |
| Vertu Motors PLC | | | 85,840 | | | | 44,917 | |
| | | | | | | | 491,741 | |
| | | | | | | | | |
| Greece (0.44%) | | | | | | | | |
| Aegean Marine Petroleum Network, Inc. | | | 8,273 | | | | 71,148 | |
| | | | | | | | | |
| Hong Kong (2.18%) | | | | | | | | |
| APT Satellite Holdings, Ltd. | | | 37,500 | | | | 24,648 | |
eSun Holdings, Ltd.(a) | | | 446,000 | | | | 42,457 | |
| G-Resources Group, Ltd. | | | 2,400,000 | | | | 42,169 | |
| Lisi Group Holdings, Ltd. | | | 614,000 | | | | 51,418 | |
| Playmates Holdings, Ltd. | | | 40,000 | | | | 46,718 | |
| Playmates Toys, Ltd. | | | 228,000 | | | | 35,776 | |
REXLot Holdings, Ltd.(a) | | | 2,725,000 | | | | 46,380 | |
| Shougang Fushan Resources Group, Ltd. | | | 300,000 | | | | 64,861 | |
| | | | | | | | 354,427 | |
| | | | | | | | | |
| India (2.09%) | | | | | | | | |
Ashapura Minechem, Ltd.(a) | | | 51,351 | | | | 54,826 | |
Eros International Media, Ltd.(a) | | | 16,587 | | | | 49,319 | |
| JK Tyre & Industries, Ltd. | | | 39,797 | | | | 84,630 | |
| Oriental Bank of Commerce | | | 30,762 | | | | 59,375 | |
Subex, Ltd.(a) | | | 264,375 | | | | 46,153 | |
| Welspun Corp., Ltd. | | | 42,527 | | | | 45,577 | |
| | | | | | | | 339,880 | |
| | | | | | | | | |
| Indonesia (0.86%) | | | | | | | | |
| Bekasi Fajar Industrial Estate Tbk PT | | | 1,728,000 | | | | 41,246 | |
| Elnusa Tbk PT | | | 1,324,000 | | | | 45,855 | |
Kawasan Industri Jababeka Tbk PT(a) | | | 2,317,900 | | | | 53,279 | |
| | | | | | | | 140,380 | |
| | | | | | | | | |
| Ireland (0.29%) | | | | | | | | |
Independent News & Media PLC(a) | | | 359,475 | | | | 46,564 | |
| | | | | | | | | |
| Israel (0.96%) | | | | | | | | |
| Magic Software Enterprises, Ltd. | | | 7,674 | | | | 56,020 | |
53 | October 31, 2016
ALPS | Metis Global Micro Cap Fund
| Statement of Investments | October 31, 2016 |
| | | Shares | | | Value (Note 2) | |
| Israel (continued) | | | | | | |
magicJack VocalTec, Ltd.(a) | | | 8,581 | | | $ | 52,773 | |
Perion Network, Ltd.(a) | | | 45,718 | | | | 47,547 | |
| | | | | | | | 156,340 | |
| | | | | | | | | |
| Japan (23.24%) | | | | | | | | |
| Aizawa Securities Co., Ltd. | | | 10,000 | | | | 55,255 | |
| Asante, Inc. | | | 3,600 | | | | 54,565 | |
| Asmo Corp. | | | 70,000 | | | | 44,692 | |
| Broadleaf Co., Ltd. | | | 5,600 | | | | 62,948 | |
| Computer Engineering & Consulting, Ltd. | | | 3,800 | | | | 71,046 | |
| Computer Institute of Japan, Ltd. | | | 10,400 | | | | 49,995 | |
| Dai Nippon Toryo Co., Ltd. | | | 21,000 | | | | 44,929 | |
| Daiichi Jitsugyo Co., Ltd. | | | 12,000 | | | | 66,469 | |
| Dainichiseika Color & Chemicals Manufacturing Co., Ltd. | | | 11,000 | | | | 58,622 | |
| Ebara Jitsugyo Co., Ltd. | | | 4,600 | | | | 55,701 | |
| Eidai Co., Ltd. | | | 14,000 | | | | 60,454 | |
| Fuji Kiko Co., Ltd. | | | 16,700 | | | | 61,064 | |
| Fujisash Co., Ltd. | | | 58,300 | | | | 49,391 | |
| Fujitec Co., Ltd. | | | 5,000 | | | | 57,200 | |
| Fujitsu Frontech, Ltd. | | | 5,600 | | | | 66,935 | |
| GCA Corp. | | | 6,400 | | | | 47,735 | |
| Gun-Ei Chemical Industry Co., Ltd. | | | 1,500 | | | | 43,139 | |
| Happinet Corp. | | | 4,500 | | | | 47,575 | |
| Hochiki Corp. | | | 4,600 | | | | 54,178 | |
| Honda Tsushin Kogyo Co., Ltd. | | | 6,300 | | | | 79,120 | |
| Ichiyoshi Securities Co., Ltd. | | | 6,100 | | | | 45,738 | |
| IwaiCosmo Holdings, Inc. | | | 5,000 | | | | 43,463 | |
| Iwasaki Electric Co., Ltd. | | | 29,000 | | | | 44,714 | |
Janome Sewing Machine Co., Ltd.(a) | | | 9,900 | | | | 73,081 | |
| Japan Digital Laboratory Co., Ltd. | | | 2,900 | | | | 45,069 | |
| JCU Corp. | | | 1,700 | | | | 68,931 | |
| Kasai Kogyo Co., Ltd. | | | 5,700 | | | | 64,558 | |
| Koatsu Gas Kogyo Co., Ltd. | | | 8,000 | | | | 53,508 | |
| Kurimoto, Ltd. | | | 3,100 | | | | 57,813 | |
| Kyowa Leather Cloth Co., Ltd. | | | 7,100 | | | | 51,511 | |
| The Michinoku Bank, Ltd. | | | 21,000 | | | | 41,818 | |
| The Mie Bank, Ltd. | | | 2,900 | | | | 59,136 | |
| MIMAKI ENGINEERING Co., Ltd. | | | 13,200 | | | | 73,818 | |
| ND Software Co., Ltd. | | | 3,600 | | | | 29,054 | |
| Nichireki Co., Ltd. | | | 7,900 | | | | 62,166 | |
| Nihon House Holdings Co., Ltd. | | | 14,900 | | | | 55,869 | |
| Nihon Nohyaku Co., Ltd. | | | 11,200 | | | | 61,163 | |
| Nippon Hume Corp. | | | 9,600 | | | | 63,549 | |
| Nippon Seisen Co., Ltd. | | | 12,000 | | | | 58,188 | |
| Nissei Plastic Industrial Co., Ltd. | | | 8,700 | | | | 68,778 | |
| Nittetsu Mining Co., Ltd. | | | 1,600 | | | | 66,760 | |
| Ohashi Technica, Inc. | | | 3,300 | | | | 44,059 | |
| Osaka Soda Co., Ltd. | | | 11,000 | | | | 47,028 | |
| Oyo Corp. | | | 4,900 | | | | 56,661 | |
| Poletowin Pitcrew Holdings, Inc. | | | 7,300 | | | | 60,734 | |
| Roland DG Corp. | | | 2,800 | | | | 66,112 | |
| Ryoden Corp. | | | 9,000 | | | | 57,857 | |
| Sankyo Seiko Co., Ltd. | | | 14,900 | | | | 48,763 | |
| Sansha Electric Manufacturing Co., Ltd. | | | 8,700 | | | | 39,511 | |
| | | Shares | | | Value (Note 2) | |
| Japan (continued) | | | | | | |
| Sanyo Trading Co., Ltd. | | | 4,500 | | | $ | 56,930 | |
| Sun Frontier Fudousan Co., Ltd. | | | 5,400 | | | | 51,476 | |
| Tabuchi Electric Co., Ltd. | | | 12,200 | | | | 38,942 | |
| Tachikawa Corp. | | | 5,400 | | | | 39,301 | |
| Tatsuta Electric Wire and Cable Co., Ltd. | | | 15,900 | | | | 63,163 | |
| Tayca Corp. | | | 12,000 | | | | 63,621 | |
| The Tochigi Bank, Ltd. | | | 15,000 | | | | 72,320 | |
| Togami Electric Manufacturing Co., Ltd. | | | 12,000 | | | | 48,907 | |
| Tokyo Tekko Co., Ltd. | | | 15,000 | | | | 65,286 | |
| Toli Corp. | | | 16,000 | | | | 57,041 | |
| Tosho Printing Co., Ltd. | | | 12,000 | | | | 54,303 | |
| The Towa Bank, Ltd. | | | 65,000 | | | | 68,698 | |
| Uchida Yoko Co., Ltd. | | | 12,000 | | | | 50,030 | |
| West Holdings Corp. | | | 8,800 | | | | 69,858 | |
| Yachiyo Industry Co., Ltd. | | | 5,900 | | | | 51,163 | |
| YAMABIKO Corp. | | | 7,200 | | | | 71,202 | |
| Yuasa Trading Co., Ltd. | | | 2,300 | | | | 55,100 | |
| Zuken, Inc. | | | 5,800 | | | | 59,371 | |
| | | | | | | | 3,777,135 | |
| | | | | | | | | |
| Luxembourg (0.49%) | | | | | | | | |
| Sword Group | | | 2,667 | | | | 79,955 | |
| | | | | | | | | |
| Malaysia (1.44%) | | | | | | | | |
| Chin Well Holdings Bhd | | | 150,300 | | | | 60,131 | |
| George Kent Malaysia Bhd | | | 129,625 | | | | 76,607 | |
| KSL Holdings Bhd | | | 185,700 | | | | 49,136 | |
| Land & General Bhd | | | 547,600 | | | | 48,951 | |
| | | | | | | | 234,825 | |
| | | | | | | | | |
| Netherlands (0.38%) | | | | | | | | |
| BinckBank NV | | | 10,472 | | | | 62,141 | |
| | | | | | | | | |
| New Zealand (0.73%) | | | | | | | | |
| Skellerup Holdings, Ltd. | | | 59,350 | | | | 60,648 | |
| Steel & Tube Holdings, Ltd. | | | 37,316 | | | | 58,439 | |
| | | | | | | | 119,087 | |
| | | | | | | | | |
| Norway (0.90%) | | | | | | | | |
BW Offshore, Ltd.(a) | | | 1,801,646 | | | | 73,990 | |
| Kvaerner ASA | | | 55,674 | | | | 73,040 | |
| | | | | | | | 147,030 | |
| | | | | | | | | |
| Pakistan (0.94%) | | | | | | | | |
| Bank Alfalah, Ltd. | | | 207,500 | | | | 58,369 | |
The Bank of Punjab(a) | | | 635,000 | | | | 94,584 | |
| | | | | | | | 152,953 | |
| | | | | | | | | |
| Poland (0.26%) | | | | | | | | |
Getin Noble Bank SA(a) | | | 126,461 | | | | 42,226 | |
| | | | | | | | | |
| Singapore (1.23%) | | | | | | | | |
| Cape PLC | | | 21,179 | | | | 53,855 | |
| CW Group Holdings, Ltd. | | | 183,500 | | | | 37,752 | |
| SHS Holdings, Ltd. | | | 389,900 | | | | 54,369 | |
54 | October 31, 2016
ALPS | Metis Global Micro Cap Fund
| Statement of Investments | October 31, 2016 |
| | Shares | | | Value (Note 2) | |
| Singapore (continued) | | | | | | |
| UMS Holdings, Ltd. | | | 122,000 | | | $ | 54,368 | |
| | | | | | | | 200,344 | |
| | | | | | | | | |
| South Africa (0.23%) | | | | | | | | |
| PPC, Ltd. | | | 93,303 | | | | 38,095 | |
| | | | | | | | | |
| South Korea (7.97%) | | | | | | | | |
| Bluecom Co., Ltd. | | | 3,746 | | | | 41,615 | |
Daeyang Electric Co., Ltd.(a) | | | 4,841 | | | | 49,026 | |
| Dong-A Hwasung Co., Ltd. | | | 10,659 | | | | 44,103 | |
| Dongyang E&P, Inc. | | | 4,360 | | | | 50,960 | |
| Hanmi Semiconductor Co., Ltd. | | | 4,145 | | | | 50,142 | |
| Hy-Lok Corp. | | | 2,801 | | | | 55,700 | |
| Hyundai Engineering Plastics Co., Ltd. | | | 6,693 | | | | 52,721 | |
| iMarketKorea, Inc. | | | 4,532 | | | | 50,571 | |
| Interpark Holdings Corp. | | | 9,743 | | | | 42,436 | |
| Kangnam Jevisco Co., Ltd. | | | 1,669 | | | | 54,333 | |
| KISCO Corp. | | | 1,531 | | | | 50,293 | |
| KONA I Co., Ltd. | | | 3,700 | | | | 38,624 | |
| Kortek Corp. | | | 4,860 | | | | 59,582 | |
| Kukdo Chemical Co., Ltd. | | | 1,001 | | | | 47,333 | |
Kwang Myung Electric Engineering Co., Ltd.(a) | | | 23,821 | | | | 66,485 | |
| NEOWIZ HOLDINGS Corp. | | | 4,201 | | | | 57,768 | |
| Sammok S-Form Co., Ltd. | | | 4,878 | | | | 58,752 | |
| SBS Contents Hub Co., Ltd. | | | 5,355 | | | | 41,250 | |
| SeAH Special Steel Co., Ltd. | | | 4,184 | | | | 70,413 | |
| Sejoong Co., Ltd. | | | 14,545 | | | | 54,635 | |
| Seoyon Electronics Co., Ltd. | | | 19,519 | | | | 53,176 | |
| SJM Co., Ltd. | | | 8,912 | | | | 47,852 | |
| TK Corp. | | | 7,002 | | | | 51,750 | |
YeaRimDang Publishing Co., Ltd.(a) | | | 9,394 | | | | 34,838 | |
| Yoosung Enterprise Co., Ltd. | | | 20,174 | | | | 71,219 | |
| | | | | | | | 1,295,577 | |
| | | | | | | | | |
| Sweden (0.79%) | | | | | | | | |
Medivir AB, B Shares(a) | | | 7,791 | | | | 57,146 | |
| Semcon AB | | | 13,912 | | | | 71,996 | |
| | | | | | | | 129,142 | |
| | | | | | | | | |
| Taiwan (5.72%) | | | | | | | | |
| Ability Enterprise Co., Ltd. | | | 99,000 | | | | 48,568 | |
| Apacer Technology, Inc. | | | 42,880 | | | | 45,028 | |
| China General Plastics Corp. | | | 95,880 | | | | 76,634 | |
| Clevo Co. | | | 59,000 | | | | 53,988 | |
| Cyberlink Corp. | | | 24,000 | | | | 47,730 | |
| Daxin Materials Corp. | | | 52,000 | | | | 58,332 | |
| Formosan Rubber Group, Inc. | | | 100,800 | | | | 46,897 | |
| Hung Poo Real Estate Development Corp. | | | 63,000 | | | | 51,804 | |
| KEE TAI Properties Co., Ltd. | | | 121,000 | | | | 38,688 | |
| Kinik Co. | | | 34,000 | | | | 56,161 | |
| Kuoyang Construction Co., Ltd. | | | 146,000 | | | | 57,375 | |
| LEE CHI Enterprises Co., Ltd. | | | 145,000 | | | | 46,385 | |
| Lion Travel Service Co., Ltd. | | | 19,000 | | | | 48,110 | |
Radium Life Tech Co., Ltd.(a) | | | 162,000 | | | | 45,929 | |
| | | Shares | | | Value (Note 2) | |
| Taiwan (continued) | | | | | | |
| Sinmag Equipment Corp. | | | 15,000 | | | $ | 70,318 | |
| We&Win Diversification Co., Ltd. | | | 165,000 | | | | 48,078 | |
| Wowprime Corp. | | | 12,000 | | | | 43,898 | |
| Yungshin Construction & Development Co., Ltd. | | | 60,000 | | | | 45,565 | |
| | | | | | | | 929,488 | |
| | | | | | | | | |
| Thailand (1.53%) | | | | | | | | |
| Asia Plus Group Holdings PCL | | | 520,900 | | | | 50,569 | |
| Dhipaya Insurance PCL | | | 48,507 | | | | 58,205 | |
| Hwa Fong Rubber Thailand PCL | | | 370,884 | | | | 47,141 | |
| Raimon Land PCL | | | 1,333,900 | | | | 47,191 | |
| Somboon Advance Technology PCL | | | 128,800 | | | | 45,267 | |
| | | | | | | | 248,373 | |
| | | | | | | | | |
| Turkey (0.28%) | | | | | | | | |
EGE Seramik Sanayi ve Ticaret AS(a) | | | 40,752 | | | | 45,753 | |
| | | | | | | | | |
| United States (20.91%) | | | | | | | | |
Alaska Communications Systems Group, Inc.(a) | | | 26,777 | | | | 43,379 | |
American Public Education, Inc.(a) | | | 1,817 | | | | 36,613 | |
| Ampco-Pittsburgh Corp. | | | 3,977 | | | | 42,952 | |
ARC Document Solutions, Inc.(a) | | | 12,508 | | | | 42,902 | |
| Atwood Oceanics, Inc. | | | 4,397 | | | | 33,549 | |
Autobytel, Inc.(a) | | | 3,515 | | | | 57,470 | |
Aware, Inc.(a) | | | 11,811 | | | | 61,712 | |
| Baldwin & Lyons, Inc., Class B | | | 2,031 | | | | 49,963 | |
| Big 5 Sporting Goods Corp. | | | 5,124 | | | | 79,421 | |
Bravo Brio Restaurant Group, Inc.(a) | | | 6,490 | | | | 29,205 | |
Bridgepoint Education, Inc.(a) | | | 7,186 | | | | 48,577 | |
| C&F Financial Corp. | | | 1,147 | | | | 47,945 | |
| CARBO Ceramics, Inc. | | | 4,139 | | | | 25,248 | |
| CDI Corp. | | | 6,430 | | | | 39,545 | |
Chart Industries, Inc.(a) | | | 2,072 | | | | 57,477 | |
Ciber, Inc.(a) | | | 38,710 | | | | 39,484 | |
| Computer Task Group, Inc. | | | 9,912 | | | | 43,216 | |
Core Molding Technologies, Inc.(a) | | | 3,568 | | | | 62,155 | |
| Crawford & Co., Class B | | | 4,490 | | | | 50,513 | |
| CSS Industries, Inc. | | | 1,877 | | | | 47,113 | |
DXP Enterprises, Inc.(a) | | | 3,178 | | | | 69,248 | |
| Federated National Holding Co. | | | 2,414 | | | | 43,235 | |
First BanCorp(a) | | | 11,784 | | | | 60,452 | |
| First Bancorp/Southern Pines NC | | | 2,841 | | | | 56,167 | |
Franklin Covey Co.(a) | | | 3,240 | | | | 59,292 | |
Geospace Technologies Corp.(a) | | | 3,231 | | | | 59,547 | |
| Gold Resource Corp. | | | 11,002 | | | | 62,491 | |
| Hallador Energy Co. | | | 7,963 | | | | 70,392 | |
| Harte-Hanks, Inc. | | | 27,477 | | | | 38,743 | |
Hawaiian Telcom Holdco, Inc.(a) | | | 2,243 | | | | 46,026 | |
| HCI Group, Inc. | | | 1,824 | | | | 49,449 | |
| Houston Wire & Cable Co. | | | 9,050 | | | | 48,418 | |
Hovnanian Enterprises, Inc., Class A(a) | | | 29,462 | | | | 45,961 | |
| Hurco Cos, Inc. | | | 1,647 | | | | 43,151 | |
| Hyster-Yale Materials Handling, Inc. | | | 834 | | | | 48,547 | |
55 | October 31, 2016
ALPS | Metis Global Micro Cap Fund
| Statement of Investments | October 31, 2016 |
| | | Shares | | | Value (Note 2) | |
| United States (continued) | | | | | | |
Iconix Brand Group, Inc.(a) | | | 7,501 | | | $ | 59,108 | |
| IDT Corp., Class B | | | 3,410 | | | | 61,005 | |
| Johnson Outdoors, Inc., Class A | | | 1,859 | | | | 66,887 | |
| LB Foster Co., Class A | | | 5,007 | | | | 62,087 | |
| Liberty Tax, Inc. | | | 3,655 | | | | 43,312 | |
Liquidity Services, Inc.(a) | | | 6,474 | | | | 57,295 | |
| Manning & Napier, Inc. | | | 6,160 | | | | 42,504 | |
Monster Worldwide, Inc.(a) | | | 19,569 | | | | 66,730 | |
NewLink Genetics Corp.(a) | | | 4,791 | | | | 58,211 | |
| OFG Bancorp | | | 5,553 | | | | 59,139 | |
| Orrstown Financial Services, Inc. | | | 2,733 | | | | 57,120 | |
PAM Transportation Services, Inc.(a) | | | 2,890 | | | | 56,933 | |
| Park-Ohio Holdings Corp. | | | 1,722 | | | | 55,018 | |
| Pzena Investment Management, Inc., Class A | | | 6,862 | | | | 49,955 | |
Radio One, Inc., Class D(a) | | | 17,387 | | | | 43,468 | |
REX American Resources Corp.(a) | | | 833 | | | | 65,799 | |
| Saga Communications, Inc., Class A | | | 1,061 | | | | 44,562 | |
| Strattec Security Corp. | | | 1,239 | | | | 43,985 | |
TravelCenters of America LLC(a) | | | 6,138 | | | | 39,283 | |
Travelzoo, Inc.(a) | | | 5,999 | | | | 61,190 | |
TRC Cos, Inc.(a) | | | 7,752 | | | | 63,179 | |
| Twin Disc, Inc. | | | 4,730 | | | | 51,131 | |
Ultra Petroleum Corp.(a) | | | 27,910 | | | | 178,344 | |
Unisys Corp.(a) | | | 6,969 | | | | 72,825 | |
VOXX International Corp.(a) | | | 16,406 | | | | 67,265 | |
| VSE Corp. | | | 1,449 | | | | 41,789 | |
Weight Watchers International, Inc.(a) | | | 4,445 | | | | 45,695 | |
ZAGG, Inc.(a) | | | 7,315 | | | | 47,548 | |
| | | | | | | | 3,400,925 | |
| | | | | | | | | |
TOTAL COMMON STOCKS (Cost $13,691,044) | | | | | | | 14,634,642 | |
| | | | | | | | | |
| PREFERRED STOCKS (1.08%) | | | | | | | | |
| Brazil (1.08%) | | | | | | | | |
| Banco ABC Brasil SA | | | 12,200 | | | | 58,669 | |
| Banco do Estado do Rio Grande do Sul SA, Class B | | | 16,400 | | | | 70,799 | |
| Centrais Eletricas Santa Catarina | | | 10,700 | | | | 46,494 | |
| | | | | | | | 175,962 | |
| | | | | | | | | |
TOTAL PREFERRED STOCKS (Cost $89,133) | | | | | | | 175,962 | |
| | 7-Day Yield | | | Shares | | | Value (Note 2) | |
| SHORT TERM INVESTMENTS (8.55%) |
| Money Market Fund (8.55%) |
| Morgan Stanley Institutional Liquidity Fund - Prime Portfolio | | | 0.587 | % | | | 1,390,997 | | | $ | 1,390,997 | |
| | | | | | | | | | | | | |
TOTAL SHORT TERM INVESTMENTS (Cost $1,390,997) | | 1,390,997 | |
| | | | | | | | | | | | | |
TOTAL INVESTMENTS (99.62%) (Cost $15,171,174) | $ | 16,201,601 | |
| | | | | | | | | | | | | |
| Other Assets In Excess Of Liabilities | (0.38 | %) | | | | | | | 61,183 | |
| NET ASSETS - 100.00% | $ | 16,262,784 | |
(a) | Non-Income Producing Security. |
For Fund compliance purposes, the Fund's industry classifications refer to any one or more of the industry sub-classifications used by one or more widely recognized market indexes or ratings group indexes, and/or as defined by Fund management. This definition may not apply for purposes of this report, which may combine industry sub-classifications for reporting ease. Industries are shown as a percent of net assets.
See Notes to Financial Statements.
56 | October 31, 2016
ALPS | Metis Global Micro Cap Fund
| Statement of Assets and Liabilities | October 31, 2016 |
| ASSETS | | | |
| Investments, at value | | $ | 16,201,601 | |
| Cash | | | 113 | |
| Foreign currency, at value (Cost $75,027) | | | 74,641 | |
| Receivable for shares sold | | | 250 | |
| Dividends and interest receivable | | | 45,131 | |
| Receivable due from advisor | | | 17,894 | |
| Deferred offering costs | | | 11,610 | |
| Prepaid expenses and other assets | | | 1,848 | |
| Total Assets | | | 16,353,088 | |
| LIABILITIES | | | | |
| Payable for foreign capital gains tax | | | 2,417 | |
| Administration and transfer agency fees payable | | | 36,992 | |
| Distribution and services fees payable | | | 840 | |
| Trustees' fees and expenses payable | | | 89 | |
| Professional fees payable | | | 17,911 | |
| Accrued expenses and other liabilities | | | 32,055 | |
| Total Liabilities | | | 90,304 | |
| NET ASSETS | | $ | 16,262,784 | |
| NET ASSETS CONSIST OF | | | | |
| Paid‐in capital | | $ | 14,284,852 | |
| Accumulated net investment income | | | 164,129 | |
| Accumulated net realized gain | | | 787,226 | |
| Net unrealized appreciation | | | 1,026,577 | |
| NET ASSETS | | $ | 16,262,784 | |
| INVESTMENTS, AT COST | | $ | 15,171,174 | |
| PRICING OF SHARES | | | | |
| Class A: | | | | |
| Net Asset Value, offering and redemption price per share | | $ | 11.48 | |
| Net Assets | | $ | 820,451 | |
| Shares of beneficial interest outstanding (unlimited number of shares, no par value common stock authorized) | | | 71,496 | |
| Maximum offering price per share ((NAV/0.9450), based on maximum sales charge of 5.50% of the offering price) | | $ | 12.15 | |
| Class C: | | | | |
Net Asset Value, offering and redemption price per share(a) | | $ | 11.40 | |
| Net Assets | | $ | 255,194 | |
| Shares of beneficial interest outstanding (unlimited number of shares, no par value common stock authorized) | | | 22,381 | |
| Class I: | | | | |
| Net Asset Value, offering and redemption price per share | | $ | 11.50 | |
| Net Assets | | $ | 15,187,139 | |
| Shares of beneficial interest outstanding (unlimited number of shares, no par value common stock authorized) | | | 1,320,860 | |
(a) | Redemption price per share may be reduced for any applicable contingent deferred sales charge. For a description of a possible sales charge, please see the Fund's Prospectus. |
See Notes to Financial Statements.
57 | October 31, 2016
ALPS | Metis Global Micro Cap Fund
| Statement of Operations | For the Period December 24, 2015 (Commencement) to October 31, 2016 |
| INVESTMENT INCOME | | | |
| Dividends | | $ | 311,411 | |
| Foreign taxes withheld on dividends | | | (27,057 | ) |
| Total Investment Income | | | 284,354 | |
| | | | | |
| EXPENSES | | | | |
| Investment advisory fees | | | 129,187 | |
| Administrative fees | | | 53,959 | |
| Transfer agency fees | | | 306 | |
| Distribution and service fees | | | | |
| Class A | | | 538 | |
| Class C | | | 562 | |
| Professional fees | | | 21,544 | |
| Delegated transfer agent equivalent services | | | | |
| Class I | | | 1,064 | |
| Reports to shareholders and printing fees | | | 2,373 | |
| State registration fees | | | 3,127 | |
| Custody fees | | | 66,122 | |
| Trustees' fees and expenses | | | 230 | |
| Offering costs | | | 65,777 | |
| Miscellaneous expenses | | | 8,745 | |
| Total Expenses | | | 353,534 | |
| Less fees waived/reimbursed by investment advisor (Note 8) | | | | |
| Class A | | | (3,182 | ) |
| Class C | | | (1,243 | ) |
| Class I | | | (172,314 | ) |
| Net Expenses | | | 176,795 | |
| Net Investment Income | | | 107,559 | |
| Net realized gain on investments | | | 789,078 | |
| Net realized gain on foreign currency transactions | | | 1,983 | |
| Net realized loss on foreign capital gains tax | | | (141 | ) |
| Net Realized Gain | | | 790,920 | |
| Net change in unrealized appreciation on investments | | | 1,030,427 | |
| Net change in unrealized depreciation on translation of assets and liabilities denominated in foreign currencies | | | (1,433 | ) |
| Net change in unrealized loss on foreign capital gains tax | | | (2,417 | ) |
| Net Change in Unrealized Appreciation | | | 1,026,577 | |
| NET REALIZED AND UNREALIZED GAIN ON INVESTMENTS | | | 1,817,497 | |
| NET INCREASE IN NET ASSETS RESULTING FROM OPERATIONS | | $ | 1,925,056 | |
See Notes to Financial Statements.
58 | October 31, 2016
ALPS | Metis Global Micro Cap Fund
Statement of Changes in Net Assets
| | | For the Period December 24, 2015 (Commencement) to October 31, 2016 | |
| OPERATIONS | | | |
| Net investment income | | $ | 107,559 | |
| Net realized gain | | | 790,920 | |
| Net change in unrealized appreciation | | | 1,026,577 | |
| Net Increase in Net Assets Resulting from Operations | | | 1,925,056 | |
| | | | | |
| BENEFICIAL INTEREST TRANSACTIONS (NOTE 6) | | | | |
| Shares sold | | | | |
| Class A | | | 821,225 | |
| Class C | | | 250,590 | |
| Class I | | | 13,303,600 | |
| Shares redeemed | | | | |
| Class A | | | (10,255 | ) |
| Class I | | | (27,432 | ) |
| Net Increase in Net Assets Derived from Beneficial Interest Transactions | | | 14,337,728 | |
| | | | | |
| Net increase in net assets | | | 16,262,784 | |
| | | | | |
| NET ASSETS | | | | |
| Beginning of year | | | – | |
| End of year * | | $ | 16,262,784 | |
| *Including accumulated net investment income of: | | $ | 164,129 | |
See Notes to Financial Statements.
59 | October 31, 2016
ALPS | Metis Global Micro Cap Fund – Class A
Financial Highlights
Selected data for a share of beneficial interest outstanding throughout the periods indicated:
| | | For the Period December 24, 2015 (Commencement) to October 31, 2016 | |
| Net asset value, beginning of period | | $ | 10.00 | |
| | | | | |
| INCOME FROM INVESTMENT OPERATIONS: | | | | |
Net investment income(a) | | | 0.11 | |
| Net realized and unrealized gain | | | 1.36 | |
| Total from investment operations | | | 1.47 | |
| | | | | |
| REDEMPTION FEES ADDED TO PAID‐IN CAPITAL (NOTE 6) | | | 0.01 | |
| Net increase in net asset value | | | 1.48 | |
| Net asset value, end of year | | $ | 11.48 | |
TOTAL RETURN(b) | | | 14.80 | % |
| | | | | |
| RATIOS/SUPPLEMENTAL DATA: | | | | |
| Net assets, end of year (000s) | | $ | 820 | |
| Ratio of expenses to average net assets excluding fee waivers and reimbursements | | | 4.47 | %(c) |
| Ratio of expenses to average net assets including fee waivers and reimbursements | | | 2.10 | %(c) |
| Ratio of net investment income to average net assets | | | 1.12 | %(c) |
Portfolio turnover rate(d) | | | 77 | % |
(a) | Calculated using the average shares method. |
(b) | Total returns are for the period indicated and have not been annualized. Total returns would have been lower had certain expenses not been waived during the period. Returns shown do not reflect the deduction of taxes that a shareholder would pay on Fund distributions or the redemption of Fund shares. Returns shown exclude any applicable sales charges. |
(d) | Portfolio turnover rate for periods less than one full year have not been annualized. |
See Notes to Financial Statements.
60 | October 31, 2016
ALPS | Metis Global Micro Cap Fund – Class C
Financial Highlights
Selected data for a share of beneficial interest outstanding throughout the periods indicated:
| | | For the Period December 24, 2015 (Commencement) to October 31, 2016 | |
| Net asset value, beginning of period | | $ | 10.00 | |
| | | | | |
| INCOME FROM INVESTMENT OPERATIONS: | | | | |
Net investment income(a) | | | 0.02 | |
| Net realized and unrealized gain | | | 1.38 | |
| Total from investment operations | | | 1.40 | |
| | | | | |
| Net increase in net asset value | | | 1.40 | |
| Net asset value, end of year | | $ | 11.40 | |
TOTAL RETURN(b) | | | 14.00 | % |
| | | | | |
| RATIOS/SUPPLEMENTAL DATA: | | | | |
| Net assets, end of year (000s) | | $ | 255 | |
| Ratio of expenses to average net assets excluding fee waivers and reimbursements | | | 4.91 | %(c) |
| Ratio of expenses to average net assets including fee waivers and reimbursements | | | 2.70 | %(c) |
| Ratio of net investment income to average net assets | | | 0.18 | %(c) |
Portfolio turnover rate(d) | | | 77 | % |
(a) | Calculated using the average shares method. |
(b) | Total returns are for the period indicated and have not been annualized. Total returns would have been lower had certain expenses not been waived during the period. Returns shown do not reflect the deduction of taxes that a shareholder would pay on Fund distributions or the redemption of Fund shares. Returns shown exclude any applicable sales charges. |
(d) | Portfolio turnover rate for periods less than one full year have not been annualized. |
See Notes to Financial Statements.
61 | October 31, 2016
ALPS | Metis Global Micro Cap Fund – Class I
Financial Highlights
Selected data for a share of beneficial interest outstanding throughout the periods indicated:
| | | For the Period December 24, 2015 (Commencement) to October 31, 2016 | |
| Net asset value, beginning of period | | $ | 10.00 | |
| | | | | |
| INCOME FROM INVESTMENT OPERATIONS: | | | | |
Net investment income(a) | | | 0.09 | |
| Net realized and unrealized gain | | | 1.41 | |
| Total from investment operations | | | 1.50 | |
| | | | | |
| Net increase in net asset value | | | 1.50 | |
| Net asset value, end of year | | $ | 11.50 | |
TOTAL RETURN(b) | | | 15.00 | % |
| | | | | |
| RATIOS/SUPPLEMENTAL DATA: | | | | |
| Net assets, end of year (000s) | | $ | 15,187 | |
| Ratio of expenses to average net assets excluding fee waivers and reimbursements | | | 3.40 | %(c) |
| Ratio of expenses to average net assets including fee waivers and reimbursements | | | 1.70 | %(c) |
| Ratio of net investment income to average net assets | | | 1.04 | %(c) |
Portfolio turnover rate(d) | | | 77 | % |
(a) | Calculated using the average shares method. |
(b) | Total returns are for the period indicated and have not been annualized. Total returns would have been lower had certain expenses not been waived during the period. Returns shown do not reflect the deduction of taxes that a shareholder would pay on Fund distributions or the redemption of Fund shares. |
(d) | Portfolio turnover rate for periods less than one full year have not been annualized. |
See Notes to Financial Statements.
62 | October 31, 2016
ALPS | Red Rocks Listed Private Equity Fund
| Management Commentary | October 31, 2016 (Unaudited) |
Overview
Priced to Perfection?
Private equity is a long cycle asset class. It takes time to find the right company in which to invest at the right price. It takes even longer to fix and/or build that company; people, systems, product/service rationalization, pricing, sales channels, etc. Done properly with sufficient time and favorable capital markets the results can be good. Sometimes quite good. At the end of the investment stage, a private equity firm hopes to make a multiple on their invested capital through an exit; IPO (Initial Public Offering), strategic sale, trade buyer, MBO (Management BuyOut) or sale to another private equity buyer. At the same time a lot can go wrong. Risks include weak management, poor implementation, incorrect buy side assumptions, product/service issues, increased competition, regulatory changes, challenging capital markets, a contraction of the cash flow/EBITDA- (Earnings Before Income Taxes, Depreciation and Amortization) multiple within the sector, etc. Many of these risks can be mitigated. For example, private equity firms try to buy a company at a low EBITDA-multiple to mitigate the multiple-contraction risk. It gives them a cushion if multiples don’t expand. The old expression buy low, sell high comes to mind.
It is this consideration (the EBITDA-multiple that a private equity firm pays when they make their initial investment) that has a lot of experienced private equity professionals asking themselves if they’re ‘paying too much in the current market for new investments?’ It appears that companies are priced to perfection. Everything has to go perfectly for the private equity firm to make their assumed return on investment. This is not a new phenomenon. It’s been building over the last several years. The same high valuations that have created near-ideal conditions to sell existing, older investments have made it difficult to make new investments at attractive EBITDA-multiples. Unless a company needs fixing or requires a restart, the valuations are frequently “full”; oftentimes “very full”. Several executives within the private equity community have pointed to the Federal Reserve’s near-zero interest rate policies. A speaker at the recent (September 2016) Wall Street Journal Private Equity Analyst Conference in New York said: “For any professional investor, this is the most difficult period we’ve ever experienced. You have historically high multiples of cash flows [EBITDA] and low yields. I’ve never seen it in my career. It’s the most treacherous moment.” The speaker mentioned that his firm is not finding value in large leveraged buyouts of publicly-traded companies. Instead they are looking at smaller companies with lower leverage and, hopefully, with lower EBITDA multiples. Net-net: That particular private equity company continues to sell more assets than it is buying. Probably because of valuations.
And therein lies the quandary. As long as there are no hiccups or a market correction, high EBITDA-multiple entry valuations work. If there is a hiccup or a market reset, then it doesn’t work so well. Are companies priced to perfection? The answer to that rests in the eye of the beholder.
Portfolio Review
For the twelve months ended October 31, 2016, the Fund’s A shares, LPEFX, returned 0.76%, (Class A delivered a net return of -4.73% at MOP), compared with 1.18% and 0.48% for the MSCI World Index and the Red Rocks Global Listed Private Equity Index, respectively .
During the period, we added Alleghany Corp, Brookfield Infrastructure Partners LP, FNFV Group, Fortive Group, IAC/Interactive Corp, Indus Holding AG, Intermediate Capital Group PLC, Kinnevik AB, Liberty SiriusXM Group, Liberty Ventures, Macquarie Infrastructure Company and Oaktree Capital Group, while we exited Altamir, Apollo Global Management, Ares Management LP, Fifth Street Senior Floating Rate Corp, ICG Graphite Enterprise Trust PLC, IP Group PLC, Oakley Capital Investments, Pantheon International Participations PLC, Ratos AB and Sofina.
Net contributors to performance for the period included:
| ● | Aurelius Equity Opportunities SE CO KGAA |
Net detractors to performance for the period included:
Beyond full valuations, several macro factors affected performance, most notably:
| ● | UK vote to leave the EU (“Brexit”) - the Fund has significant exposure to British Pound-denominated assets. After the Brexit vote, the British Pound depreciated sharply relative to the US dollar and other major currencies, which was a detractor to performance. |
| ● | Uncertainty surrounding U.S. Presidential Election – at a very high level, the proposed policies of the two major party presidential candidates were either, a) general continuation of the fiscal, economic and foreign policies of the current administration, or b) significant policy changes, especially in economic and trade policies. The uncertainty of which candidate’s policies would be enacted was reflected in lower valuations in many of the Fund’s holdings. |
| ● | Anticipation of the Federal Reserve raising interest rates – listed private equity companies use equity and debt capital to acquire and improve their portfolio companies. Their cost of capital is a significant component of their cost structure and is influenced by the interest rates established by the U.S. Federal Reserve. Generally, lower interest rates result in lower borrowing costs and potentially improve margins of listed private equity companies, while rising rates can increase borrowing costs, reduce margins and result in lower valuations of listed private equity companies. |
63 | October 31, 2016
ALPS | Red Rocks Listed Private Equity Fund
| Management Commentary | October 31, 2016 (Unaudited) |
| ● | Continued strengthening of the US dollar – the Fund has significant exposure to non-US dollar denominated assets. When the US dollar appreciates in value relative to other currencies, the impact is lower valuations and a detractor to performance. |
Outlook
I would be hard pressed to cite any institutional investor who isn’t losing some degree of sleep these days because of elevated valuations. Some say ‘high’. And yet with a near-zero to zero interest rate policy from the Federal Reserve and other Central Banks that’s created a new reality. It’s pushing equity valuations up for both public and private companies. Not to worry say some pundits. Where else are you going to put your money? Hmmm.
Private equity managers don’t need to put money to work. They’d like to. That’s what they’re tasked to do by their institutional limited partners. But they don’t need to; their capital usually comes in the form of callable commitments, not forced upon them to invest. They’re patient. They can wait out the cycle. Unfortunately, this period of elevated–to-high valuations appears that it may last longer than the usual cycle. I guess we’ll have to see what gives first.
As always, we appreciate your continued support and interest in Red Rocks and the Listed Private Equity strategy.
Adam Goldman
Co-Portfolio Manager
The views of the author and information discussed in this commentary are as of the date of publication, are subject to change, and may not reflect the writer's current views. The views expressed are those of the author only, and represent an assessment of market conditions at a specific point in time, are opinions only and should not be relied upon as investment advice regarding a particular investment or markets in general. Such information does not constitute a recommendation to buy or sell specific securities or investment vehicles. It should not be assumed that any investment will be profitable or will equal the performance of the fund(s) or any securities or any sectors mentioned in this letter. The subject matter contained in this letter has been derived from several sources believed to be reliable and accurate at the time of compilation. Neither ALPS Advisors, Inc., Red Rocks Capital LLC, nor the Fund accepts any liability for losses either direct or consequential caused by the use of this information.
Diversification cannot guarantee gain or prevent losses.
64 | October 31, 2016
ALPS | Red Rocks Listed Private Equity Fund
| Performance Update | October 31, 2016 (Unaudited) |
Performance of $10,000 Initial Investment (as of October 31, 2016)
Comparison of change in value of a $10,000 investment (includes maximum sales charges of 5.50%)
The chart above represents historical performance of a hypothetical investment of $10,000 in the Fund since inception. Past performance does not guarantee future results. This chart does not reflect the deduction of taxes that a shareholder would pay on Fund distributions or the redemption of Fund shares.
Average Annual Total Returns (as of October 31, 2016)
| | 6 Month | 1 Year | 3 Year | 5 Year | Since Inception^ | Total Expense Ratio | What You Pay* |
| Class A (NAV) | 3.11% | 0.76% | 3.10% | 11.49% | 0.25% | 2.03% | 2.03% |
| Class A (MOP) | -2.63% | -4.73% | 1.17% | 10.22% | -0.39% |
| Class C (NAV) | 2.90% | 0.34% | 2.52% | 10.77% | -0.51% | 2.68% | 2.68% |
| Class C (CDSC) | 1.90% | -0.59% | 2.52% | 10.77% | -0.51% |
| Class I | 3.40% | 1.27% | 3.48% | 11.84% | 0.56% | 1.73% | 1.73% |
| Class R | 3.20% | 0.67% | 3.05% | 11.50% | 0.03% | 2.17% | 2.17% |
MSCI World Index1 | 2.55% | 1.79% | 4.40% | 9.65% | 3.47% | | |
Red Rocks Global Listed Private Equity Index2 | 4.36% | 0.48% | 2.91% | 11.54% | 1.10% | | |
Performance data quoted represents past performance. Past performance does not guarantee future results. Investment return and principal value of an investment will fluctuate so that an investor’s shares, when sold or redeemed, may be worth more or less than the original cost. Current performance data may be higher or lower than actual data quoted. For the most current month-end performance data, please call 1-866-759-5679.
Maximum Offering Price (MOP) for Class A shares includes the Fund’s maximum sales charge of 5.50%. Performance shown at NAV does not include these sales charges and would have been lower had it been taken into account. If you invest $1 million or more, either as a lump sum or through the Fund’s accumulation or letter of intent programs, you can purchase Class A shares without an initial sales charge (load). A Contingent Deferred Sales Charge (“CDSC”) of 1.00% may apply to Class C shares redeemed within the first 12 months after a purchase, and on Class A shares redeemed within the first 18 months after a purchase in excess of $1 million. The Fund imposes a 2.00% redemption fee on shares held for less than 90 days.
Performance less than 1 year is cumulative.
65 | October 31, 2016
ALPS | Red Rocks Listed Private Equity Fund
| Performance Update | October 31, 2016 (Unaudited) |
Performance shown for Class C shares prior to June 30, 2010 reflects the historical performance of the Fund’s Class A shares, calculated using the fees and expenses of Class C shares.
| 1 | MSCI World Index: Morgan Stanley Capital International’s market capitalization weighted index is composed of companies representative of the market structure of 22 developed market countries in North America, Europe and the Asia/Pacific Region. The index is not actively managed and does not reflect any deduction for fees, expenses or taxes. An investor may not invest directly in an index. |
| 2 | The Red Rocks Global Listed Private Equity Index includes securities, ADRs and GDRs of 40 to 75 private equity companies, including business development companies, master limited partnerships and other vehicles whose principal business is to invest in, lend capital to or provide services to privately held companies. The Red Rocks Global Listed Private Equity Index is managed by the Fund’s Sub-Advisor. An investor may not invest directly in an index. |
| ^ | Fund inception date of December 31, 2007 for Classes A, I, and R; Fund inception date June 30, 2010 for Class C. |
| * | What You Pay reflects the Advisor's and Sub-Advisor’s decision to contractually limit expenses through February 28, 2017 and Acquired Fund Fees and Expenses of 0.57%. Please see the current prospectus for additional information. |
The table does not reflect the deduction of taxes that a shareholder would pay on Fund distributions or the redemption of Fund shares.
This Fund is not suitable for all investors and is subject to investment risks, including possible loss of the principal amount invested.
Listed Private Equity Companies are subject to various risks depending on their underlying investments, which could include, but are not limited to, additional liquidity risk, industry risk, non-U.S. security risk, currency risk, credit risk, managed portfolio risk and derivatives risk (derivatives risk is the risk that the value of the Listed Private Equity Companies’ derivative investments will fall because of pricing difficulties or lack of correlation with the underlying investment).
There are inherent risks in investing in private equity companies, which encompass financial institutions or vehicles whose principal business is to invest in and lend capital to privately held companies. Generally, little public information exists for private and thinly traded companies, and there is a risk that investors may not be able to make a fully informed investment decision.
Listed Private Equity Companies may have relatively concentrated investment portfolios, consisting of a relatively small number of holdings. A consequence of this limited number of investments is that the aggregate returns realized may be adversely impacted by the poor performance of a small number of investments, or even a single investment, particularly if a company experiences the need to write down the value of an investment.
Certain of the Fund’s investments may be exposed to liquidity risk due to low trading volume, lack of a market maker or legal restrictions limiting the ability of the Fund to sell particular securities at an advantageous price and/or time. As a result, these securities may be more difficult to value. Foreign investing involves special risks, such as currency fluctuations and political uncertainty. The Fund invests in derivatives and is subject to the risk that the value of those derivative investments will fall because of pricing difficulties or lack of correlation with the underlying investment.
There is no guarantee that the Fund will continue to hold any one particular security or stay invested in any one particular company. The composition of the Fund's top holdings is subject to change. Performance figures are historical and reflect the change in share price, reinvested distributions, changes in net asset value, sales charges and capital gains distributions, if any.
Not FDIC Insured – No Bank Guarantee – May Lose Value
66 | October 31, 2016
ALPS | Red Rocks Listed Private Equity Fund
| Performance Update | October 31, 2016 (Unaudited) |
Top Ten Holdings (as a % of Net Assets) †
| Aurelius Equity Opportunities SE & Co. KGaA | 6.66% |
| 3i Group PLC | 5.18% |
| Brookfield Asset Management, Inc., Class A | 5.14% |
| SVG Capital PLC | 4.84% |
| Ackermans & van Haaren N.V. | 4.53% |
| HarbourVest Global Private Equity, Ltd. | 4.49% |
| Onex Corp. | 4.28% |
| The Blackstone Group LP | 4.16% |
| Investor AB, B Shares | 4.12% |
| Schouw & Co. AB | 3.48% |
| Top Ten Holdings | 46.88% |
| † | Holdings are subject to change and my not reflect the current or future position of the portfolio. Table presents indicative values only. |
Industry Sector Allocation (as a % of Net Assets)
67 | October 31, 2016
ALPS | Red Rocks Listed Private Equity Fund
| Statement of Investments | October 31, 2016 |
| | | Shares | | | Value (Note 2) | |
| CLOSED‐END FUNDS (7.64%) | | | | | | |
| Apax Global Alpha, Ltd. | | | 3,455,779 | | | $ | 6,059,298 | |
HBM Healthcare Investments AG,
Class A | 84,144 | | | | 8,490,504 | |
| HgCapital Trust PLC | | | 590,871 | | | | 10,479,552 | |
| | | | | | | | 25,029,354 | |
| | | | | | | | | |
| TOTAL CLOSED‐END FUNDS | | | | | | | | |
| (Cost $25,225,468) | | | | | | | 25,029,354 | |
| | | | | | | | | |
| COMMON STOCKS (90.50%) | | | | | | | | |
| Communications (4.80%) | | | | | | | | |
| Internet (3.57%) | | | | | | | | |
| IAC/InterActiveCorp | | | 113,449 | | | | 7,310,653 | |
Liberty Ventures, Series A(a) | | | 109,461 | | | | 4,367,494 | |
| | | | | | | | 11,678,147 | |
| | | | | | | | | |
| Media (1.23%) | | | | | | | | |
Liberty Media Corp-Liberty SiriusXM, Class A(a) | | | 121,233 | | | | 4,033,422 | |
| | | | | | | | | |
| TOTAL COMMUNICATIONS | | 15,711,569 | |
| | | | | | | | | |
| Consumer, Non-Cyclical (1.39%) | | | | | | | | |
| Commercial Services (1.39%) | | | | | | | | |
| Macquarie Infrastructure Corp. | | | 55,414 | | | | 4,533,419 | |
| | | | | | | | | |
| TOTAL CONSUMER, NON-CYCLICAL | | 4,533,419 | |
| | | | | | | | | |
| Diversified (12.35%) | | | | | | | | |
| Holding Companies-Diversified Operations (12.35%) | |
| Ackermans & van Haaren N.V. | | | 106,870 | | | | 14,846,412 | |
| Remgro, Ltd. | | | 263,084 | | | | 4,370,507 | |
| Schouw & Co. AB | | | 179,602 | | | | 11,411,001 | |
| Wendel SA | | | 85,339 | | | | 9,817,759 | |
| | | | | | | | 40,445,679 | |
| | | | | | | | | |
| TOTAL DIVERSIFIED | | | | | | | 40,445,679 | |
| | | | | | | | | |
| Financials (65.31%) | | | | | | | | |
| Diversified Financial Services (10.00%) | | | | | |
| The Blackstone Group LP | | | 543,932 | | | | 13,614,618 | |
| The Carlyle Group LP | | | 208,559 | | | | 3,232,665 | |
FNFV Group(a) | | | 571,512 | | | | 6,886,720 | |
| Intermediate Capital Group PLC | | | 787,000 | | | | 5,832,712 | |
| KKR & Co. LP | | | 223,876 | | | | 3,176,800 | |
| | | | | | | | 32,743,515 | |
| | | | | | | | | |
| Insurance (2.83%) | | | | | | | | |
Alleghany Corp.(a) | | | 17,946 | | | | 9,263,905 | |
| | | Shares | | | Value (Note 2) | |
| Investment Companies (34.88%) | | | | | | |
| 3i Group PLC | | | 2,066,675 | | | $ | 16,973,694 | |
| Ares Capital Corp. | | | 608,188 | | | | 9,305,276 | |
| Aurelius Equity Opportunities SE & Co. KGaA | | | 366,006 | | | | 21,808,791 | |
| Eurazeo SA | | | 129,973 | | | | 7,480,602 | |
| Grand Parade Investments, Ltd. | | | 5,246,766 | | | | 1,459,192 | |
| Hosken Consolidated Investments, Ltd. | | | 501,484 | | | | 4,723,350 | |
| Investment AB Kinnevik, B Shares | | | 212,640 | | | | 5,377,122 | |
| Investor AB, B Shares | | | 379,900 | | | | 13,505,742 | |
| mutares AG | | | 71,140 | | | | 1,040,602 | |
| Oaktree Capital Group LLC | | | 63,868 | | | | 2,656,909 | |
| Onex Corp. | | | 216,744 | | | | 14,019,764 | |
SVG Capital PLC(a) | | | 1,844,285 | | | | 15,858,278 | |
| | | | | | | | 114,209,322 | |
| | | | | | | | | |
| Private Equity (12.47%) | | | | | | | | |
Castle Private Equity, Ltd.(a) | | | 192,983 | | | | 3,003,323 | |
| Electra Private Equity PLC | | | 165,299 | | | | 8,710,138 | |
HarbourVest Global Private Equity, Ltd.(a) | 1,116,204 | | | | 14,687,021 | |
Riverstone Energy, Ltd.(a) | | | 534,414 | | | | 8,137,291 | |
| Standard Life European Private Equity Trust PLC, Ordinary Shares | | | 1,822,000 | | | | 6,300,115 | |
| | | | | | | | 40,837,888 | |
| | | | | | | | | |
| Real Estate (5.13%) | | | | | | | | |
| Brookfield Asset Management, Inc., Class A | | | 480,145 | | | | 16,814,678 | |
| | | | | | | | | |
| TOTAL FINANCIALS | | | | | | | 213,869,308 | |
| | | | | | | | | |
| Industrials (5.31%) | | | | | | | | |
| Electronics (0.79%) | | | | | | | | |
| Fortive Corp. | | | 50,386 | | | | 2,572,205 | |
| | | | | | | | | |
| Miscellaneous Manufacturers (4.52%) | | | | | |
| Danaher Corp. | | | 111,215 | | | | 8,735,939 | |
| Indus Holding AG | | | 103,000 | | | | 6,072,897 | |
| | | | | | | | 14,808,836 | |
| | | | | | | | | |
| TOTAL INDUSTRIALS | | | | | | | 17,381,041 | |
68 | October 31, 2016
ALPS | Red Rocks Listed Private Equity Fund
| Statement of Investments | October 31, 2016 |
| | | Shares | | | Value (Note 2) | |
| Utilities (1.34%) | | | | | | |
| Electric (1.34%) | | | | | | |
| Brookfield Infrastructure Partners LP | | | 130,102 | | | $ | 4,401,351 | |
| | | | | | | | | |
| TOTAL UTILITIES | | 4,401,351 | |
| | | | | | | | | |
TOTAL COMMON STOCKS (Cost $273,612,431) | | 296,342,367 | |
| | | 7-Day Yield | | | Shares | | | Value (Note 2) | |
| SHORT TERM INVESTMENTS (2.32%) |
| Money Market Fund (2.32%) |
| State Street Institutional Treasury Plus Money Market Fund | | | 0.221 | % | | | 7,592,066 | | | | 7,592,066 | |
| | | | | | | | | | | | | |
TOTAL SHORT TERM INVESTMENTS (Cost $7,592,066) | | 7,592,066 | |
| | | | | | | | | | | | | |
TOTAL INVESTMENTS (100.46%) (Cost $306,429,965) | $ | 328,963,787 | |
| | | | | | | | | | | | | |
| Liabilities In Excess Of Other Assets (-0.46%) | | (1,515,805 | ) |
| | | | | | | | | | | | | |
| NET ASSETS (100.00%) | $ | 327,447,982 | |
(a) | Non-Income Producing Security. |
For Fund compliance purposes, the Fund's industry classifications refer to any one or more of the industry sub-classifications used by one or more widely recognized market indexes or ratings group indexes, and/or as defined by Fund management. This definition may not apply for purposes of this report, which may combine industry sub-classifications for reporting ease. Industries are shown as a percent of net assets.
See Notes to Financial Statements.
69 | October 31, 2016
ALPS | Red Rocks Listed Private Equity Fund
| Statement of Assets and Liabilities | October 31, 2016 |
| ASSETS | | | |
| Investments, at value | | $ | 328,963,787 | |
| Foreign currency, at value (Cost $9,536) | | | 9,517 | |
| Receivable for investments sold | | | 452,767 | |
| Receivable for shares sold | | | 182,151 | |
| Dividends receivable | | | 769,752 | |
| Prepaid expenses and other assets | | | 11,432 | |
| Total Assets | | | 330,389,406 | |
| LIABILITIES | | | | |
| Payable for investments purchased | | | 2,157,270 | |
| Payable for shares redeemed | | | 231,478 | |
| Investment advisory fees payable | | | 236,223 | |
| Administration and transfer agency fees payable | | | 112,198 | |
| Distribution and services fees payable | | | 116,727 | |
| Professional fees payable | | | 31,108 | |
| Custody fees payable | | | 20,049 | |
| Accrued expenses and other liabilities | | | 36,371 | |
| Total Liabilities | | | 2,941,424 | |
| NET ASSETS | | $ | 327,447,982 | |
| NET ASSETS CONSIST OF | | | | |
| Paid-in capital | | $ | 318,153,853 | |
| Accumulated net investment loss | | | (7,312,477 | ) |
| Accumulated net realized loss | | | (5,850,998 | ) |
| Net unrealized appreciation | | | 22,457,604 | |
| NET ASSETS | | $ | 327,447,982 | |
| INVESTMENTS, AT COST | | $ | 306,429,965 | |
| PRICING OF SHARES | | | | |
| Class A: | | | | |
| Net Asset Value, offering and redemption price per share | | $ | 6.29 | |
| Net Assets | | $ | 128,920,251 | |
| Shares of beneficial interest outstanding (unlimited number of shares, no par value common stock authorized) | | | 20,482,642 | |
| Maximum offering price per share ((NAV/0.9450), based on maximum sales charge of 5.50% of the offering price) | | $ | 6.66 | |
| Class C: | | | | |
Net Asset Value, offering and redemption price per share(a) | | $ | 6.04 | |
| Net Assets | | $ | 14,784,428 | |
| Shares of beneficial interest outstanding (unlimited number of shares, no par value common stock authorized) | | | 2,449,722 | |
| Class I: | | | | |
| Net Asset Value, offering and redemption price per share | | $ | 6.39 | |
| Net Assets | | $ | 180,891,576 | |
| Shares of beneficial interest outstanding (unlimited number of shares, no par value common stock authorized) | | | 28,325,532 | |
| Class R: | | | | |
| Net Asset Value, offering and redemption price per share | | $ | 5.48 | |
| Net Assets | | $ | 2,851,727 | |
| Shares of beneficial interest outstanding (unlimited number of shares, no par value common stock authorized) | | | 520,739 | |
(a) | Redemption price per share may be reduced for any applicable contingent deferred sales charge. For a description of a possible sales charge, please see the Fund's Prospectus. |
See Notes to Financial Statements.
70 | October 31, 2016
ALPS | Red Rocks Listed Private Equity Fund
| Statement of Operations | For the Year Ended October 31, 2016 |
| INVESTMENT INCOME | | | |
| Dividends | | $ | 11,251,220 | |
| Foreign taxes withheld on dividends | | | (919,960 | ) |
| Total Investment Income | | | 10,331,260 | |
| | | | | |
| EXPENSES | | | | |
| Investment advisory fees | | | 3,357,874 | |
| Administrative fees | | | 320,901 | |
| Transfer agency fees | | | 314,669 | |
| Distribution and service fees | | | | |
| Class A | | | 535,662 | |
| Class C | | | 157,929 | |
| Class R | | | 15,198 | |
| Professional fees | | | 42,337 | |
| Delegated transfer agent equivalent services | | | | |
| Class A | | | 8,642 | |
| Class C | | | 9,104 | |
| Class I | | | 192,020 | |
| Class R | | | 805 | |
| Reports to shareholders and printing fees | | | 101,372 | |
| State registration fees | | | 83,097 | |
| SEC registration fees | | | 123 | |
| Insurance fees | | | 4,931 | |
| Custody fees | | | 82,889 | |
| Trustees' fees and expenses | | | 11,426 | |
| Miscellaneous expenses | | | 12,887 | |
| Total Expenses | | | 5,251,866 | |
| Net Investment Income | | | 5,079,394 | |
| Net realized gain on investments | | | 5,325,295 | |
| Net realized loss on foreign currency transactions | | | (186,469 | ) |
| Net Realized Gain | | | 5,138,826 | |
| Net change in unrealized depreciation on investments | | | (18,101,736 | ) |
| Net change in unrealized depreciation on translation of assets and liabilities denominated in foreign currencies | | | (45,831 | ) |
| Net Change in Unrealized Depreciation | | | (18,147,567 | ) |
| NET REALIZED AND UNREALIZED LOSS ON INVESTMENTS | | | (13,008,741 | ) |
| NET DECREASE IN NET ASSETS RESULTING FROM OPERATIONS | | $ | (7,929,347 | ) |
See Notes to Financial Statements.
71 | October 31, 2016
ALPS | Red Rocks Listed Private Equity Fund
Statements of Changes in Net Assets
| | | For the Year Ended October 31, 2016 | | | For the Year Ended October 31, 2015 | |
| OPERATIONS | | | | | | |
| Net investment income | | $ | 5,079,394 | | | $ | 4,260,492 | |
| Net realized gain | | | 5,138,826 | | | | 36,440,573 | |
| Net realized gain distributions from other investment companies | | | – | | | | 6,673 | |
| Net change in unrealized depreciation | | | (18,147,567 | ) | | | (13,183,350 | ) |
| Net Increase/(Decrease) in Net Assets Resulting from Operations | | | (7,929,347 | ) | | | 27,524,388 | |
| | | | | | | | | |
| DISTRIBUTIONS | | | | | | | | |
| Dividends to shareholders from net investment income | | | | | | | | |
| Class A | | | (6,248,174 | ) | | | (6,787,971 | ) |
| Class C | | | (630,713 | ) | | | (546,212 | ) |
| Class I | | | (10,024,183 | ) | | | (8,199,257 | ) |
| Class R | | | (128,992 | ) | | | (38,970 | ) |
| Dividends to shareholders from net realized gains | | | | | | | | |
| Class A | | �� | (7,618,574 | ) | | | (640,746 | ) |
| Class C | | | (793,436 | ) | | | (55,244 | ) |
| Class I | | | (12,028,227 | ) | | | (732,422 | ) |
| Class R | | | (157,523 | ) | | | (3,531 | ) |
| Net Increase/ (Decrease) in Net Assets from Distributions | | | (37,629,822 | ) | | | 17,004,353 | |
| | | | | | | | | |
| BENEFICIAL INTEREST TRANSACTIONS (NOTE 6) | | | | | | | | |
| Shares sold | | | | | | | | |
| Class A | | | 31,102,997 | | | | 75,334,373 | |
| Class C | | | 2,197,631 | | | | 5,854,839 | |
| Class I | | | 84,505,922 | | | | 130,086,390 | |
| Class R | | | 1,259,547 | | | | 2,675,544 | |
| Dividends reinvested | | | | | | | | |
| Class A | | | 12,476,384 | | | | 6,770,481 | |
| Class C | | | 933,873 | | | | 409,526 | |
| Class I | | | 14,054,048 | | | | 4,364,013 | |
| Class R | | | 251,373 | | | | 41,018 | |
| Shares redeemed, net of redemption fees | | | | | | | | |
| Class A | | | (90,898,383 | ) | | | (97,968,261 | ) |
| Class C | | | (5,935,877 | ) | | | (4,331,209 | ) |
| Class I | | | (179,180,972 | ) | | | (101,036,008 | ) |
| Class R | | | (1,428,484 | ) | | | (487,437 | ) |
| Net Increase/(Decrease) in Net Assets Derived from Beneficial Interest Transactions | | | (130,661,941 | ) | | | 21,713,269 | |
| | | | | | | | | |
| Net increase/(decrease) in net assets | | | (176,221,110 | ) | | | 32,233,304 | |
| | | | | | | | | |
| NET ASSETS | | | | | | | | |
| Beginning of year | | | 503,669,092 | | | | 471,435,788 | |
| End of year * | | $ | 327,447,982 | | | $ | 503,669,092 | |
| *Including accumulated net investment loss of: | | $ | (7,312,477 | ) | | $ | (10,280,498 | ) |
See Notes to Financial Statements.
72 | October 31, 2016
ALPS | Red Rocks Listed Private Equity Fund – Class A
Financial Highlights
Selected data for a share of beneficial interest outstanding throughout the periods indicated:
| | | For the Year Ended October 31, 2016 | | | For the Year Ended October 31, 2015 | | | For the Fiscal Period Ended October 31, 2014(a) | | | For the Year Ended April 30, 2014 | | | For the Year Ended April 30, 2013 | | | For the Year Ended April 30, 2012 | |
| Net asset value, beginning of period | | $ | 6.76 | | | $ | 6.61 | | | $ | 7.00 | | | $ | 6.05 | | | $ | 4.67 | | | $ | 6.44 | |
| | | | | | | | | | | | | | | | | | | | | | | | | |
| INCOME/(LOSS) FROM INVESTMENT OPERATIONS: |
Net investment income(b) | | | 0.06 | | | | 0.05 | | | | 0.02 | | | | 0.03 | | | | 0.08 | | | | 0.07 | |
| Net realized and unrealized gain/(loss) | | | (0.04 | ) | | | 0.34 | | | | (0.41 | ) | | | 1.37 | | | | 1.39 | | | | (1.41 | ) |
| Total from investment operations | | | 0.02 | | | | 0.39 | | | | (0.39 | ) | | | 1.40 | | | | 1.47 | | | | (1.34 | ) |
| | | | | | | | | | | | | | | | | | | | | | | | | |
| DISTRIBUTIONS: | | | | | | | | | | | | | | | | | | | | | | | | |
| From net investment income | | | (0.22 | ) | | | (0.22 | ) | | | – | | | | (0.45 | ) | | | (0.09 | ) | | | (0.43 | ) |
| From net realized gains | | | (0.27 | ) | | | (0.02 | ) | | | – | | | | – | | | | – | | | | – | |
| Total distributions | | | (0.49 | ) | | | (0.24 | ) | | | – | | | | (0.45 | ) | | | (0.09 | ) | | | (0.43 | ) |
| | | | | | | | | | | | | �� | | | | | | | | | | | | |
| REDEMPTION FEES ADDED TO PAID‐IN CAPITAL (NOTE 6) | 0.00 | (c) | | | 0.00 | (c) | | | 0.00 | (c) | | | 0.00 | (c) | | | 0.00 | (c) | | | 0.00 | (c) |
| Net increase/(decrease) in net asset value | | | (0.47 | ) | | | 0.15 | | | | (0.39 | ) | | | 0.95 | | | | 1.38 | | | | (1.77 | ) |
| Net asset value, end of year | | $ | 6.29 | | | $ | 6.76 | | | $ | 6.61 | | | $ | 7.00 | | | $ | 6.05 | | | $ | 4.67 | |
TOTAL RETURN(d) | | | 0.76 | % | | | 6.01 | % | | | (5.57 | )% | | | 23.54 | % | | | 31.75 | % | | | (19.68 | )% |
| | | | | | | | | | | | | | | | | | | | | | | | | |
| RATIOS/SUPPLEMENTAL DATA: |
| Net assets, end of year (000s) | | $ | 128,920 | | | $ | 193,561 | | | $ | 203,996 | | | $ | 205,727 | | | $ | 105,488 | | | $ | 85,807 | |
Ratio of expenses to average net assets excluding fee waivers and reimbursements(e) | | | 1.47 | % | | | 1.47 | % | | | 1.59 | %(f) | | | 1.64 | % | | | 1.53 | % | | | 1.71 | % |
Ratio of expenses to average net assets including fee waivers and reimbursements(e) | | | 1.47 | %(g) | | | 1.47 | %(g) | | | 1.59 | %(f)(g) | | | 1.64 | %(g) | | | 1.51 | %(h) | | | 1.50 | % |
Ratio of net investment income to average net assets(e) | | | 1.07 | % | | | 0.72 | % | | | 0.71 | %(f) | | | 0.46 | % | | | 1.54 | % | | | 1.34 | % |
Portfolio turnover rate(i) | | | 30 | % | | | 37 | % | | | 11 | % | | | 40 | % | | | 32 | % | | | 72 | % |
(a) | Effective May 1, 2014, the Board approved changing the fiscal year-end of the Funds from April 30 to October 31. |
(b) | Calculated using the average shares method. |
(c) | Less than $0.005 per share. |
(d) | Total returns are for the period indicated and have not been annualized. Total returns would have been lower had certain expenses not been waived during the period. Returns shown do not reflect the deduction of taxes that a shareholder would pay on Fund distributions or the redemption of Fund shares. Returns shown exclude any applicable sales charges. |
(e) | The ratios exclude the impact of expenses of the underlying funds in which the Fund invests as represented in the Statement of Investments. |
(g) | According to the Fund's shareholder services plan with respect to the Fund's Class A shares, any amount of such payment not paid during the Fund's fiscal year for such service activities shall be reimbursed to the Fund as soon as practical after the end of the fiscal year. Fees were reimbursed to the Fund during the period ended October 31, 2016, October 31, 2015, October 31, 2014 and April 30, 2014, for the prior fiscal year in the amount of 0.03%, 0.02%, 0.06% and 0.01% of average net assets of Class A shares. |
(h) | Contractual expense limitation changed from 1.50% to 1.65% effective September 1, 2012. |
(i) | Portfolio turnover rate for periods less than one full year have not been annualized. |
See Notes to Financial Statements.
73 | October 31, 2016
ALPS | Red Rocks Listed Private Equity Fund – Class C
Financial Highlights
Selected data for a share of beneficial interest outstanding throughout the periods indicated:
| | | For the Year Ended October 31, 2016 | | | For the Year Ended October 31, 2015 | | | For the Fiscal Period Ended October 31, 2014(a) | | | For the Year Ended April 30, 2014 | | | For the Year Ended April 30, 2013 | | | For the Year Ended April 30, 2012 | |
| Net asset value, beginning of period | | $ | 6.53 | | | $ | 6.43 | | | $ | 6.83 | | | $ | 5.92 | | | $ | 4.59 | | | $ | 6.37 | |
| | | | | | | | | | | | | | | | | | | | | | | | | |
| INCOME/(LOSS) FROM INVESTMENT OPERATIONS: |
Net investment income/(loss)(b) | | | 0.03 | | | | 0.00 | (c) | | | (0.00 | )(c) | | | (0.00 | )(c) | | | 0.04 | | | | 0.03 | |
| Net realized and unrealized gain/(loss) | | | (0.03 | ) | | | 0.32 | | | | (0.40 | ) | | | 1.33 | | | | 1.35 | | | | (1.39 | ) |
| Total from investment operations | | | – | | | | 0.32 | | | | (0.40 | ) | | | 1.33 | | | | 1.39 | | | | (1.36 | ) |
| | | | | | | | | | | | | | | | | | | | | | | | | |
| DISTRIBUTIONS: | | | | | | | | | | | | | | | | | | | | | | | | |
| From net investment income | | | (0.22 | ) | | | (0.20 | ) | | | – | | | | (0.42 | ) | | | (0.06 | ) | | | (0.42 | ) |
| From net realized gains | | | (0.27 | ) | | | (0.02 | ) | | | – | | | | – | | | | – | | | | – | |
| Total distributions | | | (0.49 | ) | | | (0.22 | ) | | | – | | | | (0.42 | ) | | | (0.06 | ) | | | (0.42 | ) |
| | | | | | | | | | | | | | | | | | | | | | | | |
| REDEMPTION FEES ADDED TO PAID‐IN CAPITAL (NOTE 6) | 0.00 | (c) | | | 0.00 | (c) | | | 0.00 | (c) | | | 0.00 | (c) | | | 0.00 | (c) | | | 0.00 | (c) |
| Net increase/(decrease) in net asset value | | | (0.49 | ) | | | 0.10 | | | | (0.40 | ) | | | 0.91 | | | | 1.33 | | | | (1.78 | ) |
| Net asset value, end of year | | $ | 6.04 | | | $ | 6.53 | | | $ | 6.43 | | | $ | 6.83 | | | $ | 5.92 | | | $ | 4.59 | |
TOTAL RETURN(d) | | | 0.34 | % | | | 5.14 | % | | | (5.86 | )% | | | 22.97 | % | | | 30.55 | % | | | (20.33 | )% |
| | | | | | | | | | | | | | | | | | | | | | | | | |
| RATIOS/SUPPLEMENTAL DATA: |
| Net assets, end of year (000s) | | $ | 14,784 | | | $ | 19,300 | | | $ | 17,193 | | | $ | 12,200 | | | $ | 4,417 | | | $ | 2,838 | |
Ratio of expenses to average net assets excluding fee waivers and reimbursements(e) | | | 2.16 | % | | | 2.12 | % | | | 2.15 | %(f) | | | 2.20 | % | | | 2.25 | % | | | 2.37 | % |
Ratio of expenses to average net assets including fee waivers and reimbursements(e) | | | 2.16 | % | | | 2.12 | % | | | 2.15 | %(f) | | | 2.20 | % | | | 2.25 | % | | | 2.25 | % |
Ratio of net investment income/(loss) to average net assets(e) | | | 0.49 | % | | | 0.06 | % | | | (0.13 | )%(f) | | | (0.04 | )% | | | 0.79 | % | | | 0.59 | % |
Portfolio turnover rate(g) | | | 30 | % | | | 37 | % | | | 11 | % | | | 40 | % | | | 32 | % | | | 72 | % |
(a) | Effective May 1, 2014, the Board approved changing the fiscal year-end of the Funds from April 30 to October 31. |
(b) | Calculated using the average shares method. |
(c) | Less than $0.005 per share. |
(d) | Total returns are for the period indicated and have not been annualized. Total returns would have been lower had certain expenses not been waived during the period. Returns shown do not reflect the deduction of taxes that a shareholder would pay on Fund distributions or the redemption of Fund shares. Returns shown exclude any applicable sales charges. |
(e) | The ratios exclude the impact of expenses of the underlying funds in which the Fund invests as represented in the Statement of Investments. |
(g) | Portfolio turnover rate for periods less than one full year have not been annualized. |
See Notes to Financial Statements.
74 | October 31, 2016
ALPS | Red Rocks Listed Private Equity Fund – Class I
Financial Highlights
Selected data for a share of beneficial interest outstanding throughout the periods indicated:
| | | For the Year Ended October 31, 2016 | | | For the Year Ended October 31, 2015 | | | For the Fiscal Period Ended October 31, 2014(a) | | | For the Year Ended April 30, 2014 | | | For the Year Ended April 30, 2013 | | | For the Year Ended April 30, 2012 | |
| Net asset value, beginning of period | | $ | 6.83 | | | $ | 6.67 | | | $ | 7.05 | | | $ | 6.08 | | | $ | 4.69 | | | $ | 6.47 | |
| | | | | | | | | | | | | | | | | | | | | | | | | |
| INCOME/(LOSS) FROM INVESTMENT OPERATIONS: |
Net investment income(b) | | | 0.09 | | | | 0.07 | | | | 0.03 | | | | 0.06 | | | | 0.12 | | | | 0.08 | |
| Net realized and unrealized gain/(loss) | | | (0.03 | ) | | | 0.34 | | | | (0.41 | ) | | | 1.37 | | | | 1.36 | | | | (1.42 | ) |
| Total from investment operations | | | 0.06 | | | | 0.41 | | | | (0.38 | ) | | | 1.43 | | | | 1.48 | | | | (1.34 | ) |
| | | | | | | | | | | | | | | | | | | | | | | | | |
| DISTRIBUTIONS: | | | | | | | | | | | | | | | | | | | | | | | | |
| From net investment income | | | (0.23 | ) | | | (0.23 | ) | | | – | | | | (0.46 | ) | | | (0.09 | ) | | | (0.44 | ) |
| From net realized gains | | | (0.27 | ) | | | (0.02 | ) | | | – | | | | – | | | | – | | | | – | |
| Total distributions | | | (0.50 | ) | | | (0.25 | ) | | | – | | | | (0.46 | ) | | | (0.09 | ) | | | (0.44 | ) |
| | | | | | | | | | | | | | | | | | | | | | | | | |
| REDEMPTION FEES ADDED TO PAID‐IN CAPITAL (NOTE 6) | 0.00 | (c) | | | 0.00 | (c) | | | 0.00 | (c) | | | 0.00 | (c) | | | 0.00 | (c) | | | 0.00 | (c) |
| Net increase/(decrease) in net asset value | | | (0.44 | ) | | | 0.16 | | | | (0.38 | ) | | | 0.97 | | | | 1.39 | | | | (1.78 | ) |
| Net asset value, end of year | | $ | 6.39 | | | $ | 6.83 | | | $ | 6.67 | | | $ | 7.05 | | | $ | 6.08 | | | $ | 4.69 | |
TOTAL RETURN(d) | | | 1.27 | % | | | 6.30 | % | | | (5.39 | )% | | | 24.02 | % | | | 31.99 | % | | | (19.52 | )% |
| | | | | | | | | | | | | | | | | | | | | | | | | |
| RATIOS/SUPPLEMENTAL DATA: |
| Net assets, end of year (000s) | | $ | 180,892 | | | $ | 287,741 | | | $ | 249,375 | | | $ | 202,076 | | | $ | 137,856 | | | $ | 77,750 | |
Ratio of expenses to average net assets excluding fee waivers and reimbursements(e) | | | 1.18 | % | | | 1.16 | % | | | 1.25 | %(f) | | | 1.25 | % | | | 1.27 | % | | | 1.41 | % |
Ratio of expenses to average net assets including fee waivers and reimbursements(e) | | | 1.18 | % | | | 1.16 | % | | | 1.25 | %(f) | | | 1.25 | % | | | 1.25 | % | | | 1.25 | % |
Ratio of net investment income to average net assets(e) | | | 1.48 | % | | | 1.02 | % | | | 0.85 | %(f) | | | 0.91 | % | | | 2.27 | % | | | 1.60 | % |
Portfolio turnover rate(g) | | | 30 | % | | | 37 | % | | | 11 | % | | | 40 | % | | | 32 | % | | | 72 | % |
(a) | Effective May 1, 2014, the Board approved changing the fiscal year-end of the Funds from April 30 to October 31. |
(b) | Calculated using the average shares method. |
(c) | Less than $0.005 per share. |
(d) | Total returns are for the period indicated and have not been annualized. Total returns would have been lower had certain expenses not been waived during the period. Returns shown do not reflect the deduction of taxes that a shareholder would pay on Fund distributions or the redemption of Fund shares. |
(e) | The ratios exclude the impact of expenses of the underlying funds in which the Fund invests as represented in the Statement of Investments. |
(g) | Portfolio turnover rate for periods less than one full year have not been annualized. |
See Notes to Financial Statements.
75 | October 31, 2016
ALPS | Red Rocks Listed Private Equity Fund – Class R
Financial Highlights
Selected data for a share of beneficial interest outstanding throughout the periods indicated:
| | | For the Year Ended October 31, 2016 | | | For the Year Ended October 31, 2015 | | | For the Fiscal Period Ended October 31, 2014(a) | | | For the Year Ended April 30, 2014 | | | For the Year Ended April 30, 2013 | | | For the Year Ended April 30, 2012 | |
| Net asset value, beginning of period | | $ | 5.96 | | | $ | 5.87 | | | $ | 6.21 | | | $ | 5.41 | | | $ | 4.17 | | | $ | 5.82 | |
| | | | | | | | | | | | | | | | | | | | | | | | | |
| INCOME/(LOSS) FROM INVESTMENT OPERATIONS: |
Net investment income(b) | | | 0.06 | | | | 0.03 | | | | 0.01 | | | | 0.02 | | | | 0.08 | | | | 0.05 | |
| Net realized and unrealized gain/(loss) | | | (0.05 | ) | | | 0.31 | | | | (0.36 | ) | | | 1.22 | | | | 1.24 | | | | (1.27 | ) |
| Total from investment operations | | | 0.01 | | | | 0.34 | | | | (0.35 | ) | | | 1.24 | | | | 1.32 | | | | (1.22 | ) |
| | | | | | | | | | | | | | | | | | | | | | | | | |
| DISTRIBUTIONS: | | | | | | | | | | | | | | | | | | | | | | | | |
| From net investment income | | | (0.22 | ) | | | (0.23 | ) | | | – | | | | (0.44 | ) | | | (0.08 | ) | | | (0.43 | ) |
| From net realized gains | | | (0.27 | ) | | | (0.02 | ) | | | – | | | | – | | | | – | | | | – | |
| Total distributions | | | (0.49 | ) | | | (0.25 | ) | | | – | | | | (0.44 | ) | | | (0.08 | ) | | | (0.43 | ) |
| | | | | | | | | | | | | | | | | | | | | | | | | |
| REDEMPTION FEES ADDED TO PAID‐IN CAPITAL (NOTE 6) | – | | | | 0.00 | (c) | | | 0.01 | | | | – | | | | – | | | | – | |
| Net increase/(decrease) in net asset value | | | (0.48 | ) | | | 0.09 | | | | (0.34 | ) | | | 0.80 | | | | 1.24 | | | | (1.65 | ) |
| Net asset value, end of year | | $ | 5.48 | | | $ | 5.96 | | | $ | 5.87 | | | $ | 6.21 | | | $ | 5.41 | | | $ | 4.17 | |
TOTAL RETURN(d) | | | 0.67 | % | | | 5.87 | % | | | (5.48 | )% | | | 23.50 | % | | | 32.05 | % | | | (19.93 | )% |
| | | | | | | | | | | | | | | | | | | | | | | | | |
| RATIOS/SUPPLEMENTAL DATA: |
| Net assets, end of year (000s) | | $ | 2,852 | | | $ | 3,068 | | | $ | 872 | | | $ | 540 | | | $ | 191 | | | $ | 46 | |
Ratio of expenses to average net assets excluding fee waivers and reimbursements(e) | | | 1.63 | % | | | 1.60 | % | | | 1.63 | %(f) | | | 1.72 | % | | | 1.85 | % | | | 1.89 | % |
Ratio of expenses to average net assets including fee waivers and reimbursements(e) | | | 1.63 | % | | | 1.60 | % | | | 1.63 | %(f) | | | 1.72 | % | | | 1.75 | % | | | 1.75 | % |
Ratio of net investment income to average net assets(e) | | | 1.05 | % | | | 0.52 | % | | | 0.46 | %(f) | | | 0.36 | % | | | 1.80 | % | | | 1.10 | % |
Portfolio turnover rate(g) | | | 30 | % | | | 37 | % | | | 11 | % | | | 40 | % | | | 32 | % | | | 72 | % |
(a) | Effective May 1, 2014, the Board approved changing the fiscal year-end of the Funds from April 30 to October 31. |
(b) | Calculated using the average shares method. |
(c) | Less than $0.005 per share. |
(d) | Total returns are for the period indicated and have not been annualized. Total returns would have been lower had certain expenses not been waived during the period. Returns shown do not reflect the deduction of taxes that a shareholder would pay on Fund distributions or the redemption of Fund shares. |
(e) | The ratios exclude the impact of expenses of the underlying funds in which the Fund invests as represented in the Statement of Investments. |
(g) | Portfolio turnover rate for periods less than one full year have not been annualized. |
See Notes to Financial Statements.
76 | October 31, 2016
ALPS | Sterling ETF Tactical Rotation Fund
| Management Commentary | October 31, 2016 (Unaudited) |
During the 12 month period ending October 31, 2016 the ALPS | Sterling ETF Tactical Rotation Fund’s (“Fund”) Class I Shares produced a positive return of ‐4.74% compared to a return of 4.51% for the S&P 500 Total Return Index* and a 2.96% return for the Morningstar Global Allocation Index.
The Fund rotates between six asset classes using ETFs for exposure. The Fund attempts to avoid asset classes that are experiencing prolonged declining values by using momentum to both allocate and equally weight the top two asset classes on a monthly basis. The rules‐based approach includes commodities, U.S. and international equities, U.S. bonds, REITs and cash. At the end of October the Fund was allocated approximately 50% to commodities and 50% to cash.
Over the period, the Fund did not pay any dividends.
Across the 12 month period, the Fund owned REITs for nine months for an overall exposure of 37.5%, commodities for three months or 12.5% exposure, U.S. equities for five months or 20.83% exposure, international equities for one month or 4.16% exposure and US Bonds for four months or 16.7% exposure. The Fund was allocated to cash for 2 months or 8.3% exposure, for the period ending October 31, 2016.
The Fund uses momentum to allocate 50% to the top two asset classes. The theory behind the investment methodology is that, under normal market conditions, a couple of asset classes should be trending higher, while a couple of asset classes are trending lower due to the low correlations of the asset classes within the rotation. The process is designed to invest in the strongest two asset classes that are trending higher over the long‐term and to avoid the asset classes exhibiting less strength on a relative basis. Cash is utilized as a safety net in the event that everything is dropping in unison.
The Fund has two distinct risk management tools to seek to dampen downside risk. The first is the ability to invest 100% of assets in cash equivalent ETFs and the second is to rotate away from weakness or prolonged declining asset classes.
Mark W. Eicker
Chief Investment Officer
Sterling Global Strategies
| * | The S&P 500 Index is a capitalization-weighted index of 500 stocks traded on the NYSE, AMEX and OTC exchanges, and is comprised of industrial, financial, transportation and utility companies. Indexes are unmanaged and it is not possible to invest directly in an index. |
The views of the author and information discussed in this commentary are as of the date of publication, are subject to change, and may not reflect the writer's current views. The views expressed are those of the author only, and represent an assessment of market conditions at a specific point in time, are opinions only and should not be relied upon as investment advice regarding a particular investment or markets in general. Such information does not constitute a recommendation to buy or sell specific securities or
investment vehicles. It should not be assumed that any investment will be profitable or will equal the performance of the fund(s) or any securities or any sectors mentioned in this letter. The subject matter contained in this letter has been derived from several sources believed to be reliable and accurate at the time of compilation. Neither ALPS Advisors, Inc., Sterling Global Strategies, nor the Fund accepts any liability for losses either direct or consequential caused by the use of this information.
Diversification cannot guarantee gain or prevent losses.
77 | October 31, 2016
ALPS | Sterling ETF Tactical Rotation Fund
| Performance Update | October 31, 2016 (Unaudited) |
Performance of $10,000 Initial Investment (as of October 31, 2016)
Comparison of change in value of a $10,000 investment (includes maximum sales charges of 5.50%)
The chart above represents historical performance of a hypothetical investment of $10,000 in the Fund since inception. Past performance does not guarantee future results. This chart does not reflect the deduction of taxes that a shareholder would pay on Fund distributions or the redemption of Fund shares.
Average Annual Total Returns (as of October 31, 2016)
| | 6 Month | 1 Year | Since Inception^ | Total Expense Ratio | What You Pay* |
| Class A (NAV) | 0.22% | ‐5.27% | ‐3.97% | 2.32% | 1.71% |
| Class A (MOP) | ‐5.30% | ‐10.44% | ‐6.25% |
| Class C (NAV) | ‐0.23% | ‐5.94% | ‐4.59% | 2.89% | 2.31% |
| Class C (CDSC) | ‐1.22% | ‐6.87% | ‐4.59% |
| Class I (NAV) | 0.45% | ‐4.96% | ‐3.59% | 1.99% | 1.31% |
Morningstar Global Allocation Index1 | 2.26% | 4.28% | 0.82% | | |
Sterling Tactical Rotation Index TR2 | 0.16% | ‐4.73% | ‐2.84% | | |
Performance data quoted represents past performance. Past performance does not guarantee future results. Investment return and principal value of an investment will fluctuate so that an investor's shares, when sold or redeemed, may be worth more or less than the original cost. Current performance data may be higher or lower than actual data quoted. For the most current month-end performance data, please call 1-866-759-5679.
Maximum Offering Price (MOP) for Class A shares includes the Fund’s maximum sales charge of 5.50%. Performance shown at NAV does not include these sales charges and would have been lower had it been taken into account. If you invest $1 million or more, either as a lump sum or through the Fund’s accumulation or letter of intent programs, you can purchase Class A shares without an initial sales charge (load). A Contingent Deferred Sales Charge (“CDSC”) of 1.00% may apply to Class C shares redeemed within the first 12 months after purchase, and on Class A shares redeemed within the first 18 months after purchase in excess of $1 million. The Fund imposes a 1.00% redemption fee on shares held less than 30 days.
Performance less than 1 year is cumulative.
78 | October 31, 2016
ALPS | Sterling ETF Tactical Rotation Fund
| Performance Update | October 31, 2016 (Unaudited) |
| 1 | Morningstar Global Allocation Index: Global allocation portfolios seek to provide both capital appreciation and income by investing across three areas: global equities, global bonds, and cash. The Morningstar Global Allocation Index represents a multi-asset-class portfolio of 60% global equities and 40% global bonds. An investor may not invest directly in an index. |
| 2 | The Sterling Tactical Rotation Index - seeks to provide absolute returns during any market cycle or condition by employing an equally weighted strategic rotation model, trading between commodities, REITs, bonds, international and domestic equities. An investor may not invest directly in an index. |
| ^ | Fund inception date of June 30, 2014. |
| * | What You Pay reflects the Advisor’s decision to contractually limit expenses through February 28, 2017 and estimated Acquired Fund Fees and Expenses of 0.16%. Please see the prospectus for additional information. |
The Fund is “non-diversified” and will generally be more volatile than diversified funds.
Investments in small and mid-cap companies generally will experience greater price volatility. International and Emerging markets are riskier than more developed markets because they tend to develop unevenly and may never fully develop. Prices of fixed income securities generally increase when interest rates decline and decrease when interest rates increase and may cause losses. Real estate investments are subject to specific risks, such as risks related to general and local economic conditions and risks related to individual properties.
The Fund invests in Exchange Traded Funds (“ETFs”) and the Fund could lose money by investing in an ETF if the prices of the securities owned by the ETF go down. The Fund’s shareholders will indirectly incur the fees and expenses charged by the underlying ETFs held by the Fund, in addition to the expense charged by the Fund.
Commodities and futures generally are volatile and involve a high degree of risk. This fund enters into a short sale by selling a security it has borrowed. If the market price of a security increases after the Fund borrows the security, the Fund will suffer a potentially unlimited loss when it replaces the borrowed security at the higher price. The use of derivatives exposes the Fund to additional risks including increased volatility, lack of liquidity, and possible losses greater than the Fund’s initial investment as well as increased transaction.
The table does not reflect the deduction of taxes that a shareholder would pay on Fund distributions or the redemption of Fund shares.
This Fund is not suitable for all investors and is subject to investment risks, including possible loss of the principal amount invested.
There is no guarantee that the Fund will continue to hold any one particular security or stay invested in any one particular company. The composition of the Fund's top holdings is subject to change. Performance figures are historical and reflect the change in share price, reinvested distributions, changes in net asset value, sales charges and capital gains distributions, if any.
Not FDIC Insured – No Bank Guarantee – May Lose Value
Portfolio Composition (as a % of Total Investments) *
| * | Holdings are subject to change, and may not reflect the current or future position of the portfolio. |
79 | October 31, 2016
ALPS | Sterling ETF Tactical Rotation Fund
| Statement of Investments | October 31, 2016 |
| | | Shares | | | Value (Note 2) | |
| EXCHANGE TRADED FUNDS (100.70%) | | | | | | |
Powershares® DB Optimum Yield(a) | | | 348,312 | | | $ | 6,064,112 | |
| | | | | | | | | |
SPDR® Barclays 1‐3 Month T‐Bill ETF(a) | 132,578 | | | | 6,064,118 | |
| | | | | | | | | |
TOTAL EXCHANGE TRADED FUNDS
(Cost $12,131,836) | | 12,128,230 | |
| | | | | | | | | |
TOTAL INVESTMENTS (100.70%)
(Cost $12,131,836) | $ | 12,128,230 | |
| | | | | | | | | |
| Liabilities In Excess Of Other Assets (‐0.70%) | | (84,757 | ) |
| | | | | | | | | |
| NET ASSETS (100.00%) | $ | 12,043,473 | |
| (a) | Non-Income Producing Security. |
For Fund compliance purposes, the Fund's industry classifications refer to any one or more of the industry sub-classifications used by one or more widely recognized market indexes or ratings group indexes, and/or as defined by Fund management. This definition may not apply for purposes of this report, which may combine industry sub-classifications for reporting ease. Industries are shown as a percent of net assets.
See Notes to Financial Statements.
80 | October 31, 2016
ALPS | Sterling ETF Tactical Rotation Fund
| Statement of Assets and Liabilities | October 31, 2016 |
| ASSETS | | | |
| Investments, at value | | $ | 12,128,230 | |
| Receivable for investments sold | | | 12,212,224 | |
| Dividends receivable | | | 3 | |
| Receivable due from advisor | | | 6,251 | |
| Prepaid expenses and other assets | | | 12,329 | |
| Total Assets | | | 24,359,037 | |
| LIABILITIES | | | | |
| Payable for investments purchased | | | 12,131,836 | |
| Payable for shares redeemed | | | 53,667 | |
| Payable due to custodian ‐ overdraft | | | 74,958 | |
| Administration and transfer agency fees payable | | | 18,488 | |
| Distribution and services fees payable | | | 9,014 | |
| Trustees' fees and expenses payable | | | 6 | |
| Professional fees payable | | | 15,972 | |
| Accrued expenses and other liabilities | | | 11,623 | |
| Total Liabilities | | | 12,315,564 | |
| NET ASSETS | | $ | 12,043,473 | |
| NET ASSETS CONSIST OF | | | | |
| Paid‐in capital | | $ | 15,769,738 | |
| Accumulated net investment loss | | | (12,122 | ) |
| Accumulated net realized loss | | | (3,710,537 | ) |
| Net unrealized depreciation | | | (3,606 | ) |
| NET ASSETS | | $ | 12,043,473 | |
| INVESTMENTS, AT COST | | $ | 12,131,836 | |
| PRICING OF SHARES | | | | |
| Class A: | | | | |
| Net Asset Value, offering and redemption price per share | | $ | 8.94 | |
| Net Assets | | $ | 5,454,187 | |
| Shares of beneficial interest outstanding (unlimited number of shares, no par value common stock authorized) | | | 609,848 | |
| Maximum offering price per share ((NAV/0.9450), based on maximum sales charge of 5.50% of the offering price) | | $ | 9.46 | |
| Class C: | | | | |
Net Asset Value, offering and redemption price per share(a) | | $ | 8.82 | |
| Net Assets | | $ | 1,372,418 | |
| Shares of beneficial interest outstanding (unlimited number of shares, no par value common stock authorized) | | | 155,573 | |
| Class I: | | | | |
| Net Asset Value, offering and redemption price per share | | $ | 9.02 | |
| Net Assets | | $ | 5,216,868 | |
| Shares of beneficial interest outstanding (unlimited number of shares, no par value common stock authorized) | | | 578,583 | |
| (a) | Redemption price per share may be reduced for any applicable contingent deferred sales charge. For a description of a possible sales charge, please see the Fund's Prospectus. |
See Notes to Financial Statements.
81 | October 31, 2016
ALPS | Sterling ETF Tactical Rotation Fund
| Statement of Operations | For the Year Ended October 31, 2016 |
| INVESTMENT INCOME | | | |
| Dividends | | $ | 506,106 | |
| Total Investment Income | | | 506,106 | |
| | | | | |
| EXPENSES | | | | |
| Investment advisory fees | | | 211,238 | |
| Administrative fees | | | 100,819 | |
| Transfer agency fees | | | 1,785 | |
| Distribution and service fees | | | | |
| Class A | | | 29,391 | |
| Class C | | | 20,124 | |
| Professional fees | | | 20,677 | |
| Delegated transfer agent equivalent services | | | | |
| Class C | | | 277 | |
| Class I | | | 6,504 | |
| Reports to shareholders and printing fees | | | 6,226 | |
| State registration fees | | | 43,857 | |
| SEC registration fees | | | 50 | |
| Insurance fees | | | 332 | |
| Custody fees | | | 10,011 | |
| Trustees' fees and expenses | | | 694 | |
| Miscellaneous expenses | | | 13,724 | |
| Total Expenses | | | 465,709 | |
| Less fees waived/reimbursed by investment advisor (Note 8) | | | | |
| Class A | | | (68,453 | ) |
| Class C | | | (15,622 | ) |
| Class I | | | (76,409 | ) |
| Net Expenses | | | 305,225 | |
| Net Investment Income | | | 200,881 | |
| Net realized loss on investments | | | (1,865,664 | ) |
| Net change in unrealized appreciation on investments | | | 30,179 | |
| NET REALIZED AND UNREALIZED LOSS ON INVESTMENTS | | | (1,835,485 | ) |
| NET DECREASE IN NET ASSETS RESULTING FROM OPERATIONS | | $ | (1,634,604 | ) |
See Notes to Financial Statements.
82 | October 31, 2016
ALPS | Sterling ETF Tactical Rotation Fund
Statements of Changes in Net Assets
| | | For the Year Ended October 31, 2016 | | | For the Year Ended October 31, 2015 | |
| OPERATIONS | | | | | | |
| Net investment income | | $ | 200,881 | | | $ | 194,316 | |
| Net realized loss | | | (1,865,664 | ) | | | (1,696,139 | ) |
| Net change in unrealized appreciation/(depreciation) | | | 30,179 | | | | (273,084 | ) |
| Net Decrease in Net Assets Resulting from Operations | | | (1,634,604 | ) | | | (1,774,907 | ) |
| | | | | | | | | |
| DISTRIBUTIONS | | | | | | | | |
| Dividends to shareholders from net investment income | | | | | | | | |
| Class A | | | (136,109 | ) | | | (55,630 | ) |
| Class C | | | (21,385 | ) | | | (4,086 | ) |
| Class I | | | (179,885 | ) | | | (67,213 | ) |
| Net Decrease in Net Assets from Distributions | | | (337,379 | ) | | | (126,929 | ) |
| | | | | | | | | |
| BENEFICIAL INTEREST TRANSACTIONS (NOTE 6) | | | | | | | | |
| Shares sold | | | | | | | | |
| Class A | | | 1,576,788 | | | | 16,208,475 | |
| Class C | | | 260,479 | | | | 2,475,711 | |
| Class I | | | 2,500,262 | | | | 14,687,621 | |
| Dividends reinvested | | | | | | | | |
| Class A | | | 116,103 | | | | 50,265 | |
| Class C | | | 21,210 | | | | 3,473 | |
| Class I | | | 176,524 | | | | 56,161 | |
| Shares redeemed, net of redemption fees | | | | | | | | |
| Class A | | | (9,689,875 | ) | | | (6,305,132 | ) |
| Class C | | | (1,298,370 | ) | | | (352,476 | ) |
| Class I | | | (14,472,672 | ) | | | (3,228,985 | ) |
| Net Increase/(Decrease) in Net Assets Derived from Beneficial Interest Transactions | | | (20,809,551 | ) | | | 23,595,113 | |
| | | | | | | | | |
| Net increase/(decrease) in net assets | | | (22,781,534 | ) | | | 21,693,277 | |
| | | | | | | | | |
| NET ASSETS | | | | | | | | |
| Beginning of year | | | 34,825,007 | | | | 13,131,730 | |
| End of year * | | $ | 12,043,473 | | | $ | 34,825,007 | |
| *Including accumulated net investment income/(loss) of: | | $ | (12,122 | ) | | $ | 124,311 | |
See Notes to Financial Statements.
83 | October 31, 2016
ALPS | Sterling ETF Tactical Rotation Fund – Class A
Financial Highlights
Selected data for a share of beneficial interest outstanding throughout the periods indicated:
| | | For the Year Ended October 31, 2016 | | | For the Year Ended October 31, 2015 | | | For the Period July 1, 2014 (Commencement) to October 31, 2014 | |
| Net asset value, beginning of period | | $ | 9.53 | | | $ | 9.97 | | | $ | 10.00 | |
| | | | | | | | | | | | | |
| INCOME FROM INVESTMENT OPERATIONS: | | | | | | | | | | | | |
Net investment income(a) | | | 0.07 | | | | 0.06 | | | | 0.02 | |
| Net realized and unrealized loss | | | (0.57 | ) | | | (0.43 | ) | | | (0.05 | ) |
| Total from investment operations | | | (0.50 | ) | | | (0.37 | ) | | | (0.03 | ) |
| | | | | | | | | | | | | |
| DISTRIBUTIONS: | | | | | | | | | | | | |
| From net investment income | | | (0.09 | ) | | | (0.07 | ) | | | – | |
| Total distributions | | | (0.09 | ) | | | (0.07 | ) | | | – | |
| | | | | | | | | | | | | |
| REDEMPTION FEES ADDED TO PAID‐IN CAPITAL (NOTE 6) | | | 0.00 | (b) | | | 0.00 | (b) | | | 0.00 | (b) |
| Net (decrease) in net asset value | | | (0.59 | ) | | | (0.44 | ) | | | (0.03 | ) |
| Net asset value, end of year | | $ | 8.94 | | | $ | 9.53 | | | $ | 9.97 | |
TOTAL RETURN(c) | | | (5.27 | )% | | | (3.78 | )% | | | (0.30 | )% |
| | | | | | | | | | | | | |
| RATIOS/SUPPLEMENTAL DATA: | | | | | | | | | | | | |
| Net assets, end of year (000s) | | $ | 5,454 | | | $ | 14,234 | | | $ | 5,262 | |
| Ratio of expenses to average net assets excluding fee waivers and reimbursements | | | 2.17 | % | | | 2.16 | % | | | 5.01 | %(d) |
| Ratio of expenses to average net assets including fee waivers and reimbursements | | | 1.46 | % | | | 1.55 | % | | | 1.55 | %(d) |
| Ratio of net investment income to average net assets | | | 0.81 | % | | | 0.58 | % | | | 0.67 | %(d) |
Portfolio turnover rate(e) | | | 427 | % | | | 465 | % | | | 181 | % |
| (a) | Calculated using the average shares method. |
| (b) | Less than $0.005 per share. |
| (c) | Total returns are for the period indicated and have not been annualized. Total returns would have been lower had certain expenses not been waived during the period. Returns shown do not reflect the deduction of taxes that a shareholder would pay on Fund distributions or the redemption of Fund shares. Returns shown exclude any applicable sales charges. |
| (e) | Portfolio turnover rate for periods less than one full year have not been annualized. |
See Notes to Financial Statements.
84 | October 31, 2016
ALPS | Sterling ETF Tactical Rotation Fund – Class C
Financial Highlights
Selected data for a share of beneficial interest outstanding throughout the periods indicated:
| | | For the Year Ended October 31, 2016 | | | For the Year Ended October 31, 2015 | | | For the Period July 1, 2014 (Commencement) to October 31, 2014 | |
| Net asset value, beginning of period | | $ | 9.46 | | | $ | 9.95 | | | $ | 10.00 | |
| | | | | | | | | | | | | |
| INCOME FROM INVESTMENT OPERATIONS: | | | | | | | | | | | | |
Net investment loss(a) | | | (0.01 | ) | | | (0.00 | )(b) | | | – | |
| Net realized and unrealized loss | | | (0.55 | ) | | | (0.43 | ) | | | (0.05 | ) |
| Total from investment operations | | | (0.56 | ) | | | (0.43 | ) | | | (0.05 | ) |
| | | | | | | | | | | | | |
| DISTRIBUTIONS: | | | | | | | | | | | | |
| From net investment income | | | (0.08 | ) | | | (0.06 | ) | | | – | |
| Total distributions | | | (0.08 | ) | | | (0.06 | ) | | | – | |
| | | | | | | | | | | | | |
| Net (decrease) in net asset value | | | (0.64 | ) | | | (0.49 | ) | | | (0.05 | ) |
| Net asset value, end of year | | $ | 8.82 | | | $ | 9.46 | | | $ | 9.95 | |
TOTAL RETURN(c) | | | (5.94 | )% | | | (4.37 | )% | | | (0.50 | )% |
| | | | | | | | | | | | | |
| RATIOS/SUPPLEMENTAL DATA: | | | | | | | | | | | | |
| Net assets, end of year (000s) | | $ | 1,372 | | | $ | 2,530 | | | $ | 530 | |
| Ratio of expenses to average net assets excluding fee waivers and reimbursements | | | 2.93 | % | | | 2.73 | % | | | 9.70 | %(d) |
| Ratio of expenses to average net assets including fee waivers and reimbursements | | | 2.15 | % | | | 2.15 | % | | | 2.15 | %(d) |
| Ratio of net investment income/(loss) to average net assets | | | (0.07 | %) | | | (0.05 | %) | | | 0.12 | %(d) |
Portfolio turnover rate(e) | | | 427 | % | | | 465 | % | | | 181 | % |
| (a) | Calculated using the average shares method. |
| (b) | Less than ($0.005) per share. |
| (c) | Total returns are for the period indicated and have not been annualized. Total returns would have been lower had certain expenses not been waived during the period. Returns shown do not reflect the deduction of taxes that a shareholder would pay on Fund distributions or the redemption of Fund shares. Returns shown exclude any applicable sales charges. |
| (e) | Portfolio turnover rate for periods less than one full year have not been annualized. |
See Notes to Financial Statements.
85 | October 31, 2016
ALPS | Sterling ETF Tactical Rotation Fund – Class I
Financial Highlights
Selected data for a share of beneficial interest outstanding throughout the periods indicated:
| | | For the Year Ended October 31, 2016 | | | For the Year Ended October 31, 2015 | | | For the Period July 1, 2014 (Commencement) to October 31, 2014 | |
| Net asset value, beginning of period | | $ | 9.59 | | | $ | 9.98 | | | $ | 10.00 | |
| | | | | | | | | | | | | |
| INCOME FROM INVESTMENT OPERATIONS: | | | | | | | | | | | | |
Net investment income(a) | | | 0.11 | | | | 0.09 | | | | 0.03 | |
| Net realized and unrealized loss | | | (0.58 | ) | | | (0.40 | ) | | | (0.05 | ) |
| Total from investment operations | | | (0.47 | ) | | | (0.31 | ) | | | (0.02 | ) |
| | | | | | | | | | | | | |
| DISTRIBUTIONS: | | | | | | | | | | | | |
| From net investment income | | | (0.10 | ) | | | (0.08 | ) | | | – | |
| Total distributions | | | (0.10 | ) | | | (0.08 | ) | | | – | |
| | | | | | | | | | | | | |
| REDEMPTION FEES ADDED TO PAID‐IN CAPITAL (NOTE 6) | | | 0.00 | (b) | | | 0.00 | (b) | | | – | |
| Net (decrease) in net asset value | | | (0.57 | ) | | | (0.39 | ) | | | (0.02 | ) |
| Net asset value, end of year | | $ | 9.02 | | | $ | 9.59 | | | $ | 9.98 | |
TOTAL RETURN(c) | | | (4.96 | )% | | | (3.20 | )% | | | (0.20 | )% |
| | | | | | | | | | | | | |
| RATIOS/SUPPLEMENTAL DATA: | | | | | | | | | | | | |
| Net assets, end of year (000s) | | $ | 5,217 | | | $ | 18,061 | | | $ | 7,340 | |
| Ratio of expenses to average net assets excluding fee waivers and reimbursements | | | 1.87 | % | | | 1.83 | % | | | 5.93 | %(d) |
| Ratio of expenses to average net assets including fee waivers and reimbursements | | | 1.15 | % | | | 1.15 | % | | | 1.15 | %(d) |
| Ratio of net investment income to average net assets | | | 1.17 | % | | | 0.95 | % | | | 0.94 | %(d) |
Portfolio turnover rate(e) | | | 427 | % | | | 465 | % | | | 181 | % |
(a) | Calculated using the average shares method. |
(b) | Less than $0.005 per share. |
(c) | Total returns are for the period indicated and have not been annualized. Total returns would have been lower had certain expenses not been waived during the period. Returns shown do not reflect the deduction of taxes that a shareholder would pay on Fund distributions or the redemption of Fund shares. |
(e) | Portfolio turnover rate for periods less than one full year have not been annualized. |
See Notes to Financial Statements.
86 | October 31, 2016
ALPS | WMC Research Value Fund
| Management Commentary | October 31, 2016 (Unaudited) |
Market Commentary
US equities rose for the period, as measured by the S&P 500® Total Return Index, notwithstanding significant volatility earlier in the 12-month period ending October 31, 2016. The S&P 500 finished the last two months of 2015 slightly down, then dropped 11.4% to start 2016 during a risk-off environment, before reversing in late February through March. Stocks continued to rise through the second quarter, despite an unexpected Brexit referendum result, which caused equities to sell off, only to recover a couple of days later. US equities gained in the third quarter, in particular during July, before pulling back in October.
The period started with a November that finished relatively flat but data releases continued to paint a promising picture for the US economy. As widely expected, the US Federal Reserve (Fed) delivered its first rate hike since 2006 in December. The policy statement stressed the likely gradual pace to policy normalization and acknowledged “considerable improvement” in labor market conditions, which has given the Fed “reasonable confidence” that inflation will rise over the medium term to its 2% objective. Early in the first quarter of 2016, stocks plunged and moved in virtual lockstep with the price of oil as fears of a recession and weakness in China weighed on investors' minds. However, equities surged in late February and March as solid economic data, a stabilization in oil prices, and accommodative commentary from the Fed helped to calm the market's early year jitters. The Federal Open Market Committee's (FOMC's) March statement surprised many market participants with its dovish tone.
A better-than-feared US corporate earnings season in the second quarter and an encouraging economic backdrop helped sustain the rally. At its June meeting, the Fed left rates unchanged and reduced its US growth and long-run policy rate forecasts, citing mixed US economic data and uncertainty about global economic and financial developments. Fed Chair Janet Yellen also explicitly mentioned the doubts surrounding the UK’s EU referendum as a factor in the decision. US equities continued to climb in July, following a solid start to the corporate earnings season and encouraging housing and employment data releases. Stocks were essentially flat in August and September as investors remained focused on the Fed’s actions, specifically on the timing of the next rate hike. A confluence of worries contributed to increased volatility during September, including uncertainty surrounding the US presidential election, tepid economic data, and valuation concerns. Stock prices dipped in October as US election jitters took center stage.
Within the Russell 1000 Value Index, nine of eleven sectors posted positive absolute returns during the period, with the utilities and information technology sectors gaining the most.
Fund Review
On a net-of-fee basis, the Fund underperformed its benchmark, the Russell 1000 Value Index, for the period.
Overall, stock selection detracted from relative returns, as decisions in the financials, consumer staples, and consumer discretionary sectors more than offset positive stock selection in the utilities and energy sectors.
Detractors from relative performance for the period included Cobalt International Energy (energy), Santander (financials), and Advanced Auto Parts (consumer discretionary). Delays surrounding Cobalt's Angola asset sale weighed on the company's stock price. At the end of the period, we had very limited exposure to the name. The stock of specialized consumer company Santander Consumer came under pressure during the period as investors became more sensitive to the company's sub-prime auto loan portfolio, given the deterioration in macro sentiment. We continue to believe the business model will become less capital intensive and returns on investment will expand over time. The company is well supported by their parent company and the stock is trading at a valuation level that is very compelling. Advanced Auto Parts, an automotive after markets retailer, was a relative detractor after the company reported 2Q16 results below expectations driven, in part, by ongoing disruption related to the Carquest acquisition. While the integration is complex, we believe this is a strategic and financially accretive merger, creating a stronger competitive position for the company.
Top contributors to relative performance included Pioneer Natural Resources (energy), UGI (Utilities), and DreamWorks Animation (consumer discretionary). Our overweight position to Pioneer Natural Resources, a US-based exploration and production company, was a notable contributor to relative performance. The company continues to benefit from rising oil prices and the resource potential of the lowest cost oil shale asset in the US Permian Basin, where they have the largest position. UGI remains one of our top utility positions as we are confident in the management’s proven ability to manage margins, and the company also exhibits strong FCF generation and a strong balance sheet. We believe the recent turmoil in the MLP and midstream sector could benefit UGI as it might allow them to acquire assets with attractive returns. US film production company DreamWorks was also a top relative contributor, as the stock price surged on the back of news that Comcast had a deal to buy DreamWorks Animation at a rich premium over the company’s recent trading levels. At the end of the period, we no longer held DreamWorks Animation. Not owning benchmark constituent Citigroup, also contributed to positive relative performance.
Strategy and Outlook
Looking ahead, our Global Industry Analysts remain focused on fundamental, bottom-up stock selection and how the macroeconomic outlook will affect the companies in which they invest. We continue to identify themes and opportunities that will shape investment decisions going forward.
One of those themes is in the information technology sector, where expectations for further consolidation have recently bolstered the semiconductor group. The semi-cap theme of higher than expected Wafer Fab Equipment spending over the next several years has been playing out faster than we expected. Expectations were very low a year ago and are quite high right now. Our expectations for a strong ramp up in 3D NAND technology and China contributing to higher than expected spending into the memory market are now consensus. In our opinion, the rise in many stocks fully discounts the near-term dynamics and does not leave much room for the likely non-linearity of fundamentals. After a surge in prices, we eliminated the positions in Applied Materials and Linear Tech, with the latter announcing it was being acquired by Analog Devices in the period. We used the proceeds to initiate a new position in chipmaker Intel, which has materially underperformed the peer group to date. Stabilizing PC sales and strength in Intel’s Data Center Group should continue to provide a catalyst for the stock. In 2017 and beyond, Intel has a host of potential contributors to its business, including artificial intelligence, deep learning, advanced driver assistance systems, internet of things, and augmented, virtual and mixed reality.
Cheryl M. Duckworth, CFA,
Senior Managing Director and Associate Director, Global Industry Research
Mark Mandel, CFA,
Senior Managing Director and Director, Global Industry Research
87 | October 31, 2016
ALPS | WMC Research Value Fund
| Management Commentary | October 31, 2016 (Unaudited) |
The views of the authors and information discussed in this commentary are as of the date of publication, are subject to change, and may not reflect the writers’ current views. The views expressed are those of the authors only, and represent an assessment of market conditions at a specific point in time, are opinions only and should not be relied upon as investment advice regarding a particular investment or markets in general. Such information does not constitute a recommendation to buy or sell specific securities or investment vehicles. It should not be assumed that any investment will be profitable or will equal the performance of the fund(s) or any securities or any sectors mentioned in this letter. The subject matter contained in this letter has been derived from several sources believed to be reliable and accurate at the time of compilation. Neither ALPS Advisors, Inc., Wellington Management Company, LLP, nor the Fund accepts any liability for losses either direct or consequential caused by the use of this information.
Diversification cannot guarantee gain or prevent losses.
88 | October 31, 2016
ALPS | WMC Research Value Fund
| Performance Update | October 31, 2016 (Unaudited) |
Performance of $10,000 Initial Investment (as of October 31, 2016)
Comparison of change in value of a $10,000 investment (includes maximum sales charges of 5.50%)
The chart above represents historical performance of a hypothetical investment of $10,000 in the Fund since inception. Past performance does not guarantee future results. This chart does not reflect the deduction of taxes that a shareholder would pay on Fund distributions or the redemption of Fund shares.
Average Annual Total Returns (as of October 31, 2016)
| | 6 Month | 1 Year | 3 Year | 5 Year | 10 Year | Since Inception | Total Expense Ratio | What You Pay* |
| Class A (NAV) | 2.95% | 2.09% | 6.34% | 12.40% | 4.91% | 9.56% | 1.49% | 1.15% |
| Class A (MOP) | -2.67% | -3.50% | 4.35% | 11.14% | 4.32% | 9.43% |
| Class C (NAV) | 2.54% | 1.28% | 5.55% | 11.58% | 4.14% | 8.75% | 2.24% | 1.90% |
| Class C (CDSC) | 1.54% | 0.57% | 5.55% | 11.58% | 4.14% | 8.75% |
| Class I | 3.01% | 2.24% | 6.58% | 12.66% | 5.15% | 9.81% | 1.24% | 0.90% |
Russell 1000® Value Index1 | 4.36% | 6.37% | 7.59% | 13.31% | 5.35% | – | | |
S&P 500® Total Return Index2 | 4.06% | 4.51% | 8.84% | 13.57% | 6.70% | – | | |
Performance data quoted represents past performance. Past performance does not guarantee future results. Investment return and principal value of an investment will fluctuate so that an investor’s shares, when sold or redeemed, may be worth more or less than the original cost. Current performance data may be higher or lower than actual data quoted. For the most current month-end performance data, please call 1-866-759-5679.
Maximum Offering Price (MOP) for Class A shares includes the Fund’s maximum sales charge of 5.50%. Performance shown at NAV does not include these sales charges and would have been lower had it been taken into account. If you invest $1 million or more, either as a lump sum or through the Fund’s accumulation or letter of intent programs, you can purchase Class A shares without an initial sales charge (load). A Contingent Deferred Sales Charge (“CDSC”) of 1.00% may apply to Class C shares redeemed within the first 12 months after a purchase, and on Class A shares redeemed within the first 18 months after a purchase in excess of $1 million.
Performance less than 1 year is cumulative.
89 | October 31, 2016
ALPS | WMC Research Value Fund
| Performance Update | October 31, 2016 (Unaudited) |
Performance shown for Class C shares prior to June 30, 2010 reflects the historical performance of the Fund’s Class A shares, calculated using the fees and expenses of Class C shares.
Effective February 28, 2015 the Fund changed its name from the ALPS | WMC Disciplined Value Fund to the ALPS | WMC Research Value Fund.
The performance shown for the ALPS | WMC Research Value Fund (the “Fund”) for periods prior to August 29, 2009, reflects the performance of the Activa Mutual Funds Trust – Activa Value Fund (as result of a prior reorganization of Activa Mutual Funds Trust – Activa Value Fund into the Fund).
1 | The Russell 1000® Value Index measures the performance of those Russell 1000® companies with lower price-to-book ratios and lower forecasted growth values. The index is not actively managed and does not reflect any deduction for fees, expenses or taxes. An investor may not invest directly in an index. |
2 | The S&P 500® Index is the Standard & Poor’s composite index of 500 stocks, a widely recognized, unmanaged index of common stock prices. The index is not actively managed and does not reflect any deduction for fees, expenses or taxes. An investor may not invest directly in an index. |
| * | What You Pay reflects the Advisor’s decision to contractually limit expenses through February 28, 2017. Please see the prospectus for additional information. |
The table does not reflect the deduction of taxes that a shareholder would pay on Fund distributions or the redemption of Fund shares.
This Fund is not suitable for all investors and is subject to investment risks, including possible loss of the principal amount invested.
There is no guarantee that the Fund will continue to hold any one particular security or stay invested in any one particular company. The composition of the Fund's top holdings is subject to change. Performance figures are historical and reflect the change in share price, reinvested distributions, changes in net asset value, sales charges and capital gains distributions, if any.
Not FDIC Insured – No Bank Guarantee – May Lose Value
Top Ten Holdings (as a % of Net Assets) †
| Bank of America Corp. | 3.61% |
| The PNC Financial Services Group, Inc. | 2.29% |
| Capital One Financial Corp. | 2.26% |
| Medtronic PLC | 2.21% |
| Pioneer Natural Resources Co. | 2.16% |
| American Express Co. | 2.00% |
| Mondelez International, Inc., Class A | 1.78% |
| Comcast Corp., Class A | 1.73% |
| Assured Guaranty, Ltd. | 1.73% |
| NextEra Energy, Inc. | 1.66% |
| Top Ten Holdings | 21.43% |
† | Holdings are subject to change, and may not reflect the current or future position of the portfolio. Table presents indicative values only. |
Industry Sector Allocation (as a % of Net Assets)
90 | October 31, 2016
ALPS | WMC Research Value Fund
| Statement of Investments | October 31, 2016 |
| | | Shares | | | Value (Note 2) | |
| COMMON STOCKS (98.57%) | | | | | | |
| Consumer Discretionary (7.82%) | | | | | | |
| Consumer Durables & Apparel (1.18%) | | | | |
Mohawk Industries, Inc.(a) | | | 2,612 | | | $ | 481,392 | |
| Whirlpool Corp. | | | 4,060 | | | | 608,269 | |
| | | | | | | | 1,089,661 | |
| | | | | | | | | |
| Consumer Services (0.77%) | | | | | | | | |
| Las Vegas Sands Corp. | | | 6,001 | | | | 347,338 | |
| Vail Resorts, Inc. | | | 2,320 | | | | 369,901 | |
| | | | | | | | 717,239 | |
| | | | | | | | | |
| Media (3.84%) | | | | | | | | |
| Comcast Corp., Class A | | | 26,030 | | | | 1,609,175 | |
| The Interpublic Group of Companies., Inc. | | | 8,964 | | | | 200,704 | |
Liberty Broadband Corp., Class A(a) | | | 16,300 | | | | 1,058,685 | |
Liberty Media Corp. - Liberty Media, Class C(a) | | | 5,749 | | | | 157,580 | |
| Twenty-First Century Fox, Inc., Class A | | | 20,450 | | | | 537,221 | |
| | | | | | | | 3,563,365 | |
| | | | | | | | | |
| Retailing (2.03%) | | | | | | | | |
| Advance Auto Parts, Inc. | | | 7,278 | | | | 1,019,502 | |
| Expedia, Inc. | | | 3,814 | | | | 492,883 | |
Liberty Interactive Corp. QVC Group, Class A(a) | | | 19,866 | | | | 367,323 | |
| | | | | | | | 1,879,708 | |
| | | | | | | | | |
| TOTAL CONSUMER DISCRETIONARY | | 7,249,973 | |
| | | | | | | | | |
| Consumer Staples (6.16%) | | | | | | | | |
| Food Beverage & Tobacco (3.52%) | | | | | | | | |
| Mondelez International, Inc., Class A | | | 36,809 | | | | 1,654,196 | |
| Philip Morris International, Inc. | | | 5,575 | | | | 537,653 | |
Post Holdings, Inc.(a) | | | 14,059 | | | | 1,071,718 | |
| | | | | | | | 3,263,567 | |
| | | | | | | | | |
| Household & Personal Products (2.64%) | | | | | |
| Colgate-Palmolive Co. | | | 9,983 | | | | 712,387 | |
| Coty, Inc., Class A | | | 37,542 | | | | 863,090 | |
| The Estee Lauder Companies, Inc., Class A | | | 10,084 | | | | 878,619 | |
| | | | | | | | 2,454,096 | |
| | | | | | | | | |
| TOTAL CONSUMER STAPLES | | | | | | | 5,717,663 | |
| | | Shares | | | Value (Note 2) | |
| Energy (12.65%) | | | | | | |
| Energy (12.65%) | | | | | | |
| Anadarko Petroleum Corp. | | | 7,541 | | | $ | 448,237 | |
Antero Resources Corp.(a) | | | 11,567 | | | | 306,179 | |
| Baker Hughes, Inc. | | | 18,604 | | | | 1,030,662 | |
Cheniere Energy, Inc.(a) | | | 2,500 | | | | 94,250 | |
| Chevron Corp. | | | 11,139 | | | | 1,166,810 | |
Cobalt International Energy, Inc.(a) | | | 93,415 | | | | 88,193 | |
Diamondback Energy, Inc.(a) | | | 5,947 | | | | 542,902 | |
| Ensco PLC, Class A | | | 12,492 | | | | 97,687 | |
| Hess Corp. | | | 2,154 | | | | 103,327 | |
| Kinder Morgan, Inc. | | | 19,557 | | | | 399,550 | |
Newfield Exploration Co.(a) | | | 36,124 | | | | 1,466,273 | |
| Oceaneering International, Inc. | | | 5,300 | | | | 126,140 | |
| ONEOK, Inc. | | | 4,616 | | | | 223,553 | |
Parsley Energy, Inc., Class A(a) | | | 7,264 | | | | 238,986 | |
| Patterson-UTI Energy, Inc. | | | 14,080 | | | | 316,518 | |
PDC Energy, Inc.(a) | | | 11,146 | | | | 683,584 | |
| Pioneer Natural Resources Co. | | | 11,171 | | | | 1,999,832 | |
| QEP Resources, Inc. | | | 41,426 | | | | 665,716 | |
Rice Energy, Inc.(a) | | | 12,208 | | | | 269,675 | |
| Tenaris SA, ADR | | | 4,560 | | | | 128,592 | |
| Tesco Corp. | | | 27,100 | | | | 185,635 | |
| Tesoro Corp. | | | 2,524 | | | | 214,464 | |
| TransCanada Corp. | | | 12,748 | | | | 577,229 | |
| Valero Energy Corp. | | | 6,077 | | | | 360,002 | |
| | | | | | | | | |
| TOTAL ENERGY | | | | | | | 11,733,996 | |
| | | | | | | | | |
| Financials (25.41%) | | | | | | | | |
| Banks (7.12%) | | | | | | | | |
| Bank of America Corp. | | | 203,159 | | | | 3,352,123 | |
| The PNC Financial Services Group, Inc. | | | 22,219 | | | | 2,124,136 | |
| Wells Fargo & Co. | | | 24,452 | | | | 1,125,037 | |
| | | | | | | | 6,601,296 | |
| | | | | | | | | |
| Diversified Financials (8.45%) | | | | | | | | |
| American Express Co. | | | 27,950 | | | | 1,856,439 | |
| BlackRock, Inc. | | | 1,110 | | | | 378,776 | |
| Capital One Financial Corp. | | | 28,267 | | | | 2,092,889 | |
Gores Holdings, Inc., Class A(a) | | | 37,754 | | | | 430,018 | |
| Intercontinental Exchange, Inc. | | | 1,580 | | | | 427,216 | |
| Invesco, Ltd. | | | 4,408 | | | | 123,821 | |
| Legg Mason, Inc. | | | 8,530 | | | | 244,982 | |
| Morgan Stanley | | | 4,564 | | | | 153,213 | |
| Northern Trust Corp. | | | 6,350 | | | | 459,867 | |
OneMain Holdings, Inc.(a) | | | 8,270 | | | | 234,372 | |
| S&P Global, Inc. | | | 2,180 | | | | 265,633 | |
91 | October 31, 2016
ALPS | WMC Research Value Fund
| Statement of Investments | October 31, 2016 |
| | | Shares | | | Value (Note 2) | |
| Diversified Financials (continued) | | | | | | |
Santander Consumer USA Holdings, Inc.(a) | | | 88,768 | | | $ | 1,082,970 | |
| WisdomTree Investments, Inc. | | | 10,300 | | | | 88,374 | |
| | | | | | | | 7,838,570 | |
| | | | | | | | | |
| Insurance (9.84%) | | | | | | | | |
Alleghany Corp.(a) | | | 1,130 | | | | 583,317 | |
| The Allstate Corp. | | | 4,710 | | | | 319,809 | |
| American International Group, Inc. | | | 22,440 | | | | 1,384,548 | |
| Assurant, Inc. | | | 4,020 | | | | 323,691 | |
| Assured Guaranty, Ltd. | | | 53,800 | | | | 1,608,082 | |
| Chubb, Ltd. | | | 500 | | | | 63,500 | |
| The Hartford Financial Services Group, Inc. | | | 18,527 | | | | 817,226 | |
| Marsh & McLennan Companies, Inc. | | | 20,310 | | | | 1,287,451 | |
| MetLife, Inc. | | | 8,290 | | | | 389,299 | |
| Principal Financial Group, Inc. | | | 5,334 | | | | 291,236 | |
| Prudential Financial, Inc. | | | 7,404 | | | | 627,785 | |
| Reinsurance Group of America, Inc. | | | 1,490 | | | | 160,711 | |
| XL Group, Ltd. | | | 36,790 | | | | 1,276,613 | |
| | | | | | | | 9,133,268 | |
| | | | | | | | | |
| TOTAL FINANCIALS | | | | | | | 23,573,134 | |
| | | | | | | | | |
| Health Care (12.07%) | | | | | | | | |
| Health Care Equipment & Services (8.93%) | |
| Abbott Laboratories | | | 16,856 | | | | 661,429 | |
| Becton Dickinson and Co. | | | 1,908 | | | | 320,372 | |
Boston Scientific Corp.(a) | | | 44,945 | | | | 988,790 | |
| Cigna Corp. | | | 3,150 | | | | 374,314 | |
| Danaher Corp. | | | 11,930 | | | | 937,102 | |
HCA Holdings, Inc.(a) | | | 7,680 | | | | 587,750 | |
| McKesson Corp. | | | 3,745 | | | | 476,252 | |
| Medtronic PLC | | | 25,020 | | | | 2,052,140 | |
| St Jude Medical, Inc. | | | 9,220 | | | | 717,685 | |
| Stryker Corp. | | | 4,148 | | | | 478,472 | |
| UnitedHealth Group, Inc. | | | 4,850 | | | | 685,451 | |
| | | | | | | | 8,279,757 | |
| | | | | | | | | |
| Pharmaceuticals, Biotechnology & Life Sciences (3.14%) | |
Alkermes PLC(a) | | | 1,730 | | | | 87,209 | |
Allergan PLC(a) | | | 4,184 | | | | 874,205 | |
Alnylam Pharmaceuticals, Inc.(a) | | | 930 | | | | 33,108 | |
| Bristol-Myers Squibb Co. | | | 10,024 | | | | 510,322 | |
| Eli Lilly & Co. | | | 5,551 | | | | 409,886 | |
| Merck & Co., Inc. | | | 13,789 | | | | 809,690 | |
| | | Shares | | | Value (Note 2) | |
| Pharmaceuticals, Biotechnology & Life Sciences (continued) | |
Mylan N.V.(a) | | | 5,240 | | | $ | 191,260 | |
| | | | | | | | 2,915,680 | |
| | | | | | | | | |
| TOTAL HEALTH CARE | | | | | | | 11,195,437 | |
| | | | | | | | | |
| Industrials (8.34%) | | | | | | | | |
| Capital Goods (5.27%) | | | | | | | | |
| AMETEK, Inc. | | | 5,510 | | | | 242,991 | |
| Eaton Corp. PLC | | | 5,800 | | | | 369,866 | |
| Fortive Corp. | | | 5,965 | | | | 304,513 | |
| General Dynamics Corp. | | | 2,631 | | | | 396,597 | |
| General Electric Co. | | | 52,100 | | | | 1,516,110 | |
| Honeywell International, Inc. | | | 2,046 | | | | 224,406 | |
| Illinois Tool Works, Inc. | | | 3,239 | | | | 367,853 | |
NOW, Inc.(a) | | | 10,064 | | | | 216,980 | |
| Pentair PLC | | | 5,671 | | | | 312,642 | |
| United Technologies Corp. | | | 6,430 | | | | 657,146 | |
WESCO International, Inc.(a) | | | 5,210 | | | | 282,382 | |
| | | | | | | | 4,891,486 | |
| | | | | | | | | |
| Commercial & Professional Services (1.66%) | | | | | |
| Equifax, Inc. | | | 1,494 | | | | 185,211 | |
Huron Consulting Group, Inc.(a) | | | 938 | | | | 52,575 | |
IHS Markit, Ltd.(a) | | | 5,238 | | | | 192,706 | |
| ManpowerGroup, Inc. | | | 1,608 | | | | 123,494 | |
| Nielsen Holdings PLC | | | 10,322 | | | | 464,696 | |
TransUnion(a) | | | 9,904 | | | | 309,401 | |
| Waste Connections, Inc. | | | 2,855 | | | | 214,725 | |
| | | | | | | | 1,542,808 | |
| | | | | | | | | |
| Transportation (1.41%) | | | | | | | | |
| FedEx Corp. | | | 2,180 | | | | 380,018 | |
Genesee & Wyoming, Inc., Class A(a) | | | 8,044 | | | | 546,509 | |
| Kansas City Southern | | | 1,290 | | | | 113,210 | |
Kirby Corp.(a) | | | 900 | | | | 53,055 | |
XPO Logistics, Inc.(a) | | | 6,350 | | | | 209,106 | |
| | | | | | | | 1,301,898 | |
| | | | | | | | | |
| TOTAL INDUSTRIALS | | | | | | | 7,736,192 | |
| | | | | | | | | |
| Information Technology (8.75%) | | | | | | | | |
| Semiconductors & Semiconductor Equipment (3.06%) | |
| Broadcom, Ltd. | | | 341 | | | | 58,065 | |
First Solar, Inc.(a) | | | 1,742 | | | | 70,534 | |
| Intel Corp. | | | 36,556 | | | | 1,274,708 | |
| Microchip Technology, Inc. | | | 770 | | | | 46,623 | |
Micron Technology, Inc.(a) | | | 11,882 | | | | 203,895 | |
NXP Semiconductors N.V.(a) | | | 1,678 | | | | 167,800 | |
Qorvo, Inc.(a) | | | 5,207 | | | | 289,770 | |
| QUALCOMM, Inc. | | | 10,153 | | | | 697,714 | |
92 | October 31, 2016
ALPS | WMC Research Value Fund
| Statement of Investments | October 31, 2016 |
| | | Shares | | | Value (Note 2) | |
| Semiconductors & Semiconductor Equipment (continued) | |
SunPower Corp.(a) | | | 3,500 | | | $ | 25,340 | |
| | | | | | | | 2,834,449 | |
| | | | | | | | | |
| Software & Services (3.11%) | | | | | | | | |
Alliance Data Systems Corp.(a) | | | 1,422 | | | | 290,756 | |
Alphabet, Inc., Class A(a) | | | 1,049 | | | | 849,585 | |
| Automatic Data Processing, Inc. | | | 2,146 | | | | 186,831 | |
CACI International, Inc., Class A(a) | | | 2,004 | | | | 196,091 | |
Electronic Arts, Inc.(a) | | | 2,318 | | | | 182,009 | |
Genpact, Ltd.(a) | | | 6,140 | | | | 141,159 | |
| Global Payments, Inc. | | | 4,187 | | | | 303,641 | |
| SS&C Technologies Holdings, Inc. | | | 9,608 | | | | 306,784 | |
| Visa, Inc., Class A | | | 2,410 | | | | 198,849 | |
Zillow Group, Inc., Class A(a) | | | 4,136 | | | | 136,612 | |
Zillow Group, Inc., Class C(a) | | | 2,719 | | | | 90,706 | |
| | | | | | | | 2,883,023 | |
| | | | | | | | | |
| Technology Hardware & Equipment (2.58%) | | | | |
| Apple, Inc. | | | 6,762 | | | | 767,758 | |
| Cisco Systems, Inc. | | | 18,099 | | | | 555,277 | |
| Hewlett Packard Enterprise Co. | | | 17,637 | | | | 396,303 | |
Lumentum Holdings, Inc.(a) | | | 3,509 | | | | 117,903 | |
| Seagate Technology PLC | | | 15,555 | | | | 533,692 | |
VeriFone Systems, Inc.(a) | | | 1,450 | | | | 22,446 | |
| | | | | | | | 2,393,379 | |
| | | | | | | | | |
| TOTAL INFORMATION TECHNOLOGY | | | 8,110,851 | |
| | | | | | | | | |
| Materials (3.94%) | | | | | | | | |
| Materials (3.94%) | | | | | | | | |
| Ball Corp. | | | 3,460 | | | | 266,662 | |
Boise Cascade Co.(a) | | | 7,980 | | | | 153,615 | |
| Cabot Corp. | | | 3,776 | | | | 196,881 | |
| Celanese Corp., Series A | | | 3,940 | | | | 287,305 | |
| CRH PLC, Sponsored ADR | | | 5,600 | | | | 180,880 | |
Crown Holdings, Inc.(a) | | | 4,425 | | | | 240,056 | |
| The Dow Chemical Co. | | | 12,801 | | | | 688,822 | |
| International Paper Co. | | | 7,780 | | | | 350,333 | |
| Martin Marietta Materials, Inc. | | | 839 | | | | 155,534 | |
| Monsanto Co. | | | 1,470 | | | | 148,132 | |
| The Mosaic Co. | | | 3,496 | | | | 82,261 | |
Owens-Illinois, Inc.(a) | | | 5,150 | | | | 99,395 | |
| PPG Industries, Inc. | | | 1,741 | | | | 162,139 | |
| Reliance Steel & Aluminum Co. | | | 1,960 | | | | 134,809 | |
| Steel Dynamics, Inc. | | | 7,600 | | | | 208,696 | |
| Vulcan Materials Co. | | | 2,633 | | | | 298,055 | |
| | | | | | | | | |
| TOTAL MATERIALS | | | | | | | 3,653,575 | |
| | | | Shares | | | Value (Note 2) | |
| Real Estate (5.09%) | | | | | | | |
| Real Estate (5.09%) | | | | | | | |
| American Tower Corp. | | | | 4,870 | | | $ | 570,715 | |
| Apartment Investment & Management Co., Class A | | | 10,276 | | | | 452,863 | |
| Douglas Emmett, Inc. | | | | 22,867 | | | | 834,645 | |
| Duke Realty Corp. | | | | 14,901 | | | | 389,661 | |
| Equity One, Inc. | | | | 16,711 | | | | 476,264 | |
| Forest City Realty Trust, Inc., Class A | | | 18,183 | | | | 392,571 | |
| Host Hotels & Resorts, Inc. | | | | 14,300 | | | | 221,364 | |
| Outfront Media, Inc. | | | | 13,300 | | | | 286,083 | |
| QTS Realty Trust, Inc., Class A | | | 5,120 | | | | 235,315 | |
| Sun Communities, Inc. | | | | 5,450 | | | | 419,269 | |
| VEREIT, Inc. | | | | 46,639 | | | | 438,407 | |
| | | | | | | | | | |
| TOTAL REAL ESTATE | | | | | | | | 4,717,157 | |
| | | | | | | | | | |
| Utilities (8.34%) | | | | | | | | | |
| Utilities (8.34%) | | | | | | | | | |
| Ameren Corp. | | | | 7,130 | | | | 356,143 | |
| Avangrid, Inc. | | | | 17,730 | | | | 698,739 | |
| Dominion Resources, Inc. | | | 8,695 | | | | 653,864 | |
| Duke Energy Corp. | | | | 2,682 | | | | 214,614 | |
| Edison International | | | | 7,650 | | | | 562,122 | |
| Exelon Corp. | | | | 14,280 | | | | 486,520 | |
| NextEra Energy, Inc. | | | | 12,007 | | | | 1,536,896 | |
| PG&E Corp. | | | | 12,967 | | | | 805,510 | |
| Pinnacle West Capital Corp. | | | 5,020 | | | | 382,173 | |
| Sempra Energy | | | | 6,920 | | | | 741,132 | |
| UGI Corp. | | | | 28,100 | | | | 1,300,749 | |
| | | | | | | | | | |
| TOTAL UTILITIES | | 7,738,462 | |
| | | | | | | | | | |
TOTAL COMMON STOCKS
(Cost $87,408,459) | | 91,426,440 | |
| | | | | | | | | | |
| | 7-Day Yield | | Shares | | | Value (Note 2) | |
| SHORT TERM INVESTMENTS (1.59%) | | | | | |
| Money Market Fund (1.59%) |
| Morgan Stanley Institutional Liquidity Fund - Prime Portfolio | 0.576 | % | | 1,478,748 | | | | 1,478,748 | |
| | | | | | | | | | |
TOTAL SHORT TERM INVESTMENTS
(Cost $1,478,748) | 1,478,748 | |
93 | October 31, 2016
ALPS | WMC Research Value Fund
| Statement of Investments | October 31, 2016 |
| | | | Shares | | | Value (Note 2) | |
TOTAL INVESTMENTS (100.16%)
(Cost $88,887,207) | $ | 92,905,188 | |
| | | | | | | | | |
| Liabilities In Excess Of Other Assets (-0.16%) | | | | (147,585 | )(b) |
| | | | | | | | | |
| NET ASSETS (100.00%) | $ | 92,757,603 | |
(a) | Non-Income Producing Security. |
(b) | Includes cash which is being held as collateral for futures contracts in the amount of $45,000. |
For Fund compliance purposes, the Fund's industry classifications refer to any one or more of the industry sub-classifications used by one or more widely recognized market indexes or ratings group indexes, and/or as defined by Fund management. This definition may not apply for purposes of this report, which may combine industry sub-classifications for reporting ease. Industries are shown as a percent of net assets.
See Notes to Financial Statements.
FUTURES CONTRACTS
| Description | Position | | Contracts | | Expiration Date | | Value (Note 2) | | | Unrealized Depreciation | |
S&P 500® Emini Future | Long | | | 10 | | 12/16/16 | | $ | 1,060,050 | | | $ | (13,220 | ) |
| | | | | | | | | $ | 1,060,050 | | | $ | (13,220 | ) |
94 | October 31, 2016
ALPS | WMC Research Value Fund
| Statement of Assets and Liabilities | October 31, 2016 |
| ASSETS | | | |
| Investments, at value | | $ | 92,905,188 | |
| Receivable for investments sold | | | 1,184,345 | |
| Receivable for shares sold | | | 650 | |
| Deposit with broker for futures contracts (Note 3) | | | 45,000 | |
| Dividends receivable | | | 60,382 | |
| Prepaid expenses and other assets | | | 11,072 | |
| Total Assets | | | 94,206,637 | |
| LIABILITIES | | | | |
| Payable for investments purchased | | | 1,232,619 | |
| Payable for variation margin on futures contracts | | | 1,850 | |
| Payable for shares redeemed | | | 113,109 | |
| Investment advisory fees payable | | | 41,873 | |
| Administration and transfer agency fees payable | | | 16,786 | |
| Distribution and services fees payable | | | 11,075 | |
| Professional fees payable | | | 21,352 | |
| Accrued expenses and other liabilities | | | 10,370 | |
| Total Liabilities | | | 1,449,034 | |
| NET ASSETS | | $ | 92,757,603 | |
| NET ASSETS CONSIST OF | | | | |
| Paid-in capital | | $ | 86,259,410 | |
| Accumulated net realized gain | | | 2,493,432 | |
| Net unrealized appreciation | | | 4,004,761 | |
| NET ASSETS | | $ | 92,757,603 | |
| INVESTMENTS, AT COST | | $ | 88,887,207 | |
| PRICING OF SHARES | | | | |
| Class A: | | | | |
| Net Asset Value, offering and redemption price per share | | $ | 8.37 | |
| Net Assets | | $ | 49,813,813 | |
| Shares of beneficial interest outstanding (unlimited number of shares, no par value common stock authorized) | | | 5,954,100 | |
| Maximum offering price per share ((NAV/0.9450), based on maximum sales charge of 5.50% of the offering price) | | $ | 8.86 | |
| Class C: | | | | |
Net Asset Value, offering and redemption price per share(a) | | $ | 8.06 | |
| Net Assets | | $ | 448,739 | |
| Shares of beneficial interest outstanding (unlimited number of shares, no par value common stock authorized) | | | 55,687 | |
| Class I: | | | | |
| Net Asset Value, offering and redemption price per share | | $ | 8.56 | |
| Net Assets | | $ | 42,495,051 | |
| Shares of beneficial interest outstanding (unlimited number of shares, no par value common stock authorized) | | | 4,963,606 | |
(a) | Redemption price per share may be reduced for any applicable contingent deferred sales charge. For a description of a possible sales charge, please see the Fund's Prospectus. |
See Notes to Financial Statements.
95 | October 31, 2016
ALPS | WMC Research Value Fund
| Statement of Operations | For the Year Ended October 31, 2016 |
| INVESTMENT INCOME | | | |
| Dividends | | $ | 1,663,742 | |
| Foreign taxes withheld on dividends | | | (3,767 | ) |
| Total Investment Income | | | 1,659,975 | |
| | | | | |
| EXPENSES | | | | |
| Investment advisory fees | | | 874,684 | |
| Administrative fees | | | 146,432 | |
| Transfer agency fees | | | 19,405 | |
| Distribution and service fees | | | | |
| Class A | | | 125,978 | |
| Class C | | | 5,572 | |
| Professional fees | | | 32,899 | |
| Delegated transfer agent equivalent services | | | | |
| Class A | | | 46 | |
| Reports to shareholders and printing fees | | | 20,051 | |
| State registration fees | | | 51,750 | |
| Insurance fees | | | 948 | |
| Custody fees | | | 12,548 | |
| Trustees' fees and expenses | | | 2,505 | |
| Miscellaneous expenses | | | 15,090 | |
| Total Expenses | | | 1,307,908 | |
| Less fees waived/reimbursed by investment advisor (Note 8) | | | | |
| Class A | | | (190,057 | ) |
| Class C | | | (2,075 | ) |
| Class I | | | (155,578 | ) |
| Net Expenses | | | 960,198 | |
| Net Investment Income | | | 699,777 | |
| Net realized gain on investments | | | 3,947,990 | |
| Net realized gain on futures contracts | | | 130,312 | |
| Net Realized Gain | | | 4,078,302 | |
| Net change in unrealized depreciation on investments | | | (2,780,991 | ) |
| Net change in unrealized depreciation on futures contracts | | | (68,676 | ) |
| Net Change in Unrealized Depreciation | | | (2,849,667 | ) |
| NET REALIZED AND UNREALIZED GAIN ON INVESTMENTS | | | 1,228,635 | |
| NET INCREASE IN NET ASSETS RESULTING FROM OPERATIONS | | $ | 1,928,412 | |
See Notes to Financial Statements.
96 | October 31, 2016
ALPS | WMC Research Value Fund
Statements of Changes in Net Assets
| | | For the Year Ended October 31, 2016 | | | For the Year Ended October 31, 2015(a) | |
| OPERATIONS | | | | | | |
| Net investment income | | $ | 699,777 | | | $ | 642,249 | |
| Net realized gain | | | 4,078,302 | | | | 29,091,971 | |
| Net realized gain distributions from other investment companies | | | – | | | | 15,732 | |
| Net change in unrealized depreciation | | | (2,849,667 | ) | | | (26,918,449 | ) |
| Net Increase in Net Assets Resulting from Operations | | | 1,928,412 | | | | 2,831,503 | |
| | | | | | | | | |
| DISTRIBUTIONS | | | | | | | | |
| Dividends to shareholders from net investment income | | | | | | | | |
| Class A | | | (102,727 | ) | | | (280,500 | ) |
| Class C | | | (484 | ) | | | (1,366 | ) |
| Class I | | | (91,773 | ) | | | (222,337 | ) |
| Dividends to shareholders from net realized gains | | | | | | | | |
| Class A | | | (15,829,298 | ) | | | (5,704,627 | ) |
| Class C | | | (227,520 | ) | | | (35,924 | ) |
| Class I | | | (11,519,557 | ) | | | (4,142,646 | ) |
| Net Decrease in Net Assets from Distributions | | | (27,771,359 | ) | | | (10,387,400 | ) |
| | | | | | | | | |
| BENEFICIAL INTEREST TRANSACTIONS (NOTE 6) | | | | | | | | |
| Shares sold | | | | | | | | |
| Class A | | | 303,903 | | | | 1,824,143 | |
| Class C | | | 341,007 | | | | 1,632,083 | |
| Class I | | | 5,568,845 | | | | 3,318,615 | |
| Dividends reinvested | | | | | | | | |
| Class A | | | 15,117,811 | | | | 5,488,048 | |
| Class C | | | 164,039 | | | | 19,609 | |
| Class I | | | 11,601,856 | | | | 4,362,161 | |
| Shares redeemed | | | | | | | | |
| Class A | | | (6,155,607 | ) | | | (6,874,850 | ) |
| Class C | | | (671,989 | ) | | | (1,003,097 | ) |
| Class I | | | (5,062,113 | ) | | | (7,204,797 | ) |
| Net Increase in Net Assets Derived from Beneficial Interest Transactions | | | 21,207,752 | | | | 1,561,915 | |
| | | | | | | | | |
| Net decrease in net assets | | | (4,635,195 | ) | | | (5,993,982 | ) |
| | | | | | | | | |
| NET ASSETS | | | | | | | | |
| Beginning of year | | | 97,392,798 | | | | 103,386,780 | |
| End of year * | | $ | 92,757,603 | | | $ | 97,392,798 | |
| *Including accumulated net investment income of: | | $ | (0 | ) | | $ | (0 | ) |
(a) | Effective February 28, 2015 the Fund changed its name from the ALPS | WMC Disciplined Value Fund to the ALPS | WMC Research Value Fund. |
See Notes to Financial Statements.
97 | October 31, 2016
ALPS | WMC Research Value Fund – Class A
Financial Highlights
Selected data for a share of beneficial interest outstanding throughout the periods indicated:
| | | For the Year Ended October 31, 2016 | | | For the Year Ended October 31, 2015(a) | | | For the Fiscal Period Ended October 31, 2014(b) | | | For the Year Ended April 30, 2014 | | | For the Year Ended April 30, 2013(c) | | | For the Year Ended April 30, 2012 | |
| Net asset value, beginning of period | | $ | 11.57 | | | $ | 12.54 | | | $ | 11.92 | | | $ | 10.01 | | | $ | 8.42 | | | $ | 8.64 | |
| | | | | | | | | | | | | | | | | | | | | | | | | |
| INCOME/(LOSS) FROM INVESTMENT OPERATIONS: |
Net investment income(d) | | | 0.06 | | | | 0.06 | | | | 0.03 | | | | 0.06 | | | | 0.08 | | | | 0.06 | |
| Net realized and unrealized gain/(loss) | | | 0.08 | | | | 0.23 | | | | 0.59 | | | | 2.09 | | | | 1.61 | | | | (0.23 | ) |
| Total from investment operations | | | 0.14 | | | | 0.29 | | | | 0.62 | | | | 2.15 | | | | 1.69 | | | | (0.17 | ) |
| | | | | | | | | | | | | | | | | | | | | | | | | |
| DISTRIBUTIONS: | | | | | | | | | | | | | | | | | | | | | | | | |
| From net investment income | | | (0.02 | ) | | | (0.06 | ) | | | – | | | | (0.11 | ) | | | (0.10 | ) | | | (0.05 | ) |
| From net realized gains | | | (3.32 | ) | | | (1.20 | ) | | | – | | | | (0.13 | ) | | | – | | | | – | |
| Total distributions | | | (3.34 | ) | | | (1.26 | ) | | | – | | | | (0.24 | ) | | | (0.10 | ) | | | (0.05 | ) |
| | | | | | | | | | | | | | | | | | | | | | | | | |
| Net increase/(decrease) in net asset value | | | (3.20 | ) | | | (0.97 | ) | | | 0.62 | | | | 1.91 | | | | 1.59 | | | | (0.22 | ) |
| Net asset value, end of year | | $ | 8.37 | | | $ | 11.57 | | | $ | 12.54 | | | $ | 11.92 | | | $ | 10.01 | | | $ | 8.42 | |
TOTAL RETURN(e) | | | 2.09 | % | | | 2.57 | % | | | 5.20 | % | | | 21.70 | % | | | 20.17 | % | | | (1.81 | )% |
| | | | | | | | | | | | | | | | | | | | | | | | | |
| RATIOS/SUPPLEMENTAL DATA: |
| Net assets, end of year (000s) | | $ | 49,814 | | | $ | 55,608 | | | $ | 59,628 | | | $ | 59,069 | | | $ | 50,142 | | | $ | 44,989 | |
| Ratio of expenses to average net assets excluding fee waivers and reimbursements | | | 1.53 | % | | | 1.49 | % | | | 1.48 | %(f) | | | 1.47 | % | | | 1.51 | % | | | 1.58 | % |
| Ratio of expenses to average net assets including fee waivers and reimbursements | | | 1.15 | %(g) | | | 1.40 | % | | | 1.40 | %(f) | | | 1.40 | % | | | 1.40 | % | | | 1.40 | % |
| Ratio of net investment income to average net assets | | | 0.66 | % | | | 0.53 | % | | | 0.48 | %(f) | | | 0.52 | % | | | 0.95 | % | | | 0.83 | % |
Portfolio turnover rate(h) | | | 78 | % | | | 114 | % | | | 13 | % | | | 19 | % | | | 34 | % | | | 46 | % |
| (a) | Effective February 28, 2015 the Fund changed its name from the ALPS | WMC Disciplined Value Fund to the ALPS | WMC Research Value Fund. |
| (b) | Effective May 1, 2014, the Board approved changing the fiscal year-end of the Funds from April 30 to October 31. |
| (c) | Prior to August 31, 2012, the ALPS | WMC Disciplined Value Fund was known as the ALPS | WMC Value Intersection Fund. |
| (d) | Calculated using the average shares method. |
| (e) | Total returns are for the period indicated and have not been annualized. Total returns would have been lower had certain expenses not been waived during the period. Returns shown do not reflect the deduction of taxes that a shareholder would pay on Fund distributions or the redemption of Fund shares. Returns shown exclude any applicable sales charges. |
| (g) | Effective November 1, 2015 the contractual expense limitation changed from 1.40% to 1.15%. |
| (h) | Portfolio turnover rate for periods less than one full year have not been annualized. |
See Notes to Financial Statements.
98 | October 31, 2016
ALPS | WMC Research Value Fund – Class C
Financial Highlights
Selected data for a share of beneficial interest outstanding throughout the periods indicated:
| | | For the Year Ended October 31, 2016 | | | For the Year Ended October 31, 2015(a) | | | For the Fiscal Period Ended October 31, 2014(b) | | | For the Year Ended April 30, 2014 | | | For the Year Ended April 30, 2013(c) | | | For the Year Ended April 30, 2012 | |
| Net asset value, beginning of period | | $ | 11.32 | | | $ | 12.36 | | | $ | 11.80 | | | $ | 9.93 | | | $ | 8.39 | | | $ | 8.62 | |
| | | | | | | | | | | | | | | | | | | | | | | | | |
| INCOME/(LOSS) FROM INVESTMENT OPERATIONS: |
Net investment income/(loss)(d) | | | (0.01 | ) | | | (0.03 | ) | | | (0.02 | ) | | | (0.02 | ) | | | 0.02 | | | | (0.01 | ) |
| Net realized and unrealized gain/(loss) | | | 0.08 | | | | 0.24 | | | | 0.58 | | | | 2.08 | | | | 1.57 | | | | (0.20 | ) |
| Total from investment operations | | | 0.07 | | | | 0.21 | | | | 0.56 | | | | 2.06 | | | | 1.59 | | | | (0.21 | ) |
| | | | | | | | | | | | | | | | | | | | | | | | | |
| DISTRIBUTIONS: | | | | | | | | | | | | | | | | | | | | | | | | |
| From net investment income | | | (0.01 | ) | | | (0.05 | ) | | | – | | | | (0.06 | ) | | | (0.05 | ) | | | (0.02 | ) |
| From net realized gains | | | (3.32 | ) | | | (1.20 | ) | | | – | | | | (0.13 | ) | | | – | | | | – | |
| Total distributions | | | (3.33 | ) | | | (1.25 | ) | | | – | | | | (0.19 | ) | | | (0.05 | ) | | | (0.02 | ) |
| | | | | | | | | | | | | | | | | | | | | | | | | |
| Net increase/(decrease) in net asset value | | | (3.26 | ) | | | (1.04 | ) | | | 0.56 | | | | 1.87 | | | | 1.54 | | | | (0.23 | ) |
| Net asset value, end of year | | $ | 8.06 | | | $ | 11.32 | | | $ | 12.36 | | | $ | 11.80 | | | $ | 9.93 | | | $ | 8.39 | |
TOTAL RETURN(e) | | | 1.28 | % | | | 1.87 | % | | | 4.75 | % | | | 20.97 | % | | | 19.07 | % | | | (2.45 | )% |
| | | | | | | | | | | | | | | | | | | | | | | | | |
| RATIOS/SUPPLEMENTAL DATA: |
| Net assets, end of year (000s) | | $ | 449 | | | $ | 870 | | | $ | 257 | | | $ | 133 | | | $ | 100 | | | $ | 79 | |
| Ratio of expenses to average net assets excluding fee waivers and reimbursements | | | 2.27 | % | | | 2.24 | % | | | 2.24 | %(f) | | | 2.22 | % | | | 2.26 | % | | | 2.38 | % |
| Ratio of expenses to average net assets including fee waivers and reimbursements | | | 1.90 | %(g) | | | 2.15 | % | | | 2.15 | %(f) | | | 2.15 | % | | | 2.15 | % | | | 2.15 | % |
| Ratio of net investment income/(loss) to average net assets | | | (0.07 | )% | | | (0.22 | )% | | | (0.30 | )%(f) | | | (0.23 | )% | | | 0.19 | % | | | (0.16 | )% |
Portfolio turnover rate(h) | | | 78 | % | | | 114 | % | | | 13 | % | | | 19 | % | | | 34 | % | | | 46 | % |
| (a) | Effective February 28, 2015 the Fund changed its name from the ALPS | WMC Disciplined Value Fund to the ALPS | WMC Research Value Fund. |
| (b) | Effective May 1, 2014, the Board approved changing the fiscal year-end of the Funds from April 30 to October 31. |
| (c) | Prior to August 31, 2012, the ALPS | WMC Disciplined Value Fund was known as the ALPS | WMC Value Intersection Fund. |
| (d) | Calculated using the average shares method. |
| (e) | Total returns are for the period indicated and have not been annualized. Total returns would have been lower had certain expenses not been waived during the period. Returns shown do not reflect the deduction of taxes that a shareholder would pay on Fund distributions or the redemption of Fund shares. Returns shown exclude any applicable sales charges. |
| (g) | Effective November 1, 2015 the contractual expense limitation changed from 2.15% to 1.90%. |
| (h) | Portfolio turnover rate for periods less than one full year have not been annualized. |
See Notes to Financial Statements.
99 | October 31, 2016
ALPS | WMC Research Value Fund – Class I
Financial Highlights
Selected data for a share of beneficial interest outstanding throughout the periods indicated:
| | | For the Year Ended October 31, 2016 | | | For the Year Ended October 31, 2015(a) | | | For the Fiscal Period Ended October 31, 2014(b) | | | For the Year Ended April 30, 2014 | | | For the Year Ended April 30, 2013(c) | | | For the Year Ended April 30, 2012 | |
| Net asset value, beginning of period | | $ | 11.75 | | | $ | 12.69 | | | $ | 12.05 | | | $ | 10.10 | | | $ | 8.49 | | | $ | 8.71 | |
| | | | | | | | | | | | | | | | | | | | | | | | | |
| INCOME/(LOSS) FROM INVESTMENT OPERATIONS: |
Net investment income(d) | | | 0.08 | | | | 0.09 | | | | 0.05 | | | | 0.09 | | | | 0.11 | | | | 0.09 | |
| Net realized and unrealized gain/(loss) | | | 0.08 | | | | 0.23 | | | | 0.59 | | | | 2.12 | | | | 1.61 | | | | (0.24 | ) |
| Total from investment operations | | | 0.16 | | | | 0.32 | | | | 0.64 | | | | 2.21 | | | | 1.72 | | | | (0.15 | ) |
| | | | | | | | | | | | | | | | | | | | | | | | | |
| DISTRIBUTIONS: | | | | | | | | | | | | | | | | | | | | | | | | |
| From net investment income | | | (0.03 | ) | | | (0.06 | ) | | | – | | | | (0.13 | ) | | | (0.11 | ) | | | (0.07 | ) |
| From net realized gains | | | (3.32 | ) | | | (1.20 | ) | | | – | | | | (0.13 | ) | | | – | | | | – | |
| Total distributions | | | (3.35 | ) | | | (1.27 | ) | | | – | | | | (0.26 | ) | | | (0.11 | ) | | | (0.07 | ) |
| | | | | | | | | | | | | | | | | | | | | | | | | |
| Net increase/(decrease) in net asset value | | | (3.19 | ) | | | (0.94 | ) | | | 0.64 | | | | 1.95 | | | | 1.61 | | | | (0.22 | ) |
| Net asset value, end of year | | $ | 8.56 | | | $ | 11.75 | | | $ | 12.69 | | | $ | 12.05 | | | $ | 10.10 | | | $ | 8.49 | |
TOTAL RETURN(e) | | | 2.24 | % | | | 2.86 | % | | | 5.31 | % | | | 22.11 | % | | | 20.43 | % | | | (1.62 | )% |
| | | | | | | | | | | | | | | | | | | | | | | | | |
| RATIOS/SUPPLEMENTAL DATA: |
| Net assets, end of year (000s) | | $ | 42,495 | | | $ | 40,915 | | | $ | 43,502 | | | $ | 44,729 | | | $ | 39,417 | | | $ | 34,636 | |
| Ratio of expenses to average net assets excluding fee waivers and reimbursements | | | 1.28 | % | | | 1.24 | % | | | 1.23 | %(f) | | | 1.22 | % | | | 1.26 | % | | | 1.33 | % |
| Ratio of expenses to average net assets including fee waivers and reimbursements | | | 0.90 | %(g) | | | 1.15 | % | | | 1.15 | %(f) | | | 1.15 | % | | | 1.15 | % | | | 1.15 | % |
| Ratio of net investment income to average net assets | | | 0.90 | % | | | 0.78 | % | | | 0.74 | %(f) | | | 0.77 | % | | | 1.20 | % | | | 1.08 | % |
Portfolio turnover rate(h) | | | 78 | % | | | 114 | % | | | 13 | % | | | 19 | % | | | 34 | % | | | 46 | % |
| (a) | Effective February 28, 2015 the Fund changed its name from the ALPS | WMC Disciplined Value Fund to the ALPS | WMC Research Value Fund. |
| (b) | Effective May 1, 2014, the Board approved changing the fiscal year-end of the Funds from April 30 to October 31. |
| (c) | Prior to August 31, 2012, the ALPS | WMC Disciplined Value Fund was known as the ALPS | WMC Value Intersection Fund. |
| (d) | Calculated using the average shares method. |
| (e) | Total returns are for the period indicated and have not been annualized. Total returns would have been lower had certain expenses not been waived during the period. Returns shown do not reflect the deduction of taxes that a shareholder would pay on Fund distributions or the redemption of Fund shares. |
| (g) | Effective November 1, 2015 the contractual expense limitation changed from 1.15% to 0.90%. |
| (h) | Portfolio turnover rate for periods less than one full year have not been annualized. |
See Notes to Financial Statements.
100 | October 31, 2016
Clough China Fund
| Management Commentary | October 31, 2016 (Unaudited) |
The Clough China Fund’s (the “Fund”) fiscal year ended October 31, 2016 could be viewed in two segments. The first lasting from October 2015 to mid-February 2016, where the MSCI China Index fell nearly 25% from peak-to-trough as investors became concerned with an accelerating decline in foreign currency reserves in conjunction with a weakening Chinese currency, Renminbi (RMB). The lack of comment from China's Central Bank, People’s Bank of China (PBOC), also heightened fears that the Bank had lost control over the country’s capital account and currency. This fear, however, subsided after the Bank's widely respected head, Zhou Xiaochuan, clarified policy surrounding the currency, where it would “float” around a basket of currencies going forward and not be pegged solely to the U.S. dollar. Additionally, he stated that speculative attacks on the currency would be defeated by the central bank. Given the country's $3 trillion+ in foreign currency reserves, this was not an empty threat, and both the equity and currency markets reflected more calm.
This began the second segment of the year from February to the end of the fiscal year where the China market rallied sharply up nearly 32% from its mid-February low. This rally was driven by not only more policy clarity from the PBOC, but also the Chinese government adding further support to investor sentiment by introducing a property tax cut and a 0.50% reduction in China’s Reserve Requirement Ratio. The property tax cuts along with other relaxation of home purchase restrictions still in place in China resulted in a rebound in property sales. For the first ten months of this calendar year, property sales grew by just over 41% in value terms. The rebound in property sales clearly helped China’s GDP growth as it came in at 6.7%, which is a slight slowdown from last year’s 6.9%, but very far from the common narrative held by skeptical investors and Western press which have been predicting for the last several years of an imminent hard landing and debt crisis.
There has been this perception that China’s growth is driven primarily by fixed asset investment and net exports; however, both of these components of GDP have slowed with fixed asset investment decelerating from 8.2% in the nine months of 2016 versus 10% in 2015 and exports down 6.8% in the first nine months of 2016 versus a negative 2.6% in 2015. On the other hand, retail sales continue to grow at a healthy 10.4% with consumption now comprising 71% of China’s GDP growth which is even more than 2015’s 66%. This confirms our thesis that China’s economic rebalance from investment to consumption led growth continues unabated. China’s consumption story, in our view, is one of the best investment themes globally. The headline figures support this.
From a corporate earnings standpoint, China’s industrial profits picked up strongly in August where they rose 19.5% driven by higher commodity prices. China’s Producers Price Index (PPI) turned positive for the first time since 2012, which could herald better pricing power for Chinese companies. Given these positive tailwinds, China's Hang Seng China Enterprise Index trades at just 8.6X consensus estimates, which is a substantial discount to global peers. China’s growth comes attractively valued in our view.
Portfolio Composition
Over the twelve months ended October 31, 2016 the top contributors to the Fund return were Tencent (700 HK), Alibaba (BABA US), and Sands China (1928 HK). The Clough China Fund NAV declined 1.36% for the fiscal year (2015/16) ending October 31, 2016 while the MSCI China Index went up 1.54%. The major reason for the underperformance was the fund’s underweight in both IT and Energy, the top two performing sectors. The un-invested cash was also a detractor. The impact of the stock selection is analyzed here below.
Tencent stands as the largest holding of the Fund and has been for a number of years. It is also the largest component of the MSCI China Index. Founded in 1998 by Pony Ma and listed in Hong Kong in 2004, Tencent has a number of business lines in which they dominate. This would include premium messaging services, internet value added services and online games. Their social networks, Weixin and WeChat, have 846 million monthly active users. Given their market dominance, Mr. Ma has built an extremely profitable entity with return on equity (ROE) and net margins above 30%. The company’s recently released third quarter results showed very solid year over year (“YoY”) growth profile with revenues up 52% and net profit up 42%. We remain very upbeat on this company as we believe the company has only scratched the surface on the monetization front of their huge user base. This will continue to be a long-term holding of the Fund.
Alibaba is China’s e-commerce group that dominates online shopping in China, accounting for 80% of all online shopping by individual customers in China. Online shopping is a high growth segment in the market with sales of goods and services rising by 28.2% YoY representing over 14% of total consumer retail sales. This segment moved quickly to mobile devices which comprise over 70% of online transactions. The company was founded in 1999 by Jack Ma and listed on the New York Stock Exchange in September 2014. Other business segments that are important to Alibaba’s value include their online payment services called Alipay which is China’s largest third party online payment service provider. Taking a page from Amazon, Alibaba also runs China’s largest cloud infrastructure company called Aliyun. China’s cloud storage industry is still in its nascent stages and this entity’s revenue is growing well over 100% YoY. According to a recent report by Goldman Sachs, Alibaba’s cloud computing business could generate $5 billion in revenue by 2019 making Aliyun the world’s second largest player in the cloud infrastructure sector. The company recently reported its second quarter results which beat expectations with net earnings up 41% driven by a 55% increase in revenue. The company’s ROE stood at about 25% with a net margin of 24%.
Sands China is a leading developer of integrated resorts in Macau which is 70% owned by U.S.-listed Las Vegas Sands. Macau is China’s designated legalized gambling zone that generates more than 5 times the Las Vegas strip in gaming revenue1. The industry has undergone some challenges since 2013, as President Xi Jinping launched an anti-graft campaign which made gambling in Macau a less acceptable activity. We have, however, seen positive YoY growth since August of this year2, which could signal a bottoming of revenues for the territory. In spite of this challenging top-down environment, Sands China continues to find success as its properties in Macau target the mass market and high-end mass market gamers, which were far less impacted by China’s anti-corruption campaign. Another driver of revenue growth for Sands China is non-gaming revenue. According to most recent data released by the Macau government, non-gaming spend per visitor jumped 17% YoY. Given the company’s broad offering in the retail sector, Sands should benefit. This has translated into the company’s financial performance. Third quarter results were just released which reflected EBIDTA (Earnings Before Interest, Taxes, Depreciation and Amortization) growth of 15% YoY on revenue numbers up 17% on the year. The company’s stock is supported not only by these better than expected results, but a 5.3% dividend yield.
101 | October 31, 2016
Clough China Fund
| Management Commentary | October 31, 2016 (Unaudited) |
Major detractors to the Fund’s performance include China Life, Ping An, and Baidu.
China Life is China’s largest life insurance company with over 600,000 agents nationwide. The thesis behind the investment was insurance penetration remains very low in China and companies such as China Life would benefit from a structural increase in demand for their products. This in addition to attractive valuations brought us to invest in the company. However, the company reported several quarters in a row of disappointing results and thus we exited the position. We lost confidence in the company’s management ability to execute.
Ping An Insurance has a more diversified mix of products than China Life including insurance, value-oriented financial services, e-finance and banking. They also hold a 44% stake in Lufax one of China’s largest online peer-to-peer lender which is looking to list next year. This could be a catalyst for stock performance. Ping An is not a state-controlled entity and has an aggressive and dynamic management. As a result, the company has shown robust premium growth with resilient margins in all its insurance product lines. This combination is reflected in its most recent earnings announcement with first half net profit up 18%. We continue to hold a large position in this company.
Baidu is listed on the NYSE and operates China’s dominant search engine with nearly 80% market share. The company came under regulatory scrutiny after a user of Baidu’s search engine died after receiving an ineffective cancer treatment sourced on Baidu. The company subsequently pulled its healthcare ads/paid search results, which had a negative impact on the company’s growth profile. Additionally, with web access being moved from PC to mobile, both Tencent and Alibaba have become formidable competitors in their search/ad business, putting further pressure on the company’s outlook. Management has attempted to broaden the business lines in the internet arena, but these investments to date have not been successful and have dragged margins down substantially. Over the medium-to-longer term, this could be an interesting investment. We would like to see some stabilization in margins and more effective communication of business strategy going forward before stepping in again. The Fund does not hold a position at this time.
Outlook:
We remain very positive on China’s prospects.
The consumer remains robust and the private sector has built companies that are competitive nationally, but globally as well. Retail sales grew over 10% in the first three quarters of this year, consumption comprises 71% of China’s GDP growth. We believe that China consumers will continue to grow. A study done by the Boston Consulting Group forecasts that the consumer economy will grow by 55% through 2020 adding a new consumer market of $2.3 trillion or 1.3 times larger than the current consumer markets of the UK or Germany assuming a modest 5.5% GDP growth rate. Urban middle class consumers will drive this growth as this segment of the population is anticipated to grow from 350‐400 million people to over 550 million people by 2022 according to a study done by McKinsey. Household debt‐to‐GDP stands at 40%, which is less than half of U.S. and British households which stand at 87%. Additionally, savings rates are very high. Household bank deposits are equivalent to 80% of GDP versus 46% here in the U.S.
Let’s take a closer look at the Chinese auto sector as an example. Nearly 25 million units were sold in China in 2015 versus 17.2 million vehicles sold in the U.S. Year‐to‐date auto sales have grown over 15%. This is due to no small part to the health of the Chinese consumer’s balance sheet as well as a tax incentive to encourage the purchasing of a car with engines of 1.6L or less in size. In spite of the rapid growth of the auto market, auto penetration is still very low at 120 vehicles per 1,000 people per IHS Automotive. This compares with over 500 vehicles per 1,000 people in Western Europe and North America. We remain constructive on China’s automobile sector.
The challenges facing China's economy are clear. When traveling around the country and meeting with senior government policy makers, China’s growing debt stock and moribund State‐Owned Enterprise sector are discussed openly. To put some numbers to the issue, China’s total debt‐to-GDP stands at approximately 250%. This is in-line with levels seen in the U.S. The pace of debt creation, however, is troubling, with debt-to-GDP of only 150% in 2007. This rate of debt expansion far outpaces what we have seen in the Western world. One major difference, though, is that much of the debt is held at the corporate level. Both the Chinese consumer and government are not highly leveraged in a global context. In addition, much of the debt is in the hands of companies owned by the government. Thus, the country’s ability to come up with a solution to the issue is unique in a Western context. Thus, we think a Lehman style event is highly unlikely. In addition, the country has plenty of liquidity available in its financial system with over $3 trillion in foreign currency reserves along with a very high Required Reserve Ratio of over 17% for large banks. Since only 8% of China’s debt is held by foreigners3 likely eliminates any repeat of what we have seen in Latin America as well as the 1997 Asian Financial Crisis.
The Chinese leaders are not asleep at the wheel. They are addressing the parts of the Chinese economy that have excess debt as well as oversupply. For example, in the steel industry, China has targeted to close 150 million tons of capacity over the next three years out of a total of 1 billion tons. Inefficient companies will be put out of business and mergers will occur to improve overall efficiency in the sector. Just recently, Baosteel, China’s second largest steel producer, announced plans to merge with Wuhan Steel, which is a far less profitable and efficient producer of steel. To minimize the impact of layoffs in both the steel and coal sectors, the government has earmarked $23 billion to help support and retrain displaced workers which could number in the five to six million range4. In addition to M&A and outright closures, the government has just recently released guidelines for debt-to-equity swaps. Encouragingly, the debt-for-equity swaps program will be market driven and banks will not be forced to take on equity of companies with no prospects for survival. That being said, China’s debt stock will not reverse in the future, but we anticipate the pace of debt creation will slow to levels in line with nominal GDP growth.
102 | October 31, 2016
Clough China Fund
| Management Commentary | October 31, 2016 (Unaudited) |
In our view, there is an inordinate amount of focus on China’s headline GDP growth number. It is inevitable that China’s GDP growth will slow and that is due to the law of large numbers. In the early 1990’s, when China's economy was $500 billion, growth of 10-15% although quite spectacular, the actual incremental GDP created was in the $50-$75 billion range. Today, with nearly an $11 trillion economy, growing even 6.5% would mean China creates an additional $710 billion in economic activity each year. To put this into perspective, this is the size of the Swiss or Dutch economies. So we are not necessarily focused on the level of China’s growth, but the quality of growth. We believe that the government is moving the economy in the right direction on this front.
In terms of the election of Donald Trump who promised to name China as a currency manipulator and threatened to tax some imports from China, we have a number of thoughts. First of all, the Chinese currency has weakened versus the U.S. dollar, but so have all the other major currencies in the world including the British Pound, Euro, and Japanese Yen. Thus RMB weakness is a function of a strong dollar and not necessarily of any guileful policy to do so. With the PBOC’s outlining of its currency “float” policies the fact that the RMB recently attained Central Bank reserve currency status, accusations of currency manipulation need to be backed up with data which in our view remains scant. Secondly, as we noted earlier, China’s dependence on exports has diminished dramatically over the years. GDP growth is being driven by domestic demand. Finally, given Trump’s clear desire to pull out from the recently negotiated Trans-Pacific Partnership, which main policy objective was to isolate China from its Asian neighbors on the trade front, gives China breathing room in this area. Without getting too focused on geopolitics, it appears that Trump is going to be pursuing a more isolationist policy which will allow China to have more flexibility in its relationships with its regional partners.
Francoise Vappereau, Co-Portfolio Manager
Eric Brock, Co-Portfolio Manager
Brian Chen, Co-Portfolio Manager
Sources:
| 1 | Bloomberg: Macau Casino Revenue Drops Less Than Estimated on Holiday Boost 3/1/2016 |
| 2 | Gaming Inspection and Coordination Bureau Macao SAR |
| 3 | Morgan Stanley Wealth Management: Investment perspective 7/29/16 |
| 4 | Reuters: China to Lay Off Five to Six Million Workers, Earmarks at Least $23 Billion 3/3/2016 |
Investments in international and emerging markets securities include exposure to risks such as currency fluctuations, foreign taxes and regulations, and the potential for illiquid markets and political instability.
The views of the author and information discussed in this commentary are as of the date of publication, are subject to change, and may not reflect the writer's current views. The views expressed are those of the author only, and represent an assessment of market conditions at a specific point in time, are opinions only and should not be relied upon as investment advice regarding a particular investment or markets in general. Such information does not constitute a recommendation to buy or sell specific securities or investment vehicles. It should not be assumed that any investment will be profitable or will equal the performance of the fund(s) or any securities or any sectors mentioned in this letter. The subject matter contained in this letter has been derived from several sources believed to be reliable and accurate at the time of compilation. Neither ALPS, Advisors, Inc., Clough Capital Partners, LP, nor the Fund accepts any liability for losses either direct or consequential caused by the use of this information.
103 | October 31, 2016
Clough China Fund
| Performance Update | October 31, 2016 (Unaudited) |
Performance of $10,000 Initial Investment (as of October 31, 2016)
Comparison of change in value of a $10,000 investment (includes maximum sales charges of 5.50%)
The chart above represents historical performance of a hypothetical investment of $10,000 in the Fund since inception. Past performance does not guarantee future results. This chart does not reflect the deduction of taxes that a shareholder would pay on Fund distributions or the redemption of Fund shares.
Average Annual Total Returns (as of October 31, 2016)
| | 6 Month | 1 Year | 3 Year | 5 Year | 10 Year | Since Inception^ | Total Expense Ratio | What You Pay* |
| Class A (NAV) | 10.08% | -1.61% | 0.13% | 5.54% | 6.90% | 10.29% | 1.98% | 1.95% |
| Class A (MOP) | 4.05% | -7.04% | -1.73% | 4.35% | 6.30% | 9.72% |
| Class C (NAV) | 9.66% | -2.34% | -0.64% | 4.73% | 6.10% | 9.47% | 2.78% | 2.70% |
| Class C (CDSC) | 8.66% | -3.31% | -0.64% | 4.73% | 6.10% | 9.47% |
Class I 1 | 10.20% | -1.31% | 0.48% | 5.89% | 7.34% | 10.75% | 1.77% | 1.70% |
MSCI China Index2 | 12.07% | 1.54% | 2.38% | 4.82% | 6.85% | 9.94% | | |
Performance data quoted represents past performance. Past performance does not guarantee future results. Investment return and principal value of an investment will fluctuate so that an investor’s shares, when sold or redeemed, may be worth more or less than the original cost. Current performance data may be higher or lower than actual data quoted. For the most current month-end performance data, please call 1-866-759-5679.
Maximum Offering Price (MOP) for Class A shares includes the Fund’s maximum sales charge of 5.50%. Performance shown at NAV does not include these sales charges and would have been lower had it been taken into account. If you invest $1 million or more, either as a lump sum or through the Fund’s accumulation or letter of intent programs, you can purchase Class A shares without an initial sales charge (load). A Contingent Deferred Sales Charge (“CDSC”) of 1.00% may apply to Class C shares redeemed within the first 12 months after a purchase, and on Class A shares redeemed within the first 18 months after a purchase in excess of $1 million. The Fund imposes a 2.00% redemption fee on shares held for less than 30 days.
Performance less than 1 year is cumulative.
The performance shown for the Clough China Fund for periods prior to January 15, 2010, reflects the performance of the Old Mutual China Fund, a series of Old Mutual Funds I (as a result of a prior reorganization of the Old Mutual China Fund into the Clough China Fund).
| 1 | Prior to close of business on January 15, 2010, Class I was known as Institutional Class of the Old Mutual China Fund. |
104 | October 31, 2016
Clough China Fund
| Performance Update | October 31, 2016 (Unaudited) |
| 2 | The Morgan Stanley Capital International (“MSCI”) China Index is constructed according to the MSCI Global Investable Market Index (GIMI) family. The MSCI China Index is part of the MSCI Emerging Markets Index. The index is not actively managed and does not reflect any deduction for fees, expenses or taxes. An investor may not invest directly in an index. |
| ^ | Fund Inception date of December 30, 2005. |
| * | What You Pay reflects the Advisor’s decision to contractually limit expenses through February 28, 2017. Please see the prospectus for additional information. |
The table does not reflect the deduction of taxes that a shareholder would pay on Fund distributions or the redemption of Fund shares.
This Fund is not suitable for all investors and is subject to investment risks, including possible loss of the principal amount invested.
There is no guarantee that the Fund will continue to hold any one particular security or stay invested in any one particular company. The composition of the Fund's top holdings is subject to change. Performance figures are historical and reflect the change in share price, reinvested distributions, changes in net asset value, sales charges and capital gains distributions, if any.
Not FDIC Insured – No Bank Guarantee – May Lose Value
Investing in China, Hong Kong and Taiwan involves risk and considerations not present when investing in more established securities markets. The Fund may be more susceptible to the economic, market, political and local risks of these regions than a fund that is more geographically diversified.
Top Ten Holdings (as a % of Net Assets) †
| Tencent Holdings, Ltd. | 12.96% |
| Alibaba Group Holding, Ltd., | |
| Sponsored ADR | 8.85% |
| China Mobile, Ltd. | 6.80% |
| China Construction Bank Corp., Class H | 5.63% |
| Ping An Insurance Group Co. of China, Ltd., | |
| Class H | 4.69% |
| Industrial & Commercial Bank of China, | |
| Ltd., Class H | 3.96% |
| Bank of China, Ltd., Class H | 3.32% |
| Byd Co., Ltd., Class H | 2.90% |
| Sands China, Ltd. | 2.59% |
| China Petroleum & Chemical Corp., Class H | 2.43% |
| Top Ten Holdings | 54.13% |
| † | Holdings are subject to change, and may not reflect the current or future position of the portfolio. Table presents indicative values only. Excludes cash & cash equivalents. |
Industry Sector Allocation (as a % of Net Assets)
105 | October 31, 2016
Clough China Fund
| Statement of Investments | October 31, 2016 |
| | | Shares | | | Value (Note 2) | |
| COMMON STOCKS (83.77%) | | | | | | |
| Consumer Discretionary (12.26%) | | | | | | |
| Automobiles (4.09%) | | | | | | |
Byd Co., Ltd., Class H(a) | | | 266,000 | | | $ | 1,751,171 | |
| Geely Automobile Holdings, Ltd. | | | 260,000 | | | | 267,527 | |
| Guangzhou Automobile Group Co., Ltd., Class H | | | 370,000 | | | | 446,817 | |
| | | | | | | | 2,465,515 | |
| | | | | | | | | |
| Automobiles & Components (1.09%) | | | | | |
Fuyao Glass Industry Group Co., Ltd., Class H(b) | | | 227,200 | | | | 658,908 | |
| | | | | | | | | |
| Diversified Consumer Services (0.61%) | | | | | |
New Oriental Education & Technology Group, Inc., Sponsored ADR(a) | | | 4,700 | | | | 235,611 | |
TAL Education Group, ADR(a) | | | 1,600 | | | | 130,304 | |
| | | | | | | | 365,915 | |
| | | | | | | | | |
| Hotels Restaurants & Leisure (4.43%) | | | | | |
| China Lodging Group, Ltd., Sponsored ADR | | | 17,100 | | | | 735,471 | |
| Sands China, Ltd. | | | 359,600 | | | | 1,560,577 | |
| Wynn Macau, Ltd. | | | 244,400 | | | | 374,424 | |
| | | | | | | | 2,670,472 | |
| | | | | | | | | |
| Household Durables (0.54%) | | | | | | | | |
| Man Wah Holdings, Ltd. | | | 493,424 | | | | 327,483 | |
| | | | | | | | | |
| Textiles, Apparel & Luxury Goods (1.50%) | | | | | | | | |
| Anta Sports Products, Ltd. | | | 116,000 | | | | 334,523 | |
Li Ning Co., Ltd.(a) | | | 262,500 | | | | 187,137 | |
| Shenzhou International Group Holdings, Ltd. | | | 58,000 | | | | 384,169 | |
| | | | | | | | 905,829 | |
| | | | | | | | | |
| TOTAL CONSUMER DISCRETIONARY | | 7,394,122 | |
| | | | | | | | | |
| Energy (7.11%) | | | | | | | | |
| Oil, Gas & Consumable Fuels (7.11%) | | | | | |
| China Petroleum & Chemical Corp., Class H | | | 2,028,120 | | | | 1,466,739 | |
| China Shenhua Energy Co., Ltd., Class H | 364,500 | | | | 755,690 | |
| CNOOC, Ltd. | | | 1,008,000 | | | | 1,268,340 | |
| PetroChina Co., Ltd., Class H | | | 1,164,000 | | | | 796,450 | |
| | | | | | | | 4,287,219 | |
| | | | | | | | | |
| TOTAL ENERGY | | | | | | | 4,287,219 | |
| | | Shares | | | Value (Note 2) | |
| Financials (20.14%) | | | | | | |
| Banks (14.43%) | | | | | | |
| Agricultural Bank of China, Ltd., Class H | 1,343,000 | | | $ | 564,961 | |
| Bank of China, Ltd., Class H | | | 4,471,437 | | | | 2,003,738 | |
| China Construction Bank Corp., Class H | | | 4,652,080 | | | | 3,397,167 | |
| Chongqing Rural Commercial Bank, Class H | | | 580,000 | | | | 347,109 | |
| Industrial & Commercial Bank of China, Ltd., Class H | | | 3,982,967 | | | | 2,390,735 | |
| | | | | | | | 8,703,710 | |
| | | | | | | | | |
| Capital Markets (1.02%) | | | | | | | | |
| Haitong Securities Co., Ltd., Class H | | | 163,200 | | | | 288,743 | |
| Hong Kong Exchanges and Clearing, Ltd. | | | 12,300 | | | | 325,169 | |
| | | | | | | | 613,912 | |
| | | | | | | | | |
| Insurance (4.69%) | | | | | | | | |
| Ping An Insurance Group Co. of China, Ltd., Class H | | | 537,500 | | | | 2,829,142 | |
| | | | | | | | | |
| TOTAL FINANCIALS | | | | | | | 12,146,764 | |
| | | | | | | | | |
| Health Care (1.51%) | | | | | | | | |
| Health Care Providers & Services (0.81%) | | | | | | | | |
| Sinopharm Group Co., Ltd., Class H | | | 100,000 | | | | 485,600 | |
| | | | | | | | | |
| Pharmaceuticals (0.70%) | | | | | | | | |
| Sino Biopharmaceutical, Ltd. | | | 608,000 | | | | 424,965 | |
| | | | | | | | | |
| TOTAL HEALTH CARE | | | | | | | 910,565 | |
| | | | | | | | | |
| Industrials (4.60%) | | | | | | | | |
| Air Freight & Logistics (0.64%) | | | | | | | | |
ZTO Express Cayman, Inc., ADR(a) | | | 22,800 | | | | 386,004 | |
| | | | | | | | | |
| Airlines (0.80%) | | | | | | | | |
| Air China, Ltd., Class H | | | 730,000 | | | | 479,634 | |
| | | | | | | | | |
| Construction & Engineering (1.19%) | | | | | |
| China Communications Construction Co., Ltd., Class H | | | 277,000 | | | | 304,161 | |
| China Railway Construction Corp., Ltd., Class H | | | 186,000 | | | | 232,504 | |
Clough China Fund
| Statement of Investments | October 31, 2016 |
| | | Shares | | | Value (Note 2) | |
| Construction & Engineering (continued) | | | | |
| China Railway Group, Ltd., Class H | | | 237,000 | | | $ | 182,690 | |
| | | | | | | | 719,355 | |
| | | | | | | | | |
| Electrical Equipment (0.89%) | | | | | | | | |
| Xinjiang Goldwind Science & Technology Co., Ltd., Class H | | | 391,600 | | | | 539,879 | |
| | | | | | | | | |
| Transportation Infrastructure (1.08%) | | | | | |
| Jiangsu Expressway Co., Ltd., Class H | | | 480,000 | | | | 652,624 | |
| | | | | | | | | |
| TOTAL INDUSTRIALS | | | | | | | 2,777,496 | |
| | | | | | | | | |
| Information Technology (23.28%) | | | | | | | | |
| Internet Software & Services (23.28%) | | | | | |
Alibaba Group Holding, Ltd., Sponsored ADR(a) | | | 52,500 | | | | 5,338,725 | |
Momo, Inc., Sponsored ADR(a) | | | 7,800 | | | | 187,824 | |
| NetEase, Inc., ADR | | | 2,700 | | | | 693,873 | |
| Tencent Holdings, Ltd. | | | 295,000 | | | | 7,818,189 | |
| | | | | | | | 14,038,611 | |
| | | | | | | | | |
| TOTAL INFORMATION TECHNOLOGY | | | | 14,038,611 | |
| | | | | | | | | |
| Materials (4.13%) | | | | | | | | |
| Construction Materials (2.45%) | | | | | | | | |
| Anhui Conch Cement Co., Ltd., Class H | | | 305,500 | | | | 844,377 | |
| China Resources Cement Holdings, Ltd. | | | 1,568,000 | | | | 633,158 | |
| | | | | | | | 1,477,535 | |
| | | | | | | | | |
| Metals & Mining (1.68%) | | | | | | | | |
Angang Steel Co., Ltd., Class H(a) | | | 586,000 | | | | 300,073 | |
| Zijin Mining Group Co., Ltd., Class H | | | 2,252,000 | | | | 715,720 | |
| | | | | | | | 1,015,793 | |
| | | | | | | | | |
| TOTAL MATERIALS | | | | | | | 2,493,328 | |
| | | | | | | | | |
| Real Estate (1.99%) | | | | | | | | |
| Real Estate Management & Development (1.99%) | |
| Cheung Kong Property Holdings, Ltd. | | | 43,500 | | | | 321,581 | |
| Sun Hung Kai Properties, Ltd. | | | 59,000 | | | | 878,577 | |
| | | | | | | | 1,200,158 | |
| | | | | | | | | |
| TOTAL REAL ESTATE | | | | | | | 1,200,158 | |
| | | Shares | | | Value (Note 2) | |
| Telecommunication Services (8.29%) | | | | | | |
| Diversified Telecommunication (1.49%) | | | | |
| China Telecom Corp., Ltd., Class H | | | 1,398,000 | | | $ | 720,757 | |
| China Unicom Hong Kong, Ltd. | | | 152,000 | | | | 178,450 | |
| | | | | | | | 899,207 | |
| | | | | | | | | |
| Wireless Telecommunication Services (6.80%) | | | | | |
| China Mobile, Ltd. | | | 358,000 | | | | 4,101,389 | |
| | | | | | | | | |
TOTAL TELECOMMUNICATION
SERVICES | | 5,000,596 | |
| | | | | | | | | |
| Utilities (0.46%) | | | | | | | | |
| Water Utilities (0.46%) | | | | | | | | |
| CT Environmental Group, Ltd. | | | 986,000 | | | | 276,622 | |
| | | | | | | | | |
| TOTAL UTILITIES | | | | | | | 276,622 | |
| | | | | | | | | |
TOTAL COMMON STOCKS
(Cost $38,606,653) | | 50,525,481 | |
| | | | | | | | | |
| PARTICIPATION NOTES (3.42%) |
| Consumer Discretionary (1.57%) | | | | | | | | |
| Automobiles (0.90%) | | | | | | | | |
SAIC Motor Corp., Ltd., Class A (Loan Participation Notes issued by Morgan Stanley Asia Products), expiring 02/23/18(b) | | | 154,800 | | | | 541,393 | |
| | | | | | | | | |
| Household Durables (0.67%) | | | | | | | | |
Suofeiya Home Collection Co., Ltd., Class A (Loan Participation Notes issued by Morgan Stanley Asia Products), expiring 4/12/2018(a)(b) | | | 47,178 | | | | 407,968 | |
| | | | | | | | | |
| TOTAL CONSUMER DISCRETIONARY | | 949,361 | |
| | | | | | | | | |
| Consumer Staples (1.14%) | | | | | | | | |
| Beverages (1.14%) | | | | | | | | |
Kweichow Moutai Co., Ltd., Class A (Loan Participation Notes issued by Morgan Stanley Asia Products), expiring 11/09/17(b) | | | 14,600 | | | | 685,602 | |
| | | | | | | | | |
| TOTAL CONSUMER STAPLES | | 685,602 | |
Clough China Fund
| Statement of Investments | October 31, 2016 |
| | | Shares | | | Value (Note 2) | |
| Industrials (0.71%) | | | | | | |
| Machinery (0.71%) | | | | | | |
Zhengzhou Yutong Bus Co., Ltd., Class A (Loan Participation Notes issued by Morgan Stanley Asia Products), expiring 10/27/17(b) | | | 135,335 | | | $ | 430,742 | |
| | | | | | | | | |
| TOTAL INDUSTRIALS | | 430,742 | |
| | | | | | | | | |
TOTAL PARTICIPATION NOTES (Cost $1,695,004) | | 2,065,705 | |
| | | 7-Day Yield | | | Shares | | | Value (Note 2) | |
| SHORT TERM INVESTMENTS (3.62%) | | | | |
| Money Market Fund (3.62%) | | | | | | | |
| BR Liquidity T-Fund | | | 0.218 | % | | | 2,182,921 | | | | 2,182,921 | |
| | | | | | | | | | | | | |
TOTAL SHORT TERM INVESTMENTS
(Cost $2,182,921) | | 2,182,921 | |
| | | | | | | | | | | | | |
TOTAL INVESTMENTS (90.81%)
(Cost $42,484,578) | $ | 54,774,107 | |
| | | | | | | | | | | | | |
| Other Assets In Excess Of Liabilities (9.19%) | | 5,540,834 | |
| | | | | | | | | | | | | |
| NET ASSETS (100.00%) | $ | 60,314,941 | |
(a) | Non-Income Producing Security. |
(b) | Security exempt from registration under Rule 144A of the Securities Act of 1933. This security may be resold in transactions exempt from registration, normally to qualified institutional buyers. As of October 31, 2016, the aggregate market value of those securities was $2,724,613, representing 4.51% of net assets. |
For Fund compliance purposes, the Fund's industry classifications refer to any one or more of the industry sub-classifications used by one or more widely recognized market indexes or ratings group indexes, and/or as defined by Fund management. This definition may not apply for purposes of this report, which may combine industry sub-classifications for reporting ease. Industries are shown as a percent of net assets.
See Notes to Financial Statements.
Clough China Fund
| Statement of Assets and Liabilities | October 31, 2016 |
| ASSETS | | | |
| Investments, at value | | $ | 54,774,107 | |
| Foreign currency, at value (Cost $6,202,341) | | | 6,216,774 | |
| Receivable for investments sold | | | 244,923 | |
| Receivable for shares sold | | | 1,373 | |
| Dividends receivable | | | 626 | |
| Prepaid expenses and other assets | | | 5,699 | |
| Total Assets | | | 61,243,502 | |
| LIABILITIES | | | | |
| Payable for investments purchased | | | 757,830 | |
| Payable for shares redeemed | | | 27,240 | |
| Investment advisory fees payable | | | 55,044 | |
| Administration and transfer agency fees payable | | | 31,842 | |
| Distribution and services fees payable | | | 11,321 | |
| Professional fees payable | | | 24,994 | |
| Accrued expenses and other liabilities | | | 20,290 | |
| Total Liabilities | | | 928,561 | |
| NET ASSETS | | $ | 60,314,941 | |
| NET ASSETS CONSIST OF | | | | |
| Paid-in capital | | $ | 57,008,355 | |
| Accumulated net investment income | | | 103,102 | |
| Accumulated net realized loss | | | (9,100,453 | ) |
| Net unrealized appreciation | | | 12,303,937 | |
| NET ASSETS | | $ | 60,314,941 | |
| INVESTMENTS, AT COST | | $ | 42,484,578 | |
| PRICING OF SHARES | | | | |
| Class A: | | | | |
| Net Asset Value, offering and redemption price per share | | $ | 21.07 | |
| Net Assets | | $ | 18,358,019 | |
| Shares of beneficial interest outstanding (unlimited number of shares, no par value common stock authorized) | | | 871,225 | |
| Maximum offering price per share ((NAV/0.9450), based on maximum sales charge of 5.50% of the offering price) | | $ | 22.30 | |
| Class C: | | | | |
Net Asset Value, offering and redemption price per share(a) | | $ | 20.10 | |
| Net Assets | | $ | 8,351,837 | |
| Shares of beneficial interest outstanding (unlimited number of shares, no par value common stock authorized) | | | 415,459 | |
| Class I: | | | | |
| Net Asset Value, offering and redemption price per share | | $ | 21.60 | |
| Net Assets | | $ | 33,605,085 | |
| Shares of beneficial interest outstanding (unlimited number of shares, no par value common stock authorized) | | | 1,556,104 | |
(a) | Redemption price per share may be reduced for any applicable contingent deferred sales charge. For a description of a possible sales charge, please see the Fund's Prospectus. |
See Notes to Financial Statements.
109 | October 31, 2016
Clough China Fund
| Statement of Operations | For the Year Ended October 31, 2016 |
| INVESTMENT INCOME | | | |
| Dividends | | $ | 1,400,354 | |
| Foreign taxes withheld on dividends | | | (87,413 | ) |
| Total Investment Income | | | 1,312,941 | |
| | | | | |
| EXPENSES | | | | |
| Investment advisory fees | | | 822,956 | |
| Administrative fees | | | 106,453 | |
| Transfer agency fees | | | 3,449 | |
| Distribution and service fees | | | | |
| Class A | | | 49,846 | |
| Class C | | | 86,435 | |
| Professional fees | | | 26,587 | |
| Delegated transfer agent equivalent services | | | | |
| Class A | | | 7,939 | |
| Class C | | | 6,683 | |
| Class I | | | 22,890 | |
| Reports to shareholders and printing fees | | | 12,750 | |
| State registration fees | | | 47,872 | |
| Insurance fees | | | 802 | |
| Custody fees | | | 30,358 | |
| Trustees' fees and expenses | | | 1,717 | |
| Miscellaneous expenses | | | 14,259 | |
| Total Expenses | | | 1,240,996 | |
| Less fees waived/reimbursed by investment advisor (Note 8) | | | | |
| Class A | | | (17,281 | ) |
| Class C | | | (10,804 | ) |
| Class I | | | (38,704 | ) |
| Net Expenses | | | 1,174,207 | |
| Net Investment Income | | | 138,734 | |
| Net realized loss on investments | | | (5,093,298 | ) |
| Net realized loss on foreign currency transactions | | | (80,360 | ) |
| Net realized loss | | | (5,173,658 | ) |
| Net change in unrealized appreciation on investments | | | 2,907,928 | |
| Net change in unrealized appreciation on translation of assets and liabilities denominated in foreign currencies | | | 14,755 | |
| Net change in unrealized appreciation | | | 2,922,683 | |
| NET REALIZED AND UNREALIZED LOSS ON INVESTMENTS | | | (2,250,975 | ) |
| NET DECREASE IN NET ASSETS RESULTING FROM OPERATIONS | | $ | (2,112,241 | ) |
See Notes to Financial Statements.
110 | October 31, 2016
Clough China Fund
Statements of Changes in Net Assets
| | | For the Year Ended October 31, 2016 | | | For the Year Ended October 31, 2015 | |
| OPERATIONS | | | | | | |
| Net investment income | | $ | 138,734 | | | $ | 567,927 | |
| Net realized loss | | | (5,173,658 | ) | | | (1,785,995 | ) |
| Net change in unrealized appreciation/(depreciation) | | | 2,922,683 | | | | (5,138,015 | ) |
| Net Decrease in Net Assets Resulting from Operations | | | (2,112,241 | ) | | | (6,356,083 | ) |
| | | | | | | | | |
| DISTRIBUTIONS | | | | | | | | |
| Dividends to shareholders from net investment income | | | | | | | | |
| Class A | | | (356,689 | ) | | | (646,687 | ) |
| Class C | | | (65,110 | ) | | | (212,498 | ) |
| Class I | | | (620,111 | ) | | | (889,808 | ) |
| Dividends to shareholders from net realized gains | | | | | | | | |
| Class A | | | – | | | | (599,361 | ) |
| Class C | | | – | | | | (236,066 | ) |
| Class I | | | – | | | | (777,420 | ) |
| Net Decrease in Net Assets from Distributions | | | (1,041,910 | ) | | | (3,361,840 | ) |
| | | | | | | | | |
| BENEFICIAL INTEREST TRANSACTIONS (NOTE 6) | | | | | | | | |
| Shares sold | | | | | | | | |
| Class A | | | 1,548,407 | | | | 9,834,811 | |
| Class C | | | 662,919 | | | | 4,114,019 | |
| Class I | | | 6,343,930 | | | | 39,761,433 | |
| Dividends reinvested | | | | | | | | |
| Class A | | | 245,993 | | | | 858,834 | |
| Class C | | | 30,159 | | | | 247,634 | |
| Class I | | | 378,863 | | | | 1,031,976 | |
| Shares redeemed, net of redemption fees | | | | | | | | |
| Class A | | | (7,478,273 | ) | | | (13,529,955 | ) |
| Class C | | | (2,289,444 | ) | | | (4,280,998 | ) |
| Class I | | | (9,416,949 | ) | | | (36,894,860 | ) |
| Net Increase/(Decrease) in Net Assets Derived from Beneficial Interest Transactions | | | (9,974,395 | ) | | | 1,142,894 | |
| | | | | | | | | |
| Net decrease in net assets | | | (13,128,546 | ) | | | (8,575,029 | ) |
| | | | | | | | | |
| NET ASSETS | | | | | | | | |
| Beginning of year | | | 73,443,487 | | | | 82,018,516 | |
| End of year * | | $ | 60,314,941 | | | $ | 73,443,487 | |
| *Including accumulated net investment income of: | | $ | 103,102 | | | $ | 1,041,894 | |
See Notes to Financial Statements.
111 | October 31, 2016
Clough China Fund – Class A
Financial Highlights
Selected data for a share of beneficial interest outstanding throughout the periods indicated:
| | | For the Year Ended October 31, 2016 | | | For the Year Ended October 31, 2015 | | | For the Fiscal Period Ended October 31, 2014(a) | | | For the Year Ended April 30, 2014 | | | For the Year Ended April 30, 2013 | | | For the Year Ended April 30, 2012 | |
| Net asset value, beginning of period | | $ | 21.74 | | | $ | 23.50 | | | $ | 20.72 | | | $ | 21.45 | | | $ | 18.43 | | | $ | 21.02 | |
| | | | | | | | | | | | | | | | | | | | | | | | | |
| INCOME/(LOSS) FROM INVESTMENT OPERATIONS: |
Net investment income(b) | | | 0.04 | | | | 0.12 | | | | 0.45 | | | | 0.12 | | | | 0.15 | | | | 0.02 | |
| Net realized and unrealized gain/(loss) | | | (0.40 | ) | | | (0.92 | ) | | | 2.33 | | | | (0.69 | ) | | | 2.90 | | | | (2.61 | ) |
| Total from investment operations | | | (0.36 | ) | | | (0.80 | ) | | | 2.78 | | | | (0.57 | ) | | | 3.05 | | | | (2.59 | ) |
| | | | | | | | | | | | | | | | | | | | | | | | | |
| DISTRIBUTIONS: | | | | | | | | | | | | | | | | | | | | | | | | |
| From net investment income | | | (0.31 | ) | | | (0.50 | ) | | | – | | | | (0.17 | ) | | | (0.03 | ) | | | – | |
| From net realized gains | | | – | | | | (0.46 | ) | | | – | | | | – | | | | – | | | | – | |
| Total distributions | | | (0.31 | ) | | | (0.96 | ) | | | – | | | | (0.17 | ) | | | (0.03 | ) | | | – | |
| | | | | | | | | | | | | | | | | | | | | | | | | |
| REDEMPTION FEES ADDED TO PAID-IN CAPITAL (NOTE 6) | 0.00 | (c) | | | 0.00 | (c) | | | 0.00 | (c) | | | 0.01 | | | | 0.00 | (c) | | | 0.00 | (c) |
| Net increase/(decrease) in net asset value | | | (0.67 | ) | | | (1.76 | ) | | | 2.78 | | | | (0.73 | ) | | | 3.02 | | | | (2.59 | ) |
| Net asset value, end of year | | $ | 21.07 | | | $ | 21.74 | | | $ | 23.50 | | | $ | 20.72 | | | $ | 21.45 | | | $ | 18.43 | |
TOTAL RETURN(d) | | | (1.61 | )% | | | (3.49 | )% | | | 13.42 | % | | | (2.69 | )% | | | 16.54 | % | | | (12.32 | )% |
| | | | | | | | | | | | | | | | | | | | | | | | | |
| RATIOS/SUPPLEMENTAL DATA: |
| Net assets, end of year (000s) | | $ | 18,358 | | | $ | 25,276 | | | $ | 30,526 | | | $ | 31,164 | | | $ | 32,709 | | | $ | 30,542 | |
| Ratio of expenses to average net assets excluding fee waivers and reimbursements | | | 2.04 | % | | | 1.98 | % | | | 2.06 | %(e) | | | 2.06 | % | | | 2.14 | % | | | 2.08 | % |
| Ratio of expenses to average net assets including fee waivers and reimbursements | | | 1.95 | % | | | 1.95 | % | | | 1.95 | %(e) | | | 1.95 | % | | | 1.95 | % | | | 1.95 | % |
| Ratio of net investment income to average net assets | | | 0.18 | % | | | 0.50 | % | | | 3.96 | %(e) | | | 0.55 | % | | | 0.78 | % | | | 0.13 | % |
Portfolio turnover rate(f) | | | 126 | % | | | 193 | % | | | 76 | % | | | 232 | % | | | 221 | % | | | 174 | % |
(a) | Effective May 1, 2014, the Board approved changing the fiscal year-end of the Funds from April 30 to October 31. |
(b) | Calculated using the average shares method. |
(c) | Less than $0.005 per share. |
(d) | Total returns are for the period indicated and have not been annualized. Total returns would have been lower had certain expenses not been waived during the period. Returns shown do not reflect the deduction of taxes that a shareholder would pay on Fund distributions or the redemption of Fund shares. Returns shown exclude any applicable sales charges. |
(f) | Portfolio turnover rate for periods less than one full year have not been annualized. |
See Notes to Financial Statements.
112 | October 31, 2016
Clough China Fund – Class C
Financial Highlights
Selected data for a share of beneficial interest outstanding throughout the periods indicated:
| | | For the Year Ended October 31, 2016 | | | For the Year Ended October 31, 2015 | | | For the Fiscal Period Ended October 31, 2014(a) | | | For the Year Ended April 30, 2014 | | | For the Year Ended April 30, 2013 | | | For the Year Ended April 30, 2012 | |
| Net asset value, beginning of period | | $ | 20.72 | | | $ | 22.53 | | | $ | 19.94 | | | $ | 20.71 | | | $ | 17.90 | | | $ | 20.58 | |
| | | | | | | | | | | | | | | | | | | | | | | | | |
| INCOME/(LOSS) FROM INVESTMENT OPERATIONS: |
Net investment income/(loss)(b) | | | (0.10 | ) | | | (0.04 | ) | | | 0.33 | | | | (0.02 | ) | | | 0.01 | | | | (0.11 | ) |
| Net realized and unrealized gain/(loss) | | | (0.39 | ) | | | (0.89 | ) | | | 2.26 | | | | (0.68 | ) | | | 2.80 | | | | (2.57 | ) |
| Total from investment operations | | | (0.49 | ) | | | (0.93 | ) | | | 2.59 | | | | (0.70 | ) | | | 2.81 | | | | (2.68 | ) |
| | | | | | | | | | | | | | | | | | | | | | | | | |
| DISTRIBUTIONS: | | | | | | | | | | | | | | | | | | | | | | | | |
| From net investment income | | | (0.13 | ) | | | (0.42 | ) | | | – | | | | (0.07 | ) | | | – | | | | – | |
| From net realized gains | | | – | | | | (0.46 | ) | | | – | | | | – | | | | – | | | | – | |
| Total distributions | | | (0.13 | ) | | | (0.88 | ) | | | – | | | | (0.07 | ) | | | – | | | | – | |
| | | | | | | | | | | | | | | | | | | | | | | | | |
| REDEMPTION FEES ADDED TO PAID-IN CAPITAL (NOTE 6) | 0.00 | (c) | | | 0.00 | (c) | | | 0.00 | (c) | | | 0.00 | (c) | | | 0.00 | (c) | | | 0.00 | (c) |
| Net increase/(decrease) in net asset value | | | (0.62 | ) | | | (1.81 | ) | | | 2.59 | | | | (0.77 | ) | | | 2.81 | | | | (2.68 | ) |
| Net asset value, end of year | | $ | 20.10 | | | $ | 20.72 | | | $ | 22.53 | | | $ | 19.94 | | | $ | 20.71 | | | $ | 17.90 | |
TOTAL RETURN(d) | | | (2.34 | )% | | | (4.25 | )% | | | 12.99 | % | | | (3.43 | )% | | | 15.70 | % | | | (13.02 | )% |
| | | | | | | | | | | | | | | | | | | | | | | | | |
| RATIOS/SUPPLEMENTAL DATA: |
| Net assets, end of year (000s) | | $ | 8,352 | | | $ | 10,395 | | | $ | 11,575 | | | $ | 10,866 | | | $ | 12,251 | | | $ | 11,674 | |
| Ratio of expenses to average net assets excluding fee waivers and reimbursements | | | 2.83 | % | | | 2.78 | % | | | 2.87 | %(e) | | | 2.86 | % | | | 2.94 | % | | | 2.88 | % |
| Ratio of expenses to average net assets including fee waivers and reimbursements | | | 2.70 | % | | | 2.70 | % | | | 2.70 | %(e) | | | 2.70 | % | | | 2.70 | % | | | 2.70 | % |
| Ratio of net investment income/(loss) to average net assets | | | (0.52 | )% | | | (0.18 | )% | | | 3.08 | %(e) | | | (0.09 | )% | | | 0.07 | % | | | (0.62 | )% |
Portfolio turnover rate(f) | | | 126 | % | | | 193 | % | | | 76 | % | | | 232 | % | | | 221 | % | | | 174 | % |
(a) | Effective May 1, 2014, the Board approved changing the fiscal year-end of the Funds from April 30 to October 31. |
(b) | Calculated using the average shares method. |
(c) | Less than $0.005 and ($0.005) per share. |
(d) | Total returns are for the period indicated and have not been annualized. Total returns would have been lower had certain expenses not been waived during the period. Returns shown do not reflect the deduction of taxes that a shareholder would pay on Fund distributions or the redemption of Fund shares. Returns shown exclude any applicable sales charges. |
(f) | Portfolio turnover rate for periods less than one full year have not been annualized. |
See Notes to Financial Statements.
113 | October 31, 2016
Clough China Fund – Class I
Financial Highlights
Selected data for a share of beneficial interest outstanding throughout the periods indicated:
| | | For the Year Ended October 31, 2016 | | | For the Year Ended October 31, 2015 | | | For the Fiscal Period Ended October 31, 2014(a) | | | For the Year Ended April 30, 2014 | | | For the Year Ended April 30, 2013 | | | For the Year Ended April 30, 2012 | |
| Net asset value, beginning of period | | $ | 22.28 | | | $ | 23.97 | | | $ | 21.11 | | | $ | 21.82 | | | $ | 18.71 | | | $ | 21.30 | |
| | | | | | | | | | | | | | | | | | | | | | | | | |
| INCOME/(LOSS) FROM INVESTMENT OPERATIONS: |
Net investment income(b) | | | 0.09 | | | | 0.23 | | | | 0.45 | | | | 0.19 | | | | 0.13 | | | | 0.06 | |
| Net realized and unrealized gain/(loss) | | | (0.39 | ) | | | (1.00 | ) | | | 2.41 | | | | (0.69 | ) | | | 3.02 | | | | (2.65 | ) |
| Total from investment operations | | | (0.30 | ) | | | (0.77 | ) | | | 2.86 | | | | (0.50 | ) | | | 3.15 | | | | (2.59 | ) |
| | | | | | | | | | | | | | | | | | | | | | | | | |
| DISTRIBUTIONS: | | | | | | | | | | | | | | | | | | | | | | | | |
| From net investment income | | | (0.38 | ) | | | (0.53 | ) | | | – | | | | (0.21 | ) | | | (0.06 | ) | | | – | |
| From net realized gains | | | – | | | | (0.46 | ) | | | – | | | | – | | | | – | | | | – | |
| Total distributions | | | (0.38 | ) | | | (0.99 | ) | | | – | | | | (0.21 | ) | | | (0.06 | ) | | | – | |
| | | | | | | | | | | | | | | | | | | | | | | | | |
| REDEMPTION FEES ADDED TO PAID-IN CAPITAL (NOTE 6) | 0.00 | (c) | | | 0.07 | | | | 0.00 | (c) | | | 0.00 | (c) | | | 0.02 | | | | 0.00 | (c) |
| Net increase/(decrease) in net asset value | | | (0.68 | ) | | | (1.69 | ) | | | 2.86 | | | | (0.71 | ) | | | 3.11 | | | | (2.59 | ) |
| Net asset value, end of year | | $ | 21.60 | | | $ | 22.28 | | | $ | 23.97 | | | $ | 21.11 | | | $ | 21.82 | | | $ | 18.71 | |
TOTAL RETURN(d) | | | (1.31 | )% | | | (2.99 | )% | | | 13.55 | % | | | (2.41 | )% | | | 16.95 | % | | | (12.16 | )% |
| | | | | | | | | | | | | | | | | | | | | | | | | |
| RATIOS/SUPPLEMENTAL DATA: |
| Net assets, end of year (000s) | | $ | 33,605 | | | $ | 37,772 | | | $ | 39,917 | | | $ | 33,435 | | | $ | 25,972 | | | $ | 28,868 | |
| Ratio of expenses to average net assets excluding fee waivers and reimbursements | | | 1.82 | % | | | 1.77 | % | | | 1.82 | %(e) | | | 1.81 | % | | | 1.94 | % | | | 1.85 | % |
| Ratio of expenses to average net assets including fee waivers and reimbursements | | | 1.70 | % | | | 1.70 | % | | | 1.70 | %(e) | | | 1.70 | % | | | 1.70 | % | | | 1.70 | % |
| Ratio of net investment income to average net assets | | | 0.46 | % | | | 0.95 | % | | | 3.89 | %(e) | | | 0.83 | % | | | 0.69 | % | | | 0.33 | % |
Portfolio turnover rate(f) | | | 126 | % | | | 193 | % | | | 76 | % | | | 232 | % | | | 221 | % | | | 174 | % |
(a) | Effective May 1, 2014, the Board approved changing the fiscal year-end of the Funds from April 30 to October 31. |
(b) | Calculated using the average shares method. |
(c) | Less than $0.005 per share. |
(d) | Total returns are for the period indicated and have not been annualized. Total returns would have been lower had certain expenses not been waived during the period. Returns shown do not reflect the deduction of taxes that a shareholder would pay on Fund distributions or the redemption of Fund shares. |
(f) | Portfolio turnover rate for periods less than one full year have not been annualized. |
See Notes to Financial Statements.
114 | October 31, 2016
RiverFront Global Allocation Series
Management Commentary | October 31, 2016 (Unaudited) |
Overview:
In 2016, markets have remained somewhat volatile, with a variety of headlines driving much of the price action – both in the equity and fixed income markets. In the US, November elections have dominated all forms of media. Additionally, the specter of the Federal Reserve starting to raise interest rates has loomed with the release of each economic data point. Internationally, there have also been numerous storylines that can be blamed (or praised in the event of positive tape action) for market reactions. The summer months brought the storm clouds of Brexit and worries about the Italian bank stress test. Lastly, the perceived failure on the part of the Bank of Japan to deliver meaningful policies to stimulate economic growth has cast a pall over Japan’s equities. The list of headline drivers is arguably much longer, but just these few underscore the wide range of issues that have all contributed to investment decision‐making over the past year.
As we moved past the fears surrounding the Brexit vote, we saw risk assets begin to outperform. With oil prices stabilizing and growth in China recovering, emerging markets led the way. High yield bonds continued to perform well. In addition, accommodative central banks provided confidence that the global economic recovery would continue. European markets recovered nicely with the election of a new prime minister in the UK who made it clear that, while the UK would leave the EU, the process would be slow and deliberate.
As the fiscal year ended just prior to the Presidential election, our investment team analyzed a number of different election scenarios to determine the likely market reaction to various outcomes. With the Trump victory, we believe the challenge for investors now is to determine the likely long‐term economic and financial market impact of the Republican sweep (control of the presidency and both houses of Congress). We believe that the most likely direction for economic policy and the potential economic and market impacts are:
| ● | We believe that the business‐friendly policies of a Trump administration will likely offset the negative impact of his previously announced trade policies. This could be positive for both US and European equity markets. |
| ● | We believe that trade policy is likely to become more protectionist, which could be negative for China and possibly Mexico. |
| ● | We think inflation is likely to move higher, which could ultimately result in more pricing power for US companies. |
| ● | We think the Fed could become more hawkish given the previous calls from both Trump and some Congressional leaders that the Fed raise interest rates. |
| ● | We believe, based on Trump’s suggestions of infrastructure build, a larger military and other such spending programs, that the US budget deficit will grow larger in the short run. |
| ● | We believe the corporate tax code is likely to be reformed. |
| ● | We think the Affordable Care Act (Obamacare) is likely to be repealed. |
Trump’s policy proposals are not very detailed and could be substantially modified in the legislative process. Until we get more clarity on future policy direction, we are likely to encounter more market volatility. However, if we can avoid extended trade disputes with our friends and major export markets (especially Canada and Mexico), then we believe that the long bull market that began in 2009 can remain intact. We remain overweight equities and have recently moved more of our allocation back into large cap US stocks. In our strategies with the longest time horizons, we have a modest amount of emerging markets equities. We continue to prefer that our energy exposure be primarily in master-limited-partnerships (MLPs). Within fixed income, we retain a significant portion of our allocation in high yield; however, we are cautious about valuations.
Performance Discussion for the Conservative Income Builder and Moderate Growth & Income Funds:
The RiverFront Conservative Income and Moderate Growth & Income Funds are managed using the same overarching process which is based on our Price Matters® framework. This framework allows the investment managers to develop investment themes that span across the various asset classes in which the funds are invested. As a result, these funds hold substantially the same securities, but the asset class allocations differ depending on the investment time horizon for each. This results in the performance drivers being the same. In the case of the Conservative Income Builder Fund, the allocation is 30% equities and 70% fixed income. The Moderate Growth & Income Fund is managed to a targeted allocation of 50% equities and 50% fixed income. The RiverFront investment managers have the flexibility to make allocations that differ from the benchmark.
In discussing the performance for the RiverFront Funds, it’s important to keep in mind their global allocation mandate. All of the RiverFront offerings have exposure to multi-cap, global equities; our balanced funds have the addition of fixed income. The table below illustrates the disparity of returns across the major indices during the most recent quarter, which resulted in varying degrees of relative performance when compared to the traditional single index, mutual fund benchmark.
| Benchmark Indexes | 1 Year Returns (11/1/2015-10/31/2016) |
| S&P 500 Total Return | 4.51% |
| S&P 1000 Total Return | 6.29% |
| MSCI EAFE (Net) | -3.23% |
| MSCI Emerging Markets (Net) | 9.27% |
| MSCI All Country World Index (Net) | 2.05% |
| Barclays US Aggregate | 4.37% |
| BofAML US HY Master II Total Return | 10.16% |
| Barclays US Treasury Index | 3.32% |
| Barclays US Short Treasury Index (1-3M) | 0.23% |
Data as of 10/31/2016 | |
115 | October 31, 2016
RiverFront Global Allocation Series
Management Commentary | October 31, 2016 (Unaudited) |
| * | For index definitions see footnotes at the end of the Management Commentary and below the performance data on the following pages. |
| ** | For a complete presentation of RiverFront Mutual Fund and relevant benchmark performance, please refer to the Performance Update on the following pages. |
Some Performance Contributors:
| ● | From an allocation perspective, the Funds benefitted from an underweight to fixed income. |
| ● | In addition, there was positive selection impact from the preference for high yield over traditional fixed income. |
| ● | We had positive selection impact within telecommunications and consumer staples. |
Some Performance Detractors:
| ● | As these are globally allocated funds, the portfolio managers have a mandate to have an allocation based on our strategic targets. Developed international underperformed US equities over the period and our allocation to them impacted performance negatively. |
| ● | The Funds experienced negative performance impact from the selection of securities which hedged exposure to the euro and the yen. |
| ● | The underweight to energy impacted performance negatively. |
Performance Discussion for the Global Growth, Global Allocation and Dynamic Equity Income Funds:
The RiverFront Global Growth, Global Allocation and Dynamic Equity Income Funds are managed using the same overarching process which is based on our Price Matters® framework. This framework allows the investment managers to develop investment themes that span across the various asset classes in which the funds are invested. As a result, these funds hold substantially the same securities, but the asset class allocations differ depending on the investment time horizon for each. This results in the performance drivers being the same. In the case of the Dynamic Equity Income Fund, the allocation is 70% equities and 30% fixed income. The Global Allocation fund is managed to a targeted allocation of 80% equities and 20% fixed income. The Global Growth fund is 100% equity. The RiverFront investment managers have the flexibility to make allocations that differ from the benchmark.
In discussing the performance for the RiverFront Funds, it’s important to keep in mind their global allocation mandate. All of the RiverFront offerings have exposure to multi‐cap, global equities; our balanced funds have the addition of fixed income. The table below illustrates the disparity of returns across the major indices during the most recent quarter, which resulted in varying degrees of relative performance when compared to the traditional single index, mutual fund benchmark.
| Benchmark Indexes | 1 Year Returns(11/1/2015-10/31/2016) |
| S&P 500 Total Return | 4.51% |
| S&P 1000 Total Return | 6.29% |
| MSCI EAFE (Net) | ‐3.23% |
| MSCI Emerging Markets (Net) | 9.27% |
| MSCI All Country World Index (Net) | 2.05% |
| Barclays US Aggregate | 4.37% |
| BofAML US HY Master II Total Return | 10.16% |
| Barclays US Treasury Index | 3.32% |
| Barclays US Short Treasury Index (1‐3M) | 0.23% |
Data as of 10/31/2016
| * | For index definitions see footnotes at the end of the Management Commentary and below the performance data on the following pages. |
| ** | For a complete presentation of RiverFront Mutual Fund and relevant benchmark performance, please refer to the Performance Update on the following pages. |
Some Performance Contributors:
| ● | From an allocation perspective, the Dynamic Equity Income and Global Allocation Funds benefitted from an underweight to fixed income relative to their benchmark which had a larger fixed income component. |
| ● | In addition, there was positive selection impact from the preference for high yield over traditional fixed income for Dynamic Equity Income and Global Allocation (these funds have a fixed income component). |
| ● | We had positive selection impact within telecommunications and consumer staples. |
Some Performance Detractors:
| ● | As these are globally allocated funds, the portfolio managers have a mandate to have an allocation based on our strategic targets. Developed international underperformed US equities over the period and our allocation to them impacted performance negatively. |
| ● | The funds experienced negative performance impact from the selection of securities which hedged exposure to the euro and the yen. |
| ● | The underweights to energy and healthcare impacted performance negatively. |
116 | October 31, 2016
RiverFront Global Allocation Series
Management Commentary | October 31, 2016 (Unaudited) |
Michael Jones, CFA
Co‐Portfolio Manager
Doug Sandler, CFA
Co‐Portfolio Manager
Adam Grossman, CFA
Co‐Portfolio Manager
Kevin Nicholson, CFA
Co‐Portfolio Manager
Tim Anderson, CFA
Co‐Portfolio Manager
Past performance is no guarantee of future results. Dividends are not guaranteed and are subject to change or elimination. Investments in international and emerging markets securities include exposure to risks such as currency fluctuations, foreign taxes and regulations, and the potential for illiquid markets and political instability.
The views of the author and information discussed in this commentary are as of the date of publication, are subject to change, and may not reflect the writer’s current views. The views expressed are those of the author only, and represent an assessment of market conditions at a specific point in time, are opinions only and should not be relied upon as investment advice regarding a particular investment or markets in general. Such information does not constitute a recommendation to buy or sell specific securities or investment vehicles. It should not be assumed that any investment will be profitable or will equal the performance of the fund(s) or any securities or any sectors mentioned in this letter. The subject matter contained in this letter has been derived from several sources believed to be reliable and accurate at the time of compilation. Neither ALPS Advisors, Inc., RiverFront Investment Group, LLC, nor the Funds accepts any liability for losses either direct or consequential caused by the use of this information.
The S&P 1000® Index combines the S&P MidCap 400® and the S&P SmallCap 600® to form an investable benchmark for the mid- to small-cap segment of the U.S. equity market.
The MSCI EAFE Index is recognized as the pre-eminent benchmark in the United States to measure international equity performance. It comprises the MSCI country indices that represent developed markets outside of North America: Europe, Australasia and the Far East.
The MSCI Emerging Markets Index is a free float-adjusted market capitalization index that is designed to measure equity market performance in the global emerging markets.
The BofAML US HY Master II Total Return Index tracks the performance of US dollar denominated below investment grade corporate debt publicly issued in the US domestic market.
The Barclays U.S. Treasury Index includes public obligations of the U.S. Treasury, excluding Treasury bills and certain special issues, such as state and local government series bonds (SLGs) and U.S. Treasury TIPS.
The Barclays U.S. Short Treasury Index is composed of bonds of investment grade with a maturity between one and three years.
An investor may not invest directly in an index.
Diversification cannot guarantee gain or prevent losses.
RiverFront Conservative Income Builder Fund
| Performance Update | October 31, 2016 (Unaudited) |
Performance of $10,000 Initial Investment (as of October 31, 2016)
Comparison of change in value of a $10,000 investment (includes maximum sales charges of 5.50%)
The chart above represents historical performance of a hypothetical investment of $10,000 in the Fund since inception. Past performance does not guarantee future results. This chart does not reflect the deduction of taxes that a shareholder would pay on Fund distributions or the redemption of Fund shares.
Average Annual Total Returns (as of October 31, 2016)
| | 6 Month | 1 Year | 3 Years | Since Inception^ | Total Expense Ratio | What You Pay* |
| Class A (NAV) | 1.68% | 2.47% | 2.31% | 3.80% | 2.34% | 1.43% |
| Class A (MOP) | ‐3.92% | ‐3.17% | 0.41% | 2.40% |
| Class C (NAV) | 1.35% | 1.74% | 1.58% | 3.05% | 3.09% | 2.18% |
| Class C (CDSC) | 0.35% | 0.74% | 1.58% | 3.05% |
| Class I | 1.86% | 2.66% | 2.57% | 4.04% | 2.08% | 1.18% |
Barclays U.S. Aggregate Bond Index1 | 1.51% | 4.37% | 3.48% | 2.31% | | |
30% S&P 500® and 70% Barclays U.S. Aggregate Bond1,2 | 2.28% | 4.51% | 5.20% | 5.48% | | |
Performance data quoted represents past performance. Past performance does not guarantee future results. Investment return and principal value of an investment will fluctuate so that an investor's shares, when sold or redeemed, may be worth more or less than the original cost. Current performance data may be higher or lower than actual data quoted. For the most current month-end performance data, please call 1-866-759-5679.
Maximum Offering Price (MOP) for Class A shares includes the Fund’s maximum sales charge of 5.50%. Performance shown at NAV does not include these sales charges and would have been lower had it been taken into account. If you invest $1 million or more, either as a lump sum or through the Fund’s accumulation or letter of intent programs, you can purchase Class A shares without an initial sales charge (load). A Contingent Deferred Sales Charge (“CDSC”) of 1.00% may apply to Class C shares redeemed within the first 12 months after a purchase, and on Class A shares redeemed within the first 18 months after a purchase in excess of $1 million.
Performance less than 1 year is cumulative.
118 | October 31, 2016
RiverFront Conservative Income Builder Fund
| Performance Update | October 31, 2016 (Unaudited) |
| 1 | The Barclays U.S. Aggregate Bond Index is a broad-based benchmark that measures the investment grade, U.S. dollar-denominated, fixed-rate taxable bond market, including Treasuries, government-related and corporate securities, MBS (agency fixed-rate and hybrid ARM passthroughs), ABS, and CMBS. The index is not actively managed and does not reflect any deductions for fees, expenses or taxes. An investor may not invest directly in an index. |
| 2 | The S&P 500® Index is the Standard & Poor's composite index of 500 stocks, a widely recognized, unmanaged index of common stock prices. |
| ^ | Fund inception date of August 31, 2012. |
| * | What You Pay reflects the Advisor's and Sub-Advisor's decision to contractually limit expenses through February 28, 2017 and Acquired Fund Fees and Expenses of 0.28%. Please see the prospectus for additional information. |
The table does not reflect the deduction of taxes that a shareholder would pay on Fund distributions or the redemption of Fund shares.
This Fund is not suitable for all investors and is subject to investment risks, including possible loss of the principal amount invested.
There is no guarantee that the Fund will continue to hold any one particular security or stay invested in any one particular company. The composition of the Fund's top holdings is subject to change. Performance figures are historical and reflect the change in share price, reinvested distributions, changes in net asset value, sales charges and capital gains distributions, if any.
Not FDIC Insured – No Bank Guarantee – May Lose Value
Top Ten Holdings (as a % of Net Assets) †
Vanguard® Intermediate‐Term Corporate Bond ETF | 22.47% |
| PIMCO Investment Grade Corporate Bond Index ETF | 15.39% |
Vanguard® Short‐Term Corporate Bond ETF | 9.06% |
| RiverFront Strategic Income Fund | 6.58% |
SPDR® Barclays Short Term High Yield Bond ETF | 5.20% |
| PIMCO 0‐5 Year High Yield Corporate Bond Index ETF | 5.19% |
WisdomTree® LargeCap Value Fund | 3.91% |
iShares® Core S&P® SmallCap ETF | 2.98% |
WisdomTree® LargeCap Dividend Fund | 2.91% |
iShares® Core S&P 500® ETF | 2.49% |
| Top Ten Holdings | 76.18% |
| † | Holdings are subject to change, and may not reflect the current or future position of the portfolio. Table presents indicative values only. Excludes cash & cash equivalents. |
Portfolio Composition (as a % of Net Assets)
119 | October 31, 2016
RiverFront Dynamic Equity Income Fund
| Performance Update | October 31, 2016 (Unaudited) |
Performance of $10,000 Initial Investment (as of October 31, 2016)
Comparison of change in value of a $10,000 investment (includes maximum sales charges of 5.50%)
The chart above represents historical performance of a hypothetical investment of $10,000 in the Fund since inception. Past performance does not guarantee future results. This chart does not reflect the deduction of taxes that a shareholder would pay on Fund distributions or the redemption of Fund shares.
Average Annual Total Returns (as of October 31, 2016)
| | 6 Month | 1 Year | 3 Years | 5 Years | Since Inception^ | Total Expense Ratio | What You Pay* |
| Class A (NAV) | 2.90% | 1.80% | 3.17% | 6.70% | 6.61% | 1.70% | 1.50% |
| Class A (MOP) | ‐2.78% | ‐3.84% | 1.25% | 5.50% | 5.65% |
| Class C (NAV) | 2.51% | 0.97% | 2.39% | 5.89% | 5.79% | 2.45% | 2.25% |
| Class C (CDSC) | 1.51% | 0.00% | 2.39% | 5.89% | 5.79% |
| Class I | 2.97% | 2.01% | 3.41% | 6.95% | 6.86% | 1.45% | 1.25% |
MSCI All Country World Index1 | 3.02% | 2.05% | 3.21% | 8.03% | 7.61% | | |
70% MSCI ACWI and 30% Barclays U.S. Aggregate Bond1,2 | 2.58% | 2.87% | 3.43% | 6.62% | 6.56% | | |
Performance data quoted represents past performance. Past performance does not guarantee future results. Investment return and principal value of an investment will fluctuate so that an investor's shares, when sold or redeemed, may be worth more or less than the original cost. Current performance data may be higher or lower than actual data quoted. For the most current month-end performance data, please call 1-866-759-5679.
Maximum Offering Price (MOP) for Class A shares includes the Fund’s maximum sales charge of 5.50%. Performance shown at NAV does not include these sales charges and would have been lower had it been taken into account. If you invest $1 million or more, either as a lump sum or through the Fund’s accumulation or letter of intent programs, you can purchase Class A shares without an initial sales charge (load). A Contingent Deferred Sales Charge (“CDSC”) of 1.00% may apply to Class C shares redeemed within the first 12 months after a purchase, and on Class A shares redeemed within the first 18 months after a purchase in excess of $1 million.
Performance less than 1 year is cumulative.
120 | October 31, 2016
RiverFront Dynamic Equity Income Fund
| Performance Update | October 31, 2016 (Unaudited) |
| 1 | The MSCI ACWI (All Country World Index) is a free float-adjusted market capitalization weighted index that is designed to measure the equity market performance of developed and emerging markets. The MSCI ACWI consists of 45 country indices comprising 24 developed and 21 emerging market country indices. The index includes reinvestment of dividends, net of foreign withholding taxes. The index is not actively managed and does not reflect any deductions for fees, expenses or taxes. An investor may not invest directly in an index. |
| 2 | The Barclays U.S. Aggregate Bond Index is a broad-based benchmark that measures the investment grade, U.S. dollar-denominated, fixed-rate taxable bond market, including Treasuries, government-related and corporate securities, MBS (agency fixed-rate and hybrid ARM passthroughs), ABS, and CMBS. The index is not actively managed and does not reflect any deductions for fees, expenses or taxes. An investor may not invest directly in an index. |
| ^ | Fund inception date of August 2, 2010. |
| * | What You Pay reflects the Advisor's and Sub-Advisor's decision to contractually limit expenses through February 28, 2017 and Acquired Fund Fees and Expenses of 0.35%. Please see the prospectus for additional information. |
The table does not reflect the deduction of taxes that a shareholder would pay on Fund distributions or the redemption of Fund shares.
This Fund is not suitable for all investors and is subject to investment risks, including possible loss of the principal amount invested.
There is no guarantee that the Fund will continue to hold any one particular security or stay invested in any one particular company. The composition of the Fund's top holdings is subject to change. Performance figures are historical and reflect the change in share price, reinvested distributions, changes in net asset value, sales charges and capital gains distributions, if any.
Not FDIC Insured – No Bank Guarantee – May Lose Value
Top Ten Holdings (as a % of Net Assets) †
iShares® Core MSCI Emerging Markets ETF | 11.40% |
WisdomTree® Europe Hedged Equity Fund | 8.09% |
iShares® MSCI EAFE Growth ETF | 6.06% |
SPDR® Morgan Stanley Technology ETF | 5.60% |
PowerShares® S&P 500® High Dividend Portfolio | 4.38% |
| RiverFront Strategic Income Fund | 4.00% |
| ETRACS Alerian MLP Infrastructure Index ETN | 3.45% |
| Goldman Sachs ActiveBeta U.S. Large Cap Equity ETF | 3.16% |
| PIMCO 0‐5 Year High Yield Corporate Bond Index ETF | 3.06% |
SPDR® Barclays Short Term High Yield Bond ETF | 3.06% |
| Top Ten Holdings | 52.26% |
| † | Holdings are subject to change, and may not reflect the current or future position of the portfolio. Table presents indicative values only. Excludes cash & cash equivalents. |
Portfolio Composition (as a % of Net Assets)
121 | October 31, 2016
RiverFront Global Allocation Fund
| Performance Update | October 31, 2016 (Unaudited) |
Performance of $10,000 Initial Investment (as of October 31, 2016)
Comparison of change in value of a $10,000 investment (includes maximum sales charges of 5.50%)
The chart above represents historical performance of a hypothetical investment of $10,000 in the Fund since inception. Past performance does not guarantee future results. This chart does not reflect the deduction of taxes that a shareholder would pay on Fund distributions or the redemption of Fund shares.
Average Annual Total Returns (as of October 31, 2016)
| | 6 Month | 1 Year | 3 Years | 5 Years | Since Inception^ | Total Expense Ratio | What You Pay* |
| Class A (NAV) | 2.76% | ‐0.88% | 1.83% | 6.29% | 5.52% | 1.80% | 1.52% |
| Class A (MOP) | ‐2.85% | ‐6.33% | ‐0.07% | 5.09% | 4.57% |
| Class C (NAV) | 2.29% | ‐1.61% | 1.06% | 5.51% | 4.73% | 2.55% | 2.27% |
| Class C (CDSC) | 1.29% | ‐2.58% | 1.06% | 5.51% | 4.73% |
| Class I | 2.80% | ‐0.60% | 2.06% | 6.55% | 5.76% | 1.55% | 1.27% |
MSCI All Country World Index1 | 3.02% | 2.05% | 3.21% | 8.03% | 7.61% | | |
80% MSCI ACWI and 20% Barclays U.S. Aggregate Bond1,2 | 2.73% | 2.61% | 3.37% | 7.10% | 6.93% | | |
Performance data quoted represents past performance. Past performance does not guarantee future results. Investment return and principal value of an investment will fluctuate so that an investor's shares, when sold or redeemed, may be worth more or less than the original cost. Current performance data may be higher or lower than actual data quoted. For the most current month-end performance data, please call 1-866-759-5679.
Maximum Offering Price (MOP) for Class A shares includes the Fund’s maximum sales charge of 5.50%. Performance shown at NAV does not include these sales charges and would have been lower had it been taken into account. If you invest $1 million or more, either as a lump sum or through the Fund’s accumulation or letter of intent programs, you can purchase Class A shares without an initial sales charge (load). A Contingent Deferred Sales Charge (“CDSC”) of 1.00% may apply to Class C shares redeemed within the first 12 months after a purchase, and on Class A shares redeemed within the first 18 months after a purchase in excess of $1 million.
Performance less than 1 year is cumulative.
122 | October 31, 2016
RiverFront Global Allocation Fund
| Performance Update | October 31, 2016 (Unaudited) |
| 1 | The MSCI ACWI (All Country World Index) is a free float-adjusted market capitalization weighted index that is designed to measure the equity market performance of developed and emerging markets. The MSCI ACWI consists of 45 country indices comprising 24 developed and 21 emerging market country indices. The index includes reinvestment of dividends, net of foreign withholding taxes. The index is not actively managed and does not reflect any deductions for fees, expenses or taxes. An investor may not invest directly in an index. |
| 2 | The Barclays U.S. Aggregate Bond Index is a broad-based benchmark that measures the investment grade, U.S. dollar-denominated, fixed-rate taxable bond market, including Treasuries, government-related and corporate securities, MBS (agency fixed-rate and hybrid ARM passthroughs), ABS, and CMBS. The index is not actively managed and does not reflect any deductions for fees, expenses or taxes. An investor may not invest directly in an index. |
| ^ | Fund inception date of August 2, 2010. |
| * | What You Pay reflects the Advisor's and Sub-Advisor’s decision to contractually limit expenses through February 28, 2017 and Acquired Fund Fees and Expenses of 0.37%. Please see the prospectus for additional information. |
The table does not reflect the deduction of taxes that a shareholder would pay on Fund distributions or the redemption of Fund shares.
This Fund is not suitable for all investors and is subject to investment risks, including possible loss of the principal amount invested.
There is no guarantee that the Fund will continue to hold any one particular security or stay invested in any one particular company. The composition of the Fund's top holdings is subject to change. Performance figures are historical and reflect the change in share price, reinvested distributions, changes in net asset value, sales charges and capital gains distributions, if any.
Not FDIC Insured – No Bank Guarantee – May Lose Value
Top Ten Holdings (as a % of Net Assets) †
iShares® Core MSCI Emerging Markets ETF | 14.15% |
iShares® MSCI EAFE Growth ETF | 7.87% |
WisdomTree® Europe Hedged Equity Fund | 7.86% |
SPDR® Morgan Stanley Technology ETF | 6.44% |
| Goldman Sachs ActiveBeta U.S. Large Cap Equity ETF | 3.53% |
| ETRACS Alerian MLP Infrastructure Index ETN | 3.49% |
FlexShares® Quality Dividend Index Fund | 3.47% |
iShares® U.S. Consumer Goods ETF | 3.28% |
PowerShares® Europe Currency Hedged Low Volatility Portfolio | 2.97% |
iShares® Core S&P® SmallCap ETF | 2.69% |
| Top Ten Holdings | 55.75% |
| † | Holdings are subject to change, and may not reflect the current or future position of the portfolio. Table presents indicative values only. Excludes cash & cash equivalents. |
Portfolio Composition (as a % of Net Assets)
123 | October 31, 2016
RiverFront Global Growth Fund
| Performance Update | October 31, 2016 (Unaudited) |
Performance of $10,000 Initial Investment (as of October 31, 2016)
Comparison of change in value of a $10,000 investment (includes maximum sales charges of 5.50%)
The chart above represents historical performance of a hypothetical investment of $10,000 in the Fund since inception. Past performance does not guarantee future results. This chart does not reflect the deduction of taxes that a shareholder would pay on Fund distributions or the redemption of Fund shares.
Average Annual Total Returns (as of October 31, 2016)
| | 6 Month | 1 Year | 3 Years | 5 Years | Since Inception^ | Total Expense Ratio | What You Pay* |
| Class A (NAV) | 3.52% | ‐0.57% | 2.02% | 7.05% | 8.73% | 1.77% | 1.54% |
| Class A (MOP) | ‐2.17% | ‐6.03% | 0.10% | 5.84% | 7.96% |
| Class C (NAV) | 3.05% | ‐1.31% | 1.24% | 6.27% | 7.93% | 2.52% | 2.29% |
| Class C (CDSC) | 2.05% | ‐2.28% | 1.24% | 6.27% | 7.93% |
| Class I | 3.64% | ‐0.31% | 2.25% | 7.30% | 8.99% | 1.53% | 1.29% |
Class L1 | 3.57% | ‐0.31% | 2.27% | 7.33% | 8.99% | 1.52% | 1.29% |
| Investor Class | 3.54% | ‐0.51% | 2.03% | 7.06% | 8.71% | 1.77% | 1.54% |
MSCI All Country World Index2 | 3.02% | 2.05% | 3.21% | 8.03% | 10.58% | | |
S&P 500® Total Return Index3 | 4.06% | 4.51% | 8.84% | 13.57% | 13.16% | | |
Performance data quoted represents past performance. Past performance does not guarantee future results. Investment return and principal value of an investment will fluctuate so that an investor's shares, when sold or redeemed, may be worth more or less than the original cost. Current performance data may be higher or lower than actual data quoted. For the most current month-end performance data, please call 1-866-759-5679.
Maximum Offering Price (MOP) for Class A shares includes the Fund’s maximum sales charge of 5.50%. Performance shown at NAV does not include these sales charges and would have been lower had it been taken into account. If you invest $1 million or more, either as a lump sum or through the Fund’s accumulation or letter of intent programs, you can purchase Class A shares without an initial sales charge (load). A Contingent Deferred Sales Charge (“CDSC”) of 1.00% may apply to Class C shares redeemed within the first 12 months after a purchase, and on Class A shares redeemed within the first 18 months after a purchase in excess of $1 million.
Performance less than 1 year is cumulative.
124 | October 31, 2016
RiverFront Global Growth Fund
| Performance Update | October 31, 2016 (Unaudited) |
| 1 | Prior to close of business on September 24, 2010, Class L was known as Institutional Class of the Baird Funds, Inc. - RiverFront Long-Term Growth Fund. |
| 2 | The MSCI ACWI (All Country World Index) is a free float-adjusted market capitalization weighted index that is designed to measure the equity market performance of developed and emerging markets. The MSCI ACWI consists of 45 country indices comprising 24 developed and 21 emerging market country indices. The index includes reinvestment of dividends, net of foreign withholding taxes. The index is not actively managed and does not reflect any deductions for fees, expenses or taxes. An investor may not invest directly in an index. |
| 3 | S&P 500® Total Return Index is the Standard & Poor's composite index of 500 stocks, a widely recognized, unmanaged index of common stock prices. The index is not actively managed and does not reflect any deduction for fees, expenses or taxes. An investor may not invest directly in an index. |
| ^ | Fund inception date of October 28, 2008. |
| * | What You Pay reflects the Advisor's and Sub-Advisor's decision to contractually limit expenses through February 28, 2017 and Acquired Fund Fees and Expenses of 0.39%. Please see the prospectus for additional information. |
The Class A, C, I and L shares performance shown for periods prior to September 27, 2010 reflects the performance of the Baird Funds, Inc. – RiverFront Long-Term Growth Fund’s Institutional Class shares (as result of the reorganization of the Baird Funds, Inc. – RiverFront Long-Term Growth Fund into the Fund).
The Investor Class performance shown for periods prior to September 27, 2010 reflects the performance of the Baird Funds, Inc. – RiverFront Long-Term Growth Fund’s Investor Class shares (as result of the reorganization of the Baird Funds, Inc. – RiverFront Long-Term Growth Fund into the Fund).
The table does not reflect the deduction of taxes that a shareholder would pay on Fund distributions or the redemption of Fund shares.
This Fund is not suitable for all investors and is subject to investment risks, including possible loss of the principal amount invested.
There is no guarantee that the Fund will continue to hold any one particular security or stay invested in any one particular company. The composition of the Fund's top holdings is subject to change. Performance figures are historical and reflect the change in share price, reinvested distributions, changes in net asset value, sales charges and capital gains distributions, if any.
Not FDIC Insured – No Bank Guarantee – May Lose Value
Top Ten Holdings (as a % of Net Assets) †
iShares® Core MSCI Emerging Markets ETF | 16.09% |
WisdomTree® Europe Hedged Equity Fund | 8.81% |
iShares® MSCI EAFE Growth ETF | 8.70% |
SPDR® Morgan Stanley Technology ETF | 6.33% |
| Goldman Sachs ActiveBeta U.S. Large Cap Equity ETF | 4.34% |
| ETRACS Alerian MLP Infrastructure Index ETN | 4.03% |
iShares® Core S&P 500® ETF | 3.95% |
WisdomTree® LargeCap Value Fund | 3.90% |
FlexShares® Quality Dividend Index Fund | 3.14% |
PowerShares® Europe Currency Hedged Low Volatility Portfolio | 2.97% |
| Top Ten Holdings | 62.26% |
| † | Holdings are subject to change, and may not reflect the current or future position of the portfolio. Table presents indicative values only. Excludes cash & cash equivalents. |
Portfolio Composition (as a % of Net Assets)
125 | October 31, 2016
RiverFront Moderate Growth & Income Fund
| Performance Update | October 31, 2016 (Unaudited) |
Performance of $10,000 Initial Investment (as of October 31, 2016)
Comparison of change in value of a $10,000 investment (includes maximum sales charges of 5.50%)
The chart above represents historical performance of a hypothetical investment of $10,000 in the Fund since inception. Past performance does not guarantee future results. This chart does not reflect the deduction of taxes that a shareholder would pay on Fund distributions or the redemption of Fund shares.
Average Annual Total Returns (as of October 31, 2016)
| | 6 Month | 1 Year | 3 Years | 5 Years | Since Inception^ | Total Expense Ratio | What You Pay* |
| Class A (NAV) | 2.24% | 1.81% | 3.21% | 5.69% | 5.57% | 1.61% | 1.46% |
| Class A (MOP) | ‐3.42% | ‐3.81% | 1.27% | 4.50% | 4.62% |
| Class C (NAV) | 1.80% | 1.03% | 2.41% | 4.87% | 4.77% | 2.36% | 2.21% |
| Class C (CDSC) | 0.80% | 0.06% | 2.41% | 4.87% | 4.77% |
| Class I | 2.30% | 2.05% | 3.44% | 5.93% | 5.81% | 1.36% | 1.21% |
S&P 500® Total Return Index1 | 4.06% | 4.51% | 8.84% | 13.57% | 13.09% | | |
50% S&P 500® and 50% Barclays U.S. Aggregate Bond1,2 | 2.79% | 4.56% | 6.29% | 8.27% | 8.39% | | |
Performance data quoted represents past performance. Past performance does not guarantee future results. Investment return and principal value of an investment will fluctuate so that an investor's shares, when sold or redeemed, may be worth more or less than the original cost. Current performance data may be higher or lower than actual data quoted. For the most current month-end performance data, please call 1-866-759-5679.
Maximum Offering Price (MOP) for Class A shares includes the Fund’s maximum sales charge of 5.50%. Performance shown at NAV does not include these sales charges and would have been lower had it been taken into account. If you invest $1 million or more, either as a lump sum or through the Fund’s accumulation or letter of intent programs, you can purchase Class A shares without an initial sales charge (load). A Contingent Deferred Sales Charge (“CDSC”) of 1.00% may apply to Class C shares redeemed within the first 12 months after a purchase, and on Class A shares redeemed within the first 18 months after a purchase in excess of $1 million.
Performance less than 1 year is cumulative.
126 | October 31, 2016
RiverFront Moderate Growth & Income Fund
| Performance Update | October 31, 2016 (Unaudited) |
| 1 | S&P 500® Total Return Index is the Standard & Poor's composite index of 500 stocks, a widely recognized, unmanaged index of common stock prices. The index is not actively managed and does not reflect any deduction for fees, expenses or taxes. An investor may not invest directly in an index. |
| 2 | The Barclays U.S. Aggregate Bond Index is a broad-based benchmark that measures the investment grade, U.S. dollar-denominated, fixed-rate taxable bond market, including Treasuries, government-related and corporate securities, MBS (agency fixed-rate and hybrid ARM passthroughs), ABS, and CMBS. The index is not actively managed and does not reflect any deductions for fees, expenses or taxes. An investor may not invest directly in an index. |
| ^ | Fund inception date of August 2, 2010. |
| * | What You Pay reflects the Advisor's and Sub-Advisor’s decision to contractually limit expenses through February 28, 2017 and Acquired Fund Fees and Expenses of 0.31%. Please see the prospectus for additional information. |
The table does not reflect the deduction of taxes that a shareholder would pay on Fund distributions or the redemption of Fund shares.
This Fund is not suitable for all investors and is subject to investment risks, including possible loss of the principal amount invested.
There is no guarantee that the Fund will continue to hold any one particular security or stay invested in any one particular company. The composition of the Fund's top holdings is subject to change. Performance figures are historical and reflect the change in share price, reinvested distributions, changes in net asset value, sales charges and capital gains distributions, if any.
Not FDIC Insured – No Bank Guarantee – May Lose Value
Top Ten Holdings (as a % of Net Assets) †
Vanguard® Intermediate‐Term Corporate Bond ETF | 12.49% |
Vanguard® Short‐Term Corporate Bond ETF | 6.56% |
| RiverFront Strategic Income Fund | 6.56% |
FlexShares® Quality Dividend Index Fund | 5.94% |
SPDR® Barclays Short Term High Yield Bond ETF | 5.11% |
| PIMCO 0‐5 Year High Yield Corporate Bond Index ETF | 5.11% |
| PIMCO Investment Grade Corporate Bond Index ETF | 4.93% |
SPDR® Morgan Stanley Technology ETF | 4.36% |
| Goldman Sachs ActiveBeta U.S. Large Cap Equity ETF | 3.61% |
iShares® Core MSCI Emerging Markets ETF | 3.09% |
| Top Ten Holdings | 57.76 % |
| † | Holdings are subject to change, and may not reflect the current or future position of the portfolio. Table presents indicative values only. Excludes cash & cash equivalents. |
Portfolio Composition (as a % of Net Assets)
127 | October 31, 2016
RiverFront Conservative Income Builder Fund
| Statement of Investments | October 31, 2016 |
| | | Shares | | | Value (Note 2) | |
| EXCHANGE TRADED FUNDS (96.07%) | | | | | | |
| Debt (65.87%) | | | | | | |
Guggenheim BulletShares® 2021 Corporate Bond ETF | | | 13,774 | | | $ | 296,003 | |
| PIMCO 0‐5 Year High Yield Corporate Bond Index ETF | | | 7,831 | | | | 770,962 | |
| PIMCO Investment Grade Corporate Bond Index ETF | | | 21,661 | | | | 2,285,236 | |
RiverFront Strategic Income Fund(a) | | | 38,857 | | | | 977,254 | |
SPDR® Bloomberg Barclays Short Term High Yield Bond ETF | | | 28,087 | | | | 771,831 | |
Vanguard® Intermediate‐Term Corporate Bond ETF | | | 37,677 | | | | 3,336,675 | |
Vanguard® Short‐Term Corporate Bond ETF | | | 16,745 | | | | 1,344,958 | |
| | | | | | | | 9,782,919 | |
| | | | | | | | | |
| Equity (30.20%) | | | | | | | | |
FlexShares® Quality Dividend Index Fund | | | 7,156 | | | | 265,702 | |
| Global X MSCI Norway ETF | | | 8,519 | | | | 94,200 | |
Goldman Sachs ActiveBeta® U.S. Large Cap Equity ETF | | | 4,724 | | | | 201,431 | |
iShares® Core S&P 500® ETF | | | 1,732 | | | | 370,111 | |
iShares® Core S&P® SmallCap ETF | | | 3,724 | | | | 441,927 | |
iShares® International Select Dividend ETF | | | 4,841 | | | | 140,873 | |
iShares® MSCI Australia ETF | | | 7,269 | | | | 147,415 | |
iShares® Nasdaq Biotechnology ETF | | | 331 | | | | 84,961 | |
iShares® U.S. Consumer Goods ETF | | | 1,852 | | | | 207,479 | |
PowerShares® Aerospace & Defense Portfolio | | | 2,873 | | | | 110,385 | |
PowerShares® KBW Regional Banking Portfolio | | | 1,860 | | | | 82,231 | |
Powershares® QQQ Trust Series 1 | | | 1,637 | | | | 191,513 | |
PowerShares® S&P 500® Ex‐Rate Sensitive Low Volatility Portfolio | | | 5,794 | | | | 154,932 | |
| Schwab U.S. REIT ETF™ | | | 2,032 | | | | 81,788 | |
SPDR® Morgan Stanley Technology ETF | | | 5,023 | | | | 301,180 | |
SPDR® S&P® Capital Markets ETF | | | 1,869 | | | | 73,396 | |
Vanguard® Telecommunication Services ETF | | | 1,177 | | | | 107,083 | |
WisdomTree® Europe Hedged Equity Fund | | | 2,103 | | | | 114,235 | |
WisdomTree® International Hedged Quality Dividend Growth Fund | | | 11,750 | | | | 301,505 | |
WisdomTree® LargeCap Dividend Fund | | | 5,731 | | | | 432,289 | |
| | | Shares | | | Value (Note 2) | |
| Equity (continued) | | | | | | |
| WisdomTree® LargeCap Value Fund | | | 9,265 | | | $ | 579,990 | |
| | | | | | | | 4,484,626 | |
| | | | | | | | | |
TOTAL EXCHANGE TRADED FUNDS
(Cost $13,840,464) | | 14,267,545 | |
| | | | | | | | | |
| EXCHANGE TRADED NOTES (1.79%) | | | |
| Equity (1.79%) | | | | | | | | |
| ETRACS Alerian MLP Infrastructure Index ETN | | | 9,945 | | | | 265,730 | |
| | | | | | | | | |
TOTAL EXCHANGE TRADED NOTES
(Cost $215,263) | 265,730 | |
| | | 7-Day Yield | | | Shares | | | Value (Note 2) | |
| SHORT TERM INVESTMENTS (2.20%) |
| Money Market Fund (2.20%) |
| State Street Institutional Treasury Plus Money Market Fund | | | 0.220 | % | | | 325,798 | | | | 325,798 | |
| | | | | | | | | | | | | |
TOTAL SHORT TERM INVESTMENTS
(Cost $325,798) | | 325,798 | |
| | | | | | | | | | | | | |
TOTAL INVESTMENTS (100.06%)
(Cost $14,381,525) | $ | 14,859,073 | |
| | | | | | | | | | | | | |
| Liabilities In Excess Of Other Assets (‐0.06%) | | | (8,342 | ) |
| | | | | | | | | | | | | |
| NET ASSETS (100.00%) | $ | 14,850,731 | |
| (a) | Affiliated Company. See Note 7 in Notes to Financial Statements. |
128 | October 31, 2016
RiverFront Conservative Income Builder Fund
| Statement of Investments | October 31, 2016 |
For Fund compliance purposes, the Fund's industry classifications refer to any one or more of the industry sub-classifications used by one or more widely recognized market indexes or ratings group indexes, and/or as defined by Fund management. This definition may not apply for purposes of this report, which may combine industry sub-classifications for reporting ease. Industries are shown as a percent of net assets.
See Notes to Financial Statements.
129 | October 31, 2016
RiverFront Dynamic Equity Income Fund
| Statement of Investments | October 31, 2016 |
| | | Shares | | | Value (Note 2) | |
| COMMON STOCKS (1.60%) | | | | | | |
| Communications (0.57%) | | | | | | |
| Telecommunications (0.57%) | | | | | | |
| AT&T, Inc. | | | 12,555 | | | $ | 461,899 | |
| | | | | | | | | |
| TOTAL COMMUNICATIONS | | | | | | | 461,899 | |
| | | | | | | | | |
| Consumer, Non‐Cyclical (0.51%) | | | | | | | | |
| Beverages (0.51%) | | | | | | | | |
| PepsiCo, Inc. | | | 3,875 | | | | 415,400 | |
| | | | | | | | | |
| TOTAL CONSUMER, NON‐CYCLICAL | | 415,400 | |
| | | | | | | | | |
| Technology (0.52%) | | | | | | | | |
| Software (0.52%) | | | | | | | | |
| Paychex, Inc. | | | 7,595 | | | | 419,244 | |
| | | | | | | | | |
| TOTAL TECHNOLOGY | | | | | | | 419,244 | |
| | | | | | | | | |
TOTAL COMMON STOCKS (Cost $1,229,431) | | 1,296,543 | |
| | | | | | | | | |
| EXCHANGE TRADED FUNDS (90.25%) | | | | | |
| Debt (13.13%) | | | | | | | | |
| PIMCO 0-5 Year High Yield Corporate Bond Index ETF | | | 25,246 | | | | 2,485,469 | |
| PIMCO Investment Grade Corporate Bond Index ETF | | | 23,190 | | | | 2,446,545 | |
RiverFront Strategic Income Fund(a) | | | 129,408 | | | | 3,254,611 | |
SPDR® Bloomberg Barclays Short Term High Yield Bond ETF | | | 90,396 | | | | 2,484,082 | |
| | | | | | | | 10,670,707 | |
| | | | | | | | | |
| Equity (77.12%) | | | | | | | | |
Consumer Staples Select Sector SPDR® Fund | | | 24,001 | | | | 1,267,253 | |
First Trust Utilities AlphaDEX® Fund | | | 48,291 | | | | 1,264,746 | |
FlexShares® Quality Dividend Index Fund | | | 60,755 | | | | 2,255,833 | |
| Global X FTSE Nordic Region ETF | | | 15,198 | | | | 293,821 | |
| Global X MSCI Norway ETF | | | 77,332 | | | | 855,106 | |
Goldman Sachs ActiveBeta® U.S. Large Cap Equity ETF | | | 60,231 | | | | 2,568,250 | |
iShares® Core MSCI Emerging Markets ETF | | | 205,349 | | | | 9,269,454 | |
iShares® Core S&P 500® ETF | | | 5,424 | | | | 1,159,054 | |
iShares® Core S&P® SmallCap ETF | | | 6,642 | | | | 788,206 | |
| | | Shares | | | Value (Note 2) | |
| Equity (continued) | | | | | | |
iShares® Currency Hedged MSCI United Kingdom ETF | | | 65,857 | | | $ | 1,676,765 | |
iShares® International Select Dividend ETF | | | 39,406 | | | | 1,146,715 | |
iShares® MSCI Australia ETF | | | 78,988 | | | | 1,601,877 | |
iShares® MSCI EAFE Growth ETF | | | 75,388 | | | | 4,924,344 | |
iShares® Nasdaq Biotechnology ETF | | | 3,454 | | | | 886,573 | |
iShares® U.S. Healthcare Providers ETF | | | 10,190 | | | | 1,194,676 | |
PowerShares® Aerospace & Defense Portfolio | | | 22,539 | | | | 865,980 | |
PowerShares® Europe Currency Hedged Low Volatility Portfolio | | | 51,470 | | | | 1,222,927 | |
PowerShares® KBW Regional Banking Portfolio | | | 34,991 | | | | 1,546,952 | |
Powershares® QQQ Trust Series 1 | | | 17,024 | | | | 1,991,638 | |
PowerShares® S&P 500® Ex-Rate Sensitive Low Volatility Portfolio | | | 60,448 | | | | 1,616,379 | |
PowerShares® S&P 500® High Dividend Portfolio | | | 94,460 | | | | 3,562,087 | |
| Schwab U.S. REIT ETF™ | | | 9,242 | | | | 371,990 | |
SPDR® Morgan Stanley Technology ETF | | | 75,892 | | | | 4,550,492 | |
SPDR® S&P® Capital Markets ETF | | | 26,354 | | | | 1,034,922 | |
SPDR® S&P® Transportation ETF | | | 9,540 | | | | 452,673 | |
Vanguard® Information Technology ETF | | | 3,762 | | | | 450,387 | |
WisdomTree® Europe Hedged Equity Fund | | | 121,009 | | | | 6,573,209 | |
WisdomTree® International Hedged Quality Dividend Growth Fund | | | 93,981 | | | | 2,411,552 | |
WisdomTree® Japan SmallCap Dividend Fund | | | 28,018 | | | | 1,768,776 | |
WisdomTree® LargeCap Dividend Fund | | | 9,935 | | | | 749,397 | |
WisdomTree® LargeCap Value Fund | | | 37,743 | | | | 2,362,716 | |
| | | | | | | | 62,684,750 | |
| | | | | | | | | |
TOTAL EXCHANGE TRADED FUNDS (Cost $69,470,837) | | 73,355,457 | |
130 | October 31, 2016
RiverFront Dynamic Equity Income Fund
| Statement of Investments | October 31, 2016 |
| | | Shares | | | Value (Note 2) | |
| EXCHANGE TRADED NOTES (3.45%) | | | | |
| Equity (3.45%) | | | | | | |
| ETRACS Alerian MLP Infrastructure Index ETN | | | 105,049 | | | $ | 2,806,909 | |
| | | | | | | | | |
TOTAL EXCHANGE TRADED NOTES (Cost $2,224,938) | | 2,806,909 | |
| | | 7-Day Yield | | | Shares | | | Value (Note 2) | |
| SHORT TERM INVESTMENTS (4.79%) |
| Money Market Fund (4.79%) |
| State Street Institutional Treasury Plus Money Market Fund | | | 0.220 | % | | | 3,890,480 | | | | 3,890,480 | |
| | | | | | | | | | | | | |
TOTAL SHORT TERM INVESTMENTS (Cost $3,890,480) | | 3,890,480 | |
| | | | | | | | | | | | | |
TOTAL INVESTMENTS (100.09%) (Cost $76,815,686) | $ | 81,349,389 | |
| | | | | | | | | | | | | |
| Liabilities In Excess Of Other Assets (-0.09%) | | (72,897 | ) |
| | | | | | | | | | | | | |
| NET ASSETS (100.00%) | $ | 81,276,492 | |
(a) | Affiliated Company. See Note 7 in Notes to Financial Statements. |
For Fund compliance purposes, the Fund's industry classifications refer to any one or more of the industry sub-classifications used by one or more widely recognized market indexes or ratings group indexes, and/or as defined by Fund management. This definition may not apply for purposes of this report, which may combine industry sub-classifications for reporting ease. Industries are shown as a percent of net assets.
See Notes to Financial Statements.
131 | October 31, 2016
RiverFront Global Allocation Fund
| Statement of Investments | October 31, 2016 |
| | | Shares | | | Value (Note 2) | |
| COMMON STOCKS (1.65%) | | | | | | |
| Communications (0.59%) | | | | | | |
| Telecommunications (0.59%) AT&T, Inc. | | | 5,691 | | | $ | 209,372 | |
| | | | | | | | | |
| TOTAL COMMUNICATIONS | | 209,372 | |
| | | | | | | | | |
| Consumer, Non-Cyclical (0.52%) | | | | | | | | |
| Beverages (0.52%) | | | | | | | | |
| PepsiCo, Inc. | | | 1,742 | | | | 186,742 | |
| | | | | | | | | |
| TOTAL CONSUMER, NON-CYCLICAL | | 186,742 | |
| | | | | | | | | |
| Technology (0.54%) | | | | | | | | |
| Software (0.54%) | | | | | | | | |
| Paychex, Inc. | | | 3,450 | | | | 190,440 | |
| | | | | | | | | |
| TOTAL TECHNOLOGY | | 190,440 | |
| | | | | | | | | |
TOTAL COMMON STOCKS (Cost $558,007) | | 586,554 | |
| | | | | | | | | |
| EXCHANGE TRADED FUNDS (91.76%) | | | | | |
| Debt (6.65%) | | | | | | | | |
| PIMCO 0-5 Year High Yield Corporate Bond Index ETF | | | 8,279 | | | | 815,068 | |
RiverFront Strategic Income Fund(a) | | | 28,560 | | | | 718,284 | |
SPDR® Bloomberg Barclays Short Term High Yield Bond ETF | | | 29,853 | | | | 820,360 | |
| | | | | | | | 2,353,712 | |
| | | | | | | | | |
| Equity (85.11%) | | | | | | | | |
Financial Select Sector SPDR® Fund | | | 34,648 | | | | 683,952 | |
First Trust Utilities AlphaDEX® Fund | | | 21,384 | | | | 560,049 | |
FlexShares® Quality Dividend Index Fund | | | 33,049 | | | | 1,227,109 | |
| Global X FTSE Nordic Region ETF | | | 6,821 | | | | 131,870 | |
| Global X MSCI Norway ETF | | | 34,292 | | | | 379,187 | |
Goldman Sachs ActiveBeta® U.S. Large Cap Equity ETF | | | 29,307 | | | | 1,249,651 | |
iShares® Core MSCI Emerging Markets ETF | | | 110,996 | | | | 5,010,360 | |
iShares® Core S&P 500® ETF | | | 1,886 | | | | 403,019 | |
iShares® Core S&P® SmallCap ETF | | | 8,010 | | | | 950,547 | |
iShares® Currency Hedged MSCI United Kingdom ETF | | | 36,104 | | | | 919,233 | |
| | | Shares | | | Value (Note 2) | |
| Equity (continued) | | | | | | |
iShares® International Select Dividend ETF | | | 17,388 | | | $ | 505,991 | |
iShares® MSCI Australia ETF | | | 43,737 | | | | 886,986 | |
iShares® MSCI EAFE ETF | | | 7,427 | | | | 429,429 | |
iShares® MSCI EAFE Growth ETF | | | 42,631 | | | | 2,784,657 | |
iShares® MSCI Switzerland Capped ETF | | | 10,905 | | | | 316,354 | |
iShares® Nasdaq Biotechnology ETF | | | 1,499 | | | | 384,763 | |
iShares® U.S. Consumer Goods ETF | | | 10,375 | | | | 1,162,311 | |
iShares® U.S. Healthcare Providers ETF | | | 4,319 | | | | 506,360 | |
PowerShares® Aerospace &Defense Portfolio | | | 9,028 | | | | 346,868 | |
PowerShares® Europe Currency Hedged Low Volatility Portfolio | | | 44,230 | | | | 1,050,905 | |
PowerShares® KBW Regional Banking Portfolio | | | 5,679 | | | | 251,069 | |
Powershares® QQQ Trust Series 1 | | | 6,324 | | | | 739,845 | |
PowerShares® S&P 500® Ex-Rate Sensitive Low Volatility Portfolio | | | 27,387 | | | | 732,328 | |
Real Estate Select Sector SPDR® Fund | | | 4,819 | | | | 149,148 | |
| Schwab U.S. REIT ETF™ | | | 8,740 | | | | 351,785 | |
SPDR® Morgan Stanley Technology ETF | | | 38,010 | | | | 2,279,083 | |
SPDR® S&P® Capital Markets ETF | | | 5,676 | | | | 222,897 | |
SPDR® S&P® Transportation ETF | | | 3,852 | | | | 182,777 | |
WisdomTree® Europe Hedged Equity Fund | | | 51,196 | | | | 2,780,967 | |
WisdomTree® International Hedged Quality Dividend Growth Fund | | | 34,120 | | | | 875,519 | |
WisdomTree® Japan SmallCap Dividend Fund | | | 6,165 | | | | 389,197 | |
WisdomTree® LargeCap Dividend Fund | | | 7,880 | | | | 594,388 | |
WisdomTree® LargeCap Value Fund | | | 11,032 | | | | 690,604 | |
| | | | | | | | 30,129,208 | |
| | | | | | | | | |
TOTAL EXCHANGE TRADED FUNDS (Cost $30,842,431) | | 32,482,920 | |
132 | October 31, 2016
RiverFront Global Allocation Fund
| Statement of Investments | October 31, 2016 |
| | | Shares | | | Value (Note 2) | |
| EXCHANGE TRADED NOTES (3.49%) | | | | |
| Equity (3.49%) | | | | | | |
| ETRACS Alerian MLP Infrastructure Index ETN | | | 46,203 | | | $ | 1,234,544 | |
| | | | | | | | | |
TOTAL EXCHANGE TRADED NOTES (Cost $978,580) | | 1,234,544 | |
| | | 7-Day Yield | | | Shares | | | Value (Note 2) | |
| SHORT TERM INVESTMENTS (3.30%) |
| Money Market Fund (3.30%) |
| State Street Institutional Treasury Plus Money Market Fund | | | 0.220 | % | | | 1,169,020 | | | | 1,169,020 | |
| | | | | | | | | | | | | |
TOTAL SHORT TERM INVESTMENTS (Cost $1,169,020) | | 1,169,020 | |
| | | | | | | | | | | | | |
TOTAL INVESTMENTS (100.20%) (Cost $33,548,038) | $ | 35,473,038 | |
| | | | | | | | | | | | | |
| Liabilities In Excess Of Other Assets (-0.20%) | | | | (71,992 | ) |
| | | | | | | | | | | | | |
| NET ASSETS (100.00%) | $ | 35,401,046 | |
(a) | Affiliated Company. See Note 7 in Notes to Financial Statements. |
For Fund compliance purposes, the Fund's industry classifications refer to any one or more of the industry sub-classifications used by one or more widely recognized market indexes or ratings group indexes, and/or as defined by Fund management. This definition may not apply for purposes of this report, which may combine industry sub-classifications for reporting ease. Industries are shown as a percent of net assets.
See Notes to Financial Statements.
133 | October 31, 2016
RiverFront Global Growth Fund
| Statement of Investments | October 31, 2016 |
| | | Shares | | | Value (Note 2) | |
| COMMON STOCKS (1.64%) | | | | | | |
| Communications (0.58%) | | | | | | |
| Telecommunications (0.58%) | | | | | | |
| AT&T, Inc. | | | 9,092 | | | $ | 334,495 | |
| | | | | | | | | |
| TOTAL COMMUNICATIONS | | | | | | | 334,495 | |
| | | | | | | | | |
| Consumer, Non‐Cyclical (0.53%) | | | | | | | | |
| Beverages (0.53%) | | | | | | | | |
| PepsiCo, Inc. | | | 2,892 | | | | 310,022 | |
| | | | | | | | | |
| TOTAL CONSUMER, NON‐CYCLICAL | | | | 310,022 | |
| | | | | | | | | |
| Technology (0.53%) | | | | | | | | |
| Software (0.53%) | | | | | | | | |
| Paychex, Inc. | | | 5,624 | | | | 310,445 | |
| | | | | | | | | |
| TOTAL TECHNOLOGY | | 310,445 | |
| | | | | | | | | |
TOTAL COMMON STOCKS
(Cost $908,494) | | 954,962 | |
| | | | | | | | | |
| EXCHANGE TRADED FUNDS (92.00%) | | | |
| Equity (92.00%) | | | | | | | | |
Consumer Staples Select Sector SPDR® Fund | | | 8,493 | | | | 448,430 | |
Financial Select Sector SPDR® Fund | | | 44,666 | | | | 881,707 | |
First Trust Utilities AlphaDEX® Fund | | | 34,494 | | | | 903,401 | |
FlexShares® Quality Dividend Index Fund | | | 49,356 | | | | 1,832,588 | |
| Global X FTSE Nordic Region ETF | | | 11,445 | | | | 221,265 | |
| Global X MSCI Norway ETF | | | 55,476 | | | | 613,432 | |
Goldman Sachs ActiveBeta® U.S. Large Cap Equity ETF | | | 59,513 | | | | 2,537,634 | |
iShares® Core MSCI Emerging Markets ETF | | | 208,307 | | | | 9,402,978 | |
iShares® Core S&P 500® ETF | | | 10,787 | | | | 2,305,074 | |
iShares® Core S&P® SmallCap ETF | | | 6,218 | | | | 737,890 | |
iShares® Currency Hedged MSCI United Kingdom ETF | | | 59,413 | | | | 1,512,697 | |
iShares® International Select Dividend ETF | | | 28,202 | | | | 820,678 | |
iShares® MSCI Australia ETF | | | 85,079 | | | | 1,725,402 | |
iShares® MSCI EAFE Growth ETF | | | 77,795 | | | | 5,081,570 | |
iShares® MSCI Japan ETF | | | 73,080 | | | | 923,001 | |
iShares® Nasdaq Biotechnology ETF | | | 3,185 | | | | 817,526 | |
iShares® U.S. Consumer Goods ETF | | | 9,912 | | | | 1,110,441 | |
| | | Shares | | | Value (Note 2) | |
| Equity (continued) | | | | | | |
iShares® U.S. Healthcare Providers ETF | | | 8,559 | | | $ | 1,003,457 | |
PowerShares® Aerospace & Defense Portfolio | | | 19,559 | | | | 751,484 | |
PowerShares® Europe Currency Hedged Low Volatility Portfolio | | | 73,071 | | | | 1,736,167 | |
PowerShares® KBW Regional Banking Portfolio | | | 14,404 | | | | 636,801 | |
Powershares® QQQ Trust Series 1 | | | 7,900 | | | | 924,221 | |
PowerShares® S&P 500® Ex‐Rate Sensitive Low Volatility Portfolio | | | 45,114 | | | | 1,206,348 | |
Real Estate Select Sector SPDR® Fund | | | 5,976 | | | | 184,957 | |
| Schwab U.S. REIT ETF™ | | | 16,898 | | | | 680,145 | |
SPDR® Morgan Stanley Technology ETF | | | 61,648 | | | | 3,696,420 | |
SPDR® S&P® Capital Markets ETF | | | 14,501 | | | | 569,454 | |
SPDR® S&P® Transportation ETF | | | 9,155 | | | | 434,405 | |
Vanguard® Information Technology ETF | | | 4,531 | | | | 542,451 | |
WisdomTree® Europe Hedged Equity Fund | | | 94,748 | | | | 5,146,711 | |
WisdomTree® International Hedged Quality Dividend Growth Fund | | | 56,574 | | | | 1,451,689 | |
WisdomTree® Japan SmallCap Dividend Fund | | | 9,953 | | | | 628,333 | |
WisdomTree® LargeCap Value Fund | | | 36,392 | | | | 2,278,143 | |
| | | | | | | | 53,746,900 | |
| | | | | | | | | |
TOTAL EXCHANGE TRADED FUNDS
(Cost $50,919,426) | | 53,746,900 | |
| | | | | | | | | |
| EXCHANGE TRADED NOTES (4.03%) | | | |
| Equity (4.03%) | | | | | | | | |
| ETRACS Alerian MLP Infrastructure Index ETN | | | 88,196 | | | | 2,356,597 | |
| | | | | | | | | |
TOTAL EXCHANGE TRADED NOTES
(Cost $1,867,991) | | 2,356,597 | |
134 | October 31, 2016
RiverFront Global Growth Fund
| Statement of Investments | October 31, 2016 |
| | | 7-Day Yield | | | Shares | | | Value (Note 2) | |
| SHORT TERM INVESTMENTS (2.43%) |
| Money Market Fund (2.43%) |
| State Street Institutional Treasury Plus Money Market Fund | | | 0.220 | % | | | 1,421,691 | | | $ | 1,421,691 | |
| | | | | | | | | | | | | |
TOTAL SHORT TERM INVESTMENTS
(Cost $1,421,691) | | 1,421,691 | |
| | | | | | | | | | | | | |
TOTAL INVESTMENTS (100.10%)
(Cost $55,117,602) | $ | 58,480,150 | |
| | | | | | | | | | | | | |
| Liabilities In Excess Of Other Assets (‐0.10%) | | (55,604 | ) |
| | | | | | | | | | | | | |
| NET ASSETS (100.00%) | $ | 58,424,546 | |
For Fund compliance purposes, the Fund's industry classifications refer to any one or more of the industry sub-classifications used by one or more widely recognized market indexes or ratings group indexes, and/or as defined by Fund management. This definition may not apply for purposes of this report, which may combine industry sub-classifications for reporting ease. Industries are shown as a percent of net assets.
See Notes to Financial Statements.
135 | October 31, 2016
RiverFront Moderate Growth & Income Fund
| Statement of Investments | October 31, 2016 |
| | | Shares | | | Value (Note 2) | |
| COMMON STOCKS (1.61%) | | | | | | |
| Communications (0.58%) | | | | | | |
| Telecommunications (0.58%) | | | | | | |
| AT&T, Inc. | | | 20,243 | | | $ | 744,740 | |
| | | | | | | | | |
| TOTAL COMMUNICATIONS | | | | | | | 744,740 | |
| | | | | | | | | |
| Consumer, Non‐Cyclical (0.51%) | | | | | | | | |
| Beverages (0.51%) | | | | | | | | |
| PepsiCo, Inc. | | | 6,177 | | | | 662,174 | |
| | | | | | | | | |
| TOTAL CONSUMER, NON‐CYCLICAL | | | 662,174 | |
| | �� | | | | | | | |
| Technology (0.52%) | | | | | | | | |
| Software (0.52%) | | | | | | | | |
| Paychex, Inc. | | | 12,107 | | | | 668,307 | |
| | | | | | | | | |
| TOTAL TECHNOLOGY | | 668,307 | |
| | | | | | | | | |
TOTAL COMMON STOCKS
(Cost $1,973,334) | | 2,075,221 | |
| | | | | | | | | |
| EXCHANGE TRADED FUNDS (91.44%) | | | |
| Debt (40.76%) | | | | | | | | |
| PIMCO 0‐5 Year High Yield Corporate Bond Index ETF | | | 67,046 | | | | 6,600,679 | |
| PIMCO Investment Grade Corporate Bond Index ETF | | | 60,380 | | | | 6,370,090 | |
RiverFront Strategic Income Fund(a) | | | 336,873 | | | | 8,472,356 | |
SPDR® Bloomberg Barclays Short Term High Yield Bond ETF | | | 240,494 | | | | 6,608,775 | |
Vanguard® Intermediate‐Term Corporate Bond ETF | | | 182,228 | | | | 16,138,112 | |
Vanguard® Short‐Term Corporate Bond ETF | | | 105,529 | | | | 8,476,089 | |
| | | | | | | | 52,666,101 | |
| | | | | | | | | |
| Equity (50.68%) | | | | | | | | |
Consumer Staples Select Sector SPDR® Fund | | | 31,112 | | | | 1,642,714 | |
First Trust Utilities AlphaDEX® Fund | | | 77,677 | | | | 2,034,368 | |
FlexShares® Quality Dividend Index Fund | | | 206,632 | | | | 7,672,246 | |
| Global X MSCI Norway ETF | | | 74,168 | | | | 820,120 | |
Goldman Sachs ActiveBeta® U.S. Large Cap Equity ETF | | | 109,479 | | | | 4,668,184 | |
iShares® Core MSCI Emerging Markets ETF | | | 88,442 | | | | 3,992,272 | |
iShares® Core S&P 500® ETF | | | 17,916 | | | | 3,828,470 | |
| | | Shares | | | Value (Note 2) | |
| Equity (continued) | | | | | | |
iShares® Core S&P® SmallCap ETF | | | 26,833 | | | $ | 3,184,272 | |
iShares® International Select Dividend ETF | | | 41,869 | | | | 1,218,388 | |
iShares® MSCI Australia ETF | | | 62,977 | | | | 1,277,173 | |
iShares® MSCI EAFE Growth ETF | | | 36,375 | | | | 2,376,015 | |
iShares® Nasdaq Biotechnology ETF | | | 4,551 | | | | 1,168,151 | |
iShares® U.S. Healthcare Providers ETF | | | 12,996 | | | | 1,523,651 | |
PowerShares® Aerospace & Defense Portfolio | | | 29,050 | | | | 1,116,142 | |
PowerShares® Europe Currency Hedged Low Volatility Portfolio | | | 139,705 | | | | 3,319,391 | |
PowerShares® KBW Regional Banking Portfolio | | | 33,945 | | | | 1,500,708 | |
Powershares® QQQ Trust Series 1 | | | 30,211 | | | | 3,534,385 | |
PowerShares® S&P 500® Ex‐Rate Sensitive Low Volatility Portfolio | | | 87,305 | | | | 2,334,536 | |
| Schwab U.S. REIT ETF™ | | | 27,036 | | | | 1,088,199 | |
SPDR® Morgan Stanley Technology ETF | | | 93,949 | | | | 5,633,191 | |
SPDR® S&P® Capital Markets ETF | | | 23,736 | | | | 932,113 | |
SPDR® S&P® Transportation ETF | | | 18,145 | | | | 860,980 | |
WisdomTree® Europe Hedged Equity Fund | | | 25,880 | | | | 1,405,802 | |
WisdomTree® International Hedged Quality Dividend Growth Fund | | | 49,897 | | | | 1,280,357 | |
WisdomTree® LargeCap Dividend Fund | | | 46,025 | | | | 3,471,666 | |
WisdomTree® LargeCap Value Fund | | | 57,678 | | | | 3,610,649 | |
| | | | | | | | 65,494,143 | |
| | | | | | | | | |
TOTAL EXCHANGE TRADED FUNDS
(Cost $113,151,656) | | 118,160,244 | |
| | | | | | | | | |
| EXCHANGE TRADED NOTES (2.92%) | | | |
| Equity (2.92%) | | | | | | | | |
| ETRACS Alerian MLP Infrastructure Index ETN | | | 141,278 | | | | 3,774,948 | |
| | | | | | | | | |
TOTAL EXCHANGE TRADED NOTES
(Cost $2,992,268) | | 3,774,948 | |
136 | October 31, 2016
RiverFront Moderate Growth & Income Fund
| Statement of Investments | October 31, 2016 |
| | | 7-Day Yield | | | Shares | | | Value (Note 2) | |
| SHORT TERM INVESTMENTS (4.34%) |
| Money Market Fund (4.34%) |
| State Street Institutional Treasury Plus Money Market Fund | | | 0.220 | % | | | 5,608,307 | | | $ | 5,608,307 | |
| | | | | | | | | | | | | |
TOTAL SHORT TERM INVESTMENTS
(Cost $5,608,307) | | 5,608,307 | |
| | | | | | | | | | | | | |
TOTAL INVESTMENTS (100.31%)
(Cost $123,725,565) | $ | 129,618,720 | |
| | | | | | | | | | | | | |
| Liabilities In Excess Of Other Assets (‐0.31%) | | (403,219 | ) |
| | | | | | | | | | | | | |
| NET ASSETS (100.00%) | $ | 129,215,501 | |
(a) | Affiliated Company. See Note 7 in Notes to Financial Statements. |
For Fund compliance purposes, the Fund's industry classifications refer to any one or more of the industry sub-classifications used by one or more widely recognized market indexes or ratings group indexes, and/or as defined by Fund management. This definition may not apply for purposes of this report, which may combine industry sub-classifications for reporting ease. Industries are shown as a percent of net assets.
See Notes to Financial Statements.
137 | October 31, 2016
RiverFront Global Allocation Series
| Statements of Assets and Liabilities | October 31, 2016 |
| | | RiverFront Conservative Income Builder Fund | | | RiverFront Dynamic Equity Income Fund | | | RiverFront Global Allocation Fund | | | RiverFront Global Growth Fund | | | RiverFront Moderate Growth & Income Fund | |
| ASSETS | | | | | | | | | | | | | | | |
| Investments, at value | | $ | 13,881,819 | | | $ | 78,094,778 | | | $ | 34,754,754 | | | $ | 58,480,150 | | | $ | 121,146,364 | |
| Investments in affiliates, at value | | | 977,254 | | | | 3,254,611 | | | | 718,284 | | | | – | | | | 8,472,356 | |
| Receivable for shares sold | | | – | | | | 78,016 | | | | 18,358 | | | | 1,658 | | | | 31,525 | |
| Dividends and interest receivable | | | 347 | | | | 10,987 | | | | 4,671 | | | | 7,596 | | | | 19,224 | |
| Receivable due from advisor | | | 4,938 | | | | – | | | | – | | | | – | | | | – | |
| Prepaid expenses and other assets | | | 21,402 | | | | 18,233 | | | | 15,981 | | | | 29,107 | | | | 18,262 | |
| Total Assets | | | 14,885,760 | | | | 81,456,625 | | | | 35,512,048 | | | | 58,518,511 | | | | 129,687,731 | |
| LIABILITIES | | | | | | | | | | | | | | | | | | | | |
| Payable for shares redeemed | | | – | | | | 73,797 | | | | 58,742 | | | | 17,855 | | | | 292,610 | |
| Investment advisory fees payable | | | – | | | | 34,240 | | | | 7,171 | | | | 26,333 | | | | 69,588 | |
| Administration and transfer agency fees payable | | | 2,295 | | | | 9,511 | | | | 4,895 | | | | 7,281 | | | | 14,565 | |
| Distribution and services fees payable | | | 10,057 | | | | 32,435 | | | | 14,191 | | | | 13,285 | | | | 60,200 | |
| Professional fees payable | | | 20,246 | | | | 21,074 | | | | 20,593 | | | | 20,977 | | | | 21,816 | |
| Custody fees payable | | | 863 | | | | 1,968 | | | | 1,545 | | | | 2,600 | | | | 2,652 | |
| Printing fees payable | | | 653 | | | | 4,678 | | | | 2,420 | | | | 3,988 | | | | 7,464 | |
| Accrued expenses and other liabilities | | | 915 | | | | 2,430 | | | | 1,445 | | | | 1,646 | | | | 3,335 | |
| Total Liabilities | | | 35,029 | | | | 180,133 | | | | 111,002 | | | | 93,965 | | | | 472,230 | |
| NET ASSETS | | $ | 14,850,731 | | | $ | 81,276,492 | | | $ | 35,401,046 | | | $ | 58,424,546 | | | $ | 129,215,501 | |
| NET ASSETS CONSIST OF | | | | | | | | | | | | | | | | | | | | |
| Paid‐in capital | | $ | 14,641,862 | | | $ | 79,087,075 | | | $ | 34,746,360 | | | $ | 55,779,969 | | | $ | 125,995,792 | |
| Accumulated net investment income | | | 18,735 | | | | 63,827 | | | | 320,711 | | | | 514,126 | | | | 192,803 | |
| Accumulated net realized loss | | | (287,414 | ) | | | (2,408,113 | ) | | | (1,591,025 | ) | | | (1,232,097 | ) | | | (2,866,249 | ) |
| Net unrealized appreciation | | | 477,548 | | | | 4,533,703 | | | | 1,925,000 | | | | 3,362,548 | | | | 5,893,155 | |
| NET ASSETS | | $ | 14,850,731 | | | $ | 81,276,492 | | | $ | 35,401,046 | | | $ | 58,424,546 | | | $ | 129,215,501 | |
| INVESTMENTS, AT COST | | $ | 13,433,693 | | | $ | 73,687,224 | | | $ | 32,856,315 | | | $ | 55,117,602 | | | $ | 115,478,506 | |
| INVESTMENTS IN AFFILIATES, AT COST | | $ | 947,832 | | | $ | 3,128,462 | | | $ | 691,723 | | | $ | – | | | $ | 8,247,059 | |
See Notes to Financial Statements.
138 | October 31, 2016
RiverFront Global Allocation Series
| Statements of Assets and Liabilities (continued) | October 31, 2016 |
| | | RiverFront Conservative Income Builder Fund | | | RiverFront Dynamic Equity Income Fund | | | RiverFront Global Allocation Fund | | | RiverFront Global Growth Fund | | | RiverFront Moderate Growth & Income Fund | |
| | | | | | | | | | | | | | | | |
| PRICING OF SHARES | | | | | | | | | | | | | | | |
| Class A: | | | | | | | | | | | | | | | |
| Net Asset Value, offering and redemption price per share | | $ | 10.53 | | | $ | 12.38 | | | $ | 11.91 | | | $ | 13.54 | | | $ | 11.22 | |
| Net Assets | | $ | 1,036,880 | | | $ | 20,226,530 | | | $ | 6,467,210 | | | $ | 9,618,217 | | | $ | 22,679,308 | |
| Shares of beneficial interest outstanding (unlimited number of shares, no par value common stock authorized) | | | 98,433 | | | | 1,634,422 | | | | 543,040 | | | | 710,372 | | | | 2,022,079 | |
| Maximum offering price per share ((NAV/0.9450), based on maximum sales charge of 5.50% of the offering price) | | $ | 11.14 | | | $ | 13.10 | | | $ | 12.60 | | | $ | 14.33 | | | $ | 11.87 | |
| Class C: | | | | | | | | | | | | | | | | | | | | |
Net Asset Value, offering and redemption price per share(a) | | $ | 10.44 | | | $ | 12.15 | | | $ | 11.62 | | | $ | 13.18 | | | $ | 11.12 | |
| Net Assets | | $ | 11,549,949 | | | $ | 32,216,981 | | | $ | 14,693,695 | | | $ | 11,446,864 | | | $ | 63,479,986 | |
| Shares of beneficial interest outstanding (unlimited number of shares, no par value common stock authorized) | | | 1,106,693 | | | | 2,651,314 | | | | 1,264,076 | | | | 868,253 | | | | 5,706,082 | |
| Class I: | | | | | | | | | | | | | | | | | | | | |
| Net Asset Value, offering and redemption price per share | | $ | 10.36 | | | $ | 12.31 | | | $ | 11.73 | | | $ | 13.65 | | | $ | 11.21 | |
| Net Assets | | $ | 2,263,902 | | | $ | 28,832,981 | | | $ | 14,240,141 | | | $ | 10,140,047 | | | $ | 43,056,207 | |
| Shares of beneficial interest outstanding (unlimited number of shares, no par value common stock authorized) | | | 218,444 | | | | 2,341,836 | | | | 1,213,912 | | | | 742,837 | | | | 3,839,291 | |
| Class L: | | | | | | | | | | | | | | | | | | | | |
| Net Asset Value, offering and redemption price per share | | | N/A | | | | N/A | | | | N/A | | | $ | 13.63 | | | | N/A | |
| Net Assets | | | N/A | | | | N/A | | | | N/A | | | $ | 22,552,446 | | | | N/A | |
| Shares of beneficial interest outstanding (unlimited number of shares, no par value common stock authorized) | | | N/A | | | | N/A | | | | N/A | | | | 1,654,594 | | | | N/A | |
| Investor Class: | | | | | | | | | | | | | | | | | | | | |
| Net Asset Value, offering and redemption price per share | | | N/A | | | | N/A | | | | N/A | | | $ | 13.47 | | | | N/A | |
| Net Assets | | | N/A | | | | N/A | | | | N/A | | | $ | 4,666,972 | | | | N/A | |
| Shares of beneficial interest outstanding (unlimited number of shares, no par value common stock authorized) | | | N/A | | | | N/A | | | | N/A | | | | 346,568 | | | | N/A | |
(a) | Redemption price per share may be reduced for any applicable contingent deferred sales charge. For a description of a possible sales charge, please see the Fund's Prospectus. |
See Notes to Financial Statements.
139 | October 31, 2016
RiverFront Global Allocation Series
| Statements of Operations | For the Year Ended October 31, 2016 |
| | | RiverFront Conservative Income Builder Fund | | | RiverFront Dynamic Equity Income Fund | | | RiverFront Global Allocation Fund | | | RiverFront Global Growth Fund | | | RiverFront Moderate Growth & Income Fund | |
| INVESTMENT INCOME | | | | | | | | | | | | | | | |
| Dividends | | $ | 342,867 | | | $ | 2,235,759 | | | $ | 1,114,355 | | | $ | 1,991,408 | | | $ | 3,783,492 | |
| Dividends from affiliated securities | | | 46,188 | | | | 187,495 | | | | 40,718 | | | | – | | | | 472,483 | |
| Total Investment Income | | | 389,055 | | | | 2,423,254 | | | | 1,155,073 | | | | 1,991,408 | | | | 4,255,975 | |
| | | | | | | | | | | | | | | | | | | | | |
| EXPENSES | | | | | | | | | | | | | | | | | | | | |
| Investment advisory fees | | | 117,332 | | | | 698,230 | | | | 343,164 | | | | 593,010 | | | | 1,188,566 | |
| Administrative fees | | | 15,671 | | | | 85,358 | | | | 42,853 | | | | 72,696 | | | | 144,073 | |
| Transfer agency fees | | | 1,206 | | | | 6,399 | | | | 4,109 | | | | 4,470 | | | | 9,253 | |
| Distribution and service fees | | | | | | | | | | | | | | | | | | | | |
| Class A | | | 2,784 | | | | 53,865 | | | | 18,055 | | | | 37,317 | | | | 59,678 | |
| Class C | | | 105,411 | | | | 343,799 | | | | 159,893 | | | | 123,169 | | | | 687,323 | |
| Investor Class | | | – | | | | – | | | | – | | | | 14,465 | | | | – | |
| Professional fees | | | 22,505 | | | | 27,394 | | | | 24,581 | | | | 26,866 | | | | 31,752 | |
| Reports to shareholders and printing fees | | | 2,739 | | | | 12,701 | | | | 7,566 | | | | 12,128 | | | | 21,227 | |
| State registration fees | | | 49,085 | | | | 54,472 | | | | 48,240 | | | | 76,415 | | | | 54,129 | |
| Insurance fees | | | 103 | | | | 736 | | | | 413 | | | | 774 | | | | 1,380 | |
| Custody fees | | | 3,330 | | | | 5,107 | | | | 3,219 | | | | 5,778 | | | | 7,117 | |
| Trustees' fees and expenses | | | 374 | | | | 2,265 | | | | 1,139 | | | | 1,969 | | | | 3,895 | |
| Miscellaneous expenses | | | 8,929 | | | | 13,401 | | | | 10,224 | | | | 10,969 | | | | 15,215 | |
| Total Expenses | | | 329,469 | | | | 1,303,727 | | | | 663,456 | | | | 980,026 | | | | 2,223,608 | |
| Less fees waived/reimbursed by investment advisor (Note 8) | | | | | | | | | | | | | | | | | | | | |
| Class A | | | (7,737 | ) | | | (43,635 | ) | | | (21,853 | ) | | | (37,417 | ) | | | (37,280 | ) |
| Class C | | | (74,216 | ) | | | (69,414 | ) | | | (48,666 | ) | | | (31,550 | ) | | | (107,193 | ) |
| Class I | | | (15,087 | ) | | | (53,711 | ) | | | (51,640 | ) | | | (32,793 | ) | | | (73,653 | ) |
| Class L | | | – | | | | – | | | | – | | | | (60,762 | ) | | | – | |
| Investor Class | | | – | | | | – | | | | – | | | | (14,660 | ) | | | – | |
| Net Expenses | | | 232,429 | | | | 1,136,967 | | | | 541,297 | | | | 802,844 | | | | 2,005,482 | |
| Net Investment Income | | | 156,626 | | | | 1,286,287 | | | | 613,776 | | | | 1,188,564 | | | | 2,250,493 | |
| Net realized loss on investments | | | (233,602 | ) | | | (2,670,087 | ) | | | (1,825,402 | ) | | | (1,815,279 | ) | | | (3,062,705 | ) |
| Net realized loss on investments ‐ affiliated securities | | | (18,240 | ) | | | (123,814 | ) | | | (10,349 | ) | | | – | | | | (261,169 | ) |
| Net realized gain distributions from other investment companies | | | 14,171 | | | | 425,575 | | | | 250,884 | | | | 611,067 | | | | 468,489 | |
| Net realized loss | | | (237,671 | ) | | | (2,368,326 | ) | | | (1,584,867 | ) | | | (1,204,212 | ) | | | (2,855,385 | ) |
| Net change in unrealized appreciation/(depreciation) on investments | | | 386,699 | | | | 2,635,236 | | | | 469,761 | | | | (790,043 | ) | | | 2,857,457 | |
| NET REALIZED AND UNREALIZED GAIN/(LOSS) ON INVESTMENTS | | | 149,028 | | | | 266,910 | | | | (1,115,106 | ) | | | (1,994,255 | ) | | | 2,072 | |
| NET INCREASE/(DECREASE) IN NET ASSETS RESULTING FROM OPERATIONS | | $ | 305,654 | | | $ | 1,553,197 | | | $ | (501,330 | ) | | $ | (805,691 | ) | | $ | 2,252,565 | |
See Notes to Financial Statements.
140 | October 31, 2016
RiverFront Conservative Income Builder Fund
Statements of Changes in Net Assets
| | | For the Year Ended October 31, 2016 | | | For the Year Ended October 31, 2015 | |
| OPERATIONS | | | | | | |
| Net investment income | | $ | 156,626 | | | $ | 108,661 | |
| Net realized loss | | | (233,602 | ) | | | (49,727 | ) |
| Net realized loss on investments‐ affiliated securities | | | (18,240 | ) | | | (7,360 | ) |
| Net realized gain distributions from other investment companies | | | 14,171 | | | | 42,226 | |
| Net change in unrealized appreciation/(depreciation) | | | 386,699 | | | | (58,335 | ) |
| Net Increase in Net Assets Resulting from Operations | | | 305,654 | | | | 35,465 | |
| DISTRIBUTIONS | | | | | | | | |
| Dividends to shareholders from net investment income | | | | | | | | |
| Class A | | | (17,509 | ) | | | (18,043 | ) |
| Class C | | | (89,502 | ) | | | (50,246 | ) |
| Class I | | | (38,954 | ) | | | (34,644 | ) |
| Dividends to shareholders from net realized gains | | | | | | | | |
| Class A | | | (2,507 | ) | | | (33,682 | ) |
| Class C | | | (22,903 | ) | | | (128,451 | ) |
| Class I | | | (4,731 | ) | | | (53,269 | ) |
| Net Decrease in Net Assets from Distributions | | | (176,106 | ) | | | (318,335 | ) |
| BENEFICIAL INTEREST TRANSACTIONS (NOTE 6) | | | | | | | | |
| Shares sold | | | | | | | | |
| Class A | | | 420,705 | | | | 724,894 | |
| Class C | | | 4,689,259 | | | | 5,025,196 | |
| Class I | | | 924,264 | | | | 1,756,806 | |
| Dividends reinvested | | | | | | | | |
| Class A | | | 15,336 | | | | 23,644 | |
| Class C | | | 88,919 | | | | 152,720 | |
| Class I | | | 39,098 | | | | 77,128 | |
| Shares redeemed | | | | | | | | |
| Class A | | | (449,844 | ) | | | (750,894 | ) |
| Class C | | | (1,941,132 | ) | | | (1,445,157 | ) |
| Class I | | | (885,514 | ) | | | (2,401,248 | ) |
| Net Increase in Net Assets Derived from Beneficial Interest Transactions | | | 2,901,091 | | | | 3,163,089 | |
| Net increase in net assets | | | 3,030,639 | | | | 2,880,219 | |
| NET ASSETS | | | | | | | | |
| Beginning of year | | | 11,820,092 | | | | 8,939,873 | |
| End of year * | | $ | 14,850,731 | | | $ | 11,820,092 | |
| *Including accumulated net investment income of: | | $ | 18,735 | | | $ | 7,336 | |
See Notes to Financial Statements.
141 | October 31, 2016
RiverFront Dynamic Equity Income Fund
Statements of Changes in Net Assets
| | | For the Year Ended October 31, 2016 | | | For the Year Ended October 31, 2015 | |
| OPERATIONS | | | | | | |
| Net investment income | | $ | 1,286,287 | | | $ | 1,229,120 | |
| Net realized gain/(loss) | | | (2,670,087 | ) | | | 1,166,295 | |
| Net realized loss on investments‐ affiliated securities | | | (123,814 | ) | | | (30,319 | ) |
| Net realized gain distributions from other investment companies | | | 425,575 | | | | 506,364 | |
| Net change in unrealized appreciation/(depreciation) | | | 2,635,236 | | | | (2,136,654 | ) |
| Net Increase in Net Assets Resulting from Operations | | | 1,553,197 | | | | 734,806 | |
| DISTRIBUTIONS | | | | | | | | |
| Dividends to shareholders from net investment income | | | | | | | | |
| Class A | | | (363,076 | ) | | | (311,063 | ) |
| Class C | | | (435,892 | ) | | | (447,108 | ) |
| Class I | | | (522,969 | ) | | | (392,630 | ) |
| Dividends to shareholders from net realized gains | | | | | | | | |
| Class A | | | (404,558 | ) | | | (621,663 | ) |
| Class C | | | (716,376 | ) | | | (1,102,933 | ) |
| Class I | | | (508,283 | ) | | | (746,196 | ) |
| Net Decrease in Net Assets from Distributions | | | (2,951,154 | ) | | | (3,621,593 | ) |
| BENEFICIAL INTEREST TRANSACTIONS (NOTE 6) | | | | | | | | |
| Shares sold | | | | | | | | |
| Class A | | | 6,764,353 | | | | 6,311,410 | |
| Class C | | | 6,073,884 | | | | 11,151,002 | |
| Class I | | | 12,082,276 | | | | 8,108,354 | |
| Dividends reinvested | | | | | | | | |
| Class A | | | 733,284 | | | | 877,483 | |
| Class C | | | 1,063,615 | | | | 1,445,580 | |
| Class I | | | 898,243 | | | | 1,008,028 | |
| Shares redeemed | | | | | | | | |
| Class A | | | (6,714,335 | ) | | | (3,907,536 | ) |
| Class C | | | (8,957,633 | ) | | | (6,667,665 | ) |
| Class I | | | (6,584,758 | ) | | | (6,565,889 | ) |
| Net Increase in Net Assets Derived from Beneficial Interest Transactions | | | 5,358,929 | | | | 11,760,767 | |
| Net increase in net assets | | | 3,960,972 | | | | 8,873,980 | |
| NET ASSETS | | | | | | | | |
| Beginning of year | | | 77,315,520 | | | | 68,441,540 | |
| End of year * | | $ | 81,276,492 | | | $ | 77,315,520 | |
| *Including accumulated net investment income of: | | $ | 63,827 | | | $ | 92,674 | |
See Notes to Financial Statements.
142 | October 31, 2016
RiverFront Global Allocation Fund
Statements of Changes in Net Assets
| | | For the Year Ended October 31, 2016 | | | For the Year Ended October 31, 2015 | |
| OPERATIONS | | | | | | |
| Net investment income | | $ | 613,776 | | | $ | 575,330 | |
| Net realized loss | | | (1,825,402 | ) | | | (79,726 | ) |
| Net realized loss on investments‐ affiliated securities | | | (10,349 | ) | | | (33,482 | ) |
| Net realized gain distributions from other investment companies | | | 250,884 | | | | 277,874 | |
| Net change in unrealized appreciation/(depreciation) | | | 469,761 | | | | (750,472 | ) |
| Net Decrease in Net Assets Resulting from Operations | | | (501,330 | ) | | | (10,476 | ) |
| DISTRIBUTIONS | | | | | | | | |
| Dividends to shareholders from net investment income | | | | | | | | |
| Class A | | | (91,282 | ) | | | (135,563 | ) |
| Class C | | | (177,794 | ) | | | (171,705 | ) |
| Class I | | | (226,575 | ) | | | (234,337 | ) |
| Dividends to shareholders from net realized gains | | | | | | | | |
| Class A | | | (29,356 | ) | | | (560,595 | ) |
| Class C | | | (64,014 | ) | | | (1,028,926 | ) |
| Class I | | | (70,328 | ) | | | (892,615 | ) |
| Net Decrease in Net Assets from Distributions | | | (659,349 | ) | | | (3,023,741 | ) |
| BENEFICIAL INTEREST TRANSACTIONS (NOTE 6) | | | | | | | | |
| Shares sold | | | | | | | | |
| Class A | | | 790,391 | | | | 2,396,224 | |
| Class C | | | 1,972,956 | | | | 5,539,210 | |
| Class I | | | 3,069,742 | | | | 9,024,905 | |
| Dividends reinvested | | | | | | | | |
| Class A | | | 115,782 | | | | 673,030 | |
| Class C | | | 227,935 | | | | 1,146,839 | |
| Class I | | | 291,586 | | | | 1,105,082 | |
| Shares redeemed | | | | | | | | |
| Class A | | | (2,671,573 | ) | | | (2,319,283 | ) |
| Class C | | | (4,064,780 | ) | | | (3,108,530 | ) |
| Class I | | | (7,454,283 | ) | | | (3,164,067 | ) |
| Net Increase/(Decrease) in Net Assets Derived from Beneficial Interest Transactions | | | (7,722,244 | ) | | | 11,293,410 | |
| Net increase/(decrease) in net assets | | | (8,882,923 | ) | | | 8,259,193 | |
| NET ASSETS | | | | | | | | |
| Beginning of year | | | 44,283,969 | | | | 36,024,776 | |
| End of year * | | $ | 35,401,046 | | | $ | 44,283,969 | |
| *Including accumulated net investment income of: | | $ | 320,711 | | | $ | 200,285 | |
See Notes to Financial Statements.
143 | October 31, 2016
RiverFront Global Growth Fund
Statements of Changes in Net Assets
| | | For the Year Ended October 31, 2016 | | | For the Year Ended October 31, 2015 | |
| OPERATIONS | | | | | | |
| Net investment income | | $ | 1,188,564 | | | $ | 1,290,107 | |
| Net realized gain/(loss) | | | (1,815,279 | ) | | | 109,174 | |
| Net realized gain distributions from other investment companies | | | 611,067 | | | | 640,999 | |
| Net change in unrealized depreciation | | | (790,043 | ) | | | (1,412,507 | ) |
| Net Increase/(Decrease) in Net Assets Resulting from Operations | | | (805,691 | ) | | | 627,773 | |
| DISTRIBUTIONS | | | | | | | | |
| Dividends to shareholders from net investment income | | | | | | | | |
| Class A | | | (262,359 | ) | | | (284,353 | ) |
| Class C | | | (176,912 | ) | | | (141,119 | ) |
| Class I | | | (232,251 | ) | | | (243,129 | ) |
| Class L | | | (374,673 | ) | | | (453,248 | ) |
| Investor Class | | | (97,169 | ) | | | (133,236 | ) |
| Dividends to shareholders from net realized gains | | | | | | | | |
| Class A | | | (169,282 | ) | | | (1,555,258 | ) |
| Class C | | | (124,670 | ) | | | (1,077,170 | ) |
| Class I | | | (145,504 | ) | | | (1,217,027 | ) |
| Class L | | | (234,855 | ) | | | (2,207,236 | ) |
| Investor Class | | | (62,700 | ) | | | (716,298 | ) |
| Net Decrease in Net Assets from Distributions | | | (1,880,375 | ) | | | (8,028,074 | ) |
| BENEFICIAL INTEREST TRANSACTIONS (NOTE 6) | | | | | | | | |
| Shares sold | | | | | | | | |
| Class A | | | 2,821,511 | | | | 6,592,837 | |
| Class C | | | 1,881,292 | | | | 4,246,346 | |
| Class I | | | 2,341,286 | | | | 7,804,363 | |
| Class L | | | 2,416,186 | | | | 5,499,526 | |
| Investor Class | | | 32,290 | | | | 265,259 | |
| Dividends reinvested | | | | | | | | |
| Class A | | | 422,479 | | | | 1,781,624 | |
| Class C | | | 286,641 | | | | 1,189,292 | |
| Class I | | | 361,066 | | | | 1,360,312 | |
| Class L | | | 600,974 | | | | 2,618,006 | |
| Investor Class | | | 139,454 | | | | 762,580 | |
| Shares redeemed | | | | | | | | |
| Class A | | | (11,263,708 | ) | | | (5,222,204 | ) |
| Class C | | | (3,147,775 | ) | | | (2,728,617 | ) |
| Class I | | | (8,405,283 | ) | | | (4,622,386 | ) |
| Class L | | | (5,853,893 | ) | | | (3,969,239 | ) |
| Investor Class | | | (2,182,792 | ) | | | (1,134,904 | ) |
| Net Increase/(Decrease) in Net Assets Derived from Beneficial Interest Transactions | | | (19,550,272 | ) | | | 14,442,795 | |
| Net increase/(decrease) in net assets | | | (22,236,338 | ) | | | 7,042,494 | |
| NET ASSETS | | | | | | | | |
| Beginning of year | | | 80,660,884 | | | | 73,618,390 | |
| End of year * | | $ | 58,424,546 | | | $ | 80,660,884 | |
| *Including accumulated net investment income of: | | $ | 514,126 | | | $ | 463,691 | |
See Notes to Financial Statements.
144 | October 31, 2016
RiverFront Moderate Growth & Income Fund
Statements of Changes in Net Assets
| | | For the Year Ended October 31, 2016 | | | For the Year Ended October 31, 2015 | |
| OPERATIONS | | | | | | |
| Net investment income | | $ | 2,250,493 | | | $ | 2,288,918 | |
| Net realized gain/(loss) | | | (3,062,705 | ) | | | 2,496,740 | |
| Net realized loss on investments‐ affiliated securities | | | (261,169 | ) | | | (38,996 | ) |
| Net realized gain distributions from other investment companies | | | 468,489 | | | | 678,016 | |
| Net change in unrealized appreciation/(depreciation) | | | 2,857,457 | | | | (4,017,171 | ) |
| Net Increase in Net Assets Resulting from Operations | | | 2,252,565 | | | | 1,407,507 | |
| DISTRIBUTIONS | | | | | | | | |
| Dividends to shareholders from net investment income | | | | | | | | |
| Class A | | | (441,450 | ) | | | (463,745 | ) |
| Class C | | | (831,009 | ) | | | (831,484 | ) |
| Class I | | | (1,002,825 | ) | | | (836,519 | ) |
| Dividends to shareholders from net realized gains | | | | | | | | |
| Class A | | | (503,888 | ) | | | (1,452,046 | ) |
| Class C | | | (1,550,040 | ) | | | (3,504,594 | ) |
| Class I | | | (1,081,829 | ) | | | (2,361,505 | ) |
| Net Decrease in Net Assets from Distributions | | | (5,411,041 | ) | | | (9,449,893 | ) |
| BENEFICIAL INTEREST TRANSACTIONS (NOTE 6) | | | | | | | | |
| Shares sold | | | | | | | | |
| Class A | | | 4,421,568 | | | | 4,319,229 | |
| Class C | | | 10,166,181 | | | | 17,073,579 | |
| Class I | | | 17,234,510 | | | | 14,370,768 | |
| Dividends reinvested | | | | | | | | |
| Class A | | | 827,954 | | | | 1,734,135 | |
| Class C | | | 2,077,127 | | | | 3,832,260 | |
| Class I | | | 1,889,684 | | | | 2,896,869 | |
| Shares redeemed | | | | | | | | |
| Class A | | | (6,554,572 | ) | | | (7,673,351 | ) |
| Class C | | | (17,958,734 | ) | | | (12,583,566 | ) |
| Class I | | | (21,252,975 | ) | | | (10,528,810 | ) |
| Net Increase/(Decrease) in Net Assets Derived from Beneficial Interest Transactions | | | (9,149,257 | ) | | | 13,441,113 | |
| Net increase/(decrease) in net assets | | | (12,307,733 | ) | | | 5,398,727 | |
| NET ASSETS | | | | | | | | |
| Beginning of year | | | 141,523,234 | | | | 136,124,507 | |
| End of year * | | $ | 129,215,501 | | | $ | 141,523,234 | |
| *Including accumulated net investment income of: | | $ | 192,803 | | | $ | 206,858 | |
See Notes to Financial Statements.
145 | October 31, 2016
RiverFront Conservative Income Builder Fund – Class A
Financial Highlights
Selected data for a share of beneficial interest outstanding throughout the periods indicated:
| | | For the Year Ended October 31, 2016 | | | For the Year Ended October 31, 2015 | | | For the Fiscal Period Ended October 31, 2014 (a) | | | For the Year Ended April 30, 2014 | | | For the Period September 4, 2012 (Commencement) to April 30, 2013 | |
| Net asset value, beginning of period | | $ | 10.46 | | | $ | 10.86 | | | $ | 10.83 | | | $ | 10.48 | | | $ | 10.00 | |
| | | | | | | | | | | | | | | | | | | | | |
| INCOME FROM INVESTMENT OPERATIONS: |
Net investment income(b) | | | 0.18 | | | | 0.18 | | | | 0.07 | | | | 0.13 | | | | 0.09 | |
| Net realized and unrealized gain/(loss) | | | 0.07 | | | | (0.14 | ) | | | 0.04 | | | | 0.53 | | | | 0.48 | |
| Total from investment operations | | | 0.25 | | | | 0.04 | | | | 0.11 | | | | 0.66 | | | | 0.57 | |
| | | | | | | | | | | | | | | | | | | | | |
| DISTRIBUTIONS: | | | | | | | | | | | | | | | | | | | | |
| From net investment income | | | (0.16 | ) | | | (0.15 | ) | | | (0.08 | ) | | | (0.12 | ) | | | (0.09 | ) |
| From net realized gains | | | (0.02 | ) | | | (0.29 | ) | | | – | | | | (0.19 | ) | | | – | |
| Total distributions | | | (0.18 | ) | | | (0.44 | ) | | | (0.08 | ) | | | (0.31 | ) | | | (0.09 | ) |
| | | | | | | | | | | | | | | | | | | | | |
| Net increase/(decrease) in net asset value | | | 0.07 | | | | (0.40 | ) | | | 0.03 | | | | 0.35 | | | | 0.48 | |
| Net asset value, end of year | | $ | 10.53 | | | $ | 10.46 | | | $ | 10.86 | | | $ | 10.83 | | | $ | 10.48 | |
TOTAL RETURN(c) | | | 2.47 | % | | | 0.40 | % | | | 0.98 | % | | | 6.35 | % | | | 5.72 | % |
| | | | | | | | | | | | | | | | | | | | | |
| RATIOS/SUPPLEMENTAL DATA: | |
| Net assets, end of year (000s) | | $ | 1,037 | | | $ | 1,038 | | | $ | 1,089 | | | $ | 1,101 | | | $ | 607 | |
| Ratio of expenses to average net assets excluding fee waivers and reimbursements | | | 1.84 | % | | | 2.06 | % | | | 2.39 | %(d) | | | 2.94 | % | | | 5.65 | %(d)(e) |
| Ratio of expenses to average net assets including fee waivers and reimbursements | | | 1.15 | % | | | 1.15 | % | | | 1.15 | %(d) | | | 1.15 | % | | | 1.15 | %(d)(e) |
| Ratio of net investment income to average net assets | | | 1.68 | % | | | 1.74 | % | | | 1.22 | %(d) | | | 1.27 | % | | | 1.37 | %(d)(e) |
Portfolio turnover rate(f) | | | 137 | % | | | 186 | % | | | 34 | % | | | 125 | % | | | 73 | % |
(a) | Effective May 1, 2014, the Board approved changing the fiscal year-end of the Funds from April 30 to October 31. |
(b) | Calculated using the average shares method. |
(c) | Total returns are for the period indicated and have not been annualized. Total returns would have been lower had certain expenses not been waived during the period. Returns shown do not reflect the deduction of taxes that a shareholder would pay on Fund distributions or the redemption of Fund shares. Returns shown exclude any applicable sales charges. |
(e) | Expense ratios before reductions for startup periods may not be representative of longer term operating periods. |
(f) | Portfolio turnover rate for periods less than one full year have not been annualized. |
See Notes to Financial Statements.
146 | October 31, 2016
RiverFront Conservative Income Builder Fund – Class C
Financial Highlights
Selected data for a share of beneficial interest outstanding throughout the periods indicated:
| | | For the Year Ended October 31, 2016 | | | For the Year Ended October 31, 2015 | | | For the Fiscal Period Ended October 31, 2014 (a) | | | For the Year Ended April 30, 2014 | | | For the Period September 4, 2012 (Commencement) to April 30, 2013 | |
| Net asset value, beginning of period | | $ | 10.37 | | | $ | 10.81 | | | $ | 10.77 | | | $ | 10.51 | | | $ | 10.00 | |
| | | | | | | | | | | | | | | | | | | | | |
| INCOME FROM INVESTMENT OPERATIONS: | |
Net investment income(b) | | | 0.10 | | | | 0.09 | | | | 0.03 | | | | 0.06 | | | | 0.06 | |
| Net realized and unrealized gain/(loss) | | | 0.08 | | | | (0.13 | ) | | | 0.04 | | | | 0.51 | | | | 0.47 | |
| Total from investment operations | | | 0.18 | | | | (0.04 | ) | | | 0.07 | | | | 0.57 | | | | 0.53 | |
| | | | | | | | | | | | | | | | | | | | | |
| DISTRIBUTIONS: | | | | | | | | | | | | | | | | | | | | |
| From net investment income | | | (0.09 | ) | | | (0.11 | ) | | | (0.03 | ) | | | (0.12 | ) | | | (0.02 | ) |
| From net realized gains | | | (0.02 | ) | | | (0.29 | ) | | | – | | | | (0.19 | ) | | | – | |
| Total distributions | | | (0.11 | ) | | | (0.40 | ) | | | (0.03 | ) | | | (0.31 | ) | | | (0.02 | ) |
| | | | | | | | | | | | | | | | | | | | | |
| Net increase/(decrease) in net asset value | | | 0.07 | | | | (0.44 | ) | | | 0.04 | | | | 0.26 | | | | 0.51 | |
| Net asset value, end of year | | $ | 10.44 | | | $ | 10.37 | | | $ | 10.81 | | | $ | 10.77 | | | $ | 10.51 | |
TOTAL RETURN(c) | | | 1.74 | % | | | (0.39 | )% | | | 0.68 | % | | | 5.49 | % | | | 5.29 | % |
| | | | | | | | | | | | | | | | | | | | | |
| RATIOS/SUPPLEMENTAL DATA: | |
| Net assets, end of year (000s) | | $ | 11,550 | | | $ | 8,610 | | | $ | 5,021 | | | $ | 4,106 | | | $ | 2,264 | |
| Ratio of expenses to average net assets excluding fee waivers and reimbursements | | | 2.60 | % | | | 2.81 | % | | | 3.14 | %(d) | | | 3.73 | % | | | 6.53 | %(d)(e) |
| Ratio of expenses to average net assets including fee waivers and reimbursements | | | 1.90 | % | | | 1.90 | % | | | 1.90 | %(d) | | | 1.90 | % | | | 1.90 | %(d)(e) |
| Ratio of net investment income to average net assets | | | 0.92 | % | | | 0.88 | % | | | 0.47 | %(d) | | | 0.53 | % | | | 0.90 | %(d)(e) |
Portfolio turnover rate(f) | | | 137 | % | | | 186 | % | | | 34 | % | | | 125 | % | | | 73 | % |
| (a) | Effective May 1, 2014, the Board approved changing the fiscal year-end of the Funds from April 30 to October 31. |
| (b) | Calculated using the average shares method. |
| (c) | Total returns are for the period indicated and have not been annualized. Total returns would have been lower had certain expenses not been waived during the period. Returns shown do not reflect the deduction of taxes that a shareholder would pay on Fund distributions or the redemption of Fund shares. Returns shown exclude any applicable sales charges. |
| (e) | Expense ratios before reductions for startup periods may not be representative of longer term operating periods. |
| (f) | Portfolio turnover rate for periods less than one full year have not been annualized. |
See Notes to Financial Statements.
147 | October 31, 2016
RiverFront Conservative Income Builder Fund – Class I
Financial Highlights
Selected data for a share of beneficial interest outstanding throughout the periods indicated:
| | | For the Year Ended October 31, 2016 | | | For the Year Ended October 31, 2015 | | | For the Fiscal Period Ended October 31, 2014 (a) | | | For the Year Ended April 30, 2014 | | | For the Period September 4, 2012 (Commencement) to April 30, 2013 | |
| Net asset value, beginning of period | | $ | 10.30 | | | $ | 10.70 | | | $ | 10.66 | | | $ | 10.29 | | | $ | 10.00 | |
| | | | | | | | | | | | | | | | | | | | | |
| INCOME FROM INVESTMENT OPERATIONS: | |
Net investment income(b) | | | 0.19 | | | | 0.19 | | | | 0.07 | | | | 0.15 | | | | 0.12 | |
| Net realized and unrealized gain/(loss) | | | 0.08 | | | | (0.13 | ) | | | 0.06 | | | | 0.51 | | | | 0.46 | |
| Total from investment operations | | | 0.27 | | | | 0.06 | | | | 0.13 | | | | 0.66 | | | | 0.58 | |
| | | | | | | | | | | | | | | | | | | | | |
| DISTRIBUTIONS: | | | | | | | | | | | | | | | | | | | | |
| From net investment income | | | (0.19 | ) | | | (0.17 | ) | | | (0.09 | ) | | | (0.10 | ) | | | (0.29 | ) |
| From net realized gains | | | (0.02 | ) | | | (0.29 | ) | | | – | | | | (0.19 | ) | | | – | |
| Total distributions | | | (0.21 | ) | | | (0.46 | ) | | | (0.09 | ) | | | (0.29 | ) | | | (0.29 | ) |
| | | | | | | | | | | | | | | | | | | | | |
| Net increase/(decrease) in net asset value | | | 0.06 | | | | (0.40 | ) | | | 0.04 | | | | 0.37 | | | | 0.29 | |
| Net asset value, end of year | | $ | 10.36 | | | $ | 10.30 | | | $ | 10.70 | | | $ | 10.66 | | | $ | 10.29 | |
TOTAL RETURN(c) | | | 2.66 | % | | | 0.60 | % | | | 1.19 | % | | | 6.53 | % | | | 5.95 | % |
| | | | | | | | | | | | | | | | | | | | | |
| RATIOS/SUPPLEMENTAL DATA: | |
| Net assets, end of year (000s) | | $ | 2,264 | | | $ | 2,171 | | | $ | 2,830 | | | $ | 1,381 | | | $ | 715 | |
| Ratio of expenses to average net assets excluding fee waivers and reimbursements | | | 1.60 | % | | | 1.80 | % | | | 2.12 | %(d) | | | 2.66 | % | | | 7.74 | %(d)(e) |
| Ratio of expenses to average net assets including fee waivers and reimbursements | | | 0.90 | % | | | 0.90 | % | | | 0.90 | %(d) | | | 0.90 | % | | | 0.90 | %(d)(e) |
| Ratio of net investment income to average net assets | | | 1.90 | % | | | 1.84 | % | | | 1.34 | %(d) | | | 1.49 | % | | | 1.84 | %(d)(e) |
Portfolio turnover rate(f) | | | 137 | % | | | 186 | % | | | 34 | % | | | 125 | % | | | 73 | % |
| (a) | Effective May 1, 2014, the Board approved changing the fiscal year-end of the Funds from April 30 to October 31. |
| (b) | Calculated using the average shares method. |
| (c) | Total returns are for the period indicated and have not been annualized. Total returns would have been lower had certain expenses not been waived during the period. Returns shown do not reflect the deduction of taxes that a shareholder would pay on Fund distributions or the redemption of Fund shares. |
| (e) | Expense ratios before reductions for startup periods may not be representative of longer term operating periods. |
| (f) | Portfolio turnover rate for periods less than one full year have not been annualized. |
See Notes to Financial Statements.
148 | October 31, 2016
RiverFront Dynamic Equity Income Fund – Class A
Financial Highlights
Selected data for a share of beneficial interest outstanding throughout the periods indicated:
| | | For the Year Ended October 31, 2016 | | | For the Year Ended October 31, 2015 | | | For the Fiscal Period Ended October 31, 2014(a) | | | For the Year Ended April 30, 2014 | | | For the Year Ended April 30, 2013 | | | For the Year Ended April 30, 2012(b) | |
| Net asset value, beginning of period | | $ | 12.63 | | | $ | 13.10 | | | $ | 12.97 | | | $ | 12.24 | | | $ | 11.24 | | | $ | 11.73 | |
| | | | | | | | | | | | | | | | | | | | | | | | | |
| INCOME/(LOSS) FROM INVESTMENT OPERATIONS: | |
Net investment income(c) | | | 0.21 | | | | 0.25 | | | | 0.09 | | | | 0.17 | | | | 0.25 | | | | 0.16 | |
| Net realized and unrealized gain/(loss) | | | (0.00 | )(d) | | | (0.04 | ) | | | 0.13 | | | | 1.17 | | | | 0.99 | | | | (0.49 | ) |
| Total from investment operations | | | 0.21 | | | | 0.21 | | | | 0.22 | | | | 1.34 | | | | 1.24 | | | | (0.33 | ) |
| | | | | | | | | | | | | | | | | | | | | | | | | |
| DISTRIBUTIONS: | | | | | | | | | | | | | | | | | | | | | | | | |
| From net investment income | | | (0.21 | ) | | | (0.22 | ) | | | (0.09 | ) | | | (0.17 | ) | | | (0.24 | ) | | | (0.15 | ) |
| From net realized gains | | | (0.25 | ) | | | (0.46 | ) | | | – | | | | (0.44 | ) | | | – | | | | – | |
| Tax return of capital | | | – | | | | – | | | | – | | | | – | | | | – | | | | (0.01 | ) |
| Total distributions | | | (0.46 | ) | | | (0.68 | ) | | | (0.09 | ) | | | (0.61 | ) | | | (0.24 | ) | | | (0.16 | ) |
| | | | | | | | | | | | | | | | | | | | | | | | | |
| Net increase/(decrease) in net asset value | | | (0.25 | ) | | | (0.47 | ) | | | 0.13 | | | | 0.73 | | | | 1.00 | | | | (0.49 | ) |
| Net asset value, end of year | | $ | 12.38 | | | $ | 12.63 | | | $ | 13.10 | | | $ | 12.97 | | | $ | 12.24 | | | $ | 11.24 | |
TOTAL RETURN(e) | | | 1.80 | % | | | 1.64 | % | | | 1.66 | % | | | 11.15 | % | | | 11.22 | % | | | (2.80 | )% |
| | | | | | | | | | | | | | | | | | | | | | | | | |
| RATIOS/SUPPLEMENTAL DATA: | |
| Net assets, end of year (000s) | | $ | 20,227 | | | $ | 19,769 | | | $ | 17,275 | | | $ | 15,374 | | | $ | 8,087 | | | $ | 7,114 | |
| Ratio of expenses to average net assets excluding fee waivers and reimbursements | | | 1.35 | % | | | 1.35 | % | | | 1.39 | %(f) | | | 1.42 | % | | | 1.58 | % | | | 1.73 | % |
| Ratio of expenses to average net assets including fee waivers and reimbursements | | | 1.15 | % | | | 1.15 | % | | | 1.15 | %(f) | | | 1.15 | % | | | 1.20 | %(g) | | | 1.30 | % |
| Ratio of net investment income to average net assets | | | 1.74 | % | | | 1.98 | % | | | 1.33 | %(f) | | | 1.38 | % | | | 2.17 | % | | | 1.50 | % |
Portfolio turnover rate(h) | | | 129 | % | | | 75 | % | | | 45 | % | | | 99 | % | | | 136 | % | | | 133 | % |
(a) | Effective May 1, 2014, the Board approved changing the fiscal year-end of the Funds from April 30 to October 31. |
(b) | Prior to January 1, 2012, the RiverFront Dynamic Equity Income Fund was known as the RiverFront Long-Term Growth & Income Fund. |
(c) | Calculated using the average shares method. |
(d) | Less than ($0.005) per share. |
(e) | Total returns are for the period indicated and have not been annualized. Total returns would have been lower had certain expenses not been waived during the period. Returns shown do not reflect the deduction of taxes that a shareholder would pay on Fund distributions or the redemption of Fund shares. Returns shown exclude any applicable sales charges. |
(g) | Contractual expense limitation change from 1.30% to 1.15% effective September 1, 2012. |
(h) | Portfolio turnover rate for periods less than one full year have not been annualized. |
See Notes to Financial Statements.
149 | October 31, 2016
RiverFront Dynamic Equity Income Fund – Class C
Financial Highlights
Selected data for a share of beneficial interest outstanding throughout the periods indicated:
| | | For the Year Ended October 31, 2016 | | | For the Year Ended October 31, 2015 | | | For the Fiscal Period Ended October 31, 2014(a) | | | For the Year Ended April 30, 2014 | | | For the Year Ended April 30, 2013 | | | For the Year Ended April 30, 2012(b) | |
| Net asset value, beginning of period | | $ | 12.44 | | | $ | 12.97 | | | $ | 12.84 | | | $ | 12.13 | | | $ | 11.14 | | | $ | 11.67 | |
| | | | | | | | | | | | | | | | | | | | | | | | | |
| INCOME/(LOSS) FROM INVESTMENT OPERATIONS: | |
Net investment income(c) | | | 0.13 | | | | 0.15 | | | | 0.04 | | | | 0.08 | | | | 0.16 | | | | 0.09 | |
| Net realized and unrealized gain/(loss) | | | (0.02 | ) | | | (0.04 | ) | | | 0.13 | | | | 1.15 | | | | 0.98 | | | | (0.51 | ) |
| Total from investment operations | | | 0.11 | | | | 0.11 | | | | 0.17 | | | | 1.23 | | | | 1.14 | | | | (0.42 | ) |
| | | | | | | | | | | | | | | | | | | | | | | | | |
| DISTRIBUTIONS: | | | | | | | | | | | | | | | | | | | | | | | | |
| From net investment income | | | (0.15 | ) | | | (0.18 | ) | | | (0.04 | ) | | | (0.08 | ) | | | (0.15 | ) | | | (0.10 | ) |
| From net realized gains | | | (0.25 | ) | | | (0.46 | ) | | | – | | | | (0.44 | ) | | | – | | | | – | |
| Tax return of capital | | | – | | | | – | | | | – | | | | – | | | | – | | | | (0.01 | ) |
| Total distributions | | | (0.40 | ) | | | (0.64 | ) | | | (0.04 | ) | | | (0.52 | ) | | | (0.15 | ) | | | (0.11 | ) |
| | | | | | | | | | | | | | | | | | | | | | | | | |
| Net increase/(decrease) in net asset value | | | (0.29 | ) | | | (0.53 | ) | | | 0.13 | | | | 0.71 | | | | 0.99 | | | | (0.53 | ) |
| Net asset value, end of year | | $ | 12.15 | | | $ | 12.44 | | | $ | 12.97 | | | $ | 12.84 | | | $ | 12.13 | | | $ | 11.14 | |
TOTAL RETURN(d) | | | 0.97 | % | | | 0.86 | % | | | 1.30 | % | | | 10.34 | % | | | 10.41 | % | | | (3.60 | )% |
| | | | | | | | | | | | | | | | | | | | | | | | | |
| RATIOS/SUPPLEMENTAL DATA: | |
| Net assets, end of year (000s) | | $ | 32,217 | | | $ | 34,766 | | | $ | 30,170 | | | $ | 25,787 | | | $ | 16,070 | | | $ | 13,729 | |
| Ratio of expenses to average net assets excluding fee waivers and reimbursements | | | 2.10 | % | | | 2.10 | % | | | 2.15 | %(e) | | | 2.18 | % | | | 2.33 | % | | | 2.49 | % |
| Ratio of expenses to average net assets including fee waivers and reimbursements | | | 1.90 | % | | | 1.90 | % | | | 1.90 | %(e) | | | 1.90 | % | | | 1.95 | %(f) | | | 2.05 | % |
| Ratio of net investment income to average net assets | | | 1.08 | % | | | 1.18 | % | | | 0.60 | %(e) | | | 0.61 | % | | | 1.44 | % | | | 0.84 | % |
Portfolio turnover rate(g) | | | 129 | % | | | 75 | % | | | 45 | % | | | 99 | % | | | 136 | % | | | 133 | % |
| (a) | Effective May 1, 2014, the Board approved changing the fiscal year-end of the Funds from April 30 to October 31. |
| (b) | Prior to January 1, 2012, the RiverFront Dynamic Equity Income Fund was known as the RiverFront Long-Term Growth & Income Fund. |
| (c) | Calculated using the average shares method. |
| (d) | Total returns are for the period indicated and have not been annualized. Total returns would have been lower had certain expenses not been waived during the period. Returns shown do not reflect the deduction of taxes that a shareholder would pay on Fund distributions or the redemption of Fund shares. Returns shown exclude any applicable sales charges. |
| (f) | Contractual expense limitation change from 2.05% to 1.90% effective September 1, 2012. |
(g) | Portfolio turnover rate for periods less than one full year have not been annualized. |
See Notes to Financial Statements.
150 | October 31, 2016
RiverFront Dynamic Equity Income Fund – Class I
Financial Highlights
Selected data for a share of beneficial interest outstanding throughout the periods indicated:
| | | For the Year Ended October 31, 2016 | | | For the Year Ended October 31, 2015 | | | For the Fiscal Period Ended October 31, 2014(a) | | | For the Year Ended April 30, 2014 | | | For the Year Ended April 30, 2013 | | | For the Year Ended April 30, 2012(b) | |
| Net asset value, beginning of period | | $ | 12.56 | | | $ | 13.02 | | | $ | 12.88 | | | $ | 12.16 | | | $ | 11.17 | | | $ | 11.64 | |
| | | | | | | | | | | | | | | | | | | | | | | | | |
| INCOME/(LOSS) FROM INVESTMENT OPERATIONS: | |
Net investment income(c) | | | 0.25 | | | | 0.28 | | | | 0.10 | | | | 0.20 | | | | 0.27 | | | | 0.20 | |
| Net realized and unrealized gain/(loss) | | | (0.01 | ) | | | (0.05 | ) | | | 0.14 | | | | 1.16 | | | | 0.99 | | | | (0.50 | ) |
| Total from investment operations | | | 0.24 | | | | 0.23 | | | | 0.24 | | | | 1.36 | | | | 1.26 | | | | (0.30 | ) |
| | | | | | | | | | | | | | | | | | | | | | | | | |
| DISTRIBUTIONS: | | | | | | | | | | | | | | | | | | | | | | | | |
| From net investment income | | | (0.24 | ) | | | (0.23 | ) | | | (0.10 | ) | | | (0.20 | ) | | | (0.27 | ) | | | (0.16 | ) |
| From net realized gains | | | (0.25 | ) | | | (0.46 | ) | | | – | | | | (0.44 | ) | | | – | | | | – | |
| Tax return of capital | | | – | | | | – | | | | – | | | | – | | | | – | | | | (0.01 | ) |
| Total distributions | | | (0.49 | ) | | | (0.69 | ) | | | (0.10 | ) | | | (0.64 | ) | | | (0.27 | ) | | | (0.17 | ) |
| | | | | | | | | | | | | | | | | | | | | | | | | |
| Net increase/(decrease) in net asset value | | | (0.25 | ) | | | (0.46 | ) | | | 0.14 | | | | 0.72 | | | | 0.99 | | | | (0.47 | ) |
| Net asset value, end of year | | $ | 12.31 | | | $ | 12.56 | | | $ | 13.02 | | | $ | 12.88 | | | $ | 12.16 | | | $ | 11.17 | |
TOTAL RETURN(d) | | | 2.01 | % | | | 1.83 | % | | | 1.88 | % | | | 11.40 | % | | | 11.47 | % | | | (2.58 | )% |
| | | | | | | | | | | | | | | | | | | | | | | | | |
| RATIOS/SUPPLEMENTAL DATA: | |
| Net assets, end of year (000s) | | $ | 28,833 | | | $ | 22,780 | | | $ | 20,997 | | | $ | 18,254 | | | $ | 10,460 | | | $ | 6,897 | |
| Ratio of expenses to average net assets excluding fee waivers and reimbursements | | | 1.10 | % | | | 1.10 | % | | | 1.15 | %(e) | | | 1.17 | % | | | 1.33 | % | | | 1.49 | % |
| Ratio of expenses to average net assets including fee waivers and reimbursements | | | 0.90 | % | | | 0.90 | % | | | 0.90 | %(e) | | | 0.90 | % | | | 0.95 | %(f) | | | 1.05 | % |
| Ratio of net investment income to average net assets | | | 2.06 | % | | | 2.21 | % | | | 1.57 | %(e) | | | 1.61 | % | | | 2.36 | % | | | 1.88 | % |
Portfolio turnover rate(g) | | | 129 | % | | | 75 | % | | | 45 | % | | | 99 | % | | | 136 | % | | | 133 | % |
(a) | Effective May 1, 2014, the Board approved changing the fiscal year-end of the Funds from April 30 to October 31. |
(b) | Prior to January 1, 2012, the RiverFront Dynamic Equity Income Fund was known as the RiverFront Long-Term Growth & Income Fund. |
(c) | Calculated using the average shares method. |
(d) | Total returns are for the period indicated and have not been annualized. Total returns would have been lower had certain expenses not been waived during the period. Returns shown do not reflect the deduction of taxes that a shareholder would pay on Fund distributions or the redemption of Fund shares. |
(f) | Contractual expense limitation change from 1.05% to 0.90% effective September 1, 2012. |
(g) | Portfolio turnover rate for periods less than one full year have not been annualized. |
See Notes to Financial Statements.
151 | October 31, 2016
RiverFront Global Allocation Fund – Class A
Financial Highlights
Selected data for a share of beneficial interest outstanding throughout the periods indicated:
| | | For the Year Ended October 31, 2016 | | | For the Year Ended October 31, 2015 | | | For the Fiscal Period Ended October 31, 2014(a) | | | For the Year Ended April 30, 2014 | | | For the Year Ended April 30, 2013 | | | For the Year Ended April 30, 2012(b) | |
| Net asset value, beginning of period | | $ | 12.20 | | | $ | 13.14 | | | $ | 12.97 | | | $ | 11.93 | | | $ | 10.86 | | | $ | 11.66 | |
| | | | | | | | | | | | | | | | | | | | | | | | | |
| INCOME/(LOSS) FROM INVESTMENT OPERATIONS: | |
Net investment income(c) | | | 0.21 | | | | 0.22 | | | | 0.08 | | | | 0.10 | | | | 0.15 | | | | 0.12 | |
| Net realized and unrealized gain/(loss) | | | (0.32 | ) | | | (0.06 | ) | | | 0.09 | | | | 1.36 | | | | 1.08 | | | | (0.84 | ) |
| Total from investment operations | | | (0.11 | ) | | | 0.16 | | | | 0.17 | | | | 1.46 | | | | 1.23 | | | | (0.72 | ) |
| | | | | | | | | | | | | | | | | | | | | | | | | |
| DISTRIBUTIONS: | | | | | | | | | | | | | | | | | | | | | | | | |
| From net investment income | | | (0.14 | ) | | | (0.21 | ) | | | – | | | | (0.09 | ) | | | (0.16 | ) | | | (0.07 | ) |
| From net realized gains | | | (0.04 | ) | | | (0.89 | ) | | | – | | | | (0.33 | ) | | | – | | | | (0.01 | ) |
| Total distributions | | | (0.18 | ) | | | (1.10 | ) | | | – | | | | (0.42 | ) | | | (0.16 | ) | | | (0.08 | ) |
| | | | | | | | | | | | | | | | | | | | | | | | | |
| Net increase/(decrease) in net asset value | | | (0.29 | ) | | | (0.94 | ) | | | 0.17 | | | | 1.04 | | | | 1.07 | | | | (0.80 | ) |
| Net asset value, end of year | | $ | 11.91 | | | $ | 12.20 | | | $ | 13.14 | | | $ | 12.97 | | | $ | 11.93 | | | $ | 10.86 | |
TOTAL RETURN(d) | | | (0.88 | )% | | | 1.23 | % | | | 1.31 | % | | | 12.32 | % | | | 11.47 | % | | | (6.18 | )% |
| | | | | | | | | | | | | | | | | | | | | | | | | |
| RATIOS/SUPPLEMENTAL DATA: | |
| Net assets, end of year (000s) | | $ | 6,467 | | | $ | 8,456 | | | $ | 8,372 | | | $ | 9,098 | | | $ | 8,244 | | | $ | 5,791 | |
| Ratio of expenses to average net assets excluding fee waivers and reimbursements | | | 1.45 | % | | | 1.43 | % | | | 1.50 | %(e) | | | 1.51 | % | | | 1.68 | % | | | 1.80 | % |
| Ratio of expenses to average net assets including fee waivers and reimbursements | | | 1.15 | % | | | 1.15 | % | | | 1.15 | %(e) | | | 1.15 | % | | | 1.19 | %(f) | | | 1.30 | % |
| Ratio of net investment income to average net assets | | | 1.78 | % | | | 1.71 | % | | | 1.21 | %(e) | | | 0.83 | % | | | 1.32 | % | | | 1.10 | % |
Portfolio turnover rate(g) | | | 124 | % | | | 71 | % | | | 47 | % | | | 95 | % | | | 113 | % | | | 163 | % |
(a) | Effective May 1, 2014, the Board approved changing the fiscal year-end of the Funds from April 30 to October 31. |
(b) | Prior to January 1, 2012, the RiverFront Global Allocation Fund was known as the RiverFront Moderate Growth Fund. |
(c) | Calculated using the average shares method. |
(d) | Total returns are for the period indicated and have not been annualized. Total returns would have been lower had certain expenses not been waived during the period. Returns shown do not reflect the deduction of taxes that a shareholder would pay on Fund distributions or the redemption of Fund shares. Returns shown exclude any applicable sales charges. |
(f) | Contractual expense limitation change from 1.30% to 1.15% effective September 1, 2012. |
(g) | Portfolio turnover rate for periods less than one full year have not been annualized. |
See Notes to Financial Statements.
152 | October 31, 2016
RiverFront Global Allocation Fund – Class C
Financial Highlights
Selected data for a share of beneficial interest outstanding throughout the periods indicated:
| | | For the Year Ended October 31, 2016 | | | For the Year Ended October 31, 2015 | | | For the Fiscal Period Ended October 31, 2014(a) | | | For the Year Ended April 30, 2014 | | | For the Year Ended April 30, 2013 | | | For the Year Ended April 30, 2012(b) | |
| Net asset value, beginning of period | | $ | 11.98 | | | $ | 12.95 | | | $ | 12.83 | | | $ | 11.84 | | | $ | 10.81 | | | $ | 11.64 | |
| | | | | | | | | | | | | | | | | | | | | | | | | |
| INCOME/(LOSS) FROM INVESTMENT OPERATIONS: | |
Net investment income(c) | | | 0.11 | | | | 0.12 | | | | 0.03 | | | | 0.01 | | | | 0.07 | | | | 0.02 | |
| Net realized and unrealized gain/(loss) | | | (0.31 | ) | | | (0.06 | ) | | | 0.09 | | | | 1.34 | | | | 1.07 | | | | (0.82 | ) |
| Total from investment operations | | | (0.20 | ) | | | 0.06 | | | | 0.12 | | | | 1.35 | | | | 1.14 | | | | (0.80 | ) |
| | | | | | | | | | | | | | | | | | | | | | | | | |
| DISTRIBUTIONS: | | | | | | | | | | | | | | | | | | | | | | | | |
| From net investment income | | | (0.12 | ) | | | (0.14 | ) | | | – | | | | (0.03 | ) | | | (0.11 | ) | | | (0.02 | ) |
| From net realized gains | | | (0.04 | ) | | | (0.89 | ) | | | – | | | | (0.33 | ) | | | – | | | | (0.01 | ) |
| Total distributions | | | (0.16 | ) | | | (1.03 | ) | | | – | | | | (0.36 | ) | | | (0.11 | ) | | | (0.03 | ) |
| | | | | | | | | | | | | | | | | | | | | | | | | |
| Net increase/(decrease) in net asset value | | | (0.36 | ) | | | (0.97 | ) | | | 0.12 | | | | 0.99 | | | | 1.03 | | | | (0.83 | ) |
| Net asset value, end of year | | $ | 11.62 | | | $ | 11.98 | | | $ | 12.95 | | | $ | 12.83 | | | $ | 11.84 | | | $ | 10.81 | |
TOTAL RETURN(d) | | | (1.61 | )% | | | 0.46 | % | | | 0.94 | % | | | 11.48 | % | | | 10.59 | % | | | (6.86 | )% |
| | | | | | | | | | | | | | | | | | | | | | | | | |
| RATIOS/SUPPLEMENTAL DATA: | |
| Net assets, end of year (000s) | | $ | 14,694 | | | $ | 17,089 | | | $ | 14,758 | | | $ | 14,624 | | | $ | 9,686 | | | $ | 9,891 | |
| Ratio of expenses to average net assets excluding fee waivers and reimbursements | | | 2.20 | % | | | 2.18 | % | | | 2.25 | %(e) | | | 2.26 | % | | | 2.44 | % | | | 2.58 | % |
| Ratio of expenses to average net assets including fee waivers and reimbursements | | | 1.90 | % | | | 1.90 | % | | | 1.90 | %(e) | | | 1.90 | % | | | 1.95 | %(f) | | | 2.05 | % |
| Ratio of net investment income to average net assets | | | 0.95 | % | | | 0.94 | % | | | 0.40 | %(e) | | | 0.05 | % | | | 0.66 | % | | | 0.17 | % |
Portfolio turnover rate(g) | | | 124 | % | | | 71 | % | | | 47 | % | | | 95 | % | | | 113 | % | | | 163 | % |
| (a) | Effective May 1, 2014, the Board approved changing the fiscal year-end of the Funds from April 30 to October 31. |
| (b) | Prior to January 1, 2012, the RiverFront Global Allocation Fund was known as the RiverFront Moderate Growth Fund. |
| (c) | Calculated using the average shares method. |
| (d) | Total returns are for the period indicated and have not been annualized. Total returns would have been lower had certain expenses not been waived during the period. Returns shown do not reflect the deduction of taxes that a shareholder would pay on Fund distributions or the redemption of Fund shares. Returns shown exclude any applicable sales charges. |
| (f) | Contractual expense limitation change from 2.05% to 1.90% effective September 1, 2012. |
| (g) | Portfolio turnover rate for periods less than one full year have not been annualized. |
See Notes to Financial Statements.
153 | October 31, 2016
RiverFront Global Allocation Fund – Class I
Financial Highlights
Selected data for a share of beneficial interest outstanding throughout the periods indicated:
| | | For the Year Ended October 31, 2016 | | | For the Year Ended October 31, 2015 | | | For the Fiscal Period Ended October 31, 2014(a) | | | For the Year Ended April 30, 2014 | | | For the Year Ended April 30, 2013 | | | For the Year Ended April 30, 2012(b) | |
| Net asset value, beginning of period | | $ | 11.99 | | | $ | 12.92 | | | $ | 12.75 | | | $ | 11.72 | | | $ | 10.66 | | | $ | 11.42 | |
| | | | | | | | | | | | | | | | | | | | | | | | | |
| INCOME/(LOSS) FROM INVESTMENT OPERATIONS: | |
Net investment income(c) | | | 0.22 | | | | 0.22 | | | | 0.09 | | | | 0.13 | | | | 0.17 | | | | 0.13 | |
| Net realized and unrealized gain/(loss) | | | (0.30 | ) | | | (0.04 | ) | | | 0.08 | | | | 1.34 | | | | 1.07 | | | | (0.80 | ) |
| Total from investment operations | | | (0.08 | ) | | | 0.18 | | | | 0.17 | | | | 1.47 | | | | 1.24 | | | | (0.67 | ) |
| | | | | | | | | | | | | | | | | | | | | | | | | |
| DISTRIBUTIONS: | | | | | | | | | | | | | | | | | | | | | | | | |
| From net investment income | | | (0.14 | ) | | | (0.22 | ) | | | – | | | | (0.11 | ) | | | (0.18 | ) | | | (0.08 | ) |
| From net realized gains | | | (0.04 | ) | | | (0.89 | ) | | | – | | | | (0.33 | ) | | | – | | | | (0.01 | ) |
| Total distributions | | | (0.18 | ) | | | (1.11 | ) | | | – | | | | (0.44 | ) | | | (0.18 | ) | | | (0.09 | ) |
| | | | | | | | | | | | | | | | | | | | | | | | | |
| Net increase/(decrease) in net asset value | | | (0.26 | ) | | | (0.93 | ) | | | 0.17 | | | | 1.03 | | | | 1.06 | | | | (0.76 | ) |
| Net asset value, end of year | | $ | 11.73 | | | $ | 11.99 | | | $ | 12.92 | | | $ | 12.75 | | | $ | 11.72 | | | $ | 10.66 | |
TOTAL RETURN(d) | | | (0.60 | )% | | | 1.49 | % | | | 1.33 | % | | | 12.61 | % | | | 11.73 | % | | | (5.86 | )% |
| | | | | | | | | | | | | | | | | | | | | | | | | |
| RATIOS/SUPPLEMENTAL DATA: | |
| Net assets, end of year (000s) | | $ | 14,240 | | | $ | 18,739 | | | $ | 12,895 | | | $ | 10,521 | | | $ | 6,675 | | | $ | 3,496 | |
| Ratio of expenses to average net assets excluding fee waivers and reimbursements | | | 1.20 | % | | | 1.18 | % | | | 1.26 | %(e) | | | 1.26 | % | | | 1.43 | % | | | 1.55 | % |
| Ratio of expenses to average net assets including fee waivers and reimbursements | | | 0.90 | % | | | 0.90 | % | | | 0.90 | %(e) | | | 0.90 | % | | | 0.94 | %(f) | | | 1.05 | % |
| Ratio of net investment income to average net assets | | | 1.94 | % | | | 1.83 | % | | | 1.41 | %(e) | | | 1.07 | % | | | 1.52 | % | | | 1.28 | % |
Portfolio turnover rate(g) | | | 124 | % | | | 71 | % | | | 47 | % | | | 95 | % | | | 113 | % | | | 163 | % |
| (a) | Effective May 1, 2014, the Board approved changing the fiscal year-end of the Funds from April 30 to October 31. |
| (b) | Prior to January 1, 2012, the RiverFront Global Allocation Fund was known as the RiverFront Moderate Growth Fund. |
| (c) | Calculated using the average shares method. |
| (d) | Total returns are for the period indicated and have not been annualized. Total returns would have been lower had certain expenses not been waived during the period. Returns shown do not reflect the deduction of taxes that a shareholder would pay on Fund distributions or the redemption of Fund shares. |
| (f) | Contractual expense limitation change from 1.05% to 0.90% effective September 1, 2012. |
| (g) | Portfolio turnover rate for periods less than one full year have not been annualized. |
See Notes to Financial Statements.
154 | October 31, 2016
RiverFront Global Growth Fund – Class A
Financial Highlights
Selected data for a share of beneficial interest outstanding throughout the periods indicated:
| | | For the Year Ended October 31, 2016 | | | For the Year Ended October 31, 2015 | | | For the Fiscal Period Ended October 31, 2014(a) | | | For the Year Ended April 30, 2014 | | | For the Year Ended April 30, 2013 | | | For the Year Ended April 30, 2012(b) | |
| Net asset value, beginning of period | | $ | 13.95 | | | $ | 15.44 | | | $ | 15.26 | | | $ | 14.89 | | | $ | 13.37 | | | $ | 15.65 | |
| | | | | | | | | | | | | | | | | | | | | | | | | |
| INCOME/(LOSS) FROM INVESTMENT OPERATIONS: | |
Net investment income(c) | | | 0.23 | | | | 0.24 | | | | 0.08 | | | | 0.12 | | | | 0.17 | | | | 0.14 | |
| Net realized and unrealized gain/(loss) | | | (0.31 | ) | | | (0.04 | ) | | | 0.10 | | | | 1.88 | | | | 1.57 | | | | (1.41 | ) |
| Total from investment operations | | | (0.08 | ) | | | 0.20 | | | | 0.18 | | | | 2.00 | | | | 1.74 | | | | (1.27 | ) |
| | | | | | | | | | | | | | | | | | | | | | | | | |
| DISTRIBUTIONS: | | | | | | | | | | | | | | | | | | | | | | | | |
| From net investment income | | | (0.20 | ) | | | (0.25 | ) | | | – | | | | (0.12 | ) | | | (0.22 | ) | | | (0.14 | ) |
| From net realized gains | | | (0.13 | ) | | | (1.44 | ) | | | – | | | | (1.51 | ) | | | – | | | | (0.87 | ) |
| Total distributions | | | (0.33 | ) | | | (1.69 | ) | | | – | | | | (1.63 | ) | | | (0.22 | ) | | | (1.01 | ) |
| | | | | | | | | | | | | | | | | | | | | | | | | |
| Net increase/(decrease) in net asset value | | | (0.41 | ) | | | (1.49 | ) | | | 0.18 | | | | 0.37 | | | | 1.52 | | | | (2.28 | ) |
| Net asset value, end of year | | $ | 13.54 | | | $ | 13.95 | | | $ | 15.44 | | | $ | 15.26 | | | $ | 14.89 | | | $ | 13.37 | |
TOTAL RETURN(d) | | | (0.57 | )% | | | 1.34 | % | | | 1.18 | % | | | 13.66 | % | | | 13.14 | % | | | (7.51 | )% |
| | | | | | | | | | | | | | | | | | | | | | | | | |
| RATIOS/SUPPLEMENTAL DATA: | |
| Net assets, end of year (000s) | | $ | 9,618 | | | $ | 18,308 | | | $ | 16,694 | | | $ | 16,440 | | | $ | 8,525 | | | $ | 5,241 | |
| Ratio of expenses to average net assets excluding fee waivers and reimbursements | | | 1.40 | % | | | 1.38 | % | | | 1.38 | %(e) | | | 1.40 | % | | | 1.49 | % | | | 1.52 | % |
Ratio of expenses to average net assets including fee waivers and reimbursements(f) | | | 1.15 | % | | | 1.15 | % | | | 1.15 | %(e) | | | 1.15 | % | | | 0.98 | % | | | 0.92 | % |
| Ratio of net investment income to average net assets | | | 1.77 | % | | | 1.67 | % | | | 1.08 | %(e) | | | 0.76 | % | | | 1.23 | % | | | 0.99 | % |
Portfolio turnover rate(g) | | | 113 | % | | | 71 | % | | | 48 | % | | | 85 | % | | | 113 | % | | | 119 | % |
| (a) | Effective May 1, 2014, the Board approved changing the fiscal year-end of the Funds from April 30 to October 31. |
| (b) | Prior to January 1, 2012, the RiverFront Global Growth Fund was known as the RiverFront Long-Term Growth Fund. |
| (c) | Calculated using the average shares method. |
| (d) | Total returns are for the period indicated and have not been annualized. Total returns would have been lower had certain expenses not been waived during the period. Returns shown do not reflect the deduction of taxes that a shareholder would pay on Fund distributions or the redemption of Fund shares. Returns shown exclude any applicable sales charges. |
| (f) | Prior to January 1, 2013, all acquired fund fees were reimbursed. |
| (g) | Portfolio turnover rate for periods less than one full year have not been annualized. |
See Notes to Financial Statements.
155 | October 31, 2016
RiverFront Global Growth Fund – Class C
Financial Highlights
Selected data for a share of beneficial interest outstanding throughout the periods indicated:
| | | For the Year Ended October 31, 2016 | | | For the Year Ended October 31, 2015 | | | For the Fiscal Period Ended October 31, 2014(a) | | | For the Year Ended April 30, 2014 | | | For the Year Ended April 30, 2013 | | | For the Year Ended April 30, 2012(b) | |
| Net asset value, beginning of period | | $ | 13.67 | | | $ | 15.19 | | | $ | 15.07 | | | $ | 14.76 | | | $ | 13.29 | | | $ | 15.60 | |
| | | | | | | | | | | | | | | | | | | | | | | | | |
| INCOME/(LOSS) FROM INVESTMENT OPERATIONS: | |
Net investment income(c) | | | 0.12 | | | | 0.13 | | | | 0.03 | | | | 0.01 | | | | 0.08 | | | | 0.05 | |
| Net realized and unrealized gain/(loss) | | | (0.30 | ) | | | (0.04 | ) | | | 0.09 | | | | 1.86 | | | | 1.54 | | | | (1.42 | ) |
| Total from investment operations | | | (0.18 | ) | | | 0.09 | | | | 0.12 | | | | 1.87 | | | | 1.62 | | | | (1.37 | ) |
| | | | | | | | | | | | | | | | | | | | | | | | | |
| DISTRIBUTIONS: | | | | | | | | | | | | | | | | | | | | | | | | |
| From net investment income | | | (0.18 | ) | | | (0.17 | ) | | | – | | | | (0.05 | ) | | | (0.15 | ) | | | (0.07 | ) |
| From net realized gains | | | (0.13 | ) | | | (1.44 | ) | | | – | | | | (1.51 | ) | | | – | | | | (0.87 | ) |
| Total distributions | | | (0.31 | ) | | | (1.61 | ) | | | – | | | | (1.56 | ) | | | (0.15 | ) | | | (0.94 | ) |
| | | | | | | | | | | | | | | | | | | | | | | | | |
| Net increase/(decrease) in net asset value | | | (0.49 | ) | | | (1.52 | ) | | | 0.12 | | | | 0.31 | | | | 1.47 | | | | (2.31 | ) |
| Net asset value, end of year | | $ | 13.18 | | | $ | 13.67 | | | $ | 15.19 | | | $ | 15.07 | | | $ | 14.76 | | | $ | 13.29 | |
TOTAL RETURN(d) | | | (1.31 | )% | | | 0.59 | % | | | 0.80 | % | | | 12.84 | % | | | 12.31 | % | | | (8.22 | )% |
| | | | | | | | | | | | | | | | | | | | | | | | | |
| RATIOS/SUPPLEMENTAL DATA: | |
| Net assets, end of year (000s) | | $ | 11,447 | | | $ | 12,908 | | | $ | 11,420 | | | $ | 11,511 | | | $ | 7,182 | | | $ | 6,808 | |
| Ratio of expenses to average net assets excluding fee waivers and reimbursements | | | 2.16 | % | | | 2.13 | % | | | 2.13 | %(e) | | | 2.15 | % | | | 2.25 | % | | | 2.29 | % |
Ratio of expenses to average net assets including fee waivers and reimbursements(f) | | | 1.90 | % | | | 1.90 | % | | | 1.90 | %(e) | | | 1.90 | % | | | 1.73 | % | | | 1.67 | % |
| Ratio of net investment income to average net assets | | | 0.92 | % | | | 0.88 | % | | | 0.38 | %(e) | | | 0.07 | % | | | 0.57 | % | | | 0.34 | % |
Portfolio turnover rate(g) | | | 113 | % | | | 71 | % | | | 48 | % | | | 85 | % | | | 113 | % | | | 119 | % |
(a) | Effective May 1, 2014, the Board approved changing the fiscal year-end of the Funds from April 30 to October 31. |
(b) | Prior to January 1, 2012, the RiverFront Global Growth Fund was known as the RiverFront Long-Term Growth Fund. |
(c) | Calculated using the average shares method. |
(d) | Total returns are for the period indicated and have not been annualized. Total returns would have been lower had certain expenses not been waived during the period. Returns shown do not reflect the deduction of taxes that a shareholder would pay on Fund distributions or the redemption of Fund shares. Returns shown exclude any applicable sales charges. |
(f) | Prior to January 1, 2013, all acquired fund fees were reimbursed. |
(g) | Portfolio turnover rate for periods less than one full year have not been annualized. |
See Notes to Financial Statements.
156 | October 31, 2016
RiverFront Global Growth Fund – Class I
Financial Highlights
Selected data for a share of beneficial interest outstanding throughout the periods indicated:
| | | For the Year Ended October 31, 2016 | | | For the Year Ended October 31, 2015 | | | For the Fiscal Period Ended October 31, 2014(a) | | | For the Year Ended April 30, 2014 | | | For the Year Ended April 30, 2013 | | | For the Year Ended April 30, 2012(b) | |
| Net asset value, beginning of period | | $ | 14.03 | | | $ | 15.52 | | | $ | 15.32 | | | $ | 14.92 | | | $ | 13.40 | | | $ | 15.67 | |
| | | | | | | | | | | | | | | | | | | | | | | | | |
| INCOME/(LOSS) FROM INVESTMENT OPERATIONS: | | | | | | | | | | | | | |
Net investment income(c) | | | 0.26 | | | | 0.26 | | | | 0.10 | | | | 0.17 | | | | 0.20 | | | | 0.19 | |
| Net realized and unrealized gain/(loss) | | | (0.30 | ) | | | (0.03 | ) | | | 0.10 | | | | 1.89 | | | | 1.57 | | | | (1.51 | ) |
| Total from investment operations | | | (0.04 | ) | | | 0.23 | | | | 0.20 | | | | 2.06 | | | | 1.77 | | | | (1.32 | ) |
| | | | | | | | | | | | | | | | | | | | | | | | | |
| DISTRIBUTIONS: | | | | | | | | | | | | | | | | | | | | | | | | |
| From net investment income | | | (0.21 | ) | | | (0.28 | ) | | | – | | | | (0.15 | ) | | | (0.25 | ) | | | (0.16 | ) |
| From net realized gains | | | (0.13 | ) | | | (1.44 | ) | | | – | | | | (1.51 | ) | | | – | | | | (0.79 | ) |
| Total distributions | | | (0.34 | ) | | | (1.72 | ) | | | – | | | | (1.66 | ) | | | (0.25 | ) | | | (0.95 | ) |
| | | | | | | | | | | | | | | | | | | | | | | | | |
| Net increase/(decrease) in net asset value | | | (0.38 | ) | | | (1.49 | ) | | | 0.20 | | | | 0.40 | | | | 1.52 | | | | (2.27 | ) |
| Net asset value, end of year | | $ | 13.65 | | | $ | 14.03 | | | $ | 15.52 | | | $ | 15.32 | | | $ | 14.92 | | | $ | 13.40 | |
TOTAL RETURN(d) | | | (0.31 | )% | | | 1.51 | % | | | 1.31 | % | | | 14.01 | % | | | 13.36 | % | | | (7.31 | )% |
| | | | | | | | | | | | | | | | | | | | | | | | | |
| RATIOS/SUPPLEMENTAL DATA: | |
| Net assets, end of year (000s) | | $ | 10,140 | | | $ | 16,412 | | | $ | 13,343 | | | $ | 11,845 | | | $ | 7,769 | | | $ | 6,022 | |
| Ratio of expenses to average net assets excluding fee waivers and reimbursements | | | 1.15 | % | | | 1.29 | % | | | 1.36 | %(e) | | | 1.16 | % | | | 1.25 | % | | | 1.30 | % |
Ratio of expenses to average net assets including fee waivers and reimbursements(f) | | | 0.90 | % | | | 0.90 | % | | | 0.90 | %(e) | | | 0.90 | % | | | 0.73 | % | | | 0.67 | % |
| Ratio of net investment income to average net assets | | | 1.98 | % | | | 1.77 | % | | | 1.32 | %(e) | | | 1.13 | % | | | 1.45 | % | | | 1.44 | % |
Portfolio turnover rate(g) | | | 113 | % | | | 71 | % | | | 48 | % | | | 85 | % | | | 113 | % | | | 119 | % |
(a) | Effective May 1, 2014, the Board approved changing the fiscal year-end of the Funds from April 30 to October 31. |
(b) | Prior to January 1, 2012, the RiverFront Global Growth Fund was known as the RiverFront Long-Term Growth Fund. |
(c) | Calculated using the average shares method. |
(d) | Total returns are for the period indicated and have not been annualized. Total returns would have been lower had certain expenses not been waived during the period. Returns shown do not reflect the deduction of taxes that a shareholder would pay on Fund distributions or the redemption of Fund shares. |
(f) | Prior to January 1, 2013, all acquired fund fees were reimbursed. |
(g) | Portfolio turnover rate for periods less than one full year have not been annualized. |
See Notes to Financial Statements.
157 | October 31, 2016
RiverFront Global Growth Fund – Class L
Financial Highlights
Selected data for a share of beneficial interest outstanding throughout the periods indicated:
| | | For the Year Ended October 31, 2016 | | | For the Year Ended October 31, 2015 | | | For the Fiscal Period Ended October 31, 2014(a) | | | For the Year Ended April 30, 2014 | | | For the Year Ended April 30, 2013 | | | For the Year Ended April 30, 2012(b) | |
| Net asset value, beginning of period | | $ | 14.01 | | | $ | 15.49 | | | $ | 15.29 | | | $ | 14.90 | | | $ | 13.37 | | | $ | 15.65 | |
| | | | | | | | | | | | | | | | | | | | | | | | | |
| INCOME/(LOSS) FROM INVESTMENT OPERATIONS: | | | | | | | | | | | | | | | | | |
Net investment income(c) | | | 0.25 | | | | 0.27 | | | | 0.11 | | | | 0.17 | | | | 0.22 | | | | 0.17 | |
| Net realized and unrealized gain/(loss) | | | (0.29 | ) | | | (0.03 | ) | | | 0.09 | | | | 1.88 | | | | 1.56 | | | | (1.41 | ) |
| Total from investment operations | | | (0.04 | ) | | | 0.24 | | | | 0.20 | | | | 2.05 | | | | 1.78 | | | | (1.24 | ) |
| | | | | | | | | | | | | | | | | | | | | | | | | |
| DISTRIBUTIONS: | | | | | | | | | | | | | | | | | | | | | | | | |
| From net investment income | | | (0.21 | ) | | | (0.28 | ) | | | – | | | | (0.15 | ) | | | (0.25 | ) | | | (0.14 | ) |
| From net realized gains | | | (0.13 | ) | | | (1.44 | ) | | | – | | | | (1.51 | ) | | | – | | | | (0.87 | ) |
| Total distributions | | | (0.34 | ) | | | (1.72 | ) | | | – | | | | (1.66 | ) | | | (0.25 | ) | | | (1.04 | ) |
| | | | | | | | | | | | | | | | | | | | | | | | | |
| Net increase/(decrease) in net asset value | | | (0.38 | ) | | | (1.48 | ) | | | 0.20 | | | | 0.39 | | | | 1.53 | | | | (2.28 | ) |
| Net asset value, end of year | | $ | 13.63 | | | $ | 14.01 | | | $ | 15.49 | | | $ | 15.29 | | | $ | 14.90 | | | $ | 13.37 | |
TOTAL RETURN(d) | | | (0.31 | )% | | | 1.59 | % | | | 1.31 | % | | | 13.98 | % | | | 13.43 | % | | | (7.31 | )% |
| | | | | | | | | | | | | | | | | | | | | | | | | |
| RATIOS/SUPPLEMENTAL DATA: | | | | | |
| Net assets, end of year (000s) | | $ | 22,552 | | | $ | 26,109 | | | $ | 24,400 | | | $ | 25,092 | | | $ | 23,454 | | | $ | 24,765 | |
| Ratio of expenses to average net assets excluding fee waivers and reimbursements | | | 1.16 | % | | | 1.04 | % | | | 1.02 | %(e) | | | 1.15 | % | | | 1.25 | % | | | 1.08 | % |
Ratio of expenses to average net assets including fee waivers and reimbursements (includes acquired fund fee reimbursements)(f) | | | 0.90 | % | | | 0.90 | % | | | 0.90 | %(e) | | | 0.90 | % | | | 0.73 | % | | | 0.67 | % |
| Ratio of expenses to average net assets including fee waivers and reimbursements (excludes acquired fund fee reimbursements) | | | 0.90 | % | | | 0.90 | % | | | 0.90 | %(e) | | | 0.90 | % | | | 0.90 | % | | | 0.90 | % |
| Ratio of net investment income to average net assets | | | 1.90 | % | | | 1.86 | % | | | 1.37 | %(e) | | | 1.11 | % | | | 1.59 | % | | | 1.26 | % |
Portfolio turnover rate(g) | | | 113 | % | | | 71 | % | | | 48 | % | | | 85 | % | | | 113 | % | | | 119 | % |
(a) | Effective May 1, 2014, the Board approved changing the fiscal year-end of the Funds from April 30 to October 31. |
(b) | Prior to January 1, 2012, the RiverFront Global Growth Fund was known as the RiverFront Long-Term Growth Fund. |
(c) | Calculated using the average shares method. |
(d) | Total returns are for the period indicated and have not been annualized. Total returns would have been lower had certain expenses not been waived during the period. Returns shown do not reflect the deduction of taxes that a shareholder would pay on Fund distributions or the redemption of Fund shares. |
(f) | Prior to January 1, 2013, all acquired fund fees were reimbursed. |
(g) | Portfolio turnover rate for periods less than one full year have not been annualized. |
See Notes to Financial Statements.
158 | October 31, 2016
RiverFront Global Growth Fund – Investor Class
Financial Highlights
Selected data for a share of beneficial interest outstanding throughout the periods indicated:
| | | For the Year Ended October 31, 2016 | | | For the Year Ended October 31, 2015 | | | For the Fiscal Period Ended October 31, 2014(a) | | | For the Year Ended April 30, 2014 | | | For the Year Ended April 30, 2013 | | | For the Year Ended April 30, 2012(b) | |
| Net asset value, beginning of period | | $ | 13.87 | | | $ | 15.37 | | | $ | 15.19 | | | $ | 14.82 | | | $ | 13.32 | | | $ | 15.59 | |
| | | | | | | | | | | | | | | | | | | | | | | | | |
| INCOME/(LOSS) FROM INVESTMENT OPERATIONS: | | | | | | | | | | | | | |
Net investment income(c) | | | 0.23 | | | | 0.26 | | | | 0.09 | | | | 0.13 | | | | 0.18 | | | | 0.13 | |
| Net realized and unrealized gain/(loss) | | | (0.30 | ) | | | (0.07 | ) | | | 0.09 | | | | 1.87 | | | | 1.54 | | | | (1.39 | ) |
| Total from investment operations | | | (0.07 | ) | | | 0.19 | | | | 0.18 | | | | 2.00 | | | | 1.72 | | | | (1.26 | ) |
| | | | | | | | | | | | | | | | | | | | | | | | | |
| DISTRIBUTIONS: | | | | | | | | | | | | | | | | | | | | | | | | |
| From net investment income | | | (0.20 | ) | | | (0.25 | ) | | | – | | | | (0.12 | ) | | | (0.22 | ) | | | (0.14 | ) |
| From net realized gains | | | (0.13 | ) | | | (1.44 | ) | | | – | | | | (1.51 | ) | | | – | | | | (0.87 | ) |
| Total distributions | | | (0.33 | ) | | | (1.69 | ) | | | – | | | | (1.63 | ) | | | (0.22 | ) | | | (1.01 | ) |
| | | | | | | | | | | | | | | | | | | | | | | | | |
| Net increase/(decrease) in net asset value | | | (0.40 | ) | | | (1.50 | ) | | | 0.18 | | | | 0.37 | | | | 1.50 | | | | (2.27 | ) |
| Net asset value, end of year | | $ | 13.47 | | | $ | 13.87 | | | $ | 15.37 | | | $ | 15.19 | | | $ | 14.82 | | | $ | 13.32 | |
TOTAL RETURN(d) | | | (0.51 | )% | | | 1.28 | % | | | 1.18 | % | | | 13.73 | % | | | 13.07 | % | | | (7.47 | )% |
| | | | | | | | | | | | | | | | | | | | | | | | | |
| RATIOS/SUPPLEMENTAL DATA: | |
| Net assets, end of year (000s) | | $ | 4,667 | | | $ | 6,924 | | | $ | 7,762 | | | $ | 8,361 | | | $ | 9,174 | | | $ | 10,133 | |
| Ratio of expenses to average net assets excluding fee waivers and reimbursements | | | 1.40 | % | | | 1.38 | % | | | 1.38 | %(e) | | | 1.41 | % | | | 1.50 | % | | | 1.93 | % |
Ratio of expenses to average net assets including fee waivers and reimbursements (includes acquired fund fee reimbursements)(f) | | | 1.15 | % | | | 1.15 | % | | | 1.15 | %(e) | | | 1.15 | % | | | 0.98 | % | | | 0.92 | % |
| Ratio of expenses to average net assets including fee waivers and reimbursements (excludes acquired fund fee reimbursements) | | | 1.15 | % | | | 1.15 | % | | | 1.15 | %(e) | | | 1.15 | % | | | 1.15 | % | | | 1.15 | % |
| Ratio of net investment income to average net assets | | | 1.75 | % | | | 1.78 | % | | | 1.14 | %(e) | | | 0.85 | % | | | 1.36 | % | | | 0.97 | % |
Portfolio turnover rate(g) | | | 113 | % | | | 71 | % | | | 48 | % | | | 85 | % | | | 113 | % | | | 119 | % |
(a) | Effective May 1, 2014, the Board approved changing the fiscal year-end of the Funds from April 30 to October 31. |
(b) | Prior to January 1, 2012, the RiverFront Global Growth Fund was known as the RiverFront Long-Term Growth Fund. |
(c) | Calculated using the average shares method. |
(d) | Total returns are for the period indicated and have not been annualized. Total returns would have been lower had certain expenses not been waived during the period. Returns shown do not reflect the deduction of taxes that a shareholder would pay on Fund distributions or the redemption of Fund shares. |
(f) | Prior to January 1, 2013, all acquired fund fees were reimbursed. |
(g) | Portfolio turnover rate for periods less than one full year have not been annualized. |
See Notes to Financial Statements.
159 | October 31, 2016
RiverFront Moderate Growth & Income Fund – Class A
Financial Highlights
Selected data for a share of beneficial interest outstanding throughout the periods indicated:
| | | For the Year Ended October 31, 2016 | | | For the Year Ended October 31, 2015 | | | For the Fiscal Period Ended October 31, 2014(a) | | | For the Year Ended April 30, 2014 | | | For the Year Ended April 30, 2013 | | | For the Year Ended April 30, 2012 | |
| Net asset value, beginning of period | | $ | 11.48 | | | $ | 12.15 | | | $ | 11.99 | | | $ | 11.66 | | | $ | 10.96 | | | $ | 11.08 | |
| | | | | | | | | | | | | | | | | | | | | | | | | |
| INCOME/(LOSS) FROM INVESTMENT OPERATIONS: | | | | | | | | | | | | | |
Net investment income(b) | | | 0.21 | | | | 0.23 | | | | 0.09 | | | | 0.16 | | | | 0.24 | | | | 0.17 | |
| Net realized and unrealized gain/(loss) | | | (0.01 | ) | | | (0.06 | ) | | | 0.16 | | | | 0.89 | | | | 0.69 | | | | (0.12 | ) |
| Total from investment operations | | | 0.20 | | | | 0.17 | | | | 0.25 | | | | 1.05 | | | | 0.93 | | | | 0.05 | |
| | | | | | | | | | | | | | | | | | | | | | | | | |
| DISTRIBUTIONS: | | | | | | | | | | | | | | | | | | | | | | | | |
| From net investment income | | | (0.21 | ) | | | (0.20 | ) | | | (0.09 | ) | | | (0.16 | ) | | | (0.23 | ) | | | (0.17 | ) |
| From net realized gains | | | (0.25 | ) | | | (0.64 | ) | | | – | | | | (0.56 | ) | | | – | | | | – | |
| Tax return of capital | | | – | | | | – | | | | – | | | | – | | | | – | | | | (0.00 | )(c) |
| Total distributions | | | (0.46 | ) | | | (0.84 | ) | | | (0.09 | ) | | | (0.72 | ) | | | (0.23 | ) | | | (0.17 | ) |
| | | | | | | | | | | | | | | | | | | | | | | | | |
| Net increase/(decrease) in net asset value | | | (0.26 | ) | | | (0.67 | ) | | | 0.16 | | | | 0.33 | | | | 0.70 | | | | (0.12 | ) |
| Net asset value, end of year | | $ | 11.22 | | | $ | 11.48 | | | $ | 12.15 | | | $ | 11.99 | | | $ | 11.66 | | | $ | 10.96 | |
TOTAL RETURN(d) | | | 1.81 | % | | | 1.33 | % | | | 2.12 | % | | | 9.16 | % | | | 8.59 | % | | | 0.55 | % |
| | | | | | | | | | | | | | | | | | | | | | | | | |
| RATIOS/SUPPLEMENTAL DATA: | | | | | | | | |
| Net assets, end of year (000s) | | $ | 22,679 | | | $ | 24,402 | | | $ | 27,598 | | | $ | 31,033 | | | $ | 29,066 | | | $ | 20,754 | |
| Ratio of expenses to average net assets excluding fee waivers and reimbursements | | | 1.31 | % | | | 1.30 | % | | | 1.31 | %(e) | | | 1.32 | % | | | 1.40 | % | | | 1.50 | % |
| Ratio of expenses to average net assets including fee waivers and reimbursements | | | 1.15 | % | | | 1.15 | % | | | 1.15 | %(e) | | | 1.15 | % | | | 1.19 | %(f) | | | 1.30 | % |
| Ratio of net investment income to average net assets | | | 1.87 | % | | | 1.97 | % | | | 1.54 | %(e) | | | 1.35 | % | | | 2.17 | % | | | 1.65 | % |
Portfolio turnover rate(g) | | | 132 | % | | | 110 | % | | | 42 | % | | | 98 | % | | | 108 | % | | | 128 | % |
(a) | Effective May 1, 2014, the Board approved changing the fiscal year-end of the Funds from April 30 to October 31. |
(b) | Calculated using the average shares method. |
(c) | Less than ($0.005) per share. |
(d) | Total returns are for the period indicated and have not been annualized. Total returns would have been lower had certain expenses not been waived during the period. Returns shown do not reflect the deduction of taxes that a shareholder would pay on Fund distributions or the redemption of Fund shares. Returns shown exclude any applicable sales charges. |
(f) | Contractual expense limitation change from 1.30% to 1.15% effective September 1, 2012. |
(g) | Portfolio turnover rate for periods less than one full year have not been annualized. |
See Notes to Financial Statements.
160 | October 31, 2016
RiverFront Moderate Growth & Income Fund – Class C
Financial Highlights
Selected data for a share of beneficial interest outstanding throughout the periods indicated:
| | | For the Year Ended October 31, 2016 | | | For the Year Ended October 31, 2015 | | | For the Fiscal Period Ended October 31, 2014(a) | | | For the Year Ended April 30, 2014 | | | For the Year Ended April 30, 2013 | | | For the Year Ended April 30, 2012 | |
| Net asset value, beginning of period | | $ | 11.39 | | | $ | 12.10 | | | $ | 11.94 | | | $ | 11.62 | | | $ | 10.92 | | | $ | 11.06 | |
| | | | | | | | | | | | | | | | | | | | | | | | | |
| INCOME/(LOSS) FROM INVESTMENT OPERATIONS: | | | | | | | | | | | | | |
Net investment income(b) | | | 0.13 | | | | 0.13 | | | | 0.05 | | | | 0.07 | | | | 0.16 | | | | 0.09 | |
| Net realized and unrealized gain/(loss) | | | (0.02 | ) | | | (0.06 | ) | | | 0.16 | | | | 0.89 | | | | 0.68 | | | | (0.13 | ) |
| Total from investment operations | | | 0.11 | | | | 0.07 | | | | 0.21 | | | | 0.96 | | | | 0.84 | | | | (0.04 | ) |
| | | | | | | | | | | | | | | | | | | | | | | | | |
| DISTRIBUTIONS: | | | | | | | | | | | | | | | | | | | | | | | | |
| From net investment income | | | (0.13 | ) | | | (0.14 | ) | | | (0.05 | ) | | | (0.08 | ) | | | (0.14 | ) | | | (0.10 | ) |
| From net realized gains | | | (0.25 | ) | | | (0.64 | ) | | | – | | | | (0.56 | ) | | | – | | | | – | |
| Tax return of capital | | | – | | | | – | | | | – | | | | – | | | | – | | | | (0.00 | )(c) |
| Total distributions | | | (0.38 | ) | | | (0.78 | ) | | | (0.05 | ) | | | (0.64 | ) | | | (0.14 | ) | | | (0.10 | ) |
| | | | | | | | | | | | | | | | | | | | | | | | | |
| Net increase/(decrease) in net asset value | | | (0.27 | ) | | | (0.71 | ) | | | 0.16 | | | | 0.32 | | | | 0.70 | | | | (0.14 | ) |
| Net asset value, end of year | | $ | 11.12 | | | $ | 11.39 | | | $ | 12.10 | | | $ | 11.94 | | | $ | 11.62 | | | $ | 10.92 | |
TOTAL RETURN(d) | | | 1.03 | % | | | 0.52 | % | | | 1.75 | % | | | 8.33 | % | | | 7.83 | % | | | (0.37 | )% |
| | | | | | | | | | | | | | | | | | | | | | | | | |
| RATIOS/SUPPLEMENTAL DATA: | | | | | |
| Net assets, end of year (000s) | | $ | 63,480 | | | $ | 70,771 | | | $ | 66,445 | | | $ | 63,031 | | | $ | 52,579 | | | $ | 39,015 | |
| Ratio of expenses to average net assets excluding fee waivers and reimbursements | | | 2.06 | % | | | 2.05 | % | | | 2.07 | %(e) | | | 2.07 | % | | | 2.15 | % | | | 2.25 | % |
| Ratio of expenses to average net assets including fee waivers and reimbursements | | | 1.90 | % | | | 1.90 | % | | | 1.90 | %(e) | | | 1.90 | % | | | 1.95 | %(f) | | | 2.05 | % |
| Ratio of net investment income to average net assets | | | 1.14 | % | | | 1.14 | % | | | 0.77 | %(e) | | | 0.59 | % | | | 1.43 | % | | | 0.88 | % |
Portfolio turnover rate(g) | | | 132 | % | | | 110 | % | | | 42 | % | | | 98 | % | | | 108 | % | | | 128 | % |
(a) | Effective May 1, 2014, the Board approved changing the fiscal year-end of the Funds from April 30 to October 31. |
(b) | Calculated using the average shares method. |
(c) | Less than ($0.005) per share. |
(d) | Total returns are for the period indicated and have not been annualized. Total returns would have been lower had certain expenses not been waived during the period. Returns shown do not reflect the deduction of taxes that a shareholder would pay on Fund distributions or the redemption of Fund shares. Returns shown exclude any applicable sales charges. |
(f) | Contractual expense limitation change from 2.05% to 1.90% effective September 1, 2012. |
(g) | Portfolio turnover rate for periods less than one full year have not been annualized. |
See Notes to Financial Statements.
161 | October 31, 2016
RiverFront Moderate Growth & Income Fund – Class I
Financial Highlights
Selected data for a share of beneficial interest outstanding throughout the periods indicated:
| | | For the Year Ended October 31, 2016 | | | For the Year Ended October 31, 2015 | | | For the Fiscal Period Ended October 31, 2014(a) | | | For the Year Ended April 30, 2014 | | | For the Year Ended April 30, 2013 | | | For the Year Ended April 30, 2012 | |
| Net asset value, beginning of period | | $ | 11.47 | | | $ | 12.14 | | | $ | 11.98 | | | $ | 11.65 | | | $ | 10.94 | | | $ | 11.07 | |
| | | | | | | | | | | | | | | | | | | | | | | | | |
| INCOME/(LOSS) FROM INVESTMENT OPERATIONS: | | | | | | | | | | | | | |
Net investment income(b) | | | 0.24 | | | | 0.25 | | | | 0.11 | | | | 0.19 | | | | 0.26 | | | | 0.20 | |
| Net realized and unrealized gain/(loss) | | | (0.01 | ) | | | (0.06 | ) | | | 0.16 | | | | 0.89 | | | | 0.70 | | | | (0.13 | ) |
| Total from investment operations | | | 0.23 | | | | 0.19 | | | | 0.27 | | | | 1.08 | | | | 0.96 | | | | 0.07 | |
| | | | | | | | | | | | | | | | | | | | | | | | | |
| DISTRIBUTIONS: | | | | | | | | | | | | | | | | | | | | | | | | |
| From net investment income | | | (0.24 | ) | | | (0.22 | ) | | | (0.11 | ) | | | (0.19 | ) | | | (0.25 | ) | | | (0.19 | ) |
| From net realized gains | | | (0.25 | ) | | | (0.64 | ) | | | – | | | | (0.56 | ) | | | – | | | | – | |
| Tax return of capital | | | – | | | | – | | | | – | | | | – | | | | – | | | | (0.01 | ) |
| Total distributions | | | (0.49 | ) | | | (0.86 | ) | | | (0.11 | ) | | | (0.75 | ) | | | (0.25 | ) | | | (0.20 | ) |
| | | | | | | | | | | | | | | | | | | | | | | | | |
| Net increase/(decrease) in net asset value | | | (0.26 | ) | | | (0.67 | ) | | | 0.16 | | | | 0.33 | | | | 0.71 | | | | (0.13 | ) |
| Net asset value, end of year | | $ | 11.21 | | | $ | 11.47 | | | $ | 12.14 | | | $ | 11.98 | | | $ | 11.65 | | | $ | 10.94 | |
TOTAL RETURN(c) | | | 2.05 | % | | | 1.50 | % | | | 2.25 | % | | | 9.43 | % | | | 8.94 | % | | | 0.71 | % |
| | | | | | | | | | | | | | | | | | | | | | | | | |
| RATIOS/SUPPLEMENTAL DATA: | | |
| Net assets, end of year (000s) | | $ | 43,056 | | | $ | 46,350 | | | $ | 42,081 | | | $ | 37,832 | | | $ | 25,898 | | | $ | 12,880 | |
| Ratio of expenses to average net assets excluding fee waivers and reimbursements | | | 1.06 | % | | | 1.05 | % | | | 1.07 | %(d) | | | 1.07 | % | | | 1.15 | % | | | 1.26 | % |
| Ratio of expenses to average net assets including fee waivers and reimbursements | | | 0.90 | % | | | 0.90 | % | | | 0.90 | %(d) | | | 0.90 | % | | | 0.94 | %(e) | | | 1.05 | % |
| Ratio of net investment income to average net assets | | | 2.16 | % | | | 2.16 | % | | | 1.77 | %(d) | | | 1.59 | % | | | 2.39 | % | | | 1.91 | % |
Portfolio turnover rate(f) | | | 132 | % | | | 110 | % | | | 42 | % | | | 98 | % | | | 108 | % | | | 128 | % |
(a) | Effective May 1, 2014, the Board approved changing the fiscal year-end of the Funds from April 30 to October 31. |
(b) | Calculated using the average shares method. |
(c) | Total returns are for the period indicated and have not been annualized. Total returns would have been lower had certain expenses not been waived during the period. Returns shown do not reflect the deduction of taxes that a shareholder would pay on Fund distributions or the redemption of Fund shares. |
(e) | Contractual expense limitation change from 1.05% to 0.90% effective September 1, 2012. |
(f) | Portfolio turnover rate for periods less than one full year have not been annualized. |
See Notes to Financial Statements.
162 | October 31, 2016
Notes to Financial Statements
October 31, 2016
1. ORGANIZATION
Financial Investors Trust (the “Trust”), a Delaware statutory trust, is an open‐end management investment company registered under the Investment Company Act of 1940, as amended (“1940 Act”). The Trust consists of multiple separate portfolios or series. This annual report includes the financial statements and financial highlights of the following 13 funds: ALPS | Alerian MLP Infrastructure Index Fund, ALPS | CoreCommodity Management CompleteCommodities® Strategy Fund, ALPS | Kotak India Growth Fund, ALPS | Metis Global Micro Cap Fund, ALPS | Red Rocks Listed Private Equity Fund, ALPS | Sterling ETF Tactical Rotation Fund, ALPS | WMC Research Value Fund, Clough China Fund, RiverFront Conservative Income Builder Fund, RiverFront Dynamic Equity Income Fund, RiverFront Global Allocation Fund, RiverFront Global Growth Fund and RiverFront Moderate Growth & Income Fund (each, a “Fund” and collectively, the “Funds”). The Funds are considered investment companies under U.S. GAAP and follows the accounting and reporting guidance applicable to investment companies in the Financial Accounting Standards Board Accounting Standards Codification Topic 946.
ALPS | Alerian MLP Infrastructure Index Fund seeks investment results that correspond (before fees and expenses) generally to the price and yield performance of its underlying index, the Alerian MLP Infrastructure Index. The ALPS | CoreCommodity Management CompleteCommodities® Strategy Fund seeks to maximize real returns (returns after inflation), consistent with prudent investment management. ALPS | Kotak India Growth Fund’s investment goal is long‐term capital appreciation. ALPS | Metis Global Micro Cap Fund seeks long‐term growth of capital. ALPS | Red Rocks Listed Private Equity Fund seeks to maximize total return, which consists of appreciation on its investments and a variable income stream. ALPS | Sterling ETF Tactical Rotation Fund seeks investment results that correspond (before fees and expenses) generally to the performance of the Sterling Tactical Rotation Index. ALPS | WMC Research Value Fund seeks long‐term capital appreciation: dividend income may be a factor in portfolio selection but is secondary to the Fund’s principal objective. The Clough China Fund seeks to provide investors with long‐term capital appreciation. The RiverFront Conservative Income Builder Fund seeks to provide current income and potential for that income to grow over time. The RiverFront Dynamic Equity Income Fund seeks to achieve long‐term growth and income through a combination of capital appreciation and rising dividend payments that exceed the average yield on global stocks generally. The RiverFront Global Allocation Fund seeks to provide high total investment return through a fully managed investment policy utilizing United States and foreign equity securities, debt and money market securities, the combination of which will be varied from time to time both with respect to types of securities and markets in response to changing market and economic trends. Total investment return means the combination of capital appreciation and investment income. The RiverFront Global Growth Fund seeks to achieve long‐term capital appreciation through a fully managed investment policy utilizing United States and foreign equity securities, debt and money market securities, the combination of which will be varied from time to time both with respect to types of securities and markets in response to changing market and economic trends. The RiverFront Moderate Growth & Income Fund has two primary investment objectives. It seeks (1) to provide a level of current income that exceeds the average yield on U.S. stocks in general while providing a growing stream of income over the years and (2) growth of capital.
The classes of each Fund differ principally in the applicable distribution and shareholder service fees. Shareholders of each class also bear certain expenses that pertain to that particular class. All shareholders bear the common expenses of the Fund and earn income and realized gains/losses from the Fund pro rata based on the average daily net assets of each class, without distinction between share classes. Dividends to shareholders are determined separately for each class based on income and expenses allocable to each class. Realized gain distributions to shareholders are allocated to each class pro rata based on the shares outstanding of each class on the date of distribution. Differences in per share dividend rates generally result from differences in separate class expenses, including distribution and shareholder service fees, if applicable.
Basis of Consolidation for the ALPS | CoreCommodity Management CompleteCommodities® Strategy Fund
CoreCommodity Management Cayman Commodity Fund Ltd. (the “Subsidiary”), a Cayman Islands exempted company, was incorporated on April 23, 2010 and is a wholly owned subsidiary of the ALPS | CoreCommodity Management CompleteCommodities® Strategy Fund (the “CoreCommodity Fund”). The Subsidiary acts as an investment vehicle for the CoreCommodity Fund in order to effect certain commodity ‐related investments on behalf of the CoreCommodity Fund. CoreCommodity Fund is the sole shareholder of the Subsidiary pursuant to a subscription agreement dated as of June 14, 2010, and it is intended that the CoreCommodity Fund will remain the sole shareholder and will continue to wholly own and control the Subsidiary. Under the Articles of Association of the Subsidiary, shares issued by the Subsidiary confer upon a shareholder the right to vote at general meetings of the Subsidiary and certain rights in connection with any winding‐up or repayment of capital, as well as the right to participate in the profits or assets of the Subsidiary. The CoreCommodity Fund may invest up to 25% of its total assets in shares of the Subsidiary. As a wholly owned subsidiary of the CoreCommodity Fund, the financial statements of the Subsidiary are included in the consolidated financial statements and financial highlights of the CoreCommodity Fund. All investments held by the Subsidiary are disclosed in the accounts of the CoreCommodity Fund. As of October 31, 2016, net assets of the CoreCommodity Fund were $500,468,368 of which $99,357,508 or 19.85%, represented the CoreCommodity Fund’s ownership of all issued shares and voting rights of the Subsidiary.
Basis of Consolidation for the ALPS | Kotak India Growth Fund
ALPS | Kotak India Growth Fund, (the “Kotak Fund”) invests in the equity securities of Indian companies through its wholly owned, collective investment vehicle, the India Premier Equity Portfolio (the “Portfolio”). The Portfolio is registered with and regulated by the Mauritius Financial Services Commission. The Portfolio was formed for the purpose of facilitating the Kotak Fund’s purchase of securities of a wide selection of Indian companies, consistent with the Kotak Fund’s investment strategies. The Portfolio is a private company limited by shares incorporated under the Mauritius Companies Act 2001. As a wholly owned subsidiary of the Kotak Fund, financial statements of the Portfolio are included in the consolidated financial statements and financial highlights of the Kotak Fund. All investments held by the Portfolio are disclosed in the accounts of the Kotak Fund.
163 | October 31, 2016
Notes to Financial Statements
October 31, 2016
The Portfolio established residency in Mauritius allowing the Kotak Fund to receive the beneficial tax treatment under the Treaty between India and Mauritius. If the benefits of the Treaty are denied or if the Portfolio is held to have a permanent establishment in India, gains derived by the Portfolio due to the sale of securities may be subject to taxation in India. India’s Finance Act had introduced legislation on General Anti‐Avoidance Rules (“GAAR”) which contains treaty override provisions. The GAAR, which is now expected to come into effect from April 1, 2017, may be used by the Indian tax authorities to declare any arrangement whose main purpose or one of the main purposes is to obtain a tax benefit, as an “impermissible avoidance arrangement.”
2. SIGNIFICANT ACCOUNTING POLICIES
The following is a summary of significant accounting policies consistently followed by each Fund in the preparation of its financial statements. Each Fund is considered an investment company for financial reporting purposes, and follows accounting policies in conformity with accounting principles generally accepted in the United States of America (“U.S. GAAP”), including policies specific to investment companies. The preparation of financial statements in conformity with U.S. GAAP requires management to make certain estimates and assumptions that affect the reported amounts of assets and liabilities and disclosures of contingent assets and liabilities at the date of the financial statements and the reported amounts of revenue and expenses during the period. Actual results could differ from those estimates. The following is a summary of significant accounting policies consistently followed by the Funds and subsidiaries, as applicable, in preparation of their financial statements.
Investment Valuation: The Funds generally value their securities based on market prices determined at the close of regular trading on the New York Stock Exchange (“NYSE”), normally 4:00 p.m. Eastern Time, on each day the NYSE is open for trading. For equity securities and mutual funds that are traded on an exchange, the market price is usually the closing sale or official closing price on that exchange.
Corporate bonds, convertible corporate bonds, and U.S. Treasury bonds, are generally valued at the mean between the closing bid and asked prices provided by an independent pricing service. The pricing services generally uses market models that consider trade data, yields, spreads, quotations from dealers and active market makers, credit worthiness, market information on comparable securities, and other relevant security specific information.
Short‐term obligations with maturities of 60 days or less are valued at amortized cost, which approximates market value. Open end funds and money market mutual funds are valued at their net asset value.
Futures contracts that are listed or traded on a national securities exchange, commodities exchange, contract market or comparable over the counter market, and that are freely transferable, are valued at their closing settlement price on the exchange on which they are primarily traded or based upon the current settlement price for a like instrument acquired on the day on which the instrument is being valued. A settlement price may not be used if the market makes a limit move with respect to a particular commodity. Over‐the‐counter swap contracts are valued based on quotes received from independent pricing services or one or more dealers that make markets in such investments.
Option contracts are valued using the National Best Bid and Offer price (“NBBO”). In the event there is no NBBO price available, option contracts are valued at the mean between the last bid and ask.
Equity securities that are primarily traded on foreign securities exchanges are valued at the closing values of such securities on their respective foreign exchanges, except when an event occurs subsequent to the close of the foreign exchange and the close of the NYSE that was likely to have changed such value. In such an event, the fair value of those securities are determined in good faith through consideration of other factors in accordance with procedures established by and under the general supervision of the Board. The Funds will use a fair valuation model provided by an independent pricing service, which is intended to reflect fair value when a security’s value or a meaningful portion of the Fund’s portfolio is believed to have been materially affected by an valuation event that has occurred between the close of the exchange or market on which the security is traded and the close of the regular trading day on the NYSE.
Forward currency exchange contracts have a value determined by the current foreign currency exchange forward rates. The foreign currency exchange forward rates are calculated using an automated system that estimates rates on the basis of the current day foreign currency exchange rates and forward foreign currency exchange rates supplied by a pricing service. Foreign exchange rates and forward foreign currency exchange rates may generally be obtained at the close of the NYSE, normally 4:00 p.m. Eastern Time.
164 | October 31, 2016
Notes to Financial Statements
October 31, 2016
When such prices or quotations are not available, or when the Fair Value Committee appointed by the Board believes that they are unreliable, securities may be priced using fair value procedures approved by the Board. The fair valuation policies and procedures (“FV Procedures”) have been adopted by the Board for the fair valuation of portfolio assets held by the Fund(s) in the event that (1) market quotations for the current price of a portfolio security or asset are not readily available, or (2) available market quotations that would otherwise be used to value a portfolio security or asset in accordance with the Fund’s Pricing Procedures appear to be unreliable. The Pricing Procedures reflect certain pricing methodologies (or “logics”) that are not “readily available market quotations” and thus are viewed and treated as fair valuations. The Fair Value Committee routinely meets to discuss fair valuations of portfolio securities and other instruments held by the Fund(s).
Fair Value Measurements: The Funds disclose the classification of their fair value measurements following a three‐tier hierarchy based on the inputs used to measure fair value. Inputs refer broadly to the assumptions that market participants would use in pricing the asset or liability, including assumptions about risk. Inputs may be observable or unobservable. Observable inputs reflect the assumptions market participants would use in pricing the asset or liability that are developed based on market data obtained from sources independent of the reporting entity. Unobservable inputs reflect the reporting entity’s own assumptions about the assumptions market participants would use in pricing the asset or liability that are developed based on the best information available.
Various inputs are used in determining the value of each Fund’s investments as of the end of the reporting period. When inputs used fall into different levels of the fair value hierarchy, the level in the hierarchy within which the fair value measurement falls is determined based on the lowest level input that is significant to the fair value measurement in its entirety. The designated input levels are not necessarily an indication of the risk or liquidity associated with these investments. These inputs are categorized in the following hierarchy under applicable financial accounting standards:
| Level 1 – | Unadjusted quoted prices in active markets for identical investments, unrestricted assets or liabilities that a Fund has the ability to access at the measurement date; |
| Level 2 – | Quoted prices which are not active, quoted prices for similar assets or liabilities in active markets or inputs other than quoted prices that are observable (either directly or indirectly) for substantially the full term of the asset or liability; and |
| Level 3 – | Significant unobservable prices or inputs (including the Fund’s own assumptions in determining the fair value of investments) where there is little or no market activity for the asset or liability at the measurement date. |
The following is a summary of each Fund’s investments/financial instruments in the fair value hierarchy as of October 31, 2016:
| Investments in Securities at Value | | Level 1 - Unadjusted Quoted Prices | | | Level 2 - Other Significant Observable Inputs | | | Level 3 - Significant Unobservable Inputs | | | Total | |
| ALPS | Alerian MLP Infrastructure Index Fund | | | | | | | | | | |
Master Limited Partnerships(a) | | $ | 40,907,718 | | | $ | – | | | $ | – | | | $ | 40,907,718 | |
| Total | | $ | 40,907,718 | | | $ | – | | | $ | – | | | $ | 40,907,718 | |
| Investments in Securities at Value | | Level 1 - Unadjusted Quoted Prices | | | Level 2 - Other Significant Observable Inputs | | | Level 3 - Significant Unobservable Inputs | | | Total | |
ALPS | CoreCommodity Management CompleteCommodities® Strategy Fund | | | | | | | |
Common Stocks(a) | | $ | 137,336,008 | | | $ | – | | | $ | – | | | $ | 137,336,008 | |
Master Limited Partnerships(a) | | | 1,111,518 | | | | – | | | | – | | | | 1,111,518 | |
| Warrants | | | – | | | | – | | | | 0 | | | | 0 | |
| Government Bonds | | | – | | | | 315,051,731 | | | | – | | | | 315,051,731 | |
| Short Term Investments | | | 44,477,175 | | | | – | | | | – | | | | 44,477,175 | |
| TOTAL | | $ | 182,924,701 | | | $ | 315,051,731 | | | $ | 0 | | | $ | 497,976,432 | |
| Other Financial Instruments | | | | | | | | | | | | | | | | |
| Assets | | | | | | | | | | | | | | | | |
| Futures Contracts | | $ | 1,831,634 | | | $ | – | | | $ | – | | | $ | 1,831,634 | |
| Total Return Swap Contracts | | | – | | | | 611,565 | | | | – | | | | 611,565 | |
| Liabilities | | | | | | | | | | | | | | | | |
| Futures Contracts | | | (3,162,092 | ) | | | – | | | | – | | | | (3,162,092 | ) |
| Total Return Swap Contracts | | | – | | | | (796,828 | ) | | | – | | | | (796,828 | ) |
| Total | | $ | (1,330,458 | ) | | $ | (185,263 | ) | | $ | – | | | $ | (1,515,721 | ) |
165 | October 31, 2016
Notes to Financial Statements
October 31, 2016
| Investments in Securities at Value | | Level 1 - Unadjusted Quoted Prices | | | Level 2 - Other Significant Observable Inputs | | | Level 3 - Significant Unobservable Inputs | | | Total | |
| ALPS | Kotak India Growth Fund | | | | | | | | | | | | |
| Common Stocks | | | | | | | | | | | | |
| Consumer Discretionary | | $ | 250,699 | | | $ | 1,874,151 | | | $ | – | | | $ | 2,124,850 | |
| Consumer Staples | | | – | | | | 1,537,253 | | | | – | | | | 1,537,253 | |
| Energy | | | – | | | | 704,916 | | | | – | | | | 704,916 | |
| Financials | | | – | | | | 4,764,884 | | | | – | | | | 4,764,884 | |
| Health Care | | | 189,897 | | | | 967,355 | | | | – | | | | 1,157,252 | |
| Industrials | | | – | | | | 1,965,751 | | | | – | | | | 1,965,751 | |
| Information Technology | | | – | | | | 1,770,684 | | | | – | | | | 1,770,684 | |
| Materials | | | 318,920 | | | | 2,302,139 | | | | – | | | | 2,621,059 | |
| Telecommunication Services | | | – | | | | 46,051 | | | | – | | | | 46,051 | |
| Short Term Investments | | | 118,939 | | | | – | | | | – | | | | 118,939 | |
| Total | | $ | 878,455 | | | $ | 15,933,184 | | | $ | – | | | $ | 16,811,639 | |
| Investments in Securities at Value | | Level 1 - Unadjusted Quoted Prices | | | Level 2 - Other Significant Observable Inputs | | | Level 3 - Significant Unobservable Inputs | | | Total | |
| ALPS | Metis Global Micro Cap Fund | | | | | | | | | | | | |
| Common Stocks | | | | | | | | | | | | |
| Australia | | $ | 187,721 | | | $ | 629,505 | | | $ | – | | | $ | 817,226 | |
| Brazil | | | 313,928 | | | | – | | | | – | | | | 313,928 | |
| Canada | | | 458,367 | | | | – | | | | – | | | | 458,367 | |
| Chile | | | 36,446 | | | | – | | | | – | | | | 36,446 | |
| China | | | – | | | | 143,338 | | | | – | | | | 143,338 | |
| France | | | 127,705 | | | | 117,226 | | | | – | | | | 244,931 | |
| Germany | | | 58,117 | | | | 58,760 | | | | – | | | | 116,877 | |
| Great Britain | | | 491,741 | | | | – | | | | – | | | | 491,741 | |
| Greece | | | 71,148 | | | | – | | | | – | | | | 71,148 | |
| Hong Kong | | | 46,380 | | | | 308,047 | | | | – | | | | 354,427 | |
| India | | | – | | | | 339,880 | | | | – | | | | 339,880 | |
| Indonesia | | | – | | | | 140,380 | | | | – | | | | 140,380 | |
| Ireland | | | 46,564 | | | | – | | | | – | | | | 46,564 | |
| Israel | | | 156,340 | | | | – | | | | – | | | | 156,340 | |
| Japan | | | – | | | | 3,777,135 | | | | – | | | | 3,777,135 | |
| Luxembourg | | | 79,955 | | | | – | | | | – | | | | 79,955 | |
| Malaysia | | | 98,087 | | | | 136,738 | | | | – | | | | 234,825 | |
| Netherlands | | | – | | | | 62,141 | | | | – | | | | 62,141 | |
| New Zealand | | | 58,439 | | | | 60,648 | | | | – | | | | 119,087 | |
| Norway | | | – | | | | 147,030 | | | | – | | | | 147,030 | |
| Pakistan | | | 152,953 | | | | – | | | | – | | | | 152,953 | |
| Poland | | | 42,226 | | | | – | | | | – | | | | 42,226 | |
| Singapore | | | 162,592 | | | | 37,752 | | | | – | | | | 200,344 | |
| South Africa | | | – | | | | 38,095 | | | | – | | | | 38,095 | |
| South Korea | | | 54,333 | | | | 1,241,244 | | | | – | | | | 1,295,577 | |
| Sweden | | | 57,146 | | | | 71,996 | | | | – | | | | 129,142 | |
| Taiwan | | | 58,332 | | | | 871,156 | | | | – | | | | 929,488 | |
| Thailand | | | 45,267 | | | | 203,106 | | | | – | | | | 248,373 | |
| Turkey | | | – | | | | 45,753 | | | | – | | | | 45,753 | |
| United States | | | 3,400,925 | | | | – | | | | – | | | | 3,400,925 | |
Preferred Stocks(a) | | | 175,962 | | | | – | | | | – | | | | 175,962 | |
| Short Term Investments | | | 1,390,997 | | | | – | | | | – | | | | 1,390,997 | |
| Total | | $ | 7,771,671 | | | $ | 8,429,930 | | | $ | – | | | $ | 16,201,601 | |
166 | October 31, 2016
Notes to Financial Statements
October 31, 2016
| Investments in Securities at Value | | Level 1 - Unadjusted Quoted Prices | | | Level 2 - Other Significant Observable Inputs | | | Level 3 - Significant Unobservable Inputs | | | Total | |
| ALPS | Red Rocks Listed Private Equity Fund | | | | | | | | | | |
| Closed‐End Funds | | $ | 25,029,354 | | | $ | – | | | $ | – | | | $ | 25,029,354 | |
Common Stocks(a) | | | 296,342,367 | | | | – | | | | – | | | | 296,342,367 | |
| Short Term Investments | | | 7,592,066 | | | | – | | | | – | | | | 7,592,066 | |
| Total | | $ | 328,963,787 | | | $ | – | | | $ | – | | | $ | 328,963,787 | |
| Investments in Securities at Value | | Level 1 - Unadjusted Quoted Prices | | | Level 2 - Other Significant Observable Inputs | | | Level 3 - Significant Unobservable Inputs | | | Total | |
| ALPS | Sterling ETF Tactical Rotation Fund | | | | | | | | | | |
| Exchange Traded Funds | | $ | 12,128,230 | | | $ | – | | | $ | – | | | $ | 12,128,230 | |
| Total | | $ | 12,128,230 | | | $ | – | | | $ | – | | | $ | 12,128,230 | |
| Investments in Securities at Value | | Level 1 - Unadjusted Quoted Prices | | | Level 2 - Other Significant Observable Inputs | | | Level 3 - Significant Unobservable Inputs | | | Total | |
| ALPS | WMC Research Value Fund | | | | | | | | | | | | |
Common Stocks(a) | | $ | 91,426,440 | | | $ | – | | | $ | – | | | $ | 91,426,440 | |
| Short Term Investments | | | 1,478,748 | | | | – | | | | – | | | | 1,478,748 | |
| Total | | $ | 92,905,188 | | | $ | – | | | $ | – | | | $ | 92,905,188 | |
| Other Financial Instruments | | | | | | | | | | | | | | | | |
| Liabilities | | | | | | | | | | | | | | | | |
| Futures Contracts | | $ | (13,220 | ) | | $ | – | | | $ | – | | | $ | (13,220 | ) |
| Total | | $ | (13,220 | ) | | $ | – | | | $ | – | | | $ | (13,220 | ) |
| Investments in Securities at Value | | Level 1 - Unadjusted Quoted Prices | | | Level 2 - Other Significant Observable Inputs | | | Level 3 - Significant Unobservable Inputs | | | Total | |
| Clough China Fund | | | | | | | | | | | | |
| Common Stocks | | | | | | | | | | | | |
| Consumer Discretionary | | $ | 735,471 | | | $ | 5,396,652 | | | $ | – | | | $ | 6,132,123 | |
| Consumer, Cyclical | | | – | | | | 1,375,718 | | | | – | | | | 1,375,718 | |
| Consumer, Non‐cyclical | | | 365,915 | | | | 424,965 | | | | – | | | | 790,880 | |
| Energy | | | – | | | | 4,287,219 | | | | – | | | | 4,287,219 | |
| Financials | | | – | | | | 12,146,764 | | | | – | | | | 12,146,764 | |
| Health Care | | | – | | | | 485,600 | | | | – | | | | 485,600 | |
| Industrials | | | 386,004 | | | | 2,545,016 | | | | – | | | | 2,931,020 | |
| Information Technology | | | 6,032,598 | | | | 7,818,189 | | | | – | | | | 13,850,787 | |
| Materials | | | – | | | | 1,860,170 | | | | – | | | | 1,860,170 | |
| Real Estate | | | – | | | | 1,200,158 | | | | – | | | | 1,200,158 | |
| Technology | | | 187,824 | | | | – | | | | – | | | | 187,824 | |
| Telecommunication Services | | | – | | | | 5,000,596 | | | | – | | | | 5,000,596 | |
| Utilities | | | – | | | | 276,622 | | | | – | | | | 276,622 | |
Participation Notes(a) | | | – | | | | 2,065,705 | | | | – | | | | 2,065,705 | |
| Short Term Investments | | | 2,182,921 | | | | – | | | | – | | | | 2,182,921 | |
| Total | | $ | 9,890,733 | | | $ | 44,883,374 | | | $ | – | | | $ | 54,774,107 | |
| Investments in Securities at Value | | Level 1 - Unadjusted Quoted Prices | | | Level 2 - Other Significant Observable Inputs | | | Level 3 - Significant Unobservable Inputs | | | Total | |
| RiverFront Conservative Income Builder Fund | | | | | | | | | | |
Exchange Traded Funds(a) | | $ | 14,267,545 | | | $ | – | | | $ | – | | | $ | 14,267,545 | |
Exchange Traded Notes(a) | | | 265,730 | | | | – | | | | – | | | | 265,730 | |
| Short Term Investments | | | 325,798 | | | | – | | | | – | | | | 325,798 | |
| Total | | $ | 14,859,073 | | | $ | – | | | $ | – | | | $ | 14,859,073 | |
167 | October 31, 2016
Notes to Financial Statements
October 31, 2016
| Investments in Securities at Value | | Level 1 - Unadjusted Quoted Prices | | | Level 2 - Other Significant Observable Inputs | | | Level 3 - Significant Unobservable Inputs | | | Total | |
| RiverFront Dynamic Equity Income Fund | | | | | | | | | | | | |
Common Stocks(a) | | $ | 1,296,543 | | | $ | – | | | $ | – | | | $ | 1,296,543 | |
Exchange Traded Funds(a) | | | 73,355,457 | | | | – | | | | – | | | | 73,355,457 | |
Exchange Traded Notes(a) | | | 2,806,909 | | | | – | | | | – | | | | 2,806,909 | |
| Short Term Investments | | | 3,890,480 | | | | – | | | | – | | | | 3,890,480 | |
| Total | | $ | 81,349,389 | | | $ | – | | | $ | – | | | $ | 81,349,389 | |
| Investments in Securities at Value | | Level 1 - Unadjusted Quoted Prices | | | Level 2 - Other Significant Observable Inputs | | | Level 3 - Significant Unobservable Inputs | | | Total | |
| RiverFront Global Allocation Fund | | | | | | | | | | | | |
Common Stocks(a) | | $ | 586,554 | | | $ | – | | | $ | – | | | $ | 586,554 | |
Exchange Traded Funds(a) | | | 32,482,920 | | | | – | | | | – | | | | 32,482,920 | |
Exchange Traded Notes(a) | | | 1,234,544 | | | | – | | | | – | | | | 1,234,544 | |
| Short Term Investments | | | 1,169,020 | | | | – | | | | – | | | | 1,169,020 | |
| Total | | $ | 35,473,038 | | | $ | – | | | $ | – | | | $ | 35,473,038 | |
| Investments in Securities at Value | | Level 1 - Unadjusted Quoted Prices | | | Level 2 - Other Significant Observable Inputs | | | Level 3 - Significant Unobservable Inputs | | | Total | |
| RiverFront Global Growth Fund | | | | | | | | | | | | |
Common Stocks(a) | | $ | 954,962 | | | $ | – | | | $ | – | | | $ | 954,962 | |
Exchange Traded Funds(a) | | | 53,746,900 | | | | – | | | | – | | | | 53,746,900 | |
Exchange Traded Notes(a) | | | 2,356,597 | | | | – | | | | – | | | | 2,356,597 | |
| Short Term Investments | | | 1,421,691 | | | | – | | | | – | | | | 1,421,691 | |
| Total | | $ | 58,480,150 | | | $ | – | | | $ | – | | | $ | 58,480,150 | |
| Investments in Securities at Value | | Level 1 - Unadjusted Quoted Prices | | | Level 2 - Other Significant Observable Inputs | | | Level 3 - Significant Unobservable Inputs | | | Total | |
| RiverFront Moderate Growth & Income Fund | | | | | | | | | | |
Common Stocks(a) | | $ | 2,075,221 | | | $ | – | | | $ | – | | | $ | 2,075,221 | |
Exchange Traded Funds(a) | | | 118,160,244 | | | | – | | | | – | | | | 118,160,244 | |
Exchange Traded Notes(a) | | | 3,774,948 | | | | – | | | | – | | | | 3,774,948 | |
| Short Term Investments | | | 5,608,307 | | | | – | | | | – | | | | 5,608,307 | |
| Total | | $ | 129,618,720 | | | $ | – | | | $ | – | | | $ | 129,618,720 | |
| (a) | For detailed descriptions of country, sector and/or industry, see the accompanying Statement of Investments or Consolidated Statement of Investments. |
The Funds recognize transfers between levels as of the end of the period. For the Fiscal Year or Period Ended October 31, 2016, the Funds did not have any transfers between Level 1 and Level 2 securities, except the ALPS | Kotak India Growth Fund. The ALPS | Kotak India Growth Fund utilizes a fair value evaluation service with respect to international securities with an earlier market closing than the Fund’s net asset value computation cutoff. When events trigger the use of the fair value evaluation service on a reporting period date, it results in certain securities transferring from a Level 1 to a Level 2 classification. The transfer amounts disclosed in the table below represents the value of the securities as of October 31, 2016 transferred in/(out) of Level 1 and Level 2 during the reporting period that were also held at October 31, 2015.
The ALPS | Kotak India Growth Fund had the following transfers between Levels 1 and 2 at October 31, 2016:
| | | Level 1 - Quoted and Unadjusted Prices | | | Level 2 - Other Significant Observable Inputs | |
| | | Transfers In | | | Transfers (Out) | | | Transfers In | | | Transfers (Out) | |
| Common Stock | | $ | 318,920 | | | $ | (343,771 | ) | | $ | 343,771 | | | $ | (318,920 | ) |
| Total | | $ | 318,920 | | | $ | (343,771 | ) | | $ | 343,771 | | | $ | (318,920 | ) |
Due to the short term nature of the payable due to custodian ‐ overdraft, face value approximates fair value at October 31, 2016. This fair value is based on Level 2 inputs under the three‐tier fair valuation hierarchy described above.
168 | October 31, 2016
Notes to Financial Statements
October 31, 2016
Offering Costs: The ALPS | Metis Global Micro Cap Fund incurred offering costs during the Fiscal Period Ended October 31, 2016. These offering costs, including fees for printing initial prospectuses, legal, and registration fees, are being amortized over the first twelve months from the inception date of the Fund. Amounts amortized through October 31, 2016 are shown on the Fund’s Statement of Operations.
Fund and Class Expenses: Some expenses of the Trust can be directly attributed to a Fund or a specific share class of a Fund. Expenses which cannot be directly attributed are apportioned among all Funds in the Trust based on average net assets of each share class within a Fund.
Federal Income Taxes: The Funds, except for ALPS | Alerian MLP Infrastructure Index Fund, comply with the requirements under Subchapter M of the Internal Revenue Code of 1986, as amended (the “Code”) applicable to regulated investment companies and intend to distribute substantially all of their net taxable income and net capital gains, if any, each year. Those Funds are not subject to income taxes to the extent such distributions are made.
The ALPS | Alerian MLP Infrastructure Index Fund is taxed as a regular corporation (or so‐called subchapter “C” corporation) for federal income tax purposes, and will be subject to tax on its taxable income at rates applicable to corporations. Currently, the maximum marginal regular federal income tax rate for a corporation is 35 percent, but the Fund expects to pay federal income tax at a rate of 34 percent. The ALPS | Alerian MLP Infrastructure Index Fund may be subject to a 20 percent federal alternative minimum tax on its federal alternative taxable income to the extent that its alternative minimum tax exceeds its regular federal income tax. This differs from most investment companies, which elect to be treated as “regulated investment companies” under the Code in order to avoid paying entity level income taxes. Under current law, the ALPS | Alerian MLP Infrastructure Index Fund is not eligible to elect treatment as a regulated investment company due to its investments, primarily in Master Limited Partnerships (“MLPs”) invested in energy assets. As a result, the ALPS | Alerian MLP Infrastructure Index Fund will be obligated to pay applicable federal and state corporate income taxes on its taxable income as opposed to most other investment companies which are not so obligated. As discussed below, the ALPS | Alerian MLP Infrastructure Index Fund expects that a portion of the distributions it receives from MLPs may be treated as a tax-deferred return of capital, thus reducing the Fund’s current tax liability. However, the amount of taxes currently paid by the ALPS | Alerian MLP Infrastructure Index Fund will vary depending on the amount of income and gains derived from investments and/or sales of MLP interests and such taxes will reduce the return from an investment in the Fund. See further disclosure regarding MLPs below.
As of and during the Fiscal Year or Period Ended October 31, 2016, the Funds, except the ALPS | Alerian MLP Infrastructure Index Fund, did not have a liability for any unrecognized tax benefits. The Funds file U.S. federal, state, and local tax returns as required. The Funds’ tax returns are subject to examination by the relevant tax authorities until expiration of the applicable statute of limitations which is generally three years after the filing of the tax return, but may extend to four years in certain jurisdictions. Tax returns for open years have incorporated no uncertain tax positions that require a provision for income taxes.
Distributions to Shareholders: Each Fund, except the ALPS | Alerian MLP Infrastructure Index Fund, RiverFront Conservative Income Builder Fund, RiverFront Dynamic Equity Income Fund, and RiverFront Moderate Growth & Income Fund normally pays dividends and distributes capital gains, if any, on an annual basis. The ALPS | Alerian MLP Infrastructure Index Fund, RiverFront Conservative Income Builder Fund, RiverFront Dynamic Equity Income Fund, and RiverFront Moderate Growth & Income Fund normally pay dividends, if any, on a quarterly basis and distribute capital gains annually. Income dividend distributions are derived from interest and other income a Fund receives from its investments, including distributions of short-term capital gains. Capital gain distributions are derived from gains realized when a Fund sells a security it has owned for more than a year or from long-term capital gain distributions from underlying investments. Each Fund may make additional distributions and dividends at other times if its portfolio manager or managers believe doing so may be necessary for the Fund to avoid or reduce taxes.
Distributions received from the ALPS | Alerian MLP Infrastructure Index Fund’s investments in MLPs generally are comprised of income and return of capital. The Fund records investment income and return of capital based on estimates made at the time such distributions are received. Such estimates are based on historical information available from each MLP and other industry sources. These estimates may subsequently be revised based on information received from MLPs after their tax reporting periods are concluded. Return of capital distributions are not taxable income to the shareholder, but reduce the investor’s tax basis in the investor’s Fund shares. Such a reduction in tax basis will result in larger taxable gains and/or lower tax losses on a subsequent sale of Fund shares. Shareholders who periodically receive the payment of dividends or other distributions consisting of a return of capital may be under the impression that they are receiving net profits from the Fund when, in fact, they are not. Shareholders should not assume that the source of the distributions is from the net profits of the Fund.
Commodity-Linked Notes: The ALPS | CoreCommodity Management CompleteCommodities® Strategy Fund may invest in commodity-linked notes which are derivative instruments that have characteristics of a debt security and of a commodity-linked derivative. A commodity-linked note typically provides for interest payments and a principal payment at maturity linked to the price movement of the underlying commodity, commodity index or commodity futures or option contract. Commodity-linked notes may be principal protected, partially protected, or offer no principal protection. The value of these notes will rise and fall in response to changes in the underlying commodity or related index or investment. These notes are often leveraged, increasing the volatility of each note’s value relative to the change in the underlying linked index. Commodity index-linked investments may be more volatile and less liquid than the underlying index and their value may be affected by the performance of the commodities as well as other factors, including liquidity, quality, maturity and other economic variables. Commodity-linked notes are typically issued by a bank or other financial institution and are sometimes referred to as structured notes because the terms of the notes may be structured by the issuer and the purchaser of the notes to accommodate the specific investment requirements of the purchaser.
169 | October 31, 2016
Notes to Financial Statements
October 31, 2016
Exchange Traded Funds (ETFs): Each Fund may invest in shares of ETFs and other similar instruments if the investment manager chooses to adjust a Fund’s exposure to the general market or industry sectors and to manage a Fund’s risk exposure. ETFs differ from traditional index funds in that their shares are listed on a securities exchange and can be traded intraday. ETF shares are shares of exchange traded investment companies that are registered under the 1940 Act and hold a portfolio of common stocks designed to track the performance of a particular index. Limitations of the 1940 Act may prohibit a Fund from acquiring more than 3% of the outstanding shares of certain ETFs. Instruments that are similar to ETFs represent beneficial ownership interests in specific “baskets” of stocks of companies within a particular industry sector or group. These securities may also be exchange traded, but unlike ETFs, the issuers of these securities are not registered as investment companies.
The portfolio manager may decide to purchase or sell short ETF shares or options on ETF shares for the same reasons it would purchase or sell (and as an alternative to purchasing or selling) futures contracts – to obtain exposure to the stock market or a particular segment of the stock market, or to hedge a Fund’s portfolio against such exposures. Depending on the market, the holding period and other factors, the use of ETF shares and options thereon can be less costly than the use of index options or stock index futures. In addition, ETF shares and options thereon can typically be purchased in smaller amounts than are available for futures contracts and can offer exposure to market sectors and styles for which there is no suitable or liquid futures contract.
Investment Transactions and Investment Income: Investment transactions are accounted for on the date the investments are purchased or sold (trade date basis). Net realized gains and losses from investment transactions are reported on an identified cost basis. Interest income, which includes accretion of discounts and amortization of premiums, is accrued and recorded as earned. Dividend income is recognized on the ex-dividend date or for certain foreign securities, as soon as information is available to each Fund.
Foreign Securities: Each Fund may directly purchase securities of foreign issuers. Investing in securities of foreign issuers involves special risks not typically associated with investing in securities of U.S. issuers. The risks include possible reevaluation of currencies, the inability to repatriate foreign currency, less complete financial information about companies and possible future adverse political and economic developments.
Moreover, securities of many foreign issuers and their markets may be less liquid and their prices more volatile than those of securities of comparable U.S. issuers.
Foreign Currency Translation: The books and records of the Funds are maintained in U.S. dollars. Investment valuations and other assets and liabilities initially expressed in foreign currencies are converted each business day into U.S. dollars based upon current exchange rates. The portion of realized and unrealized gains or losses on investments due to fluctuations in foreign currency exchange rates is not separately disclosed and is included in realized and unrealized gains or losses on investments, when applicable.
Foreign Currency Spot Contracts: The Funds may enter into foreign currency spot contracts to facilitate transactions in foreign securities or to convert foreign currency receipts into U.S. dollars. A foreign currency spot contract is an agreement between two parties to buy and sell currencies at the current market rate, for settlement generally within two business days. The U.S. dollar value of the contracts is determined using current currency exchange rates supplied by a pricing service. The contract is marked-to-market daily for settlements beyond one day and any change in market value is recorded as an unrealized gain or loss. When the contract is closed, the Fund records a realized gain or loss equal to the difference between the value on the open and close date. Losses may arise from changes in the value of the foreign currency, or if the counterparties do not perform under the contract’s terms. The maximum potential loss from such contracts is the aggregate face value in U.S. dollars at the time the contract was opened.
Real Estate Investment Trusts (“REITs”): The Funds may invest a portion of their assets in REITs and are subject to certain risks associated with direct investment in REITs. REITs may be affected by changes in the value of their underlying properties and by defaults by borrowers or tenants. REITs depend generally on their ability to generate cash flow to make distributions to shareowners, and certain REITs have self-liquidation provisions by which mortgages held may be paid in full and distributions of capital returns may be made at any time. In addition, the performance of a REIT may be affected by its failure to qualify for tax-free pass-through of income under the Internal Revenue Code of 1986, as amended (the “Code”), or its failure to maintain exemption from registration under the 1940 Act. Distributions that the Fund receives from REITs can be classified as ordinary income, capital gain income or return of capital by the REITs that make these distributions to the Fund. However, it is not possible for the Fund to characterize distributions received from REITs during interim periods because the REIT issuers do not report their tax characterizations until subsequent to year end. During interim periods, the REIT distributions are accounted for as ordinary income until the re characterizations are made subsequent to year end.
170 | October 31, 2016
Notes to Financial Statements
October 31, 2016
Treasury Inflation Protected-Securities: The Funds may invest in treasury inflation protected securities (“TIPS”), including structured bonds in which the principal amount is adjusted daily to keep pace with inflation, as measured by the U.S. Consumer Pricing Index for Urban Consumers. The adjustments to principal due to inflation/deflation are reflected as increases/decreases to interest income with a corresponding adjustment to cost. Such adjustments may have a significant impact on a Fund’s distributions and may result in a return of capital to shareholders. The repayment of the original bond principal upon maturity is guaranteed by the full faith and credit of the U.S. Government.
Loan Participations and Assignments: Certain Funds may invest in loan participations and assignments. The Fund considers loan participations and assignments to be investments in debt securities. Loan participations typically will result in the Fund having a contractual relationship only with the lender, not with the borrower. The Fund will have the right to receive payments of principal, interest and any fees to which it is entitled only from the lender selling the participation and only upon receipt by the lender of the payments from the borrower. Under a loan participation, the Fund generally will have no right to enforce compliance by the borrower with the terms of the loan agreement relating to the loan, nor any rights of set-off against the borrower, and the Fund may not benefit directly from any collateral supporting the loan in which it has purchased the participation. As a result, the Fund will assume the credit risk of both the borrower and the lender that is selling the participation. In the event of the insolvency of the lender selling a participation, the Fund may be treated as a general creditor of the lender and may not benefit from any set-off between the lender and the borrower. When the Fund purchases assignments of loans from lenders, the Fund will acquire direct rights against the borrower on the loan, except that under certain circumstances such rights may be more limited than those held by the assigning lender.
Master Limited Partnerships: MLPs are publicly traded partnerships engaged in the transportation, storage and processing of minerals and natural resources. By confining their operations to these specific activities, their interests, or units, are able to trade on public securities exchanges exactly like the shares of a corporation, without entity level taxation. To qualify as a MLP and to not be taxed as a corporation, a partnership must receive at least 90% of its income from qualifying sources as set forth in Section 7704(d) of the Code. These qualifying sources include natural resource based activities such as the processing, transportation and storage of mineral or natural resources. MLPs generally have two classes of owners, the general partner and limited partners. The general partner of an MLP is typically owned by a major energy company, an investment fund, the direct management of the MLP, or is an entity owned by one or more of such parties. The general partner may be structured as a private or publicly traded corporation or other entity. The general partner typically controls the operations and management of the MLP through an up to 2% equity interest in the MLP plus, in many cases, ownership of common units and subordinated units. Limited partners typically own the remainder of the partnership, through ownership of common units, and have a limited role in the partnership’s operations and management. MLPs are typically structured such that common units and general partner interests have first priority to receive quarterly cash distributions up to an established minimum amount (“minimum quarterly distributions” or “MQD”). Common and general partner interests also accrue arrearages in distributions to the extent the MQD is not paid. Once common and general partner interests have been paid, subordinated units receive distributions of up to the MQD; however, subordinated units do not accrue arrearages. Distributable cash in excess of the MQD is paid to both common and subordinated units and is distributed to both common and subordinated units generally on a pro rata basis. The general partner is also eligible to receive incentive distributions if the general partner operates the business in a manner which results in distributions paid per common unit surpassing specified target levels. As the general partner increases cash distributions to the limited partners, the general partner receives an increasingly higher percentage of the incremental cash distributions.
3. DERIVATIVE INSTRUMENTS
As a part of their investment strategy, the ALPS | CoreCommodity Management CompleteCommodities® Strategy Fund and ALPS | Kotak India Growth Fund are permitted to enter in various types of derivatives contracts. The other funds including ALPS | Alerian MLP Infrastructure Index Fund, ALPS | Metis Global Micro Cap Fund, ALPS | Red Rocks Listed Private Equity Fund, ALPS| Sterling ETF Tactical Rotation Fund, ALPS | WMC Research Value Fund, Clough China Fund, RiverFront Conservative Income Builder Fund, RiverFront Dynamic Equity Income Fund, RiverFront Global Allocation Fund, RiverFront Global Growth Fund and RiverFront Moderate Growth & Income Fund may invest in derivatives contracts. In doing so, the Funds employ strategies in differing combinations to permit them to increase, decrease, or change the level or types of exposure to market factors. Central to those strategies are features inherent in derivatives that make them more attractive for this purpose than equity or debt securities; they require little or no initial cash investment, they focus exposure on only certain selected risk factors, and they may not require the ultimate receipt or delivery of the underlying security (or securities) to the contract. This may allow the Funds to pursue their objectives more quickly and efficiently than if they were to make direct purchases or sales of securities capable of affecting a similar response to market factors.
Cash collateral is being pledged to cover derivative obligations of the Funds and cash collateral received from the counterparty, if any, is reported separately on the Statements of Assets and Liabilities as cash pledged as collateral and cash received as collateral, respectively. Non-cash collateral pledged by the Funds, if any, is noted in the Statements of Investments.
171 | October 31, 2016
Notes to Financial Statements
October 31, 2016
Risk of Investing in Derivatives: The Funds’ use of derivatives can result in losses due to unanticipated changes in the market risk factors and the overall market. In instances where the Funds are using derivatives to decrease, or hedge, exposures to market risk factors for securities held by the Funds, there are also risks that those derivatives may not perform as expected resulting in losses for the combined or hedged positions.
Derivatives may have little or no initial cash investment relative to their market value exposure and therefore can produce significant gains or losses in excess of their cost. This use of embedded leverage allows the Fund to increase its market value exposure relative to its net assets and can substantially increase the volatility of the Funds’ performance.
Additional associated risks from investing in derivatives also exist and potentially could have significant effects on the valuation of the derivative and the Funds. Typically, the associated risks are not the risks that the Funds are attempting to increase or decrease exposure to, per their investment objectives, but are the additional risks from investing in derivatives.
Examples of these associated risks are liquidity risk, which is the risk that the Funds will not be able to sell or close out the derivative in a timely manner, and counterparty credit risk, which is the risk that the counterparty will not fulfill its obligation to the Funds. In addition, use of derivatives may increase or decrease exposure to the following risk factors:
Equity Risk: Equity risk relates to the change in value of equity securities as they relate to increases or decreases in the general market. Associated risks can be different for each type of derivative and are discussed by each derivative type in the notes that follow.
Commodity Risk: Exposure to the commodities markets may subject the Funds to greater volatility than investments in traditional securities. Prices of various commodities may also be affected by factors, such as drought, floods, weather, livestock disease, embargoes, tariffs and other regulatory developments, which are unpredictable. The prices of commodities can also fluctuate widely due to supply and demand disruptions in major producing or consuming regions.
Foreign Currency Risk: Currency trading involves significant risks, including market risk, interest rate risk, country risk, counterparty credit risk and short sale risk. Market risk results from the price movement of foreign currency values in response to shifting market supply and demand. Interest rate risk arises whenever a country changes its stated interest rate target associated with its currency. Country risk arises because virtually every country has interfered with international transactions in its currency.
Interest Rate Risk: Interest rate risk is the risk that fixed income securities will decline in value because of changes in interest rates. As nominal interest rates rise, the value of fixed income securities held by the Funds are likely to decrease. Securities with longer durations tend to be more sensitive to changes in interest rates, and are usually more volatile than securities.
Swap Contracts: Each Fund may enter into swap transactions for hedging purposes or to seek to increase total return. At the present time, the CoreCommodity Fund primarily enters into swap transactions for the purpose of increasing total return. Swap agreements may be executed in a multilateral or other trade facility program, such as a registered exchange (“centrally cleared swaps”) or may be privately negotiated in the over-the counter market. The duration of a swap agreement typically ranges from a few weeks to more than one year. In a centrally cleared swap, immediately following execution of the swap agreement, the swap agreement is novated to a central counterparty (the “CCP”) and the Fund’s counterparty on the swap agreement becomes the CCP. Risks may arise as a result of the failure of the counterparty to the swap contract to comply with the terms of the swap contract. The loss incurred by the failure of a counterparty is generally limited to the net payment to be received by the Funds and/or the termination value at the end of the contract. Therefore, the Funds consider the creditworthiness of each counterparty to a contract in evaluating potential credit risk. Although centrally cleared swaps typically present less counterparty risk than non-centrally cleared swaps, a Fund that has entered into centrally cleared swaps is subject to the risk of the failure of the CCP.
Additionally, risks may arise from unanticipated movements in interest rates or in the value of the underlying reference asset or index. Entering into these agreements involves, to varying degrees, market risk, liquidity risk and elements of credit, legal and documentation risk that are not directly reflected in the amounts recognized in the Statements of Assets and Liabilities.
The Funds may pay or receive cash as collateral on these contracts which may be recorded as an asset and/or liability. The Funds must set aside liquid assets, or engage in other appropriate measures, to cover its obligations under these contracts. Swaps are marked to market daily using either pricing vendor quotations, counterparty prices or model prices and the change in value, if any, is recorded as an unrealized gain or loss. Upfront payments made and/or received by the Funds are recorded as an asset and/or liability and realized gains or losses are recognized ratably over the contract’s term/event, with the exception of forward starting interest rate swaps, whose realized gains or losses are recognized ratably from the effective start date. Periodic payments received or made on swap contracts are recorded as realized gains or losses. Gains or losses are realized upon termination of a swap contract and are recorded on the Statement of Operations.
172 | October 31, 2016
Notes to Financial Statements
October 31, 2016
Total return swaps are agreements in which there is an exchange of cash flows whereby one party commits to make payments based on the total return (coupons plus capital gains/losses) of an underlying instrument in exchange for fixed or floating rate interest payments. To the extent the total return of the instrument or index underlying the transaction exceeds or falls short of the offsetting interest rate obligation, the Fund will receive a payment from or make a payment to the counterparty. Credit default swaps are a type of swap agreement in which the protection “buyer” is generally obligated to pay the protection “seller” an upfront and/ or a periodic stream of payments over the term of the contract provided that no credit event, such as a default, on a reference obligation has occurred. Credit default swaps (“CDS”) are typically two-party financial contracts that transfer credit exposure between the two parties. Under a typical CDS, one party (the “seller”) receives pre-determined periodic payments from the other party (the “buyer”). The seller agrees to make compensating specific payments to the buyer if a negative credit event occurs, such as the bankruptcy or default by the issuer of the underlying debt instrument. Swap agreements held at October 31, 2016 are disclosed after the Statement of Investments.
The average notional amount of the swap positions held in the ALPS | CoreCommodity Management CompleteCommodities® Strategy Fund for the fiscal year ended October 31, 2016 was $600,959.
Futures: Each Fund may invest in futures contracts in accordance with their investment objectives. Each Fund does so for a variety of reasons including for cash management, hedging or non-hedging purposes in an attempt to achieve the Fund’s investment objective. A futures contract provides for the future sale by one party and purchase by another party of a specified quantity of the security or other financial instrument at a specified price and time. A futures contract on an index is an agreement pursuant to which two parties agree to take or make delivery of an amount of cash equal to the difference between the value of the index at the close of the last trading day of the contract and the price at which the index contract was originally written. Futures transactions may result in losses in excess of the amount invested in the futures contract. There can be no guarantee that there will be a correlation between price movements in the hedging vehicle and in the portfolio securities being hedged. An incorrect correlation could result in a loss on both the hedged securities in a Fund and the hedging vehicle so that the portfolio return might have been greater had hedging not been attempted. There can be no assurance that a liquid market will exist at a time when a Fund seeks to close out a futures contract or a futures option position. Lack of a liquid market for any reason may prevent a Fund from liquidating an unfavorable position, and the Fund would remain obligated to meet margin requirements until the position is closed. In addition, a Fund could be exposed to risk if the counterparties to the contracts are unable to meet the terms of their contracts. With exchange traded futures, there is minimal counterparty credit risk to the Funds since futures are exchange traded and the exchange’s clearinghouse, as counterparty to all exchange traded futures, guarantees the futures against default.
When a purchase or sale of a futures contract is made by a Fund, the Fund is required to deposit with its custodian (or broker, if legally permitted) a specified amount of liquid assets (“initial margin”). The margin required for a futures contract is set by the exchange on which the contract is traded and may be modified during the term of the contract. The initial margin is in the nature of a performance bond or good faith deposit on the futures contract that is returned to a Fund upon termination of the contract, assuming all contractual obligations have been satisfied. These amounts are included in Deposit with broker for futures contracts on the Statement of Assets and Liabilities. Each day a Fund may pay or receive cash, called “variation margin,” equal to the daily change in value of the futures contract. Such payments or receipts are recorded for financial statement purposes as unrealized gains or losses by a Fund. Variation margin does not represent a borrowing or loan by a Fund but is instead a settlement between a Fund and the broker of the amount one would owe the other if the futures contract expired. When the contract is closed, a Fund records a realized gain or loss equal to the difference between the value of the contract at the time it was opened and the value at the time it was closed.
The average value of futures contracts held in the ALPS | CoreCommodity Management CompleteCommodities® Strategy Fund and the ALPS | WMC Research Value Fund for the Fiscal Year Ended October 31, 2016 were $36,607 and $12,139 respectively.
Option Contracts: Each Fund may enter into options transactions for hedging purposes and for non-hedging purposes such as seeking to enhance return. Each Fund may write covered put and call options on any stocks or stock indices, currencies traded on domestic and foreign securities exchanges, or futures contracts on stock indices, interest rates and currencies traded on domestic and, to the extent permitted by the CFTC, foreign exchanges. A call option on an asset written by a Fund obligates the Fund to sell the specified asset to the holder (purchaser) at a stated price (the exercise price) if the option is exercised before a specified date (the expiration date). A put option on an asset written by a Fund obligates the Fund to buy the specified asset from the purchaser at the exercise price if the option is exercised before the expiration date. Premiums received when writing options are recorded as liabilities and are subsequently adjusted to the current value of the options written. Premiums received from writing options that expire are treated as realized gains. Premiums received from writing options, which are either exercised or closed, are offset against the proceeds received or amount paid on the transaction to determine realized gains or losses which are recorded on the Statement of Operations.
The average value of written options held in the ALPS | CoreCommodity Management CompleteCommodities® Strategy Fund for the fiscal year ended October 31, 2016 was $98,248.
173 | October 31, 2016
Notes to Financial Statements
October 31, 2016
The Funds had the following transactions in written covered call/put options during the Fiscal Year Ended October 31, 2016:
| | Number of Contracts | | | | Premiums Received | |
ALPS | CoreCommodity Management CompleteCommodities® Strategy Fund | | | | |
| Options Outstanding, at November 1, 2015 | | | (975 | ) | | $ | 1,142,049 | |
| Options written | | | (404 | ) | | | 692,569 | |
| Options covered | | | 425 | | | | (967,028 | ) |
| Options expired | | | 954 | | | | (867,590 | ) |
| Options Outstanding, at October 31, 2016 | - | | | $ | - | |
Derivatives Instruments: The following tables disclose the amounts related to each Fund’s use of derivative instruments.
The effect of derivatives instruments on the Statement of Assets and Liabilities as of October 31, 2016:
| Risk Exposure | Asset Location | | Fair Value | | Liability Location | | Fair Value | |
ALPS | CoreCommodity Management CompleteCommodities® Strategy Fund(a) | |
Commodity Contracts
(Futures Contracts) | Unrealized appreciation on futures contracts(b) | | | 1,831,634 | | Unrealized depreciation on futures contracts (b) | | | (3,162,092 | ) |
Commodity Contracts
(Total Return Swap Contracts) | Unrealized appreciation on total return swap contracts | | | 611,565 | | Unrealized depreciation on total return swap contracts | | | (796,828 | ) |
| Total | | | $ | 2,443,199 | | | | $ | (3,958,920 | ) |
| ALPS | WMC Research Value Fund | | | | | | | | | | |
Equity Contracts
(Futures Contracts) | | N/A | | | N/A | | Unrealized depreciation on futures contracts (c) | | | (13,220 | ) |
| Total | | | | | N/A | | | | $ | (13,220 | ) |
(a) | The ALPS | CoreCommodity Management CompleteCommodities® Strategy Fund consolidates the statements of assets and liabilities. |
(b) | Represents cumulative appreciation (depreciation) of futures contracts as reported in the Consolidated Statement of Investments. Only the current day's net variation margin is reported within the Consolidated Statement of Assets and Liabilities. |
(c) | Represents cumulative appreciation (depreciation) of futures contracts as reported in the Statement of Investments. Only the current day's net variation margin is reported within the Statement of Assets and Liabilities. |
174 | October 31, 2016
Notes to Financial Statements
October 31, 2016
The effect of derivatives instruments on the Statement of Operations for the Fiscal Year Ended October 31, 2016:
| Risk Exposure | Statement of Operations Location | | Realized Gain/(Loss) on Derivatives Recognized in Income | | | Change in Unrealized Appreciation/(Depreciation) on Derivatives Recognized in Income | |
| ALPS | CoreCommodity Management | CompleteCommodities® Strategy Fund(a) | | | | | | |
Equity Contracts
(Purchased Options) | Net realized loss on investments/Net change in unrealized appreciation on investments | | $ | (502,075 | ) | | $ | 1,366,215 | |
Equity Contracts
(Written Options) | Net realized gain on written options/Net change in unrealized appreciation on written options | | | 273,274 | | | | 1,326,203 | |
Equity and Commodity Contracts
(Futures Contracts) | Net realized gain on futures contracts/Net change in unrealized depreciation on futures contracts | | | 1,040,426 | | | | (1,099,629 | ) |
Commodity Contracts
(Total Return Swap Contracts) | Net realized gain on total return swap contracts/Net change in unrealized depreciation on total return swap contracts | | | 3,427,372 | | | | (3,572,059 | ) |
| Total | | | $ | 4,238,997 | | | $ | (1,979,270 | ) |
| ALPS | WMC Research Value Fund | | | | | | | | | |
Equity Contracts
(Futures Contracts) | Net realized gain on futures contracts/Net change in unrealized depreciation on futures contracts | | | 130,312 | | | | (68,676 | ) |
| Total | | | $ | 130,312 | | | $ | (68,676 | ) |
(a) | The ALPS | CoreCommodity Management CompleteCommodities® Strategy Fund consolidates the statements of operations. |
Certain derivative contracts are executed under either standardized netting agreements or, for exchange‐traded derivatives, the relevant contracts for a particular exchange which contain enforceable netting provisions. A derivative netting arrangement creates an enforceable right of set-off that becomes effective, and affects the realization of settlement on individual assets, liabilities and collateral amounts, only following a specified event of default or early termination. Default events may include the failure to make payments or deliver securities timely, material adverse changes in financial condition or insolvency, the breach of minimum regulatory capital requirements, or loss of license, charter or other legal authorization necessary to perform under the contract.
175 | October 31, 2016
Notes to Financial Statements
October 31, 2016
The following table presents financial instruments that are subject to enforceable netting arrangements or other similar agreements as of October 31, 2016:
Offsetting of Derivatives Asset
October 31, 2016
| | | | | | | | | | | | Gross Amounts Not Offset in the Statement of Financial Position | |
| Description | | | Gross Amounts of Recognized Assets | | | Gross Amounts Offset in the Statement of Assets and Liabilities | | | Net Amounts Presented in the Statement of Assets and Liabilities | | | Financial Instruments (a) | | | Cash Collateral Received(a) | | | Net Amount | |
ALPS | CoreCommodity Management CompleteCommodities® Strategy Fund | | | | |
| Total Return Swap Contracts | | $ | 611,565 | | | $ | – | | | $ | 611,565 | | | $ | (611,565 | ) | | $ | – | | | $ | – | |
| Total | | $ | 611,565 | | | $ | – | | | $ | 611,565 | | | $ | (611,565 | ) | | $ | – | | | $ | – | |
Offsetting of Derivatives Liability
October 31, 2016
| | | | | | | | | | | | Gross Amounts Not Offset in the Statement of Financial Position | |
| Description | | Gross Amounts of Recognized Liabilities | | | Gross Amounts Offset in the Statement of Assets and Liabilities | | | Net Amounts Presented in the Statement of Assets and Liabilities | | | Financial Instruments (a) | | | Cash Collateral Pledged(a) | | | Net Amount | |
ALPS | CoreCommodity Management CompleteCommodities® Strategy Fund | | | |
| Total Return Swap Contracts | | $ | 796,828 | | | $ | – | | | $ | 796,828 | | | $ | (796,828 | ) | | $ | – | | | $ | – | |
| Total | | $ | 796,828 | | | $ | – | | | $ | 796,828 | | | $ | (796,828 | ) | | $ | – | | | $ | – | |
(a) | These amounts are limited to the derivative asset/liability balance and, accordingly, do not include excess collateral received/pledged. |
4. TAX BASIS INFORMATION
Tax Basis of Distributions to Shareholders: The character of distributions made during the year from net investment income or net realized gains may differ from its ultimate characterization for federal income tax purposes. Also, due to the timing of dividend distributions, the fiscal year in which amounts are distributed may differ from the fiscal year in which the income or realized gain were recorded by a Fund. The amounts and characteristics of tax basis distributions and composition of distributable earnings/(accumulated losses) are finalized at fiscal year-end.
176 | October 31, 2016
Notes to Financial Statements
October 31, 2016
The tax character of distributions paid by the Funds for the Fiscal Year or Period Ended October 31, 2016 were as follows:
| Fund | | Ordinary Income | | | Long-Term Capital Gain | | | Return of Capital | |
| ALPS | Alerian MLP Infrastructure Index Fund | | $ | 129,381 | | | $ | – | | | $ | 3,011,546 | |
| ALPS | Kotak India Growth Fund | | | 431,005 | | | | 1,657,288 | | | | – | |
| ALPS | Red Rocks Listed Private Equity Fund | | | 17,431,894 | | | | 20,197,928 | | | | – | |
| ALPS | Sterling ETF Tactical Rotation Fund | | | 337,379 | | | | – | | | | – | |
| ALPS| WMC Research Value Fund | | | 703,783 | | | | 27,067,576 | | | | – | |
| Clough China Fund | | | 1,041,910 | | | | – | | | | – | |
| RiverFront Conservative Income Builder Fund | | | 145,507 | | | | 30,599 | | | | – | |
| RiverFront Dynamic Equity Income Fund | | | 1,315,134 | | | | 1,636,020 | | | | – | |
| RiverFront Global Allocation Fund | | | 493,350 | | | | 165,999 | | | | – | |
| RiverFront Global Growth Fund | | | 1,138,129 | | | | 742,246 | | | | – | |
| RiverFront Moderate Growth & Income Fund | | | 2,445,173 | | | | 2,965,868 | | | | – | |
The tax character of distributions paid by the Funds for the Fiscal Year Ended October 31, 2015 were as follows:
| Fund | | Ordinary Income | | | Long-Term Capital Gain | | | Return of Capital | |
| ALPS | Alerian MLP Infrastructure Index Fund | | $ | 8,391 | | | $ | – | | | $ | 2,346,444 | |
ALPS | CoreCommodity Management CompleteCommodities® Strategy Fund | | | 1,912,471 | | | | – | | | | – | |
| ALPS | Kotak India Growth Fund | | | 422,790 | | | | 245,199 | | | | – | |
| ALPS | Red Rocks Listed Private Equity Fund | | | 15,572,410 | | | | 1,431,943 | | | | – | |
| ALPS | Sterling ETF Tactical Rotation Fund | | | 126,929 | | | | – | | | | – | |
| ALPS | WMC Research Value Fund | | | 2,088,939 | | | | 8,298,461 | | | | – | |
| Clough China Fund | | | 1,749,005 | | | | 1,612,835 | | | | – | |
| RiverFront Conservative Income Builder Fund | | | 222,922 | | | | 95,413 | | | | – | |
| RiverFront Dynamic Equity Income Fund | | | 1,884,705 | | | | 1,736,888 | | | | – | |
| RiverFront Global Allocation Fund | | | 981,226 | | | | 2,042,515 | | | | – | |
| RiverFront Global Growth Fund | | | 2,340,114 | | | | 5,687,960 | | | | – | |
| RiverFront Moderate Growth & Income Fund | | | 4,696,222 | | | | 4,753,671 | | | | – | |
Components of Distributable Earnings on a Tax Basis: At October 31, 2016, permanent differences in book and tax accounting were reclassified. These differences had no effect on net assets and were primarily attributed to differences in the treatment of commodity related commodity related controlled foreign corporations, the differing tax treatment of foreign currency, investments in partnerships, Passive Foreign Investment Companies (“PFICs”) and certain other investments.
177 | October 31, 2016
Notes to Financial Statements
October 31, 2016
For the fiscal year or period ended October 31, 2016, the following reclassifications, which had no impact on results of operations or net assets, were recorded to reflect tax character:
| Fund | | Paid-in Capital | | | Accumulated Net Investment Income/(Loss) | | | Accumulated Net Realized Gain/(Loss) on Investments | |
ALPS | CoreCommodity Management CompleteCommodities® Strategy Fund | | $ | 1,698,946 | | | $ | 2,375,999 | | | $ | (4,074,945 | ) |
| ALPS | Kotak India Growth Fund | | | – | | | | 39,313 | | | | (39,313 | ) |
ALPS | Metis Global Micro Cap Fund(a) | | | (52,876 | ) | | | 56,570 | | | | (3,694 | ) |
| ALPS | Red Rocks Listed Private Equity Fund | | | (1,284 | ) | | | 14,920,689 | | | | (14,919,405 | ) |
| ALPS | Sterling ETF Tactical Rotation Fund | | | (66 | ) | | | 65 | | | | 1 | |
| ALPS | WMC Research Value Fund | | | – | | | | (504,793 | ) | | | 504,793 | |
| Clough China Fund | | | – | | | | (35,616 | ) | | | 35,616 | |
| RiverFront Conservative Income Builder Fund | | | (280 | ) | | | 738 | | | | (458 | ) |
| RiverFront Dynamic Equity Income Fund | | | – | | | | 6,803 | | | | (6,803 | ) |
| RiverFront Global Allocation Fund | | | – | | | | 2,301 | | | | (2,301 | ) |
| RiverFront Global Growth Fund | | | – | | | | 5,235 | | | | (5,235 | ) |
| RiverFront Moderate Growth & Income Fund | | | – | | | | 10,736 | | | | (10,736 | ) |
(a) | The Fund commenced operations on December 24, 2015. |
Included in the amounts reclassified was a net operating loss offset to Paid-in Capital as follows:
| Fund | | Amount | |
ALPS | CoreCommodity Management CompleteCommodities® Strategy Fund | | $ | 326,665 | |
As of October 31, 2016, the components of distributable earnings on a tax basis were as follows:
| | | Undistributed net investment income | | | Accumulated net realized gain/(loss) on investments | | | Other cumulative effect of timing differences | | | Net unrealized appreciation/(depreciation) on investments | | | Total | |
| | | | | | | | | | | | | | | | |
ALPS | CoreCommodity Management CompleteCommodities® Strategy Fund | | $ | – | | | $ | (48,486,187 | ) | | $ | (166,651 | ) | | $ | (4,319,770 | ) | | $ | (52,972,608 | ) |
| ALPS | Kotak India Growth Fund | | | – | | | | 203,395 | | | | (38,982 | ) | | | 1,920,312 | | | | 2,084,725 | |
| ALPS | Metis Global Micro Cap Fund | | | 999,254 | | | | – | | | | – | | | | 978,678 | | | | 1,977,932 | |
| ALPS | Red Rocks Listed Private Equity Fund | | | 3,200,663 | | | | (7,048,709 | ) | | | (630,415 | ) | | | 13,772,590 | | | | 9,294,129 | |
| ALPS | Sterling ETF Tactical Rotation Fund | | | 8,686 | | | | (3,710,537 | ) | | | (20,808 | ) | | | (3,606 | ) | | | (3,726,265 | ) |
| ALPS | WMC Research Value Fund | | | – | | | | 2,742,720 | | | | 13,220 | | | | 3,742,253 | | | | 6,498,193 | |
| Clough China Fund | | | 103,102 | | | | (7,898,280 | ) | | | – | | | | 11,101,764 | | | | 3,306,586 | |
| RiverFront Conservative Income Builder Fund | | | 18,735 | | | | (265,772 | ) | | | – | | | | 455,906 | | | | 208,869 | |
| RiverFront Dynamic Equity Income Fund | | | 63,827 | | | | (1,876,290 | ) | | | – | | | | 4,001,880 | | | | 2,189,417 | |
| RiverFront Global Allocation Fund | | | 320,711 | | | | (1,501,091 | ) | | | – | | | | 1,835,066 | | | | 654,686 | |
| RiverFront Global Growth Fund | | | 514,126 | | | | (1,203,561 | ) | | | – | | | | 3,334,012 | | | | 2,644,577 | |
| RiverFront Moderate Growth & Income Fund | | | 192,803 | | | | (2,468,510 | ) | | | – | | | | 5,495,416 | | | | 3,219,709 | |
Capital Losses: As of October 31, 2016 the following Funds had capital loss carryforwards which may reduce the Funds’ taxable income arising from future net realized gains on investments, if any, to the extent permitted by the Code and thus may reduce the amount of the distributions to shareholders which would otherwise be necessary to relieve the Funds of any liability for federal tax.
178 | October 31, 2016
Notes to Financial Statements
October 31, 2016
Post-Enactment Capital Losses*:
Capital losses deferred to next tax year were as follows:
| | | | | | | |
| Fund | | Short-Term | | | Long-Term | |
ALPS | CoreCommodity Management CompleteCommodities® Strategy Fund | | $ | 22,728,373 | | | $ | 25,757,814 | |
| ALPS | Red Rocks Listed Private Equity Fund | | | 7,048,709 | | | | – | |
| ALPS | Sterling ETF Tactical Rotation Fund | | | 3,710,537 | | | | – | |
| Clough China Fund | | | 7,898,280 | | | | – | |
| RiverFront Conservative Income Builder Fund | | | 221,222 | | | | 44,550 | |
| RiverFront Dynamic Equity Income Fund | | | 1,876,290 | | | | – | |
| RiverFront Global Allocation Fund | | | 1,390,929 | | | | 110,162 | |
| RiverFront Global Growth Fund | | | 1,203,561 | | | | – | |
| RiverFront Moderate Growth & Income Fund | | | 2,468,510 | | | | – | |
| * | Post-Enactment Capital Losses arise in fiscal years beginning after December 22, 2010, and exclude any election for late year capital loss (during the period November 1st to December 31st) deferred for the current fiscal year. As a result of the enactment of the Regulated Investment Company Act of 2010, pre-enactment capital loss carryforwards may be more likely to expire unused. Additionally, post-enactment capital losses that are carried forward will retain their character as either short-term or long-term losses rather than being considered all short-term as under previous law. |
The following funds elected to defer to the period ending October 31, 2017, late year ordinary losses:
| Fund | | Amount | |
| ALPS | Kotak India Growth Fund | | $ | 38,982 | |
| ALPS | Sterling ETF Tactical Rotation Fund | | | 20,808 | |
Unrealized Appreciation and Depreciation on Investments: As of October 31, 2016, the costs of investments for federal income tax purposes and accumulated net unrealized appreciation/(depreciation) on investments were as follows:
| Fund | | Gross Appreciation (excess of value over tax cost) | | | Gross Depreciation (excess of tax cost over value) | | | Net Appreciation of Foreign Currency and Derivatives | | | Net Unrealized Appreciation/(Depreciation) | | | Cost of Investments for Income Tax Purposes | |
| ALPS | Alerian MLP Infrastructure Index Fund | | $ | 329,837 | | | $ | (3,881,642 | ) | | | – | | | $ | (3,551,805 | ) | | $ | 44,459,523 | |
ALPS | CoreCommodity Management CompleteCommodities® Strategy Fund | | | 15,801,246 | | | | (18,596,208 | ) | | $ | (1,524,808 | ) | | | (4,319,770 | ) | | | 500,771,394 | |
| ALPS | Kotak India Growth Fund | | | 2,880,101 | | | | (959,789 | ) | | | – | | | | 1,920,312 | | | | 14,891,327 | |
| ALPS | Metis Global Micro Cap Fund | | | 1,860,110 | | | | (877,582 | ) | | | (3,850 | ) | | | 978,678 | | | | 15,219,073 | |
| ALPS | Red Rocks Listed Private Equity Fund | | | 27,364,364 | | | | (13,515,556 | ) | | | (76,218 | ) | | | 13,772,590 | | | | 315,114,979 | |
| ALPS | Sterling ETF Tactical Rotation Fund | | | – | | | | (3,606 | ) | | | – | | | | (3,606 | ) | | | 12,131,836 | |
| ALPS | WMC Research Value Fund | | | 9,031,449 | | | | (5,275,976 | ) | | | (13,220 | ) | | | 3,742,253 | | | | 89,149,715 | |
| Clough China Fund | | | 11,504,087 | | | | (416,731 | ) | | | 14,408 | | | | 11,101,764 | | | | 43,686,751 | |
| RiverFront Conservative Income Builder Fund | | | 523,088 | | | | (67,182 | ) | | | – | | | | 455,906 | | | | 14,403,167 | |
| RiverFront Dynamic Equity Income Fund | | | 4,551,549 | | | | (549,669 | ) | | | – | | | | 4,001,880 | | | | 77,347,509 | |
| RiverFront Global Allocation Fund | | | 2,186,393 | | | | (351,327 | ) | | | – | | | | 1,835,066 | | | | 33,637,972 | |
| RiverFront Global Growth Fund | | | 3,992,117 | | | | (658,105 | ) | | | – | | | | 3,334,012 | | | | 55,146,138 | |
| RiverFront Moderate Growth & Income Fund | | | 6,228,788 | | | | (733,372 | ) | | | – | | | | 5,495,416 | | | | 124,123,304 | |
179 | October 31, 2016
Notes to Financial Statements
October 31, 2016
Deferred Tax Asset/Liability for ALPS | Alerian MLP Infrastructure Index Fund
Since the ALPS | Alerian MLP Infrastructure Index Fund (the “Fund” for purposes of this section) will be subject to taxation on its taxable income, the NAV of Fund shares will also be reduced by the accrual of any deferred tax liabilities. The Index however is calculated without any adjustments for taxes. As a result, the Fund’s after tax performance could differ significantly from the Index even if the pretax performance of the Fund and the performance of the Index are closely correlated.
Cash distributions from MLPs to the ALPS | Alerian MLP Infrastructure Index Fund that exceed such Fund’s allocable share of such MLP’s net taxable income are considered a tax‐deferred return of capital that will reduce the Fund’s adjusted tax basis in the equity securities of the MLP. These reductions in such Fund’s adjusted tax basis in the MLP equity securities will increase the amount of gain (or decrease the amount of loss) recognized by the Fund on a subsequent sale of the securities. The Fund will accrue deferred income taxes for any future tax liability associated with (i) that portion of MLP distributions considered to be a tax‐deferred return of capital as well as (ii) capital appreciation of its investments. Upon the sale of an MLP security, the Fund may be liable for previously deferred taxes. The Fund will rely to some extent on information provided by the MLPs, which is not necessarily timely, to estimate deferred tax liability for purposes of financial statement reporting and determining the NAV. From time to time, ALPS Advisors, Inc. will modify the estimates or assumptions related to the Fund’s deferred tax liability as new information becomes available. The Fund will generally compute deferred income taxes based on the marginal regular federal income tax rate applicable to corporations and an assumed rate attributable to state taxes.
The Fund’s income tax expense/(benefit) consists of the following:
| October 31, 2016 | | Current | | | Deferred | | | Total | |
| Federal | | $ | – | | | $ | 102,043 | | | $ | 102,043 | |
| State | | | – | | | | 6,003 | | | | 6,003 | |
| Valuation Allowance | | | – | | | | (108,046 | ) | | | (108,046 | ) |
| Total tax expense | | $ | – | | | $ | – | | | $ | – | |
| October 31, 2015 | | Current | | | Deferred | | | Total | |
| Federal | | $ | (5,654 | ) | | $ | (3,631,518 | ) | | $ | (3,637,172 | ) |
| State | | | 510 | | | | (213,335 | ) | | | (212,825 | ) |
| Valuation Allowance | | | – | | | | 2,724,888 | | | | 2,724,888 | |
| Total tax expense | | $ | (5,144 | ) | | $ | (1,119,965 | ) | | $ | (1,125,109 | ) |
Deferred income taxes reflect the net tax effect of temporary differences between the carrying amounts of assets and liabilities for financial reporting and tax purposes.
Components of the Fund’s deferred tax assets and liabilities are as follows:
| | | As of October 31, 2016 | |
| Non‐current Deferred tax assets: | | | |
| Net unrealized loss on investment securities | | $ | 1,278,651 | |
| Net Operating Loss Carryforward | | | 651,767 | |
| Capital Loss Carryforward | | | 684,232 | |
| Other | | | 2,192 | |
| Less Valuation Allowance | | | (2,616,842 | ) |
| Net Deferred tax asset | | $ | – | |
| | | As of October 31, 2015 | |
| Non‐current Deferred tax assets: | | | |
| Net unrealized loss on investment securities | | $ | 2,288,555 | |
| Net Operating Loss Carryforward | | | 435,186 | |
| Other | | | 1,147 | |
| Less Valuation Allowance | | | (2,724,888 | ) |
| Net Deferred tax asset | | $ | – | |
180 | October 31, 2016
Notes to Financial Statements
October 31, 2016
The net operating loss carryforward is available to offset future capital income. The net operating loss can be carried forward for 20 years and, accordingly, would begin to expire as of October 31, 2035. The Fund has net operating loss carryforwards for federal income tax purposes as follows:
| Year-Ended | | Amount | | Expiration |
| 10/31/2015 | | $ | 321,960 | | 10/31/2035 |
| 10/31/2016 | | $ | 1,488,504 | | 10/31/2036 |
The capital loss carryforward is available to offset future capital gains. The capital loss can be carried forward for 5 years and, accordingly, would begin to expire as of October 31, 2021. The Fund has capital loss carryforwards for federal income tax purposes as follows:
| Year-Ended | | Amount | | Expiration |
| 10/31/2016 | | $ | 1,900,644 | | 10/31/2021 |
The Fund reviews the recoverability of its deferred tax assets based upon the weight of available evidence. When assessing the recoverability of its deferred tax assets, significant weight was given to the effects of potential future realized and unrealized gains on investments and the period over which these deferred tax assets can be realized. Any capital losses that may be generated by the Fund are eligible to be carried back up to three years and can be carried forward for five years to offset capital gains recognized by the fund in those years. Net operating losses that may be generated by the Fund are eligible to be carried back up to two years and can be carried forward for 20 years to offset income generated by the Fund in those years. Currently, the Fund intends to waive its carry back period for any net operating loss generated for the year ended October 31, 2016.
To the extent the Fund has a deferred tax asset, consideration is given to whether or not a valuation allowance, which would offset the value of some or all of the deferred tax asset balance, is required. A valuation allowance is required if based on the evaluation criterion provided by Accounting Standards Codification (“ASC”) 740, Income Taxes (ASC 740) it is more likely than not that some portion, or all, of the deferred tax asset will not be realized. The factors considered in assessing the Fund’s valuation allowance include: the nature, frequency and severity of current and cumulative losses, the duration of the statutory carryforward periods and the associated risks that operating and capital loss carryforwards may expire unutilized. From time to time, as new information becomes available, the Fund will modify its estimates or assumptions regarding the deferred tax liability or asset.
As of the balance sheet date, Fund Management has assessed that it is not more likely than not that the deferred tax assets will be realized through future taxable income of the appropriate character. Accordingly, a valuation allowance has been established for the Fund’s deferred tax assets. The Fund will continue to assess the need for a valuation allowance in the future. Significant increases in the fair value of its portfolio of investments or other factors may change the Fund’s assessment of the recoverability of these assets and may result in the removal of the valuation allowance against all or a portion of the Fund’s gross deferred tax assets.
181 | October 31, 2016
Notes to Financial Statements
October 31, 2016
Total income tax benefit (current and deferred) differs from the amount computed by applying the federal statutory income tax rate of 34% to net investment and realized and unrealized gain/(losses) on investment before taxes as follows:
| | | For the Six Months Ended October 31, 2016 | |
| Income tax expense at statutory rate | | $ | 107,230 | |
| State income taxes (net of federal benefit) | | | 6,308 | |
| Permanent differences, net | | | (5,596 | ) |
| Change in estimated state referral rate | | | – | |
| Other | | | 104 | |
| Valuation Allowance | | | (108,046 | ) |
| Net income tax expense/(benefit) | | $ | – | |
| | | For the Year Ended October 31, 2015 | |
| Income tax expense at statutory rate | | $ | (3,631,596 | ) |
| State income taxes (net of federal benefit) | | | (213,624 | ) |
| Permanent differences, net | | | (4,388 | ) |
| Change in estimated state referral rate | | | 285 | |
| Other | | | (674 | ) |
| Valuation Allowance | | | 2,724,888 | |
| Net income tax expense/(benefit) | | $ | (1,125,109 | ) |
The following is a tabular reconciliation of the total amounts of unrecognized tax benefits:
| | | October 31, 2016 | |
| Unrecognized tax benefit ‐ Beginning | | $ | – | |
| Gross increases ‐ tax positions in prior period | | | – | |
| Gross decreases ‐ tax positions in prior period | | | – | |
| Gross increases ‐ tax positions in current period | | | – | |
| Settlement | | | – | |
| Lapse of statute of limitations | | | – | |
| Net income tax expense | | $ | – | |
| | | October 31, 2015 | |
| Unrecognized tax benefit ‐ Beginning | | $ | – | |
| Gross increases ‐ tax positions in prior period | | | – | |
| Gross decreases ‐ tax positions in prior period | | | – | |
| Gross increases ‐ tax positions in current period | | | – | |
| Settlement | | | – | |
| Lapse of statute of limitations | | | – | |
| Net income tax expense | | $ | – | |
The Fund recognizes interest accrued related to unrecognized tax benefits and penalties as income tax expense. The Fund had no accrued penalties or interest for the Fiscal Year Ended October 31, 2016.
The Fund recognizes the tax benefits of uncertain tax positions only where the position is “more likely than not” to be sustained assuming examination by tax authorities. Management has analyzed the Fund’s tax positions, and has concluded that no liability for unrecognized tax benefits should be recorded related to uncertain tax positions taken on U.S. tax returns and state tax returns filed since inception of the fund. No U.S. federal or state income tax returns are currently under examination. Due to the nature of the Fund’s investments, the Fund may be required to file income tax returns in several states. The Fund is not aware of any tax positions for which it is reasonably possible that the total amounts of unrecognized tax benefits will change materially in the next 12 months.
182 | October 31, 2016
Notes to Financial Statements
October 31, 2016
5. SECURITIES TRANSACTIONS
Purchases and sales of securities, excluding short‐term securities and U.S. Government Obligations during the Fiscal Year or Period Ended October 31, 2016 were as follows:
| Fund | | Purchases of Securities | | | Proceeds from Sales of Securities | |
| ALPS | Alerian MLP Infrastructure Index Fund | | $ | 38,132,352 | | | $ | 22,001,509 | |
ALPS | CoreCommodity Management CompleteCommodities® Strategy Fund(a) | | | 89,538,859 | | | | 98,880,928 | |
ALPS | Kotak India Growth Fund(b) | | | 3,397,288 | | | | 4,926,970 | |
ALPS | Metis Global Micro Cap Fund(c) | | | 20,822,527 | | | | 7,828,833 | |
| ALPS | Red Rocks Listed Private Equity Fund | | | 119,140,734 | | | | 278,306,288 | |
| ALPS | Sterling ETF Tactical Rotation Fund | | | 95,313,774 | | | | 115,972,540 | |
| ALPS | WMC Research Value Fund | | | 71,437,619 | | | | 76,839,708 | |
| Clough China Fund | | | 70,026,933 | | | | 83,662,088 | |
| RiverFront Conservative Income Builder Fund | | | 20,535,209 | | | | 17,644,650 | |
| RiverFront Dynamic Equity Income Fund | | | 102,744,822 | | | | 100,261,385 | |
| RiverFront Global Allocation Fund | | | 48,079,578 | | | | 55,528,650 | |
| RiverFront Global Growth Fund | | | 75,223,188 | | | | 94,000,997 | |
| RiverFront Moderate Growth & Income Fund | | | 174,897,886 | | | | 188,239,549 | |
Purchases and sales of U.S. Government Obligations during the Fiscal Year Ended October 31, 2016 were as follows:
| Fund | | Purchases of Securities | | | Proceeds from Sales of Securities | |
ALPS | CoreCommodity Management CompleteCommodities® Strategy Fund(a) | | $ | 154,961,369 | | | $ | 86,040,227 | |
| (a) | Purchases and sales for ALPS | CoreCommodity Management CompleteCommodities® Strategy Fund are consolidated and include the balances of CoreCommodity Management Cayman Commodity Fund, Ltd. (wholly owned subsidiary). |
| (b) | Purchases and sales for ALPS | Kotak India Growth Fund are consolidated and include the balances of Kotak Mauritius Portfolio (wholly owned subsidiary). |
| (c) | The Fund commenced operations on December 24, 2015. |
6. BENEFICIAL INTEREST TRANSACTIONS
Shares redeemed within 90 days of purchase for ALPS | Red Rocks Listed Private Equity Fund, 60 days of purchase for ALPS | Metis Global Micro Cap Fund and 30 days of purchase for ALPS | CoreCommodity Management CompleteCommodities® Strategy Fund, ALPS | Kotak India Growth Fund, and Clough China Fund, may incur a 2% short‐term redemption fee deducted from the redemption amount. In addition, shares redeemed within 30 days of purchase for the ALPS | Sterling ETF Tactical Rotation Fund may incur a 1% short‐term redemption fee. The ALPS | Alerian MLP Infrastructure Index Fund, ALPS | WMC Research Value Fund, RiverFront Conservative Income Builder Fund, RiverFront Dynamic Equity Income Fund, RiverFront Global Allocation Fund, RiverFront Global Growth Fund, and RiverFront Moderate Growth & Income Fund shares do not incur redemption fees.
183 | October 31, 2016
Notes to Financial Statements
October 31, 2016
For the Fiscal Year or Period Ended October 31, 2016, the amounts listed below were retained by the Funds. These amounts are reflected in “Shares redeemed” in the Statements of Changes in Net Assets.
| | | Redemption Fee Retained | |
| Fund | | For the Year Ended October 31, 2016 | | | For the Year Ended October 31, 2015 | |
| ALPS | Alerian MLP Infrastructure Index Fund ‐ Class A | | $ | 2,343 | | | $ | – | |
ALPS | CoreCommodity Management CompleteCommodities® Strategy Fund ‐ Class A | | | 952 | | | | 8,433 | |
ALPS | CoreCommodity Management CompleteCommodities® Strategy Fund ‐ Class C | | | – | | | | 106 | |
ALPS | CoreCommodity Management CompleteCommodities® Strategy Fund ‐ Class I | | | 37,944 | | | | 77,754 | |
| ALPS | Kotak India Growth Fund ‐ Class A | | | 10 | | | | 684 | |
| ALPS | Kotak India Growth Fund ‐ Class C | | | 102 | | | | – | |
| ALPS | Kotak India Growth Fund ‐ Class I | | | 7 | | | | 10,529 | |
ALPS | Metis Global Micro Cap Fund ‐ Class A(a) | | | 198 | | | | – | |
| ALPS | Red Rocks Listed Private Equity Fund ‐ Class A | | | 16,347 | | | | 28,724 | |
| ALPS | Red Rocks Listed Private Equity Fund ‐ Class C | | | 272 | | | | 5,076 | |
| ALPS | Red Rocks Listed Private Equity Fund ‐ Class I | | | 58,375 | | | | 54,952 | |
| ALPS | Red Rocks Listed Private Equity Fund ‐ Class R | | | – | | | | 60 | |
| ALPS | Sterling ETF Tactical Rotation Fund ‐ Class A | | | 23 | | | | 401 | |
| ALPS | Sterling ETF Tactical Rotation Fund ‐ Class I | | | 172 | | | | 348 | |
| Clough China Fund ‐ Class A | | | 650 | | | | 2,852 | |
| Clough China Fund ‐ Class C | | | 101 | | | | 56 | |
| Clough China Fund ‐ Class I | | | 2,551 | | | | 138,993 | |
| (a) | The Fund commenced operations on December 24, 2015. |
Transactions in shares of capital stock were as follows:
| | | ALPS | Alerian MLP Infrastructure Index Fund | |
| | | For the Year Ended October 31, 2016 | | | For the Year Ended October 31, 2015 | |
| Class A | | | | | | |
| Shares sold | | | 1,353,490 | | | | 1,259,572 | |
| Dividends reinvested | | | 119,284 | | | | 123,898 | |
| Shares redeemed | | | (1,755,246 | ) | | | (427,258 | ) |
| Net increase/(decrease) in shares outstanding | | | (282,472 | ) | | | 956,212 | |
| Class C | | | | | | | | |
| Shares sold | | | 678,733 | | | | 818,801 | |
| Dividends reinvested | | | 107,988 | | | | 80,720 | |
| Shares redeemed | | | (553,699 | ) | | | (402,241 | ) |
| Net increase in shares outstanding | | | 233,022 | | | | 497,280 | |
| Class I | | | | | | | | |
| Shares sold | | | 2,801,399 | | | | 735,624 | |
| Dividends reinvested | | | 221,667 | | | | 48,740 | |
| Shares redeemed | | | (667,182 | ) | | | (786,515 | ) |
| Net increase/(decrease) in shares outstanding | | | 2,355,884 | | | | (2,151 | ) |
184 | October 31, 2016
Notes to Financial Statements
October 31, 2016
| | | ALPS | CoreCommodity Management CompleteCommodities® Strategy Fund | |
| | | For the Year Ended October 31, 2016 | | | For the Year Ended October 31, 2015 | |
| Class A | | | | | | |
| Shares sold | | | 2,078,071 | | | | 2,262,826 | |
| Dividends reinvested | | | – | | | | – | |
| Shares redeemed | | | (2,244,116 | ) | | | (2,238,826 | ) |
| Net increase/(decrease) in shares outstanding | | | (166,045 | ) | | | 24,000 | |
| Class C | | | | | | | | |
| Shares sold | | | 301,619 | | | | 518,739 | |
| Dividends reinvested | | | – | | | | – | |
| Shares redeemed | | | (469,230 | ) | | | (659,903 | ) |
| Net decrease in shares outstanding | | | (167,611 | ) | | | (141,164 | ) |
| Class I | | | | | | | | |
| Shares sold | | | 38,694,156 | | | | 38,810,785 | |
| Dividends reinvested | | | – | | | | 209,271 | |
| Shares redeemed | | | (25,932,814 | ) | | | (29,430,269 | ) |
| Net increase in shares outstanding | | | 12,761,342 | | | | 9,589,787 | |
| | | ALPS | Kotak India Growth Fund | |
| | | For the Year Ended October 31, 2016 | | | For the Year Ended October 31, 2015 | |
| Class A | | | | | | |
| Shares sold | | | 95,245 | | | | 275,925 | |
| Dividends reinvested | | | 65,989 | | | | 17,640 | |
| Shares redeemed | | | (162,724 | ) | | | (242,799 | ) |
| Net increase/(decrease) in shares outstanding | | | (1,490 | ) | | | 50,766 | |
| Class C | | | | | | | | |
| Shares sold | | | 5,570 | | | | 81,887 | |
| Dividends reinvested | | | 25,549 | | | | 4,439 | |
| Shares redeemed | | | (29,391 | ) | | | (41,866 | ) |
| Net increase in shares outstanding | | | 1,728 | | | | 44,460 | |
| Class I | | | | | | | | |
| Shares sold | | | 192,239 | | | | 356,462 | |
| Dividends reinvested | | | 102,843 | | | | 26,939 | |
| Shares redeemed | | | (189,585 | ) | | | (385,524 | ) |
| Net increase/(decrease) in shares outstanding | | | 105,497 | | | | (2,123 | ) |
185 | October 31, 2016
Notes to Financial Statements
October 31, 2016
| | | ALPS | Metis Global Micro Cap Fund | |
| | | For the Period December 24, 2015 (Commencement) to October 31, 2016 | |
| Class A | | | |
| Shares sold | | | 72,442 | |
| Dividends reinvested | | | – | |
| Shares redeemed | | | (946 | ) |
| Net increase in shares outstanding | | | 71,496 | |
| Class C | | | | |
| Shares sold | | | 22,381 | |
| Dividends reinvested | | | – | |
| Shares redeemed | | | – | |
| Net increase in shares outstanding | | | 22,381 | |
| Class I | | | | |
| Shares sold | | | 1,323,269 | |
| Dividends reinvested | | | – | |
| Shares redeemed | | | (2,409 | ) |
| Net increase in shares outstanding | | | 1,320,860 | |
| | | ALPS | Red Rocks Listed Private Equity Fund | |
| | | For the Year Ended October 31, 2016 | | | For the Year Ended October 31, 2015 | |
| Class A | | | | | | | |
| Shares sold | | | 5,175,428 | | | | 10,981,499 | |
| Dividends reinvested | | | 2,082,869 | | | | 1,033,219 | |
| Shares redeemed | | | (15,426,234 | ) | | | (14,218,098 | ) |
| Net decrease in shares outstanding | | | (8,167,937 | ) | | | (2,203,380 | ) |
| Class C | | | | | | | | |
| Shares sold | | | 372,093 | | | | 870,902 | |
| Dividends reinvested | | | 161,570 | | | | 64,156 | |
| Shares redeemed | | | (1,037,361 | ) | | | (655,615 | ) |
| Net increase/(decrease) in shares outstanding | | | (503,698 | ) | | | 279,443 | |
| Class I | | | | | | | | |
| Shares sold | | | 13,689,387 | | | | 18,816,997 | |
| Dividends reinvested | | | 2,315,329 | | | | 659,785 | |
| Shares redeemed | | | (29,797,754 | ) | | | (14,723,024 | ) |
| Net increase/(decrease) in shares outstanding | | | (13,793,038 | ) | | | 4,753,758 | |
| Class R | | | | | | | | |
| Shares sold | | | 233,544 | | | | 439,998 | |
| Dividends reinvested | | | 48,064 | | | | 7,077 | |
| Shares redeemed | | | (275,974 | ) | | | (80,417 | ) |
| Net increase in shares outstanding | | | 5,634 | | | | 366,658 | |
186 | October 31, 2016
Notes to Financial Statements
October 31, 2016
| | | ALPS | Sterling ETF Tactical Rotation Fund | |
| | | For the Year Ended October 31, 2016 | | | For the Year Ended October 31, 2015 | |
| Class A | | | | | | |
| Shares sold | | | 172,061 | | | | 1,594,176 | |
| Dividends reinvested | | | 12,338 | | | | 4,852 | |
| Shares redeemed | | | (1,067,645 | ) | | | (633,557 | ) |
| Net increase/(decrease) in shares outstanding | | | (883,246 | ) | | | 965,471 | |
| Class C | | | | | | | | |
| Shares sold | | | 27,924 | | | | 248,835 | |
| Dividends reinvested | | | 2,271 | | | | 336 | |
| Shares redeemed | | | (141,979 | ) | | | (35,100 | ) |
| Net increase/(decrease) in shares outstanding | | | (111,784 | ) | | | 214,071 | |
| Class I | | | | | | | | |
| Shares sold | | | 270,021 | | | | 1,466,642 | |
| Dividends reinvested | | | 18,640 | | | | 5,410 | |
| Shares redeemed | | | (1,593,551 | ) | | | (323,715 | ) |
| Net increase/(decrease) in shares outstanding | | | (1,304,890 | ) | | | 1,148,337 | |
| | | ALPS | WMC Research Value Fund | |
| | | For the Year Ended October 31, 2016 | | | For the Year Ended October 31, 2015 | |
| Class A | | | | | | |
| Shares sold | | | 36,897 | | | | 155,776 | |
| Dividends reinvested | | | 1,861,799 | | | | 485,238 | |
| Shares redeemed | | | (749,507 | ) | | | (590,531 | ) |
| Net increase in shares outstanding | | | 1,149,189 | | | | 50,483 | |
| Class C | | | | | | | | |
| Shares sold | | | 40,514 | | | | 142,521 | |
| Dividends reinvested | | | 20,844 | | | | 1,762 | |
| Shares redeemed | | | (82,540 | ) | | | (88,229 | ) |
| Net increase/(decrease) in shares outstanding | | | (21,182 | ) | | | 56,054 | |
| Class I | | | | | | | | |
| Shares sold | | | 674,466 | | | | 278,507 | |
| Dividends reinvested | | | 1,399,500 | | | | 380,975 | |
| Shares redeemed | | | (593,532 | ) | | | (605,101 | ) |
| Net increase in shares outstanding | | | 1,480,434 | | | | 54,381 | |
187 | October 31, 2016
Notes to Financial Statements
October 31, 2016
| | | Clough China Fund | |
| | | For the Year Ended October 31, 2016 | | | For the Year Ended October 31, 2015 | |
| Class A | | | | | | |
| Shares sold | | | 77,224 | | | | 388,837 | |
| Dividends reinvested | | | 11,930 | | | | 38,495 | |
| Shares redeemed | | | (380,746 | ) | | | (563,454 | ) |
| Net decrease in shares outstanding | | | (291,592 | ) | | | (136,122 | ) |
| Class C | | | | | | | | |
| Shares sold | | | 34,861 | | | | 170,382 | |
| Dividends reinvested | | | 1,522 | | | | 11,566 | |
| Shares redeemed | | | (122,615 | ) | | | (194,090 | ) |
| Net decrease in shares outstanding | | | (86,232 | ) | | | (12,142 | ) |
| Class I | | | | | | | | |
| Shares sold | | | 312,441 | | | | 1,506,104 | |
| Dividends reinvested | | | 17,964 | | | | 45,342 | |
| Shares redeemed | | | (469,529 | ) | | | (1,521,537 | ) |
| Net increase/(decrease) in shares outstanding | | | (139,124 | ) | | | 29,909 | |
| | | RiverFront Conservative Income Builder Fund | |
| | | For the Year Ended October 31, 2016 | | | For the Year Ended October 31, 2015 | |
| Class A | | | | | | |
| Shares sold | | | 40,524 | | | | 68,088 | |
| Dividends reinvested | | | 1,467 | | | | 2,235 | |
| Shares redeemed | | | (42,823 | ) | | | (71,287 | ) |
| Net decrease in shares outstanding | | | (832 | ) | | | (964 | ) |
| Class C | | | | | | | | |
| Shares sold | | | 457,023 | | | | 487,979 | |
| Dividends reinvested | | | 8,597 | | | | 14,535 | |
| Shares redeemed | | | (189,391 | ) | | | (136,754 | ) |
| Net increase in shares outstanding | | | 276,229 | | | | 365,760 | |
| Class I | | | | | | | | |
| Shares sold | | | 90,395 | | | | 168,227 | |
| Dividends reinvested | | | 3,804 | | | | 7,413 | |
| Shares redeemed | | | (86,636 | ) | | | (229,291 | ) |
| Net increase/(decrease) in shares outstanding | | | 7,563 | | | | (53,651 | ) |
188 | October 31, 2016
Notes to Financial Statements
October 31, 2016
| | | RiverFront Dynamic Equity Income Fund | |
| | | For the Year Ended October 31, 2016 | | | For the Year Ended October 31, 2015 | |
| Class A | | | | | | |
| Shares sold | | | 561,317 | | | | 486,948 | |
| Dividends reinvested | | | 60,340 | | | | 68,595 | |
| Shares redeemed | | | (552,664 | ) | | | (308,287 | ) |
| Net increase in shares outstanding | | | 68,993 | | | | 247,256 | |
| Class C | | | | | | | | |
| Shares sold | | | 510,382 | | | | 878,269 | |
| Dividends reinvested | | | 88,886 | | | | 114,440 | |
| Shares redeemed | | | (743,582 | ) | | | (522,786 | ) |
| Net increase/(decrease) in shares outstanding | | | (144,314 | ) | | | 469,923 | |
| Class I | | | | | | | | |
| Shares sold | | | 998,443 | | | | 639,114 | |
| Dividends reinvested | | | 74,325 | | | | 79,298 | |
| Shares redeemed | | | (544,834 | ) | | | (517,459 | ) |
| Net increase in shares outstanding | | | 527,934 | | | | 200,953 | |
| | | RiverFront Global Allocation Fund | |
| | | For the Year Ended October 31, 2016 | | | For the Year Ended October 31, 2015 | |
| Class A | | | | | | | | |
| Shares sold | | | 68,762 | | | | 187,353 | |
| Dividends reinvested | | | 9,681 | | | | 54,813 | |
| Shares redeemed | | | (228,709 | ) | | | (186,115 | ) |
| Net increase/(decrease) in shares outstanding | | | (150,266 | ) | | | 56,051 | |
| Class C | | | | | | | | |
| Shares sold | | | 173,583 | | | | 445,383 | |
| Dividends reinvested | | | 19,399 | | | | 94,535 | |
| Shares redeemed | | | (355,357 | ) | | | (253,151 | ) |
| Net increase/(decrease) in shares outstanding | | | (162,375 | ) | | | 286,767 | |
| Class I | | | | | | | | |
| Shares sold | | | 270,958 | | | | 732,674 | |
| Dividends reinvested | | | 24,795 | | | | 91,727 | |
| Shares redeemed | | | (644,674 | ) | | | (259,448 | ) |
| Net increase/(decrease) in shares outstanding | | | (348,921 | ) | | | 564,953 | |
189 | October 31, 2016
Notes to Financial Statements
October 31, 2016
| | | RiverFront Global Growth Fund | |
| | | For the Year Ended October 31, 2016 | | | For the Year Ended October 31, 2015 | |
| Class A | | | | | | |
| Shares sold | | | 213,667 | | | | 461,853 | |
| Dividends reinvested | | | 31,179 | | | | 126,977 | |
| Shares redeemed | | | (847,250 | ) | | | (357,314 | ) |
| Net increase/(decrease) in shares outstanding | | | (602,404 | ) | | | 231,516 | |
| Class C | | | | | | | | |
| Shares sold | | | 145,830 | | | | 299,191 | |
| Dividends reinvested | | | 21,584 | | | | 86,034 | |
| Shares redeemed | | | (243,333 | ) | | | (193,028 | ) |
| Net increase/(decrease) in shares outstanding | | | (75,919 | ) | | | 192,197 | |
| Class I | | | | | | | | |
| Shares sold | | | 174,701 | | | | 539,263 | |
| Dividends reinvested | | | 26,491 | | | | 96,480 | |
| Shares redeemed | | | (628,217 | ) | | | (325,705 | ) |
| Net increase/(decrease) in shares outstanding | | | (427,025 | ) | | | 310,038 | |
| Class L | | | | | | | | |
| Shares sold | | | 193,055 | | | | 381,064 | |
| Dividends reinvested | | | 44,157 | | | | 186,091 | |
| Shares redeemed | | | (446,291 | ) | | | (278,706 | ) |
| Net increase/(decrease) in shares outstanding | | | (209,079 | ) | | | 288,449 | |
| Investor Class | | | | | | | | |
| Shares sold | | | 2,428 | | | | 18,530 | |
| Dividends reinvested | | | 10,345 | | | | 54,628 | |
| Shares redeemed | | | (165,289 | ) | | | (79,199 | ) |
| Net decrease in shares outstanding | | | (152,516 | ) | | | (6,041 | ) |
| | | RiverFront Moderate Growth & Income Fund | |
| | | For the Year Ended October 31, 2016 | | | For the Year Ended October 31, 2015 | |
| Class A | | | | | | | | |
| Shares sold | | | 408,231 | | | | 366,429 | |
| Dividends reinvested | | | 74,720 | | | | 148,964 | |
| Shares redeemed | | | (587,432 | ) | | | (660,624 | ) |
| Net decrease in shares outstanding | | | (104,481 | ) | | | (145,231 | ) |
| Class C | | | | | | | | |
| Shares sold | | | 927,265 | | | | 1,473,735 | |
| Dividends reinvested | | | 189,021 | | | | 331,196 | |
| Shares redeemed | | | (1,622,269 | ) | | | (1,084,631 | ) |
| Net increase/(decrease) in shares outstanding | | | (505,983 | ) | | | 720,300 | |
| Class I | | | | | | | | |
| Shares sold | | | 1,559,584 | | | | 1,228,437 | |
| Dividends reinvested | | | 170,570 | | | | 248,980 | |
| Shares redeemed | | | (1,930,466 | ) | | | (905,092 | ) |
| Net increase/(decrease) in shares outstanding | | | (200,312 | ) | | | 572,325 | |
190 | October 31, 2016
Notes to Financial Statements
October 31, 2016
7. AFFILIATED COMPANIES
Funds may invest in certain securities that are considered securities issued by affiliated companies. As defined by the Investment Company Act of 1940, an affiliated person, including an affiliated company, is one in which a Fund owns 5% or more of the outstanding voting securities, or a company which is under common ownership or control with the Fund.
For the Fiscal Year Ended October 31, 2016, the RiverFront Funds listed below held shares of the RiverFront Strategic Income Fund, which is considered an affiliate to the Funds.
| | | Share Balance November 1, 2015 | | | Purchases | | | Sales | | | Share Balance October 31, 2016 | | | Dividend Income | | | Realized Loss | | | Market Value October 31, 2016 | |
| RiverFront Conservative Income Builder Fund | | | 47,086 | | | | 21,258 | | | | 29,487 | | | | 38,857 | | | $ | 46,188 | | | $ | (18,240 | ) | | $ | 977,254 | |
| RiverFront Dynamic Equity Income Fund | | | 215,714 | | | | 114,042 | | | | 200,348 | | | | 129,408 | | | | 187,495 | | | | (123,814 | ) | | | 3,254,611 | |
| RiverFront Global Allocation Fund | | | 39,386 | | | | 59,551 | | | | 70,377 | | | | 28,560 | | | | 40,718 | | | | (10,349 | ) | | | 718,284 | |
| RiverFront Moderate Growth & Income Fund | | | 562,358 | | | | 140,390 | | | | 365,875 | | | | 336,873 | | | | 472,483 | | | | (261,169 | ) | | | 8,472,356 | |
8. MANAGEMENT AND RELATED-PARTY TRANSACTIONS
ALPS Advisors, Inc. (“AAI”), subject to the authority of the Board, is responsible for the overall management of the Funds listed below. AAI has delegated daily management of the Funds listed below to the corresponding Sub-Advisor(s) listed in the table below. Each Sub-Advisor manages the investments of the Fund in accordance with its investment objective, policies and limitations and investment guidelines established jointly by AAI and the Board.
| Fund | Sub-Advisor(s) |
ALPS | CoreCommodity Management CompleteCommodities® Strategy Fund | CoreCommodity Management, LLC |
| ALPS | Kotak India Growth Fund | Kotak Mahindra (UK) Limited |
| ALPS | Metis Global Micro Cap Fund | Metis Global Partners, LLC |
| ALPS | Red Rocks Listed Private Equity Fund | Red Rocks Capital, LLC(a) |
| ALPS | Sterling ETF Tactical Rotation Fund | Sterling Global Strategies, LLC |
| ALPS | WMC Research Value Fund | Wellington Management Company, LLP |
| Clough China Fund | Clough Capital Partners, LP |
| RiverFront Conservative Income Builder Fund | RiverFront Investment Group, LLC |
| RiverFront Dynamic Equity Income Fund | RiverFront Investment Group, LLC |
| RiverFront Global Allocation Fund | RiverFront Investment Group, LLC |
| RiverFront Global Growth Fund | RiverFront Investment Group, LLC |
| RiverFront Moderate Growth & Income Fund | RiverFront Investment Group, LLC |
(a) | Red Rocks Capital LLC is a subsidiary of ALPS Advisers, Inc. |
191 | October 31, 2016
Notes to Financial Statements
October 31, 2016
Pursuant to the Investment Advisory Agreement (the “Advisory Agreement”), the Funds listed below pay AAI an annual management fee which is based on each Fund’s average daily net assets. The management fee is paid on a monthly basis. The following table reflects the Funds’ contractual management fee rates (expressed as an annual rate).
| Fund | Contractual Management Fee |
| ALPS | Alerian MLP Infrastructure Index Fund | 0.70% |
ALPS | CoreCommodity Management CompleteCommodities® Strategy Fund | 0.85% |
| ALPS | Kotak India Growth Fund | 1.25% |
| ALPS | Metis Global Micro Cap Fund | 1.25% |
| ALPS | Red Rocks Listed Private Equity Fund | 0.85% |
| ALPS | Sterling ETF Tactical Rotation Fund | 0.95% |
| ALPS | WMC Research Value Fund | 0.95%(a) |
| Clough China Fund | 1.35% |
| RiverFront Conservative Income Builder Fund | 0.85% |
| RiverFront Dynamic Equity Income Fund | 0.85% |
| RiverFront Global Allocation Fund | 0.85% |
| RiverFront Global Growth Fund | 0.85% |
| RiverFront Moderate Growth & Income Fund | 0.85% |
(a) | The contractual management fee is 0.95% for the first $250 million of net assets, 0.85% for the next $250 million of net assets, and 0.75% for net assets in excess of $500 million. |
Pursuant to an Investment Sub-advisory Agreement, AAI pays the Sub-Advisors of the Funds listed below an annual sub-advisory management fee which is based on each Fund’s average daily assets. AAI is required to pay all fees due to each Sub-Advisor out of the management fee AAI receives from each Fund listed below. The following table reflects the Funds’ contractual sub-advisory fee rates.
| Fund | Average Daily Net Assets of the Fund | Contractual Sub-Advisory Fee |
ALPS | CoreCommodity Management CompleteCommodities® Strategy Fund | All Asset Levels | 0.75% |
| ALPS | Kotak India Growth Fund | First $50 Million Over $50 Million | |
| ALPS | Metis Global Micro Cap Fund | All Asset Levels | 1.00% |
| ALPS | Red Rocks Listed Private Equity Fund | All Asset Levels | 0.57% |
| ALPS | Sterling ETF Tactical Rotation Fund | All Asset Levels | 0.60% |
| ALPS | WMC Research Value Fund | First $250 Million $250 Million - $500 Million Over $500 Million | |
| Clough China Fund | All Asset Levels | 0.90% |
| RiverFront Conservative Income Builder Fund | All Asset Levels | 0.60% |
| RiverFront Dynamic Equity Income Fund | All Asset Levels | 0.60% |
| RiverFront Global Allocation Fund | All Asset Levels | 0.60% |
| RiverFront Global Growth Fund | All Asset Levels | 0.60% |
| RiverFront Moderate Growth & Income Fund | All Asset Levels | 0.60% |
ALPS | Alerian MLP Infrastructure Index Fund
AAI has contractually agreed to limit the amount of the Fund’s total annual expenses, exclusive of distribution and service (12b-1) fees, shareholder services fees, acquired fund fees and expenses, brokerage commissions, taxes and extraordinary expenses that exceed the following annual rates below.
ALPS | CoreCommodity Management CompleteCommodities® Strategy Fund
AAI and CoreCommodity Management LLC have contractually agreed to limit the amount of the Fund’s total annual expenses, exclusive of distribution and service (12b-1) fees, shareholder services fees, acquired fund fees and expenses, brokerage commissions, interest expense, taxes and extraordinary expenses that exceed the following annual rates below.
192 | October 31, 2016
Notes to Financial Statements
October 31, 2016
ALPS | Kotak India Growth Fund
AAI and Kotak Mahindra (UK) Limited have contractually agreed to limit the amount of the Fund’s total annual expenses, exclusive of distribution and service (12b-1) fees, shareholder services fees, acquired fund fees and expenses, brokerage expenses, interest expenses, taxes and extraordinary expenses that exceed the following annual rates below.
ALPS | Metis Global Micro Cap Fund
AAI and Metis Global Partners, LLC have contractually agreed to limit the amount of the Fund’s total annual expenses, exclusive of distribution and service (12b-1) fees, shareholder services fees, acquired fund fees and expenses, brokerage expenses, interest expense, taxes and extraordinary expenses that exceed the following annual rates below.
ALPS | Red Rocks Listed Private Equity Fund
AAI and Red Rocks Capital LLC have contractually agreed to limit the amount of the Fund’s total annual expenses, exclusive of distribution and service (12b-1) fees, shareholder service fees, brokerage expenses, interest expense, taxes and extraordinary expenses that exceed the following annual rates below.
ALPS | Sterling ETF Tactical Rotation Fund
AAI and Sterling Global Strategies LLC have contractually agreed to limit the amount of the Fund’s total annual expenses, exclusive of Rule 12b-1 fees, shareholder service fees, acquired fund fees and expenses, brokerage expenses, interest expense, taxes and extraordinary expenses that exceed the following annual rates below.
ALPS | WMC Research Value Fund
AAI has contractually agreed to limit the amount of the Fund’s total annual expenses, exclusive of distribution and service (12b-1) fees, shareholder service fees, acquired fund fees and expenses, brokerage expenses, interest expense, taxes and extraordinary expenses that exceed the following annual rates below.
Clough China Fund
AAI has contractually agreed to limit the amount of the Fund’s total annual expenses, exclusive of underlying fund fees and expenses, interest, taxes, brokerage costs and commissions, dividend and interest expense on short sales, litigation, indemnification and extraordinary expenses as determined under generally accepted accounting principles that exceed the following annual rates below.
RiverFront Funds
AAI and RiverFront Investment Group, LLC have contractually agreed to limit the amount of each Fund’s total annual expenses, exclusive of distribution and service (12b-1) fees, shareholder services fees, acquired fund fees and expenses, brokerage commissions, taxes and extraordinary expenses that exceed the following annual rates below.
* * * * * *
These agreements are reevaluated on an annual basis. The current agreement runs through February 28, 2017. Fees waived or reimbursed for the Fiscal Year or Period Ended October 31, 2016 are disclosed on the Statement of Operations or Consolidated Statement of Operations.
| Fund | Class A | Class C | Class I | Class Inv | Class L | Class R |
| ALPS | Alerian MLP Infrastructure Index Fund | 0.85% | 0.85% | 0.85% | N/A | N/A | N/A |
ALPS | CoreCommodity Management CompleteCommodities® Strategy Fund | 1.05% | 1.05% | 1.15% | N/A | N/A | N/A |
| ALPS | Kotak India Growth Fund | 1.60% | 1.60% | 1.60% | N/A | N/A | N/A |
ALPS | Metis Global Micro Cap Fund(a) | 1.70% | 1.70% | 1.70% | N/A | N/A | N/A |
| ALPS | Red Rocks Listed Private Equity Fund | 1.25% | 1.25% | 1.25% | N/A | N/A | 1.25% |
| ALPS | Sterling ETF Tactical Rotation Fund | 1.15% | 1.15% | 1.15% | N/A | N/A | N/A |
| ALPS | WMC Research Value Fund | 0.90% | 0.90% | 0.90% | N/A | N/A | N/A |
| Clough China Fund | 1.95% | 2.70% | 1.70% | N/A | N/A | N/A |
| RiverFront Conservative Income Builder Fund | 0.90% | 0.90% | 0.90% | N/A | N/A | N/A |
| RiverFront Dynamic Equity Income Fund | 0.90% | 0.90% | 0.90% | N/A | N/A | N/A |
| RiverFront Global Allocation Fund | 0.90% | 0.90% | 0.90% | N/A | N/A | N/A |
| RiverFront Global Growth Fund | 0.90% | 0.90% | 0.90% | 0.90% | 0.90% | N/A |
| RiverFront Moderate Growth & Income Fund | 0.90% | 0.90% | 0.90% | N/A | N/A | N/A |
(a) | The Fund commenced operations on December 24, 2015. |
193 | October 31, 2016
Notes to Financial Statements
October 31, 2016
The Advisor(s) and each Sub-Advisor are permitted to recover expenses they have waived or reimbursed, on a class-by-class basis, through the agreements described above to the extent that expenses in later periods fall below the annual limits set forth in these agreements. Clough China Fund is not obligated to pay any such waived or reimbursed fees and expenses more than one year after the end of the fiscal year in which the fees or expenses were waived or reimbursed. The ALPS | Alerian MLP Infrastructure Index Fund, ALPS | CoreCommodity Management CompleteCommodities® Strategy Fund, ALPS | Kotak India Growth Fund, ALPS | Metis Global Micro Cap Fund, ALPS | Red Rocks Listed Private Equity Fund, ALPS | Sterling ETF Tactical Rotation Fund, ALPS | WMC Research Value Fund, RiverFront Conservative Income Builder Fund, RiverFront Global Growth Fund, RiverFront Dynamic Equity Income Fund, RiverFront Global Allocation Fund and RiverFront Moderate Growth & Income Fund are not obligated to pay any such waived or reimbursed fees and expenses more than three years after the end of the fiscal year in which the fees or expenses were waived or reimbursed. As of the Fiscal Year or Period Ended October 31, 2016, the Advisor and Sub-Advisor(s) may seek reimbursement of previously waived and reimbursed fees as follows:
| Fund | | Expires 4/30/17 | | | Expires 10/31/17 | | | Expires 10/31/18 | | | Expires 10/31/19 | | | Total | |
| ALPS | Alerian MLP Infrastructure Index Fund - Class A | | $ | 95,994 | | | $ | 48,763 | | | $ | 74,027 | | | $ | 46,940 | | | $ | 265,724 | |
| ALPS | Alerian MLP Infrastructure Index Fund - Class C | | | 28,674 | | | | 24,506 | | | | 48,448 | | | | 39,470 | | | | 141,098 | |
| ALPS | Alerian MLP Infrastructure Index Fund - Class I | | | 38,321 | | | | 23,255 | | | | 34,028 | | | | 82,786 | | | | 178,390 | |
ALPS | CoreCommodity Management CompleteCommodities® Strategy Fund - Class A | | | 54,765 | | | | 5,093 | | | | 6,800 | | | | N/A | | | | 66,658 | |
ALPS | CoreCommodity Management CompleteCommodities® Strategy Fund - Class C | | | 9,025 | | | | 1,738 | | | | 1,838 | | | | N/A | | | | 12,601 | |
ALPS | CoreCommodity Management CompleteCommodities® Strategy Fund - Class I | | | 20,464 | | | | 11,487 | | | | 86,129 | | | | N/A | | | | 118,080 | |
| ALPS | Kotak India Growth Fund - Class A | | | 198,350 | | | | 81,178 | | | | 95,360 | | | | 99,781 | | | | 474,669 | |
| ALPS | Kotak India Growth Fund - Class C | | | 38,130 | | | | 16,958 | | | | 29,402 | | | | 36,083 | | | | 120,573 | |
| ALPS | Kotak India Growth Fund - Class I | | | 87,957 | | | | 78,796 | | | | 150,329 | | | | 155,959 | | | | 473,041 | |
| ALPS | Red Rocks Listed Private Equity Fund - Class A | | | N/A | | | | N/A | | | | N/A | | | | N/A | | | | N/A | |
| ALPS | Red Rocks Listed Private Equity Fund - Class C | | | N/A | | | | N/A | | | | N/A | | | | N/A | | | | N/A | |
| ALPS | Red Rocks Listed Private Equity Fund - Class I | | | N/A | | | | N/A | | | | N/A | | | | N/A | | | | N/A | |
| ALPS | Red Rocks Listed Private Equity Fund - Class R | | | N/A | | | | N/A | | | | N/A | | | | N/A | | | | N/A | |
ALPS | Metis Global Micro Cap Fund - Class A(a) | | | N/A | | | | N/A | | | | N/A | | | | 3,182 | | | | 3,182 | |
ALPS | Metis Global Micro Cap Fund - Class C(a) | | | N/A | | | | N/A | | | | N/A | | | | 1,243 | | | | 1,243 | |
ALPS | Metis Global Micro Cap Fund - Class I(a) | | | N/A | | | | N/A | | | | N/A | | | | 172,314 | | | | 172,314 | |
| ALPS | Sterling ETF Tactical Rotation Fund - Class A | | | N/A | | | | 15,562 | | | | 78,926 | | | | 68,453 | | | | 162,941 | |
| ALPS | Sterling ETF Tactical Rotation Fund - Class C | | | N/A | | | | 7,752 | | | | 8,258 | | | | 15,622 | | | | 31,632 | |
| ALPS | Sterling ETF Tactical Rotation Fund - Class I | | | N/A | | | | 53,715 | | | | 86,740 | | | | 76,409 | | | | 216,864 | |
| ALPS | WMC Research Value Fund - Class A | | | 39,957 | | | | 25,559 | | | | 51,771 | | | | 190,057 | | | | 307,344 | |
| ALPS | WMC Research Value Fund - Class C | | | 81 | | | | 74 | | | | 1,084 | | | | 2,075 | | | | 3,314 | |
| ALPS | WMC Research Value Fund - Class I | | | 31,790 | | | | 18,931 | | | | 38,056 | | | | 155,578 | | | | 244,355 | |
| Clough China Fund - Class A | | | N/A | | | | N/A | | | | N/A | | | | 17,281 | | | | 17,281 | |
| Clough China Fund - Class C | | | N/A | | | | N/A | | | | N/A | | | | 10,804 | | | | 10,804 | |
| Clough China Fund - Class I | | | N/A | | | | N/A | | | | N/A | | | | 38,704 | | | | 38,704 | |
| RiverFront Conservative Income Builder Fund - Class A | | | 14,608 | | | | 6,814 | | | | 10,172 | | | | 7,737 | | | | 39,331 | |
| RiverFront Conservative Income Builder Fund - Class C | | | 50,526 | | | | 28,317 | | | | 44,843 | | | | 74,216 | | | | 197,902 | |
| RiverFront Conservative Income Builder Fund - Class I | | | 23,541 | | | | 11,336 | | | | 19,129 | | | | 15,087 | | | | 69,093 | |
194 | October 31, 2016
Notes to Financial Statements
October 31, 2016
| Fund | | Expires 4/30/17 | | | Expires 10/31/17 | | | Expires 10/31/18 | | | Expires 10/31/19 | | | Total | |
| RiverFront Dynamic Equity Income Fund - Class A | | $ | 28,302 | | | $ | 20,436 | | | $ | 36,445 | | | $ | 43,635 | | | $ | 128,818 | |
| RiverFront Dynamic Equity Income Fund - Class C | | | 55,724 | | | | 35,936 | | | | 65,254 | | | | 69,414 | | | | 226,328 | |
| RiverFront Dynamic Equity Income Fund - Class I | | | 39,925 | | | | 24,440 | | | | 43,549 | | | | 53,711 | | | | 161,625 | |
| RiverFront Global Allocation Fund - Class A | | | 31,141 | | | | 15,480 | | | | 24,491 | | | | 21,853 | | | | 92,965 | |
| RiverFront Global Allocation Fund - Class C | | | 41,816 | | | | 26,510 | | | | 44,562 | | | | 48,665 | | | | 161,553 | |
| RiverFront Global Allocation Fund - Class I | | | 30,843 | | | | 21,126 | | | | 43,041 | | | | 51,640 | | | | 146,650 | |
| RiverFront Global Growth Fund - Class A | | | 28,381 | | | | 20,676 | | | | 40,534 | | | | 37,416 | | | | 127,007 | |
| RiverFront Global Growth Fund - Class C | | | 22,962 | | | | 13,878 | | | | 29,002 | | | | 31,550 | | | | 97,392 | |
| RiverFront Global Growth Fund - Class I | | | 27,339 | | | | 29,599 | | | | 36,381 | | | | 32,793 | | | | 126,112 | |
| RiverFront Global Growth Fund - Class L | | | 60,282 | | | | 15,078 | | | | 60,547 | | | | 60,762 | | | | 196,669 | |
| RiverFront Global Growth Fund - Investor Class | | | 22,272 | | | | 9,650 | | | | 17,309 | | | | 14,660 | | | | 63,891 | |
| RiverFront Moderate Growth & Income Fund | | | 52,042 | | | | 25,024 | | | | 39,744 | | | | 37,280 | | | | 154,090 | |
| RiverFront Moderate Growth & Income Fund | | | 96,176 | | | | 54,689 | | | | 102,129 | | | | 107,193 | | | | 360,187 | |
| RiverFront Moderate Growth & Income Fund | | | 55,830 | | | | 33,901 | | | | 67,898 | | | | 73,653 | | | | 231,282 | |
(a) | The Fund commenced operations on December 24, 2015. |
ALPS | CoreCommodity recovered $10,272 of reimbursed expense during the financial year ended October 31, 2016.
ALPS Portfolio Solutions Distributor, Inc. (the “Distributor”) acts as the distributor of the Funds’ shares pursuant to a Distribution Agreement with the Trust. Shares are sold on a continuous basis by the Distributor, as agent for the Funds, and the Distributor has agreed to use its best efforts to solicit orders for the sale of Funds’ shares, although it is not obliged to sell any particular amount of shares. The Distributor is not entitled to any compensation for its services. The Distributor is registered as a broker -dealer with the Securities and Exchange Commission. The Funds’ Distributor is also the distributor of the Select Sector SPDR exchange traded funds (the “Underlying Sector ETFs”). As required by exemptive relief obtained by the Underlying Sector ETFs, the Advisor(s) will reimburse any applicable Fund an amount equal to the distribution fee received by the Distributor from the Underlying Sector ETFs attributable to such Fund’s investment in the Underlying Sector ETFs, for so long as the Distributor acts as distributor to such Fund and the Underlying Sector ETFs. There were no amounts reimbursed during the Funds’ Fiscal Year or Period Ended October 31, 2016.
Distribution and Services (12b-1) Plans
Each Fund has adopted Distribution and Services Plans (the “Plans”) pursuant to Rule 12b-1 of the 1940 Act for its Class A, Class C, Class R (ALPS | Red Rocks Listed Private Equity Fund only) and Investor Class (RiverFront Global Growth Fund only) shares. A description of the Distribution and Services Plan for the Class C shares of the ALPS | Metis Global Micro Cap Fund is provided below. The Plans allows a Fund to use Class A, Class C, Class R and Investor Class assets to pay fees in connection with the distribution and marketing of Class A, Class C, Class R and Investor Class shares and/or the provision of shareholder services to Class A, Class C, Class R and Investor Class shareholders. The Plans permit payment for services in connection with the administration of plans or programs that use Class A, Class C, Class R and Investor Class shares of a Fund, if any, as their funding medium and for related expenses. The Plans permit a Fund to make total payments at an annual rate of up to 0.25% of a Fund’s average daily net assets attributable to its Class A and Investor Class shares, 0.75% of a Fund’s average daily net assets attributable to its Class C shares and 0.50% of the ALPS | Red Rocks Listed Private Equity Fund’s average daily net assets attributable to its Class R shares.
Under the terms of the Plans, the Trust is authorized to make payments to the Distributor for remittance to financial intermediaries, as compensation for distribution and/or shareholder ongoing services performed by such entities for beneficial shareholders of the Fund. The Distributor is entitled to retain some or all fees payable under the Plans in certain circumstances, including when there is no broker of record or when certain qualification standards have not been met by the broker of record.
The ALPS | Metis Global Micro Cap Fund has adopted a Distribution and Services Plan (the “Metis Plan”) pursuant to Rule 12b-1 of the 1940 Act for its Class C shares. The Metis Plan permits the Fund to make total payments at an aggregate amount not to exceed 1.00% per annum of the average daily net assets of the Fund’s Class C Shares as follows: (a) an amount equal to the daily equivalent of 0.75% per annum of the net asset value of a Fund’s Class C Shares outstanding on each day, which shall accrue daily and is payable no more frequently than monthly in arrears, as a distribution and marketing fee (the “Distribution Fee”). The Distribution Fee may be used by the Distributor to compensate intermediaries for distribution and sales-related expenses or activities in respect of Class C shares of the Fund; and (b) an amount equal to the daily equivalent of 0.25% per annum of the net asset value of the Fund’s Class C shares outstanding on each day, which shall accrue daily and is payable no more frequently than monthly in arrears, as a service fee (the “Service Fee”). The Service Fee may be used by the Distributor to compensate intermediaries for service-related expenses or activities in respect of Class C shares of the Fund.
195 | October 31, 2016
Notes to Financial Statements
October 31, 2016
Under the terms of the Metis Plan, the Distribution Fee may be retained by the Distributor or used to compensate intermediaries for any activities or expenses primarily intended to finance, directly or indirectly, any activity which is anticipated to result in the sale of Class C shares issued by the Fund. The Service Fee may be used by the Distributor in part for the implementation of shareholder service arrangements or to compensate intermediaries for personal services rendered to Class C shareholders of the Fund and/or maintenance of Class C shareholder accounts (but will generally not be spent on record keeping charges, accounting expenses, transfer agent costs or custodian fees).
The expenses of the Plans and the Metis Plan are reflected as distribution and service fees on the Statement of Operations or Consolidated Statement of Operations. Because these fees are paid out of a Fund’s Class A, Class C, Class R and Investor Class assets, if any, on an ongoing basis, over time they will increase the cost of an investment in Class A, Class C, Class R and Investor Class shares, if any, and Plan fees may cost an investor more than other types of sales charges.
Shareholder Services Plans
Each Fund has adopted a shareholder services plan with respect to their Class A shares (the “Class A Shareholder Services Plan”). Under the Class A Shareholder Services Plan, the Funds are authorized to compensate certain financial intermediaries, including broker-dealers and Fund affiliates (“Participating Organizations”), an aggregate fee in an amount not to exceed on an annual basis 0.15% for Class A shares of the average daily net asset value of Class A shares of the Funds attributable to or held in the name of a Participating Organization pursuant to an agreement with a such Participating Organizations (“Agreement”). Each Agreement will set forth the non-distribution related shareholder services to be performed by the Participating Organization for the benefit of a Fund’s shareholders who have elected to have such Participating Organization service their accounts. Any amount of such payment not paid to Participating Organizations during the Fund’s fiscal year for such service activities shall be reimbursed to the Fund as soon as practicable after the end of the fiscal year. Class A Shareholder Services Plan fees are included with distribution and service fees on the Statements of Operations.
Each Fund has adopted a shareholder services plan with respect to its Class C shares (the “Class C Shareholder Services Plan”). Under the Class C Shareholder Services Plan, the Funds are authorized to pay banks and their affiliates and other institutions, including broker-dealers and Fund affiliates (“Participating Organizations”), an aggregate fee in an amount not to exceed on an annual basis 0.25% for Class C shares of the average daily net asset value of the Class C shares attributable to or held in the name of a Participating Organization for its clients as compensation for providing shareholder service activities, which do not include distribution services, pursuant to an agreement with a Participating Organization. Any amount of such payment not paid to Participating Organizations during a Fund’s fiscal year for such service activities shall be reimbursed to the Fund as soon as practicable after the end of the fiscal year. Class C Shareholder Services Plan fees are included with distribution and service fees on the Statements of Operations.
Certain intermediaries may charge networking, omnibus account or other administrative fees with respect to transactions in shares of each Fund. Transactions may be processed through the National Securities Clearing Corporation or similar systems or processed on a manual basis. These fees generally are paid by the Fund to the Distributor, which uses such fees to reimburse intermediaries. In the event an intermediary receiving payments from the Distributor on behalf of the Fund converts from a networking structure to an omnibus account structure or otherwise experiences increased costs, fees borne by the Fund may increase. Networking fees are shown in the Statements of Operations, if applicable to the Fund.
ALPS Fund Services, Inc. (“ALPS”) serves as administrator to the Funds and the Funds have agreed to pay expenses incurred in connection with their administrative activities. Pursuant to an Administrative Agreement, ALPS provides operational services to the Funds including, but not limited to, fund accounting and fund administration and generally assists in the Funds’ operations. Officers of the Trust are employees of ALPS. The Funds’ administration fee is accrued on a daily basis and paid monthly. Administration fees paid by the Funds for the Fiscal Year or Period Ended October 31, 2016 are disclosed in the Statement of Operations.
ALPS is reimbursed by the Funds for certain out-of-pocket expenses.
Trustees
The fees and expenses of the independent trustees of the Board are presented in the Statements of Operations
9. INDEMNIFICATIONS
Under the Trust’s organizational documents, its officers and Trustees are indemnified against certain liability arising out of the performance of their duties to the Trust. Additionally, in the normal course of business, the Trust enters into contracts with service providers that may contain general indemnification clauses which may permit indemnification to the extent permissible under applicable law. The Trust’s maximum exposure under these arrangements is unknown, as this would involve future claims that may be made against the Trust that have not yet occurred.
10. SUBSEQUENT EVENTS
Effective December 13 , 2016, the Fund’s Adviser has contractually agreed to extend their fee waiver agreement through February 28, 2018.
196 | October 31, 2016
Report of Independent Registered Public Accounting Firm
To the Shareholders and Board of Trustees of Financial Investors Trust:
We have audited the accompanying statements of assets and liabilities, including the statements of investments, of ALPS | Alerian MLP Infrastructure Index Fund, ALPS | Red Rocks Listed Private Equity Fund, ALPS | Sterling ETF Tactical Rotation Fund, ALPS | WMC Research Value Fund (formerly known as ALPS | WMC Disciplined Value Fund), Clough China Fund, RiverFront Conservative Income Builder Fund, RiverFront Dynamic Equity Income Fund, RiverFront Global Allocation Fund, RiverFront Global Growth Fund, RiverFront Moderate Growth & Income Fund, and ALPS | Metis Global Micro Cap Fund, eleven of the funds of Financial Investors Trust (the “Trust”), as of October 31, 2016, and the related statements of operations for the year then ended (as to the ALPS | Metis Global Micro Cap Fund, for the period from December 24, 2015 (commencement of operations) to October 31, 2016), the statements of changes in net assets for each of the two years in the period then ended (as to the ALPS | Metis Global Micro Cap Fund, for the period from December 24, 2015 (commencement of operations) to October 31, 2016), and the financial highlights for each of the periods presented. We have also audited the accompanying consolidated statements of assets and liabilities, including the consolidated statements of investments, of ALPS | Kotak India Growth Fund and ALPS | CoreCommodity Management CompleteCommodities® Strategy Fund, two of the funds of the Trust, as of October 31, 2016, and the related consolidated statements of operations for the year then ended, the consolidated statements of changes in net assets for each of the two years in the period then ended, and the consolidated financial highlights for each of the periods presented. These financial statements and financial highlights for these thirteen funds are the responsibility of the Trust’s management. Our responsibility is to express an opinion on these financial statements and financial highlights based on our audits.
We conducted our audits in accordance with the standards of the Public Company Accounting Oversight Board (United States). Those standards require that we plan and perform the audit to obtain reasonable assurance about whether the financial statements and financial highlights are free of material misstatement. The Trust is not required to have, nor were we engaged to perform, an audit of its internal control over financial reporting. Our audits included consideration of internal control over financial reporting as a basis for designing audit procedures that are appropriate in the circumstances, but not for the purpose of expressing an opinion on the effectiveness of the Trust’s internal control over financial reporting. Accordingly, we express no such opinion. An audit also includes examining, on a test basis, evidence supporting the amounts and disclosures in the financial statements, assessing the accounting principles used and significant estimates made by management, as well as evaluating the overall financial statement presentation. Our procedures included confirmation of securities owned as of October 31, 2016, by correspondence with the custodian and brokers; where replies were not received from brokers, we performed other auditing procedures. We believe that our audits provide a reasonable basis for our opinion.
In our opinion, the financial statements and financial highlights referred to above present fairly, in all material respects, the financial position of each of the thirteen funds constituting Financial Investors Trust as of October 31, 2016, and the results of their operations, the changes in their net assets and the financial highlights for each of the periods presented, in conformity with accounting principles generally accepted in the United States of America.
DELOITTE & TOUCHE LLP
Denver, Colorado
December 22, 2016
197 | October 31, 2016
Additional Information
October 31, 2016 (Unaudited)
1. FUND HOLDINGS
The Funds file their complete schedule of portfolio holdings with the Securities and Exchange Commission (the “SEC”) for the first and third quarters of each fiscal year on Form N‐Q within 60 days after the end of the period. Copies of the Funds’ Form N‐Q are available without charge on the SEC website at http:// www.sec.gov. You may also review and copy the Form N‐Q at the SEC’s Public Reference Room in Washington, D.C. For more information about the operation of the Public Reference Room, please call the SEC at 1‐800‐SEC‐0330.
2. FUND PROXY VOTING POLICIES, PROCEDURES AND SUMMARIES
Fund policies and procedures used in determining how to vote proxies and information regarding how each of the Funds voted proxies relating to portfolio securities during the most recent prior 12‐month period ending June 30 are available without charge, (1) upon request, by calling (toll‐free) (866) 759‐5679 and (2) on the SEC’s website at http://www.sec.gov.
3. TAX DESIGNATIONS
Of the distributions paid by the Funds from ordinary income for the calendar year ended December 31, 2015, the following percentages met the requirements to be treated as qualifying for qualified dividend income and the corporate dividends received deduction:
| | QDI | DRD |
ALPS | CoreCommodity Management CompleteCommodities® Strategy Fund | 0.00% | 0.00% |
| ALPS | Kotak India Growth Fund | 37.73% | 0.00% |
| ALPS | Metis Global Micro Cap Fund | 0.00% | 0.00% |
| ALPS | Red Rocks Listed Private Equity Fund | 21.65% | 1.05% |
| ALPS | Sterling ETF Tactical Rotation Fund | 92.60% | 21.18% |
| ALPS | WMC Research Value Fund | 33.58% | 33.58% |
| Clough China Fund | 48.56% | 0.00% |
| RiverFront Conservative Income Builder Fund | 93.32% | 53.02% |
| RiverFront Dynamic Equity Income Fund | 100.00% | 50.35% |
| RiverFront Global Allocation Fund | 100.00% | 43.86% |
| RiverFront Global Growth Fund | 100.00% | 33.35% |
| RiverFront Moderate Growth & Income Fund | 77.70% | 44.14% |
In early 2016, if applicable, shareholders of record received this information for the distribution paid to them by the Funds during the calendar year 2015 via Form 1099. The Funds will notify shareholders in early 2017 of amounts paid to them by the Funds, if any, during the calendar year 2016.
Pursuant to Section 852(b)(3) of the Internal Revenue Code the Funds designate the following amounts as long‐term capital gain dividends:
ALPS | CoreCommodity Management CompleteCommodities® Strategy Fund | | $ | – | |
| ALPS | Kotak India Growth Fund | | $ | 1,657,288 | |
| ALPS | Metis Global Micro Cap Fund | | $ | – | |
| ALPS | Red Rocks Listed Private Equity Fund | | $ | 20,197,928 | |
| ALPS | Sterling ETF Tactical Rotation Fund | | $ | – | |
| ALPS | WMC Research Value Fund | | $ | 27,067,576 | |
| Clough China Fund | | $ | – | |
| RiverFront Conservative Income Builder Fund | | $ | 30,599 | |
| RiverFront Dynamic Equity Income Fund | | $ | 1,636,020 | |
| RiverFront Global Allocation Fund | | $ | 165,999 | |
| RiverFront Global Growth Fund | | $ | 742,246 | |
| RiverFront Moderate Growth & Income Fund | | $ | 2,965,868 | |
Pursuant to Section 853(c) of the Internal Revenue Code, the following Funds designate the amounts listed below as foreign taxes paid and foreign source income during the current fiscal year:
| | | Foreign Taxes Paid | | | Foreign Source Income | |
| ALPS | Metis Global Micro Cap Fund | | $ | 23,117 | | | $ | 243,191 | |
| Clough China Fund | | $ | 69,697 | | | $ | 1,400,492 | |
198 | October 31, 2016
Additional Information
October 31, 2016 (Unaudited)
4. DISCLOSURE REGARDING APPROVAL OF FUND ADVISORY AND SUB‐ADVISORY AGREEMENTS
ALPS | Alerian MLP Infrastructure Index Fund
On June 7‐8, 2016, the Trustees met in person to discuss, among other things, the approval of the investment advisory agreement between Financial Investors Trust (the “Trust”) and ALPS Advisors, Inc. (“ALPS Advisors”) (the “Investment Advisory Agreement”), in accordance with Section 15(c) of the 1940 Act. The Independent Trustees met with independent legal counsel during executive session and discussed the Investment Advisory Agreement and other related materials.
In renewing and approving the Investment Advisory Agreement with ALPS Advisors, the Trustees, including the Independent Trustees, considered the following factors with respect to the ALPS | Alerian MLP Infrastructure Index Fund (the “Alerian Fund”):
Investment Advisory Fee Rate: The Trustees reviewed and considered the contractual annual advisory fee to be paid by the Trust, on behalf of the Alerian Fund, to ALPS Advisors of 0.70% of the Alerian Fund’s daily average net assets, in light of the extent and quality of the advisory services provided by ALPS Advisors to the Alerian Fund. The Trustees also considered information regarding compensation to be paid to affiliates of ALPS Advisors under other agreements, such as the Fund Accounting and Administration Agreement with ALPS.
The Board received and considered information including a comparison of the Alerian Fund’s contractual and actual management fees and overall expenses with those of funds in the relevant peer expense group and universe of funds provided by an independent provider of investment company data (the “Data Provider”). The Trustees noted that the contractual and actual management fee rates for each class of the Alerian Fund were below their respective Data Provider expense group average and median contractual management fee rate and actual management fee rate, respectively.
Total Expense Ratios: Based on such information, the Trustees further reviewed and considered the total expense ratios (after waivers) of 1.235%, 1.849% and 0.842% for the Class A, Class C and Class I shares, respectively, of the Alerian Fund. The Trustees noted that the total expense ratio (after waivers) of each class of the Alerian Fund was below its respective Data Provider average and median expense group total expense ratio (after waivers).
Nature, Extent and Quality of the Services under the Investment Advisory Agreement: The Trustees received and considered information regarding the nature, extent and quality of services to be provided to the Alerian Fund under the Investment Advisory Agreement. The Trustees reviewed certain background materials supplied by ALPS Advisors in its presentation, including its Form ADV.
The Trustees reviewed and considered ALPS Advisors’ investment advisory personnel, its history as an asset manager and its performance and the amount of assets currently under management by ALPS Advisors and its affiliated entities. The Trustees also reviewed the research and decision‐making processes utilized by ALPS Advisors, including the methods adopted to seek to achieve compliance with the investment objectives, policies and restrictions of the Alerian Fund.
The Trustees considered the background and experience of ALPS Advisors’ management in connection with the Alerian Fund, including reviewing the qualifications, backgrounds and responsibilities of the management team primarily responsible for the day‐to‐day portfolio management of the Alerian Fund and the extent of the resources devoted to research and analysis of actual and potential investments.
The Trustees also reviewed, among other things, ALPS Advisors’ insider trading policies and procedures and its Code of Ethics.
Performance: The Trustees reviewed performance information for the Alerian Fund. That review included a comparison of the Alerian Fund’s performance to the net total return performance of a group of comparable funds selected by the Data Provider. The Trustees noted the net total return performance of each class of the Alerian Fund was above the respective Data Provider performance universe average for the one‐year, two‐year and three‐year periods ended March 31, 2016. The Trustees also considered ALPS Advisors’ discussion of the Alerian Fund’s underlying portfolio diversification categories, its top contributors and top detractors, as well as ALPS Advisors’ performance and reputation generally and its investment techniques, risk management controls and decision‐making processes.
Comparable Accounts: The Trustees noted certain information provided by ALPS Advisors regarding fees charged to its other clients utilizing a strategy similar to that employed by the Alerian Fund.
Profitability: The Trustees received and considered a profitability analysis prepared by ALPS Advisors based on the fees payable under the Investment Advisory Agreement with ALPS Advisors with respect to the Alerian Fund. The Trustees considered the profits, if any, anticipated to be realized by ALPS Advisors in connection with the operation of the Alerian Fund. The Board then reviewed ALPS Advisors’ financial statements in order to analyze the financial condition and stability and profitability of ALPS Advisors.
199 | October 31, 2016
Additional Information
October 31, 2016 (Unaudited)
Economies of Scale: The Trustees considered whether economies of scale in the provision of services to the Alerian Fund will be passed along to the shareholders under the agreements.
Other Benefits to the Adviser: The Trustees reviewed and considered any other incidental benefits derived or to be derived by ALPS Advisors from its relationship with the Alerian Fund, including whether soft dollar arrangements were used.
In renewing ALPS Advisors as the Alerian Fund’s investment adviser and renewing the Investment Advisory Agreement and the fees charged under the Investment Advisory Agreement, the Trustees concluded that no single factor reviewed by the Trustees was identified by the Trustees to be determinative as the principal factor in whether to renew the Investment Advisory Agreement. Further, the Independent Trustees were advised by separate independent legal counsel throughout the process. The Trustees, including all of the Independent Trustees, concluded that:
| ● | the contractual management fee rate for each class of the Alerian Fund was below its respective Data Provider expense group average and median contractual and actual management fee rates; |
| ● | the total expense ratio (after waivers) of each class of the Alerian Fund was below its respective Data Provider average and median expense group total expense ratio (after waivers); |
| ● | the nature, extent and quality of services rendered by ALPS Advisors under the Investment Advisory Agreement with respect to the Alerian Fund were adequate; |
| ● | the net total return performance of each class of the Alerian Fund was above the respective Data Provider performance universe average for the one‐year, two‐year and three‐year periods ended March 31, 2016; |
| ● | bearing in mind the limitations of comparing different types of managed accounts and the different levels of service typically associated with such accounts, the fee structures applicable to ALPS Advisors’ other clients employing a comparable strategy to the Alerian Fund was not indicative of any unreasonableness with respect to the advisory fees proposed to be payable by the Alerian Fund; |
| ● | the Alerian Fund was not profitable to ALPS Advisors in 2015; the profit, if any, realized or anticipated to be realized by ALPS Advisors in connection with the operation of the Alerian Fund is not unreasonable to the Alerian Fund; and |
| ● | there were no material economies of scale or other incidental benefits accruing to ALPS Advisors in connection with its relationship with the Alerian Fund. |
During the review process, the Trustees noted certain instances where clarification or follow‐up was appropriate and others where the Trustees determined that further clarification or follow‐up was not necessary. In those instances where clarification or follow‐up was requested, the Board determined that in each case either information responsive to its requests had been provided, or where any request was outstanding in whole or in part, given the totality of the information provided, the Board had received sufficient information to approve the Investment Advisory Agreement with ALPS Advisors.
Based on the Trustees’ deliberations and their evaluation of the information described above, the Trustees, including all of the Independent Trustees, concluded that ALPS Advisors’ compensation for investment advisory services is consistent with the best interests of the Alerian Fund and its shareholders.
ALPS | Red Rocks Listed Private Equity Fund
On June 7‐8, 2016, the Trustees met in person to discuss, among other things, the approval of the investment advisory agreement between the Trust and ALPS Advisors (the “Investment Advisory Agreement”), in accordance with Section 15(c) of the 1940 Act. The Independent Trustees met with independent legal counsel during executive session and discussed the Investment Advisory Agreement and other related materials.
In renewing and approving the Investment Advisory Agreement with ALPS Advisors, the Trustees, including the Independent Trustees, considered the following factors with respect to the ALPS | Red Rocks Listed Private Equity Fund (the “LPE Fund”):
Investment Advisory Fee Rate: The Trustees reviewed and considered the contractual annual advisory fee to be paid by the Trust, on behalf of the LPE Fund, to ALPS Advisors of 0.85% of the LPE Fund’s daily average net assets, in light of the extent and quality of the advisory services provided by ALPS Advisors to the LPE Fund. The Trustees also considered information regarding compensation to be paid to affiliates of ALPS Advisors under other agreements, such as the Fund Accounting and Administration Agreement with ALPS.
The Board received and considered information including a comparison of the LPE Fund’s contractual and actual management fees and overall expenses with those of funds in the relevant peer expense group and universe of funds provided by the Data Provider. The Trustees noted that the contractual and actual management fee rates for each class of the LPE Fund were above their respective Data Provider expense group average and median contractual management fee rate and actual management fee rate, respectively.
200 | October 31, 2016
Additional Information
October 31, 2016 (Unaudited)
Total Expense Ratios: Based on such information, the Trustees further reviewed and considered the total expense ratios (after waivers) of 1.472%, 2.122%, 1.16% and 1.60% for the Class A, Class C, Class I and Class R shares, respectively, of the LPE Fund. The Trustees noted that the total expense ratio (after waivers) of each class of the LPE Fund was above its respective Data Provider average expense group total expense ratio (after waivers).
Nature, Extent and Quality of the Services under the Investment Advisory Agreement: The Trustees received and considered information regarding the nature, extent and quality of services to be provided to the LPE Fund under the Investment Advisory Agreement. The Trustees reviewed certain background materials supplied by ALPS Advisors in its presentation, including its Form ADV.
The Trustees reviewed and considered ALPS Advisors’ investment advisory personnel, its history as an asset manager and its performance and the amount of assets currently under management by ALPS Advisors and its affiliated entities. The Trustees also reviewed the research and decision‐making processes utilized by ALPS Advisors, including the methods adopted to seek to achieve compliance with the investment objectives, policies and restrictions of the LPE Fund.
The Trustees considered the background and experience of ALPS Advisors’ management in connection with the LPE Fund, including reviewing the qualifications, backgrounds and responsibilities of the management team primarily responsible for the day‐to‐day portfolio management of the LPE Fund and the extent of the resources devoted to research and analysis of actual and potential investments.
The Trustees also reviewed, among other things, ALPS Advisors’ insider trading policies and procedures and its Code of Ethics.
Performance: The Trustees reviewed performance information for the LPE Fund. That review included a comparison of the LPE Fund’s performance to the performance of a group of comparable funds selected by the Data Provider. The Trustees noted that the net total return performance of each class of the LPE Fund was above the respective Data Provider performance universe average for the one‐year, two‐year, three‐year, four‐year and five‐year periods ended March 31, 2016. The Trustees also considered ALPS Advisors’ discussion of the LPE Fund’s underlying portfolio diversification categories, its top contributors and top detractors, as well as ALPS Advisors’ performance and reputation generally and its investment techniques, risk management controls and decision‐making processes.
Comparable Accounts: The Trustees noted certain information provided by ALPS Advisors regarding fees charged to its other clients utilizing a strategy similar to that employed by the LPE Fund.
Profitability: The Trustees received and considered a profitability analysis prepared by ALPS Advisors based on the fees payable under the Investment Advisory Agreement with ALPS Advisors with respect to the LPE Fund. The Trustees considered the profits, if any, anticipated to be realized by ALPS Advisors in connection with the operation of the LPE Fund. The Board then reviewed ALPS Advisors’ financial statements in order to analyze the financial condition and stability and profitability of ALPS Advisors.
Economies of Scale: The Trustees considered whether economies of scale in the provision of services to the LPE Fund will be passed along to the shareholders under the agreements.
Other Benefits to the Adviser: The Trustees reviewed and considered any other incidental benefits derived or to be derived by ALPS Advisors from its relationship with the LPE Fund, including whether soft dollar arrangements were used.
In renewing ALPS Advisors as the LPE Fund’s investment adviser and renewing the Investment Advisory Agreement and the fees charged under the Investment Advisory Agreement, the Trustees concluded that no single factor reviewed by the Trustees was identified by the Trustees to be determinative as the principal factor in whether to renew the Investment Advisory Agreement. Further, the Independent Trustees were advised by separate independent legal counsel throughout the process. The Trustees, including all of the Independent Trustees, concluded that:
| ● | the contractual management fee rate for each class of the LPE Fund was above its respective Data Provider expense group average and median contractual management fee rate; |
| ● | the total expense ratio (after waivers) of each class of the LPE Fund was above its respective Data Provider average expense group total expense ratio (after waivers); |
| ● | the nature, extent and quality of services rendered by ALPS Advisors under the Investment Advisory Agreement with respect to the LPE Fund were adequate; |
| ● | the net total return performance of each class of the LPE Fund was above the respective Data Provider performance universe average for the one‐year, two‐year, three‐year, four‐year and five‐year periods ended March 31, 2016; |
201 | October 31, 2016
Additional Information
October 31, 2016 (Unaudited)
| ● | bearing in mind the limitations of comparing different types of managed accounts and the different levels of service typically associated with such accounts, the fee structures applicable to ALPS Advisors’ other clients employing a comparable strategy to the LPE Fund was not indicative of any unreasonableness with respect to the advisory fees proposed to be payable by the LPE Fund; |
| ● | the LPE Fund was profitable to ALPS Advisors in 2015; the profit, if any, realized or anticipated to be realized by ALPS Advisors in connection with the operation of the LPE Fund is not unreasonable to the LPE Fund; and |
| ● | there were no material economies of scale or other incidental benefits accruing to ALPS Advisors in connection with its relationship with the LPE Fund. |
During the review process, the Trustees noted certain instances where clarification or follow‐up was appropriate and others where the Trustees determined that further clarification or follow‐up was not necessary. In those instances where clarification or follow‐up was requested, the Board determined that in each case either information responsive to its requests had been provided, or where any request was outstanding in whole or in part, given the totality of the information provided, the Board had received sufficient information to approve the Investment Advisory Agreement with ALPS Advisors.
Based on the Trustees’ deliberations and their evaluation of the information described above, the Trustees, including all of the Independent Trustees, concluded that ALPS Advisors’ compensation for investment advisory services is consistent with the best interests of the LPE Fund and its shareholders.
ALPS | WMC Research Value Fund
On June 7‐8, 2016, the Trustees met in person to discuss, among other things, the approval of the investment advisory agreement between the Trust and ALPS Advisors (the “Investment Advisory Agreement”), and the sub‐advisory agreement with Wellington Management Company, LLP (“Wellington”) (the “Sub‐Advisory Agreement”), in accordance with Section 15(c) of the 1940 Act. The Independent Trustees met with independent legal counsel during executive session and discussed the Investment Advisory Agreement, the Sub‐Advisory Agreement and other related materials.
In renewing and approving the Investment Advisory Agreement with ALPS Advisors and the Sub‐Advisory Agreement with Wellington, the Trustees, including the Independent Trustees, considered the following factors with respect to the ALPS | WMC Research Value Fund (the “WMC Fund”):
Investment Advisory and Sub‐Advisory Fee Rate: The Trustees reviewed and considered the contractual annual advisory fee to be paid by the Trust, on behalf of the WMC Fund, to ALPS Advisors of (i) 0.95% of the WMC Fund’s daily average net assets of $0‐$250M; (ii) 0.85% of the WMC Fund’s daily average net assets between $250M‐$500M; and (iii) 0.75% of the WMC Fund’s daily average net assets over $500M in light of the extent and quality of the advisory services to be provided by ALPS Advisors to the WMC Fund. The Trustees also reviewed and considered the contractual annual sub‐advisory fee to be paid by ALPS Advisors to Wellington of (i) 0.50% of the WMC Fund’s daily average net assets of $0‐$250M; (ii) 0.40% of the WMC Fund’s daily average net assets between $250M‐$500M; and (iii) 0.30% of the WMC Fund’s daily average net assets over $500M, in light of the extent and quality of the advisory services provided by Wellington to the WMC Fund. The Trustees also considered information regarding compensation to be paid to affiliates of ALPS Advisors under other agreements, such as the Fund Accounting and Administration Agreement with ALPS.
The Board received and considered information including a comparison of the WMC Fund’s contractual and actual management fees and overall expenses with those of funds in the relevant peer expense group and universe of funds provided by the Data Provider. The Trustees noted that the contractual and actual management fee rates for each class of the WMC Fund were above their respective Data Provider expense group average and median contractual management fee rate and actual management fee rate.
Total Expense Ratios: Based on such information, the Trustees further reviewed and considered the total expense ratios (after waivers) of 1.407%, 2.15% and 1.157% for the Class A, Class C, and Class I shares, respectively, of the WMC Fund. The Trustees noted that the total expense ratio (after waivers) of each class of the WMC Fund was above its respective Data Provider average and median expense group total expense ratio (after waivers).
Nature, Extent and Quality of the Services under the Investment Advisory and Sub‐Advisory Agreements: The Trustees received and considered information regarding the nature, extent and quality of services to be provided to the WMC Fund under the Investment Advisory and Sub‐Advisory Agreements. The Trustees reviewed certain background materials supplied by ALPS Advisors and Wellington in their presentations, including their Forms ADV.
The Trustees reviewed and considered ALPS Advisors’ and Wellington’s investment advisory personnel, their history as asset managers and their performance and the amount of assets currently under management by ALPS Advisors and Wellington and their affiliated entities. The Trustees also reviewed the research and decision‐making processes utilized by ALPS Advisors and Wellington, including the methods adopted to seek to achieve compliance with the investment objectives, policies and restrictions of the WMC Fund.
202 | October 31, 2016
Additional Information
October 31, 2016 (Unaudited)
The Trustees considered the background and experience of ALPS Advisors’ and Wellington’s management in connection with the WMC Fund, including reviewing the qualifications, backgrounds and responsibilities of the management team primarily responsible for the day‐to‐day portfolio management of the WMC Fund and the extent of the resources devoted to research and analysis of actual and potential investments.
The Trustees also reviewed, among other things, ALPS Advisors’ and Wellington’s insider trading policies and procedures and their Codes of Ethics.
Performance: The Trustees reviewed performance information for the WMC Fund. That review included a comparison of the WMC Fund’s performance to the performance of a group of comparable funds selected by the Data Provider. The Trustees noted the net total return performance of each class of the WMC Fund was generally below the respective Data Provider performance universe average for the one‐year, two‐year, three‐year, four‐year and five‐year periods ended March 31, 2016. The Trustees also considered Wellington’s discussion of the WMC Fund’s underlying portfolio diversification categories, its top contributors and top detractors, as well as Wellington’s performance and reputation generally and its investment techniques, risk management controls and decision‐making processes.
Comparable Accounts: The Trustees noted certain information provided by Wellington regarding fees charged to its other clients utilizing a strategy similar to that employed by the WMC Fund.
Profitability: The Trustees received and considered a retrospective and projected profitability analysis prepared by ALPS Advisors and Wellington based on the fees payable under the Investment Advisory Agreement with ALPS Advisors and the Sub‐Advisory Agreement with Wellington, with respect to the WMC Fund. The Trustees considered the profits, if any, anticipated to be realized by ALPS Advisors and Wellington in connection with the operation of the WMC Fund. The Board then reviewed ALPS Advisors’ and Wellington’s financial statements in order to analyze the financial condition and stability and profitability of ALPS Advisors and Wellington.
Economies of Scale: The Trustees considered whether economies of scale in the provision of services to the WMC Fund will be passed along to the shareholders under the agreements.
Other Benefits to the Adviser: The Trustees reviewed and considered any other incidental benefits derived or to be derived by ALPS Advisors from its relationship with the WMC Fund, including whether soft dollar arrangements were used.
In renewing ALPS Advisors as the WMC Fund’s investment adviser and Wellington as the WMC Fund’s sub‐adviser and the fees charged under the Investment Advisory and Sub‐Advisory Agreements, the Trustees concluded that no single factor reviewed by the Trustees was identified by the Trustees to be determinative as the principal factor in whether to renew the Investment Advisory and Sub‐Advisory Agreements. Further, the Independent Trustees were advised by separate independent legal counsel throughout the process. The Trustees, including all of the Independent Trustees, concluded that:
| ● | the contractual management fee rate for each class of the WMC Fund was above its respective Data Provider expense group average and median contractual management fee rate; |
| ● | Wellington’s fees under its sub‐advisory agreements are paid directly by ALPS Advisors; |
| ● | the total expense ratio (after waivers) of each class of the WMC Fund was above its respective Data Provider average and median expense group total expense ratio (after waivers); |
| ● | the nature, extent and quality of services rendered by ALPS Advisors and Wellington under the Investment Advisory and Sub‐Advisory Agreements, respectively, with respect to the WMC Fund were adequate; |
| ● | the net total return performance of each class of the WMC Fund was generally below the respective Data Provider performance universe average for the one‐year, two‐year, three‐year, four‐year and five‐year periods ended March 31, 2016; |
| ● | bearing in mind the limitations of comparing different types of managed accounts and the different levels of service typically associated with such accounts, the fee structures applicable to ALPS Advisors’ and Wellington’s other clients employing a comparable strategy to the WMC Fund was not indicative of any unreasonableness with respect to the advisory and sub‐advisory fees proposed to be payable by the WMC Fund; |
| ● | the WMC Fund was not profitable to ALPS Advisors in 2015; the profit, if any, realized or anticipated to be realized by ALPS Advisors and Wellington in connection with the operation of the WMC Fund is not unreasonable to the WMC Fund; and |
| ● | there were no material economies of scale or other incidental benefits accruing to ALPS Advisors and Wellington in connection with their relationship with the WMC Fund. |
During the review process, the Trustees noted certain instances where clarification or follow‐up was appropriate and others where the Trustees determined that further clarification or follow‐up was not necessary. In those instances where clarification or follow‐up was requested, the Board determined that in each case either information responsive to its requests had been provided, or where any request was outstanding in whole or in part, given the totality of the information provided, the Board had received sufficient information to approve the Investment Advisory Agreement with ALPS Advisors and the Investment Sub‐Advisory Agreement with Wellington.
203 | October 31, 2016
Additional Information
October 31, 2016 (Unaudited)
Based on the Trustees’ deliberations and their evaluation of the information described above, the Trustees, including all of the Independent Trustees, concluded that ALPS Advisors’ and Wellington’s compensation for investment advisory and sub‐advisory services is consistent with the best interests of the WMC Fund and its shareholders.
Clough China Fund
On June 7‐8, 2016, the Trustees met in person to discuss, among other things, the approval of the investment advisory agreement between the Trust and ALPS Advisors (the “Investment Advisory Agreement”), and the sub‐advisory agreement with Clough Capital Partners LP (“Clough Capital”) (the “Sub‐Advisory Agreement”), in accordance with Section 15(c) of the 1940 Act. The Independent Trustees met with independent legal counsel during executive session and discussed the Investment Advisory Agreement, the Sub‐Advisory Agreement and other related materials.
In renewing and approving the Investment Advisory Agreement with ALPS Advisors and the Sub‐Advisory Agreement with Clough Capital, the Trustees, including the Independent Trustees, considered the following factors with respect to the Clough China Fund (the “China Fund”):
Investment Advisory and Sub‐Advisory Fee Rate: The Trustees reviewed and considered the contractual annual advisory fee paid by the Trust, on behalf of the China Fund, to ALPS Advisors of 1.35% of the China Fund’s daily average net assets, in light of the extent and quality of the advisory services provided by ALPS Advisors to the China Fund. The Trustees also reviewed and considered the contractual annual sub‐advisory fee paid by ALPS Advisors to Clough Capital of 0.90% of the China Fund’s daily average net assets, in light of the extent and quality of the advisory services provided by Clough Capital to the China Fund. The Trustees also considered information regarding compensation to be paid to affiliates of ALPS Advisors under other agreements, such as the Fund Accounting and Administration Agreement with ALPS.
The Board received and considered information including a comparison of the China Fund’s contractual and actual management fees and overall expenses with those of funds in the peer expense group and universe of funds provided by the Data Provider. The Trustees noted that the contractual and actual management fee rates for each class of the China Fund was above its respective Data Provider expense group average and median contractual management fee rate and actual management fee rate, respectively.
Total Expense Ratios: Based on such information, the Trustees further reviewed and considered the total expense ratios (after waivers) of 1.95%, 2.70% and 1.70% for the Class A, Class C and Class I shares, respectively, of the China Fund. The Trustees noted that the total expense ratio (after waivers) of each class of the China Fund was above its respective Data Provider average and median expense group total expense ratio (after waivers).
Nature, Extent and Quality of the Services under the Investment Advisory and Sub‐Advisory Agreements: The Trustees received and considered information regarding the nature, extent and quality of services to be provided to the China Fund under the Investment Advisory and Sub‐Advisory Agreements. The Trustees reviewed certain background materials supplied by ALPS Advisors and Clough Capital in their presentations, including their Forms ADV.
The Trustees reviewed and considered ALPS Advisors’ and Clough Capital’s investment advisory personnel, their history as asset managers and their performance and the amount of assets currently under management by ALPS Advisors and Clough Capital and their affiliated entities. The Trustees also reviewed the research and decision‐making processes utilized by ALPS Advisors and Clough Capital, including the methods adopted to seek to achieve compliance with the investment objectives, policies and restrictions of the China Fund.
The Trustees considered the background and experience of ALPS Advisors’ and Clough Capital’s management in connection with the China Fund, including reviewing the qualifications, backgrounds and responsibilities of the management team primarily responsible for the day‐to‐day portfolio management of the China Fund and the extent of the resources devoted to research and analysis of actual and potential investments.
The Trustees also reviewed, among other things, ALPS Advisors’ and Clough Capital’s insider trading policies and procedures and their Codes of Ethics.
Performance: The Trustees reviewed performance information for the China Fund. That review included a comparison of the China Fund’s performance to the performance of a group of comparable funds selected by the Data Provider. The Trustees noted the net total return performance of each class of the China Fund was below the respective Data Provider performance universe average for the one‐year, two‐year and three‐year periods ended March 31, 2016, but generally above the respective Data Provider performance universe average for the four‐year, five‐ year and 10‐year periods ended March 31, 2016. The Trustees also considered Clough Capital’s discussion of the China Fund’s underlying portfolio diversification categories, its top contributors and top detractors, as well as Clough Capital’s performance and reputation generally and its investment techniques, risk management controls and decision‐making processes.
204 | October 31, 2016
Additional Information
October 31, 2016 (Unaudited)
Comparable Accounts: The Trustees noted certain information provided by Clough Capital regarding fees charged to its other clients utilizing a strategy similar to that employed by the China Fund.
Profitability: The Trustees received and considered a profitability analysis prepared by ALPS Advisors and Clough Capital based on the fees payable under the Investment Advisory Agreement with ALPS Advisors and the Investment Sub‐Advisory Agreement with Clough Capital with respect to the China Fund. The Trustees considered the profits, if any, anticipated to be realized by ALPS Advisors and Clough Capital in connection with the operation of the China Fund. The Board then reviewed ALPS Advisors’ and Clough Capital’s financial statements in order to analyze the financial condition and stability and profitability of ALPS Advisors and Clough Capital.
Economies of Scale: The Trustees considered whether economies of scale in the provision of services to the China Fund will be passed along to the shareholders under the agreements.
Other Benefits to the Adviser: The Trustees reviewed and considered any other incidental benefits derived or to be derived by ALPS Advisors from its relationship with the China Fund, including whether soft dollar arrangements were used.
In renewing ALPS Advisors as the China Fund’s investment adviser and Clough Capital as the China Fund’s sub‐adviser and the fees charged under the Investment Advisory and Sub‐Advisory Agreements, the Trustees concluded that no single factor reviewed by the Trustees was identified by the Trustees to be determinative as the principal factor in whether to renew the Investment Advisory and Sub‐Advisory Agreements. Further, the Independent Trustees were advised by separate independent legal counsel throughout the process. The Trustees, including all of the Independent Trustees, concluded that:
| ● | the contractual management fee rate for each class of the China Fund was above its respective Data Provider expense group average and median contractual management fee rate; |
| ● | Clough Capital’s fees under its sub‐advisory agreements are paid directly by ALPS Advisors; |
| ● | the total expense ratio (after waivers) of each class of the China Fund was above its respective Data Provider average and median expense group total expense ratio (after waivers); |
| ● | the nature, extent and quality of services rendered by ALPS Advisors and Clough Capital under the Investment Advisory and Sub‐Advisory Agreements, respectively, with respect to the China Fund were adequate; |
| ● | the net total return performance of each class of the China Fund was below the respective Data Provider performance universe average for the one‐year, two‐year and three‐year periods ended March 31, 2016, but generally above the respective Data Provider performance universe average for the four‐year, five‐year and 10‐year periods ended March 31, 2016; |
| ● | bearing in mind the limitations of comparing different types of managed accounts and the different levels of service typically associated with such accounts, the fee structures applicable to ALPS Advisors’ and Clough Capital’s other clients employing a comparable strategy to the China Fund was not indicative of any unreasonableness with respect to the advisory and sub‐advisory fees proposed to be payable by the China Fund; |
| ● | the China Fund was not profitable to ALPS Advisors in 2015; the profit, if any, realized or anticipated to be realized by ALPS Advisors and Clough Capital in connection with the operation of the China Fund is not unreasonable to the China Fund; and |
| ● | there were no material economies of scale or other incidental benefits accruing to ALPS Advisors and Clough Capital in connection with their relationship with the China Fund. |
During the review process, the Trustees noted certain instances where clarification or follow‐up was appropriate and others where the Trustees determined that further clarification or follow‐up was not necessary. In those instances where clarification or follow‐up was requested, the Board determined that in each case either information responsive to its requests had been provided, or where any request was outstanding in whole or in part, given the totality of the information provided, the Board had received sufficient information to approve the Investment Advisory Agreement with ALPS Advisors and the Investment Sub‐Advisory Agreement with Clough Capital.
Based on the Trustees’ deliberations and their evaluation of the information described above, the Trustees, including all of the Independent Trustees, concluded that ALPS Advisors’ and Clough Capital’s compensation for investment advisory and sub‐advisory services is consistent with the best interests of the China Fund and its shareholders.
205 | October 31, 2016
Additional Information
October 31, 2016 (Unaudited)
ALPS | CoreCommodity Management CompleteCommodites® Strategy Fund
On June 7‐8, 2016, the Trustees met in person to discuss, among other things, the approval of the investment advisory agreement between the Trust and ALPS Advisors (the “Investment Advisory Agreement”), and the sub‐advisory agreement with CoreCommodity Management LLC (“CoreCommodity”) (the “Sub‐Advisory Agreement”), in accordance with Section 15(c) of the 1940 Act. The Independent Trustees met with independent legal counsel during executive session and discussed the Investment Advisory Agreement, the Sub‐Advisory Agreement and other related materials.
In renewing and approving the Investment Advisory Agreement with ALPS Advisors and the Sub‐Advisory Agreement with CoreCommodity, the Trustees, including the Independent Trustees, considered the following factors with respect to the ALPS | CoreCommodity Management CompleteCommodites® Strategy Fund (the “CoreCommodity Fund”):
Investment Advisory and Sub‐Advisory Fee Rate: The Trustees reviewed and considered the contractual annual advisory fee paid by the Trust, on behalf of the CoreCommodity Fund, to ALPS Advisors of 0.85% of the CoreCommodity Fund’s daily average net assets, in light of the extent and quality of the advisory services to be provided by ALPS Advisors to the CoreCommodity Fund. The Trustees also reviewed and considered the contractual annual sub‐advisory fee paid by ALPS Advisors to CoreCommodity of 0.75% of the CoreCommodity Fund’s daily average net assets, in light of the extent and quality of the advisory services provided by CoreCommodity to the CoreCommodity Fund. The Trustees also considered information regarding compensation to be paid to affiliates of ALPS Advisors under other agreements, such as the Fund Accounting and Administration Agreement with ALPS.
The Board received and considered information including a comparison of the CoreCommodity Fund’s contractual and actual management fees and overall expenses with those of funds in the relevant peer expense group and universe of funds provided by the Data Provider. The Trustees noted that the contractual management fee rate for each class of the CoreCommodity Fund was generally equal to or above its respective Data Provider expense group average and median contractual management fee rate.
Total Expense Ratios: Based on such information, the Trustees further reviewed and considered the total expense ratios (after waivers) of 1.45%, 2.05% and 1.15% for the Class A, Class C and Class I shares, respectively, of the CoreCommodity Fund. The Trustees noted that the total expense ratio (after waivers) of each class, except Class C, of the CoreCommodity Fund was above its respective Data Provider average expense group total expense ratio (after waivers). The Trustees noted that the total expense ratio (after waivers) of each class, except Class I, of the CoreCommodity Fund was below its respective Data Provider median expense group total expense ratio (after waivers).
Nature, Extent and Quality of the Services under the Investment Advisory and Sub‐Advisory Agreements: The Trustees received and considered information regarding the nature, extent and quality of services to be provided to the CoreCommodity Fund under the Investment Advisory and Sub‐Advisory Agreements. The Trustees reviewed certain background materials supplied by ALPS Advisors and CoreCommodity in their presentations, including their Forms ADV.
The Trustees reviewed and considered ALPS Advisors’ and CoreCommodity’s investment advisory personnel, their history as asset managers and their performance and the amount of assets currently under management by ALPS Advisors and CoreCommodity and their affiliated entities. The Trustees also reviewed the research and decision‐making processes utilized by ALPS Advisors and CoreCommodity, including the methods adopted to seek to achieve compliance with the investment objectives, policies and restrictions of the CoreCommodity Fund.
The Trustees considered the background and experience of ALPS Advisors’ and CoreCommodity’s management in connection with the CoreCommodity Fund, including reviewing the qualifications, backgrounds and responsibilities of the management team primarily responsible for the day‐to‐day portfolio management of the CoreCommodity Fund and the extent of the resources devoted to research and analysis of actual and potential investments.
The Trustees also reviewed, among other things, ALPS Advisors’ and CoreCommodity’s insider trading policies and procedures and their Codes of Ethics.
Performance: The Trustees reviewed performance information for the CoreCommodity Fund. That review included a comparison of the CoreCommodity Fund’s performance to the performance of a group of comparable funds selected by the Data Provider. The Trustees noted the net total return performance of each class of the CoreCommodity Fund was generally above the respective Data Provider performance universe average the one‐year, two‐year, three‐year, four‐year and five‐year periods ended March 31, 2016. The Trustees also considered CoreCommodity’s discussion of the CoreCommodity Fund’s underlying portfolio diversification categories, its top contributors and top detractors, as well as CoreCommodity’s performance and reputation generally and its investment techniques, risk management controls and decision‐making processes.
Additional Information
October 31, 2016 (Unaudited)
Comparable Accounts: The Trustees noted certain information provided by CoreCommodity regarding fees charged to its other clients utilizing a strategy similar to that employed by the CoreCommodity Fund.
Profitability: The Trustees received and considered a profitability analysis prepared by ALPS Advisors and CoreCommodity based on the fees payable under the Investment Advisory Agreement with ALPS Advisors and the Investment Sub‐Advisory Agreement with CoreCommodity with respect to the CoreCommodity Fund. The Trustees considered the profits, if any, anticipated to be realized by ALPS Advisors and CoreCommodity in connection with the operation of the CoreCommodity Fund. The Board then reviewed ALPS Advisors’ and CoreCommodity’s financial statements in order to analyze the financial condition and stability and profitability of ALPS Advisors and CoreCommodity.
Economies of Scale: The Trustees considered whether economies of scale in the provision of services to the CoreCommodity Fund will be passed along to the shareholders under the agreements.
Other Benefits to the Adviser: The Trustees reviewed and considered any other incidental benefits derived or to be derived by ALPS Advisors from its relationship with the CoreCommodity Fund, including whether soft dollar arrangements were used.
In renewing ALPS Advisors as the CoreCommodity Fund’s investment adviser and CoreCommodity as the CoreCommodity Fund’s sub‐adviser and the fees charged under the Investment Advisory and Sub‐Advisory Agreements, the Trustees concluded that no single factor reviewed by the Trustees was identified by the Trustees to be determinative as the principal factor in whether to renew the Investment Advisory and Sub‐Advisory Agreements. Further, the Independent Trustees were advised by separate independent legal counsel throughout the process. The Trustees, including all of the Independent Trustees, concluded that:
| ● | the contractual management fee rate for each class of the CoreCommodity Fund was generally equal to or above its respective Data Provider expense group average and median contractual management fee rate; |
| ● | CoreCommodity’s fees under its sub‐advisory agreements are paid directly by ALPS Advisors; |
| ● | the total expense ratio (after waivers) of each class, except Class I, of the CoreCommodity Fund was below its respective Data Provider median expense group total expense ratio (after waivers); |
| ● | the nature, extent and quality of services rendered by ALPS Advisors and CoreCommodity under the Investment Advisory and Sub‐Advisory Agreements, respectively, with respect to the CoreCommodity Fund were adequate; |
| ● | the net total return performance of each class of the CoreCommodity Fund was generally above the respective Data Provider performance universe average the one‐year, two‐year, three‐year, four‐year and five‐year periods ended March 31, 2016; |
| ● | bearing in mind the limitations of comparing different types of managed accounts and the different levels of service typically associated with such accounts, the fee structures applicable to ALPS Advisors’ and CoreCommodity’s other clients employing a comparable strategy to the CoreCommodity Fund was not indicative of any unreasonableness with respect to the advisory and sub‐advisory fees proposed to be payable by the CoreCommodity Fund; |
| ● | the CoreCommodity Fund was not profitable to ALPS Advisors in 2015; the profit, if any, realized or anticipated to be realized by ALPS Advisors and CoreCommodity in connection with the operation of the CoreCommodity Fund is not unreasonable to the CoreCommodity Fund; and |
| ● | there were no material economies of scale or other incidental benefits accruing to ALPS Advisors and CoreCommodity in connection with their relationship with the CoreCommodity Fund. |
During the review process, the Trustees noted certain instances where clarification or follow‐up was appropriate and others where the Trustees determined that further clarification or follow‐up was not necessary. In those instances where clarification or follow‐up was requested, the Board determined that in each case either information responsive to its requests had been provided, or where any request was outstanding in whole or in part, given the totality of the information provided, the Board had received sufficient information to approve the Investment Advisory Agreement with ALPS Advisors and the Investment Sub‐Advisory Agreement with CoreCommodity.
Based on the Trustees’ deliberations and their evaluation of the information described above, the Trustees, including all of the Independent Trustees, concluded that ALPS Advisors’ and CoreCommodity’s compensation for investment advisory and sub‐advisory services is consistent with the best interests of the CoreCommodity Fund and its shareholders.
The Trustees applied the same analysis to the advisory arrangements between ALPS Advisors, CoreCommodity and the wholly owned Cayman Island subsidiary of the CoreCommodity Fund.
207 | October 31, 2016
Additional Information
October 31, 2016 (Unaudited)
RiverFront Global Allocation Series
On June 7‐8, 2016, the Trustees met in person to discuss, among other things, the approval of the investment advisory agreement between the Trust and ALPS Advisors (the “Investment Advisory Agreement”), and the sub‐advisory agreement with RiverFront Investment Group, LLC (“RiverFront”) (the “Sub‐Advisory Agreement”), in accordance with Section 15(c) of the 1940 Act. The Independent Trustees met with independent legal counsel during executive session and discussed the Investment Advisory Agreement, the Sub‐Advisory Agreement and other related materials.
In renewing and approving the Investment Advisory Agreement with ALPS Advisors and the Sub‐Advisory Agreement with RiverFront, the Trustees, including the Independent Trustees, considered the following factors with respect to the RiverFront Global Allocation Series (the “RiverFront Global Allocation Series”):
Investment Advisory and Sub‐Advisory Fee Rate: The Trustees reviewed and considered the contractual annual advisory fee to be paid by the Trust, on behalf of the RiverFront Global Allocation Series, to ALPS Advisors of 0.85% of each RiverFront Global Allocation Series’ daily average net assets, in light of the extent and quality of the advisory services provided by ALPS Advisors to the RiverFront Global Allocation Series. The Trustees also reviewed and considered the contractual annual sub‐advisory fee to be paid by ALPS Advisors to RiverFront of 0.60% of each of the RiverFront Global Allocation Series’ daily average net assets, in light of the extent and quality of the advisory services provided by RiverFront to the RiverFront Global Allocation Series. The Trustees also considered information regarding compensation to be paid to affiliates of ALPS Advisors under other agreements, such as the Fund Accounting and Administration Agreement with ALPS.
The Board received and considered information including a comparison of the RiverFront Global Allocation Series’ contractual and actual management fees and overall expenses with those of funds in the peer expense group and universe of funds provided by the Data Provider. The Trustees noted that the contractual management fee rate for each class of shares of each RiverFront Global Allocation Series’ were above the Data Provider expense group average and median contractual management fee rates.
Total Expense Ratios: Based on such information, the Trustees further reviewed and considered the total expense ratios (after waivers) of 1.15%, 1.90%, 0.90%, 1.15% and 0.90% for the Class A, Class C, Class I, Investors Class and Class L shares, respectively, of the RiverFront Global Allocation Series. The Trustees noted that the total expense ratio (after waivers) of each class of each of the RiverFront Global Allocation Series’ were generally equal to or below its respective Data Provider average and median expense group total expense ratios (after waivers).
Nature, Extent and Quality of the Services under the Investment Advisory and Sub‐Advisory Agreements: The Trustees received and considered information regarding the nature, extent and quality of services to be provided to the RiverFront Global Allocation Series under the Investment Advisory and Sub‐Advisory Agreements. The Trustees reviewed certain background materials supplied by ALPS Advisors and RiverFront in their presentations, including their Forms ADV.
The Trustees reviewed and considered ALPS Advisors’ and RiverFront’s investment advisory personnel, their history as asset managers and their performance and the amount of assets currently under management by ALPS Advisors and RiverFront and their affiliated entities. The Trustees also reviewed the research and decision‐making processes utilized by ALPS Advisors and RiverFront, including the methods adopted to seek to achieve compliance with the investment objectives, policies and restrictions of the RiverFront Global Allocation Series.
The Trustees considered the background and experience of ALPS Advisors’ and RiverFront’s management in connection with the RiverFront Global Allocation Series, including reviewing the qualifications, backgrounds and responsibilities of the management team primarily responsible for the day‐to‐day portfolio management of the RiverFront Global Allocation Series and the extent of the resources devoted to research and analysis of actual and potential investments.
The Trustees also reviewed, among other things, ALPS Advisors’ and RiverFront’s insider trading policies and procedures and their Codes of Ethics.
Performance: The Trustees reviewed performance information for the RiverFront Global Allocation Series for the one‐year, two‐year, three‐year, four‐year and five‐year periods, as applicable, ended March 31, 2016. That review included a comparison of the RiverFront Global Allocation Series’ performance to the performance of a group of comparable funds selected by the Data Provider. The Trustees noted the net total return performance of each class of each of the RiverFront Global Allocation Series, except the RiverFront Moderate Growth & Income Fund, was generally below its respective performance universe average. The Trustees also considered RiverFront’s discussion of the RiverFront Global Allocation Series’ underlying portfolio diversification categories, its top contributors and top detractors, as well as RiverFront’s performance and reputation generally and its investment techniques, risk management controls and decision‐making processes.
Comparable Accounts: The Trustees noted certain information provided by RiverFront regarding fees charged to its other clients utilizing a strategy similar to that employed by the RiverFront Global Allocation Series.
208 | October 31, 2016
Additional Information
October 31, 2016 (Unaudited)
Profitability: The Trustees received and considered a retrospective and projected profitability analysis prepared by ALPS Advisors and RiverFront based on the fees payable under the Investment Advisory Agreement with ALPS Advisors and the Investment Sub‐Advisory Agreement with RiverFront with respect to the RiverFront Global Allocation Series. The Trustees considered the profits, if any, anticipated to be realized by ALPS Advisors and RiverFront in connection with the operation of each RiverFront Global Allocation Series. The Board then reviewed ALPS Advisors’ and RiverFront’s financial statements in order to analyze the financial condition and stability and profitability of ALPS Advisors and RiverFront.
Economies of Scale: The Trustees considered whether economies of scale in the provision of services to the RiverFront Global Allocation Series will be passed along to the shareholders under the agreements.
Other Benefits to the Adviser: The Trustees reviewed and considered any other incidental benefits derived or to be derived by ALPS Advisors from its relationship with the RiverFront Global Allocation Series, including whether soft dollar arrangements were used.
In renewing ALPS Advisors as the RiverFront Global Allocation Series’ investment adviser and RiverFront as the RiverFront Global Allocation Series’ sub‐adviser and the fees charged under the Investment Advisory and Sub‐Advisory Agreements, the Trustees concluded that no single factor reviewed by the Trustees was identified by the Trustees to be determinative as the principal factor in whether to renew the Investment Advisory and Sub‐Advisory Agreements. Further, the Independent Trustees were advised by separate independent legal counsel throughout the process. The Trustees, including all of the Independent Trustees, concluded that:
| ● | the contractual management fee rate for each class of shares of each RiverFront Global Allocation Series was above the Data Provider expense group average and median contractual management fee rate; |
| ● | RiverFront’s fees under its sub‐advisory agreements are paid directly by ALPS Advisors; |
| ● | the total expense ratio (after waivers) of each class of each of the RiverFront Global Allocation Series’ were generally equal to or below its respective Data Provider average and median expense group total expense ratios (after waivers); |
| ● | the nature, extent and quality of services rendered by ALPS Advisors and RiverFront under the Investment Advisory and Sub‐Advisory Agreements, respectively, with respect to the RiverFront Global Allocation Series, as applicable, were adequate; |
| ● | the net total return performance of each class of each of the RiverFront Global Allocation Series, except the RiverFront Moderate Growth & Income Fund, was generally below its respective performance universe average; |
| ● | bearing in mind the limitations of comparing different types of managed accounts and the different levels of service typically associated with such accounts, the fee structures applicable to ALPS Advisors’ and RiverFront’s other clients employing a comparable strategy to one or more of the RiverFront Global Allocation Series were not indicative of any unreasonableness with respect to the advisory and sub‐ advisory fees proposed to be payable by the RiverFront Global Allocation Series; |
| ● | none of the RiverFront Global Allocation Series was profitable to ALPS Advisors in 2015; the profit, if any, realized or anticipated to be realized by ALPS Advisors and RiverFront in connection with the operation of the RiverFront Global Allocation Series, as applicable, is not unreasonable to the RiverFront Global Allocation Series; and |
| ● | there were no material economies of scale or other incidental benefits accruing to ALPS Advisors and RiverFront in connection with their relationship with the RiverFront Global Allocation Series. |
During the review process, the Trustees noted certain instances where clarification or follow‐up was appropriate and others where the Trustees determined that further clarification or follow‐up was not necessary. In those instances where clarification or follow‐up was requested, the Board determined that in each case either information responsive to its requests had been provided, or where any request was outstanding in whole or in part, given the totality of the information provided, the Board had received sufficient information to approve the Investment Advisory Agreement with ALPS Advisors and the Investment Sub‐Advisory Agreement with RiverFront.
Based on the Trustees’ deliberations and their evaluation of the information described above, the Trustees, including all of the Independent Trustees, concluded that ALPS Advisors’ and RiverFront’s compensation for investment advisory and sub‐advisory services is consistent with the best interests of the RiverFront Global Allocation Series and their shareholders.
ALPS | Kotak India Growth Fund
On June 7‐8, 2016, the Trustees met in person to discuss, among other things, the approval of the investment advisory agreement between the Trust and ALPS Advisors (the “Investment Advisory Agreement”), and the sub‐advisory agreement with Kotak Mahindra (UK) Limited (“Kotak”) (the “Sub‐Advisory Agreement”), in accordance with Section 15(c) of the 1940 Act. The Independent Trustees met with independent legal counsel during executive session and discussed the Investment Advisory Agreement, the Sub‐Advisory Agreement and other related materials.
In renewing and approving the Investment Advisory Agreement with ALPS Advisors and the Sub‐Advisory Agreement with Kotak, the Trustees, including the Independent Trustees, considered the following factors with respect to the ALPS | Kotak India Growth Fund (the “India Fund”):
209 | October 31, 2016
Additional Information
October 31, 2016 (Unaudited)
Investment Advisory and Sub‐Advisory Fee Rate: The Trustees reviewed and considered the contractual annual advisory fee to be paid by the Trust, on behalf of the India Fund, to ALPS Advisors of 1.25% of the India Fund’s daily average net assets, in light of the extent and quality of the advisory services provided by ALPS Advisors to the India Fund. The Trustees also reviewed and considered the contractual annual sub‐advisory fee rates to be paid by ALPS Advisors to Kotak of 1.15% of the India Fund’s daily average net assets on the first $50 million and 1.05% based on the India Fund’s daily average net assets over $50 million, in light of the extent and quality of the advisory services provided by Kotak to the India Fund. The Trustees also considered information regarding compensation to be paid to affiliates of ALPS Advisors under other agreements, such as the Fund Accounting and Administration Agreement with ALPS.
The Board received and considered information including a comparison of the India Fund’s contractual and actual management fees and overall expenses with those of funds in the peer expense group and universe of funds provided by the Data Provider. The Trustees noted that the contractual management fee rate for each class of the India Fund was above its respective Data Provider expense group average and median contractual management fee rate.
Total Expense Ratios: Based on such information, the Trustees further reviewed and considered the total expense ratios (after waivers) of 1.96%, 2.60% and 1.60% for the Class A, Class C and Class I shares, respectively, of the India Fund. The Trustees noted that the total expense ratio (after waivers) of each class of the India Fund was above its respective Data Provider average and median expense group total expense ratio (after waivers).
Nature, Extent and Quality of the Services under the Investment Advisory and Sub‐Advisory Agreements: The Trustees received and considered information regarding the nature, extent and quality of services to be provided to the India Fund under the Investment Advisory and Sub‐Advisory Agreements. The Trustees reviewed certain background materials supplied by ALPS Advisors and Kotak in their presentations, including their Forms ADV.
The Trustees reviewed and considered ALPS Advisors’ and Kotak’s investment advisory personnel, their history as asset managers and their performance and the amount of assets currently under management by ALPS Advisors and Kotak and their affiliated entities. The Trustees also reviewed the research and decision‐making processes utilized by ALPS Advisors and Kotak, including the methods adopted to seek to achieve compliance with the investment objectives, policies and restrictions of the India Fund.
The Trustees considered the background and experience of ALPS Advisors’ and Kotak’s management in connection with the India Fund, including reviewing the qualifications, backgrounds and responsibilities of the management team primarily responsible for the day‐to‐day portfolio management of the India Fund and the extent of the resources devoted to research and analysis of actual and potential investments.
The Trustees also reviewed, among other things, ALPS Advisors’ and Kotak’s insider trading policies and procedures and their Codes of Ethics.
Performance: The Trustees reviewed performance information for the India Fund. That review included a comparison of the India Fund’s performance to the performance of a group of comparable funds selected by the Data Provider. The Trustees noted the net total return performance of each class of the India Fund was above the respective Data Provider performance universe average for the one‐year, two‐year, three‐year, four‐year and five‐year periods ended March 31, 2016. The Trustees also considered Kotak’s discussion of the India Fund’s underlying portfolio diversification categories, its top contributors and top detractors, as well as Kotak’s performance and reputation generally and its investment techniques, risk management controls and decision‐making processes.
Comparable Accounts: The Trustees noted certain information provided by Kotak regarding fees charged to its other clients utilizing a strategy similar to that employed by the India Fund.
Profitability: The Trustees received and considered a retrospective and projected profitability analysis prepared by ALPS Advisors and Kotak based on the fees payable under the Investment Advisory Agreement with ALPS Advisors and the Investment Sub‐Advisory Agreement with Kotak, with respect to the India Fund. The Trustees considered the profits, if any, anticipated to be realized by ALPS Advisors and Kotak in connection with the operation of the India Fund. The Board then reviewed ALPS Advisors’ and Kotak’s financial statements in order to analyze the financial condition and stability and profitability of ALPS Advisors and Kotak.
Economies of Scale: The Trustees considered whether economies of scale in the provision of services to the India Fund will be passed along to the shareholders under the agreements.
Other Benefits to the Adviser: The Trustees reviewed and considered any other incidental benefits derived or to be derived by ALPS Advisors from its relationship with the India Fund, including whether soft dollar arrangements were used.
210 | October 31, 2016
Additional Information
October 31, 2016 (Unaudited)
In renewing ALPS Advisors as the India Fund’s investment adviser and Kotak as the India Fund’s sub‐adviser and the fees charged under the Investment Advisory and Sub‐Advisory Agreements, the Trustees concluded that no single factor reviewed by the Trustees was identified by the Trustees to be determinative as the principal factor in whether to renew the Investment Advisory and Sub‐Advisory Agreements. Further, the Independent Trustees were advised by separate independent legal counsel throughout the process. The Trustees, including all of the Independent Trustees, concluded that:
| ● | the contractual management fee rate for each class of the India Fund was above its respective Data Provider expense group average and median contractual management fee rate; |
| ● | Kotak’s fees under its sub‐advisory agreements are paid directly by ALPS Advisors; |
| ● | the total expense ratio (after waivers) of each class of the India Fund was above its respective Data Provider average and median expense group total expense ratio (after waivers); |
| ● | the nature, extent and quality of services rendered by ALPS Advisors and Kotak under the Investment Advisory and Sub‐Advisory Agreements, respectively, with respect to the India Fund were adequate; |
| ● | the net total return performance of each class of the India Fund was above the respective Data Provider performance universe average for the one‐year, two‐year, three‐year, four‐year and five‐year periods ended March 31, 2016; |
| ● | bearing in mind the limitations of comparing different types of managed accounts and the different levels of service typically associated with such accounts, the fee structures applicable to ALPS Advisors’ and Kotak’s other clients employing a comparable strategy to the India Fund was not indicative of any unreasonableness with respect to the advisory and sub‐advisory fees proposed to be payable by the India Fund; |
| ● | the India Fund was not profitable to ALPS Advisors in 2015; the profit, if any, realized or anticipated to be realized by ALPS Advisors and Kotak in connection with the operation of the India Fund is not unreasonable to the India Fund; and |
| ● | there were no material economies of scale or other incidental benefits accruing to ALPS Advisors and Kotak in connection with their relationship with the India Fund. |
During the review process, the Trustees noted certain instances where clarification or follow‐up was appropriate and others where the Trustees determined that further clarification or follow‐up was not necessary. In those instances where clarification or follow‐up was requested, the Board determined that in each case either information responsive to its requests had been provided, or where any request was outstanding in whole or in part, given the totality of the information provided, the Board had received sufficient information to approve the Investment Advisory Agreement with ALPS Advisors and the Investment Sub‐Advisory Agreement with Kotak.
Based on the Trustees’ deliberations and their evaluation of the information described above, the Trustees, including all of the Independent Trustees, concluded that ALPS Advisors’ and Kotak’s compensation for investment advisory and sub‐advisory services is consistent with the best interests of the India Fund and its shareholders.
ALPS | Sterling ETF Tactical Rotation Fund
On June 7‐8, 2016, the Trustees met in person to discuss, among other things, the approval of the investment advisory agreement between the Trust and ALPS Advisors (the “Investment Advisory Agreement”), and the sub‐advisory agreement with Sterling Global Strategies LLC (“Sterling”) (the “Sub‐Advisory Agreement”), in accordance with Section 15(c) of the 1940 Act. The Independent Trustees met with independent legal counsel during executive session and discussed the Investment Advisory Agreement, the Sub‐Advisory Agreement and other related materials.
In renewing and approving the Investment Advisory Agreement with ALPS Advisors and the Sub‐Advisory Agreement with Sterling, the Trustees, including the Independent Trustees, considered the following factors with respect to the ALPS | Sterling ETF Tactical Rotation Fund (the “Sterling Fund”):
Investment Advisory and Sub‐Advisory Fee Rate: The Trustees reviewed and considered the contractual annual advisory fee to be paid by the Trust, on behalf of the Sterling Fund, to ALPS Advisors of 0.95% of the Sterling Fund’s daily average net assets, in light of the extent and quality of the advisory services provided by ALPS Advisors to the Sterling Fund. The Trustees also reviewed and considered the contractual annual sub‐ advisory fee rates to be paid by ALPS Advisors to Sterling of 0.60% of the Sterling Fund’s daily average net assets, in light of the extent and quality of the advisory services provided by Sterling to the Sterling Fund. The Trustees also considered information regarding compensation to be paid to affiliates of ALPS Advisors under other agreements, such as the Fund Accounting and Administration Agreement with ALPS.
The Board received and considered information including a comparison of the Sterling Fund’s contractual and actual management fees and overall expenses with those of funds in the peer expense group and universe of funds provided by the Data Provider. The Trustees noted that the contractual management fee rate for each class of the Sterling Fund was below its respective Data Provider expense group average and median contractual management fee rate.
211 | October 31, 2016
Additional Information
October 31, 2016 (Unaudited)
Total Expense Ratios: Based on such information, the Trustees further reviewed and considered the total expense ratios (after waivers) of 1.553%, 2.15% and 1.15% for Class A, Class C and Class I, respectively, for the Sterling Fund. The Trustees noted that the total expense ratio (after waivers) of each class of the Sterling Fund was below its respective Data Provider average and median expense group total expense ratio (after waivers).
Nature, Extent and Quality of the Services under the Investment Advisory and Sub‐Advisory Agreements: The Trustees received and considered information regarding the nature, extent and quality of services to be provided to the Sterling Fund under the Investment Advisory and Sub‐Advisory Agreements. The Trustees reviewed certain background materials supplied by ALPS Advisors and Sterling in their presentations, including their Forms ADV.
The Trustees reviewed and considered ALPS Advisors’ and Sterling’s investment advisory personnel, their history as asset managers and their performance and the amount of assets currently under management by ALPS Advisors and Sterling and their affiliated entities. The Trustees also reviewed the research and decision‐making processes utilized by ALPS Advisors and Sterling, including the methods adopted to seek to achieve compliance with the investment objectives, policies and restrictions of the Sterling Fund.
The Trustees considered the background and experience of ALPS Advisors’ and Sterling’s management in connection with the Sterling Fund, including reviewing the qualifications, backgrounds and responsibilities of the management team primarily responsible for the day‐to‐day portfolio management of the Sterling Fund and the extent of the resources devoted to research and analysis of actual and potential investments.
The Trustees also reviewed, among other things, ALPS Advisors’ and Sterling’s insider trading policies and procedures and their Codes of Ethics.
Performance: The Trustees reviewed performance information for the Sterling Fund. That review included a comparison of the Sterling Fund’s performance to the performance of a group of comparable funds selected by the Data Provider. The Trustees noted the net total return performance of each class of the Sterling Fund was below the respective Data Provider performance universe average for the one‐year period ended March 31, 2016. The Trustees also considered Sterling’s discussion of the Sterling Fund’s underlying portfolio diversification categories, its top contributors and top detractors, as well as Sterling’s performance and reputation generally and its investment techniques, risk management controls and decision‐making processes.
Comparable Accounts: The Trustees noted certain information provided by Sterling regarding fees charged to its other clients utilizing a strategy similar to that employed by the Sterling Fund.
Profitability: The Trustees received and considered a retrospective and projected profitability analysis prepared by ALPS Advisors and Sterling based on the fees payable under the Investment Advisory Agreement with ALPS Advisors and the Investment Sub‐Advisory Agreement with Sterling, with respect to the Sterling Fund. The Trustees considered the profits, if any, anticipated to be realized by ALPS Advisors and Sterling in connection with the operation of the Sterling Fund. The Board then reviewed ALPS Advisors’ and Sterling’s financial statements in order to analyze the financial condition and stability and profitability of ALPS Advisors and Sterling.
Economies of Scale: The Trustees considered whether economies of scale in the provision of services to the Sterling Fund will be passed along to the shareholders under the agreements.
Other Benefits to the Adviser: The Trustees reviewed and considered any other incidental benefits derived or to be derived by ALPS Advisors from its relationship with the Sterling Fund, including whether soft dollar arrangements were used.
In renewing ALPS Advisors as the Sterling Fund’s investment adviser and Sterling as the Sterling Fund’s sub‐adviser and the fees charged under the Investment Advisory and Sub‐Advisory Agreements, the Trustees concluded that no single factor reviewed by the Trustees was identified by the Trustees to be determinative as the principal factor in whether to renew the Investment Advisory and Sub‐Advisory Agreements. Further, the Independent Trustees were advised by separate independent legal counsel throughout the process. The Trustees, including all of the Independent Trustees, concluded that:
| ● | the contractual management fee rate for each class of the Sterling Fund was below its respective Data Provider expense group average and median contractual management fee rate; |
| ● | Sterling’s fees under its sub‐advisory agreements are paid directly by ALPS Advisors; |
| ● | total expense ratio (after waivers) of each class of the Sterling Fund was below its respective Data Provider average and median expense group total expense ratio (after waivers); |
212 | October 31, 2016
Additional Information
October 31, 2016 (Unaudited)
| ● | the nature, extent and quality of services rendered by ALPS Advisors and Sterling under the Investment Advisory and Sub‐Advisory Agreements, respectively, with respect to the Sterling Fund were adequate; |
| ● | the net total return performance of each class of the Sterling Fund was below the respective Data Provider performance universe average for the one‐year period ended March 31, 2016; |
| ● | bearing in mind the limitations of comparing different types of managed accounts and the different levels of service typically associated with such accounts, the fee structures applicable to ALPS Advisors’ and Sterling’s other clients employing a comparable strategy to the Sterling Fund was not indicative of any unreasonableness with respect to the advisory and sub‐advisory fees proposed to be payable by the Sterling Fund; |
| ● | the Sterling Fund was not profitable to ALPS Advisors in 2015; the profit, if any, realized or anticipated to be realized by ALPS Advisors and Sterling in connection with the operation of the Sterling Fund is not unreasonable to the Sterling Fund; and |
| ● | there were no material economies of scale or other incidental benefits accruing to ALPS Advisors and Sterling in connection with their relationship with the Sterling Fund. |
During the review process, the Trustees noted certain instances where clarification or follow‐up was appropriate and others where the Trustees determined that further clarification or follow‐up was not necessary. In those instances where clarification or follow‐up was requested, the Board determined that in each case either information responsive to its requests had been provided, or where any request was outstanding in whole or in part, given the totality of the information provided, the Board had received sufficient information to approve the Investment Advisory Agreement with ALPS Advisors and the Investment Sub‐Advisory Agreement with Sterling.
Based on the Trustees’ deliberations and their evaluation of the information described above, the Trustees, including all of the Independent Trustees, concluded that ALPS Advisors’ and Sterling’s compensation for investment advisory and sub‐advisory services is consistent with the best interests of the Sterling Fund and its shareholders.
213 | October 31, 2016
Trustees and Officers
October 31, 2016 (Unaudited)
Additional information regarding the Funds’ trustees is included in the Statement of Additional Information, which can be obtained without charge by calling (toll‐free) (866) 759‐5679.
INDEPENDENT TRUSTEES
| Name, Address* & Year of Birth | Position(s) Held with Fund | Term of Office** and Length of Time Served | Principal Occupation(s) During Past 5 Years*** | Number of Funds in Fund Complex Overseen by Trustee**** | Other Directorships Held by Trustee During Past 5 Years*** |
| Mary K. Anstine, 1940 | Trustee | Ms. Anstine was elected at a special meeting of shareholders held on March 21, 1997 and re-elected at a special meeting of shareholders held on August 7, 2009. | Ms. Anstine was formerly an Executive Vice President of First Interstate Bank of Denver until 1994, President/Chief Executive Officer of HealthONE Alliance, Denver, Colorado, from 1994 to 2004, and has been retired since 2004. Ms. Anstine is also Trustee/Director of AV Hunter Trust and Colorado Uplift Board. Ms. Anstine was formerly a Director of the Trust Bank of Colorado (later purchased and now known as Northern Trust Bank), Health and ONE Denver Area Council of the Boy Scouts of America, and a member of the American Bankers Association Trust Executive Committee. | 62 | Ms. Anstine is a Trustee of ALPS ETF Trust (21 funds); ALPS Variable Investment Trust (10 funds); Reaves Utility Income Fund (1 fund); and Westcore Trust (14 funds). |
| Jeremy W. Deems, 1976 | Trustee | Mr. Deems was appointed as a Trustee at the March 11, 2008 meeting of the Board of Trustees and elected at a special meeting of shareholders held on August 7, 2009. | Mr. Deems is the Co-Founder, Chief Operations Officer and Chief Financial Officer of Green Alpha Advisors, LLC, a registered investment advisor, and Co-Portfolio Manager of the Shelton Green Alpha Fund. Prior to joining Green Alpha Advisors, Mr. Deems was CFO and Treasurer of Forward Management, LLC, ReFlow Management Co., LLC, ReFlow Fund, LLC, a private investment fund, and Sutton Place Management, LLC, an administrative services company, from 1998 to June 2007. From 2004 to 2005, Mr Deems also served as Treasurer of the Forward Funds and the Sierra Club Funds. | 64 | Mr. Deems is a Trustee of ALPS ETF Trust (21 funds); ALPS Variable Investment Trust (10 funds); Clough Funds Trust (1 fund); Elevation ETF Trust (2 funds); and Reaves Utility Income Fund (1 fund). |
| * | All communications to Trustees and Officers may be directed to Financial Investors Trust c/o 1290 Broadway, Suite 1100, Denver, CO 80203. |
| ** | This is the period for which the Trustee began serving the Trust. Each Trustee serves an indefinite term, until his successor is elected. |
| *** | Except as otherwise indicated, each individual has held the office shown or other offices in the same company for the last five years. |
| **** | The Fund Complex includes all series of the Trust, currently 34, and any other investment companies for which any Trustee serves as Trustee for and which ALPS Advisors, Red Rocks, Wellington Management, Clough Capital, RiverFront, Kotak, or Sterling Global Strategies LLC provides investment advisory services (currently 37 funds, 1 fund, 0 funds, 4 funds, 5 funds, 0 funds, and 0 funds, respectively). |
214 | October 31, 2016
Trustees and Officers
October 31, 2016 (Unaudited)
INDEPENDENT TRUSTEES (continued)
| Name, Address* & Year of Birth | Position(s) Held with Fund | Term of Office** and Length of Time Served | Principal Occupation(s) During Past 5 Years*** | Number of Funds in Fund Complex Overseen by Trustee**** | Other Directorships Held by Trustee During Past 5 Years*** |
Jerry G. Rutledge, 1944 | Trustee | Mr. Rutledge was elected at a special meeting of shareholders held on August 7, 2009. | Mr. Rutledge is the President and owner of Rutledge’s Inc., a retail clothing business. Mr. Rutledge is currently Director of the American National Bank. He was from 1994 to 2007 a Regent of the University of Colorado. | 34 | Mr. Rutledge is a Trustee of Clough Global Dividend and Income Fund (1 fund), Clough Global Equity Fund (1 fund) and Clough Global Opportunities Fund (1 fund). |
Michael “Ross” Shell, 1970 | Trustee | Mr. Shell was elected at a special meeting of shareholders held on August 7, 2009. | Mr. Shell is Founder and CEO of Red Idea, LLC, a strategic consulting/early stage venture firm (since June 2008). From 1999 to 2009, he was a part-owner and Director of Tesser, Inc., a brand agency. From December 2005 to May 2008, he was Director, Marketing and Investor Relations, of Woodbourne, a REIT/real estate hedge fund and private equity firm. Prior to this, from May 2004 to November 2005, he worked as a business strategy consultant; from June 2003 to April 2004, he was on the Global Client Services team of IDEO, a product design/innovation firm; and from 1999 to 2003, he was President of Tesser, Inc. Mr. Shell graduated with honors from Stanford University with a degree in Political Science. | 31 | None. |
| * | All communications to Trustees and Officers may be directed to Financial Investors Trust c/o 1290 Broadway, Suite 1100, Denver, CO 80203. |
| ** | This is the period for which the Trustee began serving the Trust. Each Trustee serves an indefinite term, until his successor is elected. |
| *** | Except as otherwise indicated, each individual has held the office shown or other offices in the same company for the last five years. |
| **** | The Fund Complex includes all series of the Trust, currently 34, and any other investment companies for which any Trustee serves as Trustee for and which ALPS Advisors, Red Rocks, Wellington Management, Clough Capital, RiverFront, Kotak, or Sterling Global Strategies LLC provides investment advisory services (currently 37 funds, 1 fund, 0 funds, 4 funds, 5 funds, 0 funds, and 0 funds, respectively). |
215 | October 31, 2016
Trustees and Officers
October 31, 2016 (Unaudited)
INTERESTED TRUSTEE
| Name, Address* & Year of Birth | Position(s) Held with Fund | Term of Office** and Length of Time Served | Principal Occupation(s) During Past 5 Years*** | Number of Funds in Fund Complex Overseen by Trustee**** | Other Directorships Held by Trustee During Past 5 Years*** |
Edmund J. Burke, 1961 | Trustee, Chairman and President | Mr. Burke was elected as Chairman at the August 28, 2009 meeting of the Board of Trustees. Mr. Burke was elected as Trustee at a special meeting of shareholders held on August 7, 2009. Mr. Burke was elected President of the Trust at the December 17, 2002 meeting of the Board of Trustees. | Mr. Burke is President and a Director of ALPS Holdings, Inc. (“AHI”) (since 2005) and Director of Boston Financial Data Services, Inc. (“BFDS”), ALPS Advisors, Inc. (“AAI”), ALPS Distributors, Inc. (“ADI”), ALPS Fund Services, Inc. (“AFS”) and ALPS Portfolio Solutions Distributor, Inc. (“APSD”) and from 2001-2008, was President of AAI, ADI, AFS and APSD. Because of his positions with AHI, BFDS, AAI, ADI, AFS and APSD, Mr. Burke is deemed an affiliate of the Trust as defined under the 1940 Act. Mr. Burke is Trustee and President of the Clough Global Dividend and Income Fund (Trustee since 2006; President since 2004); Trustee and President of the Clough Global Equity Fund (Trustee since 2006; President since 2005); Trustee and President of the Clough Global Opportunities Fund (since 2006); Trustee of the Liberty All-Star Equity Fund; and Director of the Liberty All-Star Growth Fund, Inc. | 37 | Mr. Burke is a Trustee of Clough Global Dividend and Income Fund (1 fund); Clough Global Equity Fund (1 fund); Clough Global Opportunities Fund (1 fund); Clough Funds Trust (1 fund); Liberty All-Star Equity Fund (1 fund); and Director of the Liberty All-Star Growth Fund, Inc. (1 fund). |
| * | All communications to Trustees and Officers may be directed to Financial Investors Trust c/o 1290 Broadway, Suite 1100, Denver, CO 80203. |
| ** | This is the period for which the Trustee began serving the Trust. Each Trustee serves an indefinite term, until his successor is elected. |
| *** | Except as otherwise indicated, each individual has held the office shown or other offices in the same company for the last five years. |
| **** | The Fund Complex includes all series of the Trust, currently 34, and any other investment companies for which any Trustee serves as Trustee for and which ALPS Advisors, Red Rocks, Wellington Management, Clough Capital, RiverFront, Kotak, or Sterling Global Strategies LLC provides investment advisory services (currently 37 funds, 1 fund, 0 funds, 4 funds, 5 funds, 0 funds, and 0 funds, respectively). |
216 | October 31, 2016
Trustees and Officers
October 31, 2016 (Unaudited)
| OFFICERS | | | |
| | | | |
Name, Address* & Year of Birth | Position(s) Held with Fund | Term of Office** and Length of Time Served | Principal Occupation(s) During Past 5 Years*** |
Kimberly R. Storms, 1972 | Treasurer | Ms. Storms was elected Treasurer of the Trust at the March 12, 2013 meeting of the Board of Trustees. | Ms. Storms is Senior Vice President - Director of Fund Administration of ALPS. Because of her position with ALPS, Ms. Storms is deemed an affiliate of the Trust as defined under the 1940 Act. Ms. Storms is also Treasurer of Liberty All-Star Equity Fund, Liberty All-Star Growth Fund, Inc., ALPS Series Trust and Elevation ETF Trust. Ms. Storms also serves as a Board member and Treasurer of The Center for Trauma & Resilience, a nonprofit agency. |
Karen S. Gilomen, 1970 | Secretary | Ms. Gilomen was elected Secretary of the Trust at the December 13, 2016 meeting of the Board of Trustees. | Ms. Gilomen joined ALPS in August 2016 as Vice President and Senior Counsel. Prior to joining ALPS, Ms. Gilomen was Vice President - General Counsel & CCO of Monticello Associates, Inc. from 2010 to 2016. Because of her position with ALPS, Ms. Gilomen is deemed an affiliate of the Trust, as defined under the 1940 Act. Ms. Gilomen is also the Secretary of Oak Associates Funds and Reaves Utility Income Fund, and the Assistant Secretary of the WesMark Funds. |
Ted Uhl, 1974 | Chief Compliance Officer (“CCO”) | Mr. Uhl was appointed CCO of the Trust at the June 8, 2010 meeting of the Board of Trustees. | Mr. Uhl joined ALPS in October 2006, and is currently Deputy Compliance Officer of ALPS. Prior to his current role, Mr. Uhl served as Senior Risk Manager for ALPS from October 2006 until June 2010. Before joining ALPS, Mr. Uhl served a Sr. Analyst with Enenbach and Associates (RIA), and a Sr. Financial Analyst at Sprint. Because of his position with ALPS, Mr. Uhl is deemed an affiliate of the Trust as defined under the 1940 Act. Mr. Uhl is also CCO of the Boulder Growth & Income Fund, Inc., Centre Funds, Elevation ETF Trust, Index Funds, Reality Shares ETF Trust and Reaves Utility Income Fund. |
Jennell Panella, 1974 | Assistant Treasurer | Ms. Panella was elected Assistant Treasurer of the Trust at the September 15, 2015 meeting of the Board of Trustees | Ms. Panella joined ALPS in June 2012 and is currently Fund Controller of ALPS Fund Services, Inc. Prior to joining ALPS, Ms. Panella served as Financial Reporting Manager for Parker Global Strategies, LLC (2009-2012). Because of her position with ALPS, Ms. Panella is deemed an affiliate of the Trust as defined under the 1940 Act. Ms. Panella also serves as Assistant Treasurer of James Advantage Funds. |
| * | All communications to Trustees and Officers may be directed to Financial Investors Trust c/o 1290 Broadway, Suite 1100, Denver, CO 80203. |
| ** | This is the period for which the Trustee began serving the Trust. Each Trustee serves an indefinite term, until his successor is elected. |
| *** | Except as otherwise indicated, each individual has held the office shown or other offices in the same company for the last five years. |
217 | October 31, 2016
Trustees and Officers
October 31, 2016 (Unaudited)
| OFFICERS (continued) | | |
| | | | |
Name, Address* & Year of Birth | Position(s) Held with Fund | Term of Office** and Length of Time Served | Principal Occupation(s) During Past 5 Years*** |
Alan Gattis, 1980 | Assistant Treasurer | Mr. Gattis was elected Assistant Treasurer of the Trust at the September 13, 2016 meeting of the Board of Trustees | Mr. Gattis joined ALPS in 2011 and is currently Vice President and Fund Controller of ALPS. Prior to joining ALPS, Mr. Gattis was an Auditor at Spicer Jeffries LLP (2009 through 2011) and an Auditor at PricewaterhouseCoopers LLP (2004 - 2009). Because of his position with ALPS, Mr. Gattis is deemed an affiliate of the Trust as defined under the 1940 Act. Mr. Gattis is also Assistant Treasurer of ALPS Series Trust, Clough Funds Trust, Clough Global Opportunities Fund, Clough Global Dividend and Income Fund, Clough Global Equity, Griffin Institutional Access Real Estate Fund, Stadion Funds and Centaur Mutual Funds Trust. |
Sharon Akselrod, 1974 | Assistant Secretary | Ms. Akselrod was elected Assistant Secretary of the Trust at the September 15, 2015 meeting of the Board of Trustees. | Ms. Akselrod joined ALPS in August 2014 and is currently Senior Investment Company Act Paralegal of ALPS Fund Services, Inc. Prior to joining ALPS, Ms. Akselrod served as Corporate Governance and Regulatory Associate for Nordstrom fsb (2013- 2014) and Senior Legal Assistant – Legal Manager for AXA Equitable Life Insurance Company (2008-2013). Because of her position with ALPS, Ms. Akselrod is deemed an affiliate of the Trust as defined under the 1940 Act. Ms. Akselrod is also Assistant Secretary of ALPS ETF Trust. |
Jennifer Craig, 1973 | Assistant Secretary | Ms. Craig was elected Assistant Secretary of the Trust at the June 8, 2016 meeting of the Board of Trustees. | Ms. Craig joined ALPS in 2007 and is currently Assistant Vice President and Legal Manager of ALPS. Prior to joining ALPS, Ms. Craig was Legal Manager at Janus Capital Management LLC and served as Assistant Secretary of Janus Investment Fund, Janus Adviser Series and Janus Aspen Series. Ms. Craig is also Assistant Secretary of Clough Global Dividend and Income Fund, Clough Global Equity Fund, Clough Global Opportunities Fund, Clough Funds Trust and ALPS Series Trust. |
| * | All communications to Trustees and Officers may be directed to Financial Investors Trust c/o 1290 Broadway, Suite 1100, Denver, CO 80203. |
| ** | This is the period for which the Trustee began serving the Trust. Each Trustee serves an indefinite term, until his successor is elected. |
| *** | Except as otherwise indicated, each individual has held the office shown or other offices in the same company for the last five years. |
218 | October 31, 2016
Intentionally Left Blank
| (a) | The Registrant, as of the end of the period covered by this report, has adopted a code of ethics that applies to the Registrant’s principal executive officer, principal financial officer, principal accounting officer or controller or any persons performing similar functions on behalf of the Registrant. |
| (c) | During the period covered by this report, no amendments to the provisions of the code of ethics described in Item 2(a) above were made. |
| (d) | During the period covered by this report, no implicit or explicit waivers to the provisions of the code of ethics described in Item 2(a) above were granted. |
| (f) | The Registrant’s Code of Ethics is attached as an Exhibit to this report. |
| Item 3. | Audit Committee Financial Expert. |
The Board of Trustees of the Registrant has determined that the Registrant has at least one Audit Committee Financial Expert serving on its audit committee. The Board of Trustees of the Registrant has designated Jeremy W. Deems as the Registrant’s “Audit Committee Financial Expert.” Mr. Deems is “independent” as defined in paragraph (a)(2) of Item 3 to Form N-CSR.
| Item 4. | Principal Accountant Fees and Services. |
| (a) | Audit Fees: For the Registrant’s fiscal years ended October 31, 2016 and October 31, 2015, the aggregate fees billed for professional services rendered by the principal accountant for the audit of the Registrant’s annual financial statements were $240,080 and $234,500, respectively. |
| (b) | Audit-Related Fees: For the Registrant’s fiscal years ended October 31, 2016 and October 31, 2015, the aggregate fees billed for assurance and related services by the principal accountant that were reasonably related to the performance of the audit of the Registrant’s financial statements and are not reported under paragraph (a) of this Item were $0 and $0, respectively. |
| (c) | Tax Fees: For the Registrant’s fiscal years ended October 31, 2016 and October 31, 2015, the aggregate fees billed for professional services rendered by the principal accountant for tax compliance, tax advice and tax planning were $61,380 and $35,890, respectively. The fiscal year 2016 and 2015 tax fees were for services for dividend calculation, excise tax preparation and tax return preparation. |
| (d) | All Other Fees: For the Registrant’s fiscal years ended October 31, 2016 and October 31, 2015, no fees were billed to Registrant by the principal accountant for services other than the services reported in paragraphs (a) through (c) of this Item. |
| (e)(1) | Audit Committee Pre-Approval Policies and Procedures: All services to be performed by the Registrant’s principal accountant must be pre-approved by the Registrant’s audit committee. The Chairman of the Audit Committee may pre-approve non-audit services to be performed by the Registrant’s principal accountant on an interim basis, subject to ratification by the Audit Committee at its next regularly scheduled meeting. |
| (e)(2) | No services described in paragraphs (b) through (d) of this Item were approved by the Registrant’s audit committee pursuant to paragraph (c)(7)(i)(C) of Rule 2-01 of Regulation S-X. |
| (g) | The aggregate non-audit fees billed by the Registrant’s accountant for services rendered to the Registrant, and rendered to the Registrant’s investment adviser (not including any sub-adviser whose role is primarily portfolio management and is subcontracted with or overseen by another investment adviser), and any entity controlling, controlled by, or under common control with the adviser that provides ongoing services to the Registrant, were $85,777 in the fiscal year ended October 31, 2016 and $88,772 in fiscal year ended October 31, 2015. These fees consisted of non-audit fees billed to (i) the Registrant of $61,380 in the fiscal year ended October 31, 2016 and $35,890 in fiscal year ended October 31, 2015 as described in response to paragraph (c) above and (ii) to ALPS Fund Services, Inc. (“AFS”), an entity under common control with ALPS Advisors, Inc., the Registrant’s investment adviser, of $24,397 in the fiscal year ended October 31, 2016 and $52,882 in fiscal year ended October 31, 2015. The non-audit fees billed to AFS related to SSAE 16 services and other compliance-related matters. |
| (h) | The Registrant’s audit committee has considered whether the provision of non-audit services that were rendered to the Registrant’s investment adviser (not including any sub-adviser whose role is primarily portfolio management and is subcontracted with or overseen by another investment adviser), and any entity controlling, controlled by, or under common control with the investment adviser that provides ongoing services to the Registrant that were not pre-approved pursuant to paragraph (c)(7)(ii) of Rule 2-01 of Regulation S-X, is compatible with maintaining the principal accountant’s independence. The Registrant’s audit committee determined that the provision of such non-audit services is compatible with maintaining the principal accountant’s independence. |
| Item 5. | Audit Committee of Listed Registrants. |
Not applicable.
| (a) | Schedule of Investments is included as part of the Reports to Stockholders filed under Item 1 of this Form N-CSR. |
| Item 7. | Disclosure of Proxy Voting Policies and Procedures for Closed-End Management Investment Companies. |
Not applicable to the Registrant.
| Item 8. | Portfolio Managers of Closed-End Management Investment Companies. |
Not applicable to the Registrant.
| Item 9. | Purchases of Equity Securities by Closed-End Management Investment Company and Affiliated Purchasers. |
Not applicable to the Registrant.
| Item 10. | Submission of Matters to a Vote of Security Holders. |
There have been no material changes to the procedures by which shareholders may recommend nominees to the Registrant’s Board of Trustees, where those changes were implemented after the Registrant last provided disclosure in response to the requirements of Item 407(c)(2)(iv) of Regulation S-K, or this Item.
| Item 11. | Controls and Procedures. |
| (a) | The Registrant’s principal executive officer and principal financial officer have concluded that the Registrant’s disclosure controls and procedures (as defined in Rule 30a-3(c) under the Investment Company Act of 1940, as amended) are effective based on their evaluation of these controls and procedures as of a date within 90 days of the filing date of this report. |
| (b) | There was no change in the Registrant’s internal control over financial reporting (as defined in Rule 30a-3(d) under the Investment Company Act of 1940, as amended) during the second fiscal quarter of the period covered by this report that has materially affected, or is reasonably likely to materially affect, the Registrant’s internal control over financial reporting. |
| (a)(1) | The Registrant’s Code of Ethics for Principal Executive and Senior Financial Officers, which is the subject of the disclosure required by Item 2 of Form N-CSR, is attached hereto as Exhibit 12(a)(1). |
| (a)(2) | The certifications required by Rule 30a-2(a) of the Investment Company Act of 1940, as amended, and Section 302 of the Sarbanes-Oxley Act of 2002 are attached hereto as Exhibit 99.Cert. |
| (b) | The certifications by the Registrant’s principal executive officer and principal financial officer, as required by Rule 30a-2(b) of the Investment Company Act of 1940, as amended, and Section 906 of the Sarbanes-Oxley Act of 2002 are attached hereto as Exhibit 99.906Cert. |
SIGNATURES
Pursuant to the requirements of the Securities Exchange Act of 1934 and the Investment Company Act of 1940, the Registrant has duly caused this report to be signed on its behalf by the undersigned, thereunto duly authorized.
FINANCIAL INVESTORS TRUST
| By: | /s/ Edmund J. Burke | |
| | Edmund J. Burke (Principal Executive Officer) | |
| | President | |
| | | |
| Date: | January 9, 2017 | |
| | | |
Pursuant to the requirements of the Securities Exchange Act of 1934 and the Investment Company Act of 1940, this report has been signed below by the following persons on behalf of the Registrant and in the capacities and on the dates indicated. |
| | | |
| FINANCIAL INVESTORS TRUST | |
| | | |
| By: | /s/ Edmund J. Burke | |
| | Edmund J. Burke (Principal Executive Officer) | |
| | President | |
| | | |
| Date: | January 9, 2017 | |
| | | |
| By: | /s/ Kimberly R. Storms | |
| | Kimberly R. Storms (Principal Financial Officer) | |
| | Treasurer | |
| | | |
| Date: | January 9, 2017 | |