UNITED STATES
SECURITIES AND EXCHANGE COMMISSION
Washington, D.C. 20549
FORM N-CSR
CERTIFIED SHAREHOLDER REPORT OF REGISTERED
MANAGEMENT INVESTMENT COMPANIES
Investment Company Act file number: 811-8194
FINANCIAL INVESTORS TRUST
(Exact name of registrant as specified in charter)
1290 Broadway, Suite 1100, Denver, Colorado 80203
(Address of principal executive offices) (Zip code)
David T. Buhler, Secretary
Financial Investors Trust
1290 Broadway, Suite 1100
Denver, Colorado 80203
(Name and address of agent for service)
Registrant’s telephone number, including area code: 303-623-2577
Date of fiscal year end: October 31
Date of reporting period: November 1, 2013 – October 31, 2014
| Item 1. | Reports to Stockholders. |

October 31, 2014

ALPS | Alerian MLP Infrastructure Index Fund
ALPS | CoreCommodity Management CompleteCommodities® Strategy Fund
ALPS | Kotak India Growth Fund
ALPS Real Asset Income Fund
ALPS | Red Rocks Listed Private Equity Fund
ALPS | Sterling ETF Tactical Rotation Fund
ALPS | Westport Resources Hedged High Income Fund
ALPS | WMC Disciplined Value Fund
Clough China Fund
RiverFront Global Allocation Series
An ALPS Advisors Solution

table of
CONTENTS
| 1 | ||||
| 5 | ||||
| 6 | ||||
| 8 | ||||
| 9 | ||||
| 10 | ||||
| 11 | ||||
| 12 | ||||
| 15 | ||||
| 17 | ||||
| 19 | ||||
| 26 | ||||
| 28 | ||||
| 29 | ||||
| 30 | ||||
| 33 | ||||
| 36 | ||||
| 38 | ||||
| 40 | ||||
| 41 | ||||
| 42 | ||||
| 43 | ||||
| 46 | ||||
| 47 | ||||
| 49 | ||||
| 52 | ||||
| 53 | ||||
| 54 | ||||
| 55 | ||||
| 58 | ||||
| 60 | ||||
| 63 | ||||
| 65 | ||||
| 66 | ||||
| 67 | ||||
| 68 | ||||
| 72 | ||||
| 73 | ||||
| 75 | ||||
| 76 | ||||
| 77 | ||||
| 78 | ||||
| 79 | ||||
| 82 | ||||
| 83 | ||||
| 85 | ||||
| 93 | ||||
| 94 | ||||
| 95 | ||||
| 96 | ||||
| 99 | ||||
| 100 | ||||
| 102 | ||||
| 105 | ||||
| 106 | ||||
| 107 | ||||
| 108 | ||||
| 111 | ||||
| 113 | ||||
| 115 | ||||
| 118 | ||||
| 119 | ||||
| 120 | ||||
| 121 | ||||
| 124 | ||||
| 126 | ||||
| 136 | ||||
| 146 | ||||
| 148 | ||||
| 151 | ||||
| 156 | ||||
| 173 | ||||
| 209 | ||||
| 210 | ||||
| 224 | ||||

| Disclosure of Fund Expenses | ||
| October 31, 2014 (Unaudited) |
Examples. As a shareholder of the Funds, you will incur two types of costs: (1) transaction costs, including applicable sales charges (loads) and redemption fees; and (2) ongoing costs, including management fees, distribution and service (12b-1) fees, shareholder service fees and other Fund expenses. The following examples are intended to help you understand your ongoing costs (in dollars) of investing in the Funds and to compare these costs with the ongoing costs of investing in other mutual funds. The examples are based on an investment of $1,000 invested on May 1, 2014 and held until October 31, 2014.
Actual Expenses. The first line under each class in the following table provides information about actual account values and actual expenses. You may use the information in this line, together with the amount you invested, to estimate the expenses that you paid over the period. Simply divide your account value by $1,000 (for example, an $8,600 account value divided by $1,000 = 8.6), then multiply the result by the number in the first line under the heading “Expenses Paid During Period May 1, 2014 – October 31, 2014” to estimate the expenses you paid on your account during this period.
Hypothetical Example for Comparison Purposes. The second line under each class in the following table provides information about hypothetical account values and hypothetical expenses based on the Fund’s actual expense ratio and an assumed rate of return of 5% per year before expenses, which is not the Fund’s actual return. The hypothetical account values and expenses may not be used to estimate the actual ending account balance or expenses you paid for the period. You may use this information to compare the ongoing costs of investing in the Funds and other mutual funds. To do so, compare these 5% hypothetical examples with the 5% hypothetical examples that appear in the shareholder reports of the other funds.
Please note that the expenses shown in the table are meant to highlight your ongoing costs only and do not reflect any transactional costs, such as sales charges or redemption fees. Therefore, the second line under each class in the following table is useful in comparing ongoing costs only, and will not help you determine the relative total costs of owning different funds. In addition, if these transactional costs were included, your costs would have been higher.
| Beginning Account Value May 1, 2014 | Ending Account Value October 31, 2014 | Expense Ratio(a) | Expenses Paid May 1, 2014 - | |||||
ALPS | Alerian MLP Infrastructure Index Fund | ||||||||
Class A | ||||||||
Actual | $ 1,000.00 | $ 1,056.10 | 1.23% | $ 6.37 | ||||
Hypothetical (5% return before expenses) | $ 1,000.00 | $ 1,019.00 | 1.23% | $ 6.26 | ||||
Class C | ||||||||
Actual | $ 1,000.00 | $ 1,053.70 | 1.85% | $ 9.58 | ||||
Hypothetical (5% return before expenses) | $ 1,000.00 | $ 1,015.88 | 1.85% | $ 9.40 | ||||
Class I | ||||||||
Actual | $ 1,000.00 | $ 1,057.80 | 0.85% | $ 4.41 | ||||
Hypothetical (5% return before expenses) | $ 1,000.00 | $ 1,020.92 | 0.85% | $ 4.33 | ||||
ALPS | CoreCommodity Management CompleteCommodities® Strategy Fund(c) | ||||||||
Class A | ||||||||
Actual | $ 1,000.00 | $ 879.50 | 1.45% | $ 6.87 | ||||
Hypothetical (5% return before expenses) | $ 1,000.00 | $ 1,017.90 | 1.45% | $ 7.38 | ||||
Class C | ||||||||
Actual | $ 1,000.00 | $ 876.70 | 2.05% | $ 9.70 | ||||
Hypothetical (5% return before expenses) | $ 1,000.00 | $ 1,014.87 | 2.05% | $ 10.41 | ||||
Class I | ||||||||
Actual | $ 1,000.00 | $ 880.40 | 1.15% | $ 5.45 | ||||
Hypothetical (5% return before expenses) | $ 1,000.00 | $ 1,019.41 | 1.15% | $ 5.85 | ||||
| 1 | October 31, 2014 |
| Disclosure of Fund Expenses | ||
| October 31, 2014 (Unaudited) |
Beginning Account Value May 1, 2014 | Ending Account Value October 31, 2014 | Expense Ratio(a) | Expenses Paid During Period May 1, 2014 - | |||||
ALPS | Kotak India Growth Fund(d) | ||||||||
Class A | ||||||||
Actual | $ 1,000.00 | $ 1,321.30 | 1.90% | $ 11.12 | ||||
Hypothetical (5% return before expenses) | $ 1,000.00 | $ 1,015.63 | 1.90% | $ 9.65 | ||||
Class C | ||||||||
Actual | $ 1,000.00 | $ 1,318.30 | 2.60% | $ 15.19 | ||||
Hypothetical (5% return before expenses) | $ 1,000.00 | $ 1,012.10 | 2.60% | $ 13.19 | ||||
Class I | ||||||||
Actual | $ 1,000.00 | $ 1,323.70 | 1.60% | $ 9.37 | ||||
Hypothetical (5% return before expenses) | $ 1,000.00 | $ 1,017.14 | 1.60% | $ 8.13 | ||||
ALPS Real Asset Income Fund(e) | ||||||||
Class A | ||||||||
Actual | $ 1,000.00 | $ 993.70 | 1.40% | $ 7.04 | ||||
Hypothetical (5% return before expenses) | $ 1,000.00 | $ 1,018.15 | 1.40% | $ 7.12 | ||||
Class C | ||||||||
Actual | $ 1,000.00 | $ 990.70 | 2.00% | $ 10.04 | ||||
Hypothetical (5% return before expenses) | $ 1,000.00 | $ 1,015.12 | 2.00% | $ 10.16 | ||||
Class I | ||||||||
Actual | $ 1,000.00 | $ 996.40 | 1.00% | $ 5.03 | ||||
Hypothetical (5% return before expenses) | $ 1,000.00 | $ 1,020.16 | 1.00% | $ 5.09 | ||||
ALPS | Red Rocks Listed Private Equity Fund | ||||||||
Class A | ||||||||
Actual | $ 1,000.00 | $ 944.30 | 1.59% | $ 7.79 | ||||
Hypothetical (5% return before expenses) | $ 1,000.00 | $ 1,017.19 | 1.59% | $ 8.08 | ||||
Class C | ||||||||
Actual | $ 1,000.00 | $ 941.40 | 2.15% | $ 10.52 | ||||
Hypothetical (5% return before expenses) | $ 1,000.00 | $ 1,014.37 | 2.15% | $ 10.92 | ||||
Class I | ||||||||
Actual | $ 1,000.00 | $ 946.10 | 1.25% | $ 6.13 | ||||
Hypothetical (5% return before expenses) | $ 1,000.00 | $ 1,018.90 | 1.25% | $ 6.36 | ||||
Class R | ||||||||
Actual | $ 1,000.00 | $ 945.20 | 1.63% | $ 7.99 | ||||
Hypothetical (5% return before expenses) | $ 1,000.00 | $ 1,016.99 | 1.63% | $ 8.29 | ||||
ALPS | Sterling ETF Tactical Rotation Fund(f) | ||||||||
Class A | ||||||||
Actual | $ 1,000.00 | $ 997.00 | 1.55% | $ 5.22 | ||||
Hypothetical (5% return before expenses) | $ 1,000.00 | $ 1,017.39 | 1.55% | $ 7.88 | ||||
Class C | ||||||||
Actual | $ 1,000.00 | $ 995.00 | 2.15% | $ 7.23 | ||||
Hypothetical (5% return before expenses) | $ 1,000.00 | $ 1,014.37 | 2.15% | $ 10.92 | ||||
Class I | ||||||||
Actual | $ 1,000.00 | $ 998.00 | 1.15% | $ 3.87 | ||||
Hypothetical (5% return before expenses) | $1,000.00 | $ 1,019.41 | 1.15% | $ 5.85 | ||||
| 2 | October 31, 2014 |
| Disclosure of Fund Expenses | ||
| October 31, 2014 (Unaudited) |
Beginning Account Value May 1, 2014 | Ending Account Value October 31, 2014 | Expense Ratio(a) | Expenses Paid During Period May 1, 2014 - | |||||
ALPS | Westport Resources Hedged High Income Fund | ||||||||
Class A | ||||||||
Actual | $ 1,000.00 | $ 994.30 | 2.39% | $ 12.01 | ||||
Hypothetical (5% return before expenses) | $ 1,000.00 | $ 1,013.16 | 2.39% | $ 12.13 | ||||
Class C | ||||||||
Actual | $ 1,000.00 | $ 991.30 | 2.99% | $ 15.01 | ||||
Hypothetical (5% return before expenses) | $ 1,000.00 | $ 1,010.13 | 2.99% | $15.15 | ||||
Class I | ||||||||
Actual | $ 1,000.00 | $ 996.30 | 1.99% | $ 10.01 | ||||
Hypothetical (5% return before expenses) | $ 1,000.00 | $ 1,015.17 | 1.99% | $ 10.11 | ||||
ALPS | WMC Disciplined Value Fund | ||||||||
Class A | ||||||||
Actual | $ 1,000.00 | $ 1,052.00 | 1.40% | $ 7.24 | ||||
Hypothetical (5% return before expenses) | $ 1,000.00 | $ 1,018.15 | 1.40% | $ 7.12 | ||||
Class C | ||||||||
Actual | $ 1,000.00 | $ 1,047.50 | 2.15% | $ 11.10 | ||||
Hypothetical (5% return before expenses) | $ 1,000.00 | $ 1,014.37 | 2.15% | $ 10.92 | ||||
Class I | ||||||||
Actual | $ 1,000.00 | $ 1,053.10 | 1.15% | $ 5.95 | ||||
Hypothetical (5% return before expenses) | $ 1,000.00 | $ 1,019.41 | 1.15% | $ 5.85 | ||||
Clough China Fund | ||||||||
Class A | ||||||||
Actual | $ 1,000.00 | $ 1,134.20 | 1.95% | $ 10.49 | ||||
Hypothetical (5% return before expenses) | $ 1,000.00 | $ 1,015.38 | 1.95% | $ 9.91 | ||||
Class C | ||||||||
Actual | $ 1,000.00 | $ 1,129.90 | 2.70% | $ 14.49 | ||||
Hypothetical (5% return before expenses) | $ 1,000.00 | $ 1,011.59 | 2.70% | $ 13.69 | ||||
Class I | ||||||||
Actual | $ 1,000.00 | $ 1,135.50 | 1.70% | $ 9.15 | ||||
Hypothetical (5% return before expenses) | $ 1,000.00 | $ 1,016.64 | 1.70% | $ 8.64 | ||||
RiverFront Conservative Income Builder Fund | ||||||||
Class A | ||||||||
Actual | $ 1,000.00 | $ 1,009.80 | 1.15% | $ 5.83 | ||||
Hypothetical (5% return before expenses) | $ 1,000.00 | $ 1,019.41 | 1.15% | $ 5.85 | ||||
Class C | ||||||||
Actual | $ 1,000.00 | $ 1,006.80 | 1.90% | $ 9.61 | ||||
Hypothetical (5% return before expenses) | $ 1,000.00 | $ 1,015.63 | 1.90% | $ 9.65 | ||||
Class I | ||||||||
Actual | $ 1,000.00 | $ 1,011.90 | 0.90% | $ 4.56 | ||||
Hypothetical (5% return before expenses) | $ 1,000.00 | $ 1,020.67 | 0.90% | $ 4.58 | ||||
RiverFront Dynamic Equity Income Fund | ||||||||
Class A | ||||||||
Actual | $ 1,000.00 | $ 1,016.60 | 1.15% | $ 5.85 | ||||
Hypothetical (5% return before expenses) | $ 1,000.00 | $ 1,019.41 | 1.15% | $ 5.85 | ||||
Class C | ||||||||
Actual | $ 1,000.00 | $ 1,013.00 | 1.90% | $ 9.64 | ||||
Hypothetical (5% return before expenses) | $ 1,000.00 | $ 1,015.63 | 1.90% | $ 9.65 | ||||
Class I | ||||||||
Actual | $ 1,000.00 | $ 1,018.80 | 0.90% | $ 4.58 | ||||
Hypothetical (5% return before expenses) | $ 1,000.00 | $ 1,020.67 | 0.90% | $ 4.58 | ||||
| 3 | October 31, 2014 |
| Disclosure of Fund Expenses | ||
| October 31, 2014 (Unaudited) |
Beginning Account Value May 1, 2014 | Ending Account Value October 31, 2014 | Expense Ratio(a) | Expenses Paid During Period May 1, 2014 - | |||||
RiverFront Global Allocation Fund | ||||||||
Class A | ||||||||
Actual | $ 1,000.00 | $ 1,013.10 | 1.15% | $ 5.84 | ||||
Hypothetical (5% return before expenses) | $ 1,000.00 | $ 1,019.41 | 1.15% | $ 5.85 | ||||
Class C | ||||||||
Actual | $ 1,000.00 | $ 1,009.40 | 1.90% | $ 9.62 | ||||
Hypothetical (5% return before expenses) | $ 1,000.00 | $ 1,015.63 | 1.90% | $ 9.65 | ||||
Class I | ||||||||
Actual | $ 1,000.00 | $ 1,013.30 | 0.90% | $ 4.57 | ||||
Hypothetical (5% return before expenses) | $ 1,000.00 | $ 1,020.67 | 0.90% | $ 4.58 | ||||
RiverFront Global Growth Fund | ||||||||
Class A | ||||||||
Actual | $ 1,000.00 | $ 1,011.80 | 1.15% | $ 5.83 | ||||
Hypothetical (5% return before expenses) | $ 1,000.00 | $ 1,019.41 | 1.15% | $ 5.85 | ||||
Class C | ||||||||
Actual | $ 1,000.00 | $ 1,008.00 | 1.90% | $ 9.62 | ||||
Hypothetical (5% return before expenses) | $ 1,000.00 | $ 1,015.63 | 1.90% | $ 9.65 | ||||
Class I | ||||||||
Actual | $ 1,000.00 | $ 1,013.10 | 0.90% | $ 4.57 | ||||
Hypothetical (5% return before expenses) | $ 1,000.00 | $ 1,020.67 | 0.90% | $ 4.58 | ||||
Class L | ||||||||
Actual | $ 1,000.00 | $ 1,013.10 | 0.90% | $ 4.57 | ||||
Hypothetical (5% return before expenses) | $ 1,000.00 | $ 1,020.67 | 0.90% | $ 4.58 | ||||
Investor Class | ||||||||
Actual | $ 1,000.00 | $ 1,011.80 | 1.15% | $ 5.83 | ||||
Hypothetical (5% return before expenses) | $ 1,000.00 | $ 1,019.41 | 1.15% | $ 5.85 | ||||
RiverFront Moderate Growth & Income Fund | ||||||||
Class A | ||||||||
Actual | $ 1,000.00 | $ 1,021.20 | 1.15% | $ 5.86 | ||||
Hypothetical (5% return before expenses) | $ 1,000.00 | $ 1,019.41 | 1.15% | $ 5.85 | ||||
Class C | ||||||||
Actual | $ 1,000.00 | $ 1,017.50 | 1.90% | $ 9.66 | ||||
Hypothetical (5% return before expenses) | $ 1,000.00 | $ 1,015.63 | 1.90% | $ 9.65 | ||||
Class I | ||||||||
Actual | $ 1,000.00 | $ 1,022.50 | 0.90% | $ 4.59 | ||||
Hypothetical (5% return before expenses) | $ 1,000.00 | $ 1,020.67 | 0.90% | $ 4.58 | ||||
| (a) | Annualized, based on the Fund’s most recent fiscal half year expenses. |
| (b) | Expenses are equal to the Fund’s annualized expense ratio multiplied by the average account value over the period, multiplied by the number of days in the most recent fiscal half year (184), divided by 365. |
| (c) | Includes expenses of the CoreCommodity Management Cayman Commodity Fund Ltd. (wholly-owned subsidiary), exclusive of the subsidiary’s management fee. |
| (d) | Includes expenses of the Kotak Mauritius Portfolio (wholly-owned subsidiary). |
| (e) | Includes expenses of the ALPS Real Asset Income Fund (Cayman) Ltd. (wholly-owned subsidiary), exclusive of the subsidiary’s management fee. |
| (f) | The ALPS | Sterling ETF Tactical Rotation Fund commenced operations on July 1, 2014. For purposes of calculating the “Actual” figures, actual number of days from commencement of operations through October 31, 2014 were used (123 days). |
| 4 | October 31, 2014 |
| ALPS | Alerian MLP Infrastructure Index Fund | ||
| Management Commentary | October 31, 2014 (Unaudited) | |
During the six-month period of May 1, 2014 to October 31, 2014, the Alerian MLP Infrastructure Index Fund’s Class A shares delivered a net return of 5.61% at Net Asset Value. Class A delivered a net return of -0.17% at MOP (Maximum Offering Price), Class C was 4.37% with CDSC (Contingent Deferred Sales Charge), and Class I was 5.78%. This compares to the Fund’s index, the Alerian MLP Infrastructure Index (“AMZI Index”), which gained 5.9% on a price-return and 8.9% on a total return basis. The difference in the performance between the Index and ALERX is primarily attributable to the Fund’s operating expenses and the tax impact of the Fund’s c-corporation structure.
During the period, the fund paid three distributions:
| • | $0.175 per share on May 13, 2014 |
| • | $0.177 per share on August 13, 2014 |
| • | $0.180 per share on October 31, 2014 |
These distributions represent 0.6%, 1.1%, and 1.7% increases from their previous quarters. On an annual basis, the Fund has increased its distribution by 5.0% when comparing the October 31, 2014 distribution versus the November 15, 2013 distribution of $0.1715.
Top contributors to the Fund during the period include El Paso Pipeline Partners (EPB), Kinder Morgan Energy Partners (KMP), Enbridge Energy Partners (EEP), and Energy Transfer Partners (ETP). Eight MLPs in the Fund generated negative returns during the period, including Crestwood Midstream Partners (CMLP) and Genesis Energy (GEL). During the period, EQT Midstream Partners (EQM) was added to the Fund and TC Pipelines (TCP) was removed from the Fund.
The energy markets experienced high volatility particularly during September and October, as West Texas Intermediate (WTI) oil prices retracted on fears of global supply outpacing global demand. From its June 13 high of $107.49, WTI had fallen over 25% to $80.53 by the end of October. While the majority of MLPs operate toll-road business models that rarely take title to the underlying commodity, there were a few weeks where MLPs were not immune to the headline risk. The Fund saw the greatest amount of volatility during the first two weeks of October, sharply falling 13.5% from September 30 until October 14, retracting all gains since March 2014. Despite WTI’s continued decline in the two weeks following, the Fund quickly rebounded, netting a 4.9% loss for all of October. While MLPs exhibited a strong correlation to declining crude prices over the course of two weeks, over the long run, MLPs have exhibited a weak correlation to commodity prices, whether they are crude oil, natural gas, or natural gas liquids.
Despite the volatility, the amount of announced organic projects from master limited partnerships (“MLPs”) seemingly has not slowed down. Regardless of commodity prices, the MLP-owned energy infrastructure assets, including pipelines, storage facilities, and processing plants, are and will be the bridge by which the reserves and production in supply basins make their way to demand centers. With toll-road business models anchored by inflation-indexed tariff increases and billions of dollars of infrastructure opportunities over the next few decades, we believe that MLPs continue to represent a compelling potential investment opportunity for investors seeking after-tax yield.
The views and information discussed in this commentary are as of the date of publication, are subject to change. The views expressed are those of the Investment Advisor. The views expressed represent an assessment of market conditions at a specific point in time, are opinions only and should not be relied upon as investment advice regarding a particular investment or markets in general. Such information does not constitute a recommendation to buy or sell specific securities or investment vehicles. It should not be assumed that any investment will be profitable or will equal the performance of the fund(s) or any securities or any sectors mentioned in this letter. The subject matter contained in this letter has been derived from several sources believed to be reliable and accurate at the time of compilation. ALPS Advisors, Inc. and Alerian do not accept any liability for losses either direct or consequential caused by the use of this information.
| 5 | October 31, 2014 |
| ALPS | Alerian MLP Infrastructure Index Fund | ||
| Performance Update | October 31, 2014 (Unaudited) |
Performance of $10,000 Initial Investment (as of October 31, 2014)
Comparison of change in value of a $10,000 investment (includes maximum sales charges of 5.50%)
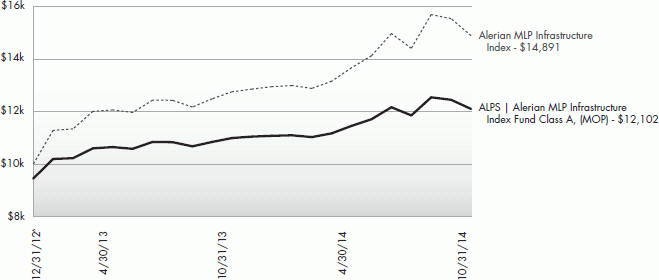
The chart above represents historical performance of a hypothetical investment of $10,000 in the Fund since inception. Past performance does not guarantee future results. This chart does not reflect the deduction of taxes that a shareholder would pay on Fund distributions or the redemption of Fund shares.
Average Annual Total Returns (as of October 31, 2014)
| 6 Month | 1 Year | Since Inception^ | Total Expense Ratio* | What You Pay** | ||||||
Class A (NAV) | 5.61% | 10.06% | 14.44% | 8.47% | 6.63% | |||||
Class A (MOP) | -0.17% | 3.98% | 10.97% | |||||||
Class C (NAV) | 5.37% | 9.63% | 13.97% | 8.87% | 7.01% | |||||
Class C (CDSC) | 4.37% | 8.63% | 13.97% | |||||||
Class I | 5.78% | 10.23% | 14.64% | 8.56% | 6.38% | |||||
Alerian MLP Infrastructure Index1 | 8.92% | 16.75% | 24.26% |
Performance data quoted represents past performance. Past performance does not guarantee future results. Investment return and principal value of an investment will fluctuate so that an investor’s shares, when sold or redeemed, may be worth more or less than the original cost. Current performance data may be higher or lower than actual data quoted. For the most current month-end performance data please call 1-866-759-5679.
Maximum Offering Price (MOP) for Class A shares includes the Fund’s maximum sales charge of 5.50%. Performance shown at NAV does not include these sales charges and would have been lower had it been taken into account. If you invest $1 million or more, either as a lump sum or through the Fund’s accumulation or letter of intent programs, you can purchase Class A shares without an initial sales charge (load). A Contingent Deferred Sales Charge (“CDSC”) of 1.00% may apply to Class C shares redeemed within the first 12 months after a purchase, and on Class A shares redeemed within the first 18 months after a purchase in excess of $1 million.
Performance less than 1 year is cumulative.
| 6 | October 31, 2014 |
| ALPS | Alerian MLP Infrastructure Index Fund | ||
| Performance Update | October 31, 2014 (Unaudited) |
Investments in securities of MLPs involve risks that differ from an investment in common stock. MLPs are controlled by their general partners, which generally have conflicts of interest and limited fiduciary duties to the MLP, which may permit the general partner to favor its own interests over the MLPs. The benefit you are expected to derive from the Fund’s investment in MLPs depends largely on the MLPs being treated as partnerships for federal income tax purposes. As a partnership, an MLP has no federal income tax liability at the entity level. Therefore, treatment of one or more MLPs as a corporation for federal income tax purposes could affect the Fund’s ability to meet its investment objective and would reduce the amount of cash available to pay or distribute to you. Legislative, judicial, or administrative changes and differing interpretations, possibly on a retroactive basis, could negatively impact the value of an investment in MLPs and therefore the value of your investment in the Fund.
| 1 | Alerian MLP Infrastructure Index is comprised of 25 midstream energy Master Limited Partnerships. The index is not actively managed and does not reflect any deductions for fees, expenses or taxes. An investor may not invest directly in an index. |
| ^ | Fund inception date of December 31, 2012. The Fund commenced operations on January 2, 2013. |
| * | Excludes current and deferred income tax expense. |
| ** | What You Pay reflects the Advisor’s and Sub-Advisor’s decision to contractually limit expenses through August 31, 2015. Please see the prospectus for additional information. |
The table does not reflect the deduction of taxes that a shareholder would pay on Fund distributions or the redemption of Fund shares.
This Fund is not suitable for all investors and is subject to investment risks, including possible loss of the principal amount invested.
There is no guarantee that the Fund will continue to hold any one particular security or stay invested in any one particular company. The composition of the Fund’s top holdings is subject to change. Performance figures are historical and reflect the change in share price, reinvested distributions, changes in net asset value, sales charges and capital gains distributions, if any.
Not FDIC Insured – No Bank Guarantee – May Lose Value
Top Ten Holdings (as a % of Net Assets) †
|
| |||
Kinder Morgan Energy Partners LP | 10.12 | % | ||
Enterprise Products Partners LP | 9.33 | % | ||
Energy Transfer Partners LP | 8.54 | % | ||
Magellan Midstream Partners LP | 7.55 | % | ||
Plains All American Pipeline LP | 7.04 | % | ||
MarkWest Energy Partners LP | 6.51 | % | ||
Buckeye Partners LP | 4.87 | % | ||
Regency Energy Partners LP | 4.72 | % | ||
Williams Partners LP | 4.36 | % | ||
ONEOK Partners LP | 4.24 | % | ||
Top Ten Holdings | 67.28 | % | ||
| † | Holdings are subject to change. Table presents approximate values only. |
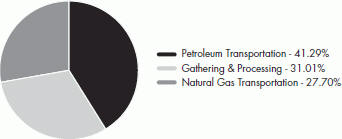
Industry Sector Allocation (as a % of Total Investments)
| 7 | October 31, 2014 |
| ALPS | Alerian MLP Infrastructure Index Fund | ||
| Statement of Investments | October 31, 2014 |
| Shares | Value (Note 2) | ||||||
MASTER LIMITED PARTNERSHIPS (102.39%) |
| |||||||
Gathering & Processing (31.75%) |
| |||||||
Pipelines (31.75%) | ||||||||
Access Midstream Partners LP | 13,013 | $ | 810,580 | |||||
Atlas Pipeline Partners LP | 9,753 | 357,935 | ||||||
Crestwood Midstream Partners LP | 19,165 | 381,192 | ||||||
DCP Midstream Partners LP | 11,007 | 582,821 | ||||||
EnLink Midstream Partners LP | 11,820 | 354,600 | ||||||
MarkWest Energy Partners LP | 22,345 | 1,565,267 | ||||||
Regency Energy Partners LP | 37,849 | 1,135,470 | ||||||
Targa Resources Partners LP | 12,961 | 791,658 | ||||||
Western Gas Partners LP | 8,694 | 607,710 | ||||||
Williams Partners LP | 20,335 | 1,048,269 | ||||||
|
| |||||||
| 7,635,502 | ||||||||
|
| |||||||
TOTAL GATHERING & PROCESSING |
| 7,635,502 | ||||||
|
| |||||||
Natural Gas Transportation (28.37%) |
| |||||||
Pipelines (28.37%) | ||||||||
El Paso Pipeline Partners LP | 17,571 | 714,261 | ||||||
Energy Transfer Partners LP | 31,863 | 2,052,933 | ||||||
Enterprise Products Partners LP | 60,809 | 2,243,852 | ||||||
EQT Midstream Partners LP | 5,019 | 444,583 | ||||||
ONEOK Partners LP | 19,937 | 1,018,781 | ||||||
Spectra Energy Partners LP | 6,444 | 347,976 | ||||||
|
| |||||||
| 6,822,386 | ||||||||
|
| |||||||
TOTAL NATURAL GAS TRANSPORTATION |
| 6,822,386 | ||||||
|
| |||||||
Petroleum Transportation (42.27%) |
| |||||||
Pipelines (42.27%) | ||||||||
Buckeye Partners LP | 15,520 | 1,170,208 | ||||||
Enbridge Energy Partners LP | 26,538 | 957,226 | ||||||
Genesis Energy LP | 9,353 | 448,757 | ||||||
Kinder Morgan Energy Partners LP | 25,959 | 2,434,954 | ||||||
Magellan Midstream Partners LP | 22,179 | 1,815,795 | ||||||
NuStar Energy LP | 8,324 | 506,099 | ||||||
Plains All American Pipeline LP | 30,053 | 1,693,487 | ||||||
Sunoco Logistics Partners LP | 18,240 | 870,595 | ||||||
Tesoro Logistics LP | 4,800 | 270,240 | ||||||
|
| |||||||
| 10,167,361 | ||||||||
|
| |||||||
TOTAL PETROLEUM TRANSPORTATION |
| 10,167,361 | ||||||
|
| |||||||
TOTAL MASTER LIMITED PARTNERSHIPS (Cost $21,159,320) |
| 24,625,249 | ||||||
|
| |||||||
| Shares | Value (Note 2) | ||||
TOTAL INVESTMENTS (102.39%) (Cost $21,159,320) | $ | 24,625,249 | ||||
Liabilities In Excess Of Other Assets (-2.39%) | (575,784 | ) | ||||
|
| |||||
NET ASSETS (100.00%) | $ | 24,049,465 | ||||
|
| |||||
Common Abbreviations:
LP - Limited Partnerships.
For Fund compliance purposes, the Fund’s industry classifications refer to any one or more of the industry sub-classifications used by one or more widely recognized market indexes or ratings group indexes, and/or as defined by Fund management. This definition may not apply for purposes of this report, which may combine industry sub-classifications for reporting ease. Industries are shown as a percent of net assets.
See Notes to Financial Statements.
| 8 | October 31, 2014 |
| ALPS | Alerian MLP Infrastructure Index Fund | ||
| Statement of Assets and Liabilities | October 31, 2014 |
ASSETS | ||||
Investments, at value | $ | 24,625,249 | ||
Receivable for shares sold | 384,101 | |||
Dividends receivable | 187,045 | |||
Receivable due from advisor | 6,427 | |||
Income tax receivable | 139 | |||
Prepaid expenses and other assets | 31,937 | |||
Total Assets | 25,234,898 | |||
LIABILITIES | ||||
Deferred tax liability | 1,119,965 | |||
Franchise tax payable | 3,810 | |||
Payable for shares redeemed | 1,108 | |||
Payable due to custodian - overdraft | 17,811 | |||
Administration and transfer agency fees payable | 2,624 | |||
Distribution and services fees payable | 9,616 | |||
Trustees’ fees and expenses payable | 161 | |||
Professional fees payable | 23,204 | |||
Accrued expenses and other liabilities | 7,134 | |||
Total Liabilities | 1,185,433 | |||
NET ASSETS | $ | 24,049,465 | ||
| ||||
NET ASSETS CONSIST OF | ||||
Paid-in capital | $ | 22,348,581 | ||
Accumulated net investment loss, net of deferred income taxes | (162,705) | |||
Accumulated net realized loss on investments, net of deferred income taxes | (360,533) | |||
Net unrealized appreciation on investments, net of deferred income taxes | 2,224,122 | |||
NET ASSETS | $ | 24,049,465 | ||
| ||||
INVESTMENTS, AT COST | $ | 21,159,320 | ||
PRICING OF SHARES | ||||
Class A: | ||||
Net Asset Value, offering and redemption price per share(a) | $ | 11.32 | ||
Net Assets | $ | 10,619,224 | ||
Shares of beneficial interest outstanding (unlimited number of shares, no par value common stock authorized) | 938,237 | |||
Maximum offering price per share ((NAV/0.9450), based on maximum sales charge of 5.50% of the offering price) | $ | 11.98 | ||
Class C: | ||||
Net Asset Value, offering and redemption price per share(a) | $ | 11.23 | ||
Net Assets | $ | 6,772,529 | ||
Shares of beneficial interest outstanding (unlimited number of shares, no par value common stock authorized) | 602,851 | |||
Class I: | ||||
Net Asset Value, offering and redemption price per share | $ | 11.36 | ||
Net Assets | $ | 6,657,712 | ||
Shares of beneficial interest outstanding (unlimited number of shares, no par value common stock authorized) | 586,028 | |||
| (a) | Redemption price per share may be reduced for any applicable contingent deferred sales charge. For a description of a possible sales charge, please see the Fund’s Prospectus. |
See Notes to Financial Statements.
| 9 | October 31, 2014 |
| ALPS | Alerian MLP Infrastructure Index Fund | ||
| Statements of Operations |
| For the Fiscal Period Ended October 31, 2014(a) | For the Year Ended April 30, 2014 | |||||||
INVESTMENT INCOME | ||||||||
Dividends | $ | 60 | $ | 33 | ||||
Distributions from master limited partnerships | 564,418 | 487,557 | ||||||
Less return of capital distributions | (564,418) | (487,557) | ||||||
Total Investment Income | 60 | 33 | ||||||
EXPENSES | ||||||||
Investment advisory fees | 69,776 | 59,609 | ||||||
Administrative and transfer agency fees | 11,399 | 10,014 | ||||||
Distribution and service fees | ||||||||
Class A | 19,206 | 20,539 | ||||||
Class C | 25,212 | 15,441 | ||||||
Professional fees | 56,344 | 63,165 | ||||||
Reports to shareholders and printing fees | 1,236 | 2,145 | ||||||
State registration fees | 19,047 | 27,509 | ||||||
SEC registration fees | 1,040 | 1,322 | ||||||
Insurance fees | 97 | 96 | ||||||
Franchise tax expenses | 1,941 | 1,869 | ||||||
Custody fees | 10,854 | 12,881 | ||||||
Trustees’ fees and expenses | 310 | 330 | ||||||
Offering costs | – | 46,017 | ||||||
Miscellaneous expenses | 11,153 | 12,614 | ||||||
Total Expenses | 227,615 | 273,551 | ||||||
Less fees waived/reimbursed by investment advisor (Note 8) | ||||||||
Class A | (48,763) | (95,994) | ||||||
Class C | (24,506) | (28,674) | ||||||
Class I | (23,256) | (38,321) | ||||||
Net Expenses | 131,090 | 110,562 | ||||||
Net Investment Loss, Before Income Taxes | (131,030) | (110,529) | ||||||
Deferred income tax benefit | 30,070 | 26,867 | ||||||
Deferred income tax benefit - Class A | 7,295 | 7,476 | ||||||
Deferred income tax benefit - Class C | 9,151 | 5,621 | ||||||
Net Investment Loss, Net of Income Taxes | (84,514) | (70,565) | ||||||
REALIZED AND UNREALIZED GAIN/(LOSS) | ||||||||
Net realized gain/(loss) on investments, before income taxes | 5,607 | (63,121) | ||||||
Current income tax expense | (6,658) | (3,303) | ||||||
Deferred income tax benefit | 4,423 | 26,138 | ||||||
Net Realized Gain/(Loss) on investments, Net of Income Taxes | 3,372 | (40,286) | ||||||
Net change in unrealized appreciation on investment, before deferred income taxes | 1,395,387 | 1,436,619 | ||||||
Deferred income tax expense | (492,673) | (518,386) | ||||||
Net Change in Unrealized Appreciation on Investments | 902,714 | 918,233 | ||||||
NET REALIZED AND UNREALIZED GAIN ON INVESTMENTS, NET OF INCOME TAXES | 906,086 | 877,947 | ||||||
NET INCREASE IN NET ASSETS RESULTING FROM OPERATIONS | $ | 821,572 | $ | 807,382 | ||||
| ||||||||
| (a) | Effective May 1, 2014, the Board approved changing the fiscal year-end of the Funds from April 30 to October 31. |
See Notes to Financial Statements.
| 10 | October 31, 2014 |
| ALPS | Alerian MLP Infrastructure Index Fund | ||
| Statements of Changes in Net Assets |
| For the Fiscal Period Ended October 31, 2014(a) | For the Year April 30, 2014 | For the Period January 2, 2013 (Commencement) April 30, 2013 | ||||||||||
OPERATIONS | ||||||||||||
Net investment loss, net of income taxes | $ | (84,514) | $ | (70,565) | $ | (7,626) | ||||||
Net realized gain/(loss) on investments, net of income taxes | 3,372 | (40,286) | (764) | |||||||||
Net change in unrealized appreciation on investments, net of deferred income taxes | 902,714 | 918,233 | 403,175 | |||||||||
Net Increase in Net Assets Resulting from Operations | 821,572 | 807,382 | 394,785 | |||||||||
DISTRIBUTIONS | ||||||||||||
Dividends to shareholders from net investment income | ||||||||||||
Class A | (26,390) | (137,326) | – | |||||||||
Class C | (32,401) | (42,694) | – | |||||||||
Class I | (36,117) | (47,927) | – | |||||||||
Dividends to shareholders from tax return of capital | ||||||||||||
Class A | (422,657) | (120,029) | (8,653) | |||||||||
Class C | (205,706) | (41,147) | (8,137) | |||||||||
Class I | (200,052) | (74,680) | (32,548) | |||||||||
Net Decrease in Net Assets from Distributions | (923,323) | (463,803) | (49,338) | |||||||||
BENEFICIAL INTEREST TRANSACTIONS (NOTE 6) | ||||||||||||
Shares sold | ||||||||||||
Class A | 3,317,091 | 9,171,152 | 851,295 | |||||||||
Class C | 3,457,848 | 3,336,491 | 500,010 | |||||||||
Class I | 5,196,869 | 1,646,324 | 2,000,010 | |||||||||
Dividends reinvested | ||||||||||||
Class A | 427,003 | 240,424 | 8,653 | |||||||||
Class C | 178,058 | 58,350 | 8,137 | |||||||||
Class I | 219,273 | 118,124 | 32,548 | |||||||||
Shares redeemed | ||||||||||||
Class A | (1,375,093) | (2,345,899) | (10) | |||||||||
Class C | (245,100) | (621,954) | (10) | |||||||||
Class I | (184,339) | (2,533,055) | (10) | |||||||||
Net Increase in Net Assets Derived from Beneficial Interest Transactions | 10,991,610 | 9,069,957 | 3,400,623 | |||||||||
Net increase in net assets | 10,889,859 | 9,413,536 | 3,746,070 | |||||||||
NET ASSETS | ||||||||||||
Beginning of period | 13,159,606 | 3,746,070 | – | |||||||||
End of period * | $ | 24,049,465 | $ | 13,159,606 | $ | 3,746,070 | ||||||
| ||||||||||||
| *Including accumulated net investment loss, net of deferred income taxes, of: | $ | (162,705) | $ | (78,191) | $ | (7,626) | ||||||
| (a) | Effective May 1, 2014, the Board approved changing the fiscal year-end of the Funds from April 30 to October 31. |
See Notes to Financial Statements.
| 11 | October 31, 2014 |
| ALPS | Alerian MLP Infrastructure Index Fund – Class A | ||
| Financial Highlights | ||
Selected data for a share of beneficial interest outstanding throughout the periods indicated:
| For the Fiscal Period Ended October 31, 2014(a) | For the Year Ended April 30, 2014 | For the Period January 2, 2013 | ||||
Net asset value, beginning of period | $11.23 | $11.10 | $10.00 | |||
INCOME/(LOSS) FROM INVESTMENT OPERATIONS: | ||||||
Net investment loss(b) | (0.05) | (0.09) | (0.03) | |||
Net realized and unrealized gain | 0.67 | 0.90 | 1.29 | |||
| ||||||
Total from investment operations | 0.62 | 0.81 | 1.26 | |||
| ||||||
DISTRIBUTIONS: | ||||||
From net investment income | (0.03) | (0.36) | – | |||
From tax return of capital | (0.50) | (0.32) | (0.16) | |||
| ||||||
Total distributions | (0.53) | (0.68) | (0.16) | |||
| ||||||
Net increase in net asset value | 0.09 | 0.13 | 1.10 | |||
| ||||||
Net asset value, end of year | $11.32 | $11.23 | $11.10 | |||
| ||||||
TOTAL RETURN(c) | 5.61% | 7.59% | 12.68% | |||
RATIOS/SUPPLEMENTAL DATA: | ||||||
Net assets, end of year (000s) | $10,619 | $8,223 | $928 | |||
Ratio of expenses to average net assets before waivers, franchise tax expense and income tax expense/benefit | 2.20%(d) | 3.09% | 5.51%(d)(e) | |||
Ratio of expense waivers to average net assets | (0.97%)(d) | (1.84%) | (4.26%)(d)(e) | |||
| ||||||
Ratio of expenses to average net assets net of waivers before franchise tax expense and income tax expense/benefit | 1.23%(d)(f) | 1.25% | 1.25%(d)(e) | |||
Ratio of franchise tax expense and deferred income tax expense to average net assets(g) | 4.49%(d) | 5.38% | 20.55%(d) | |||
| ||||||
Ratio of total expenses to average net assets | 5.72%(d) | 6.63% | 21.80%(d) | |||
| ||||||
Ratio of investment loss to average net assets before waivers, franchise tax expense and income tax expense/benefit | (2.20%)(d) | (3.09%) | (5.51%)(d)(e) | |||
Ratio of expense waivers to average net assets | (0.97%)(d) | (1.84%) | (4.26%)(d)(e) | |||
| ||||||
Ratio of investment loss to average net assets net of waivers before franchise tax expense and income tax expense/benefit | (1.23%)(d)(f) | (1.25%) | (1.25%)(d)(e) | |||
Ratio of franchise tax expense and deferred income tax benefit to average net assets(h) | 0.43%(d) | 0.43% | 0.40%(d) | |||
| ||||||
Ratio of net investment loss to average net assets | (0.80%)(d) | (0.82%) | (0.85%)(d) | |||
| ||||||
Portfolio turnover rate(i) | 7% | 63% | 3% | |||
| ||||||
| (a) | Effective May 1, 2014, the Board approved changing the fiscal year-end of the Funds from April 30 to October 31. |
| (b) | Calculated using the average shares method. |
| (c) | Total returns are for the period indicated and have not been annualized. Total returns would have been lower had certain expenses not been waived during the period. Returns shown do not reflect the deduction of taxes that a shareholder would pay on Fund distributions or the redemption of Fund shares. Returns shown exclude any applicable sales charges. |
| (d) | Annualized. |
| (e) | Expense ratios before reductions for startup periods may not be representative of longer term operating periods. |
| (f) | According to the Fund’s shareholder services plan with respect to the Fund’s Class A shares, any amount of such payment not paid during the Fund’s fiscal year for such service activities shall be reimbursed to the Fund as soon as practical after the end of the fiscal year. Fees were reimbursed to the Fund during the period ended October 31, 2014, for the prior fiscal year in the amount of 0.02% of average net assets of Class A shares. |
| (g) | Deferred income tax expense estimate for the ratio calculation is derived from the net investment loss, and realized and unrealized gains/losses. |
| (h) | Deferred income tax benefit for the ratio calculation is derived from net investment loss only. |
| (i) | Portfolio turnover rate for periods less than one full year have not been annualized. |
See Notes to Financial Statements.
| 12 | October 31, 2014 |
| ALPS | Alerian MLP Infrastructure Index Fund – Class C |
Financial Highlights Selected data for a share of beneficial interest outstanding throughout the periods indicated: |
| For the Fiscal Period Ended October 31, 2014(a) | For the Year Ended April 30, 2014 | For the Period January 2, 2013 | ||||
Net asset value, beginning of period | $11.17 | $11.09 | $10.00 | |||
INCOME/(LOSS) FROM INVESTMENT OPERATIONS: | ||||||
Net investment loss(b) | (0.07) | (0.13) | (0.05) | |||
Net realized and unrealized gain | 0.66 | 0.89 | 1.30 | |||
| ||||||
Total from investment operations | 0.59 | 0.76 | 1.25 | |||
| ||||||
DISTRIBUTIONS: | ||||||
From net investment income | (0.08) | (0.35) | – | |||
From tax return of capital | (0.45) | (0.33) | (0.16) | |||
| ||||||
Total distributions | (0.53) | (0.68) | (0.16) | |||
| ||||||
Net increase in net asset value | 0.06 | 0.08 | 1.09 | |||
| ||||||
Net asset value, end of year | $11.23 | $11.17 | $11.09 | |||
| ||||||
TOTAL RETURN(c) | 5.37% | 7.13% | 12.58% | |||
RATIOS/SUPPLEMENTAL DATA: | ||||||
Net assets, end of year (000s) | $6,773 | $3,429 | $563 | |||
Ratio of expenses to average net assets before waivers, franchise tax expense and income tax expense/benefit | 2.82%(d) | 3.71% | 7.01%(d)(e) | |||
Ratio of expense waivers to average net assets | (0.97%)(d) | (1.86%) | (5.16%)(d)(e) | |||
| ||||||
Ratio of expenses to average net assets net of waivers before franchise tax expense and income tax expense/benefit | 1.85%(d) | 1.85% | 1.85%(d)(e) | |||
Ratio of franchise tax expense and deferred income tax expense to average net | 4.27%(d) | 5.16% | 20.55%(d) | |||
| ||||||
Ratio of total expenses to average net assets | 6.12%(d) | 7.01% | 22.40%(d) | |||
| ||||||
Ratio of investment loss to average net assets before waivers, franchise tax expense and income tax expense/benefit | (2.82%)(d) | (3.71%) | (7.01%)(d)(e) | |||
Ratio of expense waivers to average net assets | (0.97%)(d) | (1.86%) | (5.16%)(d)(e) | |||
| ||||||
Ratio of investment loss to average net assets net of waivers before franchise tax expense and income tax expense/benefit | (1.85%)(d) | (1.85%) | (1.85%)(d)(e) | |||
Ratio of franchise tax expense and deferred income tax benefit to average net assets(g) | 0.65%(d) | 0.65% | 0.40%(d) | |||
| ||||||
Ratio of net investment loss to average net assets | (1.20%)(d) | (1.20%) | (1.45%)(d) | |||
| ||||||
Portfolio turnover rate(h) | 7% | 63% | 3% | |||
| ||||||
| (a) | Effective May 1, 2014, the Board approved changing the fiscal year-end of the Funds from April 30 to October 31. |
| (b) | Calculated using the average shares method. |
| (c) | Total returns are for the period indicated and have not been annualized. Total returns would have been lower had certain expenses not been waived during the period. Returns shown do not reflect the deduction of taxes that a shareholder would pay on Fund distributions or the redemption of Fund shares. Returns shown exclude any applicable sales charges. |
| (d) | Annualized. |
| (e) | Expense ratios before reductions for startup periods may not be representative of longer term operating periods. |
| (f) | Deferred income tax expense estimate for the ratio calculation is derived from the net investment loss, and realized and unrealized gains/losses. |
| (g) | Deferred income tax benefit for the ratio calculation is derived from net investment loss only. |
| (h) | Portfolio turnover rate for periods less than one full year have not been annualized. |
See Notes to Financial Statements.
| 13 | October 31, 2014 |
| ALPS | Alerian MLP Infrastructure Index Fund – Class I | ||
Financial Highlights Selected data for a share of beneficial interest outstanding throughout the periods indicated: | ||
| For the Fiscal Period Ended October 31, 2014(a) | For the Year Ended April 30, 2014 | For the Period January 2, 2013 (Commencement) to April 30, 2013 | ||||
Net asset value, beginning of period | $11.25 | $11.11 | $10.00 | |||
INCOME/(LOSS) FROM INVESTMENT OPERATIONS: | ||||||
Net investment loss(b) | (0.03) | (0.06) | (0.02) | |||
Net realized and unrealized gain | 0.67 | 0.88 | 1.29 | |||
| ||||||
Total from investment operations | 0.64 | 0.82 | 1.27 | |||
| ||||||
DISTRIBUTIONS: | ||||||
From net investment income | (0.04) | (0.27) | – | |||
From tax return of capital | (0.49) | (0.41) | (0.16) | |||
| ||||||
Total distributions | (0.53) | (0.68) | (0.16) | |||
| ||||||
Net increase in net asset value | 0.11 | 0.14 | 1.11 | |||
| ||||||
Net asset value, end of year | $11.36 | $11.25 | $11.11 | |||
| ||||||
TOTAL RETURN(c) | 5.78% | 7.68% | 12.78% | |||
RATIOS/SUPPLEMENTAL DATA: | ||||||
Net assets, end of year (000s) | $6,658 | $1,507 | $2,256 | |||
Ratio of expenses to average net assets before waivers, franchise tax expense and income tax expense/benefit | 1.81%(d) | 3.03% | 6.01%(d)(e) | |||
Ratio of expense waivers to average net assets | (0.96%)(d) | (2.18%) | (5.16%)(d)(e) | |||
| ||||||
Ratio of expenses to average net assets net of waivers before franchise tax expense and income tax expense/benefit | 0.85%(d) | 0.85% | 0.85%(d)(e) | |||
Ratio of franchise tax expense and deferred income tax expense to average net assets(f) | 4.63%(d) | 5.53% | 20.55%(d) | |||
| ||||||
Ratio of total expenses to average net assets | 5.48%(d) | 6.38% | 21.40%(d) | |||
| ||||||
Ratio of investment loss to average net assets before waivers, franchise tax expense and income tax expense/benefit | (1.81%)(d) | (3.03%) | (6.01%)(d)(e) | |||
Ratio of expense waivers to average net assets | (0.96%)(d) | (2.18%) | (5.16%)(d)(e) | |||
| ||||||
Ratio of investment loss to average net assets net of waivers before franchise tax expense and income tax expense/benefit | (0.85%)(d) | (0.85%) | (0.85%)(d)(e) | |||
Ratio of franchise tax expense and deferred income tax benefit to average net assets(g) | 0.28%(d) | 0.29% | 0.40%(d) | |||
| ||||||
Ratio of net investment loss to average net assets | (0.57%)(d) | (0.56%) | (0.45%)(d) | |||
| ||||||
Portfolio turnover rate(h) | 7% | 63% | 3% | |||
| ||||||
| (a) | Effective May 1, 2014, the Board approved changing the fiscal year-end of the Funds from April 30 to October 31. |
| (b) | Calculated using the average shares method. |
| (c) | Total returns are for the period indicated and have not been annualized. Total returns would have been lower had certain expenses not been waived during the period. Returns shown do not reflect the deduction of taxes that a shareholder would pay on Fund distributions or the redemption of Fund shares. |
| (d) | Annualized. |
| (e) | Expense ratios before reductions for startup periods may not be representative of longer term operating periods. |
| (f) | Deferred income tax expense estimate for the ratio calculation is derived from the net investment loss, and realized and unrealized gains/losses. |
| (g) | Deferred income tax benefit for the ratio calculation is derived from net investment loss only. |
| (h) | Portfolio turnover rate for periods less than one full year have not been annualized. |
See Notes to Financial Statements.
| 14 | October 31, 2014 |
ALPS | CoreCommodity Management CompleteCommodities® Strategy Fund | ||
| Management Commentary | October 31, 2014 (Unaudited) |
The six month period ending on October 31, 2014 produced negative returns for commodities. Commodity futures prices, as measured by the diversified Bloomberg Commodities Total Return Index, were down 14.55%. Commodity equities also declined during the period, down 7.08% as measured by the Standard and Poor’s Global Natural Resources Net Total Return Index. Commodity equities diverged notably from the performance of the broader Standard & Poor’s 500 Total Return Index for the period which posted +8.22% gains. The ALPS CoreCommodity Complete Commodities Strategy Fund (JCRIX) delivered a net negative return of -11.88% (JCRAX was -12.05% at MOP and JCRCX was down 12.32% with CDSC).
The Fund outperformed its benchmark, the Bloomberg Commodity Total Return Index, by approximately 259 basis points1 (or 2.59%) during this period (measured against the performance of the “I” shares). The Fund employs a strategy that combines an actively managed portfolio of commodity futures related exposure (collateralized by Treasury Inflation Protected Securities – TIPS), commodity equities, and physical commodity ETF’s (Exchange-Traded Funds). At the end of October, the Fund allocated approximately 69% of its assets toward commodity futures related investments and approximately 31% of its assets in commodity equities. The Fund was more than 99% invested by the end of the period.
Commodity prices were generally under pressure during the six month period ending in October 31, 2014. Two macro-economic issues contributed headwinds to commodity price appreciation. First, the value of the US Dollar, as measured by the US Dollar Index, increased by 9.37% for the six month period ending in October 31, 2014. Since most commodities are priced in US Dollars, an increase in the value of the Dollar would most likely have an inverse response in commodity prices, all other factors left alone. The second macro factor that had a detrimental effect on commodity prices was stubbornly slow economic growth in many parts of the world. Central banks in Japan and Europe reinforced their efforts to stimulate their economies with limited success. Gross domestic product numbers slipped in both regions from more hopeful levels in the first quarter of 2014.
Live cattle futures were the best performing constituent within the Bloomberg Commodity Index from the end of April 2014 to the end of October 2014, up 21.03%. Lingering effects of 2012’s extreme drought and heat in the mid-west coupled with a brutally cold winter in late 2013 into early 2014 contributed to reduced cattle herds. Aluminum prices gained 13.28%, one of the few industrial metals to appreciate during this six month stretch.
Cotton prices declined by the greatest percentage within the Bloomberg Commodity Index during the six month period ending in October 2014, down 31.65%. Ideal weather and high yields depressed prices for cotton, soybeans, corn and wheat during the same period. Soybean prices dropped by 30.64%, while corn and wheat fell 27.41% and 26.92% respectively. Energy prices fell as global gross domestic product (GDP) growth slowed. West Texas Intermediate crude oil (WTI) declined by 19.25% while Brent crude,
an international marker crude, slipped by 19.71%. The Fund has exposure to both types of crude oil futures. Natural gas prices were 19.56% lower for the period. Gold and silver price declines largely mirrored the increase in the US Dollar. Gold was down 9.59% while silver prices lost 15.76% for six months ending in October.
The Fund’s top equity holdings at the end of October 2014 included CF Industries (CF) +13.19% YTD (year-to-date), Monsanto (MON) +.23% YTD, AGCO Corp (AGCO) -24.66% YTD, Hormel Foods (HRL) +21.36% YTD, Chevron Corporation (CVX) -1.45% YTD, Sociedad Quimica Minera de Chile (SQM) -5.23% YTD, K&S Ag-Reg (SDF) +.45% YTD, Tyson Foods Inc. (TSN) +20.85% YTD, Mosaic Co. (MOS) -4.28% YTD Exxon/Mobil (XOM) -1.57% YTD.
U.S. Treasury Inflation Protected Bonds or TIPS are held by the fund to invest excess cash and as collateral for commodity futures related investments held in our Cayman Island subsidiary. Nominal yields on the benchmark 10 year note2 were at 2.645% at the end of April 2014 and ended the six month period modestly lower, 2.335%. The Federal Reserve announced the end to their quantitative easing program (QE) for US Treasuries despite the efforts by the Federal Reserve and other central banks to maintain historically low interest rates; we believe we may be nearing the end of what has been a significant multi-year rally in US treasury prices. As a result, we continue to invest in TIPS with limited duration exposure. At the end of October, our weighted average maturity3 was approximately 1.15 years in our TIPS portfolio.
We strongly believe that the long term fundamental drivers of commodity demand and ultimately higher prices are still in place. Population growth is likely to remain unabated regardless of the economic environment in the US and Europe. A billion more people will be added to the world population over the next decade. The trend of wealth distribution to the developing world as those economies grow at rapid rates relative to the slow or negative growth occurring in the developed countries is contributing to ever increasing demand for raw materials and food. Incremental gains in disposable income in the developing nations have led to competition for the commodities needed for more complex and costly lifestyles. In a world with limited supplies of food, fuel, building materials, and other necessities of life, price may become the ultimate allocator. Additionally, we believe the aggressively accommodative central bank monetary policies recently announced coupled with measures already in place globally are likely to make commodities and other real assets more attractive over time as currencies, including the US Dollar, may decline in value.
Satch Chada
Co-Portfolio Manager
Robert Hyman
Co-Portfolio Manager
| 15 | October 31, 2014 |
ALPS | CoreCommodity Management CompleteCommodities® Strategy Fund | ||
| Management Commentary | October 31, 2014 (Unaudited) |
| 1 | A basis point is a unit that is equal to 1/100th of 1% and is used to denote the change in a financial instrument. |
| 2 | The 10 Year Treasury Note is a debt obligation issued by the United States government that matures in 10 years. |
| 3 | To arrive at the weighted average maturity the weight of each security is multiplied by the time until maturity of each position, and then all the values are added together. |
The views and information discussed in this commentary are as of the date of publication, are subject to change, and may not reflect the writer’s current views. The views expressed represent an assessment of market conditions at a specific point in time, are opinions only and should not be relied upon as investment advice regarding a particular investment or markets in general. Such information does not constitute a recommendation to buy or sell specific securities or investment vehicles. It should not be assumed that any investment will be profitable or will equal the performance of the fund(s) or any securities or any sectors mentioned in this letter. The subject matter contained in this letter has been derived from several sources believed to be reliable and accurate at the time of compilation. Neither the Fund nor CoreCommodity Management, LLC accepts any liability for losses either direct or consequential caused by the use of this information.
Diversification cannot guarantee gain or prevent losses.
| 16 | October 31, 2014 |
ALPS | CoreCommodity Management CompleteCommodities® Strategy Fund | ||
| Performance Update | October 31, 2014 (Unaudited) |
Performance of $10,000 Initial Investment (as of October 31, 2014)
Comparison of change in value of a $10,000 investment (includes maximum sales charges of 5.50%)
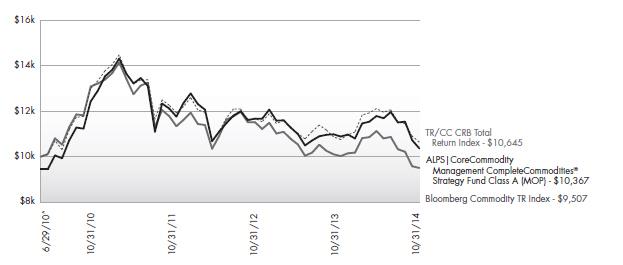
The chart above represents historical performance of a hypothetical investment of $10,000 in the Fund since inception. Past performance does not guarantee future results. This chart does not reflect the deduction of taxes that a shareholder would pay on Fund distributions or the redemption of Fund shares.
Average Annual Total Returns (as of October 31, 2014)
| 6 Month | 1 Year | 3 Year | Since Inception^ | Total Expense Ratio | What You Pay* | |||||||||||||||||||||||||||||||||||||
Class A (NAV) | -12.05% | -5.63% | -5.63% | 2.15% | 1.51% | 1.46% | ||||||||||||||||||||||||||||||||||||
Class A (MOP) | -16.87% | -10.82% | -7.40% | 0.83% | ||||||||||||||||||||||||||||||||||||||
Class C (NAV) | -12.32% | -6.19% | -6.23% | 1.57% | 2.11% | 2.06% | ||||||||||||||||||||||||||||||||||||
Class C (CDSC) | -13.20% | -7.13% | -6.23% | 1.57% | ||||||||||||||||||||||||||||||||||||||
Class I | -11.96% | -5.34% | -5.37% | 2.45% | 1.17% | 1.16% | ||||||||||||||||||||||||||||||||||||
TR/CC CRB Total Return Index1 | -12.13% | -2.08% | -5.21% | 1.45% | ||||||||||||||||||||||||||||||||||||||
Bloomberg Commodity TR Index1 | -14.55% | -5.94% | -7.59% | -1.16% | ||||||||||||||||||||||||||||||||||||||
Performance data quoted represents past performance. Past performance does not guarantee future results. Investment return and principal value of an investment will fluctuate so that an investor’s shares, when sold or redeemed, may be worth more or less than the original cost. Current performance data may be higher or lower than actual data quoted. For the most current month-end performance data, please call 1-866-759-5679.
Maximum Offering Price (MOP) for Class A shares includes the Fund’s maximum sales charge of 5.50%. Performance shown at NAV does not include these sales charges and would have been lower had it been taken into account. If you invest $1 million or more, either as a lump sum or through the Fund’s accumulation or letter of intent programs, you can purchase Class A shares without an initial sales charge (load). A Contingent Deferred Sales Charge (“CDSC”) of 1.00% may apply to Class C shares redeemed within the first 12 months after a purchase, and on Class A shares redeemed within the first 18 months after a purchase in excess of $1 million. The Fund imposes a 2.00% redemption fee on shares held for less than 30 days.
Performance less than 1 year is cumulative.
| 17 | October 31, 2014 |
ALPS | CoreCommodity Management CompleteCommodities® Strategy Fund | ||
| Performance Update | October 31, 2014 (Unaudited) | |
Investments in securities of MLPs involve risks that differ from an investment in common stock. MLPs are controlled by their general partners, which generally have conflicts of interest and limited fiduciary duties to the MLP, which may permit the general partner to favor its own interests over the MLPs. The benefit you are expected to derive from the Fund’s investment in MLPs depends largely on the MLPs being treated as partnerships for federal income tax purposes. As a partnership, an MLP has no federal income tax liability at the entity level. Therefore, treatment of one or more MLPs as a corporation for federal income tax purposes could affect the Fund’s ability to meet its investment objective and would reduce the amount of cash available to pay or distribute to you. Legislative, judicial, or administrative changes and differing interpretations, possibly on a retroactive basis, could negatively impact the value of an investment in MLPs and therefore the value of your investment in the Fund.
| 1 | Thomson Reuters/CC CRB Total Return Index and the Bloomberg Commodity TR Index (formerly the Dow Jones-UBS Commodity Index) are unmanaged indices used as a measurement of change in commodity market conditions based on the performance of a basket of different commodities. Each index is composed of a different basket of commodities, a different weighting of the commodities in the basket, and a different re-balancing schedule. The indices are not actively managed and do not reflect any deduction for fees, expenses or taxes. An investor may not invest directly in an index. |
| ^ | Fund Inception date of June 29, 2010. |
| * | What You Pay reflects the Advisor’s decision to contractually limit expenses through August 31, 2015. Please see the prospectus for additional information. |
The table does not reflect the deduction of taxes that a shareholder would pay on Fund distributions or the redemption of Fund shares.
There is no guarantee that the Fund will continue to hold any one particular security or stay invested in any one particular company. The composition of the Fund’s top holdings is subject to change. Performance figures are historical and reflect the change in share price, reinvested distributions, changes in net asset value, sales charges and capital gains distributions, if any.
Not FDIC Insured – No Bank Guarantee – May Lose Value
This Fund is not suitable for all investors, and is subject to investment risks, including possible loss of the principal amount invested.
Investing in commodity-related securities involves risk and considerations not present when investing in more conventional securities. The Fund may be more susceptible to high volatility of commodity markets.
Derivatives generally are more sensitive to changes in economic or market conditions than other types of investments; this could result in losses that significantly exceed the Fund’s original investment.
Asset Type Allocation (as a % of Net Assets) †
Government Bonds | 48.34 | % | ||
Common Stocks | 33.17 | % | ||
Commodity-Linked Notes | 1.04 | % | ||
Master Limited Partnerships | 0.36 | % | ||
Purchased Options | 0.16 | % | ||
Short Term Investments and Other Assets | 16.93 | % | ||
Total | 100.00 | % |
| † | Holdings are subject to change. Table presents approximate values only. |
| 18 | October 31, 2014 |
ALPS | CoreCommodity Management CompleteCommodities® Strategy Fund | ||
| Consolidated Statement of Investments | October 31, 2014 | |
| Shares | Value (Note 2) | |||||||
| ||||||||
COMMON STOCKS (33.17%) | ||||||||
Argentina (0.21%) | ||||||||
YPF SA, Sponsored ADR | 27,285 | $ | 959,613 | |||||
|
| |||||||
Australia (0.85%) | ||||||||
BHP Billiton, Ltd. | 26,697 | 797,837 | ||||||
Caltex Australia, Ltd. | 14,292 | 390,390 | ||||||
Fortescue Metals Group, Ltd. | 31,313 | 96,444 | ||||||
GrainCorp, Ltd., Class A | 41,007 | 316,116 | ||||||
Iluka Resources, Ltd. | 60,429 | 382,879 | ||||||
Incitec Pivot, Ltd. | 188,051 | 481,563 | ||||||
Newcrest Mining, Ltd.(a) | 11,624 | 95,336 | ||||||
Nufarm, Ltd. | 36,328 | 158,245 | ||||||
Orica, Ltd. | 34,452 | 624,548 | ||||||
Regis Resources, Ltd. | 104,820 | 127,294 | ||||||
Woodside Petroleum, Ltd. | 9,366 | 330,756 | ||||||
|
| |||||||
| 3,801,408 | ||||||||
|
| |||||||
Austria (0.14%) | ||||||||
OMV AG | 10,960 | 344,530 | ||||||
Voestalpine AG | 7,476 | 299,372 | ||||||
|
| |||||||
| 643,902 | ||||||||
|
| |||||||
Bermuda (0.07%) | ||||||||
Nabors Industries, Ltd. | 11,916 | 212,701 | ||||||
Seadrill, Ltd. | 4,179 | 96,117 | ||||||
|
| |||||||
| 308,818 | ||||||||
|
| |||||||
Brazil (0.42%) | ||||||||
Cia de Saneamento Basico do Estado de Sao Paulo, Sponsored ADR | 77,481 | 601,252 | ||||||
Cia Siderurgica Nacional SA, Sponsored ADR | 1,580 | 5,182 | ||||||
Gerdau SA, Sponsored ADR | 75,015 | 339,818 | ||||||
Petroleo Brasileiro SA, Sponsored ADR | 25,208 | 294,934 | ||||||
Vale SA, Sponsored ADR | 62,030 | 625,883 | ||||||
|
| |||||||
| 1,867,069 | ||||||||
|
| |||||||
Canada (4.26%) | ||||||||
Agnico-Eagle Mines, Ltd. | 15,765 | 370,888 | ||||||
Agrium, Inc. | 6,144 | 601,006 | ||||||
Alamos Gold, Inc. | 39,700 | 296,240 | ||||||
ARC Resources, Ltd. | 6,787 | 160,063 | ||||||
Argonaut Gold, Inc.(a) | 48,675 | 103,651 | ||||||
AuRico Gold, Inc. | 120,230 | 385,938 | ||||||
B2Gold Corp.(a) | 101,500 | 169,309 | ||||||
Barrick Gold Corp. | 119,484 | 1,418,275 | ||||||
Cameco Corp. | 5,892 | 102,403 | ||||||
Canadian Natural Resources, Ltd. | 5,741 | 200,246 | ||||||
Canadian Oil Sands, Ltd. | 75,851 | 1,188,526 | ||||||
Cenovus Energy, Inc. | 31,700 | 784,449 | ||||||
Centerra Gold, Inc. | 50,100 | 195,590 | ||||||
Crescent Point Energy Corp. | 8,378 | 276,900 | ||||||
Detour Gold Corp.(a) | 37,187 | 217,767 | ||||||
| Shares | Value (Note 2) | |||||||
| ||||||||
Canada (continued) | ||||||||
Eldorado Gold Corp. | 122,462 | $ | 671,092 | |||||
Encana Corp. | 60,213 | 1,121,768 | ||||||
Endeavour Silver Corp.(a) | 62,490 | 189,970 | ||||||
First Quantum Minerals, Ltd. | 8,647 | 130,428 | ||||||
Franco-Nevada Corp. | 12,538 | 586,151 | ||||||
Goldcorp, Inc. | 14,581 | 273,831 | ||||||
Husky Energy, Inc. | 10,586 | 255,574 | ||||||
IAMGOLD Corp.(a) | 76,143 | 143,910 | ||||||
Imperial Oil, Ltd. | 18,800 | 904,595 | ||||||
Kinross Gold Corp.(a) | 156,515 | 336,507 | ||||||
Maple Leaf Foods, Inc. | 10,500 | 181,669 | ||||||
New Gold, Inc.(a) | 110,990 | 399,564 | ||||||
Osisko Gold Royalties, Ltd.(a) | 8,569 | 107,051 | ||||||
Pacific Rubiales Energy Corp. | 41,500 | 625,970 | ||||||
Pan American Silver Corp. | 82,711 | 763,423 | ||||||
Peyto Exploration & Development Corp. | 13,600 | 383,848 | ||||||
Potash Corp. of Saskatchewan, Inc. | 24,356 | 832,245 | ||||||
SEMAFO, Inc.(a) | 64,900 | 158,356 | ||||||
Silver Standard Resources, Inc.(a) | 68,096 | 297,580 | ||||||
Silver Wheaton Corp. | 47,239 | 820,541 | ||||||
SunCoke Energy, Inc.(a) | 16,171 | 386,487 | ||||||
Suncor Energy, Inc. | 39,748 | 1,411,778 | ||||||
Teck Resources, Ltd., Class B | 31,426 | 496,291 | ||||||
TransCanada Corp. | 7,142 | 352,015 | ||||||
Turquoise Hill Resources, Ltd.(a) | 109,666 | 367,381 | ||||||
Yamana Gold, Inc. | 88,119 | 350,801 | ||||||
|
| |||||||
| 19,020,077 | ||||||||
|
| |||||||
Chile (0.67%) | ||||||||
Sociedad Quimica y Minera de Chile SA, Sponsored ADR | 126,457 | 3,000,825 | ||||||
|
| |||||||
China (0.49%) | ||||||||
China Petroleum & Chemical Corp.,Class H | 400,358 | 346,919 | ||||||
China Shenhua Energy Co., Ltd., Class H | 95,369 | 268,700 | ||||||
CNOOC, Ltd. | 250,001 | 392,644 | ||||||
Jiangxi Copper Co., Ltd., Class H | 50,082 | 88,990 | ||||||
PetroChina Co., Ltd., ADR | 4,087 | 512,918 | ||||||
PetroChina Co., Ltd., Class H | 330,045 | 413,240 | ||||||
Zijin Mining Group Co., Ltd., Class H | 560,331 | 143,783 | ||||||
|
| |||||||
| 2,167,194 | ||||||||
|
| |||||||
Colombia (0.18%) | ||||||||
Ecopetrol SA, Sponsored ADR | 29,551 | 791,967 | ||||||
|
| |||||||
Denmark (0.06%) | ||||||||
FLSmidth & Co. A/S | 6,011 | 272,238 | ||||||
|
| |||||||
Finland (0.17%) | ||||||||
Kemira OYJ | 10,739 | 138,613 | ||||||
Neste Oil OYJ | 19,790 | 427,797 | ||||||
| 19 | October 31, 2014 |
ALPS | CoreCommodity Management CompleteCommodities® Strategy Fund | ||
| Consolidated Statement of Investments | October 31, 2014 | |
| Shares | Value (Note 2) | |||||||
| ||||||||
Finland (continued) | ||||||||
Outotec OYJ | 30,692 | $ | 202,885 | |||||
|
| |||||||
| 769,295 | ||||||||
|
| |||||||
France (0.40%) | ||||||||
Total SA | 7,874 | 467,907 | ||||||
Total SA, Sponsored ADR | 21,707 | 1,300,032 | ||||||
|
| |||||||
| 1,767,939 | ||||||||
|
| |||||||
Germany (0.78%) | ||||||||
Aurubis AG | 6,206 | 323,447 | ||||||
K+S AG | 93,826 | 2,617,872 | ||||||
Salzgitter AG | 7,919 | 238,268 | ||||||
ThyssenKrupp AG | 11,855 | 284,865 | ||||||
|
| |||||||
| 3,464,452 | ||||||||
|
| |||||||
India (0.10%) | ||||||||
Reliance Industries, Ltd., Sponsored GDR(b) | 8,852 | 286,805 | ||||||
Sesa Sterlite, Ltd., ADR | 9,014 | 151,796 | ||||||
|
| |||||||
| 438,601 | ||||||||
|
| |||||||
Israel (0.17%) | ||||||||
Israel Chemicals, Ltd. | 55,718 | 374,293 | ||||||
The Israel Corp., Ltd.(a) | 785 | 384,191 | ||||||
|
| |||||||
| 758,484 | ||||||||
|
| |||||||
Italy (0.16%) | ||||||||
Eni SpA, Sponsored ADR | 16,393 | 696,703 | ||||||
|
| |||||||
Japan (0.92%) | ||||||||
Hitachi Metals, Ltd. | 26,000 | 427,759 | ||||||
Inpex Corp. | 106,133 | 1,325,659 | ||||||
Iseki & Co., Ltd. | 20,907 | 47,277 | ||||||
JFE Holdings, Inc. | 11,500 | 222,782 | ||||||
Kubota Corp. | 18,000 | 278,433 | ||||||
Kurita Water Industries, Ltd. | 10,616 | 227,867 | ||||||
Maruichi Steel Tube, Ltd. | 6,900 | 160,944 | ||||||
Nihon Nohyaku Co., Ltd. | 16,100 | 159,817 | ||||||
Nihon Trim Co., Ltd. | 4,101 | 89,194 | ||||||
Nippon Steel & Sumitomo Metal Corp. | 20,342 | 52,519 | ||||||
Nisshin Steel Co., Ltd. | 23,900 | 215,754 | ||||||
Sumitomo Forestry Co., Ltd. | 15,159 | 156,145 | ||||||
Sumitomo Metal Mining Co.,Ltd. | 16,000 | 215,660 | ||||||
TonenGeneral Sekiyu KK | 36,000 | 311,845 | ||||||
Yamato Kogyo Co., Ltd. | 6,700 | 212,945 | ||||||
|
| |||||||
| 4,104,600 | ||||||||
|
| |||||||
Jersey (0.04%) | ||||||||
Randgold Resources, Ltd., ADR | 2,744 | 159,728 | ||||||
|
| |||||||
Luxembourg (0.25%) | ||||||||
APERAM(a) | 13,273 | 381,313 | ||||||
ArcelorMittal | 20,626 | 271,438 | ||||||
Subsea 7 SA | 29,473 | 317,454 | ||||||
| Shares | Value (Note 2) | |||||||
| ||||||||
Luxembourg (continued) | ||||||||
Tenaris SA, ADR | 4,150 | $ | 164,506 | |||||
|
| |||||||
| 1,134,711 | ||||||||
|
| |||||||
Mexico (0.26%) | ||||||||
Grupo Mexico SAB de CV, Series B | 288,283 | 992,252 | ||||||
Industrias Penoles SAB de CV | 6,927 | 156,891 | ||||||
|
| |||||||
| 1,149,143 | ||||||||
|
| |||||||
Netherlands (0.21%) | ||||||||
Nutreco N.V. | 12,688 | 635,283 | ||||||
Royal Dutch Shell PLC, Class A, Sponsored ADR | 4,503 | 323,270 | ||||||
|
| |||||||
| 958,553 | ||||||||
|
| |||||||
Norway (0.79%) | ||||||||
Marine Harvest ASA | 4,429 | 62,709 | ||||||
Norsk Hydro ASA | 26,688 | 149,327 | ||||||
Statoil ASA | 48,474 | 1,099,567 | ||||||
Yara International ASA | 48,557 | 2,229,535 | ||||||
|
| |||||||
| 3,541,138 | ||||||||
|
| |||||||
Peru (0.11%) | ||||||||
Cia de Minas Buenaventura SAA, ADR | 52,039 | 478,759 | ||||||
|
| |||||||
Singapore (0.35%) | ||||||||
Golden Agri-Resources, Ltd. | 893,758 | 361,761 | ||||||
Olam International, Ltd. | 331,254 | 549,211 | ||||||
Wilmar International, Ltd. | 257,061 | 640,301 | ||||||
|
| |||||||
| 1,551,273 | ||||||||
|
| |||||||
South Africa (0.56%) | ||||||||
Anglo Platinum, Ltd.(a) | 5,831 | 183,953 | ||||||
AngloGold Ashanti, Ltd., Sponsored ADR(a) | 74,874 | 619,208 | ||||||
Gold Fields, Ltd., Sponsored ADR | 229,217 | 731,202 | ||||||
Harmony Gold Mining Co., Ltd., Sponsored ADR(a) | 122,681 | 198,743 | ||||||
Impala Platinum Holdings, Ltd.(a) | 39,295 | 286,044 | ||||||
Kumba Iron Ore, Ltd. | 1,186 | 29,619 | ||||||
Sasol, Ltd. | 7,492 | 373,039 | ||||||
Sibanye Gold, Ltd., Sponsored ADR | 8,280 | 60,858 | ||||||
|
| |||||||
| 2,482,666 | ||||||||
|
| |||||||
South Korea (0.11%) | ||||||||
POSCO, Sponsored ADR | 6,977 | 499,274 | ||||||
|
| |||||||
Spain (0.03%) | ||||||||
Acerinox SA | 10,270 | 152,314 | ||||||
|
| |||||||
Sweden (0.28%) | ||||||||
Holmen AB, B Shares | 11,000 | 363,481 | ||||||
Lundin Petroleum AB(a) | 16,470 | 233,529 | ||||||
SSAB AB, A Shares(a) | 41,117 | 298,181 | ||||||
| 20 | October 31, 2014 |
ALPS | CoreCommodity Management
CompleteCommodities® Strategy Fund | ||
Consolidated Statement of Investments | October 31, 2014 |
| Shares | Value (Note 2) | |||||||
Sweden (continued) | ||||||||
Svenska Cellulosa AB SCA, B | ||||||||
Shares | 16,465 | $ | 368,136 | |||||
|
| |||||||
| 1,263,327 | ||||||||
|
| |||||||
Switzerland (0.48%) | ||||||||
Glencore PLC | 28,003 | 143,303 | ||||||
Noble Corp. PLC | 9,174 | 191,920 | ||||||
Syngenta AG | 3,828 | 1,184,824 | ||||||
Transocean, Ltd. | 8,890 | 265,189 | ||||||
Weatherford International, Ltd.(a) | 20,498 | 336,577 | ||||||
|
| |||||||
| 2,121,813 | ||||||||
|
| |||||||
United Kingdom (0.77%) | ||||||||
Anglo American PLC | 6,469 | 136,237 | ||||||
Antofagasta PLC | 13,306 | 149,531 | ||||||
BG Group PLC | 23,065 | 383,728 | ||||||
BHP Billiton PLC, ADR | 4,881 | 254,007 | ||||||
BP PLC, Sponsored ADR | 21,309 | 926,089 | ||||||
CNH Industrial N.V. | 36,636 | 298,583 | ||||||
Fresnillo PLC | 14,550 | 162,347 | ||||||
Kazakhmys PLC(a) | 11,431 | 42,095 | ||||||
Lonmin PLC(a) | 32,588 | 91,020 | ||||||
Petropavlovsk PLC(a) | 10,690 | 3,677 | ||||||
Rio Tinto PLC, Sponsored ADR | 9,441 | 452,885 | ||||||
Severn Trent PLC | 9,330 | 297,906 | ||||||
United Utilities Group PLC | 16,752 | 228,989 | ||||||
|
| |||||||
| 3,427,094 | ||||||||
|
| |||||||
United States (18.88%) | ||||||||
AGCO Corp. | 108,346 | 4,800,811 | ||||||
Alcoa, Inc. | 15,849 | 265,629 | ||||||
Allegheny Technologies, Inc. | 5,767 | 189,446 | ||||||
Allied Nevada Gold Corp.(a) | 95,099 | 132,188 | ||||||
American States Water Co. | 3,691 | 132,064 | ||||||
American Vanguard Corp. | 9,167 | 105,787 | ||||||
American Water Works Co., Inc. | 3,695 | 197,202 | ||||||
Anadarko Petroleum Corp. | 8,727 | 800,964 | ||||||
The Andersons, Inc. | 7,675 | 489,128 | ||||||
Apache Corp. | 7,118 | 549,510 | ||||||
Aqua America, Inc. | 19,834 | 519,651 | ||||||
Archer-Daniels-Midland Co. | 14,930 | 701,710 | ||||||
Baker Hughes, Inc. | 10,613 | 562,064 | ||||||
Bunge, Ltd. | 9,138 | 810,084 | ||||||
Calgon Carbon Corp.(a) | 5,034 | 105,865 | ||||||
California Water Service Group | 7,154 | 186,219 | ||||||
Cameron International Corp.(a) | 19,673 | 1,171,527 | ||||||
Carpenter Technology Corp. | 5,307 | 265,615 | ||||||
Century Aluminum Co.(a) | 20,809 | 609,288 | ||||||
CF Industries Holdings, Inc. | 26,298 | 6,837,480 | ||||||
Chesapeake Energy Corp. | 17,429 | 386,575 | ||||||
Chevron Corp. | 25,051 | 3,004,867 | ||||||
Chiquita Brands International, Inc.(a) | 13,695 | 197,619 | ||||||
Civeo Corp. | 14,255 | 173,768 | ||||||
Cliffs Natural Resources, Inc. | 7,741 | 86,931 | ||||||
| Shares | Value (Note 2) | |||||||
United States (continued) | ||||||||
Coeur Mining, Inc.(a) | 33,267 | $ | 123,088 | |||||
Commercial Metals Co. | 16,778 | 290,092 | ||||||
ConocoPhillips | 21,492 | 1,550,648 | ||||||
Continental Resources, Inc.(a) | 9,974 | 562,234 | ||||||
CST Brands, Inc. | 2,472 | 94,554 | ||||||
Darling Ingredients, Inc.(a) | 11,542 | 203,139 | ||||||
Deere & Co. | 8,346 | 713,917 | ||||||
Devon Energy Corp. | 19,140 | 1,148,400 | ||||||
Diamond Offshore Drilling, Inc. | 3,190 | 120,295 | ||||||
Energen Corp. | 4,854 | 328,616 | ||||||
Ensco PLC, Class A | 9,480 | 384,793 | ||||||
EOG Resources, Inc. | 7,714 | 733,216 | ||||||
EP Energy Corp., Class A(a) | 16,040 | 234,184 | ||||||
EQT Corp. | 5,525 | 519,571 | ||||||
Exxon Mobil Corp. | 25,385 | 2,454,983 | ||||||
First Majestic Silver Corp.(a) | 40,390 | 207,201 | ||||||
FMC Corp. | 23,643 | 1,355,926 | ||||||
FMC Technologies, Inc.(a) | 6,853 | 384,042 | ||||||
Freeport-McMoRan, Inc. | 6,163 | 175,646 | ||||||
Halliburton Co. | 14,488 | 798,868 | ||||||
Harsco Corp. | 13,921 | 301,807 | ||||||
Hecla Mining Co. | 78,046 | 170,140 | ||||||
Helmerich & Payne, Inc. | 9,400 | 816,108 | ||||||
Hess Corp. | 15,458 | 1,310,993 | ||||||
HollyFrontier Corp. | 28,340 | 1,286,069 | ||||||
Hormel Foods Corp. | 61,869 | 3,335,358 | ||||||
Ingredion, Inc. | 16,981 | 1,311,782 | ||||||
Intrepid Potash, Inc.(a) | 38,590 | 519,036 | ||||||
Joy Global, Inc. | 18,799 | 989,391 | ||||||
Kinder Morgan, Inc. | 11,056 | 427,867 | ||||||
Lindsay Corp. | 4,274 | 374,830 | ||||||
Marathon Oil Corp. | 56,984 | 2,017,234 | ||||||
Marathon Petroleum Corp. | 20,829 | 1,893,356 | ||||||
McEwen Mining, Inc.(a) | 98,280 | 121,867 | ||||||
Monsanto Co. | 52,592 | 6,050,184 | ||||||
The Mosaic Co. | 56,938 | 2,522,923 | ||||||
Murphy Oil Corp. | 19,277 | 1,029,199 | ||||||
National Oilwell Varco, Inc. | 4,787 | 347,728 | ||||||
Newfield Exploration Co.(a) | 8,554 | 278,946 | ||||||
Newmont Mining Corp. | 13,992 | 262,490 | ||||||
Noble Energy, Inc. | 4,222 | 243,314 | ||||||
NOW, Inc.(a) | 1,643 | 49,389 | ||||||
Nucor Corp. | 4,675 | 252,731 | ||||||
Occidental Petroleum Corp. | 13,899 | 1,236,038 | ||||||
Oceaneering International, Inc. | 28,111 | 1,975,360 | ||||||
Oil States International, Inc.(a) | 23,508 | 1,404,368 | ||||||
Paragon Offshore PLC | 3,058 | 14,892 | ||||||
Peabody Energy Corp. | 7,370 | 76,869 | ||||||
Phillips 66 | 19,781 | 1,552,809 | ||||||
Pilgrim’s Pride Corp.(a) | 15,869 | 450,838 | ||||||
Pioneer Natural Resources Co. | 2,078 | 392,867 | ||||||
Plum Creek Timber Co., Inc. REIT | 6,200 | 254,262 | ||||||
Potash Corp. REIT | 7,200 | 316,728 | ||||||
Rayonier Advanced Materials, Inc. | 6,683 | 190,666 | ||||||
Rayonier, Inc. REIT | 33,134 | 1,108,995 | ||||||
Reliance Steel & Aluminum Co. | 7,703 | 519,798 | ||||||
| 21 | October 31, 2014 |
ALPS | CoreCommodity Management
| CompleteCommodities® Strategy Fund | ||
| Consolidated Statement of Investments | October 31, 2014 |
| Shares | Value (Note 2) | |||||||
United States (continued) | ||||||||
Royal Gold, Inc. | 9,863 | $ | 563,670 | |||||
Sanderson Farms, Inc. | 4,276 | 359,098 | ||||||
Schlumberger, Ltd. | 10,293 | 1,015,507 | ||||||
Seventy Seven Energy, Inc.(a) | 592 | 7,737 | ||||||
SM Energy Co. | 11,797 | 664,171 | ||||||
Southern Copper Corp. | 40,191 | 1,156,697 | ||||||
Southwestern Energy Co.(a) | 7,599 | 247,043 | ||||||
Spectra Energy Corp. | 5,869 | 229,654 | ||||||
Stillwater Mining Co.(a) | 18,679 | 245,255 | ||||||
Superior Energy Services, Inc. | 10,901 | 274,160 | ||||||
Tesoro Corp. | 13,886 | 991,599 | ||||||
Tyson Foods, Inc., Class A | 62,859 | 2,536,361 | ||||||
Valero Energy Corp. | 39,829 | 1,995,035 | ||||||
Walter Energy, Inc. | 68,768 | 165,731 | ||||||
Weyerhaeuser Co. REIT | 54,151 | 1,833,553 | ||||||
Whiting Petroleum Corp.(a) | 2,199 | 134,667 | ||||||
The Williams Co., Inc. | 7,776 | 431,646 | ||||||
Worthington Industries, Inc. | 7,978 | 308,350 | ||||||
|
| |||||||
| 84,232,571 | ||||||||
|
| |||||||
TOTAL COMMON STOCKS | 147,985,549 | |||||||
|
| |||||||
MASTER LIMITED PARTNERSHIPS (0.36%) | ||||||||
United States (0.36%) | ||||||||
Buckeye Partners LP | 977 | 73,666 | ||||||
CVR Partners LP | 7,942 | 96,734 | ||||||
Energy Transfer Partners LP | 2,591 | 166,938 | ||||||
Enterprise Products Partners LP | 10,676 | 393,944 | ||||||
Kinder Morgan Energy Partners LP | 2,628 | 246,506 | ||||||
Magellan Midstream Partners LP | 2,054 | 168,161 | ||||||
MarkWest Energy Partners LP | 1,427 | 99,961 | ||||||
Plains All American Pipeline LP | 3,090 | 174,121 | ||||||
Rentech Nitrogen Partners LP | 7,631 | 92,717 | ||||||
Williams Partners LP | 1,434 | 73,923 | ||||||
|
| |||||||
| 1,586,671 | ||||||||
|
| |||||||
TOTAL MASTER LIMITED PARTNERSHIPS | 1,586,671 | |||||||
|
| |||||||
| Principal Amount | Value (Note 2) | |||||||
COMMODITY-LINKED NOTES (1.04%) |
| |||||||
Bank of America Corp., Commodity-Linked Note Linked to the Merrill Lynch Commodity Index eXtra J-Series F3 Total Return Index, 0.000%, 1/9/15(c) | $ | 4,900,000 | $ | 4,634,704 | ||||
|
| |||||||
TOTAL COMMODITY-LINKED NOTES | 4,634,704 | |||||||
|
| |||||||
GOVERNMENT BONDS (48.34%) | ||||||||
U.S. Treasury Bonds (48.34%) | ||||||||
United States Treasury Inflation Indexed Bonds |
| |||||||
1.625%, 1/15/15(d) | 13,983,207 | 13,967,909 | ||||||
0.500%, 4/15/15(d) | 11,991,389 | 11,969,841 | ||||||
1.875%, 7/15/15 | 8,865,953 | 9,031,498 | ||||||
2.000%, 1/15/16 | 21,272,488 | 21,970,480 | ||||||
0.125%, 4/15/16(d) | 100,758,405 | 101,907,655 | ||||||
2.500%, 7/15/16 | 2,178,986 | 2,309,215 | ||||||
2.375%, 1/15/17(d) | 10,320,713 | 11,024,616 | ||||||
0.125%, 4/15/17(d) | 15,185,270 | 15,423,724 | ||||||
2.625%, 7/15/17(d) | 14,632,920 | 15,963,608 | ||||||
1.625%, 1/15/18 | 11,354,100 | 12,092,117 | ||||||
|
| |||||||
| 215,660,663 | ||||||||
|
| |||||||
TOTAL GOVERNMENT BONDS | 215,660,663 | |||||||
|
| |||||||
Expiration Date | Exercise Price | Number of Contracts | Value | |||||||||||||
PURCHASED OPTIONS (0.16%) |
| |||||||||||||||
Purchased Call Options (0.07%) |
| |||||||||||||||
Gold 100 Oz. Future: |
| |||||||||||||||
| 12/24/14 | $ | 1,350.00 | 20 | $ | 3,200 | |||||||||||
|
| |||||||||||||||
WTI Crude Future: |
| |||||||||||||||
| 11/17/15 | 100.00 | 225 | 310,500 | |||||||||||||
|
| |||||||||||||||
Total Purchased Call Options |
| 313,700 | ||||||||||||||
|
| |||||||||||||||
Purchased Put Options (0.09%) |
| |||||||||||||||
SPDR® S&P 500® ETF Trust: |
| |||||||||||||||
| 3/20/15 | 175.00 | 475 | 89,775 | |||||||||||||
| 6/19/15 | 185.00 | 300 | 166,500 | |||||||||||||
|
| |||||||||||||||
| 256,275 | ||||||||||||||||
|
| |||||||||||||||
| 22 | October 31, 2014 |
ALPS | CoreCommodity Management
| CompleteCommodities® Strategy Fund | ||
| Consolidated Statement of Investments | October 31, 2014 |
Expiration Date | Exercise Price | Number of Contracts | Value | |||||||||||||
Put (continued) |
| |||||||||||||||
Corn Future: | ||||||||||||||||
| 4/24/15 | $ | 350.00 | 370 | $ | 152,625 | |||||||||||
|
| |||||||||||||||
Total Purchased Put Options |
| 408,900 | ||||||||||||||
|
| |||||||||||||||
TOTAL PURCHASED OPTIONS |
| 722,600 | ||||||||||||||
|
| |||||||||||||||
| 7-Day Yield | Shares | Value (Note 2) | ||||||||||||||
SHORT TERM INVESTMENTS (12.62%) |
| |||||||||||||||
Money Market Fund (12.62%) |
| |||||||||||||||
Dreyfus Treasury Prime Cash Management Fund, Institutional Shares |
| 0.00011 | % | 56,311,780 | $ | 56,311,780 | ||||||||||
|
| |||||||||||||||
TOTAL SHORT TERM INVESTMENTS |
| 56,311,780 | ||||||||||||||
|
| |||||||||||||||
TOTAL INVESTMENTS (95.69%) |
| $ | 426,901,967 | |||||||||||||
Other Assets In Excess Of Liabilities (4.31%)(e) |
| 19,221,007 | ||||||||||||||
NET ASSETS - 100.00% |
| $ | 446,122,974 | |||||||||||||
| (a) | Non-Income Producing Security. |
| (b) | Security exempt from registration under rule 144A of the securities act of 1933. This security may be resold in transactions exempt from registration, normally to qualified institutional buyers. As of October 31, 2014, the market value of those securities was $286,805, representing 0.06% of the Fund’s net assets. |
| (c) | Floating or variable rate security. Interest rate disclosed is that which is in effect at October 31, 2014 |
| (d) | Security, or portion of security, is being held as collateral for total return swap contracts, futures contracts and written options aggregating a total market value of $61,812,044. |
| (e) | Includes cash which is being held as collateral for total return swap contracts, future contracts and written options in the amount of $27,881,772. |
Common Abbreviations:
| A/S | - Aktieselskab is the Danish equivalent for the term Stock Company. |
| AB | - Aktiebolag is the Swedish equivalent of the term corporation. |
| ADR | - American Depositary Receipt. |
| AG | - Aktiengesellschaft is a German term that refers to a corporation that is limited by shares, i.e., owned by shareholders. |
| ASA | - Allmennaksjeselskap is the Norwegian term for public limited company. |
| ETF | - Exchange Traded Fund. |
| GDR | - Global Depositary Receipt. |
| KK | - Kabushiki Kaisha is the Japanese equivalent for the term Stock Company. |
| Ltd. | - Limited. |
| LP | - Limited Partnership. |
| N.V. | - Naamloze vennootschap is the Dutch term for a public limited liability corporation. |
| OYJ | - Osakeyhtio is the Finnish equivalent of a public limited company. |
| PLC | - Public Limited Co. |
| REIT | - Real Estate Investment Trust. |
| SA | - Generally designated corporations in various countries, mostly those employing the civil law. |
| SAA | - Sociedad Anonima Abierta is the Peruvian term used for companies with 20 or more shareholders. |
| SAB | de CV - A variable capital company. |
| SCA | - Societe en commandite pe actiuni is the Romanian term for limited liability partnership. |
| SpA | - Societa per Azione. |
| SPDR | - Standard & Poor’s Depository Receipt. |
| S&P | - Standard & Poor’s. |
For Fund compliance purposes, the Fund’s industry and geographical classifications refer to any one or more of the industry sub-classifications used by one or more widely recognized market indexes or ratings group indexes, and/or as defined by Fund management. This definition may not apply for purposes of this report, which may combine sub-classifications for reporting ease. Industries and regions are shown as a percent of net assets.
See Notes to Financial Statements.
23 | October 31, 2014 |
ALPS | CoreCommodity Management CompleteCommodities® Strategy Fund | ||
| Consolidated Statement of Investments | October 31, 2014 |
SCHEDULE OF WRITTEN OPTIONS | Expiration Date | Exercise Price | Contracts | Value | ||||||||||
Written Call Options | ||||||||||||||
CF Industries Holdings, Inc. | 11/22/14 | $ | 245.00 | (8) | $ | (13,460) | ||||||||
|
| |||||||||||||
TOTAL WRITTEN CALL OPTIONS | ||||||||||||||
(Premiums received $9,999) | (13,460) | |||||||||||||
|
| |||||||||||||
Written Put Options | ||||||||||||||
Corn Future | 4/24/15 | 390.00 | (368) | (409,400) | ||||||||||
Crude Oil Future | 11/17/15 | 70.00 | (100) | (321,000) | ||||||||||
Gold 100 Oz. Future | 12/23/14 | 1,195.00 | (15) | (65,250) | ||||||||||
Silver Future: | ||||||||||||||
| 11/24/14 | 16.00 | (5) | (11,850) | |||||||||||
| 11/24/14 | 16.25 | (40) | (118,000) | |||||||||||
|
| |||||||||||||
TOTAL WRITTEN PUT OPTIONS | ||||||||||||||
(Premiums received $1,176,482) | (925,500) | |||||||||||||
|
| |||||||||||||
TOTAL WRITTEN OPTIONS | ||||||||||||||
(Premiums received $1,186,481) | $ | (938,960) | ||||||||||||
|
| |||||||||||||
FUTURES CONTRACTS | ||||||||||||||
| Description | Position | Contracts | Expiration Date | Value (Note 2) | Unrealized Appreciation | |||||||||
Copper Future | Short | (25) | 12/30/14 | $ | (1,904,375) | $ | 65,509 | |||||||
Copper Future | Short | (29) | 3/30/15 | (2,203,275) | 82,514 | |||||||||
Corn Future | Long | 42 | 5/15/15 | 835,800 | 46,946 | |||||||||
NY Harbor ULSD Future | Long | 8 | 12/01/14 | 843,662 | 10,248 | |||||||||
WTI LS Crude Future | Short | (187) | 11/20/14 | (15,060,980) | 691,255 | |||||||||
|
| |||||||||||||
| $ | (17,489,168) | $ | 896,472 | |||||||||||
|
| |||||||||||||
| Description | Position | Contracts | Expiration Date | Value (Note 2) | Unrealized Depreciation | |||||||||
Brent Crude Future | Long | 170 | 11/14/14 | $ | 14,596,200 | $ | (976,090) | |||||||
E-mini S&P 500® Future | Short | (115) | 12/22/14 | (11,565,550) | (113,151) | |||||||||
Gold 100 Oz. Future | Long | 72 | 12/30/14 | 8,435,520 | (903,933) | |||||||||
WTI Crude Future | Long | 10 | 11/21/14 | 805,400 | (60,721) | |||||||||
|
| |||||||||||||
| $ | 12,271,570 | $ | (2,053,895) | |||||||||||
|
| |||||||||||||
See Notes to Financial Statements.
| 24 | October 31, 2014 |
ALPS | CoreCommodity Management CompleteCommodities® Strategy Fund | ||
| Consolidated Statement of Investments | October 31, 2014 |
TOTAL RETURN SWAP CONTRACTS(a)
| Counterparty Reference | Obligation | Notional Amount | Amount Paid by Fund | Termination Date | Unrealized Appreciation | |||||||||||
Bank of America - Merrill Lynch | ML Aluminum GA6 | $ | 4,962,315 | USB3MTA* + 10 bps | 06/30/15 | $ | 138,760 | |||||||||
Bank of America - Merrill Lynch | ML eXtra Copper GA6 | 5,045,028 | USB3MTA* + 10 bps | 06/30/15 | 32,527 | |||||||||||
|
| |||||||||||||||
| $ | 171,287 | |||||||||||||||
|
| |||||||||||||||
| Counterparty Reference | Obligation | Notional Amount | Amount Received by Fund | Termination Date | Unrealized Appreciation | |||||||||||
Bank of America - Merrill Lynch | MLCS Coffee J-F3 | $ | (4,717,074 | ) | USB3MTA* | 06/30/15 | $ | 122,973 | ||||||||
Bank of America - Merrill Lynch | MLCS Silver J-F3 | (548,697 | ) | USB3MTA* | 06/30/15 | 29,968 | ||||||||||
|
| |||||||||||||||
| $ | 152,941 | |||||||||||||||
| Total Appreciation | $ | 324,228 | ||||||||||||||
|
| |||||||||||||||
| Counterparty Reference | Obligation | Notional Amount | Amount Paid by Fund | Termination Date | Unrealized Depreciation | |||||||
Bank of America - Merrill Lynch | CRB 3 Month Total Return Index** | $ 58,874,054 | USB3MTA* + 35 bps | 06/30/15 | $ | (1,305,306 | ) | |||||
Bank of America - Merrill Lynch | LME Copper Future | 4,160,400 | N/A | 06/30/15 | (89,100 | ) | ||||||
Bank of America - Merrill Lynch | ML eXtra Coffee GA6 | 4,741,371 | USB3MTA* + 10 bps | 06/30/15 | (90,385 | ) | ||||||
Bank of America - Merrill Lynch | ML eXtra Silver GA6 | 551,066 | USB3MTA* + 10 bps | 06/30/15 | (29,815 | ) | ||||||
Citigroup | CRB 3 Month Total Return Index** | 30,882,057 | USB3MTA* + 27 bps | 09/18/15 | (519,503 | ) | ||||||
Societe Generale | CRB 3 Month Total Return Index** | 133,419,485 | USB3MTA* + 35 bps | 11/28/14 | (2,958,063 | ) | ||||||
UBS | CRB3 Month Total Return Index** | 54,355,844 | USB3MTA* + 40 bps | 11/28/14 | (1,205,132 | ) | ||||||
|
| |||||||||||
| $ | (6,197,304 | ) | ||||||||||
|
| |||||||||||
| Counterparty Reference | Obligation | Notional Amount | Amount Received by Fund | Termination Date | Unrealized Depreciation | |||||||||||
Bank of America - Merrill Lynch | MLCS Copper J-F3 | $ | (5,026,083 | ) | USB3MTA* | 06/30/15 | $ | (44,282 | ) | |||||||
Bank of America - Merrill Lynch | MLCX Aluminum J-F3 | (4,888,725 | ) | USB3MTA* | 06/30/15 | (164,606 | ) | |||||||||
|
| |||||||||||||||
| $ | (208,888 | ) | ||||||||||||||
| Total Depreciation | $ | (6,406,192 | ) | |||||||||||||
|
| |||||||||||||||
| (a) | The Fund receives payments based on any positive return of the Reference Obligation less the rate paid by the Fund. The Fund makes payments on any negative return of such Reference Obligation plus the rate paid by the Fund. |
| * | United States Auction Results 3 Month Treasury Bill High Discount |
| ** | CRB - Commodity Research Bureau |
See Notes to Financial Statements.
| 25 | October 31, 2014 |
ALPS | CoreCommodity Management CompleteCommodities® Strategy Fund | ||
| Consolidated Statement of Assets and Liabilities | October 31, 2014 |
ASSETS | ||||
Investments, at value | $ | 426,901,967 | ||
Foreign currency, at value (Cost $3,527) | 3,527 | |||
Unrealized appreciation on total return swap contracts | 324,228 | |||
Receivable for shares sold | 1,652,758 | |||
Receivable for variation margin | 896,472 | |||
Cash collateral pledged for written options | 788,719 | |||
Cash collateral pledged for futures contracts | 23,881,810 | |||
Cash collateral pledged for total return swap contracts | 3,211,193 | |||
Receivable from broker for futures contracts | 3,276,275 | |||
Dividends and interest receivable | 747,811 | |||
Prepaid expenses and other assets | 36,784 | |||
Total Assets | 461,721,544 | |||
LIABILITIES | ||||
Written options, at value (premiums received $1,186,481) | 938,960 | |||
Payable for variation margin | 2,053,895 | |||
Payable due to broker for total return swap contracts | 316,191 | |||
Payable for shares redeemed | 714,579 | |||
Payable due to custodian - overdraft | 4,627,670 | |||
Unrealized depreciation on total return swap contracts | 6,406,192 | |||
Investment advisory fees payable | 296,357 | |||
Administration and transfer agency fees payable | 60,902 | |||
Distribution and services fees payable | 38,672 | |||
Trustees’ fees and expenses payable | 6,467 | |||
Professional fees payable | 45,539 | |||
Accrued expenses and other liabilities | 93,146 | |||
Total Liabilities | 15,598,570 | |||
NET ASSETS | $ | 446,122,974 | ||
NET ASSETS CONSIST OF | ||||
Paid-in capital | $ | 477,086,505 | ||
Accumulated net investment income | 1,837,073 | |||
Accumulated net realized loss on investments, written options, futures contracts, total return swap contracts and foreign currency transactions | (9,588,352) | |||
Net unrealized depreciation on investments, written options and futures contracts, total return swap contracts and translation of assets and liabilities denominated in foreign currencies | (23,212,252) | |||
NET ASSETS | $ | 446,122,974 | ||
INVESTMENTS, AT COST | $ | 443,116,435 |
See Notes to Financial Statements.
| 26 | October 31, 2014 |
ALPS | CoreCommodity Management CompleteCommodities® Strategy Fund | ||
| Consolidated Statement of Assets and Liabilities | October 31, 2014 |
PRICING OF SHARES | ||||
Class A: | ||||
Net Asset Value, offering and redemption price per share(a) | $ | 9.56 | ||
Net Assets | $ | 39,971,485 | ||
Shares of beneficial interest outstanding (unlimited number of shares, no par value common stock authorized) | 4,181,925 | |||
Maximum offering price per share ((NAV/0.9450), based on maximum sales charge of 5.50% of the offering price) | $ | 10.12 | ||
Class C: | ||||
Net Asset Value, offering and redemption price per share(a) | $ | 9.39 | ||
Net Assets | $ | 12,533,534 | ||
Shares of beneficial interest outstanding (unlimited number of shares, no par value common stock authorized) | 1,334,974 | |||
Class I: | ||||
Net Asset Value, offering and redemption price per share | $ | 9.57 | ||
Net Assets | $ | 393,617,955 | ||
Shares of beneficial interest outstanding (unlimited number of shares, no par value common stock authorized) | 41,126,203 |
| (a) | Redemption price per share may be reduced for any applicable contingent deferred sales charge. For a description of a possible sales charge, please see the Fund’s Prospectus. |
See Notes to Financial Statements.
| 27 | October 31, 2014 |
ALPS | CoreCommodity Management CompleteCommodities® Strategy Fund | ||
| Consolidated Statement of Operations |
| For the Fiscal Period Ended October 31, 2014(a) | For the Year Ended April 30, 2014 | |||||||
INVESTMENT INCOME | ||||||||
Dividends | $ | 1,849,757 | $ | 3,455,474 | ||||
Foreign taxes withheld on dividends | (134,673) | (243,705) | ||||||
Interest and other income, net of premium amortization and accretion of discount | 755,630 | (377,513) | ||||||
Total Investment Income | 2,470,714 | 2,834,256 | ||||||
EXPENSES | ||||||||
Investment advisory fees | 1,851,866 | 2,743,197 | ||||||
Administrative and transfer agency fees | 326,762 | 530,922 | ||||||
Distribution and service fees | ||||||||
Class A | 171,366 | 402,049 | ||||||
Class C | 68,258 | 171,101 | ||||||
Professional fees | 45,773 | 66,217 | ||||||
Networking fees | ||||||||
Class I | 128,096 | 125,535 | ||||||
Reports to shareholders and printing fees | 27,516 | 54,238 | ||||||
State registration fees | 30,784 | 61,840 | ||||||
SEC registration fees | 14,262 | 6,306 | ||||||
Insurance fees | 3,075 | 6,464 | ||||||
Custody fees | 28,665 | 56,388 | ||||||
Trustees’ fees and expenses | 7,573 | 14,590 | ||||||
Miscellaneous expenses | 10,417 | 22,599 | ||||||
Total Expenses | 2,714,413 | 4,261,446 | ||||||
Less fees waived/reimbursed by investment advisor (Note 8) | ||||||||
Class A | (5,093) | (55,147) | ||||||
Class C | (1,738) | (9,066) | ||||||
Class I | (11,487) | (30,311) | ||||||
Net Expenses | 2,696,095 | 4,166,922 | ||||||
Net Investment Loss | (225,381) | (1,332,666) | ||||||
Net realized loss on investments | (835,419) | (4,033,609) | ||||||
Net realized gain on written options | 557,104 | 240,680 | ||||||
Net realized gain/(loss) on futures contracts | 303,684 | (7,044,112) | ||||||
Net realized gain/(loss) on total return swap contracts | (21,272,562) | 6,067,345 | ||||||
Net realized loss on securities sold short | – | (8,487) | ||||||
Net realized gain on foreign currency transactions | 61,746 | 55,809 | ||||||
Net change in unrealized appreciation/(depreciation) on investments | (25,627,793) | 9,783,086 | ||||||
Net change in unrealized appreciation on written options | 182,393 | 65,128 | ||||||
Net change in unrealized appreciation/(depreciation) on futures contracts | (1,130,003) | 1,887,507 | ||||||
Net change in unrealized appreciation/(depreciation) on total return swap contracts | (10,250,858) | 9,186,316 | ||||||
Net change in unrealized depreciation on translation of assets and liabilities denominated in foreign currencies | (3,751) | (3,210) | ||||||
NET REALIZED AND UNREALIZED GAIN/(LOSS) ON INVESTMENTS | (58,015,459) | 16,196,453 | ||||||
NET INCREASE/(DECREASE) IN NET ASSETS RESULTING FROM OPERATIONS | $ | (58,240,840 | ) | $ | 14,863,787 | |||
| (a) | Effective May 1, 2014, the Board approved changing the fiscal year-end of the Funds from April 30 to October 31. |
See Notes to Financial Statements.
| 28 | October 31, 2014 |
ALPS | CoreCommodity Management CompleteCommodities® Strategy Fund | ||
| For the Fiscal Period Ended October 31, 2014(a) | For the Year April 30, 2014 | For the Year April 30, 2013 | ||||||||||
OPERATIONS | ||||||||||||
Net investment loss | $ | (225,381) | $ | (1,332,666) | $ | (498,594) | ||||||
Net realized loss on investments, written options, futures contracts, total return swap contracts and foreign currency transactions | (21,185,447) | (4,722,374) | (9,335,982) | |||||||||
Net change in unrealized appreciation/(depreciation) on investments, written options, futures contracts, total return swap contracts and translation of assets and liabilities denominated in foreign currencies | (36,830,012) | 20,918,827 | (4,642,501) | |||||||||
Net Increase/(Decrease) in Net Assets Resulting from Operations | (58,240,840) | 14,863,787 | (14,477,077) | |||||||||
DISTRIBUTIONS | ||||||||||||
Dividends to shareholders from tax return of capital | ||||||||||||
Class A | – | – | (532,988) | |||||||||
Class C | – | – | (84,918) | |||||||||
Class I | – | – | (699,604) | |||||||||
Net Decrease in Net Assets from Distributions | – | – | (1,317,510) | |||||||||
BENEFICIAL INTEREST TRANSACTIONS (NOTE 6) | ||||||||||||
Shares sold | ||||||||||||
Class A | 21,322,142 | 78,069,155 | 90,054,418 | |||||||||
Class C | 3,307,759 | 5,689,512 | 8,548,230 | |||||||||
Class I | 225,598,695 | 234,370,555 | 157,098,320 | |||||||||
Dividends reinvested | ||||||||||||
Class A | – | – | 395,824 | |||||||||
Class C | – | – | 51,810 | |||||||||
Class I | – | – | 542,393 | |||||||||
Shares redeemed, net of redemption fees | ||||||||||||
Class A | (86,135,268) | (73,729,663) | (66,182,451) | |||||||||
Class C | (3,037,985) | (11,437,221) | (5,831,034) | |||||||||
Class I | (49,542,035) | (165,799,406) | (45,457,181) | |||||||||
Net Increase in Net Assets Derived from Beneficial Interest Transactions | 111,513,308 | 67,162,932 | 139,220,329 | |||||||||
Net increase in net assets | 53,272,468 | 82,026,719 | 123,425,742 | |||||||||
NET ASSETS | ||||||||||||
Beginning of period | 392,850,506 | 310,823,787 | 187,398,045 | |||||||||
End of period * | $ | 446,122,974 | $ | 392,850,506 | $ | 310,823,787 | ||||||
*Including accumulated net investment income of: | $ | 1,837,073 | $ | 1,681,334 | $ | 1,091 | ||||||
| (a) | Effective May 1, 2014, the Board approved changing the fiscal year-end of the Funds from April 30 to October 31. |
See Notes to Financial Statements.
| 29 | October 31, 2014 |
ALPS | CoreCommodity Management CompleteCommodities® Strategy Fund – Class A | ||
| Consolidated Financial Highlights | ||
Selected data for a share of beneficial interest outstanding throughout the periods indicated:
| For the Fiscal Period Ended October 31, 2014(a)(b) | For the Year April 30, 2014(b) | For the Year 2013(b)(c) | For the Year Ended April 30, 2012(b) | For the Period June 29, 2010 (Inception) to April 30, 2011(b) | ||||||
Net asset value, beginning of period | $10.87 | $10.40 | $11.18 | $14.28 | $10.00 | |||||
INCOME/(LOSS) FROM INVESTMENT OPERATIONS: | ||||||||||
Net investment income/(loss)(d) | 0.00(e) | (0.06) | (0.03) | 0.04 | 0.12 | |||||
Net realized and unrealized gain/(loss) | (1.31) | 0.53 | (0.69) | (2.29) | 4.87 | |||||
Total from investment operations | (1.31) | 0.47 | (0.72) | (2.25) | 4.99 | |||||
DISTRIBUTIONS: | ||||||||||
From net investment income | – | – | – | (0.83) | (0.71) | |||||
From net realized gains | – | – | – | (0.02) | – | |||||
Tax return of capital | – | – | (0.06) | – | – | |||||
Total distributions | – | – | (0.06) | (0.85) | (0.71) | |||||
REDEMPTION FEES ADDED TO PAID-IN CAPITAL (NOTE 6) | 0.00(e) | 0.00(e) | 0.00(e) | 0.00(e) | 0.00(e) | |||||
Net increase/(decrease) in net asset value | (1.31) | 0.47 | (0.78) | (3.10) | 4.28 | |||||
Net asset value, end of year | $9.56 | $10.87 | $10.40 | $11.18 | $14.28 | |||||
TOTAL RETURN(f) | (12.05)% | 4.52% | (6.44)% | (15.77)% | 51.41% | |||||
RATIOS/SUPPLEMENTAL DATA: | ||||||||||
Net assets, end of period (000s) | $39,971 | $112,562 | $104,234 | $85,805 | $37,060 | |||||
Ratio of expenses to average net assets excluding fee waivers and reimbursements | 1.46%(g) | 1.50% | 1.50% | 1.64% | 2.59%(g) | |||||
Ratio of expenses to average net assets including fee waivers and reimbursements | 1.45%(g) | 1.45% | 1.40%(h) | 1.45% | 1.45%(g) | |||||
Ratio of net investment income/(loss) to average net assets | 0.09%(g) | (0.60)% | (0.30)% | 0.36% | 1.08%(g) | |||||
Portfolio turnover rate(i) | 12% | 28% | 117% | 264% | 59% | |||||
| (a) | Effective May 1, 2014, the Board approved changing the fiscal year-end of the Funds from April 30 to October 31. |
| (b) | Per share amounts and ratios to average net assets include income and expenses of the CoreCommodity Management Cayman Commodity Fund Ltd. (wholly-owned subsidiary). |
| (c) | Prior to April 30, 2013 the ALPS | CoreCommodity Management CompleteCommodities® Strategy Fund was known as the Jefferies Asset Management Commodity Strategy Allocation Fund. |
| (d) | Calculated using the average shares method. |
| (e) | Less than $0.005 per share. |
| (f) | Total returns are for the period indicated and have not been annualized. Total returns would have been lower had certain expenses not been waived during the period. Returns shown do not reflect the deduction of taxes that a shareholder would pay on Fund distributions or the redemption of Fund shares. Returns shown exclude any applicable sales charges. |
| (g) | Annualized. |
| (h) | According to the Fund’s shareholder services plan with respect to the Fund’s Class A shares, any amount of such payment not paid during the Fund’s fiscal year for such service activities shall be reimbursed to the Fund as soon as practical after the end of the fiscal year. Fees were reimbursed to the Fund during the year ended April 30, 2013, for the prior fiscal year in the amount of 0.05% of average net assets of Class A shares. |
| (i) | Portfolio turnover rate for periods less than one full year have not been annualized. |
See Notes to Financial Statements.
| 30 | October 31, 2014 |
ALPS | CoreCommodity Management CompleteCommodities® Strategy Fund – Class C | ||
| Consolidated Financial Highlights | ||
Selected data for a share of beneficial interest outstanding throughout the periods indicated:
| For the Fiscal Period Ended October 31, 2014(a)(b) | For the Year April 30, 2014(b) | For the Year April 30, | For the Year April 30, 2012(b) | For the Period June 29, 2010 (Inception) to April 30, 2011(b) | ||||||
Net asset value, beginning of period | $10.71 | $10.31 | $11.15 | $14.19 | $10.00 | |||||
INCOME/(LOSS) FROM INVESTMENT OPERATIONS: | ||||||||||
Net investment income/(loss)(d) | (0.04) | (0.12) | (0.10) | (0.05) | 0.08 | |||||
Net realized and unrealized gain/(loss) | (1.28) | 0.52 | (0.69) | (2.26) | 4.87 | |||||
Total from investment operations | (1.32) | 0.40 | (0.79) | (2.31) | 4.95 | |||||
DISTRIBUTIONS: | ||||||||||
From net investment income | – | – | – | (0.71) | (0.76) | |||||
From net realized gains | – | – | – | (0.02) | – | |||||
Tax return of capital | – | – | (0.05) | – | – | |||||
Total distributions | – | – | (0.05) | (0.73) | (0.76) | |||||
REDEMPTION FEES ADDED TO PAID-IN CAPITAL (NOTE 6) | 0.00(e) | 0.00(e) | 0.00(e) | 0.00(e) | 0.00(e) | |||||
Net increase/(decrease) in net asset value | (1.32) | 0.40 | (0.84) | (3.04) | 4.19 | |||||
Net asset value, end of year | $9.39 | $10.71 | $10.31 | $11.15 | $14.19 | |||||
TOTAL RETURN(f) | (12.32)% | 3.88% | (7.10)% | (16.26)% | 50.90% | |||||
RATIOS/SUPPLEMENTAL DATA: | ||||||||||
Net assets, end of period (000s) | $12,534 | $13,996 | $19,444 | $18,095 | $7,352 | |||||
Ratio of expenses to average net assets excluding fee waivers and reimbursements | 2.07%(g) | 2.10% | 2.14% | 2.24% | 4.00%(g) | |||||
Ratio of expenses to average net assets including fee waivers and reimbursements | 2.05%(g) | 2.05% | 2.05% | 2.05% | 2.05%(g) | |||||
Ratio of net investment income/(loss) to average net assets | (0.82)%(g) | (1.16)% | (0.92)% | (0.42)% | 0.72%(g) | |||||
Portfolio turnover rate(h) | 12% | 28% | 117% | 264% | 59% | |||||
| (a) | Effective May 1, 2014, the Board approved changing the fiscal year-end of the Funds from April 30 to October 31. |
| (b) | Per share amounts and ratios to average net assets include income and expenses of the CoreCommodity Management Cayman Commodity Fund Ltd. (wholly-owned subsidiary). |
| (c) | Prior to April 30, 2013 the ALPS | CoreCommodity Management CompleteCommodities® Strategy Fund was known as the Jefferies Asset Management Commodity Strategy Allocation Fund. |
| (d) | Calculated using the average shares method. |
| (e) | Less than $0.005 per share. |
| (f) | Total returns are for the period indicated and have not been annualized. Total returns would have been lower had certain expenses not been waived during the period. Returns shown do not reflect the deduction of taxes that a shareholder would pay on Fund distributions or the redemption of Fund shares. Returns shown exclude any applicable sales charges. |
| (g) | Annualized. |
| (h) | Portfolio turnover rate for periods less than one full year have not been annualized. |
See Notes to Financial Statements.
| 31 | October 31, 2014 |
ALPS | CoreCommodity Management CompleteCommodities® Strategy Fund – Class I | ||
| Consolidated Financial Highlights |
Selected data for a share of beneficial interest outstanding throughout the periods indicated:
| For the Fiscal Period Ended October 31, 2014(a)(b) | For the Year April 30, 2014(b) | For the Year April 30, | For the Year April 30, 2012(b) | For the Period June 29, 2010 (Inception) to April 30, 2011(b) | ||||||
Net asset value, beginning of period | $10.87 | $10.37 | $11.12 | $14.25 | $10.00 | |||||
INCOME/(LOSS) FROM INVESTMENT OPERATIONS: | ||||||||||
Net investment income/(loss)(d) | (0.01) | (0.03) | (0.00)(e) | 0.10 | 0.13 | |||||
Net realized and unrealized gain/(loss) | (1.29) | 0.53 | (0.69) | (2.32) | 4.89 | |||||
Total from investment operations | (1.30) | 0.50 | (0.69) | (2.22) | 5.02 | |||||
DISTRIBUTIONS: | ||||||||||
From net investment income | – | – | – | (0.89) | (0.77) | |||||
From net realized gains | – | – | – | (0.02) | – | |||||
Tax return of capital | – | – | (0.06) | – | – | |||||
Total distributions | – | – | (0.06) | (0.91) | (0.77) | |||||
REDEMPTION FEES ADDED TO PAID-IN CAPITAL (NOTE 6) | 0.00(e) | 0.00(e) | 0.00(e) | 0.00(e) | 0.00(e) | |||||
Net increase/(decrease) in net asset value | (1.30) | 0.50 | (0.75) | (3.13) | 4.25 | |||||
Net asset value, end of year | $9.57 | $10.87 | $10.37 | $11.12 | $14.25 | |||||
TOTAL RETURN(f) | (11.96)% | 4.82% | (6.16)% | (15.53)% | 51.74% | |||||
RATIOS/SUPPLEMENTAL DATA: | ||||||||||
Net assets, end of period (000s) | $393,618 | $266,293 | $187,146 | $83,497 | $73,630 | |||||
Ratio of expenses to average net assets excluding fee waivers and reimbursements | 1.16%(g) | 1.16% | 1.17% | 1.33% | 2.04%(g) | |||||
Ratio of expenses to average net assets including fee waivers and reimbursements | 1.15%(g) | 1.15% | 1.15% | 1.15% | 1.15%(g) | |||||
Ratio of net investment income/(loss) to average net assets | (0.12)%(g) | (0.26)% | (0.02)% | 0.82% | 1.19%(g) | |||||
Portfolio turnover rate(h) | 12% | 28% | 117% | 264% | 59% | |||||
| (a) | Effective May 1, 2014, the Board approved changing the fiscal year-end of the Funds from April 30 to October 31. |
| (b) | Per share amounts and ratios to average net assets include income and expenses of the CoreCommodity Management Cayman Commodity Fund Ltd. (wholly-owned subsidiary). |
| (c) | Prior to April 30, 2013 the ALPS | CoreCommodity Management CompleteCommodities® Strategy Fund was known as the Jefferies Asset Management Commodity Strategy Allocation Fund. |
| (d) | Calculated using the average shares method. |
| (e) | Less than $0.005 per share. |
| (f) | Total returns are for the period indicated and have not been annualized. Total returns would have been lower had certain expenses not been waived during the period. Returns shown do not reflect the deduction of taxes that a shareholder would pay on Fund distributions or the redemption of Fund shares. |
| (g) | Annualized. |
| (h) | Portfolio turnover rate for periods less than one full year have not been annualized. |
See Notes to Financial Statements.
| 32 | October 31, 2014 |
| ALPS | Kotak India Growth Fund | ||
| Management Commentary | October 31, 2014 (Unaudited) |
Performance
ALPS | Kotak India Growth Fund (the “Fund”) was launched on February 14, 2011. During the 6-month period ended 31st Oct 2014 (hereinafter also referred to as “the period”), the Fund’s Class A Shares, INDAX, delivered a total return of 32.13% at Net Asset Value, Class C, INFCX, delivered 31.83% with CDSC, and Class I, INDIX, delivered 32.37%. The fund outperformed the benchmark CNX 500 Index (“CNX 500”) which returned 26.24% during the period without taking into account sales charges for Class A and C Shares.
The period began with hectic political activity in India as the country went to polls for the general elections. In a landslide victory, the Bharatiya Janata Party (BJP)-led National Democratic Alliance (NDA) was given a clear and unequivocal mandate by the voting populace and a thumbs-up to BJP’s Prime Ministerial candidate Narendra Modi’s pro-growth and pro-development agenda. The period saw the Indian equity markets continue the “hope rally” that began much ahead of India’s euphoric election results and clearly shrugged off global macroeconomic worries of slow growth, sub-optimal labour markets and deflationary pressure in major developed economies and fear of capital reversals as the US Fed (Federal Reserve) stayed the course in tapering its bond-buying programme and unwinding the 6-year long quantitative easing (QE).
During the period, the Indian equity market rallied to record highs on optimism of a revival in India’s investment/infrastructure cycle, implementation of long-due reforms in indirect taxation, land acquisition, power generation and general de-bottlenecking and improvement in the ease of doing business. On the ground, optimism was also buoyed by improving macroeconomic data, resilient earning results, and strong FII (Foreign Institutional Investor) flow into the equity market. Massive corrections in commodity prices –specifically energy prices, also augur well for the Indian economy that imports a majority of its oil and gas requirement. In INR (Indian National Rupee) terms, NIFTY, CNXMCAP, and CNX500 Index returned 24.28%, 34.81%, and 27.21% respectively in the period. On the currency side, the INR appreciated to as high as 58.5/USD (U.S. Dollar) in May 2014 from 60.3/USD but then depreciated to 61.36/USD at the end of October 2014. The rupee weakness was still lower compared to the massive rally in USD against the major currency basket (U.S. Dollar Index (DXY) strengthened 8.5% during the period) as the US moved closer to the end of QE and the eventual opening up of the possibility of higher rates making US assets and currency more valuable. The period saw net FII inflows to the tune of USD 4.75 billion into the Indian equity market. The investment environment during the period was impacted by the following:
| • | The period saw volatility across asset classes and actions and statements of central bankers and their monetary stance were keenly watched for indications on how global liquidity will ebb and flow. |
| • | As expected, on the back of strong job market in the US, the US Federal Reserve continued tapering its bond-buying programme through 2014, cutting the purchase amount by USD 10 billion/month in each of the Federal Open Market |
Committee meetings and finally ending the quantitative easing (QE) completely in October 2014. Fortunately, global risk assets including Emerging Markets have so far not had any negative knee-jerk reaction to the winding up of stimulus in the US, partly also because other major economies have ramped up their own monetary easing in response to recessionary pressures. |
| • | The period marked a clear divergence of monetary policy stance in developed economies. The European Central Bank (ECB) was successful in rallying unanimous support for expanding stimulus in the troubled Euro zone through the purchase of asset backed securities (ABS). With the Euro zone recovery continuing to hurt by a prolonged period of anemic inflation and low employment rates, ECB announced its intention of increasing its asset purchases and preparedness to expand its balance sheet by approximately 1 trillion Euros, making it clear that the European central bank will do what it takes to stoke inflation back in the Euro zone. The moot question still remains when and to what extent would the ECB commit itself to buying sovereign bonds to pump liquidity in the European monetary system. Likewise Japan intensified its stimulus towards the end of October by unexpectedly announcing an expansion of its monetary stimulus and nearly tripling the government’s annual bond purchase programme from JPY (Japanese Yen) 30 trillion to JPY 80 trillion. The JPY has had a precipitous fall of almost 9% against the USD since then. |
| • | After months of record low volatilities indicating complacency, the period marked the return of volatility to all asset classes including commodity and currency markets as the USD strengthened against other currencies. Dollar Index gained 8.5% during the period. Brent crude corrected by ~17% during the period and ~24% from its high of USD 112/barrel in June 2014 as major economies struggle with recessionary pressures and China cuts back on its over capacities. Gold also declined ~10% in value to USD 1172/oz despite the increasing geopolitical tension in Syria/Iraq and Ukraine/Russia witnessed during the period. |
| • | In India, we expect the new regime to bring in much required changes to address some structural issues impacting the Indian economy. Among many measures we expect: steps to control and reduce subsidy particularly on transportation fuels, take measures to boost tax to Gross Domestic Product (GDP) by introducing a uniform good and services tax (GST), ease land acquisition for infrastructure build out and industrial capex, mitigate challenges to do business in India, increase foreign investment limits in key sectors like insurance, among others. A lot of ground work is currently underway to bring in required legislative changes for these changes and we expect some of these to be introduced in the winter session of parliament which commences in late November. |
| • | There are indications of macroeconomics turning favourable for an economic revival in India. Inflation trajectory in recent months has been trending lower aided by a favourable base effect. At its bi-monthly policy review |
| 33 | October 31, 2014 |
| ALPS | Kotak India Growth Fund | ||
| Management Commentary | October 31, 2014 (Unaudited) |
in September, RBI (Reserve Bank of India) left key policy rates unchanged, largely in line with expectations, with repo and reverse repo rate at 8% and 7% respectively. CRR (Cash Reserve Ratio) and the SLR (Statutory Liquidity Ratio) also remained unchanged at 4% and 22.5% respectively. We continue to believe that RBI would keep rates on hold in CY14 with the focus clearly on achieving the 6% CPI inflation rate by Jan 2016. The tone of the policy remains largely balanced with monetary policy having a clear target of 6% CPI inflation by Jan 2016. |
| • | The period also saw S&P upgrade India’s credit rating outlook from negative to stable while reaffirming the rating at BBB-. The upgrade on the outlook is due to improving political environment, stronger external account, and commitment towards fiscal consolidation. |
| • | During the period, inflation in India, both consumer inflation (CPI) and wholesale inflation (WPI) continued to see moderation and CPI for October 2014 came in at 5.5% down from 6.5% in September with food prices declining 5.6% aided by a 2.6% contraction in vegetable prices, even though other food categories saw an increase in prices. We expect the declining trend in CPI to continue in Nov 2014 as well and then subsequently see the CPI rising to about 7% levels in the fourth quarter of fiscal year 2015. Core inflation was steady at 5.9% in October but we expect it to head lower in the coming months due to base effect. The headline WPI also continued to decline during October –falling sharply to 1.8% due to a significant moderation in all sub-components. Primary articles inflation came in at 1.4% while energy inflation was 0.4%. With benign core inflation, it is likely that consumer inflation will fall within the target of the central bank. |
| • | In terms of economic activity, the Index of Industrial Production (IIP) shows signs of bottoming out and expanded in September 2014 to 2.5% from 0.5% in August beating estimates of 2%. Industrial production was boosted by heightened activity during the festive season. Capital goods output rebounded sharply to grow 11.6% from -11.3% in August 2014, manufacturing goods grew 2.5% as against -1.4% in the previous month. The IIP for August was revised upwards from 0.4% to 0.5%. |
| • | Preliminary indirect tax collections for the period Apr-Oct 2014 indicated a 5.6% year over year growth. The total collection of INR 2.7 trillion during the period makes up about 46% of the fiscal year 2015 budget estimate suggesting buoyancy. Taking advantage of the collapsing crude prices, the government of India raised excise duties on petrol and diesel during November by INR 1.5/liter. thereby boosting its revenues. We expect an incremental INR 70-80 billion to be garnered from the increased excise duty in the remaining of fiscal year 2015. |
| • | The Central Statistics Office (CSO) released the first quarter of fiscal year 2015 (ending June 2014) GDP number which stood at 5.7% (versus 4.6% in the fourth quarter of fiscal year 2014), higher than Bloomberg consensus expectation of 5.5%. Industry growth |
rebounded to 4.2% on account of higher electricity growth while Agriculture and Service grew at 3.8% and 6.8% respectively. The recent GDP data clearly points towards a trend of non–agricultural GDP growth bottoming out. The second quarter of fiscal year 2015 GDP is estimated to be around 5%. While we do not expect to see a huge rebound in fiscal year 2015 itself, it is likely that fiscal year 2016 would see the economic growth trajectory moving higher. Government policies and reforms would play a significant role and would need to be closely monitored. We marginally revise our forecast for real GDP growth in fiscal year 2015 upwards to 5.4% from the earlier 5.2% (maintaining 6.5% in fiscal year 2016). The upward revision is largely on the back of marginally higher numbers for manufacturing and services growth while agricultural growth is likely to be lower than earlier expected on the back of poor monsoons. |
| • | India’s current account deficit narrowed sharply to 1.7% of GDP (USD 7.8 billion) in the first quarter of fiscal year 2015 (ending June 2014) versus 4.8% of GDP in the same period last year. This was helped by a 10.6% rise in exports to USD 81.7 billion and a 6.5% moderation in imports to USD 116 billion. |
| • | In terms of flows, apart from the massive foreign portfolio flows, after many years of negative flows (redemptions) from the domestic investors, the domestic mutual funds saw positive flows during the period on the back of optimism on the back of the formation of a stable government and a fast economic recovery. Domestic mutual funds were net buyers to the tune of USD 2.67 billion during the period. |
Portfolio Composition
The portfolio continues to be positioned in a way as to benefit from a revival in the economy and improving macroeconomic tailwinds from the four broad investment themes in India – consumption led by favourable demographics, financial services, infrastructure and outsourcing. The fund mandate is flexible to invest across the spectrum of market capitalizations in order to take advantage of any opportunistic mispricing arising from market conditions, valuation differential, earnings growth or liquidity flows.
For the 6-month period ending 31st Oct 2014, Cement & Cement Products (470 basis points “bps”), Information Technology (106bps), Real Estate (63bps) and Construction (55bps) are the largest over-weights compared to benchmark, while Oil & Gas (-330bps), Utilities (-240bps), Metals & Metal products (-148bps) and FMCG (-65bps) are the largest underweights in the portfolio as against the benchmark. In terms of market capitalization focus, as of 31st Oct, the fund is invested 71.1% in large caps, 23.2% in midcaps and 1.3% in small-caps. Over the last 12 months, exposure to midcap and small-cap companies has remained in the range of 22%-26% of the fund. Thematically, Consumption (at ~31% of portfolio) and Financials (at ~29% of portfolio) constitute the most bullish themes, while Infrastructure (at ~8% of exposure) is the smallest thematic bet in the portfolio as of the period end.
| 34 | October 31, 2014 |
| ALPS | Kotak India Growth Fund | ||
| Management Commentary | October 31, 2014 (Unaudited) |
During the period, some of the quality names within our favoured sectors where we initiated new exposure and continue to hold onto the positions are JK Cements, SKS Micro Finance, Punjab National Bank, United Spirits, Max India and Cipla Ltd. Some stocks where we booked profit and exited completely include Gujarat Pipava Port, Just Dial, Eicher Motors, and Glenmark Pharma.
Outlook
The new government is expected to take strong measures to restart the investment cycle and infrastructure spending and at the same time address issues of rising subsidy and the resultant fiscal imbalances. A cyclical economic recovery and macro stabilization was already underway and this strong mandate can ease decision making, help remove bottlenecks for faster execution, and with possible structural reforms, accelerate the GDP recovery.
The recent moderation in inflation trajectory and sharp fall in global commodity prices also raises hopes of an easier monetary policy by the central bank. This could be a tailwind for equities and fixed income. On other macroeconomic indicators, we expect current account deficit to remain at manageable levels of around 1.5% of GDP. The recent commodity prices, especially oil has meaningful positive impact on India on multiple fronts, mainly inflation, fiscal deficit and current account and thus on currency with a lag.
After the big move in recent months, the key issue is whether the equity markets have already discounted the GDP recovery or there are further upsides in the market. Markets have moved to above average Price to Earnings (PE) multiples of around 15.5X-15.7X one year forward expected consensus earnings estimates. However, after more than two years of sharp GDP and corporate earnings downgrades, we are seeing the first signs of GDP upgrades and corporate earnings upgrades. With the macroeconomic parameters also showing sustained improvement, we expect equity markets to remain upbeat. The recent positive flows from domestic investors and continued strong flows from foreign investors will also be a strong support for the equity markets. If the government is able to push through hard policy measures to address structural issues of fiscal deficit and also takes measures to revive the investment cycle, it can further provide a positive bias to the equity markets. However, after a sharp rise and possible uncertainty of impact of a exit of QE by US fed and a resultant dollar strength, equity markets in India can see some short term volatility. We remain positively inclined on both strong corporate earnings growth on the back of economic recovery and continued strength in the equity markets.
Nitin Jain – Portfolio Manager
Important Notice
Investments in India are subject to a number of risks including, but not limited to, risk of losing some or all of the capital invested, high market volatility, variable market liquidity, geopolitical risks (including political instability), exchange rate fluctuations (between the currency of the fund’s share class and the Indian Rupee), changes in tax regime and restrictions on investment activities of foreign investors.
Basis Point - a unit that is equal to 1/100th of 1% and is used to denote the change in a financial instrument.
CNX 500 - The CNX 500 Index is India’s first broad based benchmark of the Indian capital market.
CNXMCAP - The CNX Midcap Index comprises 100 tradable stocks listed on the National Stock Exchange (NSE). The primary objective of the CNX Midcap Index is to capture the movement of the midcap segment of the market. CNX Midcap Index is computed using free float market capitalization method, wherein the level of the index reflects the total free float market value of all the stocks in the index relative to particular base market capitalization value.
Index of Industrial Production (IIP) – An index for India which details out the growth of various sectors in an economy such as mining, electricity and manufacturing.
NIFTY - NIFTY is an Index computed from performance of top stocks from different sectors listed on NSE (National stock exchange). NIFTY consists of 50 companies from 24 different sectors. NIFTY stands for National Stock Exchange’s fifty. The companies which form index of NIFTY may vary from time to time based on many factors considered by NSE.
PE - A valuation ratio of a company’s current share price compared to its per-share earnings.
The views and information discussed in this commentary are as of the date of publication, are subject to change, and may not reflect the writer’s current views. The views expressed represent an assessment of market conditions at a specific point in time, are opinions only and should not be relied upon as investment advice regarding a particular investment or markets in general. Such information does not constitute a recommendation to buy or sell specific securities or investment vehicles. It should not be assumed that any investment will be profitable or will equal the performance of the fund or any securities or any sectors mentioned in this letter. The subject matter contained in this letter has been derived from several sources believed to be reliable and accurate at the time of compilation. Neither the Fund nor Kotak Mahindra (UK) Limited accepts any liability for losses either direct or consequential caused by the use of this information.
| 35 | October 31, 2014 |
| ALPS | Kotak India Growth Fund | ||
| October 31, 2014 (Unaudited) |
Performance of $10,000 Initial Investment (as of October 31, 2014)
Comparison of change in value of a $10,000 investment (includes maximum sales charges of 5.50%)
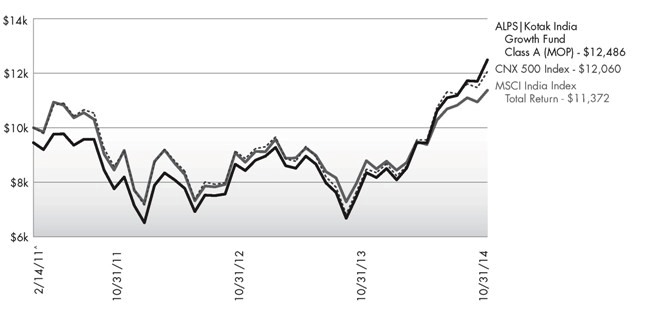
The chart above represents historical performance of a hypothetical investment of $10,000 in the Fund since inception. Past performance does not guarantee future results. This chart does not reflect the deduction of taxes that a shareholder would pay on Fund distributions or the redemption of Fund shares.
Average Annual Total Returns (as of October 31, 2014)
| 6 Month | 1 Year | 3 Year | Since Inception^ | Total Expense Ratio | What You Pay* | |||||||
Class A (NAV) | 32.13% | 49.49% | 15.07% | 7.79% | 6.63% | 2.00% | ||||||
Class A (MOP) | 24.88% | 41.33% | 12.94% | 6.17% | ||||||||
Class C (NAV) | 31.83% | 48.39% | 14.35% | 7.08% | 7.26% | 2.60% | ||||||
Class C (CDSC) | 30.83% | 47.39% | 14.35% | 7.08% | ||||||||
Class I | 32.37% | 49.97% | 15.45% | 8.15% | 6.28% | 1.60% | ||||||
CNX 500 Index1 | 26.22% | 42.23% | 9.65% | 5.18% | ||||||||
MSCI India Index Total Return2 | 21.19% | 29.36% | 7.44% | 3.53% |
Performance data quoted represents past performance. Past performance does not guarantee future results. Investment return and principal value of an investment will fluctuate so that an investor’s shares, when sold or redeemed, may be worth more or less than the original cost. Current performance data may be higher or lower than actual data quoted. For the most current month-end performance data, please call 1-877-256-8445.
Maximum Offering Price (MOP) for Class A shares includes the Fund’s maximum sales charge of 5.50%. Performance shown at NAV does not include these sales charges and would have been lower had it been taken into account. If you invest $1 million or more, either as a lump sum or through the Fund’s accumulation or letter of intent programs, you can purchase Class A shares without an initial sales charge (load). A Contingent Deferred Sales Charge (“CDSC”) of 1.00% may apply to Class C shares redeemed within the first 12 months after a purchase, and on Class A shares redeemed within the first 18 months after a purchase in excess of $1 million. The Fund imposes a 2.00% redemption fee on shares held for less than 30 days.
Performance less than 1 year is cumulative.
| 36 | October 31, 2014 |
| ALPS | Kotak India Growth Fund | ||
Performance Update | October 31, 2014 (Unaudited) |
Investing in the Fund is subject to investment risks, including possible loss of the principal amount invested. Derivatives generally are more sensitive to changes in economic or market conditions than other types of investments; this could result in losses that significantly exceed the funds original investment.
| 1 | CNX 500 Index - India’s first broad based benchmark of the Indian capital market. The CNX 500 companies are disaggregated into 72 industry indices. Industry weightages in the market. The index is not actively managed and does not reflect any deduction for fees, expenses or taxes. An investor may not invest directly in an index. |
| 2 | MSCI India Index - a free float weighted equity index. It was developed with a base value of 100 as-of December 31, 1992. The index is not actively managed and does not reflect any deduction for fees, expenses or taxes. An investor may not invest directly in an index. |
| ^ | Fund inception date of February 14, 2011. |
| * | What You Pay reflects the Advisor’s and Sub-Advisor’s decision to contractually limit expenses through August 31, 2015. Please see the prospectus for additional information. |
The table does not reflect the deduction of taxes that a shareholder would pay on Fund distributions or the redemption of Fund shares.
This Fund is not suitable for all investors and is subject to investment risks, including possible loss of the principal amount invested.
There is no guarantee that the Fund will continue to hold any one particular security or stay invested in any one particular company. The composition of the Fund’s top holdings is subject to change. Performance figures are historical and reflect the change in share price, reinvested distributions, changes in net asset value, sales charges and capital gains distributions, if any.
Not FDIC Insured – No Bank Guarantee – May Lose Value
Investing in India involves risk and considerations not present when investing in more established securities markets. The Fund may be more susceptible to economic, market, political and local risks of the region than a fund that is more geographically diversified. Investments in India are subject to a number of risks including, but not limited to, risk of losing some or all of the capital invested, high market volatility, variable market liquidity, geopolitical risks (including political instability), exchange rate fluctuations (between the currency of the fund’s share class and the Indian Rupee), changes in tax regime and restrictions on investment activities of foreign investors.
Top Ten Holdings (as a % of Net Assets) †
ICICI Bank, Ltd. | 5.36 | % | ||
Infosys, Ltd. | 5.30 | % | ||
HDFC Bank, Ltd. | 4.99 | % | ||
Tata Consultancy Services, Ltd. | 4.14 | % | ||
ITC, Ltd. | 3.41 | % | ||
Axis Bank, Ltd. | 3.32 | % | ||
Larsen & Toubro, Ltd. | 3.23 | % | ||
Housing Development Finance Corp. | 3.15 | % | ||
Tata Motors, Ltd. | 2.47 | % | ||
Reliance Industries, Ltd. | 2.38 | % | ||
Top Ten Holdings | 37.75 | % |
| † | Holdings are subject to change. Table presents approximate values only. |
Industry Sector Allocation (as a % of Net Assets)
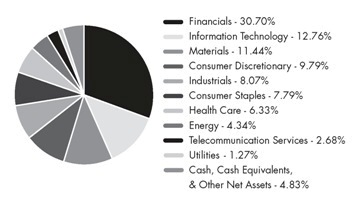
| 37 | October 31, 2014 |
| ALPS | Kotak India Growth Fund | ||
| Consolidated Statement of Investments | October 31, 2014 |
| Shares | Value (Note 2) | |||||||
COMMON STOCKS (95.17%) |
| |||||||
Consumer Discretionary (9.79%) |
| |||||||
Auto Components (0.72%) |
| |||||||
Motherson Sumi Systems, Ltd. | 16,780 | $ | 114,900 | |||||
|
| |||||||
Automobiles (6.32%) |
| |||||||
Bajaj Auto, Ltd. | 4,329 | 184,011 | ||||||
Mahindra & Mahindra, Ltd. | 7,435 | 158,094 | ||||||
Maruti Suzuki India, Ltd. | 5,031 | 273,476 | ||||||
Tata Motors, Ltd. | 72,400 | 394,987 | ||||||
|
| |||||||
| 1,010,568 | ||||||||
|
| |||||||
Media (1.94%) | ||||||||
Dish TV India, Ltd.(a) | 206,463 | 193,391 | ||||||
Zee Entertainment Enterprises, Ltd. | 20,800 | 116,583 | ||||||
|
| |||||||
| 309,974 | ||||||||
|
| |||||||
Textiles, Apparel & Luxury Goods (0.81%) |
| |||||||
Bata India, Ltd. | 6,275 | 129,958 | ||||||
|
| |||||||
TOTAL CONSUMER DISCRETIONARY |
| 1,565,400 | ||||||
|
| |||||||
Consumer Staples (7.79%) |
| |||||||
Beverages (1.49%) |
| |||||||
United Spirits, Ltd.(a) | 5,300 | 238,573 | ||||||
|
| |||||||
Food Products (1.79%) |
| |||||||
Britannia Industries, Ltd. | 11,512 | 286,866 | ||||||
|
| |||||||
Household Products (0.91%) |
| |||||||
Jyothy Laboratories, Ltd. | 35,663 | 145,478 | ||||||
|
| |||||||
Personal Products (0.19%) |
| |||||||
Emami, Ltd. | 2,288 | 30,183 | ||||||
|
| |||||||
Tobacco (3.41%) |
| |||||||
ITC, Ltd. | 94,220 | 544,816 | ||||||
|
| |||||||
TOTAL CONSUMER STAPLES |
| 1,245,916 | ||||||
|
| |||||||
Energy (4.34%) | ||||||||
Oil, Gas & Consumable Fuels (4.34%) |
| |||||||
Hindustan Petroleum Corp., Ltd. | 36,593 | 312,519 | ||||||
Reliance Industries, Ltd. | 23,459 | 380,744 | ||||||
|
| |||||||
| 693,263 | ||||||||
|
| |||||||
TOTAL ENERGY |
| 693,263 | ||||||
|
| |||||||
| Shares | Value (Note 2) | |||||||
Financials (30.70%) |
| |||||||
Commercial Banks (23.31%) |
| |||||||
Axis Bank, Ltd. | 74,164 | $ | 530,744 | |||||
Bank of Baroda | 15,008 | 227,133 | ||||||
Federal Bank, Ltd. | 104,588 | 241,776 | ||||||
HDFC Bank, Ltd. | 53,533 | 796,995 | ||||||
ICICI Bank, Ltd. | 32,277 | 857,250 | ||||||
IndusInd Bank, Ltd. | 26,047 | 305,552 | ||||||
Punjab National Bank | 10,300 | 156,188 | ||||||
State Bank of India | 7,314 | 321,889 | ||||||
Yes Bank, Ltd. | 25,958 | 289,335 | ||||||
|
| |||||||
| 3,726,862 | ||||||||
|
| |||||||
Consumer Finance (1.88%) |
| |||||||
Shriram Transport Finance Co., Ltd. | 8,665 | 134,056 | ||||||
SKS Microfinance, Ltd.(a) | 31,191 | 165,841 | ||||||
|
| |||||||
| 299,897 | ||||||||
|
| |||||||
Insurance (1.03%) |
| |||||||
MAX India, Ltd. | 28,463 | 164,566 | ||||||
|
| |||||||
Real Estate Management & Development (1.33%) |
| |||||||
The Phoenix Mills, Ltd. | 34,257 | 212,711 | ||||||
|
| |||||||
Thrifts & Mortgage Finance (3.15%) |
| |||||||
Housing Development | 27,981 | 503,958 | ||||||
|
| |||||||
TOTAL FINANCIALS | 4,907,994 | |||||||
|
| |||||||
Health Care (6.33%) |
| |||||||
Pharmaceuticals (6.33%) |
| |||||||
Cadila Healthcare, Ltd. | 10,071 | 230,345 | ||||||
Cipla, Ltd. | 20,300 | 220,428 | ||||||
Dr. Reddy’s Laboratories, Ltd. | 2,130 | 109,802 | ||||||
Lupin, Ltd. | 7,227 | 161,062 | ||||||
Sun Pharmaceutical Industries, Ltd. | 21,083 | 290,165 | ||||||
|
| |||||||
| 1,011,802 | ||||||||
|
| |||||||
TOTAL HEALTH CARE |
| 1,011,802 | ||||||
|
| |||||||
Industrials (8.07%) |
| |||||||
Construction & Engineering (3.76%) |
| |||||||
GMR Infrastructure, Ltd. | 242,975 | 85,534 | ||||||
Larsen & Toubro, Ltd. | 19,149 | 516,093 | ||||||
|
| |||||||
| 601,627 | ||||||||
|
| |||||||
Electrical Equipment (2.31%) |
| |||||||
Amara Raja Batteries, Ltd. | 19,730 | 210,528 | ||||||
Crompton Greaves, Ltd. | 51,684 | 158,309 | ||||||
|
| |||||||
| 368,837 | ||||||||
|
| |||||||
| 38 | October 31, 2014 |
| ALPS | Kotak India Growth Fund | ||
| Consolidated Statement of Investments | October 31, 2014 |
| Shares | Value (Note 2) | |||||||
Machinery (0.98%) |
| |||||||
Thermax, Ltd. | 10,763 | $ | 156,694 | |||||
|
| |||||||
Transportation Infrastructure (1.02%) |
| |||||||
IL&FS Transportation Networks, Ltd. | 50,674 | 162,691 | ||||||
|
| |||||||
TOTAL INDUSTRIALS | 1,289,849 | |||||||
|
| |||||||
Information Technology (12.76%) |
| |||||||
Internet Software & Services (0.63%) |
| |||||||
Info Edge India, Ltd. | 7,334 | 100,788 | ||||||
|
| |||||||
IT Services (12.13%) |
| |||||||
HCL Technologies, Ltd. | 5,495 | 144,125 | ||||||
Infosys, Ltd. | 12,783 | 847,393 | ||||||
Tata Consultancy Services, Ltd. | 15,548 | 661,582 | ||||||
Tech Mahindra, Ltd. | 6,974 | 285,900 | ||||||
|
| |||||||
| 1,939,000 | ||||||||
|
| |||||||
TOTAL INFORMATION TECHNOLOGY |
| 2,039,788 | ||||||
|
| |||||||
Materials (11.44%) |
| |||||||
Chemicals (1.96%) | ||||||||
Berger Paints India, Ltd. | 18,402 | 118,940 | ||||||
Coromandel International, Ltd. | 24,635 | 132,817 | ||||||
Tata Chemicals, Ltd. | 9,163 | 60,731 | ||||||
|
| |||||||
| 312,488 | ||||||||
|
| |||||||
Construction Materials (8.58%) |
| |||||||
ACC, Ltd. | 9,634 | 235,190 | ||||||
Century Textiles & Industries, Ltd. | 23,041 | 208,096 | ||||||
JK Cement, Ltd. | 30,194 | 296,605 | ||||||
The Ramco Cements, Ltd. | 45,841 | 257,389 | ||||||
Shree Cement, Ltd. | 1,292 | 190,886 | ||||||
Ultratech Cement, Ltd. | 4,433 | 183,916 | ||||||
|
| |||||||
| 1,372,082 | ||||||||
|
| |||||||
Metals & Mining (0.90%) |
| |||||||
Hindustan Zinc, Ltd. | 51,658 | 144,078 | ||||||
|
| |||||||
TOTAL MATERIALS | 1,828,648 | |||||||
|
| |||||||
Telecommunication Services (2.68%) |
| |||||||
Diversified Telecommunication (1.03%) |
| |||||||
Tata Communications, Ltd. | 25,170 | 164,955 | ||||||
|
| |||||||
Wireless Telecommunication Services (1.65%) |
| |||||||
Bharti Airtel, Ltd. | 40,470 | 262,994 | ||||||
|
| |||||||
TOTAL TELECOMMUNICATION SERVICES |
| 427,949 | ||||||
|
| |||||||
| Shares | Value (Note 2) | |||||||
Utilities (1.27%) |
| |||||||
Electric Utilities (0.58%) |
| |||||||
KSK Energy Ventures, Ltd.(a) | 89,824 | $ | 93,445 | |||||
|
| |||||||
Independent Power Producers & Energy Traders (0.69%) |
| |||||||
PTC India, Ltd. | 74,135 | 110,475 | ||||||
|
| |||||||
TOTAL UTILITIES | 203,920 | |||||||
|
| |||||||
TOTAL COMMON STOCKS (Cost $12,072,997) |
| 15,214,529 | ||||||
|
| |||||||
| 7-Day Yield | Shares | Value (Note 2) | ||||||||||
SHORT TERM INVESTMENTS (1.27%) |
| |||||||||||
Money Market Fund (1.27%) |
| |||||||||||
Dreyfus Cash Advantage Fund, Institutional Class | 0.180 | % | 203,428 | 203,428 | ||||||||
|
| |||||||||||
TOTAL SHORT TERM INVESTMENTS (Cost $203,428) |
| 203,428 | ||||||||||
|
| |||||||||||
TOTAL INVESTMENTS (96.44%) (Cost $12,276,425) |
| $ | 15,417,957 | |||||||||
Other Assets In Excess Of Liabilities (3.56%) |
| 569,673 | ||||||||||
|
| |||||||||||
NET ASSETS (100.00%) |
| $ | 15,987,630 | |||||||||
|
| |||||||||||
| (a) | Non-Income Producing Security. |
Common Abbreviations:
Ltd. - Limited.
For Fund compliance purposes, the Fund’s industry classifications refer to any one or more of the industry sub-classifications used by one or more widely recognized market indexes or ratings group indexes, and/or as defined by Fund management. This definition may not apply for purposes of this report, which may combine industry sub-classifications for reporting ease. Industries are shown as a percent of net assets.
See Notes to Financial Statements.
| 39 | October 31, 2014 |
| ALPS | Kotak India Growth Fund | ||
| Consolidated Statement of Assets and Liabilities | October 31, 2014 |
ASSETS | ||||
Investments, at value | $ | 15,417,957 | ||
Cash | 6,051 | |||
Foreign currency, at value (Cost $369,794) | 369,572 | |||
Receivable for investments sold | 49,515 | |||
Receivable for shares sold | 265,764 | |||
Dividends receivable | 2,834 | |||
Receivable due from advisor | 18,753 | |||
Prepaid expenses and other assets | 16,978 | |||
Total Assets | 16,147,424 | |||
LIABILITIES | ||||
Payable for investments purchased | 56,979 | |||
Payable for shares redeemed | 5,140 | |||
Administration and transfer agency fees payable | 18,113 | |||
Distribution and services fees payable | 5,246 | |||
Trustees’ fees and expenses payable | 1,101 | |||
Professional fees payable | 44,932 | |||
Accrued expenses and other liabilities | 28,283 | |||
Total Liabilities | 159,794 | |||
NET ASSETS | $ | 15,987,630 | ||
| ||||
NET ASSETS CONSIST OF | ||||
Paid-in capital | $ | 12,554,871 | ||
Accumulated net investment income | 63,475 | |||
Accumulated net realized gain on investments and foreign currency transactions | 228,006 | |||
Net unrealized appreciation on investments and translation of assets and liabilities denominated in foreign currencies | 3,141,278 | |||
NET ASSETS | $ | 15,987,630 | ||
| ||||
INVESTMENTS, AT COST | $ | 12,276,425 | ||
PRICING OF SHARES | ||||
Class A: | ||||
Net Asset Value, offering and redemption price per share(a) | $ | 13.20 | ||
Net Assets | $ | 5,535,775 | ||
Shares of beneficial interest outstanding (unlimited number of shares, no par value common stock authorized) | 419,226 | |||
Maximum offering price per share ((NAV/0.9450), based on maximum sales charge of 5.50% of the offering price) | $ | 13.97 | ||
Class C: | ||||
Net Asset Value, offering and redemption price per share(a) | $ | 12.88 | ||
Net Assets | $ | 1,497,160 | ||
Shares of beneficial interest outstanding (unlimited number of shares, no par value common stock authorized) | 116,271 | |||
Class I: | ||||
Net Asset Value, offering and redemption price per share | $ | 13.29 | ||
Net Assets | $ | 8,954,695 | ||
Shares of beneficial interest outstanding (unlimited number of shares, no par value common stock authorized) | 673,651 | |||
| (a) | Redemption price per share may be reduced for any applicable contingent deferred sales charge. For a description of a possible sales charge, please see the Fund’s Prospectus. |
See Notes to Financial Statements.
| 40 | October 31, 2014 |
| ALPS | Kotak India Growth Fund | ||
| Consolidated Statements of Operations |
| For the Fiscal Period Ended October 31, 2014(a) | For the Year Ended April 30, 2014 | |||||||
INVESTMENT INCOME | ||||||||
Dividends | $ | 125,558 | $ | 112,349 | ||||
Total Investment Income | 125,558 | 112,349 | ||||||
EXPENSES | ||||||||
Investment advisory fees | 74,902 | 87,269 | ||||||
Administrative and transfer agency fees | 71,984 | 141,000 | ||||||
Distribution and service fees | ||||||||
Class A | 8,162 | 12,136 | ||||||
Class C | 5,718 | 8,186 | ||||||
Professional fees | 41,380 | 46,195 | ||||||
Reports to shareholders and printing fees | 1,964 | 2,436 | ||||||
State registration fees | 19,238 | 43,440 | ||||||
SEC registration fees | 406 | – | ||||||
Insurance fees | 1,700 | 3,084 | ||||||
Custody fees | 45,248 | 78,021 | ||||||
Trustees’ fees and expenses | 2,182 | 4,260 | ||||||
Miscellaneous expenses | 13,802 | 30,436 | ||||||
Total Expenses | 286,686 | 456,463 | ||||||
Less fees waived/reimbursed by investment advisor (Note 8) | ||||||||
Class A | (81,178) | (198,350) | ||||||
Class C | (16,958) | (38,130) | ||||||
Class I | (78,795) | (87,957) | ||||||
Net Expenses | 109,755 | 132,026 | ||||||
Net Investment Income/(Loss) | 15,803 | (19,677) | ||||||
Net realized gain/(loss) on investments | 824,179 | (80,511) | ||||||
Net realized gain on futures contracts | – | 10,181 | ||||||
Net realized loss on foreign currency transactions | (19,437) | (28,692) | ||||||
Net change in unrealized appreciation on investments | 2,194,181 | 449,545 | ||||||
Net change in unrealized depreciation on translation of assets and liabilities denominated in foreign currencies | (1,271) | (43) | ||||||
NET REALIZED AND UNREALIZED GAIN ON INVESTMENTS | 2,997,652 | 350,480 | ||||||
NET INCREASE IN NET ASSETS RESULTING FROM OPERATIONS | $ | 3,013,455 | $ | 330,803 | ||||
| ||||||||
| (a) | Effective May 1, 2014, the Board approved changing the fiscal year-end of the Funds from April 30 to October 31. |
See Notes to Financial Statements.
| 41 | October 31, 2014 |
| ALPS | Kotak India Growth Fund | ||
| Consolidated Statements of Changes in Net Assets |
| For the Fiscal Period Ended October 31, 2014(a) | For the Year Ended April 30, 2014 | For the Year April 30, 2013 | ||||||||||
OPERATIONS | ||||||||||||
Net investment income/(loss) | $ | 15,803 | $ | (19,677) | $ | (43,203) | ||||||
Net realized gain/(loss) on investments and foreign currency transactions | 804,742 | (99,022) | 181,647 | |||||||||
Net change in unrealized appreciation on investments and translation of assets and liabilities denominated in foreign currencies | 2,192,910 | 449,502 | 627,189 | |||||||||
Net Increase in Net Assets Resulting from Operations | 3,013,455 | 330,803 | 765,633 | |||||||||
DISTRIBUTIONS | ||||||||||||
Dividends to shareholders from net investment income | ||||||||||||
Class I | – | (9,601) | – | |||||||||
Net Decrease in Net Assets from Distributions | – | (9,601) | – | |||||||||
BENEFICIAL INTEREST TRANSACTIONS (NOTE 6) | ||||||||||||
Shares sold | ||||||||||||
Class A | 2,894,035 | 2,368,871 | 3,239,533 | |||||||||
Class C | 545,448 | 348,482 | 532,616 | |||||||||
Class I | 6,266,320 | 325,772 | 744,593 | |||||||||
Dividends reinvested | ||||||||||||
Class I | – | 8,639 | – | |||||||||
Shares redeemed, net of redemption fees | ||||||||||||
Class A | (3,972,790) | (2,090,462) | (1,327,483) | |||||||||
Class C | (211,571) | (419,549) | (118,894) | |||||||||
Class I | (577,957) | (586,477) | (530,127) | |||||||||
Net Increase/(Decrease) in Net Assets Derived from Beneficial Interest Transactions | 4,943,485 | (44,724) | 2,540,238 | |||||||||
Net increase in net assets | 7,956,940 | 276,478 | 3,305,871 | |||||||||
NET ASSETS | ||||||||||||
Beginning of period | 8,030,690 | 7,754,212 | 4,448,341 | |||||||||
End of period * | $ | 15,987,630 | $ | 8,030,690 | $ | 7,754,212 | ||||||
| ||||||||||||
| *Including accumulated net investment income/(loss) of: | $ | 63,475 | $ | (37,846) | $ | (45,369) | ||||||
| (a) | Effective May 1, 2014, the Board approved changing the fiscal year-end of the Funds from April 30 to October 31. |
See Notes to Financial Statements.
| 42 | October 31, 2014 |
| ALPS | Kotak India Growth Fund – Class A | ||
Consolidated Financial Highlights Selected data for a share of beneficial interest outstanding throughout the periods indicated: |
| For the Fiscal Period Ended October 31, 2014(a)(b) | For the Year Ended April 30, 2014(b) | For the Year Ended April 30, 2013(b) | For the Year Ended April 30, 2012(b) | For the Period February 14, 2011 (Inception) to April 30, 2011(b) | ||||||
Net asset value, beginning of period | $9.99 | $9.47 | $8.22 | $10.35 | $10.00 | |||||
INCOME/(LOSS) FROM INVESTMENT OPERATIONS: | ||||||||||
Net investment income/(loss)(c) | 0.01 | (0.02) | (0.07) | (0.08) | (0.04) | |||||
Net realized and unrealized gain/(loss) | 3.20 | 0.54 | 1.32 | (2.04) | 0.39 | |||||
Total from investment operations | 3.21 | 0.52 | 1.25 | (2.12) | 0.35 | |||||
DISTRIBUTIONS: | ||||||||||
From net realized gains | – | – | – | (0.01) | – | |||||
Total distributions | – | – | – | (0.01) | – | |||||
REDEMPTION FEES ADDED TO PAID-IN CAPITAL (NOTE 6) | 0.00(d) | 0.00(d) | 0.00(d) | 0.00(d) | 0.00(d) | |||||
Net increase/(decrease) in net asset value | 3.21 | 0.52 | 1.25 | (2.13) | 0.35 | |||||
Net asset value, end of year | $13.20 | $9.99 | $9.47 | $8.22 | $10.35 | |||||
| ||||||||||
TOTAL RETURN(e) | 32.13% | 5.49% | 15.21% | (20.44)% | 3.40% | |||||
RATIOS/SUPPLEMENTAL DATA: | ||||||||||
Net assets, end of period (000s) | $5,536 | $5,211 | $4,681 | $2,404 | $935 | |||||
Ratio of expenses to average net assets excluding fee waivers and reimbursements | 4.92%(f) | 6.51% | 7.99% | 12.42% | 69.96%(f) | |||||
Ratio of expenses to average net assets including fee waivers and reimbursements | 1.90%(f)(g) | 1.88%(g) | 2.00% | 2.00% | 2.00%(f) | |||||
Ratio of net investment income/(loss) to average net assets | 0.19%(f) | (0.27)% | (0.82)% | (0.89)% | (1.82)%(f) | |||||
Portfolio turnover rate(h) | 28% | 65% | 93% | 114% | 9% | |||||
| (a) | Effective May 1, 2014, the Board approved changing the fiscal year-end of the Funds from April 30 to October 31. |
| (b) | Per share amounts and ratios to average net assets include income and expenses of the Kotak Mauritius Portfolio (wholly-owned subsidiary). |
| (c) | Calculated using the average shares method. |
| (d) | Less than $0.005 per share. |
| (e) | Total returns are for the period indicated and have not been annualized. Total returns would have been lower had certain expenses not been waived during the period. Returns shown do not reflect the deduction of taxes that a shareholder would pay on Fund distributions or the redemption of Fund shares. Returns shown exclude any applicable sales charges. |
| (f) | Annualized. |
| (g) | According to the Fund’s shareholder services plan with respect to the Fund’s Class A shares, any amount of such payment not paid during the Fund’s fiscal year for such service activities shall be reimbursed to the Fund as soon as practical after the end of the fiscal year. Fees were reimbursed to the Fund during the year ended October 31, 2014, for the prior fiscal year in the amount of 0.10% of average net assets of Class A shares and during the year ended April 30, 2014, for the prior fiscal year in the amount of 0.12% of average net assets of Class A shares. |
| (h) | Portfolio turnover rate for periods less than one full year have not been annualized. |
See Notes to Financial Statements.
| 43 | October 31, 2014 |
| ALPS | Kotak India Growth Fund – Class C | ||
| Consolidated Financial Highlights | ||
Selected data for a share of beneficial interest outstanding throughout the periods indicated: | ||
| For the Fiscal Period Ended October 31, 2014(a)(b) | For the Year April 30, 2014(b) | For the Year April 30, 2013(b) | For the Year April 30, 2012(b) | For the Period February 14, 2011 (Inception) to April 30, 2011(b) | |||||
Net asset value, beginning of period | $9.77 | $9.34 | $8.15 | $10.32 | $10.00 | |||||
INCOME/(LOSS) FROM INVESTMENT OPERATIONS: | ||||||||||
Net investment loss(c) | (0.03) | (0.09) | (0.12) | (0.13) | (0.05) | |||||
Net realized and unrealized gain/(loss) | 3.14 | 0.52 | 1.31 | (2.03) | 0.37 | |||||
Total from investment operations | 3.11 | 0.43 | 1.19 | (2.16) | 0.32 | |||||
DISTRIBUTIONS: | ||||||||||
From net realized gains | – | – | – | (0.01) | – | |||||
Total distributions | – | – | – | (0.01) | – | |||||
REDEMPTION FEES ADDED TO PAID-IN CAPITAL (NOTE 6) | 0.00(d) | – | – | 0.00(d) | – | |||||
Net increase/(decrease) in net asset value | 3.11 | 0.43 | 1.19 | (2.17) | 0.32 | |||||
Net asset value, end of year | $12.88 | $9.77 | $9.34 | $8.15 | $10.32 | |||||
TOTAL RETURN(e) | 31.83% | 4.60% | 14.60% | (20.97)% | 3.20% | |||||
RATIOS/SUPPLEMENTAL DATA: | ||||||||||
Net assets, end of period (000s) | $1,497 | $875 | $924 | $435 | $466 | |||||
Ratio of expenses to average net assets excluding fee waivers and reimbursements | 5.57%(f) | 7.26% | 8.54% | 13.39% | 69.64%(f) | |||||
Ratio of expenses to average net assets including fee waivers and reimbursements | 2.60%(f) | 2.60% | 2.60% | 2.60% | 2.60%(f) | |||||
Ratio of net investment loss to average net assets | (0.50)%(f) | (1.00)% | (1.42)% | (1.49)% | (2.42)%(f) | |||||
Portfolio turnover rate(g) | 28% | 65% | 93% | 114% | 9% | |||||
| (a) | Effective May 1, 2014, the Board approved changing the fiscal year-end of the Funds from April 30 to October 31. |
| (b) | Per share amounts and ratios to average net assets include income and expenses of the Kotak Mauritius Portfolio (wholly-owned subsidiary). |
| (c) | Calculated using the average shares method. |
| (d) | Less than $0.005 per share. |
| (e) | Total returns are for the period indicated and have not been annualized. Total returns would have been lower had certain expenses not been waived during the period. Returns shown do not reflect the deduction of taxes that a shareholder would pay on Fund distributions or the redemption of Fund shares. Returns shown exclude any applicable sales charges. |
| (f) | Annualized. |
| (g) | Portfolio turnover rate for periods less than one full year have not been annualized. |
| See | Notes to Financial Statements. |
| 44 | October 31, 2014 |
| ALPS | Kotak India Growth Fund – Class I | ||
Consolidated Financial Highlights Selected data for a share of beneficial interest outstanding throughout the periods indicated: | ||
| For the Fiscal Period Ended October 31, 2014(a)(b) | For the Year Ended | For the Year Ended | For the Year Ended April 30, 2012(b) | For the Period 2011 (Inception) to April 30, 2011(b) | ||||||
Net asset value, beginning of period | $10.04 | $9.55 | $8.25 | $10.34 | $10.00 | |||||
INCOME/(LOSS) FROM INVESTMENT OPERATIONS: | ||||||||||
Net investment income/(loss)(c) | 0.03 | 0.00(d) | (0.04) | (0.04) | (0.03) | |||||
Net realized and unrealized gain/(loss) | 3.22 | 0.54 | 1.34 | (2.04) | 0.37 | |||||
| ||||||||||
Total from investment operations | 3.25 | 0.54 | 1.30 | (2.08) | 0.34 | |||||
| ||||||||||
DISTRIBUTIONS: | ||||||||||
From net investment income | – | (0.05) | – | – | – | |||||
From net realized gains | – | – | – | (0.01) | – | |||||
| ||||||||||
Total distributions | – | (0.05) | – | (0.01) | – | |||||
| ||||||||||
REDEMPTION FEES ADDED TO PAID-IN CAPITAL (NOTE 6) | 0.00(d) | – | 0.00(d) | 0.00(d) | – | |||||
| ||||||||||
Net increase/(decrease) in net asset value | 3.25 | 0.49 | 1.30 | (2.09) | 0.34 | |||||
| ||||||||||
Net asset value, end of year | $13.29 | $10.04 | $9.55 | $8.25 | $10.34 | |||||
| ||||||||||
TOTAL RETURN(e) | 32.37% | 5.70% | 15.76% | (20.23)% | 3.50% | |||||
RATIOS/SUPPLEMENTAL DATA: | ||||||||||
Net assets, end of period (000s) | $8,955 | $1,945 | $2,149 | $1,609 | $568 | |||||
Ratio of expenses to average net assets excluding fee waivers and reimbursements | 4.49%(f) | 6.28% | 7.65% | 12.05% | 96.67%(f) | |||||
Ratio of expenses to average net assets including fee waivers and reimbursements | 1.60%(f) | 1.60% | 1.60% | 1.60% | 1.60%(f) | |||||
Ratio of net investment income/(loss) to average net assets | 0.50%(f) | 0.00%(g) | (0.42)% | (0.49)% | (1.36)%(f) | |||||
Portfolio turnover rate(h) | 28% | 65% | 93% | 114% | 9% | |||||
| (a) | Effective May 1, 2014, the Board approved changing the fiscal year-end of the Funds from April 30 to October 31. |
| (b) | Per share amounts and ratios to average net assets include income and expenses of the Kotak Mauritius Portfolio (wholly-owned subsidiary). |
| (c) | Calculated using the average shares method. |
| (d) | Less than $0.005 per share. |
| (e) | Total returns are for the period indicated and have not been annualized. Total returns would have been lower had certain expenses not been waived during the period. Returns shown do not reflect the deduction of taxes that a shareholder would pay on Fund distributions or the redemption of Fund shares. |
| (f) | Annualized. |
| (g) | Less than 0.005% |
| (h) | Portfolio turnover rate for periods less than one full year have not been annualized. |
See Notes to Financial Statements.
| 45 | October 31, 2014 |
| ALPS Real Asset Income Fund | ||
| Management Commentary | October 31, 2014 (Unaudited) |
During the six month period ending October 31, 2014 the ALPS Real Asset Income Fund’s Class I Shares produced a negative return of -0.36% compared to a return of 8.22% for the S&P 500 Index and 2.48% for the MSCI World Index.
The Fund employs a strategy that combines investments in Commodities, Global Infrastructure and Master Limited Partnerships (“MLPs”). At the end of October the Fund allocated approximately 30% of its total investments toward commodity-related investments, 43% toward global infrastructure securities and 27% toward MLPs.
During the period the Fund paid two distributions:
$0.10692 per share on June 26, 2014
$0.13287 per share on September 26, 2014
Performance in the period was negatively impacted by several macroeconomic events, most notably the continued weakness in commodity prices. The decline in commodity prices negatively impacted the Fund’s investments in both commodity futures and commodity producing equities, as well investments in energy-related infrastructure and MLPs. Prices trended lower due to a combination of weak demand from the world’s major economies, a strong US dollar and increasing supplies of both agricultural and energy related commodities.
Despite the efforts of central bankers in Europe and Japan, economic growth remained sluggish and failed to provide much of a tailwind for commodity consumption. Weak demand was further exacerbated by the strength of the US Dollar, which increased by 9.37% as measured by the US Dollar Index for the six month period ending October 31, 2014. As most commodities are priced in US Dollars, an increase in the value of the dollar typically results in negative performance for commodities, all other factors left alone. Finally, ideal weather conditions resulted in record crop yields for several agricultural commodities, causing cotton, soybeans, corn and wheat prices to decline 32%, 29%, 27% and 25%, respectively.
Perhaps the most notable event of the period, however, was the precipitous drop in the price of crude oil. From its peak in June at $107.49, West Texas Intermediate (WTI) fell more than 25% to settle at $80.53 at the end of October. Increased US energy production helped fuel fears of global supply outpacing demand. Uncertainty about the ability and or willingness of OPEC to curtail production amid the drop in prices also contributed to volatility in the energy markets, particularly in September and October. The decline in oil prices primarily impacted the Fund’s investments in commodity futures, such as crude oil and natural gas, as well as commodity producing equities in the oil and gas sector. While the majority of MLPs operate toll-road business models that rarely take title to the underlying commodity, there were a few weeks where MLPs were not immune to the headline risk of falling oil prices.
Despite the volatility in commodity prices, we strongly believe that the long term fundamental drivers of commodity demand and ultimately higher prices are still in place. Population growth is likely to remain unabated regardless of the economic environment in the US and Europe. A billion more people will be added to the world population over the next decade. The increase of wealth distribution to the developing world as those economies grow at rapid rates relative to the slow or negative growth occurring in the developed countries is contributing to ever increasing demand for raw materials and food. MLP-owned energy infrastructure assets, including pipelines, storage facilities, and processing plants, are and will be the bridge by which the reserves and production in supply basins make their way to demand centers. Our outlook for the global infrastructure investment universe remains positive, as investors continue to remain attracted to the stability of the cash flows and growth prospects that the high-yielding infrastructure universe could potentially deliver.
Jeremy Held
Director of Research
The views and information discussed in this commentary are as of the date of publication, are subject to change, and may not reflect the writer’s current views. The views expressed represent an assessment of market conditions at a specific point in time, are opinions only and should not be relied upon as investment advice regarding a particular investment or markets in general. Such information does not constitute a recommendation to buy or sell specific securities or investment vehicles. It should not be assumed that any investment will be profitable or will equal the performance of the fund(s) or any securities or any sectors mentioned in this letter. The subject matter contained in this letter has been derived from several sources believed to be reliable and accurate at the time of compilation. Neither the Fund nor the Fund’s sub-advisors, RREEF America LLC and CoreCommodity Management, LLC, accept any liability for losses either direct or consequential caused by the use of this information.
MSCI World Index: Morgan Stanley Capital International’s market capitalization weighted index is composed of companies representative of the market structure of 22 developed market countries in North America, Europe and the Asia/Pacific Region. The index is not actively managed and does not reflect any deduction for fees, expenses or taxes. An investor may not invest directly in an index.
US Dollar Index: A measure of the value of the U.S. Dollar relative to a majority of the United States’ most significant trading partners.
| 46 | October 31, 2014 |
| ALPS Real Asset Income Fund | ||
| Performance Update | October 31, 2014 (Unaudited) |
Performance of $10,000 Initial Investment (as of October 31, 2014)
Comparison of change in value of a $10,000 investment (includes maximum sales charges of 5.50%)
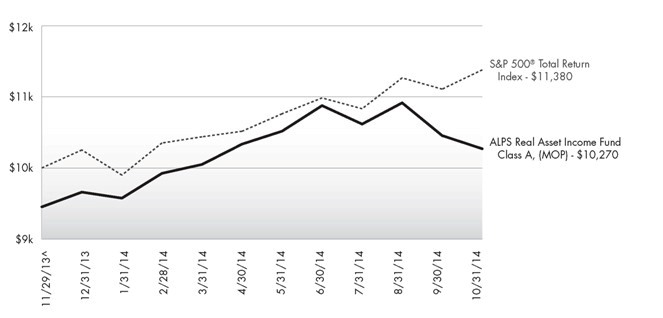
The chart above represents historical performance of a hypothetical investment of $10,000 in the Fund since inception. Past performance does not guarantee future results. This chart does not reflect the deduction of taxes that a shareholder would pay on Fund distributions or the redemption of Fund shares.
Average Annual Total Returns (as of October 31, 2014)
| 6 Month | Since Inception ^ | Total Expense Ratio | What You Pay * | |||||
Class A (NAV) | -0.63% | 8.65% | 1.54% | 1.40% | ||||
Class A (MOP) | -6.10% | 2.70% | ||||||
Class C (NAV) | -0.93% | 8.12% | 2.14% | 2.00% | ||||
Class C (CDSC) | -1.90% | 7.12% | ||||||
Class I | -0.36% | 9.14% | 1.14% | 1.00% | ||||
S&P 500® Total Return Index1 | 8.22% | 13.80% |
Performance data quoted represents past performance. Past performance does not guarantee future results. Investment return and principal value of an investment will fluctuate so that an investor’s shares, when sold or redeemed, may be worth more or less than the original cost. Current performance data may be higher or lower than actual data quoted. For the most current month-end performance data, please call 1-866-759-5679.
Maximum Offering Price (MOP) for Class A shares includes the Fund’s maximum sales charge of 5.50%. Performance shown at NAV does not include these sales charges and would have been lower had it been taken into account. If you invest $1 million or more, either as a lump sum or through the Fund’s accumulation or letter of intent programs, you can purchase Class A shares without an initial sales charge (load). A Contingent Deferred Sales Charge (“CDSC”) of 1.00% may apply to Class C shares redeemed within the first 12 months after a purchase, and on Class A shares redeemed within the first 18 months after a purchase in excess of $1 million.
Performance less than 1 year is cumulative.
Investments in securities of MLPs involve risks that differ from an investment in common stock. MLPs are controlled by their general partners, which generally have conflicts of interest and limited fiduciary duties to the MLP, which may permit the general partner to favor its own interests over the MLPs. The benefit you are expected to derive from the Fund’s investment in MLPs depends largely on the MLPs being treated as partnerships for
| 47 | October 31, 2014 |
| ALPS Real Asset Income Fund | ||
| Performance Update | October 31, 2014 (Unaudited) |
federal income tax purposes. As a partnership, an MLP has no federal income tax liability at the entity level. Therefore, treatment of one or more MLPs as a corporation for federal income tax purposes could affect the Fund’s ability to meet its investment objective and would reduce the amount of cash available to pay or distribute to you. Legislative, judicial, or administrative changes and differing interpretations, possibly on a retroactive basis, could negatively impact the value of an investment in MLPs and therefore the value of your investment in the Fund.
| 1 | The S&P 500® Index is the Standard & Poor’s composite index of 500 stocks, a widely recognized, unmanaged index of common stock prices. The index is not actively managed and does not reflect any deduction for fees, expenses or taxes. An investor may not invest directly in an index. |
| ^ | Fund inception date of November 29, 2013. |
| * | What You Pay reflects the Advisor’s decision to contractually limit expenses through February 28, 2015. Please see the prospectus for additional information. |
There is no guarantee that the Fund will continue to hold any one particular security or stay invested in any one particular company. The composition of the Fund’s top holdings is subject to change. Performance figures are historical and reflect the change in share price, reinvested distributions, changes in net asset value, sales charges and capital gains distributions, if any.
Not FDIC Insured – No Bank Guarantee – May Lose Value
Investing in commodity-related securities involves risk and considerations not present when investing in more conventional securities. The Fund may be more susceptible to high volatility of commodity markets.
Derivatives generally are more sensitive to changes in economic or market conditions than other types of investments; this could result in losses that significantly exceed the Fund’s original investment.
Top Ten Holdings (as a % of Net Assets) †
UBS AG Commodity-Linked Note Linked to the Thomson Reuter/Jefferies CRB 3 Month Forward Index,0.00% | 2.61 | % | ||
Bank of America Corp., Commodity-Linked Note Linked to the Merrill Lynch Commodity Index eXtra J-Series F3 Total Return Index, 0.00% | 2.59 | % | ||
Kinder Morgan Energy Partners LP | 2.44 | % | ||
PowerShares DB Commodity Index Tracking Fund ETF | 2.39 | % | ||
Enterprise Products Partners LP | 2.25 | % | ||
Energy Transfer Partners LP | 2.06 | % | ||
ELEMENTS Linked to the Rogers International Commodity Index - Total Return ETN | 2.02 | % | ||
Terna Rete Elettrica Nazionale SpA | 2.01 | % | ||
Westshore Terminals Investment Corp. | 2.00 | % | ||
Snam SpA | 1.95 | % | ||
Top Ten Holdings | 22.32 | % |
| † | Holdings are subject to change. Table presents approximate values only. |
Portfolio Composition (as a % of Net Assets)
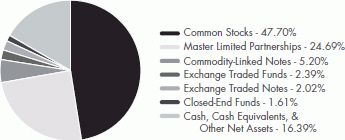
| 48 | October 31, 2014 |
| ALPS Real Asset Income Fund | ||
| Consolidated Statement of Investments | October 31, 2014 |
| Shares | Value (Note 2) | |||||||
| ||||||||
CLOSED-END FUNDS (1.61%) |
| |||||||
HICL Infrastructure Co. Ltd. | 12,400 | $ | 29,397 | |||||
International Public Partnerships Ltd. | 13,300 | 29,510 | ||||||
|
| |||||||
| 58,907 | ||||||||
|
| |||||||
TOTAL CLOSED-END FUNDS (Cost $53,968) | 58,907 | |||||||
|
| |||||||
COMMON STOCKS (47.70%) | ||||||||
Basic Materials (4.44%) | ||||||||
Chemicals (2.84%) | ||||||||
CF Industries Holdings, Inc. | 137 | 35,620 | ||||||
Monsanto Co. | 164 | 18,867 | ||||||
The Mosaic Co. | 443 | 19,629 | ||||||
Potash Corp. of Saskatchewan, | 867 | 29,625 | ||||||
|
| |||||||
| 103,741 | ||||||||
|
| |||||||
Iron/Steel (0.49%) | ||||||||
Carpenter Technology Corp. | 63 | 3,153 | ||||||
Gerdau SA, ADR | 691 | 3,130 | ||||||
Steel Dynamics, Inc. | 133 | 3,060 | ||||||
Vale SA, ADR | 828 | 8,355 | ||||||
|
| |||||||
| 17,698 | ||||||||
|
| |||||||
Mining (1.11%) | ||||||||
Goldcorp, Inc. | 862 | 16,189 | ||||||
Kinross Gold Corp.(a) | 3,189 | 6,856 | ||||||
Rio Tinto PLC, ADR | 166 | 7,963 | ||||||
Southern Copper Corp. | 336 | 9,670 | ||||||
|
| |||||||
| 40,678 | ||||||||
|
| |||||||
TOTAL BASIC MATERIALS | 162,117 | |||||||
|
| |||||||
Communications (2.76%) | ||||||||
Telecommunications (2.76%) | ||||||||
Eutelsat Communications SA | 1,300 | 42,128 | ||||||
SES SA | 1,700 | 58,691 | ||||||
|
| |||||||
| 100,819 | ||||||||
|
| |||||||
TOTAL COMMUNICATIONS | 100,819 | |||||||
|
| |||||||
Consumer, Cyclical (2.00%) | ||||||||
Storage/Warehousing (2.00%) | ||||||||
Westshore Terminals Investment Corp. | 2,400 | 73,147 | ||||||
|
| |||||||
TOTAL CONSUMER, CYCLICAL |
| 73,147 | ||||||
|
| |||||||
| Shares | Value (Note 2) | |||||||
| ||||||||
Consumer, Non-Cyclical (6.02%) |
| |||||||
Commercial Services (5.22%) | ||||||||
Atlantia SpA | 3,000 | $ | 70,677 | |||||
Jiangsu Expressway Co. Ltd., Class H | 55,200 | 61,641 | ||||||
Zhejiang Expressway Co. Ltd., Class H | 58,000 | 58,485 | ||||||
|
| |||||||
| 190,803 | ||||||||
|
| |||||||
Food (0.80%) | ||||||||
Tyson Foods, Inc., Class A | 722 | 29,133 | ||||||
|
| |||||||
TOTAL CONSUMER, |
| 219,936 | ||||||
|
| |||||||
Energy (13.01%) | ||||||||
Energy-Alternate Sources (2.75%) |
| |||||||
Pattern Energy Group, Inc. | 1,429 | 41,127 | ||||||
TransAlta Renewables, Inc. | 5,500 | 59,292 | ||||||
|
| |||||||
| 100,419 | ||||||||
|
| |||||||
Oil & Gas (4.31%) | ||||||||
Chevron Corp. | 133 | 15,953 | ||||||
ConocoPhillips | 243 | 17,532 | ||||||
Eni SpA, ADR | 377 | 16,023 | ||||||
HollyFrontier Corp. | 114 | 5,173 | ||||||
Marathon Oil Corp. | 537 | 19,010 | ||||||
Marathon Petroleum Corp. | 314 | 28,543 | ||||||
Murphy Oil Corp. | 383 | 20,448 | ||||||
Occidental Petroleum Corp. | 185 | 16,452 | ||||||
Valero Energy Corp. | 362 | 18,133 | ||||||
|
| |||||||
| 157,267 | ||||||||
|
| |||||||
Pipelines (5.95%) | ||||||||
Inter Pipeline Ltd. | 1,400 | 44,110 | ||||||
Spectra Energy Corp. | 1,100 | 43,043 | ||||||
TransCanada Corp. | 1,400 | 69,003 | ||||||
The Williams Cos, Inc. | 1,100 | 61,061 | ||||||
|
| |||||||
| 217,217 | ||||||||
|
| |||||||
TOTAL ENERGY | 474,903 | |||||||
|
| |||||||
Industrial (0.84%) | ||||||||
Environmental Control (0.84%) |
| |||||||
Pennon Group PLC | 2,300 | 30,667 | ||||||
|
| |||||||
TOTAL INDUSTRIAL | 30,667 | |||||||
|
| |||||||
Industrials (3.99%) | ||||||||
Engineering & Construction (2.43%) |
| |||||||
Ferrovial SA | 2,200 | 44,883 | ||||||
| 49 | October 31, 2014 |
| ALPS Real Asset Income Fund | ||
| Consolidated Statement of Investments | October 31, 2014 |
| Shares | Value (Note 2) | |||||||
| ||||||||
Engineering & Construction (continued) |
| |||||||
Sydney Airport | 11,300 | $ | 43,853 | |||||
|
| |||||||
| 88,736 | ||||||||
|
| |||||||
Machinery-Construction & Mining (0.22%) |
| |||||||
Joy Global, Inc. | 150 | 7,895 | ||||||
|
| |||||||
Machinery-Diversified (0.19%) |
| |||||||
AGCO Corp. | 152 | 6,735 | ||||||
|
| |||||||
Transportation (1.15%) | ||||||||
Hutchison Port Holdings Trust | 62,400 | 42,120 | ||||||
|
| |||||||
TOTAL INDUSTRIALS | 145,486 | |||||||
|
| |||||||
Utilities (14.64%) | ||||||||
Electric (6.64%) | ||||||||
AusNet Services | 23,800 | 28,798 | ||||||
DUET Group | 13,400 | 29,008 | ||||||
PG&E Corp. | 1,000 | 50,320 | ||||||
Spark Infrastructure Group | 17,700 | 29,595 | ||||||
Terna Rete Elettrica Nazionale | 14,600 | 73,513 | ||||||
Transmissora Alianca | 4,200 | 31,188 | ||||||
|
| |||||||
| 242,422 | ||||||||
|
| |||||||
Gas (6.30%) | ||||||||
Enagas SA | 1,100 | 36,874 | ||||||
Hong Kong & China Gas Co. Ltd. | 19,510 | 45,535 | ||||||
Keyera Corp. | 400 | 31,821 | ||||||
National Grid PLC | 3,000 | 44,440 | ||||||
Snam SpA | 13,200 | 71,294 | ||||||
|
| |||||||
| 229,964 | ||||||||
|
| |||||||
Water (1.70%) | ||||||||
Severn Trent PLC | 1,000 | 31,930 | ||||||
United Utilities Group PLC | 2,200 | 30,072 | ||||||
|
| |||||||
| 62,002 | ||||||||
|
| |||||||
TOTAL UTILITIES | 534,388 | |||||||
|
| |||||||
TOTAL COMMON STOCKS (Cost $1,642,501) |
| 1,741,463 | ||||||
|
| |||||||
EXCHANGE TRADED FUNDS (2.39%) |
| |||||||
PowerShares DB Commodity Index Tracking Fund | 3,900 | 87,048 | ||||||
|
| |||||||
TOTAL EXCHANGE TRADED FUNDS (Cost $99,456) |
| 87,048 | ||||||
|
| |||||||
| Shares | Value (Note 2) | |||||||
| ||||||||
EXCHANGE TRADED NOTES (2.02%) |
| |||||||
ELEMENTS Linked to the Rogers International Commodity | 10,000 | $ | 73,900 | |||||
|
| |||||||
TOTAL EXCHANGE TRADED NOTES (Cost $80,542) |
| 73,900 | ||||||
|
| |||||||
MASTER LIMITED PARTNERSHIPS (24.69%) |
| |||||||
Energy (24.69%) | ||||||||
Pipelines (24.69%) | ||||||||
Access Midstream Partners LP | 476 | 29,650 | ||||||
Atlas Pipeline Partners LP | 357 | 13,102 | ||||||
Buckeye Partners LP | 568 | 42,827 | ||||||
Crestwood Midstream Partners LP | 701 | 13,943 | ||||||
DCP Midstream Partners LP | 403 | 21,339 | ||||||
El Paso Pipeline Partners LP | 643 | 26,138 | ||||||
Enbridge Energy Partners LP | 971 | 35,024 | ||||||
Energy Transfer Partners LP | 1,166 | 75,125 | ||||||
EnLink Midstream Partners LP | 433 | 12,990 | ||||||
Enterprise Products Partners LP | 2,226 | 82,139 | ||||||
EQT Midstream Partners LP | 184 | 16,299 | ||||||
Genesis Energy LP | 342 | 16,409 | ||||||
Kinder Morgan Energy Partners LP | 950 | 89,110 | ||||||
Magellan Midstream Partners LP | 812 | 66,478 | ||||||
MarkWest Energy Partners LP | 818 | 57,301 | ||||||
NuStar Energy LP | 305 | 18,544 | ||||||
ONEOK Partners LP | 730 | 37,303 | ||||||
Plains All American Pipeline LP | 1,100 | 61,985 | ||||||
Regency Energy Partners LP | 1,385 | 41,550 | ||||||
Spectra Energy Partners LP | 236 | 12,744 | ||||||
Sunoco Logistics Partners LP | 668 | 31,884 | ||||||
Targa Resources Partners LP | 474 | 28,952 | ||||||
Tesoro Logistics LP | 176 | �� | 9,909 | |||||
Western Gas Partners LP | 318 | 22,228 | ||||||
Williams Partners LP | 744 | 38,353 | ||||||
|
| |||||||
| 901,326 | ||||||||
|
| |||||||
TOTAL ENERGY | 901,326 | |||||||
|
| |||||||
TOTAL MASTER LIMITED PARTNERSHIPS (Cost $813,033) |
| 901,326 | ||||||
|
| |||||||
| 50 | October 31, 2014 |
| ALPS Real Asset Income Fund | ||
| Consolidated Statement of Investments | October 31, 2014 |
| Principal Amount | Value (Note 2) | |||||||
| ||||||||
COMMODITY-LINKED NOTES (5.20%) |
| |||||||
Bank of America Corp., | $ | 100,000 | $ | 94,586 | ||||
UBS AG Commodity-Linked | 100,000 | 95,338 | ||||||
|
| |||||||
TOTAL COMMODITY-LINKED NOTES (Cost $200,000) |
| 189,924 | ||||||
|
| |||||||
7-Day Yield | Shares | Value (Note 2) | ||||||||||
| ||||||||||||
SHORT TERM INVESTMENTS (9.34%) |
| |||||||||||
Money Market Funds (9.34%) |
| |||||||||||
Dreyfus Treasury Prime Institutional Fund | 0.011 | % | 311,935 | 311,935 | ||||||||
Morgan Stanley Institutional Liquidity Fund, Prime Portfolio | 0.045 | % | 28,992 | 28,992 | ||||||||
|
| |||||||||||
TOTAL SHORT TERM INVESTMENTS (Cost $340,927) |
| 340,927 | ||||||||||
|
| |||||||||||
TOTAL INVESTMENTS (92.95%) (Cost $3,230,427) |
| $ | 3,393,495 | |||||||||
SEGREGATED CASH (4.13%)(c) |
| 150,659 | ||||||||||
Other Assets In Excess Of Liabilities (2.92%) |
| 106,833 | ||||||||||
|
| |||||||||||
NET ASSETS (100.00%) |
| $ | 3,650,987 | |||||||||
|
| |||||||||||
SCHEDULE OF WRITTEN OPTIONS | Expiration Date | Exercise Price | Contracts | Value | ||||||||||||
| ||||||||||||||||
Written | ||||||||||||||||
Market Vectors Agribusiness ETF | 11/22/2014 | 55.00 | (6 | ) | (75 | ) | ||||||||||
SCHEDULE OF WRITTEN OPTIONS | Expiration Date | Exercise Price | Contracts | Value | ||||||||||||
| ||||||||||||||||
Written Call Options (Continued) |
| |||||||||||||||
SPDR Gold | 11/22/2014 | $ | 117.00 | (1 | ) | $ | (59 | ) | ||||||||
|
| |||||||||||||||
TOTAL WRITTEN CALL OPTIONS (Premiums received $551) |
| $ | (134 | ) | ||||||||||||
|
| |||||||||||||||
TOTAL WRITTEN OPTIONS (Premiums received $551) |
| $ | (134 | ) | ||||||||||||
|
| |||||||||||||||
| (a) | Non-Income Producing Security. |
| (b) | Floating or variable rate security. Interest rate disclosed is that which is in effect at October 31, 2014. |
| (c) | Cash is being held as collateral for written options. |
Common Abbreviations:
ADR - American Depositary Receipt.
ETF - Exchange Traded Fund.
LP - Limited Partnership.
Ltd. - Limited.
PLC - Public Limited Company.
SA - Generally designates corporations in various
countries, mostly those employing the civil law.
SpA - Societa’ Per Azioni is an Italian shared company.
SPDR - Standard and Poor’s Depositary Receipt.
For Fund compliance purposes, the Fund’s industry classifications refer to any one or more of the industry sub-classifications used by one or more widely recognized market indexes or ratings group indexes, and/or as defined by Fund management. This definition may not apply for purposes of this report, which may combine industry sub-classifications for reporting ease. Industries are shown as a percent of net assets.
See Notes to Financial Statements.
| 51 | October 31, 2014 |
| ALPS Real Asset Income Fund | ||
| Consolidated Statement of Assets and Liabilities | October 31, 2014 |
ASSETS | ||||
Investments, at value | $ | 3,393,495 | ||
Cash | 34,108 | |||
Foreign currency, at value (Cost $6,570) | 6,508 | |||
Receivable for investments sold | 59,639 | |||
Cash collateral pledged for written options | 150,659 | |||
Dividends receivable | 9,128 | |||
Receivable due from advisor | 20,241 | |||
Deferred offering costs | 3,679 | |||
Prepaid expenses and other assets | 29,896 | |||
| ||||
Total Assets | 3,707,353 | |||
| ||||
LIABILITIES | ||||
Written options, at value (premiums received $551) | 134 | |||
Administration and transfer agency fees payable | 14,420 | |||
Distribution and services fees payable | 1,443 | |||
Professional fees payable | 23,885 | |||
Accrued expenses and other liabilities | 16,484 | |||
| ||||
Total Liabilities | 56,366 | |||
| ||||
NET ASSETS | $ | 3,650,987 | ||
| ||||
NET ASSETS CONSIST OF | ||||
Paid-in capital | $ | 3,451,227 | ||
Accumulated net investment loss | (4,939) | |||
Accumulated net realized gain on investments, written options and foreign currency transactions | 41,300 | |||
Net unrealized appreciation on investments, written options and translation of assets and liabilities denominated in foreign currencies | 163,399 | |||
| ||||
NET ASSETS | $ | 3,650,987 | ||
| ||||
INVESTMENTS, AT COST | $ | 3,230,427 | ||
| ||||
PRICING OF SHARES | ||||
Class A: | ||||
Net Asset Value, offering and redemption price per share(a) | $ | 10.52 | ||
Net Assets | $ | 786,528 | ||
Shares of beneficial interest outstanding (unlimited number of shares, no par value common stock authorized) | 74,732 | |||
Maximum offering price per share ((NAV/0.9450), based on maximum sales charge of 5.50% of the offering price) | $ | 11.13 | ||
Class C: | ||||
Net Asset Value, offering and redemption price per share(a) | $ | 10.50 | ||
Net Assets | $ | 540,564 | ||
Shares of beneficial interest outstanding (unlimited number of shares, no par value common stock authorized) | 51,487 | |||
Class I: | ||||
Net Asset Value, offering and redemption price per share | $ | 10.51 | ||
Net Assets | $ | 2,323,895 | ||
Shares of beneficial interest outstanding (unlimited number of shares, no par value common stock authorized) | 221,171 | |||
| (a) | Redemption price per share may be reduced for any applicable contingent deferred sales charge. For a description of a possible sales charge, please see the Fund’s Prospectus. |
| See Notes to Financial Statements. |
| 52 | October 31, 2014 |
| ALPS Real Asset Income Fund | ||
| Consolidated Statement of Operations | For the Period November 30, 2013 (Commencement) to October 31, 2014 |
INVESTMENT INCOME | ||||
Dividends | $ | 102,508 | ||
Foreign taxes withheld on dividends | (5,477) | |||
| ||||
Total Investment Income | 97,031 | |||
| ||||
EXPENSES | ||||
Investment advisory fees | 24,534 | |||
Administrative and transfer agency fees | 143,443 | |||
Distribution and service fees | ||||
Class A | 2,207 | |||
Class C | 4,957 | |||
Professional fees | 24,540 | |||
Networking fees | ||||
Class I | 2,019 | |||
Reports to shareholders and printing fees | 7,779 | |||
State registration fees | 8,970 | |||
SEC registration fees | 399 | |||
Custody fees | 18,053 | |||
Trustees’ fees and expenses | 5,079 | |||
Offering costs | 70,657 | |||
Miscellaneous expenses | 15,356 | |||
| ||||
Total Expenses | 327,993 | |||
| ||||
Less fees waived/reimbursed by investment advisor (Note 7) | ||||
Class A | (51,445) | |||
Class C | (46,721) | |||
Class I | (191,995) | |||
| ||||
Net Expenses | 37,832 | |||
| ||||
Net Investment Income | 59,199 | |||
| ||||
Net realized gain on investments | 26,297 | |||
Net realized gain on written options | 2,135 | |||
Net realized gain on foreign currency transactions | 165 | |||
Net change in unrealized appreciation on investments | 163,068 | |||
Net change in unrealized appreciation on written options | 417 | |||
Net change in unrealized depreciation on translation of assets and liabilities denominated in foreign currencies | (86) | |||
| ||||
NET REALIZED AND UNREALIZED GAIN ON INVESTMENTS | 191,996 | |||
| ||||
NET INCREASE IN NET ASSETS RESULTING FROM OPERATIONS | $ | 251,195 | ||
| ||||
| See Notes to Financial Statements. |
| 53 | October 31, 2014 |
| ALPS Real Asset Income Fund | ||
| Consolidated Statement of Changes in Net Assets |
For the Period November 30, 2013 (Commencement) to October 31, 2014 | ||||
| ||||
OPERATIONS | ||||
Net investment income | $ | 59,199 | ||
Net realized gain on investments, written options, securities sold short and foreign currency transactions | 28,597 | |||
Net change in unrealized appreciation on investments, written options and translation of assets and liabilities denominated in foreign currencies | 163,399 | |||
| ||||
Net Increase in Net Assets Resulting from Operations | 251,195 | |||
| ||||
DISTRIBUTIONS | ||||
Dividends to shareholders from net investment income | ||||
Class A | (20,129) | |||
Class C | (16,043) | |||
Class I | (84,688) | |||
| ||||
Net Decrease in Net Assets from Distributions | (120,860) | |||
| ||||
BENEFICIAL INTEREST TRANSACTIONS (NOTE 6) | ||||
Shares sold | ||||
Class A | 780,396 | |||
Class C | 500,030 | |||
Class I | 2,150,030 | |||
Dividends reinvested | ||||
Class A | 19,893 | |||
Class C | 16,043 | |||
Class I | 83,422 | |||
Shares redeemed | ||||
Class A | (29,102) | |||
Class C | (30) | |||
Class I | (30) | |||
| ||||
Net Increase in Net Assets Derived from Beneficial Interest Transactions | 3,520,652 | |||
| ||||
Net increase in net assets | 3,650,987 | |||
NET ASSETS | ||||
Beginning of period | – | |||
| ||||
End of period * | $ | 3,650,987 | ||
| ||||
*Including accumulated net investment loss of: | $ | (4,939) | ||
| See Notes to Financial Statements. |
| 54 | October 31, 2014 |
| ALPS Real Asset Income Fund – Class A | ||
| Consolidated Financial Highlights | ||
Selected data for a share of beneficial interest outstanding throughout the period indicated:
| For the Period November 30, 2013 October 31, 2014 | |
Net asset value, beginning of period | $10.00 | |
INCOME FROM INVESTMENT OPERATIONS: | ||
Net investment income(a) | 0.17 | |
Net realized and unrealized gain | 0.70 | |
Total from investment operations | 0.87 | |
DISTRIBUTIONS: | ||
From net investment income | (0.35) | |
Total distributions | (0.35) | |
Net increase in net asset value | 0.52 | |
Net asset value, end of year | $10.52 | |
TOTAL RETURN(b) | 8.65% | |
RATIOS/SUPPLEMENTAL DATA: | ||
Net assets, end of year (000s) | $787 | |
Ratio of expenses to average net assets excluding fee waivers and reimbursements | 10.72%(c)(d) | |
Ratio of expenses to average net assets including fee waivers and reimbursements | 1.40%(c)(d) | |
Ratio of net investment income to average net assets | 1.76%(c)(d) | |
Portfolio turnover rate(e) | 13% | |
| (a) | Calculated using the average shares method. |
| (b) | Total returns are for the period indicated and have not been annualized. Total returns would have been lower had certain expenses not been waived during the period. Returns shown do not reflect the deduction of taxes that a shareholder would pay on Fund distributions or the redemption of Fund shares. Returns shown exclude any applicable sales charges. |
| (c) | Annualized. |
| (d) | Expense ratios before reductions for startup periods may not be representative of longer term operating periods. |
| (e) | Portfolio turnover rate for periods less than one full year have not been annualized. |
See Notes to Financial Statements. |
| 55 | October 31, 2014 |
| ALPS Real Asset Income Fund – Class C | ||
| Consolidated Financial Highlights | ||
Selected data for a share of beneficial interest outstanding throughout the period indicated:
| For the Period November 30, 2013 October 31, 2014 | |
Net asset value, beginning of period | $10.00 | |
INCOME FROM INVESTMENT OPERATIONS: | ||
Net investment income(a) | 0.12 | |
Net realized and unrealized gain | 0.70 | |
Total from investment operations | 0.82 | |
DISTRIBUTIONS: | ||
From net investment income | (0.32) | |
Total distributions | (0.32) | |
Net increase in net asset value | 0.50 | |
Net asset value, end of year | $10.50 | |
TOTAL RETURN(b) | 8.12% | |
RATIOS/SUPPLEMENTAL DATA: | ||
Net assets, end of year (000s) | $541 | |
Ratio of expenses to average net assets excluding fee waivers and reimbursements | 11.43%(c)(d) | |
Ratio of expenses to average net assets including fee waivers and reimbursements | 2.00%(c)(d) | |
Ratio of net investment income to average net assets | 1.17%(c)(d) | |
Portfolio turnover rate(e) | 13% | |
| (a) | Calculated using the average shares method. |
| (b) | Total returns are for the period indicated and have not been annualized. Total returns would have been lower had certain expenses not been waived during the period. Returns shown do not reflect the deduction of taxes that a shareholder would pay on Fund distributions or the redemption of Fund shares. Returns shown exclude any applicable sales charges. |
| (c) | Annualized. |
| (d) | Expense ratios before reductions for startup periods may not be representative of longer term operating periods. |
| (e) | Portfolio turnover rate for periods less than one full year have not been annualized. |
| See Notes to Financial Statements. |
| 56 | October 31, 2014 |
| ALPS Real Asset Income Fund – Class I | ||
| Consolidated Financial Highlights |
Selected data for a share of beneficial interest outstanding throughout the period indicated:
| For the Period November 30, 2013 (Commencement) to October 31, 2014 | |
Net asset value, beginning of period | $10.00 | |
INCOME FROM INVESTMENT OPERATIONS: | ||
Net investment income(a) | 0.21 | |
Net realized and unrealized gain | 0.71 | |
Total from investment operations | 0.92 | |
DISTRIBUTIONS: | ||
From net investment income | (0.41) | |
Total distributions | (0.41) | |
Net increase in net asset value | 0.51 | |
Net asset value, end of year | $10.51 | |
TOTAL RETURN(b) | 9.14% | |
RATIOS/SUPPLEMENTAL DATA: | ||
Net assets, end of year (000s) | $2,324 | |
Ratio of expenses to average net assets excluding fee waivers and reimbursements | 10.51%(c)(d) | |
Ratio of expenses to average net assets including fee waivers and reimbursements | 1.00%(c)(d) | |
Ratio of net investment income to average net assets | 2.16%(c)(d) | |
Portfolio turnover rate(e) | 13% | |
| (a) | Calculated using the average shares method. |
| (b) | Total returns are for the period indicated and have not been annualized. Total returns would have been lower had certain expenses not been waived during the period. Returns shown do not reflect the deduction of taxes that a shareholder would pay on Fund distributions or the redemption of Fund shares. |
| (c) | Annualized. |
| (d) | Expense ratios before reductions for startup periods may not be representative of longer term operating periods. |
| (e) | Portfolio turnover rate for periods less than one full year have not been annualized. |
| See Notes to Financial Statements. |
| 57 | October 31, 2014 |
| ALPS | Red Rocks Listed Private Equity Fund | ||
| Management Commentary | October 31, 2014 (Unaudited) | |
Overview
Pause Button?
Has the private equity market hit the “pause button”? While certain segments of the listed private equity market indicate that may be the case, the overall market might disagree.
Where are we seeing the “Pause Button”:
| • | Business Development Companies (BDCs) are feeling the effects of upward interest rate expectations coupled with widening spreads in the high yield market. Given the fact that the majority of assets held on a BDC’s balance sheet are loans to private companies, the prospect of higher rates has investors concerned. |
| • | With the recent slowdown in the Euro zone, some private equity firms with large European exposure are beginning to experience muted revenue growth in portfolio companies. This contrasts with valuations for many European businesses that have been at fairly high levels over the past couple of years. So what’s the concern? There appears to be concern over potential mark downs in a private equity firm’s portfolio from a re-rating in valuation multiples. It’s helpful to keep in mind that Europe is not a homogenous set of countries; each country is quite different with different opportunities and risks. |
| • | US based publicly traded alternative asset managers (Blackstone, Carlyle, Apollo, KKR, etc.) have seen their share prices fall 20%-30% from earlier in the year. Why? I have to admit, I’m not really sure. Their business model of raising long dated/locked capital from investors with healthy management and performance fees remains firmly intact. In fact, they continue to exceed most sell side analysts’ expectations in asset gathering. And existing portfolio company exits at strong upticks to most recent valuations continues apace. Something doesn’t make sense here. |
Areas that aren’t experiencing much if any meaningful “Pause”:
| • | US dollar based investments; |
| • | Strong exit market (as previously mentioned); |
| • | Segments of the venture market, social media, healthcare/biotech, cloud based businesses, online retail; and |
| • | Discounts to NAV in listed private equity companies continue to narrow. |
Where does this leave us? As of the writing of this Commentary, much of listed private equity has given back most if not all of the share price gains they experienced earlier in the year. Some are below where they started the year. Is this cause for concern? In our opinion, not really. Private equity as a whole, along with listed private equity, continues to enjoy a good, constructive environment in what they do best: buy, build/fix, and exit.
In 2013 I wrote that an experienced and sharp institutional investor asked me how I would characterize the state of affairs in private equity. What I said then still applies now: “not too hot, not too cold, just about right.”
Portfolio Review
For the six months ended October 31, 2014, the Fund’s Class A shares, LPEFX, returned -5.57%, (Class A delivered a net return of -10.80% at MOP), compared with 2.48%, -4.32% and -1.04% for the MSCI World Index, the Red Rocks Global Listed Private Equity Index and the S&P Listed Private Equity Index, respectively.
During the period, we exited three securities, including: CIR SPA, Oaktree Capital Group and Ratos AB, while we added two securities, including: Ares Capital Corporation and Oakley Capital Investments.
At the end of the period the Fund held 37 holdings in some of the top performing private equity funds/firms from around the globe. Finding, researching and analyzing these investments is what Red Rocks Capital does best. It’s what gets us up in the morning, excited to go to work. And with that, our objective remains a constant: assemble the best global portfolio of listed private equity companies for the benefit of our shareholders.
Net contributors to performance for the period included:
| • | Brookfield Asset Management – Class A |
| • | Harbourvest Global Private Equity |
| • | HBM Healthcare Investments |
Net detractors to performance for the period included:
| • | Ratos AB – B Shares |
| • | Eurazeo |
| • | Wendel |
Outlook
Given the levels of global GDP (positive but muted) and interest rates (low by historical standards), private equity continues to benefit. Yes, valuation multiples in certain businesses look full; but that has not stopped the private equity firms that have demonstrated an expertise in operational improvement from producing positive results. Growth continues to be difficult to come by, but private equity has a knack for finding growth-oriented companies where they can accelerate revenue. Old line businesses are feeling significant (some would say unrelenting) pressure from technology and innovation; a good or bad thing depending on where one sits, but clearly creating an opportunity for savvy investors; private equity being in that category. In summary, private equity looks to be in a good spot.
As always, we appreciate your continued support and interest in Red Rocks and the Listed Private Equity strategy.
Adam Goldman
Co-Portfolio Manager
| 58 | October 31, 2014 |
| ALPS | Red Rocks Listed Private Equity Fund | ||
| Management Commentary | October 31, 2014 (Unaudited) | |
The views and information discussed in this commentary are as of the date of publication, are subject to change, and may not reflect the writer’s current views. The views expressed represent an assessment of market conditions at a specific point in time, are opinions only and should not be relied upon as investment advice regarding a particular investment or markets in general. Such information does not constitute a recommendation to buy or sell specific securities or investment vehicles. It should not be assumed that any investment will be profitable or will equal the performance of the fund(s) or any securities or any sectors mentioned in this letter. The subject matter contained in this letter has been derived from several sources believed to be reliable and accurate at the time of compilation. Neither the Fund nor Red Rocks Capital LLC accepts any liability for losses either direct or consequential caused by the use of this information.
Diversification cannot guarantee gain or prevent losses.
| 59 | October 31, 2014 |
| ALPS | Red Rocks Listed Private Equity Fund | ||
| Performance Update | October 31, 2014 (Unaudited) | |
Performance of $10,000 Initial Investment (as of October 31, 2014)
Comparison of change in value of a $10,000 investment (includes maximum sales charges of 5.50%)
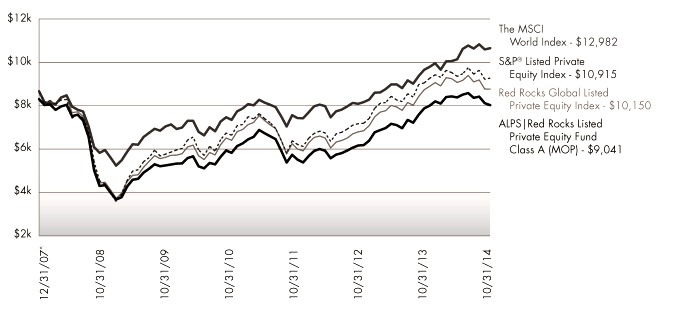
The chart above represents historical performance of a hypothetical investment of $10,000 in the Fund since inception. Past performance does not guarantee future results. This chart does not reflect the deduction of taxes that a shareholder would pay on Fund distributions or the redemption of Fund shares.
Average Annual Total Returns (as of October 31, 2014)
| 6 Month | 1 Year | 3 Year | 5 Year | Since Inception^ | Total Expense Ratio | What You Pay* | ||||||||
Class A (NAV) | -5.57% | 2.59% | 17.27% | 13.44% | -0.65% | 2.34% | 2.34% | |||||||
Class A (MOP) | -10.80% | -3.05% | 15.06% | 12.17% | -1.46% | |||||||||
Class C (NAV) | -5.86% | 2.14% | 16.49% | 12.53% | -1.43% | 2.90% | 2.90% | |||||||
Class C (CDSC) | -6.80% | 1.18% | 16.49% | 12.53% | -1.43% | |||||||||
Class I (NAV) | -5.39% | 2.94% | 17.58% | 13.77% | -0.36% | 1.95% | 1.95% | |||||||
Class R | -5.48% | 2.69% | 17.37% | 13.30% | -0.89% | 2.42% | 2.42% | |||||||
MSCI World Index1 | 2.48% | 9.25% | 15.02% | 12.02% | 3.89% | |||||||||
Red Rocks Global Listed Private Equity Index2 | -4.32% | 0.45% | 16.75% | 13.71% | 0.22% | |||||||||
S&P® LPE Total Return Index3 | -1.04% | 3.18% | 18.37% | 14.61% | 1.29% |
Performance data quoted represents past performance. Past performance does not guarantee future results. Investment return and principal value of an investment will fluctuate so that an investor’s shares, when sold or redeemed, may be worth more or less than the original cost. Current performance data may be higher or lower than actual data quoted. For the most current month-end performance data, please call 1-866-759-5679.
Maximum Offering Price (MOP) for Class A shares includes the Fund’s maximum sales charge of 5.50%. Performance shown at NAV does not include these sales charges and would have been lower had it been taken into account. If you invest $1 million or more, either as a lump sum or through the Fund’s accumulation or letter of intent programs, you can purchase Class A shares without an initial sales charge (load). A Contingent Deferred Sales Charge (“CDSC”) of 1.00% may apply to Class C shares redeemed within the first 12 months after a purchase, and on Class A shares redeemed within the first 18 months after a purchase in excess of $1 million. The Fund imposes a 2.00% redemption fee on shares held for less than 90 days.
Performance less than 1 year is cumulative.
| 60 | October 31, 2014 |
| ALPS | Red Rocks Listed Private Equity Fund | ||
| Performance Update | October 31, 2014 (Unaudited) |
Performance shown for Class C shares prior to June 30, 2010 reflects the historical performance of the Fund’s Class A shares, calculated using the fees and expenses of Class C shares.
| 1 | MSCI World Index: Morgan Stanley Capital International’s market capitalization weighted index is composed of companies representative of the market structure of 22 developed market countries in North America, Europe and the Asia/Pacific Region. The index is not actively managed and does not reflect any deduction for fees, expenses or taxes. An investor may not invest directly in an index. |
| 2 | The Red Rocks Global Listed Private Equity Index replaced the S&P Listed Private Equity Index as the Fund’s secondary index effective March 12, 2014. The Red Rocks Global Listed Private Equity Index includes securities, ADRs and GDRs of 40 to 75 private equity companies, including business development companies, master limited partnerships and other vehicles whose principal business is to invest in, lend capital to or provide services to privately held companies. The Red Rocks Global Listed Private Equity Index is managed by the Fund’s Sub-Advisor. The Advisor and Sub-Advisor made this recommendation to the Board because the new index more closely aligns to the Fund’s investment strategies and investment restrictions. Information on both indices will be shown for a one-year transition period. |
| 3 | S&P® Listed Private Equity Index: The S&P® Listed Private Equity Index is comprised of 30 leading listed private equity companies that meet size, liquidity, exposure, and activity requirements. The index is designed to provide tradable exposure to the leading publicly listed companies in the private equity space. The index is not actively managed and does not reflect any deduction for fees, expenses or taxes. An investor may not invest directly in an index. |
| ^ | Fund inception date of December 31, 2007. |
| * | What You Pay reflects the Advisor’s and Sub-Advisor’s decision to contractually limit expenses through August 31, 2015 and Acquired Fund Fees and Expenses of 0.07%. Please see the current prospectus for additional information. |
The table does not reflect the deduction of taxes that a shareholder would pay on Fund distributions or the redemption of Fund shares.
Listed Private Equity Companies are subject to various risks depending on their underlying investments, which could include, but are not limited to, additional liquidity risk, industry risk, non-U.S. security risk, currency risk, credit risk, managed portfolio risk and derivatives risk (derivatives risk is the risk that the value of the Listed Private Equity Companies’ derivative investments will fall because of pricing difficulties or lack of correlation with the underlying investment).
There are inherent risks in investing in private equity companies, which encompass financial institutions or vehicles whose principal business is to invest in and lend capital to privately held companies. Generally, little public information exists for private and thinly traded companies, and there is a risk that investors may not be able to make a fully informed investment decision.
Listed Private Equity Companies may have relatively concentrated investment portfolios, consisting of a relatively small number of holdings. A consequence of this limited number of investments is that the aggregate returns realized may be adversely impacted by the poor performance of a small number of investments, or even a single investment, particularly if a company experiences the need to write down the value of an investment.
Certain of the Fund’s investments may be exposed to liquidity risk due to low trading volume, lack of a market maker or legal restrictions limiting the ability of the Fund to sell particular securities at an advantageous price and/or time. As a result, these securities may be more difficult to value. Foreign investing involves special risks, such as currency fluctuations and political uncertainty. The Fund invests in derivatives and is subject to the risk that the value of those derivative investments will fall because of pricing difficulties or lack of correlation with the underlying investment.
There is no guarantee that the Fund will continue to hold any one particular security or stay invested in any one particular company. The composition of the Fund’s top holdings is subject to change. Performance figures are historical and reflect the change in share price, reinvested distributions, changes in net asset value, sales charges and capital gains distributions, if any.
Not FDIC Insured – No Bank Guarantee – May Lose Value
| 61 | October 31, 2014 |
| ALPS | Red Rocks Listed Private Equity Fund | ||
| Performance Update | October 31, 2014 (Unaudited) |
Top Ten Holdings (as a % of Net Assets) †
HarbourVest Global Private Equity, Ltd. | 5.81 | % | ||
Eurazeo SA | 5.17 | % | ||
Blackstone Group LP | 4.97 | % | ||
KKR & Co. LP | 4.96 | % | ||
The Carlyle Group LP | 4.47 | % | ||
Onex Corp. | 4.39 | % | ||
Aurelius AG | 4.29 | % | ||
SVG Capital PLC | 4.17 | % | ||
3i Group PLC | 4.12 | % | ||
Wendel SA | 3.91 | % | ||
Top Ten Holdings | 46.26 | % |
| † | Holdings are subject to change. Table presents indicative values only. |
Industry Sector Allocation (as a % of Net Assets)
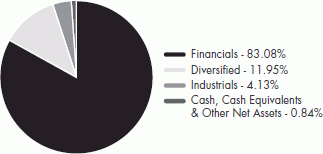
| 62 | October 31, 2014 |
| ALPS | Red Rocks Listed Private Equity Fund | ||
| Statement of Investments | October 31, 2014 |
| Shares | Value (Note 2) | ||||||
COMMON STOCKS (99.16%) | ||||||||
Diversified (11.95%) | ||||||||
Holding Companies-Diversified |
| |||||||
Ackermans & van Haaren N.V. | 124,700 | $ | 15,547,066 | |||||
Remgro, Ltd. | 358,733 | 8,227,954 | ||||||
Schouw & Co. | 318,722 | 14,112,953 | ||||||
Wendel SA | 167,306 | 18,437,436 | ||||||
|
| |||||||
| 56,325,409 | ||||||||
|
| |||||||
TOTAL DIVERSIFIED | 56,325,409 | |||||||
|
| |||||||
Financials (83.08%) | ||||||||
Closed-End Funds (28.25%) |
| |||||||
AP Alternative Assets LP(a) | 112,988 | 3,485,680 | ||||||
Better Capital PCC, Ltd.(a) | 2,000,963 | 2,680,776 | ||||||
Castle Private Equity, Ltd. | 332,681 | 4,823,468 | ||||||
Electra Private Equity | 342,111 | 13,955,449 | ||||||
HarbourVest Global Private Equity, Ltd. | 2,234,321 | 27,403,948 | ||||||
HBM Healthcare Investments AG, Class A | 110,393 | 10,475,374 | ||||||
HgCapital Trust PLC | 736,426 | 12,487,387 | ||||||
Oakley Capital Investments, Ltd.(a) | 2,780,664 | 6,618,934 | ||||||
Pantheon International Participations PLC, Ordinary Shares(a) | 278,208 | 5,304,965 | ||||||
Pantheon International Participations PLC, Redeemable Shares(a) | 317,700 | 5,704,797 | ||||||
Riverstone Energy, Ltd.(a) | 637,470 | 8,545,557 | ||||||
Standard Life European Private Equity Trust PLC, Ordinary Shares | 3,445,633 | 12,071,180 | ||||||
SVG Capital PLC(a) | 2,875,830 | 19,643,899 | ||||||
|
| |||||||
| 133,201,414 | ||||||||
|
| |||||||
Diversified Financial Services (14.82%) |
| |||||||
Blackstone Group LP | 778,226 | 23,440,167 | ||||||
Intermediate Capital Group PLC | 358,687 | 2,353,109 | ||||||
KKR & Co. LP | 1,084,333 | 23,378,220 | ||||||
Onex Corp. | 366,574 | 20,682,703 | ||||||
|
| |||||||
| 69,854,199 | ||||||||
|
| |||||||
Investment Companies (9.74%) |
| |||||||
Ares Capital Corp. | 309,780 | 4,953,382 | ||||||
Capital Southwest Corp. | 225,529 | 8,267,893 | ||||||
Grand Parade Investments, | 6,989,891 | 4,505,825 | ||||||
Hosken Consolidated | 749,090 | 10,134,338 | ||||||
|
| Shares | Value (Note 2) | |||||||
Investment Companies (continued) |
| |||||||||
Investor AB, B Shares | 505,038 | $ | 18,069,925 | |||||||
|
| |||||||||
| 45,931,363 | ||||||||||
|
| |||||||||
Private Equity (26.82%) |
| |||||||||
3i Group PLC | 3,057,900 | 19,415,160 | ||||||||
Altamir Amboise | 1,158,201 | 14,513,979 | ||||||||
Apollo Global Management LLC, Class A | 751,484 | 17,096,261 | ||||||||
Aurelius AG | 582,681 | 20,240,752 | ||||||||
The Carlyle Group LP | 759,342 | 21,079,334 | ||||||||
Eurazeo SA | 364,570 | 24,373,500 | ||||||||
IP Group PLC(a) | 2,562,857 | 8,482,453 | ||||||||
mutares AG | 13,081 | 1,221,237 | ||||||||
|
| |||||||||
| 126,422,676 | ||||||||||
|
| |||||||||
Real Estate (3.45%) |
| |||||||||
Brookfield Asset Management, Inc., Class A | 331,798 | 16,248,148 | ||||||||
|
| |||||||||
TOTAL FINANCIALS | 391,657,800 | |||||||||
|
| |||||||||
Industrials (4.13%) | ||||||||||
Miscellaneous Manufacturers (4.13%) |
| |||||||||
Danaher Corp. | 132,578 | 10,659,271 | ||||||||
Melrose Industries PLC | 2,158,055 | 8,841,149 | ||||||||
|
| |||||||||
| 19,500,420 | ||||||||||
|
| |||||||||
TOTAL INDUSTRIALS | 19,500,420 | |||||||||
|
| |||||||||
TOTAL COMMON STOCKS (Cost $413,681,185) |
| 467,483,629 | ||||||||
|
| |||||||||
7-Day | Shares | Value (Note 2) | ||||||||
SHORT TERM INVESTMENTS (0.73%) |
| |||||||||
Money Market Fund (0.73%) |
| |||||||||
Morgan Stanley Institutional Liquidity Funds - Prime Portfolio | 0.045% | 3,445,979 | 3,445,979 | |||||||
|
| |||||||||
TOTAL SHORT TERM INVESTMENTS (Cost $3,445,979) |
| 3,445,979 | ||||||||
|
| |||||||||
TOTAL INVESTMENTS (99.89%) (Cost $417,127,164) |
| $ | 470,929,608 | |||||||
Other Assets In Excess Of |
| 506,180 | ||||||||
|
| |||||||||
NET ASSETS (100.00%) | $ | 471,435,788 | ||||||||
|
| |||||||||
| 63 | October 31, 2014 |
| ALPS | Red Rocks Listed Private Equity Fund | ||
| Statement of Investments | October 31, 2014 |
| (a) | Non-Income Producing Security. |
Common Abbreviations:
| AB | - Aktiebolag is the Swedish equivalent of the term corporation. |
| AG | - Aktiengesellschaft is a German term that refers to a corporation that is limited by shares, i.e., owned by shareholders. |
| LLC | - Limited Liability Company. |
| LP | - Limited Partnership. |
| Ltd. | - Limited. |
| N.V. | - Naamloze Vennootschap is the Dutch term for a public limited liability corporation. |
| PCC | - Protected Cell Company. |
| PLC | - Public Limited Company. |
| SA | - Generally designates corporations in various countries, mostly those employing the civil law. |
For Fund compliance purposes, the Fund’s industry classifications refer to any one or more of the industry sub-classifications used by one or more widely recognized market indexes or ratings group indexes, and/or as defined by Fund management. This definition may not apply for purposes of this report, which may combine industry sub-classifications for reporting ease. Industries are shown as a percent of net assets.
See Notes to Financial Statements.
| 64 | October 31, 2014 |
| ALPS | Red Rocks Listed Private Equity Fund | ||
| Statement of Assets and Liabilities | October 31, 2014 |
ASSETS | ||||
Investments, at value | $ | 470,929,608 | ||
Foreign currency, at value (Cost $1,093,650) | 1,090,754 | |||
Receivable for investments sold | 1,872,058 | |||
Receivable for shares sold | 473,208 | |||
Dividends receivable | 1,047,843 | |||
Prepaid expenses and other assets | 28,945 | |||
Total Assets | 475,442,416 | |||
LIABILITIES | ||||
Payable for investments purchased | 2,938,185 | |||
Payable for shares redeemed | 397,008 | |||
Investment advisory fees payable | 338,185 | |||
Administration and transfer agency fees payable | 68,171 | |||
Distribution and services fees payable | 123,069 | |||
Trustees’ fees and expenses payable | 3,428 | |||
Professional fees payable | 34,779 | |||
Custody fees payable | 16,722 | |||
Accrued expenses and other liabilities | 87,081 | |||
Total Liabilities | 4,006,628 | |||
NET ASSETS | $ | 471,435,788 | ||
NET ASSETS CONSIST OF | ||||
Paid-in capital | $ | 427,103,909 | ||
Accumulated net investment loss | (13,757,302) | |||
Accumulated net realized gain on investments and foreign currency transactions | 4,300,660 | |||
Net unrealized appreciation on investments and translation of assets and liabilities denominated in foreign currencies | 53,788,521 | |||
NET ASSETS | $ | 471,435,788 | ||
INVESTMENTS, AT COST | $ | 417,127,164 | ||
PRICING OF SHARES | ||||
Class A: | ||||
Net Asset Value, offering and redemption price per share(a) | $ | 6.61 | ||
Net Assets | $ | 203,995,896 | ||
Shares of beneficial interest outstanding (unlimited number of shares, no par value common stock authorized) | 30,853,959 | |||
Maximum offering price per share ((NAV/0.9450), based on maximum sales charge of 5.50% of the offering price) | $ | 6.99 | ||
Class C: | ||||
Net Asset Value, offering and redemption price per share(a) | $ | 6.43 | ||
Net Assets | $ | 17,192,970 | ||
Shares of beneficial interest outstanding (unlimited number of shares, no par value common stock authorized) | 2,673,977 | |||
Class I: | ||||
Net Asset Value, offering and redemption price per share | $ | 6.67 | ||
Net Assets | $ | 249,375,290 | ||
Shares of beneficial interest outstanding (unlimited number of shares, no par value common stock authorized) | 37,364,812 | |||
Class R: | ||||
Net Asset Value, offering and redemption price per share | $ | 5.87 | ||
Net Assets | $ | 871,632 | ||
Shares of beneficial interest outstanding (unlimited number of shares, no par value common stock authorized) | 148,447 | |||
| (a) | Redemption price per share may be reduced for any applicable contingent deferred sales charge. For a description of a possible sales charge, please see the Fund’s Prospectus. |
See Notes to Financial Statements.
| 65 | October 31, 2014 |
| ALPS | Red Rocks Listed Private Equity Fund | ||
| Statements of Operations | ||
| For the Fiscal Period Ended October 31, 2014(a) | For the Year Ended April 30, 2014 | |||||||
INVESTMENT INCOME | ||||||||
Dividends | $ | 5,853,183 | $ | 7,542,694 | ||||
Foreign taxes withheld on dividends | (678,608) | (591,613) | ||||||
Interest and other income | – | 12,916 | ||||||
Total Investment Income | 5,174,575 | 6,963,997 | ||||||
EXPENSES | ||||||||
Investment advisory fees | 2,011,020 | 2,774,129 | ||||||
Administrative and transfer agency fees | 344,637 | 499,363 | ||||||
Distribution and service fees | ||||||||
Class A | 364,965 | 611,346 | ||||||
Class C | 81,565 | 70,686 | ||||||
Class R | 1,608 | 1,822 | ||||||
Professional fees | 31,998 | 43,852 | ||||||
Networking fees | ||||||||
Class A | 39,713 | 57,600 | ||||||
Class C | 5,130 | 3,734 | ||||||
Class I | 111,772 | 158,952 | ||||||
Class R | 117 | 159 | ||||||
Reports to shareholders and printing fees | 54,206 | 58,974 | ||||||
State registration fees | 36,491 | 69,183 | ||||||
SEC registration fees | 11,248 | 15,927 | ||||||
Insurance fees | 2,903 | 4,791 | ||||||
Custody fees | 59,592 | 111,588 | ||||||
Trustees’ fees and expenses | 6,952 | 12,833 | ||||||
Repayment of previously waived fees | ||||||||
Class A | 140,349 | 168,480 | ||||||
Class C | – | 3,091 | ||||||
Class I | 82,686 | 73,922 | ||||||
Class R | – | 263 | ||||||
Miscellaneous expenses | 10,140 | 19,431 | ||||||
Total Expenses | 3,397,092 | 4,760,126 | ||||||
Net Investment Income | 1,777,483 | 2,203,871 | ||||||
Net realized gain on investments | 10,115,111 | 31,042,197 | ||||||
Net realized loss on foreign currency transactions | (1,005,326) | (79,801) | ||||||
Net realized gain distributions from other investment companies | 7,133 | – | ||||||
Net change in unrealized appreciation/(depreciation) on investments | (39,492,219) | 36,500,824 | ||||||
Net change in unrealized appreciation/(depreciation) on translation of assets and liabilities denominated in foreign currencies | (40,464) | 17,156 | ||||||
NET REALIZED AND UNREALIZED GAIN/(LOSS) ON INVESTMENTS | (30,415,765) | 67,480,376 | ||||||
NET INCREASE/(DECREASE) IN NET ASSETS RESULTING FROM OPERATIONS | $ | (28,638,282) | $ | 69,684,247 | ||||
| (a) | Effective May 1, 2014, the Board approved changing the fiscal year-end of the Funds from April 30 to October 31. |
See Notes to Financial Statements.
| 66 | October 31, 2014 |
| ALPS | Red Rocks Listed Private Equity Fund | ||
| For the Fiscal Period Ended October 31, 2014(a) | For the Year April 30, 2014 | For the Year April 30, 2013 | ||||||||||
OPERATIONS | ||||||||||||
Net investment income | $ | 1,777,483 | $ | 2,203,871 | $ | 3,533,375 | ||||||
Net realized gain on investments and foreign currency transactions | 9,109,785 | 30,962,396 | 4,919,331 | |||||||||
Net realized gain distributions from other investment companies | 7,133 | – | – | |||||||||
Net change in unrealized appreciation/(depreciation) on investments and translation of assets and liabilities denominated in foreign currencies | (39,532,683) | 36,517,980 | 46,645,985 | |||||||||
Net Increase/(Decrease) in Net Assets Resulting from Operations | (28,638,282) | 69,684,247 | 55,098,691 | |||||||||
DISTRIBUTIONS | ||||||||||||
Dividends to shareholders from net investment income | ||||||||||||
Class A | – | (11,258,970) | (1,393,693) | |||||||||
Class C | – | (444,823) | (36,855) | |||||||||
Class I | – | (11,570,862) | (1,868,287) | |||||||||
Class R | – | (25,293) | (1,190) | |||||||||
Net Decrease in Net Assets from Distributions | – | (23,299,948) | (3,300,025) | |||||||||
BENEFICIAL INTEREST TRANSACTIONS (NOTE 6) | ||||||||||||
Shares sold | ||||||||||||
Class A | 61,140,590 | 104,537,580 | 29,478,167 | |||||||||
Class C | 7,348,056 | 7,052,467 | 1,238,806 | |||||||||
Class I | 99,388,072 | 93,622,391 | 60,979,444 | |||||||||
Class R | 453,224 | 330,734 | 148,586 | |||||||||
Dividends reinvested | ||||||||||||
Class A | – | 10,565,914 | 1,275,595 | |||||||||
Class C | – | 357,600 | 30,465 | |||||||||
Class I | – | 4,362,094 | 656,092 | |||||||||
Class R | – | 23,238 | 813 | |||||||||
Shares redeemed, net of redemption fees | ||||||||||||
Class A | (50,641,540) | (36,821,447) | (33,853,264) | |||||||||
Class C | (1,176,895) | (554,548) | (541,528) | |||||||||
Class I | (36,901,005) | (57,218,383) | (29,674,718) | |||||||||
Class R | (78,846) | (52,283) | (25,800) | |||||||||
Net Increase in Net Assets Derived from Beneficial Interest Transactions | 79,531,656 | 126,205,357 | 29,712,658 | |||||||||
Net increase in net assets | 50,893,374 | 172,589,656 | 81,511,324 | |||||||||
NET ASSETS | ||||||||||||
Beginning of period | 420,542,414 | 247,952,758 | 166,441,434 | |||||||||
End of period * | $ | 471,435,788 | $ | 420,542,414 | $ | 247,952,758 | ||||||
*Including accumulated net investment loss of: | $ | (13,757,302) | $ | (21,142,940) | $ | (8,376,470) | ||||||
| (a) | Effective May 1, 2014, the Board approved changing the fiscal year-end of the Funds from April 30 to October 31. |
See Notes to Financial Statements.
| 67 | October 31, 2014 |
| ALPS | Red Rocks Listed Private Equity Fund – Class A | ||
| Financial Highlights | ||
Selected data for a share of beneficial interest outstanding throughout the periods indicated:
For the Fiscal Period Ended | For the Year Ended | For the Year Ended April 30, 2013 | For the Year Ended April 30, 2012 | For the Year Ended April 30, 2011 | For the Year Ended April 30, 2010 | |||||||
Net asset value, beginning of period | $7.00 | $6.05 | $4.67 | $6.44 | $5.17 | $3.56 | ||||||
INCOME/(LOSS) FROM INVESTMENT OPERATIONS: | ||||||||||||
Net investment income | 0.02(b) | 0.03(b) | 0.08(b) | 0.07(b) | 0.04(b) | 0.14 | ||||||
Net realized and unrealized gain/(loss) | (0.41) | 1.37 | 1.39 | (1.41) | 1.61 | 1.99 | ||||||
Total from investment operations | (0.39) | 1.40 | 1.47 | (1.34) | 1.65 | 2.13 | ||||||
DISTRIBUTIONS: | ||||||||||||
From net investment income | – | (0.45) | (0.09) | (0.43) | (0.38) | (0.52) | ||||||
Total distributions | – | (0.45) | (0.09) | (0.43) | (0.38) | (0.52) | ||||||
REDEMPTION FEES ADDED TO PAID-IN CAPITAL (NOTE 6) | 0.00(c) | 0.00(c) | 0.00(c) | 0.00(c) | 0.00(c) | 0.00(c) | ||||||
Net increase/(decrease) in net asset value | (0.39) | 0.95 | 1.38 | (1.77) | 1.27 | 1.61 | ||||||
Net asset value, end of year | $6.61 | $7.00 | $6.05 | $4.67 | $6.44 | $5.17 | ||||||
TOTAL RETURN(d) | (5.57)% | 23.54% | 31.75% | (19.68)% | 33.22% | 61.68% | ||||||
RATIOS/SUPPLEMENTAL DATA: | ||||||||||||
Net assets, end of year (000s) | $203,996 | $205,727 | $105,488 | $85,807 | $124,874 | $67,192 | ||||||
Ratio of expenses to average net assets excluding fee waivers and reimbursements(e) | 1.59%(f) | 1.64% | 1.53% | 1.71% | 1.70% | 1.71% | ||||||
Ratio of expenses to average net assets including fee waivers and reimbursements(e) | 1.59%(f)(g) | 1.64%(g) | 1.51%(h) | 1.50% | 1.50% | 1.44%(i) | ||||||
Ratio of net investment income to average net assets(e) | 0.71%(f) | 0.46% | 1.54% | 1.34% | 0.67% | 0.42% | ||||||
Portfolio turnover rate(j) | 11% | 40% | 32% | 72% | 43% | 54% | ||||||
| (a) | Effective May 1, 2014, the Board approved changing the fiscal year-end of the Funds from April 30 to October 31. |
| (b) | Calculated using the average shares method. |
| (c) | Less than $0.005 per share. |
| (d) | Total returns are for the period indicated and have not been annualized. Total returns would have been lower had certain expenses not been waived during the period. Returns shown do not reflect the deduction of taxes that a shareholder would pay on Fund distributions or the redemption of Fund shares. Returns shown exclude any applicable sales charges. |
| (e) | The ratios exclude the impact of expenses of the underlying funds in which the Fund invests as represented in the Statement of Investments. |
| (f) | Annualized. |
| (g) | According to the Fund’s shareholder services plan with respect to the Fund’s Class A shares, any amount of such payment not paid during the Fund’s fiscal year for such service activities shall be reimbursed to the Fund as soon as practical after the end of the fiscal year. Fees were reimbursed to the Fund during the period ended October 31, 2014, for the prior fiscal year in the amount of 0.06% (annualized) of average net assets of Class A shares and during the year ended April 30, 2014, for the prior fiscal year in the amount of 0.01% of average net assets of Class A shares. |
| (h) | Contractual expense limitation changed from 1.50% to 1.65% effective September 1, 2012. |
| (i) | Contractual expense limitation changed from 1.25% to 1.50% effective September 1, 2009. |
| (j) | Portfolio turnover rate for periods less than one full year have not been annualized. |
See Notes to Financial Statements.
| 68 | October 31, 2014 |
| ALPS | Red Rocks Listed Private Equity Fund – Class C | ||
| Financial Highlights | ||
Selected data for a share of beneficial interest outstanding throughout the periods indicated:
| For the Fiscal Period Ended October 31, 2014(a) | For the Year Ended April 30, 2014 | For the Year Ended April 30, 2013 | For the Year Ended April 30, 2012 | For the Period July 2, 2010 (Incpetion) to April 30, 2011 | ||||||
Net asset value, beginning of period | $6.83 | $5.92 | $4.59 | $6.37 | $4.39 | |||||
INCOME/(LOSS) FROM INVESTMENT OPERATIONS: | ||||||||||
Net investment income/(loss)(b) | (0.00)(c) | (0.00)(c) | 0.04 | 0.03 | (0.01) | |||||
Net realized and unrealized gain/(loss) | (0.40) | 1.33 | 1.35 | (1.39) | 2.36 | |||||
Total from investment operations | (0.40) | 1.33 | 1.39 | (1.36) | 2.35 | |||||
DISTRIBUTIONS: | ||||||||||
From net investment income | – | (0.42) | (0.06) | (0.42) | (0.37) | |||||
Total distributions | – | (0.42) | (0.06) | (0.42) | (0.37) | |||||
REDEMPTION FEES ADDED TO PAID-IN CAPITAL (NOTE 6) | 0.00(c) | 0.00(c) | 0.00(c) | 0.00(c) | 0.00(c) | |||||
Net increase/(decrease) in net asset value | (0.40) | 0.91 | 1.33 | (1.78) | 1.98 | |||||
Net asset value, end of year | $6.43 | $6.83 | $5.92 | $4.59 | $6.37 | |||||
TOTAL RETURN(d) | (5.86)% | 22.97% | 30.55% | (20.33)% | 55.32% | |||||
RATIOS/SUPPLEMENTAL DATA: | ||||||||||
Net assets, end of period (000s) | $17,193 | $12,200 | $4,417 | $2,838 | $2,566 | |||||
Ratio of expenses to average net assets excluding fee waivers and reimbursements(e) | 2.15%(f) | 2.20% | 2.25% | 2.37% | 2.31%(f) | |||||
Ratio of expenses to average net assets including fee waivers and reimbursements(e) | 2.15%(f) | 2.20% | 2.25% | 2.25% | 2.25%(f) | |||||
Ratio of net investment income/(loss) to average net assets(e) | (0.13)%(f) | (0.04)% | 0.79% | 0.59% | (0.19)%(f) | |||||
Portfolio turnover rate(g) | 11% | 40% | 32% | 72% | 43%(h) | |||||
| (a) | Effective May 1, 2014, the Board approved changing the fiscal year-end of the Funds from April 30 to October 31. |
| (b) | Calculated using the average shares method. |
| (c) | Less than $0.005 per share. |
| (d) | Total returns are for the period indicated and have not been annualized. Total returns would have been lower had certain expenses not been waived during the period. Returns shown do not reflect the deduction of taxes that a shareholder would pay on Fund distributions or the redemption of Fund shares. Returns shown exclude any applicable sales charges. |
| (e) | The ratios exclude the impact of expenses of the underlying funds in which the Fund invests as represented in the Statement of Investments. |
| (f) | Annualized. |
| (g) | Portfolio turnover rate for periods less than one full year have not been annualized. |
| (h) | Portfolio turnover rate is calculated at the Fund Level and represents the year ended April 30, 2011. |
See Notes to Financial Statements.
| 69 | October 31, 2014 |
| ALPS | Red Rocks Listed Private Equity Fund – Class I | ||
Financial Highlights Selected data for a share of beneficial interest outstanding throughout the periods indicated: | ||
| For the Fiscal Period Ended October 31, 2014(a) | For the Year Ended April 30, 2014 | For the Year Ended April 30, 2013 | For the Year Ended April 30, 2012 | For the Year April 30, 2011 | For the Year Ended April 30, 2010 | |||||||
Net asset value, beginning of period | $7.05 | $6.08 | $4.69 | $6.47 | $5.19 | $3.57 | ||||||
INCOME/(LOSS) FROM INVESTMENT OPERATIONS: | ||||||||||||
Net investment income | 0.03(b) | 0.06(b) | 0.12(b) | 0.08(b) | 0.05(b) | 0.28 | ||||||
Net realized and unrealized gain/(loss) | (0.41) | 1.37 | 1.36 | (1.42) | 1.62 | 1.87 | ||||||
Total from investment operations | (0.38) | 1.43 | 1.48 | (1.34) | 1.67 | 2.15 | ||||||
DISTRIBUTIONS: | ||||||||||||
From net investment income | – | (0.46) | (0.09) | (0.44) | (0.39) | (0.53) | ||||||
Total distributions | – | (0.46) | (0.09) | (0.44) | (0.39) | (0.53) | ||||||
REDEMPTION FEES ADDED TO PAID-IN CAPITAL (NOTE 6) | 0.00(c) | 0.00(c) | 0.00(c) | 0.00(c) | 0.00(c) | 0.00(c) | ||||||
Net increase/(decrease) in net asset value | (0.38) | 0.97 | 1.39 | (1.78) | 1.28 | 1.62 | ||||||
Net asset value, end of year | $6.67 | $7.05 | $6.08 | $4.69 | $6.47 | $5.19 | ||||||
TOTAL RETURN(d) | (5.39)% | 24.02% | 31.99% | (19.52)% | 33.47% | 62.09% | ||||||
RATIOS/SUPPLEMENTAL DATA: | ||||||||||||
Net assets, end of year (000s) | $249,375 | $202,076 | $137,856 | $77,750 | $66,854 | $45,144 | ||||||
Ratio of expenses to average net assets excluding fee waivers and reimbursements(e) | 1.25% (f) | 1.25% | 1.27% | 1.41% | 1.36% | 1.47% | ||||||
Ratio of expenses to average net assets including fee waivers and reimbursements(e) | 1.25%(f) | 1.25% | 1.25% | 1.25% | 1.25% | 1.19%(g) | ||||||
Ratio of net investment income to average net assets(e) | 0.85%(f) | 0.91% | 2.27% | 1.60% | 0.91% | 0.78% | ||||||
Portfolio turnover rate(h) | 11% | 40% | 32% | 72% | 43% | 54% | ||||||
| (a) | Effective May 1, 2014, the Board approved changing the fiscal year-end of the Funds from April 30 to October 31. |
| (b) | Calculated using the average shares method. |
| (c) | Less than $0.005 per share. |
| (d) | Total returns are for the period indicated and have not been annualized. Total returns would have been lower had certain expenses not been waived during the period. Returns shown do not reflect the deduction of taxes that a shareholder would pay on Fund distributions or the redemption of Fund shares. |
| (e) | The ratios exclude the impact of expenses of the underlying funds in which the Fund invests as represented in the Statement of Investments. |
| (f) | Annualized. |
| (g) | Contractual expense limitation changed from 1.00% to 1.25% effective September 1, 2009. |
| (h) | Portfolio turnover rate for periods less than one full year have not been annualized. |
See Notes to Financial Statements.
| 70 | October 31, 2014 |
| ALPS | Red Rocks Listed Private Equity Fund – Class R | ||
Financial Highlights Selected data for a share of beneficial interest outstanding throughout the periods indicated: | ||
| For the Fiscal Period Ended October 31, 2014(a) | For the Year Ended April 30, 2014 | For the Year Ended April 30, 2013 | For the Year Ended April 30, 2012 | For the Year Ended April 30, 2011 | For the Year Ended April 30, 2010 | |||||||
Net asset value, beginning of period | $6.21 | $5.41 | $4.17 | $5.82 | $4.73 | $3.31 | ||||||
INCOME/(LOSS) FROM INVESTMENT OPERATIONS: | ||||||||||||
Net investment income/(loss) | 0.01(b) | 0.02(b) | 0.08(b) | 0.05(b) | 0.03(b) | (0.09) | ||||||
Net realized and unrealized gain/(loss) | (0.36) | 1.22 | 1.24 | (1.27) | 1.43 | 2.02 | ||||||
Total from investment operations | (0.35) | 1.24 | 1.32 | (1.22) | 1.46 | 1.93 | ||||||
DISTRIBUTIONS: | ||||||||||||
From net investment income | – | (0.44) | (0.08) | (0.43) | (0.37) | (0.51) | ||||||
Total distributions | – | (0.44) | (0.08) | (0.43) | (0.37) | (0.51) | ||||||
REDEMPTION FEES ADDED TO PAID-IN CAPITAL (NOTE 6) | 0.01 | – | – | – | – | – | ||||||
Net increase/(decrease) in net asset value | (0.34) | 0.80 | 1.24 | (1.65) | 1.09 | 1.42 | ||||||
Net asset value, end of year | $5.87 | $6.21 | $5.41 | $4.17 | $5.82 | $4.73 | ||||||
TOTAL RETURN(c) | (5.48)% | 23.50% | 32.05% | (19.93)% | 32.47% | 60.92% | ||||||
RATIOS/SUPPLEMENTAL DATA: | ||||||||||||
Net assets, end of year (000s) | $872 | $540 | $191 | $46 | $125 | $18 | ||||||
Ratio of expenses to average net assets excluding fee waivers and | 1.63%(e) | 1.72% | 1.85% | 1.89% | 1.87% | 2.27% | ||||||
Ratio of expenses to average net assets including fee waivers and | 1.63%(e) | 1.72% | 1.75% | 1.75% | 1.75% | 1.75%(f) | ||||||
Ratio of net investment income/(loss) to average | 0.46%(e) | 0.36% | 1.80% | 1.10% | 0.66% | (0.24)% | ||||||
Portfolio turnover rate(g) | 11% | 40% | 32% | 72% | 43% | 54% | ||||||
| (a) | Effective May 1, 2014, the Board approved changing the fiscal year-end of the Funds from April 30 to October 31. |
| (b) | Calculated using the average shares method. |
| (c) | Total returns are for the period indicated and have not been annualized. Total returns would have been lower had certain expenses not been waived during the period. Returns shown do not reflect the deduction of taxes that a shareholder would pay on Fund distributions or the redemption of Fund shares. |
| (d) | The ratios exclude the impact of expenses of the underlying funds in which the Fund invests as represented in the Statement of Investments. |
| (e) | Annualized. |
| (f) | Contractual expense limitation changed from 1.50% to 1.75% effective September 1, 2009. |
| (g) | Portfolio turnover rate for periods less than one full year have not been annualized. |
See Notes to Financial Statements.
| 71 | October 31, 2014 |
| ALPS | Sterling ETF Tactical Rotation Fund | ||
| Management Commentary | October 31, 2014 (Unaudited) | |
The ALPS Sterling ETF Tactical Rotation Fund was launched on 6/30/14 and attempts to replicate the Sterling Tactical Rotation Index (STRR). The investment methodology for the STRR is to rotate between six asset classes using ETFs. The Fund seeks investment results that correspond (before fees and expenses) generally to the performance of the index. The index seeks to rotate away from declining asset classes and to overweight the two asset classes exhibiting the most strength 50/50 based on a mathematical formula. The asset classes the index rotates between are commodities, US equities, US bonds, International equities, REITs and cash. Cash is the only asset class that could potentially be invested 100% using ETFs. The index re-allocates on or near the last trading day of every month.
The mathematical formula utilized for the index is based on a proprietary relative strength model that incorporates a moving average overlay. The relative strength model is designed to rotate away from weakness and the moving average overlay is the component that determines if the index allocates to cash.
Through the first four month period since the Fund’s launch on 6/30/14, the ALPS Sterling ETF Tactical Rotation Fund (ETRIX) posted a -0.10% loss. During this period financial markets experienced a substantial divergence in returns. The DB Liquid Commodity Index was down -16% while the MSCI EAFE Index fell more than -6.0%. During this same period US equities, US REITs, and US bonds posted positive returns.
The Fund attempts to avoid asset classes that are experiencing prolonged periods of declining prices. Since the 6/30/14 launch the Fund has avoided both commodities and international equities. The Fund owned US equities and US REITs during the first three months and US equities and US bonds during October. The rotation away from REITs and into US bonds during October cost the fund roughly 4.5% as REITs rebounded sharply during the month.
The investment methodology for the fund seeks strength in price movement. It relies on low correlations between the available asset classes and attempts to rotate away from weakness. The model benefits during periods of asset class divergence. By avoiding the asset classes that are falling, the model positions itself to potentially benefit from rotating into those asset classes, once they begin exhibiting strength, at much lower prices.
Every asset class experiences bull and bear market cycles of varying lengths and at different periods of time. The fund attempts to avoid asset classes during their bear market cycles and to over-weight the asset classes during their bull market cycles. We strongly believe this will result in strong risk-adjusted returns over a full market cycle.
Mark W. Eicker
Chief Investment Officer
The Deutsche Bank Liquid Commodity Index tracks the performance of six commodities in the energy, precious metals, industrial metals and grain sectors.
The MSCI EAFE Index is recognized as the pre-eminent benchmark in the United States to measure international equity performance. It comprises the MSCI country indices that represent developed markets outside of North America: Europe, Australasia and the Far East.
The views and information discussed in this commentary are as of the date of publication, are subject to change, and may not reflect the writer’s current views. The views expressed represent an assessment of market conditions at a specific point in time, are opinions only and should not be relied upon as investment advice regarding a particular investment or markets in general. Such information does not constitute a recommendation to buy or sell specific securities or investment vehicles. It should not be assumed that any investment will be profitable or will equal the performance of the fund(s) or any securities or any sectors mentioned in this letter. The subject matter contained in this letter has been derived from several sources believed to be reliable and accurate at the time of compilation. Neither the Fund nor Sterling Global Strategies accepts any liability for losses either direct or consequential caused by the use of this information.
| 72 | October 31, 2014 |
| ALPS | Sterling ETF Tactical Rotation Fund | ||
| Performance Update | October 31, 2014 (Unaudited) | |
Performance of $10,000 Initial Investment (as of October 31, 2014)
Comparison of change in value of a $10,000 investment (includes maximum sales charges of 5.50%)
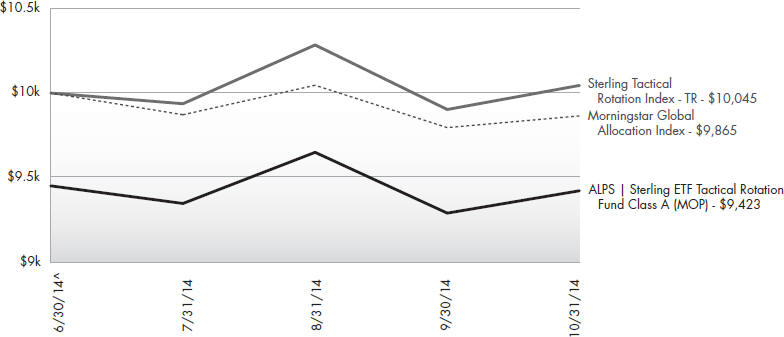
The chart above represents historical performance of a hypothetical investment of $10,000 in the Fund since inception. Past performance does not guarantee future results. This chart does not reflect the deduction of taxes that a shareholder would pay on Fund distributions or the redemption of Fund shares.
Average Annual Total Returns (as of October 31, 2014)
| 3 Month | Since Inception ^ | Total Expense Ratio | What You Pay * | |||||||
Class A (NAV) | 0.81% | -0.30% | ||||||||
Class A (MOP) | -4.78% | -5.77% | 1.85% | 1.75% | ||||||
Class C (NAV) | 0.61% | -0.50% | ||||||||
Class C (CDSC) | -0.39% | -1.50% | 2.45% | 2.35% | ||||||
Class I (NAV) | 0.81% | -0.20% | 1.45% | 1.35% | ||||||
Morningstar Global Allocation Index1 | -0.07% | -1.35% | ||||||||
Sterling Tactical Rotation Index TR2 | 1.09% | 0.45% |
Performance data quoted represents past performance. Past performance does not guarantee future results. Investment return and principal value of an investment will fluctuate so that an investor’s shares, when sold or redeemed, may be worth more or less than the original cost. Current performance data may be higher or lower than actual data quoted. The Fund imposes a 2.00% redemption fee on shares held for less than 30 days. Performance shown does not include the redemption fee, which if reflected would reduce the performance quoted. For the most current month-end performance data, please call 1-866-759-5679.
Maximum Offering Price (MOP) for Class A shares includes the Fund’s maximum sales charge of 5.50%. CDSC performance for Class C shares includes a 1% contingent deferred sales charge (CDSC) on C shares redeemed within 12 months of purchase. Performance shown at NAV does not include these sales charges and would have been lower had it been taken into account.
Performance less than 1 year is cumulative.
| 1 | Morningstar Global Allocation Index: seeks to provide both capital appreciation and income by investing across three areas: global equities, global bonds, and cash. |
| 2 | The Sterling Tactical Rotation Index - seeks to provide absolute returns during any market cycle or condition by employing an equally weighted strategic rotation model, trading between commodities, REITs, bonds, international and domestic equities. |
| ^ | Fund inception date of June 30, 2014. |
| * | What You Pay reflects the Advisor’s decision to contractually limit expenses through February 29, 2016. Please see the prospectus for additional information. |
| 73 | October 31, 2014 |
| ALPS | Sterling ETF Tactical Rotation Fund | ||
| Performance Update | October 31, 2014 (Unaudited) | |
This Fund is not suitable for all investors. The Fund is “non-diversified” and will generally be more volatile than diversified funds.
Investments in small and mid-cap companies generally will experience greater price volatility. International and Emerging markets are riskier than more developed markets because they tend to develop unevenly and may never fully develop. Prices of fixed income securities generally increase when interest rates decline and decrease when interest rates increase and may cause losses. Real estate investments are subject to specific risks, such as risks related to general and local economic conditions and risks related to individual properties.
The Fund invests in Exchange Traded Funds (“ETFs”) and the Fund could lose money by investing in an ETF if the prices of the securities owned by the ETF go down. The Fund’s shareholders will indirectly incur the fees and expenses charged by the underlying ETFs held by the Fund, in addition to the expense charged by the Fund.
Commodities and futures generally are volatile and involve a high degree of risk. This fund enters into a short sale by selling a security it has borrowed. If the market price of a security increases after the Fund borrows the security, the Fund will suffer a potentially unlimited loss when it replaces the borrowed security at the higher price. The use of derivatives exposes the Fund to additional risks including increased volatility, lack of liquidity, and possible losses greater than the Fund’s initial investment as well as increased transaction.
There is no guarantee that the Fund will continue to hold any one particular security or stay invested in any one particular company. The composition of the Fund’s top holdings is subject to change. Performance figures are historical and reflect the change in share price, reinvested distributions, changes in net asset value, sales charges and capital gains distributions, if any.
The ALPS | Sterling ETF Tactical Rotation Fund is new and has limited operating history.
Not FDIC Insured – No Bank Guarantee – May Lose Value
Portfolio Composition (as a % of Net Assets)*
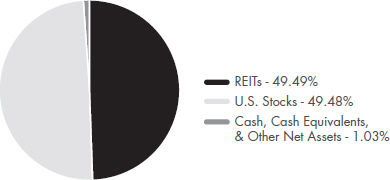
| * | Holdings are subject to change. |
| 74 | October 31, 2014 |
| ALPS | Sterling ETF Tactical Rotation Fund | ||
| October 31, 2014 |
| Shares | Value (Note 2) | |||||||||||
EXCHANGE TRADED FUNDS (98.97%) |
| |||||||||||
SPDR® S&P 500® ETF Trust |
| 32,223 | $ | 6,498,090 | ||||||||
Vanguard® REIT ETF | 82,265 | 6,498,113 | ||||||||||
|
| |||||||||||
| 12,996,203 | ||||||||||||
|
| |||||||||||
TOTAL EXCHANGE TRADED FUNDS (Cost $12,756,904) |
| 12,996,203 | ||||||||||
|
| |||||||||||
7-Day Yield | Shares | Value (Note 2) | ||||||||||
SHORT TERM INVESTMENTS (2.98%) |
| |||||||||||
Money Market Fund (2.98%) |
| |||||||||||
Morgan Stanley Institutional Liquidity Fund, Prime Portfolio | 0.045 | % | 391,455 | 391,455 | ||||||||
|
| |||||||||||
TOTAL SHORT TERM INVESTMENTS (Cost $391,455) |
| 391,455 | ||||||||||
|
| |||||||||||
TOTAL INVESTMENTS (101.95%) (Cost $13,148,359) |
| $ | 13,387,658 | |||||||||
Liabilities In Excess Of Other Assets (-1.95%) |
| (255,928 | ) | |||||||||
|
| |||||||||||
NET ASSETS (100.00%) | $ | 13,131,730 | ||||||||||
|
| |||||||||||
Common Abbreviations:
ETF - Exchange Traded Fund.
REIT - Real Estate Investment Trust.
SPDR - Standard and Poor’s Depositary Receipt.
For Fund compliance purposes, the Fund’s industry classifications refer to any one or more of the industry sub-classifications used by one or more widely recognized market indexes or ratings group indexes, and/or as defined by Fund management. This definition may not apply for purposes of this report, which may combine industry sub-classifications for reporting ease. Industries are shown as a percent of net assets.
See Notes to Financial Statements.
| 75 | October 31, 2014 |
| ALPS | Sterling ETF Tactical Rotation Fund | ||
| October 31, 2014 |
ASSETS | ||||
Investments, at value | $ | 13,387,658 | ||
Receivable for investments sold | 6,318,329 | |||
Receivable for shares sold | 115,627 | |||
Dividends receivable | 26 | |||
Receivable due from advisor | 26,447 | |||
Deferred offering costs | 47,466 | |||
Prepaid expenses and other assets | 1,439 | |||
Total Assets | 19,896,992 | |||
LIABILITIES | ||||
Payable for investments purchased | 6,707,423 | |||
Payable for shares redeemed | 22,559 | |||
Investment advisory fees payable | 3,070 | |||
Administration and transfer agency fees payable | 8,676 | |||
Distribution and services fees payable | 1,876 | |||
Professional fees payable | 16,523 | |||
Accrued expenses and other liabilities | 5,135 | |||
Total Liabilities | 6,765,262 | |||
NET ASSETS | $ | 13,131,730 | ||
NET ASSETS CONSIST OF | ||||
Paid-in capital | $ | 13,019,914 | ||
Accumulated net investment income | 21,251 | |||
Accumulated net realized loss on investments | (148,734) | |||
Net unrealized appreciation on investments | 239,299 | |||
NET ASSETS | $ | 13,131,730 | ||
INVESTMENTS, AT COST | $ | 13,148,359 | ||
PRICING OF SHARES | ||||
Class A: | ||||
Net Asset Value, offering and redemption price per share(a) | $ | 9.97 | ||
Net Assets | $ | 5,261,643 | ||
Shares of beneficial interest outstanding (unlimited number of shares, no par value common stock authorized) | 527,623 | |||
Maximum offering price per share ((NAV/0.9450), based on maximum sales charge of 5.50% of the offering price) | $ | 10.55 | ||
Class C: | ||||
Net Asset Value, offering and redemption price per share(a) | $ | 9.95 | ||
Net Assets | $ | 530,326 | ||
Shares of beneficial interest outstanding (unlimited number of shares, no par value common stock authorized) | 53,286 | |||
Class I: | ||||
Net Asset Value, offering and redemption price per share | $ | 9.98 | ||
Net Assets | $ | 7,339,761 | ||
Shares of beneficial interest outstanding (unlimited number of shares, no par value common stock authorized) | 735,136 | |||
| (a) | Redemption price per share may be reduced for any applicable contingent deferred sales charge. For a description of a possible sales charge, please see the Fund’s Prospectus. |
See Notes to Financial Statements.
| 76 | October 31, 2014 |
| ALPS | Sterling ETF Tactical Rotation Fund | ||
| Statement of Operations | For the Period July 1, 2014 (Commencement) to October 31, 2014 |
INVESTMENT INCOME | ||||
Dividends | $ | 35,889 | ||
Total Investment Income | 35,889 | |||
EXPENSES | ||||
Investment advisory fees | 15,932 | |||
Administrative and transfer agency fees | 33,912 | |||
Distribution and service fees | ||||
Class A | 1,798 | |||
Class C | 1,027 | |||
Professional fees | 16,525 | |||
Networking fees | ||||
Class I | 105 | |||
Reports to shareholders and printing fees | 1,154 | |||
State registration fees | 171 | |||
SEC registration fees | 1,160 | |||
Custody fees | 918 | |||
Trustees’ fees and expenses | 7 | |||
Offering costs | 23,679 | |||
Miscellaneous expenses | 2,754 | |||
Total Expenses | 99,142 | |||
Less fees waived/reimbursed by investment advisor (Note 8) | ||||
Class A | (15,562) | |||
Class C | (7,752) | |||
Class I | (53,715) | |||
Net Expenses | 22,113 | |||
Net Investment Income | 13,776 | |||
Net realized loss on investments | (148,734) | |||
Net change in unrealized appreciation on investments | 239,299 | |||
NET REALIZED AND UNREALIZED GAIN ON INVESTMENTS | 90,565 | |||
NET INCREASE IN NET ASSETS RESULTING FROM OPERATIONS | $ | 104,341 | ||
See Notes to Financial Statements.
| 77 | October 31, 2014 |
| ALPS | Sterling ETF Tactical Rotation Fund | ||
| Statement of Changes in Net Assets | ||
For the Period July 1, 2014 (Commencement) to | ||||
OPERATIONS | ||||
Net investment income | $ | 13,776 | ||
Net realized loss on investments | (148,734) | |||
Net change in unrealized appreciation on investments | 239,299 | |||
Net Increase in Net Assets Resulting from Operations | 104,341 | |||
BENEFICIAL INTEREST TRANSACTIONS (NOTE 6) | ||||
Shares sold | ||||
Class A | 5,280,333 | |||
Class C | 540,462 | |||
Class I | 7,423,186 | |||
Shares redeemed | ||||
Class A | (85,902) | |||
Class C | (8,249) | |||
Class I | (122,441) | |||
Net Increase in Net Assets Derived from Beneficial Interest Transactions | 13,027,389 | |||
Net increase in net assets | 13,131,730 | |||
NET ASSETS | ||||
Beginning of period | – | |||
End of year * | $ | 13,131,730 | ||
*Including accumulated net investment income of: | $ | 21,251 | ||
See Notes to Financial Statements.
| 78 | October 31, 2014 |
| ALPS | Sterling ETF Tactical Rotation Fund – Class A | ||
Selected data for a share of beneficial interest outstanding throughout the period indicated: | ||
For the Period July 1, 2014 (Commencement) to October 31, 2014 | ||
Net asset value, beginning of period | $10.00 | |
INCOME FROM INVESTMENT OPERATIONS: | ||
Net investment income(a) | 0.02 | |
Net realized and unrealized loss | (0.05) | |
Total from investment operations | (0.03) | |
REDEMPTION FEES ADDED TO PAID-IN CAPITAL (NOTE 6) | 0.00(b) | |
Net (decrease) in net asset value | (0.03) | |
Net asset value, end of year | $9.97 | |
TOTAL RETURN(c) | (0.30)% | |
RATIOS/SUPPLEMENTAL DATA: | ||
Net assets, end of year (000s) | $5,262 | |
Ratio of expenses to average net assets excluding fee waivers and reimbursements | 5.01%(d) | |
Ratio of expenses to average net assets including fee waivers and reimbursements | 1.55%(d) | |
Ratio of net investment income to average net assets | 0.67%(d) | |
Portfolio turnover rate(e) | 181% | |
| (a) | Calculated using the average shares method. |
| (b) | Less than $0.005 per share. |
| (c) | Total returns are for the period indicated and have not been annualized. Total returns would have been lower had certain expenses not been waived during the period. Returns shown do not reflect the deduction of taxes that a shareholder would pay on Fund distributions or the redemption of Fund shares. Returns shown exclude any applicable sales charges. |
| (d) | Annualized. |
| (e) | Portfolio turnover rate for periods less than one full year have not been annualized. |
See Notes to Financial Statements.
| 79 | October 31, 2014 |
| ALPS | Sterling ETF Tactical Rotation Fund – Class C | ||
Financial Highlights Selected data for a share of beneficial interest outstanding throughout the period indicated: | ||
For the Period July 1, 2014 (Commencement) to October 31, 2014 | ||
Net asset value, beginning of period | $10.00 | |
INCOME FROM INVESTMENT OPERATIONS: | ||
Net realized and unrealized loss | (0.05) | |
Total from investment operations | (0.05) | |
Net (decrease) in net asset value | (0.05) | |
Net asset value, end of year | $9.95 | |
TOTAL RETURN(a) | (0.50)% | |
RATIOS/SUPPLEMENTAL DATA: | ||
Net assets, end of year (000s) | $530 | |
Ratio of expenses to average net assets excluding fee waivers and reimbursements | 9.70%(b) | |
Ratio of expenses to average net assets including fee waivers and reimbursements | 2.15%(b) | |
Ratio of net investment income to average net assets | 0.12%(b) | |
Portfolio turnover rate(c) | 181% | |
| (a) | Total returns are for the period indicated and have not been annualized. Total returns would have been lower had certain expenses not been waived during the period. Returns shown do not reflect the deduction of taxes that a shareholder would pay on Fund distributions or the redemption of Fund shares. Returns shown exclude any applicable sales charges. |
| (b) | Annualized. |
| (c) | Portfolio turnover rate for periods less than one full year have not been annualized. |
See Notes to Financial Statements.
| 80 | October 31, 2014 |
| ALPS | Sterling ETF Tactical Rotation Fund – Class I | ||
Financial Highlights Selected data for a share of beneficial interest outstanding throughout the period indicated: | ||
For the Period July 1, 2014 (Commencement) to October 31, 2014 | ||
Net asset value, beginning of period | $10.00 | |
INCOME FROM INVESTMENT OPERATIONS: | ||
Net investment income(a) | 0.03 | |
Net realized and unrealized loss | (0.05) | |
Total from investment operations | (0.02) | |
Net (decrease) in net asset value | (0.02) | |
Net asset value, end of year | $9.98 | |
TOTAL RETURN(b) | (0.20)% | |
RATIOS/SUPPLEMENTAL DATA: | ||
Net assets, end of year (000s) | $7,340 | |
Ratio of expenses to average net assets excluding fee waivers and reimbursements | 5.93%(c) | |
Ratio of expenses to average net assets including fee waivers and reimbursements | 1.15%(c) | |
Ratio of net investment income to average net assets | 0.94%(c) | |
Portfolio turnover rate(d) | 181% | |
| (a) | Calculated using the average shares method. |
| (b) | Total returns are for the period indicated and have not been annualized. Total returns would have been lower had certain expenses not been waived during the period. Returns shown do not reflect the deduction of taxes that a shareholder would pay on Fund distributions or the redemption of Fund shares. |
| (c) | Annualized. |
| (d) | Portfolio turnover rate for periods less than one full year have not been annualized. |
See Notes to Financial Statements.
| 81 | October 31, 2014 |
| ALPS | Westport Resources Hedged High Income Fund | ||
| Management Commentary | October 31, 2014 (Unaudited) | |
Portfolio Review – October, 2014
The ALPS | Westport Resources Hedged High Income Fund’s Class I Shares declined 0.37% for the six months ended October 31, returning 2.38% year-to-date (YTD), net of fees. The Fund has outperformed the average of the Morningstar Non-Traditional Bond Universe by 0.39% for the first ten months of the year. The Fund’s benchmark, the Barclays Capital US Aggregate Bond Index advanced 2.35% for the same period and has a YTD return of 5.12%. The 30-day SEC yield for the Fund at month end was 5.55% with an average weighted duration of 1.1 years.
The Fund is invested in three sub-strategies: the Senior Loan Floating Rate Strategy, the Short Duration High Yield Strategy, and the Relative Value Long/Short Debt Strategy. Fund assets are allocated approximately one-third to each sub-strategy.
The Senior Loan Floating Rate Strategy achieved positive performance for the month, gaining 0.23%. It’s year-to-date return of 5.07% exceeds the sub-strategy’s benchmark, the Credit Suisse Leverage Loan Index1 by 234 basis points2. The Relative Value Long/Short Debt Strategy and the Short Duration High Yield Strategy had negative returns for the month, -0.67% and -0.73%, respectively. Year to date, the Relative Value Long/Short Debt Strategy is up 3.21% while the Short Duration High Yield Strategy has returned a positive 4.36%. All individual strategy returns are gross of fees.
The softness in performance has created greater opportunities within different sectors of the credit markets. The ability of our Relative Value manager, Amundi Smith Breeden LLC, to have a flexible mandate and allocate to different sectors of the credit markets should continue to benefit the Fund as they prepare for increasing issuer and spread dispersion, and capitalize on specific market opportunities. The Fund’s combination of the three active credit strategies should make the navigation through cyclical changes in the markets a much smoother ride.
Economic and Fixed Income Review
Broadly, the sub-advisors’ base economic growth and fundamental credit outlooks have not changed over the past month. They expect growth and credit fundamentals to remain generally supportive over the near-term. A 3%-area domestic growth rate should underpin solid corporate cash flow generation, capital spending plans, and low prospective corporate defaults. Valuations have reset and offer value compared to tighter levels recorded earlier this year. Market technicals (supply and demand) remain a wildcard, with the managers maintaining a constructive stance on corporate credit supported by valuations, fundamentals, the economic outlook, and positive seasonals.
Current Positioning Themes:
Outlook and Current Positioning Themes:
| • | Macro forecast calls for 3.0% area real Gross Domestic Product (GDP) growth during second half of 2014 – Fiscal year (FY) 2015 |
| • | Global developed market growth and yields to remain low. |
| • | Geopolitical uncertainties will continue to simmer. |
Macro and Rates:
| • | Low economic volatility and accommodation have compressed bond spreads and flattened the yield curve. |
| • | Real yields reside at lower end of the reasonable range |
| • | U.S. Treasury yields are susceptible to better fundamental data. |
| • | Short swap spread positioning offers a flight-to-quality hedge. |
Corporate Credit:
| • | Valuations are attractive after recent repricing |
| • | “Not too hot, not too cold” — stable economic growth is an important element for market performance. |
| • | The technical outlook is less certain while the fundamental picture remains supportive |
| • | Recent indications support continued business spending growth trends. |
| • | Market sponsorship remain a consideration for capital market flows. |
| • | Maintain a diversified and non-concentrated portfolio. |
| • | Pullback in leveraged loans could create the best opportunity set since late 2011. |
| • | Recovery in short duration/small issues generally lag on the rebound. |
Securitized Credit:
| • | Securitized credit represents an alternative to higher-yielding corporate credit |
| • | Different stages of the U.S. business/default and housing recovery cycles offer fundamental support. |
| • | New issue securitization (agency credit risk transfer, single-family rental, and ability to repay) to benefit from better underwriting quality and the housing recovery. |
| • | Look to redeploy Commercial Mortgage-Backed Securities (CMBS) sales into new issue subordinated CMBS via the new issue calendar. |
Mark Tonucci, Co-Portfolio Manager
Mike Portnoy, Co-Portfolio Manager
The views and information discussed in this commentary are as of the date of publication, are subject to change, and may not reflect the writer’s current views. The views expressed represent an assessment of market conditions at a specific point in time, are opinions only and should not be relied upon as investment advice regarding a particular investment or markets in general. Such information does not constitute a recommendation to buy or sell specific securities or investment vehicles. It should not be assumed that any investment will be profitable or will equal the performance of the fund(s) or any securities or any sectors mentioned in this letter. The subject matter contained in this letter has been derived from several sources believed to be reliable and accurate at the time of compilation. Neither ALPS Advisors, Inc., Westport Resources Management, Inc. nor the Fund accepts any liability for losses either direct or consequential caused by the use of this information.
| 1 | The Credit Suisse Leverage Loan Index is an index designed to mirror the investable universe of the US-denominated leveraged loan market. |
| 2 | A basis point is a unit that is equal to 1/100th of 1%, and is used to denote the change in a financial instrument |
| 82 | October 31, 2014 |
| ALPS | Westport Resources Hedged High Income Fund | ||
| Performance Update | October 31, 2014 (Unaudited) | |
Performance of $10,000 Initial Investment (as of October 31, 2014)
Comparison of change in value of a $10,000 investment (includes maximum sales charges of 5.50%)
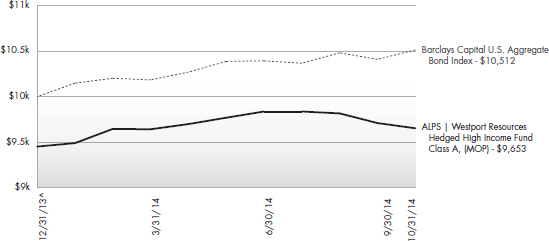
The chart above represents historical performance of a hypothetical investment of $10,000 in the Fund since inception. Past performance does not guarantee future results. This chart does not reflect the deduction of taxes that a shareholder would pay on Fund distributions or the redemption of Fund shares.
Average Annual Total Returns (as of October 31, 2014)
| 6 Month | Since Inception ^ | Total Expense Ratio | What You Pay * | |||||
Class A (NAV) | -0.57% | 2.13% | ||||||
Class A (MOP) | -6.02% | -3.47% | 2.45% | 2.39% | ||||
Class C (NAV) | -0.87% | 1.51% | ||||||
Class C (CDSC) | -1.84% | 0.53% | 3.05% | 2.99% | ||||
Class I | -0.37% | 2.38% | 2.05% | 1.99% | ||||
Barclays Capital U.S. Aggregate Bond Index1 | 2.35% | 5.12% |
Performance data quoted represents past performance. Past performance does not guarantee future results. Investment return and principal value of an investment will fluctuate so that an investor’s shares, when sold or redeemed, may be worth more or less than the original cost. Current performance data may be higher or lower than actual data quoted. For the most current month-end performance data, please call 1-866-759-5679.
Maximum Offering Price (MOP) for Class A shares includes the Fund’s maximum sales charge of 5.50%. Performance shown at NAV does not include these sales charges and would have been lower had it been taken into account. If you invest $1 million or more, either as a lump sum or through the Fund’s accumulation or letter of intent programs, you can purchase Class A shares without an initial sales charge (load). A Contingent Deferred Sales Charge (“CDSC”) of 1.00% may apply to Class C shares redeemed within the first 12 months after a purchase, and on Class A shares redeemed within the first 18 months after a purchase in excess of $1 million.
Performance less than 1 year is cumulative.
| 1 | The Barclays Capital U.S. Aggregate Bond Index is a broad-based benchmark that measures the investment grade, U.S. dollar-denominated, fixed-rate taxable bond market, including Treasuries, government-related and corporate securities, MBS (agency fixed-rate and hybrid ARM passthroughs), ABS, and CMBS. The index is not actively managed and does not reflect any deductions for fees, expenses or taxes. An investor may not invest directly in an index. |
| ^ | Fund inception date of December 31, 2013. |
| * | What You Pay reflects the Advisor’s decision to contractually limit expenses through August 31, 2015. Please see the prospectus for additional information. |
| 83 | October 31, 2014 |
| ALPS | Westport Resources Hedged High Income Fund | ||
| Performance Update | October 31, 2014 (Unaudited) | |
There is no guarantee that the Fund will continue to hold any one particular security or stay invested in any one particular company. The composition of the Fund’s top holdings is subject to change. Performance figures are historical and reflect the change in share price, reinvested distributions, changes in net asset value, sales charges and capital gains distributions, if any.
Not FDIC Insured – No Bank Guarantee – May Lose Value
Derivatives generally are more sensitive to changes in economic or market conditions than other types of investments; this could result in losses that significantly exceed the Fund’s original investment.
All investments involve risks, including possible loss of principal. The risks associated with higher-yielding, lower-rated securities include higher risk of default and loss of principal. Changes in the financial strength of a bond issuer or in a bond’s credit rating may affect its value. In addition, interest rate movements will affect the fund’s share price and yield. Credit risk refers to the possibility the bond issuer will not be able to make principal and interest payments. Bond prices generally move in the opposite direction of interest rates. Thus, as the prices of bonds in the fund adjust to a rise in interest rates, the fund’s share price may decline. These and other risk considerations are discussed in the fund’s prospectus. The principal on mortgage or asset-backed securities normally may be prepaid at any time, which will reduce the yield and market value of those securities. US obligations are supported by varying degrees of credit but generally are not backed by the full faith and credit of the US government. Investments in non-investment-grade debt securities (“high yield” or “junk” bonds) may be subject to greater market fluctuations and risk of default or loss of income and principal than securities in higher rating categories.
Senior-secured and second lien loans and bonds: Assets pledged as security for these loans and bonds would first be made available to senior lenders before other investors’ demands were met when settling a bankruptcy.
The Fund is not required to invest with any minimum number of sub-advisors, and does not have minimum or maximum limitations with respect to the allocations of the assets to any sub-advisor or investment option.
Top Ten Holdings (as a % of Net Assets) † |
Global Investments Group Finance Ltd., Sr. Unsec. Notes | 2.48 | % | ||
ION Geophysical Corp., Second Lien Notes | 2.14 | % | ||
Creditcorp, Sec. Notes | 2.12 | % | ||
American Gilsonite Co., Second Lien Notes | 2.12 | % | ||
Tempel Steel Co., Sec. Notes | 2.06 | % | ||
Broadview Networks Holdings, Inc., Sec. Notes | 1.96 | % | ||
Extreme Reach, Inc., First Lien Initial Term Loan | 1.94 | % | ||
Marine Acquisition Corp., Term Loan | 1.87 | % | ||
TeleCommunication Systems, Inc., Conv. Sr. Unsec. Notes | 1.73 | % | ||
Asurion LLC (fka Asurion Corp.), Second Lien Term Loan | 1.68 | % | ||
Top Ten Holdings | 20.10 | % |
| † | Holdings are subject to change. Table presents indicative values only. |
Portfolio Composition (as a % of Net Assets)
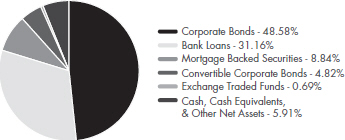
| 84 | October 31, 2014 |
| ALPS | Westport Resources Hedged High Income Fund | ||
| Statement of Investments | October 31, 2014 | |
| Shares | Value (Note 2) | |||||||
| ||||||||
EXCHANGE TRADED FUNDS (0.69%) |
| |||||||
ProShares UltraShort Russell 2000®(a) | 3,990 | $ | 170,413 | |||||
|
| |||||||
TOTAL EXCHANGE TRADED FUNDS (Cost $170,646) |
| 170,413 | ||||||
|
| |||||||
| Principal Amount | Value (Note 2) | |||||||
| ||||||||
BANK LOANS (31.16%)(b) | ||||||||
Basic Materials (1.12%) |
| |||||||
AZ Chem US, Inc., First Lien Initial Term Loan | ||||||||
4.500% 06/11/2021 | 29,684 | 29,711 | ||||||
Berlin Packaging, First Lien Initial Term Loan | ||||||||
4.500% 10/01/2021 | 14,000 | 13,955 | ||||||
HLX PLY Holdings, Inc., Term Loan | ||||||||
5.000% 06/30/2021 | 100,000 | 99,094 | ||||||
IBC Capital, Ltd., First Lien Initial Term Loan | ||||||||
4.750% 09/09/2021 | 35,000 | 34,847 | ||||||
Tensar Corp., First Lien Term Loan | ||||||||
5.750% 07/09/2021 | 100,000 | 99,438 | ||||||
|
| |||||||
Communications (5.83%) | ||||||||
ABG Intermediate Holdings LLC, First Lien Term Loan | ||||||||
5.500% 05/27/2021 | 99,500 | 99,127 | ||||||
Answers Corporation, First Lien Term Loan | ||||||||
6.250% 10/01/2021 | 22,000 | 21,340 | ||||||
AP NMT Aquisition BV, First Lien Term B Loan | ||||||||
L+5.75% 08/13/2021 (c) | 56,000 | 54,717 | ||||||
Auction.com, A-2 Term Loan | ||||||||
L+4.25% 02/28/2017 (c) | 2,964 | 2,949 | ||||||
Auction.com, A-4 Term Loan | ||||||||
L+4.25% 08/30/2016 (c) | 51,036 | 50,781 | ||||||
Block Communications, Term B Loan | ||||||||
L+3.50% 10/29/2021 (c) | 70,000 | 69,978 | ||||||
ConvergeOne Holdings Corp., First Lien Initial Term Loan | ||||||||
6.000% 06/17/2020 | 50,873 | 50,586 | ||||||
Encompass Digital Media, Inc., Second Lien Tranche B Term Loan | ||||||||
8.750% 06/06/2022 | 100,000 | 101,000 | ||||||
Extreme Reach, Inc., First Lien Initial Term Loan | ||||||||
6.750% 02/07/2020 | 476,667 | 479,050 | ||||||
| Principal Amount | Value (Note 2) | |||||||
| ||||||||
Communications (continued) |
| |||||||
Extreme Reach, Inc., Second Lien Initial Term Loan | ||||||||
10.500% 01/22/2021 | $ | 160,000 | $ | 160,800 | ||||
iParadigms Holdings LLC, First Lien Initial Term Loan | ||||||||
5.000% 07/30/2021 | 42,000 | 41,423 | ||||||
Level 3 Financing, Inc., Tranche B Term Loan | ||||||||
L+3.50% 01/31/2022 (c) | 72,000 | 72,416 | ||||||
Miller Heiman, Inc., Term Loan | ||||||||
6.750% 09/30/2019 | 34,779 | 34,007 | ||||||
NextGen Networks Pty, Ltd. (Nextgen Finance LLC), Term B Loan | ||||||||
5.000% 05/31/2021 | 99,750 | 97,256 | ||||||
TCH-2 Holdings LLC (TravelClick, Inc.), First Lien Initial Term Loan | ||||||||
5.500% 05/06/2021 | 99,756 | 98,883 | ||||||
YP LLC, Term Loan | ||||||||
8.000% 06/04/2018 | 5,580 | 5,611 | ||||||
|
| |||||||
Consumer, Cyclical (7.09%) |
| |||||||
Amaya Holdings BV, First Lien Initial Term B Loan | ||||||||
5.000% 08/01/2021 | 112,000 | 111,347 | ||||||
AMF Bowling Centers, Inc., Term B Loan | ||||||||
7.250% 09/18/2021 | 42,000 | 41,764 | ||||||
Aristocrat Leisure, Initial Term Loan | ||||||||
4.750% 10/20/2021 | 184,000 | 183,138 | ||||||
BDF Acquisition Corp., Initial Term Loan | ||||||||
5.250% 02/12/2021 | 124,625 | 121,354 | ||||||
BRG Sports, Inc. (fka Easton-Bell Sports, Inc.), First Lien Term Loan | ||||||||
6.500% 04/15/2021 | 145,565 | 146,293 | ||||||
BRG Sports, Inc. (fka Easton-Bell Sports, Inc.), Second Lien Term Loan | ||||||||
10.250% 04/15/2022 | 150,000 | 150,750 | ||||||
Caesars Entertainment Operating Company, Inc. (fka Harrah’s Operating Company, Inc.) Term B-7 Loan | ||||||||
9.750% 01/28/2018 | 199,500 | 184,945 | ||||||
Caesars Growth Properties Holdings LLC First Lien Term B Loan | ||||||||
6.250% 05/08/2021 | 18,000 | 17,058 | ||||||
| 85 | October 31, 2014 |
| ALPS | Westport Resources Hedged High Income Fund | ||
| Statement of Investments | October 31, 2014 | |
| Principal Amount | Value (Note 2) | |||||||
| ||||||||
Consumer, Cyclical (continued) |
| |||||||
Deluxe Entertainment Services Group, Inc., Initial Term Loan | ||||||||
6.500% 02/28/2020 | $ | 98,750 | $ | 92,825 | ||||
Diamond Resorts Corp., Term Loan | ||||||||
5.500% 05/09/2021 | 21,945 | 21,945 | ||||||
Fitness International LLC, Term B Loan | ||||||||
5.500% 07/01/2020 | 88,778 | 88,186 | ||||||
GOBP Holdings, Inc., First Lien Initial Term Loan | ||||||||
5.750% 10/21/2021 | 28,000 | 28,000 | ||||||
GST AutoLeather, Inc., Commitment Term B Loan | ||||||||
6.500% 07/10/2020 | 100,000 | 99,375 | ||||||
Mattress Holding Corp., Initial Term Loan | ||||||||
L+4.25% 10/20/2021 (c) | 31,000 | 31,058 | ||||||
MPG Holdco I, Inc., Initial Term Loan | ||||||||
L+3.50% 10/20/2021 (c) | 83,000 | 83,173 | ||||||
Twin River Management Group, Inc. (fka BLB Management Services, Inc.), Closing Date Term Loan | ||||||||
5.250% 07/10/2020 | 249,375 | 249,063 | ||||||
World Triathlon Corp., Initial Term Loan | ||||||||
5.250% 06/25/2021 | 99,750 | 99,127 | ||||||
|
| |||||||
Consumer, Non-cyclical (5.13%) |
| |||||||
Academi Holdings LLC (ERSM (International) Ltd.), First Lien Term Loan | ||||||||
6.250% 07/25/2019 | 42,900 | 42,685 | ||||||
Access CIG, First Lien Term B Loan | ||||||||
L+5.00% 10/18/2021 (c) | 61,000 | 60,695 | ||||||
Amneal Pharmaceuticals LLC, Term B Loan | ||||||||
L+3.75% 11/01/2019 (c) | 1,000 | 992 | ||||||
CCS Intermediate Holdings LLC, First Lien Initial Term Loan | ||||||||
5.000% 07/23/2021 | 20,000 | 19,775 | ||||||
Central Security, First Lien Initial Term Loan | ||||||||
6.250% 10/06/2020 | 47,000 | 46,530 | ||||||
CPI Buyer, First Lien InitialTerm Loan | ||||||||
5.500% 08/16/2021 | 37,000 | 36,630 | ||||||
FHC Health Systems, Initial Term Loan | ||||||||
L+4.00% 10/08/2021 (c) | 102,000 | 101,682 | ||||||
| Principal Amount | Value (Note 2) | |||||||
| ||||||||
Consumer, Non-cyclical (continued) |
| |||||||
Marine Acquisition Corp., Term Loan | ||||||||
5.250% 01/30/2021 | $ | 465,179 | $ | 462,564 | ||||
Midas Intermediate Holdco II LLC, Closing Date Term Loan | ||||||||
L+3.75% 08/18/2021 (c) | 12,582 | 12,555 | ||||||
Midas Intermediate Holdco II LLC, Delayed Draw Term Loan | ||||||||
L+3.75% 08/18/2021 (c) | 1,418 | 1,415 | ||||||
Millennium Health LLC (fka Millennium Laboratories LLC), Tranche B Term Loan | ||||||||
5.250% 04/16/2021 | 18,953 | 18,994 | ||||||
Mister Car Wash Holdings, Inc., Term Loan | ||||||||
5.000% 08/20/2021 | 41,790 | 41,633 | ||||||
ProQuest LLC, Initial Term Loan | ||||||||
L+4.25% 10/24/2021 (c) | 78,000 | 78,195 | ||||||
Sun Products Corp. (fka Huish Detergents, Inc.), Tranche B Term Loan | ||||||||
5.500% 03/23/2020 | 98,507 | 90,298 | ||||||
Vestcom International, Inc., Second Lien Term Loan | ||||||||
8.750% 09/30/2022 | 88,000 | 88,000 | ||||||
Vestcom International, Inc., Term B Loan | ||||||||
L+4.25% 09/30/2021 (c) | 118,000 | 117,705 | ||||||
Wyle Services Corp., Term Loan | ||||||||
5.000% 05/23/2021 | 46,765 | 46,804 | ||||||
|
| |||||||
Diversified (1.65%) | ||||||||
Emerald 2 Ltd., Facility B1 Loan | ||||||||
L+4.00% 05/14/2021 (c) | 100,000 | 98,750 | ||||||
Travelport Finance (Luxembourg) S.a r.l., Initial Term Loan | ||||||||
6.000% 09/02/2021 | 63,000 | 63,069 | ||||||
US LBM Holdings LLC, Term Loan | ||||||||
7.250% 04/24/2020 | 248,750 | 245,641 | ||||||
|
| |||||||
Energy (0.55%) | ||||||||
Expro Holdings, Initial Term Loan | ||||||||
5.750% 09/02/2021 | 62,000 | 60,863 | ||||||
Preferred Proppants LLC, Term Loan | ||||||||
6.750% 07/27/2020 | 35,000 | 33,381 | ||||||
| 86 | October 31, 2014 |
| ALPS | Westport Resources Hedged High Income Fund | ||
| Statement of Investments | October 31, 2014 | |
| Principal Amount | Value (Note 2) | |||||||
| ||||||||
Energy (continued) | ||||||||
WHA Holding (Wheelabrator Project Archimede), New Monthly Facility, Term B Loan | ||||||||
L+4.00% 01/24/2019 (c) | $ | 40,230 | $ | 40,406 | ||||
WHA Holding (Wheelabrator Project Archimede), New Monthly Facility, Term C Loan | ||||||||
L+4.00% 01/24/2019 (c) | 1,770 | 1,778 | ||||||
|
| |||||||
Financials (4.56%) | ||||||||
Aptean, Inc., First Lien Term Loan | ||||||||
5.250% 02/26/2020 | 99,500 | 99,417 | ||||||
Asurion LLC (fka Asurion Corp.), Incremental Tranche B-1 Term Loan | ||||||||
5.000% 05/24/2019 | 148,844 | 149,206 | ||||||
Asurion LLC (fka Asurion Corp.), Second Lien Term Loan | ||||||||
8.500% 03/03/2021 | 408,000 | 416,058 | ||||||
DTZ US Borrower LLC, Delayed Draw Term Loan | ||||||||
L+4.50% 11/04/2021 (c) | 22,400 | 22,433 | ||||||
DTZ US Borrower LLC, Second Lien Initial Term Loan | ||||||||
L+8.25% 11/04/2022 (c) | 38,000 | 38,285 | ||||||
DTZ US Borrower LLC, Term Loan | ||||||||
L+4.50% 11/04/2021 (c) | 37,600 | 37,655 | ||||||
Liquidnet Holdings, Inc., Term Loan | ||||||||
7.750% 05/22/2019 | 98,750 | 97,763 | ||||||
LTCG Holdings Corp., Initial Term Loan | ||||||||
6.000% 06/06/2020 | 98,750 | 99,491 | ||||||
NXT Capital, Inc. (NXT Capital LLC), Facility Term Loan | ||||||||
6.250% 09/04/2018 | 99,497 | 98,751 | ||||||
RCS Capital Corp., First Lien Term Loan | ||||||||
L+5.50% 04/29/2019 (c) | 45,000 | 44,634 | ||||||
York Risk Services Holding Corp. (Onex York Finance LP), Term Loan | ||||||||
L+3.75% 10/01/2021 (c) | 18,951 | 18,892 | ||||||
York Risk Services Holding Corp., Delayed Draw Term Loan | ||||||||
L+3.75% 10/01/2021 (c) | 2,049 | 2,042 | ||||||
|
| |||||||
| Principal Amount | Value (Note 2) | |||||||
| ||||||||
Industrials (2.12%) | ||||||||
C.H.I. Overhead Doors, Inc., First Lien Term Loan | ||||||||
5.500% 03/18/2019 | $ | 48,880 | $ | 48,605 | ||||
Capstone Logistics, First Lien Term Loan | ||||||||
5.500% 10/07/2021 | 12,000 | 11,992 | ||||||
Electrical Components International, Inc., Term Loan | ||||||||
5.750% 05/28/2021 | 47,000 | 47,059 | ||||||
NN, Inc., Loan | ||||||||
6.000% 08/27/2021 | 37,000 | 36,884 | ||||||
Pelican Products, Inc., Second Lien Term Loan | ||||||||
9.250% 04/09/2021 | 150,000 | 149,250 | ||||||
Pro Mach Group, Inc., First Lien Term Loan | ||||||||
L+4.50% 10/22/2021 (c) | 10,000 | 10,025 | ||||||
PSC Industrial Outsourcing LP, Term Loan | ||||||||
5.500% 05/15/2020 | 113,715 | 112,578 | ||||||
Quality Home Brands Holdings LLC, First Lien Initial Term Loan | ||||||||
7.750% 12/17/2018 | 49,625 | 49,749 | ||||||
U.S. Shipping Corp., Tranche B-1 Term Loan | ||||||||
5.500% 04/30/2018 | 59,000 | 57,820 | ||||||
|
| |||||||
Technology (2.45%) | ||||||||
Active Network, First Lien Term Loan | ||||||||
5.500% 11/13/2020 | 99,499 | 98,815 | ||||||
Datapipe, Second Lien Initial Term Loan | ||||||||
L+7.50% 09/16/2019 (c) | 13,000 | 12,594 | ||||||
Progressive Solution, First Lien Initial Term Loan | ||||||||
5.500% 10/22/2020 | 97,739 | 97,556 | ||||||
QBS Holding Company, Term Loan | ||||||||
5.750% 08/07/2021 | 200,000 | 199,000 | ||||||
Regit Eins GmbH (TV Borrower US LLC), First Lien Dollar Term Loan | ||||||||
6.000% 01/08/2021 | 100,000 | 98,125 | ||||||
Stratus Technologies Bermuda Ltd. (Stratus Technologies, Inc.), Inc., Initial Term Loan | ||||||||
6.000% 04/28/2021 | 24,863 | 25,080 | ||||||
Vencore, Inc. (fka SI Organization, Inc.), First Lien Initial Term Loan | ||||||||
5.750% 11/14/2019 | 65,150 | 65,303 | ||||||
| 87 | October 31, 2014 |
| ALPS | Westport Resources Hedged High Income Fund | ||
| Statement of Investments | October 31, 2014 | |
| Principal Amount | Value (Note 2) | |||||||
| ||||||||
Technology (continued) |
| |||||||
L+4.75% 11/23/2019 (c) | $ | 8,618 | $ | 8,638 | ||||
|
| |||||||
Utilities (0.66%) | ||||||||
Alfred Fueling Systems Intermediate Holdco Ltd. (Alfred Fueling Systems, Inc.), First Lien Initial Term Loan | ||||||||
4.750% 06/18/2022 | 63,840 | 63,441 | ||||||
Alfred Fueling Systems Intermediate Holdco Ltd. (Alfred Fueling Systems, Inc.), Second Lien Term Loan | ||||||||
8.500% 06/20/2022 | 100,000 | 98,750 | ||||||
|
| |||||||
TOTAL BANK LOANS (Cost $7,672,205) |
| 7,693,301 | ||||||
|
| |||||||
CONVERTIBLE CORPORATE BONDS (4.82%) |
| |||||||
Communications (3.18%) | ||||||||
Alaska Communications Systems Group, Inc., Conv. Sub. Notes | ||||||||
6.250% 05/01/2018 | 440,000 | 356,400 | ||||||
TeleCommunication Systems, Inc., Conv. Sr. Unsec. Notes | ||||||||
7.750% 06/30/2018 | 450,000 | 427,500 | ||||||
|
| |||||||
Total Communications | 783,900 | |||||||
|
| |||||||
Financials (1.18%) | ||||||||
Pinetree Capital Ltd., Conv. Sub. Notes | ||||||||
10.000% 05/31/2016 | 450,000 | 291,948 | ||||||
|
| |||||||
Industrials (0.46%) | ||||||||
DryShips, Inc., Conv. Sr. Unsec. Notes | ||||||||
5.000% 12/01/2014 | 115,000 | 114,138 | ||||||
|
| |||||||
TOTAL CONVERTIBLE CORPORATE BONDS (Cost $1,302,079) |
| 1,189,986 | ||||||
|
| |||||||
CORPORATE BONDS (48.58%) |
| |||||||
Basic Materials (2.22%) | ||||||||
American Gilsonite Co., Second Lien Notes | ||||||||
11.500% 09/01/2017 (d) | 500,000 | 522,500 | ||||||
Eco Services Operations LLC/Eco Finance Corp., Sr. Unsec. Notes | ||||||||
8.500% 11/01/2022 (d) | 26,000 | 26,910 | ||||||
|
| |||||||
| Principal Amount | Value (Note 2) | |||||||
| ||||||||
Basic Materials (continued) |
| |||||||
Total Basic Materials | 549,410 | |||||||
|
| |||||||
Communications (8.45%) |
| |||||||
Baker & Taylor Acquisitions Corp., Second Lien Notes | ||||||||
15.000% 04/01/2017 (d) | $ | 410,000 | $ | 393,600 | ||||
Broadview Networks Holdings, Inc., Sec. Notes | ||||||||
10.500% 11/15/2017 | 500,000 | 485,000 | ||||||
CBS Outdoor Americas Capital LLC / CBS Outdoor Americas Capital Corp., Sr. Unsec. Notes | ||||||||
5.250% 02/15/2022 (d) | 120,000 | 124,200 | ||||||
CCOH Safari LLC, Sr. Unsec. Notes | ||||||||
5.500% 12/01/2022 | 105,000 | 105,919 | ||||||
Clear Channel Communications, Inc., First Lien Notes | ||||||||
9.000% 12/15/2019 | 150,000 | 152,156 | ||||||
Interactive Network, Inc. / FriendFinder Networks, Inc., First Lien Notes | ||||||||
14.000% 12/20/2018 | 245,209 | 228,045 | ||||||
Sprint Communications, Inc., Sr. Unsec. Notes | ||||||||
7.000% 08/15/2020 | 225,000 | 239,625 | ||||||
Visant Corp., Sr. Unsec. Notes | ||||||||
10.000% 10/01/2017 | 100,000 | 88,500 | ||||||
Windstream Corp., Sr. Unsec. Notes | ||||||||
7.750% 10/01/2021 | 250,000 | 268,750 | ||||||
|
| |||||||
Total Communications | 2,085,795 | |||||||
|
| |||||||
Consumer, Cyclical (7.66%) |
| |||||||
American Airlines 2014-1 Class A Pass Through Trust, First Lien Notes, Series A | ||||||||
3.700% 10/01/2026 | 50,000 | 49,813 | ||||||
Bed Bath & Beyond, Inc., Sr. Unsec. Notes | ||||||||
5.165% 08/01/2044 | 120,000 | 120,161 | ||||||
Boardriders SA, Sr. Unsec. Notes, Series REGS | ||||||||
8.875% 12/15/2017 (e) | 250,000 | 284,308 | ||||||
Caesars Entertainment Operating Co., Inc., Sr. Unsec. Notes | ||||||||
10.750% 02/01/2016 | 250,000 | 39,375 | ||||||
K Hovnanian Enterprises, Inc., Sr. Unsec. Notes | ||||||||
8.000% 11/01/2019 (d)(f) | 55,000 | 55,000 | ||||||
KB Home, Sr. Unsec. Notes | ||||||||
8.000% 03/15/2020 | 200,000 | 224,000 | ||||||
| 88 | October 31, 2014 |
| ALPS | Westport Resources Hedged High Income Fund | ||
| Statement of Investments | October 31, 2014 | |
| Principal Amount | Value (Note 2) | |||||||
| ||||||||
Consumer, Cyclical (continued) |
| |||||||
MGM Resorts International, Sr. Unsec. Notes | ||||||||
5.250% 03/31/2020 | $ | 250,000 | $ | 256,875 | ||||
MPG Holdco I, Inc., Sr. Unsec. Notes | ||||||||
7.375% 10/15/2022 (d) | 110,000 | 116,050 | ||||||
Neebo, Inc., Sec. Notes | ||||||||
15.000% 06/30/2016 (d) | 396,500 | 398,482 | ||||||
Tunica-Biloxi Gaming Authority, Sr. Unsec. Notes | ||||||||
9.000% 11/15/2015 (d) | 400,000 | 248,000 | ||||||
United Airlines 2014-1 Class B Pass Through Trust, Second Lien Notes, Series B | ||||||||
4.750% 04/11/2022 | 100,000 | 99,625 | ||||||
|
| |||||||
Total Consumer, Cyclical | 1,891,689 | |||||||
|
| |||||||
Consumer, Non-cyclical (1.41%) |
| |||||||
The ADT Corp., Sr. Unsec. Notes | ||||||||
4.125% 06/15/2023 | 125,000 | 115,312 | ||||||
Anna Merger Sub, Inc., Sr. Unsec. Notes | ||||||||
7.750% 10/01/2022 (d) | 85,000 | 87,763 | ||||||
Constellation Brands, Inc., Sr. Unsec. Notes | ||||||||
4.750% 11/15/2024 | 50,000 | 51,250 | ||||||
Fresenius Medical Care US Finance II, Inc., Sr. Unsec. Notes | ||||||||
4.750% 10/15/2024 (d) | 40,000 | 40,450 | ||||||
WhiteWave Foods Co., Sr. Unsec. Notes | ||||||||
5.375% 10/01/2022 | 50,000 | 52,625 | ||||||
|
| |||||||
Total Consumer, Non-cyclical |
| 347,400 | ||||||
|
| |||||||
Energy (6.17%) | ||||||||
Antero Resources Corp., Sr. Unsec. Notes | ||||||||
5.125% 12/01/2022 (d) | 100,000 | 100,145 | ||||||
California Resources Corp., Sr. Unsec. Notes | ||||||||
6.000% 11/15/2024 (d) | 45,000 | 46,238 | ||||||
Denbury Resources, Inc., Sr. Sub. Notes | ||||||||
4.625% 07/15/2023 | 200,000 | 185,000 | ||||||
ION Geophysical Corp., Second Lien Notes | ||||||||
8.125% 05/15/2018 | 560,000 | 529,200 | ||||||
Kinder Morgan Energy Partners LP, Sr. Unsec. Notes | ||||||||
5.400% 09/01/2044 | 100,000 | 98,314 | ||||||
| Principal Amount | Value (Note 2) | |||||||
| ||||||||
Energy (continued) | ||||||||
Petrobras Global Finance BV, Sr. Unsec. Notes | ||||||||
6.250% 03/17/2024 | $ | 60,000 | $ | 63,707 | ||||
Pioneer Energy Services Corp., Sr. Unsec. Notes | ||||||||
6.125% 03/15/2022 (d) | 100,000 | 93,250 | ||||||
Polarcus Ltd., Sr. Unsec. Notes | ||||||||
8.000% 06/07/2018 (d) | 400,000 | 304,000 | ||||||
Targa Resources Partners LP / Targa Resources Partners Finance Corp., Sr. Unsec. Notes | ||||||||
4.125% 11/15/2019 (d) | 40,000 | 40,700 | ||||||
Tesoro Logistics LP / Tesoro Logistics Finance Corp., Sr. Unsec. Notes | ||||||||
5.500% 10/15/2019 (d) | 60,000 | 61,800 | ||||||
|
| |||||||
Total Energy | 1,522,354 | |||||||
|
| |||||||
Financials (11.28%) | ||||||||
Ares Capital Corp., Sr. Unsec. Notes | ||||||||
4.875% 11/30/2018 | 250,000 | 263,571 | ||||||
Creditcorp, Sec. Notes | ||||||||
12.000% 07/15/2018 (d) | 510,000 | 522,750 | ||||||
Fly Leasing Ltd., Sr. Unsec. Notes | ||||||||
6.375% 10/15/2021 | 200,000 | 199,500 | ||||||
General Motors Financial Co., Inc., Sr. Unsec. Notes | ||||||||
4.375% 09/25/2021 | 85,000 | 89,152 | ||||||
Global Investments Group Finance Ltd., Sr. Unsec. Notes | ||||||||
11.000% 09/24/2017 (d) | 600,000 | 612,000 | ||||||
Goldman Sachs Group, Inc., Jr. Sub. Notes, Series L | ||||||||
5.700% Perpetual | 200,000 | 205,250 | ||||||
JPMorgan Chase & Co., Jr. Sub. Notes, Series V | ||||||||
5.000% Perpetual | 100,000 | 98,875 | ||||||
JPMorgan Chase & Co., Jr. Sub. Notes, Series X | ||||||||
6.100% Perpetual | 100,000 | 100,500 | ||||||
KKR Group Finance Co. III LLC, Sr. Unsec. Notes | ||||||||
5.125% 06/01/2044 (d) | 150,000 | 158,434 | ||||||
Morgan Stanley, Sub. Medium Term Notes, Series GMTN | ||||||||
4.350% 09/08/2026 | 40,000 | 40,144 | ||||||
| 89 | October 31, 2014 |
| ALPS | Westport Resources Hedged High Income Fund | ||
| Statement of Investments | October 31, 2014 | |
| Principal Amount | Value (Note 2) | |||||||
| ||||||||
Financials (continued) | ||||||||
Sumitomo Mitsui Financial Group, Inc., Sub. Notes | ||||||||
4.436% 04/02/2024 (d) | $ | 200,000 | $ | 208,524 | ||||
TIAA Asset Management Finance Co. LLC, Sr. Unsec. Notes | ||||||||
4.125% 11/01/2024 (d) | 80,000 | 80,552 | ||||||
Wells Fargo & Co., Jr. Sub. Notes, Series S | ||||||||
5.900% Perpetual | 200,000 | 206,120 | ||||||
|
| |||||||
Total Financials | 2,785,372 | |||||||
|
| |||||||
Industrials (7.99%) | ||||||||
American Piping Products, Inc., Second Lien Notes | ||||||||
12.875% 11/15/2017 (d) | 250,000 | 270,000 | ||||||
CNH Industrial Capital LLC, Sr. Unsec. Notes | ||||||||
3.375% 07/15/2019 (d) | 85,000 | 83,087 | ||||||
Colt Defense LLC / Colt Finance Corp., Sr. Unsec. Notes | ||||||||
8.750% 11/15/2017 | 450,000 | 263,250 | ||||||
Congoleum Corp., PIK First Lien Notes | ||||||||
9.000% 12/31/2017 (f)(h) | 350,000 | 262,500 | ||||||
Euramax International, Inc., First Lien Notes | ||||||||
9.500% 04/01/2016 | 34,000 | 33,405 | ||||||
Graphic Packaging International, Inc., Sr. Unsec. Notes | ||||||||
4.875% 11/15/2022 | 20,000 | 20,150 | ||||||
Horizon Lines LLC, First Lien Notes | ||||||||
11.000% 10/15/2016 | 346,000 | 346,865 | ||||||
NCSG Crane & Heavy Haul Services, Second Lien Notes | ||||||||
9.500% 08/15/2019 (d) | 190,000 | 187,150 | ||||||
Tempel Steel Co., Sec. Notes | ||||||||
12.000% 08/15/2016 (d) | 500,000 | 507,500 | ||||||
|
| |||||||
Total Industrials | 1,973,907 | |||||||
|
| |||||||
Technology (3.40%) | ||||||||
DynCorp International, Inc., Sr. Unsec. Notes | ||||||||
10.375% 07/01/2017 | 325,000 | 283,562 | ||||||
First Data Corp., Sr. Unsec. Notes | ||||||||
12.625% 01/15/2021 | 250,000 | 302,500 | ||||||
Jazz Technologies, Inc., Sr. Unsec. Notes | ||||||||
8.000% 06/30/2015 | 250,000 | 253,750 | ||||||
|
| |||||||
| Principal Amount | Value (Note 2) | |||||||
| ||||||||
Technology (continued) | ||||||||
Total Technology | 839,812 | |||||||
|
| |||||||
TOTAL CORPORATE BONDS (Cost $12,458,437) |
| $ | 11,995,739 | |||||
|
| |||||||
MORTGAGE BACKED SECURITIES (8.84%) |
| |||||||
American Homes 4 Rent, Series 2014-SFR2 | ||||||||
6.231% 10/17/2024 (d) | 100,000 | 101,123 | ||||||
American Residential Properties Trust, Series 2014-SFR1 | ||||||||
4.074% 09/17/2016 (b)(d) | 100,000 | 97,993 | ||||||
Invitation Homes Trust, Series 2013-SFR1 | ||||||||
2.900% 12/17/2015 (b)(d) | 100,000 | 94,431 | ||||||
Invitation Homes Trust, Series 2014-SFR2 | ||||||||
3.564% 09/17/2016 (b)(d) | 100,000 | 95,784 | ||||||
|
| |||||||
Colony American Homes, Series 2014-2A | ||||||||
3.354% 07/17/2016 (b)(d) | 100,000 | 95,021 | ||||||
Colony American Homes, Series 2014-1A | ||||||||
3.050% 05/17/2017 (b)(d) | 225,000 | 212,853 | ||||||
COMM Mortgage Trust, Series 2014-CR17 | ||||||||
4.800% 05/10/2024 (b)(d) | 207,000 | 198,962 | ||||||
Countrywide Alternative Loan Trust, Series 2006-6CB | ||||||||
5.750% 05/25/2036 (b) | 285,837 | 227,937 | ||||||
Fannie Mae Connecticut Avenue Securities, Series 2014-C03 | ||||||||
3.152% 07/25/2024 (b) | 200,000 | 183,335 | ||||||
Fannie Mae Connecticut Avenue Securities, Series 2014-C02 | ||||||||
2.752% 05/25/2024 (b) | 50,000 | 44,980 | ||||||
Freddie Mac Structured Agency Credit Risk Debt Notes, Series 2014-DN4 | ||||||||
4.703% 10/25/2024 (b) | 250,000 | 251,740 | ||||||
Freddie Mac Structured Agency Credit Risk Debt Notes, Series 2014-DN1 | ||||||||
4.652% 02/25/2024 (b) | 250,000 | 252,057 | ||||||
Invitation Homes Trust, Series 2014-SFR1 | ||||||||
3.904% 06/17/2016 (b)(d) | 200,000 | 190,765 | ||||||
Morgan Stanley Bank of America Merrill Lynch Trust, Series 2014-C16 | ||||||||
4.758% 06/15/2024 (b)(d) | 100,000 | 94,331 | ||||||
| 90 | October 31, 2014 |
| ALPS | Westport Resources Hedged High Income Fund | ||
| Statement of Investments | October 31, 2014 | |
| Principal Amount | Value (Note 2) | |||||||||
| ||||||||||
Popular ABS Mortgage Pass- Through Trust, Series 2005-6 | ||||||||||
5.680% 01/25/2036 (b) | $ | 44,360 | $ | 41,353 | ||||||
|
| |||||||||
TOTAL MORTGAGE BACKED SECURITIES (Cost $2,187,426) |
| 2,182,665 | ||||||||
|
| |||||||||
| Yield | Principal Amount | Value (Note 2) | ||||||||||
| ||||||||||||
SHORT TERM INVESTMENTS (0.28%) |
| |||||||||||
Government (0.28%) |
| |||||||||||
U.S. Treasury Bills Discounted Notes, 04/02/2015(i)(j) | 0.039 | % | 70,000 | 69,989 | ||||||||
|
| |||||||||||
TOTAL SHORT TERM INVESTMENTS (Cost $69,989) |
| 69,989 | ||||||||||
|
| |||||||||||
TOTAL INVESTMENTS (94.37%) (Cost $23,860,782) |
| $ | 23,302,093 | |||||||||
Other Assets In Excess Of Liabilities (5.63%) |
| 1,389,804(k) | ||||||||||
|
| |||||||||||
NET ASSETS (100.00%) |
| $ | 24,691,897 | |||||||||
|
| |||||||||||
| (a) | Non-Income Producing Security. |
| (b) | Floating or variable rate security. Interest rate disclosed is that which is in effect at October 31, 2014. |
| (c) | All or a portion of this position has not settled as of October 31, 2014. The interest rate shown represents the stated spread over the London Interbank Offered Rate (“LIBOR” or “L”) or the applicable LIBOR floor; the Fund will not accrue interest until the settlement date, at which point LIBOR will be established. |
| (d) | Security exempt from registration under Rule 144A of the Securities Act of 1933. These securities have been deemed liquid under procedures approved by the Fund’s Board of Trustees and may normally be sold to qualified institutional buyers in transactions exempt from registration. Total market value of Rule 144A securities amounts to 6,470,349, which represents approximately 26.20% of net assets as of October 31, 2014. |
| (e) | Securities were purchased pursuant to Regulation S under the Securities Act of 1933, which exempts securities offered and sold outside of the United States from registration. Such securities cannot be sold in the United States without either an effective registration statement filed pursuant to the Securities Act of 1933, or pursuant to an exemption from registration. These securities have been deemed liquid under guidelines approved by the Fund’s Board of Trustees. As of October 31, 2014 the aggregate market value of those securities was $284,308, representing 1.15% of net assets. |
| (f) | Fair valued security under the procedures approved by the Fund’s Board of Trustees. |
| (g) | This security has no contractual maturity date, is not redeemable and contractually pays an indefinite stream of interest. |
| (h) | Payment in-kind security. |
| (i) | All or a portion of the security is pledged as collateral on futures. The aggregate market value of the collateralized securities totals $69,989 as of October 31, 2014. See Note 3 in Notes to Financial Statements. |
| (j) | Rate shown represents the bond equivalent yield to maturity at date of purchase. |
| (k) | Portion of Assets in excess of Liabilities is held as collateral for futures contracts and credit default contracts in the amount of $133,830. See Note 3 in the Notes to Financial Statements. |
Common Abbreviations:
aka - Also known as.
BV - Besloten Vennootschap is the Dutch term for private limited liability company.
Conv. - Convertible.
fka - Formerly known as.
GmbH - Gesellschaft mit beschränkter Haftungis the German term for limited liability company.
Jr. Sub. - Junior Subordinated.
LLC - Limited Liability Company.
LP - Limited Partnership.
Ltd. - Limited.
PIK - Payment in-kind.
Pty. - Proprietary.
Sec. - Secured.
Sr. Sub. - Senior Subordinated.
Sr. Unsec. - Senior Unsecured.
Sub. - Subordinated.
For Fund compliance purposes, the Fund’s industry classifications refer to any one or more of the industry sub-classifications used by one or more widely recognized market indexes or ratings group indexes, and/or as defined by Fund management. This definition may not apply for purposes of this report, which may combine industry sub-classifications for reporting ease. Industries are shown as a percent of net assets.
| 91 | October 31, 2014 |
| ALPS | Westport Resources Hedged High Income Fund | ||
| Statement of Investments | October 31, 2014 | |
FUTURES CONTRACTS
| Description | Position | Contracts | Expiration Date | Value (Note 2) | Unrealized Depreciation | |||||||||||||
10 Year USD (Interest Rate Swap) Future | Short | (7) | 12/16/14 | $ | (730,516 | ) $ | (9,424 | ) | ||||||||||
5 Year USD (Interest Rate Swap) Future | Short | (3) | 12/16/14 | (306,188 | ) | (2,271 | ) | |||||||||||
CME Ultra Long Term U.S. T-Bond Future | Short | (2) | 12/22/14 | (313,625 | ) | (6,271 | ) | |||||||||||
U.S. 10 Year T-Note Future | Short | (4) | 12/22/14 | (505,438 | ) | (4,877 | ) | |||||||||||
U.S. 5 Year T-Note Future | Short | (23) | 01/02/15 | (2,746,883 | ) | (5,940 | ) | |||||||||||
|
| |||||||||||||||||
| $ | (4,602,649 | ) $ | (28,783 | ) | ||||||||||||||
|
| |||||||||||||||||
CREDIT DEFAULT SWAP CONTRACTS
| Referenced | Obligation | Buy Credit Protection | Notional Amount | Rate Received by Fund | Termination Date | Upfront Payment Paid | Unrealized Depreciation | |||||||
Centrally cleared swap | CDX North American High Yield Index Series 23 | Buy | $ 2,000,000 | 5.00% | 12/20/19 | $ (139,227) | $ (10,674) | |||||||
TOTAL | $ (139,227) | $ (10,674) | ||||||||||||
| ||||||||||||||
See Notes to Financial Statements.
| 92 | October 31, 2014 |
| ALPS | Westport Resources Hedged High Income Fund | ||
| Statement of Assets and Liabilities | October 31, 2014 | |
ASSETS | ||||
Investments, at value | $ | 23,302,093 | ||
Cash | 1,671,174 | |||
Foreign currency, at value (Cost $31,053) | 30,759 | |||
Receivable for investments sold | 1,266,635 | |||
Cash collateral pledged for futures contracts | 36,517 | |||
Cash collateral pledged for credit default swap contracts | 97,313 | |||
Interest receivable | 378,761 | |||
Deferred offering costs | 12,451 | |||
Prepaid expenses and other assets | 16,015 | |||
| ||||
Total Assets | 26,811,718 | |||
| ||||
LIABILITIES | ||||
Payable for investments purchased | 1,975,823 | |||
Payable for variation margin | 28,783 | |||
Unrealized depreciation on credit default swap contracts | 10,674 | |||
Investment advisory fees payable | 33,566 | |||
Administration and transfer agency fees payable | 6,864 | |||
Distribution and services fees payable | 5,182 | |||
Professional fees payable | 24,416 | |||
Accrued expenses and other liabilities | 34,513 | |||
| ||||
Total Liabilities | 2,119,821 | |||
| ||||
NET ASSETS | $ | 24,691,897 | ||
| ||||
NET ASSETS CONSIST OF | ||||
Paid-in capital | $ | 25,146,366 | ||
Accumulated net investment income | 10,674 | |||
Accumulated net realized gain on investments, futures contracts, credit default swap contracts and foreign currency transactions | 134,087 | |||
Net unrealized depreciation on investments and futures contracts, credit default swap contracts and translation of assets and liabilities denominated in foreign currencies | (599,230) | |||
| ||||
NET ASSETS | $ | 24,691,897 | ||
| ||||
INVESTMENTS, AT COST | $ | 23,860,782 | ||
| ||||
PRICING OF SHARES | ||||
Class A: | ||||
Net Asset Value, offering and redemption price per share(a) | $ | 9.86 | ||
Net Assets | $ | 4,190,183 | ||
Shares of beneficial interest outstanding (unlimited number of shares, no par value common stock authorized) | 425,153 | |||
Maximum offering price per share ((NAV/0.9450), based on maximum sales charge of 5.50% of the offering price) | $ | 10.43 | ||
Class C: | ||||
Net Asset Value, offering and redemption price per share(a) | $ | 9.85 | ||
Net Assets | $ | 1,587,076 | ||
Shares of beneficial interest outstanding (unlimited number of shares, no par value common stock authorized) | 161,093 | |||
Class I: | ||||
Net Asset Value, offering and redemption price per share | $ | 9.85 | ||
Net Assets | $ | 18,914,638 | ||
Shares of beneficial interest outstanding (unlimited number of shares, no par value common stock authorized) | 1,919,696 | |||
| (a) | Redemption price per share may be reduced for any applicable contingent deferred sales charge. For a description of a possible sales charge, please see the Fund’s Prospectus. |
See Notes to Financial Statements.
| . |
| 93 | October 31, 2014 |
| ALPS | Westport Resources Hedged High Income Fund | ||
| Statement of Operations | For the Period January 1, 2014 (Commencement) to October 31, 2014 | |
INVESTMENT INCOME | ||||
Interest and other income | $ | 1,139,857 | ||
Total Investment Income | 1,139,857 | |||
EXPENSES | ||||
Investment advisory fees | 383,540 | |||
Administrative and transfer agency fees | 50,711 | |||
Distribution and service fees | ||||
Class A | 10,818 | |||
Class C | 11,386 | |||
Professional fees | 25,161 | |||
Networking fees | ||||
Class I | 13,397 | |||
Reports to shareholders and printing fees | 5,495 | |||
State registration fees | 6,429 | |||
SEC registration fees | 1,860 | |||
Custody fees | 8,797 | |||
Trustees’ fees and expenses | 430 | |||
Offering costs | 62,906 | |||
Miscellaneous expenses | 20,768 | |||
Total Expenses | 601,698 | |||
Less fees waived/reimbursed by investment advisor (Note 8) | ||||
Class A | (33,823) | |||
Class C | (14,345) | |||
Class I | (188,185) | |||
Net Expenses | 365,345 | |||
Net Investment Income | 774,512 | |||
Net realized gain on investments | 204,098 | |||
Net realized loss on futures contracts | (61,854) | |||
Net realized loss on credit default swap contracts | (1,944) | |||
Net realized loss on foreign currency transactions | (1,364) | |||
Net change in unrealized depreciation on investments | (558,689) | |||
Net change in unrealized depreciation on futures contracts | (28,783) | |||
Net change in unrealized depreciation on credit default swap contracts | (10,674) | |||
Net change in unrealized depreciation on translation of assets and liabilities denominated in foreign currencies | (1,084) | |||
NET REALIZED AND UNREALIZED LOSS ON INVESTMENTS | (460,294) | |||
NET INCREASE IN NET ASSETS RESULTING FROM OPERATIONS | $ | 314,218 | ||
See Notes to Financial Statements.
| 94 | October 31, 2014 |
| ALPS | Westport Resources Hedged High Income Fund | ||
| Statement of Changes in Net Assets |
| For the Period Janurary 1, 2014 (Commencement) to October 31, 2014 | ||||
OPERATIONS | ||||
Net investment income | $ | 774,512 | ||
Net realized gain on investments, futures contracts, credit default swap contracts, and foreign currency transactions | 138,936 | |||
Net change in unrealized depreciation on investments, futures contracts, credit default swap contracts, and translation of assets and liabilities denominated in foreign currencies | (599,230) | |||
Net Increase in Net Assets Resulting from Operations | 314,218 | |||
DISTRIBUTIONS | ||||
Dividends to shareholders from net investment income | ||||
Class A | (126,416) | |||
Class C | (45,997) | |||
Class I | (661,379) | |||
Net Decrease in Net Assets from Distributions | (833,792) | |||
BENEFICIAL INTEREST TRANSACTIONS (NOTE 6) | ||||
Shares sold | ||||
Class A | 4,376,893 | |||
Class C | 1,732,540 | |||
Class I | 20,102,463 | |||
Dividends reinvested | ||||
Class A | 84,424 | |||
Class C | 33,245 | |||
Class I | 450,245 | |||
Shares redeemed | ||||
Class A | (176,024) | |||
Class C | (142,172) | |||
Class I | (1,250,143) | |||
Net Increase in Net Assets Derived from Beneficial Interest Transactions | 25,211,471 | |||
Net increase in net assets | 24,691,897 | |||
NET ASSETS | ||||
Beginning of period | – | |||
End of year * | $ | 24,691,897 | ||
| * Including accumulated net investment income of: | $ | 10,674 | ||
See Notes to Financial Statements.
| 95 | October 31, 2014 |
| ALPS | Westport Resources Hedged High Income Fund – Class A | ||
| Financial Highlights | ||
Selected data for a share of beneficial interest outstanding throughout the period indicated:
For the Period January 1, 2014 (Commencement) to | ||||
Net asset value, beginning of period | $10.00 | |||
INCOME FROM INVESTMENT OPERATIONS: | ||||
Net investment income(a) | 0.36 | |||
Net realized and unrealized loss | (0.14) | |||
| ||||
Total from investment operations | 0.22 | |||
| ||||
DISTRIBUTIONS: | ||||
From net investment income | (0.36) | |||
| ||||
Total distributions | (0.36) | |||
| ||||
Net (decrease) in net asset value | (0.14) | |||
| ||||
Net asset value, end of year | $9.86 | |||
| ||||
TOTAL RETURN(b) | 2.13% | |||
RATIOS/SUPPLEMENTAL DATA: | ||||
Net assets, end of year (000s) | $4,190 | |||
Ratio of expenses to average net assets excluding fee waivers and reimbursements | 3.64%(c)(d) | |||
Ratio of expenses to average net assets including fee waivers and reimbursements | 2.39%(c)(d) | |||
Ratio of net investment income to average net assets | 4.33%(c)(d) | |||
Portfolio turnover rate(e) | 108% | |||
| (a) | Calculated using the average shares method. |
| (b) | Total returns are for the period indicated and have not been annualized. Total returns would have been lower had certain expenses not been waived during the period. Returns shown do not reflect the deduction of taxes that a shareholder would pay on Fund distributions or the redemption of Fund shares. Returns shown exclude any applicable sales charges. |
| (c) | Annualized. |
| (d) | Expense ratios before reductions for startup periods may not be representative of longer term operating periods. |
| (e) | Portfolio turnover rate for periods less than one full year have not been annualized. |
See Notes to Financial Statements.
| 96 | October 31, 2014 |
| ALPS | Westport Resources Hedged High Income Fund – Class C | ||
| Financial Highlights | ||
Selected data for a share of beneficial interest outstanding throughout the period indicated:
| For the Period January 1, 2014 (Commencement) to October 31, 2014 | ||||
Net asset value, beginning of period | $10.00 | |||
INCOME FROM INVESTMENT OPERATIONS: | ||||
Net investment income(a) | 0.31 | |||
Net realized and unrealized loss | (0.16) | |||
| ||||
Total from investment operations | 0.15 | |||
| ||||
DISTRIBUTIONS: | ||||
From net investment income | (0.30) | |||
| ||||
Total distributions | (0.30) | |||
| ||||
Net (decrease) in net asset value | (0.15) | |||
| ||||
Net asset value, end of year | $9.85 | |||
| ||||
TOTAL RETURN(b) | 1.51% | |||
RATIOS/SUPPLEMENTAL DATA: | ||||
Net assets, end of year (000s) | $1,587 | |||
Ratio of expenses to average net assets excluding fee waivers and reimbursements | 4.25%(c)(d) | |||
Ratio of expenses to average net assets including fee waivers and reimbursements | 2.99%(c)(d) | |||
Ratio of net investment income to average net assets | 3.70%(c)(d) | |||
Portfolio turnover rate(e) | 108% | |||
| (a) | Calculated using the average shares method. |
| (b) | Total returns are for the period indicated and have not been annualized. Total returns would have been lower had certain expenses not been waived during the period. Returns shown do not reflect the deduction of taxes that a shareholder would pay on Fund distributions or the redemption of Fund shares. Returns shown exclude any applicable sales charges. |
| (c) | Annualized. |
| (d) | Expense ratios before reductions for startup periods may not be representative of longer term operating periods. |
| (e) | Portfolio turnover rate for periods less than one full year have not been annualized. |
See Notes to Financial Statements.
| 97 | October 31, 2014 |
| ALPS | Westport Resources Hedged High Income Fund – Class I | ||
| Financial Highlights | ||
Selected data for a share of beneficial interest outstanding throughout the period indicated:
| For the Period January 1, 2014 (Commencement) to October 31, 2014 | ||||
Net asset value, beginning of period | $10.00 | |||
INCOME FROM INVESTMENT OPERATIONS: | ||||
Net investment income(a) | 0.38 | |||
Net realized and unrealized loss | (0.14) | |||
| ||||
Total from investment operations | 0.24 | |||
| ||||
DISTRIBUTIONS: | ||||
From net investment income | (0.39) | |||
| ||||
Total distributions | (0.39) | |||
| ||||
Net (decrease) in net asset value | (0.15) | |||
| ||||
Net asset value, end of year | $9.85 | |||
| ||||
TOTAL RETURN(b) | 2.38% | |||
RATIOS/SUPPLEMENTAL DATA: | ||||
Net assets, end of year (000s) | $18,915 | |||
Ratio of expenses to average net assets excluding fee waivers and reimbursements | 3.39%(c)(d) | |||
Ratio of expenses to average net assets including fee waivers and reimbursements | 1.99%(c)(d) | |||
Ratio of net investment income to average net assets | 4.59%(c)(d) | |||
Portfolio turnover rate(e) | 108% | |||
| (a) | Calculated using the average shares method. |
| (b) | Total returns are for the period indicated and have not been annualized. Total returns would have been lower had certain expenses not been waived during the period. Returns shown do not reflect the deduction of taxes that a shareholder would pay on Fund distributions or the redemption of Fund shares. |
| (c) | Annualized. |
| (d) | Expense ratios before reductions for startup periods may not be representative of longer term operating periods. |
| (e) | Portfolio turnover rate for periods less than one full year have not been annualized. |
See Notes to Financial Statements.
| 98 | October 31, 2014 |
| ALPS | WMC Disciplined Value Fund | ||
| Management Commentary | October 31, 2014 (Unaudited) | |
Market Commentary
US equities moved higher during the six-month period ended October 31, 2014. The rally that had begun earlier in the year marched on in May amid renewed signs of life in the housing market and the best payroll gain in more than two years. However, a pullback in July ended a streak of five consecutive monthly gains. Fear gripped the market as heightened geopolitical risks, a potential Portuguese banking crisis, and worries of Federal Reserve tightening took center stage. Stocks rebounded in August as investors were emboldened by encouraging economic data, headlined by better-than-expected Gross Domestic Product growth and signs that the housing recovery still had legs. In September, US equities retreated for just the third month this year. Despite solid manufacturing and consumer confidence readings, the reality of quantitative easing ending and the prospect of higher federal funds rates in mid-2015 contributed to increased risk aversion levels. Stocks finished a volatile October at an all-time high on the heels of a positive earnings season and generally solid economic data.
The ALPS | WMC Disciplined Value Fund Class A Shares delivered a return of 5.20% at Net Asset Value and -0.56% at Maximum Offering Price (MOP). Class C Shares returned 4.75% and 3.75% at CDSC (Contingent Deferred Sales Charge) and Class I Shares returned 5.31% compared to the Fund’s benchmark, the Russell 1000 Value Index, which returned 6.25% for the six month period.
Within the Russell 1000 Value Index, nine of ten sectors posted positive returns, with the information technology, health care, and financials sectors gaining the most. The energy sector was the only sector to post a negative return during the period.
Fund Review
Sector allocation, a residual of the bottom-up stock selection process, detracted from relative returns, while stock selection was modestly additive relative to the Russell 1000 Value Index. Decisions in industrials, information technology, and energy more than offset positive relative performance from stock selection in the health care and consumer discretionary sectors.
Detractors from relative performance for the period included Intel (information technology), Hertz Global (industrials), and Patterson-UTI Energy (energy). Shares of Intel, a US-based manufacturer of semiconductor chips, underperformed amid broader weakness in the semiconductor group. In addition, some investors had concerns about rising Intel inventory in distribution channels. Shares of Hertz Global, a US-based global car and equipment rental company, declined after management lowered its 2014 earnings guidance. Shares of Patterson-UTI Energy, US-based energy service company providing land-based pressure pumping and contract drilling services, fell along with the broader energy sector amid a sharp drop in oil prices. We eliminated our position in Patterson-UTI Energy during the period.
Top contributors to relative performance included Gilead Sciences (health care), Apple (information technology), and Lowe’s Companies (consumer discretionary). Shares of Gilead Sciences, a biopharmaceutical company, moved higher after the firm reported better-than-expected quarterly earnings, led by record sales from its hepatitis C treatment franchise. Apple, a maker of an interconnected ecosystem of computing and mobile devices, saw its shares rise as investors bid up shares in anticipation of new products that were introduced in September, including a larger form factor iPhone 6.
The company posted better-than-expected quarterly earnings and gave solid guidance for the fourth quarter. Shares of Lowe’s, a US-based home improvement retailer, outperformed amid solid earnings and encouraging housing data released in August.
Outlook
We are seeing slowing growth in the emerging markets, Europe, and Latin Market. Relatively speaking, the US is one of the strongest areas in the world right now. While growth will remain moderate, we believe the US economy is on track for a self-sustaining expansion. We are seeing signs of a recovery in non-residential construction spending and capital expenditures, as well as a modest recovery in housing. Housing data has been choppy and the recovery is taking longer than we expected, but we continue to believe housing will be an important growth driver for the US economy going forward. Home improvement spending has actually been quite strong, which has benefitted our holdings in Lowe’s. Oil prices have been very weak recently given tepid global oil demand and growing supply. For us, the weakness in oil confirms a slowing rate of growth outside of the US and has made us slightly more cautious than we were three months ago. Overall, we believe a 2.5 – 3% growth rate for the overall US economy is achievable.
The global cycle continues to advance at a moderate pace with a mix of stronger growth in the US and more sluggish activity in Europe, Japan, and China. The European cycle weakened noticeably over the summer caused by uncertainties surrounding the Russia-Ukraine conflict. While the conflict may linger, we believe the European Central Bank is prepared to provide further monetary stimulus to maintain the stabilization of the eurozone economy. The Chinese economy continues to deteriorate, which is a worry, but we believe the government will act if necessary to soft-land the economy. However, our outlook is for slower growth and we continue to keep a close eye on the weak Chinese real estate data.
As of the end of the period, the Fund was most overweight the consumer discretionary, information technology, and health care sectors and most underweight the industrials, utilities, and telecommunication services sectors.
Mammen Chally, CFA
Vice President and Equity Portfolio Manager
The views and information discussed in this commentary are as of the date of publication, are subject to change, and may not reflect the writer’s current views. The views expressed represent an assessment of market conditions at a specific point in time, are opinions only and should not be relied upon as investment advice regarding a particular investment or markets in general. Such information does not constitute a recommendation to buy or sell specific securities or investment vehicles. It should not be assumed that any investment will be profitable or will equal the performance of the fund(s) or any securities or any sectors mentioned in this letter. The subject matter contained in this letter has been derived from several sources believed to be reliable and accurate at the time of compilation. Neither the Fund nor Wellington Management Company, LLP accepts any liability for losses either direct or consequential caused by the use of this information.
Diversification cannot guarantee gain or prevent losses.
| 99 | October 31, 2014 |
| ALPS | WMC Disciplined Value Fund | ||
| Performance Update | October 31, 2014 (Unaudited) | |
Performance of $10,000 Initial Investment (as of October 31, 2014)
Comparison of change in value of a $10,000 investment (includes maximum sales charges of 5.50%)
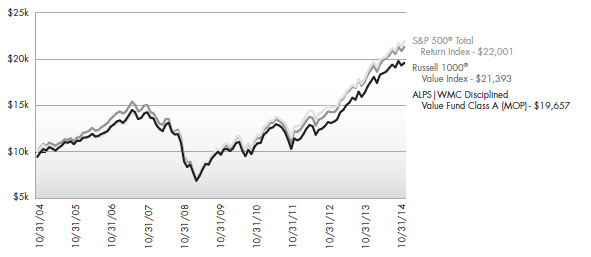
The chart above represents historical performance of a hypothetical investment of $10,000 in the Fund since inception. Past performance does not guarantee future results. This chart does not reflect the deduction of taxes that a shareholder would pay on Fund distributions or the redemption of Fund shares.
Average Annual Total Returns (as of October 31, 2014)
| 6 Month | 1 Year | 5 Year | 10 Year | Total Expense Ratio | What You Pay* | |||||||||
Class A (NAV) | 5.20% | 14.84% | 15.15% | 7.59% | 1.47% | 1.40% | ||||||||
Class A (MOP) | -0.56% | 8.52% | 13.86% | 6.99% | ||||||||||
Class C (NAV) | 4.75% | 13.97% | 14.30% | 6.80% | 2.22% | 2.15% | ||||||||
Class C (CDSC) | 3.75% | 12.97% | 14.30% | 6.80% | ||||||||||
Class I | 5.31% | 15.14% | 15.44% | 7.81% | 1.22% | 1.15% | ||||||||
Russell 1000® Value Index1 | 6.25% | 16.46% | 16.49% | 7.90% | ||||||||||
S&P 500® Total | 8.22% | 17.27% | 16.69% | 8.20% |
Performance data quoted represents past performance. Past performance does not guarantee future results. Investment return and principal value of an investment will fluctuate so that an investor’s shares, when sold or redeemed, may be worth more or less than the original cost. Current performance data may be higher or lower than actual data quoted. For the most current month-end performance data, please call 1-866-759-5679.
Maximum Offering Price (MOP) for Class A shares includes the Fund’s maximum sales charge of 5.50%. Performance shown at NAV does not include these sales charges and would have been lower had it been taken into account. If you invest $1 million or more, either as a lump sum or through the Fund’s accumulation or letter of intent programs, you can purchase Class A shares without an initial sales charge (load). A Contingent Deferred Sales Charge (“CDSC”) of 1.00% may apply to Class C shares redeemed within the first 12 months after a purchase, and on Class A shares redeemed within the first 18 months after a purchase in excess of $1 million.
Performance less than 1 year is cumulative.
| 100 | October 31, 2014 |
| ALPS | WMC Disciplined Value Fund | ||
| Performance Update | October 31, 2014 (Unaudited) | |
Performance shown for Class C shares prior to June 30, 2010 reflects the historical performance of the Fund’s Class A shares, calculated using the fees and expenses of Class C shares.
The performance shown for the ALPS | WMC Disciplined Value Fund (the “Fund”) for periods prior to August 29, 2009, reflects the performance of the Activa Mutual Funds Trust – Activa Value Fund (as result of a prior reorganization of Activa Mutual Funds Trust – Activa Value Fund into the Fund).
| 1 | The Russell 1000® Value Index measures the performance of those Russell 1000® companies with lower price-to-book ratios and lower forecasted growth values. The index is not actively managed and does not reflect any deduction for fees, expenses or taxes. An investor may not invest directly in an index. |
| 2 | The S&P 500® Index is the Standard & Poor’s composite index of 500 stocks, a widely recognized, unmanaged index of common stock prices. The index is not actively managed and does not reflect any deduction for fees, expenses or taxes. An investor may not invest directly in an index. |
| * | What You Pay reflects the Advisor’s decision to contractually limit expenses through August 31, 2015. Please see the prospectus for additional information. |
The table does not reflect the deduction of taxes that a shareholder would pay on Fund distributions or the redemption of Fund shares.
There is no guarantee that the Fund will continue to hold any one particular security or stay invested in any one particular company. The composition of the Fund’s top holdings is subject to change. Performance figures are historical and reflect the change in share price, reinvested distributions, changes in net asset value, sales charges and capital gains distributions, if any.
Not FDIC Insured – No Bank Guarantee – May Lose Value
Top Ten Holdings (as a % of Net Assets) †
| ||||
Wells Fargo & Co. | 3.74 | % | ||
JPMorgan Chase & Co. | 3.51 | % | ||
Chevron Corp. | 3.30 | % | ||
Merck & Co., Inc. | 2.87 | % | ||
Exxon Mobil Corp. | 2.44 | % | ||
Citigroup, Inc. | 2.39 | % | ||
Ameriprise Financial, Inc. | 2.36 | % | ||
CVS Health Corp. | 2.22 | % | ||
Microsoft Corp. | 2.18 | % | ||
ACE, Ltd. | 2.03 | % | ||
Top Ten Holdings | 27.04 | % |
| † | Holdings are subject to change. Table presents indicative values only. |
Industry Sector Allocation (as a % of Net Assets)
| 101 | October 31, 2014 |
| ALPS | WMC Disciplined Value Fund | ||
| Statement of Investments | October 31, 2014 |
| Shares | Value (Note 2) | |||||||
| ||||||||
COMMON STOCKS (97.97%) |
| |||||||
Consumer Discretionary (7.82%) |
| |||||||
Consumer Durables & Apparel (1.07%) |
| |||||||
PVH Corp. | 9,685 | $ | 1,107,480 | |||||
|
| |||||||
Consumer Services (0.74%) |
| |||||||
Starwood Hotels & Resorts Worldwide, Inc. | 10,000 | 766,600 | ||||||
|
| |||||||
Media (2.29%) | ||||||||
DIRECTV(a) | 5,530 | 479,949 | ||||||
Twenty-First Century Fox, Inc., Class A | 34,945 | 1,204,903 | ||||||
Viacom, Inc., Class B | 9,410 | 683,919 | ||||||
|
| |||||||
| 2,368,771 | ||||||||
|
| |||||||
Retailing (3.72%) | ||||||||
Dollar Tree, Inc.(a) | 18,850 | 1,141,744 | ||||||
Lowe’s Cos., Inc. | 25,355 | 1,450,306 | ||||||
The TJX Cos., Inc. | 19,800 | 1,253,736 | ||||||
|
| |||||||
| 3,845,786 | ||||||||
|
| |||||||
TOTAL CONSUMER DISCRETIONARY |
| 8,088,637 | ||||||
|
| |||||||
Consumer Staples (7.10%) |
| |||||||
Food & Staples Retailing (3.03%) |
| |||||||
CVS Health Corp. | 26,795 | 2,299,279 | ||||||
Walgreen Co. | 12,930 | 830,365 | ||||||
|
| |||||||
| 3,129,644 | ||||||||
|
| |||||||
Food Beverage & Tobacco (3.30%) |
| |||||||
Altria Group, Inc. | 32,180 | 1,555,581 | ||||||
Mondelez International, Inc., Class A | 52,700 | 1,858,202 | ||||||
|
| |||||||
| 3,413,783 | ||||||||
|
| |||||||
Household & Personal Products (0.77%) |
| |||||||
Coty, Inc., Class A | 48,150 | 799,290 | ||||||
|
| |||||||
TOTAL CONSUMER STAPLES | 7,342,717 | |||||||
|
| |||||||
Energy (12.63%) |
| |||||||
Energy (12.63%) | ||||||||
Anadarko Petroleum Corp. | 16,900 | 1,551,082 | ||||||
Baker Hughes, Inc. | 5,560 | 294,458 | ||||||
Chevron Corp. | 28,469 | 3,414,856 | ||||||
EOG Resources, Inc. | 10,820 | 1,028,441 | ||||||
Exxon Mobil Corp. | 26,054 | 2,519,682 | ||||||
Halliburton Co. | 21,405 | 1,180,272 | ||||||
Marathon Oil Corp. | 26,430 | 935,622 | ||||||
Marathon Petroleum Corp. | 8,800 | 799,920 | ||||||
| Shares | Value (Note 2) | ||||||
Energy (continued) |
| |||||||
Phillips 66 | 16,940 | $ | 1,329,790 | |||||
|
| |||||||
TOTAL ENERGY |
| 13,054,123 | ||||||
|
| |||||||
Financials (28.93%) |
| |||||||
Banks (11.49%) | ||||||||
Citigroup, Inc. | 46,105 | 2,468,001 | ||||||
JPMorgan Chase & Co. | 60,073 | 3,633,215 | ||||||
The PNC Financial Services Group, Inc. | 15,130 | 1,307,081 | ||||||
Wells Fargo & Co. | 72,740 | 3,861,766 | ||||||
Zions Bancorporation | 20,890 | 605,183 | ||||||
|
| |||||||
| 11,875,246 | ||||||||
|
| |||||||
Diversified Financials (6.79%) |
| |||||||
Ameriprise Financial, Inc. | 19,370 | 2,443,913 | ||||||
BlackRock, Inc. | 4,140 | 1,412,196 | ||||||
Invesco, Ltd. | 35,520 | 1,437,494 | ||||||
Morgan Stanley | 35,960 | 1,256,802 | ||||||
Santander Consumer USA Holdings, Inc. | 25,390 | 469,715 | ||||||
|
| |||||||
| 7,020,120 | ||||||||
|
| |||||||
Insurance (6.66%) | ||||||||
ACE, Ltd. | 19,160 | 2,094,188 | ||||||
American International Group, Inc. | 29,200 | 1,564,244 | ||||||
Aon PLC | 11,930 | 1,025,980 | ||||||
Lincoln National Corp. | 17,150 | 939,134 | ||||||
Prudential Financial, Inc. | 14,310 | 1,267,007 | ||||||
|
| |||||||
| 6,890,553 | ||||||||
|
| |||||||
Real Estate (3.99%) |
| |||||||
American Capital Agency Corp. | 42,510 | 966,677 | ||||||
Camden Property Trust | 11,435 | 876,722 | ||||||
Equity LifeStyle Properties, Inc. | 21,860 | 1,073,326 | ||||||
Forest City Enterprises, Inc., Class A(a) | 58,020 | 1,212,038 | ||||||
|
| |||||||
| 4,128,763 | ||||||||
|
| |||||||
TOTAL FINANCIALS | 29,914,682 | |||||||
|
| |||||||
Health Care (14.24%) |
| |||||||
Health Care Equipment & Services (5.20%) |
| |||||||
Aetna, Inc. | 15,840 | 1,306,958 | ||||||
McKesson Corp. | 6,680 | 1,358,779 | ||||||
UnitedHealth Group, Inc. | 18,640 | 1,770,986 | ||||||
Zimmer Holdings, Inc. | 8,470 | 942,203 | ||||||
|
| |||||||
| 5,378,926 | ||||||||
|
| |||||||
| 102 | October 31, 2014 |
| ALPS | WMC Disciplined Value Fund | ||
| Statement of Investments | October 31, 2014 |
| Shares | Value (Note 2) | ||||||
Pharmaceuticals, Biotechnology & Life Sciences (9.04%) |
| |||||||
Actavis PLC(a) | 4,301 | $ | 1,044,025 | |||||
Bristol-Myers Squibb Co. | 29,535 | 1,718,642 | ||||||
Eli Lilly & Co. | 15,500 | 1,028,115 | ||||||
Gilead Sciences, Inc.(a) | 13,250 | 1,484,000 | ||||||
Merck & Co., Inc. | 51,260 | 2,970,004 | ||||||
Thermo Fisher Scientific, Inc. | 9,310 | 1,094,577 | ||||||
|
| |||||||
| 9,339,363 | ||||||||
|
| |||||||
TOTAL HEALTH CARE |
| 14,718,289 | ||||||
|
| |||||||
Industrials (7.62%) |
| |||||||
Capital Goods (4.35%) |
| |||||||
Dover Corp. | 11,420 | 907,205 | ||||||
General Electric Co. | 45,865 | 1,183,776 | ||||||
Parker-Hannifin Corp. | 9,220 | 1,171,216 | ||||||
United Technologies Corp. | 11,580 | 1,239,060 | ||||||
|
| |||||||
| 4,501,257 | ||||||||
|
| |||||||
Commercial & Professional Services (2.52%) |
| |||||||
Equifax, Inc. | 17,080 | 1,293,639 | ||||||
Nielsen N.V. | 19,560 | 831,104 | ||||||
Verisk Analytics, Inc., Class A(a) | 7,750 | 483,213 | ||||||
|
| |||||||
| 2,607,956 | ||||||||
|
| |||||||
Transportation (0.75%) |
| |||||||
Hertz Global Holdings, Inc.(a) | 35,205 | 771,694 | ||||||
|
| |||||||
TOTAL INDUSTRIALS |
| 7,880,907 | ||||||
|
| |||||||
Information Technology (10.51%) |
| |||||||
Semiconductors & Semiconductor Equipment (2.58%) |
| |||||||
Altera Corp. | 21,505 | 739,127 | ||||||
Intel Corp. | 56,610 | 1,925,306 | ||||||
|
| |||||||
| 2,664,433 | ||||||||
|
| |||||||
Software & Services (5.57%) |
| |||||||
Accenture PLC, Class A | 9,495 | 770,234 | ||||||
Activision Blizzard, Inc. | 41,540 | 828,723 | ||||||
Genpact, Ltd.(a) | 52,315 | 918,128 | ||||||
Microsoft Corp. | 47,951 | 2,251,300 | ||||||
Visa, Inc., A Shares | 4,100 | 989,863 | ||||||
|
| |||||||
| 5,758,248 | ||||||||
|
| |||||||
Technology Hardware & Equipment (2.36%) |
| |||||||
Apple, Inc. | 13,280 | 1,434,240 | ||||||
Cisco Systems, Inc. | 41,380 | 1,012,569 | ||||||
|
| |||||||
| 2,446,809 | ||||||||
|
| |||||||
TOTAL INFORMATION TECHNOLOGY |
| 10,869,490 | ||||||
|
| |||||||
| Shares | Value (Note 2) | ||||||||||
Materials (3.12%) |
| |||||||||||
Materials (3.12%) |
| |||||||||||
Crown Holdings, Inc.(a) |
| 21,615 | $ | 1,036,007 | ||||||||
The Dow Chemical Co. |
| 36,458 | 1,801,025 | |||||||||
Reliance Steel & Aluminum Co. |
| 5,800 | 391,384 | |||||||||
|
| |||||||||||
TOTAL MATERIALS |
| 3,228,416 | ||||||||||
|
| |||||||||||
Telecommunication Services (1.53%) |
| |||||||||||
Telecommunication Services (1.53%) |
| |||||||||||
AT&T, Inc. | 45,295 | 1,578,078 | ||||||||||
|
| |||||||||||
TOTAL TELECOMMUNICATION SERVICES |
| 1,578,078 | ||||||||||
|
| |||||||||||
Utilities (4.47%) |
| |||||||||||
Utilities (4.47%) |
| |||||||||||
American Electric Power Co., Inc |
| 21,940 | 1,279,979 | |||||||||
NextEra Energy, Inc. |
| 17,710 | 1,774,896 | |||||||||
NRG Energy, Inc. |
| 10,620 | 318,388 | |||||||||
PG&E Corp. |
| 24,700 | 1,242,904 | |||||||||
|
| |||||||||||
TOTAL UTILITIES |
| 4,616,167 | ||||||||||
|
| |||||||||||
TOTAL COMMON STOCKS (Cost $67,575,395) |
| 101,291,506 | ||||||||||
|
| |||||||||||
EXCHANGE TRADED FUNDS (0.52%) |
| |||||||||||
iShares® Russell 1000® Value ETF |
| 5,260 | 537,572 | |||||||||
|
| |||||||||||
TOTAL EXCHANGE TRADED FUNDS (Cost $480,806) |
| 537,572 | ||||||||||
|
| |||||||||||
| 7-Day Yield | Shares | Value (Note 2) | ||||||||||
SHORT TERM INVESTMENTS (1.43%) |
| |||||||||||
Money Market Fund (1.43%) |
| |||||||||||
Morgan Stanley Institutional Liquidity Funds - Prime Portfolio | 0.045 | % | 1,479,573 | 1,479,573 | ||||||||
|
| |||||||||||
TOTAL SHORT TERM INVESTMENTS (Cost $1,479,573) |
| 1,479,573 | ||||||||||
|
| |||||||||||
| 103 | October 31, 2014 |
| ALPS | WMC Disciplined Value Fund | ||
| Statement of Investments | October 31, 2014 |
Value (Note 2) | ||||
TOTAL INVESTMENTS (99.92%) (Cost $69,535,774) | $ | 103,308,651 | ||
Other Assets In Excess Of Liabilities (0.08%) | 78,129 | |||
|
| |||
NET ASSETS (100.00%) | $ | 103,386,780 | ||
|
| |||
| (a) | Non-Income Producing Security. |
Common Abbreviations:
Ltd. - Limited.
N.V. - Naamloze Vennootschap is the Dutch term for a public limited liability corporation.
PLC - Public Limited Company.
For Fund compliance purposes, the Fund’s industry classifications refer to any one or more of the industry sub-classifications used by one or more widely recognized market indexes or ratings group indexes, and/or as defined by Fund management. This definition may not apply for purposes of this report, which may combine industry sub-classifications for reporting ease. Industries are shown as a percent of net assets.
See Notes to Financial Statements.
| 104 | October 31, 2014 |
| ALPS | WMC Disciplined Value Fund | ||
| Statement of Assets and Liabilities | October 31, 2014 | |
ASSETS | ||||
Investments, at value | $ | 103,308,651 | ||
Receivable for shares sold | 160,414 | |||
Dividends receivable | 83,244 | |||
Prepaid expenses and other assets | 21,034 | |||
Total Assets | 103,573,343 | |||
LIABILITIES | ||||
Payable for investments purchased | 53,021 | |||
Investment advisory fees payable | 73,154 | |||
Administration and transfer agency fees payable | 16,988 | |||
Distribution and services fees payable | 12,380 | |||
Trustees’ fees and expenses payable | 734 | |||
Professional fees payable | 16,778 | |||
Accrued expenses and other liabilities | 13,508 | |||
Total Liabilities | 186,563 | |||
NET ASSETS | $ | 103,386,780 | ||
NET ASSETS CONSIST OF | ||||
Paid-in capital | $ | 63,489,743 | ||
Accumulated net investment income | 214,377 | |||
Accumulated net realized gain on investments | 5,909,783 | |||
Net unrealized appreciation on investments | 33,772,877 | |||
NET ASSETS | $ | 103,386,780 | ||
INVESTMENTS, AT COST | $ | 69,535,774 | ||
PRICING OF SHARES | ||||
Class A: | ||||
Net Asset Value, offering and redemption price per share(a) | $ | 12.54 | ||
Net Assets | $ | 59,627,742 | ||
Shares of beneficial interest outstanding (unlimited number of shares, no par value common stock authorized) | 4,754,428 | |||
Maximum offering price per share ((NAV/0.9450), based on maximum sales charge of 5.50% of the offering price) | $ | 13.27 | ||
Class C: | ||||
Net Asset Value, offering and redemption price per share(a) | $ | 12.36 | ||
Net Assets | $ | 257,299 | ||
Shares of beneficial interest outstanding (unlimited number of shares, no par value common stock authorized) | 20,815 | |||
Class I: | ||||
Net Asset Value, offering and redemption price per share | $ | 12.69 | ||
Net Assets | $ | 43,501,739 | ||
Shares of beneficial interest outstanding (unlimited number of shares, no par value common stock authorized) | 3,428,791 | |||
| (a) | Redemption price per share may be reduced for any applicable contingent deferred sales charge. For a description of a possible sales charge, please see the Fund’s Prospectus. |
See Notes to Financial Statements.
| 105 | October 31, 2014 |
| ALPS | WMC Disciplined Value Fund | ||
| Statements of Operations | ||
| For the Fiscal Period Ended October 31, 2014(a) | For the Year Ended April 30, 2014 | |||||||
INVESTMENT INCOME | ||||||||
Dividends | $ | 990,674 | $ | 1,872,494 | ||||
Foreign taxes withheld on dividends | (597) | – | ||||||
Total Investment Income | 990,077 | 1,872,494 | ||||||
EXPENSES | ||||||||
Investment advisory fees | 498,909 | 927,411 | ||||||
Administrative and transfer agency fees | 92,725 | 167,183 | ||||||
Distribution and service fees | ||||||||
Class A | 75,253 | 135,923 | ||||||
Class C | 823 | 1,091 | ||||||
Professional fees | 16,601 | 21,914 | ||||||
Reports to shareholders and printing fees | 10,986 | 16,577 | ||||||
State registration fees | 18,569 | 33,461 | ||||||
Insurance fees | 925 | 1,843 | ||||||
Custody fees | 2,818 | 10,629 | ||||||
Trustees’ fees and expenses | 1,478 | 3,745 | ||||||
Miscellaneous expenses | 5,494 | 11,720 | ||||||
Total Expenses | 724,581 | 1,331,497 | ||||||
Less fees waived/reimbursed by investment advisor (Note 8) | ||||||||
Class A | (25,559) | (39,957) | ||||||
Class C | (74) | (81) | ||||||
Class I | (18,931) | (31,790) | ||||||
Net Expenses | 680,017 | 1,259,669 | ||||||
Net Investment Income | 310,060 | 612,825 | ||||||
Net realized gain on investments | 5,958,826 | 6,559,877 | ||||||
Net realized gain distributions from other investment companies | – | 13,515 | ||||||
Net change in unrealized appreciation/(depreciation) on investments | (874,500) | 12,117,145 | ||||||
NET REALIZED AND UNREALIZED GAIN ON INVESTMENTS | 5,084,326 | 18,690,537 | ||||||
NET INCREASE IN NET ASSETS RESULTING FROM OPERATIONS | $ | 5,394,386 | $ | 19,303,362 | ||||
| (a) | Effective May 1, 2014, the Board approved changing the fiscal year-end of the Funds from April 30 to October 31. |
See Notes to Financial Statements.
| 106 | October 31, 2014 |
| ALPS | WMC Disciplined Value Fund | ||
| Statements of Changes in Net Assets | ||
For the Fiscal 2014(a) | For the Year April 30, 2014 | For the Year April 30, 2013 | ||||||||||
OPERATIONS | ||||||||||||
Net investment income | $ | 310,060 | $ | 612,825 | $ | 832,964 | ||||||
Net realized gain on investments | 5,958,826 | 6,559,877 | 3,959,551 | |||||||||
Net realized gain distributions from other investment companies | – | 13,515 | – | |||||||||
Net change in unrealized appreciation/(depreciation) on investments | (874,500) | 12,117,145 | 10,023,480 | |||||||||
Net Increase in Net Assets Resulting from Operations | 5,394,386 | 19,303,362 | 14,815,995 | |||||||||
DISTRIBUTIONS | ||||||||||||
Dividends to shareholders from net investment income | ||||||||||||
Class A | – | (528,474) | (495,861) | |||||||||
Class C | – | (670) | (501) | |||||||||
Class I | – | (470,800) | (393,650) | |||||||||
Dividends to shareholders from net realized gains | ||||||||||||
Class A | – | (642,398) | – | |||||||||
Class C | – | (1,397) | – | |||||||||
Class I | – | (488,619) | – | |||||||||
Net Decrease in Net Assets from Distributions | – | (2,132,358) | (890,012) | |||||||||
BENEFICIAL INTEREST TRANSACTIONS (NOTE 6) | ||||||||||||
Shares sold | ||||||||||||
Class A | 154,740 | 2,472,682 | 2,079,629 | |||||||||
Class C | 114,228 | 28,068 | 6,300 | |||||||||
Class I | 1,715,713 | 5,245,365 | 5,541,680 | |||||||||
Dividends reinvested | ||||||||||||
Class A | – | 1,120,556 | 472,006 | |||||||||
Class C | – | 2,067 | 501 | |||||||||
Class I | – | 958,847 | 393,650 | |||||||||
Shares redeemed | ||||||||||||
Class A | (2,625,164) | (4,195,516) | (5,504,904) | |||||||||
Class C | – | (16,613) | – | |||||||||
Class I | (5,297,693) | (8,515,750) | (6,958,371) | |||||||||
Net Decrease in Net Assets Derived from Beneficial Interest Transactions | (5,938,176) | (2,900,294) | (3,969,509) | |||||||||
Net increase/(decrease) in net assets | (543,790) | 14,270,710 | 9,956,474 | |||||||||
NET ASSETS | ||||||||||||
Beginning of period | 103,930,570 | 89,659,860 | 79,703,386 | |||||||||
End of period * | $ | 103,386,780 | $ | 103,930,570 | $ | 89,659,860 | ||||||
*Including accumulated net investment income/(loss) of: | $ | 214,377 | $ | (138,735) | $ | 240,154 | ||||||
| (a) | Effective May 1, 2014, the Board approved changing the fiscal year-end of the Funds from April 30 to October 31. |
See Notes to Financial Statements.
| 107 | October 31, 2014 |
| ALPS | WMC Disciplined Value Fund – Class A | ||
Selected data for a share of beneficial interest outstanding throughout the periods indicated: | ||
For the Fiscal Period Ended | For the Year Ended April 30, 2014 | For the Year Ended April 30, 2013(b) | For the Year Ended April 30, 2012 | For the Year Ended April 30, 2011(c) | For the Fiscal Period Ended April 30, 2010(d) | For the Year Ended | ||||||||
Net asset value, beginning of period | $11.92 | $10.01 | $8.42 | $8.64 | $7.43 | $6.92 | $5.86 | |||||||
INCOME/(LOSS) FROM INVESTMENT OPERATIONS: | ||||||||||||||
Net investment income | 0.03(e) | 0.06(e) | 0.08(e) | 0.06(e) | 0.06(e) | 0.03 | 0.07 | |||||||
Net realized and unrealized gain/(loss) | 0.59 | 2.09 | 1.61 | (0.23) | 1.22 | 0.48 | 1.06 | |||||||
Total from investment operations | 0.62 | 2.15 | 1.69 | (0.17) | 1.28 | 0.51 | 1.13 | |||||||
DISTRIBUTIONS: | ||||||||||||||
From net investment income | – | (0.11) | (0.10) | (0.05) | (0.07) | – | (0.07) | |||||||
From net realized gains | – | (0.13) | – | – | – | – | – | |||||||
Total distributions | – | (0.24) | (0.10) | (0.05) | (0.07) | – | (0.07) | |||||||
Net increase/(decrease) in net asset value | 0.62 | 1.91 | 1.59 | (0.22) | 1.21 | 0.51 | 1.06 | |||||||
Net asset value, end of year | $12.54 | $11.92 | $10.01 | $8.42 | $8.64 | $7.43 | $6.92 | |||||||
TOTAL RETURN(f) | 5.20% | 21.70% | 20.17% | (1.81)% | 17.34% | 7.22% | 19.24% | |||||||
RATIOS/SUPPLEMENTAL DATA: | ||||||||||||||
Net assets, end of year (000s) | $59,628 | $59,069 | $50,142 | $44,989 | $48,899 | $45,300 | $62,264 | |||||||
Ratio of expenses to average net assets excluding fee waivers and reimbursements | 1.48%(g) | 1.47% | 1.51% | 1.58% | 1.71% | 1.70%(g) | N/A | |||||||
Ratio of expenses to average net assets including fee waivers and reimbursements | 1.40%(g) | 1.40% | 1.40% | 1.40% | 1.40% | 1.40%(g) | 1.62% | |||||||
Ratio of net investment income to average net assets | 0.48%(g) | 0.52% | 0.95% | 0.83% | 0.77% | 0.60%(g) | 1.12% | |||||||
Portfolio turnover rate(h) | 13% | 19% | 34% | 46% | 44% | 11% | 56% | |||||||
| (a) | Effective May 1, 2014, the Board approved changing the fiscal year-end of the Funds from April 30 to October 31. |
| (b) | Prior to August 31, 2012, the ALPS | WMC Value Disciplined Fund was known as the ALPS | WMC Value Intersection Fund. |
| (c) | Prior to August 31, 2010, the ALPS | WMC Value Intersection Fund was known as the Activa Value Fund (as a result of the reorganization of Activa Mutual Funds Trust - Activa Value Fund into the fund). |
| (d) | Effective March 9, 2010, the Board approved changing the fiscal year-end of the Fund from December 31 to April 30. |
| (e) | Calculated using the average shares method. |
| (f) | Total returns are for the period indicated and have not been annualized. Total returns would have been lower had certain expenses not been waived during the period. Returns shown do not reflect the deduction of taxes that a shareholder would pay on Fund distributions or the redemption of Fund shares. Returns shown exclude any applicable sales charges. |
| (g) | Annualized. |
| (h) | Portfolio turnover rate for periods less than one full year have not been annualized. |
See Notes to Financial Statements.
| 108 | October 31, 2014 |
| ALPS | WMC Disciplined Value Fund – Class C | ||
Financial Highlights
Selected data for a share of beneficial interest outstanding throughout the periods indicated: | ||
| For the Fiscal Period Ended October 31, 2014(a) | For the Year April 30, 2014 | For the Year April 30, 2013(b) | For the Year April 30, 2012 | For the Period July 2, 2010 | ||||||
Net asset value, beginning of period | $11.80 | $9.93 | $8.39 | $8.62 | $6.40 | |||||
INCOME/(LOSS) FROM INVESTMENT OPERATIONS: | ||||||||||
Net investment income/(loss)(d) | (0.02) | (0.02) | 0.02 | (0.01) | (0.01) | |||||
Net realized and unrealized gain/(loss) | 0.58 | 2.08 | 1.57 | (0.20) | 2.27 | |||||
Total from investment operations | 0.56 | 2.06 | 1.59 | (0.21) | 2.26 | |||||
DISTRIBUTIONS: | ||||||||||
From net investment income | – | (0.06) | (0.05) | (0.02) | (0.04) | |||||
From net realized gains | – | (0.13) | – | – | – | |||||
Total distributions | – | (0.19) | (0.05) | (0.02) | (0.04) | |||||
Net increase/(decrease) in net asset value | 0.56 | 1.87 | 1.54 | (0.23) | 2.22 | |||||
Net asset value, end of year | $12.36 | $11.80 | $9.93 | $8.39 | $8.62 | |||||
TOTAL RETURN(e) | 4.75% | 20.97% | 19.07% | (2.45)% | 35.44% | |||||
RATIOS/SUPPLEMENTAL DATA: | ||||||||||
Net assets, end of period (000s) | $257 | $133 | $100 | $79 | $14 | |||||
Ratio of expenses to average net assets excluding fee waivers and reimbursements | 2.24%(f) | 2.22% | 2.26% | 2.38% | 2.49%(f) | |||||
Ratio of expenses to average net assets including fee waivers and reimbursements | 2.15%(f) | 2.15% | 2.15% | 2.15% | 2.15%(f) | |||||
Ratio of net investment income/(loss) to average net assets | (0.30)%(f) | (0.23)% | 0.19% | (0.16)% | (0.09)%(f) | |||||
Portfolio turnover rate(g) | 13% | 19% | 34% | 46% | 44%(h) | |||||
| (a) | Effective May 1, 2014, the Board approved changing the fiscal year-end of the Funds from April 30 to October 31. |
| (b) | Prior to August 31, 2012, the ALPS | WMC Value Disciplined Fund was known as the ALPS | WMC Value Intersection Fund. |
| (c) | Prior to August 31, 2010, the ALPS | WMC Value Intersection Fund was known as the Activa Value Fund (as a result of the reorganization of Activa Mutual Funds Trust - Activa Value Fund into the fund). |
| (d) | Calculated using the average shares method. |
| (e) | Total returns are for the period indicated and have not been annualized. Total returns would have been lower had certain expenses not been waived during the period. Returns shown do not reflect the deduction of taxes that a shareholder would pay on Fund distributions or the redemption of Fund shares. Returns shown exclude any applicable sales charges. |
| (f) | Annualized. |
| (g) | Portfolio turnover rate for periods less than one full year have not been annualized. |
| (h) | Portfolio turnover rate is calculated at the Fund Level and represents the year ended April 30, 2011. |
See Notes to Financial Statements.
| 109 | October 31, 2014 |
| ALPS | WMC Disciplined Value Fund – Class I | ||
| Financial Highlights | ||
Selected data for a share of beneficial interest outstanding throughout the periods indicated:
For the Fiscal Period Ended October 31, 2014(a) | For the Year Ended April 30, 2014 | For the Year Ended April 30, 2013(b) | For the Year Ended April 30, 2012 | For the Year Ended April 30, 2011(c) | For the Fiscal Period Ended April 30, 2010(d) | For the Year Ended December 31, 2009 | ||||||||
| ||||||||||||||
Net asset value, beginning of period | $12.05 | $10.10 | $8.49 | $8.71 | $7.48 | $6.96 | $5.89 | |||||||
INCOME/(LOSS) FROM INVESTMENT OPERATIONS: | ||||||||||||||
Net investment income | 0.05(e) | 0.09(e) | 0.11(e) | 0.09(e) | 0.07(e) | 0.02 | 0.07 | |||||||
Net realized and unrealized gain/(loss) | 0.59 | 2.12 | 1.61 | (0.24) | 1.24 | 0.50 | 1.08 | |||||||
| ||||||||||||||
Total from investment operations | 0.64 | 2.21 | 1.72 | (0.15) | 1.31 | 0.52 | 1.15 | |||||||
| ||||||||||||||
DISTRIBUTIONS: | ||||||||||||||
From net investment income | – | (0.13) | (0.11) | (0.07) | (0.08) | – | (0.08) | |||||||
From net realized gains | – | (0.13) | – | – | – | – | – | |||||||
| ||||||||||||||
Total distributions | – | (0.26) | (0.11) | (0.07) | (0.08) | – | (0.08) | |||||||
| ||||||||||||||
Net increase/(decrease) in net asset value | 0.64 | 1.95 | 1.61 | (0.22) | 1.23 | 0.52 | 1.07 | |||||||
| ||||||||||||||
Net asset value, end of year | $12.69 | $12.05 | $10.10 | $8.49 | $8.71 | $7.48 | $6.96 | |||||||
| ||||||||||||||
TOTAL RETURN(f) | 5.31% | 22.11% | 20.43% | (1.62)% | 17.67% | 7.47% | 19.59% | |||||||
RATIOS/SUPPLEMENTAL DATA: | ||||||||||||||
Net assets, end of year (000s) | $43,502 | $44,729 | $39,417 | $34,636 | $29,251 | $16,814 | $16,465 | |||||||
Ratio of expenses to average net assets excluding fee waivers and reimbursements | 1.23%(g) | 1.22% | 1.26% | 1.33% | 1.46% | 1.49%(g) | N/A | |||||||
Ratio of expenses to average net assets including fee waivers and reimbursements | 1.15%(g) | 1.15% | 1.15% | 1.15% | 1.15% | 1.15%(g) | 1.46% | |||||||
Ratio of net investment income to average net assets | 0.74%(g) | 0.77% | 1.20% | 1.08% | 0.95% | 0.77%(g) | 1.17% | |||||||
Portfolio turnover rate(h) | 13% | 19% | 34% | 46% | 44% | 11% | 56% | |||||||
| ||||||||||||||
| (a) | Effective May 1, 2014, the Board approved changing the fiscal year-end of the Funds from April 30 to October 31. |
| (b) | Prior to August 31, 2012, the ALPS | WMC Value Disciplined Fund was known as the ALPS | WMC Value Intersection Fund. |
| (c) | Prior to August 31, 2010, the ALPS | WMC Value Intersection Fund was known as the Activa Value Fund (as a result of the reorganization of Activa Mutual Funds Trust - Activa Value Fund into the fund). |
| (d) | Effective March 9, 2010, the Board approved changing the fiscal year-end of the Fund from December 31 to April 30. |
| (e) | Calculated using the average shares method. |
| (f) | Total returns are for the period indicated and have not been annualized. Total returns would have been lower had certain expenses not been waived during the period. Returns shown do not reflect the deduction of taxes that a shareholder would pay on Fund distributions or the redemption of Fund shares. |
| (g) | Annualized. |
| (h) | Portfolio turnover rate for periods less than one full year have not been annualized. |
| See Notes to Financial Statements. |
| 110 | October 31, 2014 |
| Clough China Fund | ||
| Management Commentary | October 31, 2014 (Unaudited) |
During the six month period ending October 31 2014, the Clough China Fund Class A NAV gained 13.42%, and the MSCI China Index gained 14.23%.
Market Environment
This was an eventful period for Chinese equities. Domestic monetary and fiscal policies became more accommodative, particularly after the government issued guidance in August1 to encourage reasonable growth of money and credit and the lowering of financing costs. China’s central bank (PBoC) injected liquidity several times into policy banks and adjusted the 14-day repo rate downward twice in September and October2. Meanwhile, infrastructure projects, for instance in railway and social housing, were upgraded with most of the spending slated for the second half of this year. Then, after more cities removed or eased restrictive measures on the purchase of residential properties, banking authorities announced new support for the property market at the end of September, namely to lower mortgage rates and provide funding to property developers. They were followed a month later by an official policy announcement by the Prime Minister who indicated the government will encourage home purchases3 for the first time since 2009, among a set of measures to push consumption.
As far as economic growth is concerned4, Gross Domestic Product (GDP) growth slowed in the third quarter, to 7.3% from 7.5% in the second quarter which was in-line with the government expectations. Fixed asset investment growth in secondary industries continued to decelerate. More importantly economic5 growth this year has been led by the service sector, whose weight in the economy increased to 46.7% from 45.5% a year ago and consumer spending remained strong. Consumption was supported by growth in per capita household incomes which rose 8.2% in real terms, faster than GDP for the first nine months of 2014. Furthermore, household income rose faster in rural areas than in cities, (+9.7% vs. +6.9%), narrowing the income gap. Labor markets have remained strong with 10.9 million jobs created through September4, exceeding the full year government target of 10 million jobs.
The market continued focus on economic and social reforms, and among them the SOE (State-owned Enterprises) reform and restructuring and the urbanization progress with the loosening of the residency permits in smaller cities looked of particular interest. SOE reform intends to bring ownership diversification - with more room given to private shareholders – and the creation of “genuine” Board of Directors structures, to improve corporate governance and, finally, to increase the profitability and the value of State capital. The urbanization of more than 100 million migrant workers is intended to raise people’s standards of living and consumer spending. The benefits of these reforms will be more visible in the longer term than in the immediate future.
Finally, it was the anticipation of the launch of the Shanghai-Hong Kong Connect system that really created excitement among investors. This mutual market access program will enable international investors (like the Clough China Fund) to invest in Chinese companies listed in the domestic A share equity markets*.
Similarly mainland Chinese investors will be allowed to invest Hong Kong-listed stocks. After several weeks of delay this program was finally launched on November 17th.
Portfolio Composition
Holdings in the information technology and industrial sectors were the biggest contributors to the Fund’s performance for the period.
In terms of individual stocks, China Mobile, Tencent Holdings, and Industrial and Commercial Bank of China (ICBC) were major contributors to performance based on the combination of their individual share price performances and the size of their holdings since these three happen to be amongst the largest holdings in the Fund. China Mobile, the country’s largest mobile telecom operator, and ICBC, China’s largest commercial bank have reached market caps above $240 billion while Tencent who operates the largest mobile game distribution platform and is a leading provider of Internet, mobile and telecommunication value added services has a $150 billion market cap. They are fairly well known by international investors. They are “the classics” of China, the backbones of many Chinese equity portfolios and also happen to be major components of the MSCI China index.
But in terms of individual stocks’ absolute returns, they may not be the real “China stars”. At Clough China Fund, it is three much smaller stocks who provided the largest gains: Pax Global, CT Environmental Group and Best Pacific. All three companies were founded by individuals and are privately-owned (i.e., they are not owned by the State). All three of them have powerful growth engines and efficient managements. They are examples of the real treasures that can be selected on Chinese equities by active managers.
Pax Global is the number three worldwide provider of electronic fund transfer point of sales terminal solutions –credit card transactions terminals - (after Ingenico and Verifone). They have an asset-light business model with manufacturing outsourced to a Japanese company based in Mainland China. First half 2014 earnings more than doubled vs. the prior year driven by a 59% increase in revenue. As they expand overseas at full speed, they target their global market share to rise from 9% to 15% over the next couple of years, meaning there looks to be much more upside potential for the share price that already doubled during the period under review. CT Environmental Group is a provider of waste water treatment and industrial water supply services mainly for industrial parks in China. They expand through acquisitions of new projects and diversification in sludge treatment business –all activities well in line with the government policies to protect and clean water resources and control industrial pollution. First half profits increased 27%. The share price was up 86% in the last 6 months. Best Pacific is a manufacturer of bra fabrics, ebbing and lace. Their top customer is Victoria Secret (15% of revenue). It is a new stock, listed on the market in May 2014. Growth engines look to be twofold: more developments to come in the lace industry where profit margins are higher than average and if Victoria Secret enters the Chinese market in the near term. Share price rose 79% since the IPO.
| 111 | October 31, 2014 |
| Clough China Fund | ||
| Management Commentary | October 31, 2014 (Unaudited) |
On the other hand, CIFI, a mid-sized property developer, China State Construction, a construction and civil engineering group and Want Want, the maker of rice crackers, snacks and beverages were the major detractors on performance. We have exited the Want Want holding.
Outlook
Our views on China’s economic growth are slightly different from what is conveyed by the international media. While it is obvious that China’s GDP growth has been slowing down, from 10% per year in the last decade to some 7 to 8%, we believe it does not matter so much if it is 7.5% or 7.3% or even 7%. After all, slow growth does not mean no growth. and, regardless, China’s growth remains the highest in the world by far for a large economy, with very low inflation. We tend to consider the 7.3% growth in the third quarter as quite robust. China is not the Euro zone where the third quarter GDP was just announced at 0.8%. Importantly, China’s interest rates remain high relative to the OECD economies and policy makers have the ability to lower interest rates, if needed, to support growth. This is in stark contrast to the policy tools available to the US Federal Reserve as well as the Japanese and European central banks.
While October macro data were relatively soft, there was some recovery starting in the real estate sector, with residential investment growing 9.5% year-over-year up from 5.2% in September and new project starts turning positive4. We expect 2014 economic growth to be steady at 7.3-7.4% and we forecast 2015 GDP to grow at about 7%. Going forward, the growth deceleration will likely be gradual. With the ongoing reform policies and the consistent changes in China’s economic patterns and structures, we believe investment opportunities will continue to expand. One example to illustrate this point is the fantastic growth of on-line retail. Traditional patterns of retail sales through department stores and shopping malls have entered a difficult time with severe growth declines but online retail has now become a multi-year growth market in China. On line retail market grew 51.3% in 2012, 59.4% in 2013 and again 45.9% in the first half of 2014.It represented 8% of total retail sales last year and is expected to reach 16% of retail sales by 20176. Hence the successful IPO of Alibaba, the obvious leader of this market.
We believe the opening of the Shanghai domestic equity market to international investors through the Shanghai-Hong Kong Connect system will attract a lot of interest from overseas institutions as it represents a diversification of assets into a large universe of stocks with a market capitalization of over $2 trillion4, or 90% of Shanghai’s total market and 79% of its turnover. The Shanghai stock market has rallied more than 20% since last July but the current valuation remains low at just 9x earnings.
This is not a market to ignore, even more so since MSCI recently announced that they are considering entering A-shares in the MSCI China Index in the future. Moreover, this move seems to signal Chinese government intentions to continue to open up the capital markets in the long term and allow international standards of corporate governance and transparency penetrate Chinese
management practices. The Clough China Fund intends to participate in this new market, with stocks carefully selected on the basis of the same fundamental criteria as for our existing stockholdings: financial quality, visibility and strong earnings growth outlook at a reasonable price, while assimilating the local specific approach as well. We think there is an attractive upside potential in A shares and investment return can be high.
Francoise Vappereau, Co-Portfolio Manager
Eric Brock, Co-Portfolio Manager
Sources:
| 1 | BAML China Macro (August 15, 2014). |
| 2 | HSBC: 3Q GDPP in line with expectation (October 21, 2014). |
| 3 | Standard Chartered: China Property: State Council encourages home purchases (October 30, 2014). |
| 4 | Bloomberg. |
| 5 | BNP Paribas: Asian Instant Insight – China GDP (October 21, 2014). |
| 6 | BNP Paribas Research: China Internet – E-commerce : shopping for winners (October 29,2014) + iResearch forecast. |
| * | A-Shares are shares in mainland China-based companies that trade on Chinese stock exchanges such as the Shanghai Stock Exchange and the Shenzhen Stock Exchange. |
Investments in international and emerging markets securities include exposure to risks such as currency fluctuations, foreign taxes and regulations, and the potential for illiquid markets and political instability.
The views and information discussed in this commentary are as of the date of publication, are subject to change, and may not reflect the writer’s current views. The views expressed represent an assessment of market conditions at a specific point in time, are opinions only and should not be relied upon as investment advice regarding a particular investment or markets in general. Such information does not constitute a recommendation to buy or sell specific securities or investment vehicles. It should not be assumed that any investment will be profitable or will equal the performance of the fund(s) or any securities or any sectors mentioned in this letter. The subject matter contained in this letter has been derived from several sources believed to be reliable and accurate at the time of compilation. Neither Clough Capital Partners, LP nor the Fund accepts any liability for losses either direct or consequential caused by the use of this information.
| 112 | October 31, 2014 |
| Clough China Fund | ||
| Performance Update | October 31, 2014 (Unaudited) |
Performance of $10,000 Initial Investment (as of October 31, 2014)
Comparison of change in value of a $10,000 investment (includes maximum sales charges of 5.50%)
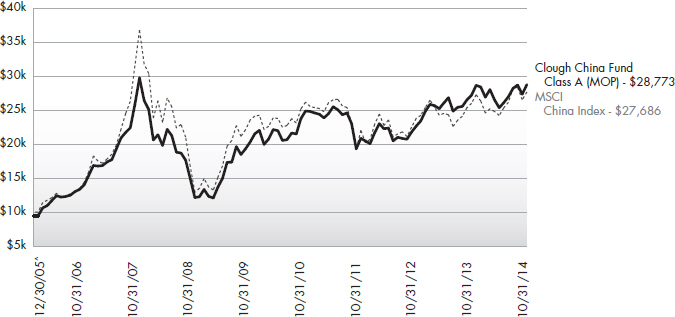
The chart above represents historical performance of a hypothetical investment of $10,000 in the Fund since inception. Past performance does not guarantee future results. This chart does not reflect the deduction of taxes that a shareholder would pay on Fund distributions or the redemption of Fund shares.
Average Annual Total Returns (as of October 31, 2014)
| 6 Month | 1 Year | 3 Year | 5 Year | Since Inception^ | Total Expense Ratio | What You Pay* | ||||||||
Class A (NAV) | 13.42% | 5.73% | 11.31% | 7.19% | 13.43% | 2.07% | 1.96% | |||||||
Class A (MOP) | 7.16% | -0.07% | 9.23% | 5.99% | 12.71% | |||||||||
Class C (NAV) | 12.99% | 4.91% | 10.45% | 6.37% | 12.59% | 2.87% | 2.71% | |||||||
Class C (CDSC) | 11.99% | 3.91% | 10.45% | 6.37% | 12.59% | |||||||||
Class I1 | 13.55% | 5.95% | 11.61% | 7.52% | 13.90% | 1.82% | 1.71% | |||||||
MSCI China Index2 | 14.23% | 6.41% | 7.86% | 3.27% | 12.22% |
Performance data quoted represents past performance. Past performance does not guarantee future results. Investment return and principal value of an investment will fluctuate so that an investor’s shares, when sold or redeemed, may be worth more or less than the original cost. Current performance data may be higher or lower than actual data quoted. For the most current month-end performance data, please call 1-877-256-8445.
Maximum Offering Price (MOP) for Class A shares includes the Fund’s maximum sales charge of 5.50%. Performance shown at NAV does not include these sales charges and would have been lower had it been taken into account. If you invest $1 million or more, either as a lump sum or through the Fund’s accumulation or letter of intent programs, you can purchase Class A shares without an initial sales charge (load). A Contingent Deferred Sales Charge (“CDSC”) of 1.00% may apply to Class C shares redeemed within the first 12 months after a purchase, and on Class A shares redeemed within the first 18 months after a purchase in excess of $1 million. The Fund imposes a 2.00% redemption fee on shares held for less than 30 days.
Performance less than 1 year is cumulative.
| 113 | October 31, 2014 |
| Clough China Fund | ||
| Performance Update | October 31, 2014 (Unaudited) |
The performance shown for the Clough China Fund for periods prior to January 15, 2010, reflects the performance of the Old Mutual China Fund, a series of Old Mutual Funds I (as a result of a prior reorganization of the Old Mutual China Fund into the Clough China Fund).
| 1 | Prior to close of business on January 15, 2010, Class I was known as Institutional Class of the Old Mutual China Fund. |
| 2 | The Morgan Stanley Capital International (“MSCI”) China Index is constructed according to the MSCI Global Investable Market Index (GIMI) family. The MSCI China Index is part of the MSCI Emerging Markets Index. The index is not actively managed and does not reflect any deduction for fees, expenses or taxes. An investor may not invest directly in an index. |
| ^ | Fund Inception date of December 30, 2005. |
| * | What You Pay reflects the Advisor’s decision to contractually limit expenses through August 31, 2015. Please see the prospectus for additional information. |
The table does not reflect the deduction of taxes that a shareholder would pay on Fund distributions or the redemption of Fund shares.
There is no guarantee that the Fund will continue to hold any one particular security or stay invested in any one particular company. The composition of the Fund’s top holdings is subject to change. Performance figures are historical and reflect the change in share price, reinvested distributions, changes in net asset value, sales charges and capital gains distributions, if any.
Not FDIC Insured – No Bank Guarantee – May Lose Value
Investing in the Fund is subject to investment risks, including possible loss of the principal amount invested.
Investing in China, Hong Kong and Taiwan involves risk and considerations not present when investing in more established securities markets. The Fund may be more susceptible to the economic, market, political and local risks of these regions than a fund that is more geographically diversified.
This Fund is not suitable for all investors.
Top Ten Holdings (as a % of Net Assets) †
Tencent Holdings, Ltd. | 9.44 | % | ||
China Mobile, Ltd. | 8.17 | % | ||
China Construction Bank Corp., Class H | 6.49 | % | ||
Industrial & Commercial Bank of China, Ltd., Class H | 5.96 | % | ||
Byd Co., Ltd., Class H | 2.98 | % | ||
CSR Corp., Ltd., Class H | 2.73 | % | ||
Bank of China, Ltd., Class H | 2.46 | % | ||
Ping An Insurance Group Co. of China, Ltd., Class H | 2.29 | % | ||
Alibaba Group Holding, Ltd., Sponsored ADR | 2.28 | % | ||
PAX Global Technology, Ltd. | 2.25 | % | ||
Top Ten Holdings | 45.05 | % |
| † | Holdings are subject to change. Table presents indicative values only. |
Industry Sector Allocation (as a % of Net Assets)
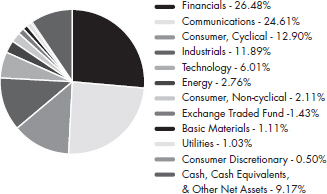
| 114 | October 31, 2014 |
| Clough China Fund | ||
| Statement of Investments | October 31, 2014 |
| Shares | Value (Note 2) | |||||||
| ||||||||
COMMON STOCKS (89.40%) |
| |||||||
Basic Materials (1.11%) | ||||||||
Iron/Steel (1.11%) | ||||||||
Angang Steel Co., Ltd., Class H | 1,242,000 | $ | 913,062 | |||||
|
| |||||||
TOTAL BASIC MATERIALS |
| 913,062 | ||||||
|
| |||||||
Communications (24.61%) |
| |||||||
Internet (11.72%) |
| |||||||
Alibaba Group Holding, Ltd., Sponsored | 18,966 | 1,870,048 | ||||||
Tencent Holdings, Ltd. | 481,800 | 7,743,621 | ||||||
|
| |||||||
| 9,613,669 | ||||||||
|
| |||||||
Telecommunications (12.89%) |
| |||||||
China Fiber Optic Network System Group, Ltd. | 4,734,000 | 1,436,093 | ||||||
China Mobile, Ltd. | 538,500 | 6,700,296 | ||||||
China Telecom Corp., Ltd., Class H | 1,614,000 | 1,028,853 | ||||||
China Unicom Hong Kong, Ltd. | 458,000 | 688,152 | ||||||
ZTE Corp., Class H | 295,800 | 717,327 | ||||||
|
| |||||||
| 10,570,721 | ||||||||
|
| |||||||
TOTAL COMMUNICATIONS |
| 20,184,390 | ||||||
|
| |||||||
Consumer Discretionary (0.50%) |
| |||||||
Specialty Retail (0.50%) |
| |||||||
China ZhengTong Auto Services Holdings, Ltd. | 718,000 | 406,748 | ||||||
|
| |||||||
TOTAL CONSUMER DISCRETIONARY |
| 406,748 | ||||||
|
| |||||||
Consumer, Cyclical (12.90%) |
| |||||||
Airlines (0.91%) | ||||||||
Air China, Ltd., Class H | 1,150,000 | 744,738 | ||||||
|
| |||||||
Apparel (3.82%) |
| |||||||
Best Pacific International Holdings, Ltd., Class H | 3,430,000 | 1,707,227 | ||||||
Sitoy Group Holdings, Ltd. | 1,733,000 | 1,427,260 | ||||||
|
| |||||||
| 3,134,487 | ||||||||
|
| |||||||
Auto Manufacturers (2.14%) |
| |||||||
Brilliance China Automotive Holdings, Ltd. | 346,000 | 598,326 | ||||||
Chongqing Changan Automobile Co., Ltd., Class B | 252,070 | 557,072 | ||||||
Great Wall Motor Co., Ltd., Class H | 135,500 | 595,477 | ||||||
| Shares | Value (Note 2) | |||||||
| ||||||||
Auto Manufacturers (continued) |
| |||||||
Jiangling Motors Corp., Ltd. | 1,600 | $ | 6,241 | |||||
|
| |||||||
| 1,757,116 | ||||||||
|
| |||||||
Auto Parts & Equipment (0.43%) |
| |||||||
Weifu High-Technology Group Co., Ltd. | 92,400 | 350,388 | ||||||
|
| |||||||
Lodging (1.82%) |
| |||||||
Sands China, Ltd. | 239,600 | 1,494,412 | ||||||
|
| |||||||
Retail (1.74%) |
| |||||||
Lifestyle International Holdings, Ltd. | 205,500 | 388,468 | ||||||
Man Wah Holdings, Ltd. | 694,556 | 1,039,188 | ||||||
|
| |||||||
| 1,427,656 | ||||||||
|
| |||||||
Textiles (2.04%) | ||||||||
Anta Sports Products, Ltd. | 347,000 | 681,087 | ||||||
Pacific Textile Holdings, Ltd. | 741,000 | 993,714 | ||||||
|
| |||||||
| 1,674,801 | ||||||||
|
| |||||||
TOTAL CONSUMER, CYCLICAL |
| 10,583,598 | ||||||
|
| |||||||
Consumer, Non-Cyclical (2.11%) |
| |||||||
Pharmaceuticals (2.11%) |
| |||||||
Sinopharm Group Co., Ltd., Class H | 442,000 | 1,726,713 | ||||||
|
| |||||||
TOTAL CONSUMER, NON-CYCLICAL |
| 1,726,713 | ||||||
|
| |||||||
Energy (2.76%) | ||||||||
Oil & Gas (2.16%) | ||||||||
China Petroleum & Chemical Corp., Class H | 2,048,000 | 1,776,050 | ||||||
|
| |||||||
Oil & Gas Services (0.60%) |
| |||||||
Sinopec Kantons Holdings, Ltd. | 592,000 | 489,432 | ||||||
|
| |||||||
TOTAL ENERGY | 2,265,482 | |||||||
|
| |||||||
Financials (26.48%) | ||||||||
Banks (15.87%) | ||||||||
Agricultural Bank of China, Ltd., Class H | 1,714,000 | 796,484 | ||||||
Bank of China, Ltd., Class H | 4,207,000 | 2,013,686 | ||||||
China Construction Bank Corp., Class H | 7,132,080 | 5,321,240 | ||||||
Industrial & Commercial Bank of China, Ltd., Class H | 7,358,967 | 4,886,060 | �� | |||||
|
| |||||||
| 13,017,470 | ||||||||
|
| |||||||
| 115 | October 31, 2014 |
| Clough China Fund | ||
| Statement of Investments | October 31, 2014 |
| Shares | Value (Note 2) | |||||||
| ||||||||
Diversified Financial Services (0.88%) |
| |||||||
Haitong Securities Co., Ltd., Class H | 421,600 | $ | 723,854 | |||||
|
| |||||||
Insurance (2.29%) | ||||||||
Ping An Insurance Group Co. of China, Ltd., Class H | 229,500 | 1,876,102 | ||||||
|
| |||||||
Real Estate (7.44%) |
| |||||||
Cheung Kong Holdings, Ltd. | 48,000 | 852,109 | ||||||
China Overseas Land & Investment, Ltd. | 386,000 | 1,119,954 | ||||||
China Resources Land, Ltd. | 254,000 | 604,145 | ||||||
China South City Holdings, Ltd. | 2,220,000 | 1,005,484 | ||||||
CIFI Holdings Group Co., Ltd. | 5,012,000 | 930,355 | ||||||
Kaisa Group Holdings, Ltd. | 1,766,000 | 656,300 | ||||||
Shimao Property Holdings, Ltd. | 434,500 | 935,147 | ||||||
|
| |||||||
| 6,103,494 | ||||||||
|
| |||||||
TOTAL FINANCIALS |
| 21,720,920 | ||||||
|
| |||||||
Industrials (11.89%) | ||||||||
Engineering & Construction (3.93%) |
| |||||||
Beijing Urban Construction Design & Development Group Co., Ltd., Class H(a) | 1,681,000 | 1,160,090 | ||||||
China Railway Construction Corp., Ltd., Class H | 1,207,000 | 1,268,069 | ||||||
China State Construction International Holdings, Ltd. | 512,200 | 791,812 | ||||||
|
| |||||||
| 3,219,971 | ||||||||
|
| |||||||
Environmental Control (2.68%) |
| |||||||
China Everbright International, Ltd. | 771,000 | 1,064,536 | ||||||
CT Environmental Group, Ltd. | 608,760 | 650,119 | ||||||
Kangda International Environmental Co., Ltd.(a) | 1,045,000 | 482,614 | ||||||
|
| |||||||
| 2,197,269 | ||||||||
|
| |||||||
Machinery-Diversified (2.73%) |
| |||||||
CSR Corp., Ltd., Class H(b) | 2,204,000 | 2,242,324 | ||||||
|
| |||||||
Transportation (2.55%) |
| |||||||
Orient Overseas International, Ltd. | 73,000 | 415,900 | ||||||
Sinotrans, Ltd., Class H | 2,112,000 | 1,675,883 | ||||||
|
| |||||||
| 2,091,783 | ||||||||
|
| |||||||
TOTAL INDUSTRIALS |
| 9,751,347 | ||||||
|
| |||||||
| Shares | Value (Note 2) | |||||||
| ||||||||
Technology (6.01%) | ||||||||
Computers (3.03%) | ||||||||
Lenovo Group, Ltd. | 432,000 | $ | 636,770 | |||||
PAX Global Technology, Ltd.(a) | 1,719,000 | 1,846,295 | ||||||
|
| |||||||
| 2,483,065 | ||||||||
|
| |||||||
Electrical Equipment & Instruments (2.98%) |
| |||||||
Byd Co., Ltd., Class H | 384,500 | 2,442,619 | ||||||
|
| |||||||
TOTAL TECHNOLOGY | 4,925,684 | |||||||
|
| |||||||
Utilities (1.03%) | ||||||||
Electric (1.03%) | ||||||||
Huadian Power International Corp., Ltd., Class H | 1,108,000 | 846,347 | ||||||
|
| |||||||
TOTAL UTILITIES | 846,347 | |||||||
|
| |||||||
TOTAL COMMON STOCKS (Cost $58,782,976) |
| 73,324,291 | ||||||
|
| |||||||
EXCHANGE TRADED FUNDS (1.43%) |
| |||||||
CSOP FTSE China A50 ETF | 969,000 | 1,167,025 | ||||||
|
| |||||||
TOTAL EXCHANGE TRADED FUNDS (Cost $1,192,081) |
| 1,167,025 | ||||||
|
| |||||||
7-Day Yield | Shares | Value (Note 2) | ||||||||||
| ||||||||||||
SHORT TERM INVESTMENTS (2.27%) |
| |||||||||||
Money Market Fund (2.27%) |
| |||||||||||
Morgan Stanley Institutional Liquidity Funds - Prime Portfolio | 0.045 | % | 1,864,529 | 1,864,529 | ||||||||
|
| |||||||||||
TOTAL SHORT TERM INVESTMENTS (Cost $1,864,529) |
| 1,864,529 | ||||||||||
|
| |||||||||||
Value (Note 2) | ||||||||||||
| ||||||||||||
TOTAL INVESTMENTS (93.10%) (Cost $61,839,586) |
| $ | 76,355,845 | |||||||||
Other Assets In Excess Of Liabilities (6.90%) |
| 5,662,671 | ||||||||||
|
| |||||||||||
NET ASSETS (100.00%) |
| $ | 82,018,516 | |||||||||
|
| |||||||||||
| 116 | October 31, 2014 |
| Clough China Fund | ||
| Statement of Investments | October 31, 2014 |
| (a) | Non-Income Producing Security. |
| (b) | Fair valued security under the procedures approved by the Fund’s Board of Trustees. |
Common Abbreviations:
ADR - American Depositary Receipt
ETF - Exchange Traded Fund.
FTSE - Financial Times and the London Stock Exchange.
Ltd. - Limited.
For Fund compliance purposes, the Fund’s industry classifications refer to any one or more of the industry sub-classifications used by one or more widely recognized market indexes or ratings group indexes, and/or as defined by Fund management. This definition may not apply for purposes of this report, which may combine industry sub-classifications for reporting ease. Industries are shown as a percent of net assets.
See Notes to Financial Statements.
| 117 | October 31, 2014 |
| Clough China Fund | ||
| Statement of Assets and Liabilities | October 31, 2014 |
ASSETS | ||||
Investments, at value | $ | 76,355,845 | ||
Foreign currency, at value (Cost $5,674,385) | 5,677,358 | |||
Receivable for investments sold | 1,514,921 | |||
Receivable for shares sold | 38,786 | |||
Dividends receivable | 24,842 | |||
Prepaid expenses and other assets | 17,129 | |||
Total Assets | 83,628,881 | |||
LIABILITIES | ||||
Payable for investments purchased | 1,429,797 | |||
Payable for shares redeemed | 15,561 | |||
Investment advisory fees payable | 72,577 | |||
Administration and transfer agency fees payable | 15,480 | |||
Distribution and services fees payable | 15,881 | |||
Trustees’ fees and expenses payable | 593 | |||
Professional fees payable | 32,883 | |||
Accrued expenses and other liabilities | 27,593 | |||
Total Liabilities | 1,610,365 | |||
NET ASSETS | $ | 82,018,516 | ||
NET ASSETS CONSIST OF | ||||
Paid-in capital | $ | 65,839,856 | ||
Accumulated net investment income | 1,699,179 | |||
Accumulated net realized loss on investments and foreign currency transactions | (39,788) | |||
Net unrealized appreciation on investments and translation of assets and liabilities denominated in foreign currencies | 14,519,269 | |||
NET ASSETS | $ | 82,018,516 | ||
INVESTMENTS, AT COST | $ | 61,839,586 | ||
PRICING OF SHARES | ||||
Class A: | ||||
Net Asset Value, offering and redemption price per share(a) | $ | 23.50 | ||
Net Assets | $ | 30,525,582 | ||
Shares of beneficial interest outstanding (unlimited number of shares, no par value common stock authorized) | 1,298,939 | |||
Maximum offering price per share ((NAV/0.9450), based on maximum sales charge of 5.50% of the offering price) | $ | 24.87 | ||
Class C: | ||||
Net Asset Value, offering and redemption price per share(a) | $ | 22.53 | ||
Net Assets | $ | 11,575,455 | ||
Shares of beneficial interest outstanding (unlimited number of shares, no par value common stock authorized) | 513,833 | |||
Class I: | ||||
Net Asset Value, offering and redemption price per share | $ | 23.97 | ||
Net Assets | $ | 39,917,479 | ||
Shares of beneficial interest outstanding (unlimited number of shares, no par value common stock authorized) | 1,665,319 | |||
| (a) | Redemption price per share may be reduced for any applicable contingent deferred sales charge. For a description of a possible sales charge, please see the Fund’s Prospectus. |
See Notes to Financial Statements.
| 118 | October 31, 2014 |
| Clough China Fund | ||
| Statements of Operations |
| For the Fiscal Period Ended October 31, 2014(a) | For the Year Ended April 30, 2014 | |||||||
INVESTMENT INCOME | ||||||||
Dividends | $ | 2,487,317 | $ | 2,286,061 | ||||
Foreign taxes withheld on dividends | (181,746) | (119,466) | ||||||
Total Investment Income | 2,305,571 | 2,166,595 | ||||||
EXPENSES | ||||||||
Investment advisory fees | 541,832 | 1,155,579 | ||||||
Administrative and transfer agency fees | 71,774 | 150,311 | ||||||
Distribution and service fees | ||||||||
Class A | 39,517 | 90,072 | ||||||
Class C | 57,600 | 121,069 | ||||||
Professional fees | 26,445 | 30,156 | ||||||
Networking fees | ||||||||
Class A | 4,981 | 15,272 | ||||||
Class C | 4,977 | 10,431 | ||||||
Class I | 6,802 | 12,632 | ||||||
Reports to shareholders and printing fees | 6,584 | 13,963 | ||||||
State registration fees | 21,013 | 43,532 | ||||||
SEC registration fees | – | 1,450 | ||||||
Insurance fees | 818 | 1,326 | ||||||
Custody fees | 37,005 | 99,353 | ||||||
Trustees’ fees and expenses | 1,090 | 3,197 | ||||||
Miscellaneous expenses | 8,218 | 18,150 | ||||||
Total Expenses | 828,656 | 1,766,493 | ||||||
Less fees waived/reimbursed by investment advisor (Note 8) | ||||||||
Class A | (17,210) | (40,594) | ||||||
Class C | (9,617) | (18,643) | ||||||
Class I | (22,406) | (40,939) | ||||||
Net Expenses | 779,423 | 1,666,317 | ||||||
Net Investment Income | 1,526,148 | 500,278 | ||||||
Net realized gain on investments | 2,030,435 | 2,054,689 | ||||||
Net realized gain on foreign currency transactions | 19,099 | 6,743 | ||||||
Net change in unrealized appreciation/(depreciation) on investments | 6,055,868 | (5,386,635) | ||||||
Net change in unrealized appreciation/(depreciation) on translation of assets and liabilities denominated in foreign currencies | (1,573) | 3,955 | ||||||
NET REALIZED AND UNREALIZED GAIN/(LOSS) ON INVESTMENTS | 8,103,829 | (3,321,248) | ||||||
NET INCREASE/(DECREASE) IN NET ASSETS RESULTING FROM OPERATIONS | $ | 9,629,977 | $ | (2,820,970) | ||||
| (a) | Effective May 1, 2014, the Board approved changing the fiscal year-end of the Funds from April 30 to October 31. |
See Notes to Financial Statements.
| 119 | October 31, 2014 |
| Clough China Fund | ||
| Statements of Changes in Net Assets |
| For the Fiscal Period Ended October 31, 2014(a) | For the Year Ended April 30, 2014 | For the Year April 30, 2013 | ||||||||||
OPERATIONS | ||||||||||||
Net investment income | $ | 1,526,148 | $ | 500,278 | $ | 401,561 | ||||||
Net realized gain on investments and foreign currency transactions | 2,049,534 | 2,061,432 | 1,151,438 | |||||||||
Net change in unrealized appreciation/(depreciation) on investments and translation of assets and liabilities denominated in foreign currencies | 6,054,295 | (5,382,680) | 5,521,514 | |||||||||
Net Increase/(Decrease) in Net Assets Resulting from Operations | 9,629,977 | (2,820,970) | 7,074,513 | |||||||||
DISTRIBUTIONS | ||||||||||||
Dividends to shareholders from net investment income | ||||||||||||
Class A | – | (300,642) | (38,487) | |||||||||
Class C | – | (39,515) | – | |||||||||
Class I | – | (359,841) | (61,529) | |||||||||
Net Decrease in Net Assets from Distributions | – | (699,998) | (100,016) | |||||||||
BENEFICIAL INTEREST TRANSACTIONS (NOTE 6) | ||||||||||||
Shares sold | ||||||||||||
Class A | 3,360,623 | 13,818,283 | 8,119,247 | |||||||||
Class C | 896,076 | 4,109,696 | 2,575,377 | |||||||||
Class I | 8,345,000 | 17,778,504 | 41,213,968 | |||||||||
Dividends reinvested | ||||||||||||
Class A | – | 401,410 | 25,075 | |||||||||
Class C | – | 21,934 | – | |||||||||
Class I | – | 167,997 | 18,451 | |||||||||
Shares redeemed, net of redemption fees | ||||||||||||
Class A | (7,865,957) | (14,337,423) | (10,136,711) | |||||||||
Class C | (1,541,832) | (4,986,624) | (3,351,866) | |||||||||
Class I | (6,269,825) | (8,919,474) | (45,590,967) | |||||||||
Net Increase/(Decrease) in Net Assets Derived from Beneficial Interest Transactions | (3,075,915) | 8,054,303 | (7,127,426) | |||||||||
Net increase/(decrease) in net assets | 6,554,062 | 4,533,335 | (152,929) | |||||||||
NET ASSETS | ||||||||||||
Beginning of period | 75,464,454 | 70,931,119 | 71,084,048 | |||||||||
End of period * | $ | 82,018,516 | $ | 75,464,454 | $ | 70,931,119 | ||||||
*Including accumulated net investment income of: | $ | 1,699,179 | $ | 173,708 | $ | 336,688 | ||||||
| (a) | Effective May 1, 2014, the Board approved changing the fiscal year-end of the Funds from April 30 to October 31. |
See Notes to Financial Statements.
| 120 | October 31, 2014 |
| Clough China Fund – Class A | ||
| Financial Highlights |
Selected data for a share of beneficial interest outstanding throughout the periods indicated:
| For the Fiscal Period Ended October 31, 2014(a) | For the Year April 30, 2014 | For the Year April 30, 2013 | For the Year April 30, 2012 | For the Year April 30, 2011 | For the Fiscal Period Ended April 30, 2010(b)(c) | For the Year July 31, 2009 | ||||||||
Net asset value, beginning of period | $20.72 | $21.45 | $18.43 | $21.02 | $18.21 | $16.32 | $15.81 | |||||||
INCOME/(LOSS) FROM INVESTMENT OPERATIONS: | ||||||||||||||
Net investment income/(loss) | 0.45(d) | 0.12(d) | 0.15(d) | 0.02(d) | (0.04)(d) | 0.10 | 0.09(d) | |||||||
Net realized and unrealized gain/(loss) | 2.33 | (0.69) | 2.90 | (2.61) | 2.94 | 1.85 | 0.62(e) | |||||||
Total from investment operations | 2.78 | (0.57) | 3.05 | (2.59) | 2.90 | 1.95 | 0.71 | |||||||
DISTRIBUTIONS: | ||||||||||||||
From net investment income | – | (0.17) | (0.03) | – | (0.09) | (0.07) | (0.20) | |||||||
Total distributions | – | (0.17) | (0.03) | – | (0.09) | (0.07) | (0.20) | |||||||
REDEMPTION FEES ADDED TO PAID-IN CAPITAL (NOTE 6) | 0.00(f) | 0.01 | 0.00(f) | 0.00(f) | 0.00(d)(f) | 0.01 | 0.00(d)(f) | |||||||
Net increase/(decrease) in net asset value | 2.78 | (0.73) | 3.02 | (2.59) | 2.81 | 1.89 | 0.51 | |||||||
Net asset value, end of year | $23.50 | $20.72 | $21.45 | $18.43 | $21.02 | $18.21 | $16.32 | |||||||
TOTAL RETURN(g) | 13.42% | (2.69)% | 16.54% | (12.32)% | 16.00% | 12.07% | 5.00%(e) | |||||||
RATIOS/SUPPLEMENTAL DATA: | ||||||||||||||
Net assets, end of year (000s) | $30,526 | $31,164 | $32,709 | $30,542 | $44,616 | $28,695 | $15,069 | |||||||
Ratio of expenses to average net assets excluding fee waivers and reimbursements | 2.06%(h) | 2.06% | 2.14% | 2.08% | 2.07% | 2.24%(h) | 2.62% | |||||||
Ratio of expenses to average net assets including fee waivers and reimbursements | 1.95%(h) | 1.95% | 1.95% | 1.95% | 1.89%(i) | 1.87%(h)(j) | 1.95% | |||||||
Ratio of net investment income/ (loss) to average net assets | 3.96%(h) | 0.55% | 0.78% | 0.13% | (0.22)% | (0.53)%(h) | 0.70% | |||||||
Portfolio turnover rate(k) | 76% | 232% | 221% | 174% | 170% | 110% | 120% | |||||||
| (a) | Effective May 1, 2014, the Board approved changing the fiscal year-end of the Funds from April 30 to October 31. |
| (b) | Prior to its reorganization on January 15, 2010, the Clough China Fund was known as the Old Mutual China Fund. |
| (c) | Effective March 9, 2010, the Board approved changing the fiscal year-end of the Fund from July 31 to April 30. |
| (d) | Calculated using the average shares method. |
| (e) | Impact of payment by affiliate was less than $0.01 per share and 0.01%, respectively. |
| (f) | Less than $0.005 per share. |
| (g) | Total returns are for the period indicated and have not been annualized. Total returns would have been lower had certain expenses not been waived during the period. Returns shown do not reflect the deduction of taxes that a shareholder would pay on Fund distributions or the redemption of Fund shares. Returns shown exclude any applicable sales charges. |
| (h) | Annualized. |
| (i) | Contractual expense limitation changed from 1.85% to 1.95% effective January 1, 2011. |
| (j) | Contractual expense limitation changed from 1.95% to 1.85% effective January 1, 2010. |
| (k) | Portfolio turnover rate for periods less than one full year have not been annualized. |
See Notes to Financial Statements.
121 | October 31, 2014 |
| Clough China Fund – Class C | ||
| Financial Highlights |
Selected data for a share of beneficial interest outstanding throughout the periods indicated:
| For the Fiscal Period Ended October 31, 2014(a) | For the Year April 30, 2014 | For the Year April 30, 2013 | For the Year April 30, 2012 | For the Year April 30, 2011 | For the Fiscal Period Ended April 30, 2010(b)(c) | For the Year July 31, 2009 | ||||||||
Net asset value, beginning of period | $19.94 | $20.71 | $17.90 | $20.58 | $17.89 | $16.08 | $15.48 | |||||||
INCOME/(LOSS) FROM INVESTMENT OPERATIONS: | ||||||||||||||
Net investment income/(loss) | 0.33(d) | (0.02)(d) | 0.01(d) | (0.11)(d) | (0.21)(d) | (0.17) | (0.01)(d) | |||||||
Net realized and unrealized gain/(loss) | 2.26 | (0.68) | 2.80 | (2.57) | 2.90 | 1.98 | 0.65(e) | |||||||
Total from investment operations | 2.59 | (0.70) | 2.81 | (2.68) | 2.69 | 1.81 | 0.64 | |||||||
DISTRIBUTIONS: | ||||||||||||||
From net investment income | – | (0.07) | – | – | (0.00)(f) | – | (0.04) | |||||||
Total distributions | – | (0.07) | – | – | (0.00)(f) | – | (0.04) | |||||||
REDEMPTION FEES ADDED TO PAID-IN CAPITAL (NOTE 6) | 0.00(f) | 0.00(f) | 0.00(f) | 0.00(f) | 0.00(f) | – | – | |||||||
Net increase/(decrease) in net asset value | 2.59 | (0.77) | 2.81 | (2.68) | 2.69 | 1.81 | 0.60 | |||||||
Net asset value, end of year | $22.53 | $19.94 | $20.71 | $17.90 | $20.58 | $17.89 | $16.08 | |||||||
TOTAL RETURN(g) | 12.99% | (3.43)% | 15.70% | (13.02)% | 15.13% | 11.26% | 4.21%(e) | |||||||
RATIOS/SUPPLEMENTAL DATA: | ||||||||||||||
Net assets, end of year (000s) | $11,575 | $10,866 | $12,251 | $11,674 | $16,848 | $7,594 | $8,267 | |||||||
Ratio of expenses to average net assets excluding fee waivers and reimbursements | 2.87%(h) | 2.86% | 2.94% | 2.88% | 2.86% | 3.18%(h) | 3.43% | |||||||
Ratio of expenses to average net assets including fee waivers and reimbursements | 2.70%(h) | 2.70% | 2.70% | 2.70% | 2.70% | 2.70%(h) | 2.70% | |||||||
Ratio of net investment income/ (loss) to average net assets | 3.08%(h) | (0.09)% | 0.07% | (0.62)% | (1.10)% | (1.26)%(h) | (0.05)% | |||||||
Portfolio turnover rate(i) | 76% | 232% | 221% | 174% | 170% | 110% | 120% | |||||||
| (a) | Effective May 1, 2014, the Board approved changing the fiscal year-end of the Funds from April 30 to October 31. |
| (b) | Prior to its reorganization on January 15, 2010, the Clough China Fund was known as the Old Mutual China Fund. |
| (c) | Effective March 9, 2010, the Board approved changing the fiscal year-end of the Fund from July 31 to April 30. |
| (d) | Calculated using the average shares method. |
| (e) | Impact of payment by affiliate was less than $0.01 per share and 0.01%, respectively. |
| (f) | Less than $0.005 and ($0.005) per share. |
| (g) | Total returns are for the period indicated and have not been annualized. Total returns would have been lower had certain expenses not been waived during the period. Returns shown do not reflect the deduction of taxes that a shareholder would pay on Fund distributions or the redemption of Fund shares. Returns shown exclude any applicable sales charges. |
| (h) | Annualized. |
| (i) | Portfolio turnover rate for periods less than one full year have not been annualized. |
See Notes to Financial Statements.
122 | October 31, 2014 |
| Clough China Fund – Class I | ||
| Financial Highlights |
Selected data for a share of beneficial interest outstanding throughout the periods indicated:
| For the Fiscal Period Ended October 31, 2014(a) | For the Year April 30, 2014 | For the Year April 30, 2013 | For the Year April 30, 2012 | For the Year April 30, 2011 | For the Fiscal Period Ended April 30, 2010(b)(c) | For the Year July 31, 2009 | ||||||||
Net asset value, beginning of period | $21.11 | $21.82 | $18.71 | $21.30 | $18.41 | $16.52 | $16.10 | |||||||
INCOME/(LOSS) FROM INVESTMENT OPERATIONS: | ||||||||||||||
Net investment income/(loss) | 0.45(d) | 0.19(d) | 0.13(d) | 0.06(d) | (0.01)(d) | 0.01 | 0.15(d) | |||||||
Net realized and unrealized gain/(loss) | 2.41 | (0.69) | 3.02 | (2.65) | 3.03 | 2.03 | 0.60(e) | |||||||
Total from investment operations | 2.86 | (0.50) | 3.15 | (2.59) | 3.02 | 2.04 | 0.75 | |||||||
DISTRIBUTIONS: | ||||||||||||||
From net investment income | – | (0.21) | (0.06) | – | (0.13) | (0.15) | (0.33) | |||||||
Total distributions | – | (0.21) | (0.06) | – | (0.13) | (0.15) | (0.33) | |||||||
REDEMPTION FEES ADDED TO PAID-IN CAPITAL (NOTE 6) | 0.00(f) | 0.00(f) | 0.02 | 0.00(f) | 0.00(f) | – | – | |||||||
Net increase/(decrease) in net asset value | 2.86 | (0.71) | 3.11 | (2.59) | 2.89 | 1.89 | 0.42 | |||||||
Net asset value, end of year | $23.97 | $21.11 | $21.82 | $18.71 | $21.30 | $18.41 | $16.52 | |||||||
TOTAL RETURN(g) | 13.55% | (2.41)% | 16.95% | (12.16)% | 16.45% | 12.36% | 5.51%(e) | |||||||
RATIOS/SUPPLEMENTAL DATA: | ||||||||||||||
Net assets, end of year (000s) | $39,917 | $33,435 | $25,972 | $28,868 | $41,054 | $15,071 | $9,744 | |||||||
Ratio of expenses to average net assets excluding fee waivers and reimbursements | 1.82%(h) | 1.81% | 1.94% | 1.85% | 1.85% | 1.86%(h) | 1.97% | |||||||
Ratio of expenses to average net assets including fee waivers and reimbursements | 1.70%(h) | 1.70% | 1.70% | 1.70% | 1.53%(i) | 1.40%(h) | 1.40% | |||||||
Ratio of net investment income/ (loss) to average net assets | 3.89%(h) | 0.83% | 0.69% | 0.33% | (0.03)% | 0.08%(h) | 1.20% | |||||||
Portfolio turnover rate(j) | 76% | 232% | 221% | 174% | 170% | 110% | 120% | |||||||
| (a) | Effective May 1, 2014, the Board approved changing the fiscal year-end of the Funds from April 30 to October 31. |
| (b) | Prior to its reorganization on January 15, 2010, the Clough China Fund was known as the Old Mutual China Fund and Class I was known as the Institutional Class. |
| (c) | Effective March 9, 2010, the Board approved changing the fiscal year-end of the Fund from July 31 to April 30. |
| (d) | Calculated using the average shares method. |
| (e) | Impact of payment by affiliate was less than $0.01 per share and 0.01%, respectively. |
| (f) | Less than $0.005 per share. |
| (g) | Total returns are for the period indicated and have not been annualized. Total returns would have been lower had certain expenses not been waived during the period. Returns shown do not reflect the deduction of taxes that a shareholder would pay on Fund distributions or the redemption of Fund shares. |
| (h) | Annualized. |
| (i) | Contractual expense limitation changed from 1.40% to 1.70% effective January 1, 2011. |
| (j) | Portfolio turnover rate for periods less than one full year have not been annualized. |
See Notes to Financial Statements.
123 | October 31, 2014 |
| RiverFront Global Allocation Series | ||
| Management Commentary | October 31, 2014 (Unaudited) |
Positioning
We do not believe that the five-year bull market in risk assets has ended, despite global equity markets’ rise in volatility and falling prices as we have transitioned to the last part of 2014. From a positioning standpoint, RiverFront strategies have been and remain positioned in “risk-on” mode. Despite record highs for US markets, it is our belief that we remain in a secular bull market and that investors with longer than three years should have an allocation to US stocks.
Until recently, we have favored developed international equities over US equities for the majority of the past six months. While Europe is not without problems, we felt that the Eurozone was in the early stages of laying the groundwork for an economic recovery. Based on comments by Mario Draghi, the President of the European Central Bank (ECB), we believe there is the real possibility of additional Quantitative Easing (QE) by the ECB if deflationary pressures are not eased. We continue to believe that the possibility exists for above average returns, based on our Price Matters® framework but acknowledge that investors have lost patience. We took advantage of the pullback in US equities in mid-October to increase our domestic exposure. We believe that the US has the clearest economic momentum and that US equity markets could have more powerful short-term catalysts.
For our balanced strategies, we believe that we are headed for a bond bear market so we have remained underweight traditional fixed income and have positioned that allocation more towards high yield, shorter duration investments. The Fed is due to finish tapering in October, but expectations are for interest rates to remain near zero until the middle of 2015. We believe that markets could experience “Goldilocks” conditions; low interest rates mainly due to foreign investors buying US Treasuries, and moderate growth in the US for the next couple of quarters as consumers spend more as a result of higher wages and falling commodity prices. Globally, yields are near record lows, causing foreign investors to seek higher returns by buying higher yielding US Treasuries. We continue to believe it is better to take credit risk rather than duration risk with fixed income assets just in case the Fed raises rates faster than market participants expect.
Performance Discussion:
RiverFront’s investment process combines dynamic strategic asset allocation with tactical adjustment tools. We believe that over longer time frames, valuation, or the price you pay for an asset, is the single most important determinant of your odds of being successful. However, in our view, investors rarely give themselves or their investment manager sufficient time to be proven right. Thus Riverfront incorporates tactical adjustments to our dynamic strategic allocations in an attempt to manage risk and lower short term volatility for our shorter time horizon portfolios (3-7 years) and to enhance returns in our longer term portfolios (7-10 yrs).
Tactical moves in our more conservative offerings tend to be more oriented to “risk management” than opportunistic adjustments. In our two most conservative strategies (Conservative Income Builder
and Moderate Growth & Income), we seek to navigate short-term cycles with less volatility, and provide our clients the reassurance that portfolio risks will be actively managed; thereby giving them the confidence to remain invested across a market cycle. Conversely, tactical tilts in our longer time frame funds tend to be more opportunistic. Given the longer time horizon (7-10) years for these funds, investors in these strategies should be able to withstand higher levels of volatility in times of market uncertainly in order to achieve their longer term goals.
With this process as the backdrop, the RiverFront Investment Team typically constructs a core portfolio of securities and then makes variations in position sizes to conform to the risk profile of each individual model. For example, our most aggressive offering, the Global Growth Fund is comprised of all equities. Those same equities are utilized in Global Allocation, but a measure of fixed income is added to provide a potential offset to downside volatility. To that end, the drivers of performance for the two funds will be the same, generally, just in different degrees. The same holds true for the balanced funds (those that contain a higher proportion of fixed income) Dynamic Equity Income, Moderate Growth & Income and Conservative Income Builder.
The table below illustrates the disparity of returns across the major indices during the past six months, which resulted in varying degrees of relative performance when compared to the traditional single index, mutual fund benchmark.
| Benchmark Indexes* | 6 Month Returns** | |
S&P 500 Total Return | 8.22% | |
S&P 1000 Total Return | 5.24% | |
MSCI EAFE (Net) | -4.83% | |
MSCI Emerging Markets (Net) | -1.77% | |
MSCI All Country World Index (Net) | 2.37% | |
Barclays US Aggregate | 2.35% | |
Barclays US Treasury Index | 2.12% | |
Barclays US Short Treasury Index (1-3M) | 0.04% |
Data as of 10/31/2014
| * | For index definitions see footnotes at the end of the management commentary and below the performance data on the following pages. |
| ** | For a complete presentation of RiverFront mutual fund and relevant benchmark performance, please refer to the Performance Discussion on the following pages. |
Performance Contributors:
| — | The allocation to Master Limited Partnerships (MLPs) and Real Estate Investment Trusts (REITs) has contributed positively to all strategies. |
| — | Within US equity, the consumer discretionary sector had a positive impact – specifically stock selection with media. |
| — | Despite the relative outperformance of US equities when compared with other markets, we had positive selection contribution from some of our international equity |
| 124 | October 31, 2014 |
| RiverFront Global Allocation Series | ||
| Management Commentary | October 31, 2014 (Unaudited) |
holdings. Within developed international, we have shifted our allocation to securities that hedge our exposure to the Yen and the Euro and that has contributed positively to performance. |
Detractors to Performance:
| — | Emerging markets equities have underperformed US large cap equities during the period so our allocation to this asset class impacted the strategies negatively. |
| — | The allocation to US Micro-Cap equities impacted performance negatively. |
| — | Being underweight large cap pharmaceuticals and biotechs (within the US equity allocation) had a negative impact. |
| — | Within our balanced strategies, fixed income had a negative impact. The Barclays Aggregate Bond Index had a positive return during the period as compared to most high yield and shorter duration instruments. Given our preference to take credit risk over duration risk, we were lower in quality and shorter in duration than the benchmark which had a negative impact. |
Past performance is no guarantee of future results. Dividends are not guaranteed and are subject to change or elimination. Investments in international and emerging markets securities include exposure to risks such as currency fluctuations, foreign taxes and regulations, and the potential for illiquid markets and political instability.
The views and information discussed in this commentary are as of the date of publication, are subject to change, and may not reflect the writer’s current views. The views expressed represent an assessment of market conditions at a specific point in time, are opinions only and should not be relied upon as investment advice regarding a particular investment or markets in general. Such information does not constitute a recommendation to buy or sell specific securities or investment vehicles. It should not be assumed that any investment will be profitable or will equal the performance of the fund(s) or any securities or any sectors mentioned in this letter. The subject matter contained in this letter has been derived from several sources believed to be reliable and accurate at the time of compilation. Neither the Fund(s) nor RiverFront Investment Group, LLC accepts any liability for losses either direct or consequential caused by the use of this information.
The S&P 1000® Index combines the S&P MidCap 400® and the S&P SmallCap 600® to form an investable benchmark for the mid- to small-cap segment of the U.S. equity market.
The MSCI EAFE Index is recognized as the pre-eminent benchmark in the United States to measure international equity performance. It comprises the MSCI country indices that represent developed markets outside of North America: Europe, Australasia and the Far East.
The MSCI Emerging Markets Index is a free float-adjusted market capitalization index that is designed to measure equity market performance in the global emerging markets.
The Barclays Capital U.S. Treasury Index includes public obligations of the U.S. Treasury, excluding Treasury bills and certain special
issues, such as state and local government series bonds (SLGs) and U.S. Treasury TIPS.
The Barclays Capital U.S. Short Treasury Index is composed of bonds of investment grade with a maturity between one and three years.
Diversification cannot guarantee gain or prevent losses.
| 125 | October 31, 2014 |
| RiverFront Conservative Income Builder Fund | ||
| Performance Update | October 31, 2014 (Unaudited) |
Performance of $10,000 Initial Investment (as of October 31, 2014)
Comparison of change in value of a $10,000 investment (includes maximum sales charges of 5.50%)
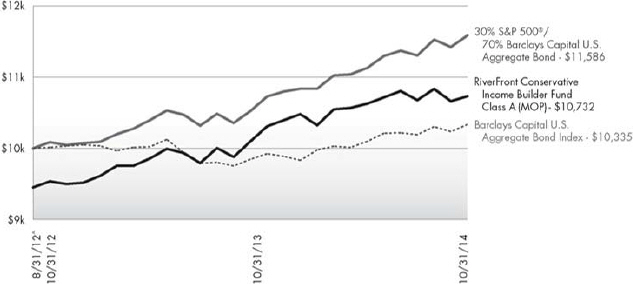
The chart above represents historical performance of a hypothetical investment of $10,000 in the Fund since inception. Past performance does not guarantee future results. This chart does not reflect the deduction of taxes that a shareholder would pay on Fund distributions or the redemption of Fund shares.
Average Annual Total Returns (as of October 31, 2014)
| 6 Months | 1 Year | Since Inception^ | Total Expense Ratio | What You Pay* | ||||||
Class A (NAV) | 0.98% | 4.10% | 6.03% | 3.22% | 1.43% | |||||
Class A (MOP) | -4.57% | -1.60% | 3.31% | |||||||
Class C (NAV) | 0.68% | 3.42% | 5.29% | 4.01% | 2.18% | |||||
Class C (CDSC) | -0.32% | 2.42% | 5.29% | |||||||
Class I | 1.19% | 4.48% | 6.33% | 2.94% | 1.18% | |||||
Barclays Capital U.S. Aggregate Bond Index1 | 2.35% | 4.14% | 1.53% | |||||||
30% S&P 500® and 70% Barclays Capital U.S. Aggregate Bond1,2 | 4.10% | 8.00% | 7.03% |
Performance data quoted represents past performance. Past performance does not guarantee future results. Investment return and principal value of an investment will fluctuate so that an investor’s shares, when sold or redeemed, may be worth more or less than the original cost. Current performance data may be higher or lower than actual data quoted. For the most current month-end performance data, please call 1-866-759-5679.
Maximum Offering Price (MOP) for Class A shares includes the Fund’s maximum sales charge of 5.50%. Performance shown at NAV does not include these sales charges and would have been lower had it been taken into account. If you invest $1 million or more, either as a lump sum or through the Fund’s accumulation or letter of intent programs, you can purchase Class A shares without an initial sales charge (load). A Contingent Deferred Sales Charge (“CDSC”) of 1.00% may apply to Class C shares redeemed within the first 12 months after a purchase, and on Class A shares redeemed within the first 18 months after a purchase in excess of $1 million.
Performance less than 1 year is cumulative.
| 126 | October 31, 2014 |
| RiverFront Conservative Income Builder Fund | ||
| Performance Update | October 31, 2014 (Unaudited) |
| 1 | The Barclays Capital U.S. Aggregate Bond Index is a broad-based benchmark that measures the investment grade, U.S. dollar-denominated, fixed-rate taxable bond market, including Treasuries, government-related and corporate securities, MBS (agency fixed-rate and hybrid ARM passthroughs), ABS, and CMBS. The index is not actively managed and does not reflect any deductions for fees, expenses or taxes. An investor may not invest directly in an index. |
| 2 | The S&P 500® Index is the Standard & Poor’s composite index of 500 stocks, a widely recognized, unmanaged index of common stock prices. |
| ^ | Fund inception date of August 31, 2012. The Fund commenced operations September 4, 2012. |
| * | What You Pay reflects the Advisor’s and Sub-Advisor’s decision to contractually limit expenses through August 31, 2015. Please see the prospectus for additional information. |
The table does not reflect the deduction of taxes that a shareholder would pay on Fund distributions or the redemption of Fund shares.
This Fund is not suitable for all investors. Subject to investment risks, including possible loss of the principal amount invested.
There is no guarantee that the Fund will continue to hold any one particular security or stay invested in any one particular company. The composition of the Fund’s top holdings is subject to change. Performance figures are historical and reflect the change in share price, reinvested distributions, changes in net asset value, sales charges and capital gains distributions, if any.
Not FDIC Insured – No Bank Guarantee – May Lose Value
Top Ten Holdings (as a % of Net Assets) †
SPDR® Barclays Short Term Corporate Bond ETF | 14.94 | % | ||
iShares® Barclays 1-3 Year Credit Bond ETF | 12.70 | % | ||
RiverFront Strategic Income Fund | 9.56 | % | ||
WisdomTree® LargeCap Dividend Fund | 8.60 | % | ||
PIMCO 0-5 Year High Yield Corporate Bond Index ETF | 8.53 | % | ||
SPDR® Barclays Short Term High Yield Bond ETF | 8.39 | % | ||
WisdomTree® Europe Hedged Equity Fund | 4.71 | % | ||
iShares® Core MSCI Emerging Markets ETF | 3.20 | % | ||
First Trust NASDAQ Technology Dividend Index Fund | 3.07 | % | ||
Consumer Staples Select Sector SPDR® Fund | 2.16 | % | ||
Top Ten Holdings | 75.86 | % |
| † | Holdings are subject to change. Table presents indicative values only. |
Portfolio Composition (as a % of Net Assets)
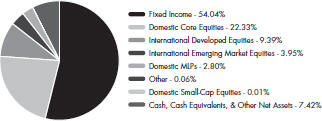 |
| 127 | October 31, 2014 |
| RiverFront Dynamic Equity Income Fund | ||
| Performance Update | October 31, 2014 (Unaudited) |
Performance of $10,000 Initial Investment (as of October 31, 2014)
Comparison of change in value of a $10,000 investment (includes maximum sales charges of 5.50%)
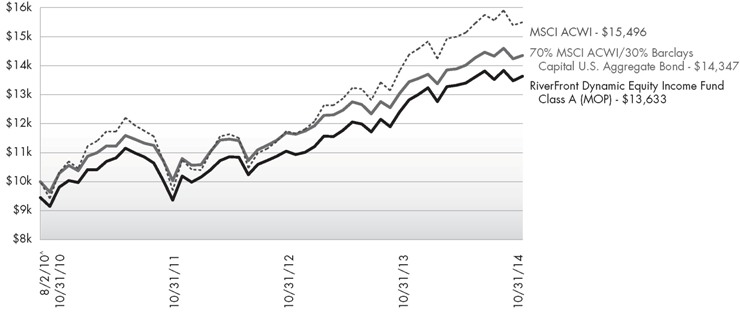
The chart above represents historical performance of a hypothetical investment of $10,000 in the Fund since inception. Past performance does not guarantee future results. This chart does not reflect the deduction of taxes that a shareholder would pay on Fund distributions or the redemption of Fund shares.
Average Annual Total Returns (as of October 31, 2014)
| 6 Months | 1 Year | 3 Years | Since Inception^ | Total Expense Ratio | What You Pay* | |||||||
Class A (NAV) | 1.66% | 6.14% | 10.18% | 9.01% | 1.74% | 1.47% | ||||||
Class A (MOP) | -3.90% | 0.33% | 8.13% | 7.57% | ||||||||
Class C (NAV) | 1.30% | 5.40% | 9.34% | 8.17% | 2.50% | 2.22% | ||||||
Class C (CDSC) | 0.30% | 4.40% | 9.34% | 8.17% | ||||||||
Class I | 1.88% | 6.46% | 10.45% | 9.26% | 1.49% | 1.22% | ||||||
MSCI All Country World Index1 | 2.37% | 7.77% | 12.98% | 10.86% | ||||||||
70% MSCI ACWI and 30% Barclays Capital U.S. Aggregate Bond1,2 | 2.38% | 6.75% | 9.95% | 8.87% |
Performance data quoted represents past performance. Past performance does not guarantee future results. Investment return and principal value of an investment will fluctuate so that an investor’s shares, when sold or redeemed, may be worth more or less than the original cost. Current performance data may be higher or lower than actual data quoted. For the most current month-end performance data, please call 1-866-759-5679.
Maximum Offering Price (MOP) for Class A shares includes the Fund’s maximum sales charge of 5.50%. Performance shown at NAV does not include these sales charges and would have been lower had it been taken into account. If you invest $1 million or more, either as a lump sum or through the Fund’s accumulation or letter of intent programs, you can purchase Class A shares without an initial sales charge (load). A Contingent Deferred Sales Charge (“CDSC”) of 1.00% may apply to Class C shares redeemed within the first 12 months after a purchase, and on Class A shares redeemed within the first 18 months after a purchase in excess of $1 million.
Performance less than 1 year is cumulative.
| 128 | October 31, 2014 |
| RiverFront Dynamic Equity Income Fund | ||
| Performance Update | October 31, 2014 (Unaudited) |
| 1 | The MSCI ACWI (All Country World Index) is a free float-adjusted market capitalization weighted index that is designed to measure the equity market performance of developed and emerging markets. The MSCI ACWI consists of 45 country indices comprising 24 developed and 21 emerging market country indices. The index includes reinvestment of dividends, net of foreign withholding taxes. The index is not actively managed and does not reflect any deductions for fees, expenses or taxes. An investor may not invest directly in an index. |
| 2 | The Barclays Capital U.S. Aggregate Bond Index is a broad-based benchmark that measures the investment grade, U.S. dollar-denominated, fixed-rate taxable bond market, including Treasuries, government-related and corporate securities, MBS (agency fixed-rate and hybrid ARM passthroughs), ABS, and CMBS. The index is not actively managed and does not reflect any deductions for fees, expenses or taxes. An investor may not invest directly in an index. |
| ^ | Fund inception date of August 2, 2010. |
| * | What You Pay reflects the Advisor’s and Sub-Advisor’s decision to contractually limit expenses through August 31, 2015. Please see the prospectus for additional information. |
The table does not reflect the deduction of taxes that a shareholder would pay on Fund distributions or the redemption of Fund shares.
This Fund is not suitable for all investors. Subject to investment risks, including possible loss of the principal amount invested.
There is no guarantee that the Fund will continue to hold any one particular security or stay invested in any one particular company. The composition of the Fund’s top holdings is subject to change. Performance figures are historical and reflect the change in share price, reinvested distributions, changes in net asset value, sales charges and capital gains distributions, if any.
Not FDIC Insured – No Bank Guarantee – May Lose Value
Top Ten Holdings (as a % of Net Assets) †
WisdomTree® LargeCap Dividend Fund | 24.75% | |
WisdomTree® Europe Hedged Equity Fund | 11.97% | |
iShares® Core MSCI Emerging Markets ETF | 5.84% | |
SPDR® Barclays Short Term High Yield Bond ETF | 5.72% | |
RiverFront Strategic Income Fund | 5.21% | |
WisdomTree® Japan Hedged Equity Fund | 4.14% | |
iShares® MSCI All Country Asia ex Japan Index ETF | 4.06% | |
Deutsche X-trackers MSCI EAFE Hedged Equity ETF | 3.09% | |
Global X MLP & Energy Infrastructure ETF | 2.73% | |
Global X MSCI Norway ETF | 2.30% | |
Top Ten Holdings | 69.81% |
| † | Holdings are subject to change. Table presents indicative values only. |
Portfolio Composition (as a % of Net Assets)
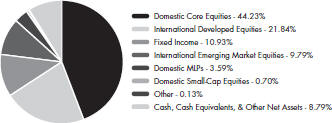
| 129 | October 31, 2014 |
| RiverFront Global Allocation Fund | ||
| Performance Update | October 31, 2014 (Unaudited) |
Performance of $10,000 Initial Investment (as of October 31, 2014)
Comparison of change in value of a $10,000 investment (includes maximum sales charges of 5.50%)
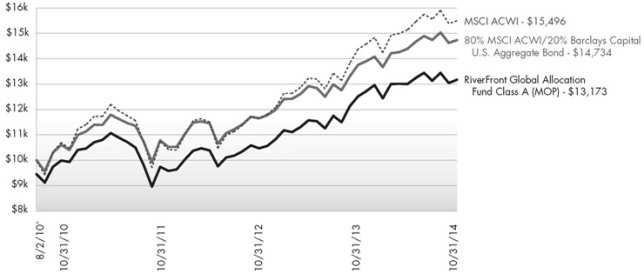
The chart above represents historical performance of a hypothetical investment of $10,000 in the Fund since inception. Past performance does not guarantee future results. This chart does not reflect the deduction of taxes that a shareholder would pay on Fund distributions or the redemption of Fund shares.
Average Annual Total Returns (as of October 31, 2014)
| 6 Months | 1 Year | 3 Years | Since Inception^ | Total Expense Ratio | What You Pay* | |||||||
Class A (NAV) | 1.31% | 5.24% | 10.58% | 8.13% | 1.83% | 1.47% | ||||||
Class A (MOP) | -4.23% | -0.55% | 8.51% | 6.71% | ||||||||
Class C (NAV) | 0.94% | 4.41% | 9.77% | 7.33% | 2.58% | 2.22% | ||||||
Class C (CDSC) | -0.06% | 3.41% | 9.77% | 7.33% | ||||||||
Class I | 1.33% | 5.39% | 10.82% | 8.37% | 1.58% | 1.22% | ||||||
MSCI All Country World Index1 | 2.37% | 7.77% | 12.98% | 10.86% | ||||||||
80% MSCI ACWI and 20% Barclays Capital U.S. Aggregate Bond1,2 | 2.38% | 7.09% | 10.96% | 9.56% |
Performance data quoted represents past performance. Past performance does not guarantee future results. Investment return and principal value of an investment will fluctuate so that an investor’s shares, when sold or redeemed, may be worth more or less than the original cost. Current performance data may be higher or lower than actual data quoted. For the most current month-end performance data, please call 1-866-759-5679.
Maximum Offering Price (MOP) for Class A shares includes the Fund’s maximum sales charge of 5.50%. Performance shown at NAV does not include these sales charges and would have been lower had it been taken into account. If you invest $1 million or more, either as a lump sum or through the Fund’s accumulation or letter of intent programs, you can purchase Class A shares without an initial sales charge (load). A Contingent Deferred Sales Charge (“CDSC”) of 1.00% may apply to Class C shares redeemed within the first 12 months after a purchase, and on Class A shares redeemed within the first 18 months after a purchase in excess of $1 million.
Performance less than 1 year is cumulative.
| 130 | October 31, 2014 |
| RiverFront Global Allocation Fund | ||
| Performance Update | October 31, 2014 (Unaudited) |
| 1 | The MSCI ACWI (All Country World Index) is a free float-adjusted market capitalization weighted index that is designed to measure the equity market performance of developed and emerging markets. The MSCI ACWI consists of 45 country indices comprising 24 developed and 21 emerging market country indices. The index includes reinvestment of dividends, net of foreign withholding taxes. The index is not actively managed and does not reflect any deductions for fees, expenses or taxes. An investor may not invest directly in an index. |
| 2 | The Barclays Capital U.S. Aggregate Bond Index is a broad-based benchmark that measures the investment grade, U.S. dollar-denominated, fixed-rate taxable bond market, including Treasuries, government-related and corporate securities, MBS (agency fixed-rate and hybrid ARM passthroughs), ABS, and CMBS. The index is not actively managed and does not reflect any deductions for fees, expenses or taxes. An investor may not invest directly in an index. |
| ^ | Fund inception date of August 2, 2010. |
| * | What You Pay reflects the Advisor’s and Sub-Advisor’s decision to contractually limit expenses through August 31, 2015. Please see the prospectus for additional information. |
The table does not reflect the deduction of taxes that a shareholder would pay on Fund distributions or the redemption of Fund shares.
This Fund is not suitable for all investors. Subject to investment risks, including possible loss of the principal amount invested.
There is no guarantee that the Fund will continue to hold any one particular security or stay invested in any one particular company. The composition of the Fund’s top holdings is subject to change. Performance figures are historical and reflect the change in share price, reinvested distributions, changes in net asset value, sales charges and capital gains distributions, if any.
Not FDIC Insured – No Bank Guarantee – May Lose Value
Top Ten Holdings (as a % of Net Assets) †
WisdomTree® Europe Hedged Equity Fund | 13.17 | % | ||
iShares® Core MSCI Emerging Markets ETF | 5.64 | % | ||
iShares® MSCI All Country Asia ex Japan Index ETF | 5.62 | % | ||
iShares® Core S&P 500 ETF | 5.59 | % | ||
WisdomTree® Japan Hedged Equity Fund | 4.99 | % | ||
WisdomTree® LargeCap Dividend Fund | 4.91 | % | ||
iShares® Russell Micro-Cap ETF | 4.10 | % | ||
First Trust NASDAQ Technology Dividend Index Fund | 3.91 | % | ||
Vanguard® FTSE® Developed Markets ETF | 3.75 | % | ||
Deutsche X-trackers MSCI EAFE Hedged Equity ETF | 3.05 | % | ||
Top Ten Holdings | 54.73 | % |
| † | Holdings are subject to change. Table presents indicative values only. |
Portfolio Composition (as a % of Net Assets)
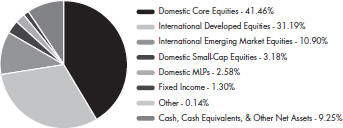
| 131 | October 31, 2014 |
| RiverFront Global Growth Fund | ||
| Performance Update | October 31, 2014 (Unaudited) |
Performance of $10,000 Initial Investment (as of October 31, 2014)
Comparison of change in value of a $10,000 investment (includes maximum sales charges of 5.50%)
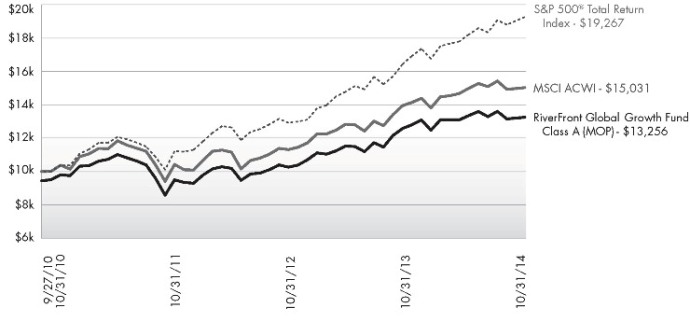
The chart above represents historical performance of a hypothetical investment of $10,000 in the Fund since inception. Past performance does not guarantee future results. This chart does not reflect the deduction of taxes that a shareholder would pay on Fund distributions or the redemption of Fund shares.
Average Annual Total Returns (as of October 31, 2014)
| 6 Months | 1 Year | 3 Years | Since Inception^ | Total Expense Ratio | What You Pay* | |||||||||||||
Class A (NAV) | 1.18% | 5.37% | 11.74% | 11.66% | 1.73% | 1.48% | ||||||||||||
Class A (MOP) | -4.40% | -0.45% | 9.64% | 11.66% | ||||||||||||||
Class C (NAV) | 0.80% | 4.54% | 10.93% | 10.83% | 2.48% | 2.23% | ||||||||||||
Class C (CDSC) | -0.20% | 3.59% | 10.93% | 10.83% | ||||||||||||||
Class I | 1.31% | 5.65% | 12.02% | 11.94% | 1.49% | 1.23% | ||||||||||||
Class L 1 | 1.31% | 5.61% | 12.04% | 11.92% | 1.48% | 1.23% | ||||||||||||
Investor | 1.18% | 5.40% | 11.75% | 11.64% | 1.74% | 1.48% | ||||||||||||
S&P 500® Total Return Index2 | 8.22% | 17.27% | 19.77% | 16.07% | ||||||||||||||
MSCI All Country World Index3 | 2.37% | 7.77% | 12.98% | 13.96% | ||||||||||||||
Performance data quoted represents past performance. Past performance does not guarantee future results. Investment return and principal value of an investment will fluctuate so that an investor’s shares, when sold or redeemed, may be worth more or less than the original cost. Current performance data may be higher or lower than actual data quoted. For the most current month-end performance data, please call 1-866-759-5679.
Maximum Offering Price (MOP) for Class A shares includes the Fund’s maximum sales charge of 5.50%. Performance shown at NAV does not include these sales charges and would have been lower had it been taken into account. If you invest $1 million or more, either as a lump sum or through the Fund’s accumulation or letter of intent programs, you can purchase Class A shares without an initial sales charge (load). A Contingent Deferred Sales Charge (“CDSC”) of 1.00% may apply to Class C shares redeemed within the first 12 months after a purchase, and on Class A shares redeemed within the first 18 months after a purchase in excess of $1 million.
Performance less than 1 year is cumulative.
| 132 | October 31, 2014 |
| RiverFront Global Growth Fund | ||
| Performance Update | October 31, 2014 (Unaudited) |
| 1 | Prior to close of business on September 24, 2010, Class L was known as Institutional Class of the Baird Funds, Inc. - RiverFront Long-Term Growth Fund. |
| 2 | S&P 500® Total Return Index is the Standard & Poor’s composite index of 500 stocks, a widely recognized, unmanaged index of common stock prices. The index is not actively managed and does not reflect any deduction for fees, expenses or taxes. An investor may not invest directly in an index. |
| 3 | The MSCI ACWI (All Country World Index) is a free float-adjusted market capitalization weighted index that is designed to measure the equity market performance of developed and emerging markets. The MSCI ACWI consists of 45 country indices comprising 24 developed and 21 emerging market country indices. The index includes reinvestment of dividends, net of foreign withholding taxes. The index is not actively managed and does not reflect any deductions for fees, expenses or taxes. An investor may not invest directly in an index. |
| ^ | Fund inception date of October 28, 2008. |
| * | What You Pay reflects the Advisor’s and Sub-Advisor’s decision to contractually limit expenses through August 31, 2015. Please see the prospectus for additional information. |
The Class A, C, I and L shares performance shown for periods prior to September 27, 2010 reflects the performance of the Baird Funds, Inc. – RiverFront Long-Term Growth Fund’s Institutional Class shares (as result of the reorganization of the Baird Funds, Inc. – RiverFront Long-Term Growth Fund into the Fund).
The Investor Class performance shown for periods prior to September 27, 2010 reflects the performance of the Baird Funds, Inc. – RiverFront Long-Term Growth Fund’s Investor Class shares (as result of the reorganization of the Baird Funds, Inc. – RiverFront Long-Term Growth Fund into the Fund).
The table does not reflect the deduction of taxes that a shareholder would pay on Fund distributions or the redemption of Fund shares.
This Fund is not suitable for all investors. Subject to investment risks, including possible loss of the principal amount invested.
There is no guarantee that the Fund will continue to hold any one particular security or stay invested in any one particular company. The composition of the Fund’s top holdings is subject to change. Performance figures are historical and reflect the change in share price, reinvested distributions, changes in net asset value, sales charges and capital gains distributions, if any.
Not FDIC Insured – No Bank Guarantee – May Lose Value
Top Ten Holdings (as a % of Net Assets) †
WisdomTree® Europe Hedged Equity Fund | 16.89 | % | ||
iShares® MSCI All Country Asia ex Japan Index ETF | 7.24 | % | ||
WisdomTree® Japan Hedged Equity Fund | 5.88 | % | ||
WisdomTree® LargeCap Dividend Fund | 5.09 | % | ||
iShares® Russell Micro-Cap ETF | 5.07 | % | ||
Vanguard® FTSE® Developed Markets ETF | 4.04 | % | ||
iShares® Core MSCI Emerging Markets ETF | 3.91 | % | ||
First Trust NASDAQ Technology Dividend Index Fund | 3.73 | % | ||
Deutsche X-trackers MSCI EAFE Hedged Equity ETF | 3.09 | % | ||
PowerShares® S&P 500® High Beta Port ETF | 2.40 | % | ||
Top Ten Holdings | 57.34 | % |
| † | Holdings are subject to change. Table presents indicative values only. |
Portfolio Composition (as a % of Net Assets)
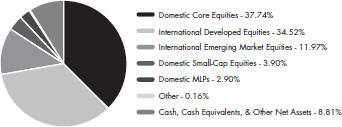
| 133 | October 31, 2014 |
| RiverFront Moderate Growth & Income Fund | ||
| Performance Update | October 31, 2014 (Unaudited) | |
Performance of $10,000 Initial Investment (as of October 31, 2014)
Comparison of change in value of a $10,000 investment (includes maximum sales charges of 5.50%)
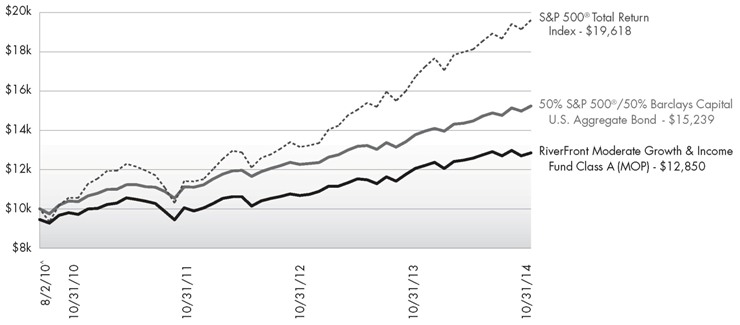
The chart above represents historical performance of a hypothetical investment of $10,000 in the Fund since inception. Past performance does not guarantee future results. This chart does not reflect the deduction of taxes that a shareholder would pay on Fund distributions or the redemption of Fund shares.
Average Annual Total Returns (as of October 31, 2014)
| 6 Months | 1 Year | 3 Years | Since Inception^ | Total Expense Ratio | What You Pay* | |||||||
Class A (NAV) | 2.12% | 6.55% | 8.53% | 7.50% | 1.62% | 1.45% | ||||||
Class A (MOP) | -3.51% | 0.66% | 6.50% | 6.08% | ||||||||
Class C (NAV) | 1.75% | 5.75% | 7.68% | 6.71% | 2.37% | 2.20% | ||||||
Class C (CDSC) | 0.75% | 4.75% | 7.68% | 6.71% | ||||||||
Class I | 2.25% | 6.85% | 8.79% | 7.77% | 1.37% | 1.20% | ||||||
S&P 500® Total Return Index1 | 8.22% | 17.27% | 19.77% | 17.20% | ||||||||
50% S&P 500® and 50% Barclays Capital U.S. Aggregate Bond1,2 | 5.27% | 10.62% | 11.07% | 10.43% |
Performance data quoted represents past performance. Past performance does not guarantee future results. Investment return and principal value of an investment will fluctuate so that an investor’s shares, when sold or redeemed, may be worth more or less than the original cost. Current performance data may be higher or lower than actual data quoted. For the most current month-end performance data, please call 1-866-759-5679.
Maximum Offering Price (MOP) for Class A shares includes the Fund’s maximum sales charge of 5.50%. Performance shown at NAV does not include these sales charges and would have been lower had it been taken into account. If you invest $1 million or more, either as a lump sum or through the Fund’s accumulation or letter of intent programs, you can purchase Class A shares without an initial sales charge (load). A Contingent Deferred Sales Charge (“CDSC”) of 1.00% may apply to Class C shares redeemed within the first 12 months after a purchase, and on Class A shares redeemed within the first 18 months after a purchase in excess of $1 million.
Performance less than 1 year is cumulative.
| 134 | October 31, 2014 |
| RiverFront Moderate Growth & Income Fund | ||
| Performance Update | October 31, 2014 (Unaudited) | |
| 1 | S&P 500® Total Return Index is the Standard & Poor’s composite index of 500 stocks, a widely recognized, unmanaged index of common stock prices. The index is not actively managed and does not reflect any deduction for fees, expenses or taxes. An investor may not invest directly in an index. |
| 2 | The Barclays Capital U.S. Aggregate Bond Index is a broad-based benchmark that measures the investment grade, U.S. dollar-denominated, fixed-rate taxable bond market, including Treasuries, government-related and corporate securities, MBS (agency fixed-rate and hybrid ARM passthroughs), ABS, and CMBS. The index is not actively managed and does not reflect any deductions for fees, expenses or taxes. An investor may not invest directly in an index. |
| ^ | Fund inception date of August 2, 2010. |
| * | What You Pay reflects the Advisor’s and Sub-Advisor’s decision to contractually limit expenses through August 31, 2015. Please see the prospectus for additional information. |
The table does not reflect the deduction of taxes that a shareholder would pay on Fund distributions or the redemption of Fund shares.
This Fund is not suitable for all investors. Subject to investment risks, including possible loss of the principal amount invested.
There is no guarantee that the Fund will continue to hold any one particular security or stay invested in any one particular company. The composition of the Fund’s top holdings is subject to change. Performance figures are historical and reflect the change in share price, reinvested distributions, changes in net asset value, sales charges and capital gains distributions, if any.
Not FDIC Insured – No Bank Guarantee – May Lose Value
Top Ten Holdings (as a % of Net Assets) †
WisdomTree® LargeCap Dividend Fund | 21.56 | % | ||
RiverFront Strategic Income Fund | 9.02 | % | ||
SPDR® Barclays Short Term High Yield Bond ETF | 7.43 | % | ||
WisdomTree® Europe Hedged Equity Fund | 6.71 | % | ||
PIMCO 0-5 Year High Yield Corporate Bond Index ETF | 6.56 | % | ||
SPDR® Barclays Short Term Corporate Bond ETF | 3.87 | % | ||
iShares® Barclays 1-3 Year Credit Bond ETF | 3.57 | % | ||
iShares® Core MSCI Emerging Markets ETF | 3.36 | % | ||
First Trust NASDAQ Technology Dividend Index Fund | 3.32 | % | ||
Schwab U.S. REIT ETF | 3.20 | % | ||
Top Ten Holdings | 68.60 | % |
| † | Holdings are subject to change. Table presents indicative values only. |
Portfolio Composition (as a % of Net Assets)
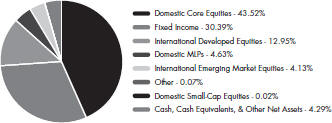
| 135 | October 31, 2014 |
| RiverFront Conservative Income Builder Fund | ||
| Statement of Investments | October 31, 2014 |
| Shares | Value (Note 2) | |||||
COMMON STOCKS (5.17%) | ||||||
Communications (1.18%) | ||||||
Telecommunications (1.18%) | ||||||
Verizon Communications, Inc. | 2,098 | $ | 105,425 | |||
|
| |||||
TOTAL COMMUNICATIONS | 105,425 | |||||
|
| |||||
Consumer, Cyclical (1.18%) | ||||||
Retail (1.18%) | ||||||
CVS Health Corp. | 661 | 56,720 | ||||
Dollar Tree, Inc.(a) | 799 | 48,396 | ||||
|
| |||||
| 105,116 | ||||||
|
| |||||
TOTAL CONSUMER, CYCLICAL | 105,116 | |||||
|
| |||||
Consumer, Non-Cyclical (1.32%) |
| |||||
Pharmaceuticals (1.32%) | ||||||
Abbott Laboratories | 1,584 | 69,047 | ||||
Bristol-Myers Squibb Co. | 849 | 49,403 | ||||
|
| |||||
| 118,450 | ||||||
|
| |||||
TOTAL CONSUMER, | 118,450 | |||||
|
| |||||
Energy (0.46%) | ||||||
Pipelines (0.46%) | ||||||
Kinder Morgan, Inc. | 1,064 | 41,177 | ||||
|
| |||||
TOTAL ENERGY | 41,177 | |||||
|
| |||||
Financials (0.58%) | ||||||
Diversified Financial | ||||||
Discover Financial Services | 813 | 51,853 | ||||
|
| |||||
TOTAL FINANCIALS | 51,853 | |||||
|
| |||||
Technology (0.45%) | ||||||
Software (0.45%) | ||||||
Oracle Corp. | 1,030 | 40,221 | ||||
|
| |||||
TOTAL TECHNOLOGY | 40,221 | |||||
|
| |||||
TOTAL COMMON STOCKS (Cost $421,979) | 462,242 | |||||
|
| |||||
EXCHANGE TRADED FUNDS (87.72%) |
| |||||
Debt (54.13%) | ||||||
iShares® Barclays 1-3 Year Credit Bond ETF | 10,769 | 1,135,807 | ||||
PIMCO 0-5 Year High Yield Corporate Bond Index ETF | 7,307 | 762,266 | ||||
RiverFront Strategic Income | 34,106 |
| 854,696 |
| ||
| Shares | Value (Note 2) | |||||||
Debt (continued) | ||||||||
SPDR® Barclays Short Term Corporate Bond ETF | 43,440 | $ | 1,335,780 | |||||
SPDR® Barclays Short Term High Yield Bond ETF | 25,043 | 750,038 | ||||||
|
| |||||||
| 4,838,587 | ||||||||
|
| |||||||
Equity (33.59%) | ||||||||
Consumer Staples Select Sector SPDR® Fund | 4,135 | 193,146 | ||||||
Deutsche X-trackers MSCI EAFE Hedged Equity ETF | 6,340 | 177,564 | ||||||
First Trust NASDAQ Technology Dividend Index Fund | 10,122 | 274,205 | ||||||
Global X MLP & Energy Infrastructure ETF | 7,438 | 145,190 | ||||||
Global X MSCI Norway ETF | 9,831 | 146,384 | ||||||
iShares® Core MSCI Emerging Markets ETF | 5,670 | 285,938 | ||||||
iShares® MSCI All Country Asia ex Japan ETF | 1,988 | 125,025 | ||||||
iShares® MSCI Australia ETF | 1,598 | 40,637 | ||||||
iShares® Transportation Average ETF | 501 | 78,507 | ||||||
PowerShares® KBW Bank Portfolio | 1,336 | 49,592 | ||||||
Schwab U.S. REIT ETF | 2,383 | 89,792 | ||||||
WisdomTree® Europe Hedged Equity Fund | 7,442 | 421,068 | ||||||
WisdomTree® Japan Hedged Equity Fund | 2,666 | 143,484 | ||||||
WisdomTree® Japan SmallCap Dividend Fund | 1,221 | 63,394 | ||||||
WisdomTree® LargeCap Dividend Fund | 10,572 | 769,113 | ||||||
|
| |||||||
| 3,003,039 | ||||||||
|
| |||||||
TOTAL EXCHANGE TRADED FUNDS (Cost $7,759,014) |
| 7,841,626 | ||||||
|
| |||||||
EXCHANGE TRADED NOTES (2.15%) |
| |||||||
Equity (2.15%) | ||||||||
Barclays ETN+ Select MLP ETNs | 2,973 | 93,441 | ||||||
Credit Suisse MLP Equal Weight Index ETN | 2,858 | 98,858 | ||||||
|
| |||||||
| 192,299 | ||||||||
|
| |||||||
TOTAL EXCHANGE TRADED NOTES (Cost $165,990) |
| 192,299 | ||||||
|
| |||||||
| 136 | October 31, 2014 |
| RiverFront Conservative Income Builder Fund | ||
| Statement of Investments | October 31, 2014 |
| 7-Day Yield | Shares | Value (Note 2) | ||||||
SHORT TERM INVESTMENTS (4.85%) |
| |||||||
Money Market Fund (4.85%) | ||||||||
Morgan Stanley Institutional Liquidity Fund - Prime Portfolio | 0.045% | 433,930 | $ | 433,930 | ||||
|
| |||||||
TOTAL SHORT TERM INVESTMENTS (Cost $ 433,930) | 433,930 | |||||||
|
| |||||||
TOTAL INVESTMENTS (99.89%) (Cost $ 8,780,913) | $ | 8,930,097 | ||||||
Other Assets In Excess Of | 9,776 | |||||||
|
| |||||||
NET ASSETS (100.00%) | $ | 8,939,873 | ||||||
|
| |||||||
| (a) | Non-Income Producing Security. |
| (b) | Affiliated Company. See Note 7 in Notes to Financial Statements. |
Common Abbreviations:
EAFE - Europe, Australia, and Far East.
ETF - Exchange Traded Fund.
ETN - Exchange Traded Note.
KBW- Keefe, Bruyette, & Woods.
MLP - Master Limited Partnership.
MSCI - Morgan Stanley Capital International.
NASDAQ- National Association of Securities Dealers
Automated Quotations.
PIMCO - Pacific Investment Management Company.
REIT - Real Estate Investment Trust.
SPDR - Standard and Poor’s Depositary Receipt.
For Fund compliance purposes, the Fund’s industry classifications refer to any one or more of the industry sub-classifications used by one or more widely recognized market indexes or ratings group indexes, and/or as defined by Fund management. This definition may not apply for purposes of this report, which may combine industry sub-classifications for reporting ease. Industries are shown as a percent of net assets.
See Notes to Financial Statements.
| 137 | October 31, 2014 |
| RiverFront Dynamic Equity Income Fund | ||
| Statement of Investments | October 31, 2014 | |
| Shares | Value (Note 2) | |||||||
| ||||||||
COMMON STOCKS (6.88%) |
| |||||||
Communications (1.30%) | ||||||||
Telecommunications (1.30%) |
| |||||||
Verizon Communications, Inc. | 17,721 | $ | 890,480 | |||||
|
| |||||||
TOTAL COMMUNICATIONS |
| 890,480 | ||||||
|
| |||||||
Consumer, Cyclical (1.78%) |
| |||||||
Retail (1.78%) | ||||||||
CVS Health Corp. | 7,084 | 607,878 | ||||||
Dollar Tree, Inc.(a) | 10,001 | 605,761 | ||||||
|
| |||||||
| 1,213,639 | ||||||||
|
| |||||||
TOTAL CONSUMER, CYCLICAL |
| 1,213,639 | ||||||
|
| |||||||
Consumer, Non-Cyclical (1.66%) |
| |||||||
Pharmaceuticals (1.66%) |
| |||||||
Abbott Laboratories | 12,174 | 530,664 | ||||||
Bristol-Myers Squibb Co. | 10,415 | 606,049 | ||||||
|
| |||||||
| 1,136,713 | ||||||||
|
| |||||||
TOTAL CONSUMER, |
| 1,136,713 | ||||||
|
| |||||||
Energy (0.73%) | ||||||||
Pipelines (0.73%) | ||||||||
Kinder Morgan, Inc. | 12,930 | 500,391 | ||||||
|
| |||||||
TOTAL ENERGY | 500,391 | |||||||
|
| |||||||
Financials (0.68%) | ||||||||
Diversified Financial Services (0.68%) | ||||||||
Discover Financial Services | 7,318 | 466,742 | ||||||
|
| |||||||
TOTAL FINANCIALS | 466,742 | |||||||
|
| |||||||
Technology (0.73%) | ||||||||
Software (0.73%) | ||||||||
Oracle Corp. | 12,840 | 501,402 | ||||||
|
| |||||||
TOTAL TECHNOLOGY | 501,402 | |||||||
|
| |||||||
TOTAL COMMON STOCKS (Cost $4,279,744) |
| 4,709,367 | ||||||
|
| |||||||
EXCHANGE TRADED FUNDS (87.93%) |
| |||||||
Debt (10.93%) | ||||||||
RiverFront Strategic Income Fund(b) | 142,382 | 3,568,093 | ||||||
| Shares | Value (Note 2) | |||||||
| ||||||||
Debt (continued) | ||||||||
SPDR® Barclays Short Term High Yield Bond ETF | 130,582 | $ | 3,910,931 | |||||
|
| |||||||
| 7,479,024 | ||||||||
|
| |||||||
Equity (77.00%) | ||||||||
Consumer Staples Select Sector SPDR® Fund | 30,080 | 1,405,037 | ||||||
Deutsche X-trackers MSCI EAFE Hedged Equity ETF | 75,422 | 2,112,344 | ||||||
First Trust NASDAQ Technology Dividend Index Fund | 35,507 | 961,885 | ||||||
FlexShares Quality Dividend Index Fund | 29,506 | 1,056,905 | ||||||
Global X FTSE Nordic Region ETF | 13,042 | 318,265 | ||||||
Global X MLP & Energy Infrastructure ETF | 95,680 | 1,867,674 | ||||||
Global X MSCI Norway ETF | 105,708 | 1,573,992 | ||||||
iShares® Asia 50 ETF | 20,427 | 984,377 | ||||||
iShares® Core MSCI Emerging Markets ETF | 79,235 | 3,995,821 | ||||||
iShares® Micro-Cap ETF | 9,267 | 685,665 | ||||||
iShares® MSCI All Country Asia ex Japan ETF | 44,156 | 2,776,971 | ||||||
iShares® MSCI Australia ETF | 56,465 | 1,435,905 | ||||||
iShares® MSCI Poland Capped ETF | 16,155 | 443,778 | ||||||
iShares® MSCI Spain Capped ETF | 16,632 | 629,022 | ||||||
iShares® Transportation Average ETF | 3,871 | 606,586 | ||||||
PowerShares® KBW Bank Portfolio | 23,224 | 862,075 | ||||||
Schwab U.S. REIT ETF | 41,477 | 1,562,853 | ||||||
Vanguard® Information Technology ETF | 8,207 | 837,032 | ||||||
WisdomTree® Europe Hedged Equity Fund | 144,749 | 8,189,898 | ||||||
WisdomTree® Japan Hedged Equity Fund | 52,665 | 2,834,430 | ||||||
WisdomTree® Japan SmallCap Dividend Fund | 12,014 | 623,767 | ||||||
WisdomTree® LargeCap Dividend Fund | 232,851 | 16,939,910 | ||||||
|
| |||||||
| 52,704,192 | ||||||||
|
| |||||||
TOTAL EXCHANGE TRADED FUNDS (Cost $56,859,673) |
| 60,183,216 | ||||||
|
| |||||||
EXCHANGE TRADED NOTES (2.48%) |
| |||||||
Equity (2.48%) | ||||||||
Barclays ETN+ Select MLP ETNs | 30,058 | 944,723 | ||||||
| 138 | October 31, 2014 |
| RiverFront Dynamic Equity Income Fund | ||
| Statement of Investments | October 31, 2014 | |
| Shares | Value (Note 2) | |||||||||
| ||||||||||
Equity (continued) | ||||||||||
Credit Suisse MLP Equal Weight Index ETN | 21,759 | $ | 752,644 | |||||||
|
| |||||||||
| 1,697,367 | ||||||||||
|
| |||||||||
TOTAL EXCHANGE TRADED NOTES (Cost $1,415,412) |
| 1,697,367 | ||||||||
|
| |||||||||
| 7-Day Yield | Shares | Value (Note 2) | ||||||||||
| ||||||||||||
SHORT TERM INVESTMENTS (2.70%) |
| |||||||||||
Money Market Fund (2.70%) |
| |||||||||||
Morgan Stanley Institutional Liquidity Fund - Prime Portfolio | 0.045 | % | 1,843,732 | 1,843,732 | ||||||||
|
| |||||||||||
TOTAL SHORT TERM INVESTMENTS (Cost $1,843,732) |
| 1,843,732 | ||||||||||
|
| |||||||||||
TOTAL INVESTMENTS (99.99%) (Cost $64,398,561) |
| $ | 68,433,682 | |||||||||
Other Assets In Excess Of |
| 7,858 | ||||||||||
|
| |||||||||||
NET ASSETS (100.00%) |
| $ | 68,441,540 | |||||||||
|
| |||||||||||
| (a) | Non-Income Producing Security. |
| (b) | Affiliated Company. See Note 7 in Notes to Financial Statements. |
Common Abbreviations:
EAFE - Europe, Australia, and Far East.
ETF - Exchange Traded Fund.
ETN - Exchange Traded Note.
FTSE - Financial Times and the London Stock Exchange.
KBW- Keefe, Bruyette, & Woods.
MLP - Master Limited Partnership.
MSCI - Morgan Stanley Capital International.
| NASDAQ | - National Association of Securities Dealers Automated Quotations. |
REIT - Real Estate Investment Trust.
SPDR - Standard and Poor’s Depositary Receipt.
For Fund compliance purposes, the Fund’s industry classifications refer to any one or more of the industry sub-classifications used by one or more widely recognized market indexes or ratings group indexes, and/or as defined by Fund management. This definition may not apply for purposes of this report, which may combine industry sub-classifications for reporting ease. Industries are shown as a percent of net assets.
See Notes to Financial Statements.
| 139 | October 31, 2014 |
| RiverFront Global Allocation Fund | ||
| Statement of Investments | October 31, 2014 |
| Shares | Value (Note 2) | |||||||
| ||||||||
COMMON STOCKS (8.21%) |
| |||||||
Communications (0.80%) |
| |||||||
Telecommunications (0.80%) | ||||||||
Verizon Communications, Inc. | 5,748 | $ | 288,837 | |||||
|
| |||||||
TOTAL COMMUNICATIONS | 288,837 | |||||||
|
| |||||||
Consumer, Cyclical (3.81%) | ||||||||
Distribution/Wholesale (1.55%) | ||||||||
Fossil Group, Inc.(a) | 2,759 | 280,480 | ||||||
LKQ Corp.(a) | 9,769 | 279,100 | ||||||
|
| |||||||
| 559,580 | ||||||||
|
| |||||||
Retail (2.26%) | ||||||||
CVS Health Corp. | 3,258 | 279,569 | ||||||
Dollar Tree, Inc.(a) | 5,409 | 327,623 | ||||||
Urban Outfitters, Inc.(a) | 6,767 | 205,446 | ||||||
|
| |||||||
| 812,638 | ||||||||
|
| |||||||
TOTAL CONSUMER, CYCLICAL | 1,372,218 | |||||||
|
| |||||||
Consumer, Non-Cyclical (2.34%) |
| |||||||
Pharmaceuticals (2.34%) | ||||||||
Abbott Laboratories | 5,651 | 246,327 | ||||||
Bristol-Myers Squibb Co. | 5,285 | 307,534 | ||||||
Omnicare, Inc. | 4,360 | 290,333 | ||||||
|
| |||||||
| 844,194 | ||||||||
|
| |||||||
TOTAL CONSUMER, NON-CYCLICAL |
| 844,194 | ||||||
|
| |||||||
Financials (0.57%) | ||||||||
Diversified Financial | ||||||||
Discover Financial Services | 3,213 | 204,925 | ||||||
|
| |||||||
TOTAL FINANCIALS | 204,925 | |||||||
|
| |||||||
Technology (0.69%) | ||||||||
Software (0.69%) | ||||||||
Oracle Corp. | 6,337 | 247,460 | ||||||
|
| |||||||
TOTAL TECHNOLOGY | 247,460 | |||||||
|
| |||||||
TOTAL COMMON STOCKS (Cost $2,671,380) | 2,957,634 | |||||||
|
| |||||||
| Shares | Value (Note 2) | |||||||
| ||||||||
EXCHANGE TRADED FUNDS (87.46%) |
| |||||||
Debt (1.31%) | ||||||||
RiverFront Strategic Income Fund(b) | 18,764 | $ | 470,226 | |||||
|
| |||||||
Equity (86.15%) | ||||||||
Deutsche X-trackers MSCI EAFE Hedged Equity ETF | 39,242 | 1,099,051 | ||||||
Financial Select Sector SPDR® Fund | 35,439 | 844,866 | ||||||
First Trust NASDAQ Technology Dividend Index Fund | 51,944 | 1,407,163 | ||||||
First Trust NYSE Arca Biotechnology Index Fund(a) | 4,172 | 414,947 | ||||||
FlexShares Quality Dividend Index Fund | 25,361 | 908,431 | ||||||
Global X FTSE Nordic Region ETF | 7,111 | 173,530 | ||||||
Global X MLP & Energy Infrastructure ETF | 32,463 | 633,678 | ||||||
Global X MSCI Norway ETF | 58,922 | 877,349 | ||||||
iShares® Asia 50 ETF | 10,754 | 518,235 | ||||||
iShares® Core MSCI Emerging Markets ETF | 40,283 | 2,031,472 | ||||||
iShares® Core S&P 500® ETF | 9,917 | 2,013,052 | ||||||
iShares® Core S&P® SmallCap ETF | 6,572 | 732,844 | ||||||
iShares® Micro-Cap ETF | 19,946 | 1,475,805 | ||||||
iShares® MSCI All Country Asia ex Japan ETF | 32,196 | 2,024,806 | ||||||
iShares® MSCI Australia ETF | 29,953 | 761,705 | ||||||
iShares® MSCI EAFE ETF | 7,618 | 487,171 | ||||||
iShares® MSCI Japan Index ETF | 25,515 | 307,711 | ||||||
iShares® MSCI Poland Capped ETF | 8,550 | 234,869 | ||||||
iShares® MSCI Spain Capped ETF | 10,143 | 383,608 | ||||||
iShares® MSCI Switzerland Capped ETF | 11,105 | 359,469 | ||||||
iShares® MSCI United Kingdom ETF | 14,007 | 266,273 | ||||||
iShares® Transportation Average ETF | 2,399 | 375,923 | ||||||
iShares® U.S. Consumer Goods ETF | 5,103 | 521,067 | ||||||
iShares® U.S. Home Construction ETF | 15,256 | 367,212 | ||||||
PowerShares® KBW Bank Portfolio | 13,665 | 507,245 | ||||||
Schwab U.S. REIT ETF | 10,055 | 378,872 | ||||||
Vanguard® FTSE® Developed Markets ETF | 34,081 | 1,349,948 | ||||||
Vanguard® Large-Cap ETF | 10,142 | 939,149 | ||||||
WisdomTree® Europe Hedged Equity Fund | 83,856 | 4,744,573 | ||||||
| 140 | October 31, 2014 |
| RiverFront Global Allocation Fund | ||
| Statement of Investments | October 31, 2014 |
| Shares | Value (Note 2) | |||||||
| ||||||||
Equity (continued) | ||||||||
WisdomTree® Japan Hedged Equity Fund | 33,427 | $ | 1,799,041 | |||||
WisdomTree® Japan SmallCap Dividend Fund | 6,326 | 328,446 | ||||||
WisdomTree® LargeCap Dividend Fund | 24,319 | 1,769,207 | ||||||
|
| |||||||
| 31,036,718 | ||||||||
|
| |||||||
TOTAL EXCHANGE TRADED FUNDS (Cost $29,629,535) |
| 31,506,944 | ||||||
|
| |||||||
EXCHANGE TRADED NOTES (2.40%) |
| |||||||
Equity (2.40%) | ||||||||
Barclays ETN+ Select MLP ETNs | 12,929 | 406,358 | ||||||
Credit Suisse MLP Equal Weight Index ETN | 13,281 | 459,390 | ||||||
|
| |||||||
| 865,748 | ||||||||
|
| |||||||
TOTAL EXCHANGE TRADED NOTES (Cost $823,700) |
| 865,748 | ||||||
|
| |||||||
| 7-Day Yield | Shares | Value (Note 2) | ||||||||||
| ||||||||||||
SHORT TERM INVESTMENTS (2.49%) |
| |||||||||||
Money Market Fund (2.49%) |
| |||||||||||
Morgan Stanley Institutional Liquidity Fund - Prime Portfolio | 0.045 | % | 897,808 | 897,808 | ||||||||
|
| |||||||||||
TOTAL SHORT TERM INVESTMENTS (Cost $897,808) |
| 897,808 | ||||||||||
|
| |||||||||||
TOTAL INVESTMENTS (100.56%) (Cost $34,022,423) |
| $ | 36,228,134 | |||||||||
Liabilities In Excess Of |
| (203,358 | ) | |||||||||
|
| |||||||||||
NET ASSETS (100.00%) |
| $ | 36,024,776 | |||||||||
|
| |||||||||||
| (a) | Non-Income Producing Security. |
| (b) | Affiliated Company. See Note 7 in Notes to Financial Statements. |
Common Abbreviations:
EAFE - Europe, Australia, and Far East.
ETN - Exchange Traded Note.
ETF - Exchange Traded Fund.
FTSE - Financial Times and the London Stock Exchange.
KBW - Keefe, Bruyette, & Woods.
MLP - Master Limited Partnership.
MSCI - Morgan Stanley Capital International.
| NASDAQ | - National Association of Securities Dealers Automated Quotations. |
NYSE - New York Stock Exchange.
REIT - Real Estate Investment Trust.
S&P - Standard and Poor’s.
SPDR - Standard and Poor’s Depositary Receipt.
For Fund compliance purposes, the Fund’s industry classifications refer to any one or more of the industry sub-classifications used by one or more widely recognized market indexes or ratings group indexes, and/or as defined by Fund management. This definition may not apply for purposes of this report, which may combine industry sub-classifications for reporting ease. Industries are shown as a percent of net assets.
See Notes to Financial Statements.
| 141 | October 31, 2014 |
| RiverFront Global Growth Fund | ||
| Statement of Investments | October 31, 2014 |
| Shares | Value (Note 2) | |||||||
COMMON STOCKS (9.25%) |
| |||||||
Communications (0.84%) | ||||||||
Telecommunications (0.84%) |
| |||||||
Verizon Communications, Inc. | 12,284 | $ | 617,271 | |||||
|
| |||||||
TOTAL COMMUNICATIONS | 617,271 | |||||||
|
| |||||||
Consumer, Cyclical (4.22%) |
| |||||||
Distribution/Wholesale (1.71%) |
| |||||||
Fossil Group, Inc.(a) | 6,053 | 615,348 | ||||||
LKQ Corp.(a) | 22,427 | 640,739 | ||||||
|
| |||||||
| 1,256,087 | ||||||||
|
| |||||||
Retail (2.51%) | ||||||||
CVS Health Corp. | 8,075 | 692,916 | ||||||
Dollar Tree, Inc.(a) | 11,295 | 684,138 | ||||||
Urban Outfitters, Inc.(a) | 15,608 | 473,859 | ||||||
|
| |||||||
| 1,850,913 | ||||||||
|
| |||||||
TOTAL CONSUMER, CYCLICAL |
| 3,107,000 | ||||||
|
| |||||||
Consumer, Non-Cyclical (2.72%) |
| |||||||
Pharmaceuticals (2.72%) |
| |||||||
Abbott Laboratories | 13,711 | 597,663 | ||||||
Bristol-Myers Squibb Co. | 12,193 | 709,511 | ||||||
Omnicare, Inc. | 10,482 | 697,996 | ||||||
|
| |||||||
| 2,005,170 | ||||||||
|
| |||||||
TOTAL CONSUMER, | 2,005,170 | |||||||
|
| |||||||
Financials (0.68%) | ||||||||
Diversified Financial |
| |||||||
Discover Financial Services | 7,848 | 500,545 | ||||||
|
| |||||||
TOTAL FINANCIALS | 500,545 | |||||||
|
| |||||||
Technology (0.79%) | ||||||||
Software (0.79%) | ||||||||
Oracle Corp. | 14,884 | 581,220 | ||||||
|
| |||||||
TOTAL TECHNOLOGY | 581,220 | |||||||
|
| |||||||
TOTAL COMMON STOCKS (Cost $6,100,530) | 6,811,206 | |||||||
|
| |||||||
EXCHANGE TRADED |
| |||||||
Equity (88.05%) | ||||||||
Deutsche X-trackers MSCI EAFE Hedged Equity ETF | 81,099 | 2,271,340 | ||||||
Financial Select Sector SPDR® Fund | 33,412 | 796,542 | ||||||
| Shares | Value (Note 2) | |||||||
Equity (continued) | ||||||||
First Trust NASDAQ Technology Dividend Index Fund | 101,289 | $ | 2,743,919 | |||||
First Trust NYSE Arca Biotechnology Index Fund(a) | 9,645 | 959,292 | ||||||
FlexShares Quality Dividend Index Fund | 33,020 | 1,182,776 | ||||||
Global X FTSE Nordic Region ETF | 14,658 | 357,701 | ||||||
Global X MLP & Energy Infrastructure ETF | 78,596 | 1,534,194 | ||||||
Global X MSCI Norway ETF | 118,022 | 1,757,348 | ||||||
iShares® Asia 50 ETF | 22,519 | 1,085,191 | ||||||
iShares® Core MSCI Emerging Markets ETF | 57,083 | 2,878,696 | ||||||
iShares® Core S&P® SmallCap ETF | 13,571 | 1,513,302 | ||||||
iShares® Micro-Cap ETF | 50,429 | 3,731,242 | ||||||
iShares® MSCI All Country Asia ex Japan ETF | 84,775 | 5,331,500 | ||||||
iShares® MSCI Australia ETF | 62,454 | 1,588,205 | ||||||
iShares® MSCI Japan Index ETF | 66,737 | 804,848 | ||||||
iShares® MSCI Pacific ex Japan ETF | 15,408 | 748,829 | ||||||
iShares® MSCI Poland Capped ETF | 18,152 | 498,635 | ||||||
iShares® MSCI Spain Capped ETF | 18,190 | 687,946 | ||||||
iShares® MSCI Switzerland Capped ETF | 22,673 | 733,925 | ||||||
iShares® MSCI United Kingdom ETF | 27,146 | 516,045 | ||||||
iShares® Transportation Average ETF | 4,963 | 777,702 | ||||||
iShares® U.S. Consumer Goods ETF | 8,652 | 883,456 | ||||||
iShares® U.S. Home Construction ETF | 42,293 | 1,017,992 | ||||||
PowerShares® FTSE RAFI Emerging Markets Portfolio | 54,753 | 1,107,653 | ||||||
PowerShares® KBW Bank Portfolio | 40,835 | 1,515,795 | ||||||
PowerShares® S&P 500® High Beta Port ETF | 51,900 | 1,765,119 | ||||||
Schwab U.S. REIT ETF | 33,500 | 1,262,280 | ||||||
Vanguard® FTSE® Developed Markets ETF | 74,996 | 2,970,591 | ||||||
Vanguard® Information Technology ETF | 5,942 | 606,025 | ||||||
WisdomTree® Europe Hedged Equity Fund | 219,784 | 12,435,379 | ||||||
WisdomTree® Japan Hedged Equity Fund | 80,472 | 4,331,003 | ||||||
WisdomTree® Japan SmallCap Dividend Fund | 13,004 | 675,168 | ||||||
| 142 | October 31, 2014 |
| RiverFront Global Growth Fund | ||
| Statement of Investments | October 31, 2014 |
| Shares | Value (Note 2) | |||||
Equity (continued) | ||||||
WisdomTree® LargeCap Dividend Fund | 51,535 | $ | 3,749,171 | |||
|
| |||||
| 64,818,810 | ||||||
|
| |||||
TOTAL EXCHANGE TRADED FUNDS (Cost $60,049,852) | 64,818,810 | |||||
|
| |||||
EXCHANGE TRADED NOTES (2.69%) | ||||||
Equity (2.69%) | ||||||
Barclays ETN+ Select MLP ETNs | 27,346 | 859,485 | ||||
Credit Suisse MLP Equal Weight Index ETN | 32,473 | 1,123,241 | ||||
|
| |||||
| 1,982,726 | ||||||
|
| |||||
TOTAL EXCHANGE TRADED NOTES (Cost $1,897,262) | 1,982,726 | |||||
|
| |||||
TOTAL INVESTMENTS (99.99%) (Cost $68,047,644) | $ | 73,612,742 | ||||
Other Assets In Excess Of | 5,648 | |||||
|
| |||||
NET ASSETS (100.00%) | $ | 73,618,390 | ||||
|
| |||||
| (a) | Non-Income Producing Security. |
Common Abbreviations:
EAFE - Europe, Australia, and Far East.
ETN - Exchange Traded Note.
ETF - Exchange Traded Fund.
FTSE - Financial Times and the London Stock Exchange.
KBW- Keefe, Bruyette, & Woods.
MLP - Master Limited Partnership.
MSCI - Morgan Stanley Capital International.
| NASDAQ | - National Association of Securities Dealers Automated Quotations. |
NYSE - New York Stock Exchange.
RAFI - Research Affiliates Fundamental Index.
REIT - Real Estate Investment Trust.
S&P - Standard and Poor’s.
SPDR - Standard and Poor’s Depositary Receipt.
For Fund compliance purposes, the Fund’s industry classifications refer to any one or more of the industry sub-classifications used by one or more widely recognized market indexes or ratings group indexes, and/or as defined by Fund management. This definition may not apply for purposes of this report, which may combine industry sub-classifications for reporting ease. Industries are shown as a percent of net assets.
See Notes to Financial Statements.
| 143 | October 31, 2014 |
| RiverFront Moderate Growth & Income Fund | ||
| Statement of Investments | October 31, 2014 | |
| Shares | Value (Note 2) | |||||||
COMMON STOCKS (6.77%) | ||||||||
Communications (1.34%) | ||||||||
Telecommunications (1.34%) |
| |||||||
Verizon Communications, Inc. | 36,301 | $ | 1,824,125 | |||||
|
| |||||||
TOTAL COMMUNICATIONS |
| 1,824,125 | ||||||
|
| |||||||
Consumer, Cyclical (1.59%) |
| |||||||
Retail (1.59%) | ||||||||
CVS Health Corp. | 14,371 | 1,233,176 | ||||||
Dollar Tree, Inc.(a) | 15,218 | 921,754 | ||||||
|
| |||||||
| 2,154,930 | ||||||||
|
| |||||||
TOTAL CONSUMER, CYCLICAL |
| 2,154,930 | ||||||
|
| |||||||
Consumer, Non-Cyclical (1.69%) |
| |||||||
Pharmaceuticals (1.69%) |
| |||||||
Abbott Laboratories | 24,928 | 1,086,612 | ||||||
Bristol-Myers Squibb Co. | 20,917 | 1,217,160 | ||||||
|
| |||||||
| 2,303,772 | ||||||||
|
| |||||||
TOTAL CONSUMER, | 2,303,772 | |||||||
|
| |||||||
Energy (0.72%) | ||||||||
Pipelines (0.72%) | ||||||||
Kinder Morgan, Inc. | 25,349 | 981,006 | ||||||
|
| |||||||
TOTAL ENERGY | 981,006 | |||||||
|
| |||||||
Financials (0.71%) | ||||||||
Diversified Financial Services (0.71%) | ||||||||
Discover Financial Services | 15,212 | 970,221 | ||||||
|
| |||||||
TOTAL FINANCIALS | 970,221 | |||||||
|
| |||||||
Technology (0.72%) | ||||||||
Software (0.72%) | ||||||||
Oracle Corp. | 25,148 | 982,030 | ||||||
|
| |||||||
TOTAL TECHNOLOGY | 982,030 | |||||||
|
| |||||||
TOTAL COMMON STOCKS (Cost $8,263,622) | 9,216,084 | |||||||
|
| |||||||
EXCHANGE TRADED FUNDS (88.92%) |
| |||||||
Debt (30.46%) | ||||||||
iShares® Barclays 1-3 Year Credit Bond ETF | 46,136 | 4,865,964 | ||||||
PIMCO 0-5 Year High Yield Corporate Bond Index ETF | 85,653 | 8,935,321 | ||||||
| Shares | Value (Note 2) | |||||||
Debt (continued) | ||||||||
RiverFront Strategic Income Fund(b) | 489,954 | $ | 12,278,247 | |||||
SPDR® Barclays Short Term Corporate Bond ETF | 171,455 | 5,272,241 | ||||||
SPDR® Barclays Short Term High Yield Bond ETF | 337,827 | 10,117,919 | ||||||
|
| |||||||
| 41,469,692 | ||||||||
|
| |||||||
Equity (58.46%) | ||||||||
Consumer Staples Select Sector SPDR® Fund | 87,824 | 4,102,259 | ||||||
Deutsche X-trackers MSCI EAFE Hedged Equity ETF | 99,924 | 2,798,572 | ||||||
First Trust NASDAQ Technology Dividend Index Fund | 166,735 | 4,516,851 | ||||||
FlexShares Quality Dividend Index Fund | 106,874 | 3,828,227 | ||||||
Global X MLP & Energy Infrastructure ETF | 154,598 | 3,017,753 | ||||||
Global X MSCI Norway ETF | 154,809 | 2,305,106 | ||||||
iShares® Core MSCI Emerging Markets ETF | 90,582 | 4,568,050 | ||||||
iShares® MSCI All Country Asia ex Japan ETF | 31,567 | 1,985,249 | ||||||
iShares® MSCI Australia ETF | 68,363 | 1,738,471 | ||||||
iShares® MSCI Spain Capped ETF | 33,887 | 1,281,606 | ||||||
iShares® Transportation Average ETF | 9,222 | 1,445,087 | ||||||
PowerShares® KBW Bank Portfolio | 30,928 | 1,148,047 | ||||||
Schwab U.S. REIT ETF | 115,568 | 4,354,602 | ||||||
WisdomTree® Europe Hedged Equity Fund | 161,423 | 9,133,313 | ||||||
WisdomTree® Japan Hedged Equity Fund | 56,192 | 3,024,254 | ||||||
WisdomTree® Japan SmallCap Dividend Fund | 18,926 | 982,638 | ||||||
WisdomTree® LargeCap Dividend Fund | 403,377 | 29,345,677 | ||||||
|
| |||||||
| 79,575,762 | ||||||||
|
| |||||||
TOTAL EXCHANGE TRADED FUNDS (Cost $115,819,828) | 121,045,454 | |||||||
|
| |||||||
EXCHANGE TRADED NOTES (3.60%) | ||||||||
Equity (3.60%) | ||||||||
Barclays ETN+ Select MLP ETNs | 107,016 | 3,363,513 | ||||||
| 144 | October 31, 2014 |
| RiverFront Moderate Growth & Income Fund | ||
| Statement of Investments | October 31, 2014 |
| Shares | Value (Note 2) | |||||||
Equity (continued) | ||||||||
Credit Suisse MLP Equal Weight Index ETN | 44,476 | $ | 1,538,424 | |||||
|
| |||||||
| 4,901,937 | ||||||||
|
| |||||||
TOTAL EXCHANGE TRADED NOTES (Cost $4,027,156) | 4,901,937 | |||||||
|
| |||||||
| 7-Day Yield | Shares | Value (Note 2) | ||||||
SHORT TERM INVESTMENTS (0.80%) | ||||||||
Money Market Fund (0.80%) | ||||||||
Morgan Stanley Institutional Liquidity Fund - Prime Portfolio | 0.045% | 1,084,172 | 1,084,172 | |||||
|
| |||||||
TOTAL SHORT TERM INVESTMENTS (Cost $1,084,172) | 1,084,172 | |||||||
|
| |||||||
TOTAL INVESTMENTS (100.09%) (Cost $129,194,778) | $ | 136,247,647 | ||||||
Liabilities In Excess Of Other | (123,140 | ) | ||||||
|
| |||||||
NET ASSETS (100.00%) | $ | 136,124,507 | ||||||
|
| |||||||
| (a) | Non-Income Producing Security. |
| (b) | Affiliated Company. See Note 7 in Notes to Financial Statements. |
Common Abbreviations:
EAFE - Europe, Australia, and Far East.
ETF - Exchange Traded Fund.
ETN - Exchange Traded Note.
KBW - Keefe, Bruyette, & Woods.
MLP - Master Limited Partnership.
MSCI - Morgan Stanley Capital International.
NASDAQ- National Association of Securities Dealers Automated Quotations.
PIMCO - Pacific Investment Management Company.
REIT - Real Estate Investment Trust.
SPDR - Standard and Poor’s Depositary Receipt.
For Fund compliance purposes, the Fund’s industry classifications refer to any one or more of the industry sub-classifications used by one or more widely recognized market indexes or ratings group indexes, and/or as defined by Fund management. This definition may not apply for purposes of this report, which may combine industry sub-classifications for reporting ease. Industries are shown as a percent of net assets.
See Notes to Financial Statements.
| 145 | October 31, 2014 |
| RiverFront Global Allocation Series | ||
| Statements of Assets and Liabilities | October 31, 2014 |
RiverFront Fund | RiverFront Income Fund | RiverFront Fund | RiverFront Fund | RiverFront & Income Fund | ||||||||||||||||
| ||||||||||||||||||||
ASSETS | ||||||||||||||||||||
Investments, at value | $ | 8,075,401 | $ | 64,865,589 | $ | 35,757,908 | $ | 73,612,742 | $ | 123,969,400 | ||||||||||
Investments in affiliates, at value | 854,696 | 3,568,093 | 470,226 | – | 12,278,247 | |||||||||||||||
Receivable for shares sold | 115 | 53,232 | 20,570 | 81,242 | 13,926 | |||||||||||||||
Dividends and interest receivable | 4,930 | 23,889 | 7,248 | 16,632 | 79,044 | |||||||||||||||
Receivable due from advisor | 873 | – | – | – | – | |||||||||||||||
Prepaid expenses and other assets | 27,374 | 27,439 | 26,069 | 38,715 | 29,909 | |||||||||||||||
| ||||||||||||||||||||
Total Assets | 8,963,389 | 68,538,242 | 36,282,021 | 73,749,331 | 136,370,526 | |||||||||||||||
| ||||||||||||||||||||
LIABILITIES | ||||||||||||||||||||
Payable for shares redeemed | 725 | 1,001 | 201,950 | 11,028 | 58,699 | |||||||||||||||
Investment advisory fees payable | – | 34,478 | 16,278 | 36,427 | 79,111 | |||||||||||||||
Administration and transfer agency fees payable | 936 | 7,509 | 4,311 | 8,144 | 14,491 | |||||||||||||||
Distribution and services fees payable | 4,305 | 28,358 | 13,818 | 14,519 | 61,038 | |||||||||||||||
Trustees’ fees and expenses payable | 53 | 482 | 253 | 544 | 968 | |||||||||||||||
Professional fees payable | 16,109 | 16,659 | 16,377 | 16,760 | 17,832 | |||||||||||||||
Custody fees payable | 535 | 1,254 | 649 | 925 | 1,332 | |||||||||||||||
Printing fees payable | 452 | 4,428 | 2,777 | 4,640 | 10,129 | |||||||||||||||
Overdraft payable | – | – | – | 36,470 | – | |||||||||||||||
Accrued expenses and other liabilities | 401 | 2,533 | 832 | 1,484 | 2,419 | |||||||||||||||
| ||||||||||||||||||||
Total Liabilities | 23,516 | 96,702 | 257,245 | 130,941 | 246,019 | |||||||||||||||
| ||||||||||||||||||||
NET ASSETS | $ | 8,939,873 | $ | 68,441,540 | $ | 36,024,776 | $ | 73,618,390 | $ | 136,124,507 | ||||||||||
| ||||||||||||||||||||
NET ASSETS CONSIST OF | ||||||||||||||||||||
Paid-in capital | $ | 8,577,962 | $ | 61,967,379 | $ | 31,175,194 | $ | 60,887,446 | $ | 121,703,936 | ||||||||||
Accumulated net investment income | 1,621 | 14,068 | 166,583 | 424,637 | 49,688 | |||||||||||||||
Accumulated net realized gain on investments | 211,106 | 2,424,972 | 2,477,288 | 6,741,209 | 7,318,014 | |||||||||||||||
Net unrealized appreciation in value on investments | 149,184 | 4,035,121 | 2,205,711 | 5,565,098 | 7,052,869 | |||||||||||||||
| ||||||||||||||||||||
NET ASSETS | $ | 8,939,873 | $ | 68,441,540 | $ | 36,024,776 | $ | 73,618,390 | $ | 136,124,507 | ||||||||||
| ||||||||||||||||||||
INVESTMENTS, AT COST | $ | 7,924,475 | $ | 60,828,296 | $ | 33,557,559 | $ | 68,047,644 | $ | 116,902,952 | ||||||||||
| ||||||||||||||||||||
INVESTMENTS IN AFFILIATES, ATCOST | $ | 856,438 | $ | 3,570,265 | $ | 464,864 | $ | – | $ | 12,291,826 | ||||||||||
| ||||||||||||||||||||
See Notes to Financial Statements.
| 146 | October 31, 2014 |
| RiverFront Global Allocation Series | ||
| Statements of Assets and Liabilities (continued) | October 31, 2014 |
RiverFront Fund | RiverFront Income Fund | RiverFront Fund | RiverFront Fund | RiverFront Fund | ||||||||||||||||
| ||||||||||||||||||||
PRICING OF SHARES | ||||||||||||||||||||
Class A: | ||||||||||||||||||||
Net Asset Value, offering and redemption price per share(a) | $ | 10.86 | $ | 13.10 | $ | 13.14 | $ | 15.44 | $ | 12.15 | ||||||||||
Net Assets | $ | 1,088,931 | $ | 17,274,622 | $ | 8,371,593 | $ | 16,693,550 | $ | 27,598,252 | ||||||||||
Shares of beneficial interest outstanding (unlimited number of shares, no par value common stock authorized) | 100,229 | 1,318,173 | 637,255 | 1,081,260 | 2,271,791 | |||||||||||||||
Maximum offering price per share ((NAV/0.9450), based on maximum sales charge of 5.50% of the offering price) | $ | 11.49 | $ | 13.86 | $ | 13.90 | $ | 16.34 | $ | 12.86 | ||||||||||
Class C: | ||||||||||||||||||||
Net Asset Value, offering and redemption price per share(a) | $ | 10.81 | $ | 12.97 | $ | 12.95 | $ | 15.19 | $ | 12.10 | ||||||||||
Net Assets | $ | 5,021,383 | $ | 30,170,221 | $ | 14,758,147 | $ | 11,419,809 | $ | 66,444,839 | ||||||||||
Shares of beneficial interest outstanding (unlimited number of shares, no par value common stock authorized) | 464,704 | 2,325,705 | 1,139,684 | 751,975 | 5,491,765 | |||||||||||||||
Class I: | ||||||||||||||||||||
Net Asset Value, offering and redemption price per share | $ | 10.70 | $ | 13.02 | $ | 12.92 | $ | 15.52 | $ | 12.14 | ||||||||||
Net Assets | $ | 2,829,559 | $ | 20,996,697 | $ | 12,895,036 | $ | 13,342,933 | $ | 42,081,416 | ||||||||||
Shares of beneficial interest outstanding (unlimited number of shares, no par value common stock authorized) | 264,532 | 1,612,949 | 997,880 | 859,824 | 3,467,278 | |||||||||||||||
Class L: | ||||||||||||||||||||
Net Asset Value, offering and redemption price per share | N/A | N/A | N/A | $ | 15.49 | N/A | ||||||||||||||
Net Assets | N/A | N/A | N/A | $ | 24,399,822 | N/A | ||||||||||||||
Shares of beneficial interest outstanding (unlimited number of shares, no par value common stock authorized) | N/A | N/A | N/A | 1,575,224 | N/A | |||||||||||||||
Investor Class: | ||||||||||||||||||||
Net Asset Value, offering and redemption price per share | N/A | N/A | N/A | $ | 15.37 | N/A | ||||||||||||||
Net Assets | N/A | N/A | N/A | $ | 7,762,276 | N/A | ||||||||||||||
Shares of beneficial interest outstanding (unlimited number of shares, no par value common stock authorized) | N/A | N/A | N/A | 505,125 | N/A | |||||||||||||||
| (a) | Redemption price per share may be reduced for any applicable contingent deferred sales charge. For a description of a possible sales charge, please see the Fund’s Prospectus. |
See Notes to Financial Statements.
| 147 | October 31, 2014 |
| RiverFront Global Allocation Series | ||
| Statements of Operations |
RiverFront Conservative Income Builder Fund | RiverFront Dynamic Equity Income Fund | |||||||||||||||
| For the Fiscal Period Ended October 31, 2014(a) | For the Year Ended April 30, 2014 | For the Fiscal Period Ended October 31, 2014(a) | For the Year Ended April 30, 2014 | |||||||||||||
INVESTMENT INCOME | ||||||||||||||||
Dividends | $ | 77,834 | $ | 113,718 | $ | 763,819 | $ | 1,094,541 | ||||||||
Dividends from affiliated securities | 10,210 | 4,863 | 54,010 | 40,524 | ||||||||||||
Other income | – | – | – | 90 | ||||||||||||
Total Investment Income | 88,044 | 118,581 | 817,829 | 1,135,155 | ||||||||||||
EXPENSES | ||||||||||||||||
Investment advisory fees | 31,969 | 41,738 | 279,637 | 383,400 | ||||||||||||
Administrative and transfer agency fees | 5,549 | 7,108 | 37,976 | 52,970 | ||||||||||||
Distribution and service fees | ||||||||||||||||
Class A | 1,374 | 2,038 | 20,908 | 25,783 | ||||||||||||
Class C | 22,844 | 27,598 | 146,001 | 202,348 | ||||||||||||
Professional fees | 15,115 | 16,263 | 16,144 | 18,266 | ||||||||||||
Reports to shareholders and printing fees | 567 | 741 | 4,796 | 6,796 | ||||||||||||
State registration fees | 19,144 | 33,646 | 22,762 | 40,684 | ||||||||||||
Insurance fees | 45 | 52 | 404 | 722 | ||||||||||||
Custody fees | 2,697 | 9,102 | 4,811 | 10,391 | ||||||||||||
Trustees’ fees and expenses | 111 | 197 | 992 | 1,772 | ||||||||||||
Offering costs | – | 19,356 | – | – | ||||||||||||
Miscellaneous expenses | 5,121 | 4,647 | 9,375 | 14,934 | ||||||||||||
Total Expenses | 104,536 | 162,486 | 543,806 | 758,066 | ||||||||||||
Less fees waived/reimbursed by investment advisor (Note 8) | ||||||||||||||||
Class A | (6,814) | (14,608) | (20,436) | (28,302) | ||||||||||||
Class C | (28,317) | (50,536) | (35,936) | (55,724) | ||||||||||||
Class I | (11,336) | (23,541) | (24,440) | (39,925) | ||||||||||||
Net Expenses | 58,069 | 73,801 | 462,994 | 634,115 | ||||||||||||
Net Investment Income | 29,975 | 44,780 | 354,835 | 501,040 | ||||||||||||
Net realized gain on investments | 110,437 | 173,828 | 495,747 | 2,992,680 | ||||||||||||
Net realized loss on investments - affiliated securities | (42 | ) | (270 | ) | (2,968 | ) | – | |||||||||
Net realized gain distributions from other investment companies | – | 1,636 | – | 14,904 | ||||||||||||
Net change in unrealized appreciation/(depreciation) on investments | (67,675) | 107,775 | 59,792 | 1,272,714 | ||||||||||||
NET REALIZED AND UNREALIZED GAIN ON INVESTMENTS | 42,720 | 282,969 | 552,571 | 4,280,298 | ||||||||||||
NET INCREASE IN NET ASSETS RESULTING FROM OPERATIONS | $ | 72,695 | $ | 327,749 | $ | 907,406 | $ | 4,781,338 | ||||||||
| (a) | Effective May 1, 2014, the Board approved changing the fiscal year-end of the Funds from April 30 to October 31. |
See Notes to Financial Statements.
| 148 | October 31, 2014 |
| RiverFront Global Allocation Series | ||
| Statements of Operations |
| RiverFront Global Allocation Fund | RiverFront Global Growth Fund | |||||||||||||||
| For the Fiscal Period Ended October 31, 2014(a) | For the Year Ended April 30, 2014 | For the Fiscal Period Ended October 31, 2014(a) | For the Year Ended April 30, 2014 | |||||||||||||
INVESTMENT INCOME | ||||||||||||||||
Dividends | $ | 386,747 | $ | 546,861 | $ | 854,233 | $ | 1,261,108 | ||||||||
Dividends from affiliated securities | 25,735 | 24,674 | – | – | ||||||||||||
Other income | – | 31 | – | 131 | ||||||||||||
Total Investment Income | 412,482 | 571,566 | 854,233 | 1,261,239 | ||||||||||||
EXPENSES | ||||||||||||||||
Investment advisory fees | 151,293 | 247,136 | 321,490 | 539,339 | ||||||||||||
Administrative and transfer agency fees | 21,387 | 34,995 | 43,279 | 73,797 | ||||||||||||
Distribution and service fees | ||||||||||||||||
Class A | 10,971 | 21,599 | 22,033 | 28,226 | ||||||||||||
Class C | 74,736 | 117,660 | 59,131 | 90,588 | ||||||||||||
Investor Class | – | – | 10,293 | 21,787 | ||||||||||||
Professional fees | 15,614 | 17,654 | 16,313 | 19,073 | ||||||||||||
Reports to shareholders and printing fees | 2,922 | 4,334 | 4,907 | 8,756 | ||||||||||||
State registration fees | 22,265 | 38,316 | 28,623 | 61,742 | ||||||||||||
Insurance fees | 263 | 472 | 588 | 1,104 | ||||||||||||
Custody fees | 2,459 | 9,499 | 4,441 | 8,928 | ||||||||||||
Trustees’ fees and expenses | 499 | 1,133 | 1,084 | 2,432 | ||||||||||||
Miscellaneous expenses | 6,605 | 11,931 | 8,557 | 17,128 | ||||||||||||
Total Expenses | 309,014 | 504,729 | 520,739 | 872,900 | ||||||||||||
Less fees waived/reimbursed by investment advisor (Note 8) | ||||||||||||||||
Class A | (15,480) | (31,141) | (20,676) | (28,381) | ||||||||||||
Class C | (26,510) | (41,816) | (13,878) | (22,962) | ||||||||||||
Class I | (21,125) | (30,843) | (15,078) | (27,339) | ||||||||||||
Class L | – | – | (29,599) | (60,282) | ||||||||||||
Investor Class | – | – | (9,650) | (22,272) | ||||||||||||
Net Expenses | 245,899 | 400,929 | 431,858 | 711,664 | ||||||||||||
Net Investment Income | 166,583 | 170,637 | 422,375 | 549,575 | ||||||||||||
Net realized gain on investments | 1,047,052 | 2,148,570 | 3,579,076 | 6,157,817 | ||||||||||||
Net realized loss on investments - affiliated securities | (14,540) | – | – | – | ||||||||||||
Net realized gain distributions from other investment companies | – | 9,169 | – | 24,369 | ||||||||||||
Net change in unrealized appreciation/(depreciation) on investments | (814,242) | 958,395 | (3,270,391) | 1,314,672 | ||||||||||||
NET REALIZED AND UNREALIZED GAIN ON INVESTMENTS | 218,270 | 3,116,134 | 308,685 | 7,496,858 | ||||||||||||
NET INCREASE IN NET ASSETS RESULTING FROM OPERATIONS | $ | 384,853 | $ | 3,286,771 | $ | 731,060 | $ | 8,046,433 | ||||||||
| (a) | Effective May 1, 2014, the Board approved changing the fiscal year-end of the Funds from April 30 to October 31. |
See Notes to Financial Statements.
| 149 | October 31, 2014 |
| RiverFront Global Allocation Series | ||
| Statements of Operations |
| RiverFront Moderate Growth & Income Fund | ||||||||
| For the Fiscal Year Ended October 31, 2014(a) | For the Year Ended April 30, 2014 | |||||||
INVESTMENT INCOME | ||||||||
Dividends | $ | 1,661,985 | $ | 2,941,388 | ||||
Dividends from affiliated securities | 171,796 | 106,997 | ||||||
Other income | – | 222 | ||||||
Total Investment Income | 1,833,781 | 3,048,607 | ||||||
EXPENSES | ||||||||
Investment advisory fees | 582,225 | 1,039,286 | ||||||
Administrative and transfer agency fees | 76,901 | 140,563 | ||||||
Distribution and service fees | ||||||||
Class A | 38,074 | 77,669 | ||||||
Class C | 329,365 | 576,494 | ||||||
Professional fees | 17,848 | 22,209 | ||||||
Reports to shareholders and printing fees | 9,551 | 17,655 | ||||||
State registration fees | 24,446 | 42,681 | ||||||
Insurance fees | 1,157 | 2,125 | ||||||
Custody fees | 5,045 | 12,232 | ||||||
Trustees’ fees and expenses | 1,929 | 4,703 | ||||||
Miscellaneous expenses | 10,985 | 23,015 | ||||||
Total Expenses | 1,097,526 | 1,958,632 | ||||||
Less fees waived/reimbursed by investment advisor (Note 8) | ||||||||
Class A | (25,024) | (52,042) | ||||||
Class C | (54,689) | (96,176) | ||||||
Class I | (33,901) | (55,830) | ||||||
Net Expenses | 983,912 | 1,754,584 | ||||||
Net Investment Income | 849,869 | 1,294,023 | ||||||
Net realized gain on investments | 3,635,670 | 7,624,458 | ||||||
Net realized gain distributions from other investment companies | – | 33,187 | ||||||
Net change in unrealized appreciation/(depreciation) on investments | (1,889,311) | 1,671,672 | ||||||
NET REALIZED AND UNREALIZED GAIN ON INVESTMENTS | 1,746,359 | 9,329,317 | ||||||
NET INCREASE IN NET ASSETS RESULTING FROM OPERATIONS | $ | 2,596,228 | $ | 10,623,340 | ||||
| (a) | Effective May 1, 2014, the Board approved changing the fiscal year-end of the Funds from April 30 to October 31. |
See Notes to Financial Statements.
| 150 | October 31, 2014 |
| RiverFront Conservative Income Builder Fund | ||
| Statements of Changes in Net Assets |
| For the Fiscal Period Ended October 31, 2014(a) | For the Year Ended April 30, 2014 | For the Period September 4, 2012 (Commencement) to April 30, 2013 | ||||||||||
OPERATIONS | ||||||||||||
Net investment income | $ | 29,975 | $ | 44,780 | $ | 15,227 | ||||||
Net realized gain on investments | 110,437 | 173,828 | 16,667 | |||||||||
Net realized loss on investments - affiliated securities | (42) | (270) | – | |||||||||
Net realized gain distributions from other investment companies | – | 1,636 | – | |||||||||
Net change in unrealized appreciation/(depreciation) on investments | (67,675) | 107,775 | 109,084 | |||||||||
Net Increase in Net Assets Resulting from Operations | 72,695 | 327,749 | 140,978 | |||||||||
DISTRIBUTIONS | ||||||||||||
Dividends to shareholders from net investment income | ||||||||||||
Class A | (7,517) | (7,713) | (895) | |||||||||
Class C | (14,233) | (26,587) | (3,477) | |||||||||
Class I | (13,957) | (11,868) | (12,108) | |||||||||
Dividends to shareholders from net realized gains | ||||||||||||
Class A | – | (16,067) | – | |||||||||
Class C | – | (47,172) | – | |||||||||
Class I | – | (27,911) | – | |||||||||
Net Decrease in Net Assets from Distributions | (35,707) | (137,318) | (16,480) | |||||||||
BENEFICIAL INTEREST TRANSACTIONS (NOTE 6) | ||||||||||||
Shares sold | ||||||||||||
Class A | 224,208 | 546,840 | 590,998 | |||||||||
Class C | 1,216,347 | 2,524,709 | 2,176,853 | |||||||||
Class I | 1,817,467 | 1,927,846 | 745,479 | |||||||||
Dividends reinvested | ||||||||||||
Class A | 3,697 | 8,715 | 475 | |||||||||
Class C | 12,819 | 68,221 | 2,582 | |||||||||
Class I | 13,270 | 39,779 | 12,108 | |||||||||
Shares redeemed | ||||||||||||
Class A | (244,851) | (92,120) | – | |||||||||
Class C | (336,045) | (825,324) | (6,853) | |||||||||
Class I | (392,394) | (1,387,092) | (59,778) | |||||||||
Net Increase in Net Assets Derived from Beneficial Interest Transactions | 2,314,518 | 2,811,574 | 3,461,864 | |||||||||
Net increase in net assets | 2,351,506 | 3,002,005 | 3,586,362 | |||||||||
NET ASSETS | ||||||||||||
Beginning of year | 6,588,367 | 3,586,362 | – | |||||||||
End of year * | $ | 8,939,873 | $ | 6,588,367 | $ | 3,586,362 | ||||||
*Including accumulated net investment | $ | 1,621 | $ | 7,353 | $ | 8,505 | ||||||
| (a) | Effective May 1, 2014, the Board approved changing the fiscal year-end of the Funds from April 30 to October 31. |
See Notes to Financial Statements.
| 151 | October 31, 2014 |
| RiverFront Dynamic Equity Income Fund | ||
| Statements of Changes in Net Assets |
| For the Fiscal Period Ended October 31, 2014(a) | For the Year Ended April 30, 2014 | For the Year Ended April 30, 2013 | ||||||||||
OPERATIONS | ||||||||||||
Net investment income | $ | 354,835 | $ | 501,040 | $ | 531,046 | ||||||
Net realized gain on investments | 495,747 | 2,992,680 | 1,802,700 | |||||||||
Net realized loss on investments - affiliated securities | (2,968) | – | – | |||||||||
Net realized gain distributions from other investment companies | – | 14,904 | – | |||||||||
Net change in unrealized appreciation on investments | 59,792 | 1,272,714 | 764,280 | |||||||||
Net Increase in Net Assets Resulting from Operations | 907,406 | 4,781,338 | 3,098,026 | |||||||||
DISTRIBUTIONS | ||||||||||||
Dividends to shareholders from net investment income | ||||||||||||
Class A | (111,022) | (135,855) | (140,732) | |||||||||
Class C | (86,202) | (134,304) | (192,727) | |||||||||
Class I | (158,721) | (236,905) | (177,578) | |||||||||
Dividends to shareholders from net realized gains | ||||||||||||
Class A | – | (365,030) | – | |||||||||
Class C | – | (742,929) | – | |||||||||
Class I | – | (549,797) | – | |||||||||
Net Decrease in Net Assets from Distributions | (355,945) | (2,164,820) | (511,037) | |||||||||
BENEFICIAL INTEREST TRANSACTIONS (NOTE 6) | ||||||||||||
Shares sold | ||||||||||||
Class A | 3,938,297 | 7,646,945 | 3,202,766 | |||||||||
Class C | 7,076,964 | 10,756,383 | 4,609,418 | |||||||||
Class I | 3,502,112 | 9,923,982 | 5,250,086 | |||||||||
Dividends reinvested | ||||||||||||
Class A | 102,697 | 464,335 | 129,832 | |||||||||
Class C | 79,328 | 824,340 | 180,549 | |||||||||
Class I | 138,648 | 679,588 | 159,280 | |||||||||
Shares redeemed | ||||||||||||
Class A | (2,263,648) | (1,433,618) | (2,936,263) | |||||||||
Class C | (3,022,626) | (3,025,374) | (3,724,460) | |||||||||
Class I | (1,075,996) | (3,656,006) | (2,581,492) | |||||||||
Net Increase in Net Assets Derived from Beneficial Interest Transactions | 8,475,776 | 22,180,575 | 4,289,716 | |||||||||
Net increase in net assets | 9,027,237 | 24,797,093 | 6,876,705 | |||||||||
NET ASSETS | ||||||||||||
Beginning of year | 59,414,303 | 34,617,210 | 27,740,505 | |||||||||
End of year * | $ | 68,441,540 | $ | 59,414,303 | $ | 34,617,210 | ||||||
*Including accumulated net investment income of: | $ | 14,068 | $ | 15,178 | $ | 21,202 | ||||||
| (a) | Effective May 1, 2014, the Board approved changing the fiscal year-end of the Funds from April 30 to October 31. |
See Notes to Financial Statements.
| 152 | October 31, 2014 |
| RiverFront Global Allocation Fund | ||
| Statements of Changes in Net Assets |
| For the Fiscal Period Ended October 31, 2014(a) | For the Year Ended April 30, 2014 | For the Year Ended April 30, 2013 | ||||||||||
OPERATIONS | ||||||||||||
Net investment income | $ | 166,583 | $ | 170,637 | $ | 213,148 | ||||||
Net realized gain on investments | 1,047,052 | 2,148,570 | 1,215,328 | |||||||||
Net realized loss on investments - affiliated securities | (14,540) | – | – | |||||||||
Net realized gain distributions from other investment companies | – | 9,169 | – | |||||||||
Net change in unrealized appreciation/(depreciation) on investments | (814,242) | 958,395 | 803,271 | |||||||||
Net Increase in Net Assets Resulting from Operations | 384,853 | 3,286,771 | 2,231,747 | |||||||||
DISTRIBUTIONS | ||||||||||||
Dividends to shareholders from net investment income | ||||||||||||
Class A | – | (60,721) | (97,608) | |||||||||
Class C | – | (29,814) | (82,166) | |||||||||
Class I | – | (77,225) | (70,616) | |||||||||
Dividends to shareholders from net realized gains | ||||||||||||
Class A | – | (225,948) | – | |||||||||
Class C | – | (315,722) | – | |||||||||
Class I | – | (241,798) | – | |||||||||
Net Decrease in Net Assets from Distributions | – | (951,228) | (250,390) | |||||||||
BENEFICIAL INTEREST TRANSACTIONS (NOTE 6) | ||||||||||||
Shares sold | ||||||||||||
Class A | 704,281 | 1,828,903 | 3,042,104 | |||||||||
Class C | 1,706,825 | 5,733,154 | 2,492,791 | |||||||||
Class I | 3,218,570 | 4,414,127 | 4,368,510 | |||||||||
Dividends reinvested | ||||||||||||
Class A | – | 278,213 | 89,657 | |||||||||
Class C | – | 333,197 | 76,038 | |||||||||
Class I | – | 312,410 | 68,350 | |||||||||
Shares redeemed | ||||||||||||
Class A | (1,557,221) | (1,969,635) | (1,396,094) | |||||||||
Class C | (1,700,105) | (2,060,625) | (3,584,254) | |||||||||
Class I | (975,931) | (1,566,346) | (1,712,016) | |||||||||
Net Increase in Net Assets Derived from Beneficial Interest Transactions | 1,396,419 | 7,303,398 | 3,445,086 | |||||||||
Net increase in net assets | 1,781,272 | 9,638,941 | 5,426,443 | |||||||||
NET ASSETS | ||||||||||||
Beginning of year | 34,243,504 | 24,604,563 | 19,178,120 | |||||||||
End of year * | $ | 36,024,776 | $ | 34,243,504 | $ | 24,604,563 | ||||||
*Including accumulated net investment income/(loss) of: | $ | 166,583 | $ | – | $ | (19,166) | ||||||
| (a) | Effective May 1, 2014, the Board approved changing the fiscal year-end of the Funds from April 30 to October 31. |
See Notes to Financial Statements.
| 153 | October 31, 2014 |
| RiverFront Global Growth Fund | ||
| Statements of Changes in Net Assets |
| For the Fiscal Period Ended October 31, 2014(a) | For the Year Ended April 30, 2014 | For the Year Ended April 30, 2013 | ||||||||||
OPERATIONS | ||||||||||||
Net investment income | $ | 422,375 | $ | 549,575 | $ | 679,592 | ||||||
Net realized gain on investments | 3,579,076 | 6,157,817 | 4,550,863 | |||||||||
Net realized gain distributions from other investment companies | – | 24,369 | – | |||||||||
Net change in unrealized appreciation/(depreciation) on investments | (3,270,391) | 1,314,672 | 1,032,501 | |||||||||
Net Increase in Net Assets Resulting from Operations | 731,060 | 8,046,433 | 6,262,956 | |||||||||
DISTRIBUTIONS | ||||||||||||
Dividends to shareholders from net investment income | ||||||||||||
Class A | – | (87,390) | (116,274) | |||||||||
Class C | – | (28,977) | (75,361) | |||||||||
Class I | – | (101,824) | (79,598) | |||||||||
Class L | – | (216,395) | (390,061) | |||||||||
Investor Class | – | (65,366) | (141,444) | |||||||||
Dividends to shareholders from net realized gains | ||||||||||||
Class A | – | (1,086,883) | – | |||||||||
Class C | – | (878,168) | – | |||||||||
Class I | – | (1,050,842) | – | |||||||||
Class L | – | (2,201,623) | – | |||||||||
Investor Class | – | (797,894) | – | |||||||||
Net Decrease in Net Assets from Distributions | – | (6,515,362) | (802,738) | |||||||||
BENEFICIAL INTEREST TRANSACTIONS (NOTE 6) | ||||||||||||
Shares sold | ||||||||||||
Class A | 4,307,345 | 10,986,353 | 6,220,932 | |||||||||
Class C | 1,088,318 | 5,045,220 | 2,331,909 | |||||||||
Class I | 2,214,171 | 4,759,222 | 3,837,874 | |||||||||
Class L | 1,420,447 | 3,180,517 | 2,863,936 | |||||||||
Investor Class | 66,568 | 270,199 | 228,451 | |||||||||
Dividends reinvested | ||||||||||||
Class A | – | 1,095,779 | 110,123 | |||||||||
Class C | – | 892,977 | 73,619 | |||||||||
Class I | – | 1,130,451 | 76,336 | |||||||||
Class L | – | 2,347,791 | 375,201 | |||||||||
Investor Class | – | 782,525 | 120,142 | |||||||||
Shares redeemed | ||||||||||||
Class A | (4,115,225) | (4,352,368) | (3,873,219) | |||||||||
Class C | (1,282,840) | (1,765,523) | (2,747,755) | |||||||||
Class I | (852,301) | (2,075,170) | (2,778,845) | |||||||||
Class L | (2,447,309) | (4,553,986) | (6,924,206) | |||||||||
Investor Class | (760,465) | (2,130,007) | (2,240,520) | |||||||||
Net Increase/(Decrease) in Net Assets Derived from Beneficial Interest Transactions | (361,291) | 15,613,980 | (2,326,022) | |||||||||
Net increase in net assets | 369,769 | 17,145,051 | 3,134,196 | |||||||||
NET ASSETS | ||||||||||||
Beginning of year | 73,248,621 | 56,103,570 | 52,969,374 | |||||||||
End of year * | $ | 73,618,390 | $ | 73,248,621 | $ | 56,103,570 | ||||||
| ||||||||||||
*Including accumulated net investment income/(loss) of: | $ | 424,637 | $ | 2,262 | $ | (47,361) | ||||||
| (a) | Effective May 1, 2014, the Board approved changing the fiscal year-end of the Funds from April 30 to October 31. |
See Notes to Financial Statements.
| 154 | October 31, 2014 |
| RiverFront Moderate Growth & Income Fund | ||
| Statements of Changes in Net Assets | ||
| For the Fiscal Period Ended October 31, 2014(a) | For the Year Ended April 30, 2014 | For the Year Ended April 30, 2013 | ||||||||||||
OPERATIONS | ||||||||||||||
Net investment income | $ | 849,869 | $ | 1,294,023 | $ | 1,590,843 | ||||||||
Net realized gain on investments | 3,635,670 | 7,624,458 | 3,679,508 | |||||||||||
Net realized gain distributions from other investment companies | – | 33,187 | – | |||||||||||
Net change in unrealized appreciation/(depreciation) on investments | (1,889,311) | 1,671,672 | 2,504,601 | |||||||||||
Net Increase in Net Assets Resulting from Operations | 2,596,228 | 10,623,340 | 7,774,952 | |||||||||||
DISTRIBUTIONS | ||||||||||||||
Dividends to shareholders from net investment income | ||||||||||||||
Class A | (220,828) | (416,464) | (490,109) | |||||||||||
Class C | (267,118) | (361,379) | (586,750) | |||||||||||
Class I | (373,018) | (539,349) | (434,898) | |||||||||||
Dividends to shareholders from net realized gains | ||||||||||||||
Class A | – | (1,461,687) | – | |||||||||||
Class C | – | (2,693,789) | – | |||||||||||
Class I | – | (1,636,155) | – | |||||||||||
Net Decrease in Net Assets from Distributions | (860,964) | (7,108,823) | (1,511,757) | |||||||||||
BENEFICIAL INTEREST TRANSACTIONS (NOTE 6) | ||||||||||||||
Shares sold | ||||||||||||||
Class A | 4,201,326 | 11,020,034 | 11,313,240 | |||||||||||
Class C | 7,712,589 | 18,772,301 | 18,703,383 | |||||||||||
Class I | 6,525,980 | 16,516,197 | 20,012,679 | |||||||||||
Dividends reinvested | ||||||||||||||
Class A | 187,752 | 1,531,756 | 440,510 | |||||||||||
Class C | 220,912 | 2,692,375 | 482,949 | |||||||||||
Class I | 325,977 | 2,004,990 | 392,082 | |||||||||||
Shares redeemed | ||||||||||||||
Class A | (8,283,862) | (11,453,882) | (5,157,175) | |||||||||||
Class C | (5,318,273) | (12,685,999) | (8,693,372) | |||||||||||
Class I | (3,079,334) | (7,559,841) | (8,863,522) | |||||||||||
Net Increase in Net Assets Derived from Beneficial Interest Transactions | 2,493,067 | 20,837,931 | 28,630,774 | |||||||||||
Net increase in net assets | 4,228,331 | 24,352,448 | 34,893,969 | |||||||||||
NET ASSETS | ||||||||||||||
Beginning of year | 131,896,176 | 107,543,728 | 72,649,759 | |||||||||||
End of year * | $ | 136,124,507 | $ | 131,896,176 | $ | 107,543,728 | ||||||||
| ||||||||||||||
*Including accumulated net investment income of: | $ | 49,688 | $ | 60,631 | $ | 83,800 | ||||||||
| (a) | Effective May 1, 2014, the Board approved changing the fiscal year-end of the Funds from April 30 to October 31. |
See Notes to Financial Statements.
| 155 | October 31, 2014 |
| RiverFront Conservative Income Builder Fund – Class A | ||
| Financial Highlights | ||
Selected data for a share of beneficial interest outstanding throughout the periods indicated:
| For the Fiscal Period Ended October 31, 2014(a) | For the Year Ended April 30, 2014 | For the Period September 4, 2012 (Commencement) to April 30, 2013 | ||||
Net asset value, beginning of period | $10.83 | $10.48 | $10.00 | |||
INCOME FROM INVESTMENT OPERATIONS: | ||||||
Net investment income(b) | 0.07 | 0.13 | 0.09 | |||
Net realized and unrealized gain | 0.04 | 0.53 | 0.48 | |||
Total from investment operations | 0.11 | 0.66 | 0.57 | |||
DISTRIBUTIONS: | ||||||
From net investment income | (0.08) | (0.12) | (0.09) | |||
From net realized gains | – | (0.19) | – | |||
Total distributions | (0.08) | (0.31) | (0.09) | |||
Net increase in net asset value | 0.03 | 0.35 | 0.48 | |||
Net asset value, end of year | $10.86 | $10.83 | $10.48 | |||
| ||||||
TOTAL RETURN(c) | 0.98% | 6.35% | 5.72% | |||
RATIOS/SUPPLEMENTAL DATA: | ||||||
Net assets, end of year (000s) | $1,089 | $1,101 | $607 | |||
Ratio of expenses to average net assets excluding fee waivers and reimbursements | 2.39%(d) | 2.94% | 5.65%(d)(e) | |||
Ratio of expenses to average net assets including fee waivers and reimbursements | 1.15%(d) | 1.15% | 1.15%(d)(e) | |||
Ratio of net investment income to average net assets | 1.22%(d) | 1.27% | 1.37%(d)(e) | |||
Portfolio turnover rate(f) | 34% | 125% | 73% | |||
| (a) | Effective May 1, 2014, the Board approved changing the fiscal year-end of the Funds from April 30 to October 31. |
| (b) | Calculated using the average shares method. |
| (c) | Total returns are for the period indicated and have not been annualized. Total returns would have been lower had certain expenses not been waived during the period. Returns shown do not reflect the deduction of taxes that a shareholder would pay on Fund distributions or the redemption of Fund shares. Returns shown exclude any applicable sales charges. |
| (d) | Annualized. |
| (e) | Expense ratios before reductions for startup periods may not be representative of longer term operating periods. |
| (f) | Portfolio turnover rate for periods less than one full year have not been annualized. |
See Notes to Financial Statements.
| 156 | October 31, 2014 |
| RiverFront Conservative Income Builder Fund – Class C | ||
| Financial Highlights |
Selected data for a share of beneficial interest outstanding throughout the periods indicated:
| For the Fiscal Period Ended October 31, 2014(a) | For the Year Ended April 30, 2014 | For the Period September 4, 2012 (Commencement) to April 30, 2013 | ||||
Net asset value, beginning of period | $10.77 | $10.51 | $10.00 | |||
INCOME FROM INVESTMENT OPERATIONS: | ||||||
Net investment income(b) | 0.03 | 0.06 | 0.06 | |||
Net realized and unrealized gain | 0.04 | 0.51 | 0.47 | |||
Total from investment operations | 0.07 | 0.57 | 0.53 | |||
DISTRIBUTIONS: | ||||||
From net investment income | (0.03) | (0.12) | (0.02) | |||
From net realized gains | – | (0.19) | – | |||
Total distributions | (0.03) | (0.31) | (0.02) | |||
Net increase in net asset value | 0.04 | 0.26 | 0.51 | |||
Net asset value, end of year | $10.81 | $10.77 | $10.51 | |||
| ||||||
TOTAL RETURN(c) | 0.68% | 5.49% | 5.29% | |||
RATIOS/SUPPLEMENTAL DATA: | ||||||
Net assets, end of year (000s) | $5,021 | $4,106 | $2,264 | |||
Ratio of expenses to average net assets excluding fee waivers and reimbursements | 3.14%(d) | 3.73% | 6.53%(d)(e) | |||
Ratio of expenses to average net assets including fee waivers and reimbursements | 1.90%(d) | 1.90% | 1.90%(d)(e) | |||
Ratio of net investment income to average net assets | 0.47%(d) | 0.53% | 0.90%(d)(e) | |||
Portfolio turnover rate(f) | 34% | 125% | 73% | |||
| (a) | Effective May 1, 2014, the Board approved changing the fiscal year-end of the Funds from April 30 to October 31. |
| (b) | Calculated using the average shares method. |
| (c) | Total returns are for the period indicated and have not been annualized. Total returns would have been lower had certain expenses not been waived during the period. Returns shown do not reflect the deduction of taxes that a shareholder would pay on Fund distributions or the redemption of Fund shares. Returns shown exclude any applicable sales charges. |
| (d) | Annualized. |
| (e) | Expense ratios before reductions for startup periods may not be representative of longer term operating periods. |
| (f) | Portfolio turnover rate for periods less than one full year have not been annualized. |
See Notes to Financial Statements.
| 157 | October 31, 2014 |
| RiverFront Conservative Income Builder Fund – Class I | ||
| Financial Highlights | ||
Selected data for a share of beneficial interest outstanding throughout the periods indicated:
For the Fiscal Period Ended October 31, 2014(a) | For the Year Ended April 30, 2014 | For the Period | ||||||||||
Net asset value, beginning of period | $10.66 | $10.29 | $10.00 | |||||||||
INCOME FROM INVESTMENT OPERATIONS: | ||||||||||||
Net investment income(b) | 0.07 | 0.15 | 0.12 | |||||||||
Net realized and unrealized gain | 0.06 | 0.51 | 0.46 | |||||||||
Total from investment operations | 0.13 | 0.66 | 0.58 | |||||||||
DISTRIBUTIONS: | ||||||||||||
From net investment income | (0.09) | (0.10) | (0.29) | |||||||||
From net realized gains | – | (0.19) | – | |||||||||
Total distributions | (0.09) | (0.29) | (0.29) | |||||||||
Net increase in net asset value | 0.04 | 0.37 | 0.29 | |||||||||
Net asset value, end of year | $10.70 | $10.66 | $10.29 | |||||||||
TOTAL RETURN(c) | 1.19% | 6.53% | 5.95% | |||||||||
RATIOS/SUPPLEMENTAL DATA: | ||||||||||||
Net assets, end of year (000s) | $2,830 | $1,381 | $715 | |||||||||
Ratio of expenses to average net assets excluding fee waivers and reimbursements | 2.12%(d) | 2.66% | 7.74%(d)(e) | |||||||||
Ratio of expenses to average net assets including fee waivers and reimbursements | 0.90%(d) | 0.90% | 0.90%(d)(e) | |||||||||
Ratio of net investment income to average net assets | 1.34%(d) | 1.49% | 1.84%(d)(e) | |||||||||
Portfolio turnover rate(f) | 34% | 125% | 73% | |||||||||
| (a) | Effective May 1, 2014, the Board approved changing the fiscal year-end of the Funds from April 30 to October 31. |
| (b) | Calculated using the average shares method. |
| (c) | Total returns are for the period indicated and have not been annualized. Total returns would have been lower had certain expenses not been waived during the period. Returns shown do not reflect the deduction of taxes that a shareholder would pay on Fund distributions or the redemption of Fund shares. |
| (d) | Annualized. |
| (e) | Expense ratios before reductions for startup periods may not be representative of longer term operating periods. |
| (f) | Portfolio turnover rate for periods less than one full year have not been annualized. |
See Notes to Financial Statements.
| 158 | October 31, 2014 |
| RiverFront Dynamic Equity Income Fund – Class A | ||
| Financial Highlights | ||
Selected data for a share of beneficial interest outstanding throughout the periods indicated:
| For the Fiscal Period Ended October 31, 2014(a) | For the Year Ended April 30, 2014 | For the Year Ended April 30, 2013 | For the Year Ended April 30, 2012(b) | For the Period August 2, 2010 (Inception) to April 30, 2011 | ||||||
Net asset value, beginning of period | $12.97 | $12.24 | $11.24 | $11.73 | $10.00 | |||||
INCOME/(LOSS) FROM INVESTMENT OPERATIONS: | ||||||||||
Net investment income(c) | 0.09 | 0.17 | 0.25 | 0.16 | 0.12 | |||||
Net realized and unrealized gain/(loss) | 0.13 | 1.17 | 0.99 | (0.49) | 1.67 | |||||
Total from investment operations | 0.22 | 1.34 | 1.24 | (0.33) | 1.79 | |||||
DISTRIBUTIONS: | ||||||||||
From net investment income | (0.09) | (0.17) | (0.24) | (0.15) | (0.06) | |||||
From net realized gains | – | (0.44) | – | – | (0.00)(d) | |||||
Tax return of capital | – | – | – | (0.01) | (0.00)(d) | |||||
Total distributions | (0.09) | (0.61) | (0.24) | (0.16) | (0.06) | |||||
Net increase/(decrease) in net asset value | 0.13 | 0.73 | 1.00 | (0.49) | 1.73 | |||||
Net asset value, end of year | $13.10 | $12.97 | $12.24 | $11.24 | $11.73 | |||||
TOTAL RETURN(e) | 1.66% | 11.15% | 11.22% | (2.80)% | 17.99% | |||||
RATIOS/SUPPLEMENTAL DATA: | ||||||||||
Net assets, end of period (000s) | $17,275 | $15,374 | $8,087 | $7,114 | $5,723 | |||||
Ratio of expenses to average net assets excluding fee waivers and reimbursements | 1.39%(f) | 1.42% | 1.58% | 1.73% | 2.17%(f) | |||||
Ratio of expenses to average net assets including fee waivers and reimbursements | 1.15%(f) | 1.15% | 1.20%(g) | 1.30% | 1.30%(f) | |||||
Ratio of net investment income to average net assets | 1.33%(f) | 1.38% | 2.17% | 1.50% | 1.48%(f) | |||||
Portfolio turnover rate(h) | 45% | 99% | 136% | 133% | 66% | |||||
| (a) | Effective May 1, 2014, the Board approved changing the fiscal year-end of the Funds from April 30 to October 31. |
| (b) | Prior to January 1, 2012, the RiverFront Dynamic Equity Income Fund was known as the RiverFront Long-Term Growth & Income Fund. |
| (c) | Calculated using the average shares method. |
| (d) | Less than ($0.005) per share. |
| (e) | Total returns are for the period indicated and have not been annualized. Total returns would have been lower had certain expenses not been waived during the period. Returns shown do not reflect the deduction of taxes that a shareholder would pay on Fund distributions or the redemption of Fund shares. Returns shown exclude any applicable sales charges. |
| (f) | Annualized. |
| (g) | Contractual expense limitation change from 1.30% to 1.15% effective September 1, 2012. |
| (h) | Portfolio turnover rate for periods less than one full year have not been annualized. |
See Notes to Financial Statements.
| 159 | October 31, 2014 |
| RiverFront Dynamic Equity Income Fund – Class C | ||
| Financial Highlights | ||
Selected data for a share of beneficial interest outstanding throughout the periods indicated:
| For the Fiscal Period Ended October 31, 2014(a) | For the Year Ended April 30, 2014 | For the Year Ended April 30, 2013 | For the Year Ended April 30, 2012(b) | For the Period August 2, 2010 (Inception) to April 30, 2011 | ||||||
Net asset value, beginning of period | $12.84 | $12.13 | $11.14 | $11.67 | $10.00 | |||||
INCOME/(LOSS) FROM INVESTMENT OPERATIONS: | ||||||||||
Net investment income(c) | 0.04 | 0.08 | 0.16 | 0.09 | 0.05 | |||||
Net realized and unrealized gain/(loss) | 0.13 | 1.15 | 0.98 | (0.51) | 1.67 | |||||
Total from investment operations | 0.17 | 1.23 | 1.14 | (0.42) | 1.72 | |||||
DISTRIBUTIONS: | ||||||||||
From net investment income | (0.04) | (0.08) | (0.15) | (0.10) | (0.05) | |||||
From net realized gains | – | (0.44) | – | – | (0.00)(d) | |||||
Tax return of capital | – | – | – | (0.01) | (0.00)(d) | |||||
Total distributions | (0.04) | (0.52) | (0.15) | (0.11) | (0.05) | |||||
Net increase/(decrease) in net asset value | 0.13 | 0.71 | 0.99 | (0.53) | 1.67 | |||||
Net asset value, end of year | $12.97 | $12.84 | $12.13 | $11.14 | $11.67 | |||||
TOTAL RETURN(e) | 1.30% | 10.34% | 10.41% | (3.60)% | 17.32% | |||||
RATIOS/SUPPLEMENTAL DATA: | ||||||||||
Net assets, end of period (000s) | $30,170 | $25,787 | $16,070 | $13,729 | $9,223 | |||||
Ratio of expenses to average net assets excluding fee waivers and reimbursements | 2.15%(f) | 2.18% | 2.33% | 2.49% | 3.10%(f) | |||||
Ratio of expenses to average net assets including fee waivers and reimbursements | 1.90%(f) | 1.90% | 1.95%(g) | 2.05% | 2.05%(f) | |||||
Ratio of net investment income to average net assets | 0.60%(f) | 0.61% | 1.44% | 0.84% | 0.65%(f) | |||||
Portfolio turnover rate(h) | 45% | 99% | 136% | 133% | 66% | |||||
| (a) | Effective May 1, 2014, the Board approved changing the fiscal year-end of the Funds from April 30 to October 31. |
| (b) | Prior to January 1, 2012, the RiverFront Dynamic Equity Income Fund was known as the RiverFront Long-Term Growth & Income Fund. |
| (c) | Calculated using the average shares method. |
| (d) | Less than ($0.005) per share. |
| (e) | Total returns are for the period indicated and have not been annualized. Total returns would have been lower had certain expenses not been waived during the period. Returns shown do not reflect the deduction of taxes that a shareholder would pay on Fund distributions or the redemption of Fund shares. Returns shown exclude any applicable sales charges. |
| (f) | Annualized. |
| (g) | Contractual expense limitation change from 2.05% to 1.90% effective September 1, 2012. |
| (h) | Portfolio turnover rate for periods less than one full year have not been annualized. |
See Notes to Financial Statements.
| 160 | October 31, 2014 |
| RiverFront Dynamic Equity Income Fund – Class I | ||
| Financial Highlights | ||
Selected data for a share of beneficial interest outstanding throughout the periods indicated:
| For the Fiscal Period Ended October 31, 2014(a) | For the Year Ended April 30, 2014 | For the Year Ended April 30, 2013 | For the Year Ended April 30, 2012(b) | For the Period August 2, 2010 (Inception) to April 30, 2011 | ||||||
Net asset value, beginning of period | $12.88 | $12.16 | $11.17 | $11.64 | $10.00 | |||||
INCOME/(LOSS) FROM INVESTMENT OPERATIONS: | ||||||||||
Net investment income(c) | 0.10 | 0.20 | 0.27 | 0.20 | 0.12 | |||||
Net realized and unrealized gain/(loss) | 0.14 | 1.16 | 0.99 | (0.50) | 1.68 | |||||
Total from investment operations | 0.24 | 1.36 | 1.26 | (0.30) | 1.80 | |||||
DISTRIBUTIONS: | ||||||||||
From net investment income | (0.10) | (0.20) | (0.27) | (0.16) | (0.15) | |||||
From net realized gains | – | (0.44) | – | – | (0.00)(d) | |||||
Tax return of capital | – | – | – | (0.01) | (0.01) | |||||
Total distributions | (0.10) | (0.64) | (0.27) | (0.17) | (0.16) | |||||
Net increase/(decrease) in net asset value | 0.14 | 0.72 | 0.99 | (0.47) | 1.64 | |||||
Net asset value, end of year | $13.02 | $12.88 | $12.16 | $11.17 | $11.64 | |||||
TOTAL RETURN(e) | 1.88% | 11.40% | 11.47% | (2.58)% | 18.21% | |||||
RATIOS/SUPPLEMENTAL DATA: | ||||||||||
Net assets, end of period (000s) | $20,997 | $18,254 | $10,460 | $6,897 | $3,301 | |||||
Ratio of expenses to average net assets excluding fee waivers and reimbursements | 1.15%(f) | 1.17% | 1.33% | 1.49% | 2.44%(f) | |||||
Ratio of expenses to average net assets including fee waivers and reimbursements | 0.90%(f) | 0.90% | 0.95%(g) | 1.05% | 1.05%(f) | |||||
Ratio of net investment income to average net assets | 1.57%(f) | 1.61% | 2.36% | 1.88% | 1.49%(f) | |||||
Portfolio turnover rate(h) | 45% | 99% | 136% | 133% | 66% | |||||
| (a) | Effective May 1, 2014, the Board approved changing the fiscal year-end of the Funds from April 30 to October 31. |
| (b) | Prior to January 1, 2012, the RiverFront Dynamic Equity Income Fund was known as the RiverFront Long-Term Growth & Income Fund. |
| (c) | Calculated using the average shares method. |
| (d) | Less than ($0.005) per share. |
| (e) | Total returns are for the period indicated and have not been annualized. Total returns would have been lower had certain expenses not been waived during the period. Returns shown do not reflect the deduction of taxes that a shareholder would pay on Fund distributions or the redemption of Fund shares. |
| (f) | Annualized. |
| (g) | Contractual expense limitation change from 1.05% to 0.90% effective September 1, 2012. |
| (h) | Portfolio turnover rate for periods less than one full year have not been annualized. |
See Notes to Financial Statements.
| 161 | October 31, 2014 |
| RiverFront Global Allocation Fund – Class A | ||
| Financial Highlights | ||
Selected data for a share of beneficial interest outstanding throughout the periods indicated:
| For the Fiscal Period Ended October 31, 2014(a) | For the Year Ended April 30, 2014 | For the Year Ended April 30, 2013 | For the Year Ended April 30, 2012(b) | For the Period August 2, 2010 (Inception) to April 30, 2011 | ||||||
Net asset value, beginning of period | $12.97 | $11.93 | $10.86 | $11.66 | $10.00 | |||||
INCOME/(LOSS) FROM INVESTMENT OPERATIONS: | ||||||||||
Net investment income(c) | 0.08 | 0.10 | 0.15 | 0.12 | 0.10 | |||||
Net realized and unrealized gain/(loss) | 0.09 | 1.36 | 1.08 | (0.84) | 1.61 | |||||
Total from investment operations | 0.17 | 1.46 | 1.23 | (0.72) | 1.71 | |||||
DISTRIBUTIONS: | ||||||||||
From net investment income | – | (0.09) | (0.16) | (0.07) | (0.05) | |||||
From net realized gains | – | (0.33) | – | (0.01) | – | |||||
Total distributions | – | (0.42) | (0.16) | (0.08) | (0.05) | |||||
Net increase/(decrease) in net asset value | 0.17 | 1.04 | 1.07 | (0.80) | 1.66 | |||||
Net asset value, end of year | $13.14 | $12.97 | $11.93 | $10.86 | $11.66 | |||||
TOTAL RETURN(d) | 1.31% | 12.32% | 11.47% | (6.18)% | 17.12% | |||||
RATIOS/SUPPLEMENTAL DATA: | ||||||||||
Net assets, end of period (000s) | $8,372 | $9,098 | $8,244 | $5,791 | $4,686 | |||||
Ratio of expenses to average net assets excluding fee waivers and reimbursements | 1.50%(e) | 1.51% | 1.68% | 1.80% | 3.00%(e) | |||||
Ratio of expenses to average net assets including fee waivers and reimbursements | 1.15%(e) | 1.15% | 1.19%(f) | 1.30% | 1.30%(e) | |||||
Ratio of net investment income to average net assets | 1.21%(e) | 0.83% | 1.32% | 1.10% | 1.16%(e) | |||||
Portfolio turnover rate(g) | 47% | 95% | 113% | 163% | 77% | |||||
| (a) | Effective May 1, 2014, the Board approved changing the fiscal year-end of the Funds from April 30 to October 31. |
| (b) | Prior to January 1, 2012, the RiverFront Global Allocation Fund was known as the RiverFront Moderate Growth Fund. |
| (c) | Calculated using the average shares method. |
| (d) | Total returns are for the period indicated and have not been annualized. Total returns would have been lower had certain expenses not been waived during the period. Returns shown do not reflect the deduction of taxes that a shareholder would pay on Fund distributions or the redemption of Fund shares. Returns shown exclude any applicable sales charges. |
| (e) | Annualized. |
| (f) | Contractual expense limitation change from 1.30% to 1.15% effective September 1, 2012. |
| (g) | Portfolio turnover rate for periods less than one full year have not been annualized. |
See Notes to Financial Statements.
| 162 | October 31, 2014 |
| RiverFront Global Allocation Fund – Class C | ||
| Financial Highlights | ||
Selected data for a share of beneficial interest outstanding throughout the periods indicated:
| For the Fiscal Period Ended October 31, 2014(a) | For the Year Ended April 30, 2014 | For the Year Ended April 30, 2013 | For the Year Ended April 30, 2012(b) | For the Period August 2, 2010 (Inception) to April 30, 2011 | ||||||
Net asset value, beginning of period | $12.83 | $11.84 | $10.81 | $11.64 | $10.00 | |||||
INCOME/(LOSS) FROM INVESTMENT OPERATIONS: | ||||||||||
Net investment income(c) | 0.03 | 0.01 | 0.07 | 0.02 | 0.00(d) | |||||
Net realized and unrealized gain/(loss) | 0.09 | 1.34 | 1.07 | (0.82) | 1.65 | |||||
Total from investment operations | 0.12 | 1.35 | 1.14 | (0.80) | 1.65 | |||||
DISTRIBUTIONS: | ||||||||||
From net investment income | – | (0.03) | (0.11) | (0.02) | (0.01) | |||||
From net realized gains | – | (0.33) | – | (0.01) | – | |||||
Total distributions | – | (0.36) | (0.11) | (0.03) | (0.01) | |||||
Net increase/(decrease) in net asset value | 0.12 | 0.99 | 1.03 | (0.83) | 1.64 | |||||
Net asset value, end of year | $12.95 | $12.83 | $11.84 | $10.81 | $11.64 | |||||
TOTAL RETURN(e) | 0.94% | 11.48% | 10.59% | (6.86)% | 16.52% | |||||
RATIOS/SUPPLEMENTAL DATA: | ||||||||||
Net assets, end of period (000s) | $14,758 | $14,624 | $9,686 | $9,891 | $8,926 | |||||
Ratio of expenses to average net assets excluding fee waivers and reimbursements | 2.25%(f) | 2.26% | 2.44% | 2.58% | 3.21%(f) | |||||
Ratio of expenses to average net assets including fee waivers and reimbursements | 1.90%(f) | 1.90% | 1.95%(g) | 2.05% | 2.05%(f) | |||||
Ratio of net investment income to average net assets | 0.40%(f) | 0.05% | 0.66% | 0.17% | 0.04%(f) | |||||
Portfolio turnover rate(h) | 47% | 95% | 113% | 163% | 77% | |||||
| (a) | Effective May 1, 2014, the Board approved changing the fiscal year-end of the Funds from April 30 to October 31. |
| (b) | Prior to January 1, 2012, the RiverFront Global Allocation Fund was known as the RiverFront Moderate Growth Fund. |
| (c) | Calculated using the average shares method. |
| (d) | Less than $0.005 per share. |
| (e) | Total returns are for the period indicated and have not been annualized. Total returns would have been lower had certain expenses not been waived during the period. Returns shown do not reflect the deduction of taxes that a shareholder would pay on Fund distributions or the redemption of Fund shares. Returns shown exclude any applicable sales charges. |
| (f) | Annualized. |
| (g) | Contractual expense limitation change from 2.05% to 1.90% effective September 1, 2012. |
| (h) | Portfolio turnover rate for periods less than one full year have not been annualized. |
See Notes to Financial Statements.
| 163 | October 31, 2014 |
| RiverFront Global Allocation Fund – Class I | ||
| Financial Highlights | ||
Selected data for a share of beneficial interest outstanding throughout the periods indicated:
| For the Fiscal Period Ended October 31, 2014(a) | For the Year Ended April 30, 2014 | For the Year Ended April 30, 2013 | For the Year Ended April 30, 2012(b) | For the Period August 2, 2010 (Inception) to April 30, 2011 | ||||||
Net asset value, beginning of period | $12.75 | $11.72 | $10.66 | $11.42 | $10.00 | |||||
INCOME/(LOSS) FROM INVESTMENT OPERATIONS: | ||||||||||
Net investment income(c) | 0.09 | 0.13 | 0.17 | 0.13 | 0.08 | |||||
Net realized and unrealized gain/(loss) | 0.08 | 1.34 | 1.07 | (0.80) | 1.62 | |||||
Total from investment operations | 0.17 | 1.47 | 1.24 | (0.67) | 1.70 | |||||
DISTRIBUTIONS: | ||||||||||
From net investment income | – | (0.11) | (0.18) | (0.08) | (0.28) | |||||
From net realized gains | – | (0.33) | – | (0.01) | – | |||||
Total distributions | – | (0.44) | (0.18) | (0.09) | (0.28) | |||||
Net increase/(decrease) in net asset value | 0.17 | 1.03 | 1.06 | (0.76) | 1.42 | |||||
Net asset value, end of year | $12.92 | $12.75 | $11.72 | $10.66 | $11.42 | |||||
TOTAL RETURN(d) | 1.33% | 12.61% | 11.73% | (5.86)% | 17.20% | |||||
RATIOS/SUPPLEMENTAL DATA: | ||||||||||
Net assets, end of period (000s) | $12,895 | $10,521 | $6,675 | $3,496 | $1,905 | |||||
Ratio of expenses to average net assets excluding fee waivers and reimbursements | 1.26%(e) | 1.26% | 1.43% | 1.55% | 4.68%(e) | |||||
Ratio of expenses to average net assets including fee waivers and reimbursements | 0.90%(e) | 0.90% | 0.94%(f) | 1.05% | 1.05%(e) | |||||
Ratio of net investment income to average net assets | 1.41%(e) | 1.07% | 1.52% | 1.28% | 0.98%(e) | |||||
Portfolio turnover rate(g) | 47% | 95% | 113% | 163% | 77% | |||||
| (a) | Effective May 1, 2014, the Board approved changing the fiscal year-end of the Funds from April 30 to October 31. |
| (b) | Prior to January 1, 2012, the RiverFront Global Allocation Fund was known as the RiverFront Moderate Growth Fund. |
| (c) | Calculated using the average shares method. |
| (d) | Total returns are for the period indicated and have not been annualized. Total returns would have been lower had certain expenses not been waived during the period. Returns shown do not reflect the deduction of taxes that a shareholder would pay on Fund distributions or the redemption of Fund shares. |
| (e) | Annualized. |
| (f) | Contractual expense limitation change from 1.05% to 0.90% effective September 1, 2012. |
| (g) | Portfolio turnover rate for periods less than one full year have not been annualized. |
See Notes to Financial Statements.
| 164 | October 31, 2014 |
| RiverFront Global Growth Fund – Class A | ||
| Financial Highlights | ||
Selected data for a share of beneficial interest outstanding throughout the periods indicated:
| For the Fiscal Period Ended October 31, 2014(a) | For the Year Ended April 30, 2014 | For the Year Ended April 30, 2013 | For the Year Ended April 30, 2012(b) | For the Fiscal Period Ended April 30, 2011(c) | For the Period September 27, 2010 (Inception) to December 31, 2010 | |||||||
Net asset value, beginning of period | $15.26 | $14.89 | $13.37 | $15.65 | $14.66 | $13.68 | ||||||
INCOME/(LOSS) FROM INVESTMENT OPERATIONS: | ||||||||||||
Net investment income(d) | 0.08 | 0.12 | 0.17 | 0.14 | 0.00(e) | 0.23 | ||||||
Net realized and unrealized gain/(loss) | 0.10 | 1.88 | 1.57 | (1.41) | 0.99 | 1.03 | ||||||
Total from investment operations | 0.18 | 2.00 | 1.74 | (1.27) | 0.99 | 1.26 | ||||||
DISTRIBUTIONS: | ||||||||||||
From net investment income | – | (0.12) | (0.22) | (0.14) | – | (0.14) | ||||||
From net realized gains | – | (1.51) | – | (0.87) | – | (0.14) | ||||||
Total distributions | – | (1.63) | (0.22) | (1.01) | – | (0.28) | ||||||
Net increase/(decrease) in net asset value | 0.18 | 0.37 | 1.52 | (2.28) | 0.99 | 0.98 | ||||||
Net asset value, end of year | $15.44 | $15.26 | $14.89 | $13.37 | $15.65 | $14.66 | ||||||
| ||||||||||||
TOTAL RETURN(f) | 1.18% | 13.66% | 13.14% | (7.51)% | 6.75% | 9.22% | ||||||
RATIOS/SUPPLEMENTAL DATA: | ||||||||||||
Net assets, end of year (000s) | $16,694 | $16,440 | $8,525 | $5,241 | $12,307 | $1,934 | ||||||
Ratio of expenses to average net assets excluding fee waivers and reimbursements | 1.38%(g) | 1.40% | 1.49% | 1.52% | 1.58%(g) | 2.15%(g) | ||||||
Ratio of expenses to average net assets including fee waivers and reimbursements(h) | 1.15%(g) | 1.15% | 0.98% | 0.92% | 0.81%(g) | 0.91%(g) | ||||||
Ratio of net investment income to average net assets | 1.08%(g) | 0.76% | 1.23% | 0.99% | 0.06%(g) | 6.20%(g) | ||||||
Portfolio turnover rate(i) | 48% | 85% | 113% | 119% | 34% | 99% | ||||||
| (a) | Effective May 1, 2014, the Board approved changing the fiscal year-end of the Funds from April 30 to October 31. |
| (b) | Prior to January 1, 2012, the RiverFront Global Growth Fund was known as the RiverFront Long-Term Growth Fund. |
| (c) | Effective March 8, 2011, the Board approved changing the fiscal year-end of the Fund from December 31 to April 30. |
| (d) | Calculated using the average shares method. |
| (e) | Less than $0.005 per share. |
| (f) | Total returns are for the period indicated and have not been annualized. Total returns would have been lower had certain expenses not been waived during the period. Returns shown do not reflect the deduction of taxes that a shareholder would pay on Fund distributions or the redemption of Fund shares. Returns shown exclude any applicable sales charges. |
| (g) | Annualized. |
| (h) | Prior to January 1, 2013, all acquired fund fees were reimbursed. |
| (i) | Portfolio turnover rate for periods less than one full year have not been annualized. |
See Notes to Financial Statements.
| 165 | October 31, 2014 |
| RiverFront Global Growth Fund – Class C | ||
| Financial Highlights | ||
Selected data for a share of beneficial interest outstanding throughout the periods indicated:
| For the Fiscal Period Ended October 31, 2014(a) | For the Year Ended April 30, 2014 | For the Year Ended April 30, 2013 | For the Year Ended April 30, 2012(b) | For the Fiscal Period Ended April 30, 2011(c) | For the Period September 27, 2010 (Inception) to December 31, 2010 | |||||||
Net asset value, beginning of period | $15.07 | $14.76 | $13.29 | $15.60 | $14.63 | $13.68 | ||||||
INCOME/(LOSS) FROM INVESTMENT OPERATIONS: | ||||||||||||
Net investment income/(loss)(d) | 0.03 | 0.01 | 0.08 | 0.05 | (0.04) | 0.20 | ||||||
Net realized and unrealized gain/(loss) | 0.09 | 1.86 | 1.54 | (1.42) | 1.01 | 1.02 | ||||||
Total from investment operations | 0.12 | 1.87 | 1.62 | (1.37) | 0.97 | 1.22 | ||||||
DISTRIBUTIONS: | ||||||||||||
From net investment income | – | (0.05) | (0.15) | (0.07) | – | (0.13) | ||||||
From net realized gains | – | (1.51) | – | (0.87) | – | (0.14) | ||||||
Total distributions | – | (1.56) | (0.15) | (0.94) | – | (0.27) | ||||||
Net increase/(decrease) in net asset value | 0.12 | 0.31 | 1.47 | (2.31) | 0.97 | 0.95 | ||||||
Net asset value, end of year | $15.19 | $15.07 | $14.76 | $13.29 | $15.60 | $14.63 | ||||||
TOTAL RETURN(e) | 0.80% | 12.84% | 12.31% | (8.22)% | 6.63% | 8.91% | ||||||
RATIOS/SUPPLEMENTAL DATA: | ||||||||||||
Net assets, end of year (000s) | $11,420 | $11,511 | $7,182 | $6,808 | $6,156 | $2,050 | ||||||
Ratio of expenses to average net assets excluding fee waivers and reimbursements | 2.13%(f) | 2.15% | 2.25% | 2.29% | 2.33%(f) | 2.89%(f) | ||||||
Ratio of expenses to average net assets including fee waivers and reimbursements(g) | 1.90%(f) | 1.90% | 1.73% | 1.67% | 1.55%(f) | 1.66%(f) | ||||||
Ratio of net investment income/(loss) to average net assets | 0.38%(f) | 0.07% | 0.57% | 0.34% | (0.72)%(f) | 5.36%(f) | ||||||
Portfolio turnover rate(h) | 48% | 85% | 113% | 119% | 34% | 99% | ||||||
| (a) | Effective May 1, 2014, the Board approved changing the fiscal year-end of the Funds from April 30 to October 31. |
| (b) | Prior to January 1, 2012, the RiverFront Global Growth Fund was known as the RiverFront Long-Term Growth Fund. |
| (c) | Effective March 8, 2011, the Board approved changing the fiscal year-end of the Fund from December 31 to April 30. |
| (d) | Calculated using the average shares method. |
| (e) | Total returns are for the period indicated and have not been annualized. Total returns would have been lower had certain expenses not been waived during the period. Returns shown do not reflect the deduction of taxes that a shareholder would pay on Fund distributions or the redemption of Fund shares. Returns shown exclude any applicable sales charges. |
| (f) | Annualized. |
| (g) | Prior to January 1, 2013, all acquired fund fees were reimbursed. |
| (h) | Portfolio turnover rate for periods less than one full year have not been annualized. |
See Notes to Financial Statements.
| 166 | October 31, 2014 |
| RiverFront Global Growth Fund – Class I | ||
| Financial Highlights | ||
Selected data for a share of beneficial interest outstanding throughout the periods indicated:
| For the Fiscal Period Ended October 31, 2014(a) | For the Year Ended April 30, 2014 | For the Year Ended April 30, 2013 | For the Year Ended April 30, 2012(b) | For the Fiscal Period Ended April 30, 2011(c) | For the Period September 27, 2010 (Inception) to December 31, 2010 | |||||||
Net asset value, beginning of period | $15.32 | $14.92 | $13.40 | $15.67 | $14.65 | $13.68 | ||||||
INCOME/(LOSS) FROM INVESTMENT OPERATIONS: | ||||||||||||
Net investment income(d) | 0.10 | 0.17 | 0.20 | 0.19 | 0.01 | 0.17 | ||||||
Net realized and unrealized gain/(loss) | 0.10 | 1.89 | 1.57 | (1.43) | 1.01 | 1.09 | ||||||
Total from investment operations | 0.20 | 2.06 | 1.77 | (1.24) | 1.02 | 1.26 | ||||||
DISTRIBUTIONS: | ||||||||||||
From net investment income | – | (0.15) | (0.25) | (0.16) | – | (0.15) | ||||||
From net realized gains | – | (1.51) | – | (0.87) | – | (0.14) | ||||||
Total distributions | – | (1.66) | (0.25) | (1.03) | – | (0.29) | ||||||
Net increase/(decrease) in net asset value | 0.20 | 0.40 | 1.52 | (2.27) | 1.02 | 0.97 | ||||||
Net asset value, end of year | $15.52 | $15.32 | $14.92 | $13.40 | $15.67 | $14.65 | ||||||
| ||||||||||||
TOTAL RETURN(e) | 1.31% | 14.01% | 13.36% | (7.31)% | 7.04% | 9.12% | ||||||
RATIOS/SUPPLEMENTAL DATA: | ||||||||||||
Net assets, end of year (000s) | $13,343 | $11,845 | $7,769 | $6,022 | $4,508 | $2,280 | ||||||
Ratio of expenses to average net assets excluding fee waivers and reimbursements | 1.36%(f) | 1.16% | 1.25% | 1.30% | 1.30%(f) | 1.74%(f) | ||||||
Ratio of expenses to average net assets including fee waivers and reimbursements(g) | 0.90%(f) | 0.90% | 0.73% | 0.67% | 0.61%(f) | 0.66%(f) | ||||||
Ratio of net investment income to average net assets | 1.32%(f) | 1.13% | 1.45% | 1.40% | 0.23%(f) | 4.70%(f) | ||||||
Portfolio turnover rate(h) | 48% | 85% | 113% | 119% | 34% | 99% | ||||||
| (a) | Effective May 1, 2014, the Board approved changing the fiscal year-end of the Funds from April 30 to October 31. |
| (b) | Prior to January 1, 2012, the RiverFront Global Growth Fund was known as the RiverFront Long-Term Growth Fund. |
| (c) | Effective March 8, 2011, the Board approved changing the fiscal year-end of the Fund from December 31 to April 30. |
| (d) | Calculated using the average shares method. |
| (e) | Total returns are for the period indicated and have not been annualized. Total returns would have been lower had certain expenses not been waived during the period. Returns shown do not reflect the deduction of taxes that a shareholder would pay on Fund distributions or the redemption of Fund shares. |
| (f) | Annualized. |
| (g) | Prior to January 1, 2013, all acquired fund fees were reimbursed. |
| (h) | Portfolio turnover rate for periods less than one full year have not been annualized. |
See Notes to Financial Statements.
| 167 | October 31, 2014 |
| RiverFront Global Growth Fund – Class L | ||
| Financial Highlights | ||
Selected data for a share of beneficial interest outstanding throughout the periods indicated:
| For the Fiscal Period Ended October 31, 2014(a) | For the Year Ended April 30, 2014 | For the Year Ended April 30, 2013 | For the April 30, | For the Fiscal Period Ended April 30, | For the Year Ended | For the Year Ended | ||||||||
Net asset value, beginning of period | $15.29 | $14.90 | $13.37 | $15.65 | $14.63 | $13.22 | $10.49 | |||||||
INCOME/(LOSS) FROM INVESTMENT OPERATIONS: | ||||||||||||||
Net investment income(d) | 0.11 | 0.17 | 0.22 | 0.17 | 0.01 | 0.18 | 0.16 | |||||||
Net realized and unrealized gain/(loss) | 0.09 | 1.88 | 1.56 | (1.41) | 1.01 | 1.52 | 2.66 | |||||||
Total from investment operations | 0.20 | 2.05 | 1.78 | (1.24) | 1.02 | 1.70 | 2.82 | |||||||
DISTRIBUTIONS: | ||||||||||||||
From net investment income | – | (0.15) | (0.25) | (0.17) | – | (0.15) | (0.09) | |||||||
From net realized gains | – | (1.51) | – | (0.87) | – | (0.14) | – | |||||||
Total distributions | – | (1.66) | (0.25) | (1.04) | – | (0.29) | (0.09) | |||||||
Net increase/(decrease) in net asset value | 0.20 | 0.39 | 1.53 | (2.28) | 1.02 | 1.41 | 2.73 | |||||||
Net asset value, end of year | $15.49 | $15.29 | $14.90 | $13.37 | $15.65 | $14.63 | $13.22 | |||||||
| ||||||||||||||
TOTAL RETURN(e) | 1.31% | 13.98% | 13.43% | (7.31)% | 6.97% | 12.87% | 26.86% | |||||||
RATIOS/SUPPLEMENTAL DATA: | ||||||||||||||
Net assets, end of year (000s) | $24,400 | $25,092 | $23,454 | $24,765 | $42,977 | $43,240 | $27,763 | |||||||
Ratio of expenses to average net assets excluding fee waivers and reimbursements | 1.02%(f) | 1.15% | 1.25% | 1.08% | 1.28%(f) | 1.22% | 1.53% | |||||||
Ratio of expenses to average net assets including fee waivers and reimbursements (includes acquired fund fee reimbursements)(g) | 0.90%(f) | 0.90% | 0.73% | 0.67% | 0.64%(f) | 0.66% | N/A | |||||||
Ratio of expenses to average net assets including fee waivers and reimbursements (excludes acquired fund fee reimbursements) | 0.90%(f) | 0.90% | 0.90% | 0.90% | 0.90%(f) | 0.90% | 0.90% | |||||||
Ratio of net investment income to average net assets | 1.37%(f) | 1.11% | 1.59% | 1.26% | 0.19%(f) | 1.33% | 1.34% | |||||||
Portfolio turnover rate(h) | 48% | 85% | 113% | 119% | 34% | 99% | 67% | |||||||
| (a) | Effective May 1, 2014, the Board approved changing the fiscal year-end of the Funds from April 30 to October 31. |
| (b) | Prior to January 1, 2012, the RiverFront Global Growth Fund was known as the RiverFront Long-Term Growth Fund. |
| (c) | Effective March 8, 2011, the Board approved changing the fiscal year-end of the Fund from December 31 to April 30. |
| (d) | Calculated using the average shares method. |
| (e) | Total returns are for the period indicated and have not been annualized. Total returns would have been lower had certain expenses not been waived during the period. Returns shown do not reflect the deduction of taxes that a shareholder would pay on Fund distributions or the redemption of Fund shares. |
| (f) | Annualized. |
| (g) | Prior to January 1, 2013, all acquired fund fees were reimbursed. |
| (h) | Portfolio turnover rate for periods less than one full year have not been annualized. |
See Notes to Financial Statements.
| 168 | October 31, 2014 |
| RiverFront Global Growth Fund – Investor Class | ||
| Financial Highlights | ||
Selected data for a share of beneficial interest outstanding throughout the periods indicated:
| For the Fiscal Period Ended October 31, 2014(a) | For the April 30, | For the April 30, | For the April 30, | For the Fiscal Period Ended April 30, 2011(c) | For the Year Ended | For the Year Ended | ||||||||
Net asset value, beginning of period | $15.19 | $14.82 | $13.32 | $15.59 | $14.59 | $13.19 | $10.49 | |||||||
INCOME/(LOSS) FROM INVESTMENT OPERATIONS: | ||||||||||||||
Net investment income(d) | 0.09 | 0.13 | 0.18 | 0.13 | 0.00(e) | 0.12 | 0.13 | |||||||
Net realized and unrealized gain/(loss) | 0.09 | 1.87 | 1.54 | (1.39) | 1.00 | 1.54 | 2.65 | |||||||
Total from investment operations | 0.18 | 2.00 | 1.72 | (1.26) | 1.00 | 1.66 | 2.78 | |||||||
DISTRIBUTIONS: | ||||||||||||||
From net investment income | – | (0.12) | (0.22) | (0.14) | – | (0.12) | (0.08) | |||||||
From net realized gains | – | (1.51) | – | (0.87) | – | (0.14) | – | |||||||
Total distributions | – | (1.63) | (0.22) | (1.01) | – | (0.26) | (0.08) | |||||||
Net increase/(decrease) in net asset value | 0.18 | 0.37 | 1.50 | (2.27) | 1.00 | 1.40 | 2.70 | |||||||
Net asset value, end of year | $15.37 | $15.19 | $14.82 | $13.32 | $15.59 | $14.59 | $13.19 | |||||||
| ||||||||||||||
TOTAL RETURN(f) | 1.18% | 13.73% | 13.07% | (7.47)% | 6.79% | 12.58% | 26.58% | |||||||
RATIOS/SUPPLEMENTAL DATA: | ||||||||||||||
Net assets, end of year (000s) | $7,762 | $8,361 | $9,174 | $10,133 | $21,270 | $23,556 | $13,882 | |||||||
Ratio of expenses to average net assets excluding fee waivers and reimbursements | 1.38%(g) | 1.41% | 1.50% | 1.93% | 1.53%(g) | 1.47% | 1.78% | |||||||
Ratio of expenses to average net assets including fee waivers and reimbursements (includes acquired fund fee reimbursements)(h) | 1.15%(g) | 1.15% | 0.98% | 0.92% | 0.89%(g) | 0.91% | N/A | |||||||
Ratio of expenses to average net assets including fee waivers and reimbursements (excludes acquired fund fee reimbursements) | 1.15%(g) | 1.15% | 1.15% | 1.15% | 1.15%(g) | 1.15% | 1.15% | |||||||
Ratio of net investment income/ (loss) to average net assets | 1.14%(g) | 0.85% | 1.36% | 0.97% | (0.08)%(g) | 0.93% | 1.09% | |||||||
Portfolio turnover rate(i) | 48% | 85% | 113% | 119% | 34% | 99% | 67% | |||||||
| (a) | Effective May 1, 2014, the Board approved changing the fiscal year-end of the Funds from April 30 to October 31. |
| (b) | Prior to January 1, 2012, the RiverFront Global Growth Fund was known as the RiverFront Long-Term Growth Fund. |
| (c) | Effective March 8, 2011, the Board approved changing the fiscal year-end of the Fund from December 31 to April 30. |
| (d) | Calculated using the average shares method. |
| (e) | Less than $0.005 per share. |
| (f) | Total returns are for the period indicated and have not been annualized. Total returns would have been lower had certain expenses not been waived during the period. Returns shown do not reflect the deduction of taxes that a shareholder would pay on Fund distributions or the redemption of Fund shares. |
| (g) | Annualized. |
| (h) | Prior to January 1, 2013, all acquired fund fees were reimbursed. |
| (i) | Portfolio turnover rate for periods less than one full year have not been annualized. |
See Notes to Financial Statements.
| 169 | October 31, 2014 |
| RiverFront Moderate Growth & Income Fund – Class A | ||
| Financial Highlights | ||
Selected data for a share of beneficial interest outstanding throughout the periods indicated:
| For the Fiscal Period Ended October 31, 2014(a) | For the Year April 30, 2014 | For the Year April 30, 2013 | For the Year April 30, 2012 | For the Period August 2, 2010 (Inception) to April 30, 2011 | ||||||
Net asset value, beginning of period | $11.99 | $11.66 | $10.96 | $11.08 | $10.00 | |||||
INCOME/(LOSS) FROM INVESTMENT OPERATIONS: | ||||||||||
Net investment income(b) | 0.09 | 0.16 | 0.24 | 0.17 | 0.15 | |||||
Net realized and unrealized gain/(loss) | 0.16 | 0.89 | 0.69 | (0.12) | 1.01 | |||||
Total from investment operations | 0.25 | 1.05 | 0.93 | 0.05 | 1.16 | |||||
DISTRIBUTIONS: | ||||||||||
From net investment income | (0.09) | (0.16) | (0.23) | (0.17) | (0.08) | |||||
From net realized gains | – | (0.56) | – | – | (0.00)(c) | |||||
Tax return of capital | – | – | – | (0.00)(c) | – | |||||
Total distributions | (0.09) | (0.72) | (0.23) | (0.17) | (0.08) | |||||
Net increase/(decrease) in net asset value | 0.16 | 0.33 | 0.70 | (0.12) | 1.08 | |||||
Net asset value, end of year | $12.15 | $11.99 | $11.66 | $10.96 | $11.08 | |||||
| ||||||||||
TOTAL RETURN(d) | 2.12% | 9.16% | 8.59% | 0.55% | 11.70% | |||||
RATIOS/SUPPLEMENTAL DATA: | ||||||||||
Net assets, end of period (000s) | $27,598 | $31,033 | $29,066 | $20,754 | $12,148 | |||||
Ratio of expenses to average net assets excluding fee waivers and reimbursements | 1.31%(e) | 1.32% | 1.40% | 1.50% | 1.64%(e) | |||||
Ratio of expenses to average net assets including fee waivers and reimbursements | 1.15%(e) | 1.15% | 1.19%(f) | 1.30% | 1.30%(e) | |||||
Ratio of net investment income to average net assets | 1.54%(e) | 1.35% | 2.17% | 1.65% | 1.89%(e) | |||||
Portfolio turnover rate(g) | 42% | 98% | 108% | 128% | 69% | |||||
| (a) | Effective May 1, 2014, the Board approved changing the fiscal year-end of the Funds from April 30 to October 31. |
| (b) | Calculated using the average shares method. |
| (c) | Less than ($0.005) per share. |
| (d) | Total returns are for the period indicated and have not been annualized. Total returns would have been lower had certain expenses not been waived during the period. Returns shown do not reflect the deduction of taxes that a shareholder would pay on Fund distributions or the redemption of Fund shares. Returns shown exclude any applicable sales charges. |
| (e) | Annualized. |
| (f) | Contractual expense limitation change from 1.30% to 1.15% effective September 1, 2012. |
| (g) | Portfolio turnover rate for periods less than one full year have not been annualized. |
See Notes to Financial Statements.
| 170 | October 31, 2014 |
| RiverFront Moderate Growth & Income Fund – Class C | ||
| Financial Highlights | ||
Selected data for a share of beneficial interest outstanding throughout the periods indicated:
| For the Fiscal Period Ended October 31, 2014(a) | For the Year April 30, 2014 | For the Year April 30, 2013 | For the Year April 30, 2012 | For the Period August 2, 2010 (Inception) to April 30, 2011 | ||||||
Net asset value, beginning of period | $11.94 | $11.62 | $10.92 | $11.06 | $10.00 | |||||
INCOME/(LOSS) FROM INVESTMENT OPERATIONS: | ||||||||||
Net investment income(b) | 0.05 | 0.07 | 0.16 | 0.09 | 0.10 | |||||
Net realized and unrealized gain/(loss) | 0.16 | 0.89 | 0.68 | (0.13) | 1.02 | |||||
Total from investment operations | 0.21 | 0.96 | 0.84 | (0.04) | 1.12 | |||||
DISTRIBUTIONS: | ||||||||||
From net investment income | (0.05) | (0.08) | (0.14) | (0.10) | (0.06) | |||||
From net realized gains | – | (0.56) | – | – | (0.00)(c) | |||||
Tax return of capital | – | – | – | (0.00)(c) | – | |||||
Total distributions | (0.05) | (0.64) | (0.14) | (0.10) | (0.06) | |||||
Net increase/(decrease) in net asset value | 0.16 | 0.32 | 0.70 | (0.14) | 1.06 | |||||
Net asset value, end of year | $12.10 | $11.94 | $11.62 | $10.92 | $11.06 | |||||
| ||||||||||
TOTAL RETURN(d) | 1.75% | 8.33% | 7.83% | (0.37)% | 11.24% | |||||
RATIOS/SUPPLEMENTAL DATA: | ||||||||||
Net assets, end of period (000s) | $66,445 | $63,031 | $52,579 | $39,015 | $24,061 | |||||
Ratio of expenses to average net assets excluding fee waivers and reimbursements | 2.07%(e) | 2.07% | 2.15% | 2.25% | 2.54%(e) | |||||
Ratio of expenses to average net assets including fee waivers and reimbursements | 1.90%(e) | 1.90% | 1.95%(f) | 2.05% | 2.05%(e) | |||||
Ratio of net investment income to average net assets | 0.77%(e) | 0.59% | 1.43% | 0.88% | 1.22%(e) | |||||
Portfolio turnover rate(g) | 42% | 98% | 108% | 128% | 69% | |||||
| (a) | Effective May 1, 2014, the Board approved changing the fiscal year-end of the Funds from April 30 to October 31. |
| (b) | Calculated using the average shares method. |
| (c) | Less than ($0.005) per share. |
| (d) | Total returns are for the period indicated and have not been annualized. Total returns would have been lower had certain expenses not been waived during the period. Returns shown do not reflect the deduction of taxes that a shareholder would pay on Fund distributions or the redemption of Fund shares. Returns shown exclude any applicable sales charges. |
| (e) | Annualized. |
| (f) | Contractual expense limitation change from 2.05% to 1.90% effective September 1, 2012. |
| (g) | Portfolio turnover rate for periods less than one full year have not been annualized. |
See Notes to Financial Statements.
| 171 | October 31, 2014 |
| RiverFront Moderate Growth & Income Fund – Class I | ||
| Financial Highlights | ||
Selected data for a share of beneficial interest outstanding throughout the periods indicated:
| For the Fiscal Period Ended October 31, 2014(a) | For the Year April 30, 2014 | For the Year April 30, 2013 | For the Year April 30, 2012 | For the Period August 2, 2010 (Inception) to April 30, 2011 | ||||||
Net asset value, beginning of period | $11.98 | $11.65 | $10.94 | $11.07 | $10.00 | |||||
INCOME/(LOSS) FROM INVESTMENT OPERATIONS: | ||||||||||
Net investment income(b) | 0.11 | 0.19 | 0.26 | 0.20 | 0.17 | |||||
Net realized and unrealized gain/(loss) | 0.16 | 0.89 | 0.70 | (0.13) | 1.01 | |||||
Total from investment operations | 0.27 | 1.08 | 0.96 | 0.07 | 1.18 | |||||
DISTRIBUTIONS: | ||||||||||
From net investment income | (0.11) | (0.19) | (0.25) | (0.19) | (0.11) | |||||
From net realized gains | – | (0.56) | – | – | (0.00)(c) | |||||
Tax return of capital | – | – | – | (0.01) | – | |||||
Total distributions | (0.11) | (0.75) | (0.25) | (0.20) | (0.11) | |||||
Net increase/(decrease) in net asset value | 0.16 | 0.33 | 0.71 | (0.13) | 1.07 | |||||
Net asset value, end of year | $12.14 | $11.98 | $11.65 | $10.94 | $11.07 | |||||
| ||||||||||
TOTAL RETURN(d) | 2.25% | 9.43% | 8.94% | 0.71% | 11.92% | |||||
RATIOS/SUPPLEMENTAL DATA: | ||||||||||
Net assets, end of period (000s) | $42,081 | $37,832 | $25,898 | $12,880 | $7,535 | |||||
Ratio of expenses to average net assets excluding fee waivers and reimbursements | 1.07%(e) | 1.07% | 1.15% | 1.26% | 1.55%(e) | |||||
Ratio of expenses to average net assets including fee waivers and reimbursements | 0.90%(e) | 0.90% | 0.94%(f) | 1.05% | 1.05%(e) | |||||
Ratio of net investment income to average net assets | 1.77%(e) | 1.59% | 2.39% | 1.91% | 2.16%(e) | |||||
Portfolio turnover rate(g) | 42% | 98% | 108% | 128% | 69% | |||||
| (a) | Effective May 1, 2014, the Board approved changing the fiscal year-end of the Funds from April 30 to October 31. |
| (b) | Calculated using the average shares method. |
| (c) | Less than ($0.005) per share. |
| (d) | Total returns are for the period indicated and have not been annualized. Total returns would have been lower had certain expenses not been waived during the period. Returns shown do not reflect the deduction of taxes that a shareholder would pay on Fund distributions or the redemption of Fund shares. |
| (e) | Annualized. |
| (f) | Contractual expense limitation change from 1.05% to 0.90% effective September 1, 2012. |
| (g) | Portfolio turnover rate for periods less than one full year have not been annualized. |
See Notes to Financial Statements.
| 172 | October 31, 2014 |
| Notes to Financial Statements | ||
| October 31, 2014 |
1. ORGANIZATION
Financial Investors Trust (the “Trust”), a Delaware statutory trust, is an open-end management investment company registered under the Investment Company Act of 1940, as amended (“1940 Act”). As of October 31, 2014, the Trust had 32 registered funds. This annual report includes the financial statements and financial highlights of the following 14 funds: ALPS | Alerian MLP Infrastructure Index Fund, ALPS | CoreCommodity Management CompleteCommodities® Strategy Fund, ALPS | Kotak India Growth Fund, ALPS Real Asset Income Fund, ALPS | Red Rocks Listed Private Equity Fund, ALPS | Sterling ETF Tactical Rotation Fund, ALPS | Westport Resources Hedged High Income Fund, ALPS | WMC Disciplined Value Fund, Clough China Fund, RiverFront Conservative Income Builder Fund, RiverFront Dynamic Equity Income Fund, RiverFront Global Allocation Fund, RiverFront Global Growth Fund and RiverFront Moderate Growth & Income Fund (each, a “Fund” and collectively, the “Funds”). Effective May 1, 2014, the Board of Trustees (the “Board”) approved changing the fiscal year-end of the Funds from April 30 to October 31. This change applies to all funds listed except ALPS Real Asset Income Fund, ALPS | Sterling ETF Tactical Rotation Fund and ALPS | Westport Resources Hedged High Income Fund, which commenced operations during the current fiscal period and already had a year-end of October 31.
ALPS | Alerian MLP Infrastructure Index Fund seeks investment results that correspond (before fees and expenses) generally to the price and yield performance of its underlying index, the Alerian MLP Infrastructure Index. The ALPS | CoreCommodity Management CompleteCommodities® Strategy Fund seeks to maximize real returns (returns after inflation), consistent with prudent investment management. ALPS | Kotak India Growth Fund’s investment goal is long-term capital appreciation. ALPS Real Asset Income Fund’s primary investment objectives are to provide a high level of current income and long-term capital appreciation. ALPS | Red Rocks Listed Private Equity Fund seeks to maximize total return, which consists of appreciation on its investments and a variable income stream. ALPS | Sterling ETF Tactical Rotation Fund seeks investment results that correspond (before fees and expenses) generally to the performance of the Sterling Tactical Rotation Index. ALPS | Westport Resources Hedged High Income Fund seeks to provide high current income. The Fund’s secondary investment objective is to seek capital preservation, with the potential for capital appreciation. ALPS | WMC Disciplined Value Fund seeks long-term capital appreciation: dividend income may be a factor in portfolio selection but is secondary to the Fund’s principal objective. The Clough China Fund seeks to provide investors with long-term capital appreciation. The RiverFront Conservative Income Builder Fund seeks to provide current income and potential for that income to grow over time. The RiverFront Dynamic Equity Income Fund seeks to achieve long-term growth and income through a combination of capital appreciation and rising dividend payments that exceed the average yield on global stocks generally. The RiverFront Global Allocation Fund seeks to provide high total investment return through a fully managed investment policy utilizing United States and foreign equity securities, debt and money market securities, the combination of which will be varied from time to time both with respect to types of securities and markets in response to changing market and economic trends. Total investment return means the combination of capital appreciation and investment income. The RiverFront Global Growth Fund seeks to achieve long-term capital appreciation through a fully managed investment policy utilizing United States and foreign equity securities, debt and money market securities, the combination of which will be varied from time to time both with respect to types of securities and markets in response to changing market and economic trends. The RiverFront Moderate Growth & Income Fund has two primary investment objectives: (1) seeks to provide a level of current income that exceeds the average yield on U.S. stocks in general and (2) to provide a growing stream of income over the years. The Funds secondary objective is to provide growth of capital.
The classes of each Fund differ principally in the applicable distribution and shareholder service fees. Shareholders of each class also bear certain expenses that pertain to that particular class. All shareholders bear the common expenses of the Fund and earn income and realized gains/losses from the Fund pro rata based on the average daily net assets of each class, without distinction between share classes. Dividends to shareholders are determined separately for each class based on income and expenses allocable to each class. Realized gain distributions to shareholders are allocated to each class pro rata based on the shares outstanding of each class on the date of distribution. Differences in per share dividend rates generally result from differences in separate class expenses, including distribution and shareholder service fees, if applicable.
Basis of Consolidation for the ALPS | CoreCommodity Management CompleteCommodities® Strategy Fund
CoreCommodity Management Cayman Commodity Fund Ltd. (the “Subsidiary”), a Cayman Islands exempted company, was incorporated on April 23, 2010 and is a wholly owned subsidiary of the ALPS | CoreCommodity Management CompleteCommodities® Strategy Fund (the “CoreCommodity Fund”). The Subsidiary acts as an investment vehicle for the CoreCommodity Fund in order to effect certain commodity-related investments on behalf of the CoreCommodity Fund. CoreCommodity Fund is the sole shareholder of the Subsidiary pursuant to a subscription agreement dated as of June 14, 2010, and it is intended that the CoreCommodity Fund will remain the sole shareholder and will continue to wholly own and control the Subsidiary. Under the Articles of Association of the Subsidiary, shares issued by the Subsidiary confer upon a shareholder the right to vote at general meetings of the Subsidiary and certain rights in connection with any winding-up or repayment of capital,as well as the right to participate in the profits or assets of the Subsidiary. The CoreCommodity Fund may invest up to 25% of its total assets in shares of the Subsidiary. As a wholly owned subsidiary of the CoreCommodity Fund, the financial statements of the Subsidiary are included in the consolidated financial statements and financial highlights of the CoreCommodity Fund. All investments held by the Subsidiary are disclosed in the accounts of the CoreCommodity Fund. As of October 31, 2014, net assets of the CoreCommodity Fund were $446,122,974, of which $87,840,271 or 19.69%, represented the CoreCommodity Fund’s ownership of all issued shares and voting rights of the Subsidiary.
| 173 | October 31, 2014 |
| Notes to Financial Statements | ||
| October 31, 2014 |
Basis of Consolidation for the ALPS | Kotak India Growth Fund
ALPS | Kotak India Growth Fund, (the “Kotak Fund”) invests in the equity securities of Indian companies through its wholly owned, collective investment vehicle, the India Premier Equity Portfolio (the “Portfolio”). The Portfolio is registered with and regulated by the Mauritius Financial Services Commission. The Portfolio was formed for the purpose of facilitating the Kotak Fund’s purchase of securities of a wide selection of Indian companies, consistent with the Kotak Fund’s investment strategies. The Portfolio is a private company limited by shares incorporated under the Mauritius Companies Act 2001. As a wholly owned subsidiary of the Kotak Fund, financial statements of the Portfolio are included in the consolidated financial statements and financial highlights of the Kotak Fund. All investments held by the Portfolio are disclosed in the accounts of the Kotak Fund.
The Portfolio established residency in Mauritius allowing the Kotak Fund to receive the beneficial tax treatment under the Treaty between India and Mauritius. If the benefits of the Treaty are denied or if the Portfolio is held to have a permanent establishment in India, gains derived by the Portfolio due to the sale of securities, may be subject to taxation in India. India’s Finance Act of 2012 had introduced legislation on General Anti-Avoidance Rules (“GAAR”) into the Act which contains treaty override provisions. The GAAR may be used by the Indian tax authorities to declare any arrangement whose main purpose or one of the main purposes is to obtain a tax benefit, as an “impermissible avoidance arrangement”. Originally, GAAR was to be effective from April 1, 2012; however, subsequent to the 2013 amendments introduced to the Finance Act, GAAR has been deferred until April 1, 2015.
Basis of Consolidation for the ALPS Real Asset Income Fund
ALPS Real Asset Income Fund (Cayman) Ltd. (the “Subsidiary”), a Cayman Islands exempted company, was incorporated on May 23, 2013 and is a wholly owned subsidiary of the ALPS Real Asset Income Fund (the “Real Asset Income Fund”). The Subsidiary acts as an investment vehicle for the Real Asset Income Fund in order to effect certain commodity-related investments on behalf of the Real Asset Income Fund. The Real Asset Income Fund is the sole shareholder of the Subsidiary pursuant to a subscription agreement dated as of November 25, 2013, and it is intended that the Real Asset Income Fund will remain the sole shareholder and will continue to wholly own and control the Subsidiary. Under the Articles of Association of the Subsidiary, shares issued by the Subsidiary confer upon a shareholder the right to vote at general meetings of the Subsidiary and certain rights in connection with any winding-up or repayment of capital, as well as the right to participate in the profits or assets of the Subsidiary. The Real Asset Income Fund may invest up to 25% of its total assets in shares of the Subsidiary. As a wholly owned subsidiary of the Real Asset Income Fund, the statement of investments the Subsidiary is included in the consolidated statement of investments of the Real Asset Income Fund. All investments held by the Subsidiary are disclosed in the accounts of the Real Asset Income Fund. As of October 31, 2014, net assets of the Real Asset Income Fund were $3,650,987, of which $461,876, or 12.65%, represented the Real Asset Income’s ownership of all issued shares and voting rights of the Subsidiary.
2. SIGNIFICANT ACCOUNTING POLICIES
The following is a summary of significant accounting policies consistently followed by each Fund in the preparation of its financial statements. Each Fund is considered an investment company for financial reporting purposes, the following policies are in conformity with accounting principles generally accepted in the United States of America for investment companies (“U.S. GAAP”).The preparation of financial statements in conformity with U.S. GAAP requires management to make certain estimates and assumptions that affect the reported amounts of assets and liabilities and disclosures of contingent assets and liabilities at the date of the financial statements and the reported amounts of revenue and expenses during the period. Actual results could differ from those estimates. The following is a summary of significant accounting policies consistently followed by the Funds and subsidiaries, as applicable, in preparation of their financial statements.
Investment Valuation: The Funds generally value their securities based on market prices determined at the close of regular trading on the New York Stock Exchange (“NYSE”), normally 4:00 p.m. Eastern Time, on each day the NYSE is open for trading.
For equity securities and mutual funds that are traded on an exchange, the market price is usually the closing sale or official closing price on that exchange. In the case of equity securities not traded on an exchange, or if such closing prices are not otherwise available, the securities are valued at the mean of the most recent bid and ask prices on such day.
The market price for debt obligations is generally the price supplied by an independent third-party pricing service approved by the Board, which may use a matrix, formula or other objective method that takes into consideration quotations from dealers, market transactions in comparable investments, market indices and yield curves. If vendors are unable to supply a price, or if the price supplied is deemed to be unreliable, the market price may be determined using quotations received from one or more brokers-dealers that make a market in the security. Short-term debt obligations that will mature in 60 days or less are valued at amortized cost; unless it is determined that using this method would not reflect an investment’s fair value. Investments in non-exchange traded funds are fair valued at their respective net asset values.
Futures contracts that are listed or traded on a national securities exchange, commodities exchange, contract market or comparable over the counter market, and that are freely transferable, are valued at their closing settlement price on the exchange on which they are primarily traded or
| 174 | October 31, 2014 |
| Notes to Financial Statements | ||
| October 31, 2014 |
based upon the current settlement price for a like instrument acquired on the day on which the instrument is being valued. A settlement price may not be used if the market makes a limit move with respect to a particular commodity. Over-the-counter swap contracts for which market quotations are readily available are valued based on quotes received from independent pricing services or one or more dealers that make markets in such securities.
Equity securities that are primarily traded on foreign securities exchanges are valued at the closing values of such securities on their respective foreign exchanges, except when an event occurs subsequent to the close of the foreign exchange and the close of the NYSE that was likely to have changed such value. In such an event, the fair value of those securities are determined in good faith through consideration of other factors in accordance with procedures established by and under the general supervision of the Board. The Funds will use a fair valuation model provided by an independent pricing service, which is intended to reflect fair value when a security’s value or a meaningful portion of the Fund’s portfolio is believed to have been materially affected by an valuation event that has occurred between the close of the exchange or market on which the security is traded and the close of the regular trading day on the NYSE.
Forward currency exchange contracts have a market value determined by the prevailing foreign currency exchange daily rates and current foreign currency exchange forward rates. The foreign currency exchange forward rates are calculated using an automated system that estimates rates on the basis of the current day foreign currency exchange rates and forward foreign currency exchange rates supplied by a pricing service. Foreign exchange rates and forward foreign currency exchange rates may generally be obtained at the close of the NYSE, normally 4:00 p.m. Eastern Time.
When such prices or quotations are not available, or when the Fair Value Committee appointed by the Board believes that they are unreliable, securities may be priced using fair value procedures approved by the Board.
Fair Value Measurements: The Funds disclose the classification of their fair value measurements following a three-tier hierarchy based on the inputs used to measure fair value. Inputs refer broadly to the assumptions that market participants would use in pricing the asset or liability, including assumptions about risk. Inputs may be observable or unobservable. Observable inputs reflect the assumptions market participants would use in pricing the asset or liability that are developed based on market data obtained from sources independent of the reporting entity. Unobservable inputs reflect the reporting entity’s own assumptions about the assumptions market participants would use in pricing the asset or liability that are developed based on the best information available.
Various inputs are used in determining the value of each Fund’s investments as of the end of the reporting period. When inputs used fall into different levels of the fair value hierarchy, the level in the hierarchy within which the fair value measurement falls is determined based on the lowest level input that is significant to the fair value measurement in its entirety. The designated input levels are not necessarily an indication of the risk or liquidity associated with these investments. These inputs are categorized in the following hierarchy under applicable financial accounting standards:
Level 1 – | Unadjusted quoted prices in active markets for identical investments, unrestricted assets or liabilities that a Fund has the ability to access at the measurement date; | |
Level 2 – | Quoted prices which are not active, quoted prices for similar assets or liabilities in active markets or inputs other than quoted prices that are observable (either directly or indirectly) for substantially the full term of the asset or liability; and | |
Level 3 – | Significant unobservable prices or inputs (including the Fund’s own assumptions in determining the fair value of investments) where there is little or no market activity for the asset or liability at the measurement date. | |
| 175 | October 31, 2014 |
| Notes to Financial Statements | ||
| October 31, 2014 |
The following is a summary of each Fund’s investments/financial instruments in the fair value hierarchy as of October 31, 2014:
| Investments in Securities at Value | Level 1��- Unadjusted Quoted Prices | Level 2 - Other Significant Observable Inputs | Level 3 - Significant Unobservable Inputs | Total | ||||||||||||
| ||||||||||||||||
ALPS | Alerian MLP Infrastructure Index Fund |
| |||||||||||||||
Master Limited Partnerships(a) | $ | 24,625,249 | $ | – | $ | – | $ | 24,625,249 | ||||||||
| ||||||||||||||||
Total | $ | 24,625,249 | $ | – | $ | – | $ | 24,625,249 | ||||||||
| ||||||||||||||||
| Investments in Securities at Value | Level 1 - Unadjusted Quoted Prices | Level 2 - Other Significant Observable Inputs | Level 3 - Significant Unobservable Inputs | Total | ||||||||||||
| ||||||||||||||||
ALPS | CoreCommodity Management CompleteCommodities® Strategy Fund |
| |||||||||||||||
Common Stocks(a) | $ | 147,985,549 | $ | – | $ | – | $ | 147,985,549 | ||||||||
Master Limited Partnerships(a) | 1,586,671 | – | – | 1,586,671 | ||||||||||||
Commodity-Linked Notes | – | 4,634,704 | – | 4,634,704 | ||||||||||||
Government Bonds | – | 215,660,663 | – | 215,660,663 | ||||||||||||
Purchased Options | 722,600 | – | – | 722,600 | ||||||||||||
Short Term Investments | 56,311,780 | – | – | 56,311,780 | ||||||||||||
| ||||||||||||||||
Total | $ | 206,606,600 | $ | 220,295,367 | $ | – | $ | 426,901,967 | ||||||||
| ||||||||||||||||
Other Financial Instruments | ||||||||||||||||
| ||||||||||||||||
Assets | ||||||||||||||||
Futures Contracts | $ | 896,472 | $ | – | $ | – | $ | 896,472 | ||||||||
Total Return Swap Contracts | – | 324,228 | – | 324,228 | ||||||||||||
Liabilities | ||||||||||||||||
Written Options | (938,960 | ) | – | – | (938,960 | ) | ||||||||||
Futures Contracts | (2,053,895 | ) | – | – | (2,053,895 | ) | ||||||||||
Total Return Swap Contracts | – | (6,406,192 | ) | – | (6,406,192 | ) | ||||||||||
| ||||||||||||||||
Total | $ | (2,096,383 | ) | $ | (6,081,964 | ) | $ | – | $ | (8,178,347 | ) | |||||
| ||||||||||||||||
| Investments in Securities at Value | Level 1 - Unadjusted Quoted Prices | Level 2 - Other Significant Observable Inputs | Level 3 - Significant Unobservable Inputs | Total | ||||||||||||
| ||||||||||||||||
ALPS | Kotak India Growth Fund | ||||||||||||||||
Common Stocks | ||||||||||||||||
Consumer Discretionary | $ | – | $ | 1,565,400 | $ | – | $ | 1,565,400 | ||||||||
Consumer Staples | 238,573 | 1,007,343 | – | 1,245,916 | ||||||||||||
Energy | – | 693,263 | – | 693,263 | ||||||||||||
Financials | 743,455 | 4,164,539 | – | 4,907,994 | ||||||||||||
Health Care | 230,345 | 781,457 | – | 1,011,802 | ||||||||||||
Industrials | 156,694 | 1,133,155 | – | 1,289,849 | ||||||||||||
Information Technology | – | 2,039,788 | – | 2,039,788 | ||||||||||||
Materials | 257,389 | 1,571,259 | – | 1,828,648 | ||||||||||||
Telecommunication Services | – | 427,949 | – | 427,949 | ||||||||||||
Utilities | – | 203,920 | – | 203,920 | ||||||||||||
Short Term Investments | 203,428 | – | – | 203,428 | ||||||||||||
| ||||||||||||||||
Total | $ | 1,829,884 | $ | 13,588,073 | $ | – | $ | 15,417,957 | ||||||||
| ||||||||||||||||
| 176 | October 31, 2014 |
| Notes to Financial Statements | ||
| October 31, 2014 |
| Investments in Securities at Value | Level 1 - Unadjusted Quoted Prices | Level 2 - Other Significant Observable Inputs | Level 3 - Significant Unobservable Inputs | Total | ||||||||||||
ALPS Real Asset Income Fund | ||||||||||||||||
Closed-End Funds | $ | 58,907 | $ | – | $ | – | $ | 58,907 | ||||||||
Common Stocks(a) | 1,741,463 | – | – | 1,741,463 | ||||||||||||
Exchange Traded Funds | 87,048 | – | – | 87,048 | ||||||||||||
Exchange Traded Notes | 73,900 | – | – | 73,900 | ||||||||||||
Master Limited Partnerships(a) | 901,326 | – | – | 901,326 | ||||||||||||
Commodity-Linked Notes | – | 189,924 | – | 189,924 | ||||||||||||
Short Term Investments | 340,927 | – | – | 340,927 | ||||||||||||
Total | $ | 3,203,571 | $ | 189,924 | $ | – | $ | 3,393,495 | ||||||||
Other Financial Instruments | ||||||||||||||||
Liabilities | ||||||||||||||||
Written Call Options | $ | (134 | ) | $ | – | $ | – | $ | (134 | ) | ||||||
Total | $ | (134 | ) | $ | – | $ | – | $ | (134 | ) | ||||||
| Investments in Securities at Value | Level 1 - Unadjusted Quoted Prices | Level 2 - Other Significant Observable Inputs | Level 3 - Significant Unobservable Inputs | Total | ||||||||||||
ALPS | Red Rocks Listed Private Equity Fund |
| |||||||||||||||
Common Stocks(a) | $ | 467,483,629 | $ | – | $ | – | $ | 467,483,629 | ||||||||
Short Term Investments | 3,445,979 | – | – | 3,445,979 | ||||||||||||
Total | $ | 470,929,608 | $ | – | $ | – | $ | 470,929,608 | ||||||||
| Investments in Securities at Value | Level 1 - Unadjusted Quoted Prices | Level 2 - Other Significant Observable Inputs | Level 3 - Significant Unobservable Inputs | Total | ||||||||||||
ALPS | Sterling ETF Tactical Rotation Fund |
| |||||||||||||||
Exchange Traded Funds | $ | 12,996,203 | $ | – | $ | – | $ | 12,996,203 | ||||||||
Short Term Investments | 391,455 | – | – | 391,455 | ||||||||||||
Total | $ | 13,387,658 | $ | – | $ | – | $ | 13,387,658 | ||||||||
| Investments in Securities at Value | Level 1 - Unadjusted Quoted Prices | Level 2 - Other Significant Observable Inputs | Level 3 - Significant Unobservable Inputs | Total | ||||||||||||
ALPS | Westport Resources Hedged High |
| |||||||||||||||
Exchange Traded Funds | $ | 170,413 | $ | – | $ | – | $ | 170,413 | ||||||||
Bank Loans | – | 7,693,301 | – | 7,693,301 | ||||||||||||
Convertible Corporate Bonds(a) | – | 1,189,986 | – | 1,189,986 | ||||||||||||
Corporate Bonds(a) | – | 11,733,239 | 262,500 | 11,995,739 | ||||||||||||
Mortgage Backed Securities | – | 2,182,665 | – | 2,182,665 | ||||||||||||
Short Term Investments | – | 69,989 | – | 69,989 | ||||||||||||
Total | $ | 170,413 | $ | 22,869,180 | $ | 262,500 | $ | 23,302,093 | ||||||||
Other Financial Instruments | ||||||||||||||||
Liabilities | ||||||||||||||||
Credit Default Swap | $ | – | $ | (10,674 | ) | $ | – | $ | (10,674 | ) | ||||||
Futures Contracts | (28,783 | ) | – | – | (28,783 | ) | ||||||||||
Total | $ | (28,783 | ) | $ | (10,674 | ) | $ | – | $ | (39,457 | ) | |||||
| Investments in Securities at Value | Level 1 - Unadjusted Quoted Prices | Level 2 - Other Significant Observable Inputs | Level 3 - Significant Unobservable Inputs | Total | ||||||||||||
ALPS | WMC Disciplined Value Fund |
| |||||||||||||||
Common Stocks(a) | $ | 101,291,506 | $ | – | $ | – | $ | 101,291,506 | ||||||||
Exchange Traded Funds | 537,572 | – | – | 537,572 | ||||||||||||
Short Term Investments | 1,479,573 | – | – | 1,479,573 | ||||||||||||
Total | $ | 103,308,651 | $ | – | $ | – | $ | 103,308,651 | ||||||||
| 177 | October 31, 2014 |
| Notes to Financial Statements | ||
| October 31, 2014 |
| Investments in Securities at Value | Level 1 - Unadjusted Quoted Prices | Level 2 - Other Significant Observable Inputs | Level 3 - Significant Unobservable Inputs | Total | ||||||||||||
Clough China Fund |
| |||||||||||||||
Common Stocks | ||||||||||||||||
Basic Materials | $ | – | $ | 913,062 | $ | – | $ | 913,062 | ||||||||
Communications | 1,870,048 | 18,314,342 | – | 20,184,390 | ||||||||||||
Consumer Discretionary | – | 406,748 | – | 406,748 | ||||||||||||
Consumer, Cyclical | 3,089,409 | 7,494,189 | – | 10,583,598 | ||||||||||||
Consumer, Non-cyclical | – | 1,726,713 | – | 1,726,713 | ||||||||||||
Energy | – | 2,265,482 | – | 2,265,482 | ||||||||||||
Financials | – | 21,720,920 | – | 21,720,920 | ||||||||||||
Industrials | – | 9,751,347 | – | 9,751,347 | ||||||||||||
Technology | – | 4,925,684 | – | 4,925,684 | ||||||||||||
Utilities | – | 846,347 | – | 846,347 | ||||||||||||
Exchange Traded Funds | 1,167,025 | – | – | 1,167,025 | ||||||||||||
Short Term Investments | 1,864,529 | – | – | 1,864,529 | ||||||||||||
Total | $ | 7,991,011 | $ | 68,364,834 | $ | – | $ | 76,355,845 | ||||||||
| Investments in Securities at Value | Level 1 - Unadjusted Quoted Prices | Level 2 - Other Significant Observable Inputs | Level 3 - Significant Unobservable Inputs | Total | ||||||||||||
RiverFront Conservative Income Builder Fund |
| |||||||||||||||
Common Stocks(a) | $ | 462,242 | $ | – | $ | – | $ | 462,242 | ||||||||
Exchange Traded Funds(a) | 7,841,626 | – | – | 7,841,626 | ||||||||||||
Exchange Traded Notes(a) | 192,299 | – | – | 192,299 | ||||||||||||
Short Term Investments | 433,930 | – | – | 433,930 | ||||||||||||
Total | $ | 8,930,097 | $ | – | $ | – | $ | 8,930,097 | ||||||||
| Investments in Securities at Value | Level 1 - Unadjusted Quoted Prices | Level 2 - Other Significant Observable Inputs | Level 3 - Significant Unobservable Inputs | Total | ||||||||||||
RiverFront Dynamic Equity Income Fund |
| |||||||||||||||
Common Stocks(a) | $ | 4,709,367 | $ | – | $ | – | $ | 4,709,367 | ||||||||
Exchange Traded Funds(a) | 60,183,216 | – | – | 60,183,216 | ||||||||||||
Exchange Traded Notes(a) | 1,697,367 | – | – | 1,697,367 | ||||||||||||
Short Term Investments | 1,843,732 | – | – | 1,843,732 | ||||||||||||
Total | $ | 68,433,682 | $ | – | $ | – | $ | 68,433,682 | ||||||||
| Investments in Securities at Value | Level 1 - Unadjusted Quoted Prices | Level 2 - Other Significant Observable Inputs | Level 3 - Significant Unobservable Inputs | Total | ||||||||||||
RiverFront Global Allocation Fund |
| |||||||||||||||
Common Stocks(a) | $ | 2,957,634 | $ | – | $ | – | $ | 2,957,634 | ||||||||
Exchange Traded Funds(a) | 31,506,944 | – | – | 31,506,944 | ||||||||||||
Exchange Traded Notes(a) | 865,748 | – | – | 865,748 | ||||||||||||
Short Term Investments | 897,808 | – | – | 897,808 | ||||||||||||
Total | $ | 36,228,134 | $ | – | $ | – | $ | 36,228,134 | ||||||||
| Investments in Securities at Value | Level 1 - Unadjusted Quoted Prices | Level 2 - Other Significant Observable Inputs | Level 3 - Significant Unobservable Inputs | Total | ||||||||||||
RiverFront Global Growth Fund |
| |||||||||||||||
Common Stocks(a) | $ | 6,811,206 | $ | – | $ | – | $ | 6,811,206 | ||||||||
Exchange Traded Funds(a) | 64,818,810 | – | – | 64,818,810 | ||||||||||||
Exchange Traded Notes(a) | 1,982,726 | – | – | 1,982,726 | ||||||||||||
Total | $ | 73,612,742 | $ | – | $ | – | $ | 73,612,742 | ||||||||
| 178 | October 31, 2014 |
| Notes to Financial Statements | ||
| October 31, 2014 |
| Investments in Securities at Value | Level 1 - Unadjusted Quoted Prices | Level 2 - Other Significant Observable Inputs | Level 3 - Significant Unobservable Inputs | Total | ||||||||||||
RiverFront Moderate Growth & Income Fund |
| |||||||||||||||
Common Stocks(a) | $ | 9,216,084 | $ | – | $ | – | $ | 9,216,084 | ||||||||
Exchange Traded Funds(a) | 121,045,454 | – | – | 121,045,454 | ||||||||||||
Exchange Traded Notes(a) | 4,901,937 | – | – | 4,901,937 | ||||||||||||
Short Term Investments | 1,084,172 | – | – | 1,084,172 | ||||||||||||
Total | $ | 136,247,647 | $ | – | $ | – | $ | 136,247,647 | ||||||||
| (a) | For detailed descriptions of country, sector and/or industry, see the accompanying Consolidated Statement of Investments. |
The Funds recognize transfers between levels as of the end of the period. For the Fiscal Period Ended October 31, 2014, the Funds did not have any transfers between Level 1 and Level 2 securities, except the Clough China Fund and ALPS | Kotak India Growth Fund. The Clough China Fund and ALPS | Kotak India Growth Fund utilize a fair value evaluation service with respect to international securities with an earlier market closing than the Funds’ net asset value computation cutoff. When events trigger the use of the fair value evaluation service on a reporting period date, it results in certain securities transferring from a Level 1 to a Level 2 classification. The transfer amount disclosed in the table below represents the value of the securities as of October 31, 2014 transferred in/(out) of Level 1 and Level 2 during the reporting period that were also held as of April 30, 2014.
The Clough China Fund had the following transfers out of Levels 1 and 2 at October 31, 2014:
| Level 1 - Quoted and Unadjusted Prices | Level 2 - Other Significant Observable Inputs | |||||||||||||||
| Transfers In | Transfers (Out) | Transfers In | Transfers (Out) | |||||||||||||
Common Stocks | $ | – | $ | (7,257,368 | ) | $ | 7,257,368 | $ | – | |||||||
Total | $ | – | $ | (7,257,368 | ) | $ | 7,257,368 | $ | – | |||||||
| The ALPS | Kotak India Growth Fund had the following transfers out of Levels 1 and 2 at October 31, 2014: | ||||||||||||||||
| Level 1 - Quoted and Unadjusted Prices | Level 2 - Other Significant Observable Inputs | |||||||||||||||
| Transfers In | Transfers (Out) | Transfers In | Transfers (Out) | |||||||||||||
Common Stocks | $ | 1,212,373 | $ | (295,508 | ) | $ | 295,508 | $ | (1,212,373 | ) | ||||||
Total | $ | 1,212,373 | $ | (295,508 | ) | $ | 295,508 | $ | (1,212,373 | ) | ||||||
The changes of the fair value of investments for which the Funds have used Level 3 inputs to determine the fair value are as follows:
Investments in Securities | Balance as of 2014 cement) | Accrued discount/ premium | Realized Gain/ (Loss) | Change in ciation/ ciation) | Purchases | Sales Proceeds | Transfer into Level 3 | Transfer out of Level 3 | Balance as of | Net change in unrealized Statements 2014 | ||||||||||||||||||||||||||||||
| ||||||||||||||||||||||||||||||||||||||||
Westport Resources Hedged High Income Fund |
| |||||||||||||||||||||||||||||||||||||||
Corporate Bonds | $ | – | $ | 10,107 | $ | – | $ | (33,732 | ) | $ | 286,125 | $ | – | $ | – | $ | – | $ | 262,500 | $ | (33,732 | ) | ||||||||||||||||||
| ||||||||||||||||||||||||||||||||||||||||
Total | $ | – | $ | 10,107 | $ | – | $ | (33,732 | ) | $ | 286,125 | $ | – | $ | – | $ | – | $ | 262,500 | $ | (33,732 | ) | ||||||||||||||||||
| ||||||||||||||||||||||||||||||||||||||||
| ||||||||||||||||||||||||||||||||||||||||
| 179 | October 31, 2014 |
| Notes to Financial Statements | ||
| October 31, 2014 |
Information about Level 3 fair value measurements as of October 31, 2014:
| Fair Value | Valuation Technique | Unobservable Input | ||||||
| ||||||||
Westport Resources Hedged High Income Fund | ||||||||
Assets | ||||||||
Corporate Bonds | $ | 262,500 | Broker | Broker Quote | ||||
| ||||||||
Offering Costs: The ALPS Real Asset Income Fund, the ALPS | Sterling ETF Tactical Rotation Fund and ALPS | Westport Resources Hedged High Income Fund incurred offering costs during the Fiscal Period Ended October 31, 2014. These offering costs, including fees for printing initial prospectuses, legal, and registration fees, are being amortized over the first twelve months from the inception date of each Fund. Amounts amortized through October 31, 2014 are shown on each Fund’s Statement of Operations.
Fund and Class Expenses: Some expenses of the Trust can be directly attributed to a Fund or a specific share class of a Fund. Expenses which cannot be directly attributed are apportioned among all Funds in the Trust based on average net assets of each share class within a Fund.
Federal Income Taxes: The Funds, except for ALPS | Alerian MLP Infrastructure Index Fund, comply with the requirements under Subchapter M of the Internal Revenue Code of 1986, as amended (the “Code”) applicable to regulated investment companies and intend to distribute substantially all of their net taxable income and net capital gains, if any, each year. Those Funds are not subject to income taxes to the extent such distributions are made.
The ALPS | Alerian MLP Infrastructure Index Fund is taxed as a regular corporation (or so-called subchapter “C” corporation) for federal income tax purposes, and will be subject to tax on its taxable income at rates applicable to corporations. Currently, the maximum marginal regular federal income tax rate for a corporation is 34 percent. The ALPS | Alerian MLP Infrastructure Index Fund may be subject to a 20 percent federal alternative minimum tax on its federal alternative taxable income to the extent that its alternative minimum tax exceeds its regular federal income tax. This differs from most investment companies, which elect to be treated as “regulated investment companies” under the Code in order to avoid paying entity level income taxes. Under current law, the ALPS | Alerian MLP Infrastructure Index Fund is not eligible to elect treatment as a regulated investment company due to its investments, primarily in Master Limited Partnerships (“MLPs”) invested in energy assets. As a result, the ALPS | Alerian MLP Infrastructure Index Fund will be obligated to pay applicable federal and state corporate income taxes on its taxable income as opposed to most other investment companies which are not so obligated. As discussed below, the ALPS | Alerian MLP Infrastructure Index Fund expects that a portion of the distributions it receives from MLPs may be treated as a tax-deferred return of capital, thus reducing the Fund’s current tax liability. However, the amount of taxes currently paid by the ALPS | Alerian MLP Infrastructure Index Fund will vary depending on the amount of income and gains derived from investments and/or sales of MLP interests and such taxes will reduce the return from an investment in the Fund. See further disclosure regarding MLPs below.
As of and during the Fiscal Period Ended October 31, 2014, the Funds did not have a liability for any unrecognized tax benefits. The Funds file U.S. federal, state, and local tax returns as required. The Funds’ tax returns are subject to examination by the relevant tax authorities until expiration of the applicable statute of limitations which is generally three years after the filing of the tax return, but may extend to four years in certain jurisdictions. Tax returns for open years have incorporated no uncertain tax positions that require a provision for income taxes.
Distributions to Shareholders: Each Fund, except the ALPS | CoreCommodity Management CompleteCommodities® Strategy Fund, RiverFront Conservative Income Builder Fund, RiverFront Dynamic Equity Income Fund, and RiverFront Moderate Growth & Income Fund normally pays dividends and distributes capital gains, if any, on an annual basis. The ALPS | CoreCommodity Management CompleteCommodities® Strategy Fund, RiverFront Conservative Income Builder Fund, RiverFront Dynamic Equity Income Fund, and RiverFront Moderate Growth & Income Fund pay dividends, if any, on a quarterly basis and distribute capital gains annually. Income dividend distributions are derived from interest and other income the Fund receives from its investments, including distributions of short-term capital gains. Capital gain distributions are derived from gains realized when the Fund sells a security it has owned for more than a year. Each Fund may make additional distributions and dividends at other times if its portfolio manager or managers believe doing so may be necessary for the Fund to avoid or reduce taxes.
Distributions received from the ALPS | Alerian MLP Infrastructure Index Fund’s investments in MLPs generally are comprised of income and return of capital. The Fund records investment income and return of capital based on estimates made at the time such distributions are received. Such estimates are based on historical information available from each MLP and other industry sources. These estimates may subsequently be revised based on information received from MLPs after their tax reporting periods are concluded. Return of capital distributions are not taxable income to the shareholder, but reduce the investor’s tax basis in the investor’s Fund shares. Such a reduction in tax basis will result in larger taxable gains and/or lower tax losses on a subsequent sale of Fund shares. Shareholders who periodically receive the payment of dividends or other distributions consisting of a return of capital may be under the impression that they are receiving net profits from the Fund when, in fact, they are not. Shareholders should not assume that the source of the distributions is from the net profits of the Fund.
| 180 | October 31, 2014 |
| Notes to Financial Statements | ||
| October 31, 2014 |
Commodity-Linked Notes: The ALPS | CoreCommodity Management CompleteCommodities® Strategy Fund and ALPS Real Asset Income Fund may invest in commodity-linked notes which are derivative instruments that have characteristics of a debt security and of a commodity-linked derivative. A commodity-linked note typically provides for interest payments and a principal payment at maturity linked to the price movement of the underlying commodity, commodity index or commodity futures or option contract. Commodity-linked notes may be principal protected, partially protected, or offer no principal protection. The value of these notes will rise and fall in response to changes in the underlying commodity or related index or investment. These notes are often leveraged, increasing the volatility of each note’s value relative to the change in the underlying linked index. Commodity index-linked investments may be more volatile and less liquid than the underlying index and their value may be affected by the performance of the commodities as well as other factors, including liquidity, quality, maturity and other economic variables. Commodity-linked notes are typically issued by a bank or other financial institution and are sometimes referred to as structured notes because the terms of the notes may be structured by the issuer and the purchaser of the notes to accommodate the specific investment requirements of the purchaser.
Investment Transactions and Investment Income: Investment transactions are accounted for on the date the investments are purchased or sold (trade date basis). Net realized gains and losses from investment transactions are reported on an identified cost basis. Interest income, which includes accretion of discounts and amortization of premiums, is accrued and recorded as earned. Dividend income is recognized on the ex-dividend date or for certain foreign securities, as soon as information is available to each Fund.
Foreign Securities: Each Fund may directly purchase securities of foreign issuers. Investing in securities of foreign issuers involves special risks not typically associated with investing in securities of U.S. issuers. The risks include possible reevaluation of currencies, the inability to repatriate foreign currency, less complete financial information about companies and possible future adverse political and economic developments.
Moreover, securities of many foreign issuers and their markets may be less liquid and their prices more volatile than those of securities of comparable U.S. issuers.
Foreign Currency Translation: The books and records of the Funds are maintained in U.S. dollars. Investment valuations and other assets and liabilities initially expressed in foreign currencies are converted each business day into U.S. dollars based upon current exchange rates. The portion of realized and unrealized gains or losses on investments due to fluctuations in foreign currency exchange rates is not separately disclosed and is included in realized and unrealized gains or losses on investments, when applicable.
Foreign Currency Spot Contracts: The Funds may enter into foreign currency spot contracts to facilitate transactions in foreign securities or to convert foreign currency receipts into U.S. dollars. A foreign currency spot contract is an agreement between two parties to buy and sell currencies at the current market rate, for settlement generally within two business days. The U.S. dollar value of the contracts is determined using current currency exchange rates supplied by a pricing service. The contract is marked-to-market daily for settlements beyond one day and any change in market value is recorded as an unrealized gain or loss. When the contract is closed, the Fund records a realized gain or loss equal to the difference between the value on the open and close date. Losses may arise from changes in the value of the foreign currency, or if the counterparties do not perform under the contract’s terms. The maximum potential loss from such contracts is the aggregate face value in U.S. dollars at the time the contract was opened.
Real Estate Investment Trusts (“REITs”): The Funds may invest a portion of their assets in REITs and are subject to certain risks associated with direct investment in REITs. REITs may be affected by changes in the value of their underlying properties and by defaults by borrowers or tenants. REITs depend generally on their ability to generate cash flow to make distributions to shareowners, and certain REITs have self-liquidation provisions by which mortgages held may be paid in full and distributions of capital returns may be made at any time. In addition, the performance of a REIT may be affected by its failure to qualify for tax-free pass-through of income under the Internal Revenue Code of 1986, as amended (the “Code”), or its failure to maintain exemption from registration under the 1940 Act.
Treasury Inflation Protected-Securities: The Funds may invest in treasury inflation protected securities (“TIPS”), including structured bonds in which the principal amount is adjusted daily to keep pace with inflation, as measured by the U.S. Consumer Pricing Index for Urban Consumers. The adjustments to principal due to inflation/deflation are reflected as increases/decreases to interest income with a corresponding adjustment to cost. Such adjustments may have a significant impact on a Fund’s distributions and may result in a return of capital to shareholders. The repayment of the original bond principal upon maturity is guaranteed by the full faith and credit of the U.S. Government.
Loan Participations and Assignments: Certain Funds may invest in loan participations and assignments. The Fund considers loan participations and assignments to be investments in debt securities. Loan participations typically will result in the Fund having a contractual relationship only with the lender, not with the borrower. The Fund will have the right to receive payments of principal, interest and any fees to which it is entitled only from the lender selling the participation and only upon receipt by the lender of the payments from the borrower. Under a loan participation, the
| 181 | October 31, 2014 |
| Notes to Financial Statements | ||
| October 31, 2014 |
Fund generally will have no right to enforce compliance by the borrower with the terms of the loan agreement relating to the loan, nor any rights of set-off against the borrower, and the Fund may not benefit directly from any collateral supporting the loan in which it has purchased the participation. As a result, the Fund will assume the credit risk of both the borrower and the lender that is selling the participation. In the event of the insolvency of the lender selling a participation, the Fund may be treated as a general creditor of the lender and may not benefit from any set-off between the lender and the borrower. When the Fund purchases assignments of loans from lenders, the Fund will acquire direct rights against the borrower on the loan, except that under certain circumstances such rights may be more limited than those held by the assigning lender.
Master Limited Partnerships: MLPs are publicly traded partnerships engaged in the transportation, storage and processing of minerals and natural resources. By confining their operations to these specific activities, their interests, or units, are able to trade on public securities exchanges exactly like the shares of a corporation, without entity level taxation. To qualify as a MLP and to not be taxed as a corporation, a partnership must receive at least 90% of its income from qualifying sources as set forth in Section 7704(d) of the Code. These qualifying sources include natural resource based activities such as the processing, transportation and storage of mineral or natural resources. MLPs generally have two classes of owners, the general partner and limited partners. The general partner of an MLP is typically owned by a major energy company, an investment fund, the direct management of the MLP, or is an entity owned by one or more of such parties. The general partner may be structured as a private or publicly traded corporation or other entity. The general partner typically controls the operations and management of the MLP through an up to 2% equity interest in the MLP plus, in many cases, ownership of common units and subordinated units. Limited partners typically own the remainder of the partnership, through ownership of common units, and have a limited role in the partnership’s operations and management. MLPs are typically structured such that common units and general partner interests have first priority to receive quarterly cash distributions up to an established minimum amount (“minimum quarterly distributions” or “MQD”). Common and general partner interests also accrue arrearages in distributions to the extent the MQD is not paid. Once common and general partner interests have been paid, subordinated units receive distributions of up to the MQD; however, subordinated units do not accrue arrearages. Distributable cash in excess of the MQD is paid to both common and subordinated units and is distributed to both common and subordinated units generally on a pro rata basis. The general partner is also eligible to receive incentive distributions if the general partner operates the business in a manner which results in distributions paid per common unit surpassing specified target levels. As the general partner increases cash distributions to the limited partners, the general partner receives an increasingly higher percentage of the incremental cash distributions.
3. DERIVATIVE INSTRUMENTS
As a part of their investment strategy, the ALPS | CoreCommodity Management CompleteCommodities® Strategy Fund, ALPS | Kotak India Growth Fund, ALPS Real Asset Income Fund and ALPS | Westport Resources Hedged High Income Fund are permitted to enter in various types of derivatives contracts. The other funds including ALPS | Alerian MLP Infrastructure Index Fund, ALPS | Red Rocks Listed Private Equity Fund, ALPS|Sterling ETF Tactical Rotation Fund, ALPS | WMC Disciplined Value Fund, Clough China Fund, RiverFront Conservative Income Builder Fund, RiverFront Dynamic Equity Income Fund, RiverFront Global Allocation Fund, RiverFront Global Growth Fund and RiverFront Moderate Growth & Income Fund may invest to a lesser extent in derivatives contracts. In doing so, the Funds will employ strategies in differing combinations to permit them to increase, decrease, or change the level or types of exposure to market factors. Central to those strategies are features inherent in derivatives that make them more attractive for this purpose than equity or debt securities; they require little or no initial cash investment, they can focus exposure on only certain selected risk factors, and they may not require the ultimate receipt or delivery of the underlying security (or securities) to the contract. This may allow the Funds to pursue their objectives more quickly and efficiently than if they were to make direct purchases or sales of securities capable of affecting a similar response to market factors.
Cash collateral that has been pledged to cover derivative obligations of the Funds and cash collateral received from the counterparty, if any, is reported separately on the Statements of Assets and Liabilities as cash pledged as collateral and cash received as collateral, respectively. Non-cash collateral pledged by the Funds, if any, is noted in the Statements of Investments.
Risk of Investing in Derivatives: The Funds’ use of derivatives can result in losses due to unanticipated changes in the market risk factors and the overall market. In instances where the Funds are using derivatives to decrease, or hedge, exposures to market risk factors for securities held by the Funds, there are also risks that those derivatives may not perform as expected resulting in losses for the combined or hedged positions.
Derivatives may have little or no initial cash investment relative to their market value exposure and therefore can produce significant gains or losses in excess of their cost. This use of embedded leverage allows the Fund to increase its market value exposure relative to its net assets and can substantially increase the volatility of the Funds’ performance.
Additional associated risks from investing in derivatives also exist and potentially could have significant effects on the valuation of the derivative and the Funds. Typically, the associated risks are not the risks that the Funds are attempting to increase or decrease exposure to, per their investment objectives, but are the additional risks from investing in derivatives.
| 182 | October 31, 2014 |
| Notes to Financial Statements | ||
| October 31, 2014 |
Examples of these associated risks are liquidity risk, which is the risk that the Funds will not be able to sell or close out the derivative in a timely manner, and counterparty credit risk, which is the risk that the counterparty will not fulfill its obligation to the Funds. In addition, use of derivatives may increase or decrease exposure to the following risk factors:
Equity Risk: Equity risk relates to the change in value of equity securities as they relate to increases or decreases in the general market. Associated risks can be different for each type of derivative and are discussed by each derivative type in the notes that follow.
Commodity Risk: Exposure to the commodities markets may subject the Funds to greater volatility than investments in traditional securities. Prices of various commodities may also be affected by factors, such as drought, floods, weather, livestock disease, embargoes, tariffs and other regulatory developments, which are unpredictable. The prices of commodities can also fluctuate widely due to supply and demand disruptions in major producing or consuming regions.
Foreign Currency Risk: Currency trading involves significant risks, including market risk, interest rate risk, country risk, counterparty credit risk and short sale risk. Market risk results from the price movement of foreign currency values in response to shifting market supply and demand. Interest rate risk arises whenever a country changes its stated interest rate target associated with its currency. Country risk arises because virtually every country has interfered with international transactions in its currency.
Interest Rate Risk: Interest rate risk is the risk that fixed income securities will decline in value because of changes in interest rates. As nominal interest rates rise, the value of fixed income securities held by the Funds are likely to decrease. Securities with longer durations tend to be more sensitive to changes in interest rates, and are usually more volatile than securities.
Swap Contracts: Each Fund may enter into swap transactions for hedging purposes or to seek to increase total return. At the present time, the CoreCommodity Fund primarily enters into swap transactions for the purpose of increasing total return and the ALPS Westport Hedged High Income Fund for hedging purposes. Risks may arise as a result of the failure of the counterparty to the swap contract to comply with the terms of the swap contract. The loss incurred by the failure of a counterparty is generally limited to the net payment to be received by the Funds and/or the termination value at the end of the contract.
Therefore, the Funds consider the creditworthiness of each counterparty to a contract in evaluating potential credit risk. Additionally, risks may arise from unanticipated movements in interest rates or in the value of the underlying reference asset or index. Entering into these agreements involves, to varying degrees, market risk, liquidity risk and elements of credit, legal and documentation risk that are not directly reflected in the amounts recognized in the Statements of Assets and Liabilities.
The Funds may pay or receive cash as collateral on these contracts which may be recorded as an asset and/or liability. The Funds must set aside liquid assets, or engage in other appropriate measures, to cover its obligations under these contracts. Swaps are marked to market daily using either pricing vendor quotations, counterparty prices or model prices and the change in value, if any, is recorded as an unrealized gain or loss. Upfront payments made and/or received by the Funds are recorded as an asset and/or liability and realized gains or losses are recognized ratably over the contract’s term/event, with the exception of forward starting interest rate swaps, whose realized gains or losses are recognized ratably from the effective start date. Periodic payments received or made on swap contracts are recorded as realized gains or losses. Gains or losses are realized upon termination of a swap contract and are recorded on the Statement of Operations.
Total return swaps are agreements in which there is an exchange of cash flows whereby one party commits to make payments based on the total return (coupons plus capital gains/losses) of an underlying instrument in exchange for fixed or floating rate interest payments. To the extent the total return of the instrument or index underlying the transaction exceeds or falls short of the offsetting interest rate obligation, the Fund will receive a payment from or make a payment to the counterparty. Credit default swaps are a type of swap agreement in which the protection “buyer” is generally obligated to pay the protection “seller” an upfront and/or a periodic stream of payments over the term of the contract provided that no credit event, such as a default, on a reference obligation has occurred. Credit default swaps (“CDS”) are typically two-party financial contracts that transfer credit exposure between the two parties. Under a typical CDS, one party (the “seller”) receives pre-determined periodic payments from the other party (the “buyer”). The seller agrees to make compensating specific payments to the buyer if a negative credit event occurs, such as the bankruptcy or default by the issuer of the underlying debt instrument. Swap agreements held at October 31, 2014 are disclosed after the Statement of Investments.
The number of swap contracts held at October 31, 2014 is representative of the swap contract activity for the Fiscal Periods Ended October 31, 2014.
Futures: Each Funds may invest in futures contracts in accordance with their investment objectives. Each Fund does so for a variety of reasons including for cash management, hedging or non-hedging purposes in an attempt to achieve investment returns consistent with the Fund’s investment objective. A futures contract provides for the future sale by one party and purchase by another party of a specified quantity of the
| 183 | October 31, 2014 |
| Notes to Financial Statements | ||
| October 31, 2014 |
security or other financial instrument at a specified price and time. A futures contract on an index is an agreement pursuant to which two parties agree to take or make delivery of an amount of cash equal to the difference between the value of the index at the close of the last trading day of the contract and the price at which the index contract was originally written. Futures transactions may result in losses in excess of the amount invested in the futures contract. There can be no guarantee that there will be a correlation between price movements in the hedging vehicle and in the portfolio securities being hedged. An incorrect correlation could result in a loss on both the hedged securities in a Fund and the hedging vehicle so that the portfolio return might have been greater had hedging not been attempted. There can be no assurance that a liquid market will exist at a time when a Fund seeks to close out a futures contract or a futures option position. Lack of a liquid market for any reason may prevent a Fund from liquidating an unfavorable position, and the Fund would remain obligated to meet margin requirements until the position is closed. In addition, a Fund could be exposed to risk if the counterparties to the contracts are unable to meet the terms of their contracts. With exchange traded futures, there is minimal counterparty credit risk to the Funds since futures are exchange traded and the exchange’s clearinghouse, as counterparty to all exchange traded futures, guarantees the futures against default.
When a purchase or sale of a futures contract is made by a Fund, the Fund is required to deposit with its custodian (or broker, if legally permitted) a specified amount of liquid assets (“initial margin”). The margin required for a futures contract is set by the exchange on which the contract is traded and may be modified during the term of the contract. The initial margin is in the nature of a performance bond or good faith deposit on the futures contract that is returned to a Fund upon termination of the contract, assuming all contractual obligations have been satisfied. Each day a Fund may pay or receive cash, called “variation margin,” equal to the daily change in value of the futures contract. Such payments or receipts are recorded for financial statement purposes as unrealized gains or losses by a Fund. Variation margin does not represent a borrowing or loan by a Fund but is instead a settlement between a Fund and the broker of the amount one would owe the other if the futures contract expired. When the contract is closed, a Fund records a realized gain or loss equal to the difference between the value of the contract at the time it was opened and the value at the time it was closed. The number of futures contracts held at October 31, 2014 is representative of futures contracts activity during the Fiscal Periods Ended October 31, 2014.
Option Contracts: Each Fund may enter into options transactions for hedging purposes and for non-hedging purposes such as seeking to enhance return. Each Fund may write covered put and call options on any stocks or stock indices, currencies traded on domestic and foreign securities exchanges, or futures contracts on stock indices, interest rates and currencies traded on domestic and, to the extent permitted by the CFTC, foreign exchanges. A call option on an asset written by a Fund obligates the Fund to sell the specified asset to the holder (purchaser) at a stated price (the exercise price) if the option is exercised before a specified date (the expiration date). A put option on an asset written by a Fund obligates the Fund to buy the specified asset from the purchaser at the exercise price if the option is exercised before the expiration date. Premiums received when writing options are recorded as liabilities and are subsequently adjusted to the current value of the options written. Premiums received from writing options that expire are treated as realized gains. Premiums received from writing options, which are either exercised or closed, are offset against the proceeds received or amount paid on the transaction to determine realized gains or losses which are recorded on the Statement of Operations.
The Funds had the following transactions in written covered call/put options during the Fiscal Periods Ended October 31, 2014:
| Number of Contracts | Premiums | |||||||||||
| ||||||||||||
ALPS | CoreCommodity Management CompleteCommodities® Strategy Fund |
| |||||||||||
Options Outstanding, at the beginning period | (200 | ) | $ | 502,628 | ||||||||
Options written | (3,266 | ) | 2,083,513 | |||||||||
Stock split | (18 | ) | – | |||||||||
Options closed | 2,248 | (785,993 | ) | |||||||||
Options exercised | 55 | (10,173 | ) | |||||||||
Options expired | 645 | (603,494 | ) | |||||||||
| ||||||||||||
Options Outstanding, at October 31, 2014 | (536 | ) | $ | 1,186,481 | ||||||||
| ||||||||||||
| ||||||||||||
| Number of Contracts | Premiums | |||||||||||
| ||||||||||||
ALPS Real Asset Income Fund | ||||||||||||
Options Outstanding, at the beginning period | – | $ | – | |||||||||
Options written | (59 | ) | 4,187 | |||||||||
Options closed | 14 | (952 | ) | |||||||||
Options exercised | 7 | (598 | ) | |||||||||
Options expired | 31 | (2,086 | ) | |||||||||
| ||||||||||||
Options Outstanding, at October 31, 2014 | (7 | ) | $ | 551 | ||||||||
| ||||||||||||
| ||||||||||||
| 184 | October 31, 2014 |
| Notes to Financial Statements | ||
| October 31, 2014 |
Derivatives Instruments: The following tables disclose the amounts related to each Fund’s use of derivative instruments.
The effect of derivatives instruments on the Statement of Assets and Liabilities as of October 31, 2014:
| Risk Exposure | Asset Location | Fair Value | Liability Location | Fair Value | ||||||||
ALPS | CoreCommodity Management CompleteCommodities® Strategy Fund(a) |
| |||||||||||
Equity Contracts | Investments, at value | $ | 722,600 | N/A | $ | N/A | ||||||
Equity Contracts | N/A | N/A | Written options, at value | 938,960 | ||||||||
Futures Contracts* | Receivable for variation | 896,472 | Payable for variation | 2,053,895 | ||||||||
Commodity Contracts | Unrealized appreciation on total return swap contracts | 324,228 | Unrealized depreciation | 6,406,192 | ||||||||
Total | $ | 1,943,300 | $ | 9,399,047 | ||||||||
* Risk Exposure to | ||||||||||||
Commodity Contracts | $ | 896,472 | $ | 1,940,744 | ||||||||
Equity Contracts | – | 113,151 | ||||||||||
| $ | 896,472 | $ | 2,053,895 | |||||||||
ALPS Real Asset Income Fund(a) | ||||||||||||
Equity Contracts | N/A | N/A | Written options, at value | $ | 134 | |||||||
Total | N/A | $ | 134 | |||||||||
ALPS | Westport Resources Hedged High Income Fund |
| |||||||||||
Futures Contracts* | Receivable for variation | N/A | Payable for variation | $ | 28,783 | |||||||
Interest Rate Contracts | Unrealized appreciation on credit default swap | N/A | Unrealized depreciation | 10,674 | ||||||||
Total | N/A | $ | 39,457 | |||||||||
* Risk Exposure to | ||||||||||||
Equity Contracts | $ | – | $ | 28,783 | ||||||||
| $ | – | $ | 28,783 | |||||||||
| (a) | The ALPS | CoreCommodity Management CompleteCommodities® Strategy Fund and the ALPS Real Asset Income Fund use consolidated statements of assets and liabilities. |
| (b) | Includes cumulative appreciation (depreciation) of futures contracts as reported in the consolidated statement of investments. |
| 185 | October 31, 2014 |
| Notes to Financial Statements | ||
| October 31, 2014 |
The effect of derivatives instruments on the Statement of Operations for the Fiscal Periods Ended October 31, 2014:
| Risk Exposure | Statement of Operations Location | Realized Gain/(Loss) on Derivatives Recognized in Income | Change in Unrealized Appreciation/(Depreciation) on Derivatives Recognized in Income | |||||||
ALPS | CoreCommodity Management CompleteCommodities® Strategy Fund(a) |
| |||||||||
Equity Contracts | Net realized loss on investments/Net change in unrealized (depreciation) on investments | $ | (1,193,105 | ) | $ | (1,508,088 | ) | |||
Equity Contracts | Net realized gain on written options/Net change in unrealized appreciation on written options | 557,104 | 182,393 | |||||||
Futures Contracts* | Net realized gain on futures contracts/Net change in unrealized (depreciation) on futures contracts | 303,684 | (1,130,003 | ) | ||||||
Commodity Contracts | Net realized gain on total return swap contracts/Net change in unrealized (depreciation) on total return swap contracts | (21,272,562 | ) | (10,250,858 | ) | |||||
Total | $ | (21,604,879 | ) | $ | (12,706,556 | ) | ||||
*Risk Exposure to Fund | ||||||||||
| �� | Commodity Contracts | $ | (172,956 | ) | $ | (1,715,512 | ) | |||
Currency Contracts | (249 | ) | – | |||||||
Equity Contracts | 476,889 | 585,509 | ||||||||
| $ | 303,684 | $ | (1,130,003 | ) | ||||||
ALPS Real Asset Income Fund(a) |
| |||||||||
Equity Contracts | Net realized gain on written options/Net change in unrealized appreciation on written options | 2,135 | 417 | |||||||
Total | $ | 2,315 | $ | 417 | ||||||
ALPS | Red Rocks Listed Private Equity Fund |
| |||||||||
Equity Contracts | Net realized gain on investments/Net change in unrealized appreciation/depreciation on investments | $ | 65,762 | N/A | ||||||
Total | $ | 65,762 | N/A | |||||||
ALPS | Westport Resources Hedged High Income Fund |
| |||||||||
Futures Contracts* | Net realized loss on futures contracts/Net change in unrealized depreciation on futures contracts | (61,854 | ) | (28,783 | ) | |||||
Interest Rate Contracts | Net realized loss on credit defualt swap contracts/Net change in unrealized depreciation on credit default swap contracts | (1,944 | ) | (10,674 | ) | |||||
Total | $ | (63,798 | ) | $ | (39,457 | ) | ||||
*Risk Exposure to Fund | ||||||||||
Fixed Income Contracts | $ | (61,854 | ) | $ | (28,783 | ) | ||||
| $ | (61,854 | ) | $ | (28,783 | ) | |||||
| (a) | The ALPS | CoreCommodity Management CompleteCommodities® Strategy Fund and the ALPS Real Asset Income Fund use consolidated statements of operations. |
| 186 | October 31, 2014 |
| Notes to Financial Statements | ||
| October 31, 2014 |
The effect of derivatives instruments on the Consolidated Statement of Operations for the Fiscal Year Ended April 30, 2014:
| Risk Exposure | Statement of Operations Location | Realized Gain/(Loss) in Income | Change in Unrealized Appreciation/(Depreciation) on Derivatives Recognized in Income | |||||||
ALPS | CoreCommodity Management CompleteCommodities® Strategy Fund |
| |||||||||
Equity Contracts (Purchased Options) | Net realized loss on investments/Net change in unrealized appreciation on investments | $ | (954,105) | $ | (1,098,556) | |||||
Equity Contracts (Written Options) | Net realized gain on written options/Net change in unrealized appreciation on written options | 240,680 | 65,128 | |||||||
Futures Contracts* | Net realized loss on futures contracts/Net change in unrealized appreciation on futures contracts | (7,044,122) | 1,887,507 | |||||||
Commodity Contracts (Total Return Swap Contracts) | Net realized gain on total return swap contracts/Net change in unrealized appreciation on total return swap contracts | 6,067,345 | 9,186,316 | |||||||
Total | $ | (1,690,192) | $ | 12,237,507 | ||||||
| *Risk Exposure to Fund | ||||||||||
| Commodity Contracts | $ | (2,551,041) | $ | 2,164,271 | ||||||
| Currency Contracts | (16,007) | – | ||||||||
| Equity Contracts | (4,499,724) | (276,764) | ||||||||
Fixed Income Contracts | 22,660 | – | ||||||||
| $ | (7,044,112) | $ | 1,887,507 | |||||||
ALPS | Kotak India Growth Fund(a) | ||||||||||
Futures Contracts (Equity Contracts) | Net realized gain on futures contracts/Net change in unrealized appreciation on futures contracts | $ | 10,181 | $ | – | |||||
Total | $ | 10,181 | $ | – | ||||||
Certain derivative contracts are executed under either standardized netting agreements or, for exchange-traded derivatives, the relevant contracts for a particular exchange which contain enforceable netting provisions. A derivative netting arrangement creates an enforceable right of set-off that becomes effective, and affects the realization of settlement on individual assets, liabilities and collateral amounts, only following a specified event of default or early termination. Default events may include the failure to make payments or deliver securities timely, material adverse changes in financial condition or insolvency, the breach of minimum regulatory capital requirements, or loss of license, charter or other legal authorization necessary to perform under the contract.
The following table presents financial instruments that are subject to enforceable netting arrangements or other similar agreements as of October 31, 2014:
| Offsetting of Derivatives Asset |
October 31, 2014 |
Gross Amounts Not Offset in the Statement of Financial Position | ||||||||||||||||||||||||
| Description | Gross Amounts of Recognized Assets | Gross Amounts Offset in the Statement of Assets and Liabiltities | Net Amounts Presented in the Statement of Assets and Liabiltities | Financial Instruments (a) | Cash Collateral Received(a) | Net Amount | ||||||||||||||||||
ALPS | CoreCommodity Management CompleteCommodities® Strategy Fund |
| |||||||||||||||||||||||
Total Return Swap Contracts | $ | 324,228 | $ | – | $ | 324,228 | $ | (324,228 | ) | $ | – | $ | – | |||||||||||
Total | $ | 324,228 | $ | – | $ | 324,228 | $ | (324,228 | ) | $ | – | $ | – | |||||||||||
| ||||||||||||||||||||||||
| 187 | October 31, 2014 |
| Notes to Financial Statements | ||
| October 31, 2014 |
Offsetting of Derivatives Liability | ||||||||||||
October 31, 2014 | ||||||||||||
|
| Gross Amounts Not Offset in the Statement of Financial Position |
| ||||||||||||||||||||||
Description | | Gross Amounts of Recognized Liabilities | | | Gross Amounts Offset in the Statement of Assets and Liabilities | | | Net Amounts Presented in the Statement of Assets and Liabilities | | | Financial Instruments (a) | | | Cash Collateral Pledged(a) | | Net Amount | ||||||||
ALPS | CoreCommodity Management CompleteCommodities® Strategy Fund |
| |||||||||||||||||||||||
Total Return Swap Contracts | $ | 6,406,192 | $ | – | $ | 6,406,192 | $ | (4,502,685 | ) | $ | (1,903,507 | ) | $ | – | ||||||||||
Total | $ | 6,406,192 | $ | – | $ | 6,406,192 | $ | (4,502,685 | ) | $ | (1,903,507 | ) | $ | – | ||||||||||
| (a) | These amounts are limited to the derivative asset/liability balance and, accordingly, do not include excess collateral received/pledged. |
4. TAX BASIS INFORMATION
Tax Basis of Distributions to Shareholders: The character of distributions made during the year from net investment income or net realized gains may differ from its ultimate characterization for federal income tax purposes. Also, due to the timing of dividend distributions, the fiscal year in which amounts are distributed may differ from the fiscal year in which the income or realized gain were recorded by a Fund. The amounts and characteristics of tax basis distributions and composition of distributable earnings/(accumulated losses) are finalized at fiscal year-end.
The tax character of distributions paid by the Funds for the Fiscal Periods Ended October 31, 2014 were as follows:
| Fund | Ordinary Income | Long-Term Capital Gain | Return of Capital | |||||||||
ALPS | Alerian MLP Infrastructure Index Fund | $ | 94,908 | $ | – | $ | 828,416 | ||||||
ALPS | CoreCommodity Management CompleteCommodities® Strategy Fund | – | – | – | |||||||||
ALPS | Kotak India Growth Fund | – | – | – | |||||||||
ALPS Real Asset Income Fund | 120,860 | – | – | |||||||||
ALPS | Red Rocks Listed Private Equity Fund | – | – | – | |||||||||
ALPS | Sterling ETF Tactical Rotation Fund | – | – | – | |||||||||
ALPS | Westport Resources Hedged High Income Fund | 833,792 | – | – | |||||||||
ALPS | WMC Disciplined Value Fund | – | – | – | |||||||||
Clough China Fund | – | – | – | |||||||||
RiverFront Conservative Income Builder Fund | 35,707 | – | – | |||||||||
RiverFront Dynamic Equity Income Fund | 355,945 | – | – | |||||||||
RiverFront Global Allocation Fund | – | – | – | |||||||||
RiverFront Global Growth Fund | – | – | – | |||||||||
RiverFront Moderate Growth & Income Fund | 860,964 | – | – | |||||||||
The tax character of distributions paid by the Funds for the Year Ended April 30, 2014 were as follows:
| Fund | Ordinary Income | Long-Term Capital Gain | Return of Capital | |||||||||
ALPS | Alerian MLP Infrastructure Index Fund | $ | 227,947 | $ | – | $ | 235,856 | ||||||
ALPS | CoreCommodity Management CompleteCommodities® Strategy Fund | – | – | – | |||||||||
ALPS | Kotak India Growth Fund | 9,601 | – | – | |||||||||
ALPS | Red Rocks Listed Private Equity Fund | 23,299,948 | – | – | |||||||||
ALPS | WMC Disciplined Value Fund | 1,909,564 | 222,794 | – | |||||||||
Clough China Fund | 699,998 | – | – | |||||||||
RiverFront Conservative Income Builder Fund | 137,318 | – | – | |||||||||
RiverFront Dynamic Equity Income Fund | 983,577 | 1,181,243 | – | |||||||||
RiverFront Global Allocation Fund | 602,677 | 348,551 | – | |||||||||
RiverFront Global Growth Fund | 1,466,563 | 5,048,799 | – | |||||||||
RiverFront Moderate Growth & Income Fund | 3,583,646 | 3,525,177 | – | |||||||||
| 188 | October 31, 2014 |
| Notes to Financial Statements | ||
| October 31, 2014 | ||
The tax character of distributions paid by the Funds for the Fiscal Year or Periods Ended April 30, 2013 were as follows:
| Fund | Ordinary Income | Long-Term Capital Gain | Return of Capital | |||||||||
ALPS | Alerian MLP Infrastructure Index Fund | $ | – | $ | – | $ | 49,338 | ||||||
ALPS | CoreCommodity Management CompleteCommodities® Strategy Fund | – | – | 1,317,510 | |||||||||
ALPS | Kotak India Growth Fund | – | – | – | |||||||||
ALPS | Red Rocks Listed Private Equity Fund | 3,300,025 | – | – | |||||||||
ALPS | WMC Disciplined Value Fund | 890,012 | – | – | |||||||||
Clough China Fund | 100,016 | – | – | |||||||||
RiverFront Conservative Income Builder Fund | 16,480 | – | – | |||||||||
RiverFront Dynamic Equity Income Fund | 511,037 | – | – | |||||||||
RiverFront Global Allocation Fund | 250,390 | – | – | |||||||||
RiverFront Global Growth Fund | 802,738 | – | – | |||||||||
RiverFront Moderate Growth & Income Fund | 1,511,757 | – | – | |||||||||
Components of Distributable Earnings on a Tax Basis: At October 31, 2014, permanent differences in book and tax accounting were reclassified. These differences had no effect on net assets and were primarily attributed to differences in the treatment of commodity related exchange-traded funds, the differing tax treatment of foreign currency, investments in partnerships, Passive Foreign Investment Companies (“PFICs”) and certain other investments.
For the Fiscal Periods Ended October 31, 2014, the following reclassifications, which had no impact on results of operations or net assets, were recorded to reflect tax character:
| Fund | Paid-in Capital | Accumulated Net Investment Income | Accumulated Net Realized Gain/(Loss) on Investments | |||||||||
ALPS | CoreCommodity Management CompleteCommodities® Strategy Fund | $ | (21,466,775 | ) | $ | 381,120 | $ | 21,085,655 | |||||
ALPS | Kotak India Growth Fund | 1 | 85,518 | (85,519 | ) | ||||||||
ALPS Real Asset Income Fund | (69,425 | ) | 56,722 | 12,703 | ||||||||
ALPS | Red Rocks Listed Private Equity Fund | 1 | 5,608,155 | (5,608,156 | ) | ||||||||
ALPS | Sterling ETF Tactical Rotation Fund | (7,475 | ) | 7,475 | – | ||||||||
ALPS | Westport Resources Hedged High Income Fund | (65,105 | ) | 69,954 | (4,849 | ) | |||||||
ALPS | WMC Disciplined Value Fund | – | 43,052 | (43,052 | ) | ||||||||
Clough China Fund | – | (677 | ) | 677 | ||||||||
RiverFront Conservative Income Builder Fund | – | – | – | |||||||||
RiverFront Dynamic Equity Income Fund | – | – | – | |||||||||
RiverFront Global Allocation Fund | – | – | – | |||||||||
RiverFront Global Growth Fund | – | – | – | |||||||||
RiverFront Moderate Growth & Income Fund | (152 | ) | 152 | – | ||||||||
Included in the amounts reclassified was a net operating loss offset to Paid-in Capital as follows:
| Fund | Amount | |||
ALPS | CoreCommodity Management CompleteCommodities® Strategy Fund | $ | 250,689 | ||
As of October 31, 2014, the components of distributable earnings on a tax basis were as follows:
| Undistributed net investment income | Accumulated net realized gain/(loss) on investments | Other cumulative effect of timing differences | Net unrealized appreciation on investments | Total | ||||||||||||||||
ALPS | CoreCommodity Management CompleteCommodities® Strategy Fund | $ | 1,912,384 | $ | (8,165,118 | ) | $ | (25,881 | ) | $ | (24,684,916 | ) | $ | (30,963,531 | ) | ||||||
ALPS | Kotak India Growth Fund | 422,782 | 245,186 | – | 2,764,791 | 3,432,759 | |||||||||||||||
ALPS Real Asset Income Fund | 18,835 | 587 | (47 | ) | 180,385 | 199,760 | ||||||||||||||
ALPS | Red Rocks Listed Private Equity Fund | 15,480,099 | 1,395,427 | (1,264,670 | ) | 28,721,023 | 44,331,879 | ||||||||||||||
| 189 | October 31, 2014 |
| Notes to Financial Statements | ||
| October 31, 2014 |
| Undistributed net investment income | Accumulated net realized gain/(loss) on investments | Other cumulative effect of timing differences | Net unrealized appreciation on investments | Total | |||||||||||||||
ALPS | Sterling ETF Tactical Rotation Fund | $ | 21,251 | $ | (148,421 | ) | $ | – | $ | 238,986 | $ | 111,816 | |||||||||
ALPS | Westport Resources Hedged High Income Fund | 105,398 | – | 39,457 | (599,324 | ) | (454,469 | ) | |||||||||||||
ALPS | WMC Disciplined Value Fund | 1,446,690 | 4,778,156 | – | 33,672,191 | 39,897,037 | |||||||||||||||
Clough China Fund | 1,748,992 | 1,612,835 | – | 12,816,833 | 16,178,660 | |||||||||||||||
RiverFront Conservative Income Builder Fund | 121,604 | 95,411 | – | 144,896 | 361,911 | |||||||||||||||
RiverFront Dynamic Equity Income Fund | 748,259 | 1,736,857 | – | 3,989,045 | 6,474,161 | |||||||||||||||
RiverFront Global Allocation Fund | 606,181 | 2,042,500 | – | 2,200,901 | 4,849,582 | |||||||||||||||
RiverFront Global Growth Fund | 1,513,698 | 5,687,960 | – | 5,529,286 | 12,730,944 | |||||||||||||||
RiverFront Moderate Growth & Income Fund | 2,614,120 | 4,753,582 | – | 7,052,869 | 14,420,571 | |||||||||||||||
Capital Losses: As of October 31, 2014 the following Funds had capital loss carryforwards which may reduce the Funds’ taxable income arising from future net realized gains on investments, if any, to the extent permitted by the Code and thus may reduce the amount of the distributions to shareholders which would otherwise be necessary to relieve the Funds of any liability for federal tax.
Under the recently enacted Regulated Investment Company Modernization Act of 2010, capital losses incurred by each fund in tax years beginning after December 22, 2010 will not be subject to expiration. In addition, such losses must be utilized prior to the losses incurred in the years preceding enactment.
Capital loss carryovers utilized during the Fiscal Period Ended October 31, 2014, were:
| Fund | Amount | |||
ALPS | Kotak India Growth Fund | $ | 147,278 | ||
Post-Enactment Capital Losses*:
Capital losses deferred to next tax year were as follows:
| Fund | Short-Term | Long-Term | ||||||
ALPS | CoreCommodity Management CompleteCommodities® Strategy Fund | $ | 5,494,259 | $ | 2,670,859 | ||||
ALPS | Red Rocks Listed Private Equity Fund | 35,975 | – | ||||||
ALPS | Sterling ETF Tactical Rotation Fund | 148,421 | – | ||||||
| * | Post-Enactment Capital Losses arise in fiscal years beginning after December 22, 2010, and exclude any election for late year capital loss (during the period November 1st to December 31st) deferred for the current fiscal year. As a result of the enactment of the Regulated Investment Company Act of 2010, pre-enactment capital loss carryforwards may be more likely to expire unused. Additionally, post-enactment capital losses that are carried forward will retain their character as either short-term or long-term losses rather than being considered all short-term as under previous law. |
Unrealized Appreciation and Depreciation on Investments: As of October 31, 2014, the costs of investments for federal income tax purposes and accumulated net unrealized appreciation/(depreciation) on investments were as follows:
| Fund | Gross Appreciation (excess of value over tax cost) | Gross Depreciation (excess of tax cost over value) | Net Appreciation of Foreign Currency and Derivatives | Net Unrealized Appreciation | Cost of Investments for Income Tax Purposes | |||||||||||||||
ALPS | Alerian MLP Infrastructure Index Fund | $ | 3,264,492 | $ | (148,880 | ) | $ | – | $ | 3,115,612 | $ | 21,509,637 | |||||||||
ALPS | CoreCommodity Management CompleteCommodities® Strategy Fund | 31,273,983 | (48,961,115 | ) | (6,997,784 | ) | (24,684,916 | ) | 444,589,099 | ||||||||||||
ALPS | Kotak India Growth Fund | 2,892,778 | (127,733 | ) | (254 | ) | 2,764,791 | 12,652,912 | |||||||||||||
ALPS Real Asset Income Fund | 268,212 | (88,158 | ) | 331 | 180,385 | 3,213,441 | ||||||||||||||
ALPS | Red Rocks Listed Private Equity Fund | 46,011,321 | (17,276,375 | ) | (13,923 | ) | 28,721,023 | 442,194,662 | |||||||||||||
ALPS | Sterling ETF Tactical Rotation Fund | 239,812 | (826 | ) | – | 238,986 | 13,148,672 | ||||||||||||||
| 190 | October 31, 2014 |
| Notes to Financial Statements | ||
| October 31, 2014 |
| Fund | Gross Appreciation (excess of value over tax cost) | Gross Depreciation (excess of tax cost over value) | Net Appreciation of Foreign Currency and Derivatives | Net Unrealized Appreciation | Cost of Investments for Income Tax Purposes | |||||||||||||||
ALPS | Westport Resources Hedged High Income Fund | $ | 261,449 | $ | (820,232 | ) | $ | (40,541 | ) | $ | (599,324 | ) | $ | 23,860,876 | |||||||
ALPS | WMC Disciplined Value Fund | 34,267,780 | (595,589 | ) | – | 33,672,191 | 69,636,460 | ||||||||||||||
Clough China Fund | 13,407,893 | (594,070 | ) | 3,010 | 12,816,833 | 63,542,022 | ||||||||||||||
RiverFront Conservative Income Builder Fund | 223,655 | (78,759 | ) | – | 144,896 | 8,785,201 | ||||||||||||||
RiverFront Dynamic Equity Income Fund | 4,915,755 | (926,710 | ) | – | 3,989,045 | 64,444,637 | ||||||||||||||
RiverFront Global Allocation Fund | 2,734,959 | (534,058 | ) | – | 2,200,901 | 34,027,233 | ||||||||||||||
RiverFront Global Growth Fund | 6,702,078 | (1,172,792 | ) | – | 5,529,286 | 68,083,456 | ||||||||||||||
RiverFront Moderate Growth & Income Fund | 8,513,360 | (1,460,491 | ) | – | 7,052,869 | 129,194,778 | ||||||||||||||
Deferred Tax Liability for ALPS | Alerian MLP Infrastructure Index Fund
Since the ALPS | Alerian MLP Infrastructure Index Fund will be subject to taxation on its taxable income, the NAV of Fund shares will also be reduced by the accrual of any deferred tax liabilities. The Index however is calculated without any adjustments for taxes. As a result, the Fund’s after tax performance could differ significantly from the Index even if the pretax performance of the Fund and the performance of the Index are closely correlated.
Although the ALPS | Alerian MLP Infrastructure Index Fund currently has a net deferred tax liability, it reviews the recoverability of its deferred tax assets based upon the weight of available evidence. When assessing the recoverability of its deferred tax assets, significant weight was given to the effects of potential future realized and unrealized gains on investments and the period over which these deferred tax assets can be realized currently, any capital losses that may be generated by the Fund in the future are eligible to be carried back up to three years and can be carried forward for five years to offset capital gains recognized by the fund in those years. Net operating losses that may be generated by the Fund in the future are eligible to be carried back up to two years and can be carried forward for 20 years to offset income generated by the Fund in those years.
The Fund’s income tax expense/(benefit) consists of the following:
| October 31, 2014 | Current | Deferred | Total | |||||||||
| ||||||||||||
Federal | $ | 6,396 | $ | 421,789 | $ | 428,185 | ||||||
State | 262 | 19,945 | 20,207 | |||||||||
|
| |||||||||||
Total tax expense | $ | 6,658 | $ | 441,734 | $ | 448,392 | ||||||
|
| |||||||||||
| April 30, 2014 | Current | Deferred | Total | |||||||||
| ||||||||||||
Federal | $ | 2,990 | $ | 424,574 | $ | 427,564 | ||||||
State | 313 | 27,710 | 28,023 | |||||||||
|
| |||||||||||
Total tax expense | $ | 3,303 | $ | 452,284 | $ | 455,587 | ||||||
|
| |||||||||||
Deferred income taxes reflect the net tax effect of temporary differences between the carrying amounts of assets and liabilities for financial reporting and tax purposes.
Components of the Fund’s deferred tax assets and liabilities are as follows:
| As of October 31, 2014 | ||||
| ||||
Non-current Deferred tax assets: | ||||
Net Operating Loss Carryforward | $ | – | ||
Capital Loss Carryforward | – | |||
Other | – | |||
Less Non-current Deferred tax liabilities: | ||||
Net unrealized gain on investment securities | (1,121,336 | ) | ||
Other | 1,370 | |||
|
| |||
Net Deferred tax liability | $ | (1,119,966 | ) | |
|
| |||
| 191 | October 31, 2014 |
| Notes to Financial Statements | ||
| October 31, 2014 |
| As of April 30, 2014 | ||||
| ||||
Non-current Deferred tax assets: | ||||
Net Operating Loss Carryforward | $ | 50,348 | ||
Capital Loss Carryforward | – | |||
Other | – | |||
Less Non-current Deferred tax liabilities: | ||||
Net unrealized gain on investment securities | (725,059) | |||
Other | (3,518) | |||
|
| |||
Net Deferred tax liability | $ | (678,230) | ||
|
| |||
Although the Fund currently has a net deferred tax liability, it reviews the recoverability of its deferred tax assets based upon the weight of available evidence. When assessing the recoverability of its deferred tax assets, significant weight was given to the effects of potential future realized and unrealized gains on investments and the period over which these deferred tax assets can be realized. Currently, any capital losses that may be generated by the Fund in the future are eligible to be carried back up to three years and can be carried forward for five years to offset capital gains recognized by the fund in those years. Net operating losses that may be generated by the Fund in the future are eligible to be carried back up to two years and can be carried forward for 20 years to offset income generated by the Fund in those years.
Based upon the Fund’s assessment, it has determined that it is more likely than not that its deferred tax assets will be realized through future taxable income of the appropriate character. Accordingly, no valuation allowance has been established for the Fund’s deferred tax assets. The Fund will continue to assess the need for a valuation allowance in the future. Significant declines in the fair value of its portfolio of investments may change the Fund’s assessment of the recoverability of these assets and may result in the recording of a valuation allowance against all or a portion of the Fund’s gross deferred tax assets.
Cash distributions from MLPs to the ALPS | Alerian MLP Infrastructure Index Fund that exceed such Fund’s allocable share of such MLP’s net taxable income are considered a tax-deferred return of capital that will reduce the Fund’s adjusted tax basis in the equity securities of the MLP. These reductions in such Fund’s adjusted tax basis in the MLP equity securities will increase the amount of gain (or decrease the amount of loss) recognized by the Fund on a subsequent sale of the securities. The Fund will accrue deferred income taxes for any future tax liability associated with (i) that portion of MLP distributions considered to be a tax-deferred return of capital as well as (ii) capital appreciation of its investments. Upon the sale of an MLP security, the Fund may be liable for previously deferred taxes. The Fund will rely to some extent on information provided by the MLPs, which is not necessarily timely, to estimate deferred tax liability for purposes of financial statement reporting and determining the NAV. From time to time, ALPS Advisors, Inc. will modify the estimates or assumptions related to the Fund’s deferred tax liability as new information becomes available. The Fund will generally compute deferred income taxes based on the marginal regular federal income tax rate applicable to corporations and an assumed rate attributable to state taxes.
Total income tax benefit (current and deferred) differs from the amount computed by applying the federal statutory income tax rate of 34% to net investment and realized and unrealized gain/(losses) on investment before taxes as follows:
| For the Fiscal Period Ended October 31, 2014 | ||||
| ||||
Income tax expense at statutory rate | $ | 431,788 | ||
State income taxes (net of federal benefit) | 24,966 | |||
Permanent differences, net | – | |||
Change in estimated state referral rate | (5,005) | |||
Other | (3,357) | |||
|
| |||
Net income tax expense | $ | 448,392 | ||
|
| |||
For the Fiscal Year Ended April 30, 2014 | ||||
| ||||
Income tax expense at statutory rate | $ | 429,409 | ||
State income taxes (net of federal benefit) | 28,544 | |||
Permanent differences, net | (1,968) | |||
Change in estimated state referral rate | (232) | |||
Other | (167) | |||
|
| |||
Net income tax expense | $ | 455,587 | ||
|
| |||
| 192 | October 31, 2014 |
| Notes to Financial Statements | ||
| October 31, 2014 |
The following is a tabular reconciliation of the total amounts of unrecognized tax benefits:
| October 31, 2014 | |||
Unrecognized tax benefit - Beginning | $ | – | ||
Gross increases - tax positions in prior period | – | |||
Gross decreases - tax positions in prior period | – | |||
Gross increases - tax positions in current period | – | |||
Settlement | – | |||
Lapse of statute of limitations | – | |||
Net income tax expense | $ | – | ||
| April 30, 2014 | ||||
Unrecognized tax benefit - Beginning | $ | – | ||
Gross increases - tax positions in prior period | – | |||
Gross decreases - tax positions in prior period | – | |||
Gross increases - tax positions in current period | – | |||
Settlement | – | |||
Lapse of statute of limitations | – | |||
Net income tax expense | $ | – | ||
The Fund recognizes interest accrued related to unrecognized tax benefits and penalties as income tax expense. The Fund had no accrued penalties or interest for the Fiscal Period Ended October 31, 2014.
The Fund recognizes the tax benefits of uncertain tax positions only where the position is “more likely than not” to be sustained assuming examination by tax authorities. Management has analyzed the Fund’s tax positions, and has concluded that no liability for unrecognized tax benefits should be recorded related to uncertain tax positions taken on U.S. tax returns and state tax returns filed since inception of the fund. No U.S. federal or state income tax returns are currently under examination. The Fund’s initial tax year will be for the period ended October 31, 2013 and this period remains subject to examination by tax authorities in the United States. Due to the nature of the Fund’s investments, the Fund may be required to file income tax returns in several states. The Fund is not aware of any tax positions for which it is reasonably possible that the total amounts of unrecognized tax benefits will change materially in the next 12 months.
5. SECURITIES TRANSACTIONS
Purchases and sales of securities, excluding short-term securities and U.S. Government Obligations during the Fiscal Period Ended October 31, 2014 were as follows:
| Fund | Purchases of Securities | Proceeds from Sales of Securities | ||||||
| ||||||||
ALPS | Alerian MLP Infrastructure Index Fund | $ | 11,374,045 | $ | 1,363,744 | ||||
ALPS | CoreCommodity Management CompleteCommodities® Strategy Fund(a) | 61,915,287 | 32,105,669 | ||||||
ALPS | Kotak India Growth Fund(b) | 7,544,174 | 3,214,685 | ||||||
ALPS Real Asset Income Fund(c) | 3,235,712 | 372,181 | ||||||
ALPS | Red Rocks Listed Private Equity Fund | 133,036,058 | 48,766,366 | ||||||
ALPS | Sterling ETF Tactical Rotation Fund | 22,913,730 | 10,001,072 | ||||||
ALPS | Westport Resources Hedged High Income Fund | 44,506,830 | 21,040,479 | ||||||
ALPS | WMC Disciplined Value Fund | 13,078,491 | 19,285,712 | ||||||
Clough China Fund | 54,902,218 | 59,427,130 | ||||||
RiverFront Conservative Income Builder Fund | 4,655,527 | 2,467,699 | ||||||
RiverFront Dynamic Equity Income Fund | 37,984,932 | 28,597,342 | ||||||
RiverFront Global Allocation Fund | 17,892,488 | 16,179,169 | ||||||
RiverFront Global Growth Fund | 37,303,719 | 35,415,982 | ||||||
RiverFront Moderate Growth & Income Fund | 61,271,493 | 55,003,354 | ||||||
193 | October 31, 2014 |
| Notes to Financial Statements | ||
| October 31, 2014 |
Purchases and sales of U.S. Government Obligations during the Fiscal Period Ended October 31, 2014 were as follows:
| Fund | Purchases of Securities | Proceeds from Sales of Securities | ||||||
ALPS | CoreCommodity Management CompleteCommodities® Strategy Fund | $ | 93,005,706 | $ | 11,652,040 | ||||
| (a) | Purchases and Sales for ALPS | CoreCommodity Management CompleteCommodities® Strategy Fund are consolidated and include the balances of CoreCommodity Management Cayman Commodity Fund, Ltd. (wholly owned subsidiary). |
| (b) | Purchases and Sales for ALPS | Kotak India Growth Fund are consolidated and include the balances of Kotak Mauritius Portfolio (wholly owned subsidiary). |
| (c) | Purchases and Sales for ALPS Real Asset Income Fund are consolidated and include the balances of ALPS Real Asset Core Commodity Managment Cayman Trust. (wholly owned subsidiary) |
6. BENEFICIAL INTEREST TRANSACTIONS
Shares redeemed within 90 days of purchase for ALPS | Red Rocks Listed Private Equity Fund and 30 days of purchase for ALPS | CoreCommodity Management CompleteCommodities® Strategy Fund, ALPS | Kotak India Growth Fund, and Clough China Fund, may incur a 2% short-term redemption fee deducted from the redemption amount. In addition, shares redeemed within 30 days of purchase for the ALPS | Sterling ETF Tactical Rotation Fund may incur a 1% short-term redemption fee. The ALPS | Alerian MLP Infrastructure Index Fund, ALPS Real Asset Income Fund, ALPS | Westport Resources Hedged High Income Fund, ALPS | WMC Disciplined Value Fund, RiverFront Conservative Income Builder Fund, RiverFront Dynamic Equity Income Fund, RiverFront Global Allocation Fund, RiverFront Global Growth Fund, and RiverFront Moderate Growth & Income Fund shares do not incur redemption fees.
For the Fiscal Period Ended October 31, 2014, the amounts listed below were retained by the Funds. These amounts are reflected in “Shares redeemed” in the Statements of Changes in Net Assets.
| Redemption Fee Retained | ||||||||||||
| Fund | For the Fiscal Periods Ended October 31, 2014 | For the Year Ended April 30, 2014 | For the Year Ended April 30, 2013 | |||||||||
ALPS | CoreCommodity Management CompleteCommodities® Strategy Fund - Class A | $ | 2,815 | $ | 28,999 | $ | 17,040 | ||||||
ALPS | CoreCommodity Management CompleteCommodities® Strategy Fund - Class C | 19 | 55 | 186 | |||||||||
ALPS | CoreCommodity Management CompleteCommodities® Strategy Fund - Class I | 5,450 | 15,328 | 10,053 | |||||||||
ALPS | Kotak India Growth Fund - Class A | 346 | 1,100 | 393 | |||||||||
ALPS | Kotak India Growth Fund - Class C | 142 | – | – | |||||||||
ALPS | Kotak India Growth Fund - Class I | 402 | – | 196 | |||||||||
ALPS | Red Rocks Listed Private Equity Fund - Class A | 23,046 | 15,705 | 15,999 | |||||||||
ALPS | Red Rocks Listed Private Equity Fund - Class C | 1,464 | 472 | 228 | |||||||||
ALPS | Red Rocks Listed Private Equity Fund - Class I | 37,095 | 46,273 | 9,757 | |||||||||
ALPS | Red Rocks Listed Private Equity Fund - Class R | 1,022 | – | – | |||||||||
ALPS | Sterling ETF Tactical Rotation Fund - Class A | 98 | – | – | |||||||||
Clough China Fund - Class A | 1,558 | 9,336 | 564 | |||||||||
Clough China Fund - Class C | 12 | 145 | 2 | |||||||||
Clough China Fund - Class I | 905 | 7,776 | 22,029 | |||||||||
| 194 | October 31, 2014 |
| Notes to Financial Statements | ||
| October 31, 2014 |
Transactions in shares of capital stock were as follows:
| ALPS | Alerian MLP Infrastructure Index Fund | ||||||||||||
| For the Fiscal Period Ended October 31, 2014(a) | For the Year Ended April 30, 2014 | For the Period January 2, 2013 (Commencement) to April 30, 2013 | ||||||||||
| ||||||||||||
Class A | ||||||||||||
Shares sold | 288,018 | 840,863 | 82,771 | |||||||||
Dividends reinvested | 37,693 | 22,014 | 806 | |||||||||
Shares redeemed | (119,831) | (214,096) | (1) | |||||||||
| ||||||||||||
Net increase in shares outstanding | 205,880 | 648,781 | 83,576 | |||||||||
| ||||||||||||
| ||||||||||||
Class C | ||||||||||||
Shares sold | 301,736 | 307,622 | 50,001 | |||||||||
Dividends reinvested | 15,834 | 5,355 | 758 | |||||||||
Shares redeemed | (21,671) | (56,783) | (1) | |||||||||
| ||||||||||||
Net increase in shares outstanding | 295,899 | 256,194 | 50,758 | |||||||||
| ||||||||||||
| ||||||||||||
Class I | ||||||||||||
Shares sold | 448,719 | 149,751 | 200,001 | |||||||||
Dividends reinvested | 19,256 | 10,785 | 3,031 | |||||||||
Shares redeemed | (15,903) | (229,611) | (1) | |||||||||
| ||||||||||||
Net increase/(decrease) in shares outstanding | 452,072 | (69,075) | 203,031 | |||||||||
| ||||||||||||
| ||||||||||||
| ALPS | CoreCommodity Management CompleteCommodities® Strategy Fund | ||||||||||||
For the Fiscal Period Ended October 31, 2014(a) | For the Year Ended April 30, 2014 | For the Year Ended April 30, 2013 | ||||||||||
| ||||||||||||
Class A | ||||||||||||
Shares sold | 2,009,784 | 7,651,538 | 8,530,181 | |||||||||
Dividends reinvested | – | – | 38,287 | |||||||||
Shares redeemed | (8,184,764) | (7,315,182) | (6,220,651) | |||||||||
| ||||||||||||
Net increase/(decrease) in shares outstanding | (6,174,980) | 336,356 | 2,347,817 | |||||||||
| ||||||||||||
| ||||||||||||
Class C | ||||||||||||
Shares sold | 325,208 | 566,736 | 806,811 | |||||||||
Dividends reinvested | – | – | 4,974 | |||||||||
Shares redeemed | (297,385) | (1,145,365) | (549,258) | |||||||||
| ||||||||||||
Net increase/(decrease) in shares outstanding | 27,823 | (578,629) | 262,527 | |||||||||
| ||||||||||||
| ||||||||||||
Class I | ||||||||||||
Shares sold | 21,543,668 | 22,908,918 | 14,771,425 | |||||||||
Dividends reinvested | – | – | 52,410 | |||||||||
Shares redeemed | (4,926,582) | (16,450,540) | (4,279,108) | |||||||||
| ||||||||||||
Net increase in shares outstanding | 16,617,086 | 6,458,378 | 10,544,727 | |||||||||
| ||||||||||||
| ||||||||||||
| 195 | October 31, 2014 |
| Notes to Financial Statements | ||
| October 31, 2014 |
| ALPS | Kotak India Growth Fund | ||||||||||||
| For the Fiscal Period Ended October 31, 2014(a) | For the Year Ended April 30, 2014 | For the Year Ended April 30, 2013 | ||||||||||
| ||||||||||||
Class A | ||||||||||||
Shares sold | 237,553 | 276,089 | 358,458 | |||||||||
Dividends reinvested | – | – | – | |||||||||
Shares redeemed | (339,968) | (248,518) | (156,778) | |||||||||
| ||||||||||||
Net increase/(decrease) in shares outstanding | (102,415) | 27,571 | 201,680 | |||||||||
| ||||||||||||
| ||||||||||||
Class C | ||||||||||||
Shares sold | 46,251 | 41,102 | 58,597 | |||||||||
Dividends reinvested | – | – | – | |||||||||
Shares redeemed | (19,484) | (50,514) | (13,079) | |||||||||
| ||||||||||||
Net increase/(decrease) in shares outstanding | 26,767 | (9,412) | 45,518 | |||||||||
| ||||||||||||
| ||||||||||||
Class I | ||||||||||||
Shares sold | 526,457 | 36,244 | 86,660 | |||||||||
Dividends reinvested | – | 964 | – | |||||||||
Shares redeemed | (46,610) | (68,589) | (56,376) | |||||||||
| ||||||||||||
Net increase/(decrease) in shares outstanding | 479,847 | (31,381) | 30,284 | |||||||||
| ||||||||||||
| ||||||||||||
| ALPS Real Asset Income Fund | ||||
For the Period November 30, 2013 (Commencement) to October 31, 2014 | ||||
| ||||
Class A | ||||
Shares sold | 75,662 | |||
Dividends reinvested | 1,846 | |||
Shares redeemed | (2,776) | |||
| ||||
Net increase in shares outstanding | 74,732 | |||
| ||||
| ||||
Class C | ||||
Shares sold | 50,003 | |||
Dividends reinvested | 1,487 | |||
Shares redeemed | (3) | |||
| ||||
Net increase in shares outstanding | 51,487 | |||
| ||||
| ||||
Class I | ||||
Shares sold | 213,429 | |||
Dividends reinvested | 7,745 | |||
Shares redeemed | (3) | |||
| ||||
Net increase in shares outstanding | 221,171 | |||
| ||||
| ||||
| 196 | October 31, 2014 |
| Notes to Financial Statements | ||
| October 31, 2014 |
| ALPS | Red Rocks Listed Private Equity Fund | ||||||||||||
| For the Fiscal Period Ended October 31, 2014(a) | For the Year Ended April 30, 2014 | For the Year Ended April 30, 2013 | ||||||||||
| ||||||||||||
Class A | ||||||||||||
Shares sold | 8,719,848 | 15,978,340 | 5,739,840 | |||||||||
Dividends reinvested | – | 1,603,325 | 248,170 | |||||||||
Shares redeemed | (7,255,050) | (5,633,930) | (6,914,956) | |||||||||
| ||||||||||||
Net increase/(decrease) in shares outstanding | 1,464,798 | 11,947,735 | (926,946) | |||||||||
| ||||||||||||
| ||||||||||||
Class C | ||||||||||||
Shares sold | 1,066,330 | 1,074,269 | 237,926 | |||||||||
Dividends reinvested | – | 55,528 | 6,033 | |||||||||
Shares redeemed | (179,224) | (88,700) | (116,850) | |||||||||
| ||||||||||||
Net increase in shares outstanding | 887,106 | 1,041,097 | 127,109 | |||||||||
| ||||||||||||
| ||||||||||||
Class I | ||||||||||||
Shares sold | 14,082,200 | 14,171,110 | 11,839,555 | |||||||||
Dividends reinvested | – | 657,933 | 127,149 | |||||||||
Shares redeemed | (5,365,813) | (8,859,864) | (5,867,506) | |||||||||
| ||||||||||||
Net increase in shares outstanding | 8,716,387 | 5,969,179 | 6,099,198 | |||||||||
| ||||||||||||
| ||||||||||||
Class R | ||||||||||||
Shares sold | 75,154 | 56,083 | 29,401 | |||||||||
Dividends reinvested | – | 3,972 | 178 | |||||||||
Shares redeemed | (13,616) | (8,484) | (5,330) | |||||||||
| ||||||||||||
Net increase in shares outstanding | 61,538 | 51,570 | 24,249 | |||||||||
| ||||||||||||
| ||||||||||||
| ALPS | Sterling ETF Tactical Rotation Fund | ||||
For the Period July 1, 2014 (Commencement) | ||||
| ||||
Class A | ||||
Shares sold | 536,342 | |||
Dividends reinvested | – | |||
Shares redeemed | (8,719) | |||
| ||||
Net increase in shares outstanding | 527,623 | |||
| ||||
| ||||
Class C | ||||
Shares sold | 54,102 | |||
Dividends reinvested | – | |||
Shares redeemed | (816) | |||
| ||||
Net increase in shares outstanding | 53,286 | |||
| ||||
| ||||
Class I | ||||
Shares sold | 747,556 | |||
Dividends reinvested | – | |||
Shares redeemed | (12,420) | |||
| ||||
Net increase in shares outstanding | 735,136 | |||
| ||||
| ||||
| 197 | October 31, 2014 |
| Notes to Financial Statements | ||
| October 31, 2014 |
| ALPS | Westport Resources Hedged High Income Fund | ||||
For the Period January 4, 2014 (Commencement) to October 31, 2014 | ||||
| ||||
Class A | ||||
Shares sold | 434,199 | |||
Dividends reinvested | 8,382 | |||
Shares redeemed | (17,428) | |||
| ||||
Net increase in shares outstanding | 425,153 | |||
| ||||
| ||||
Class C | ||||
Shares sold | 171,830 | |||
Dividends reinvested | 3,301 | |||
Shares redeemed | (14,038) | |||
| ||||
Net increase in shares outstanding | 161,093 | |||
| ||||
| ||||
Class I | ||||
Shares sold | 1,999,490 | |||
Dividends reinvested | 44,725 | |||
Shares redeemed | (124,519) | |||
| ||||
Net increase in shares outstanding | 1,919,696 | |||
| ||||
| ||||
| ALPS | WMC Disciplined Value Fund | ||||||||||||
| For the Fiscal Period Ended October 31, 2014(a) | For the Year Ended April 30, 2014 | For the Year Ended April 30, 2013 | ||||||||||
| ||||||||||||
Class A | ||||||||||||
Shares sold | 12,637 | 222,748 | 237,314 | |||||||||
Dividends reinvested | – | 100,951 | 53,334 | |||||||||
Shares redeemed | (212,255) | (381,282) | (620,571) | |||||||||
| ||||||||||||
Net decrease in shares outstanding | (199,618) | (57,583) | (329,923) | |||||||||
| ||||||||||||
| ||||||||||||
Class C | ||||||||||||
Shares sold | 9,584 | 2,541 | 653 | |||||||||
Dividends reinvested | – | 187 | 57 | |||||||||
Shares redeemed | – | (1,585) | – | |||||||||
| ||||||||||||
Net increase in shares outstanding | 9,584 | 1,143 | 710 | |||||||||
| ||||||||||||
| ||||||||||||
Class I | ||||||||||||
Shares sold | 139,366 | 475,904 | 596,565 | |||||||||
Dividends reinvested | – | 85,611 | 44,131 | |||||||||
Shares redeemed | (423,706) | (751,779) | (815,605) | |||||||||
| ||||||||||||
Net decrease in shares outstanding | (284,340) | (190,264) | (174,909) | |||||||||
| ||||||||||||
| ||||||||||||
| 198 | October 31, 2014 |
| Notes to Financial Statements | ||
| October 31, 2014 |
| Clough China Fund | ||||||||||||
For the Fiscal Period Ended October 31, 2014(a) | For the Year Ended April 30, 2014 | For the Year Ended April 30, 2013 | ||||||||||
| ||||||||||||
Class A | ||||||||||||
Shares sold | 146,054 | 620,113 | 403,248 | |||||||||
Dividends reinvested | – | 17,364 | 1,259 | |||||||||
Shares redeemed | (351,151) | (658,438) | (537,081) | |||||||||
| ||||||||||||
Net decrease in shares outstanding | (205,097) | (20,961) | (132,574) | |||||||||
| ||||||||||||
| ||||||||||||
Class C | ||||||||||||
Shares sold | 40,370 | 192,333 | 129,593 | |||||||||
Dividends reinvested | – | 983 | – | |||||||||
Shares redeemed | (71,486) | (239,921) | (190,104) | |||||||||
| ||||||||||||
Net decrease in shares outstanding | (31,116) | (46,605) | (60,511) | |||||||||
| ||||||||||||
| ||||||||||||
Class I | ||||||||||||
Shares sold | 356,849 | 791,750 | 1,926,116 | |||||||||
Dividends reinvested | – | 7,137 | 912 | |||||||||
Shares redeemed | (275,489) | (404,998) | (2,279,485) | |||||||||
| ||||||||||||
Net increase/(decrease) in shares outstanding | 81,360 | 393,889 | (352,457) | |||||||||
| ||||||||||||
| ||||||||||||
| RiverFront Conservative Income Builder Fund | ||||||||||||
| For the Fiscal Period Ended October 31, 2014(a) | For the Year Ended April 30, 2014 | For the Period September 4, 2014 | ||||||||||
| ||||||||||||
Class A | ||||||||||||
Shares sold | 20,788 | 51,708 | 57,836 | |||||||||
Dividends reinvested | 339 | 827 | 47 | |||||||||
Shares redeemed | (22,586) | (8,730) | – | |||||||||
| ||||||||||||
Net increase/(decrease) in shares outstanding | (1,459) | 43,805 | 57,883 | |||||||||
| ||||||||||||
| ||||||||||||
Class C | ||||||||||||
Shares sold | 113,010 | 237,894 | 215,910 | |||||||||
Dividends reinvested | 1,180 | 6,490 | 250 | |||||||||
Shares redeemed | (30,896) | (78,476) | (658) | |||||||||
| ||||||||||||
Net increase in shares outstanding | 83,294 | 165,908 | 215,502 | |||||||||
| ||||||||||||
| ||||||||||||
Class I | ||||||||||||
Shares sold | 170,292 | 188,828 | 74,254 | |||||||||
Dividends reinvested | 1,236 | 3,830 | 1,217 | |||||||||
Shares redeemed | (36,589) | (132,582) | (5,954) | |||||||||
| ||||||||||||
Net increase in shares outstanding | 134,939 | 60,076 | 69,517 | |||||||||
| ||||||||||||
| ||||||||||||
| 199 | October 31, 2014 |
| Notes to Financial Statements | ||
| October 31, 2014 |
| RiverFront Dynamic Equity Income Fund | ||||||||||||
| For the Fiscal Period Ended October 31, 2014(a) | For the Year Ended April 30, 2014 | For the Year Ended April 30, 2013 | ||||||||||
| ||||||||||||
Class A | ||||||||||||
Shares sold | 298,200 | 601,943 | 281,177 | |||||||||
Dividends reinvested | 7,788 | 36,711 | 11,503 | |||||||||
Shares redeemed | (173,465) | (113,937) | (264,787) | |||||||||
| ||||||||||||
Net increase in shares outstanding | 132,523 | 524,717 | 27,893 | |||||||||
| ||||||||||||
| ||||||||||||
Class C | ||||||||||||
Shares sold | 543,597 | 859,238 | 407,618 | |||||||||
Dividends reinvested | 6,068 | 65,716 | 16,294 | |||||||||
Shares redeemed | (232,754) | (241,047) | (331,282) | |||||||||
| ||||||||||||
Net increase in shares outstanding | 316,911 | 683,907 | 92,630 | |||||||||
| ||||||||||||
| ||||||||||||
Class I | ||||||||||||
Shares sold | 268,460 | 794,021 | 459,512 | |||||||||
Dividends reinvested | 10,588 | 54,114 | 14,180 | |||||||||
Shares redeemed | (83,369) | (291,301) | (230,931) | |||||||||
| ||||||||||||
Net increase in shares outstanding | 195,679 | 556,834 | 242,760 | |||||||||
| ||||||||||||
| ||||||||||||
| RiverFront Global Allocation Fund | ||||||||||||
| For the Fiscal Period Ended October 31, 2014(a) | For the Year Ended April 30, 2014 | For the Year Ended April 30, 2013 | ||||||||||
| ||||||||||||
Class A | ||||||||||||
Shares sold | 53,535 | 145,922 | 276,072 | |||||||||
Dividends reinvested | – | 21,838 | 8,077 | |||||||||
Shares redeemed | (117,670) | (157,419) | (126,146) | |||||||||
| ||||||||||||
Net increase/(decrease) in shares outstanding | (64,135) | 10,341 | 158,003 | |||||||||
| ||||||||||||
| ||||||||||||
Class C | ||||||||||||
Shares sold | 131,314 | 460,035 | 224,493 | |||||||||
Dividends reinvested | – | 26,360 | 6,887 | |||||||||
Shares redeemed | (131,094) | (164,939) | (328,407) | |||||||||
| ||||||||||||
Net increase/(decrease) in shares outstanding | 220 | 321,456 | (97,027) | |||||||||
| ||||||||||||
| ||||||||||||
Class I | ||||||||||||
Shares sold | 247,340 | 357,419 | 394,681 | |||||||||
Dividends reinvested | – | 24,973 | 6,276 | |||||||||
Shares redeemed | (74,901) | (126,577) | (159,373) | |||||||||
| ||||||||||||
Net increase in shares outstanding | 172,439 | 255,815 | 241,585 | |||||||||
| ||||||||||||
| ||||||||||||
| 200 | October 31, 2014 |
| Notes to Financial Statements | ||
| October 31, 2014 |
| RiverFront Global Growth Fund | ||||||||||||
| For the Fiscal Period Ended October 31, 2014(a) | For the Year Ended April 30, 2014 | For the Year Ended April 30, 2013 | ||||||||||
| ||||||||||||
Class A | ||||||||||||
Shares sold | 274,216 | 711,148 | 449,097 | |||||||||
Dividends reinvested | – | 73,149 | 8,021 | |||||||||
Shares redeemed | (270,395) | (279,502) | (276,448) | |||||||||
| ||||||||||||
Net increase in shares outstanding | 3,821 | 504,795 | 180,670 | |||||||||
| ||||||||||||
| ||||||||||||
Class C | ||||||||||||
Shares sold | 71,276 | 332,183 | 171,120 | |||||||||
Dividends reinvested | – | 60,174 | 5,393 | |||||||||
Shares redeemed | (83,298) | (114,858) | (202,053) | |||||||||
| ||||||||||||
Net increase/(decrease) in shares outstanding | (12,022) | 277,499 | (25,540) | |||||||||
| ||||||||||||
| ||||||||||||
Class I | ||||||||||||
Shares sold | 141,152 | 312,894 | 272,611 | |||||||||
Dividends reinvested | – | 75,213 | 5,552 | |||||||||
Shares redeemed | (54,618) | (135,371) | (207,050) | |||||||||
| ||||||||||||
Net increase in shares outstanding | 86,534 | 252,736 | 71,113 | |||||||||
| ||||||||||||
| ||||||||||||
Class L | ||||||||||||
Shares sold | 91,284 | 208,438 | 206,678 | |||||||||
Dividends reinvested | – | 156,519 | 27,327 | |||||||||
Shares redeemed | (157,229) | (297,731) | (511,817) | |||||||||
| ||||||||||||
Net increase/(decrease) in shares outstanding | (65,945) | 67,226 | (277,812) | |||||||||
| ||||||||||||
| ||||||||||||
Investor Class | ||||||||||||
Shares sold | 4,306 | 17,783 | 16,623 | |||||||||
Dividends reinvested | – | 52,483 | 8,789 | |||||||||
Shares redeemed | (49,732) | (138,604) | (167,484) | |||||||||
| ||||||||||||
Net decrease in shares outstanding | (45,426) | (68,338) | (142,073) | |||||||||
| ||||||||||||
| ||||||||||||
| RiverFront Moderate Growth & Income Fund | ||||||||||||
For the Fiscal Period Ended October 31, 2014(a) | For the Year Ended April 30, 2014 | For the Year Ended April 30, 2013 | ||||||||||
| ||||||||||||
Class A | ||||||||||||
Shares sold | 346,863 | 929,036 | 1,025,931 | |||||||||
Dividends reinvested | 15,435 | 131,056 | 40,069 | |||||||||
Shares redeemed | (679,187) | (964,205) | (467,697) | |||||||||
| ||||||||||||
Net increase/(decrease) in shares outstanding | (316,889) | 95,887 | 598,303 | |||||||||
| ||||||||||||
| ||||||||||||
Class C | ||||||||||||
Shares sold | 637,442 | 1,598,320 | 1,700,686 | |||||||||
Dividends reinvested | 18,215 | 231,095 | 44,339 | |||||||||
Shares redeemed | (442,477) | (1,075,044) | (792,564) | |||||||||
| ||||||||||||
Net increase in shares outstanding | 213,180 | 754,371 | 952,461 | |||||||||
| ||||||||||||
| ||||||||||||
Class I | ||||||||||||
Shares sold | 536,778 | 1,406,353 | 1,805,781 | |||||||||
Dividends reinvested | 26,841 | 171,628 | 35,557 | |||||||||
Shares redeemed | (255,089) | (642,198) | (795,302) | |||||||||
| ||||||||||||
Net increase in shares outstanding | 308,530 | 935,783 | 1,046,036 | |||||||||
| ||||||||||||
| ||||||||||||
| (a) | Effective May 1, 2014, the Board approved changing the fiscal year-end of the Funds from April 30 to October 31. |
| 201 | October 31, 2014 |
| Notes to Financial Statements | ||
| October 31, 2014 | ||
7. AFFILIATED COMPANIES
Funds may invest in certain securities that are considered securities issued by affiliated companies. As defined by the Investment Company Act of 1940, an affiliated person, including an affiliated company, is one in which a Fund owns 5% or more of the outstanding voting securities, or a company which is under common ownership or control with the Fund. The purchases, sales, dividend income, capital gains, return of capital distributions received, shares and value of investments in affiliated companies for the Fiscal Period Ended October 31, 2014 were as follows:
RiverFront Conservative Income Builder |
| |||||||||||||||||||||||||||
| Security Name | Share Balance May 1, 2014 | Purchases | Sales | Share Balance October 31, 2014 | Dividend Income | Realized Loss | Market Value October 31, 2014 | |||||||||||||||||||||
RiverFront Strategic Income Fund | 19,045 | 15,477 | 416 | 34,106 | $ | 10,210 | $ | (42 | ) | $ | 854,696 | |||||||||||||||||
| $ | 10,210 | $ | (42 | ) | $ | 854,696 | ||||||||||||||||||||||
| ||||||||||||||||||||||||||||
RiverFront Dynamic Equity Income Fund |
| |||||||||||||||||||||||||||
| Security Name | Share Balance May 1, 2014 | Purchases | Sales | Share Balance October 31, 2014 | Dividend Income | Realized Loss | Market Value | |||||||||||||||||||||
RiverFront Strategic Income Fund | 125,419 | 21,005 | 4,042 | 142,382 | $ | 54,010 | $ | (2,968 | ) | $ | 3,568,093 | |||||||||||||||||
| $ | 54,010 | $ | (2,968 | ) | $ | 3,568,093 | ||||||||||||||||||||||
| ||||||||||||||||||||||||||||
RiverFront Global Allocation Fund |
| |||||||||||||||||||||||||||
| Security Name | Share Balance May 1, 2014 | Purchases | Sales | Share Balance October 31, 2014 | Dividend Income | Realized Loss | Market Value October 31, 2014 | |||||||||||||||||||||
RiverFront Strategic Income Fund | 73,453 | 3,591 | 58,280 | 18,764 | $ | 25,735 | $ | (14,540 | ) | $ | 470,226 | |||||||||||||||||
| $ | 25,735 | $ | (14,540 | ) | $ | 470,226 | ||||||||||||||||||||||
| ||||||||||||||||||||||||||||
RiverFront Moderate Growth & Income Fund |
| |||||||||||||||||||||||||||
| Security Name | Share Balance May 1, 2014 | Purchases | Sales | Share Balance October 31, 2014 | Dividend Income | Realized Loss | Market Value October 31, 2014 | |||||||||||||||||||||
RiverFront Strategic Income Fund | 383,662 | 106,292 | – | 489,954 | $ | 171,796 | $ | – | $ | 12,278,247 | ||||||||||||||||||
| $ | 171,796 | $ | – | $ | 12,278,247 | |||||||||||||||||||||||
| ||||||||||||||||||||||||||||
8. MANAGEMENT AND RELATED-PARTY TRANSACTIONS
ALPS Advisors, Inc. (“AAI”), subject to the authority of the Board, is responsible for the overall management of the Funds listed below. AAI has delegated daily management of the Funds listed below to the corresponding Sub-Advisor(s) listed in the table below. Each Sub-Advisor manages the investments of the Fund in accordance with its investment objective, policies and limitations and investment guidelines established jointly by AAI and the Board.
| Fund Sub-Advisor(s) | ||||
ALPS | CoreCommodity Management CompleteCommodities® Strategy Fund | CoreCommodity Management, LLC | |||
ALPS | Kotak India Growth Fund | Kotak Mahindra (UK) Limited | |||
ALPS Real Asset Income Fund(a) | RREEF America LLC | |||
| CoreCommodity Management, LLC | ||||
ALPS | Red Rocks Listed Private Equity Fund | Red Rocks Capital LLC | |||
ALPS | Sterling ETF Tactical Rotation Fund | Sterling Global Strategies LLC | |||
ALPS | WMC Disciplined Value Fund | Wellington Management Company, LLP | |||
Clough China Fund | Clough Capital Partners, LP |
| 202 | October 31, 2014 |
| Notes to Financial Statements | ||
| October 31, 2014 | ||
| Fund Sub-Advisor(s) | ||||
RiverFront Conservative Income Builder Fund | RiverFront Investment Group, LLC | |||
RiverFront Dynamic Equity Income Fund | RiverFront Investment Group, LLC | |||
RiverFront Global Allocation Fund | RiverFront Investment Group, LLC | |||
RiverFront Global Growth Fund | RiverFront Investment Group, LLC | |||
RiverFront Moderate Growth & Income Fund | RiverFront Investment Group, LLC |
| (a) | AAI has delegated daily management of the ALPS Real Asset Income Fund to RREEF America LLC (“RREEF”) with respect to the Global Infrastructure Strategy, and CoreCommodity Management, LLC (“CoreCommodity”) with respect to the Commodity Strategy. |
AAI and Westport Resources Management, Inc. (“Westport Resources”) (“collectively the “Westport Co-Advisors”), subject to the authority of the Board, serve as co-investment advisors for the ALPS | Westport Resources Hedged High Income Fund (the “Westport Fund”). AAI provides fund administration services and other portfolio support services and compliance monitoring for the Westport Fund. Westport Resources manages the Fund’s investment program and selects, subject to the approval of the Board, sub-advisors to the Fund. Westport Resources and the Trust have entered into sub-advisory agreements with respect to the Fund with three Sub-Advisors (the “Westport Sub-Advisors”), Concise Capital Management, LP, Amundi Smith Breeden LLC, and Sound Point Capital Management, L.P., to manage a portion of the Fund’s assets.
Pursuant to the Investment Advisory Agreement (the “Advisory Agreement”), the Funds listed below pay AAI an annual management fee which is based on each Fund’s average daily net assets. The management fee is paid on a monthly basis. The following table reflects the Funds’ contractual management fee rates (expressed as an annual rate).
| Fund | Contractual Management Fee | |||
ALPS | Alerian MLP Infrastructure Index Fund | 0.70% | |||
ALPS | CoreCommodity Management CompleteCommodities® Strategy Fund | 0.85% | |||
ALPS | Kotak India Growth Fund | 1.25% | |||
ALPS Real Asset Income Fund | 0.80% | |||
ALPS | Red Rocks Listed Private Equity Fund | 0.85% | |||
ALPS | Sterling ETF Tactical Rotation Fund | 0.95% | |||
ALPS | WMC Disciplined Value Fund | 0.95%(a) | |||
Clough China Fund | 1.35% | |||
RiverFront Conservative Income Builder Fund | 0.85% | |||
RiverFront Dynamic Equity Income Fund | 0.85% | |||
RiverFront Global Allocation Fund | 0.85% | |||
RiverFront Global Growth Fund | 0.85% | |||
RiverFront Moderate Growth & Income Fund | 0.85% |
| (a) | The contractual management fee is 0.95% for the first $250 million of net assets, 0.85% for the next $250 million of net assets, and 0.75% for net assets in excess of $500 million. |
Pursuant to the Investment Advisory Agreement between the Westport Fund and AAI, the Westport Fund pays AAI an annual management fee of the greater of (i) 0.20%, based on the Westport Fund’s average daily net assets, or (ii) $150,000. Pursuant to the Investment Advisory Agreement between the Westport Fund and Westport Resources, the Westport Fund pays Westport Resources an annual management fee of 1.50% based on the Westport Fund’s average daily net assets. The management fee for each Advisory Agreement is paid on a monthly basis. The Westport Sub-Advisors will be engaged to manage the investments of the Westport Fund according to the its investment objective, policies and limitations and any investment guidelines established by the Westport Co-Advisors and the Board. Westport Resources will pay the Westport Sub-Advisors out of the advisory fee paid to it pursuant to the Westport Resources Advisory Agreement.
| 203 | October 31, 2014 |
| Notes to Financial Statements | ||
| October 31, 2014 |
Pursuant to an Investment Sub-advisory Agreement, AAI pays the Sub-Advisors of the Funds listed below an annual sub-advisory management fee which is based on each Fund’s average daily assets. AAI is required to pay all fees due to each Sub-Advisor out of the management fee AAI receives from each Fund listed below. The following table reflects the Funds’ contractual sub-advisory fee rates.
| Fund | Average Daily Net Assets of the Fund | Contractual Sub-Advisory Fee | ||
ALPS | CoreCommodity Management CompleteCommodities® Strategy Fund | All Asset Levels | 0.75% | ||
ALPS | Kotak India Growth Fund | First $50 Million | 1.15% | ||
| Over $50 Million | 1.05% | |||
ALPS | Red Rocks Listed Private Equity Fund | All Asset Levels | 0.57% | ||
ALPS | Sterling ETF Tactical Rotation Fund | All Asset Levels | 0.60% | ||
ALPS | WMC Disciplined Value Fund | First $250 Million | 0.50% | ||
| $250 Million - $500 Million | 0.40% | |||
| Over $500 Million | 0.30% | |||
Clough China Fund | All Asset Levels | 0.90% | ||
RiverFront Conservative Income Builder Fund | All Asset Levels | 0.60% | ||
RiverFront Dynamic Equity Income Fund | All Asset Levels | 0.60% | ||
RiverFront Global Allocation Fund | All Asset Levels | 0.60% | ||
RiverFront Global Growth Fund | All Asset Levels | 0.60% | ||
RiverFront Moderate Growth & Income Fund | All Asset Levels | 0.60% |
For the ALPS Real Asset Income Fund, pursuant to an Investment Sub-advisory Agreement with RREEF, AAI pays RREEF an annual sub-advisory management fee of 0.55% based on the Fund’s average daily net assets allocated to RREEF. Pursuant to an Investment Sub-advisory Agreement with CoreCommodity, AAI pays CoreCommodity an annual sub-advisory management fee of 0.65% based on the Fund’s average daily net assets allocated to CoreCommodity. Each sub-advisory management fee is paid on a monthly basis. AAI is required to pay all fees due to the Sub-advisors out of the management fee AAI receives from the Fund.
The Advisor(s) and each Sub-Advisor have contractually agreed to limit the amount of each Fund’s total annual expenses, exclusive of distribution and service (12b-1) fees (except Clough China Class A and Class C shares), shareholder service fees (except Clough China Class A shares and Class C shares), acquired fund fees and expenses, brokerage expenses, interest expense, taxes and extraordinary expenses, that exceed the following annual rates below. These agreements are reevaluated on an annual basis based on the terms disclosed below.
| Fund | Class A | Class C | Class I | Class Inv | Class L | Class R | Term of Expense Limit Agreement | |||||||
ALPS | Alerian MLP Infrastructure Index Fund | 0.85% | 0.85% | 0.85% | N/A | N/A | N/A | 12/31/2012 - 8/31/2014 & 9/1/2014 - 8/31/2015 | |||||||
ALPS | CoreCommodity Management CompleteCommodities® Strategy Fund | 1.05% | 1.05% | 1.15% | N/A | N/A | N/A | 9/11/2013 - 9/11/2015 | |||||||
ALPS | Kotak India Growth Fund | 1.60% | 1.60% | 1.60% | N/A | N/A | N/A | 9/1/2013 - 8/31/2014 & 9/1/2014 - 8/31/2015 | |||||||
ALPS Real Asset Income Fund | 1.00% | 1.00% | 1.00% | N/A | N/A | N/A | 11/29/2013 - 2/28/2015 | |||||||
ALPS | Red Rocks Listed Private Equity Fund | 1.25% | 1.25% | 1.25% | N/A | N/A | 1.25% | 9/1/2013 - 8/31/2014 & 9/1/2014 - 8/31/2015 | |||||||
ALPS | Sterling ETF Tactical Rotation Fund | 1.15% | 1.15% | 1.15% | N/A | N/A | N/A | 6/30/2014 - 2/29/2016 | |||||||
ALPS | Westport Resources Hedged High Income Fund | 1.99% | 1.99% | 1.99% | N/A | N/A | N/A | 12/19/2013 - 8/31/2015 | |||||||
ALPS | WMC Disciplined Value Fund | 1.15% | 1.15% | 1.15% | N/A | N/A | N/A | 9/1/2013 - 8/31/2014 & 9/1/2014 - 8/31/2015 | |||||||
Clough China Fund | 1.95% | 2.70% | 1.70% | N/A | N/A | N/A | 9/1/2013 -8/31/2014 & 9/1/2014 - 8/31/2015 | |||||||
RiverFront Conservative Income Builder Fund | 0.90% | 0.90% | 0.90% | N/A | N/A | N/A | 9/1/2013 - 8/31/2014 & 9/1/2014 - 8/31/2015 | |||||||
RiverFront Dynamic Equity Income Fund | 0.90% | 0.90% | 0.90% | N/A | N/A | N/A | 9/1/2013 - 8/31/2014 & 9/1/2014 - 8/31/2015 |
| 204 | October 31, 2014 |
| Notes to Financial Statements | ||
| October 31, 2014 |
| Fund | Class A | Class C | Class I | Class Inv | Class L | Class R | Term of Expense Limit Agreement | |||||||
RiverFront Global Allocation Fund | 0.90% | 0.90% | 0.90% | N/A | N/A | N/A | 9/1/2013 - 8/31/2014 & 9/1/2014 - 8/31/2015 | |||||||
RiverFront Global Growth Fund | 0.90% | 0.90% | 0.90% | 0.90% | 0.90% | N/A | 9/1/2013 - 8/31/2014 & 9/1/2014 - 8/31/2015 | |||||||
RiverFront Moderate Growth & Income Fund | 0.90% | 0.90% | 0.90% | N/A | N/A | N/A | 9/1/2013 - 8/31/2014 & 9/1/2014 - 8/31/2015 |
The Advisor(s) and each Sub-Advisor are permitted to recover expenses they have waived or reimbursed, on a class-by-class basis, through the agreements described above to the extent that expenses in later periods fall below the annual limits set forth in these agreements. Clough China Fund is not obligated to pay any such waived or reimbursed fees and expenses more than one year after the end of the fiscal year in which the fees or expenses were waived or reimbursed. The ALPS | Alerian MLP Infrastructure Index Fund, ALPS | CoreCommodity Management CompleteCommodities® Strategy Fund, ALPS | Kotak India Growth Fund, ALPS Real Asset Income Fund, ALPS | Red Rocks Listed Private Equity Fund, ALPS | Sterling ETF Tactical Rotation Fund, ALPS | Westport Resources Hedged High Income, ALPS | WMC Disciplined Value Fund, RiverFront Conservative Income Builder Fund, RiverFront Global Growth Fund, RiverFront Dynamic Equity Income Fund, RiverFront Global Allocation Fund and RiverFront Moderate Growth & Income Fund are not obligated to pay any such waived or reimbursed fees and expenses more than three years after the end of the fiscal year in which the fees or expenses were waived or reimbursed. At October 31, 2014, the Advisor(s) and Sub-Advisor may seek reimbursement of previously waived and reimbursed fees as follows:
| Fund | Expires 4/30/15 | Expires 10/31/15 | Expires 4/30/16 | Expires 4/30/17 | Expires 10/31/17 | Total | ||||||||||||||||||
ALPS | Alerian MLP Infrastructure Index Fund - Class A | $ | N/A | $ | N/A | $ | 9,499 | $ | 95,994 | $ | 48,763 | $ | 154,256 | ||||||||||||
ALPS | Alerian MLP Infrastructure Index Fund - Class C | N/A | N/A | 9,045 | 28,674 | 24,506 | 62,225 | ||||||||||||||||||
ALPS | Alerian MLP Infrastructure Index Fund - Class I | N/A | N/A | 36,196 | 38,321 | 23,256 | 97,773 | ||||||||||||||||||
ALPS | CoreCommodity Management CompleteCommodities® Strategy Fund - Class A | 92,408 | N/A | 91,338 | 55,147 | 5,093 | 243,986 | ||||||||||||||||||
ALPS | CoreCommodity Management CompleteCommodities® Strategy Fund - Class C | 22,973 | N/A | 17,117 | 9,066 | 1,738 | 50,894 | ||||||||||||||||||
ALPS | CoreCommodity Management CompleteCommodities® Strategy Fund - Class I | 132,927 | N/A | 21,636 | 30,311 | 11,487 | 196,361 | ||||||||||||||||||
ALPS | Kotak India Growth Fund - Class A | 162,829 | N/A | 188,194 | 198,350 | 81,178 | 630,551 | ||||||||||||||||||
ALPS | Kotak India Growth Fund - Class C | 55,637 | N/A | 37,562 | 38,130 | 16,958 | 148,287 | ||||||||||||||||||
ALPS | Kotak India Growth Fund - Class I | 156,766 | N/A | 121,202 | 87,957 | 78,795 | 444,720 | ||||||||||||||||||
ALPS Real Asset Income Fund – Class A | N/A | N/A | N/A | N/A | 51,445 | 51,445 | ||||||||||||||||||
ALPS Real Asset Income Fund – Class C | N/A | N/A | N/A | N/A | 46,721 | 46,721 | ||||||||||||||||||
ALPS Real Asset Income Fund – Class I | N/A | N/A | N/A | N/A | 191,995 | 191,995 | ||||||||||||||||||
ALPS | Red Rocks Listed Private Equity Fund - Class A | 46,849 | N/A | 11,372 | N/A | N/A | 58,221 | ||||||||||||||||||
ALPS | Red Rocks Listed Private Equity Fund - Class C | N/A | N/A | N/A | N/A | N/A | N/A | ||||||||||||||||||
ALPS | Red Rocks Listed Private Equity Fund - Class I | N/A | N/A | 14,669 | N/A | N/A | 14,669 | ||||||||||||||||||
ALPS | Red Rocks Listed Private Equity Fund - Class R | N/A | N/A | N/A | N/A | N/A | N/A | ||||||||||||||||||
ALPS | Sterling ETF Tactical Rotation Fund – Class A | N/A | N/A | N/A | N/A | 15,562 | 15,562 | ||||||||||||||||||
ALPS | Sterling ETF Tactical Rotation Fund – Class C | N/A | N/A | N/A | N/A | 7,752 | 7,752 | ||||||||||||||||||
ALPS | Sterling ETF Tactical Rotation Fund – Class I | N/A | N/A | N/A | N/A | 53,715 | 53,715 | ||||||||||||||||||
ALPS | Westport Resources Hedged High Income – Class A | N/A | N/A | N/A | N/A | 33,823 | 33,823 | ||||||||||||||||||
ALPS | Westport Resources Hedged High Income – Class C | N/A | N/A | N/A | N/A | 14,345 | 14,345 | ||||||||||||||||||
ALPS | Westport Resources Hedged High Income – Class I | N/A | N/A | N/A | N/A | 188,185 | 188,185 | ||||||||||||||||||
ALPS | WMC Disciplined Value Fund - Class A | 76,957 | N/A | 50,013 | 39,957 | 25,559 | 192,486 | ||||||||||||||||||
ALPS | WMC Disciplined Value Fund - Class C | 35 | N/A | 90 | 81 | 74 | 280 | ||||||||||||||||||
ALPS | WMC Disciplined Value Fund - Class I | 50,344 | N/A | 36,903 | 31,790 | 18,931 | 137,968 | ||||||||||||||||||
| 205 | October 31, 2014 |
| Notes to Financial Statements | ||
| October 31, 2014 |
| Fund | Expires 4/30/15 | Expires 10/31/15 | Expires 4/30/16 | Expires 4/30/17 | Expires 10/31/17 | Total | ||||||||||||||||||
Clough China Fund - Class A | $ | 40,594 | $ | 17,210 | $ | N/A | $ | N/A | $ | N/A | $ | 57,804 | ||||||||||||
Clough China Fund - Class C | 18,643 | 9,617 | N/A | N/A | N/A | 28,260 | ||||||||||||||||||
Clough China Fund - Class I | 40,939 | 22,406 | N/A | N/A | N/A | 63,345 | ||||||||||||||||||
RiverFront Conservative Income Builder Fund - Class A | N/A | N/A | 6,224 | 14,608 | 6,814 | 27,646 | ||||||||||||||||||
RiverFront Conservative Income Builder Fund - Class C | N/A | N/A | 38,763 | 50,536 | 28,317 | 117,616 | ||||||||||||||||||
RiverFront Conservative Income Builder Fund - Class I | N/A | N/A | 21,584 | 23,541 | 11,336 | 56,461 | ||||||||||||||||||
RiverFront Dynamic Equity Income Fund - Class A | 28,156 | N/A | 25,434 | 28,302 | 20,436 | 102,328 | ||||||||||||||||||
RiverFront Dynamic Equity Income Fund - Class C | 50,238 | N/A | 54,152 | 55,724 | 35,936 | 196,050 | ||||||||||||||||||
RiverFront Dynamic Equity Income Fund - Class I | 22,483 | N/A | 29,280 | 39,925 | 24,440 | 116,128 | ||||||||||||||||||
RiverFront Global Allocation Fund - Class A | 34,374 | N/A | 32,881 | 31,141 | 15,480 | 113,876 | ||||||||||||||||||
RiverFront Global Allocation Fund - Class C | 52,289 | N/A | 44,218 | 41,816 | 26,510 | 164,833 | ||||||||||||||||||
RiverFront Global Allocation Fund - Class I | 16,751 | N/A | 21,009 | 30,843 | 21,125 | 89,728 | ||||||||||||||||||
RiverFront Global Growth Fund - Class A | 28,761 | N/A | 22,444 | 28,381 | 20,675 | 100,261 | ||||||||||||||||||
RiverFront Global Growth Fund - Class C | 25,941 | N/A | 23,097 | 22,962 | 13,878 | 85,878 | ||||||||||||||||||
RiverFront Global Growth Fund - Class I | 20,698 | N/A | 18,595 | 27,339 | 29,599 | 96,231 | ||||||||||||||||||
RiverFront Global Growth Fund - Class L | 105,363 | N/A | 78,131 | 60,282 | 15,078 | 258,854 | ||||||||||||||||||
RiverFront Global Growth Fund - Investor Class | 49,504 | N/A | 31,778 | 22,272 | 9,650 | 113,204 | ||||||||||||||||||
RiverFront Moderate Growth & Income Fund - Class A | 31,744 | N/A | 49,603 | 52,042 | 25,024 | 158,413 | ||||||||||||||||||
RiverFront Moderate Growth & Income Fund - Class C | 64,551 | N/A | 92,197 | 96,176 | 54,689 | 307,613 | ||||||||||||||||||
RiverFront Moderate Growth & Income Fund - Class I | 21,391 | N/A | 38,570 | 55,830 | 33,901 | 149,692 | ||||||||||||||||||
ALPS Portfolio Solutions Distributor, Inc. (the “Distributor”) acts as the distributor of the Funds’ shares pursuant to a Distribution Agreement with the Trust. Shares are sold on a continuous basis by the Distributor, as agent for the Funds, and the Distributor has agreed to use its best efforts to solicit orders for the sale of Funds’ shares, although it is not obliged to sell any particular amount of shares. The Distributor is not entitled to any compensation for its services. The Distributor is registered as a broker-dealer with the Securities and Exchange Commission. The Funds’ Distributor is also the distributor of the Select Sector SPDR exchange traded funds (the “Underlying Sector ETFs”). As required by exemptive relief obtained by the Underlying Sector ETFs, the Advisor(s) will reimburse any applicable Fund an amount equal to the distribution fee received by the Distributor from the Underlying Sector ETFs attributable to such Fund’s investment in the Underlying Sector ETFs, for so long as the Distributor acts as distributor to such Fund and the Underlying Sector ETFs.
Each Fund has adopted a Distribution and Services Plan (the “Plan”) pursuant to Rule 12b-1 of the 1940 Act for the Class A, Class C, Class R (ALPS | Red Rocks Listed Private Equity Fund only), and Investor Class (RiverFront Global Growth Fund only) shares. The Plan allows a Fund to use Class A, Class C, Class R and Investor Class assets to pay fees in connection with the distribution and marketing of Class A, Class C, Class R and Investor Class shares and/or the provision of shareholder services to Class A, Class C, Class R and Investor Class shareholders. The Plan permits payment for services in connection with the administration of plans or programs that use Class A, Class C, Class R and Investor Class shares of a Fund, if any, as their funding medium and for related expenses. The Plan permits a Fund to make total payments at an annual rate of up to 0.25% of a Fund’s average daily net assets attributable to its Class A and Investor Class shares, 0.75% of a Fund’s average daily net assets attributable to its Class C shares and 0.50% of the ALPS | Red Rocks Listed Private Equity Fund’s average daily net assets attributable to its Class R shares.
Because these fees are paid out of a Fund’s Class A, Class C, Class R and Investor Class assets, if any, on an ongoing basis, over time they will increase the cost of an investment in Class A, Class C, Class R and Investor Class shares, if any, and Plan fees may cost an investor more than other types of sales charges.
The ALPS | Alerian MLP Infrastructure Index Fund Class A and Class C shares, ALPS | Kotak India Growth Fund Class A and Class C shares, ALPS Real Asset Income Fund Class A and Class C shares, ALPS | Red Rocks Listed Private Equity Fund Class A and Class C shares, ALPS | Sterling ETF Tactical Rotation Fund Class A and Class C shares, ALPS | Westport Resources Hedged High Income Fund Class A and Class C shares, ALPS | WMC Disciplined Value Fund Class C shares, Clough China Fund Class A and Class C shares, ALPS | CoreCommodity Management CompleteCommodities® Strategy Fund Class A and Class C shares, RiverFront Conservative Income Builder Fund Class C shares, RiverFront Dynamic Equity Income Fund Class C shares, RiverFront Global Allocation Fund Class C shares, RiverFront Global Growth Fund Class C Shares, and the RiverFront Moderate Growth & Income Fund Class C shares have adopted a shareholder services plan (“Shareholder Services Plan”). Under the Shareholder Services Plan for each Fund, the Funds are authorized to pay banks and their affiliates and other institutions, including broker-dealers and Fund affiliates (“Participating
| 206 | October 31, 2014 |
| Notes to Financial Statements | ||
| October 31, 2014 |
Organizations”), an aggregate fee in an amount not to exceed on an annual basis 0.15% for ALPS | Alerian MLP Infrastructure Index Fund Class A shares, ALPS | CoreCommodity Management CompleteCommodities® Strategy Fund Class A shares, ALPS | Kotak India Growth Fund Class A shares, ALPS Real Asset Income Fund Class A shares, ALPS | Red Rocks Listed Private Equity Fund Class A shares, ALPS | Sterling ETF Tactical Rotation Fund Class A shares, and ALPS | Westport Resources Hedged High Income Fund Class A shares, and not to exceed 0.25% for the ALPS | Alerian MLP Infrastructure Index Fund Class C shares, ALPS | CoreCommodity Management CompleteCommodities® Strategy Fund Class C shares, ALPS | Kotak India Growth Fund Class C shares, ALPS Real Asset Income Fund Class C shares, ALPS | Red Rocks Listed Private Equity Fund Class C shares, ALPS | Sterling ETF Tactical Rotation Fund Class C shares, ALPS | Westport Resources Hedged High Income Fund Class C shares, ALPS | WMC Disciplined Value Fund Class C shares, Clough China Fund Class C shares, RiverFront Conservative Income Builder Fund Class C shares, RiverFront Dynamic Equity Income Fund Class C shares, RiverFront Global Allocation Fund Class C shares, RiverFront Global Growth Fund Class C Shares, and the RiverFront Moderate Growth & Income Fund Class C shares of the average daily net asset value of the Class A shares and Class C shares, respectively, attributable to or held in the name of a Participating Organization for its clients as compensation for providing shareholder service activities, which do not include distribution services, pursuant to an agreement with a Participating Organization. Shareholder Services plan fees are included with distribution and service fees on the Statements of Operations.
Certain intermediaries may charge networking, omnibus account or other administrative fees with respect to transactions in shares of each Fund. Transactions may be processed through the National Securities Clearing Corporation or similar systems or processed on a manual basis. These fees generally are paid by the Fund to the Distributor, which uses such fees to reimburse intermediaries. In the event an intermediary receiving payments from the Distributor on behalf of the Fund converts from a networking structure to an omnibus account structure or otherwise experiences increased costs, fees borne by the Fund may increase. Networking fees are shown in the Statements of Operations, if applicable to the Fund.
ALPS Fund Services, Inc. (“ALPS”) serves as administrator to the Funds and the Funds have agreed to pay expenses incurred in connection with their administrative activities. Pursuant to an Administrative Agreement, ALPS provides operational services to the Funds including, but not limited to fund accounting and fund administration and generally assists in the Funds’ operations.
The Annual Administrative Fee is based on each Fund’s average daily net assets and will be billed monthly, at the following:
| Fund | Average Daily Net Assets of the Fund | Annual Administrative Fee | ||
ALPS | Alerian MLP Infrastructure Index Fund | All Asset Levels | 0.10% | ||
ALPS | CoreCommodity Management CompleteCommodities® Strategy Fund | All Asset Levels | 0.10%(a) | ||
ALPS | Kotak India Growth Fund | All Asset Levels | 0.15%(b) | ||
ALPS Real Asset Income Fund | All Asset Levels | 0.05%(c) | ||
ALPS | Red Rocks Listed Private Equity Fund | First $500 Million | 0.08% | ||
| $500 Million - $1 Billion | 0.06% | |||
| Over $1 Billion | 0.04% | |||
ALPS | Sterling ETF Tactical Rotation Fund | All Asset Levels | 0.05%(b) | ||
ALPS | Westport Resources Hedged High Income Fund | All Asset Levels | 0.10%(d) | ||
ALPS | WMC Disciplined Value Fund | All Asset Levels | 0.15% | ||
Clough China Fund | All Asset Levels | 0.15% | ||
RiverFront Conservative Income Builder Fund | All Asset Levels | 0.10% | ||
RiverFront Dynamic Equity Income Fund | All Asset Levels | 0.10% | ||
RiverFront Global Allocation Fund | All Asset Levels | 0.10% | ||
RiverFront Global Growth Fund | All Asset Levels | 0.10% | ||
RiverFront Moderate Growth & Income Fund | All Asset Levels | 0.10% |
| (a) | Subject to a minimum annual fee of $57,140. |
| (b) | Subject to a minimum annual fee of $100,000. |
| (c) | Subject to a minimum annual fee of $150,000. |
| (d) | Subject to a minimum annual fee of $50,000. |
In addition to the Annual Administrative Fee paid to ALPS, ALPS Price MeadowsSM (“APM”), a division of ALPS, provides administration services to the CoreCommodity Management Cayman Commodity Fund Ltd. and receives an annual fee of $50,000 for such services.
| 207 | October 31, 2014 |
| Notes to Financial Statements | ||
| October 31, 2014 |
9. INDEMNIFICATIONS
Under the Trust’s organizational documents, its officers and Trustees are indemnified against certain liability arising out of the performance of their duties to the Trust. Additionally, in the normal course of business, the Trust enters into contracts with service providers that may contain general indemnification clauses which may permit indemnification to the extent permissible under applicable law. The Trust’s maximum exposure under these arrangements is unknown, as this would involve future claims that may be made against the Trust that have not yet occurred.
| 208 | October 31, 2014 |
| Report of Independent Registered Public Accounting Firm | ||
To the Shareholders and Board of Trustees of Financial Investors Trust:
We have audited the accompanying statements of assets and liabilities, including the statements of investments, of ALPS | Red Rocks Listed Private Equity Fund, ALPS | WMC Disciplined Value Fund, Clough China Fund, ALPS | Alerian MLP Infrastructure Index Fund, ALPS | Sterling ETF Tactical Rotation Fund, ALPS | Westport Resources Hedged High Income Fund, RiverFront Conservative Income Builder Fund, RiverFront Global Growth Fund, RiverFront Dynamic Equity Income Fund, RiverFront Global Allocation Fund, RiverFront Moderate Growth & Income Fund, eleven of the funds of Financial Investors Trust (the “Trust”), as of October 31, 2014, the related statements of operations, the statements of changes in net assets and the financial highlights for the periods presented (as to the Clough China Fund, the financial highlights for the six month period ended October 31, 2014, for each of the four years in the period ended April 30, 2014, and the period August 1, 2009 to April 30, 2010) (as to the RiverFront Global Growth Fund, the financial highlights for the six month period ended October 31, 2014, for each of the three years in the period ended April 30, 2014, for the period January 1, 2011 to April 30, 2011, and for the year ended December 31, 2010). We have also audited the accompanying consolidated statements of assets and liabilities, including the consolidated statements of investments, of ALPS | Kotak India Growth Fund, ALPS | CoreCommodity Management CompleteCommodities Strategy Fund, and ALPS Real Asset Income Fund, three of the funds of the Trust, as of October 31, 2014, and the related consolidated statements of operations, the consolidated statements of changes in net assets and the consolidated financial highlights for each of the periods presented. These financial statements and financial highlights for these fourteen funds are the responsibility of the Trust’s management. Our responsibility is to express an opinion on these financial statements and financial highlights based on our audits. The financial highlights of the Clough China Fund for the year ended July 31, 2009 were audited by other auditors whose report, dated September 21, 2009, expressed an unqualified opinion on such financial highlights. The financial highlights of the RiverFront Global Growth Fund for the year ended December 31, 2009 were audited by other auditors whose report, dated February 26, 2010, expressed an unqualified opinion on such financial highlights.
We conducted our audits in accordance with the standards of the Public Company Accounting Oversight Board (United States). Those standards require that we plan and perform the audit to obtain reasonable assurance about whether the financial statements and financial highlights are free of material misstatement. The Trust is not required to have, nor were we engaged to perform, an audit of its internal control over financial reporting. Our audits included consideration of internal control over financial reporting as a basis for designing audit procedures that are appropriate in the circumstances, but not for the purpose of expressing an opinion on the effectiveness of the Trust’s internal control over financial reporting. Accordingly, we express no such opinion. An audit also includes examining, on a test basis, evidence supporting the amounts and disclosures in the financial statements, assessing the accounting principles used and significant estimates made by management, as well as evaluating the overall financial statement presentation. Our procedures included confirmation of securities owned as of October 31, 2014, by correspondence with the custodian, agent banks and brokers, where replies were not received from agent banks and brokers, we performed other auditing procedures. We believe that our audits provide a reasonable basis for our opinion.
In our opinion, the financial statements and financial highlights referred to above present fairly, in all material respects, the financial position of each of the fourteen funds constituting Financial Investors Trust as of October 31, 2014, the results of their operations, the changes in their net assets and the financial highlights for the periods presented, in conformity with accounting principles generally accepted in the United States of America (as to the Clough China Fund, the financial highlights for the six month period ended October 31, 2014, each of the four years in the period ended April 30, 2014, and the period August 1, 2009 to April 30, 2010) (as to the RiverFront Global Growth Fund, the financial highlights for the six month period ended October 31, 2014, each of the three years in the period ended April 30, 2014, the period January 1, 2011 to April 30, 2011, and for the year ended December 31, 2010).
DELOITTE & TOUCHE LLP
Denver, Colorado
December 23, 2014
| 209 | October 31, 2014 |
| Additional Information | ||
| October 31, 2014 (Unaudited) |
1. FUND HOLDINGS
The Funds file their complete schedule of portfolio holdings with the Securities and Exchange Commission (the “SEC”) for the first and third quarters of each fiscal year on Form N-Q within 60 days after the end of the period. Copies of the Funds’ Form N-Q are available without charge on the SEC website at http://www.sec.gov. You may also review and copy the Form N-Q at the SEC’s Public Reference Room in Washington, D.C. For more information about the operation of the Public Reference Room, please call the SEC at 1-800-SEC-0330.
2. FUND PROXY VOTING POLICIES, PROCEDURES AND SUMMARIES
Fund policies and procedures used in determining how to vote proxies and information regarding how each of the Funds voted proxies relating to portfolio securities during the most recent prior 12-month period ending June 30 are available without charge, (1) upon request, by calling (toll-free) (866) 759-5679 and (2) on the SEC’s website at http://www.sec.gov.
3. TAX DESIGNATIONS
Pursuant to Section 853(c) of the Internal Revenue Code, the Fund designates the following:
| Foreign Taxes Paid | Foreign Source Income | ||
Clough China Fund | $ 148,544 | $ 2,476,644 |
4. DISCLOSURE REGARDING APPROVAL OF FUND ADVISORY AND SUB-ADVISORY AGREEMENTS
Clough China Fund
On June 10, 2014, the Trustees met in person to discuss, among other things, the approval of the investment advisory agreement between the Trust and ALPS Advisors, Inc. (“ALPS Advisors”) (the “Investment Advisory Agreement”), and the Sub-Advisory Agreement with Clough Capital Partners, LLC (“Clough Capital”) (the “Sub-Advisory Agreement”), in accordance with Section 15(c) of the 1940 Act. The Independent Trustees met with independent legal counsel during executive session and discussed the Investment Advisory Agreement and Sub-Advisory Agreement, and other related materials.
In renewing and approving the Investment Advisory Agreement with ALPS Advisors and the Sub-Advisory Agreement with Clough Capital, the Trustees, including the Independent Trustees, considered the following factors with respect to the Clough China Fund (the “China Fund”):
Investment Advisory Fee Rate: The Trustees reviewed and considered the contractual annual advisory fee to be paid by (a) the Trust, on behalf of the China Fund, to ALPS Advisors of 1.35% of the China Fund’s daily average net assets and (b) ALPS Advisors to Clough Capital of 0.90% of the China Fund’s daily average net assets, in light of the extent and quality of the advisory services provided by the ALPS Advisors and Clough Capital to the China Fund. The Trustees also considered information regarding compensation to be paid to affiliates of ALPS Advisors under other agreements, such as the Fund Accounting and Administration Agreement with ALPS.
The Board received and considered information including a comparison of the China Fund’s contractual and actual advisory fees and overall expenses with those of funds in the relevant peer expense group of funds provided by an independent provider of investment company data.
Based on such information, the Trustees further determined that the annual advisory fees (after waivers) and the total expense ratios (after waivers) of 1.95%, 2.70% and 1.70% for Class A, Class C and Class I, respectively, of the China Fund, taking into account the contractual fee waivers in place through August 31, 2018 , though generally somewhat above the medians for their respective peer groups, are within a reasonable range of such peer group medians when considered in light of particular services provided to the China Fund.
Nature, Extent and Quality of the Services under the Investment Advisory Agreement and the Sub-Advisory Agreement: The Trustees received and considered information regarding the nature, extent and quality of services provided to the China Fund under the Investment Advisory Agreement and the Sub-Advisory Agreement. The Trustees reviewed certain background materials supplied by ALPS Advisors and Clough Capital in each of their presentations, including their Forms ADV and compliance policies and procedures.
The Trustees reviewed and considered ALPS Advisors’ and Clough Capital’s investment advisory personnel, their history as asset managers, their performance and the amount of assets currently under management by ALPS Advisors and Clough Capital. The Trustees also reviewed the research and decision-making processes utilized by ALPS Advisors and Clough Capital, including the methods adopted to seek to achieve compliance with the investment objectives, policies and restrictions of the China Fund.
The Trustees considered the background and experience of ALPS Advisors’ and Clough Capital’s management in connection with the China Fund, including reviewing the qualifications, backgrounds and responsibilities of the management team primarily responsible for the day-to-day portfolio management of the China Fund and the extent of the resources devoted to research and analysis of actual and potential investments.
| 210 | October 31, 2014 |
| Additional Information | ||
| October 31, 2014 (Unaudited) |
The Trustees also reviewed the accompanying compliance-related materials and noted that they have received reports on these services and compliance issues from ALPS Advisors and Clough Capital at each regular Board meeting throughout the year related to the services rendered by ALPS Advisors and Clough Capital with respect to the China Fund.
China Fund Performance: The Trustees reviewed performance information for the China Fund and the predecessor fund of the China Fund (December 30, 2005 inception date) for the 1-year, 2-year, 3-year, 4-year and 5-year periods ended March 31, 2014. That review included a comparison of the China Fund’s performance to the performance of a group of comparable funds selected by an independent provider of investment company data. The Trustees noted the China Fund’s generally favorable longer-term performance over such periods ended March 31, 2014, compared against peer funds identified by an independent provider of investment company data. The Trustees also considered Clough Capital’s performance and reputation generally and its investment techniques, risk management controls and decision-making processes, as well as Clough Capital’s overview of the China market, the economic outlook for investing in China and the potential effects of certain political and economic issues on trading in Chinese stocks.
Comparable Accounts, Total Expense Ratios, and the Advisers’ Profitability: The Trustees considered information provided by Clough Capital regarding fees charged to its closed-end investment company and private fund clients, noting Clough Capital’s statements regarding differences in trading strategies, activity levels and use of short sales and options. The Trustees received and considered a profitability analysis prepared by ALPS Advisors and by Clough Capital based on the fees payable under the Investment Advisory Agreement and Sub-Advisory Agreement, respectively. In assessing the profitability analysis, the Trustees noted that the China Fund’s total expense ratio (after waivers) and contractual advisory fee rate were was generally higher than, but within an acceptable range of the median of, comparable funds identified by an independent provider of investment company data. The Trustees considered that the China Fund was currently profitable to ALPS Advisors without the inclusion of distribution-related expenses, as well as the losses realized by Clough Capital in connection with the operation of the China Fund. The Trustees also considered Clough Capital’s statements regarding its continuing commitment to the China Fund despite these losses. The Board then reviewed ALPS Advisors’ and Clough Capital’s financial statements in order to analyze the financial condition and stability and profitability of each adviser.
Economies of Scale: The Trustees considered whether economies of scale in the provision of services to the China Fund were being passed along to the shareholders. The Trustees considered whether any economies of scale, fall-out benefits or any other direct or indirect benefits would accrue to ALPS Advisors or Clough Capital from their relationship with the Trust.
Other Benefits to the Advisers: The Trustees reviewed and considered any other benefits derived or to be derived by ALPS Advisors and Clough Capital from their relationship with the China Fund, including whether soft-dollar arrangements were used.
The Board summarized its deliberations with respect to the Investment Advisory Agreement with ALPS Advisors and the Sub-Advisory Agreement with Clough Capital. In selecting ALPS Advisors and Clough Capital and approving the investment advisory and sub-advisory agreements and fees under such agreements, the Trustees concluded that no single factor reviewed by the Trustees was identified by the Trustees to be determinative as the principal factor in whether to approve the investment advisory and sub-advisory agreements. Further, the Independent Trustees were advised by independent legal counsel throughout the process Moreover, each Trustee may have afforded different weight to the various factors in reaching his or her conclusions with respect to each agreement. The Trustees, including all of the Independent Trustees, concluded that:
| • | the total expense ratio and contractual advisory fee rate payable by the China Fund were generally higher than, but within an acceptable range of, the median of others within such Fund’s peer group; |
| • | the nature, extent and quality of services rendered by ALPS Advisors under the Investment Advisory Agreement and by Clough Capital under the Sub-Advisory Agreement were adequate; |
| • | bearing in mind the limitations of comparing different types of managed accounts and the different levels of service typically associated with such accounts, the fee structures applicable to Clough Capital’s other clients employing a comparable strategy were not indicative of any unreasonableness with respect to the sub-advisory fees proposed to be payable to Clough Capital by the Adviser ; |
| • | the performance of the China Fund was generally comparable to, or in some cases more favorable than, the longer-term performance of the funds in its performance peer universe selected by an independent provider of investment company data; |
| • | the future profit, if any, anticipated to be realized by ALPS Advisors and by Clough Capital in connection with the operation of the China Fund is not unreasonable, especially in light of the fee waiver agreement between the Trust and ALPS Advisors, and to the extent currently unprofitable, each of ALPS Advisors and Clough Capital remains committed to the China Fund; and |
| • | there were no material economies of scale or other benefits accruing to either ALPS Advisors or Clough Capital in connection with its relationship with the China Fund. |
Based on the Trustees’ deliberations and their evaluation of the information described above, all of the Trustees, including all of the Independent Trustees in person at the Meeting, concluded that ALPS Advisors’ and Clough Capital’s compensation for investment advisory services is consistent with the best interests of the China Fund and its shareholders.
| 211 | October 31, 2014 |
| Additional Information | ||
| October 31, 2014 (Unaudited) |
ALPS | Red Rocks Listed Private Equity Fund
On June 10, 2014, the Trustees met in person to discuss, among other things, the approval of the investment advisory agreement between the Trust and ALPS Advisors, Inc. (“ALPS Advisors”) (the “Investment Advisory Agreement”), and the Sub-Advisory Agreement with Red Rocks Capital LLC (“Red Rocks”) (the “Sub-Advisory Agreement”), in accordance with Section 15(c) of the 1940 Act. The Independent Trustees met with independent legal counsel during executive session and discussed the Investment Advisory Agreement and Sub-Advisory Agreement, and other related materials.
In renewing and approving the Investment Advisory and Management Agreement with ALPS Advisors and the Sub-Advisory Agreement with Red Rocks, the Trustees, including the Independent Trustees, considered the following factors with respect to the ALPS/Red Rocks Listed Private Equity Fund (the “LPE Fund”):
Investment Advisory Fee Rate: The Trustees reviewed and considered the contractual annual advisory fee to be paid by (a) the Trust, on behalf of the LPE Fund, to ALPS Advisors of 0.85% of the LPE Fund’s daily average net assets and (b) by ALPS Advisors to Red Rocks of 0.57% based on the LPE Fund’s average net assets, in light of the extent and quality of the advisory services provided by the ALPS Advisors and Red Rocks to the LPE Fund. The Trustees also considered information regarding compensation to be paid to affiliates of ALPS Advisors under other agreements, such as the Fund Accounting and Administration Agreement with ALPS.
The Board considered the information comparing the LPE Fund’s contractual and actual advisory fees and overall expenses with those of funds in the relevant peer expense group of funds provided by an independent provider of investment company data.
Based on such information, the Trustees further determined that the total expense ratio (after waivers, subject to certain exclusions) of 1.50% for Class A, 2.25% for Class C, 1.25% for Class I and 1.75% for Class R shares, respectively, of the LPE Fund, is comparable to others within such Fund’s peer group, and that the actual annual advisory fees (net of waivers) are within an acceptable range of the median of the respective peer group.
Nature, Extent and Quality of the Services under the Advisory Agreement and the Sub-Advisory Agreement: The Trustees received and considered information regarding the nature, extent and quality of services provided to the LPE Fund under the Investment Advisory and Management Agreement and the Investment Subadvisory Agreement. The Trustees reviewed certain background materials supplied by ALPS Advisors and Red Rocks in each of their presentations, including their Forms ADV and compliance policies and procedures.
The Trustees reviewed and considered ALPS Advisors’ and Red Rocks’ investment advisory personnel, their history as asset managers, their performance and the amount of assets currently under management by ALPS Advisors and Red Rocks. The Trustees also reviewed the research and decision-making processes utilized by ALPS Advisors and Red Rocks, including the methods adopted to seek to achieve compliance with the investment objectives, policies and restrictions of the LPE Fund.
The Trustees considered the background and experience of ALPS Advisors’ and Red Rocks’ management in connection with the LPE Fund, including reviewing the qualifications, backgrounds and responsibilities of the management team primarily responsible for the day-to-day portfolio management of the LPE Fund and the extent of the resources devoted to research and analysis of actual and potential investments.
The Trustees also reviewed the accompanying compliance-related materials and further noted that they have received reports on these services and compliance issues from ALPS Advisors and Red Rocks at each regular Board meeting throughout the year related to the services rendered by ALPS Advisors and Red Rocks with respect to the LPE Fund.
LPE Fund Performance: The Trustees reviewed performance information for the LPE Fund for the 1-year, 2-year, 3-year, 4-year and
5-year periods ended March 31, 2014. That review included a comparison of the LPE Fund’s performance to the performance of a universe of comparable funds selected by an independent provider of investment company data. The Trustees noted the generally favorable performance of the LPE Fund over more recent periods compared with the applicable performance peer universe of funds identified by an independent provider of investment company data. The Trustees also considered Red Rocks’ performance and reputation generally and its investment techniques, risk management controls and decision-making processes.
Comparable Accounts, Total Expense Ratios, and the Advisers’ Profitability: The Trustees received and considered a projected profitability analysis prepared by ALPS Advisors and by Red Rocks based on the fees payable under the Investment Advisory and Management Agreement and Investment Sub-Advisory Agreement, respectively. In assessing the projected profitability analysis, the Trustees noted that the LPE Fund’s total fees and expenses (after waivers) were generally comparable to the median expenses of comparable funds identified by an independent provider of investment company data. The Trustees considered the statements by both ALPS Advisors and Red Rocks that the LPE Fund was currently profitable to both. The Trustees also considered information regarding another registered investment company for which Red Rocks provides services. The Board then reviewed and discussed ALPS Advisors’ and Red Rocks’ financial statements in order to analyze the financial condition and stability of each adviser.
| 212 | October 31, 2014 |
| Additional Information | ||
| October 31, 2014 (Unaudited) |
Economies of Scale: The Trustees considered whether economies of scale in the provision of services to the LPE Fund were being passed along to the shareholders. The Trustees considered whether any economies of scale, fall-out benefits or any other direct or indirect benefits would accrue to ALPS Advisors or Red Rocks from their relationship with the Trust.
Other Benefits to the Advisers: The Trustees reviewed and considered any other benefits derived or to be derived by ALPS Advisors and Red Rocks from their relationship with the LPE Fund, including whether soft-dollar arrangements were used.
The Board summarized its deliberations with respect to the Investment Advisory and Management Agreement with ALPS Advisors and the Investment Sub-Advisory Agreement with Red Rocks. In selecting ALPS Advisors and Red Rocks and approving the investment advisory and sub-advisory agreements and fees under such agreements, the Trustees concluded that no single factor reviewed by the Trustees was identified by the Trustees to be determinative as the principal factor in whether to approve the investment advisory and sub-advisory agreements. Further, the Independent Trustees were advised by separate independent legal counsel throughout the process. The Trustees, including all of the Independent Trustees, concluded that:
| • | the investment advisory fees (after waivers) to be received by ALPS Advisors with respect to the LPE Fund were within an acceptable range of others within such Fund’s expense peer group; |
| • | the nature, extent and quality of services rendered by ALPS Advisors under the Investment Advisory and Management Agreement and by Red Rocks under the Investment Sub-Advisory Agreement were adequate; |
| • | bearing in mind the limitations of comparing different types of managed accounts and the different levels of service typically associated with such accounts, the fee structures applicable to Red Rocks’ other clients employing a comparable strategy were not indicative of any unreasonableness with respect to the advisory fees proposed to be payable by the LPE Fund; |
| • | the performance of the LPE Fund was generally comparable, and in some cases more favorable, to the performance of the funds in its performance peer universe, selected by an independent provider of investment company data, over more recent periods; |
| • | the profit, if any, anticipated to be realized by ALPS Advisors and by Red Rocks in connection with the operation of the LPE Fund is not unreasonable, especially in light of the fee waiver agreement among the Trust, ALPS Advisors and Red Rocks; and |
| • | there were no material economies of scale or other benefits accruing to ALPS Advisors or Red Rocks in connection with its relationship with the LPE Fund. |
Based on the Trustees’ deliberations and their evaluation of the information described above, all of the Trustees, including all of the Independent Trustees in person at the Meeting, concluded that ALPS Advisors’ and Red Rocks’ compensation for investment advisory services is consistent with the best interests of the LPE Fund and its shareholders.
ALPS | WMC Disciplined Value Fund
On June 10, 2014, the Trustees met in person to discuss, among other things, the approval of the investment advisory agreement between the Trust and ALPS Advisors, Inc. (“ALPS Advisors”) (the “Investment Advisory Agreement”), and the Sub-Advisory Agreement with Wellington Management Company, LLP (“Wellington”) (the “Sub-Advisory Agreement”), in accordance with Section 15(c) of the 1940 Act. The Independent Trustees met with independent legal counsel during executive session and discussed the Investment Advisory Agreement and Sub-Advisory Agreement, and other related materials.
In renewing and approving the Investment Advisory Agreement with ALPS Advisors and the Sub-Advisory Agreement with Wellington, the Trustees, including the Independent Trustees, considered the following factors with respect to the ALPS/WMC Disciplined Value Fund (the “WMC Fund”):
Investment Advisory Fee Rate: The Trustees reviewed and considered the tiered contractual annual advisory fee to be paid by (a) the Trust, on behalf of the WMC Fund, to ALPS Advisors of (i) 0.95% of the WMC Fund’s daily average net assets of $0-$250M; (ii) 0.85% of the WMC Fund’s daily average net assets between $250M-$500M ; and (iii) 0.75% of the WMC Fund’s daily average net assets over $500M and (b) by ALPS Advisors to Wellington of (i) 0.50% of the WMC Fund’s daily average net assets of $0-$250M; (ii) 0.40% of the WMC Fund’s daily average net assets between $250M-$500M; and (iii) 0.30% of the WMC Fund’s daily average net assets over $500M, in light of the extent and quality of the advisory services provided by the ALPS Advisors and Wellington to the WMC Fund. The Trustees also considered information regarding compensation to be paid to affiliates of ALPS Advisors under other agreements, such as the Fund Accounting and Administration Agreement with ALPS.
The Board received and considered information comparing the WMC Fund’s contractual and actual advisory fees and overall expenses with those of funds in the relevant expense peer group of funds provided by an independent provider of investment company data.
| 213 | October 31, 2014 |
| Additional Information | ||
| October 31, 2014 (Unaudited) |
Based on such information, the Trustees further determined that the actual annual advisory fees and the net total expense ratio of 1.40%, 2.15% and 1.15% for the WMC Fund’s Class A, Class C and Class I shares, respectively, taking into account the contractual fee waivers in place (subject to certain exclusions), though slightly above the medians for their respective peer groups, as provided by an independent provider of investment company data are within an acceptable range of such peer group medians when considered in light of service provided to the WMC Fund.
Nature, Extent and Quality of the Services under the Advisory Agreement and the Sub-Advisory Agreement: The Trustees received and considered information regarding the nature, extent and quality of services provided to the WMC Fund under the Advisory Agreement and the Sub-Advisory Agreement. The Trustees reviewed certain background materials supplied by ALPS Advisors and Wellington in each of their presentations, including their Forms ADV and compliance policies and procedures.
The Trustees reviewed and considered ALPS Advisors’ and Wellington’s investment advisory personnel, their history as asset managers, their performance and the amount of assets currently under management by ALPS Advisors and Wellington. The Trustees also reviewed the research and decision-making processes utilized by ALPS Advisors and Wellington, including the methods adopted to seek to achieve compliance with the investment objectives, policies and restrictions of the WMC Fund.
The Trustees considered the background and experience of ALPS Advisors’ and Wellington’s management in connection with the WMC Fund, including reviewing the qualifications, backgrounds and responsibilities of the management team primarily responsible for the day-to-day portfolio management of the WMC Fund and the extent of the resources devoted to research and analysis of actual and potential investments.
The Trustees also reviewed the accompanying compliance-related materials and noted that they have received reports on these services and compliance issues from ALPS Advisors and Wellington at each regular Board meeting throughout the year related to the services rendered by ALPS Advisors and Wellington with respect to the WMC Fund.
Performance: The Trustees reviewed performance information for the WMC Fund and the predecessor fund of the WMC Fund (December 31, 1999 inception) for the 1-year, 2-year, 3-year, 4-year, 5-year and 10-year periods ended March 31, 2014. That review included a comparison of the WMC Fund’s performance to the performance of a universe of comparable funds selected by an independent provider of investment company data. The Trustees noted the generally favorable performance of the WMC Fund over much of those periods compared against funds identified by an independent provider of investment company data. The Trustees also considered Wellington’s discussion of the WMC Fund’s performance contributors and detractors and its portfolio position and outlook, as well as Wellington’s performance and reputation generally and its investment techniques, risk management controls and decision-making processes.
Comparable Accounts, Total Expense Ratios, and the Advisers’ Profitability: The Trustees received and considered a projected profitability analysis prepared by ALPS Advisors and pro-forma financial information from Wellington based on the fees payable under the Investment Advisory Agreement and Sub-Advisory Agreement, respectively. The Trustees considered the losses realized by ALPS Advisors in connection with the operation of the WMC Fund. The Trustees also considered the advisers’ statements regarding their continuing commitment to the WMC Fund despite these losses. In addition, the Trustees considered information provided by Wellington regarding their institutional fee schedule for comparable strategies. In assessing the projected profitability analysis and pro-forma financial information, the Trustees noted that the WMC Fund’s total expense ratios (after waivers) were within an acceptable range of the median expenses of comparable funds identified by an independent provider of investment company data. The Board then reviewed and discussed ALPS Advisors’ and Wellington’s financial statements in order to analyze the financial condition and stability and profitability of each adviser.
Economies of Scale: The Trustees considered whether economies of scale in the provision of services to the WMC Fund were being passed along to the shareholders. The Trustees considered whether any economies of scale, fall-out benefits or any other direct or indirect benefits would accrue to ALPS Advisors or Wellington from their relationship with the Trust.
Other Benefits to the Advisers: The Trustees reviewed and considered any other benefits derived or to be derived by ALPS Advisors and Wellington from their relationship with the WMC Fund, including whether soft-dollar arrangements were used.
| 214 | October 31, 2014 |
| Additional Information | ||
| October 31, 2014 (Unaudited) |
The Board summarized its deliberations with respect to the Investment Advisory Agreement with ALPS Advisors and the Sub-Advisory Agreement with Wellington. In selecting ALPS Advisors and Wellington and approving the investment advisory and sub-advisory agreements and fees under such agreements, the Trustees concluded that no single factor reviewed by the Trustees was identified by the Trustees to be determinative as the principal factor in whether to approve the investment advisory and sub-advisory agreements. Further, the Independent Trustees were advised by separate independent legal counsel throughout the process. The Trustees, including all of the Independent Trustees, concluded that:
| • | the investment advisory fees (net of waivers) to be received by ALPS Advisors with respect to the WMC Fund were within an acceptable range of the median of others within such Fund’s peer group; |
| • | the nature, extent and quality of services rendered by ALPS Advisors under the Investment Advisory Agreement and by Wellington under the Sub-Advisory Agreement were adequate; |
| • | bearing in mind the limitations of comparing different types of managed accounts and the different levels of service typically associated with such accounts, the fee structures applicable to Wellington’s other clients employing a comparable strategy were not indicative of any unreasonableness with respect to the advisory fees proposed to be payable by the WMC Fund; |
| • | the performance of the WMC Fund was generally favorable compared with the performance of the funds in its performance peer universe selected by an independent provider of investment company data; |
| • | the profit, if any, anticipated to be realized by ALPS Advisors and by Wellington in connection with the operation of the WMC Fund is not unreasonable, especially in light of the fee waiver agreement between the Trust and ALPS Advisors, and to the extent currently unprofitable or profitable, each remains committed to the WMC Fund; and |
| • | there were no material economies of scale or other benefits accruing to either ALPS Advisors or Wellington in connection with its relationship with the WMC Fund. |
Based on the Trustees’ deliberations and their evaluation of the information described above, all of the Trustees, including all of the Independent Trustees in person at the Meeting, concluded that ALPS Advisors’ and Wellington’s compensation for investment advisory services is consistent with the best interests of the WMC Fund and its shareholders.
ALPS | CoreCommodity Management CompleteCommodities® Strategy Fund
On June 10, 2014, the Trustees met in person to discuss, among other things, the approval of the investment advisory agreement between the Trust and ALPS Advisors, Inc. (“ALPS Advisors”) (the “Investment Advisory Agreement”), in accordance with Section 15(c) of the 1940 Act. The Independent Trustees met with independent legal counsel during executive session and discussed the Investment Advisory Agreement and other related materials.
In renewing and approving the Investment Advisory Agreement with ALPS Advisors, the Trustees, including the Independent Trustees, considered the following factors with respect to the ALPS/CoreCommodity Management CompleteCommodities Strategy Fund (the “CoreCommodity Fund”):
Investment Advisory Fee Rate: The Trustees reviewed and considered the contractual annual advisory fee to be paid by (a) the Trust, on behalf of the CoreCommodity Fund, to ALPS Advisors of 0.85% of the CoreCommodity Fund’s daily average net assets and (b) by ALPS Advisors to CoreCommodity of (i) 0.75% of the CoreCommodity Fund’s daily average net assets, in light of the extent and quality of the advisory services provided by the ALPS Advisors and CoreCommodity to the CoreCommodity Fund. The Trustees also considered information regarding compensation to be paid to affiliates of ALPS Advisors under other agreements, such as the Fund Accounting and Administration Agreement with ALPS.
The Board received and considered information comparing the CoreCommodity Fund’s contractual and actual (net of waivers) advisory fees and overall expenses with those of funds in the relevant expense peer group of funds provided by an independent provider of investment company data.
Based on such information, the Trustees further determined that the actual annual advisory fees and the total expense ratio, in each case net of waivers, of 1.40% for Class A shares, 2.05% for Class C shares, and 1.15% for Class I shares of the CoreCommodity Fund, taking into account the contractual fee waivers in place, were within an acceptable range of others within such Fund’s peer universe.
Nature, Extent and Quality of the Services under the Investment Advisory Agreement: The Trustees received and considered information regarding the nature, extent and quality of services provided to the CoreCommodity Fund under the Investment Advisory Agreement. The Trustees reviewed certain background materials supplied by ALPS Advisors in its presentations, including its Form ADV.
The Trustees reviewed and considered ALPS Advisors’ investment advisory personnel, its history as an asset manager, its performance and the amount of assets currently under management by ALPS Advisors. The Trustees also reviewed the research and decision-making processes utilized by ALPS Advisors, including the methods adopted to seek to achieve compliance with the investment objectives, policies and restrictions of the CoreCommodity Fund.
| 215 | October 31, 2014 |
| Additional Information | ||
| October 31, 2014 (Unaudited) |
The Trustees considered the background and experience of ALPS Advisors’ management in connection with the CoreCommodity Fund.
The Trustees also reviewed the accompanying compliance-related materials and noted that they have received reports on these services and compliance issues from ALPS Advisors and CoreCommodity at each regular Board meeting throughout the year related to the services rendered by ALPS Advisors and CoreCommodity with respect to the CoreCommodity Fund.
CoreCommodity Fund Performance: The Trustees reviewed performance information for the CoreCommodity Fund for the 1-year, 2-year and 3-year periods ended March 31, 2014. The review included a comparison of the CoreCommodity Fund’s performance to the performance of a universe of comparable funds selected by an independent provider of investment company data. The Trustees noted that the CoreCommodity Fund had generally favorable relative performance for each of the more recent periods when compared against comparable funds identified by an independent provider of investment company data. The Trustees also considered ALPS Advisors’ CoreCommodity’s performance and reputation generally and their investment techniques, risk management controls and decision-making processes.
Total Expense Ratios and the Advisers’ Profitability: The Trustees received and considered a profitability analysis prepared by ALPS Advisors based on the fees payable under the Investment Advisory Agreement. In assessing the projected profitability analysis, the Trustees noted that the CoreCommodity Fund’s total expense ratios were within an acceptable range of the median expenses of comparable funds identified by an independent provider of investment company data. The Trustees considered that the CoreCommodity Fund was currently profitable to ALPS Advisors without the inclusion of distribution-related expenses. The Board then reviewed and discussed ALPS Advisors’ financial statements in order to analyze the financial condition and stability and profitability of the adviser.
Economies of Scale: The Trustees considered whether economies of scale in the provision of services to the CoreCommodity Fund were being passed along to the shareholders. The Trustees considered whether any economies of scale, fall-out benefits or any other direct or indirect benefits would accrue to ALPS Advisors or CoreCommodity from their relationship with the Trust.
Other Benefits to the Adviser: The Trustees reviewed and considered any other benefits derived or to be derived by ALPS Advisors and CoreCommodity from their relationship with the CoreCommodity Fund, including whether soft dollar arrangements were used.
The Board summarized its deliberations with respect to the Investment Advisory Agreement with ALPS Advisors. In selecting ALPS Advisors and approving the investment advisory agreement and fees under the agreement, the Trustees concluded that no single factor reviewed by the Trustees was identified by the Trustees to be determinative as the principal factor in whether to approve the investment advisory agreement. Further, the Independent Trustees were advised by separate independent legal counsel throughout the process. The Trustees, including all of the Independent Trustees, concluded that:
| • | the investment advisory fees (net of waivers) to be received by ALPS Advisors with respect to the CoreCommodity Fund were within an acceptable range of others within such Fund’s peer group; |
| • | the nature, extent and quality of services rendered by ALPS Advisors under the Investment Advisory Agreement were adequate; |
| • | the performance of the CoreCommodity Fund was generally favorable relative to the performance of the funds in its performance peer universe selected by an independent provider of investment company data over more recent periods; |
| • | there was no comparable account information of ALPS Advisors for the Trustees to consider; |
| • | the future profit, if any, anticipated to be realized by ALPS Advisors in connection with the operation of the CoreCommodity Fund is not unreasonable, especially in light of the fee waiver agreement between the Trust and CoreCommodity; and to the extent currently unprofitable, ALPS Advisors remains committed to the CoreCommodity Fund; and |
| • | there were no material economies of scale or other benefits accruing to ALPS Advisors in connection with its relationship with the CoreCommodity Fund. |
Based on the Trustees’ deliberations and their evaluation of the information described above, the Trustees, including all of the Independent Trustees, concluded that ALPS Advisors’ compensation for investment advisory services is consistent with the best interests of the CoreCommodity Fund and its shareholders.
RiverFront Global Allocation Series
On June 10, 2014, the Trustees met in person to discuss, among other things, the approval of the investment advisory agreement between the Trust and ALPS Advisors, Inc. (“ALPS Advisors”) (the “Investment Advisory Agreement”), and the Sub-Advisory Agreement with RiverFront
| 216 | October 31, 2014 |
| Additional Information | ||
| October 31, 2014 (Unaudited) |
Investment Group, LLC (“RiverFront”) (the “Sub-Advisory Agreement”), in accordance with Section 15(c) of the 1940 Act. The Independent Trustees met with independent legal counsel during executive session and discussed the Investment Advisory Agreement and Sub-Advisory Agreement, and other related materials.
In renewing and approving the Investment Advisory Agreement with ALPS Advisors and the Sub-Advisory Agreement with RiverFront, the Trustees, including the Independent Trustees, considered the following factors with respect to the RiverFront Global Allocation Series (the “RiverFront Funds”):
Investment Advisory Fee Rate: The Trustees reviewed and considered the contractual annual advisory fee to be paid by (a) the Trust, on behalf of the RiverFront Funds, to ALPS Advisors of 0.85% of each of the RiverFront Fund’s daily average net assets and (b) by ALPS Advisors to RiverFront of 0.60% of each of the RiverFront Fund’s daily average net assets, in light of the extent and quality of the advisory services provided by the ALPS Advisors and RiverFront to the RiverFront Funds.
The Board received and considered information comparing the RiverFront Funds’ actual advisory fees and overall expenses (net of waivers) with those of funds in the relevant peer expense group of funds provided by an independent provider of investment company data.
Based on such information, the Trustees further determined that the actual annual advisory fees and the total expense ratios for Class A, Class C, Class I, Class L and Investor Class shares of each of the RiverFront Funds, taking into account the contractual fee waivers in place (subject to certain exclusions), are comparable to, and in some cases lower than, others within such Fund’s peer group.
Nature, Extent and Quality of the Services under the Investment Advisory Agreement and the Sub-Advisory Agreement: The Trustees received and considered information regarding the nature, extent and quality of services provided to the RiverFront Funds under the Investment Advisory Agreement and the Sub-Advisory Agreement. The Trustees reviewed certain background materials supplied by ALPS Advisors and RiverFront in each of their presentations, including their Forms ADV and compliance policies and procedures.
The Trustees reviewed and considered ALPS Advisors’ and RiverFront’s investment advisory personnel, their history as asset managers, their performance and the amount of assets currently under management by ALPS Advisors and RiverFront. The Trustees also reviewed the research and decision-making processes utilized by ALPS Advisors and RiverFront, including the methods adopted to seek to achieve compliance with the investment objectives, policies and restrictions of the RiverFront Funds.
The Trustees considered the background and experience of ALPS Advisors’ and RiverFront’s management in connection with the RiverFront Funds, including reviewing the qualifications, backgrounds and responsibilities of the management team primarily responsible for the day-to-day portfolio management of the RiverFront Funds and the extent of the resources devoted to research and analysis of actual and potential investments.
The Trustees also reviewed the accompanying compliance-related materials and noted that they have received reports on these services and compliance issues from ALPS Advisors and RiverFront at each regular Board meeting throughout the year related to the services rendered by ALPS Advisors and RiverFront with respect to the RiverFront Funds.
RiverFront Funds’ Performance: The Trustees reviewed performance information for each RiverFront Fund for the 1-year, 2-year and 3-year periods ended March 31, 2014, as applicable. The review included a comparison of each of the RiverFront Fund’s performance to the performance of a universe of comparable funds selected by an independent provider of investment company data. The Trustees noted that, while the net total return performance for each Fund was generally below the respective performance universe average, such performance was still within an acceptable range of the average and applicable benchmark. The Trustees also considered RiverFront’s performance and reputation generally and its investment techniques, risk management controls and decision-making processes.
Comparable Accounts, Total Expense Ratios, and the Advisers’ Profitability: The Trustees received and considered a projected profitability analysis prepared by ALPS Advisors and by RiverFront based on the fees payable under the Investment Advisory Agreement and Sub-Advisory Agreement, respectively. In assessing the projected profitability analysis, the Trustees noted that the total expense ratios for each of the RiverFront Funds (net of waivers) were either within an acceptable range of or below the median expenses of comparable funds identified by an independent provider of investment company data. In addition, the Trustees noted certain information provided by RiverFront regarding its typical fee ranges for UMA and SMA accounts. The Trustees considered that certain of the RiverFront Funds were profitable to ALPS Advisors without the inclusion of distribution-related expenses, and that all of the RiverFront Funds were currently profitable to RiverFront excluding the RiverFront Conservative Income Builder Fund. The Trustees also considered ALPS Advisors’ and RiverFront’s statements regarding their continuing commitment to the RiverFront Funds despite any losses with respect to certain of the Funds. The Board then reviewed and discussed ALPS Advisors’ and RiverFront’s financial statements in order to analyze the financial condition and stability and profitability of each adviser.
| 217 | October 31, 2014 |
| Additional Information | ||
| October 31, 2014 (Unaudited) |
Economies of Scale: The Trustees considered whether economies of scale in the provision of services to the RiverFront Funds were being passed along to the shareholders. The Trustees considered whether any economies of scale, fall-out benefits or any other direct or indirect benefits would accrue to ALPS Advisors or RiverFront from their relationship with the Trust.
Other Benefits to the Adviser: The Trustees reviewed and considered any other benefits derived or to be derived by ALPS Advisors and RiverFront from their relationship with the RiverFront Funds, including whether soft dollar arrangements were used.
The Board summarized its deliberations with respect to the Investment Advisory Agreement with ALPS Advisors and the Sub-Advisory Agreement with RiverFront. In selecting ALPS Advisors and RiverFront and approving the investment advisory and sub-advisory agreements and fees under such agreements, the Trustees concluded that no single factor reviewed by the Trustees was identified by the Trustees to be determinative as the principal factor in whether to approve the investment advisory and sub-advisory agreements. Further, the Independent Trustees were advised by separate independent legal counsel throughout the process. The Trustees, including all of the Independent Trustees, concluded that:
| • | the actual investment advisory fees (net of waivers) to be received by ALPS Advisors with respect to the RiverFront Funds were comparable to, and in certain cases lower than, others within each Fund’s respective peer group; |
| • | the nature, extent and quality of services rendered by ALPS Advisors under the Investment Advisory Agreement and by RiverFront under the Sub-Advisory Agreement were adequate; |
| • | bearing in mind the limitations of comparing different types of managed accounts and the different levels of service typically associated with such accounts, the fee structures applicable to RiverFront’s other clients employing a comparable strategy were not indicative of any unreasonableness with respect to the advisory fees proposed to be payable by the RiverFront Funds; |
| • | the performance of each of the RiverFront Funds was generally within an acceptable range of the performance of the Funds in each Fund’s performance peer universe selected by an independent provider of investment company data; |
| • | the profit, if any, anticipated to be realized by ALPS Advisors and by RiverFront in connection with the operation of the RiverFront Funds is not unreasonable, especially in light of the fee waiver agreement among the Trust, ALPS Advisors and RiverFront, and to the extent currently unprofitable, ALPS Advisors and RiverFront remain committed to each of the RiverFront Funds; and |
| • | there were no material economies of scale or other benefits accruing to either ALPS Advisors or RiverFront in connection with its relationship with the RiverFront Funds. |
Based on the Trustees’ deliberations and their evaluation of the information described above, the Trustees, including all of the Independent Trustees, concluded that ALPS Advisors’ and RiverFront’s compensation for investment advisory services is consistent with the best interests of each of the RiverFront Funds and its shareholders.
ALPS | Kotak India Growth Fund
On June 10, 2014, the Trustees met in person to discuss, among other things, the approval of the investment advisory agreement between the Trust and ALPS Advisors, Inc. (“ALPS Advisors”) (the “Investment Advisory Agreement”), and the Sub-Advisory Agreement with Kotak Mahindra (UK) Limited (“Kotak”) (the “Sub-Advisory Agreement”), in accordance with Section 15(c) of the 1940 Act. The Independent Trustees met with independent legal counsel during executive session and discussed the Investment Advisory Agreement and Sub-Advisory Agreement, and other related materials.
In renewing and approving the Investment Advisory Agreement with ALPS Advisors and the Sub-Advisory Agreement with Kotak, the Trustees, including the Independent Trustees, considered the following factors with respect to the ALPS/Kotak India Growth Fund (the “India Fund”):
Investment Advisory Fee Rate: The Trustees reviewed and considered the contractual annual advisory fee to be paid by (a) the Trust, on behalf of the India Fund, to ALPS Advisors of 1.25% of the India Fund’s daily average net assets and (b) by ALPS Advisors to Kotak of (i) 1.15% of the India Fund’s daily average net assets on the first $50 million and 1.05% of the India Fund’s daily average net assets over $50 million, in light of the extent and quality of the advisory services provided by the ALPS Advisors and Kotak to the India Fund. The Trustees also considered information regarding compensation to be paid to affiliates of ALPS Advisors under other agreements, such as the Fund Accounting and Administration Agreement with ALPS.
The Board received and considered information comparing the India Fund’s contractual and actual advisory fees and overall expenses with those of funds in the relevant expense group of funds provided by an independent provider of investment company data.
Based on such information, the Trustees further determined that the actual annual advisory fees (net of waivers) were lower than the median of the other funds in the India Fund’s peer group, while the total expense ratio (net of waivers) of 2.00%, 2.60% and 1.60% for Class A shares, Class C shares, and Class I shares, respectively, of the India Fund was within an acceptable range of others within such Fund’s peer fund group.
| 218 | October 31, 2014 |
| Additional Information | ||
| October 31, 2014 (Unaudited) |
Nature, Extent and Quality of the Services under the Investment Advisory Agreement and the Sub-Advisory Agreement: The Trustees received and considered information regarding the nature, extent and quality of services provided to the India Fund under the Investment Advisory Agreement and the Sub-Advisory Agreement. The Trustees reviewed certain background materials supplied by ALPS Advisors and Kotak in each of their presentations, including their Forms ADV and compliance policies and procedures.
The Trustees reviewed and considered ALPS Advisors’ and Kotak’s investment advisory personnel, their history as asset managers, their performance and the amount of assets currently under management by ALPS Advisors and Kotak. The Trustees also reviewed the research and decision-making processes utilized by ALPS Advisors and Kotak, including the methods adopted to seek to achieve compliance with the investment objectives, policies and restrictions of the India Fund.
The Trustees considered the background and experience of ALPS Advisors’ and Kotak’s management in connection with the India Fund, including reviewing the qualifications, backgrounds and responsibilities of the management team primarily responsible for the day-to-day portfolio management of the India Fund and the extent of the resources devoted to research and analysis of actual and potential investments.
The Trustees also reviewed the accompanying compliance-related materials and noted that they have received reports on these services and compliance issues from ALPS Advisors and Kotak at each regular Board meeting through the year related to the services rendered by ALPS Advisors and Kotak with respect to the India Fund.
India Fund Performance: The Trustees reviewed performance information for the India Fund for the 1-year, 2-year and 3-year periods ended March 31, 2014. The review included a comparison of the India Fund’s performance to the performance of a group of comparable funds selected by an independent provider of investment company data. The Trustees also considered Kotak’s performance and reputation generally and its investment techniques, risk management controls and decision-making processes.
Comparable Accounts, Total Expense Ratios, and the Advisers’ Profitability: The Trustees received and considered a profitability analysis prepared by ALPS Advisors and by Kotak based on the fees payable under the Investment Advisory Agreement and Sub-Advisory Agreement, respectively. The Trustees also considered information provided by Kotak regarding fee schedules applicable to certain collective investment vehicles managed by Kotak and marketed outside the United States and certain other institutional clients. The Trustees considered the losses realized by ALPS Advisors and by Kotak in connection with the operation of the India Fund. The Trustees also considered the advisers’ statements regarding their continuing commitment to the India Fund despite these losses. In assessing the projected profitability analysis, the Trustees noted that the India Fund’s total expense ratios (net of waivers) were within an acceptable range of the median expenses of comparable funds identified by an independent provider of investment company data. The Board then reviewed and discussed ALPS Advisors’ and Kotak’s financial statements in order to analyze the financial condition and stability and profitability of each adviser.
Economies of Scale: The Trustees considered whether economies of scale in the provision of services to the India Fund were being passed along to the shareholders. The Trustees considered whether any economies of scale, fall-out benefits or any other direct or indirect benefits would accrue to ALPS Advisors or Kotak from their relationship with the Trust.
Other Benefits to the Adviser: The Trustees reviewed and considered any other benefits derived or to be derived by ALPS Advisors and Kotak from their relationship with the India Fund, including whether soft dollar arrangements were used.
The Board summarized its deliberations with respect to the Investment Advisory Agreement with ALPS Advisors and the Sub-Advisory Agreement with Kotak. In selecting ALPS Advisors and Kotak and approving the investment advisory and sub-advisory agreements and fees under such agreements, the Trustees concluded that no single factor reviewed by the Trustees was identified by the Trustees to be determinative as the principal factor in whether to approve the investment advisory and sub-advisory agreements. Further, the Independent Trustees were advised by separate independent legal counsel throughout the process. The Trustees, including all of the Independent Trustees, concluded that:
| • | the actual investment advisory fees (net of waivers) received by ALPS Advisors with respect to the India Fund were generally lower than the median of the others within such Fund’s peer group; |
| • | the nature, extent and quality of services rendered by ALPS Advisors under the Investment Advisory Agreement and by Kotak under the Sub-Advisory Agreement were adequate; |
| • | bearing in mind the limitations of comparing different types of managed accounts and the different levels of service typically associated with such accounts, the fee structures applicable to Kotak’s other clients employing a comparable strategy were not indicative of any unreasonableness with respect to the advisory fees proposed to be payable by the India Fund; |
| • | the performance of the India Fund was generally favorable to the performance of the funds in its performance peer universe selected by an independent provider of investment company data over more recent periods; |
| 219 | October 31, 2014 |
| Additional Information | ||
| October 31, 2014 (Unaudited) |
| • | to the extent the India Fund is currently unprofitable to ALPS Advisors and Kotak, each remains committed to the India Fund; |
| • | there were no material economies of scale or other benefits accruing to ALPS Advisors or Kotak in connection with its relationship with the India Fund. |
Based on the Trustees’ deliberations and their evaluation of the information described above, the Trustees, including all of the Independent Trustees, concluded that ALPS Advisors’ and Kotak’s compensation for investment advisory services is consistent with the best interests of the India Fund and its shareholders.
ALPS | Alerian MLP Infrastructure Index Fund
On June 10, 2014, the Trustees met in person to discuss, among other things, the approval of the investment advisory agreement between the Trust and ALPS Advisors, Inc. (“ALPS Advisors”) (the “Investment Advisory Agreement”), in accordance with Section 15(c) of the 1940 Act. The Independent Trustees met with independent legal counsel during executive session and discussed the Investment Advisory Agreement, and other related materials.
In renewing and approving the Investment Advisory Agreement with ALPS Advisors, the Trustees, including the Independent Trustees, considered the following factors with respect to the ALPS/Alerian MLP Infrastructure Index Fund (the “Alerian Fund”):
Investment Advisory Fee Rate: The Trustees reviewed and considered the contractual annual advisory fee to be paid by the Trust, on behalf of the Alerian Fund, to ALPS Advisors of 0.70% of the Fund’s daily net assets, in light of the extent and quality of the advisory services to be provided by ALPS Advisors to the Alerian Fund.
The Trustees considered the information they received comparing the Alerian Fund’s actual and contractual annual advisory fee and overall expenses with those of funds in the relevant expense group of funds provided by an independent provider of investment company data.
The Trustees also considered information regarding compensation to be paid to affiliates of ALPS Advisors under other agreements, such as the Fund Accounting and Administration Agreement with ALPS.
Based on such information, the Trustees further determined that the actual annual advisory fee for the Alerian Fund and the total expense ratio (in each case net of waivers) of 1.25% for Class A, 1.85% for Class C and 0.85% for Class I shares of the Fund, taking into account the contractual fee waiver in place, are less than the median of other funds within the Alerian Fund’s peer fund group.
Nature, Extent and Quality of the Services under the Investment Advisory Agreement: The Trustees received and considered information regarding the nature, extent and quality of services provided to the Alerian Fund under the Investment Advisory Agreement. The Trustees reviewed certain background materials supplied by ALPS Advisors in its presentation, including its Form ADV.
The Trustees reviewed and considered ALPS Advisors’ investment advisory personnel, its history as an asset manager and its performance and the amount of assets currently under management by ALPS Advisors and its affiliated entities. The Trustees also reviewed the research and decision-making processes utilized by ALPS Advisors, including the methods adopted to seek to achieve compliance with the investment objectives, policies and restrictions of the Alerian Fund.
The Trustees considered the background and experience of ALPS Advisors’ management in connection with the Alerian Fund, including reviewing the qualifications, backgrounds and responsibilities of the management team primarily responsible for the day-to-day portfolio management of the Alerian Fund and the extent of the resources devoted to research and analysis of actual and potential investments.
The Trustees also reviewed, among other things, ALPS Advisors’ Code of Ethics.
Alerian Fund Performance: The Trustees reviewed performance information for the Alerian Fund for the 1-year period ended March 31, 2014. The review included a comparison of the Alerian Fund’s performance to the performance of a universe of comparable funds selected by an independent provider of investment company data. The Trustees considered that, unlike many of its competitors, the Alerian Fund was based on a passive, index-tracking strategy and was not actively managed. The Trustees also considered ALPS Advisors’ performance and reputation generally and its investment techniques, risk management controls and decision-making processes.
Comparable Accounts, Total Expense Ratios, and the Advisers’ Profitability: The Trustees received and considered a profitability analysis prepared by ALPS Advisors based on the fees payable under the Investment Advisory Agreement. The Trustees also considered information provided by ALPS Advisors regarding the fee rate applicable to a different investment company utilizing a similar strategy, noting ALPS Advisors’ statements regarding differences in competitive markets and operational structures. The Trustees considered the losses realized by ALPS Advisors
| 220 | October 31, 2014 |
| Additional Information | ||
| October 31, 2014 (Unaudited) |
in connection with the operation of the Alerian Fund. The Trustees also considered ALPS Advisors’ statements regarding its continuing commitment to the Alerian Fund despite these losses. In assessing the profitability analysis, the Trustees noted that the Alerian Fund’s total expense ratios (net of waivers) were generally below that of the median expenses of comparable funds identified by an independent provider of investment company data. The Board then reviewed and discussed ALPS Advisors’ financial statements in order to analyze the financial condition and stability and profitability of the adviser.
Economies of Scale: The Trustees considered whether economies of scale in the provision of services to the Alerian Fund would be passed along to the shareholders.
Other Benefits to the Adviser: The Trustees reviewed and considered any other incidental benefits derived or to be derived by ALPS Advisors from its relationship with the Alerian Fund, including whether soft dollar arrangements were used.
In selecting ALPS Advisors as the Alerian Fund’s investment adviser and approving the Investment Advisory Agreement and the fees charged under the Investment Advisory Agreement, the Trustees concluded that no single factor reviewed by the Trustees was identified by the Trustees to be determinative as the principal factor in whether to approve the Investment Advisory Agreement. Further, the Independent Trustees were advised by independent legal counsel throughout the process. The Trustees, including all of the Independent Trustees, concluded that:
| • | the investment advisory fees (net of waivers) received by ALPS Advisors with respect to the Alerian Fund were generally lower than the median of other funds within such Fund’s peer group; |
| • | the nature, extent and quality of services rendered by ALPS Advisors under the Investment Advisory Agreement were adequate; |
| • | bearing in mind the limitations of comparing different types of managed accounts and the different levels of service typically associated with such accounts, the fee structures applicable to ALPS Advisors’ other clients employing a comparable strategy were not indicative of any unreasonableness with respect to the advisory fees proposed to be payable by the Alerian Fund; |
| • | the performance history of the Alerian Fund was within a reasonable range of those funds in its peer performance universe selected by an independent provider of investment company data, bearing in mind that the fact that unlike many funds in the peer universe it did not follow an active management investment strategy; |
| • | the profit, if any, anticipated to be realized by ALPS Advisors in the future in connection with the operation of the Alerian Fund is not unreasonable to the Alerian Fund, and to the extent currently unprofitable to ALPS Advisors, it remains committed to the Alerian Fund; and |
| • | there were no material economies of scale or other incidental benefits accruing to ALPS Advisors in connection with its relationship with the Alerian Fund at this time. |
Based on the Trustees’ deliberations and their evaluation of the information described above, the Trustees, including all of the Independent Trustees, concluded that ALPS Advisors’ compensation for investment advisory services is consistent with the best interests of the Alerian Fund and its shareholders.
ALPS | Sterling ETF Tactical Rotation Fund
On June 10, 2014, the Trustees met in person to discuss, among other things, the approval of the investment advisory agreement between the Trust and ALPS Advisors, Inc. (“ALPS Advisors”) (the “Investment Advisory Agreement”), and the Sub-Advisory Agreement with Sterling Global Strategies LLC (“Sterling”) (the “Sub-Advisory Agreement”), in accordance with Section 15(c) of the 1940 Act. The Independent Trustees met with independent legal counsel during executive session and discussed the Investment Advisory Agreement and Sub-Advisory Agreement, and other related materials.
In approving the Investment Advisory Agreement with ALPS Advisors and the Sub-Advisory Agreement with Sterling, the Trustees, including the Independent Trustees, considered the following factors with respect to the ALPS/Sterling ETF Tactical Rotation Fund (the “Sterling Fund”):
Investment Advisory Fee Rate: The Trustees reviewed and considered the contractual annual advisory fee to be paid (a) by the Trust, on behalf of the Sterling Fund, to ALPS Advisors of 0.95% of the Sterling Fund’s daily average net assets and (b) the contractual annual sub-advisory fee to be paid by ALPS Advisors to Sterling of 0.60% of the Sterling Fund’s daily average net assets, in light of the extent and quality of the advisory services to be provided by each to the Sterling Fund. The Trustees also considered information regarding compensation to be paid to affiliates of ALPS Advisors under other agreements, such as the proposed amended Fund Accounting and Administration Agreement with ALPS.
The Trustees considered the information they received comparing the Sterling Fund’s contractual annual advisory fees and overall expenses with those of funds in the relevant expense peer group provided by an independent provider of investment company data.
| 221 | October 31, 2014 |
| Additional Information | ||
| October 31, 2014 (Unaudited) |
Based on such information, the Trustees further determined that the contractual annual advisory fee of 0.95% of the Sterling Fund’s daily average net assets, and total expenses of 1.55%, 2.15% and 1.15% for the Class A, Class C and Class I shares, respectively, after taking into account the contractual fee waiver in place between the Trust and Sterling, subject to certain exclusions, were expected to be below the median of the funds within the Sterling Fund’s anticipated expense peer group.
Nature, Extent and Quality of the Services under the Investment Advisory Agreement and Sub-Advisory Agreement: The Trustees received and considered information regarding the nature, extent and quality of services to be provided to the Sterling Fund under the Investment Advisory Agreement and Sub-Advisory Agreement. The Trustees reviewed certain background materials supplied by ALPS Advisors and Sterling in their presentations, including their Form ADVs, financial statements and compliance policies and procedures.
The Trustees reviewed and considered ALPS Advisors’ and Sterling’s investment advisory personnel, their history as asset managers and the amount of assets currently under management by each. The Trustees also reviewed the research and decision-making processes utilized by ALPS Advisor and Sterling, including the methods adopted to seek to achieve compliance with the investment objectives, policies and restrictions of the Sterling Fund.
The Trustees considered the background and experience of ALPS Advisors’ and Sterling’s management in connection with the Sterling Fund, including reviewing the qualifications, backgrounds and responsibilities of the management team primarily responsible for the day-to-day portfolio management of the Sterling and the extent of the resources devoted to research and analysis of actual and potential investments.
The Trustees also reviewed, among other things, ALPS Advisors’ and Sterling’s codes of ethics.
Performance: The Trustees noted that since the Sterling Fund has not yet begun operations, there is no fund performance to be reviewed or analyzed at this time. The Trustees also considered the limitations on the comparability of performance information for certain related funds and accounts. The Trustees considered ALPS Advisors’ and Sterling’s reputation generally and their investment techniques, risk management controls and decision-making processes.
The Advisers’ Profitability: The Trustees received and considered a projected profitability analysis prepared by each of ALPS Advisors and Sterling based on the fees payable under the respective Investment Advisory Agreement and Sub-Advisory Agreement, as applicable. The Trustees considered the profits, if any, anticipated to be realized by ALPS Advisors and Sterling in connection with the operation of the Sterling Fund. To the extent indicated by ALPS Advisors or Sterling that the Sterling Fund would not be immediately profitable, the Board recognized the commitment made by each to the Fund. The Board then reviewed and discussed ALPS Advisors’ and Sterling’s financial statements in order to analyze the financial condition and stability and profitability of each adviser.
Economies of Scale: The Trustees considered whether economies of scale in the provision of services to the Sterling Fund will be passed along to the shareholders under the proposed agreements.
Other Benefits to the Advisers: The Trustees reviewed and considered any other incidental benefits derived or to be derived by ALPS Advisors and Sterling from their relationship with the Sterling Fund, including whether soft dollar arrangements were used.
The Board summarized its deliberations with respect to the Investment Advisory Agreement with ALPS Advisors and the Sub-Advisory Agreement with Sterling. In selecting ALPS Advisors and Sterling, and the fees charged under the Investment Advisory Agreement and Sub-Advisory Agreement, the Trustees concluded that no single factor reviewed by the Trustees was identified by the Trustees to be determinative as the principal factor in whether to approve the Investment Advisory Agreement or Sub-Advisory Agreement. Further, the Independent Trustees were advised by independent legal counsel throughout the process. The Trustees, including all of the Independent Trustees, concluded that:
| — | the investment advisory fee to be received by ALPS Advisors, and the projected total expense ratios with respect to the Sterling Fund after taking into account contractual fee waivers, were general below the median of others within the Fund’s peer group, and that the sub-advisory fees were to be paid by ALPS Advisors and not paid directly by the Fund; |
| — | the nature, extent and quality of services to be rendered by ALPS Advisors under the Investment Advisory Agreement, and Sterling under the Sub-Advisory Agreement, are adequate; |
| — | bearing in mind the limitations of comparing different types of managed accounts and the different levels of service typically associated with such accounts, the fee structures applicable to Sterling’s other clients employing a comparable strategy were not indicative of any unreasonableness with respect to the advisory fees proposed to be payable by the Sterling Fund; |
| — | there was no performance history for the Sterling Fund for the Board to consider; |
| 222 | October 31, 2014 |
| Additional Information | ||
| October 31, 2014 (Unaudited) |
| — | the terms of the proposed fee waiver and expense limitation agreement between the Trust, on behalf of the Sterling Fund, and Sterling, were not unreasonable; |
| — | there was no historical profitability for the adviser and the sub-advisor with respect to the Sterling Fund for the Board to consider; and |
| — | there were no material economies of scale or other incidental benefits accruing to ALPS Advisors and Sterling in connection with their relationship with the Sterling Fund, at this time. |
Based on the Trustees’ deliberations and their evaluation of the information described above, the Trustees, including all of the Independent Trustees, concluded that ALPS Advisors’ and Sterling’s compensation for investment advisory services is consistent with the best interests of the Sterling Fund and its shareholders.
| 223 | October 31, 2014 |
| Trustees and Officers | ||
| October 31, 2014 (Unaudited) |
Additional information regarding the Funds’ trustees is included in the Statement of Additional Information, which can be obtained without charge by calling (toll-free) (866) 759-5679.
INDEPENDENT TRUSTEES
Name, Address* & Year of Birth | Position(s) Held with Fund | Term of Office and Length of Time Served** | Principal Occupation(s) During Past 5 Years*** | Number of Funds in Fund Complex Overseen by Trustee**** | Other Directorships Held by Trustee | |||||
Mary K. Anstine, 1940 | Trustee | Ms. Anstine was elected at a special meeting of shareholders held on March 21, 1997 and re-elected at a special meeting of shareholders held on August 7, 2009. | Ms. Anstine was President/Chief Executive Officer of HealthONE Alliance, Denver, Colorado, and former Executive Vice President of First Interstate Bank of Denver. Ms. Anstine is also Trustee/Director of AV Hunter Trust and Colorado Uplift Board. Ms. Anstine was formerly a Director of the Trust Bank of Colorado (later purchased and now known as Northern Trust Bank), HealthONE and Denver Area Council of the Boy Scouts of America, and a member of the American Bankers Association Trust Executive Committee.
| 67 | Ms. Anstine is a Trustee of ALPS ETF Trust (14 funds); ALPS Variable Investment Trust (8 funds); Reaves Utility Income Fund (1 fund); and Westcore Trust (12 funds). | |||||
John R. Moran, Jr., 1930 | Trustee | Mr. Moran was elected at a special meeting of shareholders held on March 21, 1997 and re-elected at a special meeting of shareholders held on August 7, 2009. | Mr. Moran is formerly President and CEO of The Colorado Trust, a private foundation serving the health and hospital community in the state of Colorado. Currently, Mr. Moran is a member of the Treasurer’s Investment Advisory Committee for the University of Colorado.
| 32 | None. | |||||
Jeremy W. Deems, 1976 | Trustee | Mr. Deems was appointed as a Trustee at the March 11, 2008 meeting of the Board of Trustees and elected at a special meeting of shareholders held on August 7, 2009. | Mr. Deems is the Co-Founder, Chief Operations Officer and Chief Financial Officer of Green Alpha Advisors, LLC. Mr. Deems is Co-Portfolio Manager of the Shelton Green Alpha Fund. Prior to joining Green Alpha Advisors, Mr. Deems was CFO and Treasurer of Forward Management, LLC, ReFlow Management Co., LLC, ReFlow Fund, LLC, a private investment fund, and Sutton Place Management, LLC, an administrative services company, from 2004 to June 2007.
| 67 | Mr. Deems is a Trustee of ALPS ETF Trust (14 funds); ALPS Variable Investment Trust (8 funds) and Reaves Utility Income Fund (1 fund). | |||||
| * | All communications to Trustees and Officers may be directed to Financial Investors Trust c/o 1290 Broadway, Suite 1100, Denver, CO 80203. |
| ** | This is the period for which the Trustee or Officer began serving the Trust. Each Trustee and/or Officer serves an indefinite term, until his successor is elected. |
| *** | Except as otherwise indicated, each individual has held the office shown or other offices in the same company for the last five years. |
| **** | The Fund Complex includes all series of the Trust, currently 32, and any other investment companies for which any Trustee serves as Trustee for and which ALPS Advisors, Red Rocks, Wellington Management, Clough Capital, RiverFront, Kotak, RREEF America, Westport Resources, Concise Capital Management, LP, Amundi Smith Breeden LLC, Sound Point Capital Management, L.P. or Sterling Global Strategies LLC provides investment advisory services (currently 38 funds, 0 funds, 0 funds, 3 funds, 1 fund, 0 funds, 0 funds, 0 funds, 0 funds, 0 funds, 0 funds and 0 funds, respectively). |
| 224 | October 31, 2014 |
| Trustees and Officers | ||
| October 31, 2014 (Unaudited) |
INDEPENDENT TRUSTEES
Name, Address* & Year of Birth | Position(s) Held with Fund | Term of Office and Length of Time Served** | Principal Occupation(s) During Past 5 Years*** | Number of Fund Complex | Other Directorships Held by Trustee | |||||
Jerry G. Rutledge, 1944 | Trustee | Mr. Rutledge was elected at a special meeting of shareholders held on August 7, 2009. | Mr. Rutledge is the President and owner of Rutledge’s Inc., a retail clothing business. He was from 1994 to 2007 a Regent of the University of Colorado. | 36 | Mr. Rutledge is a Trustee of Principal Real Estate Income Fund (1 fund), Clough Global Allocation Fund (1 fund), Clough Global Equity Fund (1 fund) and Clough Global Opportunities Fund (1 fund).
| |||||
Michael “Ross” Shell, 1970 | Trustee | Mr. Shell was elected at a special meeting of shareholders held on August 7, 2009. | Mr. Shell is Founder and CEO of Red Idea, LLC, a strategic consulting/early stage venture firm (since June 2008). From 1999 to 2009, he was a part- owner and Director of Tesser, Inc., a brand agency. From December 2005 to May 2008, he was Director, Marketing and Investor Relations, of Woodbourne, a REIT/real estate hedge fund and private equity firm. Prior to this, from May 2004 to November 2005, he worked as a business strategy consultant; from June 2003 to April 2004, he was on the Global Client Services team of IDEO, a product design/innovation firm; and from 1999 to 2003, he was President of Tesser, Inc. Mr. Shell graduated with honors from Stanford University with a degree in Political Science.
| 32 | None. | |||||
| * | All communications to Trustees and Officers may be directed to Financial Investors Trust c/o 1290 Broadway, Suite 1100, Denver, CO 80203. |
| ** | This is the period for which the Trustee or Officer began serving the Trust. Each Trustee and/or Officer serves an indefinite term, until his successor is elected. |
| *** | Except as otherwise indicated, each individual has held the office shown or other offices in the same company for the last five years. |
| **** | The Fund Complex includes all series of the Trust, currently 32, and any other investment companies for which any Trustee serves as Trustee for and which ALPS Advisors, Red Rocks, Wellington Management, Clough Capital, RiverFront, Kotak, RREEF America, Westport Resources, Concise Capital Management, LP, Amundi Smith Breeden LLC, Sound Point Capital Management, L.P. or Sterling Global Strategies LLC provides investment advisory services (currently 38 funds, 0 funds, 0 funds, 3 funds, 1 fund, 0 funds, 0 funds, 0 funds, 0 funds, 0 funds, 0 funds and 0 funds, respectively). |
| 225 | October 31, 2014 |
| Trustees and Officers | ||
| October 31, 2014 (Unaudited) |
INTERESTED TRUSTEE
Name, Address* & Year of Birth | Position(s) Held with Fund | Term of Office and Length of Time Served** | Principal Occupation(s) During Past 5 Years*** | Number of Fund Complex | Other Directorships Held by Trustee | |||||
Edmund J. Burke, 1961 | Trustee, Chairman and President | Mr. Burke was elected as Chairman at the August 28, 2009 meeting of the Board of Trustees. Mr. Burke was elected as Trustee at a special meeting of shareholders held on August 7, 2009. Mr. Burke was elected President of the Trust at the December 17, 2002 meeting of the Board of Trustees. | Mr. Burke is President and a Director of ALPS Holdings, Inc. (“AHI”) (since 2005) and Director of Boston Financial Data Services, Inc. (“BFDS”), ALPS Advisors, Inc. (“AAI”), ALPS Distributors, Inc. (“ADI”), ALPS Fund Services, Inc. (“AFS”) and ALPS Portfolio Solutions Distributor, Inc. (“APSD”) and from 2001-2008, was President of AAI, ADI, AFS and APSD. Because of his positions with AHI, BFDS, AAI, ADI, AFS and APSD, Mr. Burke is deemed an affiliate of the Trust as defined under the 1940 Act. Mr. Burke is Trustee and President of the Clough Global Allocation Fund (Trustee since 2006; President since 2004); Trustee and President of the Clough Global Equity Fund (Trustee since 2006; President since 2005); Trustee and President of the Clough Global Opportunities Fund (since 2006); Trustee of the Liberty All-Star Equity Fund; and Director of the Liberty All-Star Growth Fund, Inc.
| 37 | Mr. Burke is a Trustee of Clough Global Allocation Fund (1 fund); Clough Global Equity Fund (1 fund); Clough Global Opportunities Fund (1 fund); Trustee of the Liberty All-Star Equity Fund (1 fund); and Director of the Liberty All-Star Growth Fund, Inc. (1 fund). | |||||
| * | All communications to Trustees and Officers may be directed to Financial Investors Trust c/o 1290 Broadway, Suite 1100, Denver, CO 80203. |
| ** | This is the period for which the Trustee began serving the Trust. Each Trustee serves an indefinite term, until his successor is elected. |
| *** | Except as otherwise indicated, each individual has held the office shown or other offices in the same company for the last five years. |
| **** | The Fund Complex includes all series of the Trust, currently 32, and any other investment companies for which any Trustee serves as Trustee for and which ALPS Advisors, Red Rocks, Wellington Management, Clough Capital, RiverFront, Kotak, RREEF America, Westport Resources, Concise Capital Management, LP, Amundi Smith Breeden LLC, Sound Point Capital Management, L.P. or Sterling Global Strategies LLC provides investment advisory services (currently 38 funds, 0 funds, 0 funds, 3 funds, 1 fund, 0 funds, 0 funds, 0 funds, 0 funds, 0 funds, 0 funds and 0 funds, respectively). |
| 226 | October 31, 2014 |
| Trustees and Officers | ||
| October 31, 2014 (Unaudited) |
OFFICERS
Name, Address* & Year of Birth | Position(s) Held with Fund | Term of Office and Length of Time Served** | Principal Occupation(s) During Past 5 Years*** | |||
Kimberly R. Storms, 1972 | Treasurer | Ms. Storms was elected Treasurer of the Trust at the March 12, 2013 meeting of the Board of Trustees. | Ms. Storms is Senior Vice President - Director of Fund Administration of ALPS. Ms. Storms joined ALPS in 1998 as Assistant Controller. Because of her position with ALPS, Ms. Storms is deemed an affiliate of the Trust as defined under the 1940 Act. Ms. Storms is also Treasurer of BPV Family of Funds and ALPS Series Trust; Assistant Treasurer of Liberty All-Star Equity Fund and Liberty All-Star Growth Fund, Inc.; Assistant Treasurer of Tilson Funds; and Chief Financial Officer of The Arbitrage Funds.
| |||
David T. Buhler, 1971 | Secretary | Mr. Buhler was elected Secretary of the Trust at the September 11, 2012 meeting of the Board of Trustees. | Mr. Buhler joined ALPS in June 2010. He is currently Vice President and Senior Associate Counsel of ALPS, AAI, ADI and APSD. Prior to joining ALPS, Mr. Buhler served as Associate General Counsel and Assistant Secretary of Founders Asset Management LLC from 2006 to 2009. Because of his position with ALPS, Mr. Buhler is deemed an affiliate of the Trust as defined under the 1940 Act. Mr. Buhler is also the Secretary ALPS Variable Investment Trust and Westcore Trust.
| |||
Ted Uhl, 1974 | Chief Compliance Officer (“CCO”) | Mr. Uhl was appointed CCO of the Trust at the June 8, 2010 meeting of the Board of Trustees. | Mr. Uhl joined ALPS in October 2006, and is currently Deputy Compliance Officer of ALPS. Prior to his current role, Mr. Uhl served as Senior Risk Manager for ALPS from October 2006 until June 2010. Before joining ALPS, Mr. Uhl served a Sr. Analyst with Enenbach and Associates (RIA), and a Sr. Financial Analyst at Sprint. Because of his position with ALPS, Mr. Uhl is deemed an affiliate of the Trust as defined under the 1940 Act. Mr. Uhl is also CCO of the Clough Global Funds, Reaves Utility Income Fund, Drexel Hamilton Funds and Transparent Value Trust.
| |||
| * | All communications to Trustees and Officers may be directed to Financial Investors Trust c/o 1290 Broadway, Suite 1100, Denver, CO 80203. |
| ** | This is the period for which the Trustee began serving the Trust. Each Trustee serves an indefinite term, until his successor is elected. |
| *** | Except as otherwise indicated, each individual has held the office shown or other offices in the same company for the last five years. |
| 227 | October 31, 2014 |
ANNUAL REPORT | October 31, 2014
| ||||
The Management Commentaries included in this shareholder report contain certain forward-looking statements about the factors that may affect the performance of the Funds in the future. These statements are based on Fund management’s predictions and expectations concerning certain future events and their expected impact on the Funds, such as performance of the economy as a whole and of specific industry sectors, changes in the levels of interest rates, the impact of developing world events, and other factors that may influence the future performance of the Funds. Management believes these forward-looking statements to be reasonable, although they are inherently uncertain and difficult to predict. Actual events may cause adjustments in portfolio management strategies from those currently expected to be employed.
Must be accompanied or preceded by a prospectus. Investors are reminded to read the prospectus carefully before investing.
ALPS Portfolio Solutions Distributor, Inc., distributor. ALP000844
|
| Item 2. | Code of Ethics. |
| (a) | The Registrant, as of the end of the period covered by this report, has adopted a code of ethics that applies to the Registrant’s principal executive officer, principal financial officer, principal accounting officer or controller or any persons performing similar functions on behalf of the Registrant. |
| (b) | Not applicable. |
| (c) | During the period covered by this report, no amendments to the provisions of the code of ethics described in Item 2(a) above were made. |
| (d) | During the period covered by this report, no implicit or explicit waivers to the provisions of the code of ethics described in Item 2(a) above were granted. |
| (e) | Not applicable. |
| (f) | The Registrant’s Code of Ethics is attached as an Exhibit to this report. |
| Item 3. | Audit Committee Financial Expert. |
The Board of Trustees of the Registrant has determined that the Registrant has at least one Audit Committee Financial Expert serving on its audit committee. The Board of Trustees of the Registrant has designated Jeremy W. Deems as the Registrant’s “Audit Committee Financial Expert.” Mr. Deems is “independent” as defined in paragraph (a)(2) of Item 3 to Form N-CSR.
| Item 4. | Principal Accountant Fees and Services. |
| (a) | Audit Fees: For the Registrant’s fiscal years ended October 31, 2014, April 30, 2014 and April 30, 2013, the aggregate fees billed for professional services rendered by the principal accountant for the audit of the Registrant’s annual financial statements were $241,500, $447,000 and $407,000, respectively. |
| (b) | Audit-Related Fees: For the Registrant’s fiscal years ended October 31, 2014, April 30, 2014 and April 30, 2013, the aggregate fees billed for assurance and related services by the principal accountant that were reasonably related to the performance of the audit of the Registrant’s financial statements and are not reported under paragraph (a) of this Item were $0, $0 and $0, respectively. |
2
| (c) | Tax Fees: For the Registrant’s fiscal years ended October 31, 2014, April 30, 2014 and April 30, 2013, the aggregate fees billed for professional services rendered by the principal accountant for tax compliance, tax advice and tax planning were $45,545, $112,280 and $104,120, respectively. The fiscal year 2014 and 2013 tax fees were for services for dividend calculation, excise tax preparation and tax return preparation. |
| (d) | All Other Fees: For the Registrant’s fiscal years ended October 31, 2014, April 30, 2014 and April 30, 2013, no fees were billed to Registrant by the principal accountant for services other than the services reported in paragraphs (a) through (c) of this Item. |
| (e)(1) | Audit Committee Pre-Approval Policies and Procedures: All services to be performed by the Registrant’s principal accountant must be pre-approved by the Registrant’s audit committee. The Chairman of the Audit Committee may pre-approve non-audit services to be performed by the Registrant’s principal accountant on an interim basis, subject to ratification by the Audit Committee at its next regularly scheduled meeting. |
| (e)(2) | No services described in paragraphs (b) through (d) of this Item were approved by the Registrant’s audit committee pursuant to paragraph (c)(7)(i)(C) of Rule 2-01 of Regulation S-X. |
| (f) | Not applicable. |
| (g) | The aggregate non-audit fees billed by the Registrant’s accountant to the Registrant, and rendered to the Registrant’s investment adviser (not including any sub-adviser whose role is primarily portfolio management and is subcontracted with or overseen by another investment adviser), and any entity controlling, controlled by, or under common control with the adviser that provides ongoing services to the Registrant, were $66,004 in fiscal year ended October 31, 2014, $153,978 in fiscal year ended April 30, 2014 and $128,443 in fiscal year ended April 30, 2013. These fees consisted of non-audit fees billed to (i) the Registrant of $45,545 in fiscal year ended October 31, 2014, $112,280 in fiscal year ended April 30, 2014 and $104,120 in fiscal year ended April 30, 2013 as described in response to paragraph (c) above and (ii) to ALPS Fund Services, Inc. (“AFS”), an entity under common control with ALPS Advisors, Inc., the Registrant’s investment adviser, of $20,459 in fiscal year ended October 31, 2014, $41,698 in fiscal year ended April 30, 2014 and $24,323 in fiscal year ended April 30, 2013. The non-audit fees billed to AFS related to SSAE 16 services and other compliance-related matters. |
| (h) | The Registrant’s audit committee has considered whether the provision of non-audit services that were rendered to the Registrant’s investment adviser (not including any sub-adviser whose role is primarily portfolio management and is |
3
subcontracted with or overseen by another investment adviser), and any entity controlling, controlled by, or under common control with the investment adviser that provides ongoing services to the Registrant that were not pre-approved pursuant to paragraph (c)(7)(ii) of Rule 2-01 of Regulation S-X, is compatible with maintaining the principal accountant’s independence. The Registrant’s audit committee determined that the provision of such non-audit services is compatible with maintaining the principal accountant’s independence. |
| Item 5. | Audit Committee of Listed Registrants. |
Not applicable.
| Item 6. | Investments. |
| (a) | Schedule of Investments is included as part of the Reports to Stockholders filed under Item 1 of this Form N-CSR. |
| (b) | Not applicable. |
| Item 7. | Disclosure of Proxy Voting Policies and Procedures for Closed-End Management Investment Companies. |
Not applicable to Registrant.
| Item 8. | Portfolio Managers of Closed-End Management Investment Companies. |
Not applicable to Registrant.
| Item 9. | Purchases of Equity Securities by Closed-End Management Investment Company and Affiliated Purchasers. |
Not applicable to Registrant.
| Item 10. | Submission of Matters to a Vote of Security Holders. |
There have been no material changes to the procedures by which shareholders may recommend nominees to the Registrant’s Board of Trustees, where those changes were implemented after the Registrant last provided disclosure in response to the requirements of Item 407(c)(2)(iv) of Regulation S-K, or this Item.
| Item 11. | Controls and Procedures. |
| (a) | The Registrant’s principal executive officer and principal financial officer have concluded that the Registrant’s disclosure controls and procedures (as defined in Rule 30a-3(c) under the Investment Company Act of 1940, as amended) are effective based on their evaluation of these controls and procedures as of a date within 90 days of the filing date of this report. |
4
| (b) | There was no change in the Registrant’s internal control over financial reporting (as defined in Rule 30a-3(d) under the Investment Company Act of 1940, as amended) during the second fiscal quarter of the period covered by this report that has materially affected, or is reasonably likely to materially affect, the Registrant’s internal control over financial reporting. |
| Item 12. | Exhibits. |
| (a)(1) | Registrant’s Code of Ethics for Principal Executive and Senior Financial Officers, which is the subject of the disclosure required by Item 2 of Form N-CSR, is incorporated by reference to Exhibit 12(a)(1) to the Registrant’s Certified Shareholder Report on Form N-CSR, File No. 811-8194, filed on July 7, 2008. |
| (a)(2) | The certifications required by Rule 30a-2(a) of the Investment Company Act of 1940, as amended, and Section 302 of the Sarbanes-Oxley Act of 2002 are attached hereto as Exhibit 99.Cert. |
| (a)(3) | Not applicable. |
| (b) | The certifications by the Registrant’s principal executive officer and principal financial officer, as required by Rule 30a-2(b) of the Investment Company Act of 1940, as amended, and Section 906 of the Sarbanes-Oxley Act of 2002 are attached hereto as Exhibit 99.906Cert. |
5
SIGNATURES
Pursuant to the requirements of the Securities Exchange Act of 1934 and the Investment Company Act of 1940, the Registrant has duly caused this report to be signed on its behalf by the undersigned, thereunto duly authorized.
FINANCIAL INVESTORS TRUST
| By: | /s/ Edmund J. Burke | |
| Edmund J. Burke (Principal Executive Officer) | ||
| President | ||
| Date: | January 8, 2015 | |
Pursuant to the requirements of the Securities Exchange Act of 1934 and the Investment Company Act of 1940, this report has been signed below by the following persons on behalf of the Registrant and in the capacities and on the dates indicated.
FINANCIAL INVESTORS TRUST
| By: | /s/ Edmund J. Burke | |
| Edmund J. Burke (Principal Executive Officer) | ||
| President | ||
| Date: | January 8, 2015 | |
| By: | /s/ Kimberly R. Storms | |
| Kimberly R. Storms (Principal Financial Officer) | ||
| Treasurer | ||
| Date: | January 8, 2015 | |
6