UNITED STATES
SECURITIES AND EXCHANGE COMMISSION
Washington, D.C. 20549
FORM N-CSR
CERTIFIED SHAREHOLDER REPORT OF REGISTERED
MANAGEMENT INVESTMENT COMPANIES
Investment Company Act file number: 811-8194
FINANCIAL INVESTORS TRUST
(Exact name of registrant as specified in charter)
1290 Broadway, Suite 1100, Denver, Colorado 80203
(Address of principal executive offices) (Zip code)
JoEllen L. Legg, Secretary
Financial Investors Trust
1290 Broadway, Suite 1100
Denver, Colorado 80203
(Name and address of agent for service)
Registrant’s telephone number, including area code: 303-623-2577
Date of fiscal year end: April 30
Date of reporting period: May 1, 2011 - April 30, 2012
EXPLANATORY NOTES
The Registrant is filing this amendment to its Form N-CSR for the period ended April 30, 2012, originally filed with the Securities and Exchange Commission on July 6, 2012 (Accession No. 0001193125-12-295889), to correct typographical errors in the share class headings on pages 10 and 11 (Consolidated Financial Highlights) of the annual report for the Aspen Managed Futures Strategy Fund. Other than the aforementioned revisions, this amendment does not reflect events occurring after the filing of the Form N-CSR filed on July 6, 2012, nor does it update or modify the disclosures therein in any other way.
Items 2 through 11 to this amendment to Form N-CSR are incorporated by reference to the Form N-CSR filed with the SEC on July 6, 2012 (Accession No. 0001193125-12-295889).
Item 1. Reports to Stockholders.
The section of the Registrant’s Form N-CSR filed on July 6, 2012 pertaining to the Annual Report (April 30, 2012) of the Aspen Managed Futures Strategy Fund is replaced in its entirety by the following:

TABLE OF CONTENTS
| | |
Aspen Managed Futures Strategy Fund | | Manager Commentary |
| | | April 30, 2012 (Unaudited) |
Market Conditions
After months of handwringing, a batch of failed elections, and continued worries over the European banking system, the Greek crisis has reached an inflection point. The most likely resolution is one that, in the eyes of Germany, solved the most issues for the lowest cost. That is why the issuance of euro bonds is the high probability outcome.
In joining the Eurozone, Germany found a way to artificially depreciate its currency, which made it more competitive in global trade.
Now the music has stopped. With no solvent trading partners left in Europe, it’s likely that the breakup of the European Union (“EU”) – or the departure of Greece, along with the second-order risks of other countries leaving – is more expensive than simply bundling up everyone’s balance sheets and issuing euro bonds.
Germany wasn’t the only beneficiary of eurozone synergy. The other member countries strapped onto Germany’s solid balance sheet and were able to borrow at lower rates than before. But if euro bonds are issued, there has to be a mechanism in place to punish member states that aren’t fiscally responsible.
It is not clear what that mechanism will be. It could be a central treasury, but that seems extreme. At any rate, the path of resolution will likely be extremely rocky. Afterward, Europe equities could be a great buy—but for now, it might be wise to keep some dry powder**.
Performance Results
For the six-month period ending April 30, 2012, the Class I shares of the Aspen Managed Futures Strategy Fund posted a loss of 4.67%. Per its mandate, the Fund maintained very tight correlation to the Aspen Managed Futures Beta Index. The index uses a combination of trend and counter-trend algorithms to determine exposures to 23 futures markets. In following the index, the Fund can take long or short exposures to each of the eligible markets. A long position in a futures market will profit if the price of the futures contract rises, and a short position will profit if the price of the futures contract falls. A loss occurs on a long position if the price of the contract falls, while a short position will incur a loss if the price of the contract rises.
The Newedge CTA index1, a managed futures benchmark, returned +0.37% in the same timeframe. Another benchmark, the BTOP50 Index3, returned -0.30%. It is important to note that there are substantive differences between the Fund and these indices in terms of construction. There were no significant changes to the Fund strategy during this period.
Explanation of Fund Performance
A brief downtrend in risk assets in early November led to an accumulation of “risk-off”*** positions in the Fund. This portfolio was whipsawed in the sharp rally at the end of the month, in a manner reminiscent of the October market activity (albeit on a much smaller scale), leading to a loss of 1.28% for the month.
Following the November market rally, the Fund’s portfolio remained somewhat delevered over the next three months. Contradictory trend signals and an uncertain outlook on global market risk contributed to substantially lower return volatility than was experienced by the Fund in the prior three-month period. Consequently the December and February gains (0.54% and 0.65% respectively) and the January loss (-0.64%) were muted.
Declining correlations, a sustained rally for risk assets, and widening yields led to the adoption of a predominantly “risk-on” portfolio in the Fund by mid-March, characterized by long equities, currencies, and commodities, and short fixed income positions. From late March through April those positions contributed losses on balance as renewed European fears and other concerns sparked a decline in the markets. By the end of April the Fund was once again holding predominantly “risk-off” allocations, such that a continued drop in risk assets would be expected to contribute gains in the Fund.
Over the entire November-to-April period the counter-trend strategy posted modest gains that were insufficient to cover losses in the (larger) trend model. Seven markets contributed positively to performance, and fifteen markets contributed negatively. Cash equivalents in the portfolio contributed an almost negligible positive amount to performance, due to the low interest rate environment. The markets with the largest gains were the New Zealand Dollar, Japanese Yen, S&P 500®4, Nikkei5 (USD), and Euro currency. The markets with the largest losses were the Canadian Dollar, Swiss Franc, sugar, Canadian government bonds, and corn.
Annualized volatility of daily returns for the Fund was about 5.5% for the November 1 through April 30 period. For comparison, the volatility of the S&P 500 Index was approximately 17% for the same period. The correlation of daily returns between the Fund and the S&P 500 Index was -0.26 (where 1.00 represents perfect positive correlation and -1.00 represents perfect negative correlation) – a negative correlation overall, but much less strongly negative than was the case for the prior August to October period.
Outlook
April 2012 marked the first bit of market weakness for the year. While equities did not drop significantly during the month, there was an uptick in volatility that continued into May. There are several reasons why we think this may continue into the summer.
First off, stocks appear priced for perfection. Among the positive earnings, there are still significant issues in the world economy, with Europe on the top of that list. April’s weaker than expected GDP report, and continued uncertainty about the direction of interest rates—as illustrated by the considerable volatility in 30-year bond prices—underscores an environment that will be difficult to map, at least in the short term.
| | |
| Annual Report | April 30, 2012 | | 1 |
| | |
Aspen Managed Futures Strategy Fund | | Manager Commentary |
| | | April 30, 2012 (Unaudited) |
It would not be wise to underestimate market seasonality. With elections in the U.S., Greece and France looming, rising energy prices and the domestic housing market trying to decide whether to bottom or keep falling, there should be enough uncertainty to keep a lid on stock prices.
Rebalancing into the weakened market may be a smart strategy. Those who are sitting on outsized gains from individual security plays may want to raise cash in anticipation of better times in the late Fall. Managed futures could be a useful addition to a thoughtfully constructed portfolio during this period.
Cumulative Total Return Performance for the period ended April 30, 2012
| | | | | | | | |
Aspen Managed Futures Strategy Fund | | Year-to-Date | | | Since Inception* | |
Aspen Managed Futures Strategy Fund - Class A (NAV)1 | | | -4.07 | % | | | -10.50 | % |
Aspen Managed Futures Strategy Fund - Class A (MOP)2 | | | -9.32 | % | | | -15.41 | % |
Aspen Managed Futures Strategy Fund - Class I | | | -3.96 | % | | | -10.20 | % |
Newedge CTA Index1 | | | -0.47 | % | | | -4.20 | % |
Aspen Managed Futures Beta Index2 | | | -4.14 | % | | | -9.98 | % |
| 1 | Net Asset Value (NAV) is the share price without sales charges. |
| 2 | Maximum Offering Price (MOP) includes sales charges. Class A returns include effects of the Fund’s maximum sales charge of 5.50%. |
Performance data quoted represents past performance. Past performance does not guarantee future results. Investment return and principal value of an investment will fluctuate so that an investor’s shares, when sold or redeemed, may be worth more or less than the original cost. Current performance data may be higher or lower than actual data quoted. For the most current month-end performance data please call 1-855-845-9444.
The Fund is a new fund with limited operating history. The table does not reflect the deduction of taxes that a shareholder would pay on Fund distributions or the redemption of Fund shares.
Performance of $10,000 Initial Investment (for the period ended April 30, 2012)
Comparison of change in value of a $10,000 investment (includes applicable sales loads)
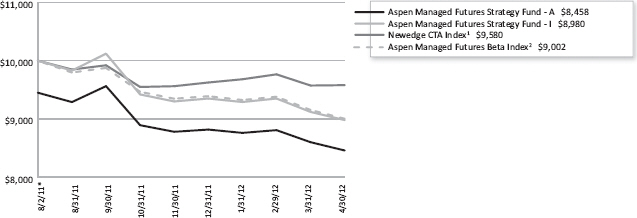
The chart represents historical performance of a hypothetical investment of $10,000 in the Fund since inception. Past performance does not guarantee future results. This chart does not reflect the deduction of taxes that a shareholder would pay on Fund distributions or the redemption of Fund shares.
The Aspen Managed Futures Beta Index and the Newedge CTA Index are not actively managed and do not reflect any deduction for fees, expenses or taxes. It is not possible to invest directly in an index.
| * | Fund Inception date of August 2, 2011. |
| ** | Dry Powder - A slang term referring to marketable securities that are highly liquid and considered cash-like. Dry powder may also refer to cash reserves kept on hand to cover future obligations or purchase assets, if conditions are favorable. Securities considered to be dry powder could be Treasuries, or other fixed income investments, and can be liquidated on short notice, in order to provide emergency operational funding or allow an investor to purchase assets. |
| *** | During a market sentiment of ‘Risk on,’ the market is optimistic and more willing to take risk in exchange for possibly better returns. At this time there will be a greater interest in shares or stocks and commodities. When the market sentiment is ‘Risk off,’ there is pessimism in the market and it will favor perceived lower risk investments such as U.S. Treasuries or U.S. dollars. http://en.wikipedia.org |
| | |
2 | | www.aspenfuturesfund.com |
| | |
Aspen Managed Futures Strategy Fund | | Manager Commentary |
| | | April 30, 2012 (Unaudited) |
| 1 | The Newedge CTA Index provides the market with a reliable daily performance benchmark of major commodity trading advisors (CTAs). The Newedge CTA Index calculates the daily rate of return for a pool of CTAs selected from the larger managers that are open to new investment. Selection of the pool of qualified CTAs used in construction of the Index will be conducted annually, with re-balancing on January 1st of each year. A committee of industry professionals has been established to monitor the methodology of the index on a regular basis. |
| 2 | Aspen Managed Futures Beta Index - The Managed Futures Beta Index is constructed using a quantitative, rules-based model designed to replicate the trend-following and counter-trend exposure of futures markets by allocating assets to liquid futures contracts of certain financial and commodities futures markets. The Index therefore seeks to reflect the performance of strategies and exposures common to a broad universe of futures markets, i.e., managed futures beta. You cannot invest directly in the index. |
| 3 | Barclay BTOP50 Index - The BTOP50 Index seeks to replicate the overall composition of the managed futures industry with regard to trading style and overall market exposure. You cannot invest directly in the index. |
| 4 | S&P 500® Index is the Standard & Poor’s composite index of 500 stocks, a widely recognized , unmanaged index of common stock prices. You cannot invest directly in the index. |
| 5 | Nikkei - The Nikkei 225 Index (USD), more commonly called the Nikkei, is a price-weighted average, and the components are reviewed once a year. Currently, the Nikkei is the most widely quoted average of Japanese equities. You cannot invest directly in the index. |
| | |
| Annual Report | April 30, 2012 | | 3 |
| | |
Aspen Managed Futures Strategy Fund | | Consolidated Disclosure of Fund Expenses |
| | | April 30, 2012 (Unaudited) |
As a shareholder of a Fund, you incur two types of costs: (1) transaction costs, including applicable sales charges (loads), redemption fees, wire fees and low balance fees; and (2) ongoing costs, including management fees, distribution and service (12b-1) fees, shareholder services fees and other Fund expenses. This example is intended to help you understand your indirect costs, also referred to as “ongoing costs” (in dollars), of investing in the Fund and to compare these costs with the ongoing costs of investing in other mutual funds.
This example is based on an investment of $1,000 invested at the beginning of the period and held for the entire six-month period of November 1, 2011 through April 30, 2012.
Actual Expenses The first line of the table below provides information about actual account values and actual expenses. You may use the information in this line, together with the amount you invested at the beginning of the period, to estimate the expenses that you paid over the period. Simply divide your account value by $1,000 (for example, an $8,600 account value divided by $1,000 = 8.6), then multiply the result by the number in the first line under the heading “Expenses Paid During Period” to estimate the expenses you paid on your account during this period.
Hypothetical Example for Comparison Purposes The second line of the table provides information about hypothetical account values and hypothetical expenses based on the Fund’s actual expense ratio and an assumed rate of return of 5% per year before expenses, which is not the Fund’s actual return. The hypothetical account values and expenses may not be used to estimate the actual ending account balance or expenses you paid for the period. You may use this information to compare ongoing costs of investing in the Fund and other funds. To do so, compare this 5% hypothetical example with the 5% hypothetical examples that appear in the shareholder reports of other funds.
Please note that the expenses shown in the table are meant to highlight your ongoing costs only and do not reflect any transactional costs, such as applicable sales charges (loads), redemption fees, wire fees and low balance fees. Therefore, the second line of the table is useful in comparing ongoing costs only and will not help you determine the relative total costs of owning different funds. In addition, if these transaction costs were included, your costs would be higher.
| | | | | | | | |
| | | Beginning
Account Value
11/1/11 | | Ending
Account Value
4/30/12 | | Expense Ratio(a) | | Expenses Paid
During period
11/1/11 - 4/30/12(b) |
| | | | |
Class A | | | | | | | | |
Actual | | $ 1,000.00 | | $ 951.10 | | 1.80% | | $ 8.73 |
Hypothetical (5% return before expenses) | | $ 1,000.00 | | $ 1,015.91 | | 1.80% | | $ 9.02 |
Class I | | | | | | | | |
Actual | | $ 1,000.00 | | $ 953.30 | | 1.55% | | $ 7.53 |
Hypothetical (5% return before expenses) | | $ 1,000.00 | | $ 1,017.16 | | 1.55% | | $ 7.77 |
| (a) | The Fund’s expense ratios have been based on the Fund’s most recent fiscal half-year expenses. |
| (b) | Expenses are equal to the Fund’s annualized expense ratio, multiplied by the average account value over the period, multiplied by the number of days in the most recent fiscal half-year (182)/366. |
| | |
4 | | www.aspenfuturesfund.com |
| | |
Aspen Managed Futures Strategy Fund | | Consolidated Schedule of Investments |
| | | April 30, 2012 |
| | | | | | | | | | |
| | | 7-Day Yield | | Shares | | | Value (Note 2) | |
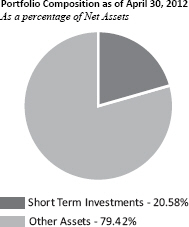
SHORT TERM INVESTMENTS (20.58%) | | | | | | | | | | |
MONEY MARKET FUND (20.58%) | | | | | | | | | | |
Dreyfus Treasury & Agency Cash Management Fund - Institutional Shares | | 0.010% | | | 9,434,950 | | | $ | 9,434,950 | |
HighMark 100% U.S. Treasury Money Market Fund | | 0.000% | | | 9,434,950 | | | | 9,434,950 | |
| | | | | | | | | | |
| | | | | | | | | 18,869,900 | |
| | | | | | | | | | |
| | | |
TOTAL SHORT TERM INVESTMENTS (Cost $18,869,900) | | | | | | | | | 18,869,900 | |
| | | | | | | | | | |
| | | |
TOTAL INVESTMENTS (20.58%) (Cost $18,869,900) | | | | | | | | $ | 18,869,900 | |
| | | |
Other Assets In Excess Of Liabilities (79.42%) | | | | | | | | | 72,834,116 | (a) |
| | | | | | | | | | |
| | | |
NET ASSETS (100.00%) | | | | | | | | $ | 91,704,016 | |
| | | | | | | | | | |
| (a) | Includes cash which is being held as collateral for futures contracts. |
Percentages are stated as a percent of net assets.
FUTURES CONTRACTS
At April 30, 2012, the Fund had outstanding futures contracts:
| | | | | | | | | | | | | | |
| Description | | Position | | Contracts | | Expiration
Date | | Underlying Face
Amount at Value | | | Unrealized
Appreciation | |
Australian Dollar Currency Future | | Long | | 30 | | 06/19/12 | | | $3,110,400 | | | | $23,851 | |
Euro STOXX 50 Index Future | | Short | | 91 | | 06/16/12 | | | (2,721,111) | | | | 9,474 | |
Euro-Bond Future | | Long | | 93 | | 06/08/12 | | | 17,368,716 | | | | 194,517 | |
New Zealand Dollar Future | | Long | | 84 | | 06/19/12 | | | 6,845,160 | | | | 17,711 | |
Nikkei 225 Index Future | | Short | | 27 | | 06/08/12 | | | (1,279,125) | | | | 18,115 | |
S&P 500® Mini Future | | Long | | 38 | | 06/16/12 | | | 2,647,840 | | | | 5,752 | |
Soybean Future | | Long | | 32 | | 07/14/12 | | | 2,408,800 | | | | 65,203 | |
Sugar No. 11 (World) Future | | Short | | 95 | | 07/01/12 | | | (2,247,168) | | | | 71,141 | |
U.S. 10-Year Treasury Notes Future | | Long | | 130 | | 06/21/12 | | | 17,209,569 | | | | 80,260 | |
| | | | | | | | | | |
| | | | | | | | | $43,343,081 | | | | $486,024 | |
| | | | | | | | | | |
| | | | | |
| Description | | Position | | Contracts | | Expiration
Date | | Underlying Face
Amount at Value | | | Unrealized
Depreciation | |
Canadian 10 Year Bond Future | | Long | | 43 | | 06/21/12 | | | $5,747,988 | | | | $(15,731) | |
Canadian Dollar Currency Future | | Long | | 73 | | 06/20/12 | | | 7,385,410 | | | | (31,154) | |
Copper Future | | Short | | 16 | | 07/28/12 | | | (1,531,800) | | | | (48,656) | |
Corn Future | | Short | | 51 | | 07/14/12 | | | (1,617,337) | | | | (65,895) | |
Crude Oil Future | | Short | | 7 | | 06/30/12 | | | (734,090) | | | | (5,274) | |
Euro FX Currency Future | | Short | | 44 | | 06/19/12 | | | (7,283,100) | | | | (74,909) | |
FTSE 100 IDX Future | | Short | | 15 | | 06/16/12 | | | (1,391,100) | | | | (17,685) | |
Gold 100 Oz Future | | Short | | 4 | | 06/28/12 | | | (665,680) | | | | (16,144) | |
Heating Oil Future | | Short | | 5 | | 06/01/12 | | | (668,682) | | | | (3,650) | |
Japanese Yen Currency Future | | Short | | 67 | | 06/19/12 | | | (10,498,900) | | | | (361,986) | |
Long Gilt Future | | Long | | 30 | | 06/28/12 | | | 5,628,713 | | | | (21,137) | |
Silver Future | | Short | | 10 | | 07/28/12 | | | (1,550,800) | | | | (26,200) | |
Swiss Franc Currency Future | | Short | | 49 | | 06/19/12 | | | (6,754,038) | | | | (67,128) | |
| | | | | | | | | | |
| | | | | | | | | $(13,933,416) | | | | $(755,549) | |
| | | | | | | | | | |
| | |
| Annual Report | April 30, 2012 | | 5 |
| | |
Aspen Managed Futures Strategy Fund | | Consolidated Schedule of Investments |
| | | April 30, 2012 |
Common Abbreviations:
FTSE - Financial Times and the London Stock Exchange
FX - Foreign
No. - Number
Oz - Ounce
S&P - Standard and Poor’s
See Notes to Consolidated Financial Statements.
| | |
6 | | www.aspenfuturesfund.com |
| | |
Aspen Managed Futures Strategy Fund | | Consolidated Statement of Assets & Liabilities |
| | | April 30, 2012 |
| | | | |
ASSETS: | | | | |
Investments, at value | | $ | 18,869,900 | |
Deposit with broker for futures contracts | | | 73,985,303 | |
Receivable for shares sold | | | 214,961 | |
Interest receivable | | | 76 | |
Prepaid and other assets | | | 42,480 | |
Total assets | | | 93,112,720 | |
| |
LIABILITIES: | | | | |
Foreign cash due to custodian (Cost $(956,310)) | | | 956,104 | |
Payable to advisor | | | 63,389 | |
Payable for variation margin | | | 269,525 | |
Payable for shares redeemed | | | 36,974 | |
Payable for administration fees | | | 17,142 | |
Payable for distribution and service fees | | | | |
Class A | | | 246 | |
Payable for transfer agency fees | | | 7,352 | |
Payable to trustees | | | 2,985 | |
Payable for chief compliance officer fee | | | 2,500 | |
Payable for principal financial officer fees | | | 417 | |
Accrued expenses and other liabilities | | | 52,070 | |
Total liabilities | | | 1,408,704 | |
NET ASSETS | | $ | 91,704,016 | |
| | | | | |
| |
NET ASSETS CONSIST OF: | | | | |
| |
Paid-in capital | | $ | 96,269,725 | |
Accumulated net investment loss | | | (677,175) | |
Accumulated net realized loss on futures contracts and foreign currency transactions | | | (3,619,215) | |
Net unrealized depreciation on futures contracts and translation of assets and liabilities in foreign currencies | | | (269,319) | |
NET ASSETS | | $ | 91,704,016 | |
| | | | | |
| |
INVESTMENTS, AT COST | | $ | 18,869,900 | |
| |
PRICING OF SHARES: | | | | |
Class A: | | | | |
Net Asset Value, offering and redemption price per share | | $ | 8.95 | |
Net Assets | | $ | 1,254,497 | |
Shares of beneficial interest outstanding | | | 140,131 | |
Maximum offering price per share (NAV/0.9450), based on maximum sales charge of 5.50% of the offering price | | $ | 9.47 | |
| |
Class I: | | | | |
Net Asset Value, offering and redemption price per share | | $ | 8.98 | |
Net Assets | | $ | 90,449,519 | |
Shares of beneficial interest outstanding | | | 10,077,469 | |
See Notes to Consolidated Financial Statements.
| | |
Annual Report | April 30, 2012 | | 7 |
| | |
Aspen Managed Futures Strategy Fund | | Consolidated Statement of Operations |
| | | For the Period August 2, 2011 (Inception) to April 30, 2012 |
| | | | |
INVESTMENT INCOME: | | | | |
Interest | | | $5,246 | |
Other Income | | | 271 | |
Total Investment Income | | | 5,517 | |
| |
EXPENSES: | | | | |
Investment advisory fees | | | 307,514 | |
Administrative fees | | | 151,959 | |
Distribution and service fees | | | | |
Class A | | | 7,497 | |
Transfer agency fees | | | 32,878 | |
Legal and audit fees | | | 56,375 | |
Offering cost | | | 101,228 | |
Custodian fees | | | 7,446 | |
Trustees’ fees and expenses | | | 33,577 | |
Principal financial officer fees | | | 3,750 | |
Chief compliance officer fees | | | 22,500 | |
Other | | | 15,073 | |
Total expenses before waiver/reimbursement | | | 739,797 | |
Less fees waived/reimbursed by investment advisor (Note 6) | | | | |
Class A | | | (21,773) | |
Class I | | | (74,999) | |
Total Net Expenses | | | 643,025 | |
NET INVESTMENT LOSS | | | (637,508) | |
| |
Net realized loss on futures contracts | | | (5,061,786) | |
Net realized loss on foreign currency transactions | | | (1,552) | |
Net change in unrealized depreciation on futures contracts | | | (269,525) | |
Net change in unrealized appreciation on translation of assets and liabilities denominated in foreign currency transactions | | | 206 | |
NET REALIZED AND UNREALIZED LOSS ON INVESTMENTS | | | (5,332,657) | |
NET DECREASE IN NET ASSETS RESULTING FROM OPERATIONS | | | $ (5,970,165) | |
| | | | | |
See Notes to Consolidated Financial Statements.
| | |
8 | | www.aspenfuturesfund.com |
| | |
Aspen Managed Futures Strategy Fund | | Consolidated Statement of Changes in Net Assets |
| | | |
| | | | |
| | | For the Period
August 2, 2011
(Inception) to
April 30, 2012 | |
OPERATIONS: | | | | |
Net investment loss | | $ | (637,508) | |
Net realized loss on futures contracts and foreign currency transactions | | | (5,063,338) | |
Net change in unrealized depreciation on futures contracts and foreign currency translations | | | (269,319) | |
Net decrease in net assets resulting from operations | | | (5,970,165) | |
| |
SHARE TRANSACTIONS (Note 4): | | | | |
Class A | | | | |
Proceeds from sales of shares | | | 11,355,891 | |
Cost of shares redeemed | | | (9,450,244) | |
Class I | | | | |
Proceeds from sales of shares | | | 120,133,964 | |
Cost of shares redeemed | | | (24,374,693) | |
Redemption fees | | | 9,263 | |
Net increase from share transactions | | | 97,674,181 | |
| |
Net increase in net assets | | | 91,704,016 | |
| |
| |
NET ASSETS: | | | | |
Beginning of period | | | – | |
End of period* | | $ | 91,704,016 | |
| | |
*Includes accumulated net investment loss of: | | $ | (677,175) | |
| |
Other Information: | | | | |
SHARE TRANSACTIONS: | | | | |
Class A | | | | |
Sold | | | 1,141,658 | |
Redeemed | | | (1,001,527) | |
Net increase in shares outstanding | | | 140,131 | |
| | | | | |
| |
Class I | | | | |
Sold | | | 12,696,132 | |
Redeemed | | | (2,618,663) | |
Net increase in shares outstanding | | | 10,077,469 | |
| | | | | |
See Notes to Consolidated Financial Statements.
| | |
Annual Report | April 30, 2012 | | 9 |
| | |
Aspen Managed Futures Strategy Fund – Class A | | Consolidated Financial Highlights |
| | | For a share outstanding throughout the period presented. |
| | | | |
| | | For the Period August 2, 2011 (Inception) to April 30, 2012
(a) | |
NET ASSET VALUE, BEGINNING OF PERIOD | | | $ 10.00 | |
INCOME/(LOSS) FROM OPERATIONS: | | | | |
Net investment loss(b) | | | (0.13 | ) |
Net realized and unrealized loss on investments | | | (0.92 | ) |
Total from investment operations | | | (1.05 | ) |
DECREASE IN NET ASSET VALUE | | | (1.05 | ) |
NET ASSET VALUE, END OF PERIOD | | | $ 8.95 | |
| | |
| |
TOTAL RETURN(c) | | | (10.50 | %) (d) |
| |
RATIOS AND SUPPLEMENTAL DATA: | | | | |
Net assets, end of period (000’s) | | | $ 1,254 | |
| |
RATIOS TO AVERAGE NET ASSETS: | | | | |
Operating expenses including fee waivers/reimbursements | | | 1.80 | % (e) |
Operating expenses excluding fee waivers/reimbursements | | | 2.53 | % (e) |
Net investment loss including fee waivers/reimbursements | | | (1.79 | %)(e) |
| |
PORTFOLIO TURNOVER RATE | | | 0 | % (d) |
| (a) | Per share amounts and ratios to average net assets include income and expenses of the Aspen Futures Fund Ltd. (subsidiary), exclusive of the subsidiary’s management fee. |
| (b) | Per share numbers have been calculated using the average shares method. |
| (c) | Total return does not reflect the effect of sales charges. |
See Notes to Consolidated Financial Statements.
| | |
10 | | www.aspenfuturesfund.com |
| | |
Aspen Managed Futures Strategy Fund — Class I | | Consolidated Financial Highlights |
| | | For a share outstanding throughout the period presented. |
| | | | |
| | | For the Period
August 2, 2011
(Inception) to
April 30, 2012 (a) | |
NET ASSET VALUE, BEGINNING OF PERIOD | | | $ 10.00 | |
INCOME/(LOSS) FROM OPERATIONS: | | | | |
Net investment loss(b) | | | (0.11) | |
Net realized and unrealized loss on investments | | | (0.91) | |
Total from investment operations | | | (1.02) | |
REDEMPTION FEES ADDED TO PAID IN CAPITAL (NOTE 4) | | | 0.00 | (c) |
DECREASE IN NET ASSET VALUE | | | (1.02) | |
NET ASSET VALUE, END OF PERIOD | | | $ 8.98 | |
| | |
| |
TOTAL RETURN | | | (10.20%) | (d) |
| |
RATIOS AND SUPPLEMENTAL DATA: | | | | |
Net assets, end of period (000’s) | | | $ 90,450 | |
| |
RATIOS TO AVERAGE NET ASSETS: | | | | |
Operating expenses including fee waivers/reimbursements | | | 1.55% | (e) |
Operating expenses excluding fee waivers/reimbursements | | | 1.75% | (e) |
Net investment loss including fee waivers/reimbursements | | | (1.54%) | (e) |
| |
PORTFOLIO TURNOVER RATE | | | 0% | (d) |
| (a) | Per share amounts and ratios to average net assets include income and expenses of the Aspen Futures Fund Ltd. (subsidiary), exclusive of the subsidiary’s management fee. |
| (b) | Per share numbers have been calculated using the average shares method. |
| (c) | Less than $0.005 per share. |
See Notes to Consolidated Financial Statements.
| | |
| Annual Report | April 30, 2012 | | 11 |
| | |
Aspen Managed Futures Strategy Fund | | Notes to Consolidated Financial Statements |
| | | April 30, 2012 |
1. ORGANIZATION
Financial Investors Trust (the “Trust”), a Delaware statutory trust, is an open-end management investment company registered under the Investment Company Act of 1940, as amended (“1940 Act”). As of April 30, 2012, the Trust had twenty registered funds. This annual report describes the Aspen Managed Futures Strategy Fund (the “Fund”). The Fund seeks investment results that replicate as closely as possible, before fees and expenses, the price and yield performance of the Aspen Managed Futures Beta Index (the “MFBI” or “Index”). The Aspen Managed Futures Strategy Fund offers Class A and Class I shares. All classes of shares have identical rights to earnings, assets and voting privileges, except for class specific expenses and exclusive rights to vote on matters affecting only individual classes.
Basis of Consolidation for the Aspen Futures Fund, Ltd.
Aspen Futures Fund, Ltd. (the “Subsidiary”), a Cayman Islands exempted company, is a wholly owned subsidiary of the Fund. The Subsidiary acts as an investment vehicle for the Fund in order to effect certain commodity-related investments on behalf of the Fund. Investments in the Subsidiary are expected to provide the Fund with exposure to the commodity markets within the limitations of Subchapter M of the Internal Revenue Code of 1986, as amended (the “Code”), and recent IRS revenue rulings, as discussed below under “Dividends and Distribution” and “Taxes.” The Fund is the sole shareholder of the Subsidiary pursuant to a subscription agreement dated as of August 2, 2011, and it is intended that the Fund will remain the sole shareholder and will continue to control the Subsidiary. Under the Articles of Association of the Subsidiary, shares issued by the Subsidiary confer upon a shareholder the right to wholly own and vote at general meetings of the Subsidiary and certain rights in connection with any winding-up or repayment of capital, as well as the right to participate in the profits or assets of the Subsidiary. The Fund may invest up to 25% of its total assets in shares of the Subsidiary. As a wholly owned subsidiary of the Aspen Managed Futures Strategy Fund, all assets and liabilities, income and expenses of the Subsidiary are consolidated in the financial statements and financial highlights of the Fund. All investments held by the Subsidiary are disclosed in the accounts of the Fund. As of April 30, 2012, net assets of the Fund were $91,706,041, of which $17,732,559, or 19.34%, represented the Fund’s ownership of all issued shares and voting rights of the Subsidiary.
2. SIGNIFICANT ACCOUNTING POLICIES
The following is a summary of significant accounting policies consistently followed by the Fund and Subsidiary. These policies are in conformity with U.S. generally accepted accounting principles (“GAAP”).
The preparation of financial reporting in accordance with GAAP requires management to make certain estimates and assumptions that affect the reported amounts and disclosures in the financial statements during the reporting period. Management believes the estimates and security valuations are appropriate; however, actual results may differ from those estimates, and the security valuations reflected in the financial statements may differ from the value the Fund ultimately realizes upon sale of the securities. The financial statements have been prepared as of the close of the New York Stock Exchange (“NYSE”) on April 30, 2012.
Investment Valuation: The Fund generally values its securities based on market prices determined at the close of regular trading on the New York Stock Exchange (“NYSE”), normally 4:00 p.m. Eastern Time, on each day the NYSE is open for trading.
For equity securities and mutual funds that are traded on an exchange, the market price is usually the closing sale or official closing price on that exchange. In the case of equity securities not traded on an exchange, or if such closing prices are not otherwise available, the securities are valued at the mean of the most recent bid and ask prices on such day.
The market price for debt obligations is generally the price supplied by an independent third-party pricing service approved by the Board of Trustees (the “Board”), which may use a matrix, formula or other objective method that takes into consideration quotations from dealers, market transactions in comparable investments, market indices and yield curves. If vendors are unable to supply a price, or if the price supplied is deemed to be unreliable, the market price may be determined using quotations received from one or more brokers–dealers that make a market in the security. Short–term debt obligations that will mature in 60 days or less are valued at amortized cost, unless it is determined that using this method would not reflect an investment’s fair value. Investments in non-exchange traded funds are fair valued at their respective net asset values.
Futures contracts that are listed or traded on a national securities exchange, commodities exchange, contract market or comparable over-the-counter market, and that are freely transferable, are valued at their closing settlement price on the exchange on which they are primarily traded or based upon the current settlement price for a like instrument acquired on the day on which the instrument is being valued. A settlement price may not be used if the market makes a limit move with respect to a particular commodity.
Forward currency exchange contracts have a market value determined by the prevailing foreign currency exchange daily rates and current foreign currency exchange forward rates. The foreign currency exchange forward rates are calculated using an automated system that estimates rates on the basis of the current day foreign currency exchange rates and forward foreign currency exchange rates supplied by a pricing service.
| | |
12 | | www.aspenfuturesfund.com |
| | |
Aspen Managed Futures Strategy Fund | | Notes to Consolidated Financial Statements |
| | | April 30, 2012 |
Redeemable securities issued by open-end registered investment companies are valued at the investment company’s applicable net asset value.
Investment securities that are primarily traded on foreign securities exchanges are valued at the preceding closing values of such securities on their respective exchanges, except when an occurrence subsequent to the time a value was so established is likely to have changed such value. In such an event, the fair value of those securities are determined in good faith through consideration of other factors in accordance with procedures established by and under the general supervision of the Board.
When such prices or quotations are not available, or when the Fair Value Committee appointed by the Board believes that they are unreliable, securities may be priced using fair value procedures approved by the Board. The Fund may also use fair value procedures if the Fair Value Committee determines that a significant event has occurred between the time at which a market price is determined and the time at which a Fund’s NAV is calculated. In particular, the value of non-U.S. securities may be materially affected by events occurring after the close of the foreign exchange on which they are traded, but before the Fund prices its shares.
Fair Value Measurements: The Fund discloses the classification of its fair value measurements following a three-tier hierarchy based on the inputs used to measure fair value. Inputs refer broadly to the assumptions that market participants would use in pricing the asset or liability, including assumptions about risk. Inputs may be observable or unobservable. Observable inputs reflect the assumptions market participants would use in pricing the asset or liability that are developed based on market data obtained from sources independent of the reporting entity. Unobservable inputs reflect the reporting entity’s own assumptions about the assumptions market participants would use in pricing the asset or liability that are developed based on the best information available.
Various inputs are used in determining the value of the Fund’s investments as of the end of the reporting period. When inputs used fall into different levels of the fair value hierarchy, the level in the hierarchy within which the fair value measurement falls is determined based on the lowest level input that is significant to the fair value measurement in its entirety. The designated input levels are not necessarily an indication of the risk or liquidity associated with these investments. These inputs are categorized in the following hierarchy under applicable financial accounting standards:
| | |
Level 1 – | | Unadjusted quoted prices in active markets for identical investments, unrestricted assets or liabilities that a Fund has the ability to access at the measurement date; |
| |
Level 2 – | | Quoted prices which are not active, quoted prices for similar assets or liabilities in active markets or inputs other than quoted prices that are observable (either directly or indirectly) for substantially the full term of the asset or liability; and |
| |
Level 3 – | | Significant unobservable prices or inputs (including the Fund’s own assumptions in determining the fair value of investments) where there is little or no market activity for the asset or liability at the measurement date. |
The following is a summary of each input used to value the Fund as of April 30, 2012:
| | | | | | | | | | | | | | | | |
| Investments in Securities at Value | | Level 1 -
Quoted Prices | | | Level 2 -
Other Significant
Observable Inputs | | | Level 3 -
Significant Unobservable
Inputs | | | Total | |
Short Term Investments | | $ | 18,869,900 | | | $ | – | | | $ | – | | | $ | 18,869,900 | |
TOTAL | | $ | 18,869,900 | | | $ | – | | | $ | – | | | $ | 18,869,900 | |
| | | | | | | | | | | | | | | | | |
Other Financial Instruments | | | | | | | | | |
Assets: | | | | | | | | | | | | | | | | |
Futures Contracts | | $ | 486,024 | | | $ | – | | | $ | – | | | $ | 486,024 | |
Liabilities: | | | | | | | | | | | | | | | | |
Futures Contracts | | | (755,549 | ) | | | – | | | | – | | | | (755,549) | |
TOTAL | | $ | (269,525 | ) | | $ | – | | | $ | – | | | $ | (269,525) | |
| | |
For the period ended April 30, 2012, the Fund did not have any significant transfers between Level 1 and Level 2 securities.
It is the Fund’s policy to consider transfers into or out of Level 1 and Level 2 as of the end of the reporting period.
For the year ended April 30, 2012, the Fund did not have significant unobservable inputs (Level 3) used in determining fair value. Therefore, a reconciliation of assets in which significant unobservable inputs (Level 3) were used in determining fair value is not applicable.
| | |
| Annual Report | April 30, 2012 | | 13 |
| | |
Aspen Managed Futures Strategy Fund | | Notes to Consolidated Financial Statements |
| | | April 30, 2012 |
Investment Transactions: Investment transactions are accounted for on the date the investments are purchased or sold (trade date). Realized gains and losses from investment transactions are reported on an identified cost basis. Interest income, which includes accretion of discounts, is accrued and recorded as earned. Dividend income is recognized on the ex-dividend date or for certain foreign securities, as soon as information is available to the Fund.
Foreign Securities: The Fund may directly purchase securities of foreign issuers. Investing in securities of foreign issuers involves special risks not typically associated with investing in securities of U.S. issuers. The risks include possible reevaluation of currencies, the inability to repatriate foreign currency, less complete financial information about companies and possible future adverse political and economic developments. Moreover, securities of many foreign issuers and their markets may be less liquid and their prices more volatile than those of securities of comparable U.S. issuers.
Foreign Currency Translation: The books and records of the Fund are maintained in U.S. dollars. Investment valuations and other assets and liabilities initially expressed in foreign currencies are converted each business day into U.S. dollars based upon current exchange rates. Prevailing foreign exchange rates may generally be obtained at the close of the NYSE (normally, 4:00 p.m. Eastern Time). The portion of realized and unrealized gains or losses on investments due to fluctuations in foreign currency exchange rates is not separately disclosed and is included in realized and unrealized gains or losses on investments, when applicable.
Foreign Currency Spot Contracts: The Fund may enter into foreign currency spot contracts to facilitate transactions in foreign securities or to convert foreign currency receipts into U.S. dollars. A foreign currency spot contract is an agreement between two parties to buy and sell currencies at the current market rate, for settlement generally within two business days. The U.S. dollar value of the contracts is determined using current currency exchange rates supplied by a pricing service. The contract is marked-to-market daily for settlements beyond one day and any change in market value is recorded as an unrealized gain or loss. When the contract is closed, the Fund records a realized gain or loss equal to the difference between the value on the open and close date. Losses may arise from changes in the value of the foreign currency, or if the counterparties do not perform under the contract’s terms. The maximum potential loss from such contracts is the aggregate face value in U.S. dollars at the time the contract was opened.
Trust Expenses: Some expenses of the Trust can be directly attributed to the Fund. Expenses which cannot be directly attributed to the Fund are apportioned among all Funds in the Trust based on average net assets of each Fund.
Fund Expenses: Expenses that are specific to a class of shares of the Fund are charged directly to that share class. All of the realized and unrealized gains and losses and net investment income, other than class specific expenses, are allocated daily to each class in proportion to its average daily net assets. Fees provided under the distribution (Rule 12b-1) and/or shareholder service plans for a particular class of the fund are charged to the operations of such class.
Offering Costs: Offering costs, including costs of printing initial prospectuses, legal and registration fees, are being amortized over twelve months from the inception date of the Fund. As of April 30, 2012, $38,212 of offering costs remain to be amortized for the Fund.
Federal Income Taxes: The Fund complies with the requirements under Subchapter M of the Code applicable to regulated investment companies and intends to distribute substantially all of their net taxable income and net capital gains, if any, each year. The Fund is not subject to income taxes to the extent such distributions are made. As of and during the period ended April 30, 2012, the Fund did not have a liability for any unrecognized tax benefits in the accompanying financial statements. The Fund files income tax returns in the U.S. Federal jurisdiction and Colorado.
Distributions to Shareholders: The Fund normally pays dividends and distributes capital gains, if any, on an annual basis. Income dividend distributions are derived from interest and other income the Fund receives from its investments, including distributions of short term capital gains. Capital gains distributions are derived from gains realized when the Fund sells a security it has owned for more than a year. The Fund may make additional distributions and dividends at other times if the portfolio manager believes doing so may be necessary for the Fund to avoid or reduce taxes. Net investment income/(loss) and net realized gain/(loss) may differ for financial statement and tax purposes. The character of distributions made during the year from net investment income or net realized gains may differ from its ultimate characterization for federal income tax purposes. Also, due to the timing of dividend distributions, the fiscal year in which amounts are distributed may differ from the fiscal year in which the income or realized gain were recorded by the Fund. During the period ended April 30, 2012, the Fund did not make any distributions.
3. DERIVATIVE INSTRUMENTS
The Fund uses derivatives (including futures) to pursue its investment objective. The Fund’s use of derivative instruments involves risks different from, or possibly greater than, the risks associated with investing directly in securities and other traditional investments. These risks may include (i) the risk that the counterparty to a derivative transaction may not fulfill its contractual obligations, (ii) risk of mispricing or improper valuation, and (iii) the risk that changes in the value of the derivative may not correlate perfectly with the underlying asset, rate or index. These risks could cause
| | |
14 | | www.aspenfuturesfund.com |
| | |
Aspen Managed Futures Strategy Fund | | Notes to Consolidated Financial Statements |
| | | April 30, 2012 |
the Fund to lose more than the principal amount invested. In addition, investments in derivatives involve leverage, which means a small percentage of assets invested in derivatives can have a disproportionately large impact on the Fund.
The Fund’s use of derivatives can result in losses due to unanticipated changes in the market risk factors and the overall market. In instances where the Fund is using derivatives to decrease, or hedge, exposures to market risk factors for securities held by the Fund, there are also risks that those derivatives may not perform as expected resulting in losses for the combined or hedged positions. Derivatives may have little or no initial cash investment relative to their market value exposure and therefore can produce significant gains or losses in excess of their cost. This use of embedded leverage allows the Fund to increase its market value exposure relative to its net assets and can substantially increase the volatility of the Fund’s performance.
In addition, use of derivatives may increase or decrease exposure to the following risk factors:
| | • | | Equity Risk: Equity risk relates to the change in value of equity securities as they relate to increases or decreases in the general market. | |
| | • | | Fixed Income Risk: When the Fund invests in fixed-income securities or derivatives, the value of an investment in the Fund will fluctuate with changes in interest rates. Typically, a rise in interest rates causes a decline in the value of fixed-income securities or derivatives owned by the Fund. In general, the market price of debt securities with longer maturities will increase or decrease more in response to changes in interest rates than shorter-term securities. Other risk factors include credit risk (the debtor may default) and prepayment risk (the debtor may pay its obligation early, reducing the amount of interest payments). | |
| | • | | Foreign Currency Risk: Currency trading involves significant risks, including market risk, interest rate risk, country risk, counterparty credit risk and short sale risk. Market risk results from the price movement of foreign currency values in response to shifting market supply and demand. Interest rate risk arises whenever a country changes its stated interest rate target associated with its currency. Country risk arises because virtually every country has interfered with international transactions in its currency. Counterparty credit risk arises when the counterparty will not fulfill its obligations to the Fund. Short sale risk arises from the sale of a security that is not owned, or any sale that is completed by the delivery of a security borrowed. | |
| | • | | Commodity Risk: Exposure to the commodities markets may subject the Fund to greater volatility than investments in traditional securities. Commodity prices are influenced by unfavorable weather, animal and plant disease, geologic and environmental factors, as well as changes in government regulation such as tariffs, embargoes or burdensome production rules and restrictions. | |
Futures: The Fund and the Subsidiary may enter into futures contracts. Futures contracts are agreements between two parties to buy and sell a particular commodity, instrument or index for a specified price on a specified future date. When the Fund or the Subsidiary enters into a futures contract, it is required to deposit with (or for the benefit of) its broker an amount of cash or short-term high-quality securities as “initial margin”. As the value of the contract changes, the value of the futures contract position increases or declines. Subsequent payments, known as “variation margin”, are made or received by the Fund or the Subsidiary, depending on the price fluctuations in the fair value of the contract and the value of cash or securities on deposit with the broker. The aggregate principal amounts of the contracts are not recorded in the financial statements. Fluctuations in the value of the contracts are recorded in the Consolidated Statements of Assets and Liabilities as an asset (liability) and in the Consolidated Statements of Operations as unrealized appreciation (depreciation) until the contracts are closed, when they are recorded as realized gains (losses). Realized gain or loss on a futures position is equal to the difference between the value of the contract at the time it was opened and the value at the time it was closed, minus brokerage commissions. When the Fund or the Subsidiary enters into a futures contract certain risks may arise, such as illiquidity in the futures market, which may limit the Fund’s or the Subsidiary’s ability to close out a futures contract prior to settlement date, and unanticipated movements in the value of securities, commodities or interest rates. Futures contracts are exchange-traded. Exchange-traded futures are standardized contracts and are settled through a clearing house with fulfillment supported by the credit of the exchange. Therefore, counterparty credit risk to the Fund and the Subsidiary is reduced.
Balance Sheet – Fair Value of Derivative Instruments as of April 30, 2012(a):
| | | | | | | | | | |
| Derivatives Instruments | | Asset Derivatives Balance Sheet Location | | Fair Value | | Liabilities Derivatives Balance Sheet Location | | Fair Value | |
| Futures Contracts* | | Variation Margin Receivable | | $ – | | Variation Margin Payable | | $ | (269,525) | |
| | | | | | | | | | |
| | | | $ – | | | | $ | (269,525) | |
| | | | | | | | | | |
| | | | | | | | | | |
| | | | | | *Risk Exposure to Fund | | | | |
| | | | | | Commodity Contracts | | $ | (29,475) | |
| | | | | | Equity Contracts | | | 15,656 | |
| | | | | | Fixed Income Contracts | | | 237,909 | |
| | | | | | Foreign Currency Contacts | | | (493,615) | |
| | | | | | | | | | |
| | | | | | | | $ | (269,525) | |
| | | | | | | | | | |
| | | | | | | | | | |
| | |
| Annual Report | April 30, 2012 | | 15 |
| | |
Aspen Managed Futures Strategy Fund | | Notes to Consolidated Financial Statements |
| | | April 30, 2012 |
| (a) | For open derivative instruments as of April 30, 2012, see the Consolidated Schedule of Investments, which is also indicative of the activity for the period ended April 30, 2012. |
Consolidated Statement of Operations – The effect of Derivative Instruments for the period ended April 30, 2012:
| | | | | | | | | | |
| Derivatives Instruments | | Location of Gains/(Loss) on
Derivatives Recognized in Income | | Realized Gain/(Loss) on Derivatives Recognized in Income | | | Changed in Unrealized Gain/(Loss) on Derivatives Recognized in Income | |
| Futures Contracts* | | Net realized loss on futures contracts/Net change in unrealized appreciation on futures contracts | | $ | (5,061,786 | ) | | $ | (269,525 | ) |
| | | | | | |
| | | | $ | (5,061,786 | ) | | $ | (269,525 | ) |
| | | | | | |
| | *Risk Exposure to Fund | | | | | | | | |
| | Commodity Contracts | | $ | (1,110,683 | ) | | $ | (29,475 | ) |
| | Equity Contracts | | | (1,134,370 | ) | | | 15,656 | |
| | Fixed Income Contracts | | | (1,285,474 | ) | | | 237,909 | |
| | Foreign Currency Contacts | | | (1,531,259 | ) | | | (493,615 | ) |
| | | | | | |
| | | | $ | (5,061,786 | ) | | $ | (269,525 | ) |
| | | | | | |
4. TAX BASIS INFORMATION
Distributions are determined in accordance with Federal income tax regulations, which differ from GAAP, and, therefore, may differ significantly in amount or character from net investment income and realized gains for financial reporting purposes. Financial reporting records are adjusted for permanent book/tax differences to reflect tax character but are not adjusted for temporary differences.
Reclassifications to paid-in capital relate primarily to differing book/tax treatment of ordinary net investment losses. For the period ended April 30, 2012, the following reclassifications, which had no impact on results of operations or net assets, were recorded to reflect tax character:
| | | | | | | | | | | | |
| Fund | | Paid-in Capital | | | Accumulated Net Investment Income/(Loss) | | | Accumulated Net Realized Gain/Loss on Investments | |
Aspen Managed Futures Strategy Fund | | $ | (1,404,456 | ) | | $ | (39,667 | ) | | $ | 1,444,123 | |
Included in the amounts reclassified was a net operating loss offset to Paid-In-Capital of $127,959.
As of April 30, 2012, the aggregate cost of investments, gross unrealized appreciation/(depreciation) and net unrealized appreciation for Federal tax purposes was as follows:
| | | | | | | | | | | | | | | | |
| Fund | | Cost of
Investments | | | Gross Unrealized Appreciation | | | Gross Unrealized (Depreciation) | | | Net Unrealized Appreciation of Foreign Currency and Derivatives | |
Aspen Managed Futures Strategy Fund | | $ | 19,025,906 | | | $ | 528,074 | | | $ | (684,080 | ) | | $ | (269,319 | ) |
At April 30, 2012, components of distributable earnings were as follows:
| | | | |
| | | Aspen Managed Futures Strategy Fund | |
Undistributed ordinary income | | $ | 0 | |
Other Cumulative Effect of Timing Differences | | $ | (233,135 | ) |
Net unrealized appreciation/(depreciation) on investments | | $ | (425,325 | ) |
Accumulated Capital Gains/(Losses) | | $ | (3,907,249 | ) |
Total distributable earnings | | $ | (4,565,709 | ) |
Under the Regulated Investment Company Modernization Act of 2010 (“the Modernization Act”), net capital losses recognized in tax years beginning after December 22, 2010 may be carried forward indefinitely, and the character of the losses is retained as short-term and/or long-term.
| | |
16 | | www.aspenfuturesfund.com |
| | |
Aspen Managed Futures Strategy Fund | | Notes to Consolidated Financial Statements |
| | | April 30, 2012 |
Post Modernization Act enactment, short-term capital losses in the amount of $627,443 and long-term capital losses in the amount of $704,192 are deferred to the next fiscal year.
The Fund elects to defer to the period ending April 30, 2013, capital losses recognized during the period November 1, 2011 through April 30, 2012 in the amount of $2,575,614.
The Fund elects to defer to the period ending April 30, 2013 late year ordinary losses in the amount of $677,175.
5. SHARES OF BENEFICIAL INTEREST
The capitalization of the Trust consists of an unlimited number of shares of beneficial interest with no par value per share. Holders of the shares of the Fund of the Trust have one vote for each share held and a proportionate fraction of a vote for each fractional share. All shares issued and outstanding are fully paid and are non-assessable, transferable and redeemable at the option of the shareholder. Shares have no pre-emptive rights.
Fund shares redeemed within 30 days of purchase may incur a 2% short-term redemption fee deducted from the redemption amount. The Fund’s Class I shares received $9,263 in redemption fees during the period ended April 30, 2012. There were no redemption fees collected on Class A shares.
Beneficial Ownership: The beneficial ownership, either directly or indirectly, of more than 25% of the voting securities of any class of the Fund creates a presumption of control of the Fund under Section 2(a)(9) of the 1940 Act. As of April 30, 2012, the following entities owned beneficially 25% or greater of the Fund’s outstanding shares. The shares are held under omnibus accounts (whereby the transactions of two or more shareholders are combined and carried in the name of the originating broker rather than designated separately).
| | | | | | |
| Class | | Aspen Managed Futures Strategy Fund | | Percentage | | |
I | | Charles Schwab & Co. | | 26.54% | | |
I | | National Financial Services Corp. | | 58.87% | | |
6. MANAGEMENT AND RELATED-PARTY TRANSACTIONS
Aspen Partners Ltd. (the “Adviser” or “Aspen”), subject to the authority of the Board, is responsible for the overall management and administration of the Fund’s business affairs. The Adviser manages the investments of the Fund in accordance with the Fund’s investment objective, policies and limitations and investment guidelines established jointly by the Adviser and the Trustees. Pursuant to the Investment Advisory Agreement, (the “Advisory Agreement”), the Fund will pay the Adviser an annual management fee of 0.75%, based on the Fund’s average daily net assets. The management fee is paid on a monthly basis.
The Subsidiary has entered into a separate advisory agreement (the “Subsidiary Advisory Agreement”) with Aspen, the Subsidiary’s investment adviser and the Fund’s investment adviser, for the management of the Subsidiary’s portfolio pursuant to which the Subsidiary is obligated to pay the Adviser a management fee at the same rate that the Fund pays the Adviser for investment advisory services provided to the Fund. The Adviser has agreed to waive the advisory fee it receives from the Fund in an amount equal to the management fee paid by the Subsidiary. This waiver may not be terminated or modified without the consent of the Board.
The initial term of the Advisory Agreement and the Subsidiary Advisory Agreement is two years and may be reapproved annually thereafter. The Board, shareholders of the Fund, or the Adviser may terminate the Advisory Agreement and the Subsidiary Advisory Agreement upon sixty (60) days’ notice.
The Adviser has agreed to waive and/or reimburse fees or expenses in order to limit total annual Fund operating expenses after fee waiver/expense reimbursements (excluding distribution and service (12b-1) fees, shareholder services fees, acquired fund fees and expenses, brokerage expenses, interest expenses, taxes and extraordinary expenses) to 1.55% of the Fund’s average daily net assets. This agreement is in effect through August 31, 2013. This agreement may not be terminated or modified prior to this date except with the approval of the Board.
Pursuant to this agreement, the Fund will reimburse the Adviser for any fee waivers and expense reimbursements made by the Adviser, provided that any such reimbursements made by the Fund to the Adviser will not cause the Fund’s expense limitation to exceed expense limitations in existence at the time the expense was incurred, or at the time of the reimbursement, whichever is lower, and the reimbursement is made within three years after the expenses were incurred.
| | |
| Annual Report | April 30, 2012 | | 17 |
| | |
Aspen Managed Futures Strategy Fund | | Notes to Consolidated Financial Statements |
| | | April 30, 2012 |
For the period ended April 30, 2012, the fee waivers and/or reimbursements were as follows:
| | | | | | |
| Fund | | Fees Waived/ Reimbursed
By Advisor | | Recoupment of Past Waived
Fees By Advisor | | Total |
Aspen Managed Futures Strategy Fund - Class A | | $ 21,773 | | $ – | | $ 21,773 |
Aspen Managed Futures Strategy Fund - Class I | | 74,999 | | – | | 74,999 |
As of April 30, 2012, the balances of recoupable expenses for the Fund were as follows:
| | | | |
| Fund | | 2012 | | |
Aspen Managed Futures Strategy Fund - Class A | | $ 21,773 | | |
Aspen Managed Futures Strategy Fund - Class I | | 74,999 | | |
Fund Accounting Fees and Expenses
ALPS Fund Services, Inc. (“ALPS” and the “Administrator”) provides administrative, fund accounting and other services to the Fund and the Subsidiary.
The Fund’s administration fee is accrued on a daily basis, and paid on a monthly basis following the end of the month, based on the greater of (a) an annual total fee of $165,000 from the first to the last, or projected last, day of the then current year of service under the Administration Agreement; or (b) the following basis point fee schedule:
| | | | |
| Average Total Net Assets | | Contractual Fee | | |
Between $0-$500M | | 0.05% | | |
$500M-$1B | | 0.03% | | |
Above $1B | | 0.02% | | |
The Subsidiary’s administration fee is based on an annual rate of $37,500.
The Administrator is also reimbursed by the Fund for certain out-of-pocket expenses.
Transfer Agent
ALPS serves as transfer, dividend paying and shareholder servicing agent for the Fund. ALPS is compensated based upon a $20,000 annual base fee for the Fund, and annually $9 per direct open account and $7 per open account through the National Securities Clearing Corporation. ALPS is also reimbursed by the Fund for certain out-of-pocket expenses.
Compliance Services
ALPS provides services as the Fund’s Chief Compliance Officer to assist the Trust’s Chief Compliance Officer in monitoring and testing the policies and procedures of the Trust in conjunction with requirements under Rule 38a-1 under the 1940 Act and receives an annual base fee of $30,000.
Principal Financial Officer
ALPS receives an annual fee of $5,000 for providing Principal Financial Officer services to the Fund.
Distributor
ALPS Distributors, Inc. (an affiliate of ALPS Fund Services, Inc.) (“ADI” or the “Distributor”) acts as the distributor of the Fund’s shares pursuant to a Distribution Agreement with the Trust. Shares are sold on a continuous basis by ADI as agent for the Fund, and ADI has agreed to use its best efforts to solicit orders for the sale of the Fund’s shares, although it is not obliged to sell any particular amount of shares. ADI is not entitled to any compensation for its services as Distributor. ADI is registered as a broker-dealer with the Securities and Exchange Commission.
The Fund has adopted a plan of distribution for Class A shares pursuant to Rule 12b-1 under the 1940 Act (the “Plan”). The Plan allows the Fund to use Class A assets to pay fees in connection with the distribution and marketing of Class A shares and/or the provision of shareholder services to Class A shareholders. The Plan permits payment for services in connection with the administration of plans or programs that use Class A shares as their funding medium and for related expenses. The Plan permits the Fund to use its Class A assets to make total payments at an annual rate of up to 0.25% of the Fund’s average daily net assets attributable to its Class A shares. The expenses of the plan are reflected as distribution and service fees in the Consolidated Statement of Operations.
| | |
18 | | www.aspenfuturesfund.com |
| | |
Aspen Managed Futures Strategy Fund | | Notes to Consolidated Financial Statements |
| | | April 30, 2012 |
7. NEW ACCOUNTING PRONOUNCEMENTS
In May 2011, the Financial Accounting Standards Board (“FASB”) issued Accounting Standards Update (“ASU”) No. 2011-04 “Amendments to Achieve Common Fair Value Measurement and Disclosure Requirements.” ASU No. 2011-04 amends FASB ASC Topic 820, Fair Value Measurements and Disclosures, to establish common requirements for measuring fair value and for disclosing information about fair value measurements in accordance with GAAP and International Financial Reporting Standards (“IFRS”). ASU No. 2011-04 is effective for fiscal years beginning after December 15, 2011, and for interim periods within those fiscal years. Management is currently evaluating the impact these amendments may have on the Fund’s financial statements.
8. INDEMNIFICATIONS
Under the Trust’s organizational documents, its officers and Trustees are indemnified against certain liability arising out of the performance of their duties to the Trust. Additionally, in the normal course of business, the Trust enters into contracts with service providers that may contain general indemnification clauses. The Trust’s maximum exposure under these arrangements is unknown, as this would involve future claims that may be made against the Trust that have not yet occurred.
| | |
| Annual Report | April 30, 2012 | | 19 |
| | |
Aspen Managed Futures Strategy Fund | | Report of Independent Registered Public Accounting Firm |
| | | |
To the Shareholders and Board of Trustees of Financial Investors Trust:
We have audited the accompanying consolidated statement of assets and liabilities, including the consolidated schedule of investments, of Aspen Managed Futures Strategy Fund and subsidiary (the “Fund”), one of the portfolios constituting Financial Investors Trust, as of April 30, 2012, and the related consolidated statements of operations and changes in net assets, and the consolidated financial highlights for the period August 2, 2011 (Inception) to April 30, 2012. These financial statements and financial highlights are the responsibility of the Fund’s management. Our responsibility is to express an opinion on these financial statements and financial highlights based on our audit.
We conducted our audit in accordance with the standards of the Public Company Accounting Oversight Board (United States). Those standards require that we plan and perform the audit to obtain reasonable assurance about whether the financial statements and financial highlights are free of material misstatement. The Fund is not required to have, nor were we engaged to perform, an audit of its internal control over financial reporting. Our audit included consideration of internal control over financial reporting as a basis for designing audit procedures that are appropriate in the circumstances, but not for the purpose of expressing an opinion on the effectiveness of the Fund’s internal control over financial reporting. Accordingly, we express no such opinion. An audit also includes examining, on a test basis, evidence supporting the amounts and disclosures in the financial statements, assessing the accounting principles used and significant estimates made by management, as well as evaluating the overall financial statement presentation. Our procedures included confirmation of securities owned as of April 30, 2012, by correspondence with the custodian and broker. We believe that our audit provides a reasonable basis for our opinion.
In our opinion, the consolidated financial statements and financial highlights referred to above present fairly, in all material respects, the financial position of Aspen Managed Futures Strategy Fund and subsidiary of the Financial Investors Trust, as of April 30, 2012, the results of their operations, the changes in their net assets, and the financial highlights for the period August 2, 2011 (Inception) to April 30, 2012, in conformity with accounting principles generally accepted in the United States of America.
DELOITTE & TOUCHE LLP
Denver, Colorado
June 29, 2012
| | |
20 | | www.aspenfuturesfund.com |
| | |
Aspen Managed Futures Strategy Fund | | Additional Information |
| | | April 30, 2012 (Unaudited) |
1. FUND HOLDINGS
The Fund files its complete schedule of portfolio holdings with the Securities and Exchange Commission (the “SEC”) for the first and third quarters of each fiscal year on Form N-Q within 60 days after the end of the period. Copies of the Fund’s Form N-Q are available without charge on the SEC website at http://www.sec.gov. You may also review and copy the Form N-Q at the SEC’s Public Reference Room in Washington, DC. For more information about the operation of the Public Reference Room, please call the SEC at 1-800-SEC-0330.
2. FUND PROXY VOTING POLICIES, PROCEDURES AND SUMMARIES
The Funds policies and procedures used in determining how to vote proxies and information regarding how the Fund voted proxies relating to portfolio securities during the most recent prior 12-month period ending June 30 are available without charge, (1) upon request, by calling 1-855-845-9444 and (2) on the SEC’s website at http://www.sec.gov.
| | |
| Annual Report | April 30, 2012 | | 21 |
| | |
Aspen Managed Futures Strategy Fund | | Trustees and Officers |
| | | April 30, 2012 (Unaudited) |
INDEPENDENT TRUSTEES
| | | | | | | | | | |
Name, Address* & Age | | Position(s) Held with Fund | | Term of Office and Length of Time Served | | Principal Occupation(s) During Past 5 Years** | | Number of Funds in Fund Complex Overseen by Trustee*** | | Other Directorships Held by Trustee During Past 5 Years** |
Mary K. Anstine, age 71 | | Trustee | | Ms. Anstine was elected at a special meeting of shareholders held on March 21, 1997 and re-elected at a special meeting of shareholders held on August 7, 2009. | | Ms. Anstine was President/Chief Executive Officer of HealthONE Alliance, Denver, Colorado, and former Executive Vice President of First Interstate Bank of Denver. Ms. Anstine is also Trustee/Director of AV Hunter Trust and Colorado Uplift Board. Ms. Anstine was formerly a Director of the Trust Bank of Colorado (later purchased and now known as Northern Trust Bank), HealthONE and Denver Area Council of the Boy Scouts of America, and a member of the American Bankers Association Trust Executive Committee. | | 20 | | Ms. Anstine is a Trustee of ALPS ETF Trust (4 funds); Financial Investors Variable Insurance Trust (5 funds); Reaves Utility Income Fund (1 fund); and Westcore Trust (12 funds). |
John R. Moran, Jr., age 81 | | Trustee | | Mr. Moran was elected at a special meeting of shareholders held on March 21, 1997 and re-elected at a special meeting of shareholders held on August 7, 2009. | | Mr. Moran is formerly President and CEO of The Colorado Trust, a private foundation serving the health and hospital community in the state of Colorado. An attorney, Mr. Moran was formerly a partner with the firm of Kutak Rock & Campbell in Denver, Colorado and a member of the Colorado House of Representatives. Currently, Mr. Moran is a member of the Treasurer’s Investment Advisory Committee for the University of Colorado. | | 20 | | None. |
Jeremy W. Deems, age 35 | | Trustee | | Mr. Deems was appointed as a Trustee at the March 11, 2008 meeting of the Board of Trustees and elected at a special meeting of shareholders held on August 7, 2009. | | Mr. Deems is the Co-Founder, Chief Operations Officer and Chief Financial Officer of Green Alpha Advisors, LLC. Prior to joining Green Alpha Advisors, Mr. Deems was CFO and Treasurer of Forward Management, LLC, an investment management company, ReFlow Management Co., LLC, a liquidity resourcing company, ReFlow Fund, LLC, a private investment fund, and Sutton Place Management, LLC, an administrative services company (from 2004 to June 2007). Prior to this, Mr. Deems served as Controller of Forward Management, LLC, ReFlow Management Co., LLC, ReFlow Fund, LLC and Sutton Place Management, LLC. | | 20 | | Mr. Deems is a Trustee of ALPS ETF Trust (4 funds); Financial Investors Variable Insurance Trust (5 funds) and Reaves Utility Income Fund (1 fund). |
Jerry G. Rutledge, age 67 | | Trustee | | Mr. Rutledge was elected at a special meeting of shareholders held on August 7, 2009. | | Mr. Rutledge is the President and owner of Rutledge’s Inc., a retail clothing business. Mr. Rutledge is currently Director of the American National Bank. He was from 1994 to 2007 a Regent of the University of Colorado. | | 20 | | Mr. Rutledge is a Trustee of Clough Global Allocation Fund (1 fund), Clough Global Equity Fund (1 fund) and Clough Global Opportunities Fund (1 fund). |
Michael “Ross” Shell, age 41 | | Trustee | | Mr. Shell was elected at a special meeting of shareholders held on August 7, 2009. | | Mr. Shell is Founder and CEO of Red Idea, LLC, a strategic consulting/early stage venture firm (since June 2008). From 1999 to 2009, he was a part-owner and Director of Tesser, Inc., a brand agency. From December 2005 to May 2008, he was Director, Marketing and Investor Relations, of Woodbourne, a REIT/real estate hedge fund and private equity firm. Prior to this, from May 2004 to November 2005, he worked as a business strategy consultant; from June 2003 to April 2004, he was on the Global Client Services team of IDEO, a product design/innovation firm; and from 1999 to 2003, he was President of Tesser, Inc. Mr. Shell graduated with honors from Stanford University with a degree in Political Science. | | 20 | | None. |
| | |
22 | | www.aspenfuturesfund.com |
| | |
Aspen Managed Futures Strategy Fund | | Trustees and Officers |
| | | April 30, 2012 (Unaudited) |
INTERESTED TRUSTEE
| | | | | | | | | | |
Name, Address* & Age | | Position(s) Held with Fund | | Term of Office and Length of Time Served | | Principal Occupation(s) During Past 5 Years** | | Number of Funds in Fund Complex Overseen by Trustee*** | | Other Directorships Held by Trustee |
Edmund J. Burke, age 51 | | Trustee, Chairman and President | | Mr. Burke was elected as Chairman at the August 28, 2009 meeting of the Board of Trustees. Mr. Burke was elected as Trustee at a special meeting of shareholders held on August 7, 2009. Mr. Burke was elected President of the Trust at the December 17, 2002 meeting of the Board of Trustees. | | Mr. Burke is Chief Executive Officer and a Director of ALPS Holdings, Inc. (“AHI”) (since 2005) and Director of ALPS Advisors, Inc. (“AAI”), ALPS Distributors, Inc. (“ADI”), ALPS Fund Services, Inc. (“AFS”) and FTAM Distributors, Inc. (“FDI”) and from 2001-2008, was President of AAI, ADI, AFS and FDI. Because of his positions with AHI, AAI, ADI, AFS and FDI, Mr. Burke is deemed an affiliate of the Trust as defined under the 1940 Act. Mr. Burke is Trustee and President of the Clough Global Allocation Fund (Trustee since 2006; President since 2004); Trustee and President of the Clough Global Equity Fund (Trustee since 2006; President since 2005); Trustee and President of the Clough Global Opportunities Fund (since 2006); Trustee of the Liberty All-Star Equity Fund; and Director of the Liberty All-Star Growth Fund, Inc. | | 20 | | Mr. Burke is a Trustee of Clough Global Allocation Fund (1 fund); Clough Global Equity Fund (1 fund); Clough Global Opportunities Fund (1 fund); Trustee of the Liberty All-Star Equity Fund (1 fund); and Director of the Liberty All- Star Growth Fund, Inc. (1 fund). |
OFFICERS
| | | | | | |
Name, Address* & Age | | Position(s) Held with Fund | | Term of Office And Length of Time Served | | Principal Occupation(s) During Past 5 Years** |
Jeremy O. May, age 42 | | Treasurer | | Mr. May was elected Treasurer of the Trust at the October 7, 1997 meeting of the Board of Trustees. | | Mr. May joined ALPS in 1995 and is currently President and Director of AFS and Executive Vice President and Director of AHI, AAI, ADI and FDI. Because of his positions with these entities, Mr. May is deemed an affiliate of the Trust as defined under the 1940 Act. Mr. May is also the Treasurer of the Liberty All-Star Equity Fund, Liberty All-Star Growth Fund, Inc., Clough Global Allocation Fund, Clough Global Equity Fund, Clough Global Opportunities Fund and Financial Investors Variable Insurance Trust. Mr. May is also Chairman and Trustee of the Reaves Utility Income Fund. Mr. May is currently on the Board of Directors and is Chairman of the Audit Committee of the University of Colorado Foundation. |
JoEllen L. Legg, age 50 | | Secretary | | Ms. Legg was elected Secretary of the Trust at the November 13, 2007 meeting of the Board of Trustees. | | Ms. Legg joined ALPS in October 2007 and is currently Vice President and Senior Associate Counsel of ALPS, AAI, ADI and FDI. Prior to joining ALPS, Ms. Legg served as Senior Counsel - Law (Corporate & Securities) for Adelphia Communications Corporation from February 2005 to March 2007. Prior to this, Ms. Legg held associate positions at Fried Frank Harris Shriver & Jacobson LLP (1998 - 2004) and at Patton Boggs LLP (2004 - 2005). Because of her position with ALPS, Ms. Legg is deemed an affiliate of the Trust as defined under the 1940 Act. Ms. Legg is also Assistant Secretary of the Stone Harbor Investment Funds, Stone Harbor Emerging Markets Debt Fund and WesMark Funds. |
Ted Uhl, age 37 | | Chief Compliance Officer (“CCO”) | | Mr. Uhl was appointed CCO of the Trust at the June 8, 2010 meeting of the Board of Trustees. | | Mr. Uhl joined ALPS in October 2006, and is currently Deputy Compliance Officer of ALPS. Prior to his current role, Mr. Uhl served as Senior Risk Manager for ALPS from October 2006 until June 2010. Before joining ALPS, Mr. Uhl served a Sr. Analyst with Enenbach and Associates (RIA), and a Sr. Financial Analyst at Sprint. Because of his position with ALPS, Mr. Uhl is deemed an affiliate of the Trust as defined under the 1940 Act. Mr. Uhl is also CCO of the Clough Global Funds, Reaves Utility Income Fund, Drexel Hamilton Funds and the Transparent Value Trust. |
| Kimberly R. Storms, age 40 | | Assistant Treasurer | | Ms. Storms was elected Assistant Treasurer of the Trust at the June 14, 2005 meeting of the Board of Trustees. | | Ms. Storms is Senior Vice President - Director of Fund Administration of ALPS. Ms. Storms joined ALPS in 1998 as Assistant Controller. Because of her position with ALPS, Ms. Storms is deemed an affiliate of the Trust as defined under the 1940 Act. Ms. Storms is also Assistant Treasurer of Liberty All-Star Equity Fund and Liberty All-Star Growth Fund, Inc.; and Assistant Secretary of Ameristock Mutual Fund, Inc. |
| * | All communications to Trustees and Officers may be directed to Financial Investors Trust c/o 1290 Broadway, Suite 1100, Denver, CO 80203. |
| ** | Except as otherwise indicated, each individual has held the office shown or other offices in the same company for the last five years. |
| *** | The Fund Complex includes all series of the Trust and any other investment companies for which Aspen Partners provides investment advisory services. |
| | |
| Annual Report | April 30, 2012 | | 23 |

This material must be accompanied or preceded by the prospectus.
WWW.ASPENFUTURESFUND.COM
Item 12. Exhibits.
| | (a)(1) | The Registrant’s Code of Ethics Senior Financial Officers, which is the subject of the disclosure required by Item 2 of Form N-CSR, was filed as Exhibit 12(a)(1) to the Registrant’s Certified Shareholder Report on Form N-CSR, File No. 811-8194, on July 7, 2008. |
| | (a)(2) | The certifications required by Rule 30a-2(a) of the Investment Company Act of 1940, as amended, and Section 302 of the Sarbanes-Oxley Act of 2002 are attached hereto as Exhibit 99.Cert. |
| | (b) | The certifications by the Registrant’s principal executive officer and principal financial officer, as required by Rule 30a-2(b) of the Investment Company Act of 1940, as amended, and Section 906 of the Sarbanes-Oxley Act of 2002 are attached hereto as Exhibit 99.906Cert. | |
SIGNATURES
Pursuant to the requirements of the Securities Exchange Act of 1934 and the Investment Company Act of 1940, the Registrant has duly caused this report to be signed on its behalf by the undersigned, thereunto duly authorized.
| | |
FINANCIAL INVESTORS TRUST |
| |
By: | | /s/ Edmund J. Burke |
| | Edmund J. Burke (Principal Executive Officer) |
| | President |
| |
Date: | | August 20, 2012 |
Pursuant to the requirements of the Securities Exchange Act of 1934 and the Investment Company Act of 1940, this report has been signed below by the following persons on behalf of the Registrant and in the capacities and on the dates indicated.
| | |
FINANCIAL INVESTORS TRUST |
| |
By: | | /s/ Edmund J. Burke |
| | Edmund J. Burke (Principal Executive Officer) |
| | President |
| |
Date: | | August 20, 2012 |
| |
By: | | /s/ Jeremy O. May |
| | Jeremy O. May (Principal Financial Officer) |
| | Treasurer |
| |
Date: | | August 20, 2012 |