UNITED STATES
SECURITIES AND EXCHANGE COMMISSION
Washington, D.C. 20549
FORM N-CSR
CERTIFIED SHAREHOLDER REPORT OF REGISTERED
MANAGEMENT INVESTMENT COMPANIES
Investment Company Act file number: 811-8194
FINANCIAL INVESTORS TRUST
(Exact name of registrant as specified in charter)
1290 Broadway, Suite 1100, Denver, Colorado 80203
(Address of principal executive offices) (Zip code)
JoEllen L. Legg, Secretary
Financial Investors Trust
1290 Broadway, Suite 1100
Denver, Colorado 80203
(Name and address of agent for service)
Registrant’s telephone number, including area code: 303-623-2577
Date of fiscal year end: December 31
Date of reporting period: January 1, 2010 – December 31, 2010
Item 1. Reports to Stockholders.
| | | | |
Table of Contents | | | | |
| | | December 31, 2010 | |
| | | | | | |
| RiverFront Long-Term Growth Fund | | | | |
| | | | |
| | | Management Commentary | | | December 31, 2010 (Unaudited) | |
For the year ending December 31, 2010, the RiverFront Long-Term Growth Fund’s (the “Fund”) Class A Shares, RLTAX, delivered a net return of +12.81% at NAV (Class A delivered a net return of +6.60% at market offering price (“MOP”), Class C, RLTCX, was +10.86% with CDSC, Class I, RLFIX, was +12.92% with CDSC, Class L, RLTIX, was +12.87%, and Investor Class, RLTSX, was +12.58%) for the year1. The Fund’s performance was below that of the broad based S&P 500 Index (+15.06%), without taking into account sales charges for Class A and C Shares.
Our assessment of financial market as we entered 2010 was that equity markets were priced to offer strong returns if everything went well but did not have much of a margin of safety if events turn out less favorably than expected. In that environment, our strategy concentrated the portfolio in those asset classes, securities and tactical strategies that offered, in our view, the best tradeoff between potential risk and potential reward. We were particularly cautious in balancing upside potential with downside risk for our lower risk portfolios, since these Riverfront investors enjoyed good returns across the 2008/2009 period, and we felt that their risk tolerance and point in life could not tolerate giving back those gains.
Market volatility and sudden mood swings characterized financial markets throughout 2010. Early in the year markets expected the US economy to enjoy the period of strong growth that typically occurs after a recession. Equity markets soared as the growth associated with accelerating government stimulus spending and inventory rebuilding seemed to confirm those expectations. As we moved into the second quarter these temporary boosts to growth began to fade just as the sovereign debt2 problems in Europe became more acute. As the market’s mood dramatically reversed toward expecting a double dip recession, equity prices plummeted along with expected economic growth and markets threatened to collapse back toward crises levels. The final mood swing of 2010 occurred in the third quarter as the economy proved neither as strong as was hoped early in the year nor as weak as was feared during the summer. This realization, combined with renewed quantitative easing purchases on the part of the Federal Reserve and Republican electoral victories, sparked a dramatic rally that continued through year end, leaving the S&P 500 up about 15.0% for the year.
In this volatile environment marked by several sharp turns in market direction and sentiment, our longer term allocation strategies performed well across the year. We substantially increased micro cap and emerging markets weightings and our new asset allocation strategies benefited from strong performance in these asset classes, while a sharp sell-off in the bond market toward year end finally validated our decision to remove long maturity bonds from our portfolios. That, along with an allocation to foreign currencies and an emphasis on
credit risk allowed our fixed income portfolios to perform well despite having far less interest rate risk than the overall market.
From a tactical perspective, our performance suffered from buying insurance that we ultimately did not need. During the market collapse in May and June major technical support levels were breached and markets were threatening to break down to levels not seen since the crises of 2008/2009. Although our fundamental view remained positive, our risk management disciplines remained a focus in our lower risk portfolios. This defensive posture was augmented by our large cap equity strategy, which emphasized higher quality, lower valuation companies with global franchises. This quality emphasis was predicated on the simple notion that low quality might work if everything went as expected, but high quality would almost certainly work in any of our potential economic and market scenarios. The only risk was that it might not work as well as higher risk alternatives.
As the market gained confidence toward the end of the summer, we had to quickly switch from defense to offense and get those cash balances invested and increase the beta3 in our equity positioning.
Although we believe performance would have been even better in 2010 had we not implemented our defensive tactical strategy and quality bias in our equity holdings, Riverfront’s investment discipline occasionally requires risking a bit of upside participation if it allows us to potentially mitigate downside in the portfolios. This focus on balancing upside opportunities with downside risks has helped our investors successfully navigate the tumultuous markets of the past decade and we believe will continue to serve them well in 2011.
As we move into 2011, we believe that continuing the bull market of 2010 is likely to require global policy makers to go beyond merely buying time with deficit spending and aggressive money printing and actually addressing underlying economic problems. We see three key signposts that can signal concrete progress is being made on these issues:
| 1. | China allows increases in the pace of appreciation in their currency. |
| 2. | The European Central Bank becomes more aggressive in countering the deflationary pressures arising from the debt crises in Greece, Ireland, Portugal, etc. |
| 3. | The US emulates the UK by putting in place a credible plan that reduces its budget deficit to a sustainable level. |
Substantial progress on all three issues would create an extraordinarily bullish outlook for equity markets. However, our expected scenario is a “muddle through” outcome in which sufficient progress is made to keep markets rising but at a slower
| | | | | | |
| RiverFront Long-Term Growth Fund | | | | |
| | | | |
| | | Management Commentary | | | December 31, 2010 (Unaudited) | |
pace than that of 2010. Our portfolio strategy will become more aggressive if we are surprised by the decisiveness of policy makers in addressing these issues. We believe that the weight of economic and political pressures (inflation in China, elections in Europe, etc.) will help ensure that some progress is made on these issues, but if we are wrong and policy makers continue to avoid these tough decisions, then our portfolios will shift to a more defensive posture.
| 1 | The Class A, C, I, and L shares performance shown for periods prior to September 27, 2010, reflects the performance of the Baird Funds, Inc. – RiverFront Long-Term Growth Fund’s Institutional Class shares (as result of the reorganization of the Baird Funds, Inc. – RiverFront Long-Term Growth Fund into the Fund). The Investor Class performance shown for periods prior to September 27, 2010, reflects the performance of the Baird Funds, Inc. – RiverFront Long-Term Growth Fund’s Investor Class shares (as result of the reorganization of the Baird Funds, Inc. – RiverFront Long-Term Growth Fund into the Fund). |
| 2 | Financial liabilities of a national government. |
| 3 | A mathmatical measure of the sensitivity of rates of return on a portfolio or a given stock compared with rates of return on the market as a whole. |
The Management Commentaries included in this shareholder report contains certain forward-looking statements about the factors that may affect the performance of the Funds in the future. These statements are based on Fund management’s predictions and expectations concerning certain future events and their expected impact on the Funds, such as performance of the economy as a whole and of specific industry sectors, changes in the levels of interest rates, the impact of developing world events, and other factors that may influence the future performance of the Funds. Management believes these forward-looking statements to be reasonable, although they are inherently uncertain and difficult to predict. Actual events may cause adjustments in portfolio management strategies from those currently expected to be employed.
| | | | | | |
| RiverFront Long-Term Growth Fund | | | | |
| | | | |
| | | Management Commentary | | | December 31, 2010 (Unaudited) | |
Performance of $10,000 Initial Investment (as of December 31, 2010)
Comparison of change in value of a $10,000 investment (includes applicable sales loads)
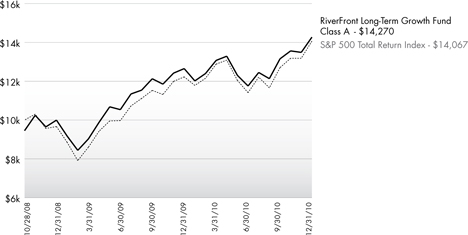
The chart above represents historical performance of a hypothetical investment of $10,000 in the Fund since inception. Past performance does not guarantee future results. This chart does not reflect the deduction of taxes that a shareholder would pay on Fund distributions or the redemption of Fund shares.
Annualized Return (as of December 31, 2010)
| | | | | | | | |
| | | 1 Year | | Since Inception^ | | Gross Expense Ratio | | Net Expense Ratio* |
Investor (NAV)1 | | 12.58% | | 20.71% | | 1.70% | | 1.15% |
Class L (NAV)1,3 | | 12.87% | | 21.04% | | 1.45% | | 0.90% |
Class A (NAV)1 | | 12.81% | | 20.85% | | 1.70% | | 1.15% |
Class A (MOP)2 | | 6.60% | | 17.76% | | |
Class C (NAV)1 | | 11.86% | | 19.89% | | 2.45% | | 1.90% |
Class C (CDSC)2 | | 10.86% | | 19.89% | | |
Class I | | 12.92% | | 21.07% | | 1.45% | | 0.90% |
S&P 500 Total Return Index4 | | 15.06% | | 16.98% | | | | |
Performance data quoted represents past performance. Past performance does not guarantee future results. Investment return and principal value of an investment will fluctuate so that an investor’s shares, when sold or redeemed, may be worth more or less than the original cost. Current performance data may be higher or lower than actual data quoted. For the most current month-end performance data, please call (866) 759-5679.
| 1 | Net Asset Value (NAV) is the share price without sales charges. |
| 2 | Maximum Offering Price (MOP) includes sales charges. Class A returns include effects of the Fund’s maximum sales charge of 5.50%; Class C returns include the 1.00% CDSC. |
| 3 | Prior to close of business on September 24, 2010, Class L was known as Institutional Class of the RiverFront Long-Term Growth Fund, a former series of Baird Funds, Inc. (the “Predecessor Fund”). |
| 4 | S&P 500 Total Return Index is the Standard & Poor’s composite index of 500 stocks, a widely recognized, unmanaged index of common stock prices. An investor may not invest directly in the index. |
| ^ | Fund inception date of October 28, 2008. |
| * | ALPS Advisors, Inc. (the “Adviser”) and RiverFront Investment Group, LLC (“RiverFront” or the “Sub-Adviser”) have contractually agreed to limit the total annual expenses of the Fund (including acquired fund fees and expenses) to 0.90% of the average daily net assets for each Class of the Fund. This obligation excludes distribution and service 12b-1 fees, shareholder services fees, brokerage commissions, taxes and extraordinary expenses. This agreement is in effect through December 31, 2012 and is reevaluated on an annual basis. Without this agreement, expenses could be higher. |
The Class A, C, I and L shares’ performance within the annualized returns shown for periods prior to close of business on September 24, 2010, reflects the performance of the Baird Funds, Inc. – RiverFront Long-Term Growth Fund’s Institutional Class shares (as a result of the reorganization of the Baird Funds, Inc. – RiverFront Long-Term Growth Fund into the Fund).
The Investor Class performance within the annualized returns shown for periods prior to close of business on September 24, 2010, reflects the performance of the Baird Funds, Inc. – RiverFront Long-Term Growth Fund’s Investor Class shares (as a result of the reorganization of the Baird Funds, Inc. – RiverFront Long-Term Growth Fund into the Fund).
The table does not reflect the deduction of taxes that a shareholder would pay on Fund distributions or the redemption of Fund shares. This Fund is not suitable for all investors. Subject to investment risks, including possible loss of the principal amount invested.
| | | | | | |
| RiverFront Long-Term Growth Fund | | | | |
| | | | |
| | | Disclosure of Fund Expenses | | | December 31, 2010 (Unaudited) | |
As a shareholder of the Fund you will incur two types of costs: (1) transaction costs, including applicable sales charges (loads) and redemption fees; and (2) ongoing costs, including management fees, distribution and service (12b-1) fees, shareholder service fees and other Fund expenses. The following examples are intended to help you understand your ongoing costs (in dollars) of investing in the Fund and to compare these costs with the ongoing costs of investing in other mutual funds. The examples are based on an investment of $1,000 invested on July 1, 2010 and held until December 31, 2010.
Actual Expenses. The first line of the table on the next page provides information about actual account values and actual expenses. You may use the information in this line, together with the amount you invested, to estimate the expenses that you paid over the period. Simply divide your account value by $1,000 (for example, an $8,600 account value divided by $1,000 = 8.6), then multiply the result by the number in the first line under the heading “Expense Paid During Period” to estimate the expenses you paid on your account during this period.
Hypothetical Example for Comparison Purposes. The second line of the table on the next page provides information about hypothetical account values and hypothetical expenses based on the Fund’s actual expense ratio and an assumed rate of return of 5% per year before expenses, which is not the Fund’s actual return. The hypothetical account values and expenses may not be used to estimate the actual ending account balance or expenses you paid for the period. You may use this information to compare the ongoing costs of investing in the Fund and other mutual funds. To do so, compare this 5% hypothetical example with the 5% hypothetical examples that appear in the shareholder reports of the other funds.
The expenses shown in the table are meant to highlight ongoing Fund costs only and do not reflect transaction fees, such as sales charges, redemption fees or exchange fees. Therefore, the second line of the table on the next page is useful in comparing ongoing costs only, and may not help you determine the relative total costs of owning different funds. In addition, if these transactional costs were included, your costs would have been higher.
The examples are based on an investment of $1,000 invested on July 1, 2010 and held until December 31, 2010.
| | | | | | | | | | | | | | |
| | | Beginning Account Value 7/1/10 | | | Ending Account Value 12/31/10 | | | Expenses Paid During Period 7/1/10-12/31/10 | | | Expense Ratio |
Class A(a) | | | | | | | | | | | | | | |
| | | | |
Actual Fund Return(b) | | | $ 1,000.00 | | | | $ 1,092.20 | | | | $ 3.13 | | | 1.15% |
Hypothetical Fund Return(c) | | | $ 1,000.00 | | | | $ 1,010.02 | | | | $ 5.83 | | | 1.15% |
| | | | |
Class C(a) | | | | | | | | | | | | | | |
| | | | |
Actual Fund Return(b) | | | $ 1,000.00 | | | | $ 1,089.10 | | | | $ 5.17 | | | 1.90% |
Hypothetical Fund Return(c) | | | $ 1,000.00 | | | | $ 1,008.07 | | | | $ 9.62 | | | 1.90% |
| | | | |
Class I(a) | | | | | | | | | | | | | | |
| | | | |
Actual Fund Return(b) | | | $ 1,000.00 | | | | $ 1,091.20 | | | | $ 2.45 | | | 0.90% |
Hypothetical Fund Return(c) | | | $ 1,000.00 | | | | $ 1,010.67 | | | | $ 4.56 | | | 0.90% |
| | | | |
Class L(d) | | | | | | | | | | | | | | |
| | | | |
Actual Fund Return(b) | | | $ 1,000.00 | | | | $ 1,213.10 | | | | $ 5.02 | | | 0.90% |
Hypothetical Fund Return(c) | | | $ 1,000.00 | | | | $ 1,020.67 | | | | $ 4.58 | | | 0.90% |
| | | | |
Investor Class | | | | | | | | | | | | | | |
| | | | |
Actual Fund Return(b) | | | $ 1,000.00 | | | | $ 1,212.20 | | | | $ 6.41 | | | 1.15% |
Hypothetical Fund Return(c) | | | $ 1,000.00 | | | | $ 1,019.41 | | | | $ 5.85 | | | 1.15% |
| (a) | Shares commenced operations on September 27, 2010. |
| (b) | The “Actual” example in the table above is equal to the Class’s annualized expense ratio multiplied by the average account value over the period, multiplied by the number of days in the most recent fiscal half year (95 days for Class A, Class C and I, 184 days for Class L and Investor Class), then divided by 365. |
| (c) | The “Hypothetical” example in the table above is equal to the Class’s annualized expense ratio multiplied by the average account value over the period, multiplied by the number of days in the most recent fiscal half year (184), then divided by 365. |
| (d) | Prior to close of business on September 24, 2010, Class L was known as Institutional Class of the Predecessor Fund. |
| | | | | | | | |
| | | RiverFront Long-Term Growth Fund | |
| | | | | | |
| | | | | Statement of Investments | | | December 31, 2010 | |
| | | | | | | | |
| | | Shares | | | Value | |
|
COMMON STOCKS (34.48%) | |
Advertising (0.55%) | |
Omnicom Group, Inc. | | | 8,771 | | | $ | 401,712 | |
| | | | | | | | |
|
Aerospace & Defense (2.63%) | |
Esterline Technologies Corp.(a) | | | 9,187 | | | | 630,136 | |
L-3 Communications Holdings, Inc. | | | 4,759 | | | | 335,462 | |
Lockheed Martin Corp. | | | 6,107 | | | | 426,941 | |
United Technologies Corp. | | | 6,736 | | | | 530,258 | |
| | | | | | | | |
| | | | | | | 1,922,797 | |
| | | | | | | | |
|
Agriculture (0.53%) | |
Altria Group, Inc. | | | 15,778 | | | | 388,454 | |
| | | | | | | | |
| | |
Banks (1.37%) | | | | | | | | |
East West Bancorp, Inc. | | | 27,083 | | | | 529,472 | |
State Street Corp. | | | 10,149 | | | | 470,305 | |
| | | | | | | | |
| | | | | | | 999,777 | |
| | | | | | | | |
| | |
Chemicals (1.88%) | | | | | | | | |
Monsanto Co. | | | 6,553 | | | | 456,351 | |
The Scotts Miracle-Gro Co., Class A | | | 10,156 | | | | 515,620 | |
Sensient Technologies Corp. | | | 10,842 | | | | 398,227 | |
| | | | | | | | |
| | | | | | | 1,370,198 | |
| | | | | | | | |
|
Commercial Banks (0.48%) | |
Cullen/Frost Bankers, Inc. | | | 5,686 | | | | 347,528 | |
| | | | | | | | |
|
Commercial Services (1.15%) | |
Automatic Data Processing, Inc. | | | 9,086 | | | | 420,500 | |
Iron Mountain, Inc. | | | 16,903 | | | | 422,744 | |
| | | | | | | | |
| | | | | | | 843,244 | |
| | | | | | | | |
|
Commercial Services & Supplies (0.46%) | |
Manpower, Inc. | | | 5,368 | | | | 336,896 | |
| | | | | | | | |
|
Communications Equipment (0.61%) | |
Harris Corp. | | | 9,780 | | | | 443,034 | |
| | | | | | | | |
|
Computers & Peripherals (2.08%) | |
Apple, Inc.(a) | | | 2,701 | | | | 871,235 | |
International Business Machines Corp. | | | 4,411 | | | | 647,358 | |
| | | | | | | | |
| | | | | | | 1,518,593 | |
| | | | | | | | |
|
Containers & Packaging (0.94%) | |
Ball Corp. | | | 10,084 | | | | 686,216 | |
| | | | | | | | |
| | | | | | | | |
| | | Shares | | | Value | |
|
Diversified Financial Services (0.49%) | |
The NASDAQ OMX Group, Inc.(a) | | | 15,185 | | | $ | 360,036 | |
| | | | | | | | |
| | |
Electric (0.50%) | | | | | | | | |
DPL, Inc. | | | 14,110 | | | | 362,768 | |
| | | | | | | | |
|
Energy Equipment & Services (0.99%) | |
Diana Shipping, Inc.(a) | | | 19,371 | | | | 232,839 | |
Superior Energy Services, Inc.(a) | | | 14,039 | | | | 491,225 | |
| | | | | | | | |
| | | | | | | 724,064 | |
| | | | | | | | |
|
Food & Staples Retailing (1.65%) | |
CVS Caremark Corp. | | | 9,400 | | | | 326,838 | |
NIKE, Inc., Class B | | | 6,707 | | | | 572,912 | |
Wal-Mart Stores, Inc. | | | 5,730 | | | | 309,019 | |
| | | | | | | | |
| | | | | | | 1,208,769 | |
| | | | | | | | |
|
Health Care Providers & Services (2.65%) | |
CareFusion Corp.(a) | | | 20,583 | | | | 528,983 | |
DaVita, Inc.(a) | | | 4,381 | | | | 304,436 | |
Express Scripts, Inc.(a) | | | 4,711 | | | | 254,629 | |
Henry Schein, Inc.(a) | | | 7,349 | | | | 451,155 | |
PSS World Medical, Inc.(a) | | | 17,538 | | | | 396,359 | |
| | | | | | | | |
| | | | | | | 1,935,562 | |
| | | | | | | | |
|
Healthcare Products (0.59%) | |
Becton Dickinson and Co. | | | 5,105 | | | | 431,475 | |
| | | | | | | | |
|
Hotels, Restaurants & Leisure (0.99%) | |
Darden Restaurants, Inc. | | | 6,709 | | | | 311,566 | |
Penn National Gaming, Inc.(a) | | | 11,642 | | | | 409,216 | |
| | | | | | | | |
| | | | | | | 720,782 | |
| | | | | | | | |
|
Insurance (1.20%) | |
Chubb Corp. | | | 5,405 | | | | 322,354 | |
HCC Insurance Holdings, Inc. | | | 19,236 | | | | 556,690 | |
| | | | | | | | |
| | | | | | | 879,044 | |
| | | | | | | | |
|
IT Services (0.76%) | |
Fiserv, Inc.(a) | | | 9,472 | | | | 554,680 | |
| | | | | | | | |
|
Leisure Equipment & Products (0.44%) | |
Hasbro, Inc. | | | 6,773 | | | | 319,550 | |
| | | | | | | | |
|
Media (0.42%) | |
DreamWorks Animation SKG, Inc., Class A(a) | | | 10,453 | | | | 308,050 | |
| | | | | | | | |
|
Multiline Retail (0.80%) | |
Dollar Tree, Inc.(a) | | | 10,396 | | | | 583,008 | |
| | | | | | | | |
| | | | | | |
| | | RiverFront Long-Term Growth Fund |
| | | | | |
| | | | | Statement of Investments | | December 31, 2010 |
| | | | | | | | |
| | | Shares | | | Value | |
| | |
Oil & Gas (3.46%) | | | | | | | | |
Chevron Corp. | | | 8,429 | | | $ | 769,146 | |
Cimarex Energy Co. | | | 4,377 | | | | 387,496 | |
Exxon Mobil Corp. | | | 7,511 | | | | 549,205 | |
Forest Oil Corp.(a) | | | 13,626 | | | | 517,379 | |
Petrohawk Energy
Corp.(a) | | | 16,509 | | | | 301,289 | |
| | | | | | | | |
| | | | | | | 2,524,515 | |
| | | | | | | | |
|
Pharmaceuticals (1.33%) | |
Abbott Laboratories | | | 4,330 | | | | 207,450 | |
Omnicare, Inc. | | | 20,492 | | | | 520,292 | |
PerkinElmer, Inc. | | | 9,411 | | | | 242,992 | |
| | | | | | | | |
| | | | | | | 970,734 | |
| | | | | | | | |
|
Real Estate Investment Trusts (1.94%) | |
American Campus Communities, Inc. | | | 13,527 | | | | 429,618 | |
Corporate Office Properties Trust | | | 11,892 | | | | 415,625 | |
DuPont Fabros Technology, Inc. | | | 12,982 | | | | 276,127 | |
Weingarten Realty Investors | | | 12,585 | | | | 299,020 | |
| | | | | | | | |
| | | | | | | 1,420,390 | |
| | | | | | | | |
|
Semiconductors & Semiconductor Equipment (1.13%) | |
Microchip Technology, Inc. | | | 12,700 | | | | 434,467 | |
Skyworks Solutions,
Inc.(a) | | | 13,718 | | | | 392,746 | |
| | | | | | | | |
| | | | | | | 827,213 | |
| | | | | | | | |
| | |
Software (0.37%) | | | | | | | | |
BMC Software, Inc.(a) | | | 5,687 | | | | 268,085 | |
| | | | | | | | |
|
Telecommunications (0.86%) | |
QUALCOMM, Inc. | | | 5,715 | | | | 282,836 | |
Verizon Communications, Inc. | | | 9,686 | | | | 346,565 | |
| | | | | | | | |
| | | | | | | 629,401 | |
| | | | | | | | |
| | |
Tobacco (0.54%) | | | | | | | | |
Philip Morris International, Inc. | | | 6,729 | | | | 393,849 | |
| | | | | | | | |
| | |
Transportation (0.69%) | | | | | | | | |
United Parcel Service, Inc., Class B 6,990 | | | | | | | 507,334 | |
| | | | | | | | |
| |
TOTAL COMMON STOCKS (Cost $21,097,877) | | | | 25,187,758 | |
| | | | | | | | |
|
EXCHANGE TRADED FUNDS (56.12%) | |
Commodity Fund (3.90%) | | | | | | | | |
PowerShares DB Oil Fund(a) | | | 51,465 | | | | 1,452,342 | |
SPDR Gold Shares(a) | | | 10,087 | | | | 1,399,269 | |
| | | | | | | | |
| | | | | | | 2,851,611 | |
| | | | | | | | |
| | | | | | | | |
| | | Shares | | | Value | |
| |
Emerging Markets (11.89%) | | | | | |
iShares MSCI All Country Asia ex Japan Index Fund | | | 27,926 | | | $ | 1,778,886 | |
iShares MSCI Chile Investable Market Index Fund | | | 6,036 | | | | 480,466 | |
iShares MSCI Emerging Markets Index Fund | | | 20,605 | | | | 981,210 | |
Vanguard Emerging Markets ETF | | | 113,179 | | | | 5,449,569 | |
| | | | | | | | |
| | | | | | | 8,690,131 | |
| | | | | | | | |
| | |
Equity Fund (3.97%) | | | | | | | | |
Global X China Consumer ETF | | | 17,630 | | | | 318,927 | |
iShares MSCI United Kingdom Index Fund | | | 40,953 | | | | 711,353 | |
Materials Select Sector SPDR ETF(b) | | | 16,498 | | | | 635,173 | |
PowerShares Dynamic Building & Construction Portfolio | | | 30,941 | | | | 402,295 | |
PowerShares S&P Small-Cap Industrials Portfolio | | | 14,551 | | | | 426,490 | |
SPDR S&P Oil & Gas Equipment & Services ETF | | | 11,154 | | | | 409,463 | |
| | | | | | | | |
| | | | | | | 2,903,701 | |
| | | | | | | | |
| |
Financial Services (1.30%) | | | | | |
PowerShares Dynamic Banking Portfolio | | | 21,215 | | | | 281,523 | |
SPDR KBW Capital Markets ETF | | | 17,485 | | | | 671,249 | |
| | | | | | | | |
| | | | | | | 952,772 | |
| | | | | | | | |
| |
Growth (3.97%) | | | | | |
Wilshire Micro-Cap ETF | | | 151,553 | | | | 2,900,724 | |
| | | | | | | | |
| |
Growth Mid Cap (1.90%) | | | | | |
SPDR S&P Mid-Cap 400 ETF Trust | | | 8,429 | | | | 1,388,088 | |
| | | | | | | | |
| |
Growth Small Cap (3.80%) | | | | | |
Powershares Zacks Micro-Cap Portfolio | | | 187,548 | | | | 2,252,451 | |
Vanguard Small-Cap ETF | | | 7,187 | | | | 521,992 | |
| | | | | | | | |
| | | | | | | 2,774,443 | |
| | | | | | | | |
| |
Health & Biotechnology (0.60%) | | | | | |
PowerShares S&P Small-Cap Health Care Portfolio | | | 15,542 | | | | 439,994 | |
| | | | | | | | |
| | | | | | |
| | | RiverFront Long-Term Growth Fund |
| | | | | |
| | | | | Statement of Investments | | December 31, 2010 |
| | | | | | | | |
| | | Shares | | | Value | |
| | |
|
International Equity (9.87%) | |
iShares MSCI Canada Index Fund | | | 46,064 | | | $ | 1,427,984 | |
iShares MSCI Singapore Index Fund | | | 150,871 | | | | 2,089,564 | |
Vanguard Europe Pacific ETF | | | 102,102 | | | | 3,690,987 | |
| | | | | | | | |
| | | | | | | 7,208,535 | |
| | | | | | | | |
|
Large Cap (1.62%) | |
iShares S&P North American Technology-Software Index Fund(a) | | | 20,237 | | | | 1,182,245 | |
| | | | | | | | |
|
Micro Cap (2.92%) | |
First Trust Dow Jones Select MicroCap Index Fund | | | 96,285 | | | | 2,132,713 | |
| | | | | | | | |
| | |
Mid Cap (0.60%) | | | | | | | | |
SPDR KBW Bank ETF | | | 17,005 | | | | 440,600 | |
| | | | | | | | |
|
Small Cap (8.30%) | |
PowerShares Dynamic Food & Beverage Portfolio | | | 21,585 | | | | 393,494 | |
PowerShares Dynamic Leisure & Entertainment Portfolio | | | 28,742 | | | | 530,865 | |
SPDR S&P Emerging Small-Cap ETF | | | 90,100 | | | | 5,136,601 | |
| | | | | | | | |
| | | | | | | 6,060,960 | |
| | | | | | | | |
|
Technology (0.63%) | |
PowerShares S&P Small-Cap Information Technology Portfolio | | | 15,541 | | | | 456,750 | |
| | | | | | | | |
| | |
Value (0.85%) | | | | | | | | |
PowerShares Dividend Achievers Portfolio | | | 44,140 | | | | 618,843 | |
| | | | | | | | |
| |
TOTAL EXCHANGE TRADED FUNDS (Cost $34,668,639) | | | | 41,002,110 | |
| | | | | | | | |
|
EXCHANGE TRADED NOTES (2.76%) | |
Equity Fund (2.76%) | | | | | | | | |
JPMorgan Alerian MLP Index ETN | | | 37,006 | | | | 1,345,168 | |
UBS E-TRACS Alerian MLP Infrastructure ETN | | | 22,187 | | | | 667,829 | |
| | | | | | | | |
| | | | | | | 2,012,997 | |
| | | | | | | | |
| |
TOTAL EXCHANGE TRADED NOTES (Cost $1,779,791) | | | | 2,012,997 | |
| | | | | | | | |
| | | | | | | | |
| | |
| 7-Day Yield | | Shares | | | Value | |
| | |
|
SHORT TERM INVESTMENTS (4.27%) | |
Dreyfus Cash Management Fund, Institutional Class 0.14% | | | 3,121,083 | | | $ | 3,121,083 | |
| | | | | | | | |
| |
TOTAL SHORT TERM INVESTMENTS (Cost $3,121,083) | | | | 3,121,083 | |
| | | | | | | | |
| |
TOTAL INVESTMENTS (97.63%) (Cost $60,667,390) | | | $ | 71,323,948 | |
| |
Other Assets In Excess of
Liabilities (2.37%) | | | | 1,735,113 | |
| | | | | | | | |
| |
NET ASSETS (100.00%) | | | $ | 73,059,061 | |
| | | | | | | | |
Common Abbreviations:
ETF - Exchange Traded Fund
ETN - Exchange Traded Note
E-TRACS - Exchange Traded Access Securities
MLP - Master Limited Partnership
MSCI - Morgan Stanley Capital International
S&P - Standard & Poor’s
SPDR - Standard & Poor’s Depository Receipt
| (a) | Non-Income Producing Security. |
| (b) | Affiliated Company. See Note 6 to Financial Statements. |
See Notes to Financial Statements.
| | | | | | |
| RiverFront Long-Term Growth Fund | | | | |
| | | | |
| | | Statement of Investments | | | December 31, 2010 (Unaudited) | |
Top Ten Holdings (as a % of Net Assets) †
| | | | |
Vanguard Emerging Markets ETF | | | 7.46 | % |
SPDR S&P Emerging SmallCap ETF | | | 7.03 | % |
Vanguard Europe Pacific ETF | | | 5.05 | % |
Wilshire Micro-Cap ETF | | | 3.97 | % |
Powershares Zacks Micro-Cap Portfolio | | | 3.08 | % |
First Trust Dow Jones Select MicroCap Index Fund | | | 2.92 | % |
iShares MSCI Singapore Index Fund | | | 2.86 | % |
iShares MSCI All Country Asia ex Japan Index Fund | | | 2.43 | % |
PowerShares DB Oil Fund | | | 1.99 | % |
iShares MSCI Canada Index Fund | | | 1.95 | % |
Top Ten Holdings | | | 38.74 | % |
| † | Future holdings are subject to change. |
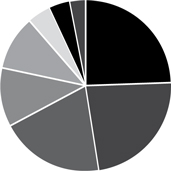
Portfolio Composition (as a % of Net Assets)
| | | | |
Sector | | | % | |
Small/Mid-Cap Equity | | | 24.65 | % |
Large Cap Equity | | | 23.00 | % |
Emerging Market Equity | | | 19.83 | % |
International Equity | | | 11.10 | % |
Micro Cap Equity | | | 10.22 | % |
Cash | | | 4.38 | % |
Currency and Other | | | 4.00 | % |
Income Oriented Equities | | | 2.82 | % |
| | | | | | | | |
| | | Statement of Assets and Liabilities | |
| | | | | | |
| | | | | | | | December 31, 2010 | |
| | | | |
ASSETS | | | | |
Investments, at value (Cost $60,126,460) | | $ | 70,688,775 | |
Investments in affiliates, at value (Cost $540,930) | | | 635,173 | |
Receivable for shares sold | | | 1,665,876 | |
Dividends and interest receivable | | | 39,674 | |
Receivable due from adviser | | | 66,015 | |
Prepaid expenses and other assets | | | 15,456 | |
| | |
Total Assets | | | 73,110,969 | |
| | |
| |
LIABILITIES | | | | |
Administration and transfer agency fees payable | | | 6,336 | |
Distribution and services fees payable | | | 6,851 | |
Directors’ fees and expenses payable | | | 3,152 | |
Legal fees payable | | | 8,154 | |
Custody fees payable | | | 2,000 | |
Report to shareholders and printing fees payable | | | 6,114 | |
Accrued expenses and other liabilities | | | 19,301 | |
| | |
Total Liabilities | | | 51,908 | |
| | |
NET ASSETS | | $ | 73,059,061 | |
| | |
| |
NET ASSETS CONSIST OF | | | | |
Paid-in capital | | $ | 61,681,884 | |
Undistributed net investment income | | | 12,313 | |
Accumulated net realized gain on investments | | | 708,306 | |
Net unrealized appreciation on investments | | | 10,656,558 | |
| | |
NET ASSETS | | $ | 73,059,061 | |
| | |
See Notes to Financial Statements.
| | | | | | | | |
| | | Statement of Assets and Liabilities | |
| | | | | | |
| | | | | | | | December 31, 2010 | |
| | | | |
PRICING OF SHARES | | | | |
Class A: | | | | |
Net Asset Value, offering and redemption price per share(a) | | $ | 14.66 | |
Net Assets | | $ | 1,934,030 | |
Shares of beneficial interest outstanding (unlimited number of shares, no par value common stock authorized) | | | 131,950 | |
Maximum offering price per share (NAV/0.9450), based on maximum sales charge of 5.50% of the offering price) | | $ | 15.51 | |
| |
Class C: | | | | |
Net Asset Value, offering and redemption price per share(a) | | $ | 14.63 | |
Net Assets | | $ | 2,049,698 | |
Shares of beneficial interest outstanding (unlimited number of shares, no par value common stock authorized) | | | 140,119 | |
| |
Class I: | | | | |
Net Asset Value, offering and redemption price per share | | $ | 14.65 | |
Net Assets | | $ | 2,279,925 | |
Shares of beneficial interest outstanding (unlimited number of shares, no par value common stock authorized) | | | 155,636 | |
| |
Class L: | | | | |
Net Asset Value, offering and redemption price per share | | $ | 14.63 | |
Net Assets | | $ | 43,239,595 | |
Shares of beneficial interest outstanding (unlimited number of shares, no par value common stock authorized) | | | 2,955,362 | |
| |
Investor Class: | | | | |
Net Asset Value, offering and redemption price per share | | $ | 14.59 | |
Net Assets | | $ | 23,555,813 | |
Shares of beneficial interest outstanding (unlimited number of shares, no par value common stock authorized) | | | 1,614,688 | |
| (a) | Redemption price per share may be reduced for any applicable contingent deferred sales charge. For a description of a possible sales charge, please see the Fund’s Prospectus. |
See Notes to Financial Statements.
| | | | | | | | |
| | | Statement of Operations | |
| | | | | | |
| | | | | | | | For the Year Ended December 31, 2010 | |
| | | | |
INVESTMENT INCOME | | | | |
Dividends from unaffiliated securities | | $ | 1,028,056 | |
Dividends from affiliated securities | | | 18,340 | |
Interest and other income | | | 47,256 | |
| | |
Total Investment Income | | | 1,093,652 | |
| | |
| |
EXPENSES | | | | |
Investment advisory fees | | | 403,220 | |
Administrative and transfer agency fee | | | 65,485 | |
Distribution and service fees | | | | |
Class A | | | 546 | |
Class C | | | 2,140 | |
Investor Class | | | 49,477 | |
Legal fees | | | 78,098 | |
Reports to shareholders and printing fees | | | 19,455 | |
State registration fees | | | 25,407 | |
Insurance | | | 500 | |
Custody fees | | | 13,255 | |
Directors’ fees and expenses | | | 54,411 | |
Miscellaneous | | | 17,157 | |
| | |
Total Expenses | | | 729,151 | |
Less fees waived/reimbursed by investment adviser and sub-adviser | | | | |
Class A | | | (2,709) | |
Class C | | | (2,631) | |
Class I | | | (1,245) | |
Class L | | | (195,927) | |
Investor Class | | | (110,797) | |
| | |
Net Expenses | | | 415,842 | |
| | |
Net Investment Income | | | 677,810 | |
| | |
| |
Net realized gain on investments | | | 1,387,125 | |
Net realized loss on investments - affiliated securities | | | (410) | |
Net change in unrealized appreciation of investments | | | 5,485,730 | |
| | |
NET REALIZED AND UNREALIZED GAIN ON INVESTMENTS | | | 6,872,445 | |
| | |
NET INCREASE IN NET ASSETS RESULTING FROM OPERATIONS | | $ | 7,550,255 | |
| | |
See Notes to Financial Statements.
| | | | | | |
| | | Statements of Changes in Net Assets |
| | | | | |
| | | | | | | |
| | | | | | | | |
| | | For the Year Ended December 31, 2010 | | | For the Year Ended December 31, 2009 | |
| | |
OPERATIONS | | | | | | | | |
Net investment income | | $ | 677,810 | | | $ | 256,209 | |
Net realized gain on investments | | | 1,387,125 | | | | 83,824 | |
Net realized loss on investments - affiliated securities | | | (410) | | | | – | |
Net change in unrealized appreciation on investments | | | 5,485,730 | | | | 5,035,621 | |
| | |
Net Increase in Net Assets Resulting from Operations | | | 7,550,255 | | | | 5,375,654 | |
| | |
| | |
DISTRIBUTIONS | | | | | | | | |
Dividends to shareholders from net investment income | | | | | | | | |
Class A | | | (17,765) | | | | N/A | |
Class C | | | (16,050) | | | | N/A | |
Class I | | | (7,114) | | | | N/A | |
Class L | | | (433,125) | | | | (183,786) | |
Investor Class | | | (189,956) | | | | (79,120) | |
Dividends to shareholders from net realized gains | | | | | | | | |
Class A | | | (17,553) | | | | N/A | |
Class C | | | (17,494) | | | | N/A | |
Class I | | | (6,746) | | | | N/A | |
Class L | | | (401,355) | | | | – | |
Investor Class | | | (221,742) | | | | – | |
| | |
Net Decrease in Net Assets from Distributions | | | (1,328,900) | | | | (262,906) | |
| | |
| | |
BENEFICIAL INTEREST TRANSACTIONS (NOTE 4) | | | | | | | | |
Shares sold | | | | | | | | |
Class A | | | 1,873,880 | | | | N/A | |
Class C | | | 1,977,787 | | | | N/A | |
Class I | | | 2,241,130 | | | | N/A | |
Class L | | | 17,118,139 | | | | 19,773,680 | |
Investor Class | | | 10,282,445 | | | | 12,871,509 | |
Dividends reinvested | | | | | | | | |
Class A | | | 30,821 | | | | N/A | |
Class C | | | 32,260 | | | | N/A | |
Class I | | | 10,823 | | | | N/A | |
Class L | | | 803,434 | | | | 176,343 | |
Investor Class | | | 372,558 | | | | 75,986 | |
Shares redeemed | | | | | | | | |
Class A | | | (8,866) | | | | N/A | |
Class C | | | – | | | | N/A | |
Class I | | | – | | | | N/A | |
Class L | | | (6,407,084) | | | | (3,570,027) | |
Investor Class | | | (3,134,097) | | | | (660,468) | |
| | |
Net Increase in Net Assets Derived from Beneficial Interest Transactions | | | 25,193,230 | | | | 28,667,023 | |
| | |
| | |
Net increase in net assets | | | 31,414,585 | | | | 33,779,771 | |
| | |
Net Assets | | | | | | | | |
Beginning of year | | | 41,644,476 | | | | 7,864,705 | |
| | |
End of year* | | $ | 73,059,061 | | | $ | 41,644,476 | |
| | |
| | |
* Includes undistributed net investment income of: | | $ | 12,313 | | | $ | – | |
See Notes to Financial Statements.
| | | | | | |
| | | Financial Highlights |
| | | | | |
| | | | | Selected data for a share of beneficial interest outstanding throughout the period indicated: | | |
| | |
| | | RiverFront Long-Term Growth Fund [Class A] |
| |
| | | For the Period September 27, 2010 (Inception) to December 31, 2010 |
| |
| |
Net asset value, beginning of period | | $13.68 |
| |
INCOME FROM INVESTMENT OPERATIONS: | | |
Net investment income after reimbursements (a) | | 0.23 |
Net realized and unrealized gain | | 1.03 |
| |
Total from investment operations | | 1.26 |
| |
| |
DISTRIBUTIONS: | | |
From net investment income after reimbursements | | (0.14) |
From net realized gains | | (0.14) |
| |
Total distributions | | (0.28) |
| |
| |
Net increase in net asset value | | 0.98 |
| |
Net asset value, end of year | | $14.66 |
| |
TOTAL RETURN (b) | | 9.22% |
| |
RATIOS/SUPPLEMENTAL DATA: | | |
Net assets, end of year (000s) | | $1,934 |
Ratio of net investment income after reimbursements to average net assets | | 6.20%(c) |
Ratio of expenses to average net assets including fee waivers and reimbursements (includes acquired fund fee reimbursement) | | 0.91%(c) |
Ratio of expenses to average net assets including fee waivers and reimbursements (excludes acquired fund fee reimbursement) | | 1.15%(c) |
Ratio of expenses to average net assets excluding fee waivers and reimbursements | | 2.15%(c) |
Portfolio turnover rate | | 99%(d) |
| (a) | Calculated using average shares outstanding during the period. |
| (b) | Total returns are for the period indicated and have not been annualized. Total returns would have been lower had certain expenses not been waived during the period. Returns shown do not reflect the deduction of taxes that a shareholder would pay on Fund distributions or the redemption of Fund shares. Returns shown exclude any applicable sales charges. |
| (d) | Portfolio turnover rate for periods less than one full year have not been annualized. |
See Notes to Financial Statements.
| | | | | | |
| | | Financial Highlights |
| | | | | |
| | | | | Selected data for a share of beneficial interest outstanding throughout the period indicated: | | |
| | |
| | | RiverFront Long-Term Growth Fund [Class C] |
| |
| | | For the Period September 27, 2010 (Inception) to December 31, 2010 |
| |
| |
Net asset value, beginning of period | | $13.68 |
| |
INCOME FROM INVESTMENT OPERATIONS: | | |
Net investment income after reimbursements (a) | | 0.20 |
Net realized and unrealized gain | | 1.02 |
| |
Total from investment operations | | 1.22 |
| |
| |
DISTRIBUTIONS: | | |
From net investment income after reimbursements | | (0.13) |
From net realized gains | | (0.14) |
| |
Total distributions | | (0.27) |
| |
| |
Net increase in net asset value | | 0.95 |
| |
Net asset value, end of year | | $14.63 |
| |
TOTAL RETURN (b) | | 8.91% |
| |
RATIOS/ SUPPLEMENTAL DATA: | | |
Net assets, end of year (000s) | | $2,050 |
Ratio of net investment income after reimbursements to average net assets | | 5.36% (c) |
Ratio of expenses to average net assets including fee waivers and reimbursements (includes acquired fund fee reimbursement) | | 1.66% (c) |
Ratio of expenses to average net assets including fee waivers and reimbursements (excludes acquired fund fee reimbursement) | | 1.90% (c) |
Ratio of expenses to average net assets excluding fee waivers and reimbursements | | 2.89% (c) |
Portfolio turnover rate | | 99% (d) |
| (a) | Calculated using average shares outstanding during the period. |
| (b) | Total returns are for the period indicated and have not been annualized. Total returns would have been lower had certain expenses not been waived during the period. Returns shown do not reflect the deduction of taxes that a shareholder would pay on Fund distributions or the redemption of Fund shares. Returns shown exclude any applicable sales charges. |
| (d) | Portfolio turnover rate for periods less than one full year have not been annualized. |
See Notes to Financial Statements.
| | | | | | |
| | | Financial Highlights |
| | | | | |
| | | | | Selected data for a share of beneficial interest outstanding throughout the period indicated: | | |
| | |
| | | RiverFront Long-Term Growth Fund [Class I] |
| |
| | | For the Period September 27, 2010 (Inception) to December 31, 2010 |
| |
| |
Net asset value, beginning of period | | $13.68 |
| |
INCOME FROM INVESTMENT OPERATIONS: | | |
Net investment income after reimbursements (a) | | 0.17 |
Net realized and unrealized gain | | 1.09 |
| |
Total from investment operations | | 1.26 |
| |
| |
DISTRIBUTIONS: | | |
From net investment income after reimbursements | | (0.15) |
From net realized gains | | (0.14) |
| |
Total distributions | | (0.29) |
| |
| |
Net increase in net asset value | | 0.97 |
| |
Net asset value, end of year | | $14.65 |
| |
TOTAL RETURN (b) | | 9.12% |
| |
RATIOS/ SUPPLEMENTAL DATA: | | |
Net assets, end of year (000s) | | $2,280 |
Ratio of net investment income after reimbursements to average net assets | | 4.70% (c) |
Ratio of expenses to average net assets including fee waivers and reimbursements (includes acquired fund fee reimbursement) | | 0.66% (c) |
Ratio of expenses to average net assets including fee waivers and reimbursements (excludes acquired fund fee reimbursement) | | 0.90% (c) |
Ratio of expenses to average net assets excluding fee waivers and reimbursements | | 1.74% (c) |
Portfolio turnover rate | | 99% (d) |
| (a) | Calculated using average shares outstanding during the period. |
| (b) | Total returns are for the period indicated and have not been annualized. Total returns would have been lower had certain expenses not been waived during the period. Returns shown do not reflect the deduction of taxes that a shareholder would pay on Fund distributions or the redemption of Fund shares. |
| (d) | Portfolio turnover rate for periods less than one full year have not been annualized. |
See Notes to Financial Statements.
| | | | | | | | |
| Financial Highlights | | | | |
| | | | | | |
| | | | | Selected data for a share of beneficial interest outstanding throughout the periods indicated: | | | | |
| | | | | | | | | | | | |
| | | RiverFront Long-Term Growth Fund [Class L^] | |
| | |
| | | For the Year Ended December 31, 2010 | | | For the Year Ended December 31, 2009 | | | For the Period October 28, 2008 (Inception) to December 31, 2008 | |
| | |
| | | |
Net asset value, beginning of period | | | $13.22 | | | | $10.49 | | | | $10.00 | |
| | |
INCOME FROM INVESTMENT OPERATIONS: | | | | | | | | | |
Net investment income after reimbursements (a) | | | 0.18 | | | | 0.16 | | | | 0.12 | |
Net realized and unrealized gain | | | 1.52 | | | | 2.66 | | | | 0.46 | |
| | |
Total from investment operations | | | 1.70 | | | | 2.82 | | | | 0.58 | |
| | |
| | | |
DISTRIBUTIONS: | | | | | | | | | | | | |
From net investment income after reimbursements | | | (0.15) | | | | (0.09) | | | | (0.09) | |
From net realized gains | | | (0.14) | | | | – | | | | – | |
| | |
Total distributions | | | (0.29) | | | | (0.09) | | | | (0.09) | |
| | |
| | | |
Net increase in net asset value | | | 1.41 | | | | 2.73 | | | | 0.49 | |
| | |
Net asset value, end of year | | | $14.63 | | | | $13.22 | | | | $10.49 | |
| | |
TOTAL RETURN (b) | | | 12.87% | | | | 26.86% | | | | 5.81% | |
| | | |
RATIOS/ SUPPLEMENTAL DATA: | | | | | | | | | | | | |
Net assets, end of year (000s) | | | $43,240 | | | | $27,763 | | | | $7,439 | |
Ratio of net investment income after reimbursements to average net assets | | | 1.33% | | | | 1.34% | | | | 7.55% (c) | |
Ratio of expenses to average net assets including fee waivers and reimbursements (includes acquired fund fee reimbursement) | | | 0.66% | | | | N/A | | | | N/A | |
Ratio of expenses to average net assets including fee waivers and reimbursements (excludes acquired fund fee reimbursement) | | | 0.90% | | | | 0.90% | | | | 0.90% (c) | |
Ratio of expenses to average net assets excluding fee waivers and reimbursements | | | 1.22% | | | | 1.53% | | | | 4.97% (c) | |
Portfolio turnover rate (d) | | | 99% | | | | 67% | | | | 13% | |
| ^ | Prior to close of business on September 24, 2010, Class L was known as Institutional Class of the Predecessor Fund. |
| (a) | Calculated using average shares outstanding during the period. |
| (b) | Total returns are for the period indicated and have not been annualized. Total returns would have been lower had certain expenses not been waived during the period. Returns shown do not reflect the deduction of taxes that a shareholder would pay on Fund distributions or the redemption of Fund shares. |
| (d) | Portfolio turnover rate for periods less than one full year have not been annualized. |
See Notes to Financial Statements.
| | | | | | | | |
| Financial Highlights | | | | |
| | | | | | |
| | | | | Selected data for a share of beneficial interest outstanding throughout the periods indicated: | | | | |
| | | | | | | | | | | | |
| | | RiverFront Long-Term Growth Fund [Investor Class] | |
| | |
| | | For the Year Ended December 31, 2010 | | | For the Year Ended December 31, 2009 | | | For the Period October 28, 2008 (Inception) to December 31, 2008 | |
| | |
| | | |
Net asset value, beginning of period | | | $13.19 | | | | $10.49 | | | | $10.00 | |
| | | |
INCOME FROM INVESTMENT OPERATIONS: | | | | | | | | | | | | |
Net investment income after reimbursements (a) | | | 0.12 | | | | 0.13 | | | | 0.12 | |
Net realized and unrealized gain | | | 1.54 | | | | 2.65 | | | | 0.46 | |
| | |
Total from investment operations | | | 1.66 | | | | 2.78 | | | | 0.58 | |
| | |
| | | |
DISTRIBUTIONS: | | | | | | | | | | | | |
From net investment income after reimbursements | | | (0.12) | | | | (0.08) | | | | (0.09) | |
From net realized gains | | | (0.14) | | | | – | | | | – | |
| | |
Total distributions | | | (0.26) | | | | (0.08) | | | | (0.09) | |
| | |
| | | |
Net increase in net asset value | | | 1.40 | | | | 2.70 | | | | 0.49 | |
| | |
Net asset value, end of year | | | $14.59 | | | | $13.19 | | | | $10.49 | |
| | |
TOTAL RETURN (b) | | | 12.58% | | | | 26.58% | | | | 5.68% | |
| | | |
RATIOS/ SUPPLEMENTAL DATA: | | | | | | | | | | | | |
Net assets, end of year (000s) | | | $23,556 | | | | $13,882 | | | | $425,980 | |
Ratio of net investment income after reimbursements to average net assets | | | 0.93% | | | | 1.09% | | | | 7.30% (c) | |
Ratio of expenses to average net assets including fee waivers and reimbursements (includes acquired fund fee reimbursement) | | | 0.91% | | | | N/A | | | | N/A | |
Ratio of expenses to average net assets including fee waivers and reimbursements (excludes acquired fund fee reimbursement) | | | 1.15% | | | | 1.15% | | | | 1.15% (c) | |
Ratio of expenses to average net assets excluding fee waivers and reimbursements | | | 1.47% | | | | 1.78% | | | | 5.22% (c) | |
Portfolio turnover rate (d) | | | 99% | | | | 67% | | | | 13% | |
| (a) | Calculated using average shares outstanding during the period. |
| (b) | Total returns are for the period indicated and have not been annualized. Total returns would have been lower had certain expenses not been waived during the period. Returns shown do not reflect the deduction of taxes that a shareholder would pay on Fund distributions or the redemption of Fund shares. |
| (d) | Portfolio turnover rate for periods less than one full year have not been annualized. |
See Notes to Financial Statements.
| | | | | | |
| Notes to Financial Statements | | | | |
| | | | |
| | | | | | December 31, 2010 | |
1. ORGANIZATION
Financial Investors Trust (the “Trust”) was organized as a Delaware statutory trust on November 30, 1993 and registered as an open-end management investment company under the Investment Company Act of 1940, as amended (“1940 Act”). As of December 31, 2010, the Trust consists of 11 separate portfolios which include multiple series of shares, with differing investment objectives and policies. This report pertains to the RiverFront Long-Term Growth Fund (the “Fund”). The Fund’s objective is to achieve long-term capital appreciation.
The Fund offers multiple series of shares. Each class differs as to sales and redemption charges and ongoing fees. All classes of shares have identical rights to earnings, assets and voting privileges, except for class-specific expenses and exclusive rights to vote on matters affecting only individual classes. Class A shares of the Fund are subject to an initial sales charge of up to 5.50%. Class A shares and Class C shares of the Fund, as applicable, for which no initial sales charge was paid are subject to a contingent deferred sales charge of 1% if the shares are sold within twelve months after a purchase in excess of $1 million.
Each class has equal rights as to class and voting privileges. The classes differ principally in the applicable distribution and shareholder service fees. Shareholders of each class also bear certain expenses that pertain to that particular class. All shareholders bear the common expenses of the Fund and earn income and realized gains/losses from the Fund pro rata based on the average daily net assets of each class, without distinction between share classes. Dividends are determined separately for each class based on income and expenses allocable to each class. Realized gain distributions are allocated to each class pro rata based on the shares outstanding of each class on the date of distribution. Differences in per share dividend rates generally result from differences in separate class expenses, including distribution and shareholder service fees, if applicable.
On September 24, 2010, RiverFront Long-Term Growth Fund (the “Predecessor Fund”), a series of Baird Funds, Inc., participated in a tax-free reorganization whereby the Predecessor Fund merged into the newly created RiverFront Long-Term Growth Fund, a series of the Financial Investors Trust. For financial reporting purposes, the Predecessor Fund was considered the acquirer and as such the Fund has carried over the historic performance and financial results of the Predecessor Fund. The Predecessor Fund commenced operations on October 28, 2008.
2. SIGNIFICANT ACCOUNTING POLICIES
The following is a summary of significant accounting policies consistently followed by the Fund in the preparation of its financial statements. The accompanying financial statements were prepared in accordance with accounting principles generally accepted in
the United States of America (“U.S. GAAP”). The preparation of financial statements in conformity with U.S. GAAP requires management to make certain estimates and assumptions that affect the reported amounts of assets and liabilities and disclosures of contingent assets and liabilities at the date of the financial statements and the reported amounts of revenue and expenses during the period. Actual results could differ from those estimates.
Investment Valuation
The Fund generally values its securities based on market prices determined at the close of regular trading on the New York Stock Exchange (“NYSE”), normally 4:00 p.m. Eastern Time, on each day the NYSE is open for trading. The Fund’s net asset value (“NAV”) is computed by dividing the value of all assets of the Fund (including accrued interest and dividends), less all liabilities (including accrued expenses and dividends declared but unpaid), by the total number of shares outstanding.
For equity securities and funds that are traded on an exchange, the market price is usually the closing sale or official closing price on that exchange. In the case of equity securities not traded on an exchange, or if such closing prices are not otherwise available, the market price is typically determined by independent third party pricing vendors approved by the Board using a variety of pricing techniques and methodologies. The market price for debt obligations is generally the price supplied by an independent third-party pricing service approved by the Board, which may use a matrix, formula or other objective method that takes into consideration market indices, yield curves and other specific adjustments. Short–term debt obligations that will mature in 60 days or less are valued at amortized cost, unless it is determined that using this method would not reflect an investment’s fair value. If vendors are unable to supply a price, or if the price supplied is deemed to be unreliable, the market price may be determined using quotations received from one or more brokers–dealers that make a market in the security. Investments in non-exchange traded funds are fair valued at their respective net asset values.
When such prices or quotations are not available, or when the Fair Value Committee appointed by the Board of Trustees (the “Board”) believes that they are unreliable, securities may be priced using fair value procedures approved by the Board. The Fund may also use fair value procedures if the Fair Value Committee determines that a significant event has occurred between the time at which a market price is determined and the time at which the Fund’s NAV is calculated. In particular, the value of non-U.S. securities may be materially affected by events occurring after the close of the foreign exchange on which they are traded, but before the Fund prices its shares. The Fund held no fair valued securities on December 31, 2010.
The Fund discloses the classification of its fair value measurements following a three-tier hierarchy based on the inputs used to
| | | | | | |
| Notes to Financial Statements | | | | |
| | | | |
| | | | | | December 31, 2010 | |
measure fair value. Inputs refer broadly to the assumptions that market participants would use in pricing the asset or liability, including assumptions about risk. Inputs may be observable or unobservable. Observable inputs reflect the assumptions market participants would use in pricing the asset or liability that are developed based on market data obtained from sources independent of the reporting entity. Unobservable inputs reflect the reporting entity’s own assumptions about the assumptions market participants would use in pricing the asset or liability that are developed based on the best information available.
Various inputs are used in determining the value of the Fund’s investments as of the end of the reporting period. When inputs used fall into different levels of the fair value hierarchy, the level in the hierarchy within which the fair value measurement falls is
determined based on the lowest level input that is significant to the fair value measurement in its entirety. The designated input levels are not necessarily an indication of the risk or liquidity associated with these investments. These inputs are categorized in the following hierarchy under applicable financial accounting standards:
| | | | |
| Level 1 – | | | | unadjusted quoted prices in active markets for identical investments |
| Level 2 – | | | | other significant observable inputs (including quoted prices for similar securities, interest rates, prepayment speeds, credit risk, etc.) |
| Level 3 – | | | | significant unobservable inputs (including the Fund’s own assumptions in determining the fair value of investments) |
| | | | | | | | |
Investments in Securities at Value* | | Level 1 – Unadjusted Quoted Prices | | Level 2 – Other Significant Observable Inputs | | Level 3 – Significant Unobservable Inputs | | Total |
Common Stocks | | $ 25,187,758 | | $ – | | $ – | | $ 25,187,758 |
Exchange Traded Funds | | 41,002,110 | | – | | – | | 41,002,110 |
Exchange Traded Notes | | 2,012,997 | | – | | – | | 2,012,997 |
Short Term Investments | | 3,121,083 | | – | | – | | 3,121,083 |
Total | | $ 71,323,948 | | $ – | | $ – | | $ 71,323,948 |
| | | | | | | | | |
| * | For detailed descriptions of industries, see the accompanying Statement of Investments. |
Investment Transactions
Investment and shareholder transactions are accounted for on the date the investments are purchased or sold (trade date). Realized gains and losses from investment transactions are reported on an identified cost basis. Interest income, which includes accretion of discounts, is accrued and recorded as earned. Dividend income is recognized on the ex-dividend date or for certain foreign securities, as soon as information is available to the Fund.
Trust Expenses
Some expenses of the Trust can be directly attributed to the Fund. Expenses which cannot be directly attributed are apportioned among all funds in the Trust based on average net assets.
Federal Income Taxes
The Fund complies with the requirements under Subchapter M of the Internal Revenue Code applicable to regulated investment companies and intends to distribute substantially all of its net taxable income and net capital gains, if any, each year. The Fund is not subject to income taxes to the extent such distributions are made.
As of and during the fiscal year ended December 31, 2010, the Fund did not have a liability for any unrecognized tax benefits in the accompanying financial statements. The Fund
files income tax returns in the U.S. federal jurisdiction and Colorado. For the periods ended December 31, 2008 through December 31, 2010, the Fund’s returns are still open to examination by the appropriate taxing authority.
Distributions to Shareholders
The Fund normally pays dividends and distributes capital gains, if any, on an annual basis. Income dividend distributions are derived from interest and other income the Fund receives from its investments, including distributions of short-term capital gains. Capital gain distributions are derived from gains realized when the Fund sells a security it has owned for more than a year. The Fund may make additional distributions and dividends at other times if the portfolio manager believes doing so may be necessary for the Fund to avoid or reduce taxes. Net investment income/(loss) and net realized gain/(loss) may differ for financial statement and tax purposes. The character of distributions made during the year from net investment income or net realized gains may differ from its ultimate characterization for federal income tax purposes. Also, due to the timing of dividend distributions, the fiscal year in which amounts are distributed may differ from the fiscal year in which the income or realized gain were recorded by the Fund.
| | | | | | |
| Notes to Financial Statements | | | | |
| | | | |
| | | | | | December 31, 2010 | |
The tax character of distributions paid by the Fund for the period ended December 31, 2010 is as follows:
| | | | | | |
Distributions paid from: | | | | | | |
Ordinary income | | | | $ | 780,256 | |
Long-term capital gain | | | | $ | 548,644 | |
Components of Earnings
For the period ended December 31, 2010, permanent differences in book and tax accounting were reclassified. These differences had no effect on net assets and were primarily attributed to differences in the treatment of commodity related ETFs and certain other investments. The reclassifications were as follows:
| | | | |
Undistributed Net Investment Income | | Accumulated Net Realized Gain | | Paid-in Capital |
$ (1,487) | | $ 1,495 | | $ (8) |
Post October Losses
Under current tax law, capital and currency losses realized after October 31 may be deferred and treated as occurring on the first day of the following fiscal year. No capital or currency losses were deferred for the year ending December 31, 2010.
As of December 31, 2010, the components of distributable earnings on a tax basis were as follows:
| | | | |
Accumulated Capital Gains Undistributed | | Ordinary Income Undistributed | | Net Unrealized Appreciation |
$ 451,234 | | $ 369,172 | | $ 10,556,771 |
Capital Loss Carry Forwards
Accumulated capital losses noted below represent net capital loss carryovers as of December 31, 2010 that may be available to offset future realized capital gains and thereby reduce future taxable gains distributions. The Fund had no capital loss carryovers as of December 31, 2010.
Unrealized Appreciation and Depreciation on Investments
As of December 31, 2010, the costs of investments for federal income tax purposes and accumulated net unrealized appreciation/(depreciation) on investments were as follows:
| | | | | | |
Gross Appreciation
(excess of value over tax cost) | | | | $ | 10,965,966 | |
Gross Depreciation
(excess of tax cost over value) | | | | | (409,195 | ) |
Net unrealized appreciation/
(depreciation) | | | | $ | 10,556,771 | |
Cost of investments for income tax purposes | | | | $ | 60,767,177 | |
3. SECURITY TRANSACTIONS
Purchases and sales of securities, excluding short–term securities during the period ended December 31, 2010 were $72,319,951 and $51,123,689, respectively.
4. CAPITAL SHARE TRANSACTIONS
Transactions in shares of capital stock for the last two full fiscal years were as follows:
| | | | | | | | |
| | | For the Year Ended December 31, 2010 | | | For the Year Ended December 31, 2009 | |
Class A | | | | | | | | |
Shares sold | | | 130,462 | | | | N/A | |
Dividends reinvested | | | 2,115 | | | | N/A | |
Shares redeemed | | | (627 | ) | | | N/A | |
Net increase in shares outstanding | | | 131,950 | | | | N/A | |
| | | | | | | | | |
Class C | | | | | | | | |
Shares sold | | | 137,900 | | | | N/A | |
Dividends reinvested | | | 2,219 | | | | N/A | |
Net increase in shares outstanding | | | 140,119 | | | | N/A | |
| | | | | | | | | |
Class I | | | | | | | | |
Shares sold | | | 154,892 | | | | N/A | |
Dividends reinvested | | | 744 | | | | N/A | |
Net increase in shares outstanding | | | 155,636 | | | | N/A | |
| | | | | | | | | |
Class L | | | | | | | | |
Shares sold | | | 1,286,522 | | | | 1,709,014 | |
Dividends reinvested | | | 55,257 | | | | 13,072 | |
Shares redeemed | | | (486,215 | ) | | | (331,302) | |
Net increase in shares outstanding | | | 855,564 | | | | 1,390,784 | |
| | | | | | | | | |
| | | | | | |
| Notes to Financial Statements | | | | |
| | | | |
| | | | | | December 31, 2010 | |
| | | | | | | | |
| | | For the Year Ended December 31, 2010 | | | For the Year Ended December 31, 2009 | |
Investor Class | | | | | | | | |
Shares sold | | | 771,332 | | | | 1,060,950 | |
Dividends reinvested | | | 25,694 | | | | 5,717 | |
Shares redeemed | | | (234,795 | ) | | | (54,832) | |
Net increase in shares outstanding | | | 562,231 | | | | 1,011,835 | |
| | | | | | | | | |
| 5. | MANAGEMENT AND RELATED-PARTY TRANSACTIONS |
ALPS Advisors, Inc. (“AAI” or “Adviser”), subject to the authority of the Board, is responsible for the overall management and administration of the Fund’s business affairs. AAI has delegated daily management of the Fund to RiverFront Investment Group, LLC (the “Sub-Adviser”). The Sub-Adviser manages the investments of the Fund in accordance with its investment objective, policies and limitations and investment guidelines established jointly by the Adviser and the Board.
Pursuant to the Investment Advisory Agreement (the “Advisory Agreement”), the Fund pays the Adviser an annual management fee of 0.90% based on the Fund’s average daily net assets. The management fee is paid on a monthly basis. The Adviser pays the Sub-Adviser an annual sub-advisory management fee of 0.60% based on the Fund’s average daily net assets. The management fee is paid on a monthly basis.
Prior to close of business on September 24, 2010, the Predecessor Fund had an Investment Advisory Agreement with Baird Funds, Inc. for the provision of investment advisory services. Pursuant to that agreement, Baird Funds, Inc. was entitled to receive a fee, calculated daily and payable monthly, at the annual rate of 0.65% of the Predecessor Fund’s average daily net assets. Baird Funds, Inc. also maintained a Sub-Advisory Agreement with RiverFront Investment Group, LLC under which the Sub-Adviser was responsible for daily management of the Predecessor Fund. Pursuant to that Sub-Advisory Agreement, Baird Funds, Inc. was responsible for paying a sub-advisory fee at an annual rate of 0.45% of the Predecessor Fund’s average daily net assets.
The Adviser and the Sub-Adviser have contractually agreed to waive and/or reimburse fund expenses (including Acquired Fund Fees and Expenses) in order to limit the net annual operating expenses of the Fund to 0.90% of the average daily net assets for each Class of the Fund. This obligation excludes distribution and service (12b-1) fees, shareholder service fees, brokerage commissions, taxes and extraordinary expenses. Acquired Fund Fees and Expenses are expected to be indirecty incurred by the Fund as a result of its investments in investment companies and exchange-traded funds. This agreement was in effect with
Baird Funds, Inc. until September 24, 2010 and is currently in effect with the Adviser and the Sub-Adviser through December 31, 2012 and will be reevaluated on an annual basis thereafter. Each of the Adviser and the Sub-Adviser will be permitted to recover expenses it has waived or reimbursed, on a class-by-class basis, through this agreement to the extent that expenses in later periods fall below the annual limits set forth in this agreement. The Fund will not be obligated to pay any such waived or reimbursed fees and expenses more than three years after the end of the fiscal year in which the fees or expenses were waived or reimbursed. At December 31, 2010, the Adviser may seek reimbursement of previously waived and reimbursed fees as follows:
ALPS Distributors, Inc. (an affiliate of ALPS and AAI) (“ADI” or the “Distributor”) acts as the distributor of the Fund’s shares pursuant to a Distribution Agreement with the Trust. Shares are sold on a continuous basis by ADI as agent for the Fund, and ADI has agreed to use its best efforts to solicit orders for the sale of Fund shares, although it is not obliged to sell any particular amount of shares. ADI is not entitled to any compensation for its services as Distributor. ADI is registered as a broker-dealer with the Securities and Exchange Commission.
The Fund has adopted a Distribution and Services Plan (the “Plan”) pursuant to Rule 12b-1 of the 1940 Act for the Class A, Class C and Investor Class shares. The Plan allows the Fund to use Class A, Class C and Investor Class assets to pay fees in connection with the distribution and marketing of Class A, Class C and Investor Class shares and/or the provision of shareholder services to Class A, Class C and Investor Class shareholders. The Plan permits payment for services in connection with the administration of plans or programs that use Class A, Class C and Investor Class shares of the Fund, if any, as their funding medium and for related expenses. The Plan permits the Fund to make total payments at an annual rate of up to 0.25% of the Fund’s average daily net assets attributable to its Class A and Investor Class shares, if any, and 0.75% of the Fund’s average daily net assets attributable to its Class C shares. Because these fees are paid out of the Fund’s Class A, Class C and Investor Class assets, if any, on an ongoing basis, over time they will increase the cost of an investment in Class A, Class C and Investor Class shares, if any, and Plan fees may cost an investor more than other types of sales charges.
Prior to the close of business on September 24, 2010, the Predecessor Fund had a Distribution and Services Plan with Robert W. Baird & Co. Inc. that allowed it to use Investor Class assets to pay fees of up to 0.25% of the Predecessor Fund’s Investor Class average net assets in connection with the distribution and marketing of Investor Class shares and/or the provision of shareholder services to Investor Class shareholders.
| | | | | | |
| Notes to Financial Statements | | | | |
| | | | |
| | | | | | December 31, 2010 | |
The Fund has adopted a shareholder services plan (a “Shareholder Services Plan”) with respect to the Fund’s Class C shares. Under the Shareholder Services Plan, the Fund is authorized to pay banks and their affiliates and other institutions, including broker-dealers and Fund affiliates (“Participating Organizations”), an aggregate fee in an amount not to exceed on an annual basis 0.25% for Class C shares of the average daily net asset value of the Class C shares of the Fund attributable to or held in the name of a Participating Organization for its clients as compensation for providing shareholder service activities, which do not include distribution services, pursuant to an agreement with a Participating Organization.
ALPS Fund Services, Inc. (“ALPS”) (an affiliate of ADI and AAI) serves as administrator to the Fund and the Fund has agreed to pay expenses incurred in connection with its administrative activities. Pursuant to an Administrative Agreement, ALPS provides operational services to the Fund including, but not limited to fund accounting and fund administration and generally assists in the Fund’s operations. The Annual Administrative Fee is based on the Fund’s average daily net assets, annualized, and will be billed monthly, at the rate of 0.10%.
6. TRANSACTIONS WITH AFFILIATES
For the year ended December 31, 2010, the Fund recorded distributions from affiliated investment companies as affiliated dividend income, and had the following affiliated purchases and sales:
| | | | | | | | | | | | | | | | | | | | | | | | | | | | |
| Security Name | | Share Balance January 1, 2010 | | | Purchases | | | Sales | | | Share Balance December 31, 2010 | | | Dividend Income | | | Realized Loss | | | Market Value December 31, 2010 | |
| | |
Materials Select Sector SPDR ETF | | | – | | | | 16,498 | | | | – | | | | 16,498 | | | $ | 15,319 | | | $ | – | | | $ | 635,173 | |
Utilities Select Sector SPDR ETF | | | – | | | | 9,882 | | | | 9,882 | | | | – | | | | 3,021 | | | | (410 | ) | | | – | |
| | |
| | | | | | | | | | | | | | | | | | $ | 18,340 | | | $ | (410 | ) | | $ | 635,173 | |
| | |
The above securities are deemed affiliated investment companies because the Fund’s Distributor is also the distributor of the Select Sector SPDR exchange traded funds (the “Underlying Sector ETFs”). As required by exemptive relief obtained by the Underlying Sector ETFs, the Adviser will reimburse the Fund an amount equal to the distribution fee received by ADI from the Underlying Sector ETFs attributable to the Fund’s investment in the Underlying Sector ETFs, for so long as ADI acts as the distributor to the Fund and the Underlying Sector ETFs.
7. INDEMNIFICATIONS
Under the Trust’s organizational documents, its officers and Trustees are indemnified against certain liability arising out of the performance of their duties to the Trust. Additionally, in the normal course of business, the Trust enters into contracts with service providers that contain general indemnification clauses. The Trust’s maximum exposure under these arrangements is unknown, as this would involve future claims that may be made against the Trust that have not yet occurred.
| | | | | | |
| Report of Independent Registered Public Accounting Firm | | | | |
| | | | |
| | | | | | | |
To the Board of Trustees and Shareholders of Financial Investors Trust:
We have audited the accompanying statement of assets and liabilities of RiverFront Long-Term Growth Fund of Financial Investors Trust (the “Fund”), including the statement of investments, as of December 31, 2010, and the related statements of operations and changes in net assets, and the financial highlights for the year then ended. These financial statements and financial highlights are the responsibility of the Fund’s management. Our responsibility is to express an opinion on these financial statements and financial highlights based on our audit. The statement of changes in net assets for the year ended December 31, 2009 and the financial highlights for the year ended December 31, 2009 and the period October 28, 2008 (inception) through December 31, 2008, were audited by other auditors whose report, dated February 26, 2010, expressed an unqualified opinion on such statement of changes in net assets and financial highlights.
We conducted our audit in accordance with the standards of the Public Company Accounting Oversight Board (United States). Those standards require that we plan and perform the audit to obtain reasonable assurance about whether the financial statements and financial highlights are free of material misstatement. The Fund is not required to have, nor were we engaged to perform, an audit of its internal control over financial reporting. Our audit included consideration of internal control over financial reporting as a basis for designing audit procedures that are appropriate in the circumstances, but not for the purpose of expressing an opinion on the effectiveness of the Fund’s internal control over financial reporting. Accordingly, we express no such opinion. An audit also includes examining, on a test basis, evidence supporting the amounts and disclosures in the financial statements, assessing the accounting principles used and significant estimates made by management, as well as evaluating the overall financial statement presentation. Our procedures included confirmation of securities owned as of December 31, 2010, by correspondence with the custodian. We believe that our audit provides a reasonable basis for our opinion.
In our opinion, the 2010 financial statements and financial highlights referred to above present fairly, in all material respects, the financial position of RiverFront Long-Term Growth Fund of Financial Investors Trust, as of December 31, 2010, the results of its operations, the changes in its net assets, and the financial highlights for the year then ended, in conformity with accounting principles generally accepted in the United States of America.
DELOITTE & TOUCHE LLP
Denver, Colorado
February 28, 2011
| | | | | | |
| Additional Information | | | | |
| | | | |
| | | | | | December 31, 2010 (Unaudited) | |
1. FUND HOLDINGS
The Fund files its complete schedule of portfolio holdings with the Securities and Exchange Commission (the “SEC”) for the first and third quarters of each fiscal year on Form N-Q within 60 days after the end of the period. Copies of the Fund’s Form N-Q are available without charge on the SEC website at http://www.sec. gov. You may also review and copy the Form N-Q at the SEC’s Public Reference Room in Washington, D.C. For more information about the operation of the Public Reference Room, please call the SEC at 1-800-SEC-0330.
| 2. | FUND PROXY VOTING POLICIES, PROCEDURES AND SUMMARIES |
The Fund’s policies and procedures used in determining how to vote proxies and information regarding how the Fund voted proxies relating to portfolio securities during the most recent prior 12-month period ending June 30 will be available without charge, (1) upon request, by calling (866) 759-5679 and (2) on the SEC’s website at http://www.sec.gov.
3. TAX DESIGNATIONS
The Fund designates the following for federal income tax purposes for the period ended December 31, 2010:
| | | | |
Qualified Dividend Income | | | 53.26 | % |
Corporate Dividends Received Deduction | | | 54.41 | % |
Pursuant to section 852(b)(3) of the Internal Revenue Code, the Fund designates $548,644 as long-term capital gain dividends.
| 4. | DISCLOSURE REGARDING APPROVAL OF FUND ADVISORY AGREEMENT |
On June 8, 2010, the Trustees met in person to discuss, among other things, the approval of the Investment Advisory Agreement between the Trust and the Adviser (the “Advisory Agreement”) and the Investment Sub-Advisory Agreement among the Trust, the Adviser and the Sub-Adviser (the “Sub-Advisory Agreement, together with the Advisory Agreement, the “Fund Advisory Agreements”) in accordance with Section 15(a) of the 1940 Act. The Trustees were informed that the Adviser, as the investment adviser, has responsibility for the investment and management of the Fund’s assets and securities. The Independent Trustees met with independent legal counsel during executive session and discussed the Fund Advisory Agreements and other related materials.
In approving the Advisory Agreement with the Adviser and the Sub-Advisory Agreement with the Sub-Adviser, the Trustees, including the Independent Trustees, considered the following factors with respect to the Fund:
Investment Advisory Fee Rate: The Trustees reviewed and considered the contractual annual advisory fee to be paid by (a) the Trust, on behalf of the Fund, to the Adviser of 0.90% of the Fund’s daily average net assets and (b) by the Adviser to the Sub-Adviser of 0.60% of the Fund’s daily average net assets, in light of the extent and quality of the advisory services provided by the Adviser and the Sub-Adviser to the Fund.
The Board received and considered information comparing the Fund’s contractual advisory fees and overall expenses with those of funds in both the relevant expense group and universe of funds provided by Lipper, an independent provider of investment company data, as well as the Fund’s direct competitors.
Based on such information, the Trustees further determined that the contractual annual advisory fees set forth above and the total expense ratio of 1.30%, 2.05% and 1.05% for Class A, Class C and Class I shares of the Fund, taking into account the contractual fee waivers in place, is comparable to others within such Fund’s peer universe.
Nature, Extent and Quality of the Services under the Advisory Agreement and the Sub-Advisory Agreement: The Trustees received and considered information regarding the nature, extent and quality of services provided to the Fund under the Advisory Agreement and the Sub-Advisory Agreement. The Trustees reviewed certain background materials supplied by the Adviser and the Sub-Adviser in each of their presentations, including their Forms ADV.
The Trustees reviewed and considered the Adviser’s and the Sub-Adviser’s investment advisory personnel, their history as asset managers, their performance and the amount of assets currently under management by the Adviser and the Sub-Adviser. The Trustees also reviewed the research and decision-making processes utilized by the Adviser and the Sub-Adviser, including the methods adopted to seek to achieve compliance with the investment objectives, policies and restrictions of the Fund.
The Trustees considered the background and experience of the Adviser’s and the Sub-Adviser’s management in connection with the Fund, including reviewing the qualifications, backgrounds and responsibilities of the management team primarily responsible for the day-to-day portfolio management of the Fund and the extent of the resources devoted to research and analysis of actual and potential investments.
The Trustees also reviewed, among other things, the Adviser’s and the Sub-Adviser’s insider trading policies and procedures and a description of their Codes of Ethics.
| | | | | | |
| Additional Information | | | | |
| | | | |
| | | | | | December 31, 2010 (Unaudited) | |
Performance: The Trustees noted that since the Fund had not begun operations, there was no performance to be reviewed or analyzed at this time.
The Advisers’ Profitability: The Trustees received and considered a profitability analysis prepared by the Adviser based on the fees payable under the Advisory Agreement, as well as a profitability analysis prepared by the Sub-Adviser based on fees payable under the Sub-Advisory Agreement. The Trustees considered the profits, if any, anticipated to be realized by the Adviser in connection with the operation of the Fund. The Board then reviewed the Adviser’s and the Sub-Adviser’s financial statements in order to analyze the financial condition and stability and profitability of each adviser.
Economies of Scale: The Trustees considered whether economies of scale in the provision of services to the Fund were being passed along to the shareholders.
Other Benefits to the Adviser: The Trustees reviewed and considered any other benefits derived or to be derived by the Adviser and the Sub-Adviser from their relationship with the Fund, including soft dollar arrangements.
In selecting the Adviser as the Fund’s investment adviser and the Sub-Adviser as the Fund’s sub-adviser and approving the Advisory Agreement and Sub-Advisory Agreement and the fees charged under each agreement, the Trustees concluded that no single factor reviewed by the Trustees was identified by the Trustees to be determinative as the principal factor in whether to approve the Advisory Agreement and Sub-Advisory Agreement. Further, the Independent Trustees were advised by separate independent legal counsel throughout the process. The Trustees, including all of the Independent Trustees, concluded that:
| » | the investment advisory fees to be received by the Adviser with respect to the Fund were comparable to others with in the Fund’s peer universe; |
| » | the nature, extent and quality of services rendered by the Adviser under the Advisory Agreement and by the Sub-Adviser under the Sub-Advisory Agreement were adequate; |
| » | the profit, if any, anticipated to be realized by the Adviser in connection with the operation of the Fund is fair to the Trust, especially in light of the fee waiver agreement among the Trust, the Adviser and the Sub-Adviser; and |
| » | there were no material other benefits accruing to the Adviser or the Sub-Adviser in connection with its relationship with the Fund. |
Based on the Trustees’ deliberations and their evaluation of the information described above, the Trustees, including all of the Independent Trustees, concluded that the Adviser’s and the Sub-Adviser’s compensation for investment advisory services is consistent with the best interests of the Fund and its shareholders.
| | | | | | |
| Trustees and Officers | | | | |
| | | | |
| | | | | | December 31, 2010 (Unaudited) | |
| | | | | | | | | | | | |
| INDEPENDENT TRUSTEES |
Name, Address* & Age | | Position(s) Held with Fund | | | Term of Office and Length of Time Served | | Principal Occupation(s) During Past 5 Years** | | Number of Portfolios in Fund Complex Overseen by Trustees*** | | Other Directorships Held by Trustee |
Mary K. Anstine, age 70 | | | Trustee | | | Ms. Anstine was elected at a special meeting of shareholders held on March 21, 1997 and re-elected at a special meeting of shareholders held on August 7, 2009. | | Ms. Anstine was President/Chief Executive Officer of HealthONE Alliance, Denver, Colorado, and former Executive Vice President of First Interstate Bank of Denver. Ms. Anstine is also Trustee/Director of AV Hunter Trust and Colorado Uplift Board. Ms. Anstine was formerly a Director of the Trust Bank of Colorado (later purchased and now known as Northern Trust Bank), HealthONE and Denver Area Council of the Boy Scouts of America, and a member of the American Bankers Association Trust Executive Committee. | | 24 | | Ms. Anstine is a Trustee of ALPS ETF Trust (10 funds); Financial Investors Variable Insurance Trust (5 funds); Reaves Utility Income Fund (1 fund); and Westcore Trust (12 funds). |
John R. Moran, Jr., age 80 | | | Trustee | | | Mr. Moran was elected at a special meeting of shareholders held on March 21, 1997 and re-elected at a special meeting of shareholders held on August 7, 2009. | | Mr. Moran is formerly President and CEO of The Colorado Trust, a private foundation serving the health and hospital community in the state of Colorado. An attorney, Mr. Moran was formerly a partner with the firm of Kutak Rock & Campbell in Denver, Colorado and a member of the Colorado House of Representatives. Currently, Mr. Moran is a member of the Treasurer’s Investment Advisory Committee for the University of Colorado. | | 11 | | None. |
Jeremy W. Deems, age 34 | | | Trustee | | | Mr. Deems was appointed as a Trustee at the March 11, 2008 meeting of the Board of Trustees and elected at a special meeting of shareholders held on August 7, 2009. | | Mr. Deems is the Co-Founder, Chief Compliance Officer and Chief Financial Officer of Green Alpha Advisors, LLC. Prior to joining Green Alpha Advisors, Mr. Deems was CFO and Treasurer of Forward Management, LLC, an investment management company, ReFlow Management Co., LLC, a liquidity resourcing company, ReFlow Fund, LLC, a private investment fund, and Sutton Place Management, LLC, an administrative services company (from 2004 to June 2007). Prior to this, Mr. Deems served as Controller of Forward Management, LLC, ReFlow Management Co., LLC, ReFlow Fund, LLC and Sutton Place Management, LLC. | | 24 | | Mr. Deems is a Trustee of ALPS ETF Trust (10 funds); ALPS Variable Insurance Trust (1 fund); Financial Investors Variable Insurance Trust (5 funds) and Reaves Utility Income Fund (1 fund). |
| | | | | | |
| Trustees and Officers | | | | |
| | | | |
| | | | | | December 31, 2010 (Unaudited) | |
| | | | | | | | | | |
Name, Address* & Age | | Position(s) Held with Fund | | Term of Office and Length of Time Served | | Principal Occupation(s)_ During Past 5 Years** | | Number of Portfolios in Fund Complex Overseen by Trustees*** | | Other Directorships Held by Trustee |
| | | | | |
Jerry G. Rutledge, age 66 | | Trustee | | Mr. Rutledge was elected at a special meeting of shareholders held on August 7, 2009. | | Mr. Rutledge is the President and owner of Rutledge’s Inc., a retail clothing business. Mr. Rutledge is currently Director of the American National Bank. He was from 1994 to 2007 a Regent of the University of Colorado. | | 11 | | Mr. Rutledge is a Trustee of Clough Global Allocation Fund (1 fund), Clough Global Equity Fund (1 fund) and Clough Global Opportunities Fund (1 fund). |
| | | | | |
| Michael “Ross” Shell, age 40 | | Trustee | | Mr. Shell was elected at a special meeting of shareholders held on August 7, 2009. | | Mr. Shell is Founder and CEO of Red Idea, LLC, a strategic consulting/early stage venture firm (since June 2008). From 1999 to 2009, he was a part-owner and Director of Tesser, Inc., a brand agency. From December 2005 to May 2008, he was Director, Marketing and Investor Relations, of Woodbourne, a REIT/real estate hedge fund and private equity firm. Prior to this, from May 2004 to November 2005, he worked as a business strategy consultant; from June 2003 to April 2004, he was on the Global Client Services team of IDEO, a product design/ innovation firm; and from 1999 to 2003, he was President of Tesser, Inc. Mr. Shell graduated with honors from Stanford University with a degree in Political Science. | | 11 | | None. |
| * | All communications to Trustees and Officers may be directed to Financial Investors Trust c/o 1290 Broadway, Suite 1100, Denver, CO 80203. |
| ** | Except as otherwise indicated, each individual has held the office shown or other offices in the same company for the last five years. |
| *** | The Fund Complex includes all series of the Trust and any other investment companies for which ALPS Advisors, Inc. or RiverFront Investment Group, LLC provides investment advisory services. |
| | | | | | |
| Trustees and Officers | | | | |
| | | | |
| | | | | | December 31, 2010 (Unaudited) | |
| | | | | | | | | | | | |
| INTERESTED TRUSTEE |
Name, Address* & Age | | Position(s) Held with Fund | | Term of Office and Length of Time Served | | Principal Occupation(s)_ During Past 5 Years** | | Number of
Portfolios
in Fund Complex Overseen
by Trustees*** | | Other Directorships
Held by Trustee |
| | | | | |
Edmund J. Burke, age 50 | | Trustee, Chairman and President | | Mr. Burke was elected as Chairman at the August 28, 2009 meeting of the Board of Trustees. Mr. Burke was elected as Trustee at a special meeting of shareholders held on August 7, 2009. Mr. Burke was elected President of the Trust at the December 17, 2002 meeting of the Board of Trustees. | | Mr. Burke is Chief Executive Officer and a Director of ALPS Holdings, Inc. (“AHI”) (since 2005) and Director of ALPS Advisors, Inc. (“AAI”), ALPS Distributors, Inc. (“ADI”), ALPS Fund Services, Inc. (“AFS”) and FTAM Distributors, Inc. (“FDI”) and from 2001-2008, was President of AAI, ADI, AFS and FDI. Because of his positions with AHI, AAI, ADI, AFS and FDI, Mr. Burke is deemed an affiliate of the Trust as defined under the 1940 Act. Mr. Burke is Trustee and President of the Clough Global Allocation Fund (Trustee since 2006; President since 2004); Trustee and President of the Clough Global Equity Fund (Trustee since 2006; President since 2005); Trustee and President of the Clough Global Opportunities Fund (since 2006); Trustee of the Liberty All-Star Equity Fund; and Director of the Liberty All-Star Growth Fund, Inc. | | 13 | | Mr. Burke is a Trustee of Clough Global Allocation Fund (1 fund); Clough Global Equity Fund (1 fund); Clough Global Opportunities Fund (1 fund); Trustee of the Liberty All-Star Equity Fund (1 fund); and Director of the Liberty All-Star Growth Fund, Inc. (1 fund). |
| | | | | | | | | | | | |
| OFFICERS |
| | | |
Name, Address* & Age | | Position(s) Held with Funds | | Term of Office and Length of Time Served | | Principal Occupation(s)_During Past 5 Years** |
| | | |
Jeremy O. May, age 40 | | Treasurer | | Mr. May was elected Treasurer of the Trust at the October 7, 1997 meeting of the Board of Trustees. | | Mr. May joined ALPS in 1995 and is currently President and Director of AFS and Executive Vice President and Director of AHI, AAI, ADI and FDI. Because of his positions with these entities, Mr. May is deemed an affiliate of the Trust as defined under the 1940 Act. Mr. May is also the Treasurer of the Liberty All-Star Equity Fund, Liberty All- Star Growth Fund, Inc., Clough Global Allocation Fund, Clough Global Equity Fund, Clough Global Opportunities Fund, Financial Investors Trust and Financial Investors Variable Insurance Trust. Mr. May is also President, Chairman and Trustee of the ALPS Variable Insurance Trust and Chairman and Trustee of the Reaves Utility Income Fund. Mr. May is currently on the Board of Directors and is Chairman of the Audit Committee of the University of Colorado Foundation. |
| | | | | | |
| | | Trustees and Officers |
| | | | | |
| | | | | | | December 31, 2010 (Unaudited) |
| | | | | | |
Name, Address* & Age | | Position(s) Held with Funds | | Term of Office and Length of Time Served | | Principal Occupation(s) During Past 5 Years** |
| | | |
JoEllen L. Legg, age 48 | | Secretary | | Ms. Legg was elected Secretary of the Trust at the November 13, 2007 meeting of the Board of Trustees. | | Ms. Legg joined ALPS in October 2007 and is currently Vice President and Associate Counsel of ALPS, AAI, ADI and FDI. Prior to joining ALPS, Ms. Legg served as Senior Counsel - Law (Corporate & Securities) for Adelphia Communications Corporation from February 2005 to March 2007. Prior to this, Ms. Legg held associate positions at Fried Frank Harris Shriver & Jacobson LLP (1998 - 2004) and at Patton Boggs LLP (2004 - 2005). Because of her position with ALPS, Ms. Legg is deemed an affiliate of the Trust as defined under the 1940 Act. Ms. Legg is also the Secretary of the Transparent Value Trust and Assistant Secretary of the Stone Harbor Investment Funds and WesMark Funds. |
| | | |
Ted Uhl, age 35 | | Chief Compliance Officer (“CCO”) | | Mr. Uhl was appointed CCO of the Trust at the June 8, 2010 meeting of the Board of Trustees. | | Mr. Uhl joined ALPS in October 2006, and is currently Deputy Compliance Officer of ALPS. Prior to his current role, Mr. Uhl served as Senior Risk Manager for ALPS from October 2006 until June 2010. Before joining ALPS, Mr. Uhl served a Sr. Analyst with Enenbach and Associates (RIA), and a Sr. Financial Analyst at Sprint. Because of his position with ALPS, Mr. Uhl is deemed an affiliate of the Trust as defined under the 1940 Act. |
| | | |
Kimberly R. Storms, age 38 | | Assistant Treasurer | | Ms. Storms was elected Assistant Treasurer of the Trust at the June 14, 2005 meeting of the Board of Trustees. | | Ms. Storms is Senior Vice President - Director of Fund Administration of ALPS. Ms. Storms joined ALPS in 1998 as Assistant Controller. Because of her position with ALPS, Ms. Storms is deemed an affiliate of the Trust as defined under the 1940 Act. Ms. Storms is also Treasurer of ALPS ETF Trust and ALPS Variable Insurance Trust; Assistant Treasurer of Liberty All-Star Equity Fund and Liberty All-Star Growth Fund, Inc.; and Assistant Secretary of Ameristock Mutual Fund, Inc. |
| | | |
Monette R. Nickels, age 40 | | Tax Officer | | Ms. Nickels was elected Tax Officer of the Trust at the December 8, 2009 meeting of the Board of Trustees. | | Ms. Nickels is Senior Vice President and Director of Tax Administration of ALPS. Ms. Nickels joined ALPS in 2004 as Director of Tax Administration. Because of her position with ALPS, Ms. Nickels is deemed an affiliate of the Trust as defined under the 1940 Act. Ms. Nickels is also Tax Officer of ALPS Variable Insurance Trust, ALPS ETF Trust, Liberty All-Star Equity Fund, Liberty All-Star Growth Fund, Inc., Reaves Utility Income Fund, Clough Global Allocation Fund, Clough Global Opportunities Fund, Clough Global Equity Fund and Financial Investors Variable Insurance Trust. |
| * | All communications to Trustees and Officers may be directed to Financial Investors Trust c/o 1290 Broadway, Suite 1100, Denver, CO 80203. |
| ** | Except as otherwise indicated, each individual has held the office shown or other offices in the same company for the last five years. |
| *** | The Fund Complex includes all series of the Trust and any other investment companies for which ALPS Advisors, Inc. or RiverFront Investment Group, LLC provides investment advisory services. |

Item 2. Code of Ethics.
| | (a) | The Registrant, as of the end of the period covered by this report, has adopted a code of ethics that applies to the Registrant’s principal executive officer, principal financial officer, principal accounting officer or controller or any persons performing similar functions on behalf of the Registrant. |
| | (c) | During the period covered by this report, no amendments to the provisions of the code of ethics adopted in Item 2(a) above were made. |
| | (d) | During the period covered by this report, no implicit or explicit waivers to the provisions of the code of ethics adopted in Item 2(a) above were granted. |
| | (f) | The Registrant’s Code of Ethics is attached as an Exhibit hereto. |
Item 3. Audit Committee Financial Expert.
The Board of Trustees of the Registrant has determined that the Registrant has at least one Audit Committee Financial Expert serving on its audit committee. The Board of Trustees of the Registrant has designated Jeremy W. Deems as the Registrant’s “Audit Committee Financial Expert.” Mr. Deems is “independent” as defined in paragraph (a)(2) of Item 3 to Form N-CSR.
Item 4. Principal Accountant Fees and Services.
| | (a) | Audit Fees: For the fiscal years ended December 31, 2009 and December 31, 2010, with respect to the RiverFront Long-Term Growth Fund, a series of the Registrant, the aggregate fees billed for professional services rendered by the principal accountant for the audit of the RiverFront Long-Term Growth Fund’s annual financial statements were $0 and $20,980, respectively. |
| | (b) | Audit-Related Fees: For the fiscal years ended December 31, 2009 and December 31, 2010, with respect to the RiverFront Long-Term Growth Fund, a series of the Registrant, the aggregate fees billed for professional services rendered by the principal accountant for the verification of the RiverFront Long-Term Growth |
| | Fund’s securities and similar investments in accordance with Rule 17f-2 under the Investment Company Act of 1940 were $0 and $20,000, respectively. |
| | (c) | Tax Fees: For the fiscal years ended December 31, 2009 and December 31, 2010, with respect to the RiverFront Long-Term Growth Fund, a series of the Registrant, the aggregate fees billed for professional services rendered by the principal accountant for tax compliance, tax advice and tax planning were $0 and $980, respectively. The fiscal year 2009 and 2010 tax fees were for services for dividend calculation, excise tax preparation and tax return preparation. |
| | (d) | All Other Fees: For the fiscal years ended December 31, 2009 and December 31, 2010, with respect to the RiverFront Long-Term Growth Fund, a series of the Registrant, no fees were billed to Registrant by the principal accountant for services to the RiverFront Long-Term Growth Fund other than the services reported in paragraphs (a) through (c) of this Item. |
| | (e)(1) | Audit Committee Pre-Approval Policies and Procedures: All services to be performed by the Registrant’s principal accountant must be pre-approved by the Registrant’s audit committee. |
| | (e)(2) | No services described in paragraphs (b) through (d) of this Item were approved by the Registrant’s audit committee pursuant to paragraph (c)(7)(i)(C) of Rule 2-01 of Regulation S-X. |
| | (g) | The aggregate non-audit fees billed by the Registrant’s accountant in each of the last two fiscal years of the RiverFront Long-Term Growth Fund, a series of the Registrant, were $0 in 2009 and $2,980 in 2010. These fees consisted of non-audit fees billed to (i) the Registrant of $0 in 2009 and $980 in 2010 as described in response to paragraph (c) above and (ii) to ALPS Fund Services, Inc. (“AFS”), an entity under common control with ALPS Advisors, Inc., the Registrant’s investment adviser, of $0 in 2009 and $2,000 in 2010. The non-audit fees billed to AFS related to SAS 70 services and other compliance-related matters. |
| | (h) | The Registrant’s audit committee has considered whether the provision of non-audit services that were rendered to the Registrant’s investment adviser (not including any sub-adviser whose role is primarily portfolio management and is subcontracted with or overseen by another investment adviser), and any entity controlling, controlled by, or under common control with the investment adviser that provides ongoing services to the Registrant that were not pre-approved pursuant to paragraph (c)(7)(ii) of Rule 2-01 of Regulation S-X, is compatible with maintaining the principal accountant’s independence. The Registrant’s audit committee determined that the provision of such non-audit services is compatible with maintaining the principal accountant’s independence. |
| Item 5. | Audit Committee of Listed Registrants. |
Not applicable.
| | (a) | Schedule of Investments in securities of unaffiliated issuers as of the close of the reporting period is included as part of the Reports to Stockholders filed under Item 1 of this Form N-CSR. |
| Item 7. | Disclosure of Proxy Voting Policies and Procedures for Closed-End Management Investment Companies. |
Not applicable to Registrant.
| Item 8. | Portfolio Managers of Closed-End Management Investment Companies. |
Not applicable to Registrant.
| Item 9. | Purchases of Equity Securities by Closed-End Management Investment Company and Affiliated Purchasers. |
Not applicable to Registrant.
| Item 10. | Submission of Matters to a Vote of Security Holders. |
There have been no material changes to the procedures by which shareholders may recommend nominees to the Registrant’s Board of Trustees, where those changes were implemented after the Registrant last provided disclosure in response to the requirements of Item 407(c)(2) of Regulation S-K, or this Item.
| Item 11. | Controls and Procedures. |
| | (a) | The Registrant’s principal executive officer and principal financial officer have concluded that the Registrant’s disclosure controls and procedures (as defined in Rule 30a-3(c) under the Investment Company Act of 1940, as amended) are effective based on their evaluation of these controls and procedures as of a date within 90 days of the filing date of this report. |
| | (b) | There was no change in the Registrant’s internal control over financial reporting (as defined in Rule 30a-3(d) under the Investment Company Act of 1940, as amended) during the second fiscal quarter of the period covered by this report that has materially affected, or is reasonably likely to materially affect, the Registrant’s internal control over financial reporting. |
Item 12. Exhibits.
| | | | |
| | (a)(1) | | Registrant’s Code of Ethics for Senior Financial Officers, which is the subject of the disclosure required by Item 2 of Form N-CSR, was filed as Exhibit 12(a)(1) to the Registrant’s Certified Shareholder Report on Form N-CSR, File No. 811-8194, on July 7, 2008. |
| | |
| | (a)(2) | | The certifications required by Rule 30a-2(a) of the Investment Company Act of 1940, as amended, and Section 302 of the Sarbanes-Oxley Act of 2002 are attached hereto as Exhibit 99.Cert. |
| | |
| | (a)(3) | | Not applicable. |
| | |
| | (b) | | The certifications by the Registrant’s principal executive officer and principal financial officer, as required by Rule 30a-2(b) of the Investment Company Act of 1940, as amended, and Section 906 of the Sarbanes-Oxley Act of 2002 are attached hereto as Exhibit 99.906Cert. |
SIGNATURES
Pursuant to the requirements of the Securities Exchange Act of 1934 and the Investment Company Act of 1940, the Registrant has duly caused this report to be signed on its behalf by the undersigned, thereunto duly authorized.
FINANCIAL INVESTORS TRUST
| | |
By: | | /s/ Edmund J. Burke |
| | Edmund J. Burke (Principal Executive Officer) |
| | President |
| |
Date: | | March 7, 2011 |
Pursuant to the requirements of the Securities Exchange Act of 1934 and the Investment Company Act of 1940, this report has been signed below by the following persons on behalf of the Registrant and in the capacities and on the dates indicated.
| | |
FINANCIAL INVESTORS TRUST |
| |
By: | | /s/ Edmund J. Burke |
| | Edmund J. Burke (Principal Executive Officer) |
| | President |
| |
Date: | | March 7, 2011 |
| |
By: | | /s/ Jeremy O. May |
| | Jeremy O. May (Principal Financial Officer) |
| | Treasurer |
| |
Date: | | March 7, 2011 |