UNITED STATES
SECURITIES AND EXCHANGE COMMISSION
Washington, D.C. 20549
FORM N-CSR
CERTIFIED SHAREHOLDER REPORT OF REGISTERED
MANAGEMENT INVESTMENT COMPANIES
Investment Company Act file number | 811-8194 |
|
FINANCIAL INVESTORS TRUST |
(Exact name of registrant as specified in charter) |
|
1290 Broadway, Suite 1100, Denver, Colorado | | 80203 |
(Address of principal executive offices) | | (Zip code) |
|
JoEllen L. Legg, Secretary Financial Investors Trust 1290 Broadway, Suite 1100 Denver, Colorado 80203 |
(Name and address of agent for service) |
|
Registrant’s telephone number, including area code: | 303-623-2577 | |
|
Date of fiscal year end: | December 31 | |
|
Date of reporting period: | January 1, 2009 – December 31, 2009 | |
| | | | | | | | | |
Item 1. Reports to Stockholders.
Table of Contents
December 31, 2009
Contents | | Page |
| | |
Shareholder Letter | | 2 |
| | |
Disclosure of Fund Expenses | | 3 |
| | |
Manager Commentary | | 4 |
| | |
Statement of Investments | | 6 |
| | |
Statement of Assets and Liabilities | | 9 |
| | |
Statement of Operations | | 10 |
| | |
Statements of Changes in Net Assets | | 11 |
| | |
Financial Highlights | | 12 |
| | |
Notes to Financial Statements | | 14 |
| | |
Report of Independent Registered Public Accounting Firm | | 19 |
| | |
Additional Information | | 20 |
| | |
Trustees & Officers | | 23 |
Annual Report | December 31, 2009
1
Shareholder Letter
December 31, 2009 (Unaudited)
Market Comment
After a tumultuous start, US equities finished 2009 near their highs for the year and recorded a third consecutive quarter of gains. Throughout the year, extraordinary government measures helped to stabilize global economies and markets, and as the year progressed, low interest rates, better-than-expected corporate earnings, and improving economic data provided a favorable backdrop for equities.
Growth stocks outpaced value for the period as measured by the Russell 1000 Growth Index [37.21%] versus the Russell 1000 Value Index [19.69%] . The Russell 1000 Value rose sharply and performance was positive across all sectors. Materials (62.98%), Information Technology (58.33%), and Consumer Discretionary (49.88%) stocks led the market higher, while Energy (9.46%) and Telecommunications (9.46%) lagged the Russell 1000 Value Index.
Fund Review
Despite the highly volatile market environment, the Activa Value Fund Class A Shares [19.24%, net of expenses] performed roughly in line with the Russell 1000 Value Index [19.69%] ..
The Sub-Adviser focuses on adding value through stock selection within sectors; with sector weights managed within +/-3% of those of the Russell 1000 Value Index. To complement fundamental security analysis research, the Sub-Adviser also uses an internally-developed, quantitative analytical approach.
During the year, the Fund’s investment approach produced positive benchmark-relative results in five of the ten broad market sectors. Stock selection within the Financials, Energy, and Industrials sectors was strong. Relative strength was modestly offset by weak stock selection within the Consumer Discretionary, Health Care, and Information Technology sectors.
Strong security selection in the Financials sector was additive to the Fund’s relative returns. Top relative contributors included diversified financial firms Citigroup and Morgan Stanley and investment management firm Ameriprise Financial. Citigroup, a global financial services firm, stock fell as fears mounted that the company would require additional capital from the government; these fears were well-founded as the government provided a capital injection in the early half of the year. We eliminated the stock early in the period which contributed to relative performance. Ameriprise Financial, Inc. provides financial planning, asset management, and insurance services to individuals, businesses, and institutions. They expect significant accretion from the acquisition of Columbia Management from Bank of America. This acquisition will transform Ameriprise Financial into a much bigger presence in long term asset management business.
Morgan Stanley is a financial service provider to corporations and individuals worldwide. After a dismal 2008, signs of stability in the inter bank lending market and a nascent revival in the capital markets created optimism in its shares. We eliminated our position in Morgain Stanley during the latter half of the year on soft revenue and earnings numbers and a sense that the company’s valuation no longer fully reflected the headwinds it faced. Within the Energy sector, Occidental Petroleum aided relative performance. Occidental Petroleum shares rose in the early half of the year on the announcement that they had signed a Development and Production Sharing Agreement (DPSA) with the National Oil and Gas Authority of Bahrain (NOGA) for the further development of the Bahrain Field. The shares continued to climb in the later half of the year as well on the announcement that they signed an agreement to purchase Phibro LLC, a leading commodities trading firm, from Citigroup Inc.
Consumer Discretionary holdings underperformed during the period, due to poor performance from office supplier Office-Max and private education provider Apollo Group. We eliminated our holding in OfficeMax early in the year after downward revisions in our analysts earning expectations. Shares of Apollo Group, a for-profit educational services provider, fell after the firm announced an informal SEC investigation into its revenue recognition practices. We have continued to hold the stock as we expect the investigation will not result in any drastic changes to revenue recognition.
Outlook
We expect that inexpensive stocks with improving fundamentals will continue to outperform as long as the economic backdrop remains constructive. We believe the US economy will likely experience tepid growth for 2010 and top line growth for most US companies could likely face some headwinds.
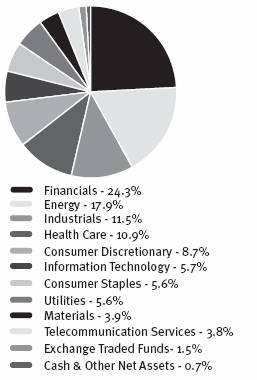
The Fund focuses on stock selection as the key driver of returns and uses proprietary fundamental and quantitative research in a disciplined framework to build a portfolio of the most attractive stocks. We are confident this unique investment process will continue to provide shareholders with consistent and style pure investment results. Sector exposures are residuals from this bottom-up stock selection process and are not explicit management decisions. Based on individual stock decisions, the Fund ended the period most overweight the Health Care, Industrials, and Information Technology sectors and most underweight Telecommunication Services, Utilities, and Consumer Discretionary relative to the Russell 1000 Value Index, the Fund’s benchmark.
Mammen Chally, CFA*
Vice President and Equity Portfolio Manager
Wellington Management Company, LLP
*CFA is a trademark owned by the CFA Institute.
Activa Value Fund
2
Disclosure of Fund Expenses
December 31, 2009 (Unaudited)
As a shareholder of Activa Value Fund (the “Fund”), you will incur two types of costs: (1) transaction costs, including applicable sales charges (loads); and (2) ongoing costs, including management fees, distribution and service (12b-1) fees, shareholder service fees and other Fund expenses. The following examples are intended to help you understand your ongoing costs (in dollars) of investing in the Fund and to compare these costs with the ongoing costs of investing in other mutual funds. The examples are based on an investment of $1,000 invested on July 1, 2009 and held until December 31, 2009.
Actual Expenses. The first line of the table on the next page provides information about actual account values and actual expenses. You may use the information in this line, together with the amount you invested, to estimate the expenses that you paid over the period. Simply divide your account value by $1,000 (for example, an $8,600 account value divided by $1,000 = 8.6), then multiply the result by the number in the first line under the heading “Expenses Paid During Period” to estimate the expenses you paid on your account during this period.
Hypothetical Example for Comparison Purposes. The second line of the table on the next page provides information about hypothetical account values and hypothetical expenses based on the Fund’s actual expense ratio and an assumed rate of return of 5% per year before expenses, which is not the Fund’s actual return. The hypothetical account values and expenses may not be used to estimate the actual ending account balance or expenses you paid for the period. You may use this information to compare the ongoing costs of investing in the Fund and other mutual funds. To do so, compare this 5% hypothetical example with the 5% hypothetical examples that appear in the shareholder reports of the other funds.
The expenses shown in the table are meant to highlight ongoing Fund costs only and do not reflect transaction fees, such as sales charges or exchange fees. Therefore, the second line of the table on the next page is useful in comparing ongoing costs only, and may not help you determine the relative total costs of owning different funds. In addition, if these transactional costs were included, your costs would have been higher.
The examples are based on an investment of $1,000 invested on July 1, 2009 and held until December 31, 2009.
| | | | | | Expenses Paid | |
| | Beginning Account | | Ending Account | | During Period | |
| | Value 7/1/09 | | Value 12/31/09 | | 7/1/09-12/31/09* | |
Class A | | | | | | | |
Actual Fund Return | | $ | 1,000.00 | | $ | 1,196.40 | | $ | 9.63 | |
Hypothetical Fund Return | | $ | 1,000.00 | | $ | 1,016.43 | | $ | 8.84 | |
| | | | | | | |
Class I | | | | | | | |
Actual Fund Return | | $ | 1,000.00 | | $ | 1,200.00 | | $ | 8.32 | |
Hypothetical Fund Return | | $ | 1,000.00 | | $ | 1,017.64 | | $ | 7.63 | |
* Expenses are equal to the Fund’s annualized expense ratio, of 1.74% or 1.50% for Class A or Class I shares, respectively, mul- tiplied by the average account value over the period, multiplied by the number of days in the most recent fiscal half year (184), then divided by 365.
3
Manager Commentary
December 31, 2009 (Unaudited)
Average Annual Total Returns (as of December 31, 2009)
| | | | | | | | Expense Ratios* | |
| | 1 Year | | 5 Year | | 10 Year | | Gross | | Net** | |
Activa Class A | | 19.24 | % | 0.00 | % | 2.56 | % | 1.53 | % | 1.40 | % |
Activa Class I*** | | 19.59 | % | 0.14 | % | 2.69 | % | 1.28 | % | 1.15 | % |
S&P 500 Index(1) | | 26.46 | % | 0.42 | % | -0.95 | % | — | | — | |
Russell 1000 Value Index(2) | | 19.69 | % | -0.25 | % | 2.47 | % | — | | — | |
Performance data quoted represents past performance. Past performance does not guarantee future results. Investment return and principal value of an investment will fluctuate so that an investor’s shares, when sold or redeemed, may be worth more or less than the original cost. Current performance data may be higher or lower than actual data quoted. The performance data shown does not reflect the deduction of the sales load or fee, and that, if reflected, the load or fee would reduce the performance quoted. For the most current month-end performance data, please visit www.activafunds.com.
On August 29, 2009, the Activa Value Fund, a series of the Activa Mutual Fund Trust (the “Predecessor Fund”), reorganized into the Fund. The Predecessor Fund was advised by Activa Asset Management LLC and sub-advised by Wellington Management Company, LLP, the Fund’s sub-adviser. The Fund’s performance for periods prior to August 29, 2009 is that of the Predecessor Fund.
The table does not reflect the deduction of taxes that a shareholder would pay on Fund distributions or the redemption of fund shares.
Inception date of predecessor Fund — 8/10/71.
Subject to investment risks, including possible loss of the principal amount invested. Derivatives generally are more sensitive to changes in economic or market conditions than other types of investments; this could result in losses that significantly exceed the funds original investment.
*The gross and net expense ratios are as stated in the “Fees and Expenses of the Fund” in the Fund’s current prospectus.
**ALPS Advisors, Inc. (the “Adviser”) has given a contractual agreement to the Fund to limit the amount of the Fund’s total annual expenses, exclusive of Distribution and Service (12b-1) Fees, Acquired Fund Fees and Expenses, brokerage expenses, interest expense, taxes and extraordinary expenses, to 1.15% of the Fund’s average daily net assets. This agreement is in effect from July 23, 2009 through August 31, 2011 and is reevaluated on an annual basis. Without this agreement, expenses would be higher. The Adviser will be permitted to recover, on a class-by-class basis, expenses it has borne through the agreement described above to the extent that the Fund’s expenses in later periods fall below the annual rates set forth in the relevant agreement. The Fund will not be obligated to pay any such deferred fees and expenses more than one year after the end of the fiscal year in which the fee and expense was deferred.
***Prior to close of business on August 28, 2009, Class I was known as Class R.
Top Ten Holdings^
Exxon Mobil Corp. | | 4.2 | % |
AT&T Inc. | | 3.8 | % |
Wells Fargo & Co. | | 3.5 | % |
JPMorgan Chase & Co. | | 3.4 | % |
Pfizer, Inc. | | 3.2 | % |
General Electric Co. | | 3.1 | % |
Bank of America Corp. | | 2.7 | % |
ConocoPhillips | | 2.5 | % |
Occidental Petroleum Corp. | | 2.4 | % |
The Goldman Sachs Group, Inc. | | 2.1 | % |
Top Ten Holdings | | 30.9 | % |
Total Number of Holdings | | 95 | |
^Holdings are subject to change.
Industry Sector Allocation
4
Performance of $10,000 Initial Investment as of 12/31/09
Comparison of change in value of a $10,000 investment
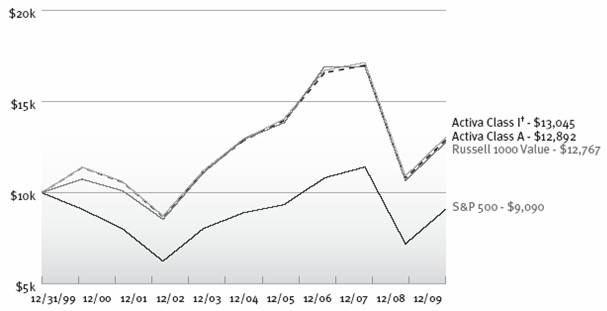
Source: Morningstar
The chart above represents historical performance of a hypothetical investment of $10,000 in the Fund since inception. Past performance does not guarantee future results. This chart does not reflect the deduction of taxes that a shareholder would pay on Fund distributions or the redemption of Fund shares. For the most current month-end performance data, please visit www.activafunds.com.
On August 29, 2009, the Activa Value Fund, a series of the Activa Mutual Fund Trust (the “Predecessor Fund”), reorganized into the Fund. The Predecessor Fund was advised by Activa Asset Management LLC and sub-advised by Wellington Management Company, LLP, the Fund’s sub-adviser. The Fund’s performance for periods prior to August 29, 2009 is that of the Predecessor Fund.
† Prior to close of business on August 28, 2009, Class I was known as Class R.
(1) The S&P 500 Index is the Standard & Poor’s composite index of 500 stocks, a widely recognized, unmanaged index of common stock prices. You cannot invest directly in an index.
(2) The Russell 1000 Value Index measures the performance of those Russell 1000 companies with lower price-to-book ratios and lower forecasted growth values. You cannot invest directly in an index.
5
Statement of Investments
December 31, 2009
| | | | Market Value | |
| | Shares | | (Note 1) | |
| | | | | |
COMMON STOCKS (97.86%) | | | | | |
Consumer Discretionary (8.67%) | | | | | |
Automobiles & Components (1.93%) | | | | | |
Ford Motor Co.(1) | | 107,200 | | $ | 1,072,000 | |
TRW Automotive Holdings Corp.(1) | | 18,700 | | 446,556 | |
| | | | 1,518,556 | |
Consumer Durables & Apparel (0.57%) | | | | | |
Whirlpool Corp. | | 5,600 | | 451,696 | |
| | | | | |
Consumer Services (0.61%) | | | | | |
Apollo Group, Inc., Class A(1) | | 7,900 | | 478,582 | |
| | | | | |
Media (2.76%) | | | | | |
Time Warner Cable, Inc. | | 24,339 | | 1,007,391 | |
Time Warner, Inc. | | 40,000 | | 1,165,600 | |
| | | | 2,172,991 | |
Retailing (2.80%) | | | | | |
Best Buy Co. Inc | | 10,100 | | 398,546 | |
Office Depot, Inc.(1) | | 74,800 | | 482,460 | |
The Gap, Inc. | | 63,200 | | 1,324,040 | |
| | | | 2,205,046 | |
| | | | | |
TOTAL CONSUMER DISCRETIONARY | | | | 6,826,871 | |
| | | | | |
Consumer Staples (5.64%) | | | | | |
Food & Staples Retailing (0.75%) | | | | | |
BJ’s Wholesale Club, Inc.(1) | | 18,000 | | 588,780 | |
| | | | | |
Food, Beverage & Tobacco (4.12%) | | | | | |
Altria Group, Inc. | | 25,900 | | 508,417 | |
Archer-Daniels-Midland Co. | | 23,300 | | 729,523 | |
Coca-Cola Enterprises, Inc. | | 18,900 | | 400,680 | |
Dr Pepper Snapple Group, Inc. | | 12,400 | | 350,920 | |
Philip Morris International, Inc. | | 18,925 | | 911,996 | |
Smithfield Foods, Inc.(1) | | 22,500 | | 341,775 | |
| | | | 3,243,311 | |
Household & Personal Products (0.77%) | | | | | |
Kimberly-Clark Corp. | | 9,600 | | 611,616 | |
| | | | | |
TOTAL CONSUMER STAPLES | | | | 4,443,707 | |
| | | | | |
Energy (17.95%) | | | | | |
Energy (17.95%) | | | | | |
Apache Corp. | | 1,800 | | 185,706 | |
Baker Hughes, Inc. | | 13,900 | | 562,672 | |
Chevron Corp. | | 13,819 | | 1,063,925 | |
ConocoPhillips | | 39,200 | | 2,001,944 | |
EOG Resources, Inc. | | 4,800 | | 467,040 | |
Exxon Mobil Corp. | | 49,064 | | 3,345,674 | |
Hess Corp. | | 13,300 | | 804,650 | |
Marathon Oil Corp. | | 43,900 | | 1,370,558 | |
Nabors Industries, Ltd.(1) | | 37,600 | | 823,064 | |
National Oilwell Varco, Inc. | | 23,200 | | 1,022,888 | |
Occidental Petroleum Corp. | | 23,200 | | 1,887,320 | |
XTO Energy, Inc. | | 12,900 | | 600,237 | |
| | | | | |
TOTAL ENERGY | | | | 14,135,678 | |
| | | | | |
Financials (24.31%) | | | | | |
Banks (5.87%) | | | | | |
Comerica, Inc. | | 16,460 | | 486,722 | |
PNC Financial Services Group, Inc. | | 13,100 | | 691,549 | |
US Bancorp | | 29,000 | | 652,790 | |
Wells Fargo & Co. | | 103,400 | | 2,790,766 | |
| | | | 4,621,827 | |
Diversified Financials (9.73%) | | | | | |
Ameriprise Financial, Inc. | | 30,900 | | 1,199,538 | |
Bank of America Corp. | | 141,312 | | 2,128,159 | |
JPMorgan Chase & Co. | | 63,400 | | 2,641,879 | |
The Goldman Sachs Group, Inc. | | 10,000 | | 1,688,400 | |
| | | | 7,657,976 | |
Insurance (6.27%) | | | | | |
ACE, Ltd.(1) | | 20,200 | | 1,018,080 | |
Allied World Assurance Co. Holdings, Ltd. | | 10,400 | | 479,128 | |
Axis Capital Holdings, Ltd. | | 19,900 | | 565,359 | |
Everest Re Group Ltd. | | 5,700 | | 488,376 | |
Genworth Financial, Inc.(1) | | 31,400 | | 356,390 | |
Hartford Financial Services Group, Inc. | | 19,600 | | 455,896 | |
Prudential Financial, Inc. | | 12,400 | | 617,024 | |
The Travelers Cos, Inc. | | 11,300 | | 563,418 | |
Unum Group | | 20,200 | | 394,304 | |
| | | | 4,937,975 | |
| | | | | | |
6
| | | | Market Value | |
| | Shares | | (Note 1) | |
| | | | | |
Real Estate (2.44%) | | | | | |
Annaly Capital Management, Inc. | | 36,100 | | $ | 626,335 | |
Forest City Enterprises, Inc.(1) | | 38,500 | | 453,530 | |
Health Care REIT, Inc. | | 9,100 | | 403,312 | |
Vornado Realty Trust | | 6,222 | | 435,200 | |
| | | | 1,918,377 | |
| | | | | |
TOTAL FINANCIALS | | | | 19,136,155 | |
| | | | | |
Health Care (10.88%) | | | | | |
Health Care Equipment & Services (2.81%) | | | | | |
McKesson Corp. | | 10,100 | | 631,250 | |
UnitedHealth Group, Inc. | | 23,500 | | 716,280 | |
WellPoint, Inc.(1) | | 14,900 | | 868,521 | |
| | | | 2,216,051 | |
Pharmaceuticals, Biotechnology & Life Sciences (8.07%) | | | | | |
Amgen, Inc.(1) | | 15,400 | | 871,178 | |
Eli Lilly & Co. | | 32,000 | | 1,142,720 | |
Forest Laboratories, Inc.(1) | | 13,028 | | 418,329 | |
Johnson & Johnson | | 7,700 | | 495,957 | |
Merck & Co. Inc | | 23,800 | | 869,652 | |
Pfizer, Inc. | | 140,323 | | 2,552,475 | |
| | | | 6,350,311 | |
| | | | | |
TOTAL HEALTH CARE | | | | 8,566,362 | |
| | | | | |
Industrials (11.48%) | | | | | |
Capital Goods (9.89%) | | | | | |
3M Co. | | 5,000 | | 413,350 | |
Caterpillar, Inc. | | 11,100 | | 632,589 | |
Dover Corp. | | 18,000 | | 748,980 | |
General Dynamics Corp. | | 12,500 | | 852,125 | |
General Electric Co. | | 163,800 | | 2,478,294 | |
Oshkosh Corp. | | 9,300 | | 344,379 | |
Parker Hannifin Corp. | | 11,300 | | 608,844 | |
Raytheon Co. | | 11,100 | | 571,872 | |
United Technologies Corp. | | 16,400 | | 1,138,324 | |
| | | | 7,788,757 | |
Commercial & Professional Services (0.75%) | | | | | |
Manpower, Inc. | | 3,200 | | 174,656 | |
RR Donnelley & Sons Co. | | 18,700 | | 416,449 | |
| | | | 591,105 | |
Transportation (0.84%) | | | | | |
FedEx Corp. | | 7,900 | | 659,255 | |
| | | | | |
TOTAL INDUSTRIALS | | | | 9,039,117 | |
| | | | | |
Information Technology (5.68%) | | | | | |
Semiconductors & Semiconductor Equipment (1.63%) | | | | | |
Texas Instruments, Inc. | | 17,100 | | 445,626 | |
Xilinx, Inc. | | 33,300 | | 834,498 | |
| | | | 1,280,124 | |
Software & Services (2.92%) | | | | | |
Accenture PLC | | 19,100 | | 792,650 | |
Automatic Data Processing, Inc. | | 9,600 | | 411,072 | |
Microsoft Corp. | | 27,000 | | 823,230 | |
The Western Union Co. | | 14,600 | | 275,210 | |
| | | | 2,302,162 | |
Technology Hardware & Equipment (1.13%) | | | | | |
International Business Machines Corp. | | 3,700 | | 484,330 | |
Seagate Technology | | 22,100 | | 401,999 | |
| | | | 886,329 | |
| | | | | |
TOTAL INFORMATION TECHNOLOGY | | | | 4,468,615 | |
| | | | | |
Materials (3.88%) | | | | | |
Materials (3.88%) | | | | | |
Freeport-McMoRan Copper & Gold, Inc.(1) | | 8,600 | | 690,494 | |
International Paper Co. | | 25,100 | | 672,178 | |
Owens-Illinois, Inc.(1) | | 11,500 | | 378,005 | |
Reliance Steel & Aluminum Co. | | 9,000 | | 388,980 | |
The Mosaic Co. | | 9,300 | | 555,489 | |
Valspar Corp. | | 13,600 | | 369,104 | |
| | | | | |
TOTAL MATERIALS | | | | 3,054,250 | |
| | | | | |
Telecommunication Services (3.76%) | | | | | |
Telecommunication Services (3.76%) | | | | | |
AT&T Inc. | | 105,645 | | 2,961,229 | |
| | | | | |
TOTAL TELECOMMUNICATION SERVICES | | | | 2,961,229 | |
| | | | | | |
7
| | | | Market Value | |
| | Shares | | (Note 1) | |
| | | | | |
Utilities (5.61%) | | | | | |
Utilities (5.61%) | | | | | |
CenterPoint Energy, Inc. | | 30,300 | | $ | 439,653 | |
DPL, Inc. | | 11,300 | | 311,880 | |
Entergy Corp. | | 4,700 | | 384,648 | |
Exelon Corp. | | 16,100 | | 786,807 | |
FirstEnergy Corp. | | 11,100 | | 515,595 | |
FPL Group, Inc. | | 6,500 | | 343,330 | |
UGI Corp. | | 47,800 | | 1,156,282 | |
Xcel Energy, Inc. | | 22,400 | | 475,552 | |
| | | | | |
TOTAL UTILITIES | | | | 4,413,747 | |
| | | | | |
TOTAL COMMON STOCKS
(Cost $73,528,990) | | | | 77,045,731 | |
| | | | | |
EXCHANGE TRADED FUNDS (1.51%) | | | | | |
Equity Fund (1.51%) | | | | | |
iShares Russell 1000 Value Index Fund | | 20,700 | | 1,187,973 | |
| | | | | |
TOTAL EXCHANGE TRADED FUNDS
(Cost $1,156,896) | | | | 1,187,973 | |
| | | | | | |
| | | | | |
7-Day Yield | | | | | |
| | | | | |
SHORT TERM INVESTMENTS (0.67%) | | | | | |
Money Market Fund (0.67%) | | | | | |
Fidelity Institutional Money Market Portfolio - Class I 0.25% | | 523,853 | | 523,853 | |
| | | | | |
TOTAL MONEY MARKET FUND | | | | 523,853 | |
| | | | | |
TOTAL SHORT TERM INVESTMENTS
(COST $523,853) | | | | 523,853 | |
| | | | | |
TOTAL INVESTMENTS (100.04%)
(COST $75,209,739) | | | | $ | 78,757,557 | |
| | | | | |
OTHER LIABILITIES IN EXCESS OF ASSETS (-0.04%) | | | | (29,234 | ) |
| | | | | |
NET ASSETS (100.00%) | | | | $ | 78,728,323 | |
(1) Non-Income Producing Security.
Common Abbreviations:
Ltd. - Limited
PLC - Public Limited Company
REIT - Real Estate Investment Trust
For Fund compliance purposes, the Fund’s industry classifications refer to any one or more of the industry sub-classifications used by one or more widely recognized market indexes or ratings group indexes, and/or as defined by Fund management. This definition may not apply for purposes of this report, which may combine industry sub-classifications for reporting ease. Industries are shown as a percent of net assets. These industry classifications are based on third-party definitions and are unaudited. The definitions are industry terms and do not reflect the legal status of any of the investments or the companies in which the Fund has invested.
See Notes to Financial Statements.
8
Statement of Assets and Liabilities
December 31, 2009
ASSETS | | | |
Investments, at value (Cost $75,209,739) | | $ | 78,757,557 | |
Receivable for shares sold | | 17,743 | |
Dividends and interest receivable | | 131,288 | |
Prepaid expenses and other assets | | 8,603 | |
Total Assets | | 78,915,191 | |
| | | |
LIABILITIES | | | |
Payable for shares redeemed | | 15,681 | |
Investment advisory fees payable | | 88,994 | |
Administration fees payable | | 19,935 | |
Legal and audit fees payable | | 34,826 | |
Directors’ fees and expenses payable | | 200 | |
12b-1 fees payable — Class A | | 13,254 | |
Printing fees payable | | 11,613 | |
Accrued expenses and other payables | | 2,365 | |
Total Liabilities | | 186,868 | |
NET ASSETS | | $ | 78,728,323 | |
| | | |
COMPOSITION OF NET ASSETS | | | |
Paid-in capital | | 90,171,327 | |
Undistributed net investment income | | 90,081 | |
Accumulated net realized loss | | (15,080,903 | ) |
Net unrealized appreciation on investments | | 3,547,818 | |
NET ASSETS | | $ | 78,728,323 | |
| | | |
PRICING OF SHARES | | | |
Class A: | | | |
Net Asset Value, offering and redemption price per share | | $ | 6.92 | |
Net Assets | | $ | 62,263,763 | |
Shares of beneficial interest outstanding (unlimited number of shares, no par value common stock authorized) | | 8,992,382 | |
Maximum offering price per share
(NAV/0.945, based on maximum sales charge of 5.50% of the offering price) | | $ | 7.32 | |
| | | |
Class I: | | | |
Net Asset Value, offering and redemption price per share | | $ | 6.96 | |
Net Assets | | $ | 16,464,560 | |
Shares of beneficial interest outstanding (unlimited number of shares, no par value common stock authorized) | | 2,365,356 | |
See Notes to Financial Statements.
9
Statement of Operations
For the Year Ended December 31, 2009
INVESTMENT INCOME | | | |
Dividends | | $ | 1,797,893 | |
Securities lending income | | 8,835 | |
Interest and other income | | 24,453 | |
Total Investment Income | | 1,831,181 | |
| | | |
EXPENSES | | | |
Investment advisory fee | | 495,567 | |
Fund accounting, fund administration and transfer agency fees (Note 4) | | 51,322 | |
12b-1 fees - Class A | | 85,940 | |
Previous service fees | | 102,992 | |
Previous fund accounting fees | | 35,446 | |
Legal fees | | 30,755 | |
Audit fees | | 72,043 | |
Reports to Shareholders | | 46,841 | |
State registration | | 589 | |
Insurance | | 48,789 | |
Custody fees | | 14,391 | |
Trustee fees | | 21,315 | |
Michigan state business tax | | (74,213 | ) |
Previous transfer agent fees - Class A | | 124,469 | |
Previous transfer agent fees - Class I* | | 14,245 | |
Miscellaneous | | 2,433 | |
Total Expenses | | 1,072,924 | |
Net Investment Income | | 758,257 | |
| | | |
REALIZED AND UNREALIZED GAIN/(LOSS) ON INVESTMENTS | | | |
Net realized loss on investments | | (2,572,827 | ) |
| | | |
Net unrealized appreciation of investments | | 16,108,515 | |
| | | |
NET REALIZED AND UNREALIZED GAIN ON INVESTMENTS: | | 13,535,688 | |
NET INCREASE IN NET ASSETS RESULTING FROM OPERATIONS | | $ | 14,293,945 | |
*Prior to close of business August 28, 2009, Class I was known as Class R.
See Notes to Financial Statements.
10
Statements of Changes in Net Assets
| | Year Ended | | Year Ended | |
| | December 31, 2009 | | December 31, 2008 | |
| | | | | |
OPERATIONS: | | | | | |
Net investment income | | $ | 758,257 | | $ | 894,243 | |
Net realized loss on investments sold | | (2,572,827 | ) | (12,507,251 | ) |
Net change in unrealized appreciation/(depreciation) on investments | | 16,108,515 | | (22,231,765 | ) |
Net Increase/(Decrease) in Net Assets Resulting from Operations | | 14,293,945 | | (33,844,773 | ) |
| | | | | |
DISTRIBUTIONS | | | | | |
Dividends to shareholders from net investment income | | | | | |
Class A | | (602,511 | ) | (706,713 | ) |
Class I | | (197,487 | ) | (55,708 | ) |
Dividends to shareholders from net realized gains | | | | | |
Class A | | — | | 901 | |
Class I | | — | | (85 | ) |
Net decrease in net assets from distributions | | (799,998 | ) | (761,605 | ) |
| | | | | |
BENEFICIAL INTEREST TRANSACTIONS | | | | | |
Shares sold | | | | | |
Class A | | 2,575,630 | | 2,679,527 | |
Class I | | 11,456,364 | | 962,266 | |
Dividends reinvested | | | | | |
Class A | | 585,747 | | 688,975 | |
Class I | | 197,487 | | 55,792 | |
Shares redeemed | | | | | |
Class A | | (4,161,769 | ) | (5,756,696 | ) |
Class I | | (2,918,243 | ) | (625,028 | ) |
Net increase/(decrease) in net assets derived from beneficial interest transactions | | 7,735,216 | | (1,995,164 | ) |
| | | | | |
Net increase/(decrease) in net assets | | 21,229,163 | | (36,601,542 | ) |
| | | | | |
NET ASSETS | | | | | |
Beginning of year | | 57,499,160 | | 94,100,702 | |
End of year* | | $ | 78,728,323 | | $ | 57,499,160 | |
* Includes undistributed net investment income of: | | $ | 90,081 | | $ | 38,859 | |
See Notes to Financial Statements.
11
Financial Highlights
Selected data for a share of beneficial interest outstanding throughout the periods indicated:
| | Activa
Value Fund [Class A] | |
| | Year Ended | | Year Ended | | Year Ended | | Year Ended | | Year Ended | |
| | December 31, | | December 31, | | December 31, | | December 31, | | December 31, | |
| | 2009 | | 2008 | | 2007 | | 2006 | | 2005 | |
| | | | | | | | | | | |
OPERATING PERFORMANCE: | | | | | | | | | | | |
Net Asset Value - Beginning of Year | | $ | 5.86 | | $ | 9.35 | | $ | 9.81 | | $ | 8.65 | | $ | 8.06 | |
| | | | | | | | | | | |
INCOME FROM INVESTMENT OPERATIONS: | | | | | | | | | | | |
Net investment income | | 0.07 | | 0.08 | | 0.14 | | 0.13 | | 0.09 | |
Net realized gain/(loss) | | 1.06 | | (3.49 | ) | 0.09 | | 1.49 | | 0.59 | |
Total from investment operations | | 1.13 | | (3.41 | ) | 0.23 | | 1.62 | | 0.68 | |
| | | | | | | | | | | |
DISTRIBUTIONS: | | | | | | | | | | | |
From net investment income | | (0.07 | ) | (0.08 | ) | (0.14 | ) | (0.13 | ) | 0.09 | |
From net realized gain | | — | | — | | (0.55 | ) | (0.33 | ) | — | |
Total distributions | | (0.07 | ) | (0.08 | ) | (0.69 | ) | (0.46 | ) | (0.09 | ) |
Net asset value, end of period | | $ | 6.92 | | $ | 5.86 | | $ | 9.35 | | $ | 9.81 | | $ | 8.65 | |
Total return | | 19.24 | % | (36.45 | )% | 2.43 | % | 18.80 | % | 8.47 | % |
| | | | | | | | | | | |
RATIOS/SUPPLEMENTAL DATA: | | | | | | | | | | | |
Net assets, end of year (000) | | $ | 62,264 | | $ | 53,841 | | $ | 88,679 | | $ | 125,459 | | $ | 132,597 | |
| | | | | | | | | | | |
Ratio of expenses to average net assets | | 1.62 | % | 1.5 | % | 1.2 | % | 1.1 | % | 1.2 | % |
Ratio of net investment income to average net assets | | 1.12 | % | 1.1 | % | 1.4 | % | 1.4 | % | 1.1 | % |
Portfolio Turnover(1) | | 56 | % | 83 | % | 52 | % | 64 | % | 54 | % |
(1) A portfolio turnover rate is the percentage computed by taking the lesser of the purchases and sales of portfolio securities (excluding securities with a maturity date of one year or less at the time of acquisition) for a period and dividing it by the monthly average of the market value of such securities during the period. Purchases and sales of investment securities (excluding short-term securities) for the year ended December 31, 2009 were $45,417,733 and $36,860,606, respectively.
See Notes to Financial Statements.
12
| Activa | |
| Value Fund [Class I] (1) | |
| | Year Ended | | Year Ended | | Year Ended | | Year Ended | | Year Ended | |
| | December 31, | | December 31, | | December 31, | | December 31, | | December 31, | |
| | 2009 | | 2008 | | 2007 | | 2006 | | 2005 | |
| | | | | | | | | | | |
OPERATING PERFORMANCE: | | | | | | | | | | | |
Net Asset Value - Beginning of Year | | $ | 5.89 | | $ | 9.41 | | $ | 9.86 | | $ | 8.69 | | $ | 8.10 | |
| | | | | | | | | | | |
INCOME FROM INVESTMENT OPERATIONS: | | | | | | | | | | | |
Net investment income | | 0.07 | | 0.09 | | 0.15 | | 0.14 | | 0.10 | |
Net realized gain/(loss) | | 1.08 | | (3.52 | ) | 0.10 | | 1.50 | | 0.59 | |
Total from investment operations | | 1.15 | | (3.43 | ) | 0.25 | | 1.64 | | 0.69 | |
| | | | | | | | | | | |
DISTRIBUTIONS: | | | | | | | | | | | |
From net investment income | | (0.08 | ) | (0.09 | ) | (0.15 | ) | (0.14 | ) | (0.10 | ) |
From net realized gain | | — | | — | | (0.55 | ) | (0.33 | ) | — | |
Total distributions | | (0.08 | ) | (0.09 | ) | (0.70 | ) | (0.47 | ) | (0.10 | ) |
Net asset value, end of period | | $ | 6.96 | | $ | 5.89 | | $ | 9.41 | | $ | 9.86 | | $ | 8.69 | |
Total return | | 19.59 | % | (36.38 | )% | 2.59 | % | 18.89 | % | 8.52 | % |
| | | | | | | | | | | |
RATIOS/SUPPLEMENTAL DATA: | | | | | | | | | | | |
Net assets, end of year (000) | | $ | 16,465 | | $ | 3,658 | | $ | 5,422 | | $ | 4,956 | | $ | 4,264 | |
| | | | | | | | | | | |
Ratio of expenses to average net assets | | 1.46 | % | 1.4 | % | 1.1 | % | 1.1 | % | 1.1 | % |
Ratio of net investment income to average net assets | | 1.17 | % | 1.3 | % | 1.4 | % | 1.4 | % | 1.2 | % |
Portfolio Turnover(2) | | 56 | % | 83 | % | 52 | % | 64 | % | 54 | % |
(1) Prior to the close of business on August 28, 2009, Class I was known as Class R.
(2) A portfolio turnover rate is the percentage computed by taking the lesser of the purchases and sales of portfolio securities (excluding securities with a maturity date of one year or less at the time of acquisition) for a period and dividing it by the monthly average of the market value of such securities during the period. Purchases and sales of investment securities (excluding short-term securities) for the year ended December 31, 2009 were $45,417,733 and $36,860,606, respectively.
See Notes to Financial Statements.
13
Notes to Financial Statements
December 31, 2009
1. ORGANIZATION AND SIGNIFICANT ACCOUNTING POLICIES
Financial Investors Trust (the “Trust”) was organized as a Delaware statutory trust on November 30, 1993, and registered as an open-end management investment company under the Investment Company Act of 1940, as amended (“1940 Act”). Activa Value Fund (the “Fund”) is one of seven separate series offered to the public under the Trust as of December 31, 2009. The Fund has two classes of shares authorized: Class A and Class I. Each class differs as to sales and redemption charges and ongoing fees. All classes of shares have identical rights to earnings, assets, and voting privileges, except for class-specific expenses and exclusive rights to vote on matters affecting only individual classes. Class A shares of the Fund are subject to an initial sales charge of up to 5.50% . Class A shares of the Fund for which no initial sales charge was paid are subject to a contingent deferred sales charge of 1% if the shares are sold within twelve months. The Fund’s investment objective is to achieve maximum total return consisting of appreciation on its investment and a variable income stream.
On August 29, 2009, Activa Value Fund (“predecessor Fund”), a series of the Activa Mutual Fund Trust, participated in a tax-free reorganization. Through the reorganization, the predecessor Fund merged into the newly created Fund series of the Trust. The Fund has carried over the historic performance and financial statements of the predecessor Fund. The predecessor Fund commenced operations on August 10, 1971.
Management has evaluated whether any events or transactions occurred subsequent to December 31, 2009 through February 24, 2010, the date of issuance of the Fund’s financial statements, and determined that there were no other material events or transactions that would require recognition or disclosure in the Fund’s financial statements.
The following is a summary of significant accounting policies consistently followed by the Fund in the preparation of its financial statements. The policies are in conformity with accounting principles generally accepted in the United States of America for investment companies.
Investment Valuation: The Board of Trustees (“Board” or “Trustees”) has approved procedures to be used to value the Fund’s securities for the purposes of determining the Fund’s net asset value (“NAV”). The valuation of the securities of the Fund is determined in good faith by or under the direction of the Board. The Board has delegated certain valuation functions for the Fund to ALPS Fund Services, Inc. (“ALPS” or the “Administrator”).
The Fund generally values its securities based on market prices determined at the close of regular trading on the New York Stock Exchange (“NYSE”) (normally, 4 p.m. Eastern time) on each business day (Monday through Friday). The Fund will not value its securities on any day that the NYSE is closed, including the following observed holidays: New Year’s Day, Martin Luther King, Jr. Day, Presidents’ Day, Good Friday, Memorial Day, Independence Day, Labor Day, Thanksgiving Day, and Christmas Day, and the preceding Friday or subsequent Monday when one of those holidays falls on a Saturday or Sunday, respectively.
The Fund’s currency valuations, if any, are done as of the close of regularly scheduled trading on the NYSE, which is usually at 4:00 p.m. Eastern time. For equity securities that are traded on an exchange, the market price is usually the closing sale or official closing price on that exchange. In the case of securities not traded on an exchange, or if such closing prices are not otherwise available, the market price is typically determined by independent third-party pricing vendors approved by the Fund’s Board using a variety of pricing techniques and methodologies. The market price for debt obligations is generally the price supplied by an independent third-party pricing service approved by the Fund’s Board, which may use a matrix, formula or other objective method that takes into consideration market indices, yield curves and other specific adjustments. Short-term debt obligations that will mature in 60 days or less are valued at amortized cost, unless it is determined that using this method would not reflect an investment’s fair value. If vendors are unable to supply a price, or if the price supplied is deemed to be unreliable, the market price may be determined using quotations received from one or more brokers/dealers that make a market in the security. Investments in other funds are calculated at their respective net asset values as determined by those funds, in accordance with the Investment Company Act of 1940.
When such prices or quotations are not available, or when the Fair Value Committee appointed by the Board believes that they are unreliable, securities may be priced using fair value procedures approved by the Board. Because the Fund may invest in securities that may be thinly traded or for which market quotations may not be readily available or may be unreliable (such as securities of small capitalization companies), the Fund may use fair valuation procedures more frequently than funds that invest primarily in securities that are more liquid (such as equity securities of large capitalization domestic issuers). The Fund may also use fair value procedures if the Fair Value Committee determines that a significant event has occurred between the time at which a market price is determined and the time at which the Fund’s net asset value is calculated. In particular, the value of non-U.S. securities may be materially affected by events occurring after the close of the
14
Notes to Financial Statements
December 31, 2009
market on which they are traded, but before the Fund prices its shares.
The Fund may determine the fair value of investments based on information provided by pricing services and other third-party vendors, which may recommend fair value prices or adjustments with reference to other securities, indices, or assets. In considering whether fair value pricing is required and in determining fair values, the Fund may, among other things, consider significant events (which may be considered to include changes in the value of U.S. securities or securities indices) that occur after the close of the relevant market and before the Fund values its securities. In addition, the Fund may utilize modeling tools provided by third-party vendors to determine fair values of non-U.S. securities. The Fund’s use of fair value pricing may help deter “stale price arbitrage.”
Valuing securities at fair value involves greater reliance on judgment than valuation of securities based on readily available market quotations. A fund that uses fair value to price securities may value those securities higher or lower than another fund using market quotations or its own fair value methodologies to price the same securities. There can be no assurance that the Fund could obtain the fair value assigned to a security if it were to sell the security at approximately the time at which the Fund determines its net asset value, and the difference between fair value and the price of the securities may be material.
Fair Value Measurements: A three-tier hierarchy has been established to classify fair value measurements for disclosure purposes. Inputs refer broadly to the assumptions that market participants would use in pricing the asset or liability, including assumptions about risk. Inputs may be observable or unobservable. Observable inputs are inputs that reflect the assumptions market participants would use in pricing the asset or liability that are developed based on market data obtained from sources independent of the reporting entity. Unobservable inputs are inputs that reflect the reporting entity’s own assumptions about the assumptions market participants would use in pricing the asset or liability that are developed based on the best information available.
Various inputs are used in determining the value of the Fund’s investments as of the reporting period end. The designated input levels are not necessarily an indication of the risk or liquidity associated with these investments. These inputs are categorized in the following hierarchy under applicable financial accounting standards:
· Level 1 — Unadjusted quoted prices in active markets for identical investments
· Level 2 — Other significant observable inputs (including quoted prices for similar investments, interest rates, prepayment speeds, credit risk, etc.)
· Level 3 — Significant unobservable inputs (including the Fund’s own assumptions in determining the fair value of investments)
The following is a summary of the inputs used to value the Fund’s investments as of December 31, 2009:
| | | | Level 2 - | | | | | |
| | | | Other | | Level 3 - | | | |
Investment | | | | Significant | | Significant | | | |
in Securities | | Level 1 - | | Observable | | Unobservable | | | |
at value | | Quoted Prices | | Inputs | | Inputs | | Total | |
Common Stocks | | $ | 77,045,731 | | $ | — | | $ | — | | $ | 77,045,731 | |
Exchange Traded Funds | | 1,187,973 | | | | | | 1,187,973 | |
Short Term Investments | | 523,853 | | — | | — | | 523,853 | |
TOTAL | | $ | 78,757,557 | | $ | — | | $ | — | | $ | 78,757,557 | |
For the fiscal year ended December 31, 2009, the Fund did not have any securities which used significant unobservable inputs (Level 3) in determining fair value. Therefore, a reconciliation of assets in which significant unobservable inputs (Level 3) were used in determining fair value is not applicable.
Investment Transactions: Investment transactions are accounted for on the date the investments are purchased or sold (trade date). Realized gains and losses from investment transactions are reported on an identified cost basis, which is the same basis the Fund uses for federal income tax purposes. Interest income, which includes accretion of discounts, is accrued and recorded as earned.
Dividend income from investments in real estate investment trusts (“REITs”) is recorded at management’s estimate of income included in distributions received. Distributions received in excess of this amount are recorded as a reduction of the cost of investments. The actual amount of income and return of capital are determined by each REIT only after its fiscal year-end, and may differ from the estimated amounts. Such differences, if any, are recorded in Fund’s following year.
Securities lending: The predecessor Fund loaned portfolio securities from time to time in order to earn additional income. The income recorded as a result of securities lending transactions is included in Securities lending income in the Statement of Operations. The predecessor Fund received collateral in the form of U.S. Treasury obligations, letters of credit, and/or cash against the loaned securities, and maintained collateral in an amount not less than 100% of the market value
15
Notes to Financial Statements
December 31, 2009
of the loaned securities during the period of the loan. The market value of the loaned securities was determined at the close of business of the predecessor Fund and any additional required collateral was delivered to the predecessor Fund on the next business day. If the borrower defaulted on its obligation to return the securities loaned because of insolvency or other reasons, the predecessor Fund could experience delays and costs in recovering the securities loaned or in gaining access to the collateral.
Foreign Securities: The Fund may directly purchase securities of foreign issuers. Investing in securities of foreign issuers involves special risks not typically associated with investing in securities of U.S. issuers. The risks include possible reevaluation of currencies, the inability to repatriate the Fund, less complete financial information about companies and possible future adverse political and economic developments. Moreover, securities of many foreign issuers and their markets may be less liquid and their prices more volatile than those of securities of comparable U.S. issuers.
Foreign Currency Translation: The books and records of the Fund are maintained in U.S. dollars. Investment valuations and other assets and liabilities initially expressed in foreign currencies are converted each business day into U.S. dollars based upon current exchange rates. Prevailing foreign exchange rates may generally be obtained at the close of the NYSE, normally 4:00 p.m. Eastern time. The portion of realized and unrealized gains or losses on investments due to fluctuations in foreign currency exchange rates is not separately disclosed and is included in realized and unrealized gains or losses on investments, when applicable.
Forward Foreign Currency Transactions: The Fund may engage in currency transactions with counterparties to hedge the value of portfolio securities denominated in particular currencies against fluctuations in relative value, to gain or reduce exposure to certain currencies, or to generate income or gains. All commitments are marked to market daily at the applicable exchange rates and any resulting unrealized gains or losses are recorded in the Fund’s financial statements. The Fund records realized gains or losses at the time a forward contract is offset by entry into a closing transaction or extinguished by delivery of the currency. The Fund did not have forward foreign currency contracts at December 31, 2009.
Expenses: Some expenses of the Trust can be directly attributed to the Fund or the Fund specific share class. Expenses which cannot be directly attributed are apportioned among all funds in the Trust based on average net assets.
Use of Estimates: The Fund’s financial statements are prepared in accordance with accounting principles generally accepted in the United States of America. This requires management to make estimates and assumptions that affect (a) the reported amounts of assets and liabilities and disclosure of contingent assets and liabilities at the date of the financial statements, and (b) the reported amounts of increases and decreases in net assets from operations during the reporting period. Actual results could differ from these estimates.
Income Taxes: The Fund complies with the requirements under Subchapter M of the Internal Revenue Code applicable to regulated investment companies and intends to distribute substantially all of its net taxable income and net capital gains, if any, each year. The Fund is not subject to income taxes to the extent such distributions are made.
During the fiscal year ended December 31, 2009, the Fund did not have a liability for any unrecognized tax benefits in the accompanying financial statements. The Fund files income tax returns in the U.S. federal jurisdiction and the State of Colorado. For the years ended December 31, 2006 through December 31, 2009 for the federal jurisdiction and for the years ended December 31, 2005 through December 31, 2008 for Michigan, and for the year ended December 31, 2009 for Colorado the predecessor Fund’s and the current Fund’s returns are still open to examination by the appropriate taxing authority.
On January 9,2009, the Michigan Business Tax was amended to provide an exemption for Regulated Investment Companies. The Fund received a refund in 2009 of tax payments made in 2008 for the Michigan Business Tax. This refund is reflected on the Statement of Operations as Michigan state business tax.
Distributions to Shareholders: The Fund normally pays dividends and distributes capital gains, if any, on an annual basis. Income dividend distributions are derived from interest and other income the Fund receives from its investments, including distributions of short-term capital gains. Capital gain distributions are derived from gains realized when the Fund sells a security it has owned for more than a year. The Fund may make additional distributions and dividends at other times if the portfolio manager believes doing so may be necessary for the Fund to avoid or reduce taxes. Net investment income (loss) and net realized gain (loss) may differ for financial statement and tax purposes. The character of distributions made during the year from net investment income or net realized gains may differ from its ultimate characterization for federal income tax purposes. Also, due to the timing of dividend distributions, the fiscal year in which amounts are
16
Notes to Financial Statements
December 31, 2009
distributed may differ from the fiscal year in which the income or realized gain were recorded by the Fund.
The tax character of the distributions paid by the Fund for the year ended December 31, 2009 is as follows:
Distributions Paid From:
Components of Earnings: At December 31, 2009, permanent differences in book and tax accounting were reclassified. These differences had no effect on net assets and were primarily attributed to previous redemption in kind gains, differences in book and tax distributions and certain other investments. The reclassifications were as follows:
| | Increase | | (Decrease) | |
| | Accumulated | | Accumulated | |
Increase | | Net Investment | | Net Realized | |
Paid In-Capital | | Income | | Gain | |
$ | 19,391,225 | | $ | 92,963 | | $ | (19,484,188 | ) |
| | | | | | | | |
As of December 31, 2009, the components of distributable earnings on a tax basis were as follows:
Undistributed ordinary income | | $ | 90,081 | |
Accumulated net realized loss | | (15,016,220 | ) |
Unrealized Appreciation | | 3,483,135 | |
Total | | $ | (11,443,004 | ) |
As of December 31, 2009, net unrealized appreciation/ (depreciation) of investments based on federal tax cost was as follows:
Gross appreciation on investments (excess of value over tax cost) | | $ | 11,667,972 | |
Gross depreciation on investments (excess of tax cost over value) | | (8,184,837 | ) |
Net unrealized appreciation | | 3,483,135 | |
Total cost for federal income tax purposes | | $ | 75,274,422 | |
Capital Loss Carry Forwards: At December 31, 2009, the Fund had available for tax purposes unused capital loss carry forwards of $12,235,938, expiring December 31, 2016, and $2,780,282, expiring December 31, 2017.
2. SECURITIES TRANSACTIONS
Purchases and sales of securities, excluding short term securities during the year ended December 31, 2009 were $45,417,733 and $36,860,606, respectively.
3. CAPITAL SHARE TRANSACTIONS
Shares redeemed within 90 days of purchase may incur a 2% short-term redemption fee deducted from the redemption amount. The Fund retained $0 for the fiscal year ended December 31, 2009 which is reflected in the “Shares redeemed” in the Statement of Changes in Net Assets. Transactions in shares of capital stock for the fiscal year ended December 31, 2009 and December 31, 2008 were as follows:
| | Year Ended | | Year Ended | |
| | December 31, 2009 | | December 31, 2008 | |
Class A | | | | | |
Sold | | 433,024 | | 310,678 | |
Issued in reinvestment of distributions | | 84,159 | | 123,473 | |
Redeemed | | (715,207 | ) | (723,115 | ) |
Net decrease in shares outstanding | | (198,024 | ) | (288,964 | ) |
| | Year Ended | | Year Ended | |
| | December 31, 2009 | | December 31, 2008 | |
Class I(1) | | | | | |
Sold | | 2,184,008 | | 116,500 | |
Issued in reinvestment of distributions | | 28,213 | | 9,963 | |
Redeemed | | (468,350 | ) | (81,393 | ) |
Net increase in shares outstanding | | 1,743,871 | | 45,070 | |
(1) Prior to the close of business on August 28, 2009, Class I was known as Class R.
4. MANAGEMENT AND RELATED PARTY TRANSACTIONS
ALPS Advisors, Inc. (“AAI” or “Adviser”), subject to the authority of the Board, is responsible for the overall management and administration of the Fund’s business affairs. AAI has delegated daily management of Fund assets to Wellington Management Company, LLP (“Wellington”), the sub-adviser of the Fund. Wellington manages the investments of the Fund in accordance with its investment objective, policies and limitations and investment guidelines established jointly by the Adviser and the Trustees. Pursuant to the Investment Advisory Agreement (the “Advisory Agreement”), the Fund pays AAI an annual management fee of 0.95% based on the Fund’s average daily net assets. Pursuant to an Investment Sub-advisory Agreement, AAI pays Wellington an annual sub-advisory management fee of (i) fifty (50) basis points of the Fund’s daily net assets during the month of $0 - $250 million; (ii) forty (40) basis points of the Fund’s daily net assets during the month
17
Notes to Financial Statements
December 31, 2009
of between $250 million and $500 million; and (iii) thirty (30) basis points of the Fund’s daily net assets during the month of $500 million and above. AAI is required to pay all fees due to Wellington out of the management fee AAI receives from the Fund.
AAI has contractually agreed with the Fund to limit the amount of the Fund’s total annual expenses (exclusive of distribution and service (12b-1) fees, acquired fund fees and expenses, brokerage expenses, interest expense, taxes and extraordinary expenses) to 1.15% of the Fund’s average daily net assets. This agreement is in effect from July 23, 2009 through August 31, 2011 and is reevaluated on an annual basis. Without this agreement, expenses could be higher. In addition, the Fund’s organizational expenses have been borne by AAI. The Adviser will be permitted to recover, on a class by class basis, expenses it has borne through the agreement described above to the extent that the Fund’s expenses in later periods fall below the annual rates set forth in the relevant agreement. The Fund will not be obligated to pay any such deferred fees and expenses more than one year after the end of the fiscal year in which the fee and expense was deferred. ALPS Distributors, Inc. (an affiliate of ALPS and AAI) (“ADI” or the “Distributor”) acts as the distributor of the Fund’s shares pursuant to a Distribution Agreement with the Trust. Shares are sold on a continuous basis by ADI as agent for the Fund, and ADI has agreed to use its best efforts to solicit orders for the sale of Fund shares, although it is not obliged to sell any particular amount of shares. ADI is not entitled to any compensation for its services as Distributor. ADI is registered as a broker-dealer with the Securities and Exchange Commission.
The Fund has adopted a Distribution and Services Plan (the “Plan”) pursuant to Rule 12b-1 under the 1940 Act for the Class A shares. The Plan allows the Fund to use its Class A assets to pay fees in connection with the distribution, marketing and/or the provision of shareholder services to Class A shareholders. The Plan permits payment for services in connection with the administration of plans or programs that use Class A shares of the Fund as their funding medium and for related expenses. The Plan permits the Fund to make total payments at an annual rate of up to 0.25% of the Fund’s average daily net assets attributable to its Class A shares. Because these fees are paid out of a Fund’s share class assets on an ongoing basis, over time they will increase the cost of an investment in Class A shares, and Plan fees may cost an investor more than other types of sales charges.
ALPS (an affiliate of ADI and AAI) serves as administrator to the Fund and the Fund has agreed to pay expenses incurred in connection with its administrative activities. Pursuant to an Administrative Agreement, ALPS will provide operational services to the Fund including, but not limited to fund accounting, fund administration, and generally assist in the Fund’s operations. The Annual Administrative Fee will be billed monthly, in the amount of 0.15% of the Fund’s average net assets.
Beneficial Ownership: The beneficial ownership, either directly or indirectly, of more than 25% of the voting securities of any class a fund creates a presumption of control of the Fund, under Section 2(a)(9) of the 1940 Act. As of Decem-ber 31, 2009, Amway Investment Corp. held approximately 30.82% of Class A of the Fund and Fidelity Investments held approximately 100% of Class I of the Fund.
18
Report of Independent Registered Public Accounting Firm
December 31, 2009
To the Shareholders and Board of Trustees of Activa Value Fund of the Financial Investors Trust:
We have audited the accompanying statement of assets and liabilities of Activa Value Fund of the Financial Investors Trust (the “Fund”), including the statement of investments, as of December 31, 2009, and the related statements of operations, the statement of changes in net assets, and the financial highlights for the year then ended. These financial statements and financial highlights are the responsibility of the Fund’s management. Our responsibility is to express an opinion on these financial statements and financial highlights based on our audits. The statements of changes in net assets for the year ended December 31, 2008 and the financial highlights for each of the four years in the period ended December 31, 2008, were audited by other auditors whose report, dated February 17, 2009, expressed an unqualified opinion on such statement of changes in net assets and financial highlights.
We conducted our audits in accordance with the standards of the Public Company Accounting Oversight Board (United States). Those standards require that we plan and perform the audit to obtain reasonable assurance about whether the financial statements and financial highlights are free of material misstatement. The Fund is not required to have, nor were we engaged to perform, an audit of its internal control over financial reporting. Our audits included consideration of internal control over financial reporting as a basis for designing audit procedures that are appropriate in the circumstances, but not for the purpose of expressing an opinion on the effectiveness of the Fund’s internal control over financial reporting. Accordingly, we express no such opinion. An audit also includes examining, on a test basis, evidence supporting the amounts and disclosures in the financial statements, assessing the accounting principles used and significant estimates made by management, as well as evaluating the overall financial statement presentation. Our procedures included confirmation of securities owned as of December 31, 2009, by correspondence with the custodian. We believe that our audits provide a reasonable basis for our opinion.
In our opinion, the financial statements and financial highlights referred to above present fairly, in all material respects, the financial position of Activa Value Fund of the Financial Investors Trust as of December 31, 2009, the results of its operations for the year then ended, the changes in its net assets and its financial highlights for the year then ended, in conformity with accounting principles generally accepted in the United States of America.

Denver, Colorado
February 24, 2010
19
Additional Information
December 31, 2009 (Unaudited)
1. FUND HOLDINGS
The Fund files its complete schedule of portfolio holdings with the Securities and Exchange Commission (the “SEC”) for the first and third quarters of each fiscal year on Form N-Q within 60 days after the end of the period. Copies of the Fund’s Forms N-Q are available without charge on the SEC website at http://www.sec.gov. You may also review and copy the Form N-Q at the SEC’s Public Reference Room in Washington,DC. For more information about the operation of the Public Reference Room, please call the SEC at 1-800-SEC-0330.
2. FUND PROXY VOTING POLICIES, PROCEDURES AND SUMMARIES
Fund policies and procedures used in determining how to vote proxies and information regarding how the Fund voted proxies relating to portfolio securities during the most recent prior 12-month period ending June 30 will be available without charge, (1) upon request, by calling (866) 759-5679 and (2) on the SEC’s website at http://www.sec.gov.
3. SHAREHOLDER MEETINGS
A Special Meeting of Shareholders of the predecessor Fund was held on August 27, 2009. At the meeting the following matter was voted on by the predecessor Fund’s Shareholders. Each vote reported represents one dollar of net asset value held on the record date of the meeting. The results of the Special Meeting of Shareholders are noted below.
Proposal 1
To approve an agreement and plan of reorganization and the transactions it contemplates, including the transfer of all the assets of the predecessor fund, Activa Value Fund, a series of the Activa Mutual Fund Trust, to the Activa Value Fund, a newly created series of Financial Investors Trust.
| | Record | | Number of Votes | | Percentage of Total Outstanding Votes | | Percentage of Voted | |
Fund | | Date Votes | | Affirmative | | Against | | Abstain | | Total | | Affirmative | | Against | | Abstain | | Total | | Affirmative | | Against | | Abstain | | Total | |
Activa Value Fund | | 11,548,094 | | 5,625,833 | | 67,568 | | 156,144 | | 5,849,545 | | 48.72 | % | 0.59 | % | 1.35 | % | 50.66 | % | 96.18 | % | 1.15 | % | 2.67 | % | 100.00 | % |
The matters described below were submitted to a vote of shareholders of the Trust on August 7, 2009, which is during the period covered by this report. On that date, however, the Fund’s shareholders were not shareholders of the Trust, and were not eligible to vote.
Proposal 1
To elect and re-elect the nominees specified below as Trustees of Financial Investors Trust:
| | | | | | Percentage of Total | | | |
| | Record | | Number of Votes | | Outstanding Votes | | Percentage of Voted | |
Trustees | | Date Votes | | Affirmative | | Withheld | | Total | | Affirmative | | Withheld | | Total | | Affirmative | | Withheld | | Total | |
Mary K. Anstine | | 360,498,638 | | 147,541,150 | | 11,936,590 | | 159,477,740 | | 40.93 | % | 3.31 | % | 44.24 | % | 92.52 | % | 7.48 | % | 100.00 | % |
Jeremy W. Deems | | 360,498,638 | | 147,538,926 | | 11,938,814 | | 159,477,740 | | 40.93 | % | 3.31 | % | 44.24 | % | 92.51 | % | 7.49 | % | 100.00 | % |
John R. Moran, Jr. | | 360,498,638 | | 147,532,444 | | 11,945,296 | | 159,477,740 | | 40.93 | % | 3.31 | % | 44.24 | % | 92.51 | % | 7.49 | % | 100.00 | % |
Edmund J. Burke | | 360,498,638 | | 147,541,440 | | 11,936,300 | | 159,477,740 | | 40.93 | % | 3.31 | % | 44.24 | % | 92.52 | % | 7.48 | % | 100.00 | % |
Jerry G. Rutledge | | 360,498,638 | | 147,542,846 | | 11,934,894 | | 159,477,740 | | 40.93 | % | 3.31 | % | 44.24 | % | 92.52 | % | 7.48 | % | 100.00 | % |
Michael “Ross” Shell | | 360,498,638 | | 147,544,998 | | 11,932,742 | | 159,477,740 | | 40.93 | % | 3.31 | % | 44.24 | % | 92.52 | % | 7.48 | % | 100.00 | % |
Proposal 2.A.1
To amend the Trust Instrument to permit the Board to liquidate the Trust without a shareholder vote:
| | | | Number of Votes | | Percentage of Total Outstanding Votes | | Percentage of Voted | |
| | | | | | | | | | | | | | | | | | | | Broker | | | | | | | | | | Broker | | | |
Trust | | Record Date
Votes | | Affirmative | | Against | | Abstain | | Broker
Non-Vote | | Total | | Affirmative | | Against | | Abstain | | Non-
Vote | | Total | | Affirmative | | Against | | Abstain | | Non-
Vote | | Total | |
Financial Investors Trust | | 360,498,638 | | 124,065,472 | | 28,624,479 | | 46,076 | | 6,741,712 | | 159,477,739 | | 34.41 | % | 7.94 | % | 0.01 | % | 1.87 | % | 44.23 | % | 77.79 | % | 17.95 | % | 0.03 | % | 4.23 | % | 100.00 | % |
20
Proposal 2.B
To amend the Trust Instrument to permit the Board to liquidate future Funds or Classes of the Trust whose registration statement shall become effective after the date of the Special Meeting of Shareholders, August 7, 2009, without a shareholder vote:
| | | | Number of Votes | | Percentage of Total Outstanding Votes | | Percentage of Voted | |
| | | | | | | | | | | | | | | | | | | | Broker | | | | | | | | | | Broker | | | |
Trust | | Record Date
Votes | | Affirmative | | Against | | Abstain | | Broker
Non-Vote | | Total | | Affirmative | | Against | | Abstain | | Non-
Vote | | Total | | Affirmative | | Against | | Abstain | | Non-
Vote | | Total | |
Financial Investors Trust | | 360,498,638 | | 124,072,602 | | 28,617,443 | | 45,983 | | 6,741,712 | | 159,477,740 | | 34.42 | % | 7.94 | % | 0.01 | % | 1.87 | % | 44.24 | % | 77.80 | % | 17.94 | % | 0.03 | % | 4.23 | % | 100.00 | % |
4. DISCLOSURE REGARDING APPROVAL OF FUND ADVISORY AGREEMENTS
On June 9, 2009, the Trust’s Board of Trustees (the “Trustees”) met in person to discuss, among other things, the approval of (i) the Investment Advisory Agreement (“Advisory Agreement”) between the Trust and Wellington and of (ii) the Investment Sub-Advisory Agreement (the “Sub-Advisory Agreement,” together with the Advisory Agreement, the “Fund Advisory Agreements”) between the Trust, AAI, and Wellington for the Fund in accordance with Section 15(c) of the Investment Company Act of 1940, as amended. The Trustees were informed that AAI, as the investment adviser, and Wellington, as the investment sub-adviser, have responsibility for the investment and management of the Fund’s assets and securities. The Independent Trustees met with independent legal counsel during executive session and discussed the Fund Advisory Agreements and other related materials.
In approving the Fund Advisory Agreements, the Trustees, including the Independent Trustees, considered the following factors with respect to the Fund:
Investment Advisory Fee Rate: The Trustees reviewed and considered the tiered contractual annual advisory fee to be paid by (a) the Trust, on behalf of the Fund, to AAI of (i) 0.95% of the Fund’s daily average net assets of $0-$250M; (ii) 0.85% of the Fund’s daily average net assets between $250M-$500M ; and (iii) 0.75% of the Fund’s daily average net assets over $500M and (b) by AAI to Wellington of (i) 0.50% of the Fund’s daily average net assets of $0-$250M; (ii) 0.40% of the Fund’s daily average net assets between $250M-$500M; and (iii) 0.30% of the Fund’s daily average net assets over $500M, in light of the extent and quality of the advisory services provided by the AAI and Wellington to the Fund.
The Board received and considered information comparing the Fund’s contractual advisory fees and overall expenses with those of funds in both the relevant expense group and universe of funds provided by Lipper, an independent provider of investment company data, as well as the Fund’s direct competitors.
Based on such information, the Trustees further determined that the tiered contractual annual advisory fees set forth above and the total expense ratio of 1.40% and 1.15% for Class A and Class I, respectively, of the Fund, taking into account the contractual fee waivers in place, is comparable to others within the Fund’s peer universe.
Nature, Extent and Quality of the Services under the Fund Advisory Agreements: The Trustees received and considered information regarding the nature, extent and quality of services provided to the Fund under the Fund Advisory Agreements. The Trustees reviewed certain background materials supplied by AAI and Wellington in each of their presentations, including their Forms ADV.
The Trustees reviewed and considered AAI’s and Wellington’s investment advisory personnel, their history as asset managers, their performance and the amount of assets currently under management by AAI and Wellington. The Trustees also reviewed the research and decision-making processes utilized by AAI and Wellington, including the methods adopted to seek to achieve compliance with the investment objectives, policies and restrictions of the Fund.
The Trustees considered the background and experience of AAI’s and Wellington’s management in connection with the Fund, including reviewing the qualifications, backgrounds and responsibilities of the management team primarily responsible for the day-to-day portfolio management of the Fund and the extent of the resources devoted to research and analysis of actual and potential investments.
The Trustees also reviewed, among other things, AAI’s and Wellington’s insider trading policies and procedures and a description of their Codes of Ethics.
Performance: The Trustees reviewed performance information for the Fund for the 1-, 3-, 5- and 10-year periods ended March 31, 2009 and since inception (December 31, 1999). That review included a comparison of the Fund’s performance to the performance of a group of comparable funds selected by Lipper and the Russell 1000 Value Index, the Fund’s
21
benchmark. The Trustees also considered Wellington’s representations about the effect of recent market turmoil on the Fund’s performance. The Trustees also considered Wellington’s performance and reputation generally and its investment techniques, risk management controls and decision-making processes.
The Advisers’ Profitability: The Trustees received and considered a profitability analysis prepared by AAI based on the fees payable under the Advisory Agreement. The Trustees considered the profits, if any, anticipated to be realized by AAI in connection with the operation of the Fund. The Board then reviewed AAI’s and Wellington’s financial statements in order to analyze the financial condition and stability and profitability of each adviser.
Economies of Scale: The Trustees considered whether economies of scale in the provision of services to the Fund were being passed along to the shareholders.
Other Benefits to the Adviser: The Trustees reviewed and considered any other benefits derived or to be derived by AAI and Wellington from their relationship with the Fund, including soft dollar arrangements.
In selecting AAI as the Fund’s investment adviser and Wellington as the Fund’s sub-adviser and approving the Fund Advisory Agreements and the fees charged under each agreement, the Trustees concluded that no single factor reviewed by the Trustees was identified by the Trustees to be determinative as the principal factor in whether to approve the Fund Advisory Agreements. Further, the Independent Trustees were advised by separate independent legal counsel throughout the process. The Trustees, including all of the Independent Trustees, concluded that:
· the investment advisory fees to be received by AAI with respect to the Fund were comparable to others with in the Fund’s peer universe;
· the nature, extent and quality of services rendered by AAI under the Advisory Agreement and by Wellington under the Sub-Advisory Agreement were adequate;
· the profit, if any, anticipated to be realized by AAI in connection with the operation of the Fund is fair to the Trust, especially in light of the fee waiver agreement between the Trust and AAI; and
· there were no material other benefits accruing to AAI or Wellington in connection with its relationship with the Fund.
Based on the Trustees’ deliberations and their evaluation of the information described above, the Trustees, including all of the Independent Trustees, concluded that AAI’s and Wellington’s compensation for investment advisory services is consistent with the best interests of the Fund and its shareholders.
5. DESIGNATION REQUIREMENTS
Of the distributions paid by the Fund from ordinary income for year ended December 31, 2009, the following percentages met the requirements to be treated as qualifying for the corporate dividends received deduction and qualified dividend income, respectively.
Dividends Received Deduction | | 82.68 | % |
Qualified Dividend Income | | 82.68 | % |
22
Trustees & Officers
(Unaudited)
As of December 31, 2009, the Fund represented one of seven separate series offered to the public under the Trust. The Trust’s Board of Trustees oversees the overall management of each series of the Trust and elects the officers of the Trust. You can find more information about the Trustees in the Statement of Additional Information (SAI) which is available without charge by calling (866) 759-5679. The principal occupations for the past five years of the Trustees and executive officers of the Trust are listed below.
INDEPENDENT TRUSTEES
Name, | | Position(s) | | Term of Office and | | | | Number of Funds in | | Other | |
Address* | | Held with | | Length of Time | | Principal Occupation(s) | | Fund Complex Over- | | Directorships Held | |
& Age | | Fund | | Served | | During Past 5 Years** | | seen by Trustee *** | | by Trustee | |
Mary K. Anstine,
age 68 | | Trustee | | Ms. Anstine was elected at a special meeting of share-holders held on March 21, 1997 and re-elected at a special meeting of the Shareholders held on August 7, 2009. | | Ms. Anstine was President/Chief Executive Officer of HealthONE Alliance, Denver, Colorado, and former Executive Vice President of First Interstate Bank of Denver. Ms. Anstine is also Trustee/Director of AV Hunter Trust and Colorado Uplift Board. Ms. Anstine was formerly a Director of the Trust Bank of Colorado (later purchased and now known as Northern Trust Bank), HealthONE and Denver Area Council of the Boy Scouts of America, and a member of the American Bankers Association Trust Executive Committee. | | 22 | | Ms. Anstine is a Trustee of ALPS ETF Trust (9 funds); Financial Investors Variable Insurance Trust (5 funds); ALPS Variable Insurance Trust (1 fund); Reaves Utility Income Fund (1 fund); and Westcore Trust (12 funds). | |
| | | | | | | | | | | |
John R. Moran, Jr.,
age 79 | | Trustee | | Mr. Moran was elected at a special meeting of share-holders held on March 21, 1997 and re-elected at a special meeting of the Shareholders held on August 7, 2009. | | Mr. Moran is formerly President and CEO of The Colorado Trust, a private foundation serving the health and hospital community in the state of Colorado. An attorney, Mr. Moran was formerly a partner with the firm of Kutak Rock & Campbell in Denver, Colorado and a member of the Colorado House of Representatives. Currently, Mr. Moran is a member of the Treasurer’s Investment Advisory Committee for the University of Colorado. | | 7 | | None. | |
* | All communications to Trustees and Officers may be directed to Financial Investors Trust c/o 1290 Broadway, Suite 1100, Denver, Colorado 80203. |
** | Except as otherwise indicated, each individual has held the office shown or other offices in the same company for the last five years. |
*** | The Fund complex includes all series of the Trust and any other investment companies for which ALPS Advisors, Inc. and/or Wellington Management Company, LLP provide investment advisory services. |
23
Name, | | Position(s) | | Term of Office and | | | | Number of Funds in | | Other | |
Address* | | Held with | | Length of Time | | Principal Occupation(s) | | Fund Complex Over- | | Directorships Held | |
& Age | | Fund | | Served | | During Past 5 Years** | | seen by Trustee *** | | by Trustee | |
Jeremy W. Deems,
age 33 | | Trustee | | Mr. Deems was appointed as a Trustee at the March 11, 2008 meeting of the Board of Trustees and elected at a special meeting of the Shareholders held on August 7, 2009. | | Mr. Deems is the Co-President and Chief Financial Officer of Green Alpha Advisors, LLC. Prior to joining Green Alpha Advisors, Mr. Deems was CFO and Treasurer of Forward Management, LLC, an investment management company, ReFlow Management Co., LLC, a liquidity resourcing company, ReFlow Fund, LLC, a private investment fund, and Sutton Place Management, LLC, an administrative services company (from 2004 to June 2007). Prior to this, Mr. Deems served as Controller of Forward Management, LLC, ReFlow Management Co., LLC, ReFlow Fund, LLC and Sutton Place Management, LLC. | | 17 | | Mr. Deems is a Trustee of ALPS ETF Trust ( 9 funds); ALPS Variable Insurance Trust (1 fund); and Reaves Utility Income Fund (1 fund). | |
| | | | | | | | | | | |
Jerry G. Rutledge,
age 65 | | Trustee | | Mr. Rutledge was elected at a special meeting of share-holders held on August 7, 2009. | | Mr. Rutledge is the President and owner of Rutledge’s Inc., a retail clothing business. Mr. Rutledge is currently Director of the American National Bank. He was from 1994 to 2007 a Regent of the University of Colorado. | | 7 | | Mr. Rutledge is a Trustee of Clough Global Allocation Fund (1 fund), Clough Global Equity Fund (1 fund) and Clough Global Opportunities Fund (1 fund) and a Director of the American National Bank. | |
* | All communications to Trustees and Officers may be directed to Financial Investors Trust c/o 1290 Broadway, Suite 1100, Denver, Colorado 80203. |
** | Except as otherwise indicated, each individual has held the office shown or other offices in the same company for the last five years. |
*** | The Fund complex includes all series of the Trust and any other investment companies for which ALPS Advisors, Inc. and/or Wellington Management Company, LLP provide investment advisory services. |
24
Name, | | Position(s) | | Term of Office and | | | | Number of Funds in | | Other | |
Address* | | Held with | | Length of Time | | Principal Occupation(s) | | Fund Complex Over- | | Directorships Held | |
& Age | | Fund | | Served | | During Past 5 Years** | | seen by Trustee *** | | by Trustee | |
Michael “Ross” Shell,
age 39 | | Trustee | | Mr. Shell was elected at a special meeting of share-holders held on August 7, 2009. | | Mr. Shell is Founder and CEO of Red Idea, LLC, a strategic consulting/early stage venture firm (since June 2008) and a Director of Tesser, Inc., a brand agency (since November 1999). From December 2005 to May 2008, he was Director, Marketing and Investor Relations, of Woodbourne, a REIT/real estate hedge fund and private equity firm. Prior to this, from May 2004 to November 2005, he worked as a business strategy consultant; from June 2003 to April 2004, he was on the Global Client Services team of IDEO, a product design/innovation firm; and from 1999 to 2003, he was President of Tesser, Inc. Mr. Shell graduated with honors from Stanford University with a degree in Political Science. | | 7 | | None. | |
25
INTERESTED TRUSTEE
Name, | | Position(s) | | Term of Office and | | | | Number of Funds in | | Other | |
Address* | | Held with | | Length of Time | | Principal Occupation(s) | | Fund Complex Over- | | Directorships Held | |
& Age | | Fund | | Served | | During Past 5 Years** | | seen by Trustee *** | | by Trustee | |
Edmund J. Burke,
age 48 | | Trustee, Chairman and President | | Mr. Burke was elected as Chairman at the August 28, 2009 meeting of the Board of Trustees. Mr. Burke was elected as Trustee at a special meeting of shareholders held on August 7, 2009. Mr. Burke was elected President of the Trust at the December 17, 2002 meeting of the Board of Trustees. | | Mr. Burke is Chief Executive Officer and a Director of ALPS Holdings, Inc. (“AHI”) (since 2005) and Director of ALPS Advisors, Inc. (“AAI”), ALPS Distributors, Inc. (“ADI”), ALPS Fund Services, Inc. (“AFS”) and FTAM Distributors, Inc. (“FDI”) and from 2001-2008, was President of AAI, ADI, AFS and FDI. Because of his positions with AHI, AAI, ADI, AFS and FDI, Mr. Burke is deemed an affiliate of the Trust as defined under the 1940 Act. Mr. Burke is President of the Reaves Utility Income Fund (since 2004); President of the Financial Investors Variable Insurance Trust (since 2006); Trustee and President of the Clough Global Allocation Fund (Trustee since 2006; President since 2004); Trustee and President of the Clough Global Equity Fund (Trustee since 2006; President since 2005); Trustee and President of the Clough Global Opportunities Fund (since 2006); Trustee of the Liberty All-Star Equity Fund; and Director of the Liberty All-Star Growth Fund, Inc. | | 9 | | Mr. Burke is a Trustee of Clough Global Allocation Fund (1 fund); Clough Global Equity Fund (1 fund); Clough Global Opportunities Fund (1 fund); Trustee of the Liberty All-Star Equity Fund (1 fund); and Director of the Liberty All-Star Growth Fund, Inc. (1 fund). | |
* | All communications to Trustees and Officers may be directed to Financial Investors Trust c/o 1290 Broadway, Suite 1100, Denver, Colorado 80203. |
** | Except as otherwise indicated, each individual has held the office shown or other offices in the same company for the last five years. |
*** | The Fund complex includes all series of the Trust and any other investment companies for which ALPS Advisors, Inc. and/or Wellington Management Company, LLP provide investment advisory services. |
26
OFFICERS
Name, | | | | Term of Office | | |
Address* | | Position(s) | | and Length of | | |
& Age | | Held with Fund | | Time Served | | Principal Occupation(s) During Past 5 Years** |
Jeremy O. May,
age 39 | | Treasurer | | Mr. May was elected Treasurer of the Trust at the October 7, 1997 meeting of the Board of Trustees. | | Mr. May joined ALPS in 1995 and is currently President and Director of AFS and Executive Vice President and Director of AHI, AAI, ADI and FDI. Because of his positions with these entities, Mr. May is deemed an affiliate of the Trust as defined under the 1940 Act. Mr. May is also the Treasurer of the Liberty All-Star Equity Fund, Liberty All-Star Growth Fund, Inc., Clough Global Allocation Fund, Clough Global Equity Fund, Clough Global Opportunities Fund, Financial Investors Trust, Financial Investors Variable Insurance Trust and Reaves Utility Income Fund. Mr. May is also President, Chairman and Trustee of the ALPS Variable Insurance Trust and Chairman and Trustee of the Reaves Utility Income Fund. Mr. May is currently on the Board of Directors and is Chairman of the Audit Committee of the University of Colorado Foundation. |
| | | | | | |
JoEllen L. Legg,
age 48 | | Secretary | | Ms. Legg was elected Secretary of the Trust at the November 13, 2007 meeting of the Board of Trustees. | | Ms. Legg joined ALPS in October 2007 and is currently Vice President and Associate Counsel of ALPS, AAI, ADI and FDI. Prior to joining ALPS, Ms. Legg served as Senior Counsel - Law (Corporate & Securities) for Adelphia Communications Corporation from February 2005 to March 2007. Prior to this, Ms. Legg held associate positions at Fried Frank Harris Shriver & Jacobson LLP (1998 - 2004) and at Patton Boggs LLP (2004 - 2005). Because of her position with ALPS, Ms. Legg is deemed an affiliate of the Trust as defined under the 1940 Act. Ms. Legg is also the Secretary of Transparent Value Trust and Westcore Trust and Assistant Secretary of the Stone Harbor Investment Funds and WesMark Funds. |
| | | | | | |
Michael Akins,
age 33 | | Chief Compliance Officer (“CCO”) | | Mr. Akins was appointed CCO of the Trust at the June 13, 2006 meeting of the Board of Trustees. | | Mr. Akins joined ALPS in April 2006 and is currently Vice President and Deputy Compliance Officer of ALPS. Prior to joining ALPS, Mr. Akins served as Compliance Officer and AVP for UMB Financial Corporation. Before joining UMB, Mr. Akins served as an account manager for State Street Corporation. Because of his position with ALPS, Mr. Akins is deemed an affiliate of the Trust as defined under the 1940 Act. Mr. Akins is currently the CCO of Reaves Utility Income Fund, Clough Global Allocation Fund, Clough Global Opportunities Fund and the Clough Global Equity Fund. |
| | | | | | |
Kimberly R. Storms,
age 37 | | Assistant Treasurer | | Kim Storms was elected Assistant Treasurer of the Trust at the June 14, 2005 meeting of the Board of Trustees. | | Ms. Storms is Senior Vice President - Director of Fund Administration of ALPS. Ms. Storms joined ALPS in 1998 as Assistant Controller. Because of her position with ALPS, Ms. Storms is deemed an affiliate of the Trust as defined under the 1940 Act. Ms. Storms is also Treasurer of ALPS ETF Trust and ALPS Variable Insurance Trust; Assistant Treasurer of Liberty All-Star Equity Fund and Liberty All-Star Growth Fund, Inc.; and Assistant Secretary of Ameristock Mutual Fund, Inc. |
* | All communications to Trustees and Officers may be directed to Financial Investors Trust c/o 1290 Broadway, Suite 1100, Denver, Colorado 80203. |
** | Except as otherwise indicated, each individual has held the office shown or other offices in the same company for the last five years. |
27

Item 2. Code of Ethics.
(a) The Registrant, as of the end of the period covered by this report, has adopted a code of ethics that applies to the Registrant’s principal executive officer, principal financial officer, principal accounting officer or controller or any persons performing similar functions on behalf of the Registrant.
(b) Not applicable.
(c) During the period covered by this report, no amendments to the provisions of the code of ethics adopted in Item 2(a) above were made.
(d) During the period covered by this report, no implicit or explicit waivers to the provisions of the code of ethics adopted in Item 2(a) above were granted.
(e) Not applicable.
(f) The Registrant’s Code of Ethics is attached as an Exhibit hereto.
Item 3. Audit Committee Financial Expert.
The Board of Trustees of the Registrant has determined that the Registrant has at least one Audit Committee Financial Expert serving on its audit committee. The Board of Trustees of the Registrant has designated Jeremy W. Deems as the Registrant’s “Audit Committee Financial Expert.” Mr. Deems is “independent” as defined in paragraph (a)(2) of Item 3 to Form N-CSR.
Item 4. Principal Accountant Fees and Services.
(a) Audit Fees: For the fiscal years ended December 31, 2008 and December 31, 2009, with respect to the Activa Value Fund, a series of the Registrant, the aggregate fees billed for professional services rendered by the principal accountant for the audit of the of the Activa Value Fund’s annual financial statements were $0 and $25,349, respectively.
(b) Audit-Related Fees: For the fiscal years ended December 31, 2008 and December 31, 2009 with respect to the Activa Value Fund, a series of the Registrant,, there
2
were no fees billed for assurance and related services by the principal accountant that were reasonably related to the performance of the audit of the Registrant’s financial statements and were not reported in paragraph (a) of this Item 4.
(c) Tax Fees: For the fiscal years ended December 31, 2008 and December 31, 2009, with respect to the Activa Value Fund, a series of the Registrant, the aggregate fees billed for professional services rendered by the principal accountant for tax compliance, tax advice and tax planning to the Activa Value Fund were $0 and $3,200, respectively. The fiscal year 2008 and 2009 tax fees were for services for dividend calculation, excise tax preparation and tax return preparation.
(d) All Other Fees: For the fiscal years ended December 31, 2008 and December 31, 2009, with respect to the Activa Value Fund, a series of the Registrant, no fees were billed to Registrant by the principal accountant for services to the Activa Value Fund other than the services reported in paragraphs (a) through (c) of this Item.
(e)(1) Audit Committee Pre-Approval Policies and Procedures: All services to be performed by the Registrant’s principal accountant must be pre-approved by the Registrant’s audit committee.
(e)(2) No services described in paragraphs (b) through (d) of this Item were approved by the Registrant’s audit committee pursuant to paragraph (c)(7)(i)(C) of Rule 2-01 of Regulation S-X.
(f) Not applicable.
(g) The aggregate non-audit fees billed by the Registrant’s accountant in each of the last two fiscal years with respect to the Activa Value Fund, a series of the Registrant, were $176,200 in 2009 and $0 in 2008. These fees consisted of non-audit fees billed to (i) the Registrant of $3,200 in 2009 and $0 in 2008 as described in response to paragraph (c) above and (ii) to ALPS Fund Services, Inc. (“AFS”), an entity under common control with ALPS Advisors, Inc., the Registrant’s investment adviser, of $173,000 in 2009 and $0 in 2008. The non-audit fees billed to AFS related to SAS 70 services and other compliance-related matters.
(h) The Registrant’s audit committee has considered whether the provision of non-audit services that were rendered to the Registrant’s investment adviser (not including any sub-adviser whose role is primarily portfolio management and is subcontracted with or overseen by another investment adviser), and any entity controlling, controlled by, or under common control with the investment adviser that provides ongoing services to the Registrant that were not pre-approved pursuant to paragraph (c)(7)(ii) of Rule 2-01 of Regulation S-X, is compatible with maintaining the principal accountant’s independence. The Registrant’s audit
3
committee determined that the provision of such non-audit services is compatible with maintaining the principal accountant’s independence.
Item 5. Audit Committee of Listed Registrants.
Not applicable.
Item 6. Investments.
(a) Schedule of Investments in securities of unaffiliated issuers as of the close of the reporting period is included as part of the Reports to Stockholders filed under Item 1 of this Form N-CSR.
(b) Not applicable.
Item 7. Disclosure of Proxy Voting Policies and Procedures for Closed-End Management Investment Companies.
Not applicable.
Item 8. Portfolio Managers of Closed-End Management Investment Companies.
Not applicable.
Item 9. Purchases of Equity Securities by Closed-End Management Investment Company and Affiliated Purchasers.
Not applicable.
Item 10. Submission of Matters to a Vote of Security Holders.
There have been no material changes to the procedures by which shareholders may recommend nominees to the Registrant’s Board of Trustees, where those changes were implemented after the Registrant last provided disclosure in response to the requirements of Item 407(c)(2) of Regulation S-K, or this Item.
Item 11. Controls and Procedures.
(a) The Registrant’s principal executive officer and principal financial officer have concluded that the Registrant’s disclosure controls and procedures (as defined in Rule 30a-3(c) under the Investment Company Act of 1940, as amended) are effective based on their evaluation of these controls and procedures as of a date within 90 days of the filing date of this report.
(b) There was no change in the Registrant’s internal control over financial reporting (as defined in Rule 30a-3(d) under the Investment Company Act of 1940, as
4
amended) during the second fiscal quarter of the period covered by this report that has materially affected, or is reasonably likely to materially affect, the Registrant’s internal control over financial reporting.
Item 12. Exhibits.
(a)(1) Registrant’s Code of Ethics for Senior Financial Officers, which is the subject of the disclosure required by Item 2 of Form N-CSR, was filed as Exhibit 12(a)(1) to the Registrant’s Certified Shareholder Report on Form N-CSR, File No. 811-8194, on July 7, 2008.
(a)(2) The certifications required by Rule 30a-2(a) of the Investment Company Act of 1940, as amended, and Section 302 of the Sarbanes-Oxley Act of 2002 are attached hereto as Exhibit 99.Cert.
(a)(3) Not applicable.
(b) The certifications by the Registrant’s principal executive officer and principal financial officer, as required by Rule 30a-2(b) of the Investment Company Act of 1940, as amended, and Section 906 of the Sarbanes-Oxley Act of 2002 are attached hereto as Exhibit 99.906Cert.
5
SIGNATURES
Pursuant to the requirements of the Securities Exchange Act of 1934 and the Investment Company Act of 1940, the Registrant has duly caused this report to be signed on its behalf by the undersigned, thereunto duly authorized.
FINANCIAL INVESTORS TRUST
By: | /s/ Edmund J. Burke | |
| Edmund J. Burke (Principal Executive Officer) | |
| President | |
| | |
Date: | March 8, 2010 | |
Pursuant to the requirements of the Securities Exchange Act of 1934 and the Investment Company Act of 1940, this report has been signed below by the following persons on behalf of the Registrant and in the capacities and on the dates indicated.
FINANCIAL INVESTORS TRUST | |
| |
By: | /s/ Edmund J. Burke | |
| Edmund J. Burke (Principal Executive Officer) | |
| President | |
| | |
Date: | March 8, 2010 | |
| | |
| | |
By: | /s/ Jeremy O. May | |
| Jeremy O. May (Principal Financial Officer) | |
| Treasurer | |
| | |
Date: | March 8, 2010 | |
6