Table of Contents
UNITED STATES
SECURITIES AND EXCHANGE COMMISSION
Washington, D.C. 20549
FORM N-CSR
CERTIFIED SHAREHOLDER REPORT OF REGISTERED
MANAGEMENT INVESTMENT COMPANIES
Investment Company Act file number: 811-8194
FINANCIAL INVESTORS TRUST
(exact name of Registrant as specified in charter)
1290 Broadway, Suite 1100, Denver, Colorado 80203
(Address of principal executive offices) (Zip code)
JoEllen L. Legg, Secretary
Financial Investors Trust
1290 Broadway, Suite 1100
Denver, Colorado 80203
(Name and address of agent for service)
Registrant’s telephone number, including area code: 303-623-2577
Date of fiscal year end: April 30
Date of reporting period: May 1, 2010 - October 31, 2010
Table of Contents
Item 1. Reports to Stockholders.
Table of Contents
Table of Contents
October 31, 2010
|
Table of Contents
| ALPS | GNI Long-Short Fund | ||||||
|
October 31, 2010 (Unaudited) | |||||
For the six months ended October 31, 2010, the ALPS | GNI Long-Short Fund - Class A Shares (exclusive of applicable sales loads) returned
-0.25%.
Great news, though: The recession that began in December 2007 technically ended in June 2009, so said the National Bureau of Economic Research (NBER), the group of economists that officially dates the inflection points in the economic cycle, in late September. But in the next breath, Robert Hall, Chairman of the NBER’s Business Cycle Dating Committee was quoted as saying, “The economy is not in good shape.” Somehow, we think the 15 million unemployed Americans probably concur and aren’t rejoicing just yet.*
The U.S. economic rebound, as we’ve noted a few times before, was mostly cosmetic, manufactured almost entirely by temporary and unsustainable growth drivers: unprecedented levels of government stimulus using borrowed money and inventory restocking. The upturn itself, in terms of real final demand, goes down as one of the weakest on record. The economic apocalypse was avoided – and for that we should all be grateful – but we’ve yet to see any meaningful private-sector demand in the U.S.
With interest rates near zero percent, the Federal Reserve (“the Fed”) has taken to unconventional ways to affect monetary policy, like quantitative easing (QE), increasing the supply of money by dramatically expanding its own balance sheet by buying financial assets. But QE is no cure-all. Despite the Fed spending $1.7 trillion to purchase Treasuries, mortgage-backed securities and housing agency bonds, the economy remains fragile and estimates for both economic growth and corporate earnings continue to get nudged lower.
That hasn’t discouraged our central bankers, though. In a monetary experiment with an uncertain outcome, another round of quantitative easing (QE2) is imminent. This will probably lead to a temporary boost in asset prices, but it’s unclear whether it will have the intended effect on the real economy. In anticipation of QE2, Treasury yields have fallen to 2.4%, gold has rallied up to $1,350/oz, equities had their strongest September since 1939 and the dollar has fallen like a stone.**
With a bleak labor market, a still-troubled housing sector where demand is not even stimulated by record-low mortgage rates, a huge debt overhang and a household sector that is still struggling, we believe the macro backdrop is far from rosy.
So how does this poor fundamental backdrop but extreme liquidity translate into our portfolio construction? We remain bullish on the long-term prospects for gold, because to date the government’s only economic plan has been to increase deficit spending and to systematically debase the currency through quantitative easing.
We’re also finding opportunities on the long side in higher quality, larger companies, mostly within the technology and consumer staples areas, many of which have very attractive dividend yields and derive much of their revenue from non-dollar countries. Demand for staples like food and household products is relatively stable regardless of economic activity, and we believe currency diversification in this era of mass debasement is essential.
On the short side, we have more cyclicality and have targeted more fundamentally flawed companies. We also have maintained broad index-related short exposure, especially in small-cap indexes where we expect underperformance relative to large caps. We have increased our net exposure to 20-30% net long as we attempt to participate in the “risk on” trade, but will remain vigilant in our risk controls because we believe any boost in asset prices due to QE will likely be short lived.
During the third quarter, the official government account on the causes and culprits of May’s Flash Crash was released. Though the full report is 104 pages long, it basically attributes the events of May 6 to a single trade by an overeager futures seller. Unfortunately, this report fails to mention the fundamental conditions that might lead to an environment where a crash becomes possible, and it fails to account for the near daily mini-crashes still occurring in individual securities.
Near-zero interest rate environments are unique. Discounting projected cash flows of an investment requires a discount rate, and when the dividend growth rate (or the interest rate) on a security is greater than the discount rate, the fundamental valuation formula becomes meaningless. The projected value becomes infinite, as something close to zero is in the denominator.
As a practical matter, this means we are in a speculative regime with an extreme sensitivity to slight changes in the near-zero interest rates. As the Federal Reserve drives interest rates down to zero, stocks can take on an almost infinite value. However, the process can also work in reverse.
1 | October 31, 2010
Table of Contents
| ALPS | GNI Long-Short Fund | ||||||
Management Commentary |
October 31, 2010 (Unaudited) | |||||
In our opinion, it’s not a coincidence that the Flash Crash occurred two months after the end of the first round of quantitative easing, causing the market to drop over 10% in a few minutes. Many stocks returned to the same trading levels that existed before the Federal Reserve started quantitative easing, but those trades were later erased off the tape. The free market wasn’t broken in March 2009, the government and the banks just didn’t like the prices. They didn’t like the prices in that May swoon either, so they expunged those trades.
Every bubble we have ever studied rises on increasing leverage, then crashes on the reality that it cannot be maintained. Sometimes that process takes a couple of years; sometimes it takes a day. Currently, government leverage as measured by the size of the Federal Reserve’s balance sheet and the federal government’s debt is increasing dramatically. That increasing leverage is raising the prices of securities, but that can all end in a flash as it almost did this May.
We are always grateful for the trust you’ve placed in us with the management of your assets. We cannot be sure how long the current disparity between high quality companies and low quality companies will persist. We cannot be sure of the effects or duration of another round of quantitative easing. But we do believe the current environment is setting up for exciting opportunities for long/short portfolios and we look forward to seeking to capitalize on them on your behalf.
Sincerely,
Charles L. Norton, CFA | Principal
Allen R. Gillespie, CFA | Principal
| * | The National Bureau of Economic Research and The Globe and Mail, “Slow U.S. recovery follows the Great Recession,” Sept. 20, 2010. |
| ** | Financial Times, “US stocks post best September since 1939,” Oct. 1, 2010. |
2 | October 31, 2010
Table of Contents
| ALPS | GNI Long-Short Fund | ||||||
Management Commentary |
October 31, 2010 (Unaudited) | |||||
Performance of $10,000 Initial Investment (as of October 31, 2010)
Comparison of change in value of a $10,000 investment (includes applicable sales loads)
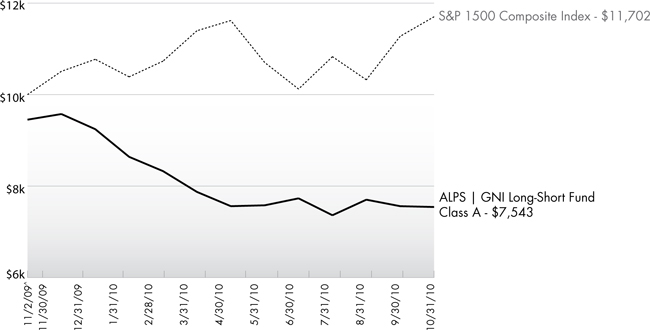
The chart above represents historical performance of a hypothetical investment of $10,000 in the Fund since inception. Past performance does not guarantee future results. This chart does not reflect the deduction of taxes that a shareholder would pay on Fund distributions or the redemption of Fund shares.
3 | October 31, 2010
Table of Contents
| ALPS | GNI Long-Short Fund | ||||||
Management Commentary |
October 31, 2010 (Unaudited) | |||||
Cumulative Return (as of October 31, 2010)
| 6 month | Since Inception^ | Gross Expense Ratio | Net Expense Ratio* | |||||
Class A (NAV)1 | -0.25% | -20.20% | 26.75% | 3.13% | ||||
Class A (MOP)2 | -5.79% | -24.57% | ||||||
Class I | 0.00% | -19.80% | 2.96% | 2.83% | ||||
S&P 1500 Composite Index3 | 0.72% | 17.03% |
Performance data quoted represents past performance. Past performance does not guarantee future results. Investment return and principal value of an investment will fluctuate so that an investor’s shares, when sold or redeemed, may be worth more or less than the original cost. Current performance data may be higher or lower than actual data quoted. The Fund imposes a 2.00% redemption fee on shares held for less than 90 days. The Fund imposes a maximum Contingent Deferred Sales Charge (“CDSC”) of 1.00% to shares redeemed within the first 12 months after a purchase in excess of $1 million. Performance data does not reflect the redemption fee or the CDSC, which if reflected would reduce the performance quoted. For the most current month-end performance data please call (866) 759-5679.
Subject to investment risks, including possible loss of the principal amount invested. Derivatives generally are more sensitive to changes in economic or market conditions than other types of investments; this could result in losses that significantly exceed the funds original investment.
1 Net Asset Value (NAV) is the share price without sales charges. 2 Maximum Offering Price (MOP) includes sales charges. Class A returns include effects of the Fund’s maximum sales charge of 5.50%. 3 S&P Composite 1500: an equity benchmark that combines three leading indices, the S&P 500®, the S&P MidCap 400 and the S&P SmallCap 600 to cover approximately 90% of the U.S. market capitalization. It is designed for investors seeking to replicate the performance of the U.S. equity market or benchmark against a representative universe of tradable stocks. You cannot invest directly in the index. ^ Fund inception date of 11/02/09. * ALPS Advisors, Inc. (the “Adviser”) has given a contractual agreement to the Fund to limit the amount of the Fund’s total annual expenses, exclusive of distribution and service (12b-1) fees, shareholder service fees, acquired fund fees and expenses, short-sale dividend expenses, brokerage expenses, interest expenses, taxes and extraordinary expenses, to 2.00% of the Fund’s average daily net assets. This agreement is in effect through August 31, 2011 and is reevaluated on an annual basis. Without this agreement, expenses could be higher.
The table does not reflect the deduction of taxes that a shareholder would pay on Fund distributions or the redemption of Fund shares.
The Fund enters into a short sale by selling a security it has borrowed. If the market price of a security increases after the Fund borrows the security, the Fund will suffer a potentially unlimited loss when it replaces the borrowed security at the higher price. Short sales also involve transaction and other costs that will reduce potential Fund gains and increase potential Fund losses. Please refer to the prospectus for complete information regarding all risks associated with the fund.
The Fund is less than a year old and has limited operating history. This fund is not suitable for all investors. Subject to investment risks, including possible loss of the principal amount invested.
Derivatives generally are more sensitive to changes in economic or market conditions than other types of investments; this could result in losses that significantly exceed the Fund’s original investment. |
4 | October 31, 2010
Table of Contents
| ALPS | GNI Long-Short Fund | ||||||
|
October 31, 2010 (Unaudited) | |||||
As a shareholder of the Fund, you will incur two types of costs: (1) transaction costs, including applicable sales charges (loads); and (2) ongoing costs, including management fees, distribution and service (12b-1) fees, shareholder service fees and other Fund expenses. The following examples are intended to help you understand your ongoing costs (in dollars) of investing in the Fund and to compare these costs with the ongoing costs of investing in other mutual funds. The examples are based on an investment of $1,000 invested on May 1, 2010 and held until October 31, 2010.
Actual Expenses. The first line of the table on the next page provides information about actual account values and actual expenses. You may use the information in this line, together with the amount you invested, to estimate the expenses that you paid over the period. Simply divide your account value by $1,000 (for example, an $8,600 account value divided by $1,000 = 8.6), then multiply the result by the number in the first line under the heading “Expense Paid During Period” to estimate the expenses you paid on your account during this period.
Hypothetical Example for Comparison Purposes. The second line of the table on the next page provides information about hypothetical account values and hypothetical expenses based on the Fund’s actual expense ratio and an assumed rate of return of 5% per year before expenses, which is not the Fund’s actual return. The hypothetical account values and expenses may not be used to estimate the actual ending account balance or expenses you paid for the period. You may use this information to compare the ongoing costs of investing in the Fund and other mutual funds. To do so, compare this 5% hypothetical example with the 5% hypothetical examples that appear in the shareholder reports of the other funds.
The expenses shown in the table are meant to highlight ongoing Fund costs only and do not reflect transaction fees, such as sales charges or exchange fees. Therefore, the second line of the table on the next page is useful in comparing ongoing costs only, and may not help you determine the relative total costs of owning different funds. In addition, if these transactional costs were included, your costs would have been higher.
The examples are based on an investment of $1,000 invested on May 1, 2010 and held until October 31, 2010.
| Beginning Account Value 5/1/10 | Ending Account Value 10/31/10 | Expense Ratio(a) | Expense Paid During Period(b) 5/1/10-10/31/10 | |||||||||||||
Class A | ||||||||||||||||
Actual | $1,000.00 | $998.70 | 3.12% | $15.72 | ||||||||||||
Hypothetical (5% return before expenses) | $1,000.00 | $1,009.48 | 3.12% | $15.80 | ||||||||||||
Class I | ||||||||||||||||
Actual | $1,000.00 | $1,001.20 | 2.98% | $15.03 | ||||||||||||
Hypothetical (5% return before expenses) | $1,000.00 | $1,010.18 | 2.98% | $15.10 | ||||||||||||
| (a) | The Fund’s expense ratios have been based on the Fund’s most recent fiscal half-year expenses. |
| (b) | Expenses are equal to the Fund’s annualized expense ratio multiplied by the average account value over the period, multiplied by the number of days in the most recent fiscal half year (184), then divided by 365. |
5 | October 31, 2010
Table of Contents
| ALPS | GNI Long-Short Fund | ||||||
|
October 31, 2010 (Unaudited) | |||||
| Shares | Value (Note 1) | |||||||
COMMON STOCKS (75.11%) |
| |||||||
Basic Materials (16.99%) |
| |||||||
Mining (16.99%) |
| |||||||
Cia de Minas Buenaventura SA, ADR | 11,500 | $ | 609,960 | |||||
Newmont Mining | 13,000 | 791,310 | ||||||
| 1,401,270 | ||||||||
TOTAL BASIC MATERIALS |
| 1,401,270 | ||||||
Communications (5.33%) |
| |||||||
Internet (5.33%) |
| |||||||
Baidu, Inc., Sponsored ADR(a) | 4,000 | 440,040 | ||||||
TOTAL COMMUNICATIONS |
| 440,040 | ||||||
Consumer, Non-Cyclical (42.27%) |
| |||||||
Agriculture (18.97%) |
| |||||||
Archer-Daniels-Midland Co. | 18,000 | 599,760 | ||||||
Philip Morris International, | 16,500 | 965,250 | ||||||
| 1,565,010 | ||||||||
Beverages (5.95%) |
| |||||||
The Coca-Cola Co. | 8,000 | 490,560 | ||||||
Biotechnology (4.87%) |
| |||||||
Dendreon Corp.(a) | 11,000 | 401,500 | ||||||
Food (7.43%) |
| |||||||
Kraft Foods, Inc., Class A | 19,000 | 613,130 | ||||||
Pharmaceuticals (5.05%) |
| |||||||
Medicis Pharmaceutical Corp., Class A | 14,000 | 416,500 | ||||||
TOTAL CONSUMER, NON-CYCLICAL |
| 3,486,700 | ||||||
Financial (5.35%) |
| |||||||
Insurance (5.35%) |
| |||||||
American International Group, Inc.(a) | 10,500 | 441,105 | ||||||
TOTAL FINANCIAL |
| 441,105 | ||||||
Technology (5.17%) |
| |||||||
Software (5.17%) |
| |||||||
Microsoft Corp.(b) | 16,000 | 426,240 | ||||||
TOTAL TECHNOLOGY |
| 426,240 | ||||||
| Shares | Value (Note 1) | |||||||
TOTAL COMMON STOCKS |
| |||||||
(Cost $5,643,758) | 6,195,355 | |||||||
| Shares | Value (Note 1) | |||||||||||
EXCHANGE TRADED FUNDS (5.22%) |
| |||||||||||
SPDR Gold Shares(a) |
| 3,250 | $ | 431,080 | ||||||||
TOTAL EXCHANGE TRADED FUNDS |
| |||||||||||
(Cost $366,262) |
| 431,080 | ||||||||||
| Expiration Date | Exercise Price | Number of Contracts | Value (Note 1) | |||||||||
PURCHASED PUT OPTIONS (5.03%) |
| |||||||||||
F5 Networks, Inc |
| |||||||||||
January, 2011 | $100.00 | 100 | 35,500 | |||||||||
iShares Russell 2000 Index Fund |
| |||||||||||
January, 2011 | 69.00 | 400 | 130,400 | |||||||||
Moody’s Corp. |
| |||||||||||
January, 2011 | 25.00 | 200 | 21,400 | |||||||||
SPDR S&P 500 |
| |||||||||||
January, 2011 | 116.00 | 600 | 227,400 | |||||||||
TOTAL PURCHASED PUT OPTIONS |
| |||||||||||
(Cost $536,500) |
| 414,700 | ||||||||||
| 7-Day Yield | Shares/ Principal Amount | Value (Note 1) | ||||||||||
SHORT TERM INVESTMENTS (30.78%) |
| |||||||||||
Money Market Fund (6.53%) |
| |||||||||||
Dreyfus Treasury Prime Cash Management Fund, Investor Shares |
| |||||||||||
| 0.00004 | % | 538,720 | 538,720 | |||||||||
U.S. Government & Agency Obligations (24.25%) |
| |||||||||||
U.S. Treasury Bill DN(b) |
| |||||||||||
11/26/10 | 0.13 | % | $2,000,000 | 1,999,862 | ||||||||
TOTAL SHORT TERM INVESTMENTS |
| |||||||||||
(Cost $2,538,582) |
| 2,538,582 | ||||||||||
TOTAL INVESTMENTS - (116.14%) |
| |||||||||||
(Cost $9,085,102) |
| $ | 9,579,717 | |||||||||
Liabilities in Excess of Other Assets (-16.14%) |
| (1,330,969 | ) | |||||||||
NET ASSETS (100.00%) |
| $ | 8,248,748 | |||||||||
6 | October 31, 2010
Table of Contents
| ALPS | GNI Long-Short Fund | ||||||
Statement of Investments |
October 31, 2010 (Unaudited) | |||||
| Expiration Date | Exercise Price | Number of Contracts | Value (Note 1) | |||||||||||||
PUT OPTIONS WRITTEN(a) |
| |||||||||||||||
iShares Russell 2000 Index Fund |
| |||||||||||||||
| January, 2011 | $64.00 | 200 | $ | (34,600 | ) | |||||||||||
Moody’s Corp. |
| |||||||||||||||
| January, 2011 | $20.00 | 200 | (4,400 | ) | ||||||||||||
SPDR S&P 500 |
| |||||||||||||||
| January, 2011 | 110.00 | 300 | (63,600 | ) | ||||||||||||
TOTAL PUT OPTIONS WRITTEN (Premiums received $123,398) |
|
| (102,600 | ) | ||||||||||||
TOTAL OPTIONS WRITTEN (Premiums received $123,398) |
|
| $ (102,600) |
| ||||||||||||
| SCHEDULE OF SECURITIES SOLD SHORT | Shares | Value (Note 1) | ||||||
COMMON STOCKS |
| |||||||
AutoZone, Inc.(a) | (800 | ) | $ | (190,104 | ) | |||
Boston Beer Co., Inc., Class A(a) | (3,500 | ) | (250,565 | ) | ||||
Brown-Forman Corp., Class B | (2,500 | ) | (152,025 | ) | ||||
Career Education Corp.(a) | (3,000 | ) | (52,620 | ) | ||||
First Solar, Inc.(a) | (700 | ) | (96,376 | ) | ||||
Foot Locker, Inc. | (6,000 | ) | (95,580 | ) | ||||
Garmin, Ltd. | (3,500 | ) | (114,940 | ) | ||||
Intuitive Surgical, Inc.(a) | (465 | ) | (122,272 | ) | ||||
NetFlix, Inc.(a) | (1,000 | ) | (173,500 | ) | ||||
OfficeMax, Inc.(a) | (6,000 | ) | (106,200 | ) | ||||
ProShares Ultra S&P500 | (12,000 | ) | (508,200 | ) | ||||
Regions Financial Corp. | (17,500 | ) | (110,250 | ) | ||||
| Shares | Value (Note 1) | |||||||
COMMON STOCKS (continued) |
| |||||||
RPC, Inc. | (5,500 | ) | $ | (121,055 | ) | |||
Salesforce.com, Inc(a) | (1,000 | ) | (116,070 | ) | ||||
Terex Corp.(a) | (2,500 | ) | (56,125 | ) | ||||
Williams-Sonoma, Inc. | (3,000 | ) | (97,110 | ) | ||||
TOTAL SECURITIES SOLD SHORT (Proceeds $2,250,009) |
| $ (2,362,992 | ) | |||||
Common Abbreviations:
ADR - American Depositary Receipt
DN - Discount Note
SA - Generally designates corporations in various countries, mostly employing the civil law.
S&P - Standard & Poor’s
SPDR - Standard & Poor’s Depositary Receipt
| (a) | Non-Income Producing Security. |
| (b) | All or a portion of the security is pledged as collateral on written options and/or short sales as of October 31, 2010. Aggregate collateral segregation to cover margin or segregration requirements on options contracts and short sales as of October 31, 2010 was $3,166,832. |
For Fund compliance purposes, the Fund’s industry classifications refer to any one or more of the industry sub-classifications used by one or more widely recognized market indexes or ratings group indexes, and/or as defined by Fund management. This definition may not apply for purposes of this report, which may combine industry sub-classifications for reporting ease. Industries are shown as a percent of net assets. These industry classifications are based on third party definitions. The definitions are industry terms and do not reflect the legal status of any of the investments or the companies in which the Fund has invested.
See Notes to Financial Statements.
Top Ten Long Holdings (as a % of Net Assets) †
Philip Morris International, Inc. | 11.70 | % | ||
Newmont Mining Corp. | 9.59 | % | ||
Kraft Foods, Inc., Class A | 7.43 | % | ||
Cia de Minas Buenaventura SA, ADR | 7.39 | % | ||
Archer-Daniels-Midland Co. | 7.27 | % | ||
The Coca-Cola Co. | 5.95 | % | ||
American International Group, Inc. | 5.35 | % | ||
Baidu, Inc. ADR | 5.33 | % | ||
Microsoft Corp. | 5.17 | % | ||
Medicis Pharmaceutical Corp., Class A | 5.05 | % | ||
Top Ten Long Holdings | 70.23 | % | ||
† Holdings are subject to change. | ||||
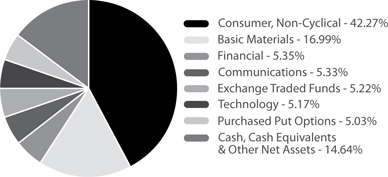
Industry Sector Allocation (Long Positions as a % of Net Assets)
7 | October 31, 2010
Table of Contents
| ALPS | Red Rocks Listed Private Equity Fund | ||||||
|
October 31, 2010 (Unaudited) | |||||
Overview
The first half of this fiscal year may go down as one of the strangest in our history of managing the ALPS | Red Rocks Listed Private Equity Fund (the “Fund”). Strange because the see-saw nature of world economic news, and the ensuing manic behavior of the equity markets was, at times, out of sync with the overall positive fundamental news coming from our portfolio companies. That development coupled with the quiet and orderly flow of activity in the listed private equity markets made for an almost surreal six months. There were no disruptions (major or minor) in the private equity world on which we focus. The debt markets continued to be accommodating to the underlying businesses of our listed private equity portfolio. In addition, the mergers and acquisitions environment was very robust with a number of transactions being both announced and consummated during the period ended October 31, 2010. In almost all examples such transactions had a positive impact on the most recent carrying valuations of our portfolio companies. In summary, the healing process of the previous year has continued.
That’s not to say that everything is back to normal and times are good. They’re far from it. Our portfolio companies, and their existing underlying businesses, continue to be challenged to find top line organic growth in a less than robust world. Consumers and corporations alike are extremely picky as to where they spend their sacred cash. The new strategy appears to be one of deferral: defer purchases until absolutely needed, or until something actually breaks or wears out. Doing more with less appears to be the new mantra. And de-levering is all the rage, whether by choice or not.
All of these issues have conspired to make for extremely challenging times for the private equity world. The management teams of our listed private equity portfolio are working harder than ever. Harder in squeezing out value through operational excellence in the businesses they own - and not through financial engineering. Harder in finding new businesses to invest in - the competition for high quality acquisition targets has rarely been higher. Harder in searching for investment alternatives in an ever-changing and different environment.
We seriously doubt that anyone had a relaxing and easy summer in the private equity world in which we invest.
Portfolio Review
For the six months ended October 31, 2010, the Class A shares returned 1.46% net of fees and sales loads, compared with 4.11% and 3.05% for the S&P Listed Private Equity Index and the MSCI World Index, respectively. As has become typical, we made few changes to the portfolio during the previous six months. The historically low turnover of the portfolio builds on our theme of being long-term investors in listed private equity companies, especially when management is steadfast in its execution.
Overall, we were quite pleased with how the portfolio performed during the previous six months, meeting, or in certain cases, exceeding our expectations.
Net contributors to performance for the six-month period included:
| » | 3i Group: 3i Group continued to be quite active, achieving liquidity within the portfolio (MHM Holding GmbH is being sold for to Caterpillar for approximately $810M), making several new investments, and forming a separate business line through the purchase of Mizuho Investment Management UK, a debt asset manager. In addition, 3i has reduced its net debt by $1.5B+ in the past year. |
| » | Intermediate Capital Group: The purchase of Royal Bank of Scotland’s €1.4 billion corporate loan portfolio by Intermediate Capital was seen as a major positive by the investor public. |
Net detractors to performance for the six-month period included:
| » | Jafco: The Japanese economy continues to be challenged from a growth perspective, muting any positive liquidity events for Jafco. |
| » | Candover Investments: After doubling in price from the beginning of 2010 to the end of April, Candover gave back a good portion of its stock price gains. The primary culprit, of the run up and the give back, was the rumored takeover of Candover by a Canadian pension plan which failed to materialize. Notwithstanding, Candover achieved several liquidity events (including Ontex and Equity Trust), and looks to be on firmer footing in 2010. |
The portfolio has seen very little movement from a diversification standpoint. Broad indirect geographic, industry, vintage and stage of investment diversification is the cornerstone of the Red Rocks listed private equity strategy. Investors in our product continue to receive institutional exposure to the private equity asset class without the inherent risk that can be associated with a non-diversified portfolio approach.
8 | October 31, 2010
Table of Contents
| ALPS | Red Rocks Listed Private Equity Fund | ||||||
Management Commentary |
October 31, 2010 (Unaudited) | |||||
Looking Ahead
Uncertainty surrounding the future is THE topic that we continue to hear about. Are we entering a period of prolonged deflation? When will the consumer come back? What about government spending and taxes? What’s going to happen with China, especially with respect to trade and its currency, the yuan? Are Portugal, Italy, Ireland, Greece and Spain real problems that can significantly disrupt the European Union (and the rest of the world), or is that concern overblown? How is the developed world going to pay for the ever increasing amounts of government debt and unfunded liabilities? Is the banking system truly fixed and on sustainable ground?
The answer to these questions and many more is: no one knows, at least not yet.
A potentially more relevant question is how will the outcomes of these issues affect the listed private equity portfolio that we’re managing for you, our shareholders? We continue to ask ourselves that question on a daily basis. While we may not have THE answer(s), we have positioned the portfolio to both weather the continuing storm of uncertainty and to benefit as conditions improve and hopefully move forward.
As always, we appreciate your continued support and interest in Red Rocks and in the ALPS | Red Rocks Listed Private Equity Fund.
Adam Goldman | Co-Portfolio Manager
Performance of $10,000 Initial Investment (as of October 31, 2010)
Comparison of change in value of a $10,000 investment (includes applicable sales loads)
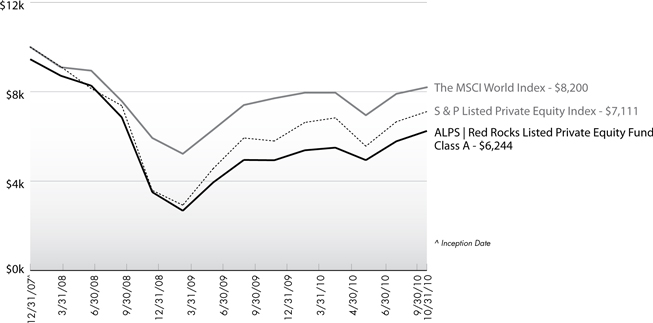
Source: Morningstar
The chart above represents historical performance of a hypothetical investment of $10,000 in the Fund since inception. Past performance does not guarantee future results. This chart does not reflect the deduction of taxes that a shareholder would pay on Fund distributions or the redemption of Fund shares.
9 | October 31, 2010
Table of Contents
| ALPS | Red Rocks Listed Private Equity Fund | ||||||
Management Commentary |
October 31, 2010 (Unaudited) | |||||
| Average Annual Total Returns (as of October 31, 2010) | ||||||||||
| 6 Month Cummulative Returns | 1 Year | Since Inception^ | Gross Expense Ratio | Net Expense Ratio* | ||||||
Class A (NAV)1 | 7.35% | 22.60% | -15.30% | 1.86% | 1.65% | |||||
Class A (MOP)2 | 1.46% | 15.93% | -16.97% | |||||||
Class C (NAV)1 | 6.44% | 21.11% | -16.08% | 2.46% | 2.40% | |||||
Class C (CDSC)2 | 5.44% | 20.11% | -16.08% | |||||||
Class I | 7.32% | 22.97% | -15.06% | 1.62% | 1.40% | |||||
Class R | 6.77% | 21.93% | -15.80% | 2.42% | 1.90% | |||||
MSCI World Index3 | 3.05% | 12.74% | -6.76% | |||||||
S&P LPE Index4 | 4.11% | 28.81% | -11.34% | |||||||
Performance data quoted represents past performance. Past performance does not guarantee future results. Investment return and principal value of an investment will fluctuate so that an investor’s shares, when sold or redeemed, may be worth more or less than the original cost. Current performance data may be higher or lower than actual data quoted. The Fund imposes a 2.00% redemption fee on shares held for less than 90 days. The Fund imposes a maximum Contingent Deferred Sales Charge (“CDSC”) of 1.00% to shares redeemed within the first 12 months after a purchase in excess of $1 million. Performance data does not reflect the redemption fee or the CDSC, which if reflected would reduce the performance quoted. For the most current month-end performance data, please call (866) 759-5679.
Maximum Offering Price (MOP) for Class A shares includes the Fund’s maximum sales charge of 5.50%. CDSC performance for Class C shares includes a 1% contingent deferred sales charge (CDSC) on C shares redeemed within 12 months of purchase. Performance shown at NAV does not include these sales charges and would have been lower had it been taken into account.
Performance shown for Class C shares prior to June 30, 2010 reflects the historical performance of the Fund’s Class A shares, calculated using the fees and expenses of Class C shares.
1 Net Asset Value (NAV) is the share price without sales charges. The performance data shown does not reflect the decution of the sales load or the redemption fee or CDSC, and that, if reflected, the load or fee would reduce the performance quoted. 2 Maximum Offering Price (MOP) includes sales charges. Returns include effects of the Fund’s maximum sales charge of 5.50% for ALPS/Red Rocks Listed Private Equity Fund - A Shares. 3 MSCI World Index: Morgan Stanley Capital International’s market capitalization weighted index is composed of companies representative of the market structure of 22 developed market countries in North America, Europe and the Asia/Pacific Region. You cannot invest directly in the index. 4 S&P Listed Private Equity Index: The S&P Listed Private Equity Index is comprised of 30 leading listed private equity companies that meet size, liquidity, exposure, and activity requirements. The index is designed to provide tradable exposure to the leading publicly listed companies in the private equity space. ^ Fund inception date of 12/31/2007. The Fund began trading on 1/2/2008. * Effective through August 31, 2011, the Adviser and the Red Rocks Capital LLC (the “Sub-Adviser”) have given a contractual agreement to the Fund to limit the amount of the Fund’s total annual expenses, exclusive of distribution and service (12b-1) fees, shareholder service fees (C shares only), acquired fund fees and expenses, brokerage expenses, interest expenses, taxes and extraordinary expenses, to 1.25% of the Fund’s average daily net assets. This agreement is reevaluated on an annual basis. Without this agreement expenses could be higher.
The table does not reflect the deduction of taxes that a shareholder would pay on Fund distributions or the redemption of Fund shares.
Listed Private Equity Companies are subject to various risks depending on their underlying investments, which could include, but are not limited to, additional liquidity risk, industry risk, non-U.S. security risk, currency risk, credit risk, managed portfolio risk and derivatives risk (derivatives risk is the risk that the value of the Listed Private Equity Companies’ derivative investments will fall because of pricing difficulties or lack of correlation with the underlying investment).
There are inherent risks in investing in private equity companies, which encompass financial institutions or vehicles whose principal business is to invest in and lend capital to privately held companies. Generally, little public information exists for private and thinly traded companies, and there is a risk that investors may not be able to make a fully informed investment decision.
Listed Private Equity Companies may have relatively concentrated investment portfolios, consisting of a relatively small number of holdings. A consequence of this limited number of investments is that the aggregate returns realized may be adversely impacted by the poor performance of a small number of investments, or even a single investment, particularly if a company experiences the need to write down the value of an investment.
Certain of the Fund’s investments may be exposed to liquidity risk due to low trading volume, lack of a market maker or legal restrictions limiting the ability of the Fund to sell particular securities at an advantageous price and/or time. As a result, these securities may be more difficult to value. Foreign investing involves special risks, such as currency fluctuations and political uncertainty. The Fund invests in derivatives and is subject to the risk that the value of those derivative investments will fall because of pricing difficulties or lack of correlation with the underlying investment. | ||||||||||
10 | October 31, 2010
Table of Contents
| ALPS | Red Rocks Listed Private Equity Fund | ||||||
As a shareholder of the Fund, you will incur two types of costs: (1) transaction costs, including applicable sales charges (loads) and redemption fees; and (2) ongoing costs, including management fees, distribution and service (12b-1) fees, shareholder service fees and other Fund expenses. The following examples are intended to help you understand your ongoing costs (in dollars) of investing in the Fund and to compare these costs with the ongoing costs of investing in other mutual funds. The examples are based on an investment of $1,000 invested on May 1, 2010 and held until October 31, 2010.
Actual Expenses. The first line of the table on the next page provides information about actual account values and actual expenses. You may use the information in this line, together with the amount you invested, to estimate the expenses that you paid over the period. Simply divide your account value by $1,000 (for example, an $8,600 account value divided by $1,000 = 8.6), then multiply the result by the number in the first line under the heading “Expense Paid During Period” to estimate the expenses you paid on your account during this period.
Hypothetical Example for Comparison Purposes. The second line of the table on the next page provides information about hypothetical account values and hypothetical expenses based on the Fund’s actual expense ratio and an assumed rate of return of 5% per year before expenses, which is not the Fund’s actual return. The hypothetical account values and expenses may not be used to estimate the actual ending account balance or expenses you paid for the period. You may use this information to compare the ongoing costs of investing in the Fund and other mutual funds. To do so, compare this 5% hypothetical example with the 5% hypothetical examples that appear in the shareholder reports of the other funds.
The expenses shown in the table are meant to highlight ongoing Fund costs only and do not reflect transaction fees, such as sales charges, redemption fees, or exchange fees. Therefore, the second line of the table on the next page is useful in comparing ongoing costs only, and may not help you determine the relative total costs of owning different funds. In addition, if these transactional costs were included, your costs would have been higher.
The examples are based on an investment of $1,000 invested on May 1, 2010 and held until October 31, 2010. |
| Beginning Account Value 5/1/10 | Ending Account Value 10/31/10 | Expense Ratio(a) | Expense Paid During Period(b) 5/1/10- 10/31/10 | |||||||||||||
Class A | ||||||||||||||||
Actual | $1,000.00 | $1,073.50 | 1.50% | $7.84 | ||||||||||||
Hypothetical (5% return before expenses) | $1,000.00 | $1,017.64 | 1.50% | $7.63 | ||||||||||||
Class C(c) | ||||||||||||||||
Actual | $1,000.00 | $1,064.40 | 2.25% | $7.76 | ||||||||||||
Hypothetical (5% return before expenses) | $1,000.00 | $1,017.68 | 2.25% | $11.42 | ||||||||||||
Class I | ||||||||||||||||
Actual | $1,000.00 | $1,073.20 | 1.25% | $6.53 | ||||||||||||
Hypothetical (5% return before expenses) | $1,000.00 | $1,018.90 | 1.25% | $6.36 | ||||||||||||
Class R | ||||||||||||||||
Actual | $1,000.00 | $1,067.70 | 1.75% | $9.12 | ||||||||||||
Hypothetical (5% return before expenses) | $1,000.00 | $1,016.38 | 1.75% | $8.89 | ||||||||||||
| (a) | The Fund’s expense ratios have been based on the Fund’s most recent fiscal half-year expenses. |
| (b) | Expenses are equal to the Fund’s annualized expense ratio multiplied by the average account value over the period, multiplied by the number of days in the most recent fiscal half year (184), then divided by 365. |
| (c) | Class C shares commenced operations on July 2, 2010. |
11 | October 31, 2010
Table of Contents
| ALPS | Red Rocks Listed Private Equity Fund | ||||||
|
October 31, 2010 (Unaudited) | |||||
| Shares | Value (Note 1) | |||||||
COMMON STOCKS (99.29%) |
| |||||||
Communications (1.56%) |
| |||||||
Internet (1.56%) |
| |||||||
Internet Capital Group, Inc.(a) | 171,000 | $ | 2,135,790 | |||||
TOTAL COMMUNICATIONS | 2,135,790 | |||||||
Consumer, Non-Cyclical (1.40%) |
| |||||||
Food (1.40%) |
| |||||||
Orkla ASA | 198,000 | 1,916,914 | ||||||
TOTAL CONSUMER, NON-CYCLICAL |
| 1,916,914 | ||||||
Diversified (12.21%) |
| |||||||
Holding Companies-Diversified Operations (12.21%) |
| |||||||
Ackermans & van Haaren N.V. | 34,300 | 2,956,000 | ||||||
HAL Trust | 34,400 | 4,194,129 | ||||||
Leucadia National Corp.(a) | 225,300 | 5,727,126 | ||||||
Wendel Investissement | 49,000 | 3,797,297 | ||||||
| 16,674,552 | ||||||||
TOTAL DIVERSIFIED |
| 16,674,552 | ||||||
Financial (84.12%) | ||||||||
Closed-End Funds (25.97%) |
| |||||||
AP Alternative Assets LP | 481,600 | 3,621,632 | ||||||
ARC Capital Holdings, Ltd.(a) | 2,488,000 | 2,948,280 | ||||||
Candover Investments PLC(a) | 171,000 | 1,986,524 | ||||||
Castle Private Equity, Ltd.(a) | 85,000 | 669,427 | ||||||
Conversus Capital LP(a) | 347,000 | 6,003,100 | ||||||
Electra Private Equity PLC(a) | 166,000 | 4,154,788 | ||||||
Graphite Enterprise Trust PLC | 572,357 | 2,751,364 | ||||||
HBM BioVentures AG, Class A(a) | 75,927 | 3,136,459 | ||||||
HgCapital Trust PLC(a) | 47,670 | 66,073 | ||||||
HgCapital Trust PLC | 190,000 | 2,864,857 | ||||||
Princess Private Equity | ||||||||
Holding, Ltd.(a) | 346,472 | 2,623,290 | ||||||
Standard Life European Private | ||||||||
Equity Trust PLC | 40,178 | 80,153 | ||||||
SVG Capital PLC(a) | 1,407,666 | 4,556,283 | ||||||
| 35,462,230 | ||||||||
Diversified Financial Services (23.11%) |
| |||||||
Blackstone Group LP | 401,500 | 5,412,220 | ||||||
GP Investments, Ltd.(a) | 517,000 | 2,189,261 | ||||||
Intermediate Capital Group PLC | 1,133,900 | 5,865,000 | ||||||
KKR & Co. LP | 833,600 | 10,570,048 | ||||||
Onex Corp. | 256,600 | 7,515,091 | ||||||
| 31,551,620 | ||||||||
| Shares | Value (Note 1) | |||||||||||
Investment Companies (18.93%) |
| |||||||||||
American Capital Strategies, Ltd.(a) | 217,000 | $ | 1,514,660 | |||||||||
Apollo Investment Corp. | 127,500 | 1,401,225 | ||||||||||
China Merchants China | ||||||||||||
Direct Investments, Ltd. | 1,066,000 | 2,461,719 | ||||||||||
DeA Capital SpA(a) | 761,000 | 1,388,566 | ||||||||||
Eurazeo | 83,300 | 6,330,193 | ||||||||||
Investor AB, Class B | 188,000 | 3,858,705 | ||||||||||
MVC Capital, Inc. | 119,300 | 1,592,655 | ||||||||||
Ratos AB, B Shares | 152,200 | 5,427,536 | ||||||||||
RHJ International(a) | 240,450 | 1,874,097 | ||||||||||
| 25,849,356 | ||||||||||||
Private Equity (15.14%) |
| |||||||||||
3i Group PLC | 1,553,000 | 7,455,435 | ||||||||||
Altamir Amboise(a) | 388,000 | 3,040,321 | ||||||||||
Deutsche Beteiligungs AG | 81,610 | 2,363,713 | ||||||||||
Dinamia Capital Privado | ||||||||||||
S.C.R., SA | 110,770 | 1,347,451 | ||||||||||
GIMV N.V. | 70,400 | 3,892,875 | ||||||||||
IP Group PLC(a) | 1,145,315 | 532,209 | ||||||||||
JAFCO Co., Ltd. | 98,050 | 2,049,461 | ||||||||||
| 20,681,465 | ||||||||||||
Real Estate (0.97%) |
| |||||||||||
Brookfield Asset Management, | ||||||||||||
Inc., Class A | 44,500 | 1,322,540 | ||||||||||
TOTAL FINANCIAL |
| 114,867,211 | ||||||||||
TOTAL COMMON STOCKS |
| |||||||||||
(Cost $108,466,055) |
| 135,594,467 | ||||||||||
| 7-Day Yield | Shares | Value (Note 1) | ||||||||||
SHORT TERM INVESTMENTS (0.71%) |
| |||||||||||
Money Market Fund (0.71%) |
| |||||||||||
Dreyfus Treasury Prime Cash Management, Investor Shares | 0.00004 | % | 961,958 | 961,958 | ||||||||
TOTAL SHORT TERM INVESTMENTS (Cost $961,958) |
| 961,958 | ||||||||||
TOTAL INVESTMENTS (100.00%) |
| |||||||||||
(Cost $109,408,013) |
| $ | 136,556,425 | |||||||||
Other Assets in Excess |
| 3,291 | ||||||||||
NET ASSETS (100.00%) |
| $ | 136,559,716 | |||||||||
12 | October 31, 2010
Table of Contents
| ALPS | Red Rocks Listed Private Equity Fund | ||||||
Statement of Investments |
October 31, 2010 (Unaudited) | |||||
Common Abbreviations:
AB - Aktiebolag is the Swedish equivalent of the term corporation.
AG - Aktiengesellschaft is a German term that refers to a corporation that is limited by shares, i.e., owned by shareholders.
ASA - Allmennaksjeselskap is the Norweigian term for a public company.
LP - Limited Partnership
Ltd. - Limited
N.V. - Naamloze Vennootschap is the Dutch term for a public limited liability corporation.
PLC - Public Limited Company
SA - Generally designates corporations in various countries, mostly those employing the civil law. This translates literally in all languages mentioned as anonymous company.
SpA - Societa Per azioni is an Italian shared company.
| (a) | Non-Income Producing Security. |
| (b) | Less than 0.005% of Net Assets. |
For Fund compliance purposes, the Fund’s industry classifications refer to any one or more of the industry sub-classifications used by one or more widely recognized market indexes or ratings group indexes, and/or as defined by Fund management. This definition may not apply for purposes of this report, which may combine industry sub-classifications for reporting ease. Industries are shown as a percent of net assets. These industry classifications are based on third party definitions and are unaudited. The definitions are industry terms and do not reflect the legal status of any of the investments or the companies in which the Fund has invested.
See Notes to Financial Statements.
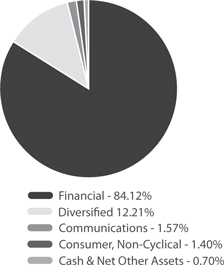
Top Ten Holdings (as a % of Net Assets) †
KKR & Co. LP | 7.74% | |||
Onex Corp. | 5.50% | |||
3i Group PLC | 5.46% | |||
Eurazeo | 4.64% | |||
Conversus Capital LP | 4.40% | |||
Intermediate Capital Group PLC | 4.29% | |||
Leucadia National Corp. | 4.19% | |||
Ratos AB, B Shares | 3.97% | |||
Blackstone Group LP | 3.96% | |||
SVG Capital PLC | 3.34% | |||
Top Ten Holdings | 47.49% |
| † | Holdings are subject to change. |
Industry Sector Allocation (as a % of Net Assets)
13 | October 31, 2010
Table of Contents
| ALPS | WMC Value Intersection Fund | ||||||
|
October 31, 2010 (Unaudited) | |||||
Market Comment
US equities rebounded in the latter part of the period as investors shrugged off concerns about the pace of economic growth. Strong corporate earnings, and robust merger and acquisition activity boosted investors’ enthusiasm for stocks. Favorable economic data helped to ease fears of a double-dip global recession and increase investors’ appetite for risk. The September and October rally erased much of the losses experienced early on in the period and pushed the broad market back into positive ground for the six months ending October 31, 2010.
Within the Russell 1000 Value Index, seven of the ten sectors recorded positive absolute returns during the period. Telecommunications Services, Utilities, and Consumer Staples led the Index higher posting the most positive returns while Financials, Industrials, and Consumer Discretionary lagged.
Fund Review
The Portfolio outperformed the Index, net of fees, for the period posting positive relative results in six of the ten broad market sectors. Strong stock selection in the Consumer Staples, Health Care, and Financials sectors more than offset negative returns within the Consumer Discretionary and Telecommunications Services sectors.
Among the top relative contributors to performance were TRW Automotive Holdings (Consumer Discretionary), Freeport-McMoRan (Materials) and Ameriprise Financial (Financials). Auto supplier TRW Automotive’s results exceeded expectations and management raised guidance citing a reduced cost structure, new business wins, and higher levels of vehicle production. Freeport-McMoRan, a global mining company with attractive copper and gold assets, is benefiting from solid demand trends and favorable pricing for copper. Ameriprise Financial is a provider of financial planning and asset management products and services. Higher average balances and good expense control at its Wealth Management and Asset Management businesses contributed to higher margins and profits. We believe the company should benefit from continued margin improvements in these divisions. Additionally, the acquisition of Columbia Management offers additional upside for the stock.
Among the top relative detractors to performance were Gap (Consumer Discretionary), Wells Fargo & Company (Financials) and Office Depot (Consumer Discretionary). Gap is a US-based global specialty retailer offering clothing, accessories, and personal care products. The company reported better-than expected second quarter earnings; however, sales disappointed and increasing inventory levels raised concerns about potential markdown risk. We trimmed our position due to softer sales trends. Wells Fargo, a diversified financial services company, shares declined modestly during the period due to ongoing concerns about regulatory pressures and the risk of mortgage “put backs”. We continue to hold our position as the shares trade at a low multiple of normalized earnings (average earnings over a cycle), as we believe the impact of put backs, if it occurs, should be very small, and overall we feel the company should benefit from an improving economy. Office Depot is a provider of office products, services, and supplies globally. Our holdings in Office Depot detracted from relative performance during the period as investors started to discount the potential for economic slowing in the second half of 2010. Given the company’s broad enterprise exposure and earnings sensitivity to incremental sales, we believe that the stock remains attractive in a scenario where we see a continued economic recovery.
Outlook
Throughout much of the recent downturn, developed market fiscal and monetary stimulus provided much-needed support to the global economy. While this was beneficial in the short term, over the longer run we believe it has the potential to open the door to imbalances in the economy as the government squeezes out private sector growth. As the recovery progresses and stimulus spending winds down, we believe that growth in the more efficient, productivity-enhancing private sector will provide sluggish Gross Domestic Product expansion for 2011. Global deflation is unlikely due to an unprecedented amount of government fiscal and monetary stimulus. The US Government recently announced that it intends to further support the economy through additional quantitative easing, if necessary. Given the high level of developed market economic slack created by the recession, we believe policy bias is likely to remain loose for some time.
14 | October 31, 2010
Table of Contents
| ALPS | WMC Value Intersection Fund | ||||||
Management Commentary |
October 31, 2010 (Unaudited) | |||||
The Fund focuses on stock selection as the key driver of returns and uses proprietary fundamental and quantitative research in a disciplined framework to build a portfolio of the most attractive stocks. We are confident this unique investment process can provide shareholders with more consistent and style pure investment results. Sector exposures are residuals from this bottom-up stock selection process and are not explicit management decisions. Based on individual stock decisions, the Fund ended the period most overweight the Industrials, Consumer Discretionary, and Energy sectors and most underweight Consumer Staples, Telecommunication Services, and Information Technology sectors relative to the Russell 1000 Value Index, the Fund’s benchmark.
Performance of $10,000 Initial Investment (as of October 31, 2010)
Comparison of change in value of a $10,000 investment (includes applicable sales loads)
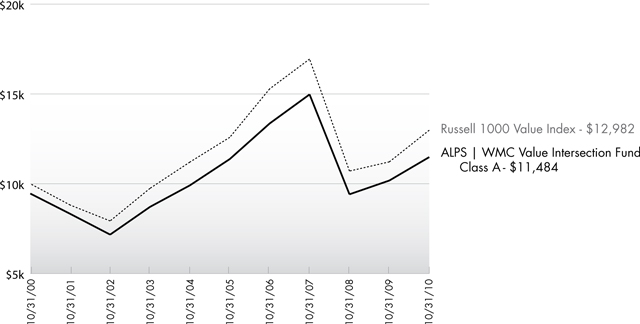
Source: Morningstar
The chart above represents historical performance of a hypothetical investment of $10,000 in the Fund since inception. Past performance does not guarantee future results. This chart does not reflect the deduction of taxes that a shareholder would pay on Fund distributions or the redemption of Fund shares.
15 | October 31, 2010
Table of Contents
| ALPS | WMC Value Intersection Fund | ||||||
Management Commentary |
October 31, 2010 (Unaudited) | |||||
| Average Annual Total Returns (as of October 31, 2010) |
| 6 Month Cummulative Returns | 1 Year | 5 Year | 10 Year | Gross Expense Ratio | Net Expense Ratio^ | |||||||
Class A (NAV)1 | -1.21% | 12.80% | 0.19% | 1.96% | 1.71% | 1.41% | ||||||
Class A (MOP)2 | -6.62% | 6.64% | -0.93% | 1.39% | ||||||||
Class C (NAV)1 | -1.47% | 12.08% | -0.54% | 1.22% | 2.46% | 2.16% | ||||||
Class C (CDSC)2 | -2.46% | 11.08% | -0.54% | 1.22% | ||||||||
Class I | -1.07% | 13.13% | 0.38% | 2.11% | 1.50% | 1.16% | ||||||
Russell 1000 Value Index3 | -1.75% | 15.71% | 0.62% | 2.64% | ||||||||
S&P 500 Index4 | 0.74% | 16.52% | 1.73% | -0.02% |
Performance data quoted represents past performance. Past performance does not guarantee future results. Investment return and principal value of an investment will fluctuate so that an investor’s shares, when sold or redeemed, may be worth more or less than the original cost. Current performance data may be higher or lower than actual data quoted. The Fund imposes a maximum Contingent Deferred Sales Charge (“CDSC”) of 1.00% to shares redeemed within the first 12 months after a purchase in excess of $1 million. Performance data does not reflect the redemption fee or the CDSC, which if reflected would reduce the performance quoted. For the most current month-end performance data, please call (866) 759-5679.
Maximum Offering Price (MOP) for Class A shares includes the Fund’s maximum sales charge of 5.50%. CDSC performance for Class C shares includes a 1% CDSC on C shares redeemed within 12 months of purchase. Performance shown at NAV does not include these sales charges and would have been lower had it been taken into account.
Performance shown for Class C shares prior to June 30, 2010 reflects the historical performance of the Fund’s Class A shares, calculated using the fees and expenses of Class C shares.
The performance shown for the ALPS | WMC Value Intersection Fund (the “Fund”) for periods prior to August 29, 2009, reflects the performance of the Activa Mutual Funds Trust – Activa Value Fund (as result of a prior reorganization of Activa Mutual Funds Trust – Activa Value Fund into the Fund).
1 Net Asset Value (NAV) is the share price without sales charges. 2 Maximum Offering Price (MOP) includes sales charges. Class A returns include effects of the Fund’s maximum sales charge of 5.50%. 3 The Russell 1000 Value Index measures the performance of those Russell 1000 companies with lower price-to-book ratios and lower forecasted growth values. You cannot invest directly in the index. 4 The S&P 500 Index is the Standard & Poor’s composite index of 500 stocks, a widely recognized, unmanaged index of common stock prices. You cannot invest directly in the index. ^ The Adviser has given a contractual agreement to the Fund to limit the amount of the Fund’s total annual expenses, exclusive of distribution and service (12b-1) fees, shareholder service fees, brokerage expenses, interest expenses, taxes and extraordinary expenses, to 1.15% of the Fund’s average daily net assets. This agreement is in effect through August 31, 2011.
The table does not reflect the deduction of taxes that a shareholder would pay on Fund distributions or the redemption of Fund shares.
Mutual funds, annuities and other investments are not insured or guaranteed by the FDIC or by any other government agency or government sponsored agency of the federal government or any state, not deposits, obligations or guaranteed by any bank or its affiliates and are subject to investment risks, including possible loss of the principal amount invested.
There is no guarantee that the Fund will continue to hold any one particular security or stay invested in any one particular company. The composition of the Fund’s top holdings is subject to change. Performance figures are historical and reflect the change in share price, reinvested distributions, changes in net asset value, sales charges and capital gains distributions, if any.
Investing in the Fund is subject to investment risks, including possible loss of the principal amount invested. Derivatives generally are more sensitive to changes in economic or market conditions than other types of investments; this could result in losses that significantly exceed the Fund’s original investment. |
16 | October 31, 2010
Table of Contents
| ALPS | WMC Value Intersection Fund | ||||||
As a shareholder of the Fund, you will incur two types of costs: (1) transaction costs, including applicable sales charges (loads); and (2) ongoing costs, including management fees, distribution and service (12b-1) fees, shareholder service fees and other Fund expenses. The following examples are intended to help you understand your ongoing costs (in dollars) of investing in the Fund and to compare these costs with the ongoing costs of investing in other mutual funds. The examples are based on an investment of $1,000 invested on May 1, 2010 and held until October 31, 2010.
Actual Expenses. The first line of the table on the next page provides information about actual account values and actual expenses. You may use the information in this line, together with the amount you invested, to estimate the expenses that you paid over the period. Simply divide your account value by $1,000 (for example, an $8,600 account value divided by $1,000 = 8.6), then multiply the result by the number in the first line under the heading “Expense Paid During Period” to estimate the expenses you paid on your account during this period.
Hypothetical Example for Comparison Purposes. The second line of the table on the next page provides information about hypothetical account values and hypothetical expenses based on the Fund’s actual expense ratio and an assumed rate of return of 5% per year before expenses, which is not the Fund’s actual return. The hypothetical account values and expenses may not be used to estimate the actual ending account balance or expenses you paid for the period. You may use this information to compare the ongoing costs of investing in the Fund and other mutual funds. To do so, compare this 5% hypothetical example with the 5% hypothetical examples that appear in the shareholder reports of the other funds.
The expenses shown in the table are meant to highlight ongoing Fund costs only and do not reflect transaction fees, such as sales charges or exchange fees. Therefore, the second line of the table on the next page is useful in comparing ongoing costs only, and may not help you determine the relative total costs of owning different funds. In addition, if these transactional costs were included, your costs would have been higher.
The examples are based on an investment of $1,000 invested on May 1, 2010 and held until October 31, 2010. |
| Beginning Account Value 5/1/10 | Ending Account Value 10/31/10 | Expense Ratio(a) | Expense Paid During Period(b) 5/1/10-10/31/10 | |||||||||||||
Class A | ||||||||||||||||
Actual | $1,000.00 | $987.90 | 1.40% | $7.01 | ||||||||||||
Hypothetical (5% return before expenses) | $1,000.00 | $1,018.15 | 1.40% | $7.12 | ||||||||||||
Class C(c) | ||||||||||||||||
Actual | $1,000.00 | $1,145.30 | 2.15% | $7.71 | ||||||||||||
Hypothetical (5% return before expenses) | $1,000.00 | $1,009.52 | 2.15% | $10.89 | ||||||||||||
Class I | ||||||||||||||||
Actual | $1,000.00 | $989.30 | 1.15% | $5.77 | ||||||||||||
Hypothetical (5% return before expenses) | $1,000.00 | $1,019.41 | 1.15% | $5.85 | ||||||||||||
(a) The Fund’s expense ratios have been based on the Fund’s most recent fiscal half-year expenses. (b) Expenses are equal to the Fund’s annualized expense ratio multiplied by the average account value over the period, multiplied by the number of days in the most recent fiscal half year (184), then divided by 365. (c) Class C shares commenced operations on July 2, 2010. |
17 | October 31, 2010
Table of Contents
| ALPS | WMC Value Intersection Fund | ||||||
|
October 31, 2010 (Unaudited) | |||||
| Shares | Value (Note 1) | |||||||
COMMON STOCKS (98.62%) |
| |||||||
Consumer Discretionary (9.38%) |
| |||||||
Automobiles & Components (2.74%) |
| |||||||
Ford Motor Co.(a) | 65,900 | $ | 931,167 | |||||
TRW Automotive Holdings | 14,100 | 644,229 | ||||||
| 1,575,396 | ||||||||
Consumer Durables & Apparel (1.02%) |
| |||||||
Mattel, Inc. | 13,600 | 317,288 | ||||||
Whirlpool Corp. | 3,600 | 272,988 | ||||||
| 590,276 | ||||||||
Consumer Services (0.22%) |
| |||||||
Carnival Corp. | 2,900 | 125,193 | ||||||
Media (2.71%) |
| |||||||
CBS Corp., Class B | 27,700 | 468,961 | ||||||
Gannett Co., Inc. | 24,000 | 284,400 | ||||||
Time Warner Cable, Inc. | 13,939 | 806,650 | ||||||
| 1,560,011 | ||||||||
Retailing (2.69%) |
| |||||||
Abercrombie & Fitch Co. - Class A | 10,800 | 462,888 | ||||||
The Gap, Inc. | 18,300 | 347,883 | ||||||
Kohl’s Corp.(a) | 4,800 | 245,760 | ||||||
Lowe’s Cos., Inc. | 11,100 | 236,763 | ||||||
Office Depot, Inc.(a) | 56,300 | 252,787 | ||||||
| 1,546,081 | ||||||||
TOTAL CONSUMER DISCRETIONARY |
| 5,396,957 | ||||||
Consumer Staples (8.53%) |
| |||||||
Food & Staples Retailing (1.34%) |
| |||||||
Wal-Mart Stores, Inc. | 14,200 | 769,214 | ||||||
Food Beverage & Tobacco (5.42%) |
| |||||||
Altria Group, Inc. | 30,200 | 767,684 | ||||||
Archer-Daniels-Midland Co. | 17,500 | 583,100 | ||||||
Dr Pepper Snapple Group, Inc. | 12,900 | 471,495 | ||||||
Lorillard, Inc. | 6,700 | 571,778 | ||||||
Philip Morris International, Inc. | 12,425 | 726,862 | ||||||
| 3,120,919 | ||||||||
Household & Personal Products (1.77%) |
| |||||||
Herbalife, Ltd. | 7,100 | 453,406 | ||||||
Kimberly-Clark Corp. | 8,900 | 563,726 | ||||||
| 1,017,132 | ||||||||
TOTAL CONSUMER STAPLES |
| 4,907,265 | ||||||
| Shares | Value (Note 1) | |||||||
Energy (12.73%) | ||||||||
Energy (12.73%) |
| |||||||
Anadarko Petroleum Corp. | 11,500 | $ | 708,055 | |||||
Apache Corp. | 1,400 | 141,428 | ||||||
Baker Hughes, Inc. | 10,500 | 486,465 | ||||||
Chevron Corp. | 20,419 | 1,686,814 | ||||||
ConocoPhillips | 6,100 | 362,340 | ||||||
Exxon Mobil Corp. | 7,564 | 502,779 | ||||||
Hess Corp. | 9,700 | 611,391 | ||||||
Marathon Oil Corp. | 29,000 | 1,031,530 | ||||||
National Oilwell Varco, Inc. | 15,700 | 844,032 | ||||||
Occidental Petroleum Corp. | 12,100 | 951,423 | ||||||
TOTAL ENERGY | 7,326,257 | |||||||
Financials (25.59%) | ||||||||
Banks (6.13%) |
| |||||||
Comerica, Inc. | 12,360 | 442,241 | ||||||
PNC Financial Services | 11,700 | 630,630 | ||||||
US Bancorp | 27,900 | 674,622 | ||||||
Wells Fargo & Co. | 68,200 | 1,778,656 | ||||||
| 3,526,149 | ||||||||
Diversified Financials (9.90%) |
| |||||||
Ameriprise Financial, Inc. | 17,800 | 920,082 | ||||||
Bank of America Corp. | 110,912 | 1,268,833 | ||||||
Citigroup, Inc.(a) | 67,300 | 280,641 | ||||||
The Goldman Sachs Group, Inc. | 6,700 | 1,078,365 | ||||||
JPMorgan Chase & Co. | 48,700 | 1,832,581 | ||||||
SLM Corp.(a) | 26,600 | 316,540 | ||||||
| 5,697,042 | ||||||||
Insurance (7.64%) | ||||||||
ACE, Ltd. | 13,300 | 790,286 | ||||||
Allied World Assurance Co. Holdings, Ltd. | 7,800 | 446,238 | ||||||
Axis Capital Holdings, Ltd. | 15,000 | 510,150 | ||||||
Everest Re Group, Ltd. | 4,300 | 362,404 | ||||||
Genworth Financial, Inc. - Class A(a) | 37,500 | 425,250 | ||||||
Hartford Financial Services | 23,400 | 561,132 | ||||||
MetLife, Inc. | 12,200 | 492,026 | ||||||
The Travelers Cos., Inc. | 8,500 | 469,200 | ||||||
Unum Group | 15,200 | 340,784 | ||||||
| 4,397,470 | ||||||||
18 | October 31, 2010
Table of Contents
| ALPS | WMC Value Intersection Fund | ||||||
Statement of Investments |
October 31, 2010 (Unaudited) | |||||
| Shares | Value (Note 1) | |||||||
Real Estate (1.92%) |
| |||||||
Annaly Capital Management, Inc. | 27,200 | $ | 481,712 | |||||
Forest City Enterprises, Inc. - | ||||||||
Class A(a) | 42,800 | 624,452 | ||||||
| 1,106,164 | ||||||||
TOTAL FINANCIALS |
| 14,726,825 | ||||||
Health Care (12.65%) |
| |||||||
Health Care Equipment & Services (3.78%) |
| |||||||
Aetna, Inc. | 11,500 | 343,390 | ||||||
McKesson Corp. | 7,600 | 501,448 | ||||||
UnitedHealth Group, Inc. | 20,500 | 739,025 | ||||||
WellPoint, Inc.(a) | 10,900 | 592,306 | ||||||
| 2,176,169 | ||||||||
Pharmaceuticals, Biotechnology & Life Sciences (8.87%) |
| |||||||
Amgen, Inc.(a) | 13,900 | 794,941 | ||||||
Eli Lilly & Co. | 13,700 | 482,240 | ||||||
Forest Laboratories, Inc.(a) | 9,828 | 324,816 | ||||||
Gilead Sciences, | 7,600 | 301,492 | ||||||
Merck & Co., Inc. | 17,400 | 631,272 | ||||||
Pfizer, Inc. | 96,123 | 1,672,540 | ||||||
Thermo Fisher Scientific, Inc.(a) | 8,400 | 431,928 | ||||||
Watson Pharmaceuticals, Inc.(a) | 10,000 | 466,500 | ||||||
| 5,105,729 | ||||||||
TOTAL HEALTH CARE |
| 7,281,898 | ||||||
Industrials (11.60%) |
| |||||||
Capital Goods (10.56%) |
| |||||||
3M Co. | 3,800 | 320,036 | ||||||
Caterpillar, Inc. | 8,400 | 660,240 | ||||||
Dover Corp. | 13,100 | 695,610 | ||||||
General Dynamics Corp. | 9,100 | 619,892 | ||||||
General Electric Co. | 59,800 | 957,996 | ||||||
Joy Global, Inc. | 5,300 | 376,035 | ||||||
Northrop Grumman Corp. | 9,100 | 575,211 | ||||||
Oshkosh Corp.(a) | 7,000 | 206,570 | ||||||
Parker Hannifin Corp. | 8,500 | 650,675 | ||||||
The Boeing Co. | 4,300 | 303,752 | ||||||
United Technologies Corp. | 9,500 | 710,315 | ||||||
| 6,076,332 | ||||||||
Commercial & Professional Services (0.45%) |
| |||||||
RR Donnelley & Sons Co. | 14,100 | 260,145 | ||||||
| Shares | Value (Note 1) | |||||||
Transportation (0.59%) |
| |||||||
Delta Air Lines, Inc.(a) | 24,500 | $ | 340,305 | |||||
TOTAL INDUSTRIALS |
| 6,676,782 | ||||||
Information Technology (4.55%) |
| |||||||
Semiconductors & Semiconductor Equipment (1.14%) |
| |||||||
Intel Corp. | 14,000 | 280,980 | ||||||
Xilinx, Inc. | 14,000 | 375,340 | ||||||
| 656,320 | ||||||||
Software & Services (3.41%) |
| |||||||
Accenture PLC - Class A | 16,400 | 733,244 | ||||||
eBay, Inc.(a) | 25,100 | 748,231 | ||||||
Microsoft Corp. | 18,100 | 482,184 | ||||||
| 1,963,659 | ||||||||
TOTAL INFORMATION TECHNOLOGY |
| 2,619,979 | ||||||
Materials (3.15%) |
| |||||||
Materials (3.15%) |
| |||||||
CF Industries Holdings, Inc. | 2,760 | 338,183 | ||||||
Freeport-McMoRan Copper & Gold, Inc. | 6,700 | 634,356 | ||||||
Newmont Mining Corp. | 4,400 | 267,828 | ||||||
Owens-Illinois, Inc.(a) | 8,700 | 243,861 | ||||||
Valspar Corp. | 10,200 | 327,420 | ||||||
TOTAL MATERIALS |
| 1,811,648 | ||||||
Telecommunication Services (3.45%) |
| |||||||
Telecommunication Services (3.45%) |
| |||||||
AT&T, Inc. | 69,645 | 1,984,882 | ||||||
TOTAL TELECOMMUNICATION SERVICES |
| 1,984,882 | ||||||
Utilities (6.99%) |
| |||||||
Utilities (6.99%) |
| |||||||
CenterPoint Energy, Inc. | 22,800 | 377,568 | ||||||
DPL, Inc. | 8,500 | 221,850 | ||||||
Entergy Corp. | 3,500 | 260,855 | ||||||
NextEra Energy, Inc. | 11,200 | 616,448 | ||||||
Northeast Utilities | 15,100 | 472,328 | ||||||
PG&E Corp. | 13,600 | 650,352 | ||||||
UGI Corp. | 31,600 | 950,844 | ||||||
Xcel Energy, Inc. | 19,700 | 470,042 | ||||||
TOTAL UTILITIES |
| 4,020,287 | ||||||
TOTAL COMMON STOCKS (Cost $49,366,767) |
| 56,752,780 | ||||||
19 | October 31, 2010
Table of Contents
| ALPS | WMC Value Intersection Fund | ||||||
Statement of Investments |
October 31, 2010 (Unaudited) | |||||
| 7-Day Yield | Shares | Value (Note 1) | ||||||||
SHORT TERM INVESTMENTS (0.51%) |
| |||||||||
Money Market Fund (0.51%) |
| |||||||||
Fidelity Institutional Money Market - Money Market Portfolio - Class I | 0.23% | 292,498 | $ | 292,498 | ||||||
TOTAL SHORT TERM INVESTMENTS (Cost $292,498) |
| 292,498 | ||||||||
TOTAL INVESTMENTS (99.13%) (Cost $49,659,265) |
| $ | 57,045,278 | |||||||
Other Assets in Excess of |
| 498,182 | ||||||||
NET ASSETS (100.00%) |
| $ | 57,543,460 | |||||||
| (a) | Non-Income Producing Security. |
Common Abbreviations:
Ltd. - Limited
PLC - Public Limited Company
For Fund compliance purposes, the Fund’s industry classifications refer to any one or more of the industry sub-classifications used by one or more widely recognized market indexes or ratings group indexes, and/or as defined by Fund management. This definition may not apply for purposes of this report, which may combine industry sub-classifications for reporting ease. Industries are shown as a percent of net assets. These industry classifications are based on third party definitions and are unaudited. The definitions are industry terms and do not reflect the legal status of any of the investments or the companies in which the Fund has invested.
See Notes to Financial Statements.
Top Ten Holdings (as a % of Net Assets) †
| ||||
AT&T, Inc. | 3.45 | % | ||
JPMorgan Chase & Co. | 3.18 | % | ||
Wells Fargo & Co. | 3.09 | % | ||
Chevron Corp. | 2.93 | % | ||
Pfizer, Inc. | 2.91 | % | ||
Bank of America Corp. | 2.20 | % | ||
The Goldman Sachs Group, Inc. | 1.87 | % | ||
Marathon Oil Corp. | 1.79 | % | ||
General Electric Co. | 1.66 | % | ||
Occidental Petroleum Corp. | 1.65 | % | ||
Top Ten Holdings | 24.73 | % |
| † | Holdings are subject to change. |
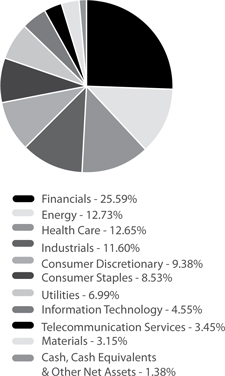
Industry Sector Allocation (as a % of Net Assets)
20 | October 31, 2010
Table of Contents
| Clough China Fund | ||||||
|
October 31, 2010 (Unaudited) | |||||
The Clough China Fund - A Shares (excluding applicable sales loads) rose 13.13% for the six-month period ended October 31, 2010 and stood 15.67% higher for the one-year period ended at October 31, 2010. The Fund has outperformed its benchmark, the MSCI China Index, which returned 10.07% and 11.11% over the same periods. The investment environment during the six-month period ended October 31, 2010 was generally positive, yet volatile, especially in the month of September when major international markets began to anticipate new monetary stimulus from the US Federal Reserve. The Fund consistently outperformed the MSCI China Index every month during the quarter, including during August when the benchmark index retreated.
Investment Environment
It appears to us that investors are becoming more comfortable with the outlook for economic growth in China. Despite a noticeable deceleration in the large US and European economies, evidence is pointing towards a “soft landing” in China. GDP grew 10.3% in the second quarter in China, a modest slowdown from the prior quarter, yet still high. Further, while recent data revealed a desirable slowdown in fixed asset investment, exports were resilient as evidenced by the $66.5 billion trade surplus for the third quarter.1 Several economists revised their forecasts for growth marginally down for the full year 2010 (Morgan Stanley to 10%, Deutsche Bank to 9.6%), but took the view the risk of a hard landing was very limited.
Property transaction volumes remained strong in Mainland China and housing prices weakened only slightly despite concerted efforts of government policy to rein in prices and curb speculation. This prompted the Central government to shift its focus towards increasing supply by accelerating the building of affordable housing. The social housing policy will become an important driver of economic growth in China over the coming years.
International pressure on China became louder and stronger for Beijing to speed up the appreciation of the Chinese Yuan (CNY) after the “de-pegging” from the US dollar in June. The reluctance of China’s leaders to bend to this pressure raised new concerns of potential trade conflict. Therefore, investors preferred to remain cautious on Chinese exporters. Meanwhile, domestic consumption remained steady and healthy. Retail sales increased 18.2% year-over-year in the first half2 and accelerated to 18.4% in August.2 Though inflation rose to 3.5% in August from 2.9% in June, it still looks under control. Regardless, purchasing power is rising much faster than prices; household income growth is supported by generous wage increases as
labor markets tighten. According to Morgan Stanley, 27 of the 31 Chinese Provinces have raised minimum wages this year by an average of 20%, some regions have even granted rises above 30%.
Portfolio Composition
To capitalize on the strong growth in consumer purchasing power, the Fund has been massively overweight consumer discretionary and consumer staples relative to the MSCI China index. The consumer discretionary and industrials sectors were the main contributors to the Fund’s outperformance during the quarter. Information technology, health care and energy were the main detractors.
In terms of individual stocks, three major contributors to performance were: 1) China State Construction International (CSCI): the largest construction firm in Hong Kong with expansion opportunities in Mainland China related to the social housing policies. While the Hong Kong infrastructure business remains strong, CSCI is one of the first listed companies with an affordable-housing project in China. CSCI also benefits from the strong support of their parent company, a state-owned enterprise based in Beijing. 2) Air China: the nation’s largest international carrier returned to profit in 2009 and is enjoying strong passenger and cargo traffic growth this year. Air China also benefits from currency appreciation as approximately 80% of its financial debts are US dollar denominated. 3) Vinda International: a leading household tissue paper producer has been building domestic brand and benefits from rising household incomes and consumer’s desires for healthier lifestyles.
Three of the major detractors to performance were: 1) China Life Insurance: the country’s largest life insurance company with over 40% market share, whose premium growth has slowed this year. 2) China Resources Power (CRP): the most profitable and efficient power producer in China, CRP is vertically integrated in coal mining to reduce raw material costs and improve margins. CRP’s underperformance had more to do with its belonging to the utilities’ sector rather than specific company issues. 3) Ruinian International: China’s largest amino acid-based nutritional supplement manufacturer. Ruinian shares declined after some of their products failed official quality tests. We eliminated this position during the quarter.
Investment Outlook
Clough Capital remains optimistic on China’s economic growth and equity markets over the next 12 – 18 months. China’s
21 | October 31, 2010
Table of Contents
| Clough China Fund | ||||||
Management Commentary |
October 31, 2010 (Unaudited) | |||||
growth model is evolving as fixed asset investment is moving from the coastal provinces, which already have well developed infrastructure like highways, rail transport, airports and power generation. We believe the new beneficiaries of investment capital will be the interior provinces in Central and Western China which have significantly lagged in infrastructure quality. This rebalancing is also helping to tighten labor markets as migrant workers have improved access to higher paying jobs at home and find it less attractive to migrate to the export factory hubs, particularly in Southern China. The income prospects for the Chinese worker have never been better in our opinion and this is very positive for the equity markets. Importantly, government policy is firmly behind this economic rebalancing which should be evident when the draft of the government’s 12th Five Year plan is released in the coming months.
While the Fund has performed well this year, Chinese equity markets have been sluggish, especially compared to the rest of Asia. Hong Kong’s Hang Seng index only recently went positive and the Shanghai Composite index remains 7.54% lower calendar year-to-date, as we write. The major reason for China underperforming the region has been weak returns from the banking sector, which has been held back over concerns
related to tighter Chinese policy on lending. Chinese banks are very inexpensive compared to most emerging market banks and continue to generate high returns on equity. To that point, Moody’s signaled they may upgrade China’s credit rating and specifically mentioned the health of the banking system as a major factor in their decision. If Chinese bank stocks are beginning to bottom, we could see a major shift in global portfolios towards China which would be bullish for the market and the Fund. We have recently increased our exposure to Chinese banks.
Our global view has been that the large developed economies (US, Eurozone and Japan) would face an extended period of sub-par growth as their economies struggle with credit deleveraging. The recent currency intervention by the Bank of Japan and the public debate at the US Federal Reserve over the merits of new, easy money policies reinforces our belief that global interest rates will remain low for an extended period of time. Given the consensus views that China offers both strong growth and a tailwind from an expected currency appreciation, low global interest rates are another factor supporting Chinese equities. Hong Kong property stocks have recently broken out and this may be a precursor to broader investment flows into China.
| 1 | Sources: National Bureau of Statistics of China (“NBS”), BNP Paribas, Morgan Stanley 07/15/2010. |
| 2 | Source: NBS prices from 12/31/09 to 03/31/10 |
Performance of $10,000 Initial Investment (as of October 31, 2010)
Comparison of change in value of a $10,000 investment (includes applicable sales loads)
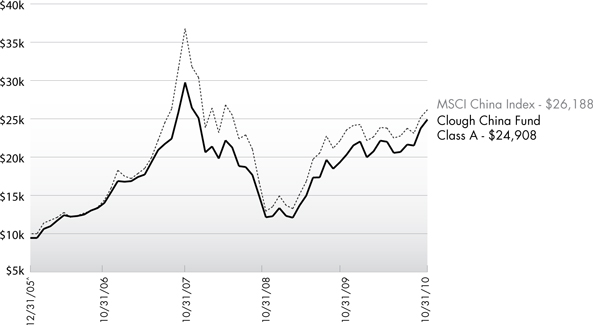
The chart above represents historical performance of a hypothetical investment of $10,000 in the Fund since inception. Past performance does not guarantee future results. This chart does not reflect the deduction of taxes that a shareholder would pay on Fund distributions or the redemption of Fund shares.
22 | October 31, 2010
Table of Contents
| Clough China Fund | ||||||
| Management Commentary | October 31, 2010 (Unaudited) |
| Average Annual Total Returns (as of October 31, 2010) |
| 6 Month Cummulative Returns | 1 Year | 3 Year | Since Inception^ | Gross Expense Ratio | Net Expense Ratio* | |||||||
Class A (NAV)1 | 13.13% | 22.38% | -5.79% | 22.16% | 2.25% | 1.86% | ||||||
Class A (MOP)2 | 6.91% | 15.67% | -7.55% | 20.75% | ||||||||
Class C (NAV)1 | 12.70% | 21.39% | -6.51% | 21.27% | 3.19% | 2.71% | ||||||
Class C (CDSC)2 | 11.70% | 20.39% | -6.51% | 21.27% | ||||||||
Class I3 | 13.42% | 22.97% | -5.30% | 22.83% | 1.87% | 1.41% | ||||||
MSCI China Index4 | 10.07% | 11.11% | -10.71% | 22.02% |
Performance data quoted represents past performance. Past performance does not guarantee future results. Investment return and principal value of an investment will fluctuate so that an investor’s shares, when sold or redeemed, may be worth more or less than the original cost. Current performance data may be higher or lower than actual data quoted. The Fund imposes a 2.00% redemption fee on shares held for less than 90 days. The Fund imposes a maximum Contingent Deferred Sales Charge (“CDSC”) of 1.00% to shares redeemed within the first 12 months after a purchase in excess of $1 million. Performance data does not reflect the redemption fee or the CDSC, which if reflected would reduce the performance quoted. For the most current month-end performance data, please call (877)256-8445.
The performance shown for the Clough China Fund for periods prior to January 15, 2010, reflects the performance of the Old Mutual China Fund, a series of Old Mutual Funds I (as a result of a prior reorganization of the Old Mutual China Fund into the Clough China Fund).
| 1 | Net Asset Value (NAV) is the share price without sales charges. |
| 2 | Maximum Offering Price (MOP) includes sales charges. Class A returns include effects of the Fund’s maximum sales charge of 5.50%; Class C returns include the 1.00% CDSC. |
| 3 | Prior to close of business on January 15, 2010, Class I was known as Institutional Class of the Predecessor Fund. |
| 4 | The Morgan Stanley Capital International (“MSCI”) China Index is constructed according to the MSCI Global Investable Market Index (GIMI) family. The MSCI China Index is part of the MSCI Emerging Markets Index. An investor may not invest directly in the index. |
| ^ | Predecessor Fund Inception date of 12/30/05. |
| * | The Adviser contractually has agreed to limit the operating expenses of the Fund (excluding underlying fund fees and expenses, interest, taxes, brokerage costs and commissions, dividend and interest expense on short sales, litigation, indemnification and extraordinary expenses as determined under generally accepted accounting principles) to an annual rate of 1.40% for Class I shares through December 31, 2010, 1.70% for Class A shares through December 31, 2009 and 1.85% for Class A shares from January 1, 2010 through December 31, 2010, and 2.70% for Class C shares through December 31, 2010. |
Effective January 1, 2011, the Adviser has given a contractual agreement to limit the operating expenses of the Fund (excluding underlying fund fees and expenses, interest, taxes, brokerage costs and commissions, dividend and interest expense on short sales, litigation, indemnification and extraordinary expenses as determined under generally accepted accounting principles) to an annual rate of 2.75% for Class I shares, 3.00% for Class A shares, and 3.75% for Class C shares through December 31, 2018. ALPS Advisors will consider further reductions to these limits on an annual basis. Without this agreement, expenses would be higher.
The table does not reflect the deduction of taxes that a shareholder would pay on Fund distributions or the redemption of Fund shares.
Investing in the Fund is ubject to investment risks, including possible loss of the principal amount invested. Derivatives generally are more sensitive to changes in economic or market conditions than other types of investments; this could result in losses that significantly exceed the Fund’s original investment.
Investing in China, Hong Kong and Taiwan involves risk and considerations not present when investing in more established securities markets. The Fund may be more susceptible to the economic, market, political and local risks of these regions than a fund that is more geographically diversified.
This Fund is not suitable for all investors.
23 | October 31, 2010
Table of Contents
| Clough China Fund | ||||||
As a shareholder of the Fund you will incur two types of costs: (1) transaction costs, including applicable sales charges (loads) and redemption fees; and (2) ongoing costs, including management fees, distribution and service (12b-1) fees, shareholder service fees and other Fund expenses. The following examples are intended to help you understand your ongoing costs (in dollars) of investing in the Fund and to compare these costs with the ongoing costs of investing in other mutual funds. The examples are based on an investment of $1,000 invested on May 1, 2010 and held until October 31, 2010.
Actual Expenses. The first line of the table on the next page provides information about actual account values and actual expenses. You may use the information in this line, together with the amount you invested, to estimate the expenses that you paid over the period. Simply divide your account value by $1,000 (for example, an $8,600 account value divided by $1,000 = 8.6), then multiply the result by the number in the first line under the heading “Expense Paid During Period” to estimate the expenses you paid on your account during this period.
Hypothetical Example for Comparison Purposes. The second line of the table on the next page provides information about hypothetical account values and hypothetical expenses based on the Fund’s actual expense ratio and an assumed rate of return of 5% per year before expenses, which is not the Fund’s actual return. The hypothetical account values and expenses may not be used to estimate the actual ending account balance or expenses you paid for the period. You may use this information to compare the ongoing costs of investing in the Fund and other mutual funds. To do so, compare this 5% hypothetical example with the 5% hypothetical examples that appear in the shareholder reports of the other funds.
The expenses shown in the table are meant to highlight ongoing Fund costs only and do not reflect transaction fees, such as sales charges, redemption fees or exchange fees. Therefore, the second line of the table on the next page is useful in comparing ongoing costs only, and may not help you determine the relative total costs of owning different funds. In addition, if these transactional costs were included, your costs would have been higher.
The examples are based on an investment of $1,000 invested on May 1, 2010 and held until October 31, 2010. |
| Beginning Account Value 5/1/10 | Ending Account Value 10/31/10 | Expense Ratio(a) | Expense Paid During Period(b) 5/1/10- 10/31/10 | |||||||||||||
Class A | ||||||||||||||||
Actual | $1,000.00 | $1,131.80 | 1.85% | $9.94 | ||||||||||||
Hypothetical (5% return before expenses) | $1,000.00 | $1,015.88 | 1.85% | $9.40 | ||||||||||||
Class C | ||||||||||||||||
Actual | $1,000.00 | $1,127.40 | 2.70% | $14.48 | ||||||||||||
Hypothetical (5% return before expenses) | $1,000.00 | $1,011.59 | 2.70% | $13.69 | ||||||||||||
Class I | ||||||||||||||||
Actual | $1,000.00 | $1,134.70 | 1.40% | $7.53 | ||||||||||||
Hypothetical (5% return before expenses) | $1,000.00 | $1,018.15 | 1.40% | $7.12 | ||||||||||||
(a) The Fund’s expense ratios have been based on the Fund’s most recent fiscal half-year expenses. (b) Expenses are equal to the Fund’s annualized expense ratio multiplied by the average account value over the period, multiplied by the number of days in the most recent fiscal half year (184), then divided by 365. |
24 | October 31, 2010
Table of Contents
| Clough China Fund | ||||||
|
October 31, 2010 (Unaudited) | |||||
| Shares | Value (Note 1) | |||||||
COMMON STOCKS (91.26%) |
| |||||||
Consumer Discretionary (18.64%) |
| |||||||
Automobiles (3.81%) |
| |||||||
Dongfeng Motor Group Co., | 846,000 | $ | 1,840,130 | |||||
Great Wall Motor Co. | 531,000 | 1,673,654 | ||||||
| 3,513,784 | ||||||||
Distributors (1.87%) |
| |||||||
Dah Chong Hong Holdings Ltd. | 781,000 | 920,787 | ||||||
Sparkle Roll Group, Ltd. | 4,216,000 | 807,383 | ||||||
| 1,728,170 | ||||||||
Hotels Restaurants & Leisure (0.97%) |
| |||||||
Ajisen China Holdings, Ltd. | 495,000 | 891,259 | ||||||
Household Durables (1.79%) |
| |||||||
Man Wah Holdings, Ltd. | 1,176,900 | 1,655,472 | ||||||
Multiline Retail (0.50%) |
| |||||||
Parkson Retail Group, Ltd. | 253,000 | 458,019 | ||||||
Specialty Retail (4.30%) |
| |||||||
Evergreen International Holdings Ltd.(a) | 6,000 | 3,561 | ||||||
Hengdeli Holdings Ltd. | 984,000 | 545,924 | ||||||
SA SA International Holdings, Ltd. | 3,730,000 | 3,415,840 | ||||||
| 3,965,325 | ||||||||
Textiles, Apparel & Luxury Goods (5.40%) |
| |||||||
Anta Sports Products, Ltd. | 351,300 | 727,513 | ||||||
Bosideng International Holdings, Ltd. | 2,414,000 | 1,222,190 | ||||||
China Lilang, Ltd. | 471,000 | 737,753 | ||||||
Texwinca Holdings, Ltd. | 719,000 | 784,993 | ||||||
Trinity Ltd. | 682,000 | 683,175 | ||||||
Xtep International Holdings, Ltd. | 992,500 | 826,088 | ||||||
| 4,981,712 | ||||||||
TOTAL CONSUMER DISCRETIONARY | 17,193,741 | |||||||
Consumer Staples (4.52%) |
| |||||||
Food & Staples Retailing (1.50%) |
| |||||||
China Resources Enterprise, Ltd. | 252,000 | 1,068,233 | ||||||
Wumart Stores, Inc., Class H | 135,000 | 318,263 | ||||||
| 1,386,496 | ||||||||
| Shares | Value (Note 1) | |||||||
Food Products (1.02%) |
| |||||||
Shenguan Holdings Group, Ltd. | 722,300 | $ | 941,979 | |||||
Household Products (1.53%) |
| |||||||
Vinda International | ||||||||
Holdings, Ltd. | 1,082,000 | 1,408,048 | ||||||
Personal Products (0.47%) |
| |||||||
Hengan International | 46,000 | 433,710 | ||||||
TOTAL CONSUMER STAPLES |
| 4,170,233 | ||||||
Energy (7.78%) |
| |||||||
Oil, Gas & Consumable Fuels (7.78%) |
| |||||||
China Coal Energy Co. Ltd. - Class H | 742,000 | 1,290,135 | ||||||
China Petroleum & Chemical Corp., Class H | 2,449,000 | 2,330,124 | ||||||
China Shenhua Energy Co., Ltd., Class H | 599,000 | 2,674,084 | ||||||
CNOOC, Ltd. | 421,000 | 878,928 | ||||||
| 7,173,271 | ||||||||
TOTAL ENERGY | 7,173,271 | |||||||
Financials (22.37%) |
| |||||||
Commercial Banks (14.77%) |
| |||||||
Agricultural Bank of China Ltd. - Class H(a) | 1,835,000 | 968,250 | ||||||
Bank of China, Ltd. - Class H | 5,695,000 | 3,420,563 | ||||||
China Construction Bank Corp. - Class H | 6,183,000 | 5,910,952 | ||||||
Industrial & Commercial Bank of China, Class H | 4,109,500 | 3,319,994 | ||||||
| 13,619,759 | ||||||||
Diversified Financial Services (1.38%) |
| |||||||
Hong Kong Exchanges and Clearing, Ltd. | 57,500 | 1,269,234 | ||||||
Insurance (6.22%) |
| |||||||
AIA Group Ltd.(a) | 375,800 | 1,117,522 | ||||||
China Life Insurance Co., Ltd., Class H | 295,000 | 1,296,904 | ||||||
Ping An Insurance Group Co. of China Ltd. - Class H | 307,500 | 3,324,598 | ||||||
| 5,739,024 | ||||||||
TOTAL FINANCIALS |
| 20,628,017 | ||||||
25 | October 31, 2010
Table of Contents
| Clough China Fund | ||||||
Statement of Investments |
October 31, 2010 (Unaudited) | |||||
| Shares | Value (Note 1) | |||||||
Health Care (0.35%) |
| |||||||
Pharmaceuticals (0.35%) |
| |||||||
Lijun International Pharmaceutical Holding Co., Ltd. | 935,000 | $ | 321,938 | |||||
TOTAL HEALTH CARE | 321,938 | |||||||
Industrials (14.97%) | ||||||||
Airlines (1.93%) | ||||||||
Air China, Ltd., Class H(a) | 1,319,000 | 1,778,746 | ||||||
Commercial Services & Supplies (0.70%) |
| |||||||
China Everbright International, Ltd. | 1,214,000 | 645,258 | ||||||
Construction & Engineering (3.44%) |
| |||||||
China State Construction International Holdings, Ltd. | 4,153,800 | 3,170,794 | ||||||
Electrical Equipment (2.56%) |
| |||||||
Dongfang Electric Corp., Ltd. - Class H | 285,200 | 1,387,916 | ||||||
Shanghai Electric Group Co., Ltd., Class H | 1,452,000 | 972,215 | ||||||
| 2,360,131 | ||||||||
Machinery (2.30%) |
| |||||||
China Automation Group, Ltd. | 1,640,000 | 1,286,949 | ||||||
Haitian International Holdings Ltd. | 819,000 | 834,950 | ||||||
| 2,121,899 | ||||||||
Road & Rail (0.90%) |
| |||||||
MTR Corp. | 219,000 | 835,809 | ||||||
Transportation Infrastructure (3.14%) |
| |||||||
China Merchants Holdings International Co., Ltd. | 200,000 | 703,314 | ||||||
COSCO Pacific, Ltd. | 426,000 | 667,107 | ||||||
Jiangsu Expressway Co., Ltd., Class H | 1,259,000 | 1,525,500 | ||||||
| 2,895,921 | ||||||||
TOTAL INDUSTRIALS |
| 13,808,558 | ||||||
| Shares | Value (Note 1) | |||||||
Information Technology (7.03%) |
| |||||||
Communications Equipment (5.46%) |
| |||||||
AAC Acoustic Technologies Holdings, Inc. | 372,000 | $ | 899,586 | |||||
China Wireless Technologies, Ltd. | 2,664,000 | 1,433,173 | ||||||
Comba Telecom Systems Holdings, Ltd. | 808,161 | 920,206 | ||||||
SIM Technology Group, Ltd. | 3,606,000 | 775,281 | ||||||
VTech Holdings, Ltd. | 96,800 | 1,010,232 | ||||||
| 5,038,478 | ||||||||
Electronic Equipment & Instruments (1.57%) |
| |||||||
Hollysys Automation Technologies, Ltd.(a) | 54,800 | 692,672 | ||||||
Kingboard Laminates Holdings Ltd. | 777,000 | 750,802 | ||||||
| 1,443,474 | ||||||||
TOTAL INFORMATION TECHNOLOGY |
| 6,481,952 | ||||||
Materials (6.20%) | ||||||||
Building Products (1.13%) |
| |||||||
West China Cement Ltd.(a) | 2,680,400 | 1,037,407 | ||||||
Construction Materials (1.45%) |
| |||||||
Anhui Conch Cement Co., Ltd., Class H | 149,000 | 627,143 | ||||||
China Resources Cement Holdings, Ltd.(a) | 1,002,100 | 709,708 | ||||||
| 1,336,851 | ||||||||
Metals & Mining (2.89%) |
| |||||||
Angang Steel Co., Ltd., Class H | 538,000 | 849,424 | ||||||
Maanshan Iron & Steel Co., Ltd. - Class H | 1,079,000 | 620,290 | ||||||
Zhaojin Mining Industry Co., Ltd., Class H | 384,000 | 1,198,521 | ||||||
| 2,668,235 | ||||||||
Paper & Forest Products (0.73%) |
| |||||||
Nine Dragons Paper Holdings, Ltd. | 418,000 | 676,285 | ||||||
TOTAL MATERIALS | 5,718,778 | |||||||
26 | October 31, 2010
Table of Contents
| Clough China Fund | ||||||
Statement of Investments |
October 31, 2010 (Unaudited) | |||||
| Shares | Value (Note 1) | |||||||
Telecommunication Services (6.51%) |
| |||||||
Diversified Telecommunication (3.23%) |
| |||||||
China Telecom Corp., Ltd., | 5,694,000 | $ | 2,973,552 | |||||
Wireless Telecommunication |
| |||||||
China Mobile, Ltd. | 296,400 | 3,026,926 | ||||||
TOTAL TELECOMMUNICATION SERVICES |
| 6,000,478 | ||||||
Utilities (2.89%) |
| |||||||
Gas Utilities (1.30%) |
| |||||||
China Resources Gas | 811,000 | 1,204,586 | ||||||
Independent Power Producers & Energy Traders (1.59%) |
| |||||||
China Resources Power | ||||||||
Holdings Co., Ltd. | 760,000 | 1,465,269 | ||||||
TOTAL UTILITIES |
| 2,669,855 | ||||||
TOTAL COMMON STOCKS (Cost $67,188,831) |
| 84,166,821 | ||||||
| 7-Day Yield | Shares | Value (Note 1) | ||||||||||
SHORT-TERM INVESTMENTS (10.46%) |
| |||||||||||
Money Market Fund (10.46%) |
| |||||||||||
Dreyfus Cash Management Fund, Institutional Class | 0.16% | 9,650,800 | $ | 9,650,800 | ||||||||
TOTAL SHORT-TERM INVESTMENTS (Cost $9,650,800) |
| 9,650,800 | ||||||||||
TOTAL INVESTMENTS - (101.72%) (Cost $76,839,631) |
| $ | 93,817,621 | |||||||||
Liabilities In Excess of Other Assets (-1.72%) |
| (1,586,297 | ) | |||||||||
NET ASSETS (100.00%) |
| $ | 92,231,324 | |||||||||
| (a) | Non-Income Producing Security. |
| Ltd. | - Limited |
Top Ten Holdings (as a % of Net Assets)†
China Construction Bank Corp. - Class H | 6.41% | |||
Bank of China, Ltd. - Class H | 3.71% | |||
SA SA International Holdings, Ltd. | 3.70% | |||
Ping An Insurance Group Co. of China Ltd. - Class H | 3.60% | |||
Industrial & Commercial Bank of China, Class H | 3.60% | |||
China State Construction International Holdings, Ltd. | 3.44% | |||
China Mobile, Ltd. | 3.28% | |||
China Telecom Corp., Ltd., Class H | 3.23% | |||
China Shenhua Energy Co., Ltd., Class H | 2.90% | |||
China Petroleum & Chemical Corp., Class H | 2.53% | |||
Top Ten Holdings | 36.40% |
† Holdings are subject to change.
Industry Sector Allocation (as a % of Net Assets)
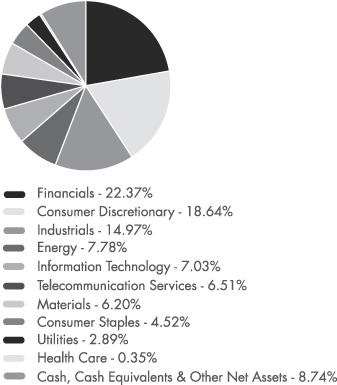
27 | October 31, 2010
Table of Contents
| Jefferies Asset Management Commodity Strategy Allocation Fund | ||||||
|
October 31, 2010 (Unaudited) | |||||
The period ending October 31, 2010 yielded a solid start for the Jefferies Asset Management Commodity Strategy Allocation Fund (the “Fund”). The Fund’s Class I Shares, JCRIX, delivered a net return of 19.66% (Class A, JCRAX, was +12.82% at MOP and Class C, JCRCX, was +18.49% with CDSC) for the quarter. The Fund’s performance exceeded both the broad based S&P 500 Index (+15.53%) and the Thomson Reuters/Jefferies CRB Total Return Index (the “TR/J CRB Index”) (+16.37%) by significant margins, without taking into account sales charges for Class A and C Shares.
The Fund’s strategy to combine commodity futures linked investments with commodity equities, and to seek exposure to commodity futures contracts with longer-dated maturities, both contributed to the performance for the period. Commodity equities as measured by the Thomson Reuters/Jefferies CRB In-The-Ground Global Commodity Equity Index (CRBQX) were up 29.01% for the quarter. The Fund held positions in a portfolio of approximately 150 equity securities of companies that produce or distribute commodities. The composition of the Fund, approximately 25% commodity equities with a balance in commodity futures related investments and US Treasury Inflation Protected Bonds, or TIPS, was maintained throughout the period. By seeking exposure to commodity futures contracts with longer-dated maturities, the Fund was able to reduce the negative roll yield caused by contango^ in many of the futures contracts that would comprise the benchmark TR/J CRB Index. By negative roll yield, we refer to the cost of replacing expiring commodity futures contracts with new contracts when the new contracts are more costly than the expiring contracts, in other words when the market is in “contango.” Combining both equities and commodity futures-related investments yielded approximately 260 basis points^^ in positive alpha for JCRIX relative to the TR/J CRB Index (+16.37%).
The Fund’s best performing and largest equity holding for the quarter was Potash (POT 5.91% of the equity holdings). It was up 68.53% since inception of the Fund through October 31. Potash is involved as a takeover target in a high profile merger with BHP of Australia. Exxon/Mobil (XOM 5.68% of
the equity holdings) and Deere & Co. (DE 4.14% of the equity holdings) were the Fund’s second and third largest holding by percentage. They were up 17.35% and 38.51% respectively since inception.
The Fund invests its excess cash in TIPS. We continue to limit our weighted average maturity to approximately 2 years.
We continue to remain optimistic on the long-term growth and potential for the commodity markets. Population growth and increases in per capita wealth are driving demand in emerging markets, especially the BRIC (Brazil, Russia, India, and China) nations. Despite the relatively slow growth currently experienced in the industrialized Western societies including the US and Europe, we expect the brisk Gross Domestic Product (GDP) growth in emerging market countries will continue to drive commodity demand higher.
Aggressive monetary policies being pursued by various Central Banks around the world, including the US Federal Reserve, are also driving commodity prices higher. Over the last quarter, the Dollar has decreased in value by 10.17% as measured by the US Dollar Index. Since most commodities are priced in Dollars, a lower Dollar should increase the price of anything denominated in the currency. Commodity prices outpaced the gains explained simply by currency moves this quarter. The commodity in the Fund with the highest contribution to performance for the quarter was cotton, up 59.31% adding 274 basis points to the return of the Fund. Corn came in second, up 55.03% and 256 basis points to the Fund. Natural gas, down 25.93% and -131 basis points to the Fund and cocoa, down 4.01% and -23 basis points to the Fund were the largest negative performers on the commodity side.
We maintain our positive outlook on commodity prices. The pace of appreciation has been significant over the last quarter. It may be difficult to realize the same result we just experienced in the same time frame. Nonetheless, we believe that the commodity prices may experience continued robust growth in the long run.
| ^ | If successive-month futures contracts are trading at prices higher than the current month, the market is said to be in “contango” |
| ^^ | A unit that is equal to 1/100th of 1% |
28 | October 31, 2010
Table of Contents
| Jefferies Asset Management Commodity Strategy Allocation Fund | ||||||
Management Commentary |
October 31, 2010 (Unaudited) | |||||
Performance of $10,000 Initial Investment (as of October 31, 2010)
Comparison of change in value of a $10,000 investment (includes applicable sales loads)
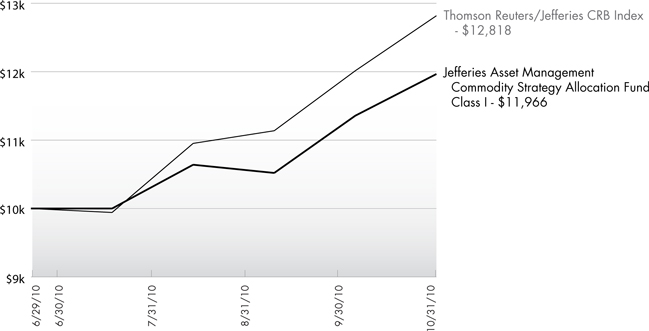
The chart above represents historical performance of a hypothetical investment of $10,000 in the Fund since inception. Past performance does not guarantee future results. This chart does not reflect the deduction of taxes that a shareholder would pay on Fund distributions or the redemption of Fund shares.
Cumulative Return (as of October 31, 2010)
| 1 month | 3 month | Since Inception^ | Gross Expense Ratio | Net Expense Ratio* | ||||||
Class A (NAV)1 | 5.27% | 12.19% | 19.37% | 1.60% | 1.45% | |||||
Class A (MOP)2 | -0.52% | 6.01% | 12.82% | |||||||
Class C (NAV)1 | 5.17% | 12.41% | 19.49% | 2.20% | 2.05% | |||||
Class C (CDSC)2 | 4.17% | 11.41% | 18.49% | |||||||
Class I | 5.36% | 12.46% | 19.66% | 1.30% | 1.15% | |||||
Thomson Reuters/Jefferies CRB Index3 | 6.69% | 17.04% | 28.18% |
Performance data quoted represents past performance. Past performance does not guarantee future results. Investment return and principal value of an investment will fluctuate so that an investor’s shares, when sold or redeemed, may be worth more or less than the original cost. Current performance data may be higher or lower than actual data quoted. The Fund imposes a 2.00% redemption fee on shares held for less than 30 days. The Fund imposes a maximum Contingent Deferred Sales Charge (“CDSC”) of 1.00% to shares redeemed within the first 12 months after a purchase in excess of $1 million. Performance data does not reflect the redemption fee or the CDSC, which if reflected would reduce the performance quoted. For the most current month-end performance data, please call (866) 759-5679.
| 1 | Net Asset Value (NAV) is the share price without sales charges. |
| 2 | Maximum Offering Price (MOP) includes sales charges. Class A returns include effects of the Fund’s maximum sales charge of 5.50%; Class C returns include the 1.00% CDSC. |
| 3 | Thomson Reuters/Jefferies CRB Index measures the performance of certain commodity futures contracts. An investor may not invest directly in the index. |
| ^ | Fund inception date of 6/29/10. |
| * | Effective through August 31, 2011, the Sub-Adviser has given a contractual agreement to the Fund to limit the amount of the Fund’s total annual expenses, exclusive of distribution and service (12b-1) fees, shareholder services fees, acquired fund fees and expenses, brokerage expenses, interest expense, taxes and extraordinary expenses to 1.05% of the average daily net assets for Class A and Class C shares, and to 1.15% of the average daily net assets for Class I shares. Without this agreement expenses could be higher. |
The table does not reflect the deduction of taxes that a shareholder would pay on Fund distributions or the redemption of Fund shares.
The Fund is less than a year old and has limited operating history. This Fund is not suitable for all investors. Subject to investment risks, including possible loss of the principal amount invested.
Investing in Commodity-Related securities involves risk and considerations not present when investing in more conventional securities. The Fund may be more susceptible to high volatility of commodity markets.
29 | October 31, 2010
Table of Contents
| Jefferies Asset Management Commodity Strategy Allocation Fund | ||||||
As a shareholder of the Fund you will incur two types of costs: (1) transaction costs, including applicable sales charges (loads) and redemption fees; and (2) ongoing costs, including management fees, distribution and service (12b-1) fees, shareholder service fees and other Fund expenses. The following examples are intended to help you understand your ongoing costs (in dollars) of investing in the Fund and to compare these costs with the ongoing costs of investing in other mutual funds. The examples are based on an investment of $1,000 invested on June 29, 2010 and held until October 31, 2010.
Actual Expenses. The first line of the table on the next page provides information about actual account values and actual expenses. You may use the information in this line, together with the amount you invested, to estimate the expenses that you paid over the period. Simply divide your account value by $1,000 (for example, an $8,600 account value divided by $1,000 = 8.6), then multiply the result by the number in the first line under the heading “Expense Paid During Period” to estimate the expenses you paid on your account during this period.
Hypothetical Example for Comparison Purposes. The second line of the table on the next page provides information about hypothetical account values and hypothetical expenses based on the Fund’s actual expense ratio and an assumed rate of return of 5% per year before expenses, which is not the Fund’s actual return. The hypothetical account values and expenses may not be used to estimate the actual ending account balance or expenses you paid for the period. You may use this information to compare the ongoing costs of investing in the Fund and other mutual funds. To do so, compare this 5% hypothetical example with the 5% hypothetical examples that appear in the shareholder reports of the other funds.
The expenses shown in the table are meant to highlight ongoing Fund costs only and do not reflect transaction fees, such as sales charges, redemption fees or exchange fees. Therefore, the second line of the table on the next page is useful in comparing ongoing costs only, and may not help you determine the relative total costs of owning different funds. In addition, if these transactional costs were included, your costs would have been higher.
The examples are based on an investment of $1,000 invested on June 29, 2010 and held until October 31, 2010.
| Beginning Account Value 6/29/10 | Ending Account Value 10/31/10 | Expense Ratio(a) | Expense Paid 10/31/10 | |||||||||||||
Class A(c) | ||||||||||||||||
Actual | $1,000.00 | $1,193.70 | 1.45% | $5.40 | ||||||||||||
Hypothetical (5% return before expenses) | $1,000.00 | $1,012.06 | 1.45% | $7.35 | ||||||||||||
Class C(c) | ||||||||||||||||
Actual | $1,000.00 | $1,194.90 | 2.05% | $7.64 | ||||||||||||
Hypothetical (5% return before expenses) | $1,000.00 | $1,010.02 | 2.05% | $10.39 | ||||||||||||
Class I(c) | ||||||||||||||||
Actual | $1,000.00 | $1,196.60 | 1.15% | $4.29 | ||||||||||||
Hypothetical (5% return before expenses) | $1,000.00 | $1,013.08 | 1.15% | $5.84 | ||||||||||||
| (a) | The Fund’s expense ratios have been based on the Fund’s inception date of June 29, 2010 through October 31, 2010. |
| (b) | Expenses are equal to the Fund’s annualized expense ratio multiplied by the average account value over the period, multiplied by the number of days in the most recent fiscal half year (184), then divided by 365. |
| (c) | Shares commenced operations on June 29, 2010. |
30 | October 31, 2010
Table of Contents
| Jefferies Asset Management Commodity Strategy Allocation Fund | ||||||
|
October 31, 2010 (Unaudited) | |||||
| Shares | Value (Note 1) | |||||||
COMMON STOCKS 24.57% |
| |||||||
Australia 0.54% |
| |||||||
Fortescue Metals Group, Ltd.* | 722 | $ | 4,420 | |||||
Incitec Pivot, Ltd. | 5,985 | 21,809 | ||||||
Newcrest Mining, Ltd. | 536 | 20,980 | ||||||
Nufarm, Ltd.* | 835 | 3,722 | ||||||
Woodside Petroleum, Ltd. | 262 | 11,164 | ||||||
| 62,095 | ||||||||
Bermuda 0.32% |
| |||||||
Aquarius Platinum, Ltd. | 513 | 2,950 | ||||||
Bunge, Ltd. | 513 | 30,816 | ||||||
Sinofert Holdings, Ltd.* | 6,566 | 3,473 | ||||||
| 37,239 | ||||||||
Brazil 0.76% |
| |||||||
Companhia Siderurgica | ||||||||
Nacional SA, ADR | 786 | 13,268 | ||||||
Gerdau SA, ADR | 486 | 6,337 | ||||||
Petroleo Brasileiro SA, ADR | 1,211 | 41,319 | ||||||
Vale SA, ADR | 801 | 25,744 | ||||||
| 86,668 | ||||||||
Canada 4.23% |
| |||||||
Agnico-Eagle Mines, Ltd. | 186 | 14,425 | ||||||
Agrium, Inc. | 580 | 51,307 | ||||||
Barrick Gold Corp. | 1,093 | 52,641 | ||||||
Cameco Corp. | 204 | 6,311 | ||||||
Canadian Natural Resources, Ltd. | 498 | 18,130 | ||||||
Eldorado Gold Corp. | 601 | 10,177 | ||||||
EnCana Corp. | 350 | 9,887 | ||||||
Goldcorp, Inc. | 811 | 36,212 | ||||||
IAMGOLD Corp. | 408 | 7,445 | ||||||
Inmet Mining Corp. | 7 | 3,408 | ||||||
Ivanhoe Mines, Ltd.* | 274 | 6,560 | ||||||
Kinross Gold Corp.* | 782 | 14,074 | ||||||
Osisko Mining Corp.* | 373 | 5,171 | ||||||
Pan American Silver Corp. | 115 | 3,679 | ||||||
Potash Corp. of Saskatchewan, Inc. | 1,090 | 157,638 | ||||||
Silver Wheaton Corp.* | 381 | 10,953 | ||||||
Suncor Energy, Inc. | 745 | 23,872 | ||||||
Talisman Energy, Inc. | 486 | 8,811 | ||||||
Teck Resources, Ltd., Class B | 248 | 11,088 | ||||||
TransCanada Corp. | 331 | 12,225 | ||||||
Viterra, Inc.* | 1,163 | 11,141 | ||||||
Yamana Gold, Inc. | 819 | 9,010 | ||||||
| 484,165 | ||||||||
| Shares | Value (Note 1) | |||||||
Cayman Islands 0.07% |
| |||||||
Chaoda Modern Agriculture | ||||||||
Holdings, Ltd. | 9,998 | $ | 8,152 | |||||
Chile 0.44% |
| |||||||
Sociedad Quimica y Minerade Chile SA, ADR | 975 | 50,505 | ||||||
China 0.34% |
| |||||||
Angang Steel Co., Ltd., Class H | 538 | 845 | ||||||
China BlueChemical, Ltd., Class H | 6,017 | 4,759 | ||||||
China Petroleum & Chemical Corp., Class H | 8,018 | 7,562 | ||||||
China Shenhua Energy Co., Ltd., | 1,619 | 7,206 | ||||||
Jiangxi Copper Co., Ltd., Class H | 694 | 1,934 | ||||||
PetroChina Co., Ltd., Class H | 9,952 | 12,146 | ||||||
Zijin Mining Group Co., Ltd., Class H | 4,455 | 4,201 | ||||||
| 38,653 | ||||||||
Denmark 0.13% |
| |||||||
Danisco A/S | 175 | 15,089 | ||||||
France 0.48% |
| |||||||
Total SA | 1,005 | 54,615 | ||||||
Germany 0.38% |
| |||||||
K+S AG | 529 | 36,887 | ||||||
ThyssenKrupp AG | 167 | 6,140 | ||||||
| 43,027 | ||||||||
Hong Kong 0.21% |
| |||||||
China Agri-Industries Holdings, Ltd. | 5,777 | 8,407 | ||||||
CNOOC, Ltd. | 7,597 | 15,740 | ||||||
| 24,147 | ||||||||
India 0.40% |
| |||||||
Reliance Industries, Ltd., GDR(a) | 783 | 38,986 | ||||||
Sterlite Industries India, Ltd., ADR | 416 | 6,435 | ||||||
| 45,421 | ||||||||
Israel 0.33% |
| |||||||
Israel Chemicals, Ltd. | 1,570 | 24,011 | ||||||
The Israel Corp., Ltd.* | 13 | 13,946 | ||||||
| 37,957 | ||||||||
Italy 0.23% |
| |||||||
Eni SpA | 1,188 | 26,770 | ||||||
31 | October 31, 2010
Table of Contents
| Jefferies Asset Management Commodity Strategy Allocation Fund | ||||||
Statement of Investments |
October 31, 2010 (Unaudited) | |||||
| Shares | Value (Note 1) | |||||||
Japan 0.27% |
| |||||||
Inpex Corp. | 1 | $ | 5,201 | |||||
JFE Holdings, Inc. | 250 | 7,804 | ||||||
Nippon Steel Corp. | 2,824 | 8,879 | ||||||
Sumitomo Metal Industries, Ltd. | 1,800 | 4,183 | ||||||
Sumitomo Metal Mining Co., Ltd. | 278 | 4,415 | ||||||
| 30,482 | ||||||||
Jersey 0.08% |
| |||||||
Randgold Resources, Ltd. | 100 | 9,334 | ||||||
Luxembourg 0.24% |
| |||||||
ArcelorMittal | 453 | 14,561 | ||||||
Evraz Group SA, GDR(b)* | 62 | 1,880 | ||||||
Tenaris SA, ADR | 282 | 11,683 | ||||||
| 28,124 | ||||||||
Mauritius 0.10% |
| |||||||
Golden Agri-Resources, Ltd. | 22,873 | 11,487 | ||||||
Mexico 0.06% |
| |||||||
Grupo Mexico SAB de CV, Series B | 1,935 | 6,373 | ||||||
Netherlands 0.49% |
| |||||||
CNH Global N.V.* | 96 | 3,810 | ||||||
Nutreco Holding N.V. | 112 | 8,150 | ||||||
Schlumberger, Ltd. | 638 | 44,590 | ||||||
| 56,550 | ||||||||
Norway 0.30% |
| |||||||
Norsk Hydro ASA | 384 | 2,351 | ||||||
Yara International ASA | 619 | 32,554 | ||||||
| 34,905 | ||||||||
Peru 0.14% |
| |||||||
Companhia de Minas Buenaventura SA, ADR | 305 | 16,177 | ||||||
Russia 0.66% |
| |||||||
Gazprom OAO, ADR | 1,414 | 30,995 | ||||||
LUKOIL OAO, ADR | 204 | 11,383 | ||||||
Mechel Steel Group, ADR | 73 | 1,719 | ||||||
MMC Norilsk Nickel, ADR | 420 | 7,833 | ||||||
Polyus Gold Co., ADR | 153 | 4,532 | ||||||
Rosneft Oil Co., GDR(b)* | 780 | 5,436 | ||||||
Uralkali, GDR(b) | 541 | 13,390 | ||||||
| 75,288 | ||||||||
Singapore 0.50% |
| |||||||
Olam International, Ltd. | 7,396 | 17,886 | ||||||
Wilmar International, Ltd. | 7,925 | 39,187 | ||||||
| 57,073 | ||||||||
| Shares | Value (Note 1) | |||||||
South Africa 0.58% |
| |||||||
Anglo Platinum, Ltd.* | 58 | $ | 5,738 | |||||
AngloGold Ashanti, Ltd., ADR | 403 | 18,985 | ||||||
Gold Fields, Ltd. | 723 | 11,314 | ||||||
Harmony Gold Mining Co., Ltd. | 241 | 2,759 | ||||||
Impala Platinum Holdings, Ltd. | 625 | 17,666 | ||||||
Sasol, Ltd. | 225 | 10,131 | ||||||
| 66,593 | ||||||||
Spain 0.10% |
| |||||||
Repsol YPF SA | 409 | 11,342 | ||||||
Switzerland 1.01% |
| |||||||
Noble Corp. | 121 | 4,178 | ||||||
Syngenta AG | 350 | 96,814 | ||||||
Transocean, Ltd.* | 152 | 9,631 | ||||||
Weatherford International, Ltd.* | 300 | 5,043 | ||||||
| 115,666 | ||||||||
United Kingdom 2.04% |
| |||||||
Anglo American PLC | 619 | 28,843 | ||||||
Antofagasta PLC | 179 | 3,792 | ||||||
BG Group PLC | 1,613 | 31,416 | ||||||
BHP Billiton PLC | 1,106 | 39,228 | ||||||
Kazakhmys PLC | 102 | 2,151 | ||||||
Lonmin PLC* | 171 | 4,792 | ||||||
Petropavlovsk PLC | 164 | 2,545 | ||||||
Rio Tinto PLC | 732 | 47,340 | ||||||
Royal Dutch Shell PLC, Class A | 1,693 | 54,914 | ||||||
Xstrata PLC | 978 | 18,954 | ||||||
| 233,975 | ||||||||
United States 9.14% |
| |||||||
AGCO Corp.* | 340 | 14,440 | ||||||
Alcoa, Inc. | 530 | 6,959 | ||||||
Allegheny Technologies, Inc. | 46 | 2,424 | ||||||
Anadarko Petroleum Corp. | 236 | 14,531 | ||||||
Apache Corp. | 173 | 17,476 | ||||||
Archer-Daniels-Midland Co. | 2,313 | 77,069 | ||||||
Baker Hughes, Inc. | 205 | 9,498 | ||||||
Cameron International Corp.* | 113 | 4,944 | ||||||
CF Industries Holdings, Inc. | 253 | 31,000 | ||||||
Chesapeake Energy Corp. | 309 | 6,705 | ||||||
Chevron Corp. | 960 | 79,306 | ||||||
Cliffs Natural Resources, Inc. | 69 | 4,499 | ||||||
Coeur d’Alene Mines Corp.* | 99 | 2,040 | ||||||
ConocoPhillips | 708 | 42,055 | ||||||
Consol Energy, Inc. | 108 | 3,970 | ||||||
Corn Products International, Inc. | 275 | 11,701 | ||||||
Deere & Co. | 1,566 | 120,269 | ||||||
Devon Energy Corp. | 194 | 12,614 | ||||||
Diamond Offshore Drilling, Inc. | 33 | 2,183 | ||||||
EOG Resources, Inc. | 120 | 11,486 | ||||||
32 | October 31, 2010
Table of Contents
| Jefferies Asset Management Commodity Strategy Allocation Fund | ||||||
Statement of Investments |
October 31, 2010 (Unaudited) | |||||
| Shares | Value (Note 1) | |||||||
United States (continued) |
| |||||||
Exxon Mobil Corp. | 2,428 | $ | 161,389 | |||||
Freeport - McMoRan Copper & Gold, Inc. | 242 | 22,913 | ||||||
Halliburton Co. | 431 | 13,732 | ||||||
Hecla Mining Co.* | 283 | 1,950 | ||||||
Hess Corp. | 145 | 9,139 | ||||||
International Paper Co. | 1,335 | 33,749 | ||||||
Intrepid Potash, Inc.* | 182 | 6,248 | ||||||
Marathon Oil Corp. | 338 | 12,023 | ||||||
Monsanto Co. | 1,992 | 118,365 | ||||||
The Mosaic Co. | 589 | 43,091 | ||||||
National Oilwell Varco, Inc. | 200 | 10,752 | ||||||
Newmont Mining Corp. | 538 | 32,748 | ||||||
Noble Energy, Inc. | 82 | 6,681 | ||||||
Nucor Corp. | 164 | 6,268 | ||||||
Occidental Petroleum Corp. | 382 | 30,037 | ||||||
Peabody Energy Corp. | 129 | 6,824 | ||||||
Royal Gold, Inc. | 57 | 2,822 | ||||||
Southern Copper Corp. | 88 | 3,766 | ||||||
Southwestern Energy Co.* | 163 | 5,518 | ||||||
United States Steel Corp. | 75 | 3,209 | ||||||
Valero Energy Corp. | 270 | 4,846 | ||||||
Weyerhaeuser Co. | 1,838 | 29,812 | ||||||
The Williams Co., Inc. | 279 | 6,004 | ||||||
| 1,047,055 | ||||||||
TOTAL COMMON STOCKS (Cost $2,414,771) |
| 2,814,927 | ||||||
WARRANT 0.00%(c) |
| |||||||
Canada 0.00%(c) | ||||||||
Kinross Gold Corp., strike price $21.30, Expires 09/17/14 | 20 | 81 | ||||||
TOTAL WARRANT (Cost $72) |
| 81 | ||||||
| Principal Amount | Value (Note 1) | |||||||
GOVERNMENT BONDS 68.79% |
| |||||||
U.S. Treasury Bonds 68.79% |
| |||||||
United States Treasury Inflation Indexed Bonds | ||||||||
3.500%, 01/15/2011 | $ | 1,442,434 | 1,452,914 | |||||
2.375%, 04/15/2011 | 1,549,407 | 2,911,878 | ||||||
3.375%, 01/15/2012 | 522,274 | 546,919 | ||||||
2.000%, 04/15/2012 | 710,325 | 1,182,804 | ||||||
1.875%, 07/15/2013 | 225,925 | 356,222 | ||||||
2.000%, 07/15/2014 | 318,552 | 348,466 | ||||||
1.625%, 01/15/2015 | 331,644 | 359,523 | ||||||
0.500%, 04/15/2015 | 347,532 | 361,895 | ||||||
1.875%, 07/15/2015 | 325,473 | 359,470 | ||||||
| 7,880,091 | ||||||||
TOTAL GOVERNMENT BONDS (Cost $7,841,687) | $ | 7,880,091 | ||||
Total Investments (Cost $10,256,530)-93.36% | $ | 10,695,099 | ||||
Net Other Assets and Liabilities - 6.64% | 761,079 | |||||
NET ASSETS - 100.00% | $ | 11,456,178 | ||||
| * | Non Income Producing Security. |
| (a) | Security exempt from registration under rule 144A of the Securities Act of 1933. This security may be resold in transactions exempt from registration, normally to qualified institutional buyers. This security has been determined to be liquid in accordance with procedures adopted by the Fund’s Board of Trustees. The security restricted under Rule 144A comprised 0.34% of net assets. |
| (b) | These securities, initially sold to other parties pursuant to Registration S under the 1933 Act and subsequently resold to the Fund, have been deemed liquid under the guidelines approved by the Fund’s Board of Trustees. At the period end, the aggregate market value of those securities was $20,706, representing 0.18% of the nets assets. |
| (c) | Less than 0.005%. |
| Common | Abbreviations: |
A/S - Aktieselskab is the Danish name for a stock - based corporation.
ADR - erican Depositary Receipt.
AG - Aktiengesellschaft is a German term that refers to a corporation that is limited by shares, i.e., owned by shareholders.
ASA - Allmennaksjeselskap is the Norwegian term for public limited company.
GDR - Global Depositary Receipt.
Ltd. - Limited.
N.V. - Naamloze Vennootschap is the Dutch term for public limited liability corporation.
OAO - Otkrytoe Aktsionernoe Obschestvo is a Russian term meaning Open Joint Stock Corporation.
PLC - Public Limited Co.
SA - Generally designated corporations in various countries, mostly those employing the civil law.
SAB de CV - A variable capital company.
SpA - Societá Per Azioni is an Italian shared company.
See Notes to Financial Statements.
33 | October 31, 2010
Table of Contents
| Jefferies Asset Management Commodity Strategy Allocation Fund | ||||||
Statement of Investments |
October 31, 2010 (Unaudited) | |||||
| Total Return Swap Contracts(a) | ||||||||||||||||||||
| Swap Counterparty | Reference Obligation | Notional Amount | Rate Paid by the Fund | Termination Date | Unrealized Appreciation | |||||||||||||||
Bank of America Merrill Lynch |
| CRB 3 Month Forward Total Return Index |
| $ | 8,064,097 | 0.48 | % | 06/30/11 | $ | 327,912 | ||||||||||
| (a) | The Fund receives monthly payments based on any positive monthly return of the Reference Obligation. The Fund makes payments on any negative monthly return of such Reference Obligation. |
For Fund compliance purposes, the Fund’s industry classifications refer to any one or more of the industry sub-classifications used by one or more widely recognized market indexes or ratings group indexes, and/or as defined by Fund management. This definition may not apply for purposes of this report, which may combine industry sub-classifications for reporting ease. Industries are shown as a percent of net assets. These industry classifications are based on third party definitions and are unaudited. The definitions are industry terms and do not reflect the legal status of any of the investments or the companies in which the Fund has invested.
Top Ten Holdings (as a % of Net Assets) †
Exxon Mobil Corp. | 1.41 | % | ||
Potash Corp. of Saskatchewan, Inc. | 1.38 | % | ||
Deere & Co. | 1.05 | % | ||
Monsanto Co. | 1.03 | % | ||
Syngenta AG | 0.85 | % | ||
Chevron Corp. | 0.69 | % | ||
Archer-Daniels-Midland Co. | 0.67 | % | ||
Royal Dutch Shell PLC, Class A | 0.48 | % | ||
Total SA | 0.48 | % | ||
Barrick Gold Corp. | 0.46 | % | ||
Top Ten Holdings | 8.50 | % |
| † | Holdings are subject to change. |
Industry Sector Allocation (as a % of Net Assets)
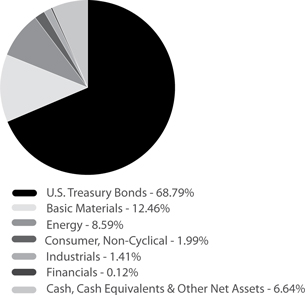
34 | October 31, 2010
Table of Contents
| RiverFront Long-Term Growth & Income Fund | ||||||
|
October 31, 2010 (Unaudited) | |||||
Financial markets have gone through three distinct mood swings so far in 2010. Early in the year, many investors expected the US economy to enjoy the period of strong growth that typically occurs after a recession. Equity markets soared as the growth associated with accelerating government stimulus spending and inventory rebuilding seemed to validate those expectations. As we moved into the second quarter, these temporary boosts to growth began to fade and the market mood reversed toward expecting a double-dip recession; equity prices plummeted along with expected economic growth. By the third quarter, financial markets appeared to come to the conclusion that RiverFront had maintained all year long – the economy is neither as strong as was hoped early in the year nor as weak as was feared during the summer. This realization, combined with additional monetary stimulus on the part of the Federal Reserve, sparked a significant rally in September that reversed earlier declines and left the S&P 500 Index up nearly 4.0% at the end of the third quarter.
The adjustments RiverFront made to our longer term allocation strategy in the second quarter boosted performance in the third quarter. For example, the portfolios’ emerging market weightings, which we increased substantially, returned 19%. Although interest rates fell during the period thanks to renewed bond purchases on the part of the Federal Reserve, high quality bonds offered so little income that investors reached for the attractive relative value we have been seeing all year in the high yield market. This strong performance from our high yield bond positions more than compensated for the lack of long maturity bonds within our new portfolio strategies.
Our tactical strategies have had to adjust rapidly to the changing market mood. We entered the quarter with many portfolios having as much as 25% cash due to the downward momentum of the market in the late spring and early summer. As the market gained confidence in the economic environment, we quickly switched from defense to offense and invested those cash balances. The success of these efforts is reflected in our performance. Portfolio gains for the quarter ranged from approximately 8% for our more conservative portfolios to nearly 12% for our more aggressive offerings. This performance was fairly close to portfolio benchmarks despite our conservative posture for most of the quarter. Although our defensive tactical strategy cost us a little bit of upside, we believe we mitigated the downside by our aggressive cash weighting, which was more than worth the cost to upside participation.
The RiverFront Long-Term Growth & Income Fund and RiverFront Moderate Growth Fund outperformed their benchmark (S&P 500 Index) for the period ended October 31, 2010. The RiverFront Moderate Growth & Income Fund slightly underperformed the benchmark, consistent with the more cautious approach we typically employ for our Growth & Income portfolios. The performance of these funds can be attributed to the following:
Cash: Risk management is at the core of RiverFront investment philosophy. As part of this risk management process, RiverFront raised higher relative cash levels during some of the prior period as important technical support levels were broken. While these
risk management efforts impacted some performance negatively in recent months as the market turned higher, we are pleased that these insurance strategies protected investor downside with less than expected impact to upside participation. Our adherence to risk management disciplines have served our investors well over the years and we will continue to manage downside risks when we deem it prudent.
Equities: Within domestic equities we have maintained a bias toward higher quality companies with consistent dividend growth. These types of securities have underperformed year-to-date and the Dow Jones Industrial Average^ (“DJIA”) is a good example of the underperformance of these types of companies. Year-to-date the DJIA has underperformed the S&P 500 Index by roughly 150 basis points^^. Our conviction behind quality dividend growers is two-fold. First, we believe ‘pound for pound’ few asset classes can touch the relative value of U.S. high quality large-caps. Companies in this universe have a history of delivering stable, consistent low to mid-teens earnings growth and are trading an 8-12 forward P/E multiples*. Secondly, we believe that maturing bull markets ultimately become stock-pickers markets where relative value and getting the most growth ‘for the buck’ become increasingly important.
Fixed Income: Our belief that we should hold shorter relative maturity issues and avoid Treasuries proved just a few weeks premature. Throughout 2010, we have been concerned about the risk that longer duration bonds posed to investors given their low historic yields and premium prices. Subsequent to October 31, interest rates have begun to rise and validate our cautious bond market strategy. We believe this rise will continue. As such, we retain shorter maturity holdings. We have maintained an overweight position in high yield, which has turned sharply higher relative to investment grade bonds in the weeks since October 31, 2010.
Portfolio positioning for the coming quarter will continue to be driven by our belief that the S&P 500 Index remains trapped within a trading range of about 1000 to 1200. Renewed prospects for quantitative easing by the Federal Reserve and hopes for Republican gains in the mid-term election are currently pushing the market toward the upper end of the range, but we are not yet convinced that top line growth and fundamental earnings power will be sufficient over the near term to allow an upside breakout. In what we perceive as a range-bound environment, we are trading against sentiment, seeking to raise cash and lower portfolio risk as we approach the upper end of the range and reversing these strategies near the bottom of the range. We believe our portfolios can offer a substantial income advantage relative to the market, and we think the incremental yield can provide a performance advantage in a range-bound environment. Finally, we are seeking asset classes that have broken free from the trading range that characterizes most developed equity markets. In particular, small cap emerging market companies are primarily focused on serving the emerging market consumer. Since these consumers are not plagued with the debt burdens holding back the developed economies, these stocks have set new highs, and they occupy a substantial weighting in our portfolios.
| ^ | The Dow Jones Industrial Average is a price-weighted average of 30 significant stocks traded on the New York Stock Exchange and the Nasdaq |
| ^^ | A unit that is equal to 1/100th of 1% |
| * | Forward P/E multiples are a measure of the price-to-earnings ratio (P/E) using forecasted earnings |
35 | October 31, 2010
Table of Contents
| RiverFront Long-Term Growth & Income Fund | ||||||
| Management Commentary | October 31, 2010 (Unaudited) |
Performance of $10,000 Initial Investment (as of October 31, 2010)
Comparison of change in value of a $10,000 investment (includes applicable sales loads)
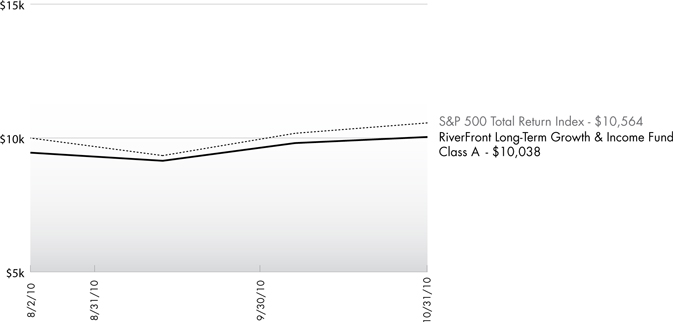
The chart above represents historical performance of a hypothetical investment of $10,000 in the Fund since inception. Past performance does not guarantee future results. This chart does not reflect the deduction of taxes that a shareholder would pay on Fund distributions or the redemption of Fund shares.
| Cumulative Return (as of October 31, 2010) |
| 1 month | Since Inception^ | Gross Expense Ratio | Net Expense Ratio* | |||||
Class A (NAV)1 | 2.31% | 6.20% | 2.01% | 1.51% | ||||
Class A (MOP)2 | -3.28% | 0.38% | ||||||
Class C (NAV)1 | 2.32% | 6.00% | 2.76% | 2.26% | ||||
Class C (CDSC)2 | 1.32% | 5.00% | ||||||
Class I | 2.41% | 6.20% | 1.76% | 1.26% | ||||
S&P 500 Total Return Index3 | 3.81% | 5.64% |
Performance data quoted represents past performance. Past performance does not guarantee future results. Investment return and principal value of an investment will fluctuate so that an investor’s shares, when sold or redeemed, may be worth more or less than the original cost. Current performance data may be higher or lower than actual data quoted. The Fund imposes a maximum Contingent Deferred Sales Charge (“CDSC”) of 1.00% to shares redeemed within the first 12 months after a purchase in excess of $1 million. Performance data does not reflect the CDSC, which if reflected would reduce the performance quoted. For the most current month-end performance data, please call (866) 759-5679.
| 1 | Net Asset Value (NAV) is the share price without sales charges. |
| 2 | Maximum Offering Price (MOP) includes sales charges. Class A returns include effects of the Fund’s maximum sales charge of 5.50%; Class C returns include the 1.00% CDSC. |
| 3 | S&P 500 Total Return Index is the Standard & Poor’s composite index of 500 stocks, a widely recognized, unmanaged index of common stock prices. An investor may not invest directly in the index. |
| ^ | Fund inception date of 8/2/10. |
| * | Effective through August 31, 2011, the Adviser and the Sub-Adviser have given a contractual agreement to the Fund to limit the amount of the Fund’s total annual expenses, exclusive of distribution and service (12b-1) fees, shareholder services fees, acquired fund fees and expenses, brokerage expenses, interest expense, taxes and extraordinary expenses to 1.05% of the average daily net assets for Class A, Class C and Class I shares. Without this agreement expenses could be higher. |
The table does not reflect the deduction of taxes that a shareholder would pay on Fund distributions or the redemption of Fund shares.
The Fund is less than a year old and has limited operating history. This Fund is not suitable for all investors. Subject to investment risks, including possible loss of the principal amount invested.
36 | October 31, 2010
Table of Contents
| RiverFront Long-Term Growth & Income Fund | ||||||
|
October 31, 2010 (Unaudited) | |||||
As a shareholder of the Fund you will incur two types of costs: (1) transaction costs, including applicable sales charges (loads) and redemption fees; and (2) ongoing costs, including management fees, distribution and service (12b-1) fees, shareholder service fees and other Fund expenses. The following examples are intended to help you understand your ongoing costs (in dollars) of investing in the Fund and to compare these costs with the ongoing costs of investing in other mutual funds. The examples are based on an investment of $1,000 invested on August 2, 2010 and held until October 31, 2010.
Actual Expenses. The first line of the table on the next page provides information about actual account values and actual expenses. You may use the information in this line, together with the amount you invested, to estimate the expenses that you paid over the period. Simply divide your account value by $1,000 (for example, an $8,600 account value divided by $1,000 = 8.6), then multiply the result by the number in the first line under the heading “Expense Paid During Period” to estimate the expenses you paid on your account during this period.
Hypothetical Example for Comparison Purposes. The second line of the table on the next page provides information about hypothetical account values and hypothetical expenses based on the Fund’s actual expense ratio and an assumed rate of return of 5% per year before expenses, which is not the Fund’s actual return. The hypothetical account values and expenses may not be used to estimate the actual ending account balance or expenses you paid for the period. You may use this information to compare the ongoing costs of investing in the Fund and other mutual funds. To do so, compare this 5% hypothetical example with the 5% hypothetical examples that appear in the shareholder reports of the other funds.
The expenses shown in the table are meant to highlight ongoing Fund costs only and do not reflect transaction fees, such as sales charges, redemption fees or exchange fees. Therefore, the second line of the table on the next page is useful in comparing ongoing costs only, and may not help you determine the relative total costs of owning different funds. In addition, if these transactional costs were included, your costs would have been higher.
The examples are based on an investment of $1,000 invested on August 2, 2010 and held until October 31, 2010.
| Beginning Account Value 8/2/10 | Ending Account Value 10/31/10 | Expense Ratio(a) | Expense Paid During Period(b) 8/2/10- 10/31/10 | |||||||||||||
Class A(c) | ||||||||||||||||
Actual | $1,000.00 | $1,062.00 | 1.30% | $3.30 | ||||||||||||
Hypothetical (5% return before expenses) | $1,000.00 | $1,009.12 | 1.30% | $6.58 | ||||||||||||
Class C(c) | ||||||||||||||||
Actual | $1,000.00 | $1,060.00 | 2.05% | $5.21 | ||||||||||||
Hypothetical (5% return before expenses) | $1,000.00 | $1,007.27 | 2.05% | $10.37 | ||||||||||||
Class I(c) | ||||||||||||||||
Actual | $1,000.00 | $1,062.00 | 1.05% | $2.67 | ||||||||||||
Hypothetical (5% return before expenses) | $1,000.00 | $1,009.74 | 1.05% | $5.32 | ||||||||||||
| (a) | The Fund’s expense ratios have been based on the Fund’s inception date of August 2, 2010 through October 31, 2010. |
| (b) | Expenses are equal to the Fund’s annualized expense ratio multiplied by the average account value over the period, multiplied by the number of days in the most recent fiscal half year (184), then divided by 365. |
| (c) | Shares commenced operations on August 2, 2010. |
37 | October 31, 2010
Table of Contents
| RiverFront Long-Term Growth & Income Fund | ||||||
|
October 31, 2010 (Unaudited) | |||||
| Shares | Value (Note 1) | |||||||
COMMON STOCKS (33.26%) |
| |||||||
Communications (1.93%) |
| |||||||
Telecommunications (1.93%) |
| |||||||
BCE, Inc. | 1,351 | $ | 45,272 | |||||
Verizon Communications, Inc. | 1,012 | 32,860 | ||||||
| 78,132 | ||||||||
TOTAL COMMUNICATIONS |
| 78,132 | ||||||
Consumer, Cyclical (5.47%) |
| |||||||
Retail (4.35%) |
| |||||||
McDonald’s Corp. | 840 | 65,327 | ||||||
Tiffany & Co. | 1,274 | 67,522 | ||||||
Wal-Mart Stores, Inc. | 798 | 43,228 | ||||||
| 176,077 | ||||||||
Toys, Games & Hobbies (1.12%) |
| |||||||
Mattel, Inc. | 1,934 | 45,120 | ||||||
TOTAL CONSUMER, CYCLICAL |
| 221,197 | ||||||
Consumer, Non-Cyclical (7.46%) |
| |||||||
Agriculture (2.40%) |
| |||||||
Altria Group, Inc. | 1,144 | 29,080 | ||||||
Philip Morris International, Inc. | 1,164 | 68,094 | ||||||
| 97,174 | ||||||||
Commercial Services (0.98%) |
| |||||||
Automatic Data Processing, Inc. | 893 | 39,667 | ||||||
Healthcare Products (1.01%) |
| |||||||
Becton Dickinson and Co. | 543 | 41,007 | ||||||
Pharmaceuticals (3.07%) |
| |||||||
Abbott Laboratories | 784 | 40,235 | ||||||
Bristol-Myers Squibb Co. | 1,791 | 48,178 | ||||||
Merck & Co., Inc. | 977 | 35,446 | ||||||
| 123,859 | ||||||||
TOTAL CONSUMER, NON-CYCLICAL |
| 301,707 | ||||||
Energy (3.60%) |
| |||||||
Oil & Gas (1.97%) |
| |||||||
Chevron Corp. | 969 | 80,049 | ||||||
Pipelines (1.63%) |
| |||||||
Oneok, Inc. | 1,320 | 65,762 | ||||||
TOTAL ENERGY |
| 145,811 | ||||||
| Shares | Value (Note 1) | |||||||
Financial (6.82%) |
| |||||||
Diversified Financial Services (1.83%) |
| |||||||
American Express Co. | 1,241 | $ | 51,452 | |||||
Och-Ziff Capital Management Group LLC | 1,522 | 22,480 | ||||||
| 73,932 | ||||||||
Insurance (1.47%) |
| |||||||
Chubb Corp. | 1,024 | 59,412 | ||||||
Real Estate Investment Trusts (3.52%) |
| |||||||
American Campus Communities, Inc. | 1,301 | 41,151 | ||||||
Corporate Office Properties Trust | 1,199 | 42,553 | ||||||
DuPont Fabros Technology, Inc. | 2,343 | 58,809 | ||||||
| 142,513 | ||||||||
TOTAL FINANCIAL |
| 275,857 | ||||||
Industrial (3.81%) |
| |||||||
Aerospace & Defense (0.87%) |
| |||||||
Lockheed Martin Corp. | 495 | 35,289 | ||||||
Miscellaneous Manufacturers (1.76%) |
| |||||||
3M Co. | 845 | 71,166 | ||||||
Transportation (1.18%) |
| |||||||
United Parcel Service, Inc. | 710 | 47,811 | ||||||
TOTAL INDUSTRIAL |
| 154,266 | ||||||
Technology (2.78%) |
| |||||||
Computers (1.54%) |
| |||||||
International Business Machines Corp. | 435 | 62,466 | ||||||
Semiconductors (1.24%) |
| |||||||
Microchip Technology, Inc. | 1,560 | 50,201 | ||||||
TOTAL TECHNOLOGY |
| 112,667 | ||||||
Utilities (1.39%) |
| |||||||
Electric (1.39%) |
| |||||||
Dominion Resources, Inc. | 1,290 | 56,063 | ||||||
TOTAL UTILITIES |
| 56,063 | ||||||
TOTAL COMMON STOCKS (Cost $1,318,109) |
| 1,345,700 | ||||||
38 | October 31, 2010
Table of Contents
| RiverFront Long-Term Growth & Income Fund | ||||||
Statement of Investments |
October 31, 2010 (Unaudited) | |||||
| Shares | Value (Note 1) | |||||||
EXCHANGE TRADED FUNDS (51.32%) |
| |||||||
Commodity Fund (1.90%) |
| |||||||
SPDR Gold Shares(a) | 580 | $ | 76,931 | |||||
Consumer Staples (0.69%) |
| |||||||
Vanguard Consumer Staples ETF | 384 | 27,978 | ||||||
Emerging Market Equity (22.47%) |
| |||||||
Global X China Consumer ETF(a) | 1,016 | 20,869 | ||||||
iShares MSCI All Country Asia ex Japan Index Fund | 1,592 | 99,166 | ||||||
iShares MSCI Chile Investable Market Index Fund | 327 | 24,800 | ||||||
iShares MSCI Singapore Index Fund | 5,768 | 78,733 | ||||||
Vanguard Emerging Markets ETF | 8,321 | 389,673 | ||||||
WisdomTree Emerging Markets Small-Cap Dividend Fund | 5,653 | 296,556 | ||||||
| 909,797 | ||||||||
Fixed Income / High Yield (9.60%) |
| |||||||
PowerShares Fundamental High Yield Corporate Bond Portfolio | 1,965 | 36,353 | ||||||
SPDR Barclays Capital High Yield Bond ETF | 8,613 | 352,099 | ||||||
| 388,452 | ||||||||
International Equity (4.89%) |
| |||||||
iShares MSCI Canada Index Fund | 1,297 | 37,496 | ||||||
iShares MSCI United Kingdom Index Fund | 4,547 | 77,526 | ||||||
Vanguard Europe Pacific ETF | 2,305 | 82,750 | ||||||
| 197,772 | ||||||||
Large-Cap (1.85%) |
| |||||||
PowerShares Dividend Achievers Portfolio | 5,529 | 74,832 | ||||||
Micro-Cap (2.76%) |
| |||||||
First Trust Dow Jones Select Micro-Cap Index Fund | 3,640 | 71,053 | ||||||
Powershares Zacks Micro-Cap Portfolio | 3,854 | 40,428 | ||||||
| 111,481 | ||||||||
Mid-Cap (4.56%) |
| |||||||
iShares S&P Mid-Cap 400 Index Fund | 805 | 66,622 | ||||||
SPDR S&P Mid-Cap 400 ETF Trust | 784 | 118,015 | ||||||
| 184,637 | ||||||||
| Shares | Value (Note 1) | |||||||||||||
Real Estate Investment Trust (REIT) (2.60%) |
| |||||||||||||
iShares Dow Jones U.S. Real Estate Index Fund | 336 | $ | 18,453 | |||||||||||
Vanguard REIT ETF | 1,587 | 86,571 | ||||||||||||
| 105,024 | ||||||||||||||
TOTAL EXCHANGE TRADED FUNDS (Cost $1,995,667) |
| 2,076,904 | ||||||||||||
EXCHANGE TRADED NOTES (4.79%) |
| |||||||||||||
Master Limited Partnerships (MLPs) (3.98%) |
| |||||||||||||
JPMorgan Alerian MLP Index ETN | 3,393 | 120,401 | ||||||||||||
UBS E-TRACS Alerian MLP Infrastructure ETN | 1,404 | 40,674 | ||||||||||||
| 161,075 | ||||||||||||||
Other / Miscellaneous (0.81%) |
| |||||||||||||
iPATH S&P 500 VIX Mid-Term Futures ETN(a) | 438 | 32,635 | ||||||||||||
TOTAL EXCHANGE TRADED NOTES (Cost $190,103) |
| 193,710 | ||||||||||||
| 7-Day Yield | Shares | Value (Note 1) | ||||||||||||
SHORT TERM INVESTMENTS (8.17%) |
| |||||||||||||
Money Market Fund (8.17%) |
| |||||||||||||
Dreyfus Cash Management Fund, Institutional Class | 0.16% | 330,460 | 330,460 | |||||||||||
TOTAL SHORT TERM INVESTMENTS (Cost $330,460) |
| 330,460 | ||||||||||||
TOTAL INVESTMENTS (97.54%) (Cost $3,834,339) |
| $ | 3,946,774 | |||||||||||
Other Assets in Excess Of Liabilities (2.46%) |
| 99,490 | ||||||||||||
NET ASSETS (100.00%) |
| $ | 4,046,264 | |||||||||||
| (a) | Non-Income Producing Security. |
39 | October 31, 2010
Table of Contents
| RiverFront Long-Term Growth & Income Fund | ||||||
Statement of Investments |
October 31, 2010 (Unaudited) | |||||
Common Abbreviations:
E-TRACS - Exchange Traded Access Securities
ETF - Exchange Traded Fund
ETN - Exchange Traded Note
LLC - Limited Liability Company
Ltd. - Limited
MLP - Master Limited Partnership
MSCI - Morgan Stanley Capital International
REIT - Real Estate Investment Trust
S&P - Standard & Poor’s
SPDR - Standard & Poor’s Depositary Receipt
VIX - Market Volatility Index
For Fund compliance purposes, the Fund’s industry classifications refer to any one or more of the industry sub-classifications used by one or more widely recognized market indexes or ratings group indexes, and/or as defined by Fund management. This definition may not apply for purposes of this report, which may combine industry sub-classifications for reporting ease. Industries are shown as a percent of net assets. These industry classifications are based on third party definitions and are unaudited. The definitions are industry terms and do not reflect the legal status of any of the investments or the companies in which the Fund has invested.
See Notes to Financial Statements.
Top Ten Holdings (as a % of Net Assets) †
Vanguard Emerging Markets ETF | 9.63 | % | ||
SPDR Barclays Capital High Yield Bond ETF | 8.70 | % | ||
WisdomTree Emerging Markets SmallCap Dividend Fund | 7.33 | % | ||
JPMorgan Alerian MLP Index ETN | 2.98 | % | ||
SPDR S&P MidCap 400 ETF Trust | 2.92 | % | ||
iShares MSCI All Country Asia ex Japan Index Fund | 2.45 | % | ||
Vanguard REIT ETF | 2.14 | % | ||
Vanguard Europe Pacific ETF | 2.05 | % | ||
Chevron Corp. | 1.98 | % | ||
iShares MSCI Singapore Index Fund | 1.95 | % | ||
Top Ten Holdings | 42.13 | % |
| † | Holdings are subject to change. |
Industry Sector Allocation (as a % of Net Assets)
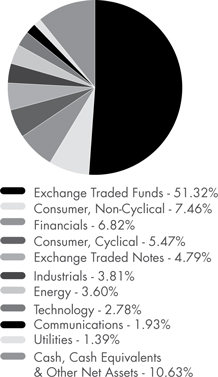
40 | October 31, 2010
Table of Contents
| RiverFront Moderate Growth Fund | ||||||
|
October 31, 2010 (Unaudited) | |||||
Financial markets have gone through three distinct mood swings so far in 2010. Early in the year, many investors expected the US economy to enjoy the period of strong growth that typically occurs after a recession. Equity markets soared as the growth associated with accelerating government stimulus spending and inventory rebuilding seemed to validate those expectations. As we moved into the second quarter, these temporary boosts to growth began to fade and the market mood reversed toward expecting a double-dip recession; equity prices plummeted along with expected economic growth. By the third quarter, financial markets appeared to come to the conclusion that RiverFront had maintained all year long – the economy is neither as strong as was hoped early in the year nor as weak as was feared during the summer. This realization, combined with additional monetary stimulus on the part of the Federal Reserve, sparked a significant rally in September that reversed earlier declines and left the S&P 500 Index up nearly 4.0% at the end of the third quarter.
The adjustments RiverFront made to our longer term allocation strategy in the second quarter boosted performance in the third quarter. For example, the portfolios’ emerging market weightings, which we increased substantially, returned 19%. Although interest rates fell during the period thanks to renewed bond purchases on the part of the Federal Reserve, high quality bonds offered so little income that investors reached for the attractive relative value we have been seeing all year in the high yield market. This strong performance from our high yield bond positions more than compensated for the lack of long maturity bonds within our new portfolio strategies.
Our tactical strategies have had to adjust rapidly to the changing market mood. We entered the quarter with many portfolios having as much as 25% cash due to the downward momentum of the market in the late spring and early summer. As the market gained confidence in the economic environment, we quickly switched from defense to offense and invested those cash balances. The success of these efforts is reflected in our performance. Portfolio gains for the quarter ranged from approximately 8% for our more conservative portfolios to nearly 12% for our more aggressive offerings. This performance was fairly close to portfolio benchmarks despite our conservative posture for most of the quarter. Although our defensive tactical strategy cost us a little bit of upside, we believe we mitigated the downside by our aggressive cash weighting, which was more than worth the cost to upside participation.
The RiverFront Long-Term Growth & Income Fund and RiverFront Moderate Growth Fund outperformed their benchmark (S&P 500 Index) for the period ended October 31, 2010. The RiverFront Moderate Growth & Income Fund slightly underperformed the benchmark, consistent with the more cautious approach we typically employ for our Growth & Income portfolios. The performance of these funds can be attributed to the following:
Cash: Risk management is at the core of RiverFront investment philosophy. As part of this risk management process, RiverFront
raised higher relative cash levels during some of the prior period as important technical support levels were broken. While these risk management efforts impacted some performance negatively in recent months as the market turned higher, we are pleased that these insurance strategies protected investor downside with less than expected impact to upside participation. Our adherence to risk management disciplines have served our investors well over the years and we will continue to manage downside risks when we deem it prudent.
Equities: Within domestic equities we have maintained a bias toward higher quality companies with consistent dividend growth. These types of securities have underperformed year-to-date and the Dow Jones Industrial Average^ (“DJIA”) is a good example of the underperformance of these types of companies. Year-to-date the DJIA has underperformed the S&P 500 Index by roughly 150 basis points^^. Our conviction behind quality dividend growers is two-fold. First, we believe ‘pound for pound’ few asset classes can touch the relative value of U.S. high quality large-caps. Companies in this universe have a history of delivering stable, consistent low to mid-teens earnings growth and are trading an 8-12 forward P/E multiples*. Secondly, we believe that maturing bull markets ultimately become stock-pickers markets where relative value and getting the most growth ‘for the buck’ become increasingly important.
Fixed Income: Our belief that we should hold shorter relative maturity issues and avoid Treasuries proved just a few weeks premature. Throughout 2010, we have been concerned about the risk that longer duration bonds posed to investors given their low historic yields and premium prices. Subsequent to October 31, interest rates have begun to rise and validate our cautious bond market strategy. We believe this rise will continue. As such, we retain shorter maturity holdings. We have maintained an overweight position in high yield, which has turned sharply higher relative to investment grade bonds in the weeks since October 31, 2010.
Portfolio positioning for the coming quarter will continue to be driven by our belief that the S&P 500 Index remains trapped within a trading range of about 1000 to 1200. Renewed prospects for quantitative easing by the Federal Reserve and hopes for Republican gains in the mid-term election are currently pushing the market toward the upper end of the range, but we are not yet convinced that top line growth and fundamental earnings power will be sufficient over the near term to allow an upside breakout. In what we perceive as a range-bound environment, we are trading against sentiment, seeking to raise cash and lower portfolio risk as we approach the upper end of the range and reversing these strategies near the bottom of the range. We believe our portfolios can offer a substantial income advantage relative to the market, and we think the incremental yield can provide a performance advantage in a range-bound environment. Finally, we are seeking asset classes that have broken free from the trading range that characterizes most developed equity markets. In particular, small cap emerging market companies are primarily focused on serving the emerging market consumer. Since these consumers are not plagued with the debt burdens holding back the developed economies, these stocks have set new highs, and they occupy a substantial weighting in our portfolios.
| ^ | The Dow Jones Industrial Average is a price-weighted average of 30 significant stocks traded on the New York Stock Exchange and the Nasdaq |
| ^^ | A unit that is equal to 1/100th of 1% |
| * | Forward P/E multiples are a measure of the price-to-earnings ratio (P/E) using forecasted earnings |
41 | October 31, 2010
Table of Contents
| RiverFront Moderate Growth Fund | ||||||
Management Commentary |
October 31, 2010 (Unaudited) | |||||
Performance of $10,000 Initial Investment (as of October 31, 2010)
Comparison of change in value of a $10,000 investment (includes applicable sales loads)
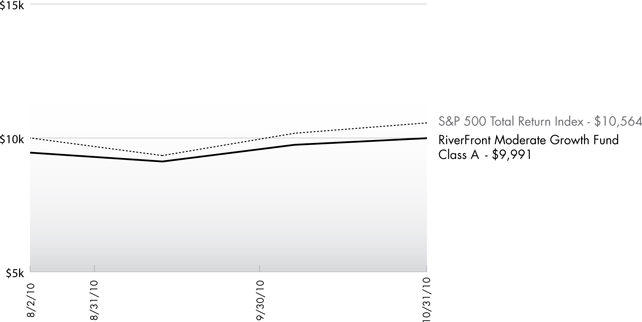
The chart above represents historical performance of a hypothetical investment of $10,000 in the Fund since inception. Past performance does not guarantee future results. This chart does not reflect the deduction of taxes that a shareholder would pay on Fund distributions or the redemption of Fund shares.
Cumulative Return (as of October 31, 2010)
| 1 month | Since Inception^ | Gross Expense Ratio | Net Expense Ratio* | |||||
Class A (NAV)1 | 2.52% | 5.70% | 2.01% | 1.51% | ||||
Class A (MOP)2 | -3.12% | -0.09% | ||||||
Class C (NAV)1 | 2.43% | 5.50% | 2.76% | 2.26% | ||||
Class C (CDSC)2 | 1.52% | 4.60% | ||||||
Class I | 2.42% | 5.70% | 1.76% | 1.26% | ||||
S&P 500 Total Return Index3 | 3.81% | 5.64% |
Performance data quoted represents past performance. Past performance does not guarantee future results. Investment return and principal value of an investment will fluctuate so that an investor’s shares, when sold or redeemed, may be worth more or less than the original cost. Current performance data may be higher or lower than actual data quoted. The Fund imposes a maximum Contingent Deferred Sales Charge (“CDSC”) of 1.00% to shares redeemed within the first 12 months after a purchase in excess of $1 million. Performance data does not reflect the CDSC, which if reflected would reduce the performance quoted. For the most current month-end performance data, please call (866) 759-5679.
| 1 | Net Asset Value (NAV) is the share price without sales charges. |
| 2 | Maximum Offering Price (MOP) includes sales charges. Class A returns include effects of the Fund’s maximum sales charge of 5.50%; Class C returns include the 1.00% CDSC. |
| 3 | S&P 500 Total Return Index is the Standard & Poor’s composite index of 500 stocks, a widely recognized, unmanaged index of common stock prices. An investor may not invest directly in the index. |
| ^ | Fund inception date of 8/2/10. |
| * | Effective through August 31, 2011, the Adviser and the Sub-Adviser have given a contractual agreement to the Fund to limit the amount of the Fund’s total annual expenses, exclusive of distribution and service (12b-1) fees, shareholder services fees, acquired fund fees and expenses, brokerage expenses, interest expense, taxes and extraordinary expenses to 1.05% of the average daily net assets for Class A, Class C and Class I shares. Without this agreement expenses could be higher. |
The table does not reflect the deduction of taxes that a shareholder would pay on Fund distributions or the redemption of Fund shares.
The Fund is less than a year old and has limited operating history. This Fund is not suitable for all investors. Subject to investment risks, including possible loss of the principal amount invested.
42 | October 31, 2010
Table of Contents
| RiverFront Moderate Growth Fund | ||||||
|
October 31, 2010 (Unaudited) | |||||
As a shareholder of the Fund you will incur two types of costs: (1) transaction costs, including applicable sales charges (loads) and redemption fees; and (2) ongoing costs, including management fees, distribution and service (12b-1) fees, shareholder service fees and other Fund expenses. The following examples are intended to help you understand your ongoing costs (in dollars) of investing in the Fund and to compare these costs with the ongoing costs of investing in other mutual funds. The examples are based on an investment of $1,000 invested on August 2, 2010 and held until October 31, 2010.
Actual Expenses. The first line of the table on the next page provides information about actual account values and actual expenses. You may use the information in this line, together with the amount you invested, to estimate the expenses that you paid over the period. Simply divide your account value by $1,000 (for example, an $8,600 account value divided by $1,000 = 8.6), then multiply the result by the number in the first line under the heading “Expense Paid During Period” to estimate the expenses you paid on your account during this period.
Hypothetical Example for Comparison Purposes. The second line of the table on the next page provides information about hypothetical account values and hypothetical expenses based on the Fund’s actual expense ratio and an assumed rate of return of 5% per year before expenses, which is not the Fund’s actual return. The hypothetical account values and expenses may not be used to estimate the actual ending account balance or expenses you paid for the period. You may use this information to compare the ongoing costs of investing in the Fund and other mutual funds. To do so, compare this 5% hypothetical example with the 5% hypothetical examples that appear in the shareholder reports of the other funds.
The expenses shown in the table are meant to highlight ongoing Fund costs only and do not reflect transaction fees, such as sales charges, redemption fees or exchange fees. Therefore, the second line of the table on the next page is useful in comparing ongoing costs only, and may not help you determine the relative total costs of owning different funds. In addition, if these transactional costs were included, your costs would have been higher.
The examples are based on an investment of $1,000 invested on August 2, 2010 and held until October 31, 2010.
| Beginning Account Value 8/2/10 | Ending Account Value 10/31/10 | Expense Ratio(a) | Expense Paid 10/31/10 | |||||||||||||
Class A(c) | ||||||||||||||||
Actual | $1,000.00 | $1,057.00 | 1.30% | $3.30 | ||||||||||||
Hypothetical (5% return before expenses) | $1,000.00 | $1,009.12 | 1.30% | $6.58 | ||||||||||||
Class C(c) | ||||||||||||||||
Actual | $1,000.00 | $1,055.00 | 2.05% | $5.19 | ||||||||||||
Hypothetical (5% return before expenses) | $1,000.00 | $1,007.27 | 2.05% | $10.37 | ||||||||||||
Class I(c) | ||||||||||||||||
Actual | $1,000.00 | $1,057.00 | 1.05% | $2.66 | ||||||||||||
Hypothetical (5% return before expenses) | $1,000.00 | $1,009.74 | 1.05% | $5.32 | ||||||||||||
| (a) | The Fund’s expense ratios have been based on the Fund’s inception date of August 2, 2010 through October 31, 2010. |
| (b) | Expenses are equal to the Fund’s annualized expense ratio multiplied by the average account value over the period, multiplied by the number of days in the most recent fiscal half year (184), then divided by 365. |
| (c) | Shares commenced operations on August 2, 2010. |
43 | October 31, 2010
Table of Contents
| RiverFront Moderate Growth Fund | ||||||
|
October 31, 2010 (Unaudited) | |||||
| Shares | Value (Note 1) | |||||||
COMMON STOCKS (24.79%) |
| |||||||
Basic Materials (0.34%) |
| |||||||
Chemicals (0.34%) |
| |||||||
Sensient Technologies Corp. | 261 | $ | 8,433 | |||||
TOTAL BASIC MATERIALS |
| 8,433 | ||||||
Communications (2.08%) |
| |||||||
Media (0.56%) |
| |||||||
DIRECTV(a) | 321 | 13,951 | ||||||
Telecommunications (1.52%) | ||||||||
Amdocs, Ltd.(a) | 339 | 10,401 | ||||||
Harris Corp. | 234 | 10,574 | ||||||
Sprint Nextel Corp.(a) | 1,523 | 6,275 | ||||||
Verizon Communications, Inc. | 320 | 10,390 | ||||||
| 37,640 | ||||||||
TOTAL COMMUNICATIONS |
| 51,591 | ||||||
Consumer, Cyclical (3.09%) |
| |||||||
Apparel (0.62%) | ||||||||
NIKE, Inc. | 189 | 15,392 | ||||||
Entertainment (0.72%) | ||||||||
DreamWorks Animation SKG, Inc.(a) | 222 | 7,837 | ||||||
Penn National Gaming, Inc.(a) | 304 | 10,111 | ||||||
| 17,948 | ||||||||
Retail (1.45%) | ||||||||
CVS Caremark Corp. | 260 | 7,831 | ||||||
Darden Restaurants, Inc. | 170 | 7,771 | ||||||
Dollar Tree, Inc. (a) | 226 | 11,595 | ||||||
Wal-Mart Stores, Inc. | 158 | 8,559 | ||||||
| 35,756 | ||||||||
Toys, Games & Hobbies (0.30%) |
| |||||||
Hasbro, Inc. | 163 | 7,539 | ||||||
TOTAL CONSUMER, CYCLICAL |
| 76,635 | ||||||
Consumer, Non-Cyclical (5.28%) |
| |||||||
Agriculture (0.91%) | ||||||||
Altria Group, Inc. | 520 | 13,218 | ||||||
Philip Morris International, Inc. | 158 | 9,243 | ||||||
| 22,461 | ||||||||
| Shares | Value (Note 1) | |||||||
Commercial Services (0.28%) |
| |||||||
Manpower, Inc. | 126 | $ | 6,896 | |||||
Food (0.63%) | ||||||||
HJ Heinz Co. | 319 | 15,666 | ||||||
Healthcare Products (1.57%) |
| |||||||
CareFusion Corp.(a) | 678 | 16,368 | ||||||
Henry Schein, Inc.(a) | 161 | 9,040 | ||||||
Johnson & Johnson | 81 | 5,157 | ||||||
PSS World Medical, Inc.(a) | 363 | 8,578 | ||||||
| 39,143 | ||||||||
Healthcare Services (0.30%) |
| |||||||
DaVita, Inc.(a) | 104 | 7,462 | ||||||
Household Products & Wares (0.48%) |
| |||||||
The Scotts Miracle-Gro Co. | 224 | 11,962 | ||||||
Pharmaceuticals (1.11%) |
| |||||||
Abbott Laboratories | 282 | 14,471 | ||||||
Bristol-Myers Squibb Co. | 245 | 6,591 | ||||||
Express Scripts, Inc.(a) | 134 | 6,502 | ||||||
| 27,564 | ||||||||
TOTAL CONSUMER, NON-CYCLICAL |
| 131,154 | ||||||
Energy (2.89%) |
| |||||||
Oil & Gas (2.54%) |
| |||||||
Chevron Corp. | 281 | 23,213 | ||||||
Cimarex Energy Co. | 93 | 7,138 | ||||||
Exxon Mobil Corp. | 241 | 16,019 | ||||||
Forest Oil Corp.(a) | 339 | 10,417 | ||||||
Petrohawk Energy Corp.(a) | 368 | 6,260 | ||||||
| 63,047 | ||||||||
Oil & Gas Services (0.35%) |
| |||||||
Superior Energy Services, Inc.(a) | 314 | 8,673 | ||||||
TOTAL ENERGY |
| 71,720 | ||||||
Financial (3.95%) |
| |||||||
Banks (0.60%) |
| |||||||
Cullen/Frost Bankers, Inc. | 149 | 7,814 | ||||||
State Street Corp. | 170 | 7,099 | ||||||
| 14,913 | ||||||||
Diversified Financial Services (0.57%) |
| |||||||
Affiliated Managers Group, Inc.(a) | 74 | 6,335 | ||||||
The NASDAQ OMX Group, Inc.(a) | 367 | 7,714 | ||||||
| 14,049 | ||||||||
44 | October 31, 2010
Table of Contents
| RiverFront Moderate Growth Fund | ||||||
Statement of Investments |
October 31, 2010 (Unaudited) | |||||
| Shares | Value (Note 1) | |||||||
Insurance (1.40%) |
| |||||||
Chubb Corp. | 182 | $ | 10,560 | |||||
HCC Insurance Holdings, Inc. | 398 | 10,539 | ||||||
The Progressive Corp. | 644 | 13,627 | ||||||
| 34,726 | ||||||||
Real Estate Investment Trusts (1.38%) |
| |||||||
American Campus Communities, Inc. | 295 | 9,331 | ||||||
Corporate Office Properties Trust | 298 | 10,575 | ||||||
DuPont Fabros Technology, Inc. | 309 | 7,756 | ||||||
Weingarten Realty Investors | 274 | 6,612 | ||||||
| 34,274 | ||||||||
TOTAL FINANCIAL |
| 97,962 | ||||||
Industrial (4.02%) | ||||||||
Aerospace & Defense (1.79%) |
| |||||||
Esterline Technologies Corp.(a) | 200 | 12,088 | ||||||
L-3 Communications Holdings, Inc. | 105 | 7,580 | ||||||
Lockheed Martin Corp. | 166 | 11,834 | ||||||
United Technologies Corp. | 177 | 13,234 | ||||||
| 44,736 | ||||||||
Electronics (0.20%) |
| |||||||
PerkinElmer, Inc. | 208 | 4,878 | ||||||
Miscellaneous Manufacturers (0.54%) |
| |||||||
Dover Corp. | 254 | 13,487 | ||||||
Packaging & Containers (0.63%) |
| |||||||
Ball Corp. | 241 | 15,511 | ||||||
Transportation (0.86%) |
| |||||||
Diana Shipping, Inc.(a) | 426 | 5,815 | ||||||
United Parcel Service, Inc. | 229 | 15,421 | ||||||
| 21,236 | ||||||||
| �� | ||||||||
TOTAL INDUSTRIAL |
| 99,848 | ||||||
Technology (2.79%) | ||||||||
Computers (1.46%) |
| |||||||
Apple, Inc.(a) | 70 | 21,062 | ||||||
International Business Machines Corp. | 104 | 14,934 | ||||||
| 35,996 | ||||||||
Semiconductors (0.67%) |
| |||||||
Microchip Technology, Inc. | 300 | 9,654 | ||||||
Skyworks Solutions, Inc.(a) | 308 | 7,056 | ||||||
| 16,710 | ||||||||
| Shares | Value (Note 1) | |||||||
Software (0.66%) |
| |||||||
BMC Software, Inc.(a) | 141 | $ | 6,410 | |||||
Fiserv, Inc.(a) | 185 | 10,086 | ||||||
| 16,496 | ||||||||
TOTAL TECHNOLOGY |
| 69,202 | ||||||
Utilities (0.35%) | ||||||||
Electric (0.35%) |
| |||||||
DPL, Inc. | 334 | 8,717 | ||||||
TOTAL UTILITIES |
| 8,717 | ||||||
TOTAL COMMON STOCKS (Cost $593,756) |
| 615,262 | ||||||
EXCHANGE TRADED FUNDS (51.88%) |
| |||||||
Commodity Fund (1.71%) |
| |||||||
SPDR Gold Shares(a) | 320 | 42,445 | ||||||
Consumer Discretionary (0.54%) |
| |||||||
Powershares Dynamic Leisure & Entertainment Portfolio | 771 | 13,415 | ||||||
Emerging Market Equity (15.46%) |
| |||||||
Global X China Consumer ETF(a) | 561 | 11,523 | ||||||
iShares MSCI All Country Asiaex Japan Index Fund | 891 | 55,500 | ||||||
iShares MSCI Chile Investable | ||||||||
Market Index Fund | 184 | 13,955 | ||||||
iShares MSCI Emerging Markets | ||||||||
Index Fund | 620 | 28,601 | ||||||
iShares MSCI Singapore | ||||||||
Index Fund | 4,776 | 65,192 | ||||||
SPDR S&P Emerging Small Cap ETF | 2,010 | 114,007 | ||||||
Vanguard Emerging Markets ETF | 2,018 | 94,503 | ||||||
| 383,281 | ||||||||
Energy (0.47%) |
| |||||||
SPDR S&P Oil & Gas Equipment & Services ETF | 369 | 11,564 | ||||||
Financial (0.52%) |
| |||||||
SPDR KBW Bank ETF | 568 | 12,831 | ||||||
Fixed Income / Corporate Bonds (6.91%) |
| |||||||
Vanguard Short-Term Corporate Bond ETF | 2,180 | 171,283 | ||||||
45 | October 31, 2010
Table of Contents
| RiverFront Moderate Growth Fund | ||||||
Statement of Investments |
October 31, 2010 (Unaudited) | |||||
| Shares | Value (Note 1) | |||||||
Fixed Income / High Yield (6.67%) |
| |||||||
PowerShares Fundamental High Yield Corporate Bond Portfolio | 3,403 | $ | 62,956 | |||||
SPDR Barclays Capital High Yield Bond ETF | 2,505 | 102,404 | ||||||
| 165,360 | ||||||||
Healthcare (1.47%) |
| |||||||
PowerShares S&P Small-Cap Health Care Portfolio(a) | 366 | 9,315 | ||||||
SPDR S&P Biotech ETF | 458 | 27,269 | ||||||
| 36,584 | ||||||||
International Equity (5.12%) |
| |||||||
iShares MSCI Canada Index Fund | 1,099 | 31,772 | ||||||
iShares MSCI United Kingdom Index Fund | 2,513 | 42,847 | ||||||
Vanguard Europe Pacific ETF | 1,461 | 52,450 | ||||||
| 127,069 | ||||||||
Large-Cap (3.85%) |
| |||||||
PowerShares Dividend Achievers Portfolio | 4,627 | 62,624 | ||||||
Vanguard Dividend Appreciation ETF | 658 | 32,946 | ||||||
| 95,570 | ||||||||
Materials (0.77%) |
| |||||||
Materials Select Sector SPDR Fund | 548 | 19,087 | ||||||
Micro-Cap (3.29%) |
| |||||||
First Trust Dow Jones Select Micro-Cap Index Fund | 2,057 | 40,153 | ||||||
Powershares Zacks Micro-Cap Portfolio | 3,960 | 41,540 | ||||||
| 81,693 | ||||||||
Real Estate Investment Trust (REIT) (1.95%) |
| |||||||
iShares Dow Jones U.S. Real Estate Index Fund | 123 | 6,755 | ||||||
Vanguard REIT ETF | 764 | 41,676 | ||||||
| 48,431 | ||||||||
Staples (0.40%) |
| |||||||
Powershares Dynamic Food & | ||||||||
Beverage Portfolio | 578 | 9,971 | ||||||
| Shares | Value (Note 1) | |||||||||||
Technology (2.33%) |
| |||||||||||
iShares S&P North American Technology-Software Index Fund(a) | 679 | $ | 37,277 | |||||||||
PowerShares S&P Small-Cap Information Technology Portfolio(a) | 364 | 9,606 | ||||||||||
Vanguard Information Technology ETF | 186 | 11,004 | ||||||||||
| 57,887 | ||||||||||||
Utilities (0.42%) |
| |||||||||||
Utilities Select Sector SPDR Fund | 332 | 10,544 | ||||||||||
TOTAL EXCHANGE TRADED FUNDS (Cost $1,249,158) |
| 1,287,015 | ||||||||||
EXCHANGE TRADED NOTES (3.25%) |
| |||||||||||
Master Limited Partnerships (MLPs) (2.52%) |
| |||||||||||
JPMorgan Alerian MLP Index ETN | 1,188 | 42,156 | ||||||||||
UBS E-TRACS Alerian MLP Infrastructure ETN | 710 | 20,569 | ||||||||||
| 62,725 | ||||||||||||
Other / Miscellaneous (0.73%) |
| |||||||||||
iPATH S&P 500 VIX Mid-Term Futures ETN(a) | 242 | 18,031 | ||||||||||
TOTAL EXCHANGE TRADED NOTES (Cost $79,882) |
| 80,756 | ||||||||||
| 7-Day Yield | Shares | Value (Note 1) | ||||||||||
SHORT TERM INVESTMENTS (10.57%) |
| |||||||||||
Money Market Fund (10.57%) |
| |||||||||||
Dreyfus Cash Management | 0.16 | % | 262,398 | 262,398 | ||||||||
TOTAL SHORT TERM INVESTMENTS (Cost $262,398) |
| 262,398 | ||||||||||
TOTAL INVESTMENTS (90.49%) (Cost $2,185,194) |
| $ | 2,245,431 | |||||||||
Other Assets in Excess of Liabilities (9.51%) |
| 236,028 | ||||||||||
NET ASSETS (100.00%) |
| $ | 2,481,459 | |||||||||
| (a) | Non-Income Producing Security. |
46 | October 31, 2010
Table of Contents
| RiverFront Moderate Growth Fund | ||||||
Statement of Investments |
October 31, 2010 (Unaudited) | |||||
Common Abbreviations:
E-TRACS - Exchange Traded Access Securities
ETF - Exchange Traded Fund
ETN - Exchange Traded Note
Ltd. - Limited
MLP - Master Limited Partnership
MSCI - Morgan Stanley Capital International
REIT - Real Estate Investment Trust
S&P - Standard & Poor’s
SPDR - Standard & Poor’s Depositary Receipt
VIX - Market Volatility Index
For Fund compliance purposes, the Fund’s industry classifications refer to any one or more of the industry sub-classifications used by one or more widely recognized market indexes or ratings group indexes, and/or as defined by Fund management. This definition may not apply for purposes of this report, which may combine industry sub-classifications for reporting ease. Industries are shown as a percent of net assets. These industry classifications are based on third party definitions and are unaudited. The definitions are industry terms and do not reflect the legal status of any of the investments or the companies in which the Fund has invested.
See Notes to Financial Statements.
Top Ten Holdings (as a % of Net Assets) †
Vanguard Short-Term Corporate Bond ETF | 6.90% | |||
SPDR S&P Emerging Small Cap ETF | 4.59% | |||
SPDR Barclays Capital High Yield Bond ETF | 4.13% | |||
Vanguard Emerging Markets ETF | 3.81% | |||
iShares MSCI Singapore Index Fund | 2.63% | |||
PowerShares Fundamental High Yield Corporate Bond Portfolio | 2.54% | |||
PowerShares Dividend Achievers Portfolio | 2.52% | |||
iShares MSCI All Country Asia ex Japan Index Fund | 2.24% | |||
Vanguard Europe Pacific ETF | 2.11% | |||
iShares MSCI United Kingdom Index Fund | 1.73% | |||
Top Ten Holdings | 33.20% |
† Holdings are subject to change.
Industry Sector Allocation (as a % of Net Assets)
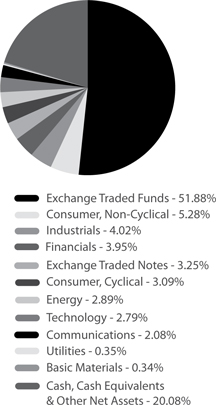
47 | October 31, 2010
Table of Contents
| RiverFront Moderate Growth & Income Fund | ||||||
|
October 31, 2010 (Unaudited) | |||||
Financial markets have gone through three distinct mood swings so far in 2010. Early in the year, many investors expected the US economy to enjoy the period of strong growth that typically occurs after a recession. Equity markets soared as the growth associated with accelerating government stimulus spending and inventory rebuilding seemed to validate those expectations. As we moved into the second quarter, these temporary boosts to growth began to fade and the market mood reversed toward expecting a double-dip recession; equity prices plummeted along with expected economic growth. By the third quarter, financial markets appeared to come to the conclusion that RiverFront had maintained all year long – the economy is neither as strong as was hoped early in the year nor as weak as was feared during the summer. This realization, combined with additional monetary stimulus on the part of the Federal Reserve, sparked a significant rally in September that reversed earlier declines and left the S&P 500 Index up nearly 4.0% at the end of the third quarter.
The adjustments RiverFront made to our longer term allocation strategy in the second quarter boosted performance in the third quarter. For example, the portfolios’ emerging market weightings, which we increased substantially, returned 19%. Although interest rates fell during the period thanks to renewed bond purchases on the part of the Federal Reserve, high quality bonds offered so little income that investors reached for the attractive relative value we have been seeing all year in the high yield market. This strong performance from our high yield bond positions more than compensated for the lack of long maturity bonds within our new portfolio strategies.
Our tactical strategies have had to adjust rapidly to the changing market mood. We entered the quarter with many portfolios having as much as 25% cash due to the downward momentum of the market in the late spring and early summer. As the market gained confidence in the economic environment, we quickly switched from defense to offense and invested those cash balances. The success of these efforts is reflected in our performance. Portfolio gains for the quarter ranged from approximately 8% for our more conservative portfolios to nearly 12% for our more aggressive offerings. This performance was fairly close to portfolio benchmarks despite our conservative posture for most of the quarter. Although our defensive tactical strategy cost us a little bit of upside, we believe we mitigated the downside by our aggressive cash weighting, which was more than worth the cost to upside participation.
The RiverFront Long-Term Growth & Income Fund and RiverFront Moderate Growth Fund outperformed their benchmark (S&P 500 Index) for the period ended October 31, 2010. The RiverFront Moderate Growth & Income Fund slightly underperformed the benchmark, consistent with the more cautious approach we typically employ for our Growth & Income portfolios. The performance of these funds can be attributed to the following:
Cash: Risk management is at the core of RiverFront investment philosophy. As part of this risk management process, RiverFront raised higher relative cash levels during some of the prior period as important technical support levels were broken. While these risk
management efforts impacted some performance negatively in recent months as the market turned higher, we are pleased that these insurance strategies protected investor downside with less than expected impact to upside participation. Our adherence to risk management disciplines have served our investors well over the years and we will continue to manage downside risks when we deem it prudent.
Equities: Within domestic equities we have maintained a bias toward higher quality companies with consistent dividend growth. These types of securities have underperformed year-to-date and the Dow Jones Industrial Average^ (“DJIA”) is a good example of the underperformance of these types of companies. Year-to-date the DJIA has underperformed the S&P 500 Index by roughly 150 basis points^^. Our conviction behind quality dividend growers is two-fold. First, we believe ‘pound for pound’ few asset classes can touch the relative value of U.S. high quality large-caps. Companies in this universe have a history of delivering stable, consistent low to mid-teens earnings growth and are trading an 8-12 forward P/E multiples*. Secondly, we believe that maturing bull markets ultimately become stock-pickers markets where relative value and getting the most growth ‘for the buck’ become increasingly important.
Fixed Income: Our belief that we should hold shorter relative maturity issues and avoid Treasuries proved just a few weeks premature. Throughout 2010, we have been concerned about the risk that longer duration bonds posed to investors given their low historic yields and premium prices. Subsequent to October 31, interest rates have begun to rise and validate our cautious bond market strategy. We believe this rise will continue. As such, we retain shorter maturity holdings. We have maintained an overweight position in high yield, which has turned sharply higher relative to investment grade bonds in the weeks since October 31, 2010.
Portfolio positioning for the coming quarter will continue to be driven by our belief that the S&P 500 Index remains trapped within a trading range of about 1000 to 1200. Renewed prospects for quantitative easing by the Federal Reserve and hopes for Republican gains in the mid-term election are currently pushing the market toward the upper end of the range, but we are not yet convinced that top line growth and fundamental earnings power will be sufficient over the near term to allow an upside breakout. In what we perceive as a range-bound environment, we are trading against sentiment, seeking to raise cash and lower portfolio risk as we approach the upper end of the range and reversing these strategies near the bottom of the range. We believe our portfolios can offer a substantial income advantage relative to the market, and we think the incremental yield can provide a performance advantage in a range-bound environment. Finally, we are seeking asset classes that have broken free from the trading range that characterizes most developed equity markets. In particular, small cap emerging market companies are primarily focused on serving the emerging market consumer. Since these consumers are not plagued with the debt burdens holding back the developed economies, these stocks have set new highs, and they occupy a substantial weighting in our portfolios.
| ^ | The Dow Jones Industrial Average is a price-weighted average of 30 significant stocks traded on the New York Stock Exchange and the Nasdaq |
| ^^ | A unit that is equal to 1/100th of 1% |
| * | Forward P/E multiples are a measure of the price-to-earnings ratio (P/E) using forecasted earnings |
48 | October 31, 2010
Table of Contents
| RiverFront Moderate Growth & Income Fund | ||||||
Management Commentary |
October 31, 2010 (Unaudited) | |||||
Performance of $10,000 Initial Investment (as of October 31, 2010)
Comparison of change in value of a $10,000 investment (includes applicable sales loads)
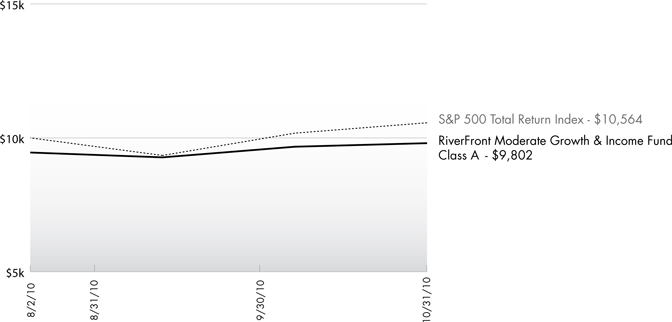
The chart above represents historical performance of a hypothetical investment of $10,000 in the Fund since inception. Past performance does not guarantee future results. This chart does not reflect the deduction of taxes that a shareholder would pay on Fund distributions or the redemption of Fund shares.
Cumulative Return (as of October 31, 2010)
| 1 month | Since Inception^ | Gross Expense Ratio | Net Expense Ratio* | |||||
Class A (NAV)1 | 1.37% | 3.70% | 2.01% | 1.51% | ||||
Class A (MOP)2 | -4.25% | -1.98% | ||||||
Class C (NAV)1 | 1.37% | 3.60% | 2.76% | 2.26% | ||||
Class C (CDSC)2 | 0.37% | 2.60% | ||||||
Class I | 1.47% | 3.80% | 1.76% | 1.26% | ||||
S&P 500 Total Return Index3 | 3.81% | 5.64% |
Performance data quoted represents past performance. Past performance does not guarantee future results. Investment return and principal value of an investment will fluctuate so that an investor’s shares, when sold or redeemed, may be worth more or less than the original cost. Current performance data may be higher or lower than actual data quoted. The Fund imposes a maximum Contingent Deferred Sales Charge (“CDSC”) of 1.00% to shares redeemed within the first 12 months after a purchase in excess of $1 million. Performance data does not reflect the CDSC, which if reflected would reduce the performance quoted. For the most current month-end performance data, please call (866) 759-5679.
| 1 | Net Asset Value (NAV) is the share price without sales charges. |
| 2 | Maximum Offering Price (MOP) includes sales charges. Class A returns include effects of the Fund’s maximum sales charge of 5.50%; Class C returns include the 1.00% CDSC. |
| 3 | S&P 500 Total Return Index is the Standard & Poor’s composite index of 500 stocks, a widely recognized, unmanaged index of common stock prices. An investor may not invest directly in the index. |
| ^ | Fund inception date of 8/2/10. |
| * | Effective through August 31, 2011, the Adviser and the Sub-Adviser have given a contractual agreement to the Fund to limit the amount of the Fund’s total annual expenses, exclusive of distribution and service (12b-1) fees, shareholder services fees, acquired fund fees and expenses, brokerage expenses, interest expense, taxes and extraordinary expenses to 1.05% of the average daily net assets for Class A, Class C and Class I shares. Without this agreement expenses could be higher. |
The table does not reflect the deduction of taxes that a shareholder would pay on Fund distributions or the redemption of Fund shares.
The Fund is less than a year old and has limited operating history. This Fund is not suitable for all investors. Subject to investment risks, including possible loss of the principal amount invested.
49 | October 31, 2010
Table of Contents
| RiverFront Moderate Growth & Income Fund | ||||||
|
October 31, 2010 (Unaudited) | |||||
As a shareholder of the Fund you will incur two types of costs: (1) transaction costs, including applicable sales charges (loads) and redemption fees; and (2) ongoing costs, including management fees, distribution and service (12b-1) fees, shareholder service fees and other Fund expenses. The following examples are intended to help you understand your ongoing costs (in dollars) of investing in the Fund and to compare these costs with the ongoing costs of investing in other mutual funds. The examples are based on an investment of $1,000 invested on August 2, 2010 and held until October 31, 2010.
Actual Expenses. The first line of the table on the next page provides information about actual account values and actual expenses. You may use the information in this line, together with the amount you invested, to estimate the expenses that you paid over the period. Simply divide your account value by $1,000 (for example, an $8,600 account value divided by $1,000 = 8.6), then multiply the result by the number in the first line under the heading “Expense Paid During Period” to estimate the expenses you paid on your account during this period.
Hypothetical Example for Comparison Purposes. The second line of the table on the next page provides information about hypothetical account values and hypothetical expenses based on the Fund’s actual expense ratio and an assumed rate of return of 5% per year before expenses, which is not the Fund’s actual return. The hypothetical account values and expenses may not be used to estimate the actual ending account balance or expenses you paid for the period. You may use this information to compare the ongoing costs of investing in the Fund and other mutual funds. To do so, compare this 5% hypothetical example with the 5% hypothetical examples that appear in the shareholder reports of the other funds.
The expenses shown in the table are meant to highlight ongoing Fund costs only and do not reflect transaction fees, such as sales charges, redemption fees or exchange fees. Therefore, the second line of the table on the next page is useful in comparing ongoing costs only, and may not help you determine the relative total costs of owning different funds. In addition, if these transactional costs were included, your costs would have been higher.
The examples are based on an investment of $1,000 invested on August 2, 2010 and held until October 31, 2010.
| Beginning Account Value 8/2/10 | Ending Account Value 10/31/10 | Expense Ratio(a) | Expense Paid 10/31/10 | |||||||||||||
Class A(c) | ||||||||||||||||
Actual | $1,000.00 | $1,037.00 | 1.30% | $3.27 | ||||||||||||
Hypothetical (5% return before expenses) | $1,000.00 | $1,009.12 | 1.30% | $6.58 | ||||||||||||
Class C(c) | ||||||||||||||||
Actual | $1,000.00 | $1,036.00 | 2.05% | $5.15 | ||||||||||||
Hypothetical (5% return before expenses) | $1,000.00 | $1,007.27 | 2.05% | $10.37 | ||||||||||||
Class I(c) | ||||||||||||||||
Actual | $1,000.00 | $1,038.00 | 1.05% | $2.64 | ||||||||||||
Hypothetical (5% return before expenses) | $1,000.00 | $1,009.74 | 1.05% | $5.32 | ||||||||||||
| (a) | The Fund’s expense ratios have been based on the Fund’s inception date of August 2, 2010 through October 31, 2010. |
| (b) | Expenses are equal to the Fund’s annualized expense ratio multiplied by the average account value over the period, multiplied by the number of days in the most recent fiscal half year (184), then divided by 365. |
| (c) | Shares commenced operations on August 2, 2010. |
50 | October 31, 2010
Table of Contents
| RiverFront Moderate Growth & Income Fund | ||||||
|
October 31, 2010 (Unaudited) | |||||
| Shares | Value (Note 1) | |||||||
COMMON STOCKS (30.18%) |
| |||||||
Communications (1.94%) |
| |||||||
Telecommunications (1.94%) |
| |||||||
BCE, Inc. | 4,380 | $ | 146,773 | |||||
Verizon Communications, Inc. | 3,495 | 113,483 | ||||||
| 260,256 | ||||||||
TOTAL COMMUNICATIONS | 260,256 | |||||||
Consumer, Cyclical (4.68%) | ||||||||
Retail (3.65%) | ||||||||
McDonald’s Corp. | 2,515 | 195,592 | ||||||
Tiffany & Co. | 3,766 | 199,598 | ||||||
Wal-Mart Stores, Inc. | 1,725 | 93,443 | ||||||
| 488,633 | ||||||||
Toys, Games & Hobbies (1.03%) | ||||||||
Mattel, Inc. | 5,937 | 138,510 | ||||||
TOTAL CONSUMER, CYCLICAL | 627,143 | |||||||
Consumer, Non-Cyclical (7.08%) | ||||||||
Agriculture (2.26%) | ||||||||
Altria Group, Inc. | 3,525 | 89,606 | ||||||
Philip Morris International, Inc. | 3,644 | 213,174 | ||||||
| 302,780 | ||||||||
Commercial Services (0.88%) | ||||||||
Automatic Data Processing, Inc. | 2,659 | 118,113 | ||||||
Healthcare Products (1.07%) | ||||||||
Becton Dickinson and Co. | 1,899 | 143,412 | ||||||
Pharmaceuticals (2.87%) | ||||||||
Abbott Laboratories | 2,333 | 119,730 | ||||||
Bristol-Myers Squibb Co. | 5,135 | 138,132 | ||||||
Merck & Co., Inc. | 3,523 | 127,814 | ||||||
| 385,676 | ||||||||
TOTAL CONSUMER, NON-CYCLICAL | 949,981 | |||||||
Energy (3.15%) | ||||||||
Oil & Gas (2.08%) | ||||||||
Chevron Corp. | 3,380 | 279,222 | ||||||
Pipelines (1.07%) | ||||||||
Oneok, Inc. | 2,871 | 143,033 | ||||||
TOTAL ENERGY | 422,255 | |||||||
| Shares | Value (Note 1) | |||||||
Financial (5.91%) | ||||||||
Diversified Financial Services (1.62%) | ||||||||
American Express Co. | 3,640 | $ | 150,914 | |||||
Och-Ziff Capital Management | ||||||||
Group LLC | 4,450 | 65,727 | ||||||
| 216,641 | ||||||||
Insurance (1.45%) | ||||||||
Chubb Corp. | 3,355 | 194,657 | ||||||
Real Estate Investment Trusts (2.84%) | ||||||||
American Campus Communities, Inc. | 4,043 | 127,880 | ||||||
Corporate Office Properties Trust | 3,338 | 118,466 | ||||||
DuPont Fabros Technology, Inc. | 5,383 | 135,113 | ||||||
| 381,459 | ||||||||
TOTAL FINANCIAL | 792,757 | |||||||
Industrial (3.45%) | ||||||||
Aerospace & Defense (0.57%) | ||||||||
Lockheed Martin Corp. | 1,075 | 76,637 | ||||||
Miscellaneous Manufacturers (1.63%) | ||||||||
3M Co. | 2,593 | 218,382 | ||||||
Transportation (1.25%) | ||||||||
United Parcel Service, Inc. | 2,482 | 167,138 | ||||||
TOTAL INDUSTRIAL | 462,157 | |||||||
Technology (2.70%) | ||||||||
Computers (1.61%) | ||||||||
International Business | ||||||||
Machines Corp. | 1,500 | 215,400 | ||||||
Semiconductors (1.09%) | ||||||||
Microchip Technology, Inc. | 4,559 | 146,709 | ||||||
TOTAL TECHNOLOGY | 362,109 | |||||||
Utilities (1.27%) | ||||||||
Electric (1.27%) | ||||||||
Dominion Resources, Inc. | 3,931 | 170,841 | ||||||
TOTAL UTILITIES | 170,841 | |||||||
TOTAL COMMON STOCKS (Cost $3,958,199) | 4,047,499 | |||||||
51 | October 31, 2010
Table of Contents
| RiverFront Moderate Growth & Income Fund | ||||||
Statement of Investments |
October 31, 2010 (Unaudited) | |||||
| Shares | Value (Note 1) | |||||||
EXCHANGE TRADED FUNDS (53.36%) |
| |||||||
Commodity Fund (1.98%) |
| |||||||
SPDR Gold Shares(a) | 2,002 | $ | 265,545 | |||||
Consumer Staples (0.58%) |
| |||||||
Vanguard Consumer Staples ETF | 1,073 | 78,179 | ||||||
Emerging Market Equity (12.92%) |
| |||||||
Global X China Consumer ETF(a) | 3,504 | 71,972 | ||||||
iShares MSCI All Country Asiaex Japan Index Fund | 5,605 | 349,135 | ||||||
iShares MSCI Chile Investable Market Index Fund | 1,142 | 86,609 | ||||||
iShares MSCI Singapore Index Fund | 19,989 | 272,850 | ||||||
Vanguard Emerging Markets ETF | 9,536 | 446,571 | ||||||
WisdomTree Emerging Markets Small-Cap Dividend Fund | 9,641 | 505,767 | ||||||
| 1,732,904 | ||||||||
Fixed Income / Corporate Bonds (19.68%) |
| |||||||
Vanguard Short-Term Corporate Bond ETF | 33,601 | 2,640,031 | ||||||
Fixed Income / High Yield (13.97%) |
| |||||||
PowerShares Fundamental High Yield Corporate Bond Portfolio | 27,810 | 514,485 | ||||||
SPDR Barclays Capital High Yield Bond ETF | 33,242 | 1,358,933 | ||||||
| 1,873,418 | ||||||||
International Equity (3.04%) |
| |||||||
iShares MSCI Canada Index Fund | 4,561 | 131,859 | ||||||
iShares MSCI United Kingdom Index Fund | 16,167 | 275,647 | ||||||
| 407,506 | ||||||||
Large-Cap (1.19%) |
| |||||||
PowerShares Dividend Achievers Portfolio | 11,765 | 159,232 | ||||||
TOTAL EXCHANGE TRADED FUNDS (Cost $6,990,108) |
| 7,156,815 | ||||||
EXCHANGE TRADED NOTES (4.35%) |
| |||||||
Master Limited Partnerships (MLPs) (3.47%) |
| |||||||
JPMorgan Alerian MLP Index ETN | 9,113 | 323,374 | ||||||
UBS E-TRACS Alerian MLP Infrastructure ETN | 4,880 | 141,374 | ||||||
| 464,748 | ||||||||
| Shares | Value (Note 1) | |||||||||||||
Other / Miscellaneous (0.88%) |
| |||||||||||||
iPATH S&P 500 VIX Mid-Term Futures ETN(a) | 1,586 | $ 118,173 | ||||||||||||
TOTAL EXCHANGE TRADED NOTES (Cost $573,571) |
| 582,921 | ||||||||||||
| 7-Day Yield | Shares | Value (Note 1) | ||||||||||||
SHORT TERM INVESTMENTS (13.86%) |
| |||||||||||||
Money Market Fund (13.86%) |
| |||||||||||||
Dreyfus Cash Management Fund, | ||||||||||||||
Institutional Class | 0.16% | 1,858,497 | 1,858,497 | |||||||||||
TOTAL SHORT TERM INVESTMENTS (Cost $1,858,497) |
| 1,858,497 | ||||||||||||
TOTAL INVESTMENTS (101.75%) (Cost $13,380,375) |
| $ | 13,645,732 | |||||||||||
Liabilities in Excess of Other Assets (-1.75%) |
| (234,512 | ) | |||||||||||
NET ASSETS (100.00%) |
| $ | 13,411,220 | |||||||||||
| (a) | Non-Income Producing Security. |
Common Abbreviations:
E-TRACS - Exchange Traded Access Securities
ETF - Exchange Traded Fund
ETN - Exchange Traded Note
LLC - Limited Liability Company
MLP - Master Limited Partnership
MSCI - Morgan Stanley Capital International
S&P - Standard & Poor’s
SPDR - Standard & Poor’s Depositary Receipt
VIX - Market Volatility Index
For Fund compliance purposes, the Fund’s industry classifications refer to any one or more of the industry sub-classifications used by one or more widely recognized market indexes or ratings group indexes, and/or as defined by Fund management. This definition may not apply for purposes of this report, which may combine industry sub-classifications for reporting ease. Industries are shown as a percent of net assets. These industry classifications are based on third party definitions and are unaudited. The definitions are industry terms and do not reflect the legal status of any of the investments or the companies in which the Fund has invested.
See Notes to Financial Statements.
52 | October 31, 2010
Table of Contents
| RiverFront Moderate Growth & Income Fund | ||||||
Statement of Investments |
October 31, 2010 (Unaudited) | |||||
Top Ten Holdings (as a % of Net Assets) †
Vanguard Short-Term Corporate Bond ETF | 19.69 | % | ||
SPDR Barclays Capital High Yield Bond ETF | 10.13 | % | ||
PowerShares Fundamental High Yield Corporate Bond Portfolio | 3.84 | % | ||
WisdomTree Emerging Markets SmallCap Dividend Fund | 3.77 | % | ||
Vanguard Emerging Markets ETF | 3.33 | % | ||
iShares MSCI All Country Asia ex Japan Index Fund | 2.60 | % | ||
JPMorgan Alerian MLP Index ETN | 2.41 | % | ||
Chevron Corp. | 2.08 | % | ||
iShares MSCI United Kingdom Index Fund | 2.06 | % | ||
iShares MSCI Singapore Index Fund | 2.03 | % | ||
Top Ten Holdings | 51.94 | % |
| † | Holdings are subject to change. |
Industry Sector Allocation (as a % of Net Assets)
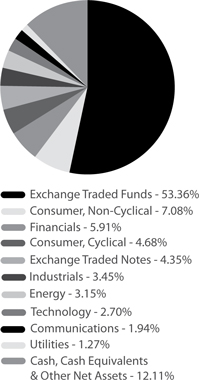
53 | October 31, 2010
Table of Contents
| Statements of Assets and Liabilities | ||||||
October 31, 2010 (Unaudited) | ||||||
| ALPS | GNI Long-Short Fund | ALPS | Red Rocks Listed Private Equity Fund | ALPS | WMC Value Intersection Fund (a) | Clough China Fund | |||||||||||||
ASSETS | ||||||||||||||||
Investments, at value | $ | 9,579,717 | $ | 136,556,425 | $ | 57,045,278 | $ 93,817,621 | |||||||||
Cash | 333,150 | – | – | – | ||||||||||||
Foreign currency, at value | – | 234,924 | – | 59,731 | ||||||||||||
Receivable for investments sold | 477,213 | 447,067 | 1,253,033 | 1,063,096 | ||||||||||||
Receivable for shares sold | – | 338,883 | 62,332 | 475,268 | ||||||||||||
Dividends and interest receivable | 650 | 68,189 | 57,389 | 14,537 | ||||||||||||
Deposits with brokers for securities sold short | 331,013 | – | – | – | ||||||||||||
Prepaid expenses and other assets | 22,630 | 37,721 | 27,804 | 18,498 | ||||||||||||
Total Assets | 10,744,373 | 137,683,209 | 58,445,836 | 95,448,751 | ||||||||||||
LIABILITIES | ||||||||||||||||
Payable for investments purchased | – | 883,514 | 841,606 | 2,905,697 | ||||||||||||
Payable for shares redeemed | – | 60,435 | 8,479 | 142,363 | ||||||||||||
Securities sold short | 2,362,992 | – | – | – | ||||||||||||
Dividends payable–short sales | 450 | – | – | – | ||||||||||||
Written options | 102,600 | – | – | – | ||||||||||||
Investment advisory fees payable | 6,478 | 63,830 | 14,352 | 82,004 | ||||||||||||
Administration and transfer agency fees payable | 1,483 | 19,368 | 9,449 | 21,128 | ||||||||||||
Distribution and services fees payable | 9 | 26,979 | 9,003 | 19,637 | ||||||||||||
Directors’ fees and expenses payable | 864 | 6,784 | 5,044 | 4,661 | ||||||||||||
Audit fees payable | 10,993 | 20,276 | 10,321 | 12,505 | ||||||||||||
Legal fees payable | – | 250 | 1,277 | 1,426 | ||||||||||||
Custody fees payable | 2,025 | 8,921 | 1,464 | 6,681 | ||||||||||||
Reports to shareholders and printing fees payable | 4,964 | 9,971 | 671 | 4,316 | ||||||||||||
Accrued expenses and other liabilities | 2,767 | 23,165 | 710 | 17,009 | ||||||||||||
Total Liabilities | 2,495,625 | 1,123,493 | 902,376 | 3,217,427 | ||||||||||||
NET ASSETS | $ | 8,248,748 | $ | 136,559,716 | $ | 57,543,460 | $ 92,231,324 | |||||||||
NET ASSETS CONSIST OF | ||||||||||||||||
Paid–in capital | $ | 10,323,336 | $ | 137,682,276 | $ | 64,387,569 | $ 77,640,850 | |||||||||
Undistributed/(overdistributed) net investment income | (75,536 | ) | (4,562,360 | ) | 519,091 | 166,348 | ||||||||||
Accumulated net realized loss on investments, securities sold short, written options and foreign currency transactions | (2,401,482 | ) | (23,712,075 | ) | (14,749,213 | ) | (2,553,534) | |||||||||
Net unrealized appreciation on investments, securities sold short, written options and translation of assets and liabilities in foreign currencies | 402,430 | 27,151,875 | 7,386,013 | 16,977,660 | ||||||||||||
NET ASSETS | $ | 8,248,748 | $ | 136,559,716 | $ | 57,543,460 | $ 92,231,324 | |||||||||
INVESTMENTS, AT COST | $ | 9,085,102 | $ | 109,408,013 | $ | 49,659,265 | $ 76,839,631 | |||||||||
See Notes to Financial Statements.
54 | October 31, 2010
Table of Contents
| Statements of Assets and Liabilities | ||||||
October 31, 2010 (Unaudited) | ||||||
| ALPS | GNI Long-Short Fund | ALPS | Red Rocks Listed Private Equity Fund | ALPS | WMC Value Intersection Fund (a) | Clough China Fund | |||||||||||||
PRICING OF SHARES | ||||||||||||||||
Class A: | ||||||||||||||||
Net Asset Value, offering and redemption price per share (b) | $ | 7.98 | $ | 5.55 | $ | 7.34 | $ | 20.61 | ||||||||
Net Assets | $ | 20,321 | $ | 83,000,165 | $ | 42,499,437 | $ | 45,088,022 | ||||||||
Shares of beneficial interest outstanding (unlimited number of shares, no par value common stock authorized) | 2,546 | 14,964,974 | 5,787,543 | 2,187,826 | ||||||||||||
Maximum offering price per share (NAV/0.9450), based on maximum sales charge of 5.50% of the offering price) | $ | 8.44 | $ | 5.87 | $ | 7.77 | $ | 21.81 | ||||||||
Class C: | ||||||||||||||||
Net Asset Value, offering and redemption price per share (b) | N/A | $ | 5.51 | $ | 7.33 | $ | 20.17 | |||||||||
Net Assets | N/A | $ | 1,136,174 | $ | 11,447 | $ | 12,974,418 | |||||||||
Shares of beneficial interest outstanding (unlimited number of shares, no par value common stock authorized) | N/A | 206,323 | 1,562 | 643,280 | ||||||||||||
Class I: | ||||||||||||||||
Net Asset Value, offering and redemption price per share | $ | 8.02 | $ | 5.57 | $ | 7.40 | $ | 20.89 | ||||||||
Net Assets | $ | 8,228,427 | $ | 52,375,090 | $ | 15,032,576 | $ | 34,168,884 | ||||||||
Shares of beneficial interest outstanding (unlimited number of shares, no par value common stock authorized) | 1,025,353 | 9,401,693 | 2,032,001 | 1,635,651 | ||||||||||||
Class R: | ||||||||||||||||
Net Asset Value, offering and redemption price per share | N/A | $ | 5.05 | N/A | N/A | |||||||||||
Net Assets | N/A | $ | 48,287 | N/A | N/A | |||||||||||
Shares of beneficial interest outstanding (unlimited number of shares, no par value common stock authorized) | N/A | 9,567 | N/A | N/A | ||||||||||||
| (a) | Prior to August 31, 2010, the ALPS | WMC Value Intersection Fund was known as the Activa Value Fund. |
| (b) | Redemption price per share may be reduced for any applicable contingent deferred sales charge. For a description of a possible sales charge, please see the Fund’s Prospectus. |
See Notes to Financial Statements.
55 | October 31, 2010
Table of Contents
| Statements of Assets and Liabilities | ||||||
October 31, 2010 (Unaudited) | ||||||
| Jefferies Asset Management Commodity Strategy Allocation Fund (a) | RiverFront Long-Term Growth & Income Fund | RiverFront Moderate Growth Fund | RiverFront Moderate Growth & Income Fund | |||||||||||||
ASSETS | ||||||||||||||||
Investments, at value | $ | 10,695,099 | $ | 3,946,774 | $ | 2,245,431 | $ | 13,645,732 | ||||||||
Total return swap contracts, at value | 327,912 | – | – | – | ||||||||||||
Cash | 447,483 | – | – | – | ||||||||||||
Foreign currency, at value (Cost $58) | 58 | – | – | – | ||||||||||||
Receivable for investments sold | – | 41,429 | 12,026 | 87,350 | ||||||||||||
Receivable for shares sold | 47,000 | 245,843 | 394,068 | 538,928 | ||||||||||||
Dividends and interest receivable | 33,023 | 1,835 | 790 | 9,268 | ||||||||||||
Receivable due from adviser | 27,029 | 22,539 | 24,298 | 13,364 | ||||||||||||
Prepaid offering costs | 64,893 | – | – | – | ||||||||||||
Prepaid expenses and other assets | 1,087 | 729 | 276 | 357 | ||||||||||||
Total Assets | 11,643,584 | 4,259,149 | 2,676,889 | 14,294,999 | ||||||||||||
LIABILITIES | ||||||||||||||||
Payable for investments purchased | 98,796 | 179,810 | 169,463 | 847,785 | ||||||||||||
Payable for shares redeemed | 15,000 | – | – | – | ||||||||||||
Interest payable – total return swap contracts | 3,479 | – | – | – | ||||||||||||
Administration and transfer agency fees payable | 15,749 | 3,496 | 4,061 | 1,010 | ||||||||||||
Distribution and services fees payable | 3,716 | 1,736 | 704 | 6,361 | ||||||||||||
Directors’ fees and expenses payable | 2,636 | 1,490 | 1,490 | 1,490 | ||||||||||||
Audit fees payable | 34,558 | 6,044 | 6,044 | 6,044 | ||||||||||||
Legal fees payable | 8,276 | 3,314 | 3,317 | 3,281 | ||||||||||||
Custody fees payable | 750 | 3,985 | 3,985 | 3,985 | ||||||||||||
Custody fees payable due to overdraft | – | 6,646 | – | 7,436 | ||||||||||||
Reports to shareholders and printing fees payable | 1,811 | 4,647 | 4,648 | 4,644 | ||||||||||||
Accrued expenses and other liabilities | 2,635 | 1,717 | 1,718 | 1,743 | ||||||||||||
Total Liabilities | 187,406 | 212,885 | 195,430 | 883,779 | ||||||||||||
NET ASSETS | $ | 11,456,178 | $ | 4,046,264 | $ | 2,481,459 | $13,411,220 | |||||||||
NET ASSETS CONSIST OF | ||||||||||||||||
Paid–in capital | $ | 10,396,796 | $ | 3,929,714 | $ | 2,421,644 | $13,146,546 | |||||||||
Undistributed/(overdistributed) net investment income | (273,039 | ) | 2,373 | 76 | 9,945 | |||||||||||
Accumulated net realized gain/(loss) on investments, swaps and foreign currency transactions | 569,798 | 1,742 | (498 | ) | (10,628) | |||||||||||
Net unrealized appreciation on investments, swaps and translation of assets and liabilities in foreign currencies | 762,623 | 112,435 | 60,237 | 265,357 | ||||||||||||
NET ASSETS | $ | 11,456,178 | $ | 4,046,264 | $ | 2,481,459 | $13,411,220 | |||||||||
INVESTMENTS, AT COST | $ | 10,256,530 | $ | 3,834,339 | $ | 2,185,194 | $13,380,375 | |||||||||
See Notes to Financial Statements.
56 | October 31, 2010
Table of Contents
| Statements of Assets and Liabilities | ||||||
October 31, 2010 (Unaudited) | ||||||
| Jefferies Asset Management Commodity Strategy Allocation Fund (a) | RiverFront Long-Term Growth & Income Fund | RiverFront Moderate Growth Fund | RiverFront Moderate Growth & Income Fund | |||||||||||||
PRICING OF SHARES | ||||||||||||||||
Class A: | ||||||||||||||||
Net Asset Value, offering and redemption price per share (b) | $ | 11.59 | $ | 10.62 | $ | 10.57 | $ | 10.37 | ||||||||
Net Assets | $ | 3,691,921 | $ | 1,237,149 | $ | 1,319,021 | $ | 2,839,978 | ||||||||
Shares of beneficial interest outstanding (unlimited number of shares, no par value common stock authorized) | 318,459 | 116,450 | 124,759 | 273,748 | ||||||||||||
Maximum offering price per share (NAV/0.9450), based on maximum sales charge of 5.50% of the offering price) | $ | 12.26 | $ | 11.24 | $ | 11.19 | $ | 10.97 | ||||||||
Class C: | ||||||||||||||||
Net Asset Value, offering and redemption price per share (b) | $ | 11.60 | $ | 10.60 | $ | 10.55 | $ | 10.36 | ||||||||
Net Assets | $ | 1,594,482 | $ | 2,423,578 | $ | 954,116 | $ | 8,352,368 | ||||||||
Shares of beneficial interest outstanding (unlimited number of shares, no par value common stock authorized) | 137,501 | 228,662 | 90,400 | 806,522 | ||||||||||||
Class I: | ||||||||||||||||
Net Asset Value, offering and redemption price per share | $ | 11.60 | $ | 10.62 | $ | 10.57 | $ | 10.38 | ||||||||
Net Assets | $ | 6,169,775 | $ | 385,537 | $ | 208,322 | $ | 2,218,874 | ||||||||
Shares of beneficial interest outstanding (unlimited number of shares, no par value common stock authorized) | 532,101 | 36,290 | 19,702 | 213,863 | ||||||||||||
| (a) | Statement of Assets and Liabilities for Jefferies Asset Management Commodity Strategy Allocation Fund is consolidated and includes the balances of Jefferies Asset Management Cayman Trust (wholly-owned subsidiary). Accordingly, all interfund balances have been eliminated. |
| (b) | Redemption price per share may be reduced for any applicable contingent deferred sales charge. For a description of a possible sales charge, please see the Fund’s Prospectus. |
See Notes to Financial Statements.
57 | October 31, 2010
Table of Contents
| Statements of Operations | ||||||
For the Six Months Ended October 31, 2010 (Unaudited) | ||||||
| ALPS | GNI Long-Short Fund | ALPS | Red Rocks Listed Private Equity Fund | ALPS | WMC Value Intersection Fund(a) | Clough China Fund | |||||||||||||
INVESTMENT INCOME | ||||||||||||||||
Dividends | $ | 58,164 | $ | 1,221,816 | $ | 647,102 | $ | 929,486 | ||||||||
Foreign taxes withheld on dividends | (446 | ) | (98,866 | ) | – | (36,849) | ||||||||||
Interest and other income | 1,110 | – | 615 | 7,086 | ||||||||||||
Total Investment Income | 58,828 | 1,122,950 | 647,717 | 899,723 | ||||||||||||
EXPENSES | ||||||||||||||||
Investment advisory fee | 58,599 | 460,884 | 265,767 | 432,440 | ||||||||||||
Administrative and transfer agency fee | 5,328 | 96,920 | 66,495 | 56,040 | ||||||||||||
Distribution and service fees | ||||||||||||||||
Class A | 58 | 133,253 | 51,964 | 42,436 | ||||||||||||
Class C(b) | N/A | 1,227 | 36 | 46,856 | ||||||||||||
Class R | N/A | 129 | N/A | N/A | ||||||||||||
Legal fees | 3,081 | 9,759 | 3,506 | 5,748 | ||||||||||||
Audit fees | 9,057 | 16,693 | 9,019 | 12,973 | ||||||||||||
Networking fees | ||||||||||||||||
Class A | – | 4,600 | – | 5,894 | ||||||||||||
Class C(b) | N/A | 52 | – | 3,777 | ||||||||||||
Class I | 752 | 16,398 | – | 1,200 | ||||||||||||
Class R | N/A | 17 | N/A | N/A | ||||||||||||
Reports to shareholders and printing fees | 2,442 | 39,008 | 26,287 | 10,095 | ||||||||||||
State registration fees | 6,924 | 36,314 | 15,318 | 11,122 | ||||||||||||
Interest expense – Margin Account | 32,660 | – | – | – | ||||||||||||
Insurance | 19 | 4,108 | 2,331 | 136 | ||||||||||||
Custody fees | 6,050 | 38,916 | 4,381 | 29,031 | ||||||||||||
Directors’ fees and expenses | 1,591 | 15,028 | 9,406 | 9,204 | ||||||||||||
Dividend Expense on short sale | 11,495 | – | – | – | ||||||||||||
Offering costs | 24,789 | – | – | – | ||||||||||||
Miscellaneous | 3,761 | 13 | 5,740 | 6,185 | ||||||||||||
Total Expense | 166,606 | 873,319 | 460,250 | 673,137 | ||||||||||||
Less fees waived/reimbursed by investment adviser and sub–adviser | ||||||||||||||||
Class A | (155 | ) | (79,264 | ) | (64,228 | ) | (37,699) | |||||||||
Class C(b) | N/A | (224 | ) | (13 | ) | (7,978) | ||||||||||
Class I | (32,087 | ) | (31,387 | ) | (22,288 | ) | (41,706) | |||||||||
Class R | N/A | (33 | ) | N/A | N/A | |||||||||||
Net Expenses | 134,364 | 762,411 | 373,721 | 585,754 | ||||||||||||
Net Investment Income/(Loss) | (75,536 | ) | 360,539 | 273,996 | 313,969 | |||||||||||
Net realized gain/(loss) on investments | (265,552 | ) | 2,378,004 | 193,368 | 2,159,251 | |||||||||||
Net realized gain on securities sold short | 120,038 | – | – | – | ||||||||||||
Net realized loss on written options | (45,517 | ) | – | – | – | |||||||||||
Net realized loss on foreign currency transactions | – | (133,893 | ) | – | (43,137) | |||||||||||
Net change in unrealized appreciation/(depreciation) of investments, securities sold short and written options | 277,858 | 6,897,794 | (1,353,506 | ) | 7,619,086 | |||||||||||
Net change in unrealized appreciation/(depreciation) on translation of assets and liabilities in foreign currencies | – | 4,379 | – | (285) | ||||||||||||
NET REALIZED AND UNREALIZED GAIN/(LOSS) ON INVESTMENTS | 86,827 | 9,146,284 | (1,160,138 | ) | 9,734,915 | |||||||||||
NET INCREASE/(DECREASE) IN NET ASSETS RESULTING FROM OPERATIONS | $ | 11,291 | $ | 9,506,823 | $ | (886,142 | ) | $ | 10,048,884 | |||||||
| (a) | Prior to August 31, 2010, the ALPS WMC Value Intersection Fund was known as the Activa Value Fund. |
| (b) | Class C shares commenced operations on July 2, 2010 for the ALPS Red Rocks Listed Private Equity Fund and ALPS WMC Value Intersection Fund. |
See Notes to Financial Statements.
58 | October 31, 2010
Table of Contents
| Statements of Operations | ||||||
(Unaudited) | ||||||
| Jefferies Asset Management Commodity Strategy Allocation Fund (a) | RiverFront Long-Term Growth & Income Fund | RiverFront Moderate Growth Fund | RiverFront Moderate Growth & Income Fund | |||||||||||||
| For the Period June 29, 2010 through October 31, 2010 | For the Period August 2, 2010 through October 31, 2010 | |||||||||||||||
INVESTMENT INCOME | ||||||||||||||||
Dividends | $ | 15,802 | $ | 8,634 | $ | 3,055 | $ | 31,653 | ||||||||
Foreign taxes withheld on dividends | (539) | (16) | – | (44) | ||||||||||||
Interest and other income | 10,639 | 102 | 62 | 457 | ||||||||||||
Total Investment Income | 25,902 | 8,720 | 3,117 | 32,066 | ||||||||||||
EXPENSES | ||||||||||||||||
Investment advisory fee | 21,102 | 3,353 | 1,846 | 11,416 | ||||||||||||
Administrative and transfer agency fee | 45,426 | 5,022 | 4,854 | 5,918 | ||||||||||||
Distribution and service fees | ||||||||||||||||
Class A | 2,720 | 212 | 201 | 543 | ||||||||||||
Class C | 4,255 | 2,223 | 687 | 8,259 | ||||||||||||
Legal fees | 8,427 | 3,321 | 3,321 | 3,295 | ||||||||||||
Audit fees | 34,558 | 6,044 | 6,044 | 6,044 | ||||||||||||
Networking fees | ||||||||||||||||
Class I | 1,377 | – | – | – | ||||||||||||
Reports to shareholders and printing fees | 4,073 | 4,649 | 4,649 | 4,649 | ||||||||||||
Insurance | 7 | – | – | – | ||||||||||||
Custody fees | 10,243 | 3,985 | 3,985 | 3,985 | ||||||||||||
Directors’ fees and expenses | 2,636 | 1,490 | 1,490 | 1,490 | ||||||||||||
Offering costs | 33,389 | – | – | – | ||||||||||||
Miscellaneous | 4,271 | 2,313 | 2,312 | 2,339 | ||||||||||||
Total Expense | 172,484 | 32,612 | 29,389 | 47,938 | ||||||||||||
Less fees waived/reimbursed by investment adviser and sub–adviser | ||||||||||||||||
Class A | (37,466) | (4,118) | (7,513) | (2,116) | ||||||||||||
Class C | (23,803) | (13,032) | (3,218) | (17,226) | ||||||||||||
Class I | (76,796) | (8,743) | (15,412) | (5,438) | ||||||||||||
Less fees waived/reimbursed by administrator | ||||||||||||||||
Class A | – | (85) | (83) | (171) | ||||||||||||
Class C | – | (223) | (68) | (681) | ||||||||||||
Class I | – | (64) | (54) | (185) | ||||||||||||
Net Expenses | 34,419 | 6,347 | 3,041 | 22,121 | ||||||||||||
Net Investment Income/(Loss) | (8,517) | 2,373 | 76 | 9,945 | ||||||||||||
Net realized gain/(loss) on investments | 5,864 | 1,742 | (498) | (10,628) | ||||||||||||
Net realized gain on total return swaps | 561,651 | – | – | – | ||||||||||||
Net realized gain on foreign currency transactions | 2,283 | – | – | – | ||||||||||||
Net change in unrealized appreciation of investments and swaps | 763,002 | 112,435 | 60,237 | 265,357 | ||||||||||||
Net change in unrealized depreciation on translation of assets and liabilities in foreign currencies | (379) | – | – | – | ||||||||||||
NET REALIZED AND UNREALIZED GAIN ON INVESTMENTS | 1,332,421 | 114,177 | 59,739 | 254,729 | ||||||||||||
NET INCREASE IN NET ASSETS RESULTING FROM OPERATIONS | $ | 1,323,904 | $ | 116,550 | $ | 59,815 | $ | 264,674 | ||||||||
| (a) | Statement of Operations for Jefferies Asset Management Commodity Strategy Allocation Fund is consolidated and includes the balances of Jefferies Asset Management Cayman Trust (a wholly owned subsidiary of the Fund). Accordingly, all interfund balances have been eliminated. |
See Notes to Financial Statements.
59 | October 31, 2010
Table of Contents
| (a) | Prior to August 31, 2010, the ALPS | WMC Value Intersection Fund was known as the Activa Value Fund. |
| (b) | Effective March 9, 2010, the Board approved changing the fiscal year-end of the Fund from December 31 to April 30. |
| (c) | Effective March 9, 2010, the Board approved changing the fiscal year-end of the Fund from July 31 to April 30. |
| (d) | Class C shares commenced operations on July 2, 2010 for the ALPS | Red Rocks Listed Private Equity Fund and ALPS | WMC Value Intersection Fund. |
| (e) | Prior to close of business August 28, 2009, Class I of the ALPS | WMC Value Intersection Fund was known as Class R of the Predecessor Fund. |
| (f) | Prior to the close of business on January 15, 2010, Class I of the Clough China Fund was known as Institutional Class of the Predecessor Fund. |
| (g) | As a result of the reorganization (Note 1), the Clough China Fund no longer offers Class Z shares. Effective as of the close of business January 15, 2010, holders of Class Z shares of the Predecessor Fund received Class A shares of the Fund. |
See Notes to Financial Statements.
60 | October 31, 2010
Table of Contents
| ALPS | WMC Value Intersection Fund (a) | Clough China Fund | |||||||||||||||||||||
| For the Six Months Ended October 31, 2010 (Unaudited) | For the Period April 30, 2010 (b) | For the Year Ended December 31, 2009 | For the Six Months Ended October 31, 2010 (Unaudited) | For the Period August 1, 2009 through April 30, 2010 (c) | For the Year E\nded July 31, 2009 (000s) | |||||||||||||||||
| $ 273,996 | $ | 155,014 | $ | 758,257 | $ | 313,969 | $ | (163,882) | $ | 221 | ||||||||||||
| – | – | – | – | – | 1 | |||||||||||||||||
| 193,368 | 138,322 | (2,572,827) | 2,159,251 | 7,475,435 | (7,544) | |||||||||||||||||
| – | – | – | – | – | – | |||||||||||||||||
| – | – | – | – | – | – | |||||||||||||||||
| – | – | – | (43,137) | (24,039) | (53) | |||||||||||||||||
| (1,353,506) | 5,191,701 | 16,108,515 | 7,618,801 | (2,468,901) | 8,482 | |||||||||||||||||
| (886,142) | 5,485,037 | 14,293,945 | 10,048,884 | 4,818,613 | 1,107 | |||||||||||||||||
| – | – | (602,511) | – | (59,414) | (182) | |||||||||||||||||
| – | N/A | N/A | – | – | (18) | |||||||||||||||||
| – | – | (197,487) | – | (87,067) | (187) | |||||||||||||||||
| N/A | N/A | N/A | N/A | N/A | N/A | |||||||||||||||||
| N/A | N/A | N/A | N/A | (95,371) | (73) | |||||||||||||||||
| – | – | (799,998) | – | (241,852) | (460) | |||||||||||||||||
| 125,270 | 1,703,692 | 2,575,630 | 17,087,950 | 22,831,904 | 5,929 | |||||||||||||||||
| 10,070 | N/A | N/A | 5,001,824 | 2,058,570 | 1,796 | |||||||||||||||||
| 693,820 | 1,570,054 | 11,456,364 | 15,774,956 | 4,220,994 | 13 | |||||||||||||||||
| N/A | N/A | N/A | N/A | N/A | N/A | |||||||||||||||||
| N/A | N/A | N/A | N/A | 14,440,499 | 7,001 | |||||||||||||||||
| – | – | 585,747 | – | 37,489 | 120 | |||||||||||||||||
| – | N/A | N/A | – | – | 9 | |||||||||||||||||
| – | – | 197,487 | – | 87,068 | 187 | |||||||||||||||||
| N/A | N/A | N/A | N/A | N/A | N/A | |||||||||||||||||
| N/A | N/A | N/A | N/A | 94,027 | 71 | |||||||||||||||||
| (2,261,249) | (22,940,410) | (4,161,769) | (5,830,372) | (10,253,870) | (8,473) | |||||||||||||||||
| (68) | N/A | N/A | (1,011,506) | (3,451,765) | (3,205) | |||||||||||||||||
| (2,252,503) | (2,432,434) | (2,918,243) | (199,821) | (3,956) | (12) | |||||||||||||||||
| N/A | N/A | N/A | N/A | N/A | N/A | |||||||||||||||||
| N/A | N/A | N/A | N/A | (28,012,416) | (1,831) | |||||||||||||||||
| (3,684,660) | (22,099,098) | 7,735,216 | 30,823,031 | 2,048,544 | 1,605 | |||||||||||||||||
| (4,570,802) | (16,614,061) | 21,229,163 | 40,871,915 | 6,625,305 | 2,252 | |||||||||||||||||
| 62,114,262 | 78,728,323 | 57,499,160 | 51,359,409 | 44,734,104 | 42,482 | |||||||||||||||||
| $ 57,543,460 | $ | 62,114,262 | $ | 78,728,323 | $ | 92,231,324 | $ | 51,359,409 | $ | 44,734 | ||||||||||||
| $ 519,091 | $ | 245,095 | $ | 90,081 | $ | 166,348 | $ | (147,621) | $ | 22 | ||||||||||||
See Notes to Financial Statements.
61 | October 31, 2010
Table of Contents
| Statements of Changes in Net Assets | ||||||||||
(Unaudited) | ||||||||||
| Jefferies Asset Management Commodity Strategy Allocation Fund (a) | RiverFront Long-Term Growth & Income Fund | RiverFront Moderate Growth Fund | RiverFront Moderate Growth & Income Fund | |||||||||||||
| For the Period June 29, 2010 through October 31, 2010 | For the Period August 2, 2010 through October 31, 2010 | |||||||||||||||
INVESTMENT INCOME | ||||||||||||||||
Net investment income/(loss) | $ | (8,517 | ) | $ | 2,373 | $ | 76 | $ | 9,945 | |||||||
Net realized gain/(loss) on investments | 5,864 | 1,742 | (498 | ) | (10,628 | ) | ||||||||||
Net realized gain on total return swaps | 561,651 | – | – | – | ||||||||||||
Net realized gain on foreign currency transactions | 2,283 | – | – | – | ||||||||||||
Net change in unrealized appreciation of investments, swaps and translation of assets and liabilities in foreign currencies | 762,623 | 112,435 | 60,237 | 265,357 | ||||||||||||
Net Increase in Net Assets Resulting from Operations | 1,323,904 | 116,550 | 59,815 | 264,674 | ||||||||||||
DISTRIBUTIONS | ||||||||||||||||
Dividends to shareholders from net investment income |
| |||||||||||||||
Class A | (72,097 | ) | – | – | – | |||||||||||
Class C | (43,711 | ) | – | – | – | |||||||||||
Class I | (148,714 | ) | – | – | – | |||||||||||
Net Decrease in Net Assets from Distributions | (264,522 | ) | – | – | – | |||||||||||
BENEFICIAL INTEREST TRANSACTIONS (NOTE 3) |
| |||||||||||||||
Shares sold | ||||||||||||||||
Class A | 3,367,243 | 1,212,531 | 1,291,417 | 2,892,490 | ||||||||||||
Class C | 1,371,488 | 2,359,624 | 935,148 | 8,184,695 | ||||||||||||
Class I | 5,441,592 | 368,001 | 244,758 | 2,171,455 | ||||||||||||
Dividends reinvested | ||||||||||||||||
Class A | 72,097 | – | – | – | ||||||||||||
Class C | 39,988 | – | – | – | ||||||||||||
Class I | 148,665 | – | – | – | ||||||||||||
Shares redeemed | ||||||||||||||||
Class A | (21,729 | ) | – | – | (98,542 | ) | ||||||||||
Class C | – | (10,442 | ) | – | (3,552 | ) | ||||||||||
Class I | (22,548 | ) | – | (49,679 | ) | – | ||||||||||
Net Increase in Net Assets Derived | 10,396,796 | 3,929,714 | 2,421,644 | 13,146,546 | ||||||||||||
Net increase in net assets | 11,456,178 | 4,046,264 | 2,481,459 | 13,411,220 | ||||||||||||
Net Assets | ||||||||||||||||
Beginning of period | – | – | – | – | ||||||||||||
End of period* | $ | 11,456,178 | $ | 4,046,264 | $ | 2,481,459 | $ | 13,411,220 | ||||||||
* Includes undistributed/ (overdistributed) net investment income of: | $ | (273,039 | ) | $ | 2,373 | $ | 76 | $ | 9,945 | |||||||
| (a) | Statement of Changes for Jefferies Asset Management Commodity Strategy Allocation Fund is consolidated and includes the balances of Jefferies Asset Management Cayman Trust (a wholly owned subsidiary of the Fund). Accordingly, all interfund balances have been eliminated. |
See Notes to Financial Statements.
62 | October 31, 2010
Table of Contents
| Financial Highlights | ||||||
Selected data for a share of beneficial interest outstanding throughout the periods indicated: | ||||||
| ALPS | GNI Long-Short Fund [Class A] | ||||||||||||
| For the Six Months Ended October 31, 2010 (Unaudited) | For the Period November 2, 2009 (Inception) through April 30, 2010 | |||||||||||
Net asset value, beginning of period | $ | 7.99 | $ | 10.00 | ||||||||
INCOME/(LOSS) FROM INVESTMENT OPERATIONS: |
| |||||||||||
Net investment loss | (0.19 | ) | – | |||||||||
Net realized and unrealized gain/(loss) | 0.18 | (2.01 | ) | |||||||||
Total from investment operations | (0.01 | ) | (2.01 | ) | ||||||||
Net decrease in net asset value | (0.01 | ) | (2.01 | ) | ||||||||
Net asset value, end of period | $ | 7.98 | $ | 7.99 | ||||||||
TOTAL RETURN (a) | (0.13 | )% | (20.10 | )% | ||||||||
RATIOS/SUPPLEMENTAL DATA: | ||||||||||||
Net assets, end of period (000s) | $ | 20 | $ | 60 | ||||||||
Ratio of net investment loss to average net assets | (2.14 | )% (b) | (2.53 | )% (b) | ||||||||
Ratio of expenses to average net assets including fee waivers and reimbursements | 3.12 | % (b) | 2.90 | % (b) | ||||||||
Ratio of expenses to average net assets excluding fee waivers and reimbursements | 3.79 | % (b) | 27.32 | % (b) | ||||||||
Ratio of expenses to average net assets including fee waivers and reimbursements (excluding interest expense and short sale dividend expense) | 2.25 | % (b) | 2.25 | % (b) | ||||||||
Ratio of expenses to average net assets excluding fee waivers and reimbursements (excluding interest expense and short sale dividend expense) | 2.92 | % (b) | 26.69 | % (b) | ||||||||
Portfolio turnover rate (c) | 176 | % | 250 | % | ||||||||
| (a) | Total returns are for the period indicated and have not been annualized. Total returns would have been lower had certain expenses not been waived during the period. Returns shown do not reflect the deduction of taxes that a shareholder would pay on Fund distributions or the redemption of Fund shares. |
| (b) | Annualized. |
| (c) | Portfolio turnover rate for periods of less than one full year have not been annualized. |
See Notes to Financial Statements.
63 | October 31, 2010
Table of Contents
| Financial Highlights | ||||||
Selected data for a share of beneficial interest outstanding throughout the periods indicated: | ||||||
| ALPS | GNI Long-Short Fund [Class I] | ||||||||
| For the Six Months Ended October 31, 2010 (Unaudited) | For the Period November 2, 2009 (Inception) through April 30, 2010 | |||||||
Net asset value, beginning of period | $ | 8.01 | $ | 10.00 | ||||
INCOME/(LOSS) FROM INVESTMENT OPERATIONS: |
| |||||||
Net investment loss | (0.07 | ) | – | |||||
Net realized and unrealized gain/(loss) | 0.08 | (1.99 | ) | |||||
Total from investment operations | 0.01 | (1.99 | ) | |||||
REDEMPTION FEES ADDED TO PAID IN CAPITAL (NOTE 3) | 0.00 | (b) | – | |||||
Net increase/(decrease) in net asset value | 0.01 | (1.99 | ) | |||||
Net asset value, end of period | $ | 8.02 | $ | 8.01 | ||||
TOTAL RETURN (a) | | 0.12 | % | (19.90 | )% | |||
RATIOS/SUPPLEMENTAL DATA: | ||||||||
Net assets, end of period (000s) | $ | 8,228 | $ | 9,119 | ||||
Ratio of net investment loss to average net assets | | (1.67 | )% (c) | (2.34 | )% (c) | |||
Ratio of expenses to average net assets including fee waivers | 2.98 | % (c) | 2.78 | % (c) | ||||
Ratio of expenses to average net assets excluding fee waivers | 3.70 | % (c) | 3.85 | % (c) | ||||
Ratio of expenses to average net assets including fee waivers | 2.00 | % (c) | 2.00 | % (c) | ||||
Ratio of expenses to average net assets excluding fee waivers | 2.72 | % (c) | 3.07 | % (c) | ||||
Portfolio turnover rate (d) | 176 | % | 250 | % | ||||
| (a) | Total returns are for the period indicated and have not been annualized. Total returns would have been lower had certain expenses not been waived during the period. Returns shown do not reflect the deduction of taxes that a shareholder would pay on Fund distributions or the redemption of Fund shares. |
| (b) | Less than $0.005 per share. |
| (c) | Annualized. |
| (d) | Portfolio turnover rate for periods of less than one full year have not been annualized. |
See Notes to Financial Statements.
64 | October 31, 2010
Table of Contents
| Financial Highlights | ||||||
Selected data for a share of beneficial interest outstanding throughout the periods indicated: | ||||||
| ALPS | Red Rocks Listed Private Equity Fund [Class A] | ||||||||||||||||
| For the Six Months Ended October 31, 2010 | For the Year Ended April 30, | For the Period Ended April 30, 2008 (a) | ||||||||||||||
| (Unaudited) | 2010 | 2009 | ||||||||||||||
Net asset value, beginning of period | $ | 5.17 | $ | 3.56 | $ | 9.47 | $ | 10.00 | ||||||||
INCOME/(LOSS) FROM INVESTMENT OPERATIONS: | ||||||||||||||||
Net investment income | 0.05 | 0.14 | 0.08 | (b) | 0.11 | |||||||||||
Net realized and unrealized gain/(loss) | 0.33 | 1.99 | (5.97 | ) (b) | (0.64 | ) | ||||||||||
Total from investment operations | 0.38 | 2.13 | (5.89 | ) | (0.53 | ) | ||||||||||
DISTRIBUTIONS: | ||||||||||||||||
From net investment income | – | (0.52 | ) | (0.03 | ) | – | ||||||||||
From net realized gains | – | – | (0.00 | ) (c) | – | |||||||||||
Total distributions | – | (0.52 | ) | (0.03 | ) | – | ||||||||||
REDEMPTION FEES ADDED TO PAID-IN | 0.00 | (c) | 0.00 | (c) | 0.01 | (b) | – | |||||||||
Net increase/(decrease) in net asset value | 0.38 | 1.61 | (5.91 | ) | (0.53 | ) | ||||||||||
Net asset value, end of period | $ | 5.55 | $ | 5.17 | $ | 3.56 | $ | 9.47 | ||||||||
TOTAL RETURN(d) | 7.35 | % | 61.68 | % | (62.01 | )% | (5.30 | )% | ||||||||
RATIOS/SUPPLEMENTAL DATA: | ||||||||||||||||
Net assets, end of period (000s) | $ | 83,000 | $ | 67,192 | $ | 27,860 | $ | 832 | ||||||||
Ratio of net investment income to average net assets | 0.58 | % (e) | 0.42 | % | 2.16 | % | 4.68 | % (e) | ||||||||
Ratio of expenses to average net assets including fee waivers and reimbursements | 1.50 | % (e) | 1.44 | % (f) | 1.25 | % | 1.25 | % (e) | ||||||||
Ratio of expenses to average net assets excluding fee waivers and reimbursements | 1.74 | % (e) | 1.71 | % | 2.08 | % | 39.07 | % (e) | ||||||||
Portfolio turnover rate(g) | 17 | % | 54 | % | 59 | % | 15 | % | ||||||||
| (a) | The Fund commenced operations on December 31, 2007. |
| (b) | Per share numbers have been calculated using the average shares method. |
| (c) | Less than $0.005 and $(0.005) per share. |
| (d) | Total returns are for the period indicated and have not been annualized. Total returns would have been lower had ceratin expenses not been waived during the period. Returns shown do not reflect the deduction of taxes that a shareholder would pay on Fund distributions or the redemption of Fund shares. Returns shown exclude any applicable sales charges. |
| (e) | Annualized. |
| (f) | Effective Sptember 1, 2009, the net expense ratio limitation changed from 1.25% to 1.50%. |
| (g) | Portfolio turnover rate for periods less than one full year have not been annualized. |
See Notes to Financial Statements.
65 | October 31, 2010
Table of Contents
| Financial Highlights | ||||||
Selected data for a share of beneficial interest outstanding throughout the period indicated: | ||||||
| ALPS | Red Rocks Listed Private Equity Fund [Class C] | ||||||||
| For the Period July 2, 2010 through October 31, 2010 (Unaudited) | ||||||||
Net asset value, beginning of period | $ 4.39 | |||||||
INCOME/(LOSS) FROM INVESTMENT OPERATIONS: | ||||||||
Net investment loss | (0.01 | ) | ||||||
Net realized and unrealized gain | 1.13 | |||||||
Total from investment operations | 1.12 | |||||||
Net increase in net asset value | 1.12 | |||||||
Net asset value, end of period | $ 5.51 | |||||||
TOTAL RETURN (a) | 25.51 | % | ||||||
RATIOS/SUPPLEMENTAL DATA: | ||||||||
Net assets, end of period (000s) | $ 1,136 | |||||||
Ratio of net investment loss to average net assets | (1.94 | )% (b) | ||||||
Ratio of expenses to average net assets including fee waivers and reimbursements | 2.25 | % (b) | ||||||
Ratio of expenses to average net assets excluding fee waivers and reimbursements | 2.43 | % (b) | ||||||
Portfolio turnover rate (c) | 17 | % (d) | ||||||
| (a) | Total returns are for the period indicated and have not been annualized. Total returns would have been lower had ceratin expenses not been waived during the period. Returns shown do not reflect the deduction of taxes that a shareholder would pay on Fund distributions or the redemption of Fund shares. Returns shown exclude any applicable sales charges. |
| (b) | Annualized. |
| (c) | Portfolio turnover rate for periods less than one full year have not been annualized. |
| (d) | Portfolio turnover rate is calculated at the Fund Level and represents the six months ended October 31, 2010. |
See Notes to Financial Statements.
66 | October 31, 2010
Table of Contents
| Financial Highlights | ||||||
Selected data for a share of beneficial interest outstanding throughout the periods indicated: | ||||||
| ALPS | Red Rocks Listed Private Equity Fund [Class I] | ||||||||||||||||
| For the Six Months Ended October 31, 2010 | For the Year Ended April 30, | For the Period Ended | ||||||||||||||
| (Unaudited) | 2010 | 2009 | April 30, 2008 (a) | |||||||||||||
Net asset value, beginning of period | $ | 5.19 | $ | 3.57 | $ | 9.47 | $ | 10.00 | ||||||||
INCOME/(LOSS) FROM INVESTMENT OPERATIONS: | ||||||||||||||||
Net investment income | 0.03 | 0.28 | 0.10 | (b) | 0.13 | |||||||||||
Net realized and unrealized gain/(loss) | 0.35 | 1.87 | (5.97 | ) (b) | (0.66) | |||||||||||
Total from investment operations | 0.38 | 2.15 | (5.87 | ) | (0.53) | |||||||||||
DISTRIBUTIONS: | ||||||||||||||||
From net investment income | – | (0.53 | ) | (0.05 | ) | – | ||||||||||
From net realized gains | – | – | (0.00 | ) (c) | – | |||||||||||
Total distributions | – | (0.53 | ) | (0.05 | ) | – | ||||||||||
REDEMPTION FEES ADDED TO PAID-IN | 0.00 (c) | 0.00 | (c) | 0.02 | (b) | – | ||||||||||
Net increase/(decrease) in net asset value | 0.38 | 1.62 | (5.90 | ) | (0.53) | |||||||||||
Net asset value, end of period | $ | 5.57 | $ | 5.19 | $ | 3.57 | $ | 9.47 | ||||||||
TOTAL RETURN (d) | 7.32% | 62.09 | % | (61.79 | )% | (5.30)% | ||||||||||
RATIOS/SUPPLEMENTAL DATA: | ||||||||||||||||
Net assets, end of period (000s) | $ | 52,375 | $ | 45,144 | $ | 12,938 | $ | 21 | ||||||||
Ratio of net investment income to average net assets | 0.81% (e) | 0.78 | % | 2.56 | % | 6.11% (e) | ||||||||||
Ratio of expenses to average net assets including fee waivers and reimbursements | 1.25% (e) | 1.19 | % (f) | 1.00 | % | 1.00% (e) | ||||||||||
Ratio of expenses to average net assets excluding fee waivers and reimbursements | 1.40% (e) | 1.47 | % | 2.05 | % | 35.33% (e) | ||||||||||
Portfolio turnover rate(g) | 17% | 54 | % | 59 | % | 15% | ||||||||||
| (a) | The Fund commenced operations on December 31, 2007. |
| (b) | Per share numbers have been calculated using the average shares method. |
| (c) | Less than $0.005 and $(0.005) per share. |
| (d) | Total returns are for the period indicated and have not been annualized. Total returns would have been lower had ceratin expenses not been waived during the period. Returns shown do not reflect the deduction of taxes that a shareholder would pay on Fund distributions or the redemption of Fund shares. |
| (e) | Annualized. |
| (f) | Effective Sptember 1, 2009, the net expense ratio limitation changed from 1.00% to 1.25%. (g) Portfolio turnover rate for periods less than one full year have not been annualized. |
See Notes to Financial Statements.
67 | October 31, 2010
Table of Contents
| Financial Highlights | ||||||
Selected data for a share of beneficial interest outstanding throughout the periods indicated: | ||||||
| ALPS | Red Rocks Listed Private Equity Fund [Class R] | ||||||||||||||||
| For the Six Months Ended October 31, 2010 | For the Year Ended | For the Period Ended April 30, 2008 (a) | ||||||||||||||
| (Unaudited) | 2010 | 2009 | ||||||||||||||
Net asset value, beginning of period | $ | 4.73 | $ | 3.31 | $ | 9.46 | $ | 10.00 | ||||||||
INCOME/(LOSS) FROM INVESTMENT OPERATIONS: |
| |||||||||||||||
Net investment income/(loss) | 0.31 | (0.09) | 0.15 | (b) | 0.12 | |||||||||||
Net realized and unrealized gain/(loss) | 0.01 | 2.02 | (6.05) | (b) | (0.66) | |||||||||||
Total from investment operations | 0.32 | 1.93 | (5.90) | (0.54) | ||||||||||||
DISTRIBUTIONS: | ||||||||||||||||
From net investment income | – | (0.51) | (0.26) | – | ||||||||||||
From net realized gains | – | – | (0.00) | (c) | – | |||||||||||
Total distributions | – | (0.51) | (0.26) | – | ||||||||||||
REDEMPTION FEES ADDED TO PAID-IN | – | – | 0.01 | (b) | – | |||||||||||
Net increase/(decrease) in net asset value | 0.32 | 1.42 | (6.15) | (0.54) | ||||||||||||
Net asset value, end of period | $ | 5.05 | $ | 4.73 | $ | 3.31 | $ | 9.46 | ||||||||
TOTAL RETURN (d) | 6.77% | 60.92% | (62.10)% | (5.40)% | ||||||||||||
RATIOS/SUPPLEMENTAL DATA: | ||||||||||||||||
Net assets, end of period (000s) | $ | 48 | $ | 18 | $ – (e) | $ | 1 | |||||||||
Ratio of net investment income/(loss) to average net assets | 0.64% (f) | (0.24)% | 2.72% | 3.90% | (f) | |||||||||||
Ratio of expenses to average net assets including fee waivers and reimbursements | 1.75% (f) | 1.75% (g) | 1.50% | 1.50% | (f) | |||||||||||
Ratio of expenses to average net assets excluding fee waivers and reimbursements | 1.88% (f) | 2.27% | 6.08% | 43.39% | (f) | |||||||||||
Portfolio turnover rate (h) | 17% | 54% | 59% | 15% | ||||||||||||
| (a) | The Fund commenced operations on December 31, 2007. |
| (b) | Per share numbers have been calculated using the average shares method. |
| (c) | Less than $(0.005) per share. |
| (d) | Total returns are for the period indicated and have not been annualized. Total returns would have been lower had ceratin expenses not been waived during the period. Returns shown do not reflect the deduction of taxes that a shareholder would pay on Fund distributions or the redemption of Fund shares. |
| (e) | Less than $500. (f) Annualized. |
| (g) | Effective Sptember 1, 2009, the net expense ratio limitation changed from 1.50% to 1.75%. |
| (h) | Portfolio turnover rate for periods less than one full year have not been annualized. |
See Notes to Financial Statements.
68 | October 31, 2010
Table of Contents
| Financial Highlights | ||||||
Selected data for a share of beneficial interest outstanding throughout the periods indicated: | ||||||
| ALPS | WMC Value Intersection Fund (a) [Class A] | ||||||||||||||||||||||||||||||
| For the Six Months Ended October 31, 2010 | For the Period January 1, 2010 through | For the Year Ended December 31, | ||||||||||||||||||||||||||||
| (Unaudited) | April 30, 2010 (b) | 2009 | 2008 | 2007 | 2006 | 2005 | ||||||||||||||||||||||||
Net asset value, beginning of period | $ | 7.43 | $ | 6.92 | $ | 5.86 | $ | 9.35 | $ | 9.81 | $ | 8.65 | $ | 8.06 | ||||||||||||||||
INCOME/(LOSS) FROM INVESTMENT OPERATIONS: |
| |||||||||||||||||||||||||||||
Net investment income | 0.04 | 0.03 | 0.07 | 0.08 | 0.14 | 0.13 | 0.09 | |||||||||||||||||||||||
Net realized and unrealized gain/(loss) | (0.13 | ) | 0.48 | 1.06 | (3.49 | ) | 0.09 | 1.49 | 0.59 | |||||||||||||||||||||
Total from investment operations | (0.09 | ) | 0.51 | 1.13 | (3.41 | ) | 0.23 | 1.62 | 0.68 | |||||||||||||||||||||
DISTRIBUTIONS: | ||||||||||||||||||||||||||||||
From net investment income | – | – | (0.07 | ) | (0.08 | ) | (0.14 | ) | (0.13 | ) | (0.09 | ) | ||||||||||||||||||
From net realized gains | – | – | – | – | (0.55 | ) | (0.33 | ) | – | |||||||||||||||||||||
Total distributions | – | – | (0.07 | ) | (0.08 | ) | (0.69 | ) | (0.46 | ) | (0.09 | ) | ||||||||||||||||||
Net increase/(decrease) | (0.09 | ) | 0.51 | 1.06 | (3.49 | ) | (0.46 | ) | 1.16 | 0.59 | ||||||||||||||||||||
Net asset value, end of period | $ | 7.34 | $ | 7.43 | $ | 6.92 | $ | 5.86 | $ | 9.35 | $ | 9.81 | $ | 8.65 | ||||||||||||||||
TOTAL RETURN (c) | (1.21 | )% | 7.22 | % | 19.24 | % | (36.45 | )% | 2.43 | % | 18.80 | % | 8.47 | % | ||||||||||||||||
RATIOS/SUPPLEMENTAL DATA: |
| |||||||||||||||||||||||||||||
Net assets, end of period (000s) | $ | 42,499 | $ | 45,300 | $ | 62,264 | $ | 53,841 | $ | 88,679 | $ | 125,459 | $ | 132,597 | ||||||||||||||||
Ratio of net investment income to average net assets | 0.92 | % (d) | 0.60 | % (d) | 1.12 | % | 1.1 | % | 1.4 | % | 1.4 | % | 1.1 | % | ||||||||||||||||
Ratio of expenses to average net assets including fee waivers and reimbursements | 1.40 | % (d) | 1.40 | % (d) | 1.62 | % | 1.5 | % | 1.2 | % | 1.1 | % | 1.2 | % | ||||||||||||||||
Ratio of expenses to average net assets excluding fee waivers and reimbursements | 1.71 | % (d) | 1.70 | % (d) | N/A | N/A | N/A | N/A | N/A | |||||||||||||||||||||
Portfolio turnover rate (e) | 18 | % | 11 | % | 56 | % | 83 | % | 52 | % | 64 | % | 54 | % | ||||||||||||||||
| (a) | Prior to August 31, 2010, the ALPS | WMC Value Intersection Fund was known as the Activa Value Fund. |
| (b) | Effective March 9, 2010, the Board approved changing the fiscal year–end of the Fund from December 31 to April 30. |
| (c) | Total returns are for the period indicated and have not been annualized. Total returns would have been lower had ceratin expenses not been waived during the period. Returns shown do not reflect the deduction of taxes that a shareholder would pay on Fund distributions or the redemption of Fund shares. Returns shown exclude any applicable sales charges. |
| (d) | Annualized. |
| (e) | Portfolio turnover rate for periods less than one full year have not been annualized. |
See Notes to Financial Statements.
69 | October 31, 2010
Table of Contents
| Financial Highlights | ||||||
Selected data for a share of beneficial interest outstanding throughout the period indicated: | ||||||
| ALPS | WMC Value Intersection Fund (a) [Class C] | ||||||||
For the Period | ||||||||
Net asset value, beginning of period | $ | 6.40 | ||||||
INCOME/(LOSS) FROM INVESTMENT OPERATIONS: | ||||||||
Net investment loss | (0.00 | ) (b) | ||||||
Net realized and unrealized gain | 0.93 | |||||||
Total from investment operations | 0.93 | |||||||
Net increase in net asset value | 0.93 | |||||||
Net asset value, end of period | $ | 7.33 | ||||||
TOTAL RETURN (c) | 14.53 | % | ||||||
RATIOS/SUPPLEMENTAL DATA: | ||||||||
Net assets, end of period (000s) | $ | 11 | ||||||
Ratio of net investment loss to average net assets | (0.03 | )% (d) | ||||||
Ratio of expenses to average net assets including fee waivers and reimbursements | 2.15 | % (d) | ||||||
Ratio of expenses to average net assets excluding fee waivers and reimbursements | 2.52 | % (d) | ||||||
Portfolio turnover rate (e) | 18 | % (f) | ||||||
| (a) | Prior to August 31, 2010, the ALPS | WMC Value Intersection Fund was known as the Activa Value Fund. |
| (b) | Less than $(0.005) per share. |
| (c) | Total returns are for the period indicated and have not been annualized. Total returns would have been lower had ceratin expenses not been waived during the period. Returns shown do not reflect the deduction of taxes that a shareholder would pay on Fund distributions or the redemption of Fund shares. |
| (d) | Annualized. |
| (e) | Portfolio turnover rate for periods less than one full year have not been annualized. |
| (f) | Portfolio turnover rate is calculated at the Fund Level and represents the six months ended October 31, 2010. |
See Notes to Financial Statements.
70 | October 31, 2010
Table of Contents
| Financial Highlights | ||||||
Selected data for a share of beneficial interest outstanding throughout the periods indicated: | ||||||
| ALPS | WMC Value Intersection Fund (a) [Class I] (b) | ||||||||||||||||||||||||||||||
| For the Six Months Ended October 31, 2010 | For the Period January 1, 2010 through | For the Year Ended December 31, | ||||||||||||||||||||||||||||
| (Unaudited) | April 30, 2010 (c) | 2009 | 2008 | 2007 | 2006 | 2005 | ||||||||||||||||||||||||
Net asset value, beginning of period | $ | 7.48 | $ | 6.96 | $ | 5.89 | $ | 9.41 | $ | 9.86 | $ | 8.69 | $ | 8.10 | ||||||||||||||||
INCOME/(LOSS) FROM INVESTMENT OPERATIONS: |
| |||||||||||||||||||||||||||||
Net investment income | 0.04 | 0.02 | 0.07 | 0.09 | 0.15 | 0.14 | 0.10 | |||||||||||||||||||||||
Net realized and unrealized gain/(loss) | (0.12 | ) | 0.50 | 1.08 | (3.52 | ) | 0.10 | 1.50 | 0.59 | |||||||||||||||||||||
Total from investment operations | (0.08 | ) | 0.52 | 1.15 | (3.43 | ) | 0.25 | 1.64 | 0.69 | |||||||||||||||||||||
DISTRIBUTIONS: | ||||||||||||||||||||||||||||||
From net investment income | – | – | (0.08 | ) | (0.09 | ) | (0.15 | ) | (0.14 | ) | (0.10 | ) | ||||||||||||||||||
From net realized gains | – | – | – | – | (0.55 | ) | (0.33 | ) | – | |||||||||||||||||||||
Total distributions | – | – | (0.08 | ) | (0.09 | ) | (0.70 | ) | (0.47 | ) | (0.10 | ) | ||||||||||||||||||
Net increase/(decrease) in net asset value | (0.08 | ) | 0.52 | 1.07 | (3.52 | ) | (0.45 | ) | 1.17 | 0.59 | ||||||||||||||||||||
Net asset value, end of period | $ | 7.40 | $ | 7.48 | $ | 6.96 | $ | 5.89 | $ | 9.41 | $ | 9.86 | $ | 8.69 | ||||||||||||||||
TOTAL RETURN (d) | (1.07 | )% | 7.47 | % | 19.59 | % | (36.38 | )% | 2.59 | % | 18.89 | % | 8.52 | % | ||||||||||||||||
RATIOS/SUPPLEMENTAL DATA: | ||||||||||||||||||||||||||||||
Net assets, end of period (000s) | $ | 15,033 | $ | 16,814 | $ | 16,465 | $ | 3,658 | $ | 5,422 | $ | 4,956 | $ | 4,264 | ||||||||||||||||
Ratio of net investment income to average net assets | 1.16 | % (e) | 0.77 | % (e) | 1.17 | % | 1.3 | % | 1.4 | % | 1.4 | % | 1.2 | % | ||||||||||||||||
Ratio of expenses to average net assets including fee waivers and reimbursements | 1.15 | % (e) | 1.15 | % (e) | 1.46 | % | 1.4 | % | 1.1 | % | 1.1 | % | 1.1 | % | ||||||||||||||||
Ratio of expenses to average net assets excluding fee waivers and reimbursements | 1.46 | % (e) | 1.49 | % (e) | N/A | N/A | N/A | N/A | N/A | |||||||||||||||||||||
Portfolio turnover rate (f) | 18 | % | 11 | % | 56 | % | 83 | % | 52 | % | 64 | % | 54 | % | ||||||||||||||||
| (a) | Prior to August 31, 2010, the ALPS | WMC Value Intersection Fund was known as the Activa Value Fund. |
| (b) | Prior to the close of business on August 28, 2009, Class I was known as Class R of the Predecessor Fund. |
| (c) | Effective March 9, 2010, the Board approved changing the fiscal year–end of the Fund from December 31 to April 30. |
| (d) | Total returns are for the period indicated and have not been annualized. Total returns would have been lower had ceratin expenses not been waived during the period. Returns shown do not reflect the deduction of taxes that a shareholder would pay on Fund distributions or the redemption of Fund shares. |
| (e) | Annualized. |
| (f) | Portfolio turnover rate for periods less than one full year have not been annualized. |
See Notes to Financial Statements.
71 | October 31, 2010
Table of Contents
| Financial Highlights | ||||||
Selected data for a share of beneficial interest outstanding throughout the periods indicated: | ||||||
| Clough China Fund [Class A] | ||||||||||||||||||||||||||
| For the Six Months Ended October 31, 2010 | For the Period August 1, 2009 through | For the Year Ended July 31, | For the Period December 30, 2005 (Inception) through | |||||||||||||||||||||||
| (Unaudited) | April 30, 2010 (a) | 2009 | 2008 | 2007 | July 31, 2006 | |||||||||||||||||||||
Net asset value, beginning of period | $ | 18.21 | $ | 16.32 | $ | 15.81 | $ | 22.46 | $ | 13.23 | $ | 10.00 | ||||||||||||||
INCOME/(LOSS) FROM INVESTMENT OPERATIONS: |
| |||||||||||||||||||||||||
Net investment income/(loss) | 0.14 | 0.10 | 0.09 | (b) | (0.01 | ) (b) | 0.06 | (b) | 0.01 | (b) | ||||||||||||||||
Net realized and unrealized gain/(loss) | 2.26 | 1.85 | 0.62 | (b)(c) | (1.73 | ) (b) | 9.59 | (b) | 3.22 | (b) | ||||||||||||||||
Total from investment operations | 2.40 | 1.95 | 0.71 | (1.74 | ) | 9.65 | 3.23 | |||||||||||||||||||
DISTRIBUTIONS: | ||||||||||||||||||||||||||
From net investment income | – | (0.07 | ) | (0.20 | ) | (0.03 | ) | (0.05 | ) | – | ||||||||||||||||
From net realized gains | – | – | – | (4.88 | ) | (0.37 | ) | – | ||||||||||||||||||
Total distributions | – | (0.07 | ) | (0.20 | ) | (4.91 | ) | (0.42 | ) | – | ||||||||||||||||
REDEMPTION FEES ADDED TO PAID-IN CAPITAL | 0.00 | (d) | 0.01 | 0.00 | (d) | – | – | – | ||||||||||||||||||
Net increase/(decrease) in net asset value | 2.40 | 1.89 | 0.51 | (6.65 | ) | 9.23 | 3.23 | |||||||||||||||||||
Net asset value, end of period | $ | 20.61 | $ | 18.21 | $ | 16.32 | $ | 15.81 | $ | 22.46 | $ | 13.23 | ||||||||||||||
TOTAL RETURN (e) | 13.18 | % | 12.07 | % | 5.00 | % (c) | (13.91 | )% | 73.81 | % | 32.30 | % | ||||||||||||||
RATIOS/SUPPLEMENTAL DATA: |
| |||||||||||||||||||||||||
Net assets, end of period (000s) | $ | 45,088 | $ | 28,695 | $ | 15,069 | $ | 17,927 | $ | 25,976 | $ | 2,532 | ||||||||||||||
Ratio of net investment income/ (loss) to average net assets | 1.02 | % (f) | (0.53 | )% (f) | 0.70 | % | (0.06 | )% | 0.31 | % | 0.12 | % (f) | ||||||||||||||
Ratio of expenses to average net assets including fee waivers and reimbursements | 1.85 | % (f) | 1.87 | % (f)(g) | 1.95 | % | 2.02 | % | 2.10 | % | 2.10 | % (f) | ||||||||||||||
Ratio of expenses to average net assets excluding fee waivers and reimbursements | 2.07 | % (f) | 2.24 | % (f) | 2.62 | % | 2.34 | % | 2.42 | % | 6.65 | % (f) | ||||||||||||||
Portfolio turnover rate (h) | 63 | % | 110 | % | 120 | % | 178 | % | 193 | % | 51 | % | ||||||||||||||
| (a) | Effective March 9, 2010, the Board approved changing the fiscal year end of the Fund from July 31 to April 30. |
| (b) | Per share numbers have been calculated using the average shares method. |
| (c) | Impact of payment by affiliate was less than $0.01 per share and 0.01%, respectively (See Note 1). |
| (d) | Less than $0.005 per share. |
| (e) | Total returns are for the period indicated and have not been annualized. Total returns would have been lower had certain expenses not been waived during the period. Returns shown do not reflect the deduction of taxes that a shareholder would pay on Fund distributions or the redemption of Fund shares. Returns shown exclude any applicable sales charges. |
| (f) | Annualized. |
| (g) | Effective January 1, 2010, the net expense ratio changed from 1.70% to 1.85%. Prior to January 1, 2010, the net expense ratio limitation was 1.95%. |
| (h) | Portfolio turnover rate for periods of less than one full year have not been annualized. |
See Notes to Financial Statements.
72 | October 31, 2010
Table of Contents
| Financial Highlights | ||||||
Selected data for a share of beneficial interest outstanding throughout the periods indicated: | ||||||
| Clough China Fund [Class C] | ||||||||||||||||||||||||
| For the Six Months Ended October 31, 2010 | For the Period August 1, 2009 through April 30, | For the Year Ended July 31 | For the Period December 30, 2005 (Inception) through | |||||||||||||||||||||
| (Unaudited) | 2010 (a) | 2009 | 2008 | 2007 | July 31, 2006 | |||||||||||||||||||
Net asset value, beginning of period | $ | 17.89 | $ | 16.08 | $ | 15.48 | $ | 2.26 | $ | 13.18 | $ | 10.00 | ||||||||||||
INCOME/(LOSS) FROM INVESTMENT OPERATIONS: |
| |||||||||||||||||||||||
Net investment income/(loss) | 0.59 | (0.17 | ) | (0.01 | ) (b) | (0.17) (b) | (0.06) (b) | (0.06) (b) | ||||||||||||||||
Net realized and unrealized gain/(loss) | 1.69 | 1.98 | 0.65 | (b)(c) | (1.64) (b) | 9.52 (b) | 3.24 (b) | |||||||||||||||||
Total from investment operations | 2.28 | 1.81 | 0.64 | (1.81) | 9.46 | 3.18 | ||||||||||||||||||
DISTRIBUTIONS: | ||||||||||||||||||||||||
From net investment income | – | – | (0.04 | ) | (0.09) | (0.02) | – | |||||||||||||||||
From net realized gains | – | – | – | (4.88) | (0.37) | – | ||||||||||||||||||
Total distributions | – | – | (0.04 | ) | (4.97) | (0.39) | – | |||||||||||||||||
REDEMPTION FEES ADDED TO PAID-IN CAPITAL (NOTE 3) | 0.00 | (d) | – | – | – | 0.01 | – | |||||||||||||||||
Net increase/(decrease) in net asset value | 2.28 | 1.81 | 0.60 | (6.78) | 9.08 | 3.18 | ||||||||||||||||||
Net asset value, end of period | $ | 20.17 | $ | 17.89 | $ | 16.08 | $ | 15.48 | $ | 22.26 | $ | 13.18 | ||||||||||||
TOTAL RETURN(e) | 12.74 | % | 11.26 | % | 4.21 | % (c) | (14.49 | )% | 76.27 | % | 31.80 | % | ||||||||||||
RATIOS/SUPPLEMENTAL DATA: |
| |||||||||||||||||||||||
Net assets, end of period (000s) | $ | 12,974 | $ | 7,594 | $ | 8,267 | $ | 9,991 | $ | 15,497 | $ | 793 | ||||||||||||
Ratio of net investment income/ (loss) to average net assets | 0.15 | % (f) | (1.26 | )% (f) | (0.05 | )% | (0.85 | )% | (0.33 | )% | (0.76 | )% (f) | ||||||||||||
Ratio of expenses to average net assets including fee waivers and reimbursements | 2.70 | % (f) | 2.70 | % (f) | 2.70 | % | 2.77 | % | 2.85 | % | 2.85 | % (f) | ||||||||||||
Ratio of expenses to average net assets excluding fee waivers and reimbursements | 2.87 | % (f) | 3.18 | % (f) | 3.43 | % | 3.15 | % | 3.33 | % | 11.53 | % (f) | ||||||||||||
Portfolio turnover rate (g) | 63 | % | 110 | % | 120 | % | 178 | % | 193 | % | 51 | % | ||||||||||||
| (a) | Effective March 9, 2010, the Board approved changing the fiscal year end of the Fund from July 31 to April 30. |
| (b) | Per share numbers have been calculated using the average shares method. |
| (c) | Impact of payment by affiliate was less than $0.01 per share and 0.01%, respectively (See Note 1). |
| (d) | Less than $0.005 per share. |
| (e) | Total returns are for the period indicated and have not been annualized. Total returns would have been lower had certain expenses not been waived during the period. Returns shown do not reflect the deduction of taxes that a shareholder would pay on Fund distributions or the redemption of Fund shares. |
| (f) | Annualized. |
| (g) | Portfolio turnover rate for periods of less than one full year have not been annualized. |
See Notes to Financial Statements.
73 | October 31, 2010
Table of Contents
| Financial Highlights | ||||||
Selected data for a share of beneficial interest outstanding throughout the periods indicated: | ||||||
| Clough China Fund [Class I] (a) | ||||||||||||||||||||||||
| For the Six Months Ended October 31, 2010 | For the Period August 1, 2009 through April 30, 2010 (b) | For the Year Ended July 31, | For the Period December 30, 2005 (Inception) through July 31, 2006 | |||||||||||||||||||||
| (Unaudited) | 2009 | 2008 | 2007 | |||||||||||||||||||||
Net asset value, beginning of period | $ | 18.41 | $ | 16.52 | $ | 16.10 | $ | 22.65 | $ | 13.27 | $ | 10.00 | ||||||||||||
INCOME/(LOSS) FROM INVESTMENT OPERATIONS: |
| |||||||||||||||||||||||
Net investment income | 0.12 (c) | 0.01 | 0.15 (c) | 0.13 (c) | 0.19 (c) | 0.08 (c) | ||||||||||||||||||
Net realized and unrealized | 2.36 (c) | 2.03 | 0.60 (c)(d) | (1.80) (c) | 9.63 (c) | 3.19 (c) | ||||||||||||||||||
Total from investment operations | 2.48 | 2.04 | 0.75 | (1.67) | 9.82 | 3.27 | ||||||||||||||||||
DISTRIBUTIONS: | ||||||||||||||||||||||||
From net investment income | – | (0.15) | (0.33) | – | (0.07) | – | ||||||||||||||||||
From net realized gains | – | – | – | (4.88) | (0.37) | – | ||||||||||||||||||
Total distributions | – | (0.15) | (0.33) | (4.88) | (0.44) | – | ||||||||||||||||||
REDEMPTION FEES ADDED TO PAID-IN CAPITAL (NOTE 3) | 0.00 | (e) | – | – | – | – | – | |||||||||||||||||
Net increase/(decrease) in net asset value | 2.48 | 1.89 | 0.42 | (6.55) | 9.38 | 3.27 | ||||||||||||||||||
Net asset value, end of period | $ | 20.89 | $ | 18.41 | $ | 16.52 | $ | 16.10 | $ | 22.65 | $ | 13.27 | ||||||||||||
TOTAL RETURN (f) | 13.47 | % | 12.36 | % | 5.51 | % (d) | (13.41 | )% | 74.91 | % | 32.70 | % | ||||||||||||
RATIOS/SUPPLEMENTAL DATA: | ||||||||||||||||||||||||
Net assets, end of period (000s) | $ | 34,169 | $ | 15,071 | $ | 9,744 | $9,231 | $ | 22,303 | $ | 12,622 | |||||||||||||
Ratio of net investment income | 1.30 | % (g) | 0.08 | % (g) | 1.20 | % | 0.62 | % | 1.06 | % | | 1.07 | % (g) | |||||||||||
Ratio of expenses to average net | 1.40 | % (g) | 1.40 | % (g) | 1.40 | % | 1.47 | % | 1.55 | % | | 1.55 | % (g) | |||||||||||
Ratio of expenses to average net | 1.80 | % (g) | 1.86 | % (g) | 1.97 | % | 1.76 | % | 1.75 | % | | 2.58 | % (g) | |||||||||||
Portfolio turnover rate (g) | 63 | % | 110 | % | 120 | % | 178 | % | 193 | % | 51 | % | ||||||||||||
| (a) | Prior to the close of business on January 15, 2010, Class I of the Clough China Fund was known as Institutional Class of the Predecessor Fund. |
| (b) | Effective March 9, 2010, the Board approved changing the fiscal year end of the Fund from July 31 to April 30. |
| (c) | Per share numbers have been calculated using the average shares method. |
| (d) | Impact of payment by affiliate was less than $0.01 per share and 0.01%, respectively (See Note 1). |
| (e) | Less than $0.005 per share. |
| (f) | Total returns are for the period indicated and have not been annualized. Total returns would have been lower had certain expenses not been waived during the period. Returns shown do not reflect the deduction of taxes that a shareholder would pay on Fund distributions or the redemption of Fund shares. |
| (g) | Annualized. |
| (h) | Portfolio turnover rate for periods of less than one full year have not been annualized. |
See Notes to Financial Statements.
74 | October 31, 2010
Table of Contents
| Financial Highlights | ||||||
Selected data for a share of beneficial interest outstanding throughout the period indicated: | ||||||
| Jefferies Asset Management Commodity Strategy Allocation Fund [Class A] | ||||||||
| For the Period June 29, 2010 through October 31, 2010 (Unaudited) | ||||||||
Net asset value, beginning of period | $ 10.00 | |||||||
INCOME/(LOSS) FROM INVESTMENT OPERATIONS: | ||||||||
Net investment loss | (0.34 | ) | ||||||
Net realized and unrealized gain | 1.60 | |||||||
Total from investment operations | 1.26 | |||||||
DISTRIBUTIONS: | ||||||||
From net investment income | 0.33 | |||||||
Total distributions | 0.33 | |||||||
REDEMPTION FEES ADDED TO PAID IN-CAPITAL (NOTE 3) | 0.00 | (a) | ||||||
Net increase in net asset value | 1.59 | |||||||
Net asset value, end of period | $ 11.59 | |||||||
TOTAL RETURN (b) | 19.37 | % | ||||||
RATIOS/SUPPLEMENTAL DATA: | ||||||||
Net assets, end of period (000s) | $ 3,692 | |||||||
Ratio of net investment loss to average net assets | (0.48 | )% (c) | ||||||
Ratio of expenses to average net assets including fee waivers and reimbursements | 1.45 | % (c) | ||||||
Ratio of expenses to average net assets excluding fee waivers and reimbursements | 6.96 | % (c) | ||||||
Portfolio turnover rate (d) | 2 | % | ||||||
| (a) | Less than $0.005 per share. |
| (b) | Total returns are for the period indicated and have not been annualized. Total returns would have been lower had ceratin expenses not been waived during the period. Returns shown do not reflect the deduction of taxes that a shareholder would pay on Fund distributions or the redemption of Fund shares. Returns shown exclude any applicable sales charges. |
| (c) | Annualized. |
| (d) | Portfolio turnover rate for periods less than one full year have not been annualized. |
See Notes to Financial Statements.
75 | October 31, 2010
Table of Contents
| Financial Highlights | ||||||
Selected data for a share of beneficial interest outstanding throughout the period indicated: | ||||||
| Jefferies Asset Management Commodity Strategy Allocation Fund [Class C] | ||||||||
| For the Period June 29, 2010 through October 31, 2010 (Unaudited) | ||||||||
Net asset value, beginning of period | $ | 10.00 | ||||||
INCOME/(LOSS) FROM INVESTMENT OPERATIONS: | ||||||||
Net investment loss | (0.36) | |||||||
Net realized and unrealized gain | 1.63 | |||||||
Total from investment operations | 1.27 | |||||||
DISTRIBUTIONS: | ||||||||
From net investment income | 0.33 | |||||||
Total distributions | 0.33 | |||||||
Net increase in net asset value | 1.60 | |||||||
Net asset value, end of period | $ | 11.60 | ||||||
TOTAL RETURN(a) | 19.49 | % | ||||||
RATIOS/SUPPLEMENTAL DATA: | ||||||||
Net assets, end of period (000s) | $ | 1,594 | ||||||
Ratio of net investment loss to average net assets | (0.97) | % (b) | ||||||
Ratio of expenses to average net assets including fee waivers and reimbursements | 2.05 | % (b) | ||||||
Ratio of expenses to average net assets excluding fee waivers and reimbursements | 7.64 | % (b) | ||||||
Portfolio turnover rate (c) | 2 | % | ||||||
| (a) | Total returns are for the period indicated and have not been annualized. Total returns would have been lower had ceratin expenses not been waived during the period. Returns shown do not reflect the deduction of taxes that a shareholder would pay on Fund distributions or the redemption of Fund shares. |
| (b) | Annualized. |
| (c) | Portfolio turnover rate for periods less than one full year have not been annualized. |
See Notes to Financial Statements.
76 | October 31, 2010
Table of Contents
| Financial Highlights | ||||||
Selected data for a share of beneficial interest outstanding throughout the period indicated: | ||||||
| Jefferies Asset Management Commodity Strategy Allocation Fund [Class I] | ||||||||
| For the Period June 29, 2010 through October 31, 2010 (Unaudited) | ||||||||
Net asset value, beginning of period | $ | 10.00 | ||||||
INCOME/(LOSS) FROM INVESTMENT OPERATIONS: | ||||||||
Net investment loss | (0.35) | |||||||
Net realized and unrealized gain | 1.60 | |||||||
Total from investment operations | 1.25 | |||||||
DISTRIBUTIONS: | ||||||||
From net investment income | 0.35 | |||||||
Total distributions | 0.35 | |||||||
Net increase in net asset value | 1.60 | |||||||
Net asset value, end of period | $11.60 | |||||||
TOTAL RETURN (a) | 19.66% | |||||||
RATIOS/SUPPLEMENTAL DATA: |
| |||||||
Net assets, end of period (000s) | $ | 6,170 | ||||||
Ratio of net investment loss to average net assets | (0.08)% (b) | |||||||
Ratio of expenses to average net assets including fee | 1.15% (b) | |||||||
Ratio of expenses to average net assets excluding fee | 6.73% (b) | |||||||
Portfolio turnover rate (c) | 2% | |||||||
| (a) | Total returns are for the period indicated and have not been annualized. Total returns would have been lower had ceratin expenses not been waived during the period. Returns shown do not reflect the deduction of taxes that a shareholder would pay on Fund distributions or the redemption of Fund shares. |
| (b) | Annualized. |
| (c) | Portfolio turnover rate for periods less than one full year have not been annualized. |
See Notes to Financial Statements.
77 | October 31, 2010
Table of Contents
| Financial Highlights | ||||||
Selected data for a share of beneficial interest outstanding throughout the period indicated: | ||||||
| RiverFront Long-Term Growth & Income Fund [Class A] | ||||||||
| For the Period August 2, 2010 through October 31, 2010 (Unaudited) | ||||||||
Net asset value, beginning of period | $ | 10.00 | ||||||
INCOME FROM INVESTMENT OPERATIONS: | ||||||||
Net investment income | 0.01 | |||||||
Net realized and unrealized gain | 0.61 | |||||||
Total from investment operations | 0.62 | |||||||
Net increase in net asset value | 0.62 | |||||||
Net asset value, end of period | $ | 10.62 | ||||||
TOTAL RETURN (a) | 6.20% | |||||||
RATIOS/SUPPLEMENTAL DATA: | ||||||||
Net assets, end of period (000s) | $ | 1,237 | ||||||
Ratio of net investment income to average net assets | 0.99% (b) | |||||||
Ratio of expenses to average net assets including fee waivers and reimbursements | 1.30% (b) | |||||||
Ratio of expenses to average net assets excluding fee waivers and reimbursements | 6.27% (b) | |||||||
Portfolio turnover rate (c) | 16% | |||||||
| (a) | Total returns are for the period indicated and have not been annualized. Total returns would have been lower had ceratin expenses not been waived during the period. Returns shown do not reflect the deduction of taxes that a shareholder would pay on Fund distributions or the redemption of Fund shares. Returns shown exclude any applicable sales charges. |
| (b) | Annualized. |
| (c) | Portfolio turnover rate for periods less than one full year have not been annualized. |
See Notes to Financial Statements.
78 | October 31, 2010
Table of Contents
| Financial Highlights | ||||||
Selected data for a share of beneficial interest outstanding throughout the period indicated: | ||||||
| RiverFront Long-Term Growth & Income Fund [Class C] | ||||||||
| For the Period August 2, 2010 through October 31, 2010 (Unaudited) | ||||||||
Net asset value, beginning of period | $ 10.00 | |||||||
INCOME FROM INVESTMENT OPERATIONS: | ||||||||
Net investment income | 0.00 (a) | |||||||
Net realized and unrealized gain | 0.60 | |||||||
Total from investment operations | 0.60 | |||||||
Net increase in net asset value | 0.60 | |||||||
Net asset value, end of period | $ 10.60 | |||||||
TOTAL RETURN (b) | 6.00% | |||||||
RATIOS/SUPPLEMENTAL DATA: | ||||||||
Net assets, end of period (000s) | $ 2,424 | |||||||
Ratio of net investment income to average net assets | 0.31% (c) | |||||||
Ratio of expenses to average net assets including fee waivers and reimbursements | 2.05% (c) | |||||||
Ratio of expenses to average net assets excluding fee waivers and reimbursements | 8.02% (c) | |||||||
Portfolio turnover rate (d) | 16% | |||||||
| (a) | Less than $0.005 per share. |
| (b) | Total returns are for the period indicated and have not been annualized. Total returns would have been lower had ceratin expenses not been waived during the period. Returns shown do not reflect the deduction of taxes that a shareholder would pay on Fund distributions or the redemption of Fund shares. |
| (c) | Annualized. |
| (d) | Portfolio turnover rate for periods less than one full year have not been annualized. |
See Notes to Financial Statements.
79 | October 31, 2010
Table of Contents
| Financial Highlights | ||||||
Selected data for a share of beneficial interest outstanding throughout the period indicated: | ||||||
| RiverFront Long-Term Growth & Income Fund [Class I] | ||||
| For the Period August 2, 2010 through October 31, 2010 (Unaudited) | ||||
Net asset value, beginning of period | $ | 10.00 | ||
INCOME FROM INVESTMENT OPERATIONS: | ||||
Net investment income | 0.02 | |||
Net realized and unrealized gain | 0.60 | |||
Total from investment operations | 0.62 | |||
Net increase in net asset value | 0.62 | |||
Net asset value, end of period | $ | 10.62 | ||
TOTAL RETURN (a) | 6.20% | |||
RATIOS/SUPPLEMENTAL DATA: | ||||
Net assets, end of period (000s) | $ | 386 | ||
Ratio of net investment income to average net assets | 1.30% (b) | |||
Ratio of expenses to average net assets including fee waivers and reimbursements | 1.04% (b) | |||
Ratio of expenses to average net assets excluding fee waivers and reimbursements | 14.46% (b) | |||
Portfolio turnover rate (c) | 16% | |||
| (a) | Total returns are for the period indicated and have not been annualized. Total returns would have been lower had ceratin expenses not been waived during the period. Returns shown do not reflect the deduction of taxes that a shareholder would pay on Fund distributions or the redemption of Fund shares. |
| (b) | Annualized. |
| (c) | Portfolio turnover rate for periods less than one full year have not been annualized. |
See Notes to Financial Statements.
80 | October 31, 2010
Table of Contents
| Financial Highlights | ||||||
Selected data for a share of beneficial interest outstanding throughout the period indicated: | ||||||
| RiverFront Moderate Growth Fund [Class A] | ||||||||
| For the Period August 2, 2010 through October 31, 2010 (Unaudited) | ||||||||
Net asset value, beginning of period | $ 10.00 | |||||||
INCOME FROM INVESTMENT OPERATIONS: | ||||||||
Net investment income | 0.00 (a) | |||||||
Net realized and unrealized gain | 0.57 | |||||||
Total from investment operations | 0.57 | |||||||
Net increase in net asset value | 0.57 | |||||||
Net asset value, end of period | $ 10.57 | |||||||
TOTAL RETURN (b) | 5.70% | |||||||
RATIOS/SUPPLEMENTAL DATA: | ||||||||
Net assets, end of period (000s) | $ 1,319 | |||||||
Ratio of net investment income to average net assets | 0.29% (c) | |||||||
Ratio of expenses to average net assets including fee waivers and reimbursements | 1.30% (c) | |||||||
Ratio of expenses to average net assets excluding fee waivers and reimbursements | 10.76% (c) | |||||||
Portfolio turnover rate (d) | 15% | |||||||
| (a) | Less than $0.005 per share. |
| (b) | Total returns are for the period indicated and have not been annualized. Total returns would have been lower had ceratin expenses not been waived during the period. Returns shown do not reflect the deduction of taxes that a shareholder would pay on Fund distributions or the redemption of Fund shares. Returns shown exclude any applicable sales charges. |
| (c) | Annualized. |
| (d) | Portfolio turnover rate for periods less than one full year have not been annualized. |
See Notes to Financial Statements.
81 | October 31, 2010
Table of Contents
| Financial Highlights | ||||||
Selected data for a share of beneficial interest outstanding throughout the period indicated: | ||||||
| RiverFront Moderate Growth Fund [Class C] | ||||||||
| For the Period August 2, 2010 through October 31, 2010 (Unaudited) | ||||||||
Net asset value, beginning of period | $ 10.00 | |||||||
INCOME FROM INVESTMENT OPERATIONS: | ||||||||
Net investment loss | (0.00 | ) (a) | ||||||
Net realized and unrealized gain | 0.55 | |||||||
Total from investment operations | 0.55 | |||||||
Net increase in net asset value | 0.55 | |||||||
Net asset value, end of period | $ 10.55 | |||||||
TOTAL RETURN (b) | 5.50% | |||||||
RATIOS/SUPPLEMENTAL DATA: | ||||||||
Net assets, end of period (000s) | $ 954 | |||||||
Ratio of net investment loss to average net assets | (0.62) | % (c) | ||||||
Ratio of expenses to average net assets including fee waivers and reimbursements | 2.05 | % (c) | ||||||
Ratio of expenses to average net assets excluding fee waivers and reimbursements | 6.84 | % (c) | ||||||
Portfolio turnover rate (d) | 15 | % | ||||||
| (a) | Less than $(0.005) per share. |
| (b) | Total returns are for the period indicated and have not been annualized. Total returns would have been lower had ceratin expenses not been waived during the period. Returns shown do not reflect the deduction of taxes that a shareholder would pay on Fund distributions or the redemption of Fund shares. |
| (c) | Annualized. |
| (d) | Portfolio turnover rate for periods less than one full year have not been annualized. |
See Notes to Financial Statements.
82 | October 31, 2010
Table of Contents
| Financial Highlights | ||||||
Selected data for a share of beneficial interest outstanding throughout the period indicated: | ||||||
| RiverFront Moderate Growth Fund [Class I] | ||||||||
| For the Period August 2, 2010 through October 31, 2010 (Unaudited) | ||||||||
Net asset value, beginning of period | $ | 10.00 | ||||||
INCOME FROM INVESTMENT OPERATIONS: | ||||||||
Net investment income | 0.01 | |||||||
Net realized and unrealized gain | 0.56 | |||||||
Total from investment operations | 0.57 | |||||||
Net increase in net asset value | 0.57 | |||||||
Net asset value, end of period | $ | 10.57 | ||||||
TOTAL RETURN (a) | 5.70% | |||||||
RATIOS/SUPPLEMENTAL DATA: | ||||||||
Net assets, end of period (000s) | $ | 208 | ||||||
Ratio of net investment income to average net assets | 0.48% (b) | |||||||
Ratio of expenses to average net assets including fee waivers and reimbursements | 1.05% (b) | |||||||
Ratio of expenses to average net assets excluding fee waivers and reimbursements | 28.64% (b) | |||||||
Portfolio turnover rate(c) | 15% | |||||||
| (a) | Total returns are for the period indicated and have not been annualized. Total returns would have been lower had ceratin expenses not been waived during the period. Returns shown do not reflect the deduction of taxes that a shareholder would pay on Fund distributions or the redemption of Fund shares. |
| (b) | Annualized. |
| (c) | Portfolio turnover rate for periods less than one full year have not been annualized. |
See Notes to Financial Statements.
83 | October 31, 2010
Table of Contents
| Financial Highlights | ||||||
Selected data for a share of beneficial interest outstanding throughout the period indicated: | ||||||
| RiverFront Moderate Growth & Income Fund [Class A] | ||||||||
| For the Period August 2, 2010 through October 31, 2010 (Unaudited) | ||||||||
Net asset value, beginning of period | $ | 10.00 | ||||||
INCOME FROM INVESTMENT OPERATIONS: | ||||||||
Net investment income | 0.01 | |||||||
Net realized and unrealized gain | 0.36 | |||||||
Total from investment operations | 0.37 | |||||||
Net increase in net asset value | 0.37 | |||||||
Net asset value, end of period | $ | 10.37 | ||||||
TOTAL RETURN (a) | 3.70% | |||||||
RATIOS/SUPPLEMENTAL DATA: | ||||||||
Net assets, end of period (000s) | $ | 2,840 | ||||||
Ratio of net investment income to average net assets | 1.14% (b) | |||||||
Ratio of expenses to average net assets including fee waivers and reimbursements | 1.30% (b) | |||||||
Ratio of expenses to average net assets excluding fee waivers and reimbursements | 2.36% (b) | |||||||
Portfolio turnover rate (c) | 16% | |||||||
| (a) | Total returns are for the period indicated and have not been annualized. Total returns would have been lower had ceratin expenses not been waived during the period. Returns shown do not reflect the deduction of taxes that a shareholder would pay on Fund distributions or the redemption of Fund shares. Returns shown exclude any applicable sales charges. |
| (b) | Annualized. |
| (c) | Portfolio turnover rate for periods less than one full year have not been annualized. |
See Notes to Financial Statements.
84 | October 31, 2010
Table of Contents
| Financial Highlights | ||||||
Selected data for a share of beneficial interest outstanding throughout the period indicated: | ||||||
| RiverFront Moderate Growth & Income Fund [Class C] | ||||||||
| For the Period August 2, 2010 through October 31, 2010 (Unaudited) | ||||||||
Net asset value, beginning of period | $ | 10.00 | ||||||
INCOME FROM INVESTMENT OPERATIONS: | ||||||||
Net investment income | 0.01 | |||||||
Net realized and unrealized gain | 0.35 | |||||||
Total from investment operations | 0.36 | |||||||
Net increase in net asset value | 0.36 | |||||||
Net asset value, end of period | $ | 10.36 | ||||||
TOTAL RETURN (a) | 3.60% | |||||||
RATIOS/SUPPLEMENTAL DATA: | ||||||||
Net assets, end of period (000s) | $ | 8,352 | ||||||
Ratio of net investment income to average net assets | 0.51% (b) | |||||||
Ratio of expenses to average net assets including fee waivers and reimbursements | 2.05% (b) | |||||||
Ratio of expenses to average net assets excluding fee waivers and reimbursements | 4.22% (b) | |||||||
Portfolio turnover rate (c) | 16% | |||||||
| (a) | Total returns are for the period indicated and have not been annualized. Total returns would have been lower had ceratin expenses not been waived during the period. Returns shown do not reflect the deduction of taxes that a shareholder would pay on Fund distributions or the redemption of Fund shares. |
| (b) | Annualized. |
| (c) | Portfolio turnover rate for periods less than one full year have not been annualized. |
See Notes to Financial Statements.
85 | October 31, 2010
Table of Contents
| Financial Highlights | ||||||
Selected data for a share of beneficial interest outstanding throughout the period indicated: | ||||||
| RiverFront Moderate Growth & Income Fund [Class I] | ||||||||
| For the Period August 2, 2010 through October 31, 2010 (Unaudited) | ||||||||
Net asset value, beginning of period | $ | 10.00 | ||||||
INCOME FROM INVESTMENT OPERATIONS: | ||||||||
Net investment income | 0.02 | |||||||
Net realized and unrealized gain | 0.36 | |||||||
Total from investment operations | 0.38 | |||||||
Net increase in net asset value | 0.38 | |||||||
Net asset value, end of period | $ | 10.38 | ||||||
TOTAL RETURN (a) | 3.80% | |||||||
RATIOS/SUPPLEMENTAL DATA: | ||||||||
Net assets, end of period (000s) | $ | 2,219 | ||||||
Ratio of net investment income to average net assets | 1.46% (b) | |||||||
Ratio of expenses to average net assets including fee waivers and reimbursements | 1.05% (b) | |||||||
Ratio of expenses to average net assets excluding fee waivers and reimbursements | 3.54% (b) | |||||||
Portfolio turnover rate (c) | 16% | |||||||
| (a) | Total returns are for the period indicated and have not been annualized. Total returns would have been lower had ceratin expenses not been waived during the period. Returns shown do not reflect the deduction of taxes that a shareholder would pay on Fund distributions or the redemption of Fund shares. |
| (b) | Annualized. |
| (c) | Portfolio turnover rate for periods less than one full year have not been annualized. |
See Notes to Financial Statements.
86 | October 31, 2010
Table of Contents
| Notes to Financial Statements | ||||||
October 31, 2010 (Unaudited) | ||||||
| 1. | ORGANIZATION AND SIGNIFICANT ACCOUNTING POLICIES |
Financial Investors Trust (the “Trust”) was organized as a Delaware statutory trust on November 30, 1993 and registered as an open-end management investment company under the Investment Company Act of 1940, as amended (“1940 Act”). ALPS | GNI Long-Short Fund, ALPS | Red Rocks Listed Private Equity Fund, ALPS | WMC Value Intersection Fund (formerly Activa Value Fund), Clough China Fund, Jefferies Asset Management Commodity Strategy Allocation Fund, RiverFront Long-Term Growth & Income Fund, RiverFront Moderate Growth Fund, and RiverFront Moderate Growth & Income Fund (each, a “Fund” and collectively, the “Funds”) are eight of eleven separate series offered to the public under the Trust as of October 31, 2010. The Trust offers eleven Funds which include multiple series of shares, with differing investment objectives and policies. Each class within a Fund differs as to sales and redemption charges and ongoing fees. All classes of shares have identical rights to earnings, assets and voting privileges, except for class-specific expenses and exclusive rights to vote on matters affecting only individual classes. Class A shares of each Fund are subject to an initial sales charge of up to 5.50%. Class A shares and Class C shares of each Fund, as applicable, for which no initial sales charge was paid are subject to a contingent deferred sales charge of 1% if the shares are sold within twelve months after a purchase in excess of $1 million.
On December 31, 2007, ALPS | Red Rocks Listed Private Equity Fund commenced operations.
On August 29, 2009, Activa Value Fund (“predecessor Activa Fund”) a series of the Activa Mutual Funds Trust, participated in a tax-free reorganization. Through the reorganization, the predecessor Activa Fund merged into the newly created ALPS | WMC Value Intersection Fund series of the Trust. The ALPS | WMC Value Intersection Fund has carried over the historic performance and financial statements of the predecessor Activa Fund. The predecessor Activa Fund commenced operations on August 10, 1971.
On November 2, 2009, ALPS | GNI Long-Short Fund commenced operations.
On January 16, 2010, Old Mutual China Fund (“predecessor China Fund”), a series of the Old Mutual Funds I, participated in a tax-free reorganization. Through the reorganization, the predecessor China Fund merged into the newly created Clough China Fund series of the Trust. The Clough China Fund has carried over the historic performance and financial statements of the predecessor China Fund. The predecessor China Fund commenced operations on December 30, 2005.
On June 29, 2010, Jefferies Asset Management Commodity Strategy Allocation Fund commenced operations.
On August 2, 2010, RiverFront Long-Term Growth & Income Fund, RiverFront Moderate Growth Fund, and RiverFront Moderate Growth & Income Fund commenced operations.
Basis for Consolidation for the Jefferies Asset Management Commodity Strategy Allocation Fund
Jefferies Asset Management Cayman Commodity Fund Ltd. (the “Subsidiary”), a Cayman Islands exempted company, was incorporated on April 23, 2010 and is currently a wholly owned subsidiary of the Jefferies Asset Management Commodity Strategy Fund. The Subsidiary acts as an investment vehicle for the Fund in order to effect certain investments on behalf of the Fund. The Fund is the sole shareholder of the Subsidiary pursuant to a subscription agreement dated as of June 14, 2010, and it is intended that the Fund will remain the sole shareholder and will continue to control the Subsidiary. Under the Articles of Association of the Subsidiary, shares issued by the Subsidiary confer upon a shareholder the right to vote at general meetings of the Subsidiary and certain rights in connection with any winding-up or repayment of capital, as well as the right to participate in the profits or assets of the Subsidiary. The Fund may invest up to 25% of its total assets in shares of the Subsidiary. The Subsidiary offers to redeem all or a portion of its shares at the current net asset value per share every regular business day. The Subsidiary prices its portfolio investments pursuant to the same pricing and valuation methodologies and procedures used by the Fund, which require, among other things, that each of the Subsidiary’s portfolio investments be marked-to-market (that is, the value on the Subsidiary’s books changes) each business day to reflect changes in the market value of each investment. The value of shares of the Subsidiary fluctuates with the value of the Subsidiary’s portfolio investments.
The following is a summary of significant accounting policies consistently followed by each Fund in the preparation of its financial statements. The policies are in conformity with accounting principles generally accepted in the United States of America for investment companies.
Investment Valuation: The Board of Trustees (“Board” or “Trustees”) of the Trust has approved procedures to be used to value the Funds’ securities for the purposes of determining the Funds’ net asset value (“NAV”). The valuation of the securities of the Funds is determined in good faith by or under the direction of the Board. The Board has delegated certain valuation functions for the Funds to ALPS Fund Services, Inc. (“ALPS” or the “Administrator”).
Each Fund generally values its investments based on market prices determined at the close of regular trading on the New York Stock Exchange (“NYSE”) (normally, 4:00 p.m. Eastern
87 | October 31, 2010
Table of Contents
| Notes to Financial Statements | ||||||
October 31, 2010 (Unaudited) | ||||||
time) on each business day (Monday through Friday). None of the Funds values their securities on any day that the NYSE is closed, including the following observed holidays: New Year’s Day, Martin Luther King, Jr. Day, Presidents’ Day, Good Friday, Memorial Day, Independence Day, Labor Day, Thanksgiving Day and Christmas Day, and the preceding Friday or subsequent Monday when one of those holidays falls on a Saturday or Sunday, respectively.
The Funds’ currency valuations, if any, are done as of the close of regularly scheduled trading on the NYSE (normally, 4:00 p.m. Eastern time). For equity securities that are traded on an exchange, the market price is usually the closing sale or official closing price on that exchange. In the case of securities not traded on an exchange, or if such closing prices are not otherwise available, the market price is typically determined by independent third-party pricing vendors approved by the Board using a variety of pricing techniques and methodologies. The market price for debt obligations is generally the price supplied by an independent third-party pricing service approved by the Board, which may use a matrix, formula or other objective method that takes into consideration market indices, yield curves and other specific adjustments. Short-term debt obligations that will mature in 60 days or less are valued at amortized cost, unless it is determined that using this method would not reflect an investment’s fair value. If vendors are unable to supply a price, or if the price supplied is deemed to be unreliable, the market price may be determined using quotations received from one or more brokers/dealers that make a market in the security. Investments in other mutual funds are calculated at their respective net asset values as determined by those funds in accordance with the 1940 Act.
When such prices or quotations are not available, or when the Fair Value Committee appointed by the Board believes that they are unreliable, securities may be priced using fair value procedures approved by the Board. Because the Funds may invest in securities that may be thinly traded or for which market quotations may not be readily available or may be unreliable (such as securities of small capitalization companies), the Funds may use fair valuation procedures more frequently than funds that invest primarily in securities that are more liquid (such as equity securities of large-capitalization domestic issuers). The Funds may also use fair value procedures if the Fair Value Committee determines that a significant event has occurred between the time at which a market price is determined and the time at which a Fund’s net asset value is calculated. In particular, the value of non-U.S. securities may be materially affected by events occurring after the close of the market on which they are traded, but before the Fund prices its shares.
The Funds may determine the fair value of investments based on information provided by pricing services and other
third-party vendors, which may recommend fair value prices or adjustments with reference to other securities, indices or assets. In considering whether fair value pricing is required and in determining fair values, the Funds may, among other things, consider significant events (which may be considered to include changes in the value of U.S. securities or securities indices) that occur after the close of the relevant market and before a Fund values its securities. In addition, the Funds may utilize modeling tools provided by third-party vendors to determine fair values of non-U.S. securities. The Funds’ use of fair value pricing may help deter “stale price arbitrage.”
Valuing securities at fair value involves greater reliance on judgment than valuation of securities based on readily available market quotations. A fund that uses fair value to price securities may value those securities higher or lower than another fund using market quotations or its own fair value methodologies to price the same securities. There can be no assurance that the Fund could obtain the fair value assigned to a security if it were to sell the security at approximately the time at which the Fund determines its net asset value, and the difference between fair value and the price of the securities may be material.
Fair Value Measurements: A three-tier hierarchy has been established to classify fair value measurements for disclosure purposes. Inputs refer broadly to the assumptions that market participants would use in pricing the asset or liability, including assumptions about risk. Inputs may be observable or unobservable. Observable inputs are inputs that reflect the assumptions market participants would use in pricing the asset or liability that are developed based on market data obtained from sources independent of the reporting entity. Unobservable inputs are inputs that reflect the reporting entity’s own assumptions about the assumptions market participants would use in pricing the asset or liability that are developed based on the best information available.
Various inputs are used in determining the value of each Fund’s investments as of the reporting period end. The designated input levels are not necessarily an indication of the risk or liquidity associated with these investments. These inputs are categorized in the following hierarchy under applicable financial accounting standards:
| » | Level 1 – Unadjusted quoted prices in active markets for identical investments |
| » | Level 2 – Other significant observable inputs (including quoted prices for similar investments, interest rates, prepayment speeds, credit risk, etc.) |
| » | Level 3 – Significant unobservable inputs (including the Fund’s own assumptions in determining the fair value of investments) |
88 | October 31, 2010
Table of Contents
| Notes to Financial Statements | ||||||
October 31, 2010 (Unaudited) | ||||||
The following is a summary of the inputs used to value each Fund’s investments as of October 31, 2010.
| Investments in Securities at Value | Level 1 - Quoted Prices | Level 2 - Other Significant Observable Inputs | Level 3 - Significant Unobservable Inputs | Total | ||||||||||||
ALPS | GNI Long-Short Fund |
| |||||||||||||||
Common Stocks (a) | $ | 6,195,355 | $ | – | $ | – | $ | 6,195,355 | ||||||||
Exchange Traded Funds | 431,080 | – | – | 431,080 | ||||||||||||
Purchased Put Options | 414,700 | – | – | 414,700 | ||||||||||||
Short Term Investments | 2,538,582 | – | – | 2,538,582 | ||||||||||||
TOTAL | $ | 9,579,717 | $ | – | $ | – | $ | 9,579,717 | ||||||||
Other Financial Instruments |
| |||||||||||||||
Liabilities: | ||||||||||||||||
Put Options Written | $ | (102,600 | ) | $ | – | $ | – | $ | (102,600 | ) | ||||||
Securities Sold Short | (2,362,992 | ) | – | – | (2,362,992 | ) | ||||||||||
TOTAL | $ | (2,465,592 | ) | $ | – | $ | – | $ | (2,465,592 | ) | ||||||
ALPS | Red Rocks Listed Private Equity Fund |
| |||||||||||||||
Common Stocks (a) | $ | 135,594,467 | $ | – | $ | – | $ | 135,594,467 | ||||||||
Short Term Investments | 961,958 | – | – | 961,958 | ||||||||||||
TOTAL | $ | 136,556,425 | $ | – | $ | – | $ | 136,556,425 | ||||||||
ALPS | WMC Value Intersection Fund |
| |||||||||||||||
Common Stocks (a) | $ | 56,752,780 | $ | – | $ | – | $ | 56,752,780 | ||||||||
Short Term Investments | 292,498 | – | – | 292,498 | ||||||||||||
TOTAL | $ | 57,045,278 | $ | – | $ | – | $ | 57,045,278 | ||||||||
Clough China Fund |
| |||||||||||||||
Common Stocks – Consumer | ||||||||||||||||
Discretionary | $ | 3,561 | $ | 17,190,180 | $ | – | $ | 17,193,741 | ||||||||
Common Stocks – Financials | 2,085,772 | 18,542,245 | – | 20,628,017 | ||||||||||||
Common Stocks – Industrials | 972,215 | 12,836,343 | – | 13,808,558 | ||||||||||||
Common Stocks – Information Technology | 692,672 | 5,789,280 | – | 6,481,952 | ||||||||||||
Common Stocks – Materials | 1,037,407 | 4,681,371 | 5,718,778 | |||||||||||||
Other Common Stocks (a) | – | 20,335,775 | – | 20,335,775 | ||||||||||||
Short Term Investments | 9,650,800 | – | – | 9,650,800 | ||||||||||||
TOTAL | $ | 14,442,427 | $ | 79,375,194 | $ | – | $ | 93,817,621 | ||||||||
Jefferies Asset Management Commodity Strategy Allocation Fund |
| |||||||||||||||
Common Stocks (a) | $ | 2,814,927 | $ | – | $ | – | $ | 2,814,927 | ||||||||
Warrant | 81 | – | – | 81 | ||||||||||||
Government Bonds | – | 7,880,091 | – | 7,880,091 | ||||||||||||
TOTAL | $ | 2,815,008 | $ | 7,880,091 | $ | – | $ | 10,695,099 | ||||||||
Other Financial Instruments |
| |||||||||||||||
Assets: | ||||||||||||||||
Total Return Swap Contracts | $ | – | $ | 327,912 | $ | – | $ | 327,912 | ||||||||
TOTAL | $ | – | $ | 327,912 | $ | – | $ | 327,912 | ||||||||
RiverFront Long–Term Growth & Income Fund |
| |||||||||||||||
Common Stocks (a) | $ | 1,345,700 | $ | – | $ | – | $ | 1,345,700 | ||||||||
Exchange Traded Funds | 2,076,904 | – | – | 2,076,904 | ||||||||||||
Exchange Traded Notes | 193,710 | – | – | 193,710 | ||||||||||||
Short Term Investments | 330,460 | – | – | 330,460 | ||||||||||||
TOTAL | $ | 3,946,774 | $ | – | $ | – | $ | 3,946,774 | ||||||||
89 | October 31, 2010
Table of Contents
| Notes to Financial Statements | ||||||
October 31, 2010 (Unaudited) | ||||||
| Investments in Securities at Value | Level 1 - Quoted Prices | Level 2 - Other Significant Observable Inputs | Level 3 - Significant Unobservable Inputs | Total | ||||||||||||
RiverFront Moderate Growth Fund |
| |||||||||||||||
Common Stocks (a) | $ | 615,262 | $ | – | $ | – | $ | 615,262 | ||||||||
Exchange Traded Funds | 1,287,015 | – | – | 1,287,015 | ||||||||||||
Exchange Traded Notes | 80,756 | – | – | 80,756 | ||||||||||||
Short Term Investments | 262,398 | – | – | 262,398 | ||||||||||||
TOTAL | $ | 2,245,431 | $ | – | $ | – | $ | 2,245,431 | ||||||||
RiverFront Moderate Growth & Income Fund |
| |||||||||||||||
Common Stocks (a) | $ | 4,047,499 | $ | – | $ | – | $ | 4,047,499 | ||||||||
Exchange Traded Funds | 7,156,815 | – | – | 7,156,815 | ||||||||||||
Exchange Traded Notes | 582,921 | – | – | 582,921 | ||||||||||||
Short Term Investments | 1,858,497 | – | – | 1,858,497 | ||||||||||||
TOTAL | $ | 13,645,732 | $ | – | $ | – | $ | 13,645,732 | ||||||||
| (a) | For detailed descriptions of sector and industry, see the accompanying Statement of Investments. |
| (b) | Prior to August 31, 2010, the ALPS | WMC Value Intersection Fund was known as Activa Value Fund. |
For the period ended October 31, 2010, the Funds did not have any significant transfers between Level 1 and Level 2 securities, except the Clough China Fund. The Clough China Fund utilizes a fair value evaluation service with respect to international securities with an earlier market closing than the Fund’s net asset value computation cutoff. As such, international securities can transfer between Level 1 and Level 2 based on triggers being met without disclosure detailing the transfers into and out of Level 1 and Level 2.
For the period ended October 31, 2010, the Funds did not have any securities which used significant unobservable inputs (Level 3) in determining fair value. Therefore, a reconciliation of assets in which significant unobservable inputs (Level 3) were used in determining fair value is not applicable.
Options: The Funds may purchase or write (sell) put and call options. One of the risks associated with purchasing an option among others, is that the Fund pays a premium whether or not the option is exercised. Additionally, each Fund bears the risk of loss of premium and change in market value should the counterparty not perform under the contract. Put and call options purchased are accounted for in the same manner as portfolio securities. The cost of securities acquired through the exercise of call options is increased by premiums paid. The proceeds from securities sold through the exercise of put options are decreased by the premiums paid.
When a Fund writes an option, an amount equal to the premium received by the Fund is recorded as a liability and is subsequently adjusted to the current value of the option written. Premiums received from writing options that expire unexercised are treated by the Fund on the expiration date as realized gains from investments. The difference between the premium and the amount paid on effecting a closing purchase transaction, including brokerage commissions, is also treated as a realized gain, or, if the premium is less than the amount paid for the closing purchase transaction, as a realized loss. If a call option
is exercised, the premium is added to the proceeds from the sale of the underlying security or currency in determining whether the Fund has realized a gain or loss. If a put option is exercised, the premium reduces the cost basis of the securities purchased by the Fund. Each Fund, as writer of an option, bears the market risk of an unfavorable change in the price of the security underlying the written option. Written and purchased options are non-income producing securities.
Written option activity for the period ended October 31, 2010 was as follows:
ALPS | GNI Long-Short Fund:
| Written Call Options | Contracts | Premiums | ||||||
Outstanding, April 30, 2010 | – | $ | – | |||||
Positions opened | 795 | 131,208 | ||||||
Exercised | – | – | ||||||
Expired | (50) | (6,450) | ||||||
Closed | (745) | (124,758) | ||||||
Outstanding, October 31, | – | $ | – | |||||
Market Value, October 31, | – | $ | – | |||||
| Written Put Options | Contracts | Premiums | ||||||
Outstanding, April 30, 2010 | 915 | $ | 66,510 | |||||
Positions opened | 9,545 | 1,349,400 | ||||||
Exercised | – | – | ||||||
Expired | (450) | (38,749) | ||||||
Closed | (9,400) | (1,253,763) | ||||||
Split | 90 | – | ||||||
Outstanding, October 31, | 700 | $ | 123,398 | |||||
Market Value, October 31, | $ | 102,600 | ||||||
90 | October 31, 2010
Table of Contents
| Notes to Financial Statements | ||||||
October 31, 2010 (Unaudited) | ||||||
Short Sales: Each Fund may sell a security it does not own in anticipation of a decline in the fair value of that security. When the Fund sells a security short, it must borrow the security sold short and deliver it to the broker-dealer through which it made the short sale. A gain, limited to the price at which the Fund sold the security short, or a loss, unlimited in size, will be recognized upon the termination of the short sale.
Derivatives Instruments and Hedging Activities: The following tables disclose the amounts related to each Fund’s use of derivative instruments and hedging activities. The Funds
may write or purchase option contracts to adjust risk and return of their overall investment positions. The average long option contracts volume and the average long option contracts notional volume during the six-month period ended October 31, 2010 in the ALPS | GNI Long-Short Fund was 1,835 and $11,617,064, respectively. The average short option contracts volume and the average short option contracts notional volume during the six-month period ended October 31, 2010 in the ALPS | GNI Long-Short Fund was 1,061 and $6,219,847, respectively.
The effect of derivatives instruments on the Balance Sheet as of October 31, 2010:
| Asset Derivatives | Liability Derivatives | |||||||||||||
| Derivatives Not Accounted For as Hedging Instruments | Balance Sheet Location | Fair Value | Balance Sheet Location | Fair Value | ||||||||||
ALPS | GNI Long-Short Fund |
| |||||||||||||
Equity Contracts | Investments, at value | $ | 414,700 | Written options | $ | 102,600 | ||||||||
Total | $ | 414,700 | $ | 102,600 | ||||||||||
Jefferies Asset Management Commodity Strategy Allocation Fund | ||||||||||||||
Equity Contracts | Total return swap contracts, at value | $ | 327,912 | N/A | $ | – | ||||||||
Total | $ | 327,912 | $ | – | ||||||||||
The effect of derivatives instruments on the Statement of Operations for the period ended October 31, 2010:
| Derivatives Not Accounted For as Hedging Instruments | Location of Gain/(Loss) On Derivatives Recognized in Income | Realized Gain On Derivatives Recognized in Income | Change in Unrealized Gain/(Loss) On Derivatives Recognized in Income | |||||||
ALPS | GNI Long-Short Fund |
| |||||||||
Equity Contracts | Net realized gain/(loss) on investments/Net realized loss on written options/Net change in unrealized appreciation/(depreciation) on investments, securities sold short and written options | $ | 19,156 | $ | (257,014 | ) | ||||
Total | $ | 19,156 | $ | (257,014 | ) | |||||
Jefferies Asset Management Commodity Strategy Allocation Fund |
| |||||||||
Equity Contracts | Net realized gain on total return swaps/Net change in unrealized appreciation of investments and swaps | $ | 561,651 | $ | 327,912 | |||||
Total | $ | 561,651 | $ | 327,912 | ||||||
Swap Contracts: The Jefferies Asset Management Commodity Strategy Allocation Fund may enter into swap transactions for hedging purposes or to seek to increase total return. At the present time, the Jefferies Asset Management Commodity Strategy Allocation Fund primarily enters into swap transactions for the purpose of increasing total return. Risks may arise as a
result of the failure of the counterparty to the swap contract to comply with the terms of the swap contract. The loss incurred by the failure of a counterparty is generally limited to the net payment to be received by the Jefferies Asset Management Commodity Strategy Allocation Fund and/or the termination value at the end of the contract.
91 | October 31, 2010
Table of Contents
| Notes to Financial Statements | ||||||
October 31, 2010 (Unaudited) | ||||||
Therefore, the Jefferies Asset Management Commodity Strategy Allocation Fund considers the creditworthiness of each counterparty to a contract in evaluating potential credit risk. Additionally, risks may arise from unanticipated movements in interest rates or in the value of the underlying reference asset or index. Entering into these agreements involves, to varying degrees, market risk, liquidity risk and elements of credit, legal and documentation risk that are not directly reflected in the amounts recognized in the Statements of Assets and Liabilities.
The Jefferies Asset Management Commodity Strategy Allocation Fund may pay or receive cash as collateral on these contracts which may be recorded as an asset and/or liability. The Jefferies Asset Management Commodity Strategy Allocation Fund must set aside liquid assets, or engage in other appropriate measures, to cover its obligations under these contracts. Swaps are marked to market daily using either pricing vendor quotations, counterparty prices or model prices and the change in value, if any, is recorded as an unrealized gain or loss. Upfront payments made and/or received by the Jefferies Asset Management Commodity Strategy Allocation Fund are recorded as an asset and/or liability and realized gains or losses are recognized ratably over the contract’s term/ event, with the exception of forward starting interest rate swaps, whose realized gains or losses are recognized ratably from the effective start date. Periodic payments received or made on swap contracts are recorded as realized gains or losses. Gains or losses are realized upon termination of a swap contract and are recorded on the Statements of Operations.
The Jefferies Asset Management Commodity Strategy Allocation Fund invests in total return swaps. A total return swap is an agreement that gives a fund the right to receive the appreciation in the value of a specified security, index or other instrument in return for a fee paid to the counterparty, which will typically be an agreed upon interest rate. If the underlying asset declines in value over the term of the swap, a fund may also be required to pay the dollar value of that decline to the counterparty.
The number of swap contracts held at October 31, 2010 is representative of swap contract activity during the six-month period ended October 31, 2010.
Treasury Inflation Protected-Securities: The Funds may invest in treasury inflation protected securities (“TIPS”), including structured bonds in which the principal amount is adjusted daily to keep pace with inflation, as measured by the U.S. Consumer Pricing Index for Urban Consumers. The adjustments to principal due to inflation/deflation are reflected as increases/decreases to interest income with a corresponding adjustment to cost. Such adjustments may have a significant impact on a Fund’s distributions and may result in a return of capital to shareholders. The repayment of the original bond principal upon maturity is guaranteed by the full faith and credit of the U.S. Government.
Investment Transactions: Investment and shareholder transactions are accounted for on the date the investments are purchased or sold (trade date). Realized gains and losses from investment transactions are reported on an identified cost basis, which is the same basis each Fund uses for federal income tax purposes. Interest income, which includes accretion of discounts, is accrued and recorded as earned. Dividend income is recognized on the ex-dividend date or for certain foreign securities, as soon as information is available to the Fund.
Foreign Securities: Each Fund may directly purchase securities of foreign issuers. Investing in securities of foreign issuers involves special risks not typically associated with investing in securities of U.S. issuers. The risks include possible reevaluation of currencies, the inability to repatriate foreign currency, less complete financial information about companies and possible future adverse political and economic developments. Moreover, securities of many foreign issuers and their markets may be less liquid and their prices more volatile than those of securities of comparable U.S. issuers.
Foreign Currency Translation: The books and records of the Funds are maintained in U.S. dollars. Investment valuations and other assets and liabilities initially expressed in foreign currencies are converted each business day into U.S. dollars based upon current exchange rates. Prevailing foreign exchange rates may generally be obtained at the close of the NYSE (normally, 4:00 p.m. Eastern time). The portion of realized and unrealized gains or losses on investments due to fluctuations in foreign currency exchange rates is not separately disclosed and is included in realized and unrealized gains or losses on investments, when applicable.
Forward Foreign Currency Transactions: Each Fund may engage in currency transactions with counterparties to hedge the value of portfolio securities denominated in particular currencies against fluctuations in relative value, to gain or reduce exposure to certain currencies, or to generate income or gains. All commitments are marked to market daily at the applicable exchange rates and any resulting unrealized gains or losses are recorded in the Fund’s financial statements. Each Fund records realized gains or losses at the time a forward contract is offset by entry into a closing transaction or extinguished by delivery of the currency. None of the Funds had open forward foreign currency contracts at October 31, 2010.
Expenses: Some expenses of the Trust can be directly attributed to a Fund or a specific share class of a Fund. Expenses which cannot be directly attributed are apportioned among all funds in the Trust based on average net assets of each share class with a Fund.
Use of Estimates: Each Fund’s financial statements are prepared in accordance with accounting principles generally accepted in the United States of America. This requires
92 | October 31, 2010
Table of Contents
| Notes to Financial Statements | ||||||
October 31, 2010 (Unaudited) | ||||||
management to make estimates and assumptions that affect (a) the reported amounts of assets and liabilities and disclosure of contingent assets and liabilities at the date of the financial statements, and (b) the reported amounts of increases and decreases in net assets from operations during the reporting period. Actual results could differ from these estimates.
Payment by Affiliates: During the year ended July 31, 2009, the predecessor China Fund was reimbursed $1,000 by Clay Finlay LLC (the predecessor China Fund’s former sub-adviser) for a trading error.
During the six-month period ended October 31, 2010, the ALPS/Red Rocks Listed Private Equity Fund was reimbursed $2,088 by Red Rocks Capital LLC for a trading error.
Income Taxes: The Funds comply with the requirements under Subchapter M of the Internal Revenue Code applicable to regulated investment companies and intend to distribute substantially all of their net taxable income and net capital gains, if any, each year. The Funds are not subject to income taxes to the extent such distributions are made.
For six-month period ended October 31, 2010, none of the Funds had a liability for any unrecognized tax benefits in the accompanying financial statements. The Funds file income tax returns in the U.S. federal jurisdiction and the State of Colorado.
For the years ended December 31, 2006 through April 30, 2010 for the U.S. federal jurisdiction, for the years ended December 31, 2005 through December 31, 2008 for Michigan, and for the year ended April 30, 2010 for Colorado, the predecessor Activa Fund’s and the current ALPS | WMC Value Intersection Fund’s returns are still open to examination by the appropriate taxing authority.
Distributions to Shareholders: Each Fund, except the Jefferies Asset Management Commodity Strategy Allocation Fund, normally pays dividends and distributes capital gains, if any, on an annual basis. The Jefferies Asset Management Commodity Strategy Allocation Fund pays dividends, if any, on a quarterly basis and distributes capital gains annually. Income dividend distributions are derived from interest and other income the Fund receives from its investments, including distributions of short-term capital gains. Capital gain distributions are derived from gains realized when the Fund sells a security it has owned for more than a year. Each Fund may make additional distributions and dividends at other times if its portfolio manager or managers believe doing so may be necessary for the Fund to avoid or reduce taxes. Net investment income (loss) and net realized gain (loss) may differ for financial statement and tax purposes. The character of distributions made during the year from net investment income or net realized gains may differ from its ultimate characterization for federal income tax purposes. Also, due to the timing of dividend distributions, the fiscal year in which amounts are distributed may differ from the fiscal year in which the income or realized gain were recorded by a Fund.
As of October 31, 2010, net unrealized appreciation/(depreciation) of investments based on federal tax cost was as follows:
| Fund | Gross (excess of value | Gross (excess of tax | Net unrealized appreciation | Cost of investments for income tax purposes | ||||||||||||
ALPS | GNI Long-Short Fund | $ | 747,503 | $ | (226,462 | ) | $ | 521,041 | $ | 9,058,676 | |||||||
ALPS | Red Rocks Listed Private Equity Fund | 6,780,180 | (2,416,012 | ) | 4,364,168 | 132,192,257 | |||||||||||
ALPS | WMC Value Intersection Fund | 9,500,509 | (2,442,682 | ) | 7,057,827 | 49,987,451 | |||||||||||
Clough China Fund | 16,878,316 | (618,047 | ) | 16,260,269 | 77,557,352 | |||||||||||
Jefferies Asset Management Commodity Strategy Allocation Fund | 461,840 | (23,734 | ) | 438,106 | 10,256,993 | |||||||||||
RiverFront Long-Term Growth & Income Fund | 131,949 | (20,012 | ) | 111,937 | 3,834,837 | |||||||||||
RiverFront Moderate Growth Fund | 67,719 | (7,787 | ) | 59,932 | 2,185,499 | |||||||||||
RiverFront Moderate Growth & Income Fund | 301,559 | (50,943 | ) | 250,616 | 13,395,116 | |||||||||||
93 | October 31, 2010
Table of Contents
| Notes to Financial Statements | ||||||
October 31, 2010 (Unaudited) | ||||||
2. SECURITIES TRANSACTIONS
Purchases and sales of securities, excluding short-term securities during the six-month period ended October 31, 2010 were as follows:
| Fund | Purchases of Securities | Proceeds from Sales of Securities | ||||||
ALPS | GNI Long-Short Fund | $ | 10,148,320 | $ | 10,765,632 | ||||
ALPS | Red Rocks Listed Private Equity Fund | 34,085,259 | 18,247,767 | ||||||
ALPS | WMC Value Intersection Fund (a) | 9,807,648 | 13,622,785 | ||||||
Clough China Fund | 65,131,474 | 35,414,905 | ||||||
Jefferies Asset Management Commodity Strategy Allocation Fund (b) | 2,537,157 | 130,599 | ||||||
RiverFront Long-Term Growth & Income Fund | 3,832,919 | 330,780 | ||||||
RiverFront Moderate Growth Fund | 2,078,327 | 155,034 | ||||||
RiverFront Moderate Growth & Income Fund | 12,601,648 | 1,069,143 | ||||||
Investment Transactions in U.S. Government Obligations for the period ended October 31, 2010 were as follows:
| Fund | Purchases of Securities | Proceeds from Sales of Securities | ||||||
Jefferies Asset Management Commodity Strategy Allocation Fund (b) | $ | 7,868,293 | $ | – | ||||
| (a) | Prior to August 31, 2010, the ALPS | WMC Value Intersection Fund was known as the Activa Value Fund. |
| (b) | Purchases and Sales for the Jefferies Asset Management Commodity Strategy Allocation Fund are consolidated and include the balances of Jefferies Asset Management Cayman Trust (a wholly owned subsidiary of the Fund). |
94 | October 31, 2010
Table of Contents
| Notes to Financial Statements | ||||||
October 31, 2010 (Unaudited) | ||||||
3. CAPITAL SHARE TRANSACTIONS
Shares redeemed within 90 days of purchase may incur a 2% short-term redemption fee deducted from the redemption amount, with the exception of ALPS | WMC Value Intersection Fund, RiverFront Long-Term Growth & Income Fund, RiverFront Moderate Growth Fund, and RiverFront Moderate Growth & Income Fund shares. For the period ended October 31, 2010, the amounts listed below were retained by the Funds. These amounts are reflected in “Shares redeemed” in the Statement of Changes in Net Assets.
| Fund | Redemption Fee retained | |||
ALPS/GNI Long-Short Fund – Class I Shares | $ 947 | |||
ALPS/Red Rocks Listed Private Equity Fund – Class A Shares | 8,068 | |||
ALPS/Red Rocks Listed Private Equity Fund – Class I Shares | 3,391 | |||
Clough China Fund – Class A Shares | 2,355 | |||
Clough China Fund – Class C Shares | 343 | |||
Clough China Fund – Class I Shares | 98 | |||
Jefferies Asset Management Commodity Strategy Allocation Fund – Class A Shares | 300 | |||
Transactions in shares of capital stock for the last two full fiscal years were as follows:
| ALPS | GNI Long–Short Fund | ALPS | Red Rocks Listed Private Equity Fund | |||||||||||||||
| For the Six Months Ended October 31, 2010 | For the Period November 2, 2009 (Inception) through April 30, 2010 | For the Six Months Ended October 31, 2010 | For the Year Ended April 30, 2010 | |||||||||||||
Class A | ||||||||||||||||
Shares sold | – | 7,546 | 3,268,305 | 6,906,283 | ||||||||||||
Dividends reinvested | – | – | – | 1,155,886 | ||||||||||||
Shares redeemed | (5,000) | – | (1,289,294) | (2,893,408) | ||||||||||||
Net increase/(decrease) in shares outstanding | (5,000) | 7,546 | 1,979,011 | 5,168,761 | ||||||||||||
Class C (a) | ||||||||||||||||
Shares sold | N/A | N/A | 206,337 | N/A | ||||||||||||
Dividends reinvested | N/A | N/A | – | N/A | ||||||||||||
Shares redeemed | N/A | N/A | (14) | N/A | ||||||||||||
Net increase in shares outstanding | N/A | N/A | 206,323 | N/A | ||||||||||||
Class I | ||||||||||||||||
Shares sold | 751 | 1,243,775 | 2,381,492 | 6,896,703 | ||||||||||||
Dividends reinvested | – | – | – | 384,322 | ||||||||||||
Shares redeemed | (113,824) | (105,349) | (1,675,843) | (2,206,417) | ||||||||||||
Net increase/(decrease) in shares outstanding | (113,073) | 1,138,426 | 705,649 | 5,074,608 | ||||||||||||
Class R | ||||||||||||||||
Shares sold | N/A | N/A | 16,690 | 4,030 | ||||||||||||
Dividends reinvested | N/A | N/A | – | 508 | ||||||||||||
Shares redeemed | N/A | N/A | (11,034) | (735) | ||||||||||||
Net increase in shares outstanding | N/A | N/A | 5,656 | 3,803 | ||||||||||||
| (a) | The Fund’s Class C shares commenced operations on July 2, 2010. |
95 | October 31, 2010
Table of Contents
| Notes to Financial Statements | ||||||
October 31, 2010 (Unaudited) | ||||||
| ALPS | WMC Value Intersection Fund (a) | ||||||||||||
| For the Six Months Ended October 31, 2010 | For the Period January 1, 2010 through April 30, 2010 (b) | For the Year Ended December 31, 2009 | ||||||||||
Class A | ||||||||||||
Shares sold | 17,569 | 236,002 | 433,024 | |||||||||
Dividends reinvested | – | – | 84,159 | |||||||||
Shares redeemed | (324,716) | (3,133,694) | (715,207) | |||||||||
Net decrease in shares outstanding | (307,147) | (2,897,692) | (198,024) | |||||||||
Class C (c) | ||||||||||||
Shares sold | 1,572 | N/A | N/A | |||||||||
Dividends reinvested | – | N/A | N/A | |||||||||
Shares redeemed | (10) | N/A | N/A | |||||||||
Net increase in shares outstanding | 1,562 | N/A | N/A | |||||||||
Class I (d) | ||||||||||||
Shares sold | 98,060 | 217,071 | 2,184,008 | |||||||||
Dividends reinvested | – | – | 28,213 | |||||||||
Shares redeemed | (314,387) | (334,099) | (468,350) | |||||||||
Net increase/(decrease) in shares outstanding | (216,327) | (117,028) | 1,743,871 | |||||||||
| Clough China Fund | ||||||||||||
| For the Six Months Ended October 31, 2010 | For the Period August 1, 2009 through April 30, 2010 (e) | For the Year Ended July 31, 2009 (000s) | ||||||||||
Class A | ||||||||||||
Shares sold | 941,672 | 1,255,330 | 458 | |||||||||
Dividends reinvested | – | 2,123 | 10 | |||||||||
Shares redeemed | (330,035) | (604,582) | (679) | |||||||||
Net increase/(decrease) in shares outstanding | 611,637 | 652,871 | (211) | |||||||||
Class C | ||||||||||||
Shares sold | 274,523 | 118,832 | 144 | |||||||||
Dividends reinvested | – | – | 1 | |||||||||
Shares redeemed | (55,807) | (208,520) | (276) | |||||||||
Net increase/(decrease) in shares outstanding | 218,716 | (89,688) | (131) | |||||||||
Class I (f) | ||||||||||||
Shares sold | 827,374 | 224,363 | 1 | |||||||||
Dividends reinvested | – | 4,881 | 16 | |||||||||
Shares redeemed | (10,442) | (216) | (1) | |||||||||
Net increase in shares outstanding | 816,932 | 229,028 | 16 | |||||||||
Class Z (g) | ||||||||||||
Shares sold | N/A | 828,700 | 507 | |||||||||
Dividends reinvested | N/A | 5,297 | 6 | |||||||||
Shares redeemed | N/A | (1,543,589) | (137) | |||||||||
Net increase/(decrease) in shares outstanding | N/A | (709,592) | 376 | |||||||||
| (a) | Prior to August 31, 2010, the ALPS | WMC Value Intersection Fund was known as the Activa Value Fund. |
| (b) | Effective March 9, 2010, the Board approved changing the fiscal year-end of the Fund from December 31 to April 30. |
| (c) | The Fund’s Class C shares commenced operations on July 2, 2010. |
| (d) | Prior to close of business August 28, 2009, Class I of the ALPS | WMC Value Intersection Fund was known as Class R of the Predecessor Fund. |
| (e) | Effective March 9, 2010, the Board approved changing the fiscal year-end of the Fund from July 31 to April 30. |
| (f) | Prior to the close of business on January 15, 2010, Class I of the Clough China Fund was known as Institutional Class of the Predecessor Fund. |
| (g) | As a result of the reorganization (Note 1), the Clough China Fund no longer offers Class Z shares. Effective as of the close of business January 15, 2010, holders of Class Z shares of the Predecessor Fund received Class A shares of the Fund. |
96 | October 31, 2010
Table of Contents
| Notes to Financial Statements | ||||||
October 31, 2010 (Unaudited) | ||||||
| Jefferies Asset Management Commodity Strategy Allocation Fund | RiverFront Long-Term Growth & Income Fund | RiverFront Moderate Growth Fund | RiverFront Moderate Growth & Income Fund | |||||||||||||
| For the Period June 29, 2010 (Inception) through October 31, 2010 | For the Period August 2, 2010 through October 31, 2010 | For the Period August 2, 2010 through October 31, 2010 | For the Period August 2, 2010 through October 31, 2010 | |||||||||||||
Class A | ||||||||||||||||
Shares sold | 313,811 | 116,450 | 124,759 | 283,288 | ||||||||||||
Dividends reinvested | 6,548 | – | – | – | ||||||||||||
Shares redeemed | (1,900) | – | – | (9,540) | ||||||||||||
Net increase in shares outstanding | 318,459 | 116,450 | 124,759 | 273,748 | ||||||||||||
Class C | ||||||||||||||||
Shares sold | 133,876 | 229,679 | 90,400 | 806,873 | ||||||||||||
Dividends reinvested | 3,625 | – | – | – | ||||||||||||
Shares redeemed | – | (1,017) | – | (351) | ||||||||||||
Net increase in shares outstanding | 137,501 | 228,662 | 90,400 | 806,522 | ||||||||||||
Class I | ||||||||||||||||
Shares sold | 520,646 | 36,290 | 24,402 | 213,863 | ||||||||||||
Dividends reinvested | 13,503 | – | – | – | ||||||||||||
Shares redeemed | (2,048) | – | (4,700) | – | ||||||||||||
Net increase in shares outstanding | 532,101 | 36,290 | 19,702 | 213,863 | ||||||||||||
97 | October 31, 2010
Table of Contents
| Notes to Financial Statements | ||||||
October 31, 2010 (Unaudited) | ||||||
4. MANAGEMENT AND RELATED-PARTY TRANSACTIONS
ALPS Advisors, Inc. (“AAI” or “Adviser”), subject to the authority of the Board, is responsible for the overall management and administration of each Fund’s business affairs. AAI has delegated daily management of the funds listed below to the corresponding sub-adviser listed in the table below. Each sub-adviser manages the investments of the Fund in accordance with its investment objective, policies and limitations and investment guidelines established jointly by the Adviser and the Board.
| Fund | Sub-Adviser | |
ALPS | GNI Long-Short Fund | GNI Capital, Inc. | |
ALPS | Red Rocks Listed Private Equity Fund | Red Rocks Capital LLC | |
ALPS | WMC Value Intersection Fund | Wellington Management Company, LLP | |
Clough China Fund | Clough Capital Partners, LP | |
Jefferies Asset Management Commodity Strategy Allocation Fund | Jefferies Asset Management, LLC | |
RiverFront Long-Term Growth & Income Fund | RiverFront Investment Group, LLC | |
RiverFront Moderate Growth Fund | RiverFront Investment Group, LLC | |
RiverFront Moderate Growth & Income Fund | RiverFront Investment Group, LLC |
Pursuant to an Investment Advisory Agreement (the “Advisory Agreement”), each Fund pays AAI an annual management fee which is based on each Fund’s average daily net assets. The following table reflects the Funds’ contractual management fee rates (expressed as an annual rate).
| Fund | Contractual Management Fee | |
ALPS | GNI Long-Short Fund | 1.30% | |
ALPS | Red Rocks Listed Private Equity Fund | 0.85% | |
ALPS | WMC Value Intersection Fund | 0.95% | |
Clough China Fund | 1.35% |
| Fund | Contractual Management Fee | |
Jefferies Asset Management Commodity Strategy Allocation Fund | 0.10% | |
RiverFront Long-Term Growth & Income Fund | 0.30% | |
RiverFront Moderate Growth Fund | 0.30% | |
RiverFront Moderate Growth & Income Fund | 0.30% |
Pursuant to an Investment Sub-advisory Agreement, AAI pays each sub-adviser an annual sub-advisory management fee which is based on each Fund’s average daily assets. AAI is required to pay all fees due to each sub-adviser out of the management fee AAI receives from each Fund. The following table reflects the Funds’ contractual sub-advisory fee rates.
| Fund | Average Daily Net Assets of the Fund | Contractual Sub-Advisory Fee | ||||||
ALPS | GNI | First $ | 10 Million | 0.85% | |||||
Long-Short Fund | Over $ | 10 Million | 0.65% | |||||
ALPS | Red Rocks Listed Private Equity Fund | All Asset Levels | 0.57% | ||||||
ALPS | WMC | First $ | 250 Million | 0.50% | |||||
Value Intersection | $ | 250 Million - $500 Million | | 0.40% | ||||
Fund | Over $ | 500 Million | 0.30% | |||||
Clough China Fund | All Asset Levels | 0.90% | ||||||
Jefferies Asset Manage | All Asset Levels | 0.75% | ||||||
RiverFront Long-Term Growth & Income Fund | All Asset Levels | 0.60% | ||||||
RiverFront Moderate Growth Fund | All Asset Levels | 0.60% | ||||||
RiverFront Moderate Growth & Income Fund | All Asset Levels | 0.60 | % | |||||
ALPS/GNI Long-Short Fund. The Adviser has given a contractual agreement to the Fund to limit the amount of the Fund’s total annual expenses, exclusive of distribution and service (12b-1) fees, shareholder service fees, acquired fund fees and expenses, short-sale dividend expenses, brokerage expenses, interest expenses, taxes and extraordinary expenses, to 2.00% of the Fund’s average daily net assets. This agreement is in effect through August 31, 2011 and is reevaluated on an annual basis. The Adviser will be permitted to recover, on a class-by-class basis, expenses it has borne through the agreement described above to the extent that the Fund’s expenses in later periods fall below the annual rates set forth in the relevant agreement. The Fund will not be obligated to pay any such deferred fees and expenses more than one year after the end of the fiscal year in which the fee and expense was deferred.
98 | October 31, 2010
Table of Contents
| Notes to Financial Statements | ||||||
October 31, 2010 (Unaudited) | ||||||
ALPS/Red Rocks Listed Private Equity Fund. The Adviser and Red Rocks Capital LLC have given a contractual agreement to the Fund to limit the amount of the Fund’s total annual expenses, exclusive of distribution and service (12b-1) fees, shareholder services fees (Class C shares only), acquired fund fees and expenses, brokerage expenses, interest expenses, taxes and extraordinary expenses, to 1.25% of the Fund’s average daily net assets. This agreement is in effect through August 31, 2011 and is reevaluated on an annual basis. Each of the Adviser and Red Rocks Capital LLC will be permitted to recover, on a class-by-class basis, expenses it has borne through the agreement described above to the extent that the Fund’s expenses in later periods fall below the annual rates set forth in the relevant agreement. The Fund will not be obligated to pay any such deferred fees and expenses more than one year after the end of the fiscal year in which the fee and expense was deferred.
ALPS/WMC Value Intersection Fund. The Adviser has given a contractual agreement to the Fund to limit the amount of the Fund’s total annual expenses, exclusive of distribution and service (12b-1) fees, shareholder service fees, brokerage expenses, interest expenses, taxes and extraordinary expenses, to 1.15% of the Funds’ average daily net assets. This agreement is in effect through August 31, 2011 and is reevaluated on an annual basis. The Adviser will be permitted to recover, on a class-by-class basis, expenses it has borne through the agreement described above to the extent that the Fund’s expenses in later periods fall below the annual rates set forth in the relevant agreement. The Fund will not be obligated to pay any such deferred fees and expenses more than one year after the end of the fiscal year in which the fee and expense was deferred.
Clough China Fund. The Adviser has contractually agreed to limit the operating expenses of the Fund, exclusive of underlying fund fees and expenses, interest, taxes, brokerage costs and commissions, dividend and interest expense on short sales, litigation, indemnification and extraordinary expenses as determined under generally accepted accounting principles, to 1.40% for Class I shares through December 31, 2010, 1.70% for Class A shares through December 31, 2009 and 1.85% for Class A shares from January 1, 2010 through December 31, 2010, and 2.70% for Class C shares through December 31, 2010. Effective January 1, 2011, the Adviser has contractually agreed to limit the operating expenses of the Fund, exclusive of underlying fund fees and expenses, interest, taxes, brokerage costs and commissions, dividend and interest expense on short sales, litigation, indemnification and extraordinary expenses as determined under generally accepted accounting principles, to 2.75% for Class I shares, 3.00% for Class A shares, and 3.75% for Class C shares through December 31, 2018. The Adviser will consider further reductions to these limits on an annual basis.
The Adviser will be permitted to recover, on a class-by-class basis, expenses it has borne through the agreement described above to the extent that the Fund’s expenses in later periods fall below the annual rates set forth in the relevant agreement. The Fund will not be obligated to pay any such deferred fees and expenses more than one year after the end of the fiscal year in which the fee and expense was deferred.
Jefferies Asset Management Commodity Strategy Allocation Fund. Jefferies Asset Management, LLC, the Fund’s sub-adviser, has given a contractual agreement to the Fund to limit the amount of the Fund’s total annual expenses, exclusive of distribution and service (12b-1) fees, shareholder service fees, acquired fund fees and expenses, brokerage expenses, interest expenses, taxes and extraordinary expenses, to 1.05% for Class A shares and Class C shares and 1.15% for Class I shares. This agreement is in effect through August 31, 2011 and is reevaluated on an annual basis. Jefferies Asset Management, LLC will be permitted to recover, on a class-by-class basis, expenses it has borne through the agreement described above to the extent that the Fund’s expenses in later periods fall below the annual rates set forth in the relevant agreement. The Fund will not be obligated to pay any such deferred fees and expenses more than two years after the end of the fiscal year in which the fee and expense was deferred.
RiverFront Long-Term Growth & Income Fund; RiverFront Moderate Growth Fund; and RiverFront Moderate Growth & Income Fund. The Adviser and RiverFront Investment Group, LLC have given a contractual agreement to the Fund to limit the amount of the Fund’s total annual expenses, exclusive of distribution and service (12b-1) fees, shareholder service fees, brokerage expenses, interest expenses, taxes and extraordinary expenses, to 1.05% for Class A shares, Class C shares and Class I shares. This agreement is in effect through August 31, 2011 and is reevaluated on an annual basis. Each of the Adviser and RiverFront Investment Group, LLC will be permitted to recover, on a class-by-class basis, expenses it has borne through the agreement described above to the extent that the Fund’s expenses in later periods fall below the annual rates set forth in the relevant agreement. The Fund will not be obligated to pay any such deferred fees and expenses more than three years after the end of the fiscal year in which the fee and expense was deferred.
In addition, each Fund’s organizational expenses have been borne by AAI.
ALPS Distributors, Inc. (an affiliate of ALPS and AAI) (“ADI” or the “Distributor”) acts as the distributor of the Funds’ shares pursuant to a Distribution Agreement with the Trust. Shares are sold on a continuous basis by ADI as agent for the Fund, and ADI has agreed to use its best efforts to solicit orders for the sale
99 | October 31, 2010
Table of Contents
| Notes to Financial Statements | ||||||
October 31, 2010 (Unaudited) | ||||||
of Fund shares, although it is not obliged to sell any particular amount of shares. ADI is not entitled to any compensation for its services as Distributor. ADI is registered as a broker-dealer with the Securities and Exchange Commission.
Each Fund has adopted a Distribution and Services Plan (the “Plan”) pursuant to Rule 12b-1 under the 1940 Act for the Class A and C shares. The Plan allows the Fund to use its Class A and Class C assets, respectively, to pay fees in connection with the distribution, marketing and/or the provision of shareholder services to Class A and Class C shareholders, respectively. The Plan permits payment for services in connection with the administration of plans or programs that use Class A and Class C shares, respectively, of each Fund as their funding medium and for related expenses. The Plan permits each Fund to make total payments at an annual rate of up to 0.25% for A shares and 0.75% for C shares of the Fund’s average daily net assets attributable to its Class A shares and Class C shares, respectively. Because these fees are paid out of a Fund’s share class assets on an ongoing basis, over time they will increase the cost of an investment in Class A shares and Class C shares, and Plan fees may cost an investor more than other types of sales charges.
Each of the ALPS | Red Rocks Listed Private Equity Fund Class A and C shares, the ALPS | WMC Value Intersection Fund, the Clough China Fund Class C shares, the Jefferies Asset Management Commodity Strategy Allocation Fund Class A and Class C shares, the RiverFront Long-Term Growth & Income Fund Class C shares, the RiverFront Moderate Growth Fund Class C shares and the RiverFront Moderate Growth & Income Fund Class C shares have adopted a shareholder services plan (a “Shareholder Services Plan”). Under the Shareholder Services Plan, the Funds are authorized to pay banks and their affiliates and other institutions, including broker-dealers and Fund affiliates (“Participating Organizations”), an aggregate fee in an amount not to exceed on an annual basis 0.15% for ALPS | Red Rocks Listed Private Equity Fund Class A shares and Jefferies Asset Management Commodity Strategy Allocation Fund Class A shares, and 0.25% for the ALPS | WMC Value Intersection Fund, Clough China Fund Class C shares, Jefferies Asset Management Commodity Strategy Allocation Fund Class C shares, RiverFront Long-Term Growth & Income Fund Class C shares, RiverFront Moderate Growth Fund Class C shares and RiverFront Moderate Growth & Income Fund Class C shares of the average daily net asset value of the Class A shares and Class C shares, respectively, attributable to or held in the name of a Participating Organization for its clients as compensation for providing shareholder service activities, which do not include distribution services, pursuant to an agreement with a Participating Organization.
ALPS (an affiliate of ADI and AAI) serves as administrator to the Funds and the Funds have agreed to pay expenses incurred
in connection with their administrative activities. Pursuant to an Administrative Agreement, ALPS will provide operational services to the Funds including, but not limited to fund accounting and fund administration and generally assist in each Fund’s operations. The Annual Administrative Fee is based on each Fund’s average daily net assets and will be billed monthly, in the amounts shown below.
| Fund | Average Daily Net Assets of the Fund | Annual Administrative Fee | ||||||
ALPS | GNI | ||||||||
Long-Short Fund | First $ | 500 Million | 0.08 | % | ||||
| $500 Million - $1 Billion | 0.06 | % | ||||||
| Over $ | 1 Billion | 0.04 | % | |||||
ALPS | Red Rocks Listed Private Equity Fund | First $500 Million | 0.08 | % | |||||
| $500 Million - $1 Billion | 0.06 | % | ||||||
| Over $1 Billion | 0.04 | % | ||||||
ALPS | WMC Value Intersection Fund | All Asset Levels | 0.15 | % | |||||
Clough China Fund | All Asset Levels | 0.15 | % | |||||
Jefferies Asset Management Commodity Strategy Allocation Fund | All Asset Levels | 0.10 | % | |||||
RiverFront Long- Term Growth & Income Fund | All Asset Levels | 0.10 | % | |||||
RiverFront Moderate Growth Fund | All Asset Levels | 0.10 | % | |||||
RiverFront Moderate Growth & Income Fund | All Asset Levels | 0.10 | % | |||||
Beneficial Ownership: The beneficial ownership, either directly or indirectly, of more than 25% of the voting securities of any class of a fund creates a presumption of control of each Fund, under Section 2(a)(9) of the 1940 Act. Beneficial owners owning more than 25% of the voting securities of each class of each fund, as of October 31, 2010, are listed below:
| Fund | Shareholder Name | Percentage Interest | ||||
ALPS | GNI Long-Short Fund - Class A | Charles Schwab & Co. Inc. | 100.00 | % | |||
ALPS | GNI Long-Short Fund - Class I | Charles Schwab & Co. Inc. | 57.73 | % | |||
100 | October 31, 2010
Table of Contents
| Notes to Financial Statements | ||||||
October 31, 2010 (Unaudited) | ||||||
| Fund | Shareholder Name | Percentage Interest | ||||
ALPS | GNI Long-Short Fund - Class I | NFS LLC | 42.27 | % | |||
ALPS | Red Rocks Listed Private Equity Fund - Class A | NFS LLC | 75.93 | % | |||
ALPS | Red Rocks Listed Private Equity Fund - Class I | Charles Schwab & Co. Inc | 49.63 | % | |||
ALPS | Red Rocks Listed Private Equity Fund - Class I | NFS LLC | 44.00 | % | |||
ALPS | Red Rocks Listed Private Equity Fund - Class R | NFS LLC | 98.73 | % | |||
Clough China Fund - Class A | Merrill Lynch | 29.66 | % | |||
Clough China Fund - Class C | Merrill Lynch | 49.93 | % | |||
Clough China Fund - Class I | Merrill Lynch | 49.03 | % | |||
Clough China Fund - Class I | John Peter Clay | 25.16 | % | |||
Jefferies Asset Management Commodity Strategy Allocation Fund - Class A | Jefferies Asset Management, LLC | 32.34 | % | |||
Jefferies Asset Management Commodity Strategy Allocation Fund - Class A | Pershing LLC | 37.81 | % | |||
Jefferies Asset Management Commodity Strategy Allocation Fund - Class C | Jefferies Asset Management, LLC | 74.91 | % | |||
Jefferies Asset Management Commodity Strategy Allocation Fund - Class I | Jefferies Asset Management, LLC | 58.16 | % | |||
RiverFront Long Term Growth & Income Fund - Class A | Robert W Baird & Co. | 32.01 | % | |||
RiverFront Long Term Growth & Income Fund - Class C | Robert W Baird & Co. | 38.38 | % | |||
RiverFront Long Term Growth & Income Fund - Class C | Pershing LLC | 25.96 | % | |||
RiverFront Long Term Growth & Income Fund - Class I | Peter J. Quinn Jr. | 55.11 | % | |||
| Fund | Shareholder Name | Percentage Interest | ||||
RiverFront Moderate Growth Fund - Class C | Peter J. Quinn Jr. | 50.76 | % | |||
RiverFront Moderate Growth Fund - Class I | Franklin A. Trice III | 27.10 | % | |||
RiverFront Moderate Growth & Income Fund - Class A | Robert W. Baird & Co. | 33.19 | % | |||
RiverFront Moderate Growth & Income Fund - Class C | Robert W. Baird & Co. | 46.86 | % | |||
RiverFront Moderate Growth & Income Fund - Class I | Robert W. Baird & Co. | 71.85 | % | |||
5. Indemnifications
Under the Trust’s organizational documents, its officers and Trustees are indemnified against certain liability arising out of the performance of their duties to the Trust. Additionally, in the normal course of business, the Trust enters into contracts with service providers that contain general indemnification clauses. The Trust’s maximum exposure under these arrangements is unknown, as this would involve future claims that may be made against the Trust that have not yet occurred.
6. Subsequent Events
Management has evaluated whether any events or transactions occurred subsequent to October 31, 2010 through the date of issuance of the Funds’ financial statements and determined that there were no other material events or transactions that would require recognition or disclosure in the Funds’ financial statements.
101 | October 31, 2010
Table of Contents
| Additional Information | ||||||
October 31, 2010 (Unaudited) | ||||||
| 1. | FUND HOLDINGS |
The Funds file their complete schedule of portfolio holdings with the Securities and Exchange Commission (the “SEC”) for the first and third quarters of each fiscal year on Form N-Q within 60 days after the end of the period. Copies of the Funds’ Form N-Q are available without charge on the SEC website at http://www.sec.gov. You may also review and copy the Form N-Q at the SEC’s Public Reference Room in Washington, D.C. For more information about the operation of the Public Reference Room, please call the SEC at 1-800-SEC-0330.
| 2. | FUND PROXY VOTING POLICIES, PROCEDURES AND SUMMARIES |
Fund policies and procedures used in determining how to vote proxies and information regarding how each of the Funds voted proxies relating to portfolio securities during the most recent prior 12-month period ending June 30 will be available without charge, (1) upon request, by calling (866) 759-5679 and (2) on the SEC’s website at http://www.sec.gov.
| 3. | DISCLOSURE REGARDING APPROVAL OF FUND ADVISORY AGREEMENTS |
ALPS| Red Rocks Listed Private Equity Fund
On September 14, 2010, the Trustees met in person to discuss, among other things, the renewal and approval of the Investment Advisory and Management Agreement between the Trust and the Adviser (the “Advisory Agreement”) and the Investment Sub-Advisory Agreement among the Trust, the Adviser and Red Rocks Capital LLC (“Red Rocks”), the sub-adviser for the ALPS| Red Rocks Listed Private Equity Fund (the “Sub-Advisory Agreement, together with the Advisory Agreement, the “Fund Advisory Agreements”) in accordance with Section 15(c) of the 1940 Act. The Independent Trustees met with independent legal counsel during executive session and discussed the Fund Advisory Agreements and other related materials.
In renewing and approving the Advisory Agreement with the Adviser and the Sub-Advisory Agreement with Red Rocks, the Trustees, including the Independent Trustees, considered the following factors with respect to the Fund:
Investment Advisory Fee Rate: The Trustees reviewed and considered the contractual annual advisory fee to be paid by (a) the Trust, on behalf of the Fund, to the Adviser of 0.85% of the Fund’s daily average net assets and (b) by the Adviser to Red Rocks of 0.57% based on the Fund’s average net assets, in light of the extent and quality of the advisory services provided by the Adviser and Red Rocks to the Fund.
The Board received and considered information comparing the Fund’s contractual advisory fees and overall expenses with those of funds in both the relevant expense group and universe of funds provided by Lipper, an independent provider of investment company data, as well as the Fund’s direct competitors and similar products advised by the Adviser and by Red Rocks.
Based on such information, the Trustees further determined that the contractual annual advisory fees set forth above and the total expense ratio (after waivers) of 1.65%, 2.40%, 1.40% and 1.90% for Class A, Class C, Class I and Class R shares, respectively, of the Fund, taking into account the contractual fee waivers in place, is comparable to others within the Fund’s peer universe.
Nature, Extent and Quality of the Services under the Advisory Agreement and the Sub-Advisory Agreement: The Trustees received and considered information regarding the nature, extent and quality of services provided to the Fund under the Investment Advisory and Management Agreement and the Investment Subadvisory Agreement. The Trustees reviewed certain background materials supplied by the Adviser and Red Rocks in each of their presentations, including their Forms ADV.
The Trustees reviewed and considered the Adviser’s and Red Rocks’ investment advisory personnel, their history as asset managers, their performance and the amount of assets currently under management by the Adviser and Red Rocks. The Trustees also reviewed the research and decision-making processes utilized by the Adviser and Red Rocks, including the methods adopted to seek to achieve compliance with the investment objectives, policies and restrictions of the Fund.
The Trustees considered the background and experience of the Adviser’s and Red Rocks’ management in connection with the Fund, including reviewing the qualifications, backgrounds and responsibilities of the management team primarily responsible for the day-to-day portfolio management of the Fund and the extent of the resources devoted to research and analysis of actual and potential investments.
The Trustees also reviewed the accompanying compliance-related materials and also noted that they have received reports on these services and compliance issues from the Adviser and Red Rocks at each regular Board meeting throughout the year related to the services rendered by the Adviser and Red Rocks with respect to the Fund.
Fund Performance: The Trustees reviewed performance information for the Fund for the one-year and since inception (December 31, 2007) periods ended July 31, 2010. That review included a comparison of the Fund’s performance to the performance of a group of comparable funds selected by Lipper. The Trustees also considered Red Rocks’ performance and reputation generally and its investment techniques, risk management controls and decision-making processes.
102 | October 31, 2010
Table of Contents
| Additional Information | ||||||
October 31, 2010 (Unaudited) | ||||||
The Advisers’ Profitability: The Trustees received and considered a profitability analysis prepared by the Adviser based on the fees payable under the Investment Advisory and Management Agreement. Based on the allocation methodologies used by the Adviser, the Trustees considered the losses realized by the Adviser in connection with the operation of the Fund. The Trustees also considered the advisers’ statements regarding their continuing commitment to the Fund despite these losses. The Board then reviewed and discussed the Adviser’s and Red Rocks’ financial statements in order to analyze the financial condition and stability and profitability of each adviser.
Economies of Scale: The Trustees considered whether economies of scale in the provision of services to the Fund were being passed along to the shareholders. The Trustees considered whether any economies of scale, fall-out benefits or any other direct or indirect benefits would accrue to the Adviser or Red Rocks from their relationship with the Trust.
Other Benefits to the Advisers: The Trustees reviewed and considered any other benefits derived or to be derived by the Adviser and Red Rocks from their relationship with the Fund, including soft-dollar arrangements.
The Board summarized its deliberations with respect to the Investment Advisory and Management Agreement with the Adviser and the Investment Subadvisory Agreement with Red Rocks. In selecting the Adviser and Red Rocks and approving the investment advisory and sub-advisory agreements and fees under such agreements, the Trustees concluded that no single factor reviewed by the Trustees was identified by the Trustees to be determinative as the principal factor in whether to approve the investment advisory and sub-advisory agreements. Further, the Trustees, including all of the Independent Trustees, concluded that:
| » | the investment advisory fees to be received by the Adviser with respect to the Fund were comparable to others within the Fund’s peer universe, as well as similar products advised by the Adviser and by Red Rocks; |
| » | the nature, extent and quality of services rendered by the Adviser under the Investment Advisory and Management Agreement and by Red Rocks under the Investment Subadvisory Agreement were adequate; |
| » | the performance of the Fund was generally comparable to the performance of the funds in its Lipper peer group, although the peer group was composed of several funds that, although in the financial sector, have very different investment theses than the Fund; |
| » | the profit, if any, anticipated to be realized by the Adviser and by Red Rocks in connection with the operation of the Fund is not unreasonable, especially in light of the fee waiver agreement among the Trust, the Adviser and Red Rocks; and |
| » | there were no material other benefits accruing to the Adviser or Red Rocks in connection with its relationship with the Fund. |
Based on the Trustees’ deliberations and their evaluation of the information described above, all of the Trustees, including all of the Independent Trustees in person at the Meeting, concluded that the Adviser’s and Red Rocks’ compensation for investment advisory services is consistent with the best interests of the Fund and its shareholders.
Jefferies Asset Management Commodity Strategy Allocation Fund
On June 8, 2010, the Trustees met in person to discuss, among other things, the approval of the Investment Advisory Agreement between the Trust and the Adviser (the “Advisory Agreement”) and the Investment Sub-Advisory Agreement among the Trust, the Adviser and Jefferies Asset Management, LLC (“JAM”), the sub-adviser for the Jefferies Asset Management Commodity Strategy Allocation Fund (the “Sub-Advisory Agreement, together with the Advisory Agreement, the “Fund Advisory Agreements”) in accordance with Section 15(a) of the 1940 Act. The Trustees were informed that the Adviser, as the investment adviser, has responsibility for the investment and management of the Fund’s assets and securities. The Independent Trustees met with independent legal counsel during executive session and discussed the Fund Advisory Agreements and other related materials.
In approving the Advisory Agreement with the Adviser and the Sub-Advisory Agreement with JAM, the Trustees, including the Independent Trustees, considered the following factors with respect to the Fund:
Investment Advisory Fee Rate: The Trustees reviewed and considered the contractual annual advisory fee to be paid by (a) the Trust, on behalf of the Fund, to the Adviser of 0.85% of the Fund’s daily average net assets and (b) by the Adviser to JAM of (i) 0.75% of the Fund’s daily average net assets, in light of the extent and quality of the advisory services provided by the Adviser and JAM to the Fund.
The Board received and considered information comparing the Fund’s contractual advisory fees and overall expenses with those of funds in both the relevant expense group and universe of funds provided by Lipper, an independent provider of investment company data, as well as the Fund’s direct competitors.
Based on such information, the Trustees further determined that the contractual annual advisory fees set forth above and the total expense ratio of 1.45% for Class A shares, 2.05% for Class C shares, and 1.15% for Class I shares of the Fund, taking into account the contractual fee waivers in place, is comparable to others within such Fund’s peer universe.
103 | October 31, 2010
Table of Contents
| Additional Information | ||||||
October 31, 2010 (Unaudited) | ||||||
Nature, Extent and Quality of the Services under the Advisory Agreement and the Sub-Advisory Agreement: The Trustees received and considered information regarding the nature, extent and quality of services provided to the Fund under the Advisory Agreement and the Sub-Advisory Agreement. The Trustees reviewed certain background materials supplied by the Adviser and JAM in each of their presentations, including their Forms ADV.
The Trustees reviewed and considered the Adviser’s and JAM’s investment advisory personnel, their history as asset managers, their performance and the amount of assets currently under management by the Adviser and JAM. The Trustees also reviewed the research and decision-making processes utilized by the Adviser and JAM, including the methods adopted to seek to achieve compliance with the investment objectives, policies and restrictions of the Fund.
The Trustees considered the background and experience of the Adviser and JAM’s management in connection with the Fund, including reviewing the qualifications, backgrounds and responsibilities of the management team primarily responsible for the day-to-day portfolio management of the Fund and the extent of the resources devoted to research and analysis of actual and potential investments.
The Trustees also reviewed, among other things, the Adviser’s and JAM’s insider trading policies and procedures and a description of their Codes of Ethics.
Performance: The Trustees noted that since the Fund had not yet begun operations, there was no performance to be reviewed or analyzed at this time.
The Advisers’ Profitability: The Trustees received and considered a profitability analysis prepared by the Adviser based on the fees payable under the Advisory Agreement. The Trustees considered the profits, if any, anticipated to be realized by the Adviser in connection with the operation of the Fund. The Board then reviewed the Adviser’s and JAM’s financial statements in order to analyze the financial condition and stability and profitability of each adviser.
Economies of Scale: The Trustees considered whether economies of scale in the provision of services to the Fund were being passed along to the shareholders.
Other Benefits to the Adviser: The Trustees reviewed and considered any other benefits derived or to be derived by the Adviser and JAM from their relationship with the Fund, including soft dollar arrangements.
In selecting the Adviser as the Fund’s investment adviser and JAM as the Fund’s sub-adviser and approving the Advisory Agreement
and Sub-Advisory Agreement and the fees charged under each agreement, the Trustees concluded that no single factor reviewed by the Trustees was identified by the Trustees to be determinative as the principal factor in whether to approve the Advisory Agreement and Sub-Advisory Agreement. Further, the Independent Trustees were advised by separate independent legal counsel throughout the process. The Trustees, including all of the Independent Trustees, concluded that:
| » | the investment advisory fees to be received by the Adviser with respect to the Fund were comparable to others within such Fund’s peer universe; |
| » | the nature, extent and quality of services rendered by the Adviser under the Advisory Agreement and by JAM under the Sub-Advisory Agreement were adequate; |
| » | the profit, if any, anticipated to be realized by the Adviser in connection with the operation of the Fund is fair to the Trust, especially in light of the fee waiver agreement between the Trust and JAM; and |
| » | there were no material other benefits accruing to the Adviser or JAM in connection with its relationship with the Fund. |
Based on the Trustees’ deliberations and their evaluation of the information described above, the Trustees, including all of the Independent Trustees, concluded that the Adviser’s and JAM’s compensation for investment advisory services is consistent with the best interests of the Fund and its shareholders.
RiverFront Long-Term Growth & Income Fund; RiverFront Moderate Growth Fund; and RiverFront Moderate Growth & Income Fund
On June 8, 2010, the Trustees met in person to discuss, among other things, the approval of the Investment Advisory Agreement between the Trust and the Adviser (the “Advisory Agreement”) and the Investment Sub-Advisory Agreement among the Trust, the Adviser and RiverFront Investment Group, LLC (“RiverFront”), the sub-adviser for the RiverFront Long-Term Growth & Income Fund, the RiverFront Moderate Growth Fund and the RiverFront Moderate Growth & Income Fund (the “RiverFront Funds”) (the “Sub-Advisory Agreement, together with the Advisory Agreement, the “Fund Advisory Agreements”) in accordance with Section 15(a) of the 1940 Act. The Trustees were informed that the Adviser, as the investment adviser, has responsibility for the investment and management of the RiverFront Funds’ assets and securities. The Independent Trustees met with independent legal counsel during executive session and discussed the Fund Advisory Agreements and other related materials.
In approving the Advisory Agreement with the Adviser and the Sub-Advisory Agreement with RiverFront, the Trustees, including the Independent Trustees, considered the following factors with respect to the RiverFront Funds:
104 | October 31, 2010
Table of Contents
| Additional Information | ||||||
October 31, 2010 (Unaudited) | ||||||
Investment Advisory Fee Rate: The Trustees reviewed and considered the contractual annual advisory fee to be paid by (a) the Trust, on behalf of the RiverFront Funds, to the Adviser of 0.90% of each of the RiverFront Fund’s daily average net assets and (b) by the Adviser to RiverFront of 0.60% of each of the RiverFront Fund’s daily average net assets, in light of the extent and quality of the advisory services provided by the Adviser and RiverFront to the RiverFront Funds.
The Board received and considered information comparing the RiverFront Funds’ contractual advisory fees and overall expenses with those of funds in both the relevant expense group and universe of funds provided by Lipper, an independent provider of investment company data, as well as each of the RiverFront Fund’s direct competitors.
Based on such information, the Trustees further determined that the contractual annual advisory fees set forth above and the total expense ratio of 1.30%, 2.05% and 1.05% for Class A, Class C and Class I shares of the RiverFront Funds, taking into account the contractual fee waivers in place, is comparable to others within such Fund’s peer universe.
Nature, Extent and Quality of the Services under the Advisory Agreement and the Sub-Advisory Agreement: The Trustees received and considered information regarding the nature, extent and quality of services provided to the RiverFront Funds under the Advisory Agreement and the Sub-Advisory Agreement. The Trustees reviewed certain background materials supplied by the Adviser and RiverFront in each of their presentations, including their Forms ADV.
The Trustees reviewed and considered the Adviser’s and RiverFront’s investment advisory personnel, their history as asset managers, their performance and the amount of assets currently under management by the Adviser and RiverFront. The Trustees also reviewed the research and decision-making processes utilized by the Adviser and RiverFront, including the methods adopted to seek to achieve compliance with the investment objectives, policies and restrictions of the RiverFront Funds.
The Trustees considered the background and experience of the Adviser and RiverFront’s management in connection with the RiverFront Funds, including reviewing the qualifications, backgrounds and responsibilities of the management team primarily responsible for the day-to-day portfolio management of the RiverFront Funds and the extent of the resources devoted to research and analysis of actual and potential investments.
The Trustees also reviewed, among other things, the Adviser’s and RiverFront’s insider trading policies and procedures and a description of their Codes of Ethics.
Performance: The Trustees noted that since none of the RiverFront Funds had begun operations, there was no performance to be reviewed or analyzed at this time.
The Advisers’ Profitability: The Trustees received and considered a profitability analysis prepared by the Adviser based on the fees payable under the Advisory Agreement, as well as a profitability analysis prepared by RiverFront based on fees payable under the Sub-Advisory Agreement. The Trustees considered the profits, if any, anticipated to be realized by the Adviser in connection with the operation of the RiverFront Funds. The Board then reviewed the Adviser’s and RiverFront’s financial statements in order to analyze the financial condition and stability and profitability of each adviser.
Economies of Scale: The Trustees considered whether economies of scale in the provision of services to the RiverFront Funds were being passed along to the shareholders.
Other Benefits to the Adviser: The Trustees reviewed and considered any other benefits derived or to be derived by the Adviser and RiverFront from their relationship with the RiverFront Funds, including soft dollar arrangements.
In selecting the Adviser as the RiverFront Funds’ investment adviser and RiverFront as the RiverFront Funds’ sub-adviser and approving the Advisory Agreement and Sub-Advisory Agreement and the fees charged under each agreement, the Trustees concluded that no single factor reviewed by the Trustees was identified by the Trustees to be determinative as the principal factor in whether to approve the Advisory Agreement and Sub-Advisory Agreement. Further, the Independent Trustees were advised by separate independent legal counsel throughout the process. The Trustees, including all of the Independent Trustees, concluded that:
| » | the investment advisory fees to be received by the Adviser with respect to the RiverFront Funds were comparable to others within such Funds’ peer universe; |
| » | the nature, extent and quality of services rendered by the Adviser under the Advisory Agreement and by RiverFront under the Sub-Advisory Agreement were adequate; |
| » | the profit, if any, anticipated to be realized by the Adviser in connection with the operation of the RiverFront Funds is fair to the Trust, especially in light of the fee waiver agreement between the Trust and the Adviser; and |
| » | there were no material other benefits accruing to the Adviser or RiverFront in connection with its relationship with the RiverFront Funds. |
Based on the Trustees’ deliberations and their evaluation of the information described above, the Trustees, including all of the Independent Trustees, concluded that the Adviser’s and RiverFront’s compensation for investment advisory services is consistent with the best interests of each RiverFront Fund and its shareholders.
105 | October 31, 2010
Table of Contents
Page intentionally left blank.
Table of Contents

Table of Contents
Page intentionally left blank.
Table of Contents
Page intentionally left blank.
Table of Contents

Table of Contents
October 31, 2010
| CONTENTS | PAGE | |
| 1 | ||
| 7 | ||
| 13 | ||
| 9 | ||
| 15 | ||
| 10 | ||
| 16 | ||
| 20 | ||
| 21 | ||
| 22 | ||
| 24 | ||
| 26 | ||
| 33 | ||
| 1-877-421-5078 | www.vulcanvaluepartners.com |
Table of Contents
October 31, 2010 (Unaudited)
We are pleased to report that the Vulcan Value Partners funds delivered solid performance for the period ended October 31, 2010; Vulcan Value Partners Fund returned 6.5% and Vulcan Value Partners Small Cap Fund returned 16.0% (all returns are net of fees). Our performance was above major market indices for the Vulcan Value Partners Small Cap Fund both year to date and for the six months ended October 31, 2010. Performance was slightly below major market indices for the Vulcan Value Partners Fund year to date and slightly above for the six months ended October 31, 2010 (See Pages 7 and 13 for fund performance)*. We place no weight on short term results, good or bad, and neither should you. We are focused on producing superior real rates of return over our five year time horizon. Everything we do is with that goal in mind, even if it hurts our results in the short run. We encourage you to place more weight on our longer term historical results and a great deal of weight on our long-term prospects. On that score, we are feeling very good.
Stated simply, we are bullish. Why?
| 1) | Most everyone we talk to is negative on the economy, the business environment, and equities in general. We acknowledge all of the challenges that give rise to these concerns but we also are acutely aware of what we are paying to bear these macro risks. Ten years ago, virtually everyone who was not a value investor was wildly bullish and valuation levels reflected this optimism. The result? Equities have provided a negative return over the last ten years. Yet, over the last decade the economy has grown, and, unlike the terrible fiscal management of the government, corporate America has done a very good job of growing values and strengthening balance sheets. The problem has not been with the performance of the companies, the problem has been the price that people paid for equities ten years ago. We believe that today is the opposite of 2000. Rampant pessimism has resulted in very attractive valuation levels. As a result, we believe that the next ten years are likely to be much better for equities than the previous decade. |
| 2) | For the past several years investors have been taking money out of equities and putting money into bonds. Since the beginning of 2009 investors have withdrawn $100 billion from U.S. stock funds and have put $620 billion into bond funds. The trend continued in the third quarter, with $43 billion flowing out of U.S. stock funds and $87 billion going into bond funds. In light of record low bond yields and very attractive stock valuation levels we view this herd mentality as extremely bullish for equities. |
| 3) | There are numerous ways to compare the attractiveness of equities to bonds and other asset classes. One measure often used is to compare earnings yields (earnings divided by price, which is the inverse of the price to earnings ratio, a calculation that compares the company’s stock price to the company’s earnings per share) to bond yields (usually the 10 year treasury). The basic idea of this comparison is that stocks are more risky than bonds but they can grow their value while bonds do not. For equities, the negative of higher risk is more or less offset by the positive of higher growth and the resulting higher long term returns. Averaging the results over many decades, this ratio of earnings yield to bond yield is close to 1.0. We pay no attention to this market metric except in cases when it is far off the average. As of the end of the quarter, the earnings yield on equities was 8% on 2011 estimates and the ten year treasury yield was 2.5%, for a ratio of 3.2 to 1. This valuation differential is at extreme levels and it is even more extreme than it looks when you adjust for record levels of cash on corporate balance sheets (more of that below). When this relationship returns to its long term average, equities should perform very well or bonds should perform very poorly, or both in combination. |
* Past performance does not guarantee future results.
Semi-Annual (Unaudited) | October 31, 2010 | 1 |
Table of Contents
Shareholder Letter
October 31, 2010 (Unaudited)
| 4) | Many corporations are in exceptional financial shape. At June 30, the most recent data available, industrial companies in the S&P 500 had a record $843 billion in cash on their balance sheets, up from $773 billion a year ago. This staggering number is equal to 11.6% of their market value and is roughly double the average percentage since 1980. Equity investors today are paying comparatively little for equities and are taking little financial risk based on historical balance sheet numbers. |
| 5) | Finally and most important, we believe in this market that the highest quality companies are often the most attractive. Since these are the companies we strive to limit ourselves to buying, we have been able to assemble portfolios full of exceptional businesses at what we believe are extremely attractive prices. Both funds are fully invested. Most of our companies are compounding their values at double digit rates. When price eventually converges with our growing values we believe we will be handsomely rewarded. Meanwhile, we will have taken on comparatively little operational or financial risk. |
So, we are bullish. On the macro front, things could get worse before they get better. If they do, our companies are well positioned to ride out the storm as they did during the recession and we believe emerge stronger than ever. If things get better faster than expected, all of the trends that have caused valuations to be so attractive should reverse and we should be rewarded sooner rather than later. We have no idea when values will be recognized but we are confident they will be eventually. That is why we are long term investors. As long as our values are rising we are content to be patient and remain bullish.
VULCAN VALUE PARTNERS FUND REVIEW
Top contributors to performance included Direct TV, Coca Cola, and Google. We went into some detail about Direct TV in the second calendar quarter of 2010 as it was one of our top contributors then as well. Since nothing has changed except that our estimate of its value is higher, we will repeat what we said three months ago: Direct TV made progress on multiple fronts. First, the company produced outstanding operational results with strong revenue gains, led by robust subscriber growth, which resulted in higher profitability and outstanding growth in free cash flow. In addition, the company improved its corporate governance by its decision to move to one class of stock. Lastly, Direct TV announced a plan to optimize its capital structure by increasing leverage and aggressively accelerating an already robust share repurchase program. Direct TV has a strong balance sheet and substantial free cash flow that is growing at high double digit rates. Meanwhile, the stock price is trading at a discount to our estimate of the company’s growing value. Therefore, we believe every dollar spent repurchasing stock results in more than a dollar of return to us, as shareholders. Even with the increased financial leverage, Direct TV’s financial leverage will remain moderate compared to its free cash flow. We applaud its management team for delivering both strong operating results and outstanding capital allocation decisions.
Coca-Cola’s global brands are delivering strong volume gains around the world, leading to double digit bottom line growth and substantial increases in free cash flow. Coca Cola derives 80% of its profits outside of North America. The company has used its very strong financial resources to reinvest in its brands and distribution network throughout the economic downturn. Those
2 | www.vulcanvaluepartners.com |
Table of Contents
Shareholder Letter
October 31, 2010 (Unaudited)
investments are paying off and the stock market is beginning to recognize Coca-Cola’s impressive results. Even though the company’s shares have risen recently, its value has compounded consistently since we purchased it. A decade ago, Coca Cola carried an aggressive valuation. Despite two recessions in the U.S., the company has grown its value significantly over the last ten years while its stock price has gone nowhere. Consequently, its valuation is modest in relation to its prospects. In fact, compared to ten years ago, the company is more exposed to rapidly growing emerging and developing economies, its brand portfolio is more robust, its worldwide distribution strengths are greater, and its brands are stronger. In our view, Coca-Cola has only gotten better. The reason it has been a poor investment over the last ten years is that its valuation was too high then. Today, we believe it is too low. The next ten years look very promising.
Google is a wonderful company to own. Its value consistently compounds, it generates tremendous free cash flow, and management is relentlessly focused on strengthening the company’s competitive position. Earlier this year, we were pleased to be featured in an article in Bloomberg BusinessWeek entitled “Google a Value Play? Really?” Yes, really: Google has roughly $100 a share in net cash and significant non-earning but very valuable assets that are poised to become highly profitable soon (YouTube, Android). Adjusting for these assets and cash, its core search business, which Google dominates globally, is very attractively priced. Why is Google cheap? We think one reason is that the company does not issue any earnings guidance whatsoever. Google’s conference calls are refreshingly centered around competitive position, corporate strategy, and building long term value. We wish every company’s conference calls were like Google’s. Despite the fact that Google does not offer guidance, Wall Street analysts forecast detailed quarterly earnings estimates for the company. Google routinely reports double digit growth, coupled with strong free cash flow generation. However, when its earnings per share is a penny or two shy of the “whisper numbers” that it is supposed to beat, the stock sells off. Whenever Google “misses” earnings estimates and only grows 18% instead of 20% it is usually because it is investing to strengthen its competitive advantage and build long term value. The value goes up, the stock goes down, and we buy more. As Ben Graham, a noted value investor, stated many years ago, the market is a weighing machine in the long run while it is a voting machine in the short run. Year to date the market weighed Google’s growing value a little more accurately.
Detractors to performance included Dell, Hewlett-Packard, and Whirlpool Corp.
Dell is one of the largest PC makers in the world. A majority of Dell’s revenue comes from business customers. The acquisition of Perot Systems in 2009 should allow Dell to offer IT services, but Dell paid a very high multiple for Perot. Dell has historically generated substantial free cash flow, and has a large cash balance. However it has had trouble executing on its business plan and is facing pressure by some larger and more diversified competitors, which seems to have been the motivation for acquiring Perot at such a high price. Therefore despite its valuation, which we regard as attractive, because of the issues facing Dell as a business, we made the decision to exit the position and redeploy the cash into positions we viewed as more attractive.
Hewlett-Packard has been a bit of a soap opera in the year to date. The reason we demand a margin of safety in terms of value over price is to protect us from unknowable events. We had no idea that Mark Hurd, who had done a wonderful job running Hewlett-Packard, would fall out of
Semi-Annual (Unaudited) | October 31, 2010 | 3 |
Table of Contents
Shareholder Letter
October 31, 2010 (Unaudited)
favor with the board of directors and leave the company. We have a favorable impression of Hewlett-Packard’s new CEO, Leo Apotheker. The company has a very strong balance sheet, is highly profitable, is a dominant force in the global technology industry, and we believe its price is very discounted. We are not pleased with the drama of the last several months but we are willing to put up with all of the noise to own one of the premier technology companies in the world at a single digit price to free cash flow ratio.
In spite of a severe U.S. housing recession, Whirlpool Corp. is generating strong free cash flow, producing double digit bottom line results, and building its brands around the world, with notable success in Brazil and India, Whirlpool Corp. has the number one market position in the U.S., where only 10% of its business is dependent on new home construction. Our value is growing. The stock is dropping. As our partners, you can surmise what we are doing.
As this letter is being written, the Vulcan Value Partners Fund is fully invested. We believe its weighted average price to value ratio is very attractive, our estimates of the values of the companies we own are growing, and we continue to find qualifying investments.
VULCAN VALUE PARTNERS SMALL CAP FUND REVIEW
There is a moderate amount of overlap between our Vulcan Value Partners Fund and our Vulcan Value Partners Small Cap Fund, so sometimes the top contributors overlap as well. This overlap occurs primarily because sometimes the companies we purchase for Vulcan Value Partners Small Cap Fund grow into companies large enough for Vulcan Value Partners Fund over time.
Top contributors to performance included Everest RE, Discovery Communications, and Dr. Pepper Snapple Group. Everest RE combines two of the qualities we prize; it is attractively valued and very well managed. The company provides reinsurance in the U.S., Bermuda and International markets. Despite a soft underwriting market, the company is compounding its value at double digit rates through intelligent capital allocation and disciplined underwriting. Its formidable balance sheet is getting stronger. When the hard market eventually returns, we believe Everest RE will have ample capacity to write business at attractive prices.
Discovery Communications is a cable programming company that has great assets in its programming. Channels include Discovery, Animal Planet and OWN. Discovery Communications generated strong free cash flow and improved profitability. The company is benefitting from strong ratings, steadily growing affiliate fees, and an improving advertising climate.
Dr. Pepper Snapple Group is a non alcoholic beverage company whose brands include Dr. Pepper, Sunkist, Canada Dry and 7UP. Dr. Pepper Snapple was spun out of Cadbury Schweppes in 2008. The company generated substantial free cash flow, strengthened its balance sheet by paying down debt, and initiated a share repurchase program. The company received a windfall from new distribution agreements with Coca Cola and Pepsi. Dr. Pepper Snapple Group is performing very well in the market place and growing its market share with new products and successful advertising.
4 | www.vulcanvaluepartners.com |
Table of Contents
Shareholder Letter
October 31, 2010 (Unaudited)
Detractors to performance included Investment Technology Group, Heartland Payment Systems, and Sonic Corp.
Investment Technology Group has one of the best price to value ratios of any company we own (the price to value ratio is a calculation that compares the price of a company’s stock to our estimate of the company’s intrinsic value). Investment Technology Group is extremely out of favor. Why? Because their core customers are long only, active equity managers who are suffering withdrawals as investors take money out of stocks and put them into bonds (see point number 2 above as to why we are bullish). Investment Technology Group operates off exchange trading platforms, sometimes called “dark pools.” In fact, it is one of three firms that dominate that business. Investment Technology Group’s earnings are cyclical and difficult to forecast in the short run because it has a fixed cost base and revenues depend on trading volumes. With trading volumes down due to equity outflows their current earnings are depressed. In 2008 it earned $2.61 per share. This year it should earn a little more than $1.00 per share. Its long term earnings power is somewhere in between. Investment Technology Group has just under $8.00 per share of net cash on its balance sheet, zero debt, generates healthy free cash flow, and is repurchasing its shares which traded for approximately $14. This is not a typo. During the third calendar quarter of 2010 it was trading for $6.00, net of cash, or 6 times its current depressed earnings.
Heartland Payment Systems processes debit and credit card transactions for merchants in the US, Europe, Russia, and Asia. Heartland Payment Systems’ results year to date have been poor, as their small merchant customers are still suffering from less than robust consumer spending and the company invested heavily in its sales force in anticipation of an improving environment. We applaud them for managing their business to build long-term value instead of being overly concerned with short term, quarterly results. Our appraisal of its value grew as Heartland settled substantially all of its data breach liabilities for less than our earlier conservative estimates.
Sonic Corp. owns and franchises Quick Serve Drive In restaurants. Sonic is typical of Heartland Payment Systems’ customers. Consumers are reticent to spend as they rebuild their personal balance sheets and unemployment remains high. As a result, Sonic Corp.’s same restaurant sales remain weak. As the economy continues to improve we expect employment growth to improve along with it and for Sonic Corp.’s sales trends to follow. In the meantime, the company continues to produce strong free cash flow, which it is using to pay down debt and strengthen its balance sheet.
As this letter is being written, Vulcan Value Partners Small Cap Fund is fully invested. We believe its weighted average price to value ratio is very attractive, our estimates of the values of the companies we own are growing, and we continue to find qualifying investments.
CLOSING
We have been able to deliver solid results since the funds began operations in December 2009. More important, we believe the prospective returns implied by our discounted price to value ratios and consistent value growth are very compelling. Neither is by accident. Our research team has been very productive and very disciplined in executing our investment philosophy. I could not be more proud to associate myself with our outstanding research team comprised of Bruce Donnellan, Hampton McFadden,
Semi-Annual (Unaudited) | October 31, 2010 | 5 |
Table of Contents
Shareholder Letter
October 31, 2010 (Unaudited)
Allen Cox, and our newest addition, Mac Dunbar (a registered representative of ALPS Distributors, Inc.). I bring up the rear.
The stable capital entrusted to us by you is the cornerstone of our ability to execute our investment philosophy. Because of you we are able to make what we believe are rational long term investment decisions when others are reacting to short term market noise. We take the confidence you have placed in us very seriously with our capital invested along side of yours.
We hope you and your families enjoy the upcoming holiday season and we look forward to updating you again early in the New Year.
Sincerely,
C.T. Fitzpatrick
Chief Investment Officer
6 | www.vulcanvaluepartners.com |
Table of Contents
October 31, 2010 (Unaudited)
Cumulative Total Returns | (as of 10/31/2010) |
Since Inception* | Expense Ratios**
| |||||||||
6 month
| Since Inception*
| (as of 9/30/2010)
| Gross
| Net***
| ||||||
Vulcan Value Partners Fund | 0.76% | 6.50% | 1.30% | 4.98% | 1.51% | |||||
S&P 500 Index(1) | 0.74% | 6.76% | 2.85% | |||||||
Performance data quoted represents past performance. Past performance does not guarantee future results. Investment return and principal value of an investment will fluctuate so that an investor’s shares, when sold or redeemed, may be worth more or less than the original cost. Current performance data may be higher or lower than actual data quoted. For the most current month-end performance data, please call 1-877-421-5078.
The Vulcan Value Partners Fund is a new fund with limited operating history. The table does not reflect the deduction of taxes that a shareholder would pay on Fund distributions or the redemption of Fund shares.
Subject to investment risks, including possible loss of the principal amount invested.
| * | Fund Inception date of 12/30/09. |
| ** | The gross and net expense ratios are as stated in the “Fees and Expenses of the Fund” in the Fund’s current prospectus. |
| *** | Vulcan Value Partners, LLC (“Vulcan” or the “Adviser”) has given a contractual agreement to the Fund that to the extent the Total Annual Fund Operating Expenses (as defined in Item 3 of Form N-1A) with respect to the Fund (exclusive of Acquired Fund Fees and Expenses (if any), brokerage expenses, interest expense, taxes and extraordinary expenses) (“Designated Annual Fund Operating Expenses”) exceed 1.50% of the Fund’s average daily net assets for a particular fiscal year of the Fund, the Adviser will reduce the Management Fee and/or Other Expenses otherwise payable to the Adviser with respect to the Fund for the fiscal year by an amount equal to such excess, and/or the Adviser shall reimburse the Fund by the amount of such excess. This agreement is in effect through August 31, 2011 and will be reevaluated on an annual basis thereafter. Without this agreement, expenses could be higher. If the Adviser foregoes any fees and/or reimburses the Fund pursuant to this letter agreement with respect to a particular fiscal year, then the Adviser shall be entitled to recover from the Fund the amount foregone or reimbursed to the extent Designated Annual Fund Operating Expenses are less than 1.50% of the Fund’s average daily net assets during any fiscal year following such fiscal year. |
Semi-Annual (Unaudited) | October 31, 2010 | 7 |
Table of Contents
Fund Overview
October 31, 2010 (Unaudited)
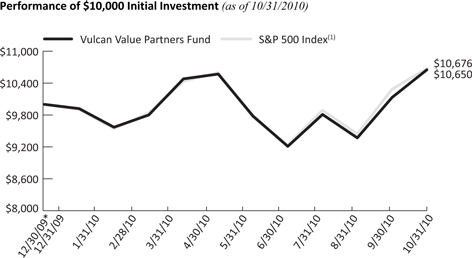
The chart above represents historical performance of a hypothetical investment of $10,000 in the Fund since inception.
| * | Fund Inception date of 12/30/09. |
| (1) | The S&P 500 Index is an unmanaged index of 500 common stocks chosen for market size, liquidity and industry group representation. It is a market-value weighted index. The S&P 500 Index figures do not reflect any fees, expenses or taxes. Investors cannot invest directly in this index. |
8 | ww.vulcanvaluepartners.com |
Table of Contents
October 31, 2010 (Unaudited)
As a shareholder of the Vulcan Value Partners Fund (the “Fund”), you will incur two types of costs: (1) transaction costs, including applicable redemptions fees; and (2) ongoing costs, including management fees and other Fund expenses. The following examples are intended to help you understand your ongoing costs(in dollars) of investing in the Fund and to compare these costs with the ongoing costs of investing in other mutual funds. The examples are based on an investment of $1,000 invested on May 1, 2010 and held until October 31, 2010.
Actual Expenses. The first line of each table below provides information about actual account values and actual expenses. You may use the information in this line, together with the amount you invested, to estimate the expenses that you paid over the period. Simply divide your account value by $1,000 (for example, an $8,600 account value divided by $1,000 = 8.6), then multiply the result by the number in the first line under the heading “Expenses Paid During Period” to estimate the expenses you paid on your account during this period.
Hypothetical Example for Comparison Purposes. The second line of the each table below provides information about hypothetical account values and hypothetical expenses based on the Fund’s actual expense ratio and an assumed rate of return of 5% per year before expenses, which is not the Fund’s actual return. The hypothetical account values and expenses may not be used to estimate the actual ending account balance or expenses you paid for the period. You may use this information to compare the ongoing costs of investing in the Fund and other mutual funds. To do so, compare this 5% hypothetical example with the 5% hypothetical examples that appear in the shareholder reports of the other funds. The expenses shown in the table are meant to highlight ongoing Fund costs only and do not reflect transaction fees, such as redemption fees or exchange fees. Therefore, the second line of each table below is useful in comparing ongoing costs only, and may not help you determine the relative total costs of owning different funds. In addition, if these transactional costs were included, your costs would have been higher.
| Beginning Account Value 5/1/10 | Ending Account Value 10/31/10 | Expense Ratio(a) | Expenses Paid During period 5/1/10 to 10/31/10(b) | |||||||||||
Vulcan Value Partners Fund | ||||||||||||||
Actual Fund Return | $ 1,000.00 | $ 1,007.60 | 1.50% | $ 7.59 | ||||||||||
Hypothetical Fund Return | $ 1,000.00 | $ 1,017.64 | 1.50% | $ 7.63 | ||||||||||
| (a) | The Fund’s expense ratios have been based on the Fund’s most recent fiscal half-year expenses. |
| (b) | Expenses are equal to the Fund’s annualized expense ratio, multiplied by the average account value over the period, multiplied by the number of days in the most recent fiscal half-year (184)/365. |
Semi-Annual (Unaudited) | October 31, 2010 | 9 |
Table of Contents
October 31, 2010 (Unaudited) |
| Shares | Value (Note 1) | |||||||
COMMON STOCKS (98.82%) | ||||||||
COMMUNICATIONS (28.22%) | ||||||||
Internet (6.91%) | ||||||||
Google, Inc., Class A(a) | 1,783 | $ | 1,092,961 | |||||
Media (21.31%) | ||||||||
Comcast Corp., Class A | 40,170 | 776,486 | ||||||
DIRECTV, Class A(a) | 21,792 | 947,081 | ||||||
Discovery Communications, Inc., Class A(a) | 6,805 | 303,571 | ||||||
Time Warner Cable, Inc. | 12,244 | 708,560 | ||||||
The Walt Disney Co. | 17,528 | 632,936 | ||||||
| 3,368,634 | ||||||||
TOTAL COMMUNICATIONS | 4,461,595 | |||||||
CONSUMER, CYCLICAL (7.15%) | ||||||||
Home Furnishings (3.98%) | ||||||||
Whirlpool Corp. | 8,294 | 628,934 | ||||||
Leisure Time (3.17%) | ||||||||
Harley-Davidson, Inc. | 16,348 | 501,557 | ||||||
TOTAL CONSUMER, CYCLICAL | 1,130,491 | |||||||
CONSUMER, NON-CYCLICAL (41.35%) | ||||||||
Beverages (10.50%) | ||||||||
The Coca-Cola Co. | 11,155 | 684,024 | ||||||
Diageo PLC, Sponsored ADR | 8,898 | 658,452 | ||||||
Dr Pepper Snapple Group, Inc. | 8,696 | 317,839 | ||||||
| 1,660,315 | ||||||||
Commercial Services (7.06%) | ||||||||
Mastercard, Inc., Class A | 4,648 | 1,115,799 | ||||||
Cosmetics & Personal Care (1.98%) | ||||||||
The Procter & Gamble Co. | 4,919 | 312,701 | ||||||
Healthcare-Products (11.70%) | ||||||||
C.R. Bard, Inc. | 5,505 | 457,576 | ||||||
Johnson & Johnson | 10,641 | 677,512 | ||||||
Medtronic, Inc. | 20,295 | 714,587 | ||||||
| 1,849,675 | ||||||||
10 | www.vulcanvaluepartners.com |
Table of Contents
Statement of Investments
Vulcan Value Partners Fund | October 31, 2010 (Unaudited) |
| Shares | Value (Note 1) | |||||||
CONSUMER, NON-CYCLICAL (continued) | ||||||||
Household Products & Wares (4.15%) | ||||||||
Church & Dwight Co., Inc. | 5,527 | $ | 363,953 | |||||
Fortune Brands, Inc. | 5,406 | 292,194 | ||||||
| 656,147 | ||||||||
Pharmaceuticals (5.96%) | ||||||||
Teva Pharmaceutical Industries, Ltd., Sponsored ADR | 18,168 | 942,919 | ||||||
TOTAL CONSUMER, NON-CYCLICAL | 6,537,556 | |||||||
FINANCIAL (8.67%) | ||||||||
Insurance (8.67%) | ||||||||
Chubb Corp. | 12,139 | 704,305 | ||||||
Everest Re Group, Ltd. | 7,918 | 667,329 | ||||||
| 1,371,634 | ||||||||
TOTAL FINANCIAL | 1,371,634 | |||||||
TECHNOLOGY (13.43%) | ||||||||
Computers (4.29%) | ||||||||
Hewlett-Packard Co. | 16,127 | 678,302 | ||||||
Semiconductors (4.48%) | ||||||||
Texas Instruments, Inc. | 23,942 | 707,965 | ||||||
Software (4.66%) | ||||||||
Microsoft Corp. | 27,701 | 737,954 | ||||||
TOTAL TECHNOLOGY | 2,124,221 | |||||||
TOTAL COMMON STOCKS (Cost $14,469,809) | 15,625,497 | |||||||
Semi-Annual (Unaudited) | October 31, 2010 | 11 |
Table of Contents
Statement of Investments
| Vulcan Value Partners Fund | October 31, 2010 (Unaudited) |
| 7-Day Yield | Shares | Value (Note 1) | ||||||||
SHORT TERM INVESTMENTS (1.38%) | ||||||||||
MONEY MARKET FUND (1.38%) | ||||||||||
Dreyfus Treasury Prime Cash Management Fund, Institutional Shares | 0.00241% | 218,913 | $ 218,913 | |||||||
TOTAL SHORT TERM INVESTMENTS (Cost $218,913) | 218,913 | |||||||||
TOTAL INVESTMENTS (100.20%) (Cost $14,688,722) | $ 15,844,410 | |||||||||
Liabilities In Excess Of Other Assets (-0.20%) | (32,056) | |||||||||
NET ASSETS (100.00%) | $ 15,812,354 | |||||||||
| (a) | Non-Income Producing Security. |
See Accompanying Notes to Financial Statements.
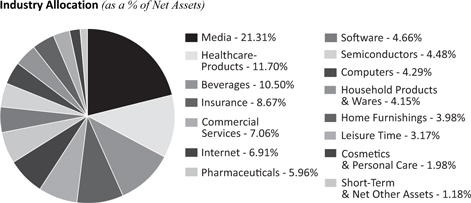
For Fund compliance purposes, the Fund’s industry classifications refer to any one or more of the industry sub-classifications used by one or more widely recognized market indexes or ratings group indexes, and/or as defined by Fund management. This definition may not apply for purposes of this report, which may combine industry subclassifications for reporting ease. Industries are shown as a percent of net assets. These industry classifications are based on third-party definitions. The definitions are industry terms and do not reflect the legal status of any of the investments or the companies in which the Fund has invested.
12 | www.vulcanvaluepartners.com |
Table of Contents
Fund Overview
October 31, 2010 (Unaudited)
VULCAN VALUE PARTNERS SMALL CAP FUND
Cumulative Total Returns | (as of 10/31/2010) |
| Since Inception* | Expense Ratios**
| |||||||||
6 month
| Since
| (as of
| Gross
| Net***
| ||||||
Vulcan Value Partners Small Cap Fund | 0.00% | 16.00% | 13.80% | 7.33% | 1.52% | |||||
S&P 500 Index(1) | -1.85% | 12.15% | 7.74% | |||||||
Performance data quoted represents past performance. Past performance does not guarantee future results. Investment return and principal value of an investment will fluctuate so that an investor’s shares, when sold or redeemed, may be worth more or less than the original cost. Current performance data may be higher or lower than actual data quoted. For the most current month-end performance data, please call 1-877-421-5078.
The Vulcan Value Partners Small Cap Fund is a new fund with limited operating history. The table does not reflect the deduction of taxes that a shareholder would pay on Fund distributions or the redemption of Fund shares.
Subject to investment risks, including possible loss of the principal amount invested.
| * | Fund Inception date of 12/30/09. |
| ** | The gross and net expense ratios are as stated in the “Fees and Expenses of the Fund” in the Fund’s current prospectus. |
| *** | Vulcan Value Partners, LLC (“Vulcan” or the “Adviser”) has given a contractual agreement to the Fund that to the extent the Total Annual Fund Operating Expenses (as defined in Item 3 of Form N-1A) with respect to the Fund (exclusive of Acquired Fund Fees and Expenses (if any), brokerage expenses, interest expense, taxes and extraordinary expenses) (“Designated Annual Fund Operating Expenses”) exceed 1.50% of such Fund’s average daily net assets for a particular fiscal year of the Fund, the Adviser will reduce the Management Fee and/or Other Expenses otherwise payable to the Adviser with respect to the Fund for such fiscal year by an amount equal to such excess, and/or the Adviser shall reimburse the Fund by the amount of such excess. This agreement is in effect through August 31, 2011 and will be reevaluated on an annual basis thereafter. Without this agreement, expenses could be higher. If the Adviser foregoes any fees and/or reimburses the Fund pursuant to this letter agreement with respect to a particular fiscal year, then the Adviser shall be entitled to recover from the Fund the amount foregone or reimbursed to the extent Designated Annual Fund Operating Expenses are less than 1.50% of the Fund’s average daily net assets during any fiscal year following such fiscal year. |
Semi-Annual (Unaudited) | October 31, 2010 | 13 |
Table of Contents
Fund Overview
October 31, 2010 (Unaudited)
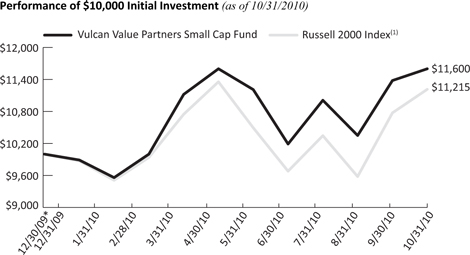
The chart above represents historical performance of a hypothetical investment of $10,000 in the Fund since inception.
| * | Fund Inception date of 12/30/09. |
| (1) | The Russell 2000 Index includes the 2000 firms from the Russell 3000 Index with the smallest market capitalizations. The Russell 2000 Index figures do not reflect any fees, expenses or taxes. Investors cannot invest directly in this index. |
14 | www.vulcanvaluepartners.com |
Table of Contents
Disclosure of Fund Expenses
October 31, 2010 (Unaudited)
As a shareholder of the Vulcan Value Partners Fund (the “Fund”), you will incur two types of costs: (1) transaction costs, including applicable redemptions fees; and (2) ongoing costs, including management fees and other Fund expenses. The following examples are intended to help you understand your ongoing costs(in dollars) of investing in the Fund and to compare these costs with the ongoing costs of investing in other mutual funds. The examples are based on an investment of $1,000 invested on May 1, 2010 and held until October 31, 2010.
Actual Expenses. The first line of each table below provides information about actual account values and actual expenses. You may use the information in this line, together with the amount you invested, to estimate the expenses that you paid over the period. Simply divide your account value by $1,000 (for example, an $8,600 account value divided by $1,000 = 8.6), then multiply the result by the number in the first line under the heading “Expenses Paid During Period” to estimate the expenses you paid on your account during this period.
Hypothetical Example for Comparison Purposes. The second line of the each table below provides information about hypothetical account values and hypothetical expenses based on the Fund’s actual expense ratio and an assumed rate of return of 5% per year before expenses, which is not the Fund’s actual return. The hypothetical account values and expenses may not be used to estimate the actual ending account balance or expenses you paid for the period. You may use this information to compare the ongoing costs of investing in the Fund and other mutual funds. To do so, compare this 5% hypothetical example with the 5% hypothetical examples that appear in the shareholder reports of the other funds. The expenses shown in the table are meant to highlight ongoing Fund costs only and do not reflect transaction fees, such as redemption fees or exchange fees. Therefore, the second line of each table below is useful in comparing ongoing costs only, and may not help you determine the relative total costs of owning different funds. In addition, if these transactional costs were included, your costs would have been higher.
Vulcan Value Partners Small Cap Fund
| Beginning Account Value 5/1/10 | Ending Account Value 10/31/10 | Expense Ratio(a) | Expenses Paid 10/31/10(b) | |||||||||
Vulcan Value Partners Small Cap Fund | ||||||||||||
Actual Fund Return | $ 1,000.00 | $ 1,000.00 | 1.50% | $ 7.56 | ||||||||
Hypothetical Fund Return | $ 1,000.00 | $ 1,017.64 | 1.50% | $ 7.63 | ||||||||
| (a) | The Fund’s expense ratios have been annualized based on the Fund’s most recent Fiscal half-year expenses. |
| (b) | Expenses are equal to the Fund’s annualized expense ratio, multiplied by the average account value over the period, multiplied by the number of days in the most recent fiscal half-year (184)/365. |
Semi-Annual (Unaudited) | October 31, 2010 | 15 |
Table of Contents
Statement of Investments
| October 31, 2010 (Unaudited) |
| Shares | Value (Note 1) | |||||||
COMMON STOCKS (99.67%) | ||||||||
COMMUNICATIONS (2.04%) | ||||||||
Media (2.04%) | ||||||||
Discovery Communications, Inc., Class A(a) | 7,972 | $ | 355,631 | |||||
TOTAL COMMUNICATIONS | 355,631 | |||||||
CONSUMER, CYCLICAL (20.57%) | ||||||||
Entertainment (3.40%) | ||||||||
Speedway Motorsports, Inc. | 38,676 | 591,743 | ||||||
Leisure Time (4.49%) | ||||||||
Harley-Davidson, Inc. | 25,492 | 782,095 | ||||||
Retail (12.68%) | ||||||||
Jos A Bank Clothiers, Inc.(a) | 17,142 | 747,391 | ||||||
Nathan’s Famous, Inc.(a) | 43,828 | 702,563 | ||||||
Sonic Corp.(a) | 85,473 | 759,000 | ||||||
| 2,208,954 | ||||||||
TOTAL CONSUMER, CYCLICAL | 3,582,792 | |||||||
CONSUMER, NON-CYCLICAL (26.03%) | ||||||||
Beverages (3.99%) | ||||||||
Dr Pepper Snapple Group, Inc. | 19,021 | 695,218 | ||||||
Commercial Services (13.49%) | ||||||||
Global Payments, Inc. | 20,539 | 800,199 | ||||||
Heartland Payment Systems, Inc. | 53,341 | 761,709 | ||||||
Towers Watson & Co., Class A | 15,334 | 788,474 | ||||||
| 2,350,382 | ||||||||
Food (4.06%) | ||||||||
Del Monte Foods Co. | 49,337 | 707,493 | ||||||
Healthcare-Services (4.49%) | ||||||||
Genoptix, Inc.(a) | 45,936 | 781,830 | ||||||
TOTAL CONSUMER, NON-CYCLICAL | 4,534,923 | |||||||
16 | www.vulcanvaluepartners.com |
Table of Contents
Statement of Investments
Vulcan Value Partners Small Cap Fund | October 31, 2010 (Unaudited) |
| Shares | Value (Note 1) | |||||||
ENERGY (3.64%) | ||||||||
Oil&Gas Services (3.64%) | ||||||||
Bolt Technology Corp.(a) | 57,055 | $ | 633,881 | |||||
TOTAL ENERGY | 633,881 | |||||||
FINANCIAL (23.47%) | ||||||||
Diversified Financial Services (9.06%) | ||||||||
Investment Technology Group, Inc.(a) | 53,758 | 765,514 | ||||||
The NASDAQ OMX Group, Inc.(a) | 38,694 | 813,348 | ||||||
| 1,578,862 | ||||||||
Insurance (14.41%) | ||||||||
Brown & Brown, Inc. | 16,685 | 371,909 | ||||||
Everest Re Group, Ltd. | 12,473 | 1,051,225 | ||||||
Markel Corp.(a) | 962 | 322,289 | ||||||
ProAssurance Corp.(a) | 13,301 | 764,674 | ||||||
| 2,510,097 | ||||||||
TOTAL FINANCIAL | 4,088,959 | |||||||
INDUSTRIAL (12.05%) | ||||||||
Hand & Machine Tools (2.99%) | ||||||||
Lincoln Electric Holdings, Inc. | 8,730 | 521,705 | ||||||
Machinery-Diversified (4.54%) | ||||||||
Hurco Cos., Inc.(a) | 42,946 | 790,206 | ||||||
Miscellaneous Manufacturers (4.52%) | ||||||||
Donaldson Co., Inc. | 16,157 | 787,169 | ||||||
TOTAL INDUSTRIAL | 2,099,080 | |||||||
TECHNOLOGY (11.87%) | ||||||||
Computers (3.54%) | ||||||||
Jack Henry & Associates, Inc. | 22,712 | 616,858 | ||||||
Software (8.33%) | ||||||||
Dun & Bradstreet Corp. | 10,165 | 756,378 | ||||||
Semi-Annual (Unaudited) | October 31, 2010 | 17 |
Table of Contents
Statement of Investments
Vulcan Value Partners Small Cap Fund | October 31, 2010 (Unaudited) |
| Shares | Value (Note 1) | |||||||||
TECHNOLOGY (continued) | ||||||||||
Fair Isaac Corp. | 28,906 | $ 694,900 | ||||||||
| 1,451,278 | ||||||||||
TOTAL TECHNOLOGY | 2,068,136 | |||||||||
TOTAL COMMON STOCKS (Cost $16,008,710) | 17,363,402 | |||||||||
| 7-Day Yield | Shares | Value (Note 1) | ||||||||
SHORT TERM INVESTMENTS (0.21%) | ||||||||||
MONEY MARKET FUND (0.21%) | ||||||||||
Dreyfus Treasury Prime Cash Management Fund, Institutional Shares | 0.00241% | 35,960 | 35,960 | |||||||
TOTAL SHORT TERM INVESTMENTS (Cost $35,960) | 35,960 | |||||||||
TOTAL INVESTMENTS (99.88%) (Cost $16,044,670) | $ | 17,399,362 | ||||||||||
Other Assets In Excess Of Liabilities (0.12%) | 21,715 | |||||||||||
NET ASSETS (100.00%) | $ | 17,421,077 | ||||||||||
| (a) | Non-Income Producing Security. |
See Accompanying Notes to Financial Statements.
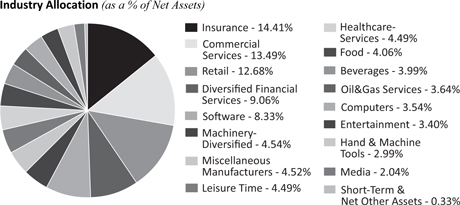
18 | www.vulcanvaluepartners.com |
Table of Contents
Statement of Investments
| Vulcan Value Partners Small Cap Fund | | October 31, 2010 (Unaudited) | |
For Fund compliance purposes, the Fund’s industry classifications refer to any one or more of the industry sub-classifications used by one or more widely recognized market indexes or ratings group indexes, and/or as defined by Fund management. This definition may not apply for purposes of this report, which may combine industry subclassifications for reporting ease. Industries are shown as a percent of net assets. These industry classifications are based on third-party definitions. The definitions are industry terms and do not reflect the legal status of any of the investments or the companies in which the Fund has invested.
Semi-Annual (Unaudited) | October 31, 2010 | 19 |
Table of Contents
Statements of Assests and Liabilities
October 31, 2010 (Unaudited)
Vulcan Value Partners Fund | Vulcan Value Partners Small Cap Fund | |||||||
ASSETS: | ||||||||
Investments, at value | $ | 15,844,410 | $ 17,399,362 | |||||
Receivable for shares sold | 41,915 | 25,000 | ||||||
Interest and dividends receivable | 7,172 | 4,445 | ||||||
Receivable due from advisor | 5,635 | 12,462 | ||||||
Other assets | 11,898 | 11,851 | ||||||
Total assets | 15,911,030 | 17,453,120 | ||||||
LIABILITIES: | ||||||||
Payable for investments purchased | 62,580 | – | ||||||
Payable for shares redeemed | 4,977 | – | ||||||
Payable for administration fees | 8,650 | 9,436 | ||||||
Payable for transfer agency fees | 5,984 | 6,433 | ||||||
Payable to trustees | 1,183 | 646 | ||||||
Payable for principal financial officer fees | 415 | 415 | ||||||
Accrued expenses and other liabilities | 14,887 | 15,113 | ||||||
Total liabilities | 98,676 | 32,043 | ||||||
NET ASSETS | $ | 15,812,354 | $ 17,421,077 | |||||
NET ASSETS CONSIST OF: | ||||||||
Paid-in capital | $ | 14,589,881 | $ 15,643,486 | |||||
Undistibuted net investment income/(loss) | 9,526 | (41,225) | ||||||
Accumulated net realized gain on investments | 57,259 | 464,124 | ||||||
Net unrealized appreciation in value of investments | 1,155,688 | 1,354,692 | ||||||
NET ASSETS | $ | 15,812,354 | $ 17,421,077 | |||||
INVESTMENTS, AT COST | $ | 14,688,722 | $ 16,044,670 | |||||
PRICING OF SHARES: | ||||||||
Net Asset Value, offering and redemption price per share | $ | 10.65 | $ 11.60 | |||||
Shares of beneficial interest outstanding (unlimited number of shares, no par value common stock authorized) | 1,484,644 | 1,501,627 | ||||||
See Accompanying Notes to Financial Statements.
20 | www.vulcanvaluepartners.com |
Table of Contents
For the Six Months Ended October 31, 2010 (Unaudited)
Vulcan Value Partners Fund | Vulcan Value Partners Small Cap Fund | |||||||
INVESTMENT INCOME: | ||||||||
Dividends | $ | 109,080 | $ | 54,657 | ||||
Foreign taxes withheld | (453) | – | ||||||
Interest | 6 | 18 | ||||||
Total income | 108,633 | 54,675 | ||||||
EXPENSES: | ||||||||
Investment advisory fees | 68,401 | 79,916 | ||||||
Administrative fees | 56,888 | 51,027 | ||||||
Transfer agency fees | 26,201 | 29,081 | ||||||
Legal and audit fees | 9,723 | 11,334 | ||||||
Offering cost | 20,454 | 20,535 | ||||||
Custodian fees | 6,050 | 6,050 | ||||||
Principal financial officer fees | 2,521 | 2,521 | ||||||
Trustees’ fees and expenses | 2,195 | 1,788 | ||||||
Other | 7,163 | 6,028 | ||||||
Total expenses before waiver | 199,596 | 208,280 | ||||||
Less fees waived/reimbursed by investment advisor | (96,993) | (112,380) | ||||||
Total net expenses | 102,603 | 95,900 | ||||||
NET INVESTMENT INCOME/(LOSS) | 6,030 | (41,225) | ||||||
Net realized gain on investments | 58,911 | 133,974 | ||||||
Net change in unrealized appreciation of investments | 255,531 | 664,183 | ||||||
NET REALIZED AND UNREALIZED GAIN ON INVESTMENTS | 314,442 | 798,157 | ||||||
NET INCREASE IN NET ASSETS RESULTING FROM OPERATIONS | $ | 320,472 | $ | 756,932 | ||||
See Accompanying Notes to Financial Statements.
Semi-Annual (Unaudited) | October 31, 2010 | 21 |
Table of Contents
Statements of Changes in Net Assets
| Vulcan Value Partners Fund | ||||||||
For the Six Months Ended October 31, 2010 (Unaudited) | For the Period December 30, 2009 (Inception) to April 30, 2010 | |||||||
OPERATIONS: | ||||||||
Net investment income/(loss) | $ 6,030 | $ (1,471) | ||||||
Net realized gain/(loss) on investments | 58,911 | (1,652) | ||||||
Net change in unrealized appreciation on investments | 255,531 | 900,157 | ||||||
Net increase in net assets resulting from operations | 320,472 | 897,034 | ||||||
SHARE TRANSACTIONS: (NOTE 3) | ||||||||
Proceeds from sales of shares | 2,823,136 | 12,180,711 | ||||||
Cost of shares redeemed, net of redemption fees | (138,341) | (270,658) | ||||||
Net Increase from share transactions | 2,684,795 | 11,910,053 | ||||||
Net increase in net assets | 3,005,267 | 12,807,087 | ||||||
NET ASSETS: | ||||||||
Beginning of period | 12,807,087 | – | ||||||
End of period (including undistributed net investment income of $9,526 and $3,496, respectively) | $ 15,812,354 | $ 12,807,087 | ||||||
See Accompanying Notes to Financial Statements.
22 | www.vulcanvaluepartners.com |
Table of Contents
Statements of Changes in Net Assets
| Vulcan Value Partners Small Cap Fund | ||||||||
For the Six Months Ended | For the Period December 30, 2009 (Inception) to April 30, 2010 | |||||||
OPERATIONS: | ||||||||
Net investment loss | $ | (41,225) | $ | (7,493) | ||||
Net realized gain on investments | 133,974 | 334,390 | ||||||
Net change in unrealized appreciation on investments | 664,183 | 690,509 | ||||||
Net increase in net assets resulting from operations | 756,932 | 1,017,406 | ||||||
SHARE TRANSACTIONS: (NOTE 3) | ||||||||
Proceeds from sales of shares | 9,898,281 | 6,207,738 | ||||||
Cost of shares redeemed, net of redemption fees | (459,280) | – | ||||||
Net Increase from share transactions | 9,439,001 | 6,207,738 | ||||||
Net increase in net assets | 10,195,933 | 7,225,144 | ||||||
NET ASSETS: | ||||||||
Beginning of period | 7,225,144 | – | ||||||
End of period (including undistributed net investment income/(loss) of $(41,225) and $0, respectively) | $ | 17,421,077 | $ | 7,225,144 | ||||
See Accompanying Notes to Financial Statements.
Semi-Annual (Unaudited) | October 31, 2010 | 23 |
Table of Contents
Vulcan Value Partners Fund
Six Months Ended (Unaudited) | For the Period December 30, 2009 (Inception) to April 30, 2010 | |||
NET ASSET VALUE, BEGINNING OF PERIOD | $10.57 | $10.00 | ||
INCOME/(LOSS) FROM OPERATIONS: | ||||
Net investment income/(loss) | 0.00(a) | (0.00)(a) | ||
Net realized and unrealized gain on investments | 0.08 | 0.57 | ||
Total from investment operations | 0.08 | 0.57 | ||
REDEMPTION FEES ADDED TO PAID IN CAPITAL (NOTE 3) | 0.00(a) | 0.00(a) | ||
INCREASE IN NET ASSET VALUE | 0.08 | 0.57 | ||
NET ASSET VALUE, END OF PERIOD | $10.65 | $10.57 | ||
Total return | 0.76%(b) | 5.70%(b) | ||
RATIOS AND SUPPLEMENTAL DATA: | ||||
Net assets, end of period (000’s) | $15,812 | $12,807 | ||
Ratio of expenses to average net assets including fee waivers/reimbursements | 1.50%(c) | 1.50%(c) | ||
Ratio of expenses to average net assets without fee waivers/reimbursements | 2.92%(c) | 4.97%(c) | ||
Net investment income/(loss) to average net assets including fee waivers/reimbursements | 0.09%(c) | (0.06)%(c) | ||
Portfolio turnover rate | 18% | 24% | ||
| (a) | Less than $0.005 per share. |
| (b) | Not annualized. |
| (c) | Annualized. |
See Accompanying Notes to Financial Statements.
24 | www.vulcanvaluepartners.com |
Table of Contents
Financial Highlights
Vulcan Value Partners Small Cap Fund
| Six Months Ended October 31, 2010 (Unaudited) | For the Period December 30, 2009 (Inception) to April 30, 2010 | |||
NET ASSET VALUE, BEGINNING OF PERIOD | $11.60 | $10.00 | ||
INCOME/(LOSS) FROM OPERATIONS: | ||||
Net investment income/(loss) | (0.03) | (0.00)(a) | ||
Net realized and unrealized gain on investments | 0.03 | 1.60 | ||
Total from investment operations | 0.00 | 1.60 | ||
REDEMPTION FEES ADDED TO PAID IN CAPITAL (NOTE 3) | 0.00(a) | – | ||
INCREASE IN NET ASSET VALUE | 0.00(a) | 1.60 | ||
NET ASSET VALUE, END OF PERIOD | $11.60 | $11.60 | ||
Total return | 0.00%(b) | 16.00%(b) | ||
RATIOS AND SUPPLEMENTAL DATA: | ||||
Net assets, end of period (000’s) | $17,421 | $7,225 | ||
Ratio of expenses to average net assets including fee waivers/reimbursements | 1.50%(c) | 1.50%(c) | ||
Ratio of expenses to average net assets without fee waivers/reimbursements | 3.26%(c) | 7.31%(c) | ||
Net investment loss to average net assets including fee waivers/reimbursements | (0.64)%(c) | (0.57)%(c) | ||
Portfolio turnover rate | 26% | 33% | ||
| (a) | Less than $0.005 per share. |
| (b) | Not annualized. |
| (c) | Annualized. |
See Accompanying Notes to Financial Statements.
Semi-Annual (Unaudited) | October 31, 2010 | 25 |
Table of Contents
October 31, 2010 (Unaudited)
1. ORGANIZATION AND SIGNIFICANT ACCOUNTING POLICIES
Financial Investors Trust (the “Trust”) was organized as a Delaware statutory trust on November 30, 1993, and registered as an open-end management investment company under the Investment Company Act of 1940, as amended (“1940 Act”). Vulcan Value Partners Fund and Vulcan Value Partners Small Cap Fund (the “Funds”) are two of eleven separate series offered to the public under the Trust as of October 31, 2010. Each Fund commenced operations on December 30, 2009. Each Fund has one class of shares authorized. Each Fund seeks to achieve long-term capital appreciation.
The following is a summary of significant accounting policies consistently followed by each Fund in the preparation of its financial statements. The policies are in conformity with accounting principles generally accepted in the United States of America for investment companies.
Investment Valuation: The Board of Trustees (“Board” or “Trustees”) has approved procedures to be used to value each Fund’s securities for the purposes of determining each Fund’s net asset value (“NAV”). The valuation of the securities of the Funds is determined in good faith by or under the direction of the Board. The Board has delegated certain valuation functions for the Funds to ALPS Fund Services, Inc. (“ALPS” or the “Administrator”).
Each Fund generally values its securities based on market prices determined at the close of regular trading on the NYSE (normally, 4:00 p.m. Eastern time) on each business day (Monday through Friday). Neither Fund values its securities on any day that the NYSE is closed, including the following observed holidays: New Year’s Day, Martin Luther King, Jr. Day, Presidents’ Day, Good Friday, Memorial Day, Independence Day, Labor Day, Thanksgiving Day and Christmas Day, and the preceding Friday or subsequent Monday when one of those holidays falls on a Saturday or Sunday, respectively.
Each Fund’s currency valuations, if any, are done as of the close of regularly scheduled trading on the NYSE (normally at 4:00 p.m. Eastern time). For equity securities that are traded on an exchange, the market price is usually the closing sale or official closing price on that exchange. In the case of securities not traded on an exchange, or if such closing prices are not otherwise available, the market price is typically determined by independent third party pricing vendors approved by the Board using a variety of pricing techniques and methodologies. The market price for debt obligations is generally the price supplied by an independent third-party pricing service approved by the Board, which may use a matrix, formula or other objective method that takes into consideration market indices, yield curves and other specific adjustments. Short term debt obligations that will mature in 60 days or less are valued at amortized cost, unless it is determined that using this method would not reflect an investment’s fair value. If vendors are unable to supply a price, or if the price supplied is deemed to be unreliable, the market price may be determined using quotations received from one or more brokers/dealers that make a market in the security. Investments in other funds are calculated to their respective net asset values as determined by those funds in accordance with the 1940 Act.
When such prices or quotations are not available, or when Vulcan Value Partners, LLC (“Vulcan” or “Adviser”) believes that they are unreliable, securities may be priced using fair value procedures approved by the Board. Because the Funds may invest in securities that may be thinly traded or for which market quotations may not be readily available or may be unreliable (such as securities of
26 | www.vulcanvaluepartners.com |
Table of Contents
Notes to Financial Statements
October 31, 2010 (Unaudited)
small capitalization companies), the Funds may use fair valuation procedures more frequently than funds that invest primarily in securities that are more liquid (such as equity securities of large capitalization domestic issuers). The Funds may also use fair value procedures if the Adviser determines that a significant event has occurred between the time at which a market price is determined and the time at which each Fund’s NAV is calculated. In particular, the value of non-U.S. securities may be materially affected by events occurring after the close of the market on which they are traded, but before each Fund prices its shares.
The Funds may determine the fair value of investments based on information provided by pricing services and other third-party vendors, which may recommend fair value prices or adjustments with reference to other securities, indices or assets. In considering whether fair value pricing is required and in determining fair values, the Funds may, among other things, consider significant events (which may be considered to include changes in the value of U.S. securities or securities indices) that occur after the close of the relevant market and before each Fund values its securities. In addition, the Funds may utilize modeling tools provided by third- party vendors to determine fair values of non-U.S. securities. The Funds’ use of fair value pricing may help deter “stale price arbitrage.”
Valuing securities at fair value involves greater reliance on judgment than valuation of securities based on readily available market quotations. A fund that uses fair value to price securities may value those securities higher or lower than another fund using market quotations or its own fair value methodologies to price the same securities. There can be no assurance that the Funds could obtain the fair value assigned to a security if it were to sell the security at approximately the time at which each Fund determines its net asset value, and the difference between fair value and the price of the securities may be material.
Fair Value Measurements: A three-tier hierarchy has been established to classify fair value measurements for disclosure purposes. Inputs refer broadly to the assumptions that market participants would use in pricing the asset or liability, including assumptions about risk. Inputs may be observable or unobservable. Observable inputs are inputs that reflect the assumptions market participants would use in pricing the asset or liability that are developed based on market data obtained from sources independent of the reporting entity. Unobservable inputs are inputs that reflect the reporting entity’s own assumptions about the assumptions market participants would use in pricing the asset or liability that are developed based on the best information available.
Various inputs are used in determining the value of each Fund’s investments as of the reporting period end. The designated input levels are not necessarily an indication of the risk or liquidity associated with these investments. These inputs are categorized in the following hierarchy under applicable financial accounting standards:
Level 1 – | Unadjusted quoted prices in active markets for identical investments | |
Level 2 – | Other significant observable inputs (including quoted prices for similar investments, interest rates, prepayment speeds, credit risk, etc.) | |
Level 3 – | Significant unobservable inputs (including the Fund’s own assumptions in determining the fair value of investments) | |
Semi-Annual (Unaudited) | October 31, 2010 | 27 |
Table of Contents
Notes to Financial Statements
October 31, 2010 (Unaudited)
The following is a summary of the inputs used to value each Fund’s investments as of October 31, 2010.
Vulcan Value Partners Fund:
Assets:
Investments in Securities at Value | Level 1 - Quoted Prices | Level 2 - Other Significant Observable Inputs | Level 3 - Significant Unobservable Inputs | Total | ||||||||||||
Common Stocks(a) | $ 15,625,497 | $ | – | $ | – | $ | 15,625,497 | |||||||||
Short Term Investment | 218,913 | – | – | 218,913 | ||||||||||||
TOTAL | $ 15,844,410 | $ | – | $ | – | $ | 15,844,410 | |||||||||
Vulcan Value Partners Small Cap Fund:
Assets:
Investments in Securities at Value | Level 1 - Quoted Prices | Level 2 - Other Significant Observable Inputs | Level 3 - Significant Unobservable Inputs | Total | ||||||||||||
Common Stocks(a) | $ 17,363,402 | $ | – | $ | – | $ | 17,363,402 | |||||||||
Short Term Investment | 35,960 | – | – | 35,960 | ||||||||||||
TOTAL | $ 17,399,362 | $ | – | $ | – | $ | 17,399,362 | |||||||||
| (a) | For detailed Industry descriptions, see the accompanying Statement of Investments. |
For the six months ended October 31, 2010 the Funds did not have any significant transfers between Level 1 and Level 2 securities. For the six months ended October 31, 2010, the Funds did not have any securities which used significant unobservable inputs (Level 3) in determining fair value. Therefore, a reconciliation of assets in which significant unobservable inputs (Level 3) were used in determining fair value is not applicable.
Investment Transactions: Investment and shareholder transactions are accounted for on the date the investments are purchased or sold (trade date). Realized gains and losses from investment transactions are reported on an identified cost basis, which is the same basis the Funds use for federal income tax purposes. Interest income, which includes accretion of discounts, is accrued and recorded as earned. Dividend income is recognized on the ex-dividend date or for certain foreign securities, as soon as information is available to the Funds.
Foreign Securities: The Funds may directly purchase securities of foreign issuers. Investing in securities of foreign issuers involves special risks not typically associated with investing in securities of U.S. issuers. The risks include possible reevaluation of currencies, the inability to repatriate foreign currency, less complete financial information about companies and possible future adverse political and economic developments. Moreover, securities of many foreign issuers and their markets may be less liquid and their prices more volatile than those of securities of comparable U.S. issuers.
28 | www.vulcanvaluepartners.com |
Table of Contents
Notes to Financial Statements
October 31, 2010 (Unaudited)
Foreign Currency Translation: The books and records of the Funds are maintained in U.S. dollars. Investment valuations and other assets and liabilities initially expressed in foreign currencies are converted each business day into U.S. dollars based upon current exchange rates. Prevailing foreign exchange rates may generally be obtained at the close of the NYSE, normally 4:00 p.m. Eastern time. As available and as provided by an appropriate pricing service, translation of foreign security and currency market values may also occur with the use of foreign exchange rates obtained at approximately 11:00 a.m. Eastern time, which approximates the close of the London Exchange.
Forward Foreign Currency Transactions: The Funds may engage in currency transactions with counterparties to hedge the value of portfolio securities denominated in particular currencies against fluctuations in relative value, to gain or reduce exposure to certain currencies, or to generate income or gains. All commitments are marked to market daily at the applicable exchange rates and any resulting unrealized gains or losses are recorded in each Fund’s financial statements. The Funds record realized gains or losses at the time a forward contract is offset by entry into a closing transaction or extinguished by delivery of the currency. The Funds did not have forward foreign currency contracts at October 31, 2010.
Expenses: Some expenses of the Trust can be directly attributed to the Funds. Expenses which cannot be directly attributed are apportioned among all funds in the Trust based on average net assets.
Use of Estimates: Each Fund’s financial statements are prepared in accordance with accounting principles generally accepted in the United States of America. This requires management to make estimates and assumptions that affect (a) the reported amounts of assets and liabilities and disclosure of contingent assets and liabilities at the date of the financial statements, and (b) the reported amounts of increases and decreases in net assets from operations during the reporting period. Actual results could differ from these estimates.
Federal Income Taxes: Each Fund complies with the requirements under Subchapter M of the Internal Revenue Code applicable to regulated investment companies and intends to distribute substantially all of its net taxable income and net capital gains, if any, each year. The Funds are not subject to income taxes to the extent such distributions are made.
During the fiscal period ended October 31, 2010, the Funds did not have liability for any unrecognized tax benefits in the accompanying financial statements. The Funds file income tax returns in the U.S. federal jurisdiction and the State of Colorado.
Distributions to Shareholders: Each Fund normally pays dividends and distributes capital gains, if any, on an annual basis. Income dividend distributions are derived from interest and other income each Fund receives from its investments, including distributions of short-term capital gains. Capital gain distributions are derived from gains realized when each Fund sells a security it has owned for more than a year. Each Fund may make additional distributions and dividends at other times if the portfolio manager believes doing so may be necessary for each Fund to avoid or reduce taxes. Net investment income (loss) and net realized gain (loss) may differ for financial statement and tax purposes. The character of distributions made during the year from net investment income or net realized gains may differ from its ultimate characterization for federal income tax purposes.
Semi-Annual (Unaudited) | October 31, 2010 | 29 |
Table of Contents
Notes to Financial Statements
October 31, 2010 (Unaudited)
Also, due to the timing of dividend distributions, the fiscal year in which amounts are distributed may differ from the fiscal year in which the income or realized gain were recorded by each Fund.
As of October 31, 2010, the cost of securities on a tax basis and gross unrealized appreciation (depreciation) on investments for federal income tax purposes were as follows:
| Vulcan Value Partners Fund | Vulcan Value Partners Small Cap Fund | |||||||
Gross appreciation | $ | 1,533,615 | $ | 1,560,008 | ||||
Gross depreciation | (429,040) | (295,372) | ||||||
Net unrealized appreciation | 1,104,575 | 1,264,636 | ||||||
Cost of investments for income tax purposes | $ | 14,739,835 | $ | 16,134,726 | ||||
2. SECURITIES TRANSACTIONS
The cost of purchases and proceeds from sales of securities (excluding short-term securities) during the six months ended October 31, 2010, was as follows:
| Fund | Purchase of Securities | Proceeds from Sales of Securities | ||||||
Vulcan Value Partners Fund | $ | 5,070,636 | $ | 2,440,420 | ||||
Vulcan Value Partners Small Cap Fund | $ | 12,718,482 | $ | 3,279,946 | ||||
3. CAPITAL SHARE TRANSACTIONS
Shares redeemed within 90 days of purchase may incur a 2% short-term redemption fee deducted from the redemption amount. The Vulcan Value Partners Fund and the Vulcan Value Partners Small Cap Fund retained $1,114 and $285, respectively for the six months ended October 31, 2010, which is reflected in the “Shares redeemed” in the Statement of Changes in Net Assets.
Transactions in shares of capital stock for the dates listed below were as follows:
Vulcan Value Partners Fund
| For the Six Months Ended October 31, 2010 | For the Period December 30, 2009 (Inception) to April 30, 2010 | |||||||
| Shares | Shares | |||||||
Shares Sold | 286,386 | 1,237,792 | ||||||
Less Shares Redeemed | (13,867) | (25,667) | ||||||
Net Increase | 272,519 | 1,212,125 | ||||||
30 | www.vulcanvaluepartners.com |
Table of Contents
Notes to Financial Statements
October 31, 2010 (Unaudited)
Vulcan Value Partners Small Cap Fund
| For the Six Months Ended October 31, 2010 | For the Period December 30, 2009 (Inception) to April 30, 2010 | |||||||
| Shares | Shares | |||||||
Shares Sold | 920,447 | 622,805 | ||||||
Less Shares Redeemed | (41,625) | – | ||||||
Net Increase | 878,822 | 622,805 | ||||||
4. MANAGEMENT AND RELATED-PARTY TRANSACTIONS
Vulcan, subject to the authority of the Board, is responsible for the overall management and administration of the Funds’ business affairs. Vulcan manages the investments of the Funds in accordance with each Fund’s investment objective, policies and limitations and investment guidelines established jointly by the Adviser and the Trustees. Pursuant to the Investment Advisory Agreement (the “Advisory Agreement”), the Funds pays Vulcan an annual management fee of 1.00% and 1.25% for Vulcan Value Partners Fund and Vulcan Value Partners Small Cap Fund, respectively, based on each Fund’s average daily net assets. Vulcan has contractually agreed with the Funds to limit the amount of each Fund’s total annual expenses (exclusive of distribution and service (12b-1) fees, acquired fund fees and expenses, brokerage expenses, interest expense, taxes and extraordinary expenses) to 1.50% of each Fund’s average daily net assets. This agreement is in effect through August 31, 2011 and is reevaluated on an annual basis. Without this agreement, expenses could be higher. In addition, each Fund’s organizational expenses have been borne by Vulcan. The Adviser will be permitted to recover expenses it has borne through the agreement described above to the extent that each Fund’s expenses in later periods fall below the annual rates set forth in the relevant agreement. If the Adviser foregoes any fees and/or reimburses a fund pursuant to this agreement with respect to a particular fiscal year, then the Adviser shall be entitled to recover from the fund the amount forgone or reimbursed to the extent Designated Annual Fund Operating Expenses are less than 1.50% of the fund’s average daily net assets during any fiscal year following such fiscal year.
Distributor: ALPS Distributors, Inc. (an affiliate of ALPS) (“ADI” or the “Distributor”) acts as the distributor of each Fund’s shares pursuant to a Distribution Agreement with the Trust. Shares are sold on a continuous basis by ADI as agent for the Funds, and ADI has agreed to use its best efforts to solicit orders for the sale of each Fund’s shares, although it is not obliged to sell any particular amount of shares. ADI is not entitled to any compensation for its services as Distributor. ADI is registered as a broker-dealer with the Securities and Exchange Commission. ALPS (an affiliate of ADI and AAI) serves as administrator to the Funds, and each Fund has agreed to pay expenses incurred in connection with its administrative activities. Pursuant to an Administrative Agreement, ALPS will provide operational services to the Funds including, but not limited to fund accounting and fund administration and generally assist in each Fund’s operations. The table below provides the administrative fee to be paid by the Funds to ALPS pursuant to the Fund Accounting and Administration Agreement: Annual Administrative Fee, billed monthly, in the amount of the greater of $210,000 annual minimum or: (i) 5.0 basis points of the Funds’ average net assets between $0 - $500 million; and (ii) 3.0 basis points of the Funds’ average net assets between $500 million - $1 billion; and (iii) 2.0 basis points of the Funds’ average net assets over $1 billion.
Semi-Annual (Unaudited) | October 31, 2010 | 31 |
Table of Contents
Notes to Financial Statements
October 31, 2010 (Unaudited)
Beneficial Ownership: The beneficial ownership, either directly or indirectly, of more than 25% of the voting securities of any class a Fund creates a presumption of control of the Fund under Section 2(a)(9) of the 1940 Act. As of October 31, 2010, Charles Schwab & Co. held approximately 60.50% and 25.57% of the Vulcan Value Partners Fund and the Vulcan Value Partners Small Cap Fund, respectively. Charles Schwab & Co. is believed to hold its shares of the Funds as nominee for the benefit of its clients. As of October 31, 2010, C.T. Fitzpatrick held approximately 6.81% and 6.71% of the Vulcan Value Partners Fund and the Vulcan Value Partners Small Cap Fund, respectively.
5. SUBSEQUENT EVENTS
Management has evaluated whether any events or transactions occurred subsequent to October 31, 2010 through the date of issuance of the Funds’ financial statements and determined that there were no other material events or transactions that would require recognition or disclosure in the Funds’ financial statements.
6. INDEMNIFICATIONS
Under the Trust’s organizational documents, its officers and Trustees are indemnified against certain liability arising out of the performance of their duties to the Trust. Additionally, in the normal course of business, the Trust enters into contracts with service providers that contain general indemnification clauses. The Trust’s maximum exposure under these arrangements is unknown, as this would involve future claims that may be made against the Trust that have not yet occurred.
32 | www.vulcanvaluepartners.com |
Table of Contents
October 31, 2010
1. FUND HOLDINGS
The Funds file their complete schedule of portfolio holdings with the Securities and Exchange Commission (the “SEC”) for the first and third quarters of each fiscal year on Form N-Q within 60 days after the end of the period. Copies of the Funds’ Form N-Q are available without charge on the SEC website at http://www.sec.gov. You may also review and copy the Form N-Q at the SEC’s Public Reference Room in Washington, DC. For more information about the operation of the Public Reference Room, please call the SEC at 1-800-SEC-0330.
2. FUND PROXY VOTING POLICIES, PROCEDURES AND SUMMARIES
Each Fund’s policies and procedures used in determining how to vote proxies and information regarding how the Funds voted proxies relating to portfolio securities during the most recent prior 12-month period ending June 30 will be available without charge, (1) upon request, by calling (866) 759-5679 and (2) on the SEC’s website at http://www.sec.gov.
Semi-Annual (Unaudited) | October 31, 2010 | 33 |
Table of Contents
“The Management Commentary included in this shareholder report contains certain forward-looking statements about the factors that may affect the performance of the Funds in the future. These statements are based on Fund management’s predictions and expectations concerning certain future events and their expected impact on the Funds, such as performance of the economy as a whole and of specific industry sectors, changes in the levels of interest rates, the impact of developing world events, and other factors that may influence the future performance of the Funds. Management believes these forward-looking statements to be reasonable, although they are inherently uncertain and difficult to predict. Actual events may cause adjustments in portfolio management strategies from those currently expected to be employed.”
This Fund is neither insured nor guaranteed by the U.S. Government, the FDIC, the Federal Reserve Board or any other governmental agency or insurer.
For more information about the Fund, including a prospectus, please visit www.vulcanvaluepartners.com or call 1.877.421.5078.
This material must be accompanied or proceeded by a prospectus.
The Vulcan Value Partners Funds are distributed by ALPS Distributors, Inc.
Table of Contents
Item 2. | Code of Ethics. | |||
Not applicable to this Report. | ||||
Item 3. | Audit Committee Financial Expert. | |||
Not applicable to this Report. | ||||
Item 4. | Principal Accountant Fees and Services. | |||
Not applicable to this Report. | ||||
Item 5. | Audit Committee of Listed Registrants. | |||
Not applicable to Registrant. | ||||
Item 6. | Investments. | |||
(a) | Schedule of Investments is included as part of the Reports to Stockholders filed under Item 1 of this Form N-CSR. | |||
(b) | Not applicable. | |||
Item 7. | Disclosure of Proxy Voting Policies and Procedures for Closed-End Management Investment Companies. | |||
Not applicable to Registrant. | ||||
Item 8. | Portfolio Managers of Closed-End Management Investment Companies. | |||
Not applicable to Registrant. | ||||
Table of Contents
Item 9. | Purchases of Equity Securities by Closed-End Management Investment Company and Affiliated Purchasers. | |||
Not applicable to Registrant. | ||||
Item 10. | Submission of Matters to a Vote of Security Holders. | |||
There have been no material changes to the procedures by which shareholders may recommend nominees to the Registrant’s Board of Trustees, where those changes were implemented after the Registrant last provided disclosure in response to the requirements of Item 407(c)(2)(iv) of Regulation S-K, or this Item. | ||||
Item 11. | Controls and Procedures. | |||
(a) | The Registrant’s principal executive officer and principal financial officer have concluded that the Registrant’s disclosure controls and procedures (as defined in Rule 30a-3(c) under the Investment Company Act of 1940, as amended) are effective based on their evaluation of these controls and procedures as of a date within 90 days of the filing date of this report. | |||
(b) | There was no change in the Registrant’s internal control over financial reporting (as defined in Rule 30a-3(d) under the Investment Company Act of 1940, as amended) that occurred during the second fiscal quarter of the period covered by this report that has materially affected, or is reasonably likely to materially affect, the Registrant’s internal control over financial reporting. | |||
Item 12. | Exhibits. | |||
(a)(1) | Not applicable to this Report. | |||
(a)(2) | The certifications required by Rule 30a-2(a) of the Investment Company Act of 1940, as amended, and Section 302 of the Sarbanes-Oxley Act of 2002 are attached hereto as Exhibit 99.Cert. | |||
(a)(3) | Not applicable to Registrant. | |||
(b) | The certifications by the Registrant’s principal executive officer and principal financial officer, as required by Rule 30a-2(b) of the Investment Company Act of 1940, as amended, and Section 906 of the Sarbanes-Oxley Act of 2002 are attached hereto as Exhibit 99.906Cert. | |||
Table of Contents
SIGNATURES
Pursuant to the requirements of the Securities Exchange Act of 1934 and the Investment Company Act of 1940, the Registrant has duly caused this report to be signed on its behalf by the undersigned, thereunto duly authorized.
FINANCIAL INVESTORS TRUST
By: | /s/ Edmund J. Burke | |||
Edmund J. Burke (Principal Executive Officer) | ||||
President | ||||
Date: | January 5, 2011 |
Pursuant to the requirements of the Securities Exchange Act of 1934 and the Investment Company Act of 1940, this report has been signed below by the following persons on behalf of the Registrant and in the capacities and on the dates indicated.
FINANCIAL INVESTORS TRUST
By: | /s/ Edmund J. Burke | |||
Edmund J. Burke (Principal Executive Officer) | ||||
President | ||||
Date: | January 5, 2011 |
By: | /s/ Jeremy O. May | |||
Jeremy O. May (Principal Financial Officer) | ||||
Treasurer | ||||
Date: | January 5, 2011 |