UNITED STATES
SECURITIES AND EXCHANGE COMMISSION
Washington, D.C. 20549
FORM N-CSR
CERTIFIED SHAREHOLDER REPORT OF REGISTERED
MANAGEMENT INVESTMENT COMPANIES
Investment Company Act file number: 811-8194
FINANCIAL INVESTORS TRUST
(exact name of Registrant as specified in charter)
1290 Broadway, Suite 1100, Denver, Colorado 80203
(Address of principal executive offices) (Zip code)
David T. Buhler, Secretary
Financial Investors Trust
1290 Broadway, Suite 1100
Denver, Colorado 80203
(Name and address of agent for service)
Registrant’s telephone number, including area code: 303-623-2577
Date of fiscal year end: April 30
Date of reporting period: May 1, 2013 - October 31, 2013
Item 1. Reports to Stockholders.
| ||
| ||
| ||
Table of Contents October 31, 2013 |
| Disclosure of Fund Expenses | 1 | |||||||
| ALPS | Alerian MLP Infrastructure Index Fund | ||||||||
| 5 | ||||||||
| 6 | ||||||||
| 8 | ||||||||
| 9 | ||||||||
| 10 | ||||||||
| 11 | ||||||||
| 12 | ||||||||
| ALPS | CoreCommodity Management CompleteCommodities® Strategy Fund | ||||||||
| 15 | ||||||||
| 17 | ||||||||
| 19 | ||||||||
| 25 | ||||||||
| 26 | ||||||||
| 27 | ||||||||
| 28 | ||||||||
| ALPS | Kotak India Growth Fund | ||||||||
| 31 | ||||||||
| 34 | ||||||||
| 36 | ||||||||
| 38 | ||||||||
| 39 | ||||||||
| 40 | ||||||||
| 41 | ||||||||
| ALPS | Red Rocks Listed Private Equity Fund | ||||||||
| 44 | ||||||||
| 45 | ||||||||
| 47 | ||||||||
| 49 | ||||||||
| 50 | ||||||||
| 51 | ||||||||
| 52 | ||||||||
| ALPS | WMC Disciplined Value Fund | ||||||||
| 56 | ||||||||
| 57 | ||||||||
| 59 | ||||||||
| 62 | ||||||||
| 63 | ||||||||
| 64 | ||||||||
| 65 | ||||||||
| Clough China Fund | ||||||||
| 68 | ||||||||
| 70 | ||||||||
| 72 | ||||||||
| 75 | ||||||||
| 76 | ||||||||
| 77 | ||||||||
| 78 | ||||||||
| RiverFront Global Allocation Series | ||||||||
| 81 | ||||||||
| 83 | ||||||||
| 93 | ||||||||
| 103 | ||||||||
| 105 | ||||||||
| 106 | ||||||||
| 111 | ||||||||
| Notes to Financial Statements | 128 | |||||||
| Additional Information | 153 | |||||||
| October 31, 2013 (Unaudited) | ||
As a shareholder of the Funds, you will incur two types of costs: (1) transaction costs, including applicable sales charges (loads) and redemption fees; and (2) ongoing costs, including management fees, distribution and service (12b-1) fees, shareholder service fees and other Fund expenses. The following examples are intended to help you understand your ongoing costs (in dollars) of investing in the Fund and to compare these costs with the ongoing costs of investing in other mutual funds. The examples are based on an investment of $1,000 invested on May 1, 2013 and held until October 31, 2013.
Actual Expenses. The first line of the table on the next page provides information about actual account values and actual expenses. You may use the information in this line, together with the amount you invested, to estimate the expenses that you paid over the period. Simply divide your account value by $1,000 (for example, an $8,600 account value divided by $1,000 = 8.6), then multiply the result by the number in the first line under the heading “Expense Paid During Period” to estimate the expenses you paid on your account during this period.
Hypothetical Example for Comparison Purposes. The second line of the table on the next page provides information about hypothetical account values and hypothetical expenses based on the Fund’s actual expense ratio and an assumed rate of return of 5% per year before expenses, which is not the Fund’s actual return. The hypothetical account values and expenses may not be used to estimate the actual ending account balance or expenses you paid for the period. You may use this information to compare the ongoing costs of investing in the Fund and other mutual funds. To do so, compare this 5% hypothetical example with the 5% hypothetical examples that appear in the shareholder reports of the other funds.
The expenses shown in the table are meant to highlight ongoing Fund costs only and do not reflect transaction fees, such as sales charges, redemption fees, or exchange fees. Therefore, the second line of the table on the next page is useful in comparing ongoing costs only, and may not help you determine the relative total costs of owning different funds. In addition, if these transactional costs were included, your costs would have been higher.
| 1 | October 31, 2013 |
Disclosure of Fund Expenses | ||
| October 31, 2013 (Unaudited) | ||
| Beginning Account Value May 1, 2013 | Ending Account Value October 31, 2013 | Expense Ratio(a) | Expense Paid During Period May 1, 2013 - October 31, 2013(b) | |||||
| ALPS | Alerian MLP Infrastructure Index Fund | ||||||||
| Class A | ||||||||
Actual | $ 1,000.00 | $ 1,032.40 | 1.25% | $ 6.40 | ||||
Hypothetical (5% return before expenses) | $ 1,000.00 | $ 1,018.90 | 1.25% | $ 6.36 | ||||
| Class C | ||||||||
Actual | $ 1,000.00 | $ 1,029.70 | 1.85% | $ 9.46 | ||||
Hypothetical (5% return before expenses) | $ 1,000.00 | $ 1,015.88 | 1.85% | $ 9.40 | ||||
| Class I | ||||||||
Actual | $ 1,000.00 | $ 1,033.30 | 0.85% | $ 4.36 | ||||
Hypothetical (5% return before expenses) | $ 1,000.00 | $ 1,020.92 | 0.85% | $ 4.33 | ||||
| ALPS | CoreCommodity Management CompleteCommodities® Strategy Fund(c) | ||||||||
| Class A | ||||||||
Actual | $ 1,000.00 | $ 974.00 | 1.45% | $ 7.21 | ||||
Hypothetical (5% return before expenses) | $ 1,000.00 | $ 1,017.90 | 1.45% | $ 7.38 | ||||
| Class C | ||||||||
Actual | $ 1,000.00 | $ 970.90 | 2.05% | $ 10.18 | ||||
Hypothetical (5% return before expenses) | $ 1,000.00 | $ 1,014.87 | 2.05% | $ 10.41 | ||||
| Class I | ||||||||
Actual | $ 1,000.00 | $ 974.90 | 1.15% | $ 5.72 | ||||
Hypothetical (5% return before expenses) | $ 1,000.00 | $ 1,019.41 | 1.15% | $ 5.85 | ||||
| ALPS | Kotak India Growth Fund(d) | ||||||||
| Class A | ||||||||
Actual | $ 1,000.00 | $ 932.40 | 2.00% | $ 9.74 | ||||
Hypothetical (5% return before expenses) | $ 1,000.00 | $ 1,015.12 | 2.00% | $ 10.16 | ||||
| Class C | ||||||||
Actual | $ 1,000.00 | $ 929.30 | 2.60% | $ 12.64 | ||||
Hypothetical (5% return before expenses) | $ 1,000.00 | $ 1,012.10 | 2.60% | $ 13.19 | ||||
| Class I | ||||||||
Actual | $ 1,000.00 | $ 933.00 | 1.60% | $ 7.80 | ||||
Hypothetical (5% return before expenses) | $ 1,000.00 | $ 1,017.14 | 1.60% | $ 8.13 | ||||
| ALPS | Red Rocks Listed Private Equity Fund | ||||||||
| Class A | ||||||||
Actual | $ 1,000.00 | $ 1,137.20 | 1.65% | $ 8.89 | ||||
Hypothetical (5% return before expenses) | $ 1,000.00 | $ 1,016.89 | 1.65% | $ 8.39 | ||||
| Class C | ||||||||
Actual | $ 1,000.00 | $ 1,133.40 | 2.25% | $ 12.10 | ||||
Hypothetical (5% return before expenses) | $ 1,000.00 | $ 1,013.86 | 2.25% | $ 11.42 | ||||
| Class I | ||||||||
Actual | $ 1,000.00 | $ 1,139.80 | 1.25% | $ 6.74 | ||||
Hypothetical (5% return before expenses) | $ 1,000.00 | $ 1,018.90 | 1.25% | $ 6.36 | ||||
| Class R | ||||||||
Actual | $ 1,000.00 | $ 1,136.80 | 1.75% | $ 9.43 | ||||
Hypothetical (5% return before expenses) | $ 1,000.00 | $ 1,016.38 | 1.75% | $ 8.89 | ||||
| 2 | October 31, 2013 |
Disclosure of Fund Expenses | ||
| October 31, 2013 (Unaudited) | ||
| Beginning Account Value May 1, 2013 | Ending Account Value October 31, 2013 | Expense Ratio(a) | Expense Paid During Period May 1, 2013 - October 31, 2013(b) | |||||
ALPS | WMC Disciplined Value Fund | ||||||||
Class A | ||||||||
Actual | $ 1,000.00 | $ 1,114.90 | 1.40% | $ 7.46 | ||||
Hypothetical (5% return before expenses) | $ 1,000.00 | $ 1,018.15 | 1.40% | $ 7.12 | ||||
Class C | ||||||||
Actual | $ 1,000.00 | $ 1,111.80 | 2.15% | $ 11.44 | ||||
Hypothetical (5% return before expenses) | $ 1,000.00 | $ 1,014.37 | 2.15% | $ 10.92 | ||||
Class I | ||||||||
Actual | $ 1,000.00 | $ 1,116.80 | 1.15% | $ 6.14 | ||||
Hypothetical (5% return before expenses) | $ 1,000.00 | $ 1,019.41 | 1.15% | $ 5.85 | ||||
| Clough China Fund | ||||||||
Class A | ||||||||
Actual | $ 1,000.00 | $ 1,043.80 | 1.95% | $ 10.05 | ||||
Hypothetical (5% return before expenses) | $ 1,000.00 | $ 1,015.38 | 1.95% | $ 9.91 | ||||
Class C | ||||||||
Actual | $ 1,000.00 | $ 1,040.10 | 2.70% | $ 13.88 | ||||
Hypothetical (5% return before expenses) | $ 1,000.00 | $ 1,011.59 | 2.70% | $ 13.69 | ||||
Class I | ||||||||
Actual | $ 1,000.00 | $ 1,045.80 | 1.70% | $ 8.77 | ||||
Hypothetical (5% return before expenses) | $ 1,000.00 | $ 1,016.64 | 1.70% | $ 8.64 | ||||
| RiverFront Conservative Income Builder Fund | ||||||||
Class A | ||||||||
Actual | $ 1,000.00 | $ 1,031.60 | 1.15% | $ 5.89 | ||||
Hypothetical (5% return before expenses) | $ 1,000.00 | $ 1,019.41 | 1.15% | $ 5.85 | ||||
Class C | ||||||||
Actual | $ 1,000.00 | $ 1,027.00 | 1.90% | $ 9.71 | ||||
Hypothetical (5% return before expenses) | $ 1,000.00 | $ 1,015.63 | 1.90% | $ 9.65 | ||||
Class I | ||||||||
Actual | $ 1,000.00 | $ 1,031.90 | 0.90% | $ 4.61 | ||||
Hypothetical (5% return before expenses) | $ 1,000.00 | $ 1,020.67 | 0.90% | $ 4.58 | ||||
| RiverFront Dynamic Equity Income Fund | ||||||||
Class A | ||||||||
Actual | $ 1,000.00 | $ 1,063.30 | 1.15% | $ 5.98 | ||||
Hypothetical (5% return before expenses) | $ 1,000.00 | $ 1,019.41 | 1.15% | $ 5.85 | ||||
Class C | ||||||||
Actual | $ 1,000.00 | $ 1,060.50 | 1.90% | $ 9.87 | ||||
Hypothetical (5% return before expenses) | $ 1,000.00 | $ 1,015.63 | 1.90% | $ 9.65 | ||||
Class I | ||||||||
Actual | $ 1,000.00 | $ 1,066.00 | 0.90% | $ 4.69 | ||||
Hypothetical (5% return before expenses) | $ 1,000.00 | $ 1,020.67 | 0.90% | $ 4.58 | ||||
| RiverFront Global Allocation Fund | ||||||||
Class A | ||||||||
Actual | $ 1,000.00 | $ 1,081.30 | 1.15% | $ 6.03 | ||||
Hypothetical (5% return before expenses) | $ 1,000.00 | $ 1,019.41 | 1.15% | $ 5.85 | ||||
Class C | ||||||||
Actual | $ 1,000.00 | $ 1,077.70 | 1.90% | $ 9.95 | ||||
Hypothetical (5% return before expenses) | $ 1,000.00 | $ 1,015.63 | 1.90% | $ 9.65 | ||||
Class I | ||||||||
Actual | $ 1,000.00 | $ 1,082.80 | 0.90% | $ 4.72 | ||||
Hypothetical (5% return before expenses) | $ 1,000.00 | $ 1,020.67 | 0.90% | $ 4.58 | ||||
| 3 | October 31, 2013 |
Disclosure of Fund Expenses | ||
| October 31, 2013 (Unaudited) | ||
Beginning Account Value May 1, 2013 | Ending Account Value October 31, 2013 | Expense Ratio(a) | Expense Paid During Period May 1, 2013 - October 31, 2013(b) | |||||
| RiverFront Global Growth Fund | ||||||||
| Class A | ||||||||
Actual | $ 1,000.00 | $ 1,091.30 | 1.15% | $ 6.06 | ||||
Hypothetical (5% return before expenses) | $ 1,000.00 | $ 1,019.41 | 1.15% | $ 5.85 | ||||
| Class C | ||||||||
Actual | $ 1,000.00 | $ 1,088.10 | 1.90% | $ 10.00 | ||||
Hypothetical (5% return before expenses) | $ 1,000.00 | $ 1,015.63 | 1.90% | $ 9.65 | ||||
| Class I | ||||||||
Actual | $ 1,000.00 | $ 1,093.20 | 0.90% | $ 4.75 | ||||
Hypothetical (5% return before expenses) | $ 1,000.00 | $ 1,020.67 | 0.90% | $ 4.58 | ||||
| Class L | ||||||||
Actual | $ 1,000.00 | $ 1,093.30 | 0.90% | $ 4.75 | ||||
Hypothetical (5% return before expenses) | $ 1,000.00 | $ 1,020.67 | 0.90% | $ 4.58 | ||||
| Investor Class | ||||||||
Actual | $ 1,000.00 | $ 1,091.80 | 1.15% | $ 6.06 | ||||
Hypothetical (5% return before expenses) | $ 1,000.00 | $ 1,019.41 | 1.15% | $ 5.85 | ||||
| RiverFront Moderate Growth & Income Fund | ||||||||
| Class A | ||||||||
Actual | $ 1,000.00 | $ 1,046.20 | 1.15% | $ 5.93 | ||||
Hypothetical (5% return before expenses) | $ 1,000.00 | $ 1,019.41 | 1.15% | $ 5.85 | ||||
| Class C | ||||||||
Actual | $ 1,000.00 | $ 1,042.30 | 1.90% | $ 9.78 | ||||
Hypothetical (5% return before expenses) | $ 1,000.00 | $ 1,015.63 | 1.90% | $ 9.65 | ||||
| Class I | ||||||||
Actual | $ 1,000.00 | $ 1,047.20 | 0.90% | $ 4.64 | ||||
Hypothetical (5% return before expenses) | $ 1,000.00 | $ 1,020.67 | 0.90% | $ 4.58 | ||||
| (a) | Annualized, based on the Fund’s most recent fiscal half year expenses. |
| (b) | Expenses are equal to the Fund’s annualized expense ratio multiplied by the average account value over the period, multiplied by the number of days in the most recent fiscal half year (184), divided by 365. |
| (c) | Includes expenses of the CoreCommodity Management Cayman Commodity Fund Ltd. (wholly-owned subsidiary), exclusive of the subsidiary’s management fee. |
| (d) | Includes expenses of the Kotak Mauritius Portfolio (wholly-owned subsidiary), exclusive of subsidiary’s management fee. |
| 4 | October 31, 2013 |
ALPS | Alerian MLP Infrastructure Index Fund
| ||
| October 31, 2013 (Unaudited) | ||
Performance
During the six month period of May 1, 2013 to October 31, 2013, the Alerian MLP Infrastructure Index Fund’s Class A Shares delivered a net return of 3.24% at Net Asset Value (Class A delivered a net return of -2.47% at MOP1 , Class C was 1.97% with CDSC, and Class I was 3.33%).
Performance of the Fund’s MLP holdings during this period was impacted both by the Federal Reserve’s May announcement to taper its bond buying program as well as uncertainty in the months following as to when tapering would actually begin. Expectations for rising rates disproportionately impacted income-oriented equities such as MLPs, REITs and utilities during this period. However, the distribution growth element of the Fund’s MLP holdings as well as investors becoming more comfortable with valuations mitigated most of the impact. To that point, the Fund’s two distributions during this period—payable May 14, 2013 and August 14, 2013—represented a 1.4% and 1.8% increase from the previous quarter.
In 2013, MLPs announced and put into service several infrastructure assets addressing takeaway needs from various areas experiencing dramatic production growth. In the Marcellus Shale in the Northeast, natural gas pipelines were expanded, connecting lines were built to larger trunklines, and a handful of pipelines transporting natural gas liquids are either under construction or being proposed. In the Bakken Shale in North Dakota, MLPs are at the forefront of the crude-by-rail trend, constructing loading and unloading terminals along major rail lines. Moving crude via rail has allowed producers the flexibility to ship Bakken crude to favorably priced markets across the US including California, the Midwest, and the Gulf Coast.
Further down south in Mont Belvieu, Texas, many MLPs continue to build out fractionation plants and expand pipelines that carry natural gas liquids to petrochemical plants along the Gulf Coast. In addition, MLPs have emerged as the leading operators of liquefied petroleum gas (LPG) export facilities along the Gulf Coast. The oversupply of natural gas liquids domestically plus an increased demand for propane and butane in emerging countries overseas has created favorable opportunities for MLPs to expand and built out additional export docks and ancillary facilities.
We believe an energy revolution is taking place in the United States through directional drilling and hydraulic fracturing, and recoverable oil and gas reserves are at levels not seen in decades. Industry executives and analysts estimate that the US will be net energy independent sometime in the next 10 years. The MLP-owned energy infrastructure assets, including pipelines, storage tanks, and processing plants, are the means by which the reserves and production in supply basins make their way to demand centers.
With toll-road business models anchored by inflation-indexed tariff increases and billions of dollars of infrastructure opportunities over the next few decades, MLPs continue, in our view, to represent a compelling investment opportunity for investors seeking after-tax yield.
The views and information discussed in this commentary are as of the date of publication, are subject to change, and may not reflect the writer’s current views. The views expressed represent an assessment of market conditions at a specific point in time, are opinions only and should not be relied upon as investment advice regarding a particular investment or markets in general. Such information does not constitute a recommendation to buy or sell specific securities or investment vehicles. It should not be assumed that any investment will be profitable or will equal the performance of the fund(s) or any securities or any sectors mentioned herein. The subject matter contained herein has been derived from several sources believed to be reliable and accurate at the time of compilation. Alerian does not accept any liability for losses either direct or consequential caused by the use of this information.
| 1 | Maximum Offering Price (MOP) includes sales charge. |
| 5 | October 31, 2013 |
ALPS | Alerian MLP Infrastructure Index Fund
| ||
| October 31, 2013 (Unaudited) | ||
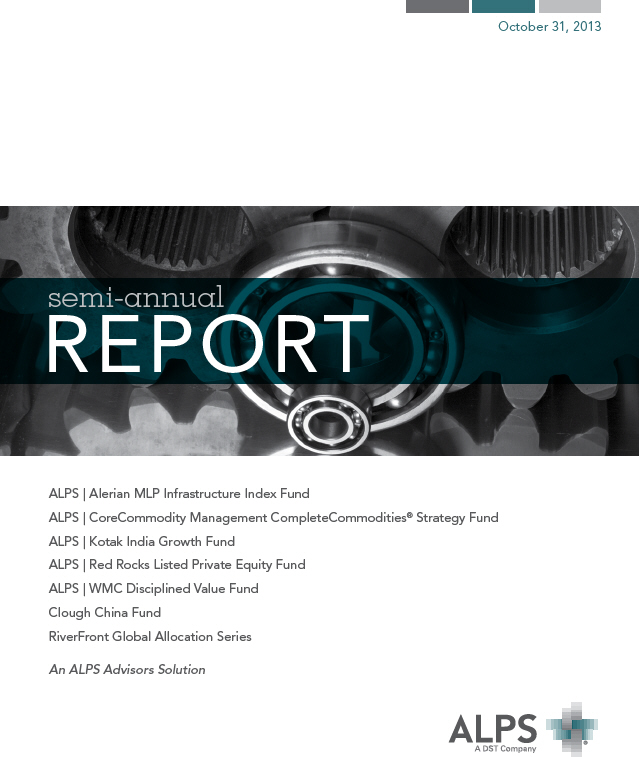
Performance of $10,000 Initial Investment (as of October 31, 2013)
Comparison of change in value of a $10,000 investment (includes maximum sales charges of 5.50%)
The chart above represents historical performance of a hypothetical investment of $10,000 in the Fund since inception. Past performance does not guarantee future results. This chart does not reflect the deduction of taxes that a shareholder would pay on Fund distributions or the redemption of Fund shares.
Average Annual Total Returns (as of October 31, 2013)
| Since Inception ^ | Total Expense Ratio * | What You Pay ** | ||||
Class A (NAV)1 | 16.33% | 1.49% | 1.25% | |||
Class A (MOP)2 | 9.96% | |||||
Class C (NAV)1 | 15.92% | 2.09% | 1.85% | |||
Class C (CDSC)2 | 14.92% | |||||
Class I | 16.54% | 1.09% | 0.85% | |||
Alerian MLP Infrastructure Index3 | 27.54% |
Performance data quoted represents past performance. Past performance does not guarantee future results. Investment return and principal value of an investment will fluctuate so that an investor’s shares, when sold or redeemed, may be worth more or less than the original cost. Current performance data may be higher or lower than actual data quoted. The Fund imposes a 2.00% redemption fee on shares held for less than 30 days. The Fund imposes a maximum Contingent Deferred Sales Charge (“CDSC”) of 1.00% to shares redeemed within the first 12 months after a purchase, and on Class A shares redeemed within the first 18 months after a purchase in excess of $1 million. Performance shown does not reflect the redemption fee or the CDSC, which if reflected would reduce the performance quoted. For the most current month-end performance data please call 1-866-759-5679.
Investments in securities of MLPs involve risks that differ from an investment in common stock. MLPs are controlled by their general partners, which generally have conflicts of interest and limited fiduciary duties to the MLP, which may permit the general partner to favor its own interests over the MLPs. The benefit you are expected to derive from the Fund’s investment in MLPs depends largely on the MLPs being treated as partnerships for federal income tax purposes. As a partnership, an MLP has no federal income tax liability at the entity level. Therefore, treatment of one or more MLPs as a corporation for federal income tax purposes could affect the Fund’s ability to meet its investment objective and would reduce the amount of cash available to pay or distribute to you. Legislative, judicial, or administrative changes and differing interpretations, possibly on a retroactive basis, could negatively impact the value of an investment in MLPs and therefore the value of your investment in the Fund.
| 6 | October 31, 2013 |
ALPS | Alerian MLP Infrastructure Index Fund
| ||
Performance Update | October 31, 2013 (Unaudited) | |
| 1 | Net Asset Value (NAV) is the share price without sales charges. |
| 2 | Maximum Offering Price (MOP) includes sales charges. Class A returns include effects of the Fund’s maximum sales charge of 5.50%; Class C returns include the 1.00% CDSC. |
| 3 | Alerian MLP Infrastructure Index is comprised of 25 midstream energy Master Limited Partnerships. The index is not actively managed and does not reflect any deductions for fees, expenses or taxes. An investor may not invest directly in an index. |
| ^ | Fund inception date of December 31, 2012. The Fund commenced operations on January 2, 2013. |
| * | Excludes current and deferred income tax expense. |
| ** | What You Pay reflects the Advisor’s and Sub-Advisor’s decision to contractually limit expenses through August 31, 2014. Please see the prospectus for additional information. |
The table does not reflect the deduction of taxes that a shareholder would pay on Fund distributions or the redemption of Fund shares.
This Fund is not suitable for all investors and is subject to investment risks, including possible loss of the principal amount invested.
There is no guarantee that the Fund will continue to hold any one particular security or stay invested in any one particular company. The composition of the Fund’s top holdings is subject to change. Performance figures are historical and reflect the change in share price, reinvested distributions, changes in net asset value, sales charges and capital gains distributions, if any.
Mutual funds are not insured or guaranteed by the FDIC or by any other government agency or government sponsored agency of the federal government or any state, not deposits, obligations or guaranteed by any bank or its affiliates and are subject to investment risks, including possible loss of the principal amount invested.
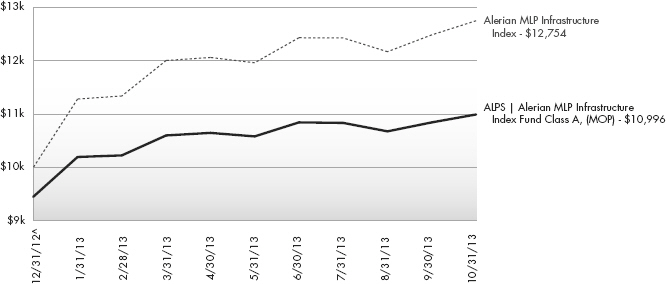
Top Ten Long Holdings (as a % of Net Assets) †
|
| Industry Sector Allocation (as a % of Net Assets)
| ||||||
Enterprise Products Partners LP | 9.98 | % |
| |||||
Kinder Morgan Energy Partners LP | 9.31 | % | ||||||
Magellan Midstream Partners LP | 7.70 | % | ||||||
MarkWest Energy Partners LP | 7.24 | % | ||||||
Energy Transfer Partners LP | 7.11 | % | ||||||
Plains All American Pipeline LP | 6.92 | % | ||||||
ONEOK Partners LP | 4.87 | % | ||||||
Williams Partners LP | 4.82 | % | ||||||
Buckeye Partners LP | 4.60 | % | ||||||
Enbridge Energy Partners LP | 4.33 | % | ||||||
Top Ten Holdings | 66.88 | % | ||||||
† Holdings are subject to change. Table presents indicative values only. |
| |||||||
| 7 | October 31, 2013 |
ALPS | Alerian MLP Infrastructure Index Fund
| ||
| October 31, 2013 (Unaudited) | ||
| Shares | Value (Note 2) | |||||||
| ||||||||
MASTER LIMITED PARTNERSHIPS (102.19%) |
| |||||||
Gathering & Processing (27.86%) |
| |||||||
Pipelines (27.86%) | ||||||||
Access Midstream Partners LP | 6,328 | $ | 338,801 | |||||
Atlas Pipeline Partners LP | 5,575 | 214,972 | ||||||
DCP Midstream Partners LP | 5,283 | 256,648 | ||||||
MarkWest Energy Partners LP | 10,933 | 812,103 | ||||||
Regency Energy Partners LP | 11,794 | 300,629 | ||||||
Targa Resources Partners LP | 7,160 | 373,108 | ||||||
Western Gas Partners LP | 4,750 | 285,522 | ||||||
Williams Partners LP | 10,518 | 540,836 | ||||||
|
| |||||||
| 3,122,619 | ||||||||
|
| |||||||
TOTAL GATHERING & PROCESSING |
| 3,122,619 | ||||||
|
| |||||||
Natural Gas Pipelines (32.65%) | ||||||||
Pipelines (32.65%) | ||||||||
Boardwalk Pipeline Partners LP | 9,069 | 271,616 | ||||||
El Paso Pipeline Partners LP | 9,826 | 398,543 | ||||||
Energy Transfer Partners LP | 15,041 | 796,722 | ||||||
Enterprise Products Partners LP | 17,684 | 1,119,043 | ||||||
ONEOK Partners LP | 10,153 | 545,927 | ||||||
PVR Partners LP | 7,459 | 195,351 | ||||||
Spectra Energy Partners LP | 3,547 | 155,075 | ||||||
TC Pipelines LP | 3,491 | 178,076 | ||||||
|
| |||||||
| 3,660,353 | ||||||||
|
| |||||||
TOTAL NATURAL GAS PIPELINES |
| 3,660,353 | ||||||
|
| |||||||
Petroleum Transportation (41.68%) |
| |||||||
Pipelines (41.68%) | ||||||||
Buckeye Partners LP | 7,666 | 515,692 | ||||||
Enbridge Energy Partners LP | 16,029 | 485,198 | ||||||
Genesis Energy LP | 5,340 | 272,126 | ||||||
Kinder Morgan Energy Partners LP | 12,934 | 1,043,774 | ||||||
Magellan Midstream Partners LP | 14,373 | 862,955 | ||||||
NuStar Energy LP | 5,029 | 216,850 | ||||||
Plains All American Pipeline LP | 15,136 | 775,266 | ||||||
Sunoco Logistics Partners LP | 5,415 | 380,025 | ||||||
Tesoro Logistics LP | 2,235 | 120,020 | ||||||
|
| |||||||
| 4,671,906 | ||||||||
|
| |||||||
TOTAL PETROLEUM TRANSPORTATION |
| 4,671,906 | ||||||
|
| |||||||
TOTAL MASTER LIMITED PARTNERSHIPS (Cost $10,340,554) |
| 11,454,878 | ||||||
|
| |||||||
| 7-Day Yield | Shares | Value (Note 2) | ||||||||||
| ||||||||||||
SHORT TERM INVESTMENTS (4.07%) |
| |||||||||||
Money Market Fund (4.07%) |
| |||||||||||
Dreyfus Treasury Prime Cash Management Fund, Institutional Shares | 0.00004 | % | 456,597 | $ | 456,597 | |||||||
|
| |||||||||||
TOTAL SHORT TERM INVESTMENTS (Cost $ 456,597) |
| 456,597 | ||||||||||
|
| |||||||||||
TOTAL INVESTMENTS (106.26%) (Cost $ 10,797,151) |
| $ | 11,911,475 | |||||||||
Liabilities In Excess Of Other Assets (-6.26%) |
| (702,083) | ||||||||||
|
| |||||||||||
NET ASSETS (100.00%) |
| $ | 11,209,392 | |||||||||
|
| |||||||||||
Common Abbreviations:
LP - Limited Partnerships.
For Fund compliance purposes, the Fund’s industry classifications refer to any one or more of the industry sub-classifications used by one or more widely recognized market indexes or ratings group indexes, and/or as defined by Fund management. This definition may not apply for purposes of this report, which may combine industry sub-classifications for reporting ease. Industries are shown as a percent of net assets.
See Notes to Financial Statements.
| 8 | October 31, 2013 |
ALPS | Alerian MLP Infrastructure Index Fund | ||
| October 31, 2013 (Unaudited) | ||
ASSETS | ||||
Investments, at value | $ | 11,911,475 | ||
Dividends receivable | 82,133 | |||
Receivable due from advisor | 15,803 | |||
Prepaid offering costs | 11,397 | |||
Prepaid expenses and other assets | 32,004 | |||
| ||||
Total Assets | 12,052,812 | |||
| ||||
LIABILITIES | ||||
Payable for investments purchased | 445,941 | |||
Deferred tax liability | 373,238 | |||
Current tax payable | 10,182 | |||
Administration and transfer agency fees payable | 1,206 | |||
Distribution and services fees payable | 4,250 | |||
Trustees’ fees and expenses payable | 85 | |||
Legal fees payable | 63 | |||
Audit and tax fees payable | 954 | |||
Accrued expenses and other liabilities | 7,501 | |||
| ||||
Total Liabilities | 843,420 | |||
| ||||
NET ASSETS | $ | 11,209,392 | ||
| ||||
NET ASSETS CONSIST OF | ||||
Paid-in capital | $ | 10,558,970 | ||
Accumulated net investment loss, net of deferred income taxes | (31,390) | |||
Accumulated net realized loss on investments, net of deferred income taxes | (26,713) | |||
Net unrealized appreciation on investments, net of deferred income taxes | 708,525 | |||
| ||||
NET ASSETS | $ | 11,209,392 | ||
| ||||
INVESTMENTS, AT COST | $ | 10,797,151 | ||
| ||||
PRICING OF SHARES | ||||
Class A: | ||||
Net Asset Value, offering and redemption price per share(a) | $ | 11.12 | ||
Net Assets | $ | 6,994,470 | ||
Shares of beneficial interest outstanding (unlimited number of shares, no par value common stock authorized) | 629,049 | |||
Maximum offering price per share ((NAV/0.9450), based on maximum sales charge of 5.50% of the offering price) | $ | 11.77 | ||
Class C: | ||||
Net Asset Value, offering and redemption price per share(a) | $ | 11.08 | ||
Net Assets | $ | 1,650,844 | ||
Shares of beneficial interest outstanding (unlimited number of shares, no par value common stock authorized) | 149,001 | |||
Class I: | ||||
Net Asset Value, offering and redemption price per share | $ | 11.14 | ||
Net Assets | $ | 2,564,078 | ||
Shares of beneficial interest outstanding (unlimited number of shares, no par value common stock authorized) | 230,206 | |||
| (a) | Redemption price per share may be reduced for any applicable contingent deferred sales charge. For a description of a possible sales charge, please see the Fund’s Prospectus. |
See Notes to Financial Statements. |
| 9 | October 31, 2013 |
ALPS | Alerian MLP Infrastructure Index Fund | ||
| For the Six Months Ended October 31, 2013 (Unaudited) | ||
INVESTMENT INCOME | ||||
Distributions from master limited partnerships | 181,312 | |||
Less return of capital distributions | (181,312) | |||
| ||||
Total Investment Income | – | |||
| ||||
EXPENSES | ||||
Investment advisory fees | 22,245 | |||
Administrative and transfer agency fees | 4,129 | |||
Distribution and service fees | ||||
Class A | 6,417 | |||
Class C | 3,950 | |||
Legal fees | 16 | |||
Audit and tax fees | 23,462 | |||
Reports to shareholders and printing fees | 706 | |||
State registration fees | 4,294 | |||
SEC registration fees | 690 | |||
Custody fees | 6,270 | |||
Trustees’ fees and expenses | 122 | |||
Offering costs | 34,620 | |||
Miscellaneous expenses | 4,612 | |||
| ||||
Total Expenses | 111,533 | |||
Less fees waived/reimbursed by investment advisor (Note 7) | ||||
Class A | (34,955) | |||
Class C | (9,835) | |||
Class I | (29,365) | |||
| ||||
Net Expenses | 37,378 | |||
| ||||
Net Investment Loss, Before Deferred Income Taxes | (37,378) | |||
Deferred income tax benefit | 13,614 | |||
| ||||
Net Investment Loss, Net of Deferred Income Taxes | (23,764) | |||
| ||||
REALIZED AND UNREALIZED GAIN/(LOSS) | ||||
Net realized loss on investments, before deferred income taxes | (10,884) | |||
Current income tax expense | (10,182) | |||
Deferred income tax benefit | 14,146 | |||
| ||||
Net Realized Loss on investments, Net of Deferred Income Taxes | (6,920) | |||
| ||||
Net change in unrealized appreciation on investment, before deferred income taxes | 480,401 | |||
Deferred income tax expense | (175,051) | |||
| ||||
Net Change in Unrealized Appreciation on Investments | 305,350 | |||
| ||||
NET REALIZED AND UNREALIZED GAIN ON INVESTMENTS, NET OF DEFERRED INCOME TAXES | 298,430 | |||
| ||||
NET INCREASE IN NET ASSETS RESULTING FROM OPERATIONS | $ | 274,666 | ||
| ||||
See Notes to Financial Statements. |
| 10 | October 31, 2013 |
ALPS | Alerian MLP Infrastructure Index Fund | ||
| For the Six MonthsEnded October 31, 2013 (Unaudited) | For the Period January 2, 2013 (Commencement) to April 30, 2013 | |||||||
| ||||||||
OPERATIONS | ||||||||
Net investment loss, net of deferred income taxes | (23,764) | (7,626) | ||||||
Net realized loss on investments, net of deferred income taxes | (6,920) | (764) | ||||||
Net change in unrealized appreciation on investments, net of deferred income taxes | 305,350 | 403,175 | ||||||
| ||||||||
Net Increase in Net Assets Resulting from Operations | 274,666 | 394,785 | ||||||
| ||||||||
DISTRIBUTIONS | ||||||||
Dividends to shareholders from net realized gains | ||||||||
Class A | (5,165) | – | ||||||
Class C | (2,812) | – | ||||||
Class I | (11,052) | – | ||||||
Dividends to shareholders from tax return of capital | ||||||||
Class A | (26,670) | (8,653) | ||||||
Class C | (14,520) | (8,137) | ||||||
Class I | (57,063) | (32,548) | ||||||
| ||||||||
Net Decrease in Net Assets from Distributions | (117,282) | (49,338) | ||||||
| ||||||||
BENEFICIAL INTEREST TRANSACTIONS (NOTE 6) | ||||||||
Shares sold | ||||||||
Class A | 6,409,506 | 851,295 | ||||||
Class C | 1,050,687 | 500,010 | ||||||
Class I | 230,232 | 2,000,010 | ||||||
Dividends reinvested | ||||||||
Class A | 27,042 | 8,653 | ||||||
Class C | 17,181 | 8,137 | ||||||
Class I | 68,115 | 32,548 | ||||||
Shares redeemed | ||||||||
Class A | (496,825) | (10) | ||||||
Class C | – | (10) | ||||||
Class I | – | (10) | ||||||
| ||||||||
Net Increase in Net Assets Derived from Beneficial Interest Transactions | 7,305,938 | 3,400,623 | ||||||
| ||||||||
Net increase in net assets | 7,463,322 | 3,746,070 | ||||||
NET ASSETS | ||||||||
Beginning of period | 3,746,070 | – | ||||||
| ||||||||
End of period * | $ | 11,209,392 | $ | 3,746,070 | ||||
| ||||||||
*Including accumulated net investment loss, net of Deferred Income Taxes, of: | $ | (31,390) | $ | (7,626) | ||||
See Notes to Financial Statements. |
| 11 | October 31, 2013 |
ALPS | Alerian MLP Infrastructure Index Fund – Class A | ||
Selected data for a share of beneficial interest outstanding throughout the periods indicated:
For the Six Months Ended October 31, 2013 | For the Period January 2, 2013 April 30, 2013 | |||
| ||||
Net asset value, beginning of period | $11.10 | $10.00 | ||
INCOME/(LOSS) FROM INVESTMENT OPERATIONS: | ||||
Net investment loss(a) | (0.05) | (0.03) | ||
Net realized and unrealized gain | 0.40 | 1.29 | ||
| ||||
Total from investment operations | 0.35 | 1.26 | ||
| ||||
DISTRIBUTIONS: | ||||
From net realized gains | (0.05) | – | ||
From tax return of capital | (0.28) | (0.16) | ||
| ||||
Total distributions | (0.33) | (0.16) | ||
| ||||
Net increase in net asset value | 0.02 | 1.10 | ||
| ||||
Net asset value, end of period | $11.12 | $11.10 | ||
| ||||
TOTAL RETURN(b) | 3.24% | 12.68% | ||
RATIOS/SUPPLEMENTAL DATA: | ||||
Net assets, end of period (000s) | $6,994 | $928 | ||
Ratio of expenses to average net assets before waivers and income tax expense | 3.43%(c)(d) | 5.51%(c)(d) | ||
Ratio of expense waivers to average net assets | (2.18%)(c)(d) | (4.26%)(c)(d) | ||
| ||||
Ratio of expenses to average net assets net of waivers and before income tax expense | 1.25%(c)(d) | 1.25%(c)(d) | ||
Ratio of deferred income tax expense to average net assets(e) | 4.96%(c) | 20.55%(c) | ||
| ||||
Ratio of total expenses to average net assets | 6.21%(c) | 21.80%(c) | ||
| ||||
Ratio of investment loss to average net assets before waivers and income tax expense | (3.43%)(c)(d) | (5.51%)(c)(d) | ||
Ratio of expense waivers to average net assets | (2.18%)(c)(d) | (4.26%)(c)(d) | ||
| ||||
Ratio of investment loss to average net assets net of waivers and before income tax expense | (1.25%)(c)(d) | (1.25%)(c)(d) | ||
Ratio of deferred income tax benefit to average net assets(f) | 0.42%(c) | 0.40%(c) | ||
| ||||
Ratio of net investment loss to average net assets | (0.83%)(c) | (0.85%)(c) | ||
| ||||
Portfolio turnover rate(g) | 7% | 3% | ||
| (a) | Calculated using the average shares method. |
| (b) | Total returns are for the period indicated and have not been annualized. Total returns would have been lower had certain expenses not been waived during the period. Returns shown do not reflect the deduction of taxes that a shareholder would pay on Fund distributions or the redemption of Fund shares. Returns shown exclude any applicable sales charges. |
| (c) | Annualized. |
| (d) | Expense ratios before reductions for startup periods may not be representative of longer term operating periods. |
| (e) | Deferred income tax expense estimate for the ratio calculation is derived from the net investment loss, and realized and unrealized gains/losses. |
| (f) | Deferred income tax benefit for the ratio calculation is derived from net investment loss only. |
| (g) | Portfolio turnover rate for periods less than one full year have not been annualized. |
See Notes to Financial Statements. |
| 12 | October 31, 2013 |
ALPS | Alerian MLP Infrastructure Index Fund – Class C | ||
Financial Highlights | ||
Selected data for a share of beneficial interest outstanding throughout the periods indicated:
For the Six Months Ended | For the Period January 2, 2013 (Commencement) to April 30, 2013 | |||
| ||||
Net asset value, beginning of period | $11.09 | $10.00 | ||
INCOME/(LOSS) FROM INVESTMENT OPERATIONS: | ||||
Net investment loss(a) | (0.08) | (0.05) | ||
Net realized and unrealized gain | 0.40 | 1.30 | ||
| ||||
Total from investment operations | 0.32 | 1.25 | ||
| ||||
DISTRIBUTIONS: | ||||
From net realized gains | (0.05) | – | ||
From tax return of capital | (0.28) | (0.16) | ||
| ||||
Total distributions | (0.33) | (0.16) | ||
| ||||
Net increase/(decrease) in net asset value | (0.01) | 1.09 | ||
| ||||
Net asset value, end of period | $11.08 | $11.09 | ||
| ||||
TOTAL RETURN(b) | 2.97% | 12.58% | ||
RATIOS/SUPPLEMENTAL DATA: | ||||
Net assets, end of period (000s) | $1,651 | $563 | ||
Ratio of expenses to average net assets before waivers and income tax expense | 4.34%(c)(d) | 7.01%(c)(d) | ||
Ratio of expense waivers to average net assets | (2.49%)(c)(d) | (5.16%)(c)(d) | ||
| ||||
Ratio of expenses to average net assets net of waivers and before income tax expense | 1.85%(c)(d) | 1.85%(c)(d) | ||
Ratio of deferred income tax expense to average net assets(e) | 4.96%(c) | 20.55%(c) | ||
| ||||
Ratio of total expenses to average net assets | 6.81%(c) | 22.40%(c) | ||
| ||||
Ratio of investment loss to average net assets before waivers and income tax expense | (4.34%)(c)(d) | (7.01%)(c)(d) | ||
Ratio of expense waivers to average net assets | (2.49%)(c)(d) | (5.16%)(c)(d) | ||
| ||||
Ratio of investment loss to average net assets net of waivers and before income tax expense | (1.85%)(c)(d) | (1.85%)(c)(d) | ||
Ratio of deferred income tax benefit to average net assets(f) | 0.42%(c) | 0.40%(c) | ||
| ||||
Ratio of net investment loss to average net assets | (1.43%)(c) | (1.45%)(c) | ||
| ||||
Portfolio turnover rate(g) | 7% | 3% | ||
| (a) | Calculated using the average shares method. |
| (b) | Total returns are for the period indicated and have not been annualized. Total returns would have been lower had certain expenses not been waived during the period. Returns shown do not reflect the deduction of taxes that a shareholder would pay on Fund distributions or the redemption of Fund shares. Returns shown exclude any applicable sales charges. |
| (c) | Annualized. |
| (d) | Expense ratios before reductions for startup periods may not be representative of longer term operating periods. |
| (e) | Deferred income tax expense estimate for the ratio calculation is derived from the net investment loss, and realized and unrealized gains/losses. |
| (f) | Deferred income tax benefit for the ratio calculation is derived from net investment loss only. |
| (g) | Portfolio turnover rate for periods less than one full year have not been annualized. |
See Notes to Financial Statements. |
| 13 | October 31, 2013 |
ALPS | Alerian MLP Infrastructure Index Fund – Class I | ||
Financial Highlights | ||
Selected data for a share of beneficial interest outstanding throughout the periods indicated:
| For the Six Months Ended October 31, 2013 (Unaudited) | For the Period January 2, 2013 (Commencement) to April 30, 2013 | |||
| ||||
Net asset value, beginning of period | $11.11 | $10.00 | ||
INCOME/(LOSS) FROM INVESTMENT OPERATIONS: | ||||
Net investment loss(a) | (0.02) | (0.02) | ||
Net realized and unrealized gain | 0.38 | 1.29 | ||
| ||||
Total from investment operations | 0.36 | 1.27 | ||
| ||||
DISTRIBUTIONS: | ||||
From net realized gains | (0.05) | – | ||
From tax return of capital | (0.28) | (0.16) | ||
| ||||
Total distributions | (0.33) | (0.16) | ||
| ||||
Net increase in net asset value | 0.03 | 1.11 | ||
| ||||
Net asset value, end of period | $11.14 | $11.11 | ||
| ||||
TOTAL RETURN(b) | 3.33% | 12.78% | ||
RATIOS/SUPPLEMENTAL DATA: | ||||
Net assets, end of period (000s) | $2,564 | $2,256 | ||
Ratio of expenses to average net assets before waivers and income tax expense | 3.34%(c)(d) | 6.01%(c)(d) | ||
Ratio of expense waivers to average net assets | (2.49%)(c)(d) | (5.16%)(c)(d) | ||
| ||||
Ratio of expenses to average net assets net of waivers and before income tax expense | 0.85%(c)(d) | 0.85%(c)(d) | ||
Ratio of deferred income tax expense to average net assets(e) | 4.96%(c) | 20.55%(c) | ||
| ||||
Ratio of total expenses to average net assets | 5.81%(c) | 21.40%(c) | ||
| ||||
Ratio of investment loss to average net assets before waivers and income tax expense | (3.34%)(c)(d) | (6.01%)(c)(d) | ||
Ratio of expense waivers to average net assets | (2.49%)(c)(d) | (5.16%)(c)(d) | ||
| ||||
Ratio of investment loss to average net assets net of waivers and before income tax expense | (0.85%)(c)(d) | (0.85%)(c)(d) | ||
Ratio of deferred income tax benefit to average net assets(f) | 0.42%(c) | 0.40%(c) | ||
| ||||
Ratio of net investment loss to average net assets | (0.43%)(c) | (0.45%)(c) | ||
| ||||
Portfolio turnover rate(g) | 7% | 3% | ||
| (a) | Calculated using the average shares method. |
| (b) | Total returns are for the period indicated and have not been annualized. Total returns would have been lower had certain expenses not been waived during the period. Returns shown do not reflect the deduction of taxes that a shareholder would pay on Fund distributions or the redemption of Fund shares. |
| (c) | Annualized. |
| (d) | Expense ratios before reductions for startup periods may not be representative of longer term operating periods. |
| (e) | Deferred income tax expense estimate for the ratio calculation is derived from the net investment loss, and realized and unrealized gains/losses. |
| (f) | Deferred income tax benefit for the ratio calculation is derived from net investment loss only. |
| (g) | Portfolio turnover rate for periods less than one full year have not been annualized. |
See Notes to Financial Statements. |
| 14 | October 31, 2013 |
ALPS | CoreCommodity Management CompleteCommodities® Strategy Fund | ||
| October 31, 2013 (Unaudited) | ||
The six month period ending on October 31, 2013 produced mixed returns for commodities. Commodity futures prices, as measured by the Thomson Reuters/CoreCommodity CRB Total Return Index, were down 3.54%. On the other hand, commodity equities appreciated during the quarter, up 3.27% as measured by the Standard and Poor’s Global Natural Resources Net Total Return Index. Commodity equities may have benefitted from the performance of the broader Standard & Poor’s 500 Total Return Index for the period which posted +11.14% gains. The ALPS CoreCommodity Strategy Allocation Fund (JCRIX) delivered a net negative return of -2.51% (JCRAX was -2.60% and JCRCX was down 2.91%).
The Fund outperformed its benchmark, the Thomson Reuters/CoreCommodity CRB Index, by approximately 103 basis points1 during this period (measured against the performance of the “I” shares). The Fund employs a strategy that combines an actively managed portfolio of commodity futures related exposure (collateralized by Treasury Inflation Protected Securities – TIPS), commodity equities, and physical commodity ETFs. Throughout most of the quarter, the Fund allocated approximately 65% of its assets toward commodity futures related investments and approximately 35% of its assets in commodity equities. The Fund was almost 98% invested by the end of October.
Commodity prices were generally under pressure during the six month period ending in October 2013. With certain exceptions, commodity prices declined at the hint of tapering of quantitative easing (QE- US Treasury bonds and mortgage backed securities purchased by the Federal Reserve with newly created currency). Many market participants equated the possibility of a reduction in the stimulus provided by QE as de facto tightening, despite the Fed’s insistence that it would maintain extremely low short term rates for an extended period of time. The Federal Reserve’s attitude toward the possibility of tapering was predicated on improving economic metrics including higher employment, increasing economic activity, and higher levels of inflation. While some of the numbers improved modestly, inflation remained stubbornly low, according to the Fed’s objectives.
Lean hogs were the best performing commodity within the Thomson Reuters/CoreCommodity CRB Index from the end of April 2013 to the end of October 2013, up 13.02%. Lingering effects of last summer’s extreme drought and heat in the mid-west contributed to smaller numbers or hogs and cattle. Live cattle prices added 4.35% in the time frame. Cocoa prices (up 12.80% for the 6 month period) were supported by dry conditions and political tension in key growing regions in Africa. Crude oil prices rose for both domestic and international markers. Modestly higher economic growth and ongoing problems in Libya, Syria, and Iran combined to gently push demand while international crude supply was constrained. West Texas Intermediate (WTI) crude rose 5.46% and Brent North Sea crude added 8.45%. The Fund has exposure to both crude oil contracts.
Coffee prices declined by the greatest percentage during the six-month period ending in October 2013, down 24.77%. Ideal weather and high yields have depressed prices for Arabica coffee globally.
Arabica beans are preferred by most premium coffee drinkers. Natural gas prices were challenged with increasing US supplies and a very quiet hurricane season in the Gulf region. Natural gas prices fell 22.56% from April through October. Corn and wheat prices retreated by 22.53% and 11.38% respectively. Farmers planted additional quantities of both grains as a response to the high prices from last year. Favorable conditions prevailed for growing and harvesting seasons. The Environmental Protection Agency (EPA) relaxed the scheduled mandate to increase ethanol to 15% from the current 10% level in reformulated gasoline. The move withdrew a certain amount of anticipated demand for corn in particular. Ethanol production diverts about 40% of the entire US corn crop from human and animal consumption. Precious metal prices continued under pressure. Gold prices went down 10.34% while silver fell 9.99%.
The Fund’s top equity holdings at the end of October 2013 included Monsanto (MON) +11.28% YTD, Exxon/Mobil (XOM) +3.28% YTD, Syngenta AG (SYNN) +2.64% YTD, Chevron Corporation (CVX) +11.80% YTD , Deere & Company (DE) -5.05% YTD, Potash (POT) -21.57% YTD, Archer Daniels Midland +46.21% YTD, British Petroleum (BP US) +11.62% YTD, CF Industries Holdings (CF) +5.16% YTD , Royal Dutch Shell (RDS/A) +.58% YTD.
TIPS are held by the Fund to invest excess cash and as collateral for commodity futures related investments held in our Cayman Island subsidiary. Nominal yields on the benchmark 10 year note began the quarter at 1.926% and ended the six month period significantly higher, 2.55%. At one point in early September, ten year note yields briefly exceeded 3%. Despite the efforts by the Federal Reserve and other central banks to maintain historically low interest rates, we believe we may be nearing the end of what has been a significant multi-year rally in US treasury prices. As a result, we continue to invest in TIPS with limited duration exposure. At the end of October, our weighted average maturity was approximately 1.75 years in our TIPS portfolio.
We strongly believe that the long term fundamental drivers of commodity demand and ultimately higher prices are still in place. Population growth is likely to remain unabated regardless of the economic environment in the US and Europe. A billion more people will be added to the world population over the next decade. The trend of wealth distribution to the developing world as those economies grow at rapid rates relative to the slow or negative growth occurring in the developed countries is contributing to ever increasing demand for raw materials and food. Incremental gains in disposable income in the developing nations have led to competition for the commodities needed for more complex and costly lifestyles. In a world with limited supplies of food, fuel, building materials, and other necessities of life, price may become the ultimate allocator. Additionally, the aggressively accommodative central bank monetary policies recently announced coupled with measures already in place globally are likely to make commodities and other real assets more attractive over time as currencies, including the US Dollar, may decline in value.
| 15 | October 31, 2013 |
ALPS | CoreCommodity Management CompleteCommodities® Strategy Fund | ||
Management Commentary | October 31, 2013 (Unaudited) | |
| 1 | Basis Points or bps is a unit that is equal to 1/100th of 1%, and is used to denote the change in a financial instrument. |
The views and information discussed in this commentary are as of the date of publication, are subject to change, and may not reflect the writer’s current views. The views expressed represent an assessment of market conditions at a specific point in time, are opinions only and should not be relied upon as investment advice regarding a particular investment or markets in general. Such information does not constitute a recommendation to buy or sell specific securities or investment vehicles. It should not be assumed that any investment will be profitable or will equal the performance of the fund(s) or any securities or any sectors mentioned herein. The subject matter contained herein has been derived from several sources believed to be reliable and accurate at the time of compilation. CoreCommodity Management, LLC does not accept any liability for losses either direct or consequential caused by the use of this information.
| 16 | October 31, 2013 |
ALPS | CoreCommodity Management CompleteCommodities® Strategy Fund | ||
| October 31, 2013 (Unaudited) | ||
Performance of $10,000 Initial Investment (as of October 31, 2013)
Comparison of change in value of a $10,000 investment (includes maximum sales charges of 5.50%)
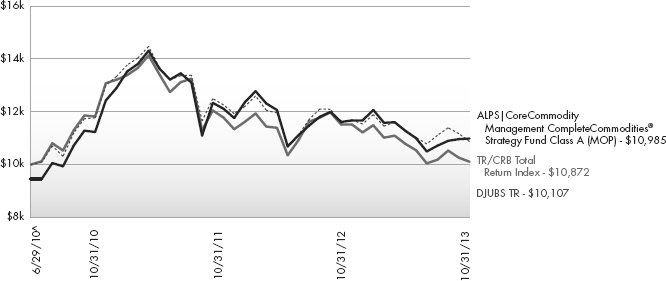
The chart above represents historical performance of a hypothetical investment of $10,000 in the Fund since inception. Past performance does not guarantee future results. This chart does not reflect the deduction of taxes that a shareholder would pay on Fund distributions or the redemption of Fund shares.
Average Annual Total Returns (as of October 31, 2013)
| 1 Year | 3 Years | Since Inception ^ | Total Expense Ratio | What You Pay * | ||||||
Class A (NAV)1 | -5.42% | -0.89% | 4.61% | 1.55% | 1.46% | |||||
Class A (MOP)2 | -10.66% | -2.72% | 2.85% | |||||||
Class C (NAV)1 | -6.02% | -1.54% | 4.02% | 2.15% | 2.06% | |||||
Class C (CDSC)2 | -6.95% | -1.54% | 4.02% | |||||||
Class I | -5.17% | -0.65% | 4.91% | 1.17% | 1.16% | |||||
TR/CRB Total Return Index3 | -6.02% | -2.52% | 2.53% | |||||||
DJUBS Commodity TR3 | -12.22% | -5.19% | 0.32% |
Performance data quoted represents past performance. Past performance does not guarantee future results. Investment return and principal value of an investment will fluctuate so that an investor’s shares, when sold or redeemed, may be worth more or less than the original cost. Current performance data may be higher or lower than actual data quoted. The Fund imposes a 2.00% redemption fee on shares held for less than 30 days. The Fund imposes a maximum Contingent Deferred Sales Charge (“CDSC”) of 1.00% to shares redeemed within the first 12 months after a purchase, and on Class A shares redeemed within the first 18 months after a purchase in excess of $1 million. Performance data does not reflect the redemption fee or the CDSC, which if reflected would reduce the performance quoted. For the most current month-end performance data, please call 1-866-759-5679.
| 17 | October 31, 2013 |
ALPS | CoreCommodity Management CompleteCommodities® Strategy Fund | ||
Performance Update | October 31, 2013 (Unaudited) | |
| 1 | Net Asset Value (NAV) is the share price without sales charges. |
| 2 | Maximum Offering Price (MOP) includes sales charges. Class A returns include effects of the Fund’s maximum sales charge of 5.50%; Class C returns include the 1.00% CDSC. |
| 3 | Thomson Reuters / CRB Index and the Dow Jones-UBS Commodity Index are unmanaged indices used as a measurement of change in commodity market conditions based on the performance of a basket of different commodities. The indices are not actively managed and do not reflect any deduction for fees, expenses or taxes. An investor may not invest directly in an index. |
| ^ | Fund inception date of June 29, 2010. |
| * | What You Pay reflects the Sub-Advisor’s decision to contractually limit expenses through August 31, 2014. Please see the prospectus for additional information. |
The table does not reflect the deduction of taxes that a shareholder would pay on Fund distributions or the redemption of Fund shares.
There is no guarantee that the Fund will continue to hold any one particular security or stay invested in any one particular company. The composition of the Fund’s top holdings is subject to change. Performance figures are historical and reflect the change in share price, reinvested distributions, changes in net asset value, sales charges and capital gains distributions, if any.
Mutual funds are not insured or guaranteed by the FDIC or by any other government agency or government sponsored agency of the federal government or any state, not deposits, obligations or guaranteed by any bank or its affiliates and are subject to investment risks, including possible loss of the principal amount invested.
This Fund is not suitable for all investors, and is subject to investment risks, including possible loss of the principal amount invested.
Investing in commodity-related securities involves risk and considerations not present when investing in more conventional securities. The Fund may be more susceptible to high volatility of commodity markets.
Derivatives generally are more sensitive to changes in economic or market conditions than other types of investments; this could result in losses that significantly exceed the Fund’s original investment.
| 18 | October 31, 2013 |
ALPS | CoreCommodity Management CompleteCommodities® Strategy Fund | ||
| October 31, 2013 (Unaudited) | ||
| Shares | Value (Note 2) | |||||||
| ||||||||
COMMON STOCKS (38.22%) |
| |||||||
Australia (0.46%) | ||||||||
Fortescue Metals Group, Ltd. | 31,313 | $ | 154,193 | |||||
Iluka Resources, Ltd. | 7,779 | 75,729 | ||||||
Incitec Pivot, Ltd. | 265,758 | 668,144 | ||||||
Newcrest Mining, Ltd. | 11,624 | 113,161 | ||||||
Regis Resources, Ltd. | 104,820 | 345,757 | ||||||
Woodside Petroleum, Ltd. | 9,366 | 343,646 | ||||||
|
| |||||||
| 1,700,630 | ||||||||
|
| |||||||
Brazil (0.38%) | ||||||||
Cia Siderurgica Nacional SA, ADR | 1,580 | 8,753 | ||||||
Gerdau SA, ADR | 10,527 | 83,479 | ||||||
Petroleo Brasileiro SA, ADR | 25,208 | 439,375 | ||||||
Vale SA, ADR | 52,655 | 843,007 | ||||||
|
| |||||||
| 1,374,614 | ||||||||
|
| |||||||
Canada (4.83%) | ||||||||
Agnico-Eagle Mines, Ltd. | 9,541 | 281,746 | ||||||
Agrium, Inc. | 24,201 | 2,064,829 | ||||||
AuRico Gold, Inc. | 120,230 | 494,145 | ||||||
Barrick Gold Corp. | 38,755 | 751,459 | ||||||
Cameco Corp. | 5,892 | 111,948 | ||||||
Canadian Natural Resources, Ltd. | 5,741 | 182,277 | ||||||
Eldorado Gold Corp. | 28,088 | 189,594 | ||||||
Encana Corp. | 19,565 | 350,605 | ||||||
First Quantum Minerals, Ltd. | 16,847 | 319,603 | ||||||
Goldcorp, Inc. | 24,289 | 617,669 | ||||||
IAMGOLD Corp. | 228,430 | 1,164,993 | ||||||
Kinross Gold Corp. | 93,747 | 475,297 | ||||||
New Gold, Inc.(a) | 81,391 | 476,137 | ||||||
Osisko Mining Corp.(a) | 85,692 | 418,331 | ||||||
Pan American Silver Corp. | 72,423 | 768,408 | ||||||
Potash Corp. of Saskatchewan, Inc. | 155,079 | 4,822,957 | ||||||
Silver Standard Resources, | 68,096 | 382,700 | ||||||
Silver Wheaton Corp. | 26,173 | 593,342 | ||||||
Suncor Energy, Inc. | 36,444 | 1,324,739 | ||||||
Teck Resources, Ltd., Class B | 14,026 | 375,055 | ||||||
TransCanada Corp. | 12,731 | 573,759 | ||||||
Turquoise Hill Resources, Ltd.(a) | 109,666 | 528,590 | ||||||
Yamana Gold, Inc. | 45,719 | 453,990 | ||||||
|
| |||||||
| 17,722,173 | ||||||||
|
| |||||||
Chile (0.09%) | ||||||||
Sociedad Quimica y Minera de Chile SA, ADR | 11,464 | 316,521 | ||||||
|
| |||||||
China (0.54%) | ||||||||
China Petroleum & Chemical Corp., Class H | 718,358 | 586,509 | ||||||
China Shenhua Energy Co., Ltd., Class H | 95,369 | 290,302 | ||||||
CNOOC, Ltd. | 250,001 | 513,352 | ||||||
Jiangxi Copper Co., Ltd., Class H | 50,082 | 96,250 | ||||||
PetroChina Co., Ltd., Class H | 330,045 | 378,021 | ||||||
| Shares | Value (Note 2) | |||||||
| ||||||||
China (continued) | ||||||||
Zijin Mining Group Co., Ltd.,Class H | 560,331 | $ | 129,368 | |||||
|
| |||||||
| 1,993,802 | ||||||||
|
| |||||||
Colombia (0.16%) | ||||||||
Ecopetrol SA | 12,334 | 584,138 | ||||||
|
| |||||||
France (0.60%) | ||||||||
Total SA | 35,634 | 2,190,022 | ||||||
|
| |||||||
Germany (0.32%) | ||||||||
K+S AG | 34,170 | 871,752 | ||||||
ThyssenKrupp AG(a) | 11,855 | 303,011 | ||||||
|
| |||||||
| 1,174,763 | ||||||||
|
| |||||||
India (0.25%) | ||||||||
Reliance Industries, Ltd., GDR(b) | 23,796 | 710,787 | ||||||
Sesa Goa, Ltd.(a) | 16,933 | 218,438 | ||||||
|
| |||||||
| 929,225 | ||||||||
|
| |||||||
Israel (0.28%) | ||||||||
Israel Chemicals, Ltd. | 55,718 | 461,071 | ||||||
The Israel Corp., Ltd.(a) | 1,110 | 559,997 | ||||||
|
| |||||||
| 1,021,068 | ||||||||
|
| |||||||
Italy (0.54%) | ||||||||
Eni SpA, ADR | 39,236 | 1,993,189 | ||||||
|
| |||||||
Japan (0.25%) | ||||||||
Inpex Corp. | 73,900 | 852,259 | ||||||
Nippon Steel & Sumitomo Metal Corp. | 20,342 | 66,820 | ||||||
|
| |||||||
| 919,079 | ||||||||
|
| |||||||
Jersey (0.06%) | ||||||||
Randgold Resources, Ltd., ADR | 2,744 | 202,782 | ||||||
|
| |||||||
Luxembourg (0.14%) | ||||||||
ArcelorMittal | 20,626 | 325,066 | ||||||
Tenaris SA, ADR | 4,150 | 194,261 | ||||||
|
| |||||||
| 519,327 | ||||||||
|
| |||||||
Mexico (0.17%) | ||||||||
Grupo Mexico SAB de CV, Series B | 54,387 | 172,366 | ||||||
Industrias Penoles SAB de CV | 14,794 | 429,547 | ||||||
|
| |||||||
| 601,913 | ||||||||
|
| |||||||
Netherlands (1.15%) | ||||||||
CNH Industrial N.V.(a) | 51,797 | 607,575 | ||||||
Nutreco N.V. | 12,688 | 622,160 | ||||||
Royal Dutch Shell PLC, ADR | 44,624 | 2,974,636 | ||||||
|
| |||||||
| 4,204,371 | ||||||||
|
| |||||||
Norway (0.46%) | ||||||||
Norsk Hydro ASA | 26,688 | 119,250 | ||||||
| 19 | October 31, 2013 |
ALPS | CoreCommodity Management CompleteCommodities® Strategy Fund | ||
Consolidated Statement of Investments | October 31, 2013 (Unaudited) | |
| Shares | Value (Note 2) | |||||||
| ||||||||
Norway (continued) | ||||||||
Yara International ASA | 36,159 | $ | 1,561,026 | |||||
|
| |||||||
| 1,680,276 | ||||||||
|
| |||||||
Peru (0.07%) | ||||||||
Cia de Minas Buenaventura SA, ADR | 18,729 | 271,571 | ||||||
|
| |||||||
Russia (1.86%) | ||||||||
Gazprom OAO, ADR | 159,410 | 1,492,078 | ||||||
LUKOIL OAO, ADR | 18,380 | 1,205,728 | ||||||
Mechel Steel Group, ADR(a) | 16,800 | 53,088 | ||||||
MMC Norilsk Nickel OJSC, ADR | 90,197 | 1,365,583 | ||||||
NovaTek OAO, GDR(c) | 1,817 | 255,288 | ||||||
Rosneft Oil OAO, GDR(c) | 53,474 | 422,177 | ||||||
Severstal OAO, GDR(c) | 78,269 | 683,288 | ||||||
Uralkali OJSC, GDR(c) | 50,441 | 1,347,279 | ||||||
|
| |||||||
| 6,824,509 | ||||||||
|
| |||||||
Singapore (0.53%) | ||||||||
Golden Agri-Resources, Ltd. | 1,263,360 | 610,221 | ||||||
Olam International, Ltd. | 331,254 | 410,668 | ||||||
Wilmar International, Ltd. | 330,439 | 920,398 | ||||||
|
| |||||||
| 1,941,287 | ||||||||
|
| |||||||
South Africa (0.76%) | ||||||||
Anglo Platinum, Ltd. | 2,554 | 103,325 | ||||||
AngloGold Ashanti, Ltd., ADR | 39,786 | 600,769 | ||||||
Gold Fields, Ltd., ADR | 187,690 | 863,374 | ||||||
Harmony Gold Mining Co., Ltd., ADR | 36,130 | 122,842 | ||||||
Impala Platinum Holdings, Ltd. | 39,295 | 477,548 | ||||||
Kumba Iron Ore, Ltd. | 1,186 | 49,647 | ||||||
Sasol, Ltd. | 10,287 | 525,583 | ||||||
Sibanye Gold, Ltd., ADR | 8,280 | 46,534 | ||||||
|
| |||||||
| 2,789,622 | ||||||||
|
| |||||||
South Korea (0.14%) | ||||||||
POSCO, ADR | 6,977 | 519,507 | ||||||
|
| |||||||
Sweden (0.10%) | ||||||||
Holmen AB, B Shares | 11,000 | 365,476 | ||||||
|
| |||||||
Switzerland (2.21%) | ||||||||
Glencore Xstrata PLC | 164,660 | 897,661 | ||||||
Syngenta AG | 15,982 | 6,455,506 | ||||||
Transocean, Ltd. | 8,890 | 418,452 | ||||||
Weatherford International, Ltd.(a) | 20,498 | 336,987 | ||||||
|
| |||||||
| 8,108,606 | ||||||||
|
| |||||||
United Kingdom (2.28%) | ||||||||
Anglo American PLC(a) | 27,213 | 647,960 | ||||||
Antofagasta PLC | 13,306 | 182,414 | ||||||
BG Group PLC | 55,192 | 1,126,990 | ||||||
BHP Billiton PLC, ADR | 20,756 | 1,279,400 | ||||||
BP PLC, ADR | 74,317 | 3,455,740 | ||||||
Kazakhmys PLC | 11,431 | 48,003 | ||||||
Lonmin PLC(a) | 32,588 | 168,565 | ||||||
| Shares | Value (Note 2) | |||||||
| ||||||||
United Kingdom (continued) |
| |||||||
Petropavlovsk PLC | 10,690 | $ | 13,712 | |||||
Rio Tinto PLC, ADR | 28,325 | 1,436,078 | ||||||
|
| |||||||
| 8,358,862 | ||||||||
|
| |||||||
United States (19.59%) | ||||||||
AGCO Corp. | 21,956 | 1,281,791 | ||||||
Alcoa, Inc. | 15,849 | 146,920 | ||||||
Allegheny Technologies, Inc. | 19,804 | 655,512 | ||||||
Allied Nevada Gold Corp.(a) | 95,099 | 388,004 | ||||||
American Vanguard Corp. | 4,915 | 128,281 | ||||||
Anadarko Petroleum Corp. | 8,727 | 831,596 | ||||||
Apache Corp. | 7,118 | 632,078 | ||||||
Archer-Daniels-Midland Co. | 105,307 | 4,307,056 | ||||||
Baker Hughes, Inc. | 10,613 | 616,509 | ||||||
Boardwalk Pipeline Partners LP | 3,100 | 92,845 | ||||||
Buckeye Partners LP | 1,400 | 94,178 | ||||||
Bunge, Ltd. | 15,262 | 1,253,468 | ||||||
Cameron International Corp.(a) | 11,146 | 611,470 | ||||||
CF Industries Holdings, Inc. | 14,847 | 3,201,013 | ||||||
Chevron Corp. | 43,292 | 5,193,308 | ||||||
Cliffs Natural Resources, Inc. | 7,741 | 198,789 | ||||||
Coeur Mining, Inc.(a) | 9,712 | 118,583 | ||||||
ConocoPhillips | 21,492 | 1,575,364 | ||||||
CST Brands, Inc. | 2,472 | 79,697 | ||||||
Deere & Co. | 60,913 | 4,985,120 | ||||||
Detour Gold Corp.(a) | 2,430 | 19,857 | ||||||
Devon Energy Corp. | 8,015 | 506,708 | ||||||
El Paso Pipeline Partners LP | 2,300 | 93,288 | ||||||
Enbridge Energy Partners LP, Class A | 3,000 | 90,810 | ||||||
Energy Transfer Partners LP | 2,000 | 105,940 | ||||||
Ensco PLC, Class A | 4,284 | 246,973 | ||||||
Enterprise Products Partners LP | 1,500 | 94,920 | ||||||
EOG Resources, Inc. | 3,478 | 620,475 | ||||||
Exxon Mobil Corp. | 107,497 | 9,633,881 | ||||||
First Majestic Silver Corp.(a) | 40,390 | 456,811 | ||||||
FMC Technologies, Inc.(a) | 6,853 | 346,419 | ||||||
Freeport-McMoRan Copper & Gold,Inc. | 13,813 | 507,766 | ||||||
Halliburton Co. | 18,836 | 998,873 | ||||||
Hecla Mining Co. | 32,888 | 102,611 | ||||||
Helmerich & Payne, Inc. | 5,481 | 425,052 | ||||||
Hess Corp. | 4,033 | 327,480 | ||||||
HollyFrontier Corp. | 9,280 | 427,437 | ||||||
Ingredion, Inc. | 17,747 | 1,167,043 | ||||||
Intrepid Potash, Inc. | 35,134 | 521,740 | ||||||
Kinder Morgan Energy Partners LP | 1,200 | 96,840 | ||||||
Kinder Morgan, Inc. | 15,180 | 536,006 | ||||||
Magellan Midstream Partners LP | 1,780 | 106,871 | ||||||
Marathon Oil Corp. | 34,740 | 1,224,932 | ||||||
Marathon Petroleum Corp. | 14,714 | 1,054,405 | ||||||
Monsanto Co. | 94,514 | 9,912,628 | ||||||
The Mosaic Co. | 54,139 | 2,482,273 | ||||||
Murphy Oil Corp. | 9,398 | 566,887 | ||||||
National Oilwell Varco, Inc. | 8,251 | 669,816 | ||||||
Newmont Mining Corp. | 22,497 | 613,268 | ||||||
| 20 | October 31, 2013 |
ALPS | CoreCommodity Management CompleteCommodities® Strategy Fund | ||
Consolidated Statement of Investments | October 31, 2013 (Unaudited) | |
| Shares | Value (Note 2) | |||||||
| ||||||||
United States (continued) |
| |||||||
Noble Energy, Inc. | 9,360 | $ | 701,345 | |||||
Nucor Corp. | 4,675 | 242,025 | ||||||
Occidental Petroleum Corp. | 19,094 | 1,834,552 | ||||||
Peabody Energy Corp. | 7,370 | 143,568 | ||||||
Phillips 66 | 17,658 | 1,137,705 | ||||||
Pioneer Natural Resources Co. | 2,762 | 565,602 | ||||||
Plains All American Pipeline LP | 1,800 | 92,196 | ||||||
Plum Creek Timber Co., Inc | 6,200 | 281,480 | ||||||
Potlatch Corp. | 7,200 | 293,976 | ||||||
Rayonier, Inc. | 5,350 | 251,557 | ||||||
Regency Energy Partners LP | 3,500 | 89,215 | ||||||
Royal Gold, Inc. | 9,863 | 473,819 | ||||||
Schlumberger, Ltd. | 26,128 | 2,448,716 | ||||||
Southern Copper Corp. | 6,156 | 172,060 | ||||||
Southwestern Energy Co.(a) | 7,599 | 282,835 | ||||||
Spectra Energy Corp. | 5,869 | 208,760 | ||||||
Tesoro Corp. | 8,749 | 427,739 | ||||||
Valero Energy Corp. | 23,762 | 978,282 | ||||||
Weyerhaeuser Co. | 10,200 | 310,080 | ||||||
The Williams Co., Inc. | 15,553 | 555,398 | ||||||
|
| |||||||
| 71,840,502 | ||||||||
|
| |||||||
TOTAL COMMON STOCKS (Cost $141,029,672) |
| 140,147,835 | ||||||
|
| |||||||
EXCHANGE TRADED FUNDS (1.38%) |
| |||||||
iShares® Gold Trust(a) | 218,898 | 2,812,839 | ||||||
SPDR® Gold Trust(a) | 17,688 | 2,259,465 | ||||||
|
| |||||||
TOTAL EXCHANGE TRADED FUNDS (Cost $6,391,017) |
| 5,072,304 | ||||||
|
| |||||||
WARRANTS (0.00%)(d) | ||||||||
Canada (0.00%)(d) | ||||||||
Kinross Gold Corp., Strike Price $21.30, Expires 9/17/14(a) | 19 | 1 | ||||||
|
| |||||||
TOTAL WARRANTS (Cost $69) |
| 1 | ||||||
|
| |||||||
Principal Amount | Value (Note 2) | |||||||
| ||||||||
GOVERNMENT BONDS (44.23%) |
| |||||||
U.S. Treasury Bonds (44.23%) |
| |||||||
United States Treasury Inflation Indexed Bonds | ||||||||
2.000%, 1/15/14(e) | $ | 6,296,858 | 6,308,173 | |||||
1.250%, 4/15/14 | 8,785,227 | 8,838,764 | ||||||
2.000%, 7/15/14 | 11,476,475 | 11,742,764 | ||||||
1.625%, 1/15/15(e)(f) | 13,748,268 | 14,180,046 | ||||||
0.500%, 4/15/15(e) | 11,789,823 | 12,037,598 | ||||||
1.875%, 7/15/15 | 8,717,038 | 9,185,578 | ||||||
2.000%, 1/15/16 | 9,131,903 | 9,760,789 | ||||||
0.125%, 4/15/16 | 21,720,160 | 22,321,700 | ||||||
2.500%, 7/15/16 | 11,290,890 | 12,461,439 | ||||||
2.375%, 1/15/17(e)(f) | 10,147,288 | 11,266,655 | ||||||
0.125%, 4/15/17(e)(f) | 14,930,070 | 15,445,620 | ||||||
| Principal Amount | Value (Note 2) | |||||||
| ||||||||
U.S. Treasury Bonds (continued) |
| |||||||
2.625%, 7/15/17(e) | $ | 14,387,100 | $ | 16,359,701 | ||||
1.625%, 1/15/18 | 11,163,300 | 12,311,468 | ||||||
|
| |||||||
| 162,220,295 | ||||||||
|
| |||||||
TOTAL GOVERNMENT BONDS |
| 162,220,295 | ||||||
|
| |||||||
| Expiration Date | Exercise Price | Number of Contracts | Value | |||||||||||
| ||||||||||||||
PURCHASED CALL OPTIONS (0.73%) |
| |||||||||||||
| Market Vectors® Gold Miners ETF: | ||||||||||||||
| 1/18/14 | $30.00 | 245 | $ | 10,167 | ||||||||||
| 1/18/14 | 36.00 | 200 | 1,400 | |||||||||||
| 1/18/14 | 38.00 | 100 | 400 | |||||||||||
| 1/18/14 | 39.00 | 550 | 2,200 | |||||||||||
|
| |||||||||||||
| 14,167 | ||||||||||||||
|
| |||||||||||||
| S&P 500® Index Future: | ||||||||||||||
| 6/20/14 | 1750.00 | 120 | 2,253,000 | |||||||||||
| E-mini S&P 500® Future: | ||||||||||||||
| 11/16/13 | 1640.00 | 75 | 421,125 | |||||||||||
TOTAL PURCHASED CALL OPTIONS |
| 2,688,292 | ||||||||||||
| ||||||||||||||
PURCHASED PUT OPTIONS (0.13%) |
| |||||||||||||
SPDR® S&P 500® ETF Trust | 9/30/14 | 170.00 | 500 | 460,500 | ||||||||||
TOTAL PURCHASED PUT OPTIONS |
| 460,500 | ||||||||||||
| ||||||||||||||
| 7-Day Yield | Shares | Value (Note 2) | ||||||||||
| ||||||||||||
SHORT TERM INVESTMENTS (14.48%) |
| |||||||||||
Money Market Fund (14.48%) |
| |||||||||||
Dreyfus Treasury Prime Cash Management Fund, Institutional Shares | 0.00004 | % | 53,092,263 | $ | 53,092,263 | |||||||
|
| |||||||||||
TOTAL SHORT TERM INVESTMENTS |
| 53,092,263 | ||||||||||
|
| |||||||||||
TOTAL INVESTMENTS (99.17%) |
| $ | 363,681,490 | |||||||||
Other Assets In Excess Of Liabilities (0.83%) |
| 3,053,472(g) | ||||||||||
| ||||||||||||
NET ASSETS - 100.00% |
| $ | 366,734,962 | |||||||||
| ||||||||||||
| 21 | October 31, 2013 |
ALPS | CoreCommodity Management CompleteCommodities® Strategy Fund | ||
Consolidated Statement of Investments | October 31, 2013 (Unaudited) | |
| (a) | Non-Income Producing Security. |
| (b) | Security exempt from registration under rule 144A of the securities act of 1933. This security may be resold in transactions exempt from registration, normally to qualified institutional buyers. At period end, the market value of those securities was $710,787, representing 0.19% of the Fund’s net assets. |
| (c) | These securities initially sold to other parties pursuant to Regulation S under the 1933 Act and subsequently resold to the Fund. At period end, the aggregate market value of those securities was $2,708,032, representing 0.74% of the Fund’s net assets. |
| (d) | Less than 0.005%. |
| (e) | Security, or portion of security, is being held as collateral for total return swap contracts. |
| (f) | Security, or portion of security, is being held as collateral for futures contracts. |
| (g) | Includes cash which is being held as collateral for written options. |
Common Abbreviations:
| AB | - Aktiebolag is the Swedish equivalent of the term corporation. |
| ADR | - American Depositary Receipt. |
| AG | - Aktiengesellschaft is a German term that refers to a corporation that is limited by shares, i.e., owned by shareholders. |
| ASA | - Allmennaksjeselskap is the Norwegian term for public limited company. |
| ETF | - Exchange Traded Fund. |
| GDR | - Global Depositary Receipt. |
| Ltd. | - Limited. |
| LP | - Limited Partnership. |
| N.V. | - Naamloze vennootschap is the Dutch term for a public limited liability corporation. |
| OAO | - Russian open joint stock company. |
| OJSC | - Open joint stock company. |
| PLC | - Public Limited Co. |
| SA | - Generally designated corporations in various countries, mostly those employing the civil law. |
| SAB | de CV - A variable capital company. |
| SpA | - Societa per Azione. |
| SPDR | - Standard & Poor’s Depository Receipt. |
For Fund compliance purposes, the Fund’s industry and geographical classifications refer to any one or more of the industry sub-classifications used by one or more widely recognized market indexes or ratings group indexes, and/or as defined by Fund management. This definition may not apply for purposes of this report, which may combine sub-classifications for reporting ease. Industries and regions are shown as a percent of net assets.
See Notes to Financial Statements.
| 22 | October 31, 2013 |
ALPS | CoreCommodity Management CompleteCommodities® Strategy Fund | ||
Consolidated Statement of Investments | October 31, 2013 (Unaudited) | |
SCHEDULE OF WRITTEN OPTIONS | Expiration Date | Exercise Price | Contracts | Value | ||||||
Written Call Options | ||||||||||
Gold 100 Oz. Future: | ||||||||||
| 12/28/13 | $ 1,285.00 | (20) | $ (100,800) | |||||||
| 12/28/13 | 1,290.00 | (5) | (23,350) | |||||||
Market Vectors® Gold Miners ETF | 11/16/13 | 27.00 | (300) | (6,600) | ||||||
| ||||||||||
TOTAL WRITTEN CALL OPTIONS | ||||||||||
(Premiums received $ 147,071) | (130,750) | |||||||||
| ||||||||||
Written Put Options | ||||||||||
Market Vectors® Gold Miners ETF | 1/18/14 | 25.00 | (100) | (19,000) | ||||||
Monsanto Co. | 1/18/14 | 110.00 | (50) | (36,750) | ||||||
Phillips 66 | 1/18/14 | 65.00 | (100) | (36,500) | ||||||
| ||||||||||
TOTAL WRITTEN PUT OPTIONS | ||||||||||
(Premiums received $ 81,002) | (92,250) | |||||||||
| ||||||||||
TOTAL WRITTEN OPTIONS | ||||||||||
(Premiums received $ 228,073) | $ (223,000) | |||||||||
| ||||||||||
FUTURES CONTRACTS | ||||||||||||||||||
| Description | Position | Contracts | Expiration Date | Value (Note 2) | Unrealized Appreciation | |||||||||||||
Brent Crude Future | Long | 150 | 11/15/13 | $ 16,326,000 | $ 235,890 | |||||||||||||
WTI Crude Future | Short | (170) | 11/20/13 | (16,384,600) | 1,141,890 | |||||||||||||
|
|
|
| |||||||||||||||
| $ (58,600) | $ 1,377,780 | |||||||||||||||||
|
|
|
| |||||||||||||||
Description | Position | Contracts | | Expiration Date | |
| Value (Note 2) |
| | Unrealized Depreciation | | |||||||
E-mini S&P 500® Future | Short | (215) | 12/23/13 | $ (18,823,250) | $ (504,072) | |||||||||||||
Gold 100 Oz. Future | Long | 35 | 12/30/13 | 4,632,950 | (15,034) | |||||||||||||
S&P 500® Index Future | Short | (54) | 12/20/13 | (23,638,500) | (472,598) | |||||||||||||
|
|
|
| |||||||||||||||
| $ (37,828,800) | $ (991,704) | |||||||||||||||||
|
|
|
| |||||||||||||||
See Notes to Financial Statements. |
| 23 | October 31, 2013 |
ALPS | CoreCommodity Management CompleteCommodities® Strategy Fund | ||
Consolidated Statement of Investments | October 31, 2013 (Unaudited) | |
| TOTAL RETURN SWAP CONTRACTS(a) | ||||||||||||||||
| Swap Counterparty | Reference Obligation | Notional Dollars | Rate Paid by the Fund | Termination Date | Unrealized Appreciation | |||||||||||
Bank of America - Merrill Lynch | ML eXtra Silver GA6 | $ | 706,507 | 0.10% | 6/30/14 | $ | 5,483 | |||||||||
Bank of America - Merrill Lynch | ML Index Robusta | (5,434,669) | 0.00% | 6/30/14 | 476,736 | |||||||||||
Bank of America - Merrill Lynch | MLCS Coffee J-F3 | (3,012,014) | 0.10% | 6/30/14 | 213,834 | |||||||||||
Bank of America - Merrill Lynch | MLCS Copper J-F3 | (5,548,322) | 0.10% | 6/30/14 | 39,721 | |||||||||||
Bank of America - Merrill Lynch | MLCX Aluminum J-F3 | (4,937,153) | 0.10% | 6/30/14 | 3,937 | |||||||||||
|
| |||||||||||||||
| $ | 739,712 | |||||||||||||||
|
| |||||||||||||||
| Swap Counterparty | Reference Obligation | Notional Dollars | Rate Paid by the Fund | Termination Date | Unrealized Depreciation | |||||||||||
Bank of America - Merrill Lynch | CRB 3 Month Forward Total Return Index | $ | 75,939,666 | 0.48% | 6/30/14 | $ | (1,512,006) | |||||||||
Bank of America - Merrill Lynch | ML Aluminum GA6 | 4,983,625 | 0.10% | 6/30/14 | (10,633) | |||||||||||
Bank of America - Merrill Lynch | ML eXtra Coffee ER | 5,359,839 | 0.30% | 6/30/14 | (378,629) | |||||||||||
Bank of America - Merrill Lynch | ML eXtra Coffee GA6 | 3,042,705 | 0.10% | 6/30/14 | (207,321) | |||||||||||
Bank of America - Merrill Lynch | ML eXtra Copper GA6 | 5,584,775 | 0.10% | 6/30/14 | (55,198) | |||||||||||
Bank of America - Merrill Lynch | MLCS Silver J-F3 | (704,397) | 0.10% | 6/30/14 | (5,243) | |||||||||||
Societe Generale | CRB 3 Month Forward Total Return Index | 76,279,090 | 0.35% | 11/29/13 | (1,495,675) | |||||||||||
UBS | CRB 3 Month Forward Total Return Index | 77,317,181 | 0.40% | 11/29/13 | (1,538,484) | |||||||||||
|
| |||||||||||||||
| $ | (5,203,188) | |||||||||||||||
|
| |||||||||||||||
| (a) | The Fund receives monthly payments based on any positive monthly return of the Reference Obligation. The Fund makes payments on any negative monthly return of such Reference Obligation. |
See Notes to Financial Statements. |
| 24 | October 31, 2013 |
ALPS | CoreCommodity Management CompleteCommodities® Strategy Fund | ||
| October 31, 2013 (Unaudited) | ||
ASSETS | ||||
Investments, at value | $ | 363,681,490 | ||
Cash | 3,421,340 | |||
Foreign currency, at value (Cost $4,775) | 4,775 | |||
Unrealized appreciation on total return swap contracts | 739,712 | |||
Receivable for shares sold | 2,566,194 | |||
Receivable for variation margin | 386,076 | |||
Deposit with broker for written options | 1,010,475 | |||
Deposit with broker for futures contracts | 210,632 | |||
Dividends and interest receivable | 919,597 | |||
Prepaid expenses and other assets | 41,342 | |||
| ||||
Total Assets | 372,981,633 | |||
| ||||
LIABILITIES | ||||
Written options, at value (premiums received $228,073) | 223,000 | |||
Payable due to broker for total return swap contracts | 82,014 | |||
Payable for shares redeemed | 234,050 | |||
Unrealized depreciation on total return swap contracts | 5,203,188 | |||
Investment advisory fees payable | 246,282 | |||
Administration and transfer agency fees payable | 51,159 | |||
Distribution and services fees payable | 119,329 | |||
Trustees’ fees and expenses payable | 3,871 | |||
Legal fees payable | 333 | |||
Audit and tax fees payable | 25,269 | |||
Accrued expenses and other liabilities | 58,176 | |||
| ||||
Total Liabilities | 6,246,671 | |||
| ||||
NET ASSETS | $ | 366,734,962 | ||
| ||||
NET ASSETS CONSIST OF | ||||
Paid-in capital | $ | 388,091,113 | ||
Accumulated net investment loss | (140,632 | ) | ||
Accumulated net realized loss on investments, written options, futures contracts, total return swap contracts and foreign currency transactions | (13,880,458 | ) | ||
Net unrealized depreciation on investments, futures contracts, total return swap contracts and translation of assets and liabilities denominated in foreign currencies | (7,335,061 | ) | ||
| ||||
NET ASSETS | $ | 366,734,962 | ||
| ||||
INVESTMENTS, AT COST | $ | 366,946,335 | ||
| ||||
PRICING OF SHARES | ||||
Class A: | ||||
Net Asset Value, offering and redemption price per share(a) | $ | 10.13 | ||
Net Assets | $ | 97,908,111 | ||
Shares of beneficial interest outstanding (unlimited number of shares, no par value common stock authorized) | 9,665,166 | |||
Maximum offering price per share ((NAV/0.9450), based on maximum sales charge of 5.50% of the offering price) | $ | 10.72 | ||
Class C: | ||||
Net Asset Value, offering and redemption price per share(a) | $ | 10.01 | ||
Net Assets | $ | 18,763,352 | ||
Shares of beneficial interest outstanding (unlimited number of shares, no par value common stock authorized) | 1,874,317 | |||
Class I: | ||||
Net Asset Value, offering and redemption price per share | $ | 10.11 | ||
Net Assets | $ | 250,063,499 | ||
Shares of beneficial interest outstanding (unlimited number of shares, no par value common stock authorized) | 24,729,561 | |||
| (a) | Redemption price per share may be reduced for any applicable contingent deferred sales charge. For a description of a possible sales charge, please see the Fund’s Prospectus. |
See Notes to Financial Statements. |
| 25 | October 31, 2013 |
ALPS | CoreCommodity Management CompleteCommodities® Strategy Fund | ||
| For the Six Months Ended October 31, 2013 (Unaudited) | ||
INVESTMENT INCOME | ||||
Dividends | $ | 2,047,851 | ||
Foreign taxes withheld on dividends | (178,898) | |||
Interest and other income | 68,255 | |||
| ||||
Total Investment Income | 1,937,208 | |||
| ||||
EXPENSES | ||||
Investment advisory fees | 1,361,858 | |||
Administrative and transfer agency fees | 259,477 | |||
Distribution and service fees | ||||
Class A | 200,479 | |||
Class C | 95,631 | |||
Legal fees | 8,224 | |||
Audit and tax fees | 19,910 | |||
Networking fees | ||||
Class I | 63,640 | |||
Reports to shareholders and printing fees | 34,123 | |||
State registration fees | 31,087 | |||
SEC registration fees | 2,838 | |||
Insurance fees | 3,430 | |||
Custody fees | 26,063 | |||
Trustees’ fees and expenses | 6,866 | |||
Miscellaneous expenses | 9,082 | |||
| ||||
Total Expense | 2,122,708 | |||
Less fees waived/reimbursed by investment advisor (Note 7) | ||||
Class A | (25,824) | |||
Class C | (4,843) | |||
Class I | (13,110) | |||
| ||||
Net Expenses | 2,078,931 | |||
| ||||
Net Investment Loss | (141,723) | |||
| ||||
Net realized loss on investments | (296,166) | |||
Net realized gain on written options | 264,753 | |||
Net realized loss on futures contracts | (4,095,750) | |||
Net realized loss on total return swap contracts | (4,209,889) | |||
Net realized gain on foreign currency transactions | 242 | |||
Net change in unrealized depreciation on investments | (2,895,084) | |||
Net change in unrealized appreciation on written options | 5,073 | |||
Net change in unrealized appreciation on futures contracts | 2,301,003 | |||
Net change in unrealized appreciation on total return swap contracts | 553,946 | |||
Net change in unrealized appreciation on translation of assets and liabilities denominated in foreign currencies | 1,068 | |||
| ||||
NET REALIZED AND UNREALIZED LOSS ON INVESTMENTS | (8,370,804) | |||
| ||||
NET DECREASE IN NET ASSETS RESULTING FROM OPERATIONS | $ | (8,512,527) | ||
| ||||
See Notes to Financial Statements. |
| 26 | October 31, 2013 |
ALPS | CoreCommodity Management CompleteCommodities® Strategy Fund | ||
| For the Six Months Ended October 31, 2013 (Unaudited) | For the Year Ended April 30, 2013 | |||||||
OPERATIONS | ||||||||
Net investment loss | $ | (141,723) | $ | (498,594) | ||||
Net realized loss on investments, written options, futures contracts, total return swap contracts and foreign currency transactions | (8,336,810) | (9,335,982) | ||||||
Net change in unrealized depreciation on investments, written options, futures contracts, total return swap contracts and translation of assets and liabilities denominated in foreign currencies | (33,994) | (4,642,501) | ||||||
| ||||||||
Net Decrease in Net Assets Resulting from Operations | (8,512,527) | (14,477,077) | ||||||
| ||||||||
DISTRIBUTIONS | ||||||||
Dividends to shareholders from tax return of capital | ||||||||
Class A | – | (532,988) | ||||||
Class C | – | (84,918) | ||||||
Class I | – | (699,604) | ||||||
| ||||||||
Net Decrease in Net Assets from Distributions | – | (1,317,510) | ||||||
| ||||||||
BENEFICIAL INTEREST TRANSACTIONS (NOTE 6) | ||||||||
Shares sold | ||||||||
Class A | 38,528,509 | 90,054,418 | ||||||
Class C | 3,413,591 | 8,548,230 | ||||||
Class I | 106,242,093 | 157,098,320 | ||||||
Dividends reinvested | ||||||||
Class A | – | 395,824 | ||||||
Class C | – | 51,810 | ||||||
Class I | – | 542,393 | ||||||
Shares redeemed | ||||||||
Class A | (41,655,776) | (66,182,451) | ||||||
Class C | (3,504,105) | (5,831,034) | ||||||
Class I | (38,600,610) | (45,457,181) | ||||||
| ||||||||
Net Increase in Net Assets Derived from Beneficial Interest Transactions | 64,423,702 | 139,220,329 | ||||||
| ||||||||
Net increase in net assets | 55,911,175 | 123,425,742 | ||||||
NET ASSETS | ||||||||
Beginning of period | 310,823,787 | 187,398,045 | ||||||
| ||||||||
End of period * | $ | 366,734,962 | $ | 310,823,787 | ||||
| ||||||||
* Including accumulated net investment income/(loss) of: | $ | (140,632) | $ | 1,091 | ||||
See Notes to Financial Statements. |
| 27 | October 31, 2013 |
ALPS | CoreCommodity Management CompleteCommodities® Strategy Fund – Class A | ||
Selected data for a share of beneficial interest outstanding throughout the periods indicated:
For the Six Months Ended | For the Year Ended April 30, 2013 (a)(b) | For the Year Ended April 30, 2012 (a) | For the Period June 29, 2010 (Inception) to April 30, 2011 (a) | |||||
Net asset value, beginning of period | $10.40 | $11.18 | $14.28 | $10.00 | ||||
INCOME/(LOSS) FROM INVESTMENT OPERATIONS: | ||||||||
Net investment income/ | (0.01) | (0.03) | 0.04 | 0.12 | ||||
Net realized and unrealized gain/(loss) | (0.26) | (0.69) | (2.29) | 4.87 | ||||
| ||||||||
Total from investment operations | (0.27) | (0.72) | (2.25) | 4.99 | ||||
| ||||||||
DISTRIBUTIONS: | ||||||||
From net investment income | – | – | (0.83) | (0.71) | ||||
From net realized gains | – | – | (0.02) | – | ||||
Tax return of capital | – | (0.06) | – | – | ||||
| ||||||||
Total distributions | – | (0.06) | (0.85) | (0.71) | ||||
| ||||||||
REDEMPTION FEES ADDED TO PAID-IN CAPITAL (NOTE 6) | 0.00(d) | 0.00(d) | 0.00(d) | 0.00(d) | ||||
| ||||||||
Net increase/(decrease) in net asset value | (0.27) | (0.78) | (3.10) | 4.28 | ||||
| ||||||||
Net asset value, end of period | $10.13 | $10.40 | $11.18 | $14.28 | ||||
| ||||||||
TOTAL RETURN(e) | (2.60)% | (6.44)% | (15.77)% | 51.41% | ||||
RATIOS/SUPPLEMENTAL DATA: | ||||||||
Net assets, end of period (000s) | $97,908 | $104,234 | $85,805 | $37,060 | ||||
Ratio of expenses to average net assets excluding fee waivers and reimbursements | 1.50%(f) | 1.50% | 1.64% | 2.59%(f) | ||||
Ratio of expenses to average net assets including fee waivers and reimbursements | 1.45%(f) | 1.40%(g) | 1.45% | 1.45%(f) | ||||
Ratio of net investment income/(loss) to average net assets | (0.23)%(f) | (0.30)% | 0.36% | 1.08%(f) | ||||
Portfolio turnover rate(h) | 5% | 117% | 264% | 59% | ||||
| ||||||||
| (a) | Per share amounts and ratios to average net assets include income and expenses of the CoreCommodity Management Cayman Commodity Fund Ltd. (wholly-owned subsidiary). |
| (b) | Prior to April 30, 2013 the ALPS | CoreCommodity Management CompleteCommodities® Strategy Fund was known as the Jefferies Asset Management Commodity Strategy Allocation Fund. |
| (c) | Calculated using the average shares method. |
| (d) | Less than $0.005 per share. |
| (e) | Total returns are for the period indicated and have not been annualized. Total returns would have been lower had certain expenses not been waived during the period. Returns shown do not reflect the deduction of taxes that a shareholder would pay on Fund distributions or the redemption of Fund shares. Returns shown exclude any applicable sales charges. |
| (f) | Annualized. |
| (g) | According to the Fund’s shareholder services plan with respect to the Fund’s Class A shares, any amount of such payment not paid during the Fund’s fiscal year for such service activities shall be reimbursed to the Fund as soon as practicable after the end of the fiscal year. Fees were reimbursed to the Fund during the year ended April 30, 2013, for the prior fiscal year in the amount of 0.05% of average net assets of Class A shares. |
| (h) | Portfolio turnover rate for periods less than one full year have not been annualized. |
See Notes to Financial Statements. |
| 28 | October 31, 2013 |
ALPS | CoreCommodity Management CompleteCommodities® Strategy Fund – Class C | ||
Consolidated Financial Highlights | ||
Selected data for a share of beneficial interest outstanding throughout the periods indicated:
For the Six Months Ended | For the Year Ended April 30, 2013 (a)(b) | For the Year Ended April 30, 2012 (a) | For the Period June 29, 2010 (Inception) to April 30, 2011 (a) | |||||
Net asset value, beginning of period | $10.31 | $11.15 | $14.19 | $10.00 | ||||
INCOME/(LOSS) FROM INVESTMENT OPERATIONS: | ||||||||
Net investment income/ | (0.04) | (0.10) | (0.05) | 0.08 | ||||
Net realized and unrealized gain/(loss) | (0.26) | (0.69) | (2.26) | 4.87 | ||||
| ||||||||
Total from investment operations | (0.30) | (0.79) | (2.31) | 4.95 | ||||
| ||||||||
DISTRIBUTIONS: | ||||||||
From net investment income | – | – | (0.71) | (0.76) | ||||
From net realized gains | – | – | (0.02) | – | ||||
Tax return of capital | – | (0.05) | – | – | ||||
| ||||||||
Total distributions | – | (0.05) | (0.73) | (0.76) | ||||
| ||||||||
REDEMPTION FEES ADDED TO PAID-IN CAPITAL (NOTE 6) | 0.00(d) | 0.00(d) | 0.00(d) | 0.00(d) | ||||
| ||||||||
Net increase/(decrease) in net asset value | (0.30) | (0.84) | (3.04) | 4.19 | ||||
| ||||||||
Net asset value, end of period | $10.01 | $10.31 | $11.15 | $14.19 | ||||
| ||||||||
TOTAL RETURN(e) | (2.91)% | (7.10)% | (16.26)% | 50.90% | ||||
RATIOS/SUPPLEMENTAL DATA: | ||||||||
Net assets, end of period (000s) | $18,763 | $19,444 | $18,095 | $7,352 | ||||
Ratio of expenses to average net assets excluding fee waivers and reimbursements | 2.10%(f) | 2.14% | 2.24% | 4.00%(f) | ||||
Ratio of expenses to average net assets including fee waivers and reimbursements | 2.05%(f) | 2.05% | 2.05% | 2.05%(f) | ||||
Ratio of net investment income/(loss) to average net assets | (0.81)%(f) | (0.92)% | (0.42)% | 0.72%(f) | ||||
Portfolio turnover rate(g) | 5% | 117% | 264% | 59% | ||||
| ||||||||
| (a) | Per share amounts and ratios to average net assets include income and expenses of the CoreCommodity Management Cayman Commodity Fund Ltd. (wholly-owned subsidiary). |
| (b) | Prior to April 30, 2013 the ALPS | CoreCommodity Management CompleteCommodities® Strategy Fund was known as the Jefferies Asset Management Commodity Strategy Allocation Fund. |
| (c) | Calculated using the average shares method. |
| (d) | Less than $0.005 per share. |
| (e) | Total returns are for the period indicated and have not been annualized. Total returns would have been lower had certain expenses not been waived during the period. Returns shown do not reflect the deduction of taxes that a shareholder would pay on Fund distributions or the redemption of Fund shares. Returns shown exclude any applicable sales charges. |
| (f) | Annualized. |
| (g) | Portfolio turnover rate for periods less than one full year have not been annualized. |
See Notes to Financial Statements. |
| 29 | October 31, 2013 |
ALPS | CoreCommodity Management CompleteCommodities® Strategy Fund – Class I | ||
Consolidated Financial Highlights | ||
Selected data for a share of beneficial interest outstanding throughout the periods indicated:
For the Six Months Ended | For the Year Ended April 30, 2013 (a)(b) | For the Year Ended April 30, 2012 (a) | For the Period June 29, 2010 (Inception) to April 30, 2011 (a) | |||||
Net asset value, beginning of period | $10.37 | $11.12 | $14.25 | $10.00 | ||||
INCOME/(LOSS) FROM INVESTMENT OPERATIONS: | ||||||||
Net investment income/(loss)(c) | 0.00(d) | (0.00)(d) | 0.10 | 0.13 | ||||
Net realized and unrealized gain/(loss) | (0.26) | (0.69) | (2.32) | 4.89 | ||||
| ||||||||
Total from investment operations | (0.26) | (0.69) | (2.22) | 5.02 | ||||
| ||||||||
DISTRIBUTIONS: | ||||||||
From net investment income | – | – | (0.89) | (0.77) | ||||
From net realized gains | – | – | (0.02) | – | ||||
Tax return of capital | – | (0.06) | – | – | ||||
| ||||||||
Total distributions | – | (0.06) | (0.91) | (0.77) | ||||
| ||||||||
REDEMPTION FEES ADDED TO PAID-IN CAPITAL (NOTE 6) | 0.00(d) | 0.00(d) | 0.00(d) | 0.00(d) | ||||
| ||||||||
Net increase/(decrease) in net asset value | (0.26) | (0.75) | (3.13) | 4.25 | ||||
| ||||||||
Net asset value, end of period | $10.11 | $10.37 | $11.12 | $14.25 | ||||
| ||||||||
TOTAL RETURN(e) | (2.51)% | (6.16)% | (15.53)% | 51.74% | ||||
RATIOS/SUPPLEMENTAL DATA: | ||||||||
Net assets, end of period (000s) | $250,063 | $187,146 | $83,497 | $73,630 | ||||
Ratio of expenses to average net assets excluding fee waivers and reimbursement | 1.16%(f) | 1.17% | 1.33% | 2.04%(f) | ||||
Ratio of expenses to average net assets including fee waivers and reimbursements | 1.15%(f) | 1.15% | 1.15% | 1.15%(f) | ||||
Ratio of net investment income/(loss) to average net assets | 0.05%(f) | (0.02)% | 0.82% | 1.19%(f) | ||||
Portfolio turnover rate(g) | 5% | 117% | 264% | 59% | ||||
| ||||||||
| (a) | Per share amounts and ratios to average net assets include income and expenses of the CoreCommodity Management Cayman Commodity Fund Ltd. (wholly-owned subsidiary). |
| (b) | Prior to April 30, 2013 the ALPS | CoreCommodity Management CompleteCommodities® Strategy Fund was known as the Jefferies Asset Management Commodity Strategy Allocation Fund. |
| (c) | Calculated using the average shares method. |
| (d) | Less than $0.005 and ($0.005) per share. |
| (e) | Total returns are for the period indicated and have not been annualized. Total returns would have been lower had certain expenses not been waived during the period. Returns shown do not reflect the deduction of taxes that a shareholder would pay on Fund distributions or the redemption of Fund shares. |
| (f) | Annualized. |
| (g) | Portfolio turnover rate for periods less than one full year have not been annualized. |
See Notes to Financial Statements. |
| 30 | October 31, 2013 |
| October 31, 2013 (Unaudited) | ||
Performance
The ALPS | Kotak India Growth Fund’s (the “Fund”) Class A Shares, INDAX, during the 6-month period ended 10/31/2013, delivered a net return of -6.76% at Net Asset Value (Class A delivered a net return of -11.88% at MOP, Class C, INFCX, was -7.07% with CDSC, Class I, INDIX, was 1 -6.70%. The Fund’s performance was above that of the CNX 500 Index1 (“CNX 500”) -10.20%, over the same period, without taking into account sales charges for Class A and C Shares.
During the period, the Indian equity markets fell amid high volatility, with broader Indian indices like CNX 500 returning -10.20%, CNX Nifty Index2 (“Nifty”) returning -7.85% and CNX Midcap Index3 (“CNX MIDCAP”) returning -16.40% (all in United States Dollar (“USD”) terms). The investment environment during this period was impacted by the factors described below, with the market experiencing negative return in USD term in the first 4 months, before recovering strongly in the last 2 months as sentiment improved (CNX 500 returned -4.47% in May, -8.49% in June, -4.97% in July, -12.80% in August, 11.83% in September, and 10.84% in October).
| » | The period was dominated by the fear of tapering of Quantitative Easing (QE) in US which started at the end of May during Bernanke’s testimony with the Joint Economic Committee (JEC) wherein it was noted that the Federal Reserve (the “Fed”) could take a step down in the pace of asset purchase in the next few meetings if the economic data remained as expected by the Fed. Global asset classes experienced big volatility as the market weighed on the potential impact of lower liquidity and higher interest rate in US. 10-year US government bond yield rose from 1.67% at the beginning of May to as high as 3% before retreating back to 2.55% at the end of October. Emerging Market (EM) asset classes bore most of the brunt with global investors, fearing that the era of continued inflow to EM may be over or reversed, scrambling to withdraw their capital from EM. Nonetheless, in the last 2 months, the sentiment reversed as consensus started building out a delay in tapering over to next year. With the near term economic data most likely distorted as a result of the partial shutdown of US government in October and the looming budget and debt ceiling debate early next year, the consensus expectation for now is for the tapering to be delayed further towards March 2014, boosting the optimism in Emerging Market assets and weakness in US Treasury yield and Dollar Index, which fell to a multi-month low. President Obama also announced the nomination of Janet Yellen as the next Fed governor which will likely ensure the continuation of the unconventional monetary policy in US. |
| » | The period also saw an escalation of conflict in Syria which caused Brent crude price to jump sharply to more than US$115/barrels (“bbl”) before falling back to around US$109/bbl at the end of the period as the tension subsided. |
| » | In India, the market’s negative performance in May, June, and August is largely on account of the currency which fell 4.2%, 5.7%, and 8.9% respectively on a monthly basis with |
respect to USD. The announcement of the liquidity tightening measure by the former Reserve Bank of India (RBI) governor in July, a spike in the long term India government bond yield, upward trending inflation numbers at the later part of the period, and big outflow from foreign institutional investors (FIIs) contributed to the fall in the Indian equity market. |
| » | On the currency side, after depreciating sharply to as high as Indian Rupee (INR) 68/US$ at the end of August, Indian rupee performed relatively well near the end of the period with the rupee back to around INR62/US$. The announcement of an increased in bilateral currency swap arrangement with Japan and some new measures announced by the new RBI governor (who assumed his office in early September) contributed positively to the performance of the Indian rupee. In his first speech as RBI (Reserve Bank of India) governor, Raghuram Rajan provided some comfort to the currency as he reiterated that “the primary role of the central bank “ is monetary stability”, that is, to sustain confidence in the value of the country’s money. Besides that, he also provided some clarity on timelines for new banking licenses and announced some measures aimed at supporting the currency; such as opening a swap window for Foreign Currency Non-Resident (Bank) (“FCNR(B)”) for a minimum tenor of 3 years and over at a fixed rate of 3.5% p/a, increasing the overseas borrowing limit, and allowing exporters to re-book cancelled forward exchange contracts to 50%. |
| » | After being in an easing mode since early this year with 3 consecutive policy rate cuts by 25 basis points (bps)4 each from Jan-May 2013 due to the falling inflation trend, RBI decided to raise the policy rate by 25bps each on its September and October policy meeting, bringing repo5 and reverse repo rate6 at 7.75% and 6.75% respectively. In addition, the marginal standing facility (MSF)7 rate is also being reduced to 8.75% while the cash reserve ratio (CRR) is held unchanged at 4%. With these steps, the RBI brought the re-adjustment of indicators to levels of normalcy since the introduction of tight liquidity measures in July 2013 is now complete and the gap between the repo and the MSF rate has been brought back to 100bps. Going forward, the policy stance will largely be focused on curbing inflationary expectations, while remaining mindful of the evolving growth dynamics. |
| » | During the period, India reported Gross Domestic Product (GDP) growth number for the quarter ending June 2013 (Q3FY13) which stood at 4.4% Year over Year (YoY), the lowest growth in 17 quarters since the Lehman crisis low of 3.5% of Q2FY09. The slowdown is all pervasive barring the bright spot in agriculture on the back of good monsoons. We cut our GDP growth estimates for FY14 to around 4.5% from earlier expectations of 5% which is well below India’s potential growth rate. |
| » | India’s Current Account Deficit (CAD)8 for the quarter ending June 2013 (Q3FY13) stood at US$21.8 billion (“bn”) (v/s US$18.2bn in Q4FY13) or 4.9% of GDP which was |
| 31 | October 31, 2013 |
ALPS | Kotak India Growth Fund | ||
Management Commentary | October 31, 2013 (Unaudited) | |
largely in line with most expectations. The CAD increase came following a high non-oil import bill due to large gold imports as well as weaker export growth. This is reflected in the trade deficit data which stood at US$50.5bn (v/s USD45.6bn in Q2FY13) with exports declined to US$74bn (v/s US$85bn in Q2FY13). Going forward, following the significant improvement in overall trade balance data in recent months, a potential hike in import duties on gold, overall slowdown of the economy, and better exports on the back of the rupee depreciation, we expect that the CAD will narrow to 3.2% of GDP in FY14. |
| » | Trade balance numbers have seen sharp improvement during the period with the trade deficit number narrowed to as low as US$6.76bn in September 2013 from this year’s record high of US$20bn in May. Export rose 13.5% YoY while import fell 14.5% YoY in October with the latter driven by a decline in Gold and Silver import after the government announced several regulations in the last few months aimed at curbing gold import. Although October trade deficit widen to US$10.6bn, it is still much lower than the average deficit of US$14.6bn recorded in this fiscal year. |
| » | Foreign Institutional Investor (FII) has been continuously buying Indian equities post the no tapering event by US Fed in September. In October, FII inflow into Indian equity market stood at US$2.6bn while this year FII inflow remained solid at US$16.2bn. |
| » | During the period, the government notified Land Acquisition Bill9 and National Foods Security Bill10. Both of the bills have been passed by the parliament and this has been met with skepticism by both investors and industry. These bills, while the intend is in right spirit, will increase the subsidy burden on the already strained economy. Land acquisition will potentially lead to slower investment cycle when a revival of the same is deeply desired. |
| » | India inflation number (Wholesale price Index - WPI)11 has been trending lower early in the year to as low as 4.58% in May before reverse with the latest September inflation number stood at 6.46%, the highest since February this year and higher than Bloomberg consensus expectation of 6.10%. Meanwhile, core inflation remained low at 2.10% while food inflation rose to 12.41%. For the period up to September, the inflation number averaged to 5.63%. |
| » | In a positively surprising move in June, Fitch12 revised its outlook on India with rating at BBB- stable outlook (v/s BBB- negative outlook previously). Fitch noted that the reduction in fiscal deficit, revival on investment climate, and declining inflation as the reason for the upgrade in the outlook. In the report, Fitch also expects the fiscal deficit to fall to 4.8% of GDP in FY14. It also expects that India’s elevated public debt would gradually reduce over the medium term. In addition, Fitch also projected GDP growth at 5.7% and 6.5% for FY14 and FY15 respectively. Despite the positive improvement, Fitch also expressed caution on the weakening currency, deteriorating asset quality in the banking sector, and structural issue pertaining to high budget deficit and demographic/labor challenge. |
Portfolio Composition
The portfolio is constructed to potentially benefit from the strong macro-economic growth in the Indian economy across four broad themes in India – consumption led by favorable demographics, financial services, infrastructure and outsourcing. The Fund has the flexibility to invest across market capitalizations – depending on market conditions, valuation differential, earnings growth, liquidity, etc.
For the 6-month period ending October 31, 2013, sectorally the key changes to the portfolio have been in Information Technology (added 420bps), Auto & Auto Ancillary (added 190bps), Fast Moving Consumer Goods (added 140bps), Banking & Finance (reduced 460bps), Media (reduced 110bps), and Capital Goods & Engineering (reduced 110bps). Thematically, Consumption (at about 37%) and Financials (at about 24%) are the largest themes in the portfolio while infrastructure exposure is less than 9% due to poor policy initiatives by the government. Over the last 6 months, exposure to midcap and small-cap companies in the fund has moved marginally from 22.38% in April 2013 to 24% in October 2013.
Sectorally, the portfolio is overweight Auto & Auto Ancillary, Infrastructure, and Pharmaceutical while underweight Utilities, Metal & Metal products, and Mining & Minerals as of 10/31/2013.
Outlook
After a decent start to the earnings season and stability of the macro economic factors, the focus of the market is shifting from real economics to real politics. Five states go into elections in late November and early December and the outcome of these elections will be a taken as a big indicator for likely outcome in General Elections scheduled for May 2014.
Election dates | States | |
11-Nov and 19-Nov | Chhattisgarh | |
25-Nov-13 | Madhya Pradesh | |
1-Dec-13 | Rajasthan | |
4-Dec-13 | Mizoram | |
4-Dec-13 | NCT Delhi | |
Source: Election Commission of India, Kotak Institutional Equities | ||
Current opinion polls suggest a reversal of fortunes for two major parties, Indian National Congress (dominant party of current ruling coalition UPA) and the Bhartiya Janata Party (dominant part of the opposition front NDA). In the 543 seat lower house, they have 206 and 134 seats respectively and the seat count is almost set to reverse in the May elections as per these opinion polls and these have been taken positively by the markets as they suggest stability post elections.
On earnings, so far so good. Going into the earnings season, there were worries on impact of the tight liquidity and asset quality of the banking sector and the negative operating leverage on corporate India in general from the slowing growth. However, helped by some buoyancy in the rural economy, corporate India seems to have
| 32 | October 31, 2013 |
ALPS | Kotak India Growth Fund | ||
Management Commentary | October 31, 2013 (Unaudited) | |
handled the slowdown well. Overall banks have surprised positively on both Asset Quality and Net Interest Margins. After seeing negative earnings revisions quarter after quarter, India seems to stand out in Asia Pacific region this quarter with an upward revision in earnings (source Credit Suisse First Boston).
Market, on the back of better than expected earnings and on opinion polls outlook, has moved up meaningfully in October and is now close to its all-time highs. While we are at new highs, it is pertinent to note that we are just touching the levels that we reached in early 2008 pre Lehman. In these five years, Index earnings have gone up by more than 50% and thus in a sense Indian markets have de rated meaningfully largely driven by worsening macroeconomic factors, both global and local. Things are turning and could turn faster if we have a stable government after the elections. We are as of now factoring in a gradual recovery in the economy. However, a sharper recovery could led to a better operating leverage on earnings and could thus potentially help in some sort of re-rating for the markets going forward. The other important point is on a USD basis, Indian markets are far cry from there earlier peaks (INR was sub 40 in 2008 and today is at around 62 to a USD).
Nifty now trades at 14.1X and 12.5X FY14 Earnings Per Share (“EPS”) and FY15 EPS respectively (Source: Kotak Institutional Equities estimate). In recent months, midcaps and cyclical have also seen a sharp recovery though they still trade at a steep discount to the large caps and defensives respectively. While we continue to remain selective and defensive in our overall portfolio, we have increased exposures to cyclical and midcaps moderately. Given that while it seems deferred, “Taper” is still around and US Debt ceiling may again become a headwind come January 2014. Additionally politics and its impact will remain heightened with the upcoming state elections in India. In this backdrop, we expect the Indian markets, both equity and currency to be volatile in the near term.
| 1 | The CNX 500 is India’s first broad based benchmark of the Indian capital market. The CNX 500 companies are disaggregated into 72 industry indices. Industry weightages in the index reflect the industry weightages in the market. An investor may not invest directly in an index. |
| 2 | CNX Nifty Index is a stock market index and benchmark index for the Indian equity market. It is a free float market capitalization weighted index. The index is not actively managed and does not reflect any deductions for fees, expenses or taxes. An investor may not invest directly in an index. |
| 3 | The CNX Midcap Index is a free float capitalization-weighted index designed to represent the midcap segment of the market in India. The index was developed with a base value of 1000 as of January 1, 2003. This index replaces the old CNX Midcap 200 Index which was discontinued effective July 18, 2005. The index is not actively managed and does not reflect any deductions for fees, expenses or taxes. An investor may not invest directly in an index. |
| 4 | Basis Points or bps is a unit that is equal to 1/100th of 1%, and is used to denote the change in a financial instrument. |
| 5 | The rate at which the RBI lends money to commercial banks is called repo rate. |
| 6 | The rate at which the RBI borrows money from commercial banks is called the Reverse Repo rate. |
| 7 | Marginal Standing Facility (MSF) rate is the rate at which banks borrow funds overnight from the Reserve Bank of India (RBI) against approved government securities. This came into effect in may 2011 and is the amount borrowed from RBI over and above the repo window. MSF scheme when introduced by RBI allowed banks to borrow overnight upto 1% of their net demand and time liabilities (NDTL) However, with effect from 17th April 2012, RBI has raised the borrowing limit under the MSF from 1% to 2% of their NDTL outstanding at the end of the second preceding fortnight. |
| 8 | Current Account Deficit (CAD) is a measurement of a country’s trade and measures the extent by which the value of goods and services that the country imports exceeds the value of goods and services it exports. The current account also includes net income (such as interest and dividends) as well as transfers payments. The current account is one of the two primary components of the balance of payments, the other being capital account. |
| 9 | Land Acquisition, Rehabilitation and Resettlement Bill in India is a much awaited bill for Land acquisition reforms and rehabilitation for the development projects in India. The bill was introduced in Lok Sabha in India on 7 September 2011. The bill will be central legislation in India for the rehabilitation and resettlement of families affected by land acquisitions. |
| 10 | The National Food Security Bill, signed into law on September 12, 2013, aims to provide subsidized food grains to approximately two thirds of India’s 1.2 billion people. |
| 11 | The Wholesale Price Index (WPI) is the price of a representative basket of wholesale goods. India uses WPI changes as a central measure of inflation. |
| 12 | Fitch is a global credit rating agency providing credit rating to sovereign, corporates, and wide range of financial instruments. Its rating is used by investor to gauge the ability to pay back the debt and the likelihood of default. BBB- rating is the lowest rating for investment grade. The rating has a bearing on the rates firms in the country get while borrowing from the international market. For an emerging economy like India, which relies on international capital for its growth, it will be difficult to secure funds if its sovereign credit rating fall below investment grade. |
The views and information discussed in this commentary are as of the date of publication, are subject to change, and may not reflect the writer’s current views. The views expressed represent an assessment of market conditions at a specific point in time, are opinions only and should not be relied upon as investment advice regarding a particular investment or markets in general. Such information does not constitute a recommendation to buy or sell specific securities or investment vehicles. It should not be assumed that any investment will be profitable or will equal the performance of the fund(s) or any securities or any sectors mentioned herein. The subject matter contained herein has been derived from several sources believed to be reliable and accurate at the time of compilation. Kotak Mahindra (UK) Limited does not accept any liability for losses either direct or consequential caused by the use of this information.
| 33 | October 31, 2013 |
ALPS | Kotak India Growth Fund | ||
| October 31, 2013 (Unaudited) | ||
Performance of $10,000 Initial Investment (as of October 31, 2013)
Comparison of change in value of a $10,000 investment (includes maximum sales charges of 5.50%)
The chart above represents historical performance of a hypothetical investment of $10,000 in the Fund since inception. Past performance does not guarantee future results. This chart does not reflect the deduction of taxes that a shareholder would pay on Fund distributions or the redemption of Fund shares.
Average Annual Total Returns (as of October 31, 2013)
| 1 Year | Since Inception ^ | Total Expense Ratio | What You Pay * | |||||
Class A (NAV)1 | -0.90% | -4.46% | 8.01% | 2.00% | ||||
Class A (MOP)2 | -6.36% | -6.43% | ||||||
Class C (NAV)1 | -1.48% | -5.06% | 8.61% | 2.60% | ||||
Class C (CDSC)2 | -2.46% | -5.06% | ||||||
Class I | -0.56% | -4.14% | 7.61% | 1.60% | ||||
CNX 500 Index3 | 4.37% | -5.90% | ||||||
MSCI India Index Total Return4 | 0.66% | -4.65% |
Performance data quoted represents past performance. Past performance does not guarantee future results. Investment return and principal value of an investment will fluctuate so that an investor’s shares, when sold or redeemed, may be worth more or less than the original cost. Current performance data may be higher or lower than actual data quoted. The Fund imposes a 2.00% redemption fee on shares held for less than 30 days. The Fund imposes a maximum Contingent Deferred Sales Charge (“CDSC”) of 1.00% to shares redeemed within the first 12 months after a purchase, and on Class A shares redeemed within the first 18 months after a purchase in excess of $1 million. Performance shown does not reflect the redemption fee or the CDSC, which if reflected would reduce the performance quoted. For the most current month-end performance data please call 1-866-759-5679.
Investing in the Fund is subject to investment risks, including possible loss of the principal amount invested. Derivatives generally are more sensitive to changes in economic or market conditions than other types of investments; this could result in losses that significantly exceed the funds original investment.
| 1 | Net Asset Value (NAV) is the share price without sales charges. |
| 2 | Maximum Offering Price (MOP) includes sales charges. Class A returns include effects of the Fund’s maximum sales charge of 5.50%; Class C returns include the 1.00% CDSC. |
| 34 | October 31, 2013 |
ALPS | Kotak India Growth Fund | ||
Performance Update | October 31, 2013 (Unaudited) | |
| 3 | CNX 500 - India’s first broad based benchmark of the Indian capital market. The CNX 500 companies are disaggregated into 72 industry indices. Industry weightages in the market. The index is not actively managed and does not reflect any deduction for fees, expenses or taxes. An investor may not invest directly in an index. |
| 4 | MSCI India Index - a free float weighted equity index. It was developed with a base value of 100 as-of December 31, 1992. The index is not actively managed and does not reflect any deduction for fees, expenses or taxes. An investor may not invest directly in an index. |
| ^ | Fund inception date of February 14, 2011. |
| * | What You Pay reflects the Advisor’s and Sub-Advisor’s decision to contractually limit expenses through August 31, 2014. Please see the prospectus for additional information. |
The table does not reflect the deduction of taxes that a shareholder would pay on Fund distributions or the redemption of Fund shares.
This Fund is not suitable for all investors and is subject to investment risks, including possible loss of the principal amount invested.
There is no guarantee that the Fund will continue to hold any one particular security or stay invested in any one particular company. The composition of the Fund’s top holdings is subject to change. Performance figures are historical and reflect the change in share price, reinvested distributions, changes in net asset value, sales charges and capital gains distributions, if any.
Mutual funds are not insured or guaranteed by the FDIC or by any other government agency or government sponsored agency of the federal government or any state, not deposits, obligations or guaranteed by any bank or its affiliates and are subject to investment risks, including possible loss of the principal amount invested.
Investing in India involves risk and considerations not present when investing in more established securities markets. The Fund may be more susceptible to economic, market, political and local risks of the region than a fund that is more geographically diversified. Investments in India are subject to a number of risks including, but not limited to, risk of losing some or all of the capital invested, high market volatility, variable market liquidity, geopolitical risks (including political instability), exchange rate fluctuations (between the currency of the fund’s share class and the Indian Rupee), changes in tax regime and restrictions on investment activities of foreign investors.
Top Ten Long Holdings (as a % of Net Assets) †
ITC, Ltd. | 6.81% | |||
Infosys, Ltd. | 6.80% | |||
ICICI Bank, Ltd. | 5.70% | |||
HDFC Bank, Ltd. | 5.19% | |||
Tata Consultancy Services, Ltd. | 4.42% | |||
Reliance Industries, Ltd. | 4.19% | |||
Housing Development Finance Corp. | 3.78% | |||
Tata Motors, Ltd. | 2.92% | |||
Britannia Industries, Ltd. | 2.26% | |||
Larsen & Toubro, Ltd. | 2.25% | |||
Top Ten Holdings | 44.32% |
| † | Holdings are subject to change. Table presents indicative values only. |
Industry Sector Allocation
(as a % of Net Assets)
| 35 | October 31, 2013 |
ALPS | Kotak India Growth Fund | ||
| October 31, 2013 (Unaudited) | ||
| Shares | Value (Note 2) | |||||||
| ||||||||
COMMON STOCKS (98.06%) | ||||||||
Consumer Discretionary (12.46%) |
| |||||||
Auto Components (1.78%) | ||||||||
Exide Industries, Ltd. | 28,056 | $ | 56,873 | |||||
Motherson Sumi Systems, Ltd. | 14,500 | 63,541 | ||||||
|
| |||||||
| 120,414 | ||||||||
|
| |||||||
Automobiles (7.30%) | ||||||||
Bajaj Auto, Ltd. | 3,366 | 116,595 | ||||||
Mahindra & Mahindra, Ltd. | 8,400 | 121,178 | ||||||
Maruti Suzuki India, Ltd. | 2,180 | 57,971 | ||||||
Tata Motors, Ltd. | 31,750 | 197,449 | ||||||
|
| |||||||
| 493,193 | ||||||||
|
| |||||||
Hotels Restaurants & Leisure (0.86%) |
| |||||||
Mahindra Holidays & Resorts India, Ltd. | 16,250 | 57,986 | ||||||
|
| |||||||
Textiles, Apparel & Luxury Goods (2.52%) | ||||||||
Bata India, Ltd. | 6,458 | 95,965 | ||||||
Raymond, Ltd. | 17,000 | 74,157 | ||||||
|
| |||||||
| 170,122 | ||||||||
|
| |||||||
TOTAL CONSUMER DISCRETIONARY |
| 841,715 | ||||||
|
| |||||||
Consumer Staples (12.36%) | ||||||||
Food Products (2.26%) | ||||||||
Britannia Industries, Ltd. | 10,013 | 152,838 | ||||||
|
| |||||||
Household Products (1.03%) | ||||||||
Jyothy Laboratories, Ltd. | 23,055 | 69,733 | ||||||
|
| |||||||
Personal Products (1.18%) | ||||||||
Emami, Ltd. | 9,802 | 79,208 | ||||||
|
| |||||||
Tobacco (7.89%) | ||||||||
ITC, Ltd. | 84,500 | 459,923 | ||||||
VST Industries, Ltd. | 3,087 | 73,241 | ||||||
|
| |||||||
| 533,164 | ||||||||
|
| |||||||
TOTAL CONSUMER STAPLES |
| 834,943 | ||||||
|
| |||||||
Energy (8.79%) | ||||||||
Oil, Gas & Consumable Fuels (8.79%) |
| |||||||
Cairn India, Ltd. | 11,991 | 61,723 | ||||||
Hindustan Petroleum Corp., Ltd. | 21,800 | 71,271 | ||||||
Oil & Natural Gas Corp., Ltd. | 15,200 | 72,632 | ||||||
Oil India, Ltd. | 6,000 | 46,279 | ||||||
Petronet LNG, Ltd. | 29,000 | 58,525 | ||||||
| Shares | Value (Note 2) | |||||||
| ||||||||
Oil, Gas & Consumable Fuels (continued) |
| |||||||
Reliance Industries, Ltd. | 19,048 | $ | 283,414 | |||||
|
| |||||||
| 593,844 | ||||||||
|
| |||||||
TOTAL ENERGY | 593,844 | |||||||
|
| |||||||
Financials (25.35%) | ||||||||
Commercial Banks (19.60%) |
| |||||||
Axis Bank, Ltd. | 5,804 | 115,352 | ||||||
Bank of Baroda | 4,200 | 43,912 | ||||||
Federal Bank, Ltd. | 57,500 | 76,757 | ||||||
HDFC Bank, Ltd. | 31,500 | 350,778 | ||||||
ICICI Bank, Ltd. | 21,250 | 385,128 | ||||||
IndusInd Bank, Ltd. | 13,500 | 97,690 | ||||||
State Bank of India | 3,600 | 105,208 | ||||||
Union Bank of India | 28,000 | 56,269 | ||||||
Yes Bank, Ltd. | 15,500 | 92,832 | ||||||
|
| |||||||
| 1,323,926 | ||||||||
|
| |||||||
Diversified Financial Services (0.89%) |
| |||||||
Bajaj Holdings and Investment, Ltd. | 4,500 | 60,439 | ||||||
|
| |||||||
Real Estate Management & Development (1.08%) |
| |||||||
Prestige Estates Projects, Ltd. | 31,300 | 72,683 | ||||||
|
| |||||||
Thrifts & Mortgage Finance (3.78%) |
| |||||||
Housing Development Finance Corp. | 18,400 | 255,674 | ||||||
|
| |||||||
TOTAL FINANCIALS | 1,712,722 | |||||||
|
| |||||||
Health Care (7.98%) | ||||||||
Pharmaceuticals (7.98%) | ||||||||
Cipla, Ltd. | 19,400 | 130,295 | ||||||
Dr. Reddy’s Laboratories, Ltd. | 2,300 | 91,682 | ||||||
Glenmark Pharmaceuticals, Ltd. | 7,500 | 68,584 | ||||||
Lupin, Ltd. | 8,161 | 117,736 | ||||||
Sun Pharmaceutical Industries, Ltd. | 13,200 | 130,566 | ||||||
|
| |||||||
| 538,863 | ||||||||
|
| |||||||
TOTAL HEALTH CARE | 538,863 | |||||||
|
| |||||||
Industrials (7.57%) | ||||||||
Construction & Engineering (3.05%) |
| |||||||
GMR Infrastructure, Ltd. | 151,000 | 54,104 | ||||||
Larsen & Toubro, Ltd. | 9,600 | 151,938 | ||||||
|
| |||||||
| 206,042 | ||||||||
|
| |||||||
Machinery (2.84%) | ||||||||
SKF India, Ltd. | 8,500 | 83,472 | ||||||
Thermax, Ltd. | 10,450 | 108,419 | ||||||
|
| |||||||
| 191,891 | ||||||||
|
| |||||||
| 36 | October 31, 2013 |
ALPS | Kotak India Growth Fund | ||
Consolidated Statement of Investments | October 31, 2013 (Unaudited) | |
| Shares | Value (Note 2) | |||||||
| ||||||||
Transportation Infrastructure (1.68%) |
| |||||||
Gujarat Pipavav Port, Ltd.(a) | 79,000 | $ | 64,189 | |||||
IL&FS Transportation Networks, Ltd. | 28,386 | 49,423 | ||||||
|
| |||||||
| 113,612 | ||||||||
|
| |||||||
TOTAL INDUSTRIALS | 511,545 | |||||||
|
| |||||||
Information Technology (14.60%) |
| |||||||
Electronic Equipment, Instruments & |
| |||||||
Redington India, Ltd. | 65,000 | 64,817 | ||||||
|
| |||||||
Internet Software & Services (0.96%) |
| |||||||
Info Edge India, Ltd. | 10,400 | 65,379 | ||||||
|
| |||||||
IT Services (12.68%) | ||||||||
Infosys, Ltd. | 8,600 | 459,580 | ||||||
Tata Consultancy Services, Ltd. | 8,690 | 298,579 | ||||||
Tech Mahindra, Ltd. | 3,900 | 98,372 | ||||||
|
| |||||||
| 856,531 | ||||||||
|
| |||||||
TOTAL INFORMATION TECHNOLOGY |
| 986,727 | ||||||
|
| |||||||
Materials (5.12%) | ||||||||
Chemicals (1.07%) | ||||||||
Coromandel International, Ltd. | 20,000 | 72,394 | ||||||
|
| |||||||
Construction Materials (2.13%) |
| |||||||
Century Textiles & Industries, Ltd. | 16,000 | 71,634 | ||||||
Shree Cement, Ltd. | �� | 1,000 | 72,095 | |||||
|
| |||||||
| 143,729 | ||||||||
|
| |||||||
Metals & Mining (1.92%) |
| |||||||
Hindustan Zinc, Ltd. | 59,800 | 129,813 | ||||||
|
| |||||||
TOTAL MATERIALS | 345,936 | |||||||
|
| |||||||
Telecommunication Services (2.08%) |
| |||||||
Wireless Telecommunication Services (2.08%) |
| |||||||
Bharti Airtel, Ltd. | 23,500 | 140,266 | ||||||
|
| |||||||
TOTAL TELECOMMUNICATION SERVICES |
| 140,266 | ||||||
|
| |||||||
Utilities (1.75%) | ||||||||
Independent Power Producers & |
| |||||||
NTPC, Ltd. | 20,000 | 48,452 | ||||||
| Shares | Value (Note 2) | |||||||
| ||||||||
Independent Power Producers & |
| |||||||
PTC India, Ltd. | 77,000 | $ | 70,126 | |||||
|
| |||||||
| 118,578 | ||||||||
|
| |||||||
TOTAL UTILITIES | 118,578 | |||||||
|
| |||||||
TOTAL COMMON STOCKS (Cost $ 6,673,990) |
| 6,625,139 | ||||||
|
| |||||||
TOTAL INVESTMENTS (98.06%) (Cost $ 6,673,990) |
| $ | 6,625,139 | |||||
Other Assets In Excess Of |
| 131,068 | ||||||
|
| |||||||
NET ASSETS (100.00%) | $ | 6,756,207 | ||||||
|
| |||||||
| (a) | Non-Income Producing Security. |
Common Abbreviations:
Ltd. - Limited.
For Fund compliance purposes, the Fund’s industry classifications refer to any one or more of the industry sub-classifications used by one or more widely recognized market indexes or ratings group indexes, and/or as defined by Fund management. This definition may not apply for purposes of this report, which may combine industry sub-classifications for reporting ease. Industries are shown as a percent of net assets.
See Notes to Financial Statements.
| 37 | October 31, 2013 |
ALPS | Kotak India Growth Fund | ||
| October 31, 2013 (Unaudited) | ||
ASSETS | ||||
Investments, at value | $ | 6,625,139 | ||
Cash | 58,318 | |||
Foreign currency, at value (Cost $135,334) | 135,145 | |||
Foreign currency held at broker for futures contracts (Cost $68,433) | 70,242 | |||
Receivable for investments sold | 80,383 | |||
Receivable for shares sold | 21,321 | |||
Dividends receivable | 3,607 | |||
Receivable due from advisor | 23,775 | |||
Prepaid expenses and other assets | 19,377 | |||
| ||||
Total Assets | 7,037,307 | |||
| ||||
LIABILITIES | ||||
Payable for investments purchased | 40,534 | |||
Payable for shares redeemed | 119,308 | |||
Administration and transfer agency fees payable | 18,005 | |||
Distribution and services fees payable | 8,755 | |||
Trustees’ fees and expenses payable | 1,910 | |||
Legal fees payable | 58 | |||
Audit and tax fees payable | 32,369 | |||
Accrued expenses and other liabilities | 60,161 | |||
| ||||
Total Liabilities | 281,100 | |||
| ||||
NET ASSETS | $ | 6,756,207 | ||
| ||||
NET ASSETS CONSIST OF | ||||
Paid-in capital | $ | 7,280,445 | ||
Accumulated net investment loss | (16,897) | |||
Accumulated net realized loss on investments, futures contracts and foreign currency transactions | (460,169) | |||
Net unrealized depreciation on investments and translation of assets and liabilities denominated in foreign currencies | (47,172) | |||
| ||||
NET ASSETS | $ | 6,756,207 | ||
| ||||
INVESTMENTS, AT COST | $ | 6,673,990 | ||
| ||||
PRICING OF SHARES | ||||
Class A: | ||||
Net Asset Value, offering and redemption price per share(a) | $ | 8.83 | ||
Net Assets | $ | 4,212,631 | ||
Shares of beneficial interest outstanding (unlimited number of shares, no par value common stock authorized) | 476,915 | |||
Maximum offering price per share ((NAV/0.9450), based on maximum sales charge of 5.50% of the offering price) | $ | 9.34 | ||
Class C: | ||||
Net Asset Value, offering and redemption price per share(a) | $ | 8.68 | ||
Net Assets | $ | 706,058 | ||
Shares of beneficial interest outstanding (unlimited number of shares, no par value common stock authorized) | 81,358 | |||
Class I: | ||||
Net Asset Value, offering and redemption price per share | $ | 8.91 | ||
Net Assets | $ | 1,837,518 | ||
Shares of beneficial interest outstanding (unlimited number of shares, no par value common stock authorized) | 206,128 | |||
| (a) | Redemption price per share may be reduced for any applicable contingent deferred sales charge. For a description of a possible sales charge, please see the Fund’s Prospectus. |
See Notes to Financial Statements. |
| 38 | October 31, 2013 |
ALPS | Kotak India Growth Fund | ||
| For the Six Months Ended October 31, 2013 (Unaudited) | ||
INVESTMENT INCOME | ||||
Dividends | $ | 96,911 | ||
| ||||
Total Investment Income | 96,911 | |||
| ||||
EXPENSES | ||||
Investment advisory fees | 43,692 | |||
Administrative and transfer agency fees | 70,283 | |||
Distribution and service fees | ||||
Class A | 8,362 | |||
Class C | 4,152 | |||
Legal fees | 4,840 | |||
Audit and tax fees | 25,353 | |||
Reports to shareholders and printing fees | 1,221 | |||
State registration fees | 20,844 | |||
SEC registration fees | 198 | |||
Insurance fees | 57 | |||
Custody fees | 49,544 | |||
Trustees’ fees and expenses | 2,974 | |||
Miscellaneous expenses | 14,309 | |||
| ||||
Total Expense | 245,829 | |||
Less fees waived/reimbursed by investment advisor (Note 7) | ||||
Class A | (106,145) | |||
Class C | (21,018) | |||
Class I | (50,227) | |||
| ||||
Net Expenses | 68,439 | |||
| ||||
Net Investment Income | 28,472 | |||
| ||||
Net realized loss on investments | (45,367) | |||
Net realized gain on futures contracts | 9,127 | |||
Net realized loss on foreign currency transactions | (29,024) | |||
Net change in unrealized depreciation on investments | (546,657) | |||
Net change in unrealized appreciation on translation of assets and liabilities denominated in foreign currencies | 619 | |||
| ||||
NET REALIZED AND UNREALIZED LOSS ON INVESTMENTS | (611,302) | |||
| ||||
NET DECREASE IN NET ASSETS RESULTING FROM OPERATIONS | $ | (582,830) | ||
| ||||
See Notes to Financial Statements. |
| 39 | October 31, 2013 |
ALPS | Kotak India Growth Fund | ||
For the Six Months Ended October 31, 2013 (Unaudited) | For the Year Ended April 30, 2013 | |||||||
| ||||||||
OPERATIONS | ||||||||
Net investment income/(loss) | $ | 28,472 | $ | (43,203) | ||||
Net realized gain/(loss) on investments, futures contracts and foreign currency transactions | (65,264) | 181,647 | ||||||
Net change in unrealized appreciation/(depreciation) on investments and translation of assets and liabilities denominated in foreign currencies | (546,038) | 627,189 | ||||||
| ||||||||
Net Increase/(Decrease) in Net Assets Resulting from Operations | (582,830) | 765,633 | ||||||
| ||||||||
BENEFICIAL INTEREST TRANSACTIONS (NOTE 6) | ||||||||
Shares sold | ||||||||
Class A | 1,400,217 | 3,239,533 | ||||||
Class C | 188,483 | 532,616 | ||||||
Class I | 325,772 | 744,593 | ||||||
Shares redeemed | ||||||||
Class A | (1,534,349) | (1,327,483) | ||||||
Class C | (325,196) | (118,894) | ||||||
Class I | (470,102) | (530,127) | ||||||
| ||||||||
Net Increase/(Decrease) in Net Assets Derived from Beneficial Interest Transactions | (415,175) | 2,540,238 | ||||||
| ||||||||
Net increase/(decrease) in net assets | (998,005) | 3,305,871 | ||||||
NET ASSETS | ||||||||
Beginning of period | 7,754,212 | 4,448,341 | ||||||
| ||||||||
End of period * | $ | 6,756,207 | $ | 7,754,212 | ||||
| ||||||||
*Including accumulated net investment loss of: | $ | (16,897) | $ | (45,369) | ||||
See Notes to Financial Statements. |
| 40 | October 31, 2013 |
ALPS | Kotak India Growth Fund – Class A | ||
Selected data for a share of beneficial interest outstanding throughout the periods indicated:
For the Six Months Ended (Unaudited) (a) | For the Year Ended April 30, 2013 (a) | For the Year Ended April 30, 2012 (a) | For the Period February 14, 2011 (Inception) to April 30, 2011 (a) | |||||
| ||||||||
Net asset value, beginning of period | $9.47 | $8.22 | $10.35 | $10.00 | ||||
INCOME/(LOSS) FROM INVESTMENT OPERATIONS: | ||||||||
Net investment income/(loss)(b) | 0.03 | (0.07) | (0.08) | (0.04) | ||||
Net realized and unrealized gain/(loss) | (0.67) | 1.32 | (2.04) | 0.39 | ||||
| ||||||||
Total from investment operations | (0.64) | 1.25 | (2.12) | 0.35 | ||||
| ||||||||
DISTRIBUTIONS: | ||||||||
From net realized gains | – | – | (0.01) | – | ||||
| ||||||||
Total distributions | – | – | (0.01) | – | ||||
| ||||||||
REDEMPTION FEES ADDED TO PAID-IN CAPITAL (NOTE 6) | 0.00(c) | 0.00(c) | 0.00(c) | 0.00(c) | ||||
| ||||||||
Net increase/(decrease) in net asset value | (0.64) | 1.25 | (2.13) | 0.35 | ||||
| ||||||||
Net asset value, end of period | $8.83 | $9.47 | $8.22 | $10.35 | ||||
| ||||||||
TOTAL RETURN(d) | (6.76)% | 15.21% | (20.44)% | 3.40% | ||||
RATIOS/SUPPLEMENTAL DATA: | ||||||||
Net assets, end of period (000s) | $4,213 | $4,681 | $2,404 | $935 | ||||
Ratio of expenses to average net assets excluding fee waivers and reimbursements | 7.08%(e) | 7.99% | 12.42% | 69.96%(e) | ||||
Ratio of expenses to average net assets including fee waivers and reimbursements | 2.00%(e) | 2.00% | 2.00% | 2.00%(e) | ||||
Ratio of net investment income/(loss) to average net assets | 0.77%(e) | (0.82)% | (0.89)% | (1.82)%(e) | ||||
Portfolio turnover rate(f) | 29% | 93% | 114% | 9% | ||||
| ||||||||
| (a) | Per share amounts and ratios to average net assets include income and expenses of the Kotak Mauritius Portfolio (wholly-owned subsidiary). |
| (b) | Calculated using the average shares method. |
| (c) | Less than $0.005 per share. |
| (d) | Total returns are for the period indicated and have not been annualized. Total returns would have been lower had certain expenses not been waived during the period. Returns shown do not reflect the deduction of taxes that a shareholder would pay on Fund distributions or the redemption of Fund shares. Returns shown exclude any applicable sales charges. |
| (e) | Annualized. |
| (f) | Portfolio turnover rate for periods less than one full year have not been annualized. |
See Notes to Financial Statements. |
| 41 | October 31, 2013 |
ALPS | Kotak India Growth Fund – Class C | ||
Consolidated Financial Highlights | ||
Selected data for a share of beneficial interest outstanding throughout the periods indicated:
For the Six Months Ended October 31, 2013 (Unaudited) (a) | For the Year Ended April 30, 2013 (a) | For the Year Ended April 30, 2012 (a) | For the Period February 14, 2011 (Inception) to April 30, 2011 (a) | |||||
| ||||||||
Net asset value, beginning of period | $9.34 | $8.15 | $10.32 | $10.00 | ||||
INCOME/(LOSS) FROM INVESTMENT OPERATIONS: | ||||||||
Net investment income/(loss)(b) | 0.01 | (0.12) | (0.13) | (0.05) | ||||
Net realized and unrealized gain/(loss) | (0.67) | 1.31 | (2.03) | 0.37 | ||||
| ||||||||
Total from investment operations | (0.66) | 1.19 | (2.16) | 0.32 | ||||
| ||||||||
DISTRIBUTIONS: | ||||||||
From net realized gains | – | – | (0.01) | – | ||||
| ||||||||
Total distributions | – | – | (0.01) | – | ||||
| ||||||||
REDEMPTION FEES ADDED TO PAID-IN CAPITAL (NOTE 6) | – | – | 0.00(c) | – | ||||
| ||||||||
Net increase/(decrease) in net asset value | (0.66) | 1.19 | (2.17) | 0.32 | ||||
| ||||||||
Net asset value, end of period | $8.68 | $9.34 | $8.15 | $10.32 | ||||
| ||||||||
TOTAL RETURN(d) | (7.07)% | 14.60% | (20.97)% | 3.20% | ||||
RATIOS/SUPPLEMENTAL DATA: | ||||||||
Net assets, end of period (000s) | $706 | $924 | $435 | $466 | ||||
Ratio of expenses to average net assets excluding fee waivers and reimbursements | 7.66%(e) | 8.54% | 13.39% | 69.64%(e) | ||||
Ratio of expenses to average net assets including fee waivers and reimbursements | 2.60%(e) | 2.60% | 2.60% | 2.60%(e) | ||||
Ratio of net investment income/(loss) to average net assets | 0.17%(e) | (1.42)% | (1.49)% | (2.42)%(e) | ||||
Portfolio turnover rate(f) | 29% | 93% | 114% | 9% | ||||
| ||||||||
| (a) | Per share amounts and ratios to average net assets include income and expenses of the Kotak Mauritius Portfolio (wholly-owned subsidiary). |
| (b) | Calculated using the average shares method. |
| (c) | Less than $0.005 per share. |
| (d) | Total returns are for the period indicated and have not been annualized. Total returns would have been lower had certain expenses not been waived during the period. Returns shown do not reflect the deduction of taxes that a shareholder would pay on Fund distributions or the redemption of Fund shares. Returns shown exclude any applicable sales charges. |
| (e) | Annualized. |
| (f) | Portfolio turnover rate for periods less than one full year have not been annualized. |
See Notes to Financial Statements. |
| 42 | October 31, 2013 |
ALPS | Kotak India Growth Fund – Class I | ||
Consolidated Financial Highlights Selected data for a share of beneficial interest outstanding throughout the periods indicated: | ||
For the Six Months Ended | For the Year Ended April 30, 2013 (a) | For the Year Ended April 30, 2012 (a) | For the Period February 14, 2011 (Inception) to April 30, 2011 (a) | |||||
| ||||||||
Net asset value, beginning of period | $9.55 | $8.25 | $10.34 | $10.00 | ||||
INCOME/(LOSS) FROM INVESTMENT OPERATIONS: | ||||||||
Net investment | 0.05 | (0.04) | (0.04) | (0.03) | ||||
Net realized and unrealized gain/(loss) | (0.69) | 1.34 | (2.04) | 0.37 | ||||
| ||||||||
Total from investment operations | (0.64) | 1.30 | (2.08) | 0.34 | ||||
| ||||||||
DISTRIBUTIONS: | ||||||||
From net realized gains | – | – | (0.01) | – | ||||
| ||||||||
Total distributions | – | – | (0.01) | – | ||||
| ||||||||
REDEMPTION FEES ADDED TO PAID-IN CAPITAL (NOTE 6) | – | 0.00(c) | 0.00(c) | – | ||||
| ||||||||
Net increase/(decrease) in net asset value | (0.64) | 1.30 | (2.09) | 0.34 | ||||
| ||||||||
Net asset value, end of period | $8.91 | $9.55 | $8.25 | $10.34 | ||||
| ||||||||
| ||||||||
TOTAL RETURN(d) | (6.70)% | 15.76% | (20.23)% | 3.50% | ||||
RATIOS/SUPPLEMENTAL DATA: | ||||||||
Net assets, end of period (000s) | $1,838 | $2,149 | $1,609 | $568 | ||||
Ratio of expenses to average net assets excluding fee waivers and reimbursements | 6.68%(e) | 7.65% | 12.05% | 96.67%(e) | ||||
Ratio of expenses to average net assets including fee waivers and reimbursements | 1.60%(e) | 1.60% | 1.60% | 1.60%(e) | ||||
Ratio of net investment income/(loss) to average net assets | 1.17%(e) | (0.42)% | (0.49)% | (1.36)%(e) | ||||
Portfolio turnover rate(f) | 29% | 93% | 114% | 9% | ||||
| ||||||||
| (a) | Per share amounts and ratios to average net assets include income and expenses of the Kotak Mauritius Portfolio (wholly-owned subsidiary). |
| (b) | Calculated using the average shares method. |
| (c) | Less than $0.005 per share. |
| (d) | Total returns are for the period indicated and have not been annualized. Total returns would have been lower had certain expenses not been waived during the period. Returns shown do not reflect the deduction of taxes that a shareholder would pay on Fund distributions or the redemption of Fund shares. |
| (e) | Annualized. |
| (f) | Portfolio turnover rate for periods less than one full year have not been annualized. |
See Notes to Financial Statements. |
| 43 | October 31, 2013 |
| October 31, 2013 (Unaudited) | ||
Overview
Up
While I’m tempted to title this version of the ALPS/Red Rocks Listed Private Equity Fund commentary as “No Major Drama = Steadily Rising Values, Part III,” I’m going to refrain from doing so. You see, I’ve used that title twice before in previous commentaries. A third time would be akin to going to the well once too often. Instead I’m going to try something fresh and catchy, yet simple. I think the word “Up” accurately describes what I’m feeling, and more importantly, what’s been happening in private equity during the semi-annual period ending October 31, 2013 (the Period). So that’s what I’m going with; Up. And with that, for those of you who want the quick take-away from the Period’s activity and results, you can stop reading now. Up is all you need to know. For those of you that want a bit more color, please read on.
The Period was another strong one for private equity. While mergers and acquisition (M&A) activity trended down (M&A…”the much needed grease that allows the financial gears of private equity to keep operating smoothly” - my reference in a previous commentary), valuations of private businesses and exit activity for the private equity firms that own them trended up. Private equity fund valuations continued in the right direction: Up. And private equity firms generally took in more capital through exits than they put to work in new investments over the Period and during 2013 as a whole. Investors in private equity have liked this.
Listed Private Equity (LPE) companies have been sharing in a similar experience; taking in more capital through exits than they put to work in new investments. When this happens analysts label it as positive cash flow. Most LPE companies have been experiencing that these days - positive cash flow. Shareholders in LPE have liked that as well, especially when valuations and exits have been increasing in a healthy market.
And with that, we believe that conditions have been good to very good in the world of private equity in general and LPE in particular. The majority of private equity backed companies appear to have done well in most every fundamental measure, albeit in slow measured paces; revenue, margins, and EBITDA (Earnings before Interest, Taxes, Depreciation and Amortization) have been generally trending up. Companies have been able to access the credit markets to refinance older debt under favorable terms with lower coupons/servicing costs. Some have even taken on more debt and paid their private equity owners a special dividend (a/k/a a Dividend Recap). When these companies have been sold or taken public, it’s frequently been at an uplift to the private equity firm’s most recent internal valuation and at a multiple of its invested capital. Even certain companies that were purchased at the height of valuations (high to very high) in 2006/2007 have been generating profitable exits for their private equity owners. Yes, we believe that these have been good times in the world of private equity and LPE.
Recently, a very experienced and sharp institutional investor asked me how I would characterize the state of affairs in private equity. My response: “Not too hot, not too cold, just about right.” Who knows, maybe that’s the title of my next commentary: Just About Right.
Portfolio Review
The Fund’s Class A shares, LPEFX, returned 13.72%, (Class A delivered a net return of 7.50% at MOP), compared with 9.68% and
9.56% for the MSCI World Index and the S&P Listed Private Equity Index, respectively.
During the Period, we exited six securities and added Better Capital Pcc Ltd, Cir Spa and Compass Diversified Holdings to the Fund.
Diversification of the Fund continues in earnest. At the end of the Period the Fund held 37 holdings in some of the top performing listed private equity funds/firms from around the globe. Finding, researching and analyzing these investments is the most challenging, yet the most rewarding part of what we do at Red Rocks Capital. Our objective is to assemble a global portfolio of the best LPE securities for the benefit of our shareholders.
Net contributors to performance for the Period included:
| • | Eurazeo SA |
| • | Aurelius AG |
| • | The Blackstone Group LP |
Net detractors to performance for the Period included:
| • | Leucadia National Corp |
| • | Ratos AB, B Shares |
| • | American Capital, Ltd. |
Outlook
So what’s not to like in the current environment? Not much outside of the usual macro-economic malaise, dysfunctional government issues and potential world conflicts that we live with almost every day. Looking a little further out, we do see a potential issue for the private equity/LPE world: the ability to invest capital in new businesses at reasonable valuations (always in the eye of the beholder). Why is that an issue? Because new capital continues to flow into the top private equity firms. Private equity firms and their investors want to see that capital put to work. Will it? Check back over the next few quarters to see how this chapter of the book is written, and more importantly, how it ends.
As always, we appreciate your continued support and interest in Red Rocks and the Listed Private Equity strategy.
Adam Goldman
Co-Portfolio Manager
The views and information discussed in this commentary are as of the date of publication, are subject to change, and may not reflect the writer’s current views. The views expressed represent an assessment of market conditions at a specific point in time, are opinions only and should not be relied upon as investment advice regarding a particular investment or markets in general. Such information does not constitute a recommendation to buy or sell specific securities or investment vehicles. It should not be assumed that any investment will be profitable or will equal the performance of the fund(s) or any securities or any sectors mentioned herein. The subject matter contained herein has been derived from several sources believed to be reliable and accurate at the time of compilation. Red Rocks Capital LLC does not accept any liability for losses either direct or consequential caused by the use of this information.
Diversification cannot guarantee gain or prevent losses.
| 44 | October 31, 2013 |
ALPS | Red Rocks Listed Private Equity Fund | ||
| October 31, 2013 (Unaudited) | ||
Performance of $10,000 Initial Investment (as of October 31, 2013)
Comparison of change in value of a $10,000 investment (includes maximum sales charges of 5.50%)

The chart above represents historical performance of a hypothetical investment of $10,000 in the Fund since inception. Past performance does not guarantee future results. This chart does not reflect the deduction of taxes that a shareholder would pay on Fund distributions or the redemption of Fund shares.
Average Annual Total Returns (as of October 31, 2013)
| 1 Year | 3 Year | 5 Year | Since Inception ^ | Total Expense Ratio | What You Pay * | |||||||
Class A (NAV)1 | 41.06% | 14.30% | 14.20% | -1.19% | 2.58% | 2.58% | ||||||
Class A (MOP)2 | 33.27% | 12.19% | 12.92% | -2.14% | ||||||||
Class C (NAV)1 | 40.04% | 13.41% | 13.22% | -2.03% | 3.21% | 3.21% | ||||||
Class C (CDSC)2 | 39.04% | 13.41% | 13.22% | -2.03% | ||||||||
Class I (NAV)1 | 41.68% | 14.62% | 14.48% | -0.92% | 2.23% | 2.21% | ||||||
Class R | 41.62% | 14.25% | 13.84% | -1.49% | 2.81% | 2.71% | ||||||
S&P® LPE Total Return Index3 | 36.40% | 14.16% | 15.54% | 0.97% | ||||||||
MSCI World Index4 | 25.77% | 11.89% | 13.34% | 2.40% |
Performance data quoted represents past performance. Past performance does not guarantee future results. Investment return and principal value of an investment will fluctuate so that an investor’s shares, when sold or redeemed, may be worth more or less than the original cost. Current performance data may be higher or lower than actual data quoted. The Fund imposes a 2.00% redemption fee on shares held for less than 90 days. The Fund imposes a maximum Contingent Deferred Sales Charge (“CDSC”) of 1.00% on Class C shares redeemed within the first 12 months after a purchase, and on Class A shares redeemed within the first 18 months after a purchase in excess of $1 million. Performance data does not reflect the redemption fee or the CDSC, which if reflected would reduce the performance quoted. For the most current month-end performance data, please call 1-866-759-5679.
Performance shown for Class C shares prior to June 30, 2010 reflects the historical performance of the Fund’s Class A shares, calculated using the fees and expenses of Class C shares.
| 1 | Net Asset Value (NAV) is the share price without sales charges. The performance data shown does not reflect the decution of the sales charge or the redemption fee or CDSC, and that, if reflected, the charge or fee would reduce the performance quoted. |
| 2 | Maximum Offering Price (MOP) for Class A shares includes the Fund’s maximum sales charge of 5.50%. CDSC performance for Class C shares includes a 1% contingent deferred sales charge (CDSC) on C shares redeemed within 12 months of purchase. Performance shown at NAV does not include these sales charges and would have been lower had it been taken into account. |
| 45 | October 31, 2013 |
ALPS | Red Rocks Listed Private Equity Fund | ||
Performance Update | October 31, 2013 (Unaudited) | |
| 3 | S&P® Listed Private Equity Index: The S&P® Listed Private Equity Index is comprised of 30 leading listed private equity companies that meet size, liquidity, exposure, and activity requirements. The index is designed to provide tradable exposure to the leading publicly listed companies in the private equity space. The index is not actively managed and does not reflect any deduction for fees, expenses or taxes. An investor may not invest directly in an index. |
| 4 | MSCI World Index: Morgan Stanley Capital International’s market capitalization weighted index is composed of companies representative of the market structure of 22 developed market countries in North America, Europe and the Asia/Pacific Region. The index is not actively managed and does not reflect any deduction for fees, expenses or taxes. An investor may not invest directly in an index. |
| ^ | Fund inception date of December 31, 2007. |
| * | What You Pay reflects the Advisor’s and Sub-Advisor’s decision to contractually limit expenses through August 31, 2014. Please see the prospectus for additional information. |
The table does not reflect the deduction of taxes that a shareholder would pay on Fund distributions or the redemption of Fund shares.
Listed Private Equity Companies are subject to various risks depending on their underlying investments, which could include, but are not limited to, additional liquidity risk, industry risk, non-U.S. security risk, currency risk, credit risk, managed portfolio risk and derivatives risk (derivatives risk is the risk that the value of the Listed Private Equity Companies’ derivative investments will fall because of pricing difficulties or lack of correlation with the underlying investment).
There are inherent risks in investing in private equity companies, which encompass financial institutions or vehicles whose principal business is to invest in and lend capital to privately held companies. Generally, little public information exists for private and thinly traded companies, and there is a risk that investors may not be able to make a fully informed investment decision.
Listed Private Equity Companies may have relatively concentrated investment portfolios, consisting of a relatively small number of holdings. A consequence of this limited number of investments is that the aggregate returns realized may be adversely impacted by the poor performance of a small number of investments, or even a single investment, particularly if a company experiences the need to write down the value of an investment.
Certain of the Fund’s investments may be exposed to liquidity risk due to low trading volume, lack of a market maker or legal restrictions limiting the ability of the Fund to sell particular securities at an advantageous price and/or time. As a result, these securities may be more difficult to value. Foreign investing involves special risks, such as currency fluctuations and political uncertainty. The Fund invests in derivatives and is subject to the risk that the value of those derivative investments will fall because of pricing difficulties or lack of correlation with the underlying investment.
There is no guarantee that the Fund will continue to hold any one particular security or stay invested in any one particular company. The composition of the Fund’s top holdings is subject to change. Performance figures are historical and reflect the change in share price, reinvested distributions, changes in net asset value, sales charges and capital gains distributions, if any.
Mutual funds are not insured or guaranteed by the FDIC or by any other government agency or government sponsored agency of the federal government or any state, not deposits, obligations or guaranteed by any bank or its affiliates and are subject to investment risks, including possible loss of the principal amount invested.
Top Ten Holdings (as a % of Net Assets) †
|
| Industry Sector Allocation (as a % of Net Assets)
| ||||||
Eurazeo SA | 5.43 | % |
| |||||
Aurelius AG | 5.18 | % | ||||||
SVG Capital PLC | 4.90 | % | ||||||
Blackstone Group LP | 4.84 | % | ||||||
KKR & Co. LP | 4.69 | % | ||||||
Apollo Global Management LLC, Class A | 4.46 | % | ||||||
The Carlyle Group LP | 4.36 | % | ||||||
HarbourVest Global Private Equity, Ltd. | 4.23 | % | ||||||
Electra Private Equity PLC | 4.13 | % | ||||||
Wendel Investissement | 4.06 | % | ||||||
Top Ten Holdings | 46.28 | % | ||||||
† Holdings are subject to change. Table presents indicative values only. | ||||||||

| 46 | October 31, 2013 |
ALPS | Red Rocks Listed Private Equity Fund | ||
| October 31, 2013 (Unaudited) | ||
| Shares | Value (Note 2) | |||||||
| ||||||||
COMMON STOCKS (99.44%) |
| |||||||
Communications (1.74%) |
| |||||||
Internet (1.74%) | ||||||||
ICG Group, Inc.(a) | 366,055 | $ | 5,970,357 | |||||
|
| |||||||
TOTAL COMMUNICATIONS | 5,970,357 | |||||||
|
| |||||||
Diversified (17.62%) | ||||||||
Holding Companies-Diversified |
| |||||||
Ackermans & van Haaren N.V. | 77,472 | 8,392,949 | ||||||
Aker ASA, Class A | 230,674 | 7,265,414 | ||||||
CIR-Compagnie Industriali Riunite | 2,739,515 | 4,563,937 | ||||||
Compass Diversified Holdings | 262,000 | 5,025,160 | ||||||
Leucadia National Corp. | 96,968 | 2,748,073 | ||||||
Remgro, Ltd. | 253,500 | 5,161,539 | ||||||
Schouw & Co. | 356,946 | 13,353,189 | ||||||
Wendel Investissement | 99,908 | 13,944,878 | ||||||
|
| |||||||
| 60,455,139 | ||||||||
|
| |||||||
TOTAL DIVERSIFIED | 60,455,139 | |||||||
|
| |||||||
Financials (80.08%) | ||||||||
Closed-End Funds (27.76%) |
| |||||||
AP Alternative Assets | 210,143 | 6,041,611 | ||||||
Better Capital PCC, | 1,889,000 | 4,694,710 | ||||||
Castle Private Equity, | 309,935 | 4,884,632 | ||||||
Electra Private Equity | 388,808 | 14,182,792 | ||||||
Graphite Enterprise Trust PLC | 101,723 | 905,226 | ||||||
HarbourVest Global Private Equity, Ltd.(a) | 1,440,000 | 14,507,996 | ||||||
HBM Healthcare Investments AG, | 84,000 | 6,383,204 | ||||||
HgCapital Trust PLC | 609,547 | 10,848,641 | ||||||
Pantheon International Participations PLC, Ordinary Shares(a) | 247,481 | 4,138,770 | ||||||
Pantheon International Participations PLC, Redeemable Shares(a) | 203,200 | 3,290,715 | ||||||
Princess Private Equity Holding, Ltd. | 349,157 | 3,181,007 | ||||||
Standard Life European Private Equity Trust PLC, Ordinary Shares | 1,691,044 | 5,395,766 | ||||||
SVG Capital PLC(a) | 2,626,173 | 16,818,085 | ||||||
|
| |||||||
| 95,273,155 | ||||||||
|
| |||||||
Diversified Financial Services (16.01%) | ||||||||
Blackstone Group LP | 631,800 | 16,603,704 | ||||||
Intermediate Capital Group PLC | 1,198,040 | 9,210,964 | ||||||
KKR & Co. LP | 732,773 | 16,084,367 | ||||||
| Shares | Value (Note 2) | |||||||
| ||||||||
Diversified Financial Services (continued) |
| |||||||
Onex Corp. | 246,600 | $ | 13,029,486 | |||||
|
| |||||||
| 54,928,521 | ||||||||
|
| |||||||
Investment Companies (6.49%) |
| |||||||
Hosken Consolidated Investments, Ltd. | 465,121 | 6,834,053 | ||||||
Investor AB, B Shares | 376,321 | 12,090,961 | ||||||
Oaktree Capital Group LLC | 58,500 | 3,329,820 | ||||||
|
| |||||||
| 22,254,834 | ||||||||
|
| |||||||
Private Equity (27.47%) | ||||||||
Altamir Amboise | 847,426 | 11,563,497 | ||||||
American Capital, Ltd.(a) | 501,500 | 7,026,015 | ||||||
Apollo Global Management LLC, Class A | 474,000 | 15,291,240 | ||||||
Aurelius AG | 520,500 | 17,766,724 | ||||||
The Carlyle Group LP | 484,368 | 14,976,658 | ||||||
Eurazeo SA | 246,046 | 18,617,729 | ||||||
IP Group PLC(a) | 995,000 | 2,345,231 | ||||||
Ratos AB, B Shares | 771,000 | 6,680,759 | ||||||
|
| |||||||
| 94,267,853 | ||||||||
|
| |||||||
Real Estate (2.35%) | ||||||||
Brookfield Asset Management, Inc., Class A | 203,440 | 8,052,155 | ||||||
|
| |||||||
TOTAL FINANCIALS | 274,776,518 | |||||||
|
| |||||||
TOTAL COMMON STOCKS (Cost $261,650,127) |
| 341,202,014 | ||||||
|
| |||||||
| 7-Day Yield | Shares | Value (Note 2) | ||||||||||
| ||||||||||||
SHORT TERM INVESTMENTS (0.70%) |
| |||||||||||
Money Market Fund (0.70%) |
| |||||||||||
Dreyfus | 0.00004 | % | 2,405,843 | 2,405,843 | ||||||||
|
| |||||||||||
TOTAL SHORT TERM INVESTMENTS (Cost $2,405,843) |
| 2,405,843 | ||||||||||
|
| |||||||||||
TOTAL INVESTMENTS (100.14%) (Cost $264,055,970) |
| $ | 343,607,857 | |||||||||
Liabilities In Excess Of Other |
| (479,928 | ) | |||||||||
|
| |||||||||||
NET ASSETS (100.00%) |
| $ | 343,127,929 | |||||||||
|
| |||||||||||
| 47 | October 31, 2013 |
ALPS | Red Rocks Listed Private Equity Fund | ||
Statement of Investments | October 31, 2013 (Unaudited) | |
| (a) | Non-Income Producing Security. |
Common Abbreviations:
AB - Aktiebolag is the Swedish equivalent of the term corporation.
AG - Aktiengesellschaft is a German term that refers to a corporation that is limited by shares, i.e., owned by shareholders.
ASA - Allmenn Aksjeselskap is a Swedish term for “joint stock company”.
LLC - Limited Liability Company.
LP - Limited Partnership.
Ltd. - Limited.
N.V. - Naamloze Vennootschap is the Dutch term for a public limited liability corporation.
PCC - Protected Cell Company.
PLC - Public Limited Company.
SA - Generally designates corporations in various countries, mostly those employing the civil law.
SpA - Societa’ Per Azioni is an Italian shared company.
For Fund compliance purposes, the Fund’s industry classifications refer to any one or more of the industry sub-classifications used by one or more widely recognized market indexes or ratings group indexes, and/or as defined by Fund management. This definition may not apply for purposes of this report, which may combine industry sub-classifications for reporting ease. Industries are shown as a percent of net assets.
See Notes to Financial Statements.
| 48 | October 31, 2013 |
ALPS | Red Rocks Listed Private Equity Fund | ||
| October 31, 2013 (Unaudited) | ||
ASSETS | ||||
Investments, at value | $ | 343,607,857 | ||
Foreign currency, at value (Cost $1,879,300) | 1,866,221 | |||
Receivable for investments sold | 1,160,375 | |||
Receivable for shares sold | 456,210 | |||
Dividends and interest receivable | 670,549 | |||
Prepaid expenses and other assets | 55,975 | |||
| ||||
Total Assets | 347,817,187 | |||
| ||||
LIABILITIES | ||||
Payable for investments purchased | 3,851,086 | |||
Payable for shares redeemed | 290,608 | |||
Investment advisory fees payable | 265,641 | |||
Administration and transfer agency fees payable | 53,647 | |||
Distribution and services fees payable | 94,650 | |||
Trustees’ fees and expenses payable | 2,545 | |||
Legal fees payable | 162 | |||
Audit and tax fees payable | 20,123 | |||
Custody fees payable | 54,590 | |||
Accrued expenses and other liabilities | 56,206 | |||
| ||||
Total Liabilities | 4,689,258 | |||
| ||||
NET ASSETS | $ | 343,127,929 | ||
| ||||
NET ASSETS CONSIST OF | ||||
Paid-in capital | $ | 277,727,185 | ||
Accumulated net investment loss | (6,352,883) | |||
Accumulated net realized loss on investments and foreign currency transactions | (7,810,164) | |||
Net unrealized appreciation on investments and translation of assets and liabilities denominated in foreign currencies | 79,563,791 | |||
| ||||
NET ASSETS | $ | 343,127,929 | ||
| ||||
INVESTMENTS, AT COST | $ | 264,055,970 | ||
| ||||
PRICING OF SHARES | ||||
Class A: | ||||
Net Asset Value, offering and redemption price per share(a) | $ | 6.88 | ||
Net Assets | $ | 165,865,923 | ||
Shares of beneficial interest outstanding (unlimited number of shares, no par value common stock authorized) | 24,120,580 | |||
Maximum offering price per share ((NAV/0.9450), based on maximum sales charge of 5.50% of the offering price) | $ | 7.28 | ||
Class C: | ||||
Net Asset Value, offering and redemption price per share(a) | $ | 6.71 | ||
Net Assets | $ | 6,570,207 | ||
Shares of beneficial interest outstanding (unlimited number of shares, no par value common stock authorized) | 978,697 | |||
Class I: | ||||
Net Asset Value, offering and redemption price per share | $ | 6.93 | ||
Net Assets | $ | 170,348,290 | ||
Shares of beneficial interest outstanding (unlimited number of shares, no par value common stock authorized) | 24,592,729 | |||
Class R: | ||||
Net Asset Value, offering and redemption price per share | $ | 6.15 | ||
Net Assets | $ | 343,509 | ||
Shares of beneficial interest outstanding (unlimited number of shares, no par value common stock authorized) | 55,868 | |||
| (a) | Redemption price per share may be reduced for any applicable contingent deferred sales charge. For a description of a possible sales charge, please see the Fund’s Prospectus. |
See Notes to Financial Statements. |
| 49 | October 31, 2013 |
ALPS | Red Rocks Listed Private Equity Fund | ||
| For the Six Months Ended October 31, 2013 (Unaudited) | ||
INVESTMENT INCOME | ||||
Dividends | $ | 4,418,446 | ||
Foreign taxes withheld on dividends | (374,802) | |||
Interest and other income | 357 | |||
| ||||
Total Investment Income | 4,044,001 | |||
| ||||
EXPENSES | ||||
Investment advisory fees | 1,177,311 | |||
Administrative and transfer agency fees | 217,871 | |||
Distribution and service fees | ||||
Class A | 260,898 | |||
Class C | 27,442 | |||
Class R | 733 | |||
Legal fees | 5,336 | |||
Audit and tax fees | 13,670 | |||
Networking fees | ||||
Class A | 19,887 | |||
Class C | 1,235 | |||
Class I | 59,028 | |||
Class R | 73 | |||
Reports to shareholders and printing fees | 30,730 | |||
State registration fees | 31,731 | |||
SEC registration fees | 681 | |||
Insurance fees | 1,941 | |||
Custody fees | 57,465 | |||
Trustees’ fees and expenses | 5,162 | |||
Repayment of previously waived fees | ||||
Class A | 65,209 | |||
Class C | 2,347 | |||
Class I | 33,504 | |||
Class R | 111 | |||
Miscellaneous expenses | 8,049 | |||
| ||||
Total Expenses | 2,020,414 | |||
| ||||
Net Investment Income | 2,023,587 | |||
| ||||
Net realized gain on investments | 14,658,882 | |||
Net realized loss on foreign currency transactions | (628,105) | |||
Net change in unrealized appreciation on investments | 22,758,048 | |||
Net change in unrealized appreciation on translation of assets and liabilities denominated in foreign currencies | 2,519 | |||
| ||||
NET REALIZED AND UNREALIZED GAIN ON INVESTMENTS | 36,791,344 | |||
| ||||
NET INCREASE IN NET ASSETS RESULTING FROM OPERATIONS | $ | 38,814,931 | ||
| ||||
See Notes to Financial Statements. |
| 50 | October 31, 2013 |
ALPS | Red Rocks Listed Private Equity Fund | ||
| For the Six Months Ended October 31, 2013 (Unaudited) | For the Year Ended | |||||||
OPERATIONS | ||||||||
Net investment income | $ | 2,023,587 | $ | 3,533,375 | ||||
Net realized gain on investments and foreign currency transactions | 14,030,777 | 4,919,331 | ||||||
Net change in unrealized appreciation on investments and translation of assets and liabilities denominated in foreign currencies | 22,760,567 | 46,645,985 | ||||||
| ||||||||
Net Increase in Net Assets Resulting from Operations | 38,814,931 | 55,098,691 | ||||||
| ||||||||
DISTRIBUTIONS | ||||||||
Dividends to shareholders from net investment income | ||||||||
Class A | – | (1,393,693) | ||||||
Class C | – | (36,855) | ||||||
Class I | – | (1,868,287) | ||||||
Class R | – | (1,190) | ||||||
| ||||||||
Net Decrease in Net Assets from Distributions | – | (3,300,025) | ||||||
| ||||||||
BENEFICIAL INTEREST TRANSACTIONS (NOTE 6) | ||||||||
Shares sold | ||||||||
Class A | 57,260,298 | 29,478,167 | ||||||
Class C | 1,777,030 | 1,238,806 | ||||||
Class I | 45,338,215 | 60,979,444 | ||||||
Class R | 113,979 | 148,586 | ||||||
Dividends reinvested | ||||||||
Class A | – | 1,275,595 | ||||||
Class C | – | 30,465 | ||||||
Class I | – | 656,092 | ||||||
Class R | – | 813 | ||||||
Shares redeemed | ||||||||
Class A | (15,165,143) | (33,853,264) | ||||||
Class C | (353,990) | (541,528) | ||||||
Class I | (32,609,273) | (29,674,718) | ||||||
Class R | (876) | (25,800) | ||||||
| ||||||||
Net Increase in Net Assets Derived from Beneficial Interest Transactions | 56,360,240 | 29,712,658 | ||||||
| ||||||||
Net increase in net assets | 95,175,171 | 81,511,324 | ||||||
NET ASSETS | ||||||||
Beginning of period | 247,952,758 | 166,441,434 | ||||||
| ||||||||
End of period * | $ | 343,127,929 | $ | 247,952,758 | ||||
| ||||||||
*Including accumulated net investment loss of: | $ | (6,352,883) | $ | (8,376,470) | ||||
See Notes to Financial Statements. |
| 51 | October 31, 2013 |
ALPS | Red Rocks Listed Private Equity Fund – Class A | ||
Selected data for a share of beneficial interest outstanding throughout the periods indicated:
For the Six Months | For the Year Ended April 30, 2013 | For the Year Ended April 30, 2012 | For the Year Ended April 30, 2011 | For the Year Ended April 30, 2010 | For the Year Ended April 30, 2009 | |||||||
Net asset value, beginning of period | $6.05 | $4.67 | $6.44 | $5.17 | $3.56 | $9.47 | ||||||
INCOME/(LOSS) FROM INVESTMENT OPERATIONS: | ||||||||||||
Net investment income | 0.04(a) | 0.08(a) | 0.07(a) | 0.04(a) | 0.14 | 0.08(a) | ||||||
Net realized and unrealized gain/(loss) | 0.79 | 1.39 | (1.41) | 1.61 | 1.99 | (5.97) | ||||||
| ||||||||||||
Total from investment operations | 0.83 | 1.47 | (1.34) | 1.65 | 2.13 | (5.89) | ||||||
| ||||||||||||
DISTRIBUTIONS: | ||||||||||||
From net investment income | – | (0.09) | (0.43) | (0.38) | (0.52) | (0.03) | ||||||
From net realized gains | – | – | – | – | – | (0.00)(b) | ||||||
| ||||||||||||
Total distributions | – | (0.09) | (0.43) | (0.38) | (0.52) | (0.03) | ||||||
| ||||||||||||
REDEMPTION FEES ADDED TO PAID-IN CAPITAL (NOTE 6) | 0.00(b) | 0.00(b) | 0.00(b) | 0.00(b) | 0.00(b) | 0.01 | ||||||
| ||||||||||||
Net increase/(decrease) in net asset value | 0.83 | 1.38 | (1.77) | 1.27 | 1.61 | (5.91) | ||||||
| ||||||||||||
Net asset value, end of period | $6.88 | $6.05 | $4.67 | $6.44 | $5.17 | $3.56 | ||||||
| ||||||||||||
TOTAL RETURN(c) | 13.72% | 31.75% | (19.68)% | 33.22% | 61.68% | (62.01)% | ||||||
RATIOS/SUPPLEMENTAL DATA: | ||||||||||||
Net assets, end of period (000s) | $165,866 | $105,488 | $85,807 | $124,874 | $67,192 | $27,860 | ||||||
Ratio of expenses to average net assets excluding fee waivers and reimbursements(d) | 1.65% (e) | 1.53% | 1.71% | 1.70% | 1.71% | 2.08% | ||||||
Ratio of expenses to average net assets including fee waivers and reimbursements(d) | 1.65%(e) | 1.51%(f) | 1.50% | 1.50% | 1.44%(g) | 1.25% | ||||||
Ratio of net investment income to average net assets(d) | 1.21%(e) | 1.54% | 1.34% | 0.67% | 0.42% | 2.16% | ||||||
Portfolio turnover rate(h) | 20% | 32% | 72% | 43% | 54% | 59% | ||||||
| ||||||||||||
| (a) | Calculated using the average shares method. |
| (b) | Less than $0.005 and ($0.005) per share. |
| (c) | Total returns are for the period indicated and have not been annualized. Total returns would have been lower had certain expenses not been waived during the period. Returns shown do not reflect the deduction of taxes that a shareholder would pay on Fund distributions or the redemption of Fund shares. Returns shown exclude any applicable sales charges. |
| (d) | The ratios exclude the impact of expenses of the underlying funds in which the Fund invests as represented in the Statement of Investments. |
| (e) | Annualized. |
| (f) | Contractual expense limitation changed from 1.50% to 1.65% effective September 1, 2012. |
| (g) | Contractual expense limitation changed from 1.25% to 1.50% effective September 1, 2009. |
| (h) | Portfolio turnover rate for periods less than one full year have not been annualized. |
See Notes to Financial Statements. |
| 52 | October 31, 2013 |
ALPS | Red Rocks Listed Private Equity Fund – Class C | ||
Financial Highlights | ||
Selected data for a share of beneficial interest outstanding throughout the periods indicated:
For the Six Months Ended October 31, 2013 (Unaudited) | For the Year Ended April 30, 2013 | For the Year Ended April 30, 2012 | For the Period July 2, 2010 (Inception) to April 30, 2011 | |||||
Net asset value, beginning of period | $5.92 | $4.59 | $6.37 | $4.39 | ||||
INCOME/(LOSS) FROM INVESTMENT OPERATIONS: | ||||||||
Net investment income/(loss)(a) | 0.02 | 0.04 | 0.03 | (0.01) | ||||
Net realized and unrealized gain/(loss) | 0.77 | 1.35 | (1.39) | 2.36 | ||||
| ||||||||
Total from investment operations | 0.79 | 1.39 | (1.36) | 2.35 | ||||
| ||||||||
DISTRIBUTIONS: | ||||||||
From net investment income | – | (0.06) | (0.42) | (0.37) | ||||
| ||||||||
Total distributions | – | (0.06) | (0.42) | (0.37) | ||||
| ||||||||
REDEMPTION FEES ADDED TO PAID-IN CAPITAL (NOTE 6) | 0.00(b) | 0.00(b) | 0.00(b) | 0.00(b) | ||||
| ||||||||
Net increase/(decrease) in net asset value | 0.79 | 1.33 | (1.78) | 1.98 | ||||
| ||||||||
Net asset value, end of period | $6.71 | $5.92 | $4.59 | $6.37 | ||||
| ||||||||
TOTAL RETURN(c) | 13.34% | 30.55% | (20.33)% | 55.32% | ||||
RATIOS/SUPPLEMENTAL DATA: | ||||||||
Net assets, end of period (000s) | $6,570 | $4,417 | $2,838 | $2,566 | ||||
Ratio of expenses to average net assets excluding fee waivers and reimbursements(d) | 2.25%(e) | 2.25% | 2.37% | 2.31%(e) | ||||
Ratio of expenses to average net assets including fee waivers and reimbursements(d) | 2.25%(e) | 2.25% | 2.25% | 2.25%(e) | ||||
Ratio of net investment income/(loss) to average net assets(d) | 0.66%(e) | 0.79% | 0.59% | (0.19)%(e) | ||||
Portfolio turnover rate(f) | 20% | 32% | 72% | 43%(g) | ||||
| ||||||||
| (a) | Calculated using the average shares method. |
| (b) | Less than $0.005 per share. |
| (c) | Total returns are for the period indicated and have not been annualized. Total returns would have been lower had certain expenses not been waived during the period. Returns shown do not reflect the deduction of taxes that a shareholder would pay on Fund distributions or the redemption of Fund shares. Returns shown exclude any applicable sales charges. |
| (d) | The ratios exclude the impact of expenses of the underlying funds in which the Fund invests as represented in the Statement of Investments. |
| (e) | Annualized. |
| (f) | Portfolio turnover rate for periods less than one full year have not been annualized. |
| (g) | Portfolio turnover rate is calculated at the Fund Level and represents the year ended April 30, 2011. |
See Notes to Financial Statements. |
| 53 | October 31, 2013 |
ALPS | Red Rocks Listed Private Equity Fund – Class I | ||
Financial Highlights | ||
Selected data for a share of beneficial interest outstanding throughout the periods indicated:
For the Six Months Ended October 31, 2013 (Unaudited) | For the Year Ended April 30, 2013 | For the Year Ended April 30, 2012 | For the Year Ended April 30, 2011 | For the Year Ended April 30, 2010 | For the Year Ended April 30, 2009 | |||||||
| ||||||||||||
Net asset value, beginning of period | $6.08 | $4.69 | $6.47 | $5.19 | $3.57 | $9.47 | ||||||
INCOME/(LOSS) FROM INVESTMENT OPERATIONS: | ||||||||||||
Net investment income | 0.05(a) | 0.12(a) | 0.08(a) | 0.05(a) | 0.28 | 0.10(a) | ||||||
Net realized and unrealized gain/(loss) | 0.80 | 1.36 | (1.42) | 1.62 | 1.87 | (5.97) | ||||||
| ||||||||||||
Total from investment operations | 0.85 | 1.48 | (1.34) | 1.67 | 2.15 | (5.87) | ||||||
| ||||||||||||
DISTRIBUTIONS: | ||||||||||||
From net investment income | – | (0.09) | (0.44) | (0.39) | (0.53) | (0.05) | ||||||
From net realized gains | – | – | – | – | – | (0.00)(b) | ||||||
| ||||||||||||
Total distributions | – | (0.09) | (0.44) | (0.39) | (0.53) | (0.05) | ||||||
| ||||||||||||
REDEMPTION FEES ADDED TO PAID-IN CAPITAL (NOTE 6) | 0.00(b) | 0.00(b) | 0.00(b) | 0.00(b) | 0.00(b) | 0.02 | ||||||
| ||||||||||||
Net increase/(decrease) in net asset value | 0.85 | 1.39 | (1.78) | 1.28 | 1.62 | (5.90) | ||||||
| ||||||||||||
Net asset value, end of period | $6.93 | $6.08 | $4.69 | $6.47 | $5.19 | $3.57 | ||||||
| ||||||||||||
TOTAL RETURN(c) | 13.98% | 31.99% | (19.52)% | 33.47% | 62.09% | (61.79)% | ||||||
RATIOS/SUPPLEMENTAL DATA: | ||||||||||||
Net assets, end of period (000s) | $170,348 | $137,856 | $77,750 | $66,854 | $45,144 | $12,938 | ||||||
Ratio of expenses to average net assets excluding fee waivers and | 1.25%(e) | 1.27% | 1.41% | 1.36% | 1.47% | 2.05% | ||||||
Ratio of expenses to average net assets including fee waivers and | 1.25%(e) | 1.25% | 1.25% | 1.25% | 1.19%(f) | 1.00% | ||||||
Ratio of net investment income to average net assets(d) | 1.73%(e) | 2.27% | 1.60% | 0.91% | 0.78% | 2.56% | ||||||
Portfolio turnover rate(g) | 20% | 32% | 72% | 43% | 54% | 59% | ||||||
| ||||||||||||
| (a) | Calculated using the average shares method. |
| (b) | Less than $0.005 and ($0.005) per share. |
| (c) | Total returns are for the period indicated and have not been annualized. Total returns would have been lower had certain expenses not been waived during the period. Returns shown do not reflect the deduction of taxes that a shareholder would pay on Fund distributions or the redemption of Fund shares. |
| (d) | The ratios exclude the impact of expenses of the underlying funds in which the Fund invests as represented in the Statement of Investments. |
| (e) | Annualized. |
| (f) | Contractual expense limitation changed from 1.00% to 1.25% effective September 1, 2009. |
| (g) | Portfolio turnover rate for periods less than one full year have not been annualized. |
See Notes to Financial Statements. |
| 54 | October 31, 2013 |
ALPS | Red Rocks Listed Private Equity Fund – Class R | ||
Financial Highlights | ||
Selected data for a share of beneficial interest outstanding throughout the periods indicated:
For the Six Months Ended October 31, 2013 (Unaudited) | For the Year Ended April 30, 2013 | For the Year Ended April 30, 2012 | For the Year Ended April 30, 2011 | For the Year Ended April 30, 2010 | For the Year Ended April 30, 2009 | |||||||
Net asset value, beginning of period | $5.41 | $4.17 | $5.82 | $4.73 | $3.31 | $9.46 | ||||||
INCOME/(LOSS) FROM INVESTMENT OPERATIONS: | ||||||||||||
Net investment income/(loss) | 0.03(a) | 0.08(a) | 0.05(a) | 0.03(a) | (0.09) | 0.15(a) | ||||||
Net realized and unrealized gain/(loss) | 0.71 | 1.24 | (1.27) | 1.43 | 2.02 | (6.05) | ||||||
| ||||||||||||
Total from investment operations | 0.74 | 1.32 | (1.22) | 1.46 | 1.93 | (5.90) | ||||||
| ||||||||||||
DISTRIBUTIONS: | ||||||||||||
From net investment income | – | (0.08) | (0.43) | (0.37) | (0.51) | (0.26) | ||||||
From net realized gains | – | – | – | – | – | (0.00)(b) | ||||||
| ||||||||||||
Total distributions | – | (0.08) | (0.43) | (0.37) | (0.51) | (0.26) | ||||||
| ||||||||||||
REDEMPTION FEES ADDED TO PAID-IN CAPITAL (NOTE 6) | – | – | – | – | – | 0.01 | ||||||
| ||||||||||||
Net increase/(decrease) in net asset value | 0.74 | 1.24 | (1.65) | 1.09 | 1.42 | (6.15) | ||||||
| ||||||||||||
Net asset value, end of period | $6.15 | $5.41 | $4.17 | $5.82 | $4.73 | $3.31 | ||||||
| ||||||||||||
TOTAL RETURN(c) | 13.68% | 32.05% | (19.93)% | 32.47% | 60.92% | (62.10)% | ||||||
RATIOS/SUPPLEMENTAL DATA: | ||||||||||||
Net assets, end of period (000s) | $344 | $191 | $46 | $125 | $18 | $ - (d) | ||||||
Ratio of expenses to average net assets excluding fee waivers and reimbursements(e) | 1.75%(f) | 1.85% | 1.89% | 1.87% | 2.27% | 6.08% | ||||||
Ratio of expenses to average net assets including fee waivers and reimbursements(e) | 1.75%(f) | 1.75% | 1.75% | 1.75% | 1.75%(g) | 1.50% | ||||||
Ratio of net investment income/(loss) to average net assets(e) | 0.95%(f) | 1.80% | 1.10% | 0.66% | (0.24)% | 2.72% | ||||||
Portfolio turnover rate(h) | 20% | 32% | 72% | 43% | 54% | 59% | ||||||
| ||||||||||||
| (a) | Calculated using the average shares method. |
| (b) | Less than ($0.005) per share. |
| (c) | Total returns are for the period indicated and have not been annualized. Total returns would have been lower had certain expenses not been waived during the period. Returns shown do not reflect the deduction of taxes that a shareholder would pay on Fund distributions or the redemption of Fund shares. |
| (d) | Less than $500. |
| (e) | The ratios exclude the impact of expenses of the underlying funds in which the Fund invests as represented in the Statement of Investments. |
| (f) | Annualized. |
| (g) | Contractual expense limitation changed from 1.50% to 1.75% effective September 1, 2009. |
| (h) | Portfolio turnover rate for periods less than one full year have not been annualized. |
See Notes to Financial Statements. |
| 55 | October 31, 2013 |
| October 31, 2013 (Unaudited) | ||
Market Comment
US equities moved higher during the six month period ending October 31, 2013, in part due to improving economic indicators and continued central bank interventions around the globe. Markets rose in July after US Federal Reserve Chairman Ben Bernanke emphasized the need for continued “highly accommodative monetary policy,” which helped to quash the tapering fears that dominated the markets earlier in the period. However, US equities suffered their worst month of the year in August after heightened geopolitical risks took center stage; investors focused on the widening conflict in Syria and the potential for an imminent US military strike against the regime of Syrian President Bashar al-Assad. In September, the Federal Open Market Committee’s decision to leave the pace of its monthly asset purchases unchanged at $85 billion surprised many investors and US equities rose as a result. Unfortunately, the liquidity-fueled euphoria was short-lived as the ideological gridlock in Congress stifled the rally; the centerpiece of the fiscal battle was defunding or delaying the Affordable Care Act (Obamacare). US equities rose into the end of the period after a last-minute deal was reached by the US Congress to reopen the US government and extend the debt ceiling.
Within the fund’s benchmark, the Russell 1000 Value Index, nine of ten sectors posted positive returns, with the industrials, consumer discretionary, and information technology sectors gaining the most. Utilities was the only sector to post a negative return during the period, while telecommunication services and consumer staples also lagged.
Fund Review
The fund outperformed its benchmark for the period, posting positive relative results in seven out of ten broad market sectors. Overall, stock selection was additive relative to the Russell 1000 Value Index, as decisions in financials, health care, and consumer discretionary more than offset negative relative performance in information technology and consumer staples.
Top contributors to relative performance included Towers Watson (industrials), Ameriprise Financial (financials), and Actavis (health care). Towers Watson, a global professional services company, saw its shares rise after IBM announced plans to move its US retirees from its company-sponsored health plan to a Medicare insurance exchange, Extended Health, owned by Towers Watson. Shares of Ameriprise Financial, a global provider of a range of financial products and services, outperformed after the firm posted strong quarterly earnings that exceeded consensus expectations. The company’s advice and wealth management segment drove results amid stronger advisor productivity and well contained expenses. Shares of Actavis, a US-based global specialty pharmaceutical company, moved higher after the company completed a merger agreement with Warner-Chilcott. Shares continued to gain following the announcement. We eliminated our position in Actavis during the period.
Detractors from relative performance for the period included Xcel Energy (utilities), PG&E (utilities), and Hertz Global (industrials). Xcel Energy, a major U.S. electric and gas company operating in eight states, underperformed as some investors feared that the company
faces a slow growth, higher capital deployment near term environment; ongoing regulatory risk in Minnesota also contributed to investors’ anxieties. We eliminated our position in Xcel Energy during the period. Shares of PG&E, a US-based utility company whose main subsidiary is Pacific Gas and Electric, a regulated utility operating in Central and Northern California, declined after the firm reported earnings that fell short of consensus expectations. In addition, uncertainty in the company’s outlook due to pending decisions related to the company’s General Rate Case and cost of capital decisions weighed on the stock. Shares of Hertz Global, a major US-based car and equipment rental company, declined after the company lowered its full-year earnings forecast due to weaker demand for airport car rentals. An underweight to Apple, on average during the period, also detracted from relative returns.
Outlook
We continue to look for a moderately growing global economy. We are encouraged by the recent data out of Europe, which suggests that perhaps Europe has stabilized. The US economy continues to improve, albeit at moderate growth rates. Continued momentum in housing and auto sales, and sustained growth in the oil shale industry, should benefit the US economy.
The fund attempts to add value by combining Wellington Management’s proprietary fundamental and quantitative research in a disciplined framework to build a portfolio of the most attractive stocks. Within this framework, the fund ended the period most overweight the consumer discretionary and consumer staples sectors and most underweight the utilities and telecommunication services sectors.
The views and information discussed in this commentary are as of the date of publication, are subject to change, and may not reflect the writer’s current views. The views expressed represent an assessment of market conditions at a specific point in time, are opinions only and should not be relied upon as investment advice regarding a particular investment or markets in general. Such information does not constitute a recommendation to buy or sell specific securities or investment vehicles. It should not be assumed that any investment will be profitable or will equal the performance of the portfolios or any securities or any sectors mentioned herein. The subject matter contained herein has been derived from several sources believed to be reliable and accurate at the time of compilation. Wellington Management Company, LLP does not accept any liability for losses either direct or consequential caused by the use of this information.
| 1 | The Russell 1000® Value Index measures the performance of those Russell 1000® companies with lower price-to-book ratios and lower forecasted growth values. The index is not actively managed and does not reflect any deduction for fees, expenses or taxes. An investor may not invest directly in an index. |
| 56 | October 31, 2013 |
ALPS | WMC Disciplined Value Fund | ||
| October 31, 2013 (Unaudited) | ||
Performance of $10,000 Initial Investment (as of October 31, 2013)
Comparison of change in value of a $10,000 investment (includes maximum sales charges of 5.50%)
The chart above represents historical performance of a hypothetical investment of $10,000 in the Fund for the last ten years. Past performance does not guarantee future results. This chart does not reflect the deduction of taxes that a shareholder would pay on Fund distributions or the redemption of Fund shares.
Average Annual Total Returns (as of October 31, 2013)
| 1 Year | 5 Year | 10 Year | Total Expense Ratio | What You Pay * | ||||||
Class A (NAV)1 | 30.26% | 13.77% | 7.49% | 1.51% | 1.40% | |||||
Class A (MOP)2 | 23.15% | 12.49% | 6.88% | |||||||
Class C (NAV)1 | 29.30% | 12.94% | 6.70% | 2.26% | 2.15% | |||||
Class C (CDSC)2 | 28.30% | 12.94% | 6.70% | |||||||
Class I | 30.51% | 14.08% | 7.67% | 1.26% | 1.15% | |||||
Russell 1000® Value Index3 | 28.29% | 14.06% | 7.81% | |||||||
S&P 500® Total Return Index4 | 27.18% | 15.17% | 7.46% |
Performance data quoted represents past performance. Past performance does not guarantee future results. Investment return and principal value of an investment will fluctuate so that an investor’s shares, when sold or redeemed, may be worth more or less than the original cost. Current performance data may be higher or lower than actual data quoted. The Fund imposes a maximum Contingent Deferred Sales Charge (“CDSC”) of 1.00% on Class C shares redeemed within the first 12 months after a purchase, and on Class A shares redeemed within the first 18 months after a purchase in excess of $1 million. Performance data does not reflect the CDSC, which if reflected would reduce the performance quoted. For the most current month-end performance data, please call 1-866-759-5679.
Performance shown for Class C shares prior to June 30, 2010 reflects the historical performance of the Fund’s Class A shares, calculated using the fees and expenses of Class C shares.
The performance shown for the ALPS | WMC Disciplined Value Fund (the “Fund”) for periods prior to August 29, 2009, reflects the performance of the Activa Mutual Funds Trust – Activa Value Fund (as result of a prior reorganization of Activa Mutual Funds Trust – Activa Value Fund into the Fund).
| 57 | October 31, 2013 |
ALPS | WMC Disciplined Value Fund | ||
Performance Update | October 31, 2013 (Unaudited) | |
| 1 | Net Asset Value (NAV) is the share price without sales charges. |
| 2 | Maximum Offering Price (MOP) for Class A shares includes the Fund’s maximum sales charge of 5.50%. CDSC performance for Class C shares includes a 1% CDSC on C shares redeemed within 12 months of purchase. Performance shown at NAV does not include these sales charges and would have been lower had it been taken into account. |
| 3 | The Russell 1000® Value Index measures the performance of those Russell 1000® companies with lower price-to-book ratios and lower forecasted growth values. The index is not actively managed and does not reflect any deduction for fees, expenses or taxes. An investor may not invest directly in an index. |
| 4 | The S&P 500® Index is the Standard & Poor’s composite index of 500 stocks, a widely recognized, unmanaged index of common stock prices. The index is not actively managed and does not reflect any deduction for fees, expenses or taxes. An investor may not invest directly in an index. |
| * | What You Pay reflects the Advisor’s decision to contractually limit expenses through August 31, 2014. Please see the prospectus for additional information. |
The table does not reflect the deduction of taxes that a shareholder would pay on Fund distributions or the redemption of Fund shares.
Mutual funds are not insured or guaranteed by the FDIC or by any other government agency or government sponsored agency of the federal government or any state, not deposits, obligations or guaranteed by any bank or its affiliates and are subject to investment risks, including possible loss of the principal amount invested.
There is no guarantee that the Fund will continue to hold any one particular security or stay invested in any one particular company. The composition of the Fund’s top holdings is subject to change. Performance figures are historical and reflect the change in share price, reinvested distributions, changes in net asset value, sales charges and capital gains distributions, if any.
Investing in the Fund is subject to investment risks, including possible loss of the principal amount invested. Derivatives generally are more sensitive to changes in economic or market conditions than other types of investments; this could result in losses that significantly exceed the Fund’s original investment.
Top Ten Holdings (as a % of Net Assets) †
|
| Industry Sector Allocation (as a % of Net Assets)
| ||||||
Chevron Corp. | 3.69 | % |
| |||||
Wells Fargo & Co. | 3.35 | % | ||||||
JPMorgan Chase & Co. | 3.34 | % | ||||||
Exxon Mobil Corp. | 2.52 | % | ||||||
Merck & Co., Inc. | 2.32 | % | ||||||
Citigroup, Inc. | 2.32 | % | ||||||
Ameriprise Financial, Inc. | 2.10 | % | ||||||
ACE, Ltd. | 1.98 | % | ||||||
CVS Caremark Corp. | 1.92 | % | ||||||
Cisco Systems, Inc. | 1.92 | % | ||||||
Top Ten Holdings | 25.46 | % | ||||||
† Holdings are subject to change. Table presents indicative values only. | ||||||||
| 58 | October 31, 2013 |
ALPS | WMC Disciplined Value Fund | ||
| October 31, 2013 (Unaudited) | ||
| Shares | Value (Note 2) | |||||||
| ||||||||
COMMON STOCKS (99.70%) |
| |||||||
Consumer Discretionary (8.69%) |
| |||||||
Automobiles & Components (1.36%) |
| |||||||
TRW Automotive Holdings Corp.(a) | 17,600 | $ | 1,321,936 | |||||
|
| |||||||
Consumer Durables & Apparel (1.10%) |
| |||||||
PVH Corp. | 8,615 | 1,073,171 | ||||||
|
| |||||||
Media (2.52%) | ||||||||
Twenty-First Century Fox, Inc., Class A | 44,245 | 1,507,870 | ||||||
Viacom, Inc., Class B | 11,390 | 948,673 | ||||||
|
| |||||||
| 2,456,543 | ||||||||
|
| |||||||
Retailing (3.71%) | ||||||||
Dollar Tree, Inc.(a) | 19,190 | 1,120,696 | ||||||
Lowe’s Cos., Inc. | 26,535 | 1,320,912 | ||||||
TJX Cos., Inc. | 19,280 | 1,172,031 | ||||||
|
| |||||||
| 3,613,639 | ||||||||
|
| |||||||
TOTAL CONSUMER DISCRETIONARY |
| 8,465,289 | ||||||
|
| |||||||
Consumer Staples (6.41%) |
| |||||||
Food & Staples Retailing (1.92%) |
| |||||||
CVS Caremark Corp. | 30,015 | 1,868,734 | ||||||
|
| |||||||
Food Beverage & Tobacco (3.76%) |
| |||||||
Altria Group, Inc. | 30,100 | 1,120,623 | ||||||
Hillshire Brands Co. | 21,640 | 710,441 | ||||||
The JM Smucker Co. | 8,275 | 920,263 | ||||||
Philip Morris International, Inc. | 10,225 | 911,252 | ||||||
|
| |||||||
| 3,662,579 | ||||||||
|
| |||||||
Household & Personal Products (0.73%) |
| |||||||
Coty, Inc., Class A | 46,030 | 707,941 | ||||||
|
| |||||||
TOTAL CONSUMER STAPLES |
| 6,239,254 | ||||||
|
| |||||||
Energy (15.38%) | ||||||||
Energy (15.38%) | ||||||||
Anadarko Petroleum Corp. | 17,780 | 1,694,256 | ||||||
Chesapeake Energy Corp. | 26,640 | 744,854 | ||||||
Chevron Corp. | 29,959 | 3,593,882 | ||||||
ConocoPhillips | 8,560 | 627,448 | ||||||
Exxon Mobil Corp. | 27,404 | 2,455,946 | ||||||
Halliburton Co. | 15,465 | 820,109 | ||||||
Marathon Oil Corp. | 26,430 | 931,922 | ||||||
Marathon Petroleum Corp. | 8,800 | 630,608 | ||||||
National Oilwell Varco, Inc. | 9,925 | 805,712 | ||||||
Newfield Exploration Co.(a) | 16,000 | 487,200 | ||||||
Patterson-UTI Energy, Inc. | 26,500 | 642,890 | ||||||
PBF Energy, Inc., Class A | 15,870 | 417,857 | ||||||
| Shares | Value (Note 2) | |||||||
| ||||||||
Energy (continued) | ||||||||
Phillips 66 | 17,540 | $ | 1,130,102 | |||||
|
| |||||||
TOTAL ENERGY | 14,982,786 | |||||||
|
| |||||||
Financials (27.81%) | ||||||||
Banks (5.14%) | ||||||||
The PNC Financial Services Group, Inc. | 15,660 | 1,151,480 | ||||||
Wells Fargo & Co. | 76,530 | 3,267,066 | ||||||
Zions Bancorporation | 20,890 | 592,649 | ||||||
|
| |||||||
| 5,011,195 | ||||||||
|
| |||||||
Diversified Financials (11.48%) |
| |||||||
Ameriprise Financial, Inc. | 20,380 | 2,049,005 | ||||||
BlackRock, Inc. | 4,360 | 1,311,532 | ||||||
Citigroup, Inc. | 46,245 | 2,255,831 | ||||||
Invesco, Ltd. | 37,370 | 1,261,237 | ||||||
JPMorgan Chase & Co. | 63,213 | 3,257,998 | ||||||
Morgan Stanley | 36,620 | 1,052,093 | ||||||
|
| |||||||
| 11,187,696 | ||||||||
|
| |||||||
Insurance (7.57%) | ||||||||
ACE, Ltd. | 20,160 | 1,924,070 | ||||||
American International Group, Inc. | 30,720 | 1,586,688 | ||||||
Aon PLC | 17,640 | 1,395,148 | ||||||
Lincoln National Corp. | 27,320 | 1,240,601 | ||||||
Prudential Financial, Inc. | 15,050 | 1,224,920 | ||||||
|
| |||||||
| 7,371,427 | ||||||||
|
| |||||||
Real Estate (3.62%) | ||||||||
American Capital Agency Corp. | 42,510 | 923,317 | ||||||
Camden Property Trust | 11,435 | 734,127 | ||||||
Equity Lifestyle Properties, Inc. | 17,100 | 649,629 | ||||||
Forest City Enterprises, Inc., Class A(a) | 60,050 | 1,216,613 | ||||||
|
| |||||||
| 3,523,686 | ||||||||
|
| |||||||
TOTAL FINANCIALS | 27,094,004 | |||||||
|
| |||||||
Health Care (13.98%) | ||||||||
Health Care Equipment & |
| |||||||
Aetna, Inc. | 13,250 | 830,775 | ||||||
Covidien PLC | 12,080 | 774,449 | ||||||
Envision Healthcare Holdings, Inc.(a) | 16,420 | 477,001 | ||||||
McKesson Corp. | 6,680 | 1,044,351 | ||||||
UnitedHealth Group, Inc. | 19,620 | 1,339,261 | ||||||
Zimmer Holdings, Inc. | 10,500 | 918,435 | ||||||
|
| |||||||
| 5,384,272 | ||||||||
|
| |||||||
Pharmaceuticals, Biotechnology & |
| |||||||
Actavis plc(a) | 8,400 | 1,298,472 | ||||||
| 59 | October 31, 2013 |
ALPS | WMC Disciplined Value Fund | ||
Statement of Investments | October 31, 2013 (Unaudited) | |
| Shares | Value (Note 2) | |||||||
| ||||||||
Pharmaceuticals, Biotechnology & Life Sciences (continued) |
| |||||||
Bristol-Myers Squibb Co. | 21,305 | $ | 1,118,939 | |||||
Forest Laboratories, Inc.(a) | 27,453 | 1,291,114 | ||||||
Gilead Sciences, Inc.(a) | 20,320 | 1,442,517 | ||||||
Merck & Co., Inc. | 50,100 | 2,259,009 | ||||||
Thermo Fisher Scientific, Inc. | 8,430 | 824,285 | ||||||
|
| |||||||
| 8,234,336 | ||||||||
|
| |||||||
TOTAL HEALTH CARE |
| 13,618,608 | ||||||
|
| |||||||
Industrials (10.30%) |
| |||||||
Capital Goods (5.83%) |
| |||||||
The Boeing Co. | 7,660 | 999,630 | ||||||
Dover Corp. | 11,420 | 1,048,242 | ||||||
General Electric Co. | 47,475 | 1,240,996 | ||||||
Parker Hannifin Corp. | 9,390 | 1,096,001 | ||||||
United Technologies Corp. | 12,180 | 1,294,125 | ||||||
|
| |||||||
| 5,678,994 | ||||||||
|
| |||||||
Commercial & Professional Services (2.80%) |
| |||||||
Equifax, Inc. | 14,110 | 912,494 | ||||||
Towers Watson & Co., Class A | 11,190 | 1,284,724 | ||||||
Verisk Analytics, Inc., Class A(a) | 7,750 | 531,030 | ||||||
|
| |||||||
| 2,728,248 | ||||||||
|
| |||||||
Transportation (1.67%) |
| |||||||
Hertz Global Holdings, Inc.(a) | 45,455 | 1,043,647 | ||||||
United Continental Holdings, Inc.(a) | 17,150 | 582,242 | ||||||
|
| |||||||
| 1,625,889 | ||||||||
|
| |||||||
TOTAL INDUSTRIALS |
| 10,033,131 | ||||||
|
| |||||||
Information Technology (8.85%) |
| |||||||
Semiconductors & Semiconductor Equipment (0.68%) |
| |||||||
Xilinx, Inc. | 14,560 | 661,315 | ||||||
|
| |||||||
Software & Services (4.66%) |
| |||||||
Accenture PLC, Class A | 9,535 | 700,823 | ||||||
eBay, Inc.(a) | 10,420 | 549,238 | ||||||
Genpact, Ltd.(a) | 41,345 | 819,872 | ||||||
Teradata Corp.(a) | 6,790 | 299,235 | ||||||
VeriSign, Inc.(a) | 10,740 | 582,967 | ||||||
Visa, Inc., A Shares | 4,100 | 806,347 | ||||||
Yahoo! Inc(a) | 23,570 | 776,160 | ||||||
|
| |||||||
| 4,534,642 | ||||||||
|
| |||||||
Technology Hardware & Equipment (3.51%) |
| |||||||
Apple, Inc. | 2,980 | 1,556,603 | ||||||
Cisco Systems, Inc. | 82,960 | 1,866,600 | ||||||
|
| |||||||
| 3,423,203 | ||||||||
|
| |||||||
TOTAL INFORMATION TECHNOLOGY |
| 8,619,160 | ||||||
|
| |||||||
| Shares | Value (Note 2) | |||||||
| ||||||||
Materials (2.46%) | ||||||||
Materials (2.46%) | ||||||||
Crown Holdings, Inc.(a) | 20,295 | $ | 884,862 | |||||
The Dow Chemical Co. | 38,358 | 1,513,990 | ||||||
|
| |||||||
TOTAL MATERIALS |
| 2,398,852 | ||||||
|
| |||||||
Telecommunication Services (1.77%) |
| |||||||
Telecommunication Services (1.77%) |
| |||||||
AT&T, Inc. | 47,645 | 1,724,749 | ||||||
|
| |||||||
TOTAL TELECOMMUNICATION SERVICES |
| 1,724,749 | ||||||
|
| |||||||
Utilities (4.05%) | ||||||||
Utilities (4.05%) | ||||||||
American Electric Power Co., Inc | 21,940 | 1,027,670 | ||||||
NextEra Energy, Inc. | 18,630 | 1,578,892 | ||||||
NRG Energy, Inc. | 10,620 | 302,989 | ||||||
PG&E Corp. | 24,700 | 1,033,695 | ||||||
|
| |||||||
TOTAL UTILITIES | 3,943,246 | |||||||
|
| |||||||
TOTAL COMMON STOCKS (Cost $67,212,121) |
| 97,119,079 | ||||||
|
| |||||||
7-Day Yield | Shares | Value (Note 2) | ||||||||||
| ||||||||||||
SHORT TERM INVESTMENTS (0.51%) |
| |||||||||||
Money Market Fund (0.51%) |
| |||||||||||
Fidelity Institutional - Money Market Portfolio, Class I | 0.041 | % | 500,399 | 500,399 | ||||||||
|
| |||||||||||
TOTAL SHORT TERM INVESTMENTS (Cost $500,399) |
| 500,399 | ||||||||||
|
| |||||||||||
TOTAL INVESTMENTS (100.21%) (Cost $67,712,520) |
| $ | 97,619,478 | |||||||||
Liabilities In Excess Of Other Assets (-0.21%) |
| (203,146 | ) | |||||||||
|
| |||||||||||
NET ASSETS (100.00%) |
| $ | 97,416,332 | |||||||||
|
| |||||||||||
| (a) | Non-Income Producing Security. |
Common Abbreviations:
Ltd. - Limited.
PLC - Public Limited Company.
| 60 | October 31, 2013 |
ALPS | WMC Disciplined Value Fund | ||
Statement of Investments | October 31, 2013 (Unaudited) | |
For Fund compliance purposes, the Fund’s industry classifications refer to any one or more of the industry sub-classifications used by one or more widely recognized market indexes or ratings group indexes, and/or as defined by Fund management. This definition may not apply for purposes of this report, which may combine industry sub-classifications for reporting ease. Industries are shown as a percent of net assets.
See Notes to Financial Statements.
| 61 | October 31, 2013 |
ALPS | WMC Disciplined Value Fund | ||
| October 31, 2013 (Unaudited) | ||
ASSETS | ||||
Investments, at value | $ | 97,619,478 | ||
Dividends receivable | 75,204 | |||
Prepaid expenses and other assets | 20,540 | |||
| ||||
Total Assets | 97,715,222 | |||
| ||||
LIABILITIES | ||||
Payable for shares redeemed | 167,398 | |||
Investment advisory fees payable | 72,831 | |||
Administration and transfer agency fees payable | 16,434 | |||
Distribution and services fees payable | 11,340 | |||
Trustees’ fees and expenses payable | 1,207 | |||
Legal fees payable | 147 | |||
Audit and tax fees payable | 10,688 | |||
Accrued expenses and other liabilities | 18,845 | |||
| ||||
Total Liabilities | 298,890 | |||
| ||||
NET ASSETS | $ | 97,416,332 | ||
| ||||
NET ASSETS CONSIST OF | ||||
Paid-in capital | $ | 70,550,996 | ||
Accumulated net investment income | 566,721 | |||
Accumulated net realized loss on investments | (3,608,343) | |||
Net unrealized appreciation on investments | 29,906,958 | |||
| ||||
NET ASSETS | $ | 97,416,332 | ||
| ||||
INVESTMENTS, AT COST | $ | 67,712,520 | ||
| ||||
PRICING OF SHARES | ||||
Class A: | ||||
Net Asset Value, offering and redemption price per share(a) | $ | 11.16 | ||
Net Assets | $ | 53,884,317 | ||
Shares of beneficial interest outstanding (unlimited number of shares, no par value common stock authorized) | 4,827,412 | |||
Maximum offering price per share ((NAV/0.9450), based on maximum sales charge of 5.50% of the offering price) | $ | 11.81 | ||
Class C: | ||||
Net Asset Value, offering and redemption price per share(a) | $ | 11.04 | ||
Net Assets | $ | 96,552 | ||
Shares of beneficial interest outstanding (unlimited number of shares, no par value common stock authorized) | 8,744 | |||
Class I: | ||||
Net Asset Value, offering and redemption price per share | $ | 11.28 | ||
Net Assets | $ | 43,435,463 | ||
Shares of beneficial interest outstanding (unlimited number of shares, no par value common stock authorized) | 3,850,755 | |||
| (a) | Redemption price per share may be reduced for any applicable contingent deferred sales charge. For a description of a possible sales charge, please see the Fund’s Prospectus. |
See Notes to Financial Statements. |
| 62 | October 31, 2013 |
ALPS | WMC Disciplined Value Fund | ||
| For the Six Months Ended October 31, 2013 (Unaudited) | ||
INVESTMENT INCOME | ||||
Dividends | $ | 946,101 | ||
| ||||
Total Investment Income | 946,101 | |||
| ||||
EXPENSES | ||||
Investment advisory fees | 457,087 | |||
Administrative and transfer agency fees | 80,353 | |||
Distribution and service fees | ||||
Class A | 65,747 | |||
Class C | 471 | |||
Legal fees | 2,984 | |||
Audit and tax fees | 8,690 | |||
Reports to shareholders and printing fees | 9,852 | |||
State registration fees | 16,210 | |||
SEC registration fees | 2 | |||
Insurance fees | 927 | |||
Custody fees | 6,135 | |||
Trustees’ fees and expenses | 2,158 | |||
Miscellaneous expenses | 5,749 | |||
| ||||
Total Expenses | 656,365 | |||
Less fees waived/reimbursed by investment advisor (Note 7) | ||||
Class A | (20,074) | |||
Class C | (36) | |||
Class I | (16,721) | |||
| ||||
Net Expenses | 619,534 | |||
| ||||
Net Investment Income | 326,567 | |||
| ||||
Net realized gain on investments | 2,740,507 | |||
Net change in unrealized appreciation on investments | 7,376,726 | |||
| ||||
NET REALIZED AND UNREALIZED GAIN ON INVESTMENTS | 10,117,233 | |||
| ||||
NET INCREASE IN NET ASSETS RESULTING FROM OPERATIONS | $ | 10,443,800 | ||
| ||||
See Notes to Financial Statements. |
| 63 | October 31, 2013 |
ALPS | WMC Disciplined Value Fund | ||
| For the Six Months Ended October 31, 2013 (Unaudited) | For the Year Ended | |||||||
| ||||||||
OPERATIONS | ||||||||
Net investment income | $ | 326,567 | $ | 832,964 | ||||
Net realized gain on investments | 2,740,507 | 3,959,551 | ||||||
Net change in unrealized appreciation on investments | 7,376,726 | 10,023,480 | ||||||
| ||||||||
Net Increase in Net Assets Resulting from Operations | 10,443,800 | 14,815,995 | ||||||
| ||||||||
DISTRIBUTIONS | ||||||||
Dividends to shareholders from net investment income | ||||||||
Class A | – | (495,861 | ) | |||||
Class C | – | (501 | ) | |||||
Class I | – | (393,650 | ) | |||||
| ||||||||
Net Decrease in Net Assets from Distributions | – | (890,012 | ) | |||||
| ||||||||
BENEFICIAL INTEREST TRANSACTIONS (NOTE 6) | ||||||||
Shares sold | ||||||||
Class A | 251,718 | 2,079,629 | ||||||
Class C | 2,500 | 6,300 | ||||||
Class I | 3,220,385 | 5,541,680 | ||||||
Dividends reinvested | ||||||||
Class A | – | 472,006 | ||||||
Class C | – | 501 | ||||||
Class I | – | 393,650 | ||||||
Shares redeemed | ||||||||
Class A | (2,199,055 | ) | (5,504,904 | ) | ||||
Class C | (16,613 | ) | – | |||||
Class I | (3,946,263 | ) | (6,958,371 | ) | ||||
| ||||||||
Net Decrease in Net Assets Derived from Beneficial Interest Transactions | (2,687,328 | ) | (3,969,509 | ) | ||||
| ||||||||
Net increase in net assets | 7,756,472 | 9,956,474 | ||||||
NET ASSETS | ||||||||
Beginning of period | 89,659,860 | 79,703,386 | ||||||
| ||||||||
End of period * | $ | 97,416,332 | $ | 89,659,860 | ||||
| ||||||||
| ||||||||
*Includingaccumulated net investment income of: | $ | 566,721 | $ | 240,154 | ||||
See Notes to Financial Statements. |
| 64 | October 31, 2013 |
ALPS | WMC Disciplined Value Fund – Class A | ||
| Selected data for a share of beneficial interest outstanding throughout the periods indicated: | ||
| For the Six Months Ended October 31, 2013 (Unaudited) | For the Year April 30, 2013 (a) | For the Year April 30, 2012 | For the Year April 30, 2011 (b) | For the Period April 30, 2010 (c) | For the Year Ended December 31, 2009 | For the Year Ended December 31, 2008 | ||||||||
| ||||||||||||||
Net asset value, beginning of period | $10.01 | $8.42 | $8.64 | $7.43 | $6.92 | $5.86 | $9.35 | |||||||
INCOME/(LOSS) FROM INVESTMENT OPERATIONS: | ||||||||||||||
Net investment income | 0.03(d) | 0.08(d) | 0.06(d) | 0.06(d) | 0.03 | 0.07 | 0.08 | |||||||
Net realized and unrealized gain/(loss) | 1.12 | 1.61 | (0.23) | 1.22 | 0.48 | 1.06 | (3.49) | |||||||
| ||||||||||||||
Total from investment operations | 1.15 | 1.69 | (0.17) | 1.28 | 0.51 | 1.13 | (3.41) | |||||||
| ||||||||||||||
DISTRIBUTIONS: | ||||||||||||||
From net investment income | – | (0.10) | (0.05) | (0.07) | – | (0.07) | (0.08) | |||||||
| ||||||||||||||
Total distributions | – | (0.10) | (0.05) | (0.07) | – | (0.07) | (0.08) | |||||||
| ||||||||||||||
Net increase/(decrease) in net asset value | 1.15 | 1.59 | (0.22) | 1.21 | 0.51 | 1.06 | (3.49) | |||||||
| ||||||||||||||
Net asset value, end of period | $11.16 | $10.01 | $8.42 | $8.64 | $7.43 | $6.92 | $5.86 | |||||||
| ||||||||||||||
| ||||||||||||||
TOTAL RETURN(e) | 11.49% | 20.17% | (1.81)% | 17.34% | 7.22% | 19.24% | (36.45)% | |||||||
RATIOS/SUPPLEMENTAL DATA: | ||||||||||||||
Net assets, end of period (000s) | $53,884 | $50,142 | $44,989 | $48,899 | $45,300 | $62,264 | $53,841 | |||||||
Ratio of expenses to average net assets excluding fee waivers and reimbursements | 1.48%(f) | 1.51% | 1.58% | 1.71% | 1.70%(f) | N/A | N/A | |||||||
Ratio of expenses to average net assets including fee waivers and reimbursements | 1.40%(f) | 1.40% | 1.40% | 1.40% | 1.40%(f) | 1.62% | 1.50% | |||||||
Ratio of net investment income to average net assets | 0.57%(f) | 0.95% | 0.83% | 0.77% | 0.60%(f) | 1.12% | 1.10% | |||||||
Portfolio turnover rate(g) | 9% | 34% | 46% | 44% | 11% | 56% | 83% | |||||||
| ||||||||||||||
| (a) | Prior to August 31, 2012, the ALPS | WMC Value Disciplined Fund was known as the ALPS | WMC Value Intersection Fund. |
| (b) | Prior to August 31, 2010, the ALPS | WMC Value Intersection Fund was known as the Activa Value Fund (as a result of the reorganization of Activa Mutual Funds Trust - Activa Value Fund into the fund). |
| (c) | Effective March 9, 2010, the Board approved changing the fiscal year-end of the Fund from December 31 to April 30. |
| (d) | Calculated using the average shares method. |
| (e) | Total returns are for the period indicated and have not been annualized. Total returns would have been lower had certain expenses not been waived during the period. Returns shown do not reflect the deduction of taxes that a shareholder would pay on Fund distributions or the redemption of Fund shares. Returns shown exclude any applicable sales charges. |
| (f) | Annualized. |
| (g) | Portfolio turnover rate for periods less than one full year have not been annualized. |
See Notes to Financial Statements. |
| 65 | October 31, 2013 |
ALPS | WMC Disciplined Value Fund – Class C | ||
Financial Highlights | ||
| Selected data for a share of beneficial interest outstanding throughout the periods indicated: | ||
For the Six Months Ended | For the Year Ended April 30, 2013 (a) | For the Year Ended April 30, 2012 | For the Period July 2, 2010 (Inception) to April 30, 2011 (b) | |||||
| ||||||||
Net asset value, beginning of period | $9.93 | $8.39 | $8.62 | $6.40 | ||||
INCOME/(LOSS) FROM INVESTMENT OPERATIONS: | ||||||||
Net investment income/(loss)(c) | (0.01) | 0.02 | (0.01) | (0.01) | ||||
Net realized and unrealized gain/(loss) | 1.12 | 1.57 | (0.20) | 2.27 | ||||
| ||||||||
Total from investment operations | 1.11 | 1.59 | (0.21) | 2.26 | ||||
| ||||||||
DISTRIBUTIONS: | ||||||||
From net investment income | – | (0.05) | (0.02) | (0.04) | ||||
| ||||||||
Total distributions | – | (0.05) | (0.02) | (0.04) | ||||
| ||||||||
Net increase/(decrease) in net asset value | 1.11 | 1.54 | (0.23) | 2.22 | ||||
| ||||||||
Net asset value, end of period | $11.04 | $9.93 | $8.39 | $8.62 | ||||
| ||||||||
| ||||||||
TOTAL RETURN(d) | 11.18% | 19.07% | (2.45)% | 35.44% | ||||
RATIOS/SUPPLEMENTAL DATA: | ||||||||
Net assets, end of period (000s) | $97 | $100 | $79 | $14 | ||||
Ratio of expenses to average net assets excluding fee waivers and reimbursements | 2.23%(e) | 2.26% | 2.38% | 2.49%(e) | ||||
Ratio of expenses to average net assets including fee waivers and reimbursements | 2.15%(e) | 2.15% | 2.15% | 2.15%(e) | ||||
Ratio of net investment income/(loss) to average net assets | (0.17)%(e) | 0.19% | (0.16)% | (0.09)%(e) | ||||
Portfolio turnover rate(f) | 9% | 34% | 46% | 44%(g) | ||||
| ||||||||
| (a) | Prior to August 31, 2012, the ALPS | WMC Value Disciplined Fund was known as the ALPS | WMC Value Intersection Fund. |
| (b) | Prior to August 31, 2010, the ALPS | WMC Value Intersection Fund was known as the Activa Value Fund (as a result of the reorganization of Activa Mutual Funds Trust - Activa Value Fund into the fund). |
| (c) | Calculated using the average shares method. |
| (d) | Total returns are for the period indicated and have not been annualized. Total returns would have been lower had certain expenses not been waived during the period. Returns shown do not reflect the deduction of taxes that a shareholder would pay on Fund distributions or the redemption of Fund shares. Returns shown exclude any applicable sales charges. |
| (e) | Annualized. |
| (f) | Portfolio turnover rate for periods less than one full year have not been annualized. |
| (g) | Portfolio turnover rate is calculated at the Fund Level and represents the year ended April 30, 2011. |
See Notes to Financial Statements. |
| 66 | October 31, 2013 |
ALPS | WMC Disciplined Value Fund – Class I | ||
Financial Highlights | ||
Selected data for a share of beneficial interest outstanding throughout the periods indicated: | ||
For the Six Months | For the Year April 30, 2013 (a) | For the Year April 30, 2012 | For the Year April 30, 2011 (b) | For the Period April 30, 2010 (c) | For the Year Ended December 31, 2009 | For the Year Ended December 31, 2008 | ||||||||
| ||||||||||||||
Net asset value, beginning of period | $10.10 | $8.49 | $8.71 | $7.48 | $6.96 | $5.89 | $9.41 | |||||||
INCOME/(LOSS) FROM INVESTMENT OPERATIONS: | ||||||||||||||
Net investment income | 0.04(d) | 0.11(d) | 0.09(d) | 0.07(d) | 0.02 | 0.07 | 0.09 | |||||||
Net realized and unrealized gain/(loss) | 1.14 | 1.61 | (0.24) | 1.24 | 0.50 | 1.08 | (3.52) | |||||||
| ||||||||||||||
Total from investment operations | 1.18 | 1.72 | (0.15) | 1.31 | 0.52 | 1.15 | (3.43) | |||||||
| ||||||||||||||
DISTRIBUTIONS: | ||||||||||||||
From net investment income | – | (0.11) | (0.07) | (0.08) | – | (0.08) | (0.09) | |||||||
| ||||||||||||||
Total distribution | – | (0.11) | (0.07) | (0.08) | – | (0.08) | (0.09) | |||||||
| ||||||||||||||
Net increase/(decrease) in net asset value | 1.18 | 1.61 | (0.22) | 1.23 | 0.52 | 1.07 | (3.52) | |||||||
| ||||||||||||||
Net asset value, end of period | $11.28 | $10.10 | $8.49 | $8.71 | $7.48 | $6.96 | $5.89 | |||||||
| ||||||||||||||
| ||||||||||||||
TOTAL RETURN(e) | 11.68% | 20.43% | (1.62)% | 17.67% | 7.47% | 19.59% | (36.38)% | |||||||
RATIOS/SUPPLEMENTAL DATA: | ||||||||||||||
Net assets, end of period (000s) | $43,435 | $39,417 | $34,636 | $29,251 | $16,814 | $16,465 | $3,658 | |||||||
Ratio of expenses to average net assets excluding fee waivers and reimbursements | 1.23%(f) | 1.26% | 1.33% | 1.46% | 1.49%(f) | N/A | N/A | |||||||
Ratio of expenses to average net assets including fee waivers and reimbursements | 1.15%(f) | 1.15% | 1.15% | 1.15% | 1.15%(f) | 1.46% | 1.40% | |||||||
Ratio of net investment income to average net assets | 0.82%(f) | 1.20% | 1.08% | 0.95% | 0.77%(f) | 1.17% | 1.30% | |||||||
Portfolio turnover rate(g) | 9% | 34% | 46% | 44% | 11% | 56% | 83% | |||||||
| ||||||||||||||
| (a) | Prior to August 31, 2012, the ALPS | WMC Value Disciplined Fund was known as the ALPS | WMC Value Intersection Fund. |
| (b) | Prior to August 31, 2010, the ALPS | WMC Value Intersection Fund was known as the Activa Value Fund (as a result of the reorganization of Activa Mutual Funds Trust - Activa Value Fund into the fund). |
| (c) | Effective March 9, 2010, the Board approved changing the fiscal year-end of the Fund from December 31 to April 30. |
| (d) | Calculated using the average shares method. |
| (e) | Total returns are for the period indicated and have not been annualized. Total returns would have been lower had certain expenses not been waived during the period. Returns shown do not reflect the deduction of taxes that a shareholder would pay on Fund distributions or the redemption of Fund shares. |
| (f) | Annualized. |
| (g) | Portfolio turnover rate for periods less than one full year have not been annualized. |
See Notes to Financial Statements. |
| 67 | October 31, 2013 |
| October 31, 2013 (Unaudited) | ||
During the six month period ending October 31, 2013, the Clough China Fund gained 7.3%, outperforming the MSCI China Index, which rose 6.3%.
Investment Environment
It was a volatile period for Chinese stocks. The market plunged in June when China’s money market rates unexpectedly rose to near record highs as the Central Bank signaled to commercial banks that they should manage their balance sheet and credit growth more prudently and slow down lending. Investors reacted negatively to the sudden liquidity tightening that continued for a few weeks before short-term rates retreated to normal levels. Market sentiment recovered in July, encouraged by a consistent improvement in monthly economic data which showed a rebound in the Purchasing Manager Index (PMI)1 as well as stronger growth in industrial production, power demand and both imports and exports. At the same time, industrial companies’ profits accelerated from 6.3% year-over-year growth in June to 18.4% in September2. As the economy re-gained momentum, fears of a “hard landing” appeared overdone and receded. The market rallied nearly 25% from its low in June through the end of October.
During the first nine months of 2013 large industrial firms recorded a 13.5% rise in profits2. This increase was driven by a 17.0% rise in private firms’ profits, whereas earnings of State-owned Enterprises (SOE) grew a more moderate 9.4%2. This divergence confirms the stronger growth of the private sector as compared to the State-sponsored sector over the last few years. Not only are private sector companies generating higher earnings growth, but they also earn a higher return on equity3 on average. While the private sector is underrepresented in most broad Chinese stock market indices, it is the most dynamic and efficient part of the economy. Overseas investors often underestimate the entrepreneurial spirit of China’s small and medium sized business leaders. Private companies have become a driver of China’s development and expansion and account for about 80% of Chinese urban employment4. They are the major job creator in China and account for about two thirds of the total fixed asset investment in the country. No wonder the government has decided to grant market forces a bigger role in the economy in the recently announced reform plan after the third plenary session of the Communist Party Congress.
Portfolio Composition
We continue to overweight the consumer discretionary sector in the portfolio (22.9% of assets vs. 5.3% in the benchmark). Holdings of consumer-oriented companies were once again the main positive contributor to the Fund’s performance whereas holdings in the industrials and energy sectors had a negative impact.
In terms of individual stocks, Tencent Holdings, a leading provider of internet, mobile and telecommunication value-added services was the best performing holding. Monetization of mobile games and of its popular mobile messaging service, “WeChat”, looks to be new earnings drivers for coming years. Tencent has already emerged as China’s largest mobile game distribution platform by users and is well placed to benefit from this fast growing market. It recently expanded its scope to the search engine business by acquiring a
36.5% stake in the online search company Sogou. Man Wah Holdings, a home furnishing group mainly engaged in the design, manufacturing and sale of mid-to-high end reclining sofas under the brand name “Cheers” in the US, Europe and China, also performed strongly. Profitability has surged in 2013 thanks to accelerating sales growth as well as efficiency gains and cost controls, leading Man Wah to issue two successive profit alerts, one for its full year to March 2013 – where earnings increased 87% - and another for the first half of 2014, when their profit jumped 129%. Great Wall Motors, our third best performer for the period, is the largest Sports Utility Vehicle (SUV) manufacturer in China. Sales increased 27%5 last year to 462,679 vehicles and again 28% in the first 10 months this year, outperforming China’s total car market growth. We consider Great Wall to be the best positioned in the Chinese auto industry. These three companies are all privately owned (i.e., not SOEs). They enjoy healthy financial situations with net cash balance sheets and high net profit margins.
The biggest detractors during the period included Skyworth Digital, a manufacturer of television and other audio visual products. Skyworth posted disappointing earnings and is no longer in the portfolio. Meanwhile, long-time holdings Biostime International Holdings, a branded importer of infant formula and oil services company Anton Oilfield Services were also weak during the period and a drag on returns.
Outlook
In the recently concluded Third Plenary session of the Communist Party Congress, President Xi Jinping announced a wide range of reform initiatives that will transform the Chinese social and economic landscape in the next five to ten years. The major lines of the program are below. We think they signal a shift in the political orientation and thinking of China’s leadership. They will introduce more flexibility and freedom in both the economy as well as in the society.
The key theme of the reform plan looks to be a re-definition of the roles of the government and the market. Whereas the Plenum document6 on the decisions that were adopted recommends to adhere to the basic economic system with public ownership playing a dominant role, it states that Beijing supports “allowing the market to play a decisive role in resource allocation”. This is in contrast with the previous “basic role” officially attributed to market forces in the last decades. Ownership of some SOEs will be transferred to the Social Security Fund to strengthen the social safety net and improve governance. SOEs will be required to raise their dividend payout ratio to 30% from the current 10 - 15%. Private capital will be allowed to enter banks. Market forces will increasingly determine the prices of water, oil, natural gas, power, transportation and telecom services. Fiscal reform will improve the local taxation system and re-allocate resources and expenditure between the central and local governments. Efforts will be made to facilitate overseas companies’ entry to China – through widened investment access, new Free Trade Zones and the opening up of some inland and coastal areas.
| 68 | October 31, 2013 |
Clough China Fund | ||
Management Commentary | October 31, 2013 (Unaudited) | |
But the series of reforms to be engaged is not limited to the economic and financial areas. It targets a broader impact on the country’s social life. For instance:
| • | A long expected land reform will grant farmers the right to possess, use and transfer their contracted land as well as to use their land ownership as collateral or guarantee. |
| • | It is specified that the protection of property rights applies not only to publicly owned property but also to privately owned property. |
| • | The new policy will ease control over farmers settling in towns and relax the restrictions of settling in medium-sized cities while large cities will review the criteria on how migrant workers will be eligible to obtain urban residency status. This is the beginning of the long awaited “Hukou” reform for the 260 million migrant workers currently living and working in Chinese cities that would enable them to enjoy the full benefit of urban social services and security protection. |
| • | The government decided to ease the 35-year old “One-child policy”, allowing couples to have two children if one of the parents is an only child. |
| • | Lastly, China will overhaul the judicial system to enhance the independence of courts. |
This is an ambitious and comprehensive reform package. It does not fix all the issues currently existing in China and the timing on its implementation is uncertain, apart from setting that all measures must be in place and at work by 2020. Nonetheless, we believe it puts China on the right path towards a more open, balanced and prosperous development path where urbanization will be easier, more efficient and where both urban residents and rural citizens will have more opportunities to contribute to the country’s expansion as well as to benefit from it. The economic work meeting in Beijing next month should start establishing a schedule for the reforms and we expect most of them to begin being implemented in 2014. The most technical reforms will be easy to put in place. Others, related to SOEs and local government finances, are likely to be more gradual as they meet some resistance from vested interests. To ensure the effective implementation of the reforms, a Central Reform Leading Group has been created at the top level of the Party, similar to the State Reform Commission created in 1982 under the State Council and who played a key role in China’s reform process. We have no doubt that this Group, chaired by the President, will seriously monitor the reform process.
Market sentiment was lifted on November 18th when details were released after the Plenum. The MSCI China Index jumped 4.1% on that day and the Hang Seng Index in Hong Kong recorded its heaviest trading volume since last February. We are confident that the market driven reforms will support a sustained growth of domestic consumption and should generate enough momentum to trigger a Gross Domestic Product (“GDP”) growth above 7% in the next few years. While Chinese equities have sharply underperformed most global equity markets since 2009, we believe significant upside and “catch up” potential that could materialize in the coming months which would benefit the Fund.
| 1 | Purchasing Manager Index –PMI is an indicator of the economic health of the manufacturing sector. The PMI index is based on five major indicators: new orders, inventory levels, production, supplier deliveries and the employment environment. |
| 2 | Source: National Bureau of Statistics NBS. |
| 3 | Return on Equity – is the amount of net income returned as a percentage of shareholders equity. Return on equity measures a corporation’s profitability by revealing how much profit a company generates with the money shareholders have invested. |
| 4 | Source: Bloomberg, UBS Asia Sales Summary September and October 2013, CLSA Sinology China Macro Strategy “Making sense of China’s corporate landscape” October 31, 2013. |
| 5 | Source: Great Wall Motors company report. |
| 6 | Source: Deutsche Bank Asia Economics Monthly September p.4 “Getting more bullish on China”, Credit Suisse “China: Detailed reform framework announced” 18 November 2013, Jefferies “China unveils a clear path to prosperity” November 18, 2013, BNP Paribas “China Economics: Bold Reform Programme” 18 November 2013. |
The views and information discussed in this commentary are as of the date of publication, are subject to change, and may not reflect the writer’s current views. The views expressed represent an assessment of market conditions at a specific point in time, are opinions only and should not be relied upon as investment advice regarding a particular investment or markets in general. Such information does not constitute a recommendation to buy or sell specific securities or investment vehicles. It should not be assumed that any investment will be profitable or will equal the performance of the fund(s) or any securities or any sectors mentioned herein. The subject matter contained herein has been derived from several sources believed to be reliable and accurate at the time of compilation. Clough Capital Partners, LP does not accept any liability for losses either direct or consequential caused by the use of this information.
| 69 | October 31, 2013 |
Clough China Fund | ||
| October 31, 2013 (Unaudited) | ||
Performance of $10,000 Initial Investment (as of October 31, 2013)
Comparison of change in value of a $10,000 investment (includes maximum sales charges of 5.50%)
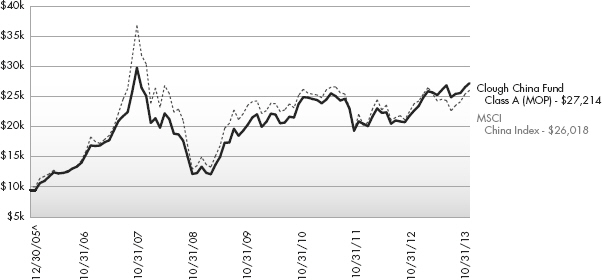
The chart above represents historical performance of a hypothetical investment of $10,000 in the Fund since inception. Past performance does not guarantee future results. This chart does not reflect the deduction of taxes that a shareholder would pay on Fund distributions or the redemption of Fund shares.
Average Annual Total Returns (as of October 31, 2013)
| 1 Year | 3 Year | 5 Year | Since Inception ^ | Total Expense Ratio | What You Pay * | |||||||
Class A (NAV)1 | 20.08% | 3.03% | 17.49% | 14.45% | 2.15% | 1.96% | ||||||
Class A (MOP)2 | 13.46% | 1.10% | 16.17% | 13.63% | ||||||||
Class C (NAV)1 | 19.20% | 2.26% | 16.60% | 13.61% | 2.95% | 2.71% | ||||||
Class C (CDSC)2 | 18.20% | 2.26% | 16.60% | 13.61% | ||||||||
Class I 3 | 20.57% | 3.32% | 17.93% | 14.96% | 1.95% | 1.71% | ||||||
MSCI China Index4 | 9.28% | -0.22% | 14.99% | 12.98% |
Performance data quoted represents past performance. Past performance does not guarantee future results. Investment return and principal value of an investment will fluctuate so that an investor’s shares, when sold or redeemed, may be worth more or less than the original cost. Current performance data may be higher or lower than actual data quoted. The Fund imposes a 2.00% redemption fee on shares held for less than 30 days. The Fund imposes a maximum Contingent Deferred Sales Charge (“CDSC”) of 1.00% on Class C shares redeemed within the first 12 months after a purchase, and on Class A shares redeemed within the first 18 months after a purchase in excess of $1 million. Performance data does not reflect the redemption fee or the CDSC, which if reflected would reduce the performance quoted. For the most current month-end performance data, please call 1-877-256-8445.
The performance shown for the Clough China Fund for periods prior to January 15, 2010, reflects the performance of the Old Mutual China Fund, a series of Old Mutual Funds I (as a result of a prior reorganization of the Old Mutual China Fund into the Clough China Fund).
| 1 | Net Asset Value (NAV) is the share price without sales charges. |
| 2 | Maximum Offering Price (MOP) includes sales charges. Class A returns include effects of the Fund’s maximum sales charge of 5.50%; Class C returns include the 1.00% CDSC. |
| 3 | Prior to close of business on January 15, 2010, Class I was known as Institutional Class of the Old Mutual China Fund. |
| 70 | October 31, 2013 |
Clough China Fund | ||
Performance Update | October 31, 2013 (Unaudited) | |
| 4 | The Morgan Stanley Capital International (“MSCI”) China Index is constructed according to the MSCI Global Investable Market Index (GIMI) family. The MSCI China Index is part of the MSCI Emerging Markets Index. The index is not actively managed and does not reflect any deduction for fees, expenses or taxes. An investor may not invest directly in an index. |
| ^ | Fund Inception date of December 30, 2005. |
| * | What You Pay reflects the Advisor’s decision to contractually limit expenses through August 31, 2014. Please see the prospectus for additional information. |
The table does not reflect the deduction of taxes that a shareholder would pay on Fund distributions or the redemption of Fund shares.
There is no guarantee that the Fund will continue to hold any one particular security or stay invested in any one particular company. The composition of the Fund’s top holdings is subject to change. Performance figures are historical and reflect the change in share price, reinvested distributions, changes in net asset value, sales charges and capital gains distributions, if any.
Mutual funds are not insured or guaranteed by the FDIC or by any other government agency or government sponsored agency of the federal government or any state, not deposits, obligations or guaranteed by any bank or its affiliates and are subject to investment risks, including possible loss of the principal amount invested.
Investing in the Fund is subject to investment risks, including possible loss of the principal amount invested.
Investing in China, Hong Kong and Taiwan involves risk and considerations not present when investing in more established securities markets. The Fund may be more susceptible to the economic, market, political and local risks of these regions than a fund that is more geographically diversified.
This Fund is not suitable for all investors.
Top Ten Holdings (as a % of Net Assets)†
China Construction Bank Corp., Class H | 6.73 | % | ||
Tencent Holdings, Ltd. | 6.31 | % | ||
CNOOC, Ltd. | 4.87 | % | ||
Industrial & Commercial Bank of China, Ltd., Class H | 4.21 | % | ||
China State Construction International Holdings, Ltd. | 4.03 | % | ||
China Petroleum & Chemical Corp., Class H | 3.67 | % | ||
Bank of China, Ltd., Class H | 3.59 | % | ||
Great Wall Motor Co., Ltd., Class H | 3.41 | % | ||
Man Wah Holdings, Ltd. | 3.06 | % | ||
China Everbright International, Ltd. | 2.70 | % | ||
Top Ten Holdings | 42.58 | % |
| † | Holdings are subject to change. Table presents indicative values only. |
Industry Sector Allocation (as a % of Net Assets)†
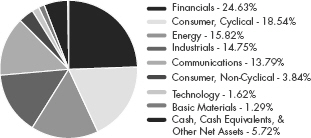
| 71 | October 31, 2013 |
Clough China Fund | ||
| October 31, 2013 (Unaudited) | ||
| Shares | Value (Note 2) | |||||||
| ||||||||
COMMON STOCKS (94.28%) |
| |||||||
Basic Materials (1.29%) | ||||||||
Iron/Steel (0.97%) | ||||||||
Angang Steel Co., Ltd., Class H(a) | 1,394,000 | $ | 843,996 | |||||
|
| |||||||
Mining (0.32%) |
| |||||||
Zhaojin Mining Industry Co., Ltd., Class H | 338,000 | 272,982 | ||||||
|
| |||||||
TOTAL BASIC MATERIALS |
| 1,116,978 | ||||||
|
| |||||||
Communications (13.79%) | ||||||||
Internet (6.93%) | ||||||||
58.com, Inc., ADR(a) | 4,139 | 99,833 | ||||||
Tencent Holdings, Ltd. | 100,200 | 5,463,949 | ||||||
YY, Inc., ADR(a) | 8,800 | 432,696 | ||||||
|
| |||||||
| 5,996,478 | ||||||||
|
| |||||||
Telecommunications (6.86%) |
| |||||||
China Mobile, Ltd. | 201,000 | 2,088,721 | ||||||
China Telecom Corp., Ltd., Class H | 1,770,000 | 924,569 | ||||||
China Unicom Hong Kong, Ltd. | 1,026,000 | 1,605,192 | ||||||
VTech Holdings, Ltd. | 92,100 | 1,322,286 | ||||||
|
| |||||||
| 5,940,768 | ||||||||
|
| |||||||
TOTAL COMMUNICATIONS |
| 11,937,246 | ||||||
|
| |||||||
Consumer, Cyclical (18.54%) |
| |||||||
Airlines (1.08%) | ||||||||
Air China, Ltd., Class H | 1,364,000 | 930,426 | ||||||
|
| |||||||
Apparel (1.88%) |
| |||||||
Shenzhou International Group Holdings, Ltd. | 473,000 | 1,630,904 | ||||||
|
| |||||||
Auto Manufacturers (5.40%) |
| |||||||
Brilliance China Automotive Holdings, Ltd. | 416,000 | 727,660 | ||||||
Chongqing Changan Automobile Co., Ltd. | 537,570 | 991,104 | ||||||
Great Wall Motor Co., Ltd., Class H | 503,000 | 2,956,494 | ||||||
|
| |||||||
| 4,675,258 | ||||||||
|
| |||||||
Auto Parts & Equipment (0.72%) |
| |||||||
Xinyi Glass Holdings, Ltd. | 632,000 | 625,929 | ||||||
|
| |||||||
Lodging (1.93%) |
| |||||||
Galaxy Entertainment Group, Ltd.(a) | 68,000 | 507,612 | ||||||
| Shares | Value (Note 2) | |||||||
| ||||||||
Lodging (continued) | ||||||||
Sands China, Ltd. | 163,600 | $ | 1,163,211 | |||||
|
| |||||||
| 1,670,823 | ||||||||
|
| |||||||
Retail (6.89%) |
| |||||||
Baoxin Auto Group, Ltd. | 776,500 | 800,008 | ||||||
Cafe de Coral Holdings, Ltd. | 286,000 | 981,551 | ||||||
Lifestyle International Holdings, Ltd. | 279,000 | 608,005 | ||||||
Man Wah Holdings, Ltd. | 1,536,556 | 2,648,235 | ||||||
SA SA International Holdings, Ltd. | 854,000 | 931,639 | ||||||
|
| |||||||
| 5,969,438 | ||||||||
|
| |||||||
Textiles (0.64%) |
| |||||||
Pacific Textile Holdings, Ltd. | 401,000 | 550,365 | ||||||
|
| |||||||
TOTAL CONSUMER, CYCLICAL |
| 16,053,143 | ||||||
|
| |||||||
Consumer, Non-Cyclical (3.84%) |
| |||||||
Cosmetics/Personal Care (0.43%) |
| |||||||
Prince Frog International Holdings, Ltd. | 334,000 | 200,753 | ||||||
Vinda International Holdings, Ltd. | 118,000 | 167,386 | ||||||
|
| |||||||
| 368,139 | ||||||||
|
| |||||||
Food (1.80%) |
| |||||||
China Huishan Dairy Holdings Co., Ltd.(a) | 1,238,000 | 491,815 | ||||||
China Modern Dairy Holdings, Ltd.(a) | 2,299,000 | 1,070,590 | ||||||
|
| |||||||
| 1,562,405 | ||||||||
|
| |||||||
Healthcare-Products (0.30%) |
| |||||||
Hengan International Group Co., Ltd. | 21,500 | 263,258 | ||||||
|
| |||||||
Household Products/Wares (1.31%) |
| |||||||
Biostime International Holdings, Ltd. | 70,000 | 529,889 | ||||||
Goodbaby International Holdings, Ltd. | 1,233,000 | 608,981 | ||||||
|
| |||||||
| 1,138,870 | ||||||||
|
| |||||||
TOTAL CONSUMER, NON-CYCLICAL |
| 3,332,672 | ||||||
|
| |||||||
Energy (15.82%) | ||||||||
Coal (0.75%) | ||||||||
China Shenhua Energy Co., Ltd., Class H | 214,500 | 652,483 | ||||||
|
| |||||||
| 72 | October 31, 2013 |
Clough China Fund | ||
Statement of Investments | October 31, 2013 (Unaudited) | |
| Shares | Value (Note 2) | |||||||
| ||||||||
Energy Equipment & |
| |||||||
China Oilfield Services, Ltd., Class H | 342,000 | $ | 955,783 | |||||
|
| |||||||
Energy-Alternate Sources (1.27%) |
| |||||||
China Longyuan Power Group Corp., Class H | 958,000 | 1,102,202 | ||||||
|
| |||||||
Oil & Gas (10.29%) | ||||||||
China Petroleum & Chemical Corp., Class H | 3,924,000 | 3,176,508 | ||||||
CNOOC, Ltd. | 2,075,000 | 4,220,491 | ||||||
PetroChina Co., Ltd., Class H | 1,326,000 | 1,510,024 | ||||||
|
| |||||||
| 8,907,023 | ||||||||
|
| |||||||
Oil & Gas Services (1.45%) |
| |||||||
Anton Oilfield Services Group | 1,198,000 | 757,728 | ||||||
SPT Energy Group, Inc. | 906,000 | 498,678 | ||||||
|
| |||||||
| 1,256,406 | ||||||||
|
| |||||||
Pipelines (0.95%) | ||||||||
China Gas Holdings, Ltd. | 740,000 | 825,313 | ||||||
|
| |||||||
TOTAL ENERGY | 13,699,210 | |||||||
|
| |||||||
Financials (24.63%) | ||||||||
Banks (17.27%) | ||||||||
Agricultural Bank of China, Ltd., Class H | 4,391,000 | 2,116,001 | ||||||
Bank of China, Ltd., Class H | 6,627,000 | 3,111,487 | ||||||
Bank of East Asia, Ltd. | 59,400 | 257,424 | ||||||
China Construction Bank Corp., Class H | 7,485,080 | 5,823,596 | ||||||
Industrial & Commercial Bank of China, Ltd., Class H | 5,201,967 | 3,646,714 | ||||||
|
| |||||||
| 14,955,222 | ||||||||
|
| |||||||
Insurance (4.09%) | ||||||||
AIA Group, Ltd. | 137,200 | 696,678 | ||||||
China Pacific Insurance Group Co., Ltd., Class H | 315,400 | 1,139,738 | ||||||
Ping An Insurance Group Co. of China, Ltd., Class H | 216,500 | 1,707,159 | ||||||
|
| |||||||
| 3,543,575 | ||||||||
|
| |||||||
Real Estate (2.94%) | ||||||||
Cheung Kong Holdings, Ltd. | 54,000 | 843,320 | ||||||
China Overseas Land & Investment, Ltd. | 272,000 | 842,934 | ||||||
Kerry Properties, Ltd. | 97,500 | 422,813 | ||||||
Shimao Property Holdings, Ltd. | 174,000 | 437,307 | ||||||
|
| |||||||
| 2,546,374 | ||||||||
|
| |||||||
| Shares | Value (Note 2) | |||||||
| ||||||||
Real Estate Management & Development (0.33%) |
| |||||||
KWG Property Holdings, Ltd. | 438,500 | $ | 283,889 | |||||
|
| |||||||
TOTAL FINANCIALS | 21,329,060 | |||||||
|
| |||||||
Industrials (14.75%) | ||||||||
Building Materials (2.06%) |
| |||||||
Anhui Conch Cement Co., Ltd., Class H | 511,000 | 1,783,273 | ||||||
|
| |||||||
Engineering & |
| |||||||
China Communications Construction Co., Ltd., Class H | 1,503,000 | 1,226,770 | ||||||
China Railway Construction Corp., Ltd., Class H | 555,000 | 608,734 | ||||||
China State Construction International Holdings, Ltd. | 2,070,000 | 3,487,764 | ||||||
|
| |||||||
| 5,323,268 | ||||||||
|
| |||||||
Environmental Control (2.70%) |
| |||||||
China Everbright International, Ltd. | 2,346,000 | 2,338,719 | ||||||
|
| |||||||
Hand/Machine Tools (0.54%) |
| |||||||
Techtronic Industries Co. | 185,364 | 465,533 | ||||||
|
| |||||||
Machinery-Diversified (2.10%) |
| |||||||
CSR Corp., Ltd., Class H | 2,180,000 | 1,816,671 | ||||||
|
| |||||||
Transportation (1.20%) |
| |||||||
Orient Overseas International, Ltd. | 201,500 | 1,040,772 | ||||||
|
| |||||||
TOTAL INDUSTRIALS | 12,768,236 | |||||||
|
| |||||||
Technology (1.62%) | ||||||||
Computers (1.12%) |
| |||||||
Lenovo Group, Ltd. | 906,000 | 970,512 | ||||||
|
| |||||||
Internet Software & |
| |||||||
Baidu, Inc., ADR(a) | 2,677 | 430,729 | ||||||
|
| |||||||
TOTAL TECHNOLOGY | 1,401,241 | |||||||
|
| |||||||
TOTAL COMMON STOCKS |
| 81,637,786 | ||||||
|
| |||||||
| 73 | October 31, 2013 |
Clough China Fund | ||
Statement of Investments | October 31, 2013 (Unaudited) | |
7-Day Yield | Shares | Value (Note 2) | ||||||||||
| ||||||||||||
SHORT TERM |
| |||||||||||
Money Market Fund (3.30%) |
| |||||||||||
Dreyfus Cash Management Fund, Institutional Class | 0.040 | % | 2,860,001 | $ | 2,860,001 | |||||||
|
| |||||||||||
TOTAL SHORT TERM INVESTMENTS (Cost $2,860,001) |
| 2,860,001 | ||||||||||
|
| |||||||||||
TOTAL INVESTMENTS (97.58%) (Cost $70,015,028) |
| $ | 84,497,787 | |||||||||
Other Assets In Excess Of Liabilities (2.42%) |
| 2,091,939 | ||||||||||
|
| |||||||||||
NET ASSETS (100.00%) |
| $ | 86,589,726 | |||||||||
|
| |||||||||||
| (a) | Non-Income Producing Security. |
Common Abbreviations:
ADR - | American Depositary Receipt. | |
Ltd. - | Limited. | |
SA - | Generally designated corporations in various countries, mostly those employing civil law. |
For Fund compliance purposes, the Fund’s industry classifications refer to any one or more of the industry sub-classifications used by one or more widely recognized market indexes or ratings group indexes, and/or as defined by Fund management. This definition may not apply for purposes of this report, which may combine industry sub-classifications for reporting ease. Industries are shown as a percent of net assets.
See Notes to Financial Statements.
| 74 | October 31, 2013 |
Clough China Fund | ||
| October 31, 2013 (Unaudited) | ||
ASSETS | ||||
Investments, at value | $ | 84,497,787 | ||
Cash | 25 | |||
Foreign currency, at value (Cost $3,161,981) | 3,162,922 | |||
Receivable for investments sold | 1,376,110 | |||
Receivable for shares sold | 31,217 | |||
Dividends receivable | 68 | |||
Prepaid expenses and other assets | 17,488 | |||
| ||||
Total Assets | 89,085,617 | |||
| ||||
LIABILITIES | ||||
Payable for investments purchased | 2,241,175 | |||
Payable for shares redeemed | 29,405 | |||
Investment advisory fees payable | 90,823 | |||
Administration and transfer agency fees payable | 17,121 | |||
Distribution and services fees payable | 17,952 | |||
Trustees’ fees and expenses payable | 646 | |||
Legal fees payable | 192 | |||
Audit and tax fees payable | 18,853 | |||
Accrued expenses and other liabilities | 79,724 | |||
| ||||
Total Liabilities | 2,495,891 | |||
| ||||
NET ASSETS | $ | 86,589,726 | ||
| ||||
NET ASSETS CONSIST OF | ||||
Paid-in capital | $ | 73,405,319 | ||
Accumulated net investment income | 1,441,785 | |||
Accumulated net realized loss on investments and foreign currency transactions | (2,741,068 | ) | ||
Net unrealized appreciation on investments and translation of assets and liabilities denominated in foreign currencies | 14,483,690 | |||
| ||||
NET ASSETS | $ | 86,589,726 | ||
| ||||
INVESTMENTS, AT COST | $ | 70,015,028 | ||
| ||||
PRICING OF SHARES | ||||
Class A: | ||||
Net Asset Value, offering and redemption price per share(a) | $ | 22.39 | ||
Net Assets | $ | 36,977,888 | ||
Shares of beneficial interest outstanding (unlimited number of shares, no par value common stock authorized) | 1,651,259 | |||
Maximum offering price per share ((NAV/0.9450), based on maximum sales charge of 5.50% of the offering price) | $ | 23.69 | ||
Class C: | ||||
Net Asset Value, offering and redemption price per share(a) | $ | 21.54 | ||
Net Assets | $ | 12,294,913 | ||
Shares of beneficial interest outstanding (unlimited number of shares, no par value common stock authorized) | 570,793 | |||
Class I: | ||||
Net Asset Value, offering and redemption price per share | $ | 22.82 | ||
Net Assets | $ | 37,316,925 | ||
Shares of beneficial interest outstanding (unlimited number of shares, no par value common stock authorized) | 1,635,344 | |||
| (a) | Redemption price per share may be reduced for any applicable contingent deferred sales charge. For a description of a possible sales charge, please see the Fund’s Prospectus. |
See Notes to Financial Statements. |
| 75 | October 31, 2013 |
Clough China Fund | ||
| For the Six Months Ended October 31, 2013 (Unaudited) | ||
INVESTMENT INCOME | ||||
Dividends | $ | 2,026,001 | ||
Foreign taxes withheld on dividends | (117,664) | |||
| ||||
Total Investment Income | 1,908,337 | |||
| ||||
EXPENSES | ||||
Investment advisory fees | 555,818 | |||
Administrative and transfer agency fees | 71,874 | |||
Distribution and service fees | ||||
Class A | 43,321 | |||
Class C | 59,961 | |||
Legal fees | 3,154 | |||
Audit and tax fees | 13,664 | |||
Networking fees | ||||
Class A | 5,690 | |||
Class C | 4,226 | |||
Class I | 13,426 | |||
Reports to shareholders and printing fees | 7,935 | |||
State registration fees | 20,685 | |||
SEC registration fees | 1,295 | |||
Insurance fees | 515 | |||
Custody fees | 57,625 | |||
Trustees’ fees and expenses | 1,358 | |||
Miscellaneous expenses | 7,696 | |||
| ||||
Total Expense | 868,243 | |||
Less fees waived/reimbursed by investment advisor (Note 7) | ||||
Class A | (22,849) | |||
Class C | (10,012) | |||
Class I | (32,142) | |||
| ||||
Net Expenses | 803,240 | |||
| ||||
Net Investment Income | 1,105,097 | |||
| ||||
Net realized gain on investments | 1,367,132 | |||
Net realized gain on foreign currency transactions | 6,491 | |||
Net change in unrealized appreciation on investments | 628,639 | |||
Net change in unrealized appreciation on translation of assets and liabilities denominated in foreign currencies | 7,397 | |||
| ||||
NET REALIZED AND UNREALIZED GAIN ON INVESTMENTS | 2,009,659 | |||
| ||||
NET INCREASE IN NET ASSETS RESULTING FROM OPERATIONS | $ | 3,114,756 | ||
| ||||
See Notes to Financial Statements. |
| 76 | October 31, 2013 |
Clough China Fund | ||
| For the Six Months Ended October 31, 2013 (Unaudited) | For the Year Ended | |||||||
| ||||||||
OPERATIONS | ||||||||
Net investment income | $ | 1,105,097 | $ | 401,561 | ||||
Net realized gain on investments and foreign currency transactions | 1,373,623 | 1,151,438 | ||||||
Net change in unrealized appreciation on investments and translation of assets and liabilities denominated in foreign currencies | 636,036 | 5,521,514 | ||||||
| ||||||||
Net Increase in Net Assets Resulting from Operations | 3,114,756 | 7,074,513 | ||||||
| ||||||||
DISTRIBUTIONS | ||||||||
Dividends to shareholders from net investment income | ||||||||
Class A | – | (38,487) | ||||||
Class I | – | (61,529) | ||||||
| ||||||||
Net Decrease in Net Assets from Distributions | – | (100,016) | ||||||
| ||||||||
BENEFICIAL INTEREST TRANSACTIONS (NOTE 6) | ||||||||
Shares sold | ||||||||
Class A | 6,890,623 | 8,119,247 | ||||||
Class C | 1,844,016 | 2,575,377 | ||||||
Class I | 12,501,661 | 41,213,968 | ||||||
Dividends reinvested | ||||||||
Class A | – | 25,075 | ||||||
Class I | – | 18,451 | ||||||
Shares redeemed | ||||||||
Class A | (3,994,051) | (10,136,711) | ||||||
Class C | (2,200,567) | (3,351,866) | ||||||
Class I | (2,497,831) | (45,590,967) | ||||||
| ||||||||
Net Increase/(Decrease) in Net Assets Derived from Beneficial Interest Transactions | 12,543,851 | (7,127,426) | ||||||
| ||||||||
Net increase/(decrease) in net assets | 15,658,607 | (152,929) | ||||||
NET ASSETS | ||||||||
Beginning of period | 70,931,119 | 71,084,048 | ||||||
| ||||||||
End of period * | $ | 86,589,726 | $ | 70,931,119 | ||||
| ||||||||
*Including accumulated net investment income of: | $ | 1,441,785 | $ | 336,688 | ||||
See Notes to Financial Statements. |
| 77 | October 31, 2013 |
Clough China Fund – Class A | ||
Selected data for a share of beneficial interest outstanding throughout the periods indicated:
For the Six Months | For the Year April 30, 2013 | For the Year April 30, 2012 | For the Year Ended April 30, 2011 | For the Period August 1, 2009 to April 30, 2010 (a)(b) | For the Year July 31, 2009 | For the Year July 31, 2008 | ||||||||
| ||||||||||||||
Net asset value, beginning of period | $21.45 | $18.43 | $21.02 | $18.21 | $16.32 | $15.81 | $22.46 | |||||||
INCOME/(LOSS) FROM INVESTMENT OPERATIONS: | ||||||||||||||
Net investment income/(loss) | 0.28(c) | 0.15(c) | 0.02(c) | (0.04)(c) | 0.10 | 0.09(c) | (0.01)(c) | |||||||
Net realized and unrealized gain/(loss) | 0.66 | 2.90 | (2.61) | 2.94 | 1.85 | 0.62(d) | (1.73) | |||||||
| ||||||||||||||
Total from investment operations | 0.94 | 3.05 | (2.59) | 2.90 | 1.95 | 0.71 | (1.74) | |||||||
| ||||||||||||||
DISTRIBUTIONS: | ||||||||||||||
From net investment income | – | (0.03) | – | (0.09) | (0.07) | (0.20) | (0.03) | |||||||
From net realized gains | – | – | – | – | – | – | (4.88) | |||||||
| ||||||||||||||
Total distributions | – | (0.03) | – | (0.09) | (0.07) | (0.20) | (4.91) | |||||||
| ||||||||||||||
REDEMPTION FEES ADDED TO PAID-IN CAPITAL (NOTE 6) | 0.00(e) | 0.00(e) | 0.00(e) | 0.00(c)(e) | 0.01 | 0.00(c)(e) | – | |||||||
| ||||||||||||||
Net increase/(decrease) in net asset value | 0.94 | 3.02 | (2.59) | 2.81 | 1.89 | 0.51 | (6.65) | |||||||
| ||||||||||||||
Net asset value, end of period | $22.39 | $21.45 | $18.43 | $21.02 | $18.21 | $16.32 | $15.81 | |||||||
| ||||||||||||||
TOTAL RETURN(f) | 4.38% | 16.54% | (12.32)% | 16.00% | 12.07% | 5.00%(d) | (13.91)% | |||||||
RATIOS/SUPPLEMENTAL DATA: | ||||||||||||||
Net assets, end of period (000s) | $36,978 | $32,709 | $30,542 | $44,616 | $28,695 | $15,069 | $17,927 | |||||||
Ratio of expenses to average net assets excluding fee waivers and reimbursements | 2.08%(g) | 2.14% | 2.08% | 2.07% | 2.24%(g) | 2.62% | 2.34% | |||||||
Ratio of expenses to average net assets including fee waivers and reimbursements | 1.95%(g) | 1.95% | 1.95% | 1.89%(h) | 1.87%(g)(i) | 1.95% | 2.02% | |||||||
Ratio of net investment income/(loss) to average net assets | 2.62%(g) | 0.78% | 0.13% | (0.22)% | (0.53)%(g) | 0.70% | (0.06)% | |||||||
Portfolio turnover rate(j) | 116% | 221% | 174% | 170% | 110% | 120% | 178% | |||||||
| ||||||||||||||
| (a) | Effective March 9, 2010, the Board approved changing the fiscal year-end of the Fund from July 31 to April 30. |
| (b) | Prior to its reorganization on January 15, 2010, the Clough China Fund was known as the Old Mutual China Fund. |
| (c) | Calculated using the average shares method. |
| (d) | Impact of payment by affiliate was less than $0.01 per share and 0.01%, respectively. |
| (e) | Less than $0.005 per share. |
| (f) | Total returns are for the period indicated and have not been annualized. Total returns would have been lower had certain expenses not been waived during the period. Returns shown do not reflect the deduction of taxes that a shareholder would pay on Fund distributions or the redemption of Fund shares. Returns shown exclude any applicable sales charges. |
| (g) | Annualized. |
| (h) | Contractual expense limitation changed from 1.85% to 1.95% effective January 1, 2011. |
| (i) | Contractual expense limitation changed from 1.95% to 1.85% effective January 1, 2010. |
| (j) | Portfolio turnover rate for periods less than one full year have not been annualized. |
See Notes to Financial Statements. |
78 | October 31, 2013
|
Clough China Fund – Class C | ||
Financial Highlights | ||
Selected data for a share of beneficial interest outstanding throughout the periods indicated:
For the Six Months | For the Year April 30, 2013 | For the Year April 30, 2012 | For the Year April 30, 2011 | For the Period August 1, 2009 to April 30, 2010 (a)(b) | For the Year July 31, 2009 | For the Year July 31, 2008 | ||||||||
| ||||||||||||||
Net asset value, beginning of period | $20.71 | $17.90 | $20.58 | $17.89 | $16.08 | $15.48 | $22.26 | |||||||
INCOME/(LOSS) FROM INVESTMENT OPERATIONS: | ||||||||||||||
Net investment income/(loss) | 0.21(c) | 0.01(c) | (0.11)(c) | (0.21)(c) | (0.17) | (0.01)(c) | (0.17)(c) | |||||||
Net realized and unrealized gain/(loss) | 0.62 | 2.80 | (2.57) | 2.90 | 1.98 | 0.65(d) | (1.64) | |||||||
| ||||||||||||||
Total from investment operations | 0.83 | 2.81 | (2.68) | 2.69 | 1.81 | 0.64 | (1.81) | |||||||
| ||||||||||||||
DISTRIBUTIONS: | ||||||||||||||
From net investment income | – | – | – | (0.00)(e) | – | (0.04) | (0.09) | |||||||
From net realized gains | – | – | – | – | – | – | (4.88) | |||||||
| ||||||||||||||
Total distributions | – | – | – | – | – | (0.04) | (4.97) | |||||||
| ||||||||||||||
REDEMPTION FEES ADDED TO PAID-IN CAPITAL (NOTE 6) | 0.00(e) | 0.00(e) | 0.00(e) | 0.00(e) | – | – | – | |||||||
| ||||||||||||||
Net increase/(decrease) in net asset value | 0.83 | 2.81 | (2.68) | 2.69 | 1.81 | 0.60 | (6.78) | |||||||
| ||||||||||||||
Net asset value, end of period | $21.54 | $20.71 | $17.90 | $20.58 | $17.89 | $16.08 | $15.48 | |||||||
| ||||||||||||||
TOTAL RETURN(f) | 4.01% | 15.70% | (13.02)% | 15.13% | 11.26% | 4.21%(d) | (14.49)% | |||||||
RATIOS/SUPPLEMENTAL DATA: | ||||||||||||||
Net assets, end of period (000s) | $12,295 | $12,251 | $11,674 | $16,848 | $7,594 | $8,267 | $9,991 | |||||||
Ratio of expenses to average net assets excluding fee waivers and reimbursements | 2.87%(g) | 2.94% | 2.88% | 2.86% | 3.18%(g) | 3.43% | 3.15% | |||||||
Ratio of expenses to average net assets including fee waivers and reimbursements | 2.70%(g) | 2.70% | 2.70% | 2.70% | 2.70%(g) | 2.70% | 2.77% | |||||||
Ratio of net investment income/ (loss) to average net assets | 1.99%(g) | 0.07% | (0.62)% | (1.10)% | (1.26)%(g) | (0.05)% | (0.85)% | |||||||
Portfolio turnover rate(h) | 116% | 221% | 174% | 170% | 110% | 120% | 178% | |||||||
| ||||||||||||||
| (a) | Effective March 9, 2010, the Board approved changing the fiscal year-end of the Fund from July 31 to April 30. |
| (b) | Prior to its reorganization on January 15, 2010, the Clough China Fund was known as the Old Mutual China Fund. |
| (c) | Calculated using the average shares method. |
| (d) | Impact of payment by affiliate was less than $0.01 per share and 0.01%, respectively. |
| (e) | Less than $0.005 and ($0.005) per share. |
| (f) | Total returns are for the period indicated and have not been annualized. Total returns would have been lower had certain expenses not been waived during the period. Returns shown do not reflect the deduction of taxes that a shareholder would pay on Fund distributions or the redemption of Fund shares. Returns shown exclude any applicable sales charges. |
| (g) | Annualized. |
| (h) | Portfolio turnover rate for periods less than one full year have not been annualized. |
See Notes to Financial Statements. |
| 79 | October 31, 2013 |
Clough China Fund – Class I | ||
Financial Highlights | ||
Selected data for a share of beneficial interest outstanding throughout the periods indicated:
For the Six Months Ended October 31, 2013 | For the Year April 30, 2013 | For the Year Ended April 30, 2012 | For the Year Ended April 30, 2011 | For the Period August 1, 2009 to April 30, 2010 (a)(b) | For the Year Ended July 31, 2009 | For the Year Ended July 31, 2008 | ||||||||
| ||||||||||||||
Net asset value, beginning of period | $21.82 | $18.71 | $21.30 | $18.41 | $16.52 | $16.10 | $22.65 | |||||||
INCOME/(LOSS) FROM INVESTMENT OPERATIONS: | ||||||||||||||
Net investment income/(loss) | 0.33(c) | 0.13(c) | 0.06(c) | (0.01)(c) | 0.01 | 0.15(c) | 0.13(c) | |||||||
Net realized and unrealized gain/(loss) | 0.67 | 3.02 | (2.65) | 3.03 | 2.03 | 0.60(d) | (1.80) | |||||||
| ||||||||||||||
Total from investment operations | 1.00 | 3.15 | (2.59) | 3.02 | 2.04 | 0.75 | (1.67) | |||||||
| ||||||||||||||
DISTRIBUTIONS: | ||||||||||||||
From net investment income | – | (0.06) | – | (0.13) | (0.15) | (0.33) | – | |||||||
From net realized gains | – | – | – | – | – | – | (4.88) | |||||||
| ||||||||||||||
Total distributions | – | (0.06) | – | (0.13) | (0.15) | (0.33) | (4.88) | |||||||
| ||||||||||||||
REDEMPTION FEES ADDED TO PAID-IN CAPITAL (NOTE 6) | 0.00(e) | 0.02 | 0.00(e) | 0.00(e) | – | – | – | |||||||
| ||||||||||||||
Net increase/(decrease) in net asset value | 1.00 | 3.11 | (2.59) | 2.89 | 1.89 | 0.42 | (6.55) | |||||||
| ||||||||||||||
Net asset value, end of period | $22.82 | $21.82 | $18.71 | $21.30 | $18.41 | $16.52 | $16.10 | |||||||
| ||||||||||||||
TOTAL RETURN(f) | 4.58% | 16.95% | (12.16)% | 16.45% | 12.36% | 5.51%(d) | (13.41)% | |||||||
RATIOS/SUPPLEMENTAL DATA: | ||||||||||||||
Net assets, end of period (000s) | $37,317 | $25,972 | $28,868 | $41,054 | $15,071 | $9,744 | $9,231 | |||||||
Ratio of expenses to average net assets excluding fee waivers and reimbursements | 1.88%(g) | 1.94% | 1.85% | 1.85% | 1.86%(g) | 1.97% | 1.76% | |||||||
Ratio of expenses to average net assets including fee waivers and reimbursements | 1.70%(g) | 1.70% | 1.70% | 1.53%(h) | 1.40%(g) | 1.40% | 1.47% | |||||||
Ratio of net investment income/ (loss) to average net assets | 2.97%(g) | 0.69% | 0.33% | (0.03)% | 0.08%(g) | 1.20% | 0.62% | |||||||
Portfolio turnover | 116% | 221% | 174% | 170% | 110% | 120% | 178% | |||||||
| ||||||||||||||
| (a) | Effective March 9, 2010, the Board approved changing the fiscal year-end of the Fund from July 31 to April 30. |
| (b) | Prior to its reorganization on January 15, 2010, the Clough China Fund was known as the Old Mutual China Fund and Class I was known as the Institutional Class. |
| (c) | Calculated using the average shares method. |
| (d) | Impact of payment by affiliate was less than $0.01 per share and 0.01%, respectively. |
| (e) | Less than $0.005 per share. |
| (f) | Total returns are for the period indicated and have not been annualized. Total returns would have been lower had certain expenses not been waived during the period. Returns shown do not reflect the deduction of taxes that a shareholder would pay on Fund distributions or the redemption of Fund shares. |
| (g) | Annualized. |
| (h) | Contractual expense limitation changed from 1.40% to 1.70% effective January 1, 2011. |
| (i) | Portfolio turnover rate for periods less than one full year have not been annualized. |
See Notes to Financial Statements. |
| 80 | October 31, 2013 |
| October 31, 2013 (Unaudited) | ||
Overview:
We continue to believe the US economic expansion is on a sustainable growth path. As the expansion begins its fifth year, we continue to favor certain indicators, not only as gauges of sustainable growth, but also for clues that the economy may be faltering. Comparing the conditions in 2009 with the most recent data shows that nearly all of our requirements have been fulfilled, but there is still room for improvement for many of them. Since mid-2009, we have monitored ten different conditions that we believed were necessary for a sustainable economic recovery and have revisited this list periodically since that time. Some of the conditions that continue to trend positively and strengthen our assertion for economic expansion include stabilizing/rising home prices, mortgage rates below 5 1⁄2%, falling unemployment rate, Purchasing Managers Index1 (PMIs) above 50, inflation expectations below 3%, and lower leverage for consumers.
As it relates to the markets, we do not believe US equities are currently in a bubble, nor do we think inflation is a current concern. With interest rates so low for so long, increasing leverage in the financial system, and the S&P 500®2 making record highs, some investors are worried about a repeat of the late 1990s or mid-2000s, particularly with the Federal Reserve printing so much money. We disagree. One feature of an asset bubble is that valuations become unanchored from underlying fundamentals, like stock prices and earnings in the late 1990s or house prices in the mid 2000s. While the S&P 500 started making record highs in April, 12-month trailing earnings have been making new highs for two years, justifying record prices, in our view. Given our belief that the US is likely to avoid recession next year and that global economic recovery will continue, we think earnings will rise next year, although estimates of 10% growth look overly optimistic to us.
The Fed’s policy of buying bonds has driven yields so low as to make it unlikely that high-quality bonds will deliver positive real returns over the next several years. Some have suggested that bonds are in a bubble; however, a bubble implies a bust. We believe bond yields will rise from current levels but that the pace will be constrained by short-term rates that are likely to stay at zero for another two years or so. Because a bond is valued primarily for the reliability and amount of its payment stream, an inflation and credit outlook are necessary to evaluate it. We think credit risks for corporate debt are low given record profits and strengthened balance sheets as businesses have used low interest rates to refinance expensive debt. Despite the recent threat of US Treasury default, sovereign credit default markets still rate the US government about as creditworthy as the UK or Australia (although the US had been better than Germany and Switzerland), suggesting investors continue to expect little risk of default. As for inflation that could potentially erode bond investors’ payment streams, headline consumer price inflation has averaged about 2.3% over the last five years.
We believe inflation has remained low despite the Fed’s actions because much of the money created is not being re-circulated through bank lending. As the US economic expansion progresses, inflation risks rise as labor markets improve and lending accelerates. We think the Fed is very aware of this and is willing to become more
restrictive. As a target, the Fed has explicitly stated it would hike rates if inflation were to drift above 2.5%. Although some investors question the Fed’s independence, resolve, and even their choice of inflation measures, we do not believe that they would risk their hard-won inflation-fighting credentials and damage the institution for the sake of short-term political expediency.
Even dovish-leaning Fed members are becoming increasingly vocal about the Fed’s ability to rein in financial market excesses and asset inflation. In July, Governor Sarah Bloom Raskin delivered a speech on ‘The Case for a Harmonized Response to Asset Bubbles’ in which she described many of the Fed’s tools that could have prevented previous bubbles, such as capital and liquidity rules, margin and haircut requirements, and more scrutiny of underwriting procedures. More recently, Governor Jeremy Stein spoke about leaning against financial imbalances, suggesting that, “high financial-sector leverage or very buoyant credit conditions today increase the probability of a sharp upward spike in credit spreads at some later date. Then the policymaker’s risk aversion over unemployment outcomes may make her willing to try to tighten credit conditions, even at the cost of some employment today, so as to reduce the variance of future employment.” Reflecting Stein’s admonition, federal banking regulators recommended banks raise underwriting standards for leveraged commercial loans last week.
Inflation has been through many phases over the last 140 years. ‘Good deflation’ in the late 1800s resulted from the productivity of the Industrial Revolution driving down goods prices. This was in sharp contrast to the deflation that accompanied the Great Depression. Periods of rapid inflation coincided with wars, excessive money creation, the 1970s’ oil price shocks, and the ensuing wage/price spiral. Excluding these episodes, inflation has tended to be in the low single digits. The Fed’s target of 2% to 3% seems attainable to us, despite its bond purchase program, because there is an oversupply of labor globally, and both banks and their customers remain cautious. Our inflation concerns will rise when the recirculation of money picks up due to growing consumer and corporate confidence. While there is no sign of this currently, we incorporate the potential for higher inflation in setting our strategic benchmarks.
Against the backdrop of a positive market outlook, all the RiverFront funds have been positioned in “risk-on” mode. Within the equity portion of the portfolios, we remain overweight developed international with an emphasis on Europe and Japan. Throughout 2013, our Price Matters framework has suggested that developed international was undervalued, but these stocks had lagged relative to the S&P 500 for much of the year as investors were plagued with lingering doubts about the European economic status and whether Japanese economic reform was “real.” However, data from both these regions suggests they are experiencing business expansions in both their manufacturing and services sectors and the equity markets have responded favorably. Within the US, our preference remains in sectors that tend to be higher beta3 such as financials, industrials, and technology. These areas of the US market have also been attractively valued and showed strong relative performance during the period. In addition, all the funds have had an allocation
| 81 | October 31, 2013 |
RiverFront Global Allocation Series | ||
Management Commentary | October 31, 2013 (Unaudited) | |
to US micro cap equities for much of year given that this asset class generally responds well during periods of favorable macro-economic conditions. During the period, the RiverFront risk management discipline forced a review of emerging markets given that we had significantly reduced exposure earlier in the year. Improving data coming out of China resulted in a reversal of momentum within emerging markets stocks. The combination of improving momentum and attractive valuations prompted us to reinvest across all portfolios; however, we remain underweight emerging markets relative to levels determined through our 2013 Capital Market Assumption process. Within emerging markets we have increased our exposure to Asia in countries such as China, Taiwan and Korea – countries with trade surpluses and foreign currency reserves. In the balanced strategies, we continue to be overweight equities relative to fixed income. Interest rates continue to hover near historic lows, and we believe we have marked the end of the 30-year bull market for bonds. In contrast to most equity indices, year-to-date fixed income returns are negative – further eroding investors’ purchasing power and creating considerable opportunity cost. Our current fixed income positioning has our bond maturities at less than three years and includes both short-term investment grade and short-term high yield. Additionally, we have begun to lower our exposure to corporate loans.
Growth Fund Performance Drivers:
The RiverFront Global Allocation Fund and RiverFront Global Growth Fund benefitted during the past six months from the overweight to developed international. In addition to overweights to Europe and Japan, specific country investments in Germany and the UK were positive contributors. The emphasis on high beta as well as the allocation to micro caps were positive contributors. Specific equity sectors that contributed positively included consumer discretionary, health care, industrials and technology.
Even though it was minimal, our cash position was a detractor to performance during the period. Despite the decision to increase our allocation to emerging markets, the underweight relative to the benchmarks created a negative impact to performance.
Balanced Fund Performance Drivers:
Relative to the benchmarks, the RiverFront Conservative Income Builder Fund, RiverFront Dynamic Equity Income Fund and RiverFront Moderate Growth and Income Fund benefitted during the period from the overweight to developed international. In addition to overweights to Europe and Japan, specific country investments in Germany and the UK were also positive contributors. The emphasis on high beta as well as the allocation to micro caps were positive contributors. Specific equity sectors that contributed positively included consumer discretionary, health care, industrials and technology. The overweight to stocks relative to fixed income was also a positive contributor.
After having a strong period of outperformance Master Limited Partnerships (MLPs) have started to lag and this impacted the funds’ performance negatively. We believe MLPs could have a difficult time outperforming in a rising rate environment and recently reduced our position to fund a tactical trade. Within traditional fixed
income, some of the individual positions lagged given their maturities are less than a year out. Finally, despite the decision to increase our allocation to emerging markets, the underweight relative to the composite benchmarks created a negative impact to performance.
Past performance is no guarantee of future results. Dividends are not guaranteed and are subject to change or elimination. Investments in international and emerging markets securities include exposure to risks such as currency fluctuations, foreign taxes and regulations, and the potential for illiquid markets and political instability.
The views and information discussed in this commentary are as of the date of publication, are subject to change, and may not reflect the writer’s current views. The views expressed represent an assessment of market conditions at a specific point in time, are opinions only and should not be relied upon as investment advice regarding a particular investment or markets in general. Such information does not constitute a recommendation to buy or sell specific securities or investment vehicles. It should not be assumed that any investment will be profitable or will equal the performance of the fund(s) or any securities or any sectors mentioned herein. The subject matter contained herein has been derived from several sources believed to be reliable and accurate at the time of compilation. RiverFront Investment Group, LLC does not accept any liability for losses either direct or consequential caused by the use of this information.
| 1 | PMI – An indicator of the economic health of the manufacturing sector. The PMI index is based on five major indicators: new orders, inventory levels, production, supplier deliveries and the employment environment. |
| 2 | Standard & Poor’s (S&P) 500® Index – measures the performance of 500 large cap stocks, which together represent about 75% of the total U.S. equities market. Net total return indices reinvest dividends after the deduction of withholding taxes, using (for international indices) a tax rate applicable to non-resident institutional investors who do not benefit from double taxation treaties. The index is not actively managed and does not reflect any deductions for fees, expenses or taxes. An investor may not invest directly in an index. |
| 3 | Beta – Is the measure of volatility, or systematic risk, of a security or a portfolio in comparison to the market as a whole. Beta is used in the capital asset pricing model (CAPM), a model that calculates the expected return of an asset based on its beta and expected market returns. |
| 82 | October 31, 2013 |
RiverFront Conservative Income Builder Fund | ||
| October 31, 2013 (Unaudited) | ||
Performance of $10,000 Initial Investment (as of October 31, 2013)
Comparison of change in value of a $10,000 investment (includes maximum sales charges of 5.50%)
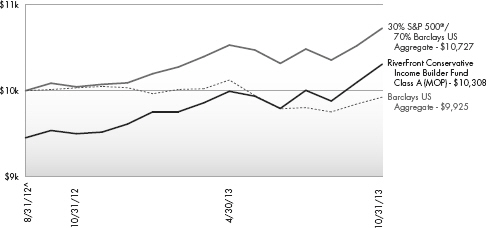
The chart above represents historical performance of a hypothetical investment of $10,000 in the Fund since inception. Past performance does not guarantee future results. This chart does not reflect the deduction of taxes that a shareholder would pay on Fund distributions or the redemption of Fund shares.
Average Annual Total Returns (as of October 31, 2013)
| 1 Year | Since Inception ^ | Total Expense Ratio | What You Pay * | |||||
Class A (NAV)1 | 8.52% | 7.72% | 5.50% | 1.45% | ||||
Class A (MOP)2 | 2.60% | 2.64% | ||||||
Class C (NAV)1 | 7.70% | 6.92% | 6.25% | 2.20% | ||||
Class C (CDSC)2 | 6.70% | 6.92% | ||||||
Class I | 8.67% | 7.94% | 5.25% | 1.20% | ||||
Barclays Capital US Aggregate Bond Index3 | -1.08% | -0.64% | ||||||
30% S&P 500® and 70% Barclays US Aggregate4 | 6.79% | 6.50% |
Performance data quoted represents past performance. Past performance does not guarantee future results. Investment return and principal value of an investment will fluctuate so that an investor’s shares, when sold or redeemed, may be worth more or less than the original cost. Current performance data may be higher or lower than actual data quoted. The Fund imposes a maximum Contingent Deferred Sales Charge (“CDSC”) of 1.00% on Class C shares redeemed within the first 12 months after a purchase, and on Class A shares redeemed within the first 18 months after a purchase in excess of $1 million. Performance data does not reflect the CDSC, which if reflected would reduce the performance quoted. For the most current month-end performance data, please call 1-866-759-5679.
| 83 | October 31, 2013 |
RiverFront Conservative Income Builder Fund | ||
Performance Update | October 31, 2013 (Unaudited) | |
| 1 | Net Asset Value (NAV) is the share price without sales charges. |
| 2 | Maximum Offering Price (MOP) includes sales charges. Class A returns include effects of the Fund’s maximum sales charge of 5.50%; Class C returns include the 1.00% CDSC. |
| 3 | The Barclay’s U.S. Aggregate Bond Index is a broad-based benchmark that measures the investment grade, U.S. dollar-denominated, fixed-rate taxable bond market, including Treasuries, government-related and corporate securities, MBS (agency fixed-rate and hybrid ARM passthroughs), ABS, and CMBS. The index is not actively managed and does not reflect any deductions for fees, expenses or taxes. An investor may not invest directly in an index. |
| 4 | S&P 500® Index - S&P 500® Index is the Standard & Poor’s composite index of 500 stocks, a widely recognized, unmanaged index of common stock prices. |
Barclays Capital U.S. Aggregate Bond Index - An unmanaged index composed of securities from the Barclays Capital Government/Corporate Bond Index, Mortgage-Backed Securities Index and the Asset-Backed Securities Index. Total return comprises price appreciation/depreciation and income as a percentage of the original investment. Indices are rebalanced monthly by market capitalization. The index is not actively managed and does not reflect any deductions for fees, expenses or taxes. An investor may not invest directly in an index. |
| ^ | Fund inception date of August 31, 2012. The Fund commenced operations September 4, 2012. |
| * | What You Pay reflects the Advisor’s and Sub-Advisor’s decision to contractually limit expenses through August 31, 2014. Please see the prospectus for additional information. |
The table does not reflect the deduction of taxes that a shareholder would pay on Fund distributions or the redemption of Fund shares.
This Fund is not suitable for all investors. Subject to investment risks, including possible loss of the principal amount invested.
There is no guarantee that the Fund will continue to hold any one particular security or stay invested in any one particular company. The composition of the Fund’s top holdings is subject to change. Performance figures are historical and reflect the change in share price, reinvested distributions, changes in net asset value, sales charges and capital gains distributions, if any.
Mutual funds are not insured or guaranteed by the FDIC or by any other government agency or government sponsored agency of the federal government or any state, not deposits, obligations or guaranteed by any bank or its affiliates and are subject to investment risks, including possible loss of the principal amount invested.
Top Ten Holdings (as a % of Net Assets) †
Vanguard® Short-Term Corporate Bond ETF | 15.78% | |||
iShares® Barclays 1-3 Year Credit Bond Fund | 14.70% | |||
PIMCO 0-5 Year High Yield Corporate Bond Index ETF | 9.47% | |||
SPDR® Barclays Short Term High Yield Bond ETF | 9.43% | |||
Vanguard® FTSE® Europe ETF | 5.65% | |||
PowerShares® S&P 500® High Beta Port ETF | 5.08% | |||
WisdomTree® LargeCap Dividend Fund | 3.42% | |||
PowerShares® Senior Loan Portfolio | 2.89% | |||
FlexShares Quality Dividend Index Fund | 2.80% | |||
iShares® MSCI EAFE Index Fund | 2.13% | |||
Top Ten Holdings | 71.35% |
| † | Holdings are subject to change. Table presents indicative values only. |
Portfolio Composition (as a % of Net Assets)
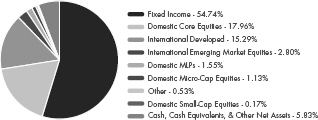
| 84 | October 31, 2013 |
RiverFront Dynamic Equity Income Fund | ||
Performance Update | October 31, 2013 (Unaudited) | |
Performance of $10,000 Initial Investment (as of October 31, 2013)
Comparison of change in value of a $10,000 investment (includes maximum sales charges of 5.50%)
The chart above represents historical performance of a hypothetical investment of $10,000 in the Fund since inception. Past performance does not guarantee future results. This chart does not reflect the deduction of taxes that a shareholder would pay on Fund distributions or the redemption of Fund shares.
The MSCI ACWI replaced the S&P 500® Index as the Fund’s primary index because it better reflects the Fund’s portfolio. The MSCI ACWI is a free float-adjusted market capitalization weighted index that is designed to measure the equity market performance of developed and emerging markets.
The MSCI ACWI consists of 45 country indices comprising 24 developed and 21 emerging market country indices. The index includes reinvestment of dividends, net of foreign withholding taxes.
Average Annual Total Returns (as of October 31, 2013)
| 1 Year | 3 Years | Since Inception ^ | Total Expense Ratio | What You Pay * | ||||||
Class A (NAV)1 | 17.23% | 8.49% | 9.84% | 1.84% | 1.43% | |||||
Class A (MOP)2 | 10.82% | 6.46% | 7.95% | |||||||
Class C (NAV)1 | 16.40% | 7.70% | 9.04% | 2.59% | 2.18% | |||||
Class C (CDSC)2 | 15.40% | 7.70% | 9.04% | |||||||
Class I | 17.66% | 8.81% | 10.14% | 1.59% | 1.18% | |||||
MSCI All Country World Index3 | 23.29% | 10.36% | 11.84% | |||||||
70% ACWI and 30% Barclays US Aggregate3,4 | 15.52% | 8.37% | 9.54% |
Performance data quoted represents past performance. Past performance does not guarantee future results. Investment return and principal value of an investment will fluctuate so that an investor’s shares, when sold or redeemed, may be worth more or less than the original cost. Current performance data may be higher or lower than actual data quoted. The Fund imposes a maximum Contingent Deferred Sales Charge (“CDSC”) of 1.00% on Class C shares redeemed within the first 12 months after a purchase, and on Class A shares redeemed within the first 18 months after a purchase in excess of $1 million. Performance data does not reflect the CDSC, which if reflected would reduce the performance quoted. For the most current month-end performance data, please call 1-866-759-5679.
| 85 | October 31, 2013 |
RiverFront Dynamic Equity Income Fund | ||
Performance Update | October 31, 2013 (Unaudited) | |
| 1 | Net Asset Value (NAV) is the share price without sales charges. |
| 2 | Maximum Offering Price (MOP) includes sales charges. Class A returns include effects of the Fund’s maximum sales charge of 5.50%; Class C returns include the 1.00% CDSC. |
| 3 | The MSCI ACWI is a free float-adjusted market capitalization weighted index that is designed to measure the equity market performance of developed and emerging markets. The MSCI ACWI consists of 45 country indices comprising 24 developed and 21 emerging market country indices. The index includes reinvestment of dividends, net of foreign withholding taxes. The index is not actively managed and does not reflect any deductions for fees, expenses or taxes. An investor may not invest directly in an index. |
| 4 | An unmanaged index composed of securities from the Barclays Capital Government/Corporate Bond Index, Mortgage-Backed Securities Index and the Asset-Backed Securities Index. Total return comprises price appreciation/depreciation and income as a percentage of the original investment. Indices are rebalanced monthly by market capitalization. The index is not actively managed and does not reflect any deductions for fees, expenses or taxes. An investor may not invest directly in an index. |
| ^ | Fund inception date of August 2, 2010. |
| * | What You Pay reflects the Advisor’s and Sub-Advisor’s decision to contractually limit expenses through August 31, 2014. Please see the prospectus for additional information. |
The table does not reflect the deduction of taxes that a shareholder would pay on Fund distributions or the redemption of Fund shares.
This Fund is not suitable for all investors. Subject to investment risks, including possible loss of the principal amount invested.
There is no guarantee that the Fund will continue to hold any one particular security or stay invested in any one particular company. The composition of the Fund’s top holdings is subject to change. Performance figures are historical and reflect the change in share price, reinvested distributions, changes in net asset value, sales charges and capital gains distributions, if any.
Mutual funds are not insured or guaranteed by the FDIC or by any other government agency or government sponsored agency of the federal government or any state, not deposits, obligations or guaranteed by any bank or its affiliates and are subject to investment risks, including possible loss of the principal amount invested.
Top Ten Holdings (as a % of Net Assets) †
|
| Portfolio Composition (as a % of Net Assets)
| ||||||
WisdomTree® LargeCap Dividend Fund | 15.84 | % |
| |||||
PowerShares® S&P 500® High Beta Port ETF | 11.22 | % | ||||||
Vanguard® FTSE® Europe ETF | 11.05 | % | ||||||
iShares® MSCI EAFE Index Fund | 6.53 | % | ||||||
PIMCO 0-5 Year High Yield Corporate Bond Index ETF | 6.44 | % | ||||||
SPDR® Barclays Short Term High Yield Bond ETF | 6.41 | % | ||||||
iShares® MSCI All Country Asia ex Japan Index Fund | 3.64 | % | ||||||
iShares® MSCI Japan Index Fund | 3.49 | % | ||||||
WisdomTree® Japan Hedged Equity | 3.09 | % | ||||||
iShares® MSCI EMU Index Fund | 2.77 | % | ||||||
Top Ten Holdings | 70.48 | % | ||||||
† Holdings are subject to change. Table presents indicative values only. | ||||||||
| 86 | October 31, 2013 |
RiverFront Global Allocation Fund | ||
Performance Update | October 31, 2013 (Unaudited) | |
Performance of $10,000 Initial Investment (as of October 31, 2013)
Comparison of change in value of a $10,000 investment (includes maximum sales charges of 5.50%)
The chart above represents historical performance of a hypothetical investment of $10,000 in the Fund since inception. Past performance does not guarantee future results. This chart does not reflect the deduction of taxes that a shareholder would pay on Fund distributions or the redemption of Fund shares.
The MSCI ACWI replaced the S&P 500® Index as the Fund’s primary index because it better reflects the Fund’s portfolio. The MSCI ACWI is a free float-adjusted market capitalization weighted index that is designed to measure the equity market performance of developed and emerging markets.
The MSCI ACWI consists of 45 country indices comprising 24 developed and 21 emerging market country indices. The index includes reinvestment of dividends, net of foreign withholding taxes.
Average Annual Total Returns (as of October 31, 2013)
| 1 Year | 3 Years | Since Inception ^ | Total Expense Ratio | What You Pay * | ||||||
Class A (NAV)1 | 19.54% | 7.81% | 9.04% | 1.95% | 1.43% | |||||
Class A (MOP)2 | 12.94% | 5.78% | 7.16% | |||||||
Class C (NAV)1 | 18.74% | 6.99% | 8.25% | 2.70% | 2.18% | |||||
Class C (CDSC)2 | 17.74% | 6.99% | 8.25% | |||||||
Class I (NAV)1 | 19.96% | 8.06% | 9.30% | 1.70% | 1.18% | |||||
MSCI All Country World Index3 | 23.29% | 10.36% | 11.84% | |||||||
80% ACWI and 20% Barclays US Aggregate3,4 | 18.06% | 9.05% | 10.33% |
Performance data quoted represents past performance. Past performance does not guarantee future results. Investment return and principal value of an investment will fluctuate so that an investor’s shares, when sold or redeemed, may be worth more or less than the original cost. Current performance data may be higher or lower than actual data quoted. The Fund imposes a maximum Contingent Deferred Sales Charge (“CDSC”) of 1.00% on Class C shares redeemed within the first 12 months after a purchase, and on Class A shares redeemed within the first 18 months after a purchase in excess of $1 million. Performance data does not reflect the CDSC, which if reflected would reduce the performance quoted. For the most current month-end performance data, please call 1-866-759-5679.
| 87 | October 31, 2013 |
RiverFront Global Allocation Fund | ||
Performance Update | October 31, 2013 (Unaudited) | |
| 1 | Net Asset Value (NAV) is the share price without sales charges. |
| 2 | Maximum Offering Price (MOP) includes sales charges. Class A returns include effects of the Fund’s maximum sales charge of 5.50%; Class C returns include the 1.00% CDSC. |
| 3 | The MSCI ACWI is a free float-adjusted market capitalization weighted index that is designed to measure the equity market performance of developed and emerging markets. The MSCI ACWI consists of 45 country indices comprising 24 developed and 21 emerging market country indices. The index includes reinvestment of dividends, net of foreign withholding taxes. The index is not actively managed and does not reflect any deductions for fees, expenses or taxes. An investor may not invest directly in an index. |
| 4 | An unmanaged index composed of securities from the Barclays Capital Government/Corporate Bond Index, Mortgage-Backed Securities Index and the Asset-Backed Securities Index. Total return comprises price appreciation/depreciation and income as a percentage of the original investment. Indices are rebalanced monthly by market capitalization. The index is not actively managed and does not reflect any deductions for fees, expenses or taxes. An investor may not invest directly in an index. |
| ^ | Fund inception date of August 2, 2010. |
| * | What You Pay reflects the Advisor’s and Sub-Advisor’s decision to contractually limit expenses through August 31, 2014. Please see the prospectus for additional information. |
The table does not reflect the deduction of taxes that a shareholder would pay on Fund distributions or the redemption of Fund shares.
This Fund is not suitable for all investors. Subject to investment risks, including possible loss of the principal amount invested.
There is no guarantee that the Fund will continue to hold any one particular security or stay invested in any one particular company. The composition of the Fund’s top holdings is subject to change. Performance figures are historical and reflect the change in share price, reinvested distributions, changes in net asset value, sales charges and capital gains distributions, if any.
Mutual funds are not insured or guaranteed by the FDIC or by any other government agency or government sponsored agency of the federal government or any state, not deposits, obligations or guaranteed by any bank or its affiliates and are subject to investment risks, including possible loss of the principal amount invested.
Top Ten Holdings (as a % of Net Assets) †
|
| Portfolio Composition (as a % of Net Assets)
| ||||||
PowerShares® S&P 500® High Beta Port ETF | 11.41 | % |
| |||||
Vanguard® FTSE® Europe ETF | 9.16 | % | ||||||
iShares® MSCI EAFE Index Fund | 7.13 | % | ||||||
iShares® MSCI All Country Asia ex Japan Index Fund | 5.65 | % | ||||||
Vanguard® Large-Cap ETF | 5.05 | % | ||||||
iShares® MSCI Japan Index Fund | 4.20 | % | ||||||
Vanguard® MSCI EAFE ETF | 4.06 | % | ||||||
iShares® MSCI EMU Index Fund | 3.81 | % | ||||||
WisdomTree® Japan Hedged Equity Fund | 3.16 | % | ||||||
Wilshire Micro-Cap ETF | 2.50 | % | ||||||
Top Ten Holdings | 56.13 | % | ||||||
† Holdings are subject to change. Table presents indicative values only. |
| |||||||
| 88 | October 31, 2013 |
RiverFront Global Growth Fund | ||
Performance Update | October 31, 2013 (Unaudited) | |
Performance of $10,000 Initial Investment (as of October 31, 2013)
Comparison of change in value of a $10,000 investment (includes maximum sales charges of 5.50%)
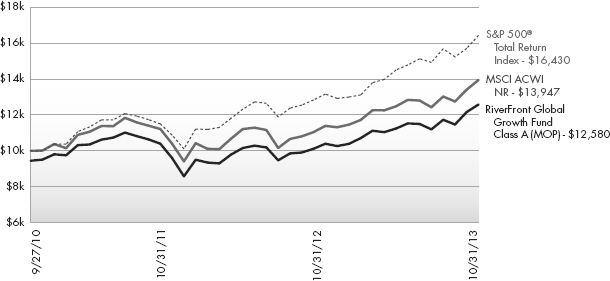
The chart above represents historical performance of a hypothetical investment of $10,000 in the Fund since inception. Past performance does not guarantee future results. This chart does not reflect the deduction of taxes that a shareholder would pay on Fund distributions or the redemption of Fund shares.
The MSCI ACWI replaced the S&P 500® Index as the Fund’s primary index because it better reflects the Fund’s portfolio. The MSCI ACWI is a free float-adjusted market capitalization weighted index that is designed to measure the equity market performance of developed and emerging markets.
The MSCI ACWI consists of 45 country indices comprising 24 developed and 21 emerging market country indices. The index includes reinvestment of dividends, net of foreign withholding taxes.
Average Annual Total Returns (as of October 31, 2013)
| 1 Year | 5 Years | Since Inception ^ | Total Expense Ratio | What You Pay * | ||||||
Class A (NAV)1 | 22.56% | 11.17% | 12.96% | 1.75% | 1.42% | |||||
Class A (MOP)2 | 15.85% | 9.92% | 11.69% | |||||||
Class C (NAV)1 | 21.66% | 10.37% | 12.14% | 2.50% | 2.17% | |||||
Class C (CDSC)2 | 20.66% | 10.37% | 12.14% | |||||||
Class I (NAV)1 | 22.82% | 11.44% | 13.23% | 1.50% | 1.17% | |||||
Class L (NAV)1, 3 | 22.91% | 11.44% | 13.23% | 1.50% | 1.17% | |||||
Investor (NAV)2 | 22.52% | 11.14% | 12.93% | 1.75% | 1.42% | |||||
S&P 500® Total Return Index4 | 27.18% | 15.17% | 15.83% | |||||||
MSCI All Country World Index5 | 23.29% | 13.47% | 15.24% |
Performance data quoted represents past performance. Past performance does not guarantee future results. Investment return and principal value of an investment will fluctuate so that an investor’s shares, when sold or redeemed, may be worth more or less than the original cost. Current performance data may be higher or lower than actual data quoted. The Fund imposes a maximum Contingent Deferred Sales Charge (“CDSC”) of 1.00% on Class C shares redeemed within the first 12 months after a purchase, and on Class A shares redeemed within the first 18 months after a purchase in excess of $1 million. Performance data does not reflect the CDSC, which if reflected would reduce the performance quoted. For the most current month-end performance data, please call 1-866-759-5679.
| 89 | October 31, 2013 |
RiverFront Global Growth Fund | ||
Performance Update | October 31, 2013 (Unaudited) | |
| 1 | Net Asset Value (NAV) is the share price without sales charges. |
| 2 | Maximum Offering Price (MOP) includes sales charges. Class A returns include effects of the Fund’s maximum sales charge of 5.50%; Class C returns include the 1.00% CDSC. |
| 3 | Prior to close of business on September 24, 2010, Class L was known as Institutional Class of the Baird Funds, Inc. - RiverFront Long-Term Growth Fund. |
| 4 | S&P 500® Total Return Index is the Standard & Poor’s composite index of 500 stocks, a widely recognized, unmanaged index of common stock prices. The index is not actively managed and does not reflect any deduction for fees, expenses or taxes. An investor may not invest directly in an index. |
| 5 | The MSCI ACWI is a free float-adjusted market capitalization weighted index that is designed to measure the equity market performance of developed and emerging markets. The MSCI ACWI consists of 45 country indices comprising 24 developed and 21 emerging market country indices. The index includes reinvestment of dividends, net of foreign withholding taxes. The index is not actively managed and does not reflect any deductions for fees, expenses or taxes. An investor may not invest directly in an index. |
| ^ | Fund inception date of October 28, 2008. |
| * | What You Pay reflects the Advisor’s and Sub-Advisor’s decision to contractually limit expenses through August 31, 2014. Please see the prospectus for additional information. |
The Class A, C, I and L shares performance shown for periods prior to September 27, 2010 reflects the performance of the Baird Funds, Inc. – RiverFront Long-Term Growth Fund’s Institutional Class shares (as result of the reorganization of the Baird Funds, Inc. – RiverFront Long-Term Growth Fund into the Fund).
The Investor Class performance shown for periods prior to September 27, 2010 reflects the performance of the Baird Funds, Inc. – RiverFront Long-Term Growth Fund’s Investor Class shares (as result of the reorganization of the Baird Funds, Inc. – RiverFront Long-Term Growth Fund into the Fund).
The table does not reflect the deduction of taxes that a shareholder would pay on Fund distributions or the redemption of Fund shares.
This Fund is not suitable for all investors. Subject to investment risks, including possible loss of the principal amount invested.
There is no guarantee that the Fund will continue to hold any one particular security or stay invested in any one particular company. The composition of the Fund’s top holdings is subject to change. Performance figures are historical and reflect the change in share price, reinvested distributions, changes in net asset value, sales charges and capital gains distributions, if any.
Mutual funds are not insured or guaranteed by the FDIC or by any other government agency or government sponsored agency of the federal government or any state, not deposits, obligations or guaranteed by any bank or its affiliates and are subject to investment risks, including possible loss of the principal amount invested.
Top Ten Holdings (as a % of Net Assets) †
|
| Portfolio Composition (as a % of Net Assets)
| ||||||
Vanguard® FTSE® Europe ETF | 12.49 | % |
| |||||
PowerShares® S&P 500® High Beta Port ETF | 12.41 | % | ||||||
iShares® MSCI All Country Asia ex Japan IndexFund | 6.56 | % | ||||||
iShares® MSCI EAFEIndex Fund | 4.57 | % | ||||||
iShares® MSCI EMU Index Fund | 4.53 | % | ||||||
iShares® MSCI JapanIndex Fund | 4.51 | % | ||||||
Vanguard® MSCI EAFEETF | 4.33 | % | ||||||
WisdomTree® Japan Hedged Equity Fund | 4.09 | % | ||||||
Vanguard® Large-Cap ETF | 2.77 | % | ||||||
Wilshire Micro-Cap ETF | 2.76 | % | ||||||
Top Ten Holdings | 59.02 | % | ||||||
† Holdings are subject to change. Table presents indicative values only. |
| |||||||
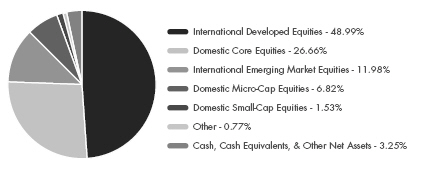
| 90 | October 31, 2013 |
RiverFront Moderate Growth & Income Fund | ||
Performance Update | October 31, 2013 (Unaudited) | |
Performance of $10,000 Initial Investment (as of October 31, 2013)
Comparison of change in value of a $10,000 investment (includes maximum sales charges of 5.50%)
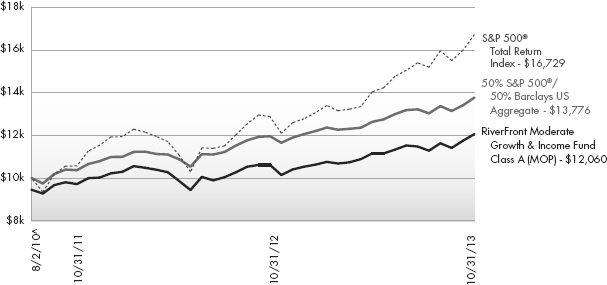
The chart above represents historical performance of a hypothetical investment of $10,000 in the Fund since inception. Past performance does not guarantee future results. This chart does not reflect the deduction of taxes that a shareholder would pay on Fund distributions or the redemption of Fund shares.
Average Annual Total Returns (as of October 31, 2013)
| 1 Year | 3 Years | Since Inception ^ | Total Expense Ratio | What You Pay * | ||||||
Class A (NAV)1 | 12.93% | 7.16% | 7.79% | 1.65% | 1.41% | |||||
Class A (MOP)2 | 6.68% | 5.17% | 5.94% | |||||||
Class C (NAV)1 | 12.05% | 6.34% | 7.00% | 2.40% | 2.16% | |||||
Class C (CDSC)2 | 11.05% | 6.34% | 7.00% | |||||||
Class I (NAV)1 | 13.10% | 7.40% | 8.06% | 1.40% | 1.16% | |||||
S&P 500® Total Return Index3 | 27.18% | 16.56% | 17.17% | |||||||
50% S&P 500® and 50% Barclays US Aggregate3,4 | 12.32% | 9.83% | 10.70% |
Performance data quoted represents past performance. Past performance does not guarantee future results. Investment return and principal value of an investment will fluctuate so that an investor’s shares, when sold or redeemed, may be worth more or less than the original cost. Current performance data may be higher or lower than actual data quoted. The Fund imposes a maximum Contingent Deferred Sales Charge (“CDSC”) of 1.00% on Class C shares redeemed within the first 12 months after a purchase, and on Class A shares redeemed within the first 18 months after a purchase in excess of $1 million. Performance data does not reflect the CDSC, which if reflected would reduce the performance quoted. For the most current month-end performance data, please call 1-866-759-5679.
| 1 | Net Asset Value (NAV) is the share price without sales charges. |
| 2 | Maximum Offering Price (MOP) includes sales charges. Class A returns include effects of the Fund’s maximum sales charge of 5.50%; Class C returns include the 1.00% CDSC. |
| 3 | S&P 500® Total Return Index is the Standard & Poor’s composite index of 500 stocks, a widely recognized, unmanaged index of common stock prices. The index is not actively managed and does not reflect any deduction for fees, expenses or taxes. An investor may not invest directly in an index. |
| 4 | An unmanaged index composed of securities from the Barclays Capital Government/Corporate Bond Index, Mortgage-Backed Securities Index and the Asset-Backed Securities Index. Total return comprises price appreciation/depreciation and income as a percentage of the original |
| 91 | October 31, 2013 |
RiverFront Moderate Growth & Income Fund | ||
Performance Update | October 31, 2013 (Unaudited) | |
investment. Indices are rebalanced monthly by market capitalization. The index is not actively managed and does not reflect any deduction for fees, expenses or taxes. An investor may not invest directly in an index. |
| ^ | Fund inception date of August 2, 2010. |
| * | What You Pay reflects the Advisor’s and Sub-Advisor’s decision to contractually limit expenses through August 31, 2014. Please see the prospectus for additional information. |
The table does not reflect the deduction of taxes that a shareholder would pay on Fund distributions or the redemption of Fund shares.
This Fund is not suitable for all investors. Subject to investment risks, including possible loss of the principal amount invested.
There is no guarantee that the Fund will continue to hold any one particular security or stay invested in any one particular company. The composition of the Fund’s top holdings is subject to change. Performance figures are historical and reflect the change in share price, reinvested distributions, changes in net asset value, sales charges and capital gains distributions, if any.
Mutual funds are not insured or guaranteed by the FDIC or by any other government agency or government sponsored agency of the federal government or any state, not deposits, obligations or guaranteed by any bank or its affiliates and are subject to investment risks, including possible loss of the principal amount invested.
Top Ten Holdings (as a % of Net Assets) †
|
| Portfolio Composition (as a % of Net Assets) | ||||||
WisdomTree® LargeCap Dividend Fund | 9.64 | % |
| |||||
Vanguard® Short-Term Corporate Bond ETF | 8.65 | % | ||||||
PowerShares® S&P 500® High Beta Port ETF | 8.04 | % | ||||||
Vanguard® FTSE® Europe ETF | 7.11 | % | ||||||
PIMCO 0-5 Year High Yield Corporate Bond Index ETF | 7.09 | % | ||||||
SPDR® Barclays Short Term High Yield Bond ETF | 7.05 | % | ||||||
iShares® Barclays 1-3 Year Credit Bond Fund | 7.04 | % | ||||||
iShares® MSCI All Country Asia ex Japan Index Fund | 4.92 | % | ||||||
FlexShares Quality Dividend Index Fund | 3.66 | % | ||||||
iShares® MSCI Japan Index Fund | 2.87 | % | ||||||
Top Ten Holdings | 66.07 | % | ||||||
† Holdings are subject to change. Table presents indicative values only. |
| |||||||
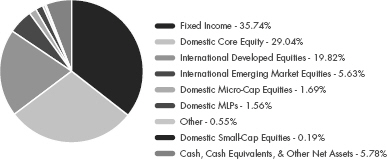
| 92 | October 31, 2013 |
RiverFront Conservative Income Builder Fund | ||
| October 31, 2013 (Unaudited) | ||
| Shares | Value (Note 2) | |||||||
| ||||||||
COMMON STOCKS (3.90%) | ||||||||
Communications (0.51%) | ||||||||
Media (0.51%) | ||||||||
The Walt Disney Co. | 344 | $ | 23,595 | |||||
|
| |||||||
TOTAL COMMUNICATIONS | 23,595 | |||||||
|
| |||||||
Consumer, Cyclical (1.09%) | ||||||||
Retail (1.09%) | ||||||||
CVS Caremark Corp. | 374 | 23,285 | ||||||
Dollar Tree, Inc.(a) | 472 | 27,565 | ||||||
|
| |||||||
| 50,850 | ||||||||
|
| |||||||
TOTAL CONSUMER, CYCLICAL |
| 50,850 | ||||||
|
| |||||||
Consumer, Non-Cyclical (1.21%) |
| |||||||
Cosmetics/Personal Care (0.50%) |
| |||||||
Colgate-Palmolive Co. | 357 | 23,109 | ||||||
|
| |||||||
Pharmaceuticals (0.71%) | ||||||||
Abbott Laboratories | 908 | 33,187 | ||||||
|
| |||||||
TOTAL CONSUMER, NON-CYCLICAL |
| 56,296 | ||||||
|
| |||||||
Financials (0.51%) | ||||||||
Diversified Financial Services (0.51%) |
| |||||||
Discover Financial Services | 462 | 23,969 | ||||||
|
| |||||||
TOTAL FINANCIALS | 23,969 | |||||||
|
| |||||||
Industrials (0.58%) | ||||||||
Electronics (0.58%) | ||||||||
Agilent Technologies, Inc. | 531 | 26,953 | ||||||
|
| |||||||
TOTAL INDUSTRIALS | 26,953 | |||||||
|
| |||||||
TOTAL COMMON STOCKS (Cost $169,164) | 181,663 | |||||||
|
| |||||||
EXCHANGE TRADED FUNDS (90.92%) |
| |||||||
Debt (55.72%) | ||||||||
iShares® Barclays 1-3 Year Credit Bond Fund | 6,494 | 684,727 | ||||||
iShares® iBoxx $ High Yield Corporate Bond Fund | 487 | 45,486 | ||||||
PIMCO 0-5 Year High Yield Corporate Bond Index ETF | 4,158 | 441,039 | ||||||
PowerShares® Senior Loan Portfolio | 5,420 | 134,579 | ||||||
Riverfront Strategic Income Fund(a) | 2,799 | 69,919 | ||||||
SPDR® Barclays Capital High Yield Bond ETF | 1,117 | 45,384 | ||||||
| Shares | Value (Note 2) | |||||||
| ||||||||
Debt (continued) | ||||||||
SPDR® Barclays Short Term High Yield Bond ETF | 14,237 | $ | 439,354 | |||||
Vanguard® Short-Term Corporate Bond ETF | 9,180 | 735,226 | ||||||
|
| |||||||
| 2,595,714 | ||||||||
|
| |||||||
Equity (35.20%) | ||||||||
FlexShares Quality Dividend Index Fund | 4,049 | 130,459 | ||||||
Global X MLP & Energy Infrastructure ETF(a) | 1,512 | 23,784 | ||||||
Guggenheim Insider Sentiment ETF | 521 | 23,112 | ||||||
iShares® MSCI All Country Asia ex Japan Index Fund | 1,528 | 92,001 | ||||||
iShares® MSCI Canada Index Fund | 1,197 | 35,156 | ||||||
iShares® MSCI EAFE Index Fund | 1,504 | 99,083 | ||||||
iShares® MSCI EAFE Value ETF | 856 | 48,432 | ||||||
iShares® MSCI EMU Index Fund | 2,108 | 83,856 | ||||||
iShares® MSCI Japan Index Fund | 7,613 | 90,595 | ||||||
iShares® MSCI United Kingdom Index Fund | 941 | 19,149 | ||||||
PowerShares® Buyback Achievers Portfolio | 1,723 | 70,298 | ||||||
PowerShares® FTSE® RAFI Developed Markets ex-U.S. Portfolio | 1,159 | 50,069 | ||||||
PowerShares® S&P 500® High Beta Port ETF | 8,293 | 236,848 | ||||||
SPDR® S&P® Insurance ETF | 505 | 30,204 | ||||||
Vanguard® FTSE® Emerging Markets ETF | 972 | 40,698 | ||||||
Vanguard® FTSE® Europe ETF | 4,636 | 263,232 | ||||||
Vanguard® Industrials ETF | 756 | 70,815 | ||||||
Vanguard® Information Technology ETF | 445 | 37,224 | ||||||
WisdomTree® Japan SmallCap Dividend Fund | 683 | 35,086 | ||||||
WisdomTree® LargeCap Dividend Fund | 2,490 | 159,534 | ||||||
|
| |||||||
| 1,639,635 | ||||||||
|
| |||||||
TOTAL EXCHANGE TRADED FUNDS (Cost $4,067,259) |
| 4,235,349 | ||||||
|
| |||||||
| 93 | October 31, 2013 |
RiverFront Conservative Income Builder Fund | ||
Statement of Investments | October 31, 2013 (Unaudited) | |
| Shares | Value (Note 2) | |||||||||||
| ||||||||||||
EXCHANGE TRADED NOTES (1.07%) |
| |||||||||||
Equity (1.07%) | ||||||||||||
Credit Suisse Cushing® 30 MLP Index ETN |
| 1,616 | $ | 49,821 | ||||||||
|
| |||||||||||
TOTAL EXCHANGE TRADED NOTES (Cost $41,608) |
| 49,821 | ||||||||||
|
| |||||||||||
7-Day Yield | Shares | Value (Note 2) | ||||||||||
| ||||||||||||
SHORT TERM INVESTMENTS (5.92%) |
| |||||||||||
Money Market Fund (5.92%) |
| |||||||||||
Dreyfus Cash Management Fund, Institutional Class | 0.040 | % | 275,765 | 275,765 | ||||||||
|
| |||||||||||
TOTAL SHORT TERM INVESTMENTS (Cost $275,765) |
| 275,765 | ||||||||||
|
| |||||||||||
TOTAL INVESTMENTS (101.81%) (Cost $4,553,796) |
| $ | 4,742,598 | |||||||||
Liabilities In Excess Of Other |
| (84,251) | ||||||||||
|
| |||||||||||
NET ASSETS (100.00%) |
| $ | 4,658,347 | |||||||||
|
| |||||||||||
| (a) | Non-Income Producing Security. |
Common Abbreviations:
EAFE - Europe, Australia, and Far East.
EMU - European Monetary Union.
ETF - Exchange Traded Fund.
ETN - Exchange Traded Note.
FTSE - Financial Times and the London Stock Exchange.
MLP - Master Limited Partnership.
MSCI - Morgan Stanley Capital International.
RAFI - Research Affiliates Fundamental Index.
S&P - Standard and Poor’s.
SPDR - Standard and Poor’s Depositary Receipt.
For Fund compliance purposes, the Fund’s industry classifications refer to any one or more of the industry sub-classifications used by one or more widely recognized market indexes or ratings group indexes, and/or as defined by Fund management. This definition may not apply for purposes of this report, which may combine industry sub-classifications for reporting ease. Industries are shown as a percent of net assets.
See Notes to Financial Statements.
| 94 | October 31, 2013 |
RiverFront Dynamic Equity Income Fund | ||
Statement of Investments | October 31, 2013 (Unaudited) | |
| Shares | Value (Note 2) | |||||||
| ||||||||
COMMON STOCKS (4.99%) |
| |||||||
Communications (0.71%) | ||||||||
Media (0.71%) | ||||||||
The Walt Disney Co. | 4,745 | $ | 325,460 | |||||
|
| |||||||
TOTAL COMMUNICATIONS |
| 325,460 | ||||||
|
| |||||||
Consumer, Cyclical (1.49%) | ||||||||
Retail (1.49%) | ||||||||
CVS Caremark Corp. | 5,167 | 321,698 | ||||||
Dollar Tree, Inc.(a) | 6,186 | 361,262 | ||||||
|
| |||||||
| 682,960 | ||||||||
|
| |||||||
TOTAL CONSUMER, CYCLICAL |
| 682,960 | ||||||
|
| |||||||
Consumer, Non-Cyclical (1.41%) |
| |||||||
Cosmetics/Personal Care (0.70%) |
| |||||||
Colgate-Palmolive Co. | 4,930 | 319,119 | ||||||
|
| |||||||
Pharmaceuticals (0.71%) | ||||||||
Abbott Laboratories | 8,879 | 324,527 | ||||||
|
| |||||||
TOTAL CONSUMER, NON-CYCLICAL |
| 643,646 | ||||||
|
| |||||||
Financials (0.60%) | ||||||||
Diversified Financial Services (0.60%) |
| |||||||
Discover Financial Services | 5,263 | 273,044 | ||||||
|
| |||||||
TOTAL FINANCIALS | 273,044 | |||||||
|
| |||||||
Industrials (0.78%) | ||||||||
Electronics (0.78%) | ||||||||
Agilent Technologies, Inc. | 7,020 | 356,335 | ||||||
|
| |||||||
TOTAL INDUSTRIALS | 356,335 | |||||||
|
| |||||||
TOTAL COMMON STOCKS (Cost $2,134,084) | 2,281,445 | |||||||
|
| |||||||
EXCHANGE TRADED FUNDS (91.02%) |
| |||||||
Debt (16.27%) | ||||||||
PIMCO 0-5 Year High Yield Corporate Bond Index ETF | 27,754 | 2,943,867 | ||||||
PowerShares® Senior Loan Portfolio | 35,162 | 873,073 | ||||||
Riverfront Strategic Income Fund(a) | 27,639 | 690,422 | ||||||
SPDR® Barclays Short Term High Yield Bond ETF | 94,930 | 2,929,540 | ||||||
|
| |||||||
| 7,436,902 | ||||||||
|
| |||||||
| Shares | Value (Note 2) | |||||||
| ||||||||
Equity (74.75%) | ||||||||
FlexShares Quality Dividend Index Fund | 21,410 | $ | 689,830 | |||||
Global X MLP & Energy Infrastructure ETF(a) | 14,662 | 230,633 | ||||||
Guggenheim Insider Sentiment ETF | 6,179 | 274,100 | ||||||
iShares® Core MSCI Emerging Markets ETF | 13,528 | 685,058 | ||||||
iShares® MSCI All Country Asia ex Japan Index Fund | 27,640 | 1,664,204 | ||||||
iShares® MSCI Canada Index Fund | 14,102 | 414,176 | ||||||
iShares® MSCI EAFE Index Fund | 45,281 | 2,983,112 | ||||||
iShares® MSCI EAFE Value ETF | 8,281 | 468,539 | ||||||
iShares® MSCI Emerging Markets Index Fund | 6,923 | 293,951 | ||||||
iShares® MSCI EMU Index Fund | 31,857 | 1,267,272 | ||||||
iShares® MSCI Japan Index Fund | 134,153 | 1,596,421 | ||||||
iShares® MSCI Pacific ex-Japan Index Fund | 14,979 | 744,756 | ||||||
iShares® MSCI South Korea Capped ETF | 5,056 | 323,129 | ||||||
PowerShares® Buyback Achievers Portfolio | 18,254 | 744,763 | ||||||
PowerShares® FTSE® RAFI Developed Markets ex-U.S. Portfolio | 24,026 | 1,037,923 | ||||||
PowerShares® S&P 500® High Beta Port ETF | 179,542 | 5,127,720 | ||||||
SPDR® S&P® Insurance ETF | 4,766 | 285,054 | ||||||
Vanguard® FTSE® Europe ETF | 88,946 | 5,050,354 | ||||||
Vanguard® Industrials ETF | 7,447 | 697,561 | ||||||
Vanguard® Information Technology ETF | 5,976 | 499,892 | ||||||
WisdomTree® Japan Hedged Equity Fund | 29,588 | 1,410,756 | ||||||
WisdomTree® Japan SmallCap Dividend Fund | 8,703 | 447,073 | ||||||
WisdomTree® LargeCap Dividend Fund | 113,004 | 7,240,166 | ||||||
|
| |||||||
| 34,176,443 | ||||||||
|
| |||||||
TOTAL EXCHANGE TRADED FUNDS (Cost $37,849,602) |
| 41,613,345 | ||||||
|
| |||||||
| 95 | October 31, 2013 |
RiverFront Dynamic Equity Income Fund | ||
Statement of Investments | October 31, 2013 (Unaudited) | |
| Shares | Value (Note 2) | |||||||||||
| ||||||||||||
EXCHANGE TRADED NOTES (1.07%) |
| |||||||||||
Equity (1.07%) |
| |||||||||||
Credit Suisse Cushing® 30 MLP Index ETN |
| 15,829 | $ | 488,008 | ||||||||
|
| |||||||||||
TOTAL EXCHANGE TRADED NOTES (Cost $389,758) |
| 488,008 | ||||||||||
|
| |||||||||||
7-Day Yield | Shares | Value (Note 2) | ||||||||||
| ||||||||||||
SHORT TERM INVESTMENTS (4.24%) |
| |||||||||||
Money Market Fund (4.24%) |
| |||||||||||
Dreyfus Cash Management Fund, Institutional Class | 0.040 | % | 1,935,784 | 1,935,784 | ||||||||
|
| |||||||||||
TOTAL SHORT TERM INVESTMENTS (Cost $1,935,784) |
| 1,935,784 | ||||||||||
|
| |||||||||||
TOTAL INVESTMENTS (101.32%) (Cost $42,309,228) |
| $ | 46,318,582 | |||||||||
Liabilities In Excess Of Other |
| (601,310 | ) | |||||||||
|
| |||||||||||
NET ASSETS (100.00%) |
| $ | 45,717,272 | |||||||||
|
| |||||||||||
| (a) | Non-Income Producing Security. |
Common Abbreviations:
EAFE - Europe, Australia, and Far East.
EMU - European Monetary Union.
ETF - Exchange Traded Fund.
ETN - Exchange Traded Note.
FTSE - Financial Times and the London Stock Exchange.
MLP - Master Limited Partnership.
MSCI - Morgan Stanley Capital International.
RAFI - Research Affiliates Fundamental Index.
S&P - Standard and Poor’s.
SPDR - Standard and Poor’s Depositary Receipt.
For Fund compliance purposes, the Fund’s industry classifications refer to any one or more of the industry sub-classifications used by one or more widely recognized market indexes or ratings group indexes, and/or as defined by Fund management. This definition may not apply for purposes of this report, which may combine industry sub-classifications for reporting ease. Industries are shown as a percent of net assets.
See Notes to Financial Statements.
| 96 | October 31, 2013 |
RiverFront Global Allocation Fund | ||
Statement of Investments | October 31, 2013 (Unaudited) | |
| Shares | Value (Note 2) | |||||||
| ||||||||
COMMON STOCKS (4.40%) |
| |||||||
Communications (0.70%) | ||||||||
Media (0.70%) | ||||||||
The Walt Disney Co. | 2,985 | $ | 204,741 | |||||
|
| |||||||
TOTAL COMMUNICATIONS |
| 204,741 | ||||||
|
| |||||||
Consumer, Cyclical (1.36%) | ||||||||
Retail (1.36%) | ||||||||
CVS Caremark Corp. | 2,793 | 173,892 | ||||||
Dollar Tree, Inc.(a) | 3,819 | 223,030 | ||||||
|
| |||||||
| 396,922 | ||||||||
|
| |||||||
TOTAL CONSUMER, CYCLICAL |
| 396,922 | ||||||
|
| |||||||
Consumer, Non-Cyclical (1.31%) |
| |||||||
Pharmaceuticals (1.31%) | ||||||||
Abbott Laboratories | 4,810 | 175,806 | ||||||
Omnicare, Inc. | 3,728 | 205,599 | ||||||
|
| |||||||
| 381,405 | ||||||||
|
| |||||||
TOTAL CONSUMER, NON-CYCLICAL |
| 381,405 | ||||||
|
| |||||||
Financials (0.49%) | ||||||||
Diversified Financial Services (0.49%) |
| |||||||
Discover Financial Services | 2,745 | 142,410 | ||||||
|
| |||||||
TOTAL FINANCIALS | 142,410 | |||||||
|
| |||||||
Industrials (0.54%) | ||||||||
Electronics (0.54%) | ||||||||
Agilent Technologies, Inc. | 3,080 | 156,341 | ||||||
|
| |||||||
TOTAL INDUSTRIALS | 156,341 | |||||||
|
| |||||||
TOTAL COMMON STOCKS (Cost $1,145,623) |
| 1,281,819 | ||||||
|
| |||||||
EXCHANGE TRADED FUNDS (91.63%) |
| |||||||
Debt (7.33%) | ||||||||
iShares® Barclays 1-3 Year Credit Bond Fund | 4,588 | 483,759 | ||||||
PowerShares® Senior Loan Portfolio | 26,070 | 647,318 | ||||||
Riverfront Strategic Income Fund(a) | 17,427 | 435,326 | ||||||
Vanguard® Short-Term Corporate Bond ETF | 7,084 | 567,358 | ||||||
|
| |||||||
| 2,133,761 | ||||||||
|
| |||||||
Equity (84.30%) | ||||||||
First Trust Dow Jones® Internet Index Fund(a) | 3,252 | 177,559 | ||||||
| Shares | Value (Note 2) | |||||||
| ||||||||
Equity (continued) | ||||||||
First Trust Dow Jones® Select Micro-Cap Index Fund | 19,965 | $ | 602,943 | |||||
FlexShares Quality Dividend Index Fund | 21,598 | 695,888 | ||||||
Guggenheim Insider Sentiment ETF | 3,285 | 145,723 | ||||||
iShares® Core MSCI Emerging Markets ETF | 11,613 | 588,082 | ||||||
iShares® MSCI ACWI ex U.S. Index Fund | 10,892 | 505,280 | ||||||
iShares® MSCI All Country Asia ex Japan Index Fund | 27,297 | 1,643,552 | ||||||
iShares® MSCI Canada Index Fund | 15,320 | 449,948 | ||||||
iShares® MSCI EAFE Index Fund | 31,492 | 2,074,693 | ||||||
iShares® MSCI EAFE Value ETF | 5,121 | 289,746 | ||||||
iShares® MSCI Emerging Markets Index Fund | 9,489 | 402,903 | ||||||
iShares® MSCI EMU Index Fund | 27,846 | 1,107,714 | ||||||
iShares® MSCI Germany Index Fund | 20,151 | 591,432 | ||||||
iShares® MSCI Japan Index Fund | 102,764 | 1,222,892 | ||||||
iShares® MSCI Pacific ex-Japan Index Fund | 11,071 | 550,450 | ||||||
iShares® MSCI South Korea Capped ETF | 3,185 | 203,553 | ||||||
iShares® MSCI Switzerland Index Fund | 9,454 | 304,513 | ||||||
iShares® MSCI United Kingdom Index Fund | 11,878 | 241,717 | ||||||
iShares® S&P SmallCap 600® Index Fund | 6,034 | 623,976 | ||||||
Market Vectors® Oil Service ETF | 2,938 | 145,784 | ||||||
Materials Select Sector SPDR® Fund | 3,309 | 144,835 | ||||||
PowerShares® Buyback Achievers Portfolio | 11,431 | 466,385 | ||||||
PowerShares® FTSE® RAFI Developed Markets ex-U.S. Portfolio | 10,160 | 438,912 | ||||||
PowerShares® S&P 500® High Beta Port ETF | 116,341 | 3,322,699 | ||||||
SPDR® S&P® Insurance ETF | 3,447 | 206,165 | ||||||
Vanguard® FTSE® Europe ETF | 46,975 | 2,667,241 | ||||||
Vanguard® Industrials ETF | 1,555 | 145,657 | ||||||
Vanguard® Large-Cap ETF | 18,192 | 1,469,368 | ||||||
Vanguard® MSCI EAFE ETF | 28,938 | 1,182,117 | ||||||
Wilshire Micro-Cap ETF | 28,862 | 727,611 | ||||||
WisdomTree® Japan Hedged Equity Fund | 19,279 | 919,223 | ||||||
| 97 | October 31, 2013 |
RiverFront Global Allocation Fund | ||
Statement of Investments | October 31, 2013 (Unaudited) | |
| Shares | Value (Note 2) | |||||||||||
| ||||||||||||
Equity (continued) | ||||||||||||
WisdomTree® Japan SmallCap Dividend Fund |
| 5,428 | $ | 278,836 | ||||||||
|
| |||||||||||
| 24,537,397 | ||||||||||||
|
| |||||||||||
TOTAL EXCHANGE TRADED FUNDS (Cost $23,394,305) |
| 26,671,158 | ||||||||||
|
| |||||||||||
7-Day Yield | Shares | Value (Note 2) | ||||||||||
| ||||||||||||
SHORT TERM INVESTMENTS (3.71%) |
| |||||||||||
Money Market Fund (3.71%) |
| |||||||||||
Dreyfus Cash | 0.040 | % | 1,080,105 | 1,080,105 | ||||||||
|
| |||||||||||
TOTAL SHORT TERM INVESTMENTS (Cost $1,080,105) |
| 1,080,105 | ||||||||||
|
| |||||||||||
TOTAL INVESTMENTS (99.74%) (Cost $25,620,033) |
| $ | 29,033,082 | |||||||||
Other Assets In Excess Of Liabilities (0.26%) |
| 75,641 | ||||||||||
|
| |||||||||||
NET ASSETS (100.00%) |
| $ | 29,108,723 | |||||||||
|
| |||||||||||
| (a) | Non-Income Producing Security. |
Common Abbreviations:
ACWI - All Country World Index.
EAFE - Europe, Australia, and Far East.
EMU - European Monetary Union.
ETF - Exchange Traded Fund.
FTSE - Financial Times and the London Stock Exchange.
MSCI - Morgan Stanley Capital International.
RAFI - Research Affiliates Fundamental Index.
S&P - Standard and Poor’s.
SPDR - Standard and Poor’s Depositary Receipt.
For Fund compliance purposes, the Fund’s industry classifications refer to any one or more of the industry sub-classifications used by one or more widely recognized market indexes or ratings group indexes, and/or as defined by Fund management. This definition may not apply for purposes of this report, which may combine industry sub-classifications for reporting ease. Industries are shown as a percent of net assets.
See Notes to Financial Statements.
| 98 | October 31, 2013 |
RiverFront Global Growth Fund | ||
Statement of Investments | October 31, 2013 (Unaudited) | |
| Shares | Value (Note 2) | |||||||
| ||||||||
COMMON STOCKS (5.00%) | ||||||||
Communications (0.71%) | ||||||||
Media (0.71%) | ||||||||
The Walt Disney Co. | 6,758 | $ | 463,531 | |||||
|
| |||||||
TOTAL COMMUNICATIONS | 463,531 | |||||||
|
| |||||||
Consumer, Cyclical (1.46%) | ||||||||
Retail (1.46%) | ||||||||
CVS Caremark Corp. | 7,413 | 461,533 | ||||||
Dollar Tree, Inc.(a) | 8,505 | 496,692 | ||||||
|
| |||||||
| 958,225 | ||||||||
|
| |||||||
TOTAL CONSUMER, CYCLICAL | 958,225 | |||||||
|
| |||||||
Consumer, Non-Cyclical (1.53%) |
| |||||||
Pharmaceuticals (1.53%) | ||||||||
Abbott Laboratories | 12,749 | 465,976 | ||||||
Omnicare, Inc. | 9,763 | 538,429 | ||||||
|
| |||||||
| 1,004,405 | ||||||||
|
| |||||||
TOTAL CONSUMER, NON-CYCLICAL |
| 1,004,405 | ||||||
|
| |||||||
Financials (0.57%) | ||||||||
Diversified Financial Services (0.57%) |
| |||||||
Discover Financial Services | 7,244 | 375,819 | ||||||
|
| |||||||
TOTAL FINANCIALS | 375,819 | |||||||
|
| |||||||
Industrials (0.73%) | ||||||||
Electronics (0.73%) | ||||||||
Agilent Technologies, Inc. | 9,476 | 481,002 | ||||||
|
| |||||||
TOTAL INDUSTRIALS | 481,002 | |||||||
|
| |||||||
TOTAL COMMON STOCKS (Cost $2,935,627) | 3,282,982 | |||||||
|
| |||||||
EXCHANGE TRADED FUNDS (91.62%) |
| |||||||
Equity (91.62%) | ||||||||
First Trust Dow Jones® Internet Index Fund(a) | 9,994 | 545,672 | ||||||
First Trust Dow Jones® Select Micro-Cap Index Fund | 56,242 | 1,698,508 | ||||||
FlexShares Quality Dividend Index Fund | 30,713 | 989,573 | ||||||
Guggenheim Insider Sentiment ETF | 10,380 | 460,457 | ||||||
iShares® Core MSCI Emerging Markets ETF | 25,506 | 1,291,624 | ||||||
iShares® MSCI ACWI ex U.S. Index Fund | 24,248 | 1,124,865 | ||||||
| Shares | Value (Note 2) | |||||||
| ||||||||
Equity (continued) | ||||||||
iShares® MSCI All Country Asia ex Japan Index Fund | 71,489 | $ | 4,304,353 | |||||
iShares® MSCI Canada Index Fund | 40,489 | 1,189,162 | ||||||
iShares® MSCI EAFE Index Fund | 45,487 | 2,996,684 | ||||||
iShares® MSCI EAFE Value ETF | 11,507 | 651,066 | ||||||
iShares® MSCI Emerging Markets Index Fund | 39,030 | 1,657,214 | ||||||
iShares® MSCI EMU Index Fund | 74,745 | 2,973,356 | ||||||
iShares® MSCI Germany Index Fund | 58,503 | 1,717,063 | ||||||
iShares® MSCI Japan Index Fund | 248,436 | 2,956,388 | ||||||
iShares® MSCI Pacific ex-Japan Index Fund | 32,214 | 1,601,680 | ||||||
iShares® MSCI South Korea Capped ETF | 9,244 | 590,784 | ||||||
iShares® MSCI Switzerland Index Fund | 20,995 | 676,249 | ||||||
iShares® MSCI United Kingdom Index Fund | 25,263 | 514,102 | ||||||
iShares® S&P SmallCap 600® Index Fund | 8,255 | 853,650 | ||||||
Market Vectors® Oil Service ETF | 10,005 | 496,448 | ||||||
Materials Select Sector SPDR® Fund | 7,502 | 328,363 | ||||||
PowerShares® Buyback Achievers Portfolio | 25,975 | 1,059,780 | ||||||
PowerShares® FTSE® RAFI Developed Markets ex-U.S. Portfolio | 30,162 | 1,302,998 | ||||||
PowerShares® S&P 500® High Beta Port ETF | 284,850 | 8,135,316 | ||||||
SPDR® S&P® Insurance ETF | 10,968 | 655,996 | ||||||
Vanguard® FTSE® Europe ETF | 144,251 | 8,190,572 | ||||||
Vanguard® Industrials ETF | 6,999 | 655,596 | ||||||
Vanguard® Information Technology ETF | 8,244 | 689,611 | ||||||
Vanguard® Large-Cap ETF | 22,494 | 1,816,840 | ||||||
Vanguard® MSCI EAFE ETF | 69,480 | 2,838,258 | ||||||
Wilshire Micro-Cap ETF | 71,902 | 1,812,649 | ||||||
WisdomTree® Japan Hedged Equity Fund | 56,288 | 2,683,812 | ||||||
WisdomTree® Japan SmallCap Dividend Fund | 11,984 | 615,618 | ||||||
|
| |||||||
| 60,074,307 | ||||||||
|
| |||||||
TOTAL EXCHANGE TRADED FUNDS (Cost $50,819,302) |
| 60,074,307 | ||||||
|
| |||||||
| 99 | October 31, 2013 |
RiverFront Global Growth Fund | ||
Statement of Investments | October 31, 2013 (Unaudited) | |
| 7-Day Yield | Shares | Value (Note 2) | ||||||||||
| ||||||||||||
SHORT TERM INVESTMENTS (3.25%) |
| |||||||||||
Money Market Fund (3.25%) |
| |||||||||||
Dreyfus Cash Management Fund, Institutional Class | 0.040 | % | 2,129,286 | $ | 2,129,286 | |||||||
|
| |||||||||||
TOTAL SHORT TERM INVESTMENTS (Cost $2,129,286) |
| 2,129,286 | ||||||||||
|
| |||||||||||
TOTAL INVESTMENTS (99.87%) (Cost $55,884,215) |
| $ | 65,486,575 | |||||||||
Other Assets In Excess Of Liabilities (0.13%) |
| 82,287 | ||||||||||
|
| |||||||||||
NET ASSETS (100.00%) |
| $ | 65,568,862 | |||||||||
|
| |||||||||||
| (a) | Non-Income Producing Security. |
Common Abbreviations:
| ACWI | - All Country World Index. |
| EAFE | - Europe, Australia, and Far East. |
| ETF | - Exchange Traded Fund. |
| EMU | - European Monetary Union. |
| FTSE | - Financial Times and the London Stock Exchange. |
| MSCI | - Morgan Stanley Capital International. |
| RAFI | - Research Affiliates Fundamental Index. |
| S&P | - Standard and Poor’s. |
| SPDR | - Standard and Poor’s Depositary Receipt. |
For Fund compliance purposes, the Fund’s industry classifications refer to any one or more of the industry sub-classifications used by one or more widely recognized market indexes or ratings group indexes, and/or as defined by Fund management. This definition may not apply for purposes of this report, which may combine industry sub-classifications for reporting ease. Industries are shown as a percent of net assets.
See Notes to Financial Statements. |
| 100 | October 31, 2013 |
RiverFront Moderate Growth & Income Fund | ||
Statement of Investments | October 31, 2013 (Unaudited) | |
| Shares | Value (Note 2) | |||||||
| ||||||||
COMMON STOCKS (4.90%) |
| |||||||
Communications (0.72%) |
| |||||||
Media (0.72%) | ||||||||
The Walt Disney Co. | 13,130 | $ | 900,587 | |||||
|
| |||||||
TOTAL COMMUNICATIONS |
| 900,587 | ||||||
|
| |||||||
Consumer, Cyclical (1.50%) |
| |||||||
Retail (1.50%) | ||||||||
CVS Caremark Corp. | 14,197 | 883,905 | ||||||
Dollar Tree, Inc.(a) | 17,278 | 1,009,035 | ||||||
|
| |||||||
| 1,892,940 | ||||||||
|
| |||||||
TOTAL CONSUMER, CYCLICAL |
| 1,892,940 | ||||||
|
| |||||||
Consumer, Non-Cyclical (1.40%) |
| |||||||
Cosmetics/Personal Care (0.70%) |
| |||||||
Colgate-Palmolive Co. | 13,544 | 876,703 | ||||||
|
| |||||||
Pharmaceuticals (0.70%) |
| |||||||
Abbott Laboratories | 24,320 | 888,896 | ||||||
|
| |||||||
TOTAL CONSUMER, NON-CYCLICAL |
| 1,765,599 | ||||||
|
| |||||||
Financials (0.61%) | ||||||||
Diversified Financial Services (0.61%) |
| |||||||
Discover Financial Services | 14,821 | 768,913 | ||||||
|
| |||||||
TOTAL FINANCIALS | 768,913 | |||||||
|
| |||||||
Industrials (0.67%) | ||||||||
Electronics (0.67%) | ||||||||
Agilent Technologies, Inc. | 16,677 | 846,525 | ||||||
|
| |||||||
TOTAL INDUSTRIALS | 846,525 | |||||||
|
| |||||||
TOTAL COMMON STOCKS (Cost $5,752,619) |
| 6,174,564 | ||||||
|
| |||||||
EXCHANGE TRADED FUNDS (89.07%) |
| |||||||
Debt (36.03%) | ||||||||
iShares® Barclays 1-3 Year Credit Bond Fund | 83,985 | 8,855,378 | ||||||
iShares® iBoxx $ High Yield Corporate Bond Fund | 12,999 | 1,214,107 | ||||||
PIMCO 0-5 Year High Yield Corporate Bond Index ETF | 84,088 | 8,919,214 | ||||||
PowerShares® Senior Loan Portfolio | 140,799 | 3,496,039 | ||||||
Riverfront Strategic Income Fund(a) | 75,739 | 1,891,960 | ||||||
SPDR® Barclays Capital High Yield Bond ETF | 29,760 | 1,209,149 | ||||||
| Shares | Value (Note 2) | |||||||
| ||||||||
Debt (continued) | ||||||||
SPDR® Barclays Short Term High Yield Bond ETF | 287,336 | $ | 8,867,189 | |||||
Vanguard® Short-Term Corporate Bond ETF | 135,901 | 10,884,311 | ||||||
|
| |||||||
| 45,337,347 | ||||||||
|
| |||||||
Equity (53.04%) | ||||||||
FlexShares Quality Dividend Index Fund | 143,131 | 4,611,681 | ||||||
Global X MLP & Energy Infrastructure ETF(a) | 40,294 | 633,825 | ||||||
Guggenheim Insider Sentiment ETF | 14,102 | 625,565 | ||||||
iShares® MSCI All Country Asia ex Japan Index Fund | 102,906 | 6,195,970 | ||||||
iShares® MSCI Canada Index Fund | 31,842 | 935,199 | ||||||
iShares® MSCI EAFE Index Fund | 43,332 | 2,854,712 | ||||||
iShares® MSCI EAFE Value ETF | 27,550 | 1,558,779 | ||||||
iShares® MSCI EMU Index Fund | 56,460 | 2,245,979 | ||||||
iShares® MSCI Japan Index Fund | 303,002 | 3,605,724 | ||||||
iShares® MSCI South Korea Capped ETF | 14,845 | 948,744 | ||||||
iShares® MSCI United Kingdom Index Fund | 50,488 | 1,027,431 | ||||||
PowerShares® Buyback Achievers Portfolio | 51,650 | 2,107,320 | ||||||
PowerShares® FTSE® RAFI Developed Markets ex-U.S. Portfolio | 45,881 | 1,982,059 | ||||||
PowerShares® S&P 500® High Beta Port ETF | 354,169 | 10,115,067 | ||||||
SPDR® S&P® Insurance ETF | 15,563 | 930,823 | ||||||
Vanguard® FTSE® Europe ETF | 157,515 | 8,943,702 | ||||||
Vanguard® Industrials ETF | 20,475 | 1,917,893 | ||||||
Vanguard® Information Technology ETF | 16,716 | 1,398,293 | ||||||
WisdomTree® Japan Hedged Equity Fund | 22,060 | 1,051,821 | ||||||
WisdomTree® Japan SmallCap Dividend Fund | 18,049 | 927,177 | ||||||
WisdomTree® LargeCap Dividend Fund | 189,274 | 12,126,785 | ||||||
|
| |||||||
| 66,744,549 | ||||||||
|
| |||||||
TOTAL EXCHANGE TRADED FUNDS (Cost $104,702,424) |
| 112,081,896 | ||||||
|
| |||||||
| 101 | October 31, 2013 |
RiverFront Moderate Growth & Income Fund | ||
Statement of Investments | October 31, 2013 (Unaudited) | |
| Shares | Value (Note 2) | |||||||
| ||||||||
EXCHANGE TRADED NOTES (1.07%) |
| |||||||
Equity (1.07%) | ||||||||
Credit Suisse Cushing® 30 MLP Index ETN | 43,555 | $ | 1,342,801 | |||||
|
| |||||||
TOTAL EXCHANGE TRADED NOTES (Cost $1,077,317) | 1,342,801 | |||||||
|
| |||||||
| 7-Day Yield | Shares | Value (Note 2) | ||||||
| ||||||||
SHORT TERM INVESTMENTS (5.80%) |
| |||||||
Money Market Fund (5.80%) | ||||||||
Dreyfus Cash Management Fund, Institutional Class | 0.040% | 7,299,604 | 7,299,604 | |||||
|
| |||||||
TOTAL SHORT TERM INVESTMENTS (Cost $7,299,604) | 7,299,604 | |||||||
|
| |||||||
TOTAL INVESTMENTS (100.84%) (Cost $118,831,964) | $ | 126,898,865 | ||||||
Liabilities In Excess Of Other Assets (-0.84%) | (1,060,398 | ) | ||||||
|
| |||||||
NET ASSETS (100.00%) | $ | 125,838,467 | ||||||
|
| |||||||
| (a) | Non-Income Producing Security. |
Common Abbreviations:
| EAFE | - Europe, Australia, and Far East. |
| EMU | - European Monetary Union. |
| ETF | - Exchange Traded Fund. |
| ETN | - Exchange Traded Note. |
| FTSE | - Financial Times and the London Stock Exchange. |
| MLP | - Master Limited Partnership. |
| MSCI | - Morgan Stanley Capital International. |
| RAFI | - Research Affiliates Fundamental Index. |
| S&P | - Standard and Poor’s. |
| SPDR | - Standard and Poor’s Depositary Receipt. |
For Fund compliance purposes, the Fund’s industry classifications refer to any one or more of the industry sub-classifications used by one or more widely recognized market indexes or ratings group indexes, and/or as defined by Fund management. This definition may not apply for purposes of this report, which may combine industry sub-classifications for reporting ease. Industries are shown as a percent of net assets.
See Notes to Financial Statements. |
| 102 | October 31, 2013 |
RiverFront Global Allocation Series | ||
| October 31, 2013 (Unaudited) | ||
RiverFront Fund | RiverFront Fund | RiverFront Global Allocation Fund | RiverFront Global Growth Fund | RiverFront Fund | ||||||||||||||||
ASSETS | ||||||||||||||||||||
Investments, at value | $ | 4,742,598 | $ | 46,318,582 | $ | 29,033,082 | $ | 65,486,575 | $ | 126,898,865 | ||||||||||
Receivable for investments sold | 176,462 | 1,529,702 | 1,034,526 | 1,449,991 | 6,329,405 | |||||||||||||||
Receivable for shares sold | – | 9,027 | 369,039 | 168,844 | 209,611 | |||||||||||||||
Dividends and interest receivable | 3,072 | 13,875 | 2,308 | 4,132 | 57,571 | |||||||||||||||
Receivable due from adviser | 1,328 | – | – | – | – | |||||||||||||||
Prepaid expenses and other assets | 37,150 | 23,150 | 23,687 | 39,683 | 23,753 | |||||||||||||||
| ||||||||||||||||||||
Total Assets | 4,960,610 | 47,894,336 | 30,462,642 | 67,149,225 | 133,519,205 | |||||||||||||||
| ||||||||||||||||||||
LIABILITIES | ||||||||||||||||||||
Payable for investments purchased | 275,553 | 2,049,719 | 1,276,165 | 1,454,085 | 7,326,782 | |||||||||||||||
Payable for shares redeemed | – | 18,616 | 6,764 | – | 41,106 | |||||||||||||||
Investment advisory fees payable | – | 39,703 | 21,053 | 60,613 | 135,340 | |||||||||||||||
Administration and transfer agency fees payable | 239 | 9,004 | 6,080 | 13,431 | 25,673 | |||||||||||||||
Distribution and services fees payable | 4,211 | 36,399 | 22,218 | 22,642 | 108,350 | |||||||||||||||
Trustees’ fees and expenses payable | 61 | 215 | 176 | 444 | 1,313 | |||||||||||||||
Legal fees payable | 32 | 408 | 242 | 251 | 1,639 | |||||||||||||||
Audit and tax fees payable | 12,280 | 9,970 | 9,957 | 9,968 | 10,017 | |||||||||||||||
Custody fees payable | 7,266 | 6,211 | 6,852 | 6,464 | 6,643 | |||||||||||||||
Printing fees payable | 528 | 5,964 | 3,790 | 9,792 | 17,165 | |||||||||||||||
Accrued expenses and other liabilities | 2,093 | 855 | 622 | 2,673 | 6,710 | |||||||||||||||
| ||||||||||||||||||||
Total Liabilities | 302,263 | 2,177,064 | 1,353,919 | 1,580,363 | 7,680,738 | |||||||||||||||
| ||||||||||||||||||||
NET ASSETS | $ | 4,658,347 | $ | 45,717,272 | $ | 29,108,723 | $ | 65,568,862 | $ | 125,838,467 | ||||||||||
| ||||||||||||||||||||
NET ASSETS CONSIST OF | ||||||||||||||||||||
Paid-in capital | $ | 4,407,483 | $ | 40,064,641 | $ | 24,860,817 | $ | 49,761,906 | $ | 111,946,684 | ||||||||||
Accumulated net investment income/(loss) | (18,295) | (873) | 61,126 | 199,852 | 55,527 | |||||||||||||||
Accumulated net realized gain on investments | 80,357 | 1,644,150 | 773,731 | 6,004,744 | 5,769,355 | |||||||||||||||
Net unrealized appreciation in value on investments | 188,802 | 4,009,354 | 3,413,049 | 9,602,360 | 8,066,901 | |||||||||||||||
| ||||||||||||||||||||
NET ASSETS | $ | 4,658,347 | $ | 45,717,272 | $ | 29,108,723 | $ | 65,568,862 | $ | 125,838,467 | ||||||||||
| ||||||||||||||||||||
INVESTMENTS, AT COST | $ | 4,553,796 | $ | 42,309,228 | $ | 25,620,033 | $ | 55,884,215 | $ | 118,831,964 | ||||||||||
| ||||||||||||||||||||
See Notes to Financial Statements. |
| 103 | October 31, 2013 |
RiverFront Global Allocation Series | ||
Statements of Assets and Liabilities (continued) | October 31, 2013 (Unaudited) | |
RiverFront Fund | RiverFront Fund | RiverFront Global Allocation Fund | RiverFront Global Growth Fund | RiverFront Fund | ||||||||||||||||
PRICING OF SHARES | ||||||||||||||||||||
Class A: | ||||||||||||||||||||
Net Asset Value, offering and redemption price per share(a) | $ | 10.69 | $ | 12.94 | $ | 12.90 | $ | 16.25 | $ | 12.12 | ||||||||||
Net Assets | $ | 831,815 | $ | 10,444,490 | $ | 8,747,492 | $ | 12,143,170 | $ | 32,392,347 | ||||||||||
Shares of beneficial interest outstanding (unlimited number of shares, no par value common stock authorized) | 77,824 | 807,264 | 678,034 | 747,185 | 2,672,510 | |||||||||||||||
Maximum offering price per share ((NAV/0.9450), based on maximum sales charge of 5.50% of the offering price) | $ | 11.31 | $ | 13.69 | $ | 13.65 | $ | 17.20 | $ | 12.83 | ||||||||||
Class C: | ||||||||||||||||||||
Net Asset Value, offering and redemption | $ | 10.67 | $ | 12.81 | $ | 12.76 | $ | 16.06 | $ | 12.07 | ||||||||||
Net Assets | $ | 2,445,768 | $ | 20,483,317 | $ | 11,665,099 | $ | 9,370,624 | $ | 59,202,291 | ||||||||||
Shares of beneficial interest outstanding (unlimited number of shares, no par value common stock authorized) | 229,232 | 1,598,697 | 914,322 | 583,623 | 4,904,544 | |||||||||||||||
Class I: | ||||||||||||||||||||
Net Asset Value, offering and redemption price per share | $ | 10.51 | $ | 12.86 | $ | 12.69 | $ | 16.31 | $ | 12.11 | ||||||||||
Net Assets | $ | 1,380,764 | $ | 14,789,465 | $ | 8,696,132 | $ | 11,227,102 | $ | 34,243,829 | ||||||||||
Shares of beneficial interest outstanding (unlimited number of shares, no par value common stock authorized) | 131,369 | 1,150,181 | 685,411 | 688,194 | 2,827,041 | |||||||||||||||
Class L: | ||||||||||||||||||||
Net Asset Value, offering and redemption price per share | N/A | N/A | N/A | $ | 16.29 | N/A | ||||||||||||||
Net Assets | N/A | N/A | N/A | $ | 24,072,196 | N/A | ||||||||||||||
Shares of beneficial interest outstanding (unlimited number of shares, no par value common stock authorized) | N/A | N/A | N/A | 1,477,792 | N/A | |||||||||||||||
Investor Class: | ||||||||||||||||||||
Net Asset Value, offering and redemption price per share | N/A | N/A | N/A | $ | 16.18 | N/A | ||||||||||||||
Net Assets | N/A | N/A | N/A | $ | 8,755,770 | N/A | ||||||||||||||
Shares of beneficial interest outstanding (unlimited number of shares, no par value common stock authorized) | N/A | N/A | N/A | 541,015 | N/A | |||||||||||||||
| (a) | Redemption price per share may be reduced for any applicable contingent deferred sales charge. For a description of a possible sales charge, please see the Fund’s Prospectus. |
See Notes to Financial Statements. |
| 104 | October 31, 2013 |
RiverFront Global Allocation Series | ||
| For the Six Months Ended October 31, 2013 (Unaudited) | ||
| RiverFront Conservative Income Builder Fund | RiverFront Fund | RiverFront Global Allocation Fund | RiverFront Fund | RiverFront Fund | ||||||||||||||||
INVESTMENT INCOME | ||||||||||||||||||||
Dividends | $ | 51,006 | $ | 500,288 | $ | 262,415 | $ | 577,550 | $ | 1,442,173 | ||||||||||
Other income | – | 90 | 12 | 64 | 98 | |||||||||||||||
| ||||||||||||||||||||
Total Investment Income | 51,006 | 500,378 | 262,427 | 577,614 | 1,442,271 | |||||||||||||||
| ||||||||||||||||||||
EXPENSES | ||||||||||||||||||||
Investment advisory fees | 17,954 | 166,220 | 112,715 | 252,650 | 500,438 | |||||||||||||||
Administrative and transfer agency fees | 3,451 | 23,851 | 16,718 | 36,144 | 69,721 | |||||||||||||||
Distribution and service fees | ||||||||||||||||||||
Class A | 883 | 11,106 | 10,544 | 11,820 | 38,345 | |||||||||||||||
Class C | 11,743 | 89,129 | 52,249 | 39,945 | 278,919 | |||||||||||||||
Investor Class | – | – | – | 11,124 | – | |||||||||||||||
Legal fees | 130 | 1,273 | 820 | 1,565 | 4,246 | |||||||||||||||
Audit and tax fees | 9,888 | 8,003 | 7,991 | 7,984 | 8,034 | |||||||||||||||
Reports to shareholders and printing fees | 357 | 3,665 | 2,110 | 6,074 | 10,283 | |||||||||||||||
State registration fees | 1,479 | 22,071 | 20,526 | 29,616 | 25,907 | |||||||||||||||
Insurance fees | 8 | 325 | 212 | 529 | 990 | |||||||||||||||
Custody fees | 6,640 | 6,162 | 6,514 | 6,264 | 6,807 | |||||||||||||||
Trustees’ fees and expenses | 106 | 592 | 435 | 1,006 | 2,482 | |||||||||||||||
Offering costs | 19,356 | – | – | – | – | |||||||||||||||
Miscellaneous expenses | 2,977 | 6,081 | 5,847 | 8,543 | 14,136 | |||||||||||||||
| ||||||||||||||||||||
Total Expense | 74,972 | 338,478 | 236,681 | 413,264 | 960,308 | |||||||||||||||
Less fees waived/reimbursed by investment advisor (Note 7) | ||||||||||||||||||||
Class A | (6,841) | (14,317) | (17,329) | (13,229) | (29,456) | |||||||||||||||
Class C | (23,670) | (28,263) | (21,481) | (11,157) | (53,555) | |||||||||||||||
Class I | (10,711) | (19,665) | (15,736) | (13,928) | (30,157) | |||||||||||||||
Class L | – | – | – | (32,196) | – | |||||||||||||||
Investor Class | – | – | – | (12,353) | – | |||||||||||||||
Less fees waived/reimbursed by administrator | ||||||||||||||||||||
Class A | (354) | – | – | – | – | |||||||||||||||
Class C | (1,174) | – | – | – | – | |||||||||||||||
Class I | (585) | – | – | – | – | |||||||||||||||
| ||||||||||||||||||||
Net Expenses | 31,637 | 276,233 | 182,135 | 330,401 | 847,140 | |||||||||||||||
| ||||||||||||||||||||
Net Investment Income | 19,369 | 224,145 | 80,292 | 247,213 | 595,131 | |||||||||||||||
| ||||||||||||||||||||
Net realized gain on investments | 63,690 | 1,061,785 | 686,937 | 3,009,387 | 3,953,025 | |||||||||||||||
Net change in unrealized appreciation on investments | 79,718 | 1,306,739 | 1,351,491 | 2,081,543 | 796,393 | |||||||||||||||
| ||||||||||||||||||||
NET REALIZED AND UNREALIZED GAIN ON INVESTMENTS | 143,408 | 2,368,524 | 2,038,428 | 5,090,930 | 4,749,418 | |||||||||||||||
| ||||||||||||||||||||
NET INCREASE IN NET ASSETS RESULTING FROM OPERATIONS | $ | 162,777 | $ | 2,592,669 | $ | 2,118,720 | $ | 5,338,143 | $ | 5,344,549 | ||||||||||
| ||||||||||||||||||||
See Notes to Financial Statements. |
| 105 | October 31, 2013 |
RiverFront Conservative Income Builder Fund | ||
For the Six Months Ended October 31, 2013 (Unaudited) | For the Period September 4, 2012 (Commencement) to April 30, 2013 | |||||||
| ||||||||
OPERATIONS | ||||||||
Net investment income | $ | 19,369 | $ | 15,227 | ||||
Net realized gain on investments | 63,690 | 16,667 | ||||||
Net change in unrealized appreciation on investments | 79,718 | 109,084 | ||||||
| ||||||||
Net Increase in Net Assets Resulting from Operations | 162,777 | 140,978 | ||||||
| ||||||||
DISTRIBUTIONS | ||||||||
Dividends to shareholders from net investment income | ||||||||
Class A | (7,713) | (895) | ||||||
Class C | (26,587) | (3,477) | ||||||
Class I | (11,869) | (12,108) | ||||||
| ||||||||
Net Decrease in Net Assets from Distributions | (46,169) | (16,480) | ||||||
| ||||||||
BENEFICIAL INTEREST TRANSACTIONS (NOTE 6) | ||||||||
Shares sold | ||||||||
Class A | 296,672 | 590,998 | ||||||
Class C | 780,273 | 2,176,853 | ||||||
Class I | 1,313,142 | 745,479 | ||||||
Dividends reinvested | ||||||||
Class A | 2,200 | 475 | ||||||
Class C | 24,074 | 2,582 | ||||||
Class I | 11,868 | 12,108 | ||||||
Shares redeemed | ||||||||
Class A | (91,581) | – | ||||||
Class C | (658,223) | (6,853) | ||||||
Class I | (723,048) | (59,778) | ||||||
| ||||||||
Net Increase in Net Assets Derived from Beneficial Interest Transactions | 955,377 | 3,461,864 | ||||||
| ||||||||
Net increase in net assets | 1,071,985 | 3,586,362 | ||||||
NET ASSETS | ||||||||
Beginning of period | 3,586,362 | – | ||||||
| ||||||||
End of period * | $ | 4,658,347 | $ | 3,586,362 | ||||
| ||||||||
*Including accumulated net investment income/(loss) of: | $ | (18,295) | $ | 8,505 | ||||
See Notes to Financial Statements. |
| 106 | October 31, 2013 |
RiverFront Dynamic Equity Income Fund | ||
Statements of Changes in Net Assets | ||
For the Six Months Ended October 31, 2013 (Unaudited) | For the Year Ended April 30, 2013 | |||||||
| ||||||||
OPERATIONS | ||||||||
Net investment income | $ | 224,145 | $ | 531,046 | ||||
Net realized gain on investments | 1,061,785 | 1,802,700 | ||||||
Net change in unrealized appreciation on investments | 1,306,739 | 764,280 | ||||||
| ||||||||
Net Increase in Net Assets Resulting from Operations | 2,592,669 | 3,098,026 | ||||||
| ||||||||
DISTRIBUTIONS | ||||||||
Dividends to shareholders from net investment income | ||||||||
Class A | (62,178) | (140,732) | ||||||
Class C | (78,704) | (192,727) | ||||||
Class I | (105,338) | (177,578) | ||||||
| ||||||||
Net Decrease in Net Assets from Distributions | (246,220) | (511,037) | ||||||
| ||||||||
BENEFICIAL INTEREST TRANSACTIONS (NOTE 6) | ||||||||
Shares sold | ||||||||
Class A | 2,491,009 | 3,202,766 | ||||||
Class C | 4,341,189 | 4,609,418 | ||||||
Class I | 5,324,228 | 5,250,086 | ||||||
Dividends reinvested | ||||||||
Class A | 55,461 | 129,832 | ||||||
Class C | 72,832 | 180,549 | ||||||
Class I | 88,229 | 159,280 | ||||||
Shares redeemed | ||||||||
Class A | (705,453) | (2,936,263) | ||||||
Class C | (1,058,238) | (3,724,460) | ||||||
Class I | (1,855,644) | (2,581,492) | ||||||
| ||||||||
Net Increase in Net Assets Derived from Beneficial Interest Transactions | 8,753,613 | 4,289,716 | ||||||
| ||||||||
Net increase in net assets | 11,100,062 | 6,876,705 | ||||||
NET ASSETS | ||||||||
Beginning of period | 34,617,210 | 27,740,505 | ||||||
| ||||||||
End of period * | $ | 45,717,272 | $ | 34,617,210 | ||||
| ||||||||
*Including accumulated net investment income/(loss) of: | $ | (873) | $ | 21,202 | ||||
See Notes to Financial Statements. |
| 107 | October 31, 2013 |
RiverFront Global Allocation Fund | ||
Statements of Changes in Net Assets | ||
For the Six Months Ended October 31, 2013 (Unaudited) | For the Year Ended April 30, 2013 | |||||||
| ||||||||
OPERATIONS | ||||||||
Net investment income | $ | 80,292 | $ | 213,148 | ||||
Net realized gain on investments | 686,937 | 1,215,328 | ||||||
Net change in unrealized appreciation on investments | 1,351,491 | 803,271 | ||||||
| ||||||||
Net Increase in Net Assets Resulting from Operations | 2,118,720 | 2,231,747 | ||||||
| ||||||||
DISTRIBUTIONS | ||||||||
Dividends to shareholders from net investment income | ||||||||
Class A | – | (97,608) | ||||||
Class C | – | (82,166) | ||||||
Class I | – | (70,616) | ||||||
| ||||||||
Net Decrease in Net Assets from Distributions | – | (250,390) | ||||||
| ||||||||
BENEFICIAL INTEREST TRANSACTIONS (NOTE 6) | ||||||||
Shares sold | ||||||||
Class A | 870,482 | 3,042,104 | ||||||
Class C | 2,212,884 | 2,492,791 | ||||||
Class I | 2,242,810 | 4,368,510 | ||||||
Dividends reinvested | ||||||||
Class A | – | 89,657 | ||||||
Class C | – | 76,038 | ||||||
Class I | – | 68,350 | ||||||
Shares redeemed | ||||||||
Class A | (1,031,974) | (1,396,094) | ||||||
Class C | (1,060,151) | (3,584,254) | ||||||
Class I | (848,611) | (1,712,016) | ||||||
| ||||||||
Net Increase in Net Assets Derived from Beneficial Interest Transactions | 2,385,440 | 3,445,086 | ||||||
| ||||||||
Net increase in net assets | 4,504,160 | 5,426,443 | ||||||
NET ASSETS | ||||||||
Beginning of period | 24,604,563 | 19,178,120 | ||||||
| ||||||||
End of period * | $ | 29,108,723 | $ | 24,604,563 | ||||
| ||||||||
*Including accumulated net investment income/(loss) of: | $ | 61,126 | $ | (19,166) | ||||
See Notes to Financial Statements. |
| 108 | October 31, 2013 |
RiverFront Global Growth Fund | ||
Statements of Changes in Net Assets | ||
For the Six Months Ended October 31, 2013 (Unaudited) | For the Year Ended April 30, 2013 | |||||||
| ||||||||
OPERATIONS | ||||||||
Net investment income | $ | 247,213 | $ | 679,592 | ||||
Net realized gain on investments | 3,009,387 | 4,550,863 | ||||||
Net change in unrealized appreciation on investments | 2,081,543 | 1,032,501 | ||||||
| ||||||||
Net Increase in Net Assets Resulting from Operations | 5,338,143 | 6,262,956 | ||||||
| ||||||||
DISTRIBUTIONS | ||||||||
Dividends to shareholders from net investment income | ||||||||
Class A | – | (116,274) | ||||||
Class C | – | (75,361) | ||||||
Class I | – | (79,598) | ||||||
Class L | – | (390,061) | ||||||
Investor Class | – | (141,444) | ||||||
| ||||||||
Net Decrease in Net Assets from Distributions | – | (802,738) | ||||||
| ||||||||
BENEFICIAL INTEREST TRANSACTIONS (NOTE 6) | ||||||||
Shares sold | ||||||||
Class A | 4,125,121 | 6,220,932 | ||||||
Class C | 2,224,706 | 2,331,909 | ||||||
Class I | 3,463,313 | 3,837,874 | ||||||
Class L | 1,162,246 | 2,863,936 | ||||||
Investor Class | 78,537 | 228,451 | ||||||
Dividends reinvested | ||||||||
Class A | – | 110,123 | ||||||
Class C | – | 73,619 | ||||||
Class I | – | 76,336 | ||||||
Class L | – | 375,201 | ||||||
Investor Class | – | 120,142 | ||||||
Shares redeemed | ||||||||
Class A | (1,371,036) | (3,873,219) | ||||||
Class C | (730,316) | (2,747,755) | ||||||
Class I | (925,625) | (2,778,845) | ||||||
Class L | (2,616,599) | (6,924,206) | ||||||
Investor Class | (1,283,198) | (2,240,520) | ||||||
| ||||||||
Net Increase/(Decrease) in Net Assets Derived from Beneficial Interest Transactions | 4,127,149 | (2,326,022) | ||||||
| ||||||||
Net increase in net assets | 9,465,292 | 3,134,196 | ||||||
NET ASSETS | ||||||||
Beginning of period | 56,103,570 | 52,969,374 | ||||||
| ||||||||
End of period * | $ | 65,568,862 | $ | 56,103,570 | ||||
| ||||||||
*Including accumulated net investment income/(loss) of: | $ | 199,852 | $ | (47,361) | ||||
See Notes to Financial Statements. |
| 109 | October 31, 2013 |
RiverFront Moderate Growth & Income Fund | ||
Statements of Changes in Net Assets | ||
For the Six Months Ended October 31, 2013 (Unaudited) | For the Year Ended April 30, 2013 | |||||||
| ||||||||
OPERATIONS | ||||||||
Net investment income | $ | 595,131 | $ | 1,590,843 | ||||
Net realized gain on investments | 3,953,025 | 3,679,508 | ||||||
Net change in unrealized appreciation on investments | 796,393 | 2,504,601 | ||||||
| ||||||||
Net Increase in Net Assets Resulting from Operations | 5,344,549 | 7,774,952 | ||||||
| ||||||||
DISTRIBUTIONS | ||||||||
Dividends to shareholders from net investment income | ||||||||
Class A | (196,307) | (490,109) | ||||||
Class C | (191,895) | (586,750) | ||||||
Class I | (235,202) | (434,898) | ||||||
| ||||||||
Net Decrease in Net Assets from Distributions | (623,404) | (1,511,757) | ||||||
| ||||||||
BENEFICIAL INTEREST TRANSACTIONS (NOTE 6) | ||||||||
Shares sold | ||||||||
Class A | 6,037,928 | 11,313,240 | ||||||
Class C | 9,619,330 | 18,703,383 | ||||||
Class I | 10,848,651 | 20,012,679 | ||||||
Dividends reinvested | ||||||||
Class A | 162,091 | 440,510 | ||||||
Class C | 158,245 | 482,949 | ||||||
Class I | 208,573 | 392,082 | ||||||
Shares redeemed | ||||||||
Class A | (4,085,505) | (5,157,175) | ||||||
Class C | (5,337,301) | (8,693,372) | ||||||
Class I | (4,038,418) | (8,863,522) | ||||||
| ||||||||
Net Increase in Net Assets Derived from Beneficial Interest Transactions | 13,573,594 | 28,630,774 | ||||||
| ||||||||
Net increase in net assets | 18,294,739 | 34,893,969 | ||||||
NET ASSETS | ||||||||
Beginning of period | 107,543,728 | 72,649,759 | ||||||
| ||||||||
End of period * | $ | 125,838,467 | $ | 107,543,728 | ||||
| ||||||||
*Including accumulated net investment income of: | $ | 55,527 | $ | 83,800 | ||||
See Notes to Financial Statements. |
| 110 | October 31, 2013 |
RiverFront Conservative Income Builder Fund – Class A | ||
Selected data for a share of beneficial interest outstanding throughout the periods indicated:
For the Six Months Ended October 31, 2013 (Unaudited) | For the Period September 4, 2012 (Commencement) to April 30, 2013 | |||
| ||||
Net asset value, beginning of period | $10.48 | $10.00 | ||
INCOME FROM INVESTMENT OPERATIONS: | ||||
Net investment income(a) | 0.07 | 0.09 | ||
Net realized and unrealized gain | 0.26 | 0.48 | ||
| ||||
Total from investment operations | 0.33 | 0.57 | ||
| ||||
DISTRIBUTIONS: | ||||
From net investment income | (0.12) | (0.09) | ||
| ||||
Total distributions | (0.12) | (0.09) | ||
| ||||
Net increase in net asset value | 0.21 | 0.48 | ||
| ||||
Net asset value, end of period | $10.69 | $10.48 | ||
| ||||
TOTAL RETURN(b) | 3.16% | 5.72% | ||
RATIOS/SUPPLEMENTAL DATA: | ||||
Net assets, end of period (000s) | $832 | $607 | ||
Ratio of expenses to average net assets excluding fee waivers and reimbursements | 3.19%(c)(d) | 5.65%(c)(d) | ||
Ratio of expenses to average net assets including fee waivers and reimbursements | 1.15%(c)(d) | 1.15%(c)(d) | ||
Ratio of net investment income to average net assets | 1.24%(c)(d) | 1.37%(c)(d) | ||
Portfolio turnover rate(e) | 74% | 73% | ||
| ||||
| (a) | Calculated using the average shares method. |
| (b) | Total returns are for the period indicated and have not been annualized. Total returns would have been lower had certain expenses not been waived during the period. Returns shown do not reflect the deduction of taxes that a shareholder would pay on Fund distributions or the redemption of Fund shares. Returns shown exclude any applicable sales charges. |
| (c) | Annualized. |
| (d) | Expense ratios before reductions for startup periods may not be representative of longer term operating periods. |
| (e) | Portfolio turnover rate for periods less than one full year have not been annualized. |
See Notes to Financial Statements. |
| 111 | October 31, 2013 |
RiverFront Conservative Income Builder Fund – Class C | ||
Financial Highlights | ||
Selected data for a share of beneficial interest outstanding throughout the periods indicated:
For the Six Months Ended October 31, 2013 (Unaudited) | For the Period September 4, 2012 (Commencement) to April 30, 2013 | |||
| ||||
Net asset value, beginning of period | $10.51 | $10.00 | ||
INCOME FROM INVESTMENT OPERATIONS: | ||||
Net investment income(a) | 0.03 | 0.06 | ||
Net realized and unrealized gain | 0.25 | 0.47 | ||
| ||||
Total from investment operations | 0.28 | 0.53 | ||
| ||||
DISTRIBUTIONS: | ||||
From net investment income | (0.12) | (0.02) | ||
| ||||
Total distributions | (0.12) | (0.02) | ||
| ||||
Net increase in net asset value | 0.16 | 0.51 | ||
| ||||
Net asset value, end of period | $10.67 | $10.51 | ||
| ||||
TOTAL RETURN(b) | 2.70% | 5.29% | ||
RATIOS/SUPPLEMENTAL DATA: | ||||
Net assets, end of period (000s) | $2,446 | $2,264 | ||
Ratio of expenses to average net assets excluding fee waivers and reimbursements | 4.02%(c)(d) | 6.53%(c)(d) | ||
Ratio of expenses to average net assets including fee waivers and reimbursements | 1.90%(c)(d) | 1.90%(c)(d) | ||
Ratio of net investment income to average net assets | 0.56%(c)(d) | 0.90%(c)(d) | ||
Portfolio turnover rate(e) | 74% | 73% | ||
| ||||
| (a) | Calculated using the average shares method. |
| (b) | Total returns are for the period indicated and have not been annualized. Total returns would have been lower had certain expenses not been waived during the period. Returns shown do not reflect the deduction of taxes that a shareholder would pay on Fund distributions or the redemption of Fund shares. Returns shown exclude any applicable sales charges. |
| (c) | Annualized. |
| (d) | Expense ratios before reductions for startup periods may not be representative of longer term operating periods. |
| (e) | Portfolio turnover rate for periods less than one full year have not been annualized. |
See Notes to Financial Statements. |
| 112 | October 31, 2013 |
RiverFront Conservative Income Builder Fund – Class I | ||
Financial Highlights | ||
Selected data for a share of beneficial interest outstanding throughout the periods indicated:
For the Six Months Ended October 31, 2013 (Unaudited) | For the Period September 4, 2012 (Commencement) to April 30, 2013 | |||
| ||||
Net asset value, beginning of period | $10.29 | $10.00 | ||
INCOME FROM INVESTMENT OPERATIONS: | ||||
Net investment income(a) | 0.07 | 0.12 | ||
Net realized and unrealized gain | 0.25 | 0.46 | ||
| ||||
Total from investment operations | 0.32 | 0.58 | ||
| ||||
DISTRIBUTIONS: | ||||
From net investment income | (0.10) | (0.29) | ||
| ||||
Total distributions | (0.10) | (0.29) | ||
| ||||
Net increase in net asset value | 0.22 | 0.29 | ||
| ||||
Net asset value, end of period | $10.51 | $10.29 | ||
| ||||
TOTAL RETURN(b) | 3.19% | 5.95% | ||
RATIOS/SUPPLEMENTAL DATA: | ||||
Net assets, end of period (000s) | $1,381 | $715 | ||
Ratio of expenses to average net assets excluding fee waivers and reimbursements | 2.83%(c)(d) | 7.74%(c)(d) | ||
Ratio of expenses to average net assets including fee waivers and reimbursements | 0.90%(c)(d) | 0.90%(c)(d) | ||
Ratio of net investment income to average net assets | 1.45%(c)(d) | 1.84%(c)(d) | ||
Portfolio turnover rate(e) | 74% | 73% | ||
| ||||
| (a) | Calculated using the average shares method. |
| (b) | Total returns are for the period indicated and have not been annualized. Total returns would have been lower had certain expenses not been waived during the period. Returns shown do not reflect the deduction of taxes that a shareholder would pay on Fund distributions or the redemption of Fund shares. |
| (c) | Annualized. |
| (d) | Expense ratios before reductions for startup periods may not be representative of longer term operating periods. |
| (e) | Portfolio turnover rate for periods less than one full year have not been annualized. |
See Notes to Financial Statements. |
| 113 | October 31, 2013 |
RiverFront Dynamic Equity Income Fund – Class A | ||
Financial Highlights | ||
Selected data for a share of beneficial interest outstanding throughout the periods indicated:
For the Six Months Ended October 31, 2013 (Unaudited) | For the Year Ended April 30, 2013 | For the Year Ended April 30, 2012 (a) | For the Period August 2, 2010 (Inception) to April 30, 2011 | |||||
| ||||||||
Net asset value, beginning of period | $12.24 | $11.24 | $11.73 | $10.00 | ||||
INCOME/(LOSS) FROM INVESTMENT OPERATIONS: | ||||||||
Net investment income(b) | 0.09 | 0.25 | 0.16 | 0.12 | ||||
Net realized and unrealized gain/(loss) | 0.68 | 0.99 | (0.49) | 1.67 | ||||
| ||||||||
Total from investment operations | 0.77 | 1.24 | (0.33) | 1.79 | ||||
| ||||||||
DISTRIBUTIONS: | ||||||||
From net investment income | (0.07) | (0.24) | (0.15) | (0.06) | ||||
From net realized gains | – | – | – | (0.00)(c) | ||||
Tax return of capital | – | – | (0.01) | (0.00)(c) | ||||
| ||||||||
Total distributions | (0.07) | (0.24) | (0.16) | (0.06) | ||||
| ||||||||
Net increase/(decrease) in net asset value | 0.70 | 1.00 | (0.49) | 1.73 | ||||
| ||||||||
Net asset value, end of period | $12.94 | $12.24 | $11.24 | $11.73 | ||||
| ||||||||
TOTAL RETURN(d) | 6.33% | 11.22% | (2.80)% | 17.99% | ||||
RATIOS/SUPPLEMENTAL DATA: | ||||||||
Net assets, end of period (000s) | $10,444 | $8,087 | $7,114 | $5,723 | ||||
Ratio of expenses to average net assets excluding fee waivers and reimbursements | 1.47%(e) | 1.58% | 1.73% | 2.17%(e) | ||||
Ratio of expenses to average net assets including fee waivers and reimbursements | 1.15%(e) | 1.20%(f) | 1.30% | 1.30%(e) | ||||
Ratio of net investment income to average net assets | 1.44%(e) | 2.17% | 1.50% | 1.48%(e) | ||||
Portfolio turnover rate(g) | 58% | 136% | 133% | 66% | ||||
| ||||||||
| (a) | Prior to January 1, 2012, the RiverFront Dynamic Equity Income Fund was known as the RiverFront Long-Term Growth & Income Fund. |
| (b) | Calculated using the average shares method. |
| (c) | Less than ($0.005) per share. |
| (d) | Total returns are for the period indicated and have not been annualized. Total returns would have been lower had certain expenses not been waived during the period. Returns shown do not reflect the deduction of taxes that a shareholder would pay on Fund distributions or the redemption of Fund shares. Returns shown exclude any applicable sales charges. |
| (e) | Annualized. |
| (f) | Contractual expense limitation change from 1.30% to 1.15% effective September 1, 2012. |
| (g) | Portfolio turnover rate for periods less than one full year have not been annualized. |
See Notes to Financial Statements. |
| 114 | October 31, 2013 |
RiverFront Dynamic Equity Income Fund – Class C | ||
Financial Highlights | ||
Selected data for a share of beneficial interest outstanding throughout the periods indicated:
For the Six Months Ended October 31, 2013 (Unaudited) | For the Year Ended April 30, 2013 | For the Year Ended April 30, 2012 (a) | For the Period August 2, 2010 (Inception) to April 30, 2011 | |||||
| ||||||||
Net asset value, beginning of period | $12.13 | $11.14 | $11.67 | $10.00 | ||||
INCOME/(LOSS) FROM INVESTMENT OPERATIONS: | ||||||||
Net investment income(b) | 0.04 | 0.16 | 0.09 | 0.05 | ||||
Net realized and unrealized gain/(loss) | 0.69 | 0.98 | (0.51) | 1.67 | ||||
| ||||||||
Total from investment operations | 0.73 | 1.14 | (0.42) | 1.72 | ||||
| ||||||||
DISTRIBUTIONS: | ||||||||
From net investment income | (0.05) | (0.15) | (0.10) | (0.05) | ||||
From net realized gains | – | – | – | (0.00)(c) | ||||
Tax return of capital | – | – | (0.01) | (0.00)(c) | ||||
| ||||||||
Total distributions | (0.05) | (0.15) | (0.11) | (0.05) | ||||
| ||||||||
Net increase/(decrease) in net asset value | 0.68 | 0.99 | (0.53) | 1.67 | ||||
| ||||||||
Net asset value, end of period | $12.81 | $12.13 | $11.14 | $11.67 | ||||
| ||||||||
TOTAL RETURN(d) | 6.05% | 10.41% | (3.60)% | 17.32% | ||||
RATIOS/SUPPLEMENTAL DATA: | ||||||||
Net assets, end of period (000s) | $20,483 | $16,070 | $13,729 | $9,223 | ||||
Ratio of expenses to average net assets excluding fee waivers and reimbursements | 2.22%(e) | 2.33% | 2.49% | 3.10%(e) | ||||
Ratio of expenses to average net assets including fee waivers and reimbursements | 1.90%(e) | 1.95%(f) | 2.05% | 2.05%(e) | ||||
Ratio of net investment income to average net assets | 0.65%(e) | 1.44% | 0.84% | 0.65%(e) | ||||
Portfolio turnover rate(g) | 58% | 136% | 133% | 66% | ||||
| ||||||||
| (a) | Prior to January 1, 2012, the RiverFront Dynamic Equity Income Fund was known as the RiverFront Long-Term Growth & Income Fund. |
| (b) | Calculated using the average shares method. |
| (c) | Less than ($0.005) per share. |
| (d) | Total returns are for the period indicated and have not been annualized. Total returns would have been lower had certain expenses not been waived during the period. Returns shown do not reflect the deduction of taxes that a shareholder would pay on Fund distributions or the redemption of Fund shares. Returns shown exclude any applicable sales charges. |
| (e) | Annualized. |
| (f) | Contractual expense limitation change from 2.05% to 1.90% effective September 1, 2012. |
| (g) | Portfolio turnover rate for periods less than one full year have not been annualized. |
See Notes to Financial Statements. |
| 115 | October 31, 2013 |
RiverFront Dynamic Equity Income Fund – Class I | ||
Financial Highlights | ||
Selected data for a share of beneficial interest outstanding throughout the periods indicated:
For the Six Months Ended October 31, 2013 (Unaudited) | For the Year Ended April 30, 2013 | For the Year Ended April 30, 2012 (a) | For the Period August 2, 2010 (Inception) to April 30, 2011 | |||||
| ||||||||
Net asset value, beginning of period | $12.16 | $11.17 | $11.64 | $10.00 | ||||
INCOME/(LOSS) FROM INVESTMENT OPERATIONS: | ||||||||
Net investment income(b) | 0.10 | 0.27 | 0.20 | 0.12 | ||||
Net realized and unrealized gain/(loss) | 0.70 | 0.99 | (0.50) | 1.68 | ||||
| ||||||||
Total from investment operations | 0.80 | 1.26 | (0.30) | 1.80 | ||||
| ||||||||
DISTRIBUTIONS: | ||||||||
From net investment income | (0.10) | (0.27) | (0.16) | (0.15) | ||||
From net realized gains | – | – | – | (0.00)(c) | ||||
Tax return of capital | – | – | (0.01) | (0.01) | ||||
| ||||||||
Total distributions | (0.10) | (0.27) | (0.17) | (0.16) | ||||
| ||||||||
Net increase/(decrease) in net asset value | 0.70 | 0.99 | (0.47) | 1.64 | ||||
| ||||||||
Net asset value, end of period | $12.86 | $12.16 | $11.17 | $11.64 | ||||
| ||||||||
TOTAL RETURN(d) | 6.60% | 11.47% | (2.58)% | 18.21% | ||||
RATIOS/SUPPLEMENTAL DATA: | ||||||||
Net assets, end of period (000s) | $14,789 | $10,460 | $6,897 | $3,301 | ||||
Ratio of expenses to average net assets excluding fee waivers and reimbursements | 1.22%(e) | 1.33% | 1.49% | 2.44%(e) | ||||
Ratio of expenses to average net assets including fee waivers and reimbursements | 0.90%(e) | 0.95%(f) | 1.05% | 1.05%(e) | ||||
Ratio of net investment income to average net assets | 1.65%(e) | 2.36% | 1.88% | 1.49%(e) | ||||
Portfolio turnover rate(g) | 58% | 136% | 133% | 66% | ||||
| ||||||||
| (a) | Prior to January 1, 2012, the RiverFront Dynamic Equity Income Fund was known as the RiverFront Long-Term Growth & Income Fund. |
| (b) | Calculated using the average shares method. |
| (c) | Less than ($0.005) per share. |
| (d) | Total returns are for the period indicated and have not been annualized. Total returns would have been lower had certain expenses not been waived during the period. Returns shown do not reflect the deduction of taxes that a shareholder would pay on Fund distributions or the redemption of Fund shares. |
| (e) | Annualized. |
| (f) | Contractual expense limitation change from 1.05% to 0.90% effective September 1, 2012. |
| (g) | Portfolio turnover rate for periods less than one full year have not been annualized. |
See Notes to Financial Statements. |
| 116 | October 31, 2013 |
RiverFront Global Allocation Fund – Class A | ||
Financial Highlights | ||
Selected data for a share of beneficial interest outstanding throughout the periods indicated:
For the Six Months Ended October 31, 2013 (Unaudited) | For the Year Ended April 30, 2013 | For the Year Ended April 30, 2012 (a) | For the Period August 2, 2010 (Inception) to April 30, 2011 | |||||
| ||||||||
Net asset value, beginning of period | $11.93 | $10.86 | $11.66 | $10.00 | ||||
INCOME/(LOSS) FROM INVESTMENT OPERATIONS: | ||||||||
Net investment income(b) | 0.05 | 0.15 | 0.12 | 0.10 | ||||
Net realized and unrealized gain/(loss) | 0.92 | 1.08 | (0.84) | 1.61 | ||||
| ||||||||
Total from investment operations | 0.97 | 1.23 | (0.72) | 1.71 | ||||
| ||||||||
DISTRIBUTIONS: | ||||||||
From net investment income | – | (0.16) | (0.07) | (0.05) | ||||
From net realized gains | – | – | (0.01) | – | ||||
| ||||||||
Total distributions | – | (0.16) | (0.08) | (0.05) | ||||
| ||||||||
Net increase/(decrease) in net asset value | 0.97 | 1.07 | (0.80) | 1.66 | ||||
| ||||||||
Net asset value, end of period | $12.90 | $11.93 | $10.86 | $11.66 | ||||
| ||||||||
TOTAL RETURN(c) | 8.13% | 11.47% | (6.18)% | 17.12% | ||||
RATIOS/SUPPLEMENTAL DATA: | ||||||||
Net assets, end of period (000s) | $8,747 | $8,244 | $5,791 | $4,686 | ||||
Ratio of expenses to average net assets excluding fee waivers and reimbursements | 1.56%(d) | 1.68% | 1.80% | 3.00%(d) | ||||
Ratio of expenses to average net assets including fee waivers and reimbursements | 1.15%(d) | 1.19%(e) | 1.30% | 1.30%(d) | ||||
Ratio of net investment income to average net assets | 0.87%(d) | 1.32% | 1.10% | 1.16%(d) | ||||
Portfolio turnover rate(f) | 45% | 113% | 163% | 77% | ||||
| ||||||||
| (a) | Prior to January 1, 2012, the RiverFront Global Allocation Fund was known as the RiverFront Moderate Growth Fund. |
| (b) | Calculated using the average shares method. |
| (c) | Total returns are for the period indicated and have not been annualized. Total returns would have been lower had certain expenses not been waived during the period. Returns shown do not reflect the deduction of taxes that a shareholder would pay on Fund distributions or the redemption of Fund shares. Returns shown exclude any applicable sales charges. |
| (d) | Annualized. |
| (e) | Contractual expense limitation change from 1.30% to 1.15% effective September 1, 2012. |
| (f) | Portfolio turnover rate for periods less than one full year have not been annualized. |
See Notes to Financial Statements. |
| 117 | October 31, 2013 |
RiverFront Global Allocation Fund – Class C | ||
Financial Highlights | ||
Selected data for a share of beneficial interest outstanding throughout the periods indicated:
For the Six Months Ended October 31, 2013 (Unaudited) | For the Year Ended April 30, 2013 | For the Year Ended April 30, 2012 (a) | For the Period August 2, 2010 (Inception) to April 30, 2011 | |||||
| ||||||||
Net asset value, beginning of period | $11.84 | $10.81 | $11.64 | $10.00 | ||||
INCOME/(LOSS) FROM INVESTMENT OPERATIONS: | ||||||||
Net investment income(b) | 0.00(c) | 0.07 | 0.02 | 0.00(c) | ||||
Net realized and unrealized gain/(loss) | 0.92 | 1.07 | (0.82) | 1.65 | ||||
| ||||||||
Total from investment operations | 0.92 | 1.14 | (0.80) | 1.65 | ||||
| ||||||||
DISTRIBUTIONS: | ||||||||
From net investment income | – | (0.11) | (0.02) | (0.01) | ||||
From net realized gains | – | – | (0.01) | – | ||||
| ||||||||
Total distributions | – | (0.11) | (0.03) | (0.01) | ||||
| ||||||||
Net increase/(decrease) in net asset value | 0.92 | 1.03 | (0.83) | 1.64 | ||||
| ||||||||
Net asset value, end of period | $12.76 | $11.84 | $10.81 | $11.64 | ||||
| ||||||||
TOTAL RETURN(d) | 7.77% | 10.59% | (6.86)% | 16.52% | ||||
RATIOS/SUPPLEMENTAL DATA: | ||||||||
Net assets, end of period (000s) | $11,665 | $9,686 | $9,891 | $8,926 | ||||
Ratio of expenses to average net assets excluding fee waivers and reimbursements | 2.31%(e) | 2.44% | 2.58% | 3.21%(e) | ||||
Ratio of expenses to average net assets including fee waivers and reimbursements | 1.90%(e) | 1.95%(f) | 2.05% | 2.05%(e) | ||||
Ratio of net investment income to average net assets | 0.06%(e) | 0.66% | 0.17% | 0.04%(e) | ||||
Portfolio turnover rate(g) | 45% | 113% | 163% | 77% | ||||
| ||||||||
| (a) | Prior to January 1, 2012, the RiverFront Global Allocation Fund was known as the RiverFront Moderate Growth Fund. |
| (b) | Calculated using the average shares method. |
| (c) | Less than $0.005 per share. |
| (d) | Total returns are for the period indicated and have not been annualized. Total returns would have been lower had certain expenses not been waived during the period. Returns shown do not reflect the deduction of taxes that a shareholder would pay on Fund distributions or the redemption of Fund shares. Returns shown exclude any applicable sales charges. |
| (e) | Annualized. |
| (f) | Contractual expense limitation change from 2.05% to 1.90% effective September 1, 2012. |
| (g) | Portfolio turnover rate for periods less than one full year have not been annualized. |
See Notes to Financial Statements. |
| 118 | October 31, 2013 |
RiverFront Global Allocation Fund – Class I | ||
Financial Highlights | ||
Selected data for a share of beneficial interest outstanding throughout the periods indicated:
For the Six Months Ended October 31, 2013 (Unaudited) | For the Year Ended April 30, 2013 | For the Year Ended April 30, 2012 (a) | For the Period August 2, 2010 (Inception) to April 30, 2011 | |||||
| ||||||||
Net asset value, beginning of period | $11.72 | $10.66 | $11.42 | $10.00 | ||||
INCOME/(LOSS) FROM INVESTMENT OPERATIONS: | ||||||||
Net investment income(b) | 0.06 | 0.17 | 0.13 | 0.08 | ||||
Net realized and unrealized gain/(loss) | 0.91 | 1.07 | (0.80) | 1.62 | ||||
| ||||||||
Total from investment operations | 0.97 | 1.24 | (0.67) | 1.70 | ||||
| ||||||||
DISTRIBUTIONS: | ||||||||
From net investment income | – | (0.18) | (0.08) | (0.28) | ||||
From net realized gains | – | – | (0.01) | – | ||||
| ||||||||
Total distributions | – | (0.18) | (0.09) | (0.28) | ||||
| ||||||||
Net increase/(decrease) in net asset value | 0.97 | 1.06 | (0.76) | 1.42 | ||||
| ||||||||
Net asset value, end of period | $12.69 | $11.72 | $10.66 | $11.42 | ||||
| ||||||||
TOTAL RETURN(c) | 8.28% | 11.73% | (5.86)% | 17.20% | ||||
RATIOS/SUPPLEMENTAL DATA: | ||||||||
Net assets, end of period (000s) | $8,696 | $6,675 | $3,496 | $1,905 | ||||
Ratio of expenses to average net assets excluding fee waivers and reimbursements | 1.31%(d) | 1.43% | 1.55% | 4.68%(d) | ||||
Ratio of expenses to average net assets including fee waivers and reimbursements | 0.90%(d) | 0.94%(e) | 1.05% | 1.05%(d) | ||||
Ratio of net investment income to average net assets | 1.06%(d) | 1.52% | 1.28% | 0.98%(d) | ||||
Portfolio turnover rate(f) | 45% | 113% | 163% | 77% | ||||
| ||||||||
| (a) | Prior to January 1, 2012, the RiverFront Global Allocation Fund was known as the RiverFront Moderate Growth Fund. |
| (b) | Calculated using the average shares method. |
| (c) | Total returns are for the period indicated and have not been annualized. Total returns would have been lower had certain expenses not been waived during the period. Returns shown do not reflect the deduction of taxes that a shareholder would pay on Fund distributions or the redemption of Fund shares. |
| (d) | Annualized. |
| (e) | Contractual expense limitation change from 1.05% to 0.90% effective September 1, 2012. |
| (f) | Portfolio turnover rate for periods less than one full year have not been annualized. |
See Notes to Financial Statements. |
| 119 | October 31, 2013 |
RiverFront Global Growth Fund – Class A | ||
Financial Highlights | ||
Selected data for a share of beneficial interest outstanding throughout the periods indicated:
For the Six Months Ended October 31, 2013 (Unaudited) | For the Year Ended April 30, 2013 | For the Year April 30, 2012 (a) | For the Period January 1, 2011 to April 30, 2011 (b) | For the Period September 27, 2010 (Inception) to December 31, 2010 | ||||||
| ||||||||||
Net asset value, beginning of period | $14.89 | $13.37 | $15.65 | $14.66 | $13.68 | |||||
INCOME/(LOSS) FROM INVESTMENT OPERATIONS: | ||||||||||
Net investment income(c) | 0.05 | 0.17 | 0.14 | 0.00(d) | 0.23 | |||||
Net realized and unrealized gain/(loss) | 1.31 | 1.57 | (1.41) | 0.99 | 1.03 | |||||
| ||||||||||
Total from investment operations | 1.36 | 1.74 | (1.27) | 0.99 | 1.26 | |||||
| ||||||||||
DISTRIBUTIONS: | ||||||||||
From net investment income | – | (0.22) | (0.14) | – | (0.14) | |||||
From net realized gains | – | – | (0.87) | – | (0.14) | |||||
| ||||||||||
Total distributions | – | (0.22) | (1.01) | – | (0.28) | |||||
| ||||||||||
Net increase/(decrease) in net asset value | 1.36 | 1.52 | (2.28) | 0.99 | 0.98 | |||||
| ||||||||||
Net asset value, end of period | $16.25 | $14.89 | $13.37 | $15.65 | $14.66 | |||||
| ||||||||||
TOTAL RETURN(e) | 9.13% | 13.14% | (7.51)% | 6.75% | 9.22% | |||||
RATIOS/SUPPLEMENTAL DATA: | ||||||||||
Net assets, end of period (000s) | $12,143 | $8,525 | $5,241 | $12,307 | $1,934 | |||||
Ratio of expenses to average net assets excluding fee waivers and reimbursements | 1.43%(f) | 1.49% | 1.52% | 1.58%(f) | 2.15%(f) | |||||
Ratio of expenses to average net assets including fee waivers and reimbursements (includes acquired fund fee reimbursements) | N/A | 0.98%(g) | 0.92% | 0.81%(f) | 0.91%(f) | |||||
Ratio of expenses to average net assets including fee waivers and reimbursements (excludes acquired fund fee reimbursements) | 1.15%(f) | 1.15% | 1.15% | 1.15%(f) | 1.15%(f) | |||||
Ratio of net investment income to average net assets | 0.68%(f) | 1.23% | 0.99% | 0.06%(f) | 6.20%(f) | |||||
Portfolio turnover rate(h) | 44% | 113% | 119% | 34% | 99% | |||||
| ||||||||||
| (a) | Prior to January 1, 2012, the RiverFront Global Growth Fund was known as the RiverFront Long-Term Growth Fund. |
| (b) | Effective March 8, 2011, the Board approved changing the fiscal year-end of the Fund from December 31 to April 30. |
| (c) | Calculated using the average shares method. |
| (d) | Less than $0.005 per share. |
| (e) | Total returns are for the period indicated and have not been annualized. Total returns would have been lower had certain expenses not been waived during the period. Returns shown do not reflect the deduction of taxes that a shareholder would pay on Fund distributions or the redemption of Fund shares. Returns shown exclude any applicable sales charges. |
| (f) | Annualized. |
| (g) | Prior to January 1, 2013, all acquired fund fees were reimbursed. |
| (h) | Portfolio turnover rate for periods less than one full year have not been annualized. |
See Notes to Financial Statements. |
| 120 | October 31, 2013 |
RiverFront Global Growth Fund – Class C | ||
Financial Highlights | ||
Selected data for a share of beneficial interest outstanding throughout the periods indicated:
For the Six Months Ended October 31, 2013 (Unaudited) | For the Year Ended April 30, 2013 | For the Year Ended April 30, 2012 (a) | For the Period January 1, 2011 to April 30, 2011 (b) | For the Period September 27, 2010 (Inception) to December 31, 2010 | ||||||
| ||||||||||
Net asset value, beginning of period | $14.76 | $13.29 | $15.60 | $14.63 | $13.68 | |||||
INCOME/(LOSS) FROM INVESTMENT OPERATIONS: | ||||||||||
Net investment income/(loss)(c) | 0.00(d) | 0.08 | 0.05 | (0.04) | 0.20 | |||||
Net realized and unrealized gain/(loss) | 1.30 | 1.54 | (1.42) | 1.01 | 1.02 | |||||
| ||||||||||
Total from investment operations | 1.30 | 1.62 | (1.37) | 0.97 | 1.22 | |||||
| ||||||||||
DISTRIBUTIONS: | ||||||||||
From net investment income | – | (0.15) | (0.07) | – | (0.13) | |||||
From net realized gains | – | – | (0.87) | – | (0.14) | |||||
| ||||||||||
Total distributions | – | (0.15) | (0.94) | – | (0.27) | |||||
| ||||||||||
Net increase/(decrease) in net asset value | 1.30 | 1.47 | (2.31) | 0.97 | 0.95 | |||||
| ||||||||||
Net asset value, end of period | $16.06 | $14.76 | $13.29 | $15.60 | $14.63 | |||||
| ||||||||||
TOTAL RETURN(e) | 8.81% | 12.31% | (8.22)% | 6.63% | 8.91% | |||||
RATIOS/SUPPLEMENTAL DATA: | ||||||||||
Net assets, end of period (000s) | $9,371 | $7,182 | $6,808 | $6,156 | $2,050 | |||||
Ratio of expenses to average net assets excluding fee waivers and reimbursements | 2.18%(f) | 2.25% | 2.29% | 2.33%(f) | 2.89%(f) | |||||
Ratio of expenses to average net assets including fee waivers and reimbursements (includes acquired fund fee reimbursements) | N/A | 1.73%(g) | 1.67% | 1.55%(f) | 1.66%(f) | |||||
Ratio of expenses to average net assets including fee waivers and reimbursements (excludes acquired fund fee reimbursements) | 1.90%(f) | 1.90% | 1.90% | 1.90%(f) | 1.90%(f) | |||||
Ratio of net investment income/(loss) to average net assets | 0.01%(f) | 0.57% | 0.34% | (0.72)%(f) | 5.36%(f) | |||||
Portfolio turnover rate(h) | 44% | 113% | 119% | 34% | 99% | |||||
| ||||||||||
| (a) | Prior to January 1, 2012, the RiverFront Global Growth Fund was known as the RiverFront Long-Term Growth Fund. |
| (b) | Effective March 8, 2011, the Board approved changing the fiscal year-end of the Fund from December 31 to April 30. |
| (c) | Calculated using the average shares method. |
| (d) | Less than $0.005 per share. |
| (e) | Total returns are for the period indicated and have not been annualized. Total returns would have been lower had certain expenses not been waived during the period. Returns shown do not reflect the deduction of taxes that a shareholder would pay on Fund distributions or the redemption of Fund shares. Returns shown exclude any applicable sales charges. |
| (f) | Annualized. |
| (g) | Prior to January 1, 2013, all acquired fund fees were reimbursed. |
| (h) | Portfolio turnover rate for periods less than one full year have not been annualized. |
See Notes to Financial Statements. |
| 121 | October 31, 2013 |
RiverFront Global Growth Fund – Class I | ||
Financial Highlights | ||
Selected data for a share of beneficial interest outstanding throughout the periods indicated:
For the Six Months Ended October 31, 2013 (Unaudited) | For the Year April 30, 2013 | For the Year Ended April 30, 2012 (a) | For the Period January 1, 2011 to April 30, 2011 (b) | For the Period September 27, 2010 (Inception) to December 31, 2010 | ||||||
| ||||||||||
Net asset value, beginning of period | $14.92 | $13.40 | $15.67 | $14.65 | $13.68 | |||||
INCOME/(LOSS) FROM INVESTMENT OPERATIONS: | ||||||||||
Net investment income(c) | 0.09 | 0.20 | 0.19 | 0.01 | 0.17 | |||||
Net realized and unrealized gain/(loss) | 1.30 | 1.57 | (1.43) | 1.01 | 1.09 | |||||
| ||||||||||
Total from investment operations | 1.39 | 1.77 | (1.24) | 1.02 | 1.26 | |||||
| ||||||||||
DISTRIBUTIONS: | ||||||||||
From net investment income | – | (0.25) | (0.16) | – | (0.15) | |||||
From net realized gains | – | – | (0.87) | – | (0.14) | |||||
| ||||||||||
Total distributions | – | (0.25) | (1.03) | – | (0.29) | |||||
| ||||||||||
Net increase/(decrease) in net asset value | 1.39 | 1.52 | (2.27) | 1.02 | 0.97 | |||||
| ||||||||||
Net asset value, end of period | $16.31 | $14.92 | $13.40 | $15.67 | $14.65 | |||||
| ||||||||||
TOTAL RETURN(d) | 9.32% | 13.36% | (7.31)% | 7.04% | 9.12% | |||||
RATIOS/SUPPLEMENTAL DATA: | ||||||||||
Net assets, end of period (000s) | $11,227 | $7,769 | $6,022 | $4,508 | $2,280 | |||||
Ratio of expenses to average net assets excluding fee waivers and reimbursements | 1.18%(e) | 1.25% | 1.30% | 1.30%(e) | 1.74%(e) | |||||
Ratio of expenses to average net assets including fee waivers and reimbursements (includes acquired fund fee reimbursements) | N/A | 0.73%(f) | 0.67% | 0.61%(e) | 0.66%(e) | |||||
Ratio of expenses to average net assets including fee waivers and reimbursements (excludes acquired fund fee reimbursements) | 0.90%(e) | 0.90% | 0.90% | 0.90%(e) | 0.90%(e) | |||||
Ratio of net investment income to average net assets | 1.10%(e) | 1.45% | 1.40% | 0.23%(e) | 4.70%(e) | |||||
Portfolio turnover rate(g) | 44% | 113% | 119% | 34% | 99% | |||||
| ||||||||||
| (a) | Prior to January 1, 2012, the RiverFront Global Growth Fund was known as the RiverFront Long-Term Growth Fund. |
| (b) | Effective March 8, 2011, the Board approved changing the fiscal year-end of the Fund from December 31 to April 30. |
| (c) | Calculated using the average shares method. |
| (d) | Total returns are for the period indicated and have not been annualized. Total returns would have been lower had certain expenses not been waived during the period. Returns shown do not reflect the deduction of taxes that a shareholder would pay on Fund distributions or the redemption of Fund shares. |
| (e) | Annualized. |
| (f) | Prior to January 1, 2013, all acquired fund fees were reimbursed. |
| (g) | Portfolio turnover rate for periods less than one full year have not been annualized. |
See Notes to Financial Statements. |
| 122 | October 31, 2013 |
RiverFront Global Growth Fund – Class L | ||
Financial Highlights | ||
Selected data for a share of beneficial interest outstanding throughout the periods indicated:
For the Six Months Ended October 31, 2013 (Unaudited) | For the Year Ended April 30, 2013 | For the Year Ended April 30, 2012 (a) | For the Period January 1, 2011 to April 30, 2011 (b) | For the Year Ended December 31, 2010 | For the Year Ended December 31, 2009 | For the Period October 28, 2008 (Inception) to December 31, 2008 | ||||||||
| ||||||||||||||
Net asset value, beginning of period | $14.90 | $13.37 | $15.65 | $14.63 | $13.22 | $10.49 | $10.00 | |||||||
INCOME/(LOSS) FROM INVESTMENT OPERATIONS: | ||||||||||||||
Net investment income(c) | 0.08 | 0.22 | 0.17 | 0.01 | 0.18 | 0.16 | 0.12 | |||||||
Net realized and unrealized gain/(loss) | 1.31 | 1.56 | (1.41) | 1.01 | 1.52 | 2.66 | 0.46 | |||||||
| ||||||||||||||
Total from investment operations | 1.39 | 1.78 | (1.24) | 1.02 | 1.70 | 2.82 | 0.58 | |||||||
| ||||||||||||||
DISTRIBUTIONS: | ||||||||||||||
From net investment income | – | (0.25) | (0.17) | – | (0.15) | (0.09) | (0.09) | |||||||
From net realized gains | – | – | (0.87) | – | (0.14) | – | – | |||||||
| ||||||||||||||
Total distributions | – | (0.25) | (1.04) | – | (0.29) | (0.09) | (0.09) | |||||||
| ||||||||||||||
Net increase/(decrease) in net asset value | 1.39 | 1.53 | (2.28) | 1.02 | 1.41 | 2.73 | 0.49 | |||||||
| ||||||||||||||
Net asset value, end of period | $16.29 | $14.90 | $13.37 | $15.65 | $14.63 | $13.22 | $10.49 | |||||||
| ||||||||||||||
TOTAL RETURN(d) | 9.33% | 13.43% | (7.31)% | 6.97% | 12.87% | 26.86% | 5.81% | |||||||
RATIOS/SUPPLEMENTAL DATA: | ||||||||||||||
Net assets, end of period (000s) | $24,072 | $23,454 | $24,765 | $42,977 | $43,240 | $27,763 | $7,439 | |||||||
Ratio of expenses to average net assets excluding fee waivers and reimbursements | 1.18%(e) | 1.25% | 1.08% | 1.28%(e) | 1.22% | 1.53% | 4.97%(e) | |||||||
Ratio of expenses to average net assets including fee waivers and reimbursements (includes acquired fund fee reimbursements) | N/A | 0.73%(f) | 0.67% | 0.64%(e) | 0.66% | N/A | N/A | |||||||
Ratio of expenses to average net assets including fee waivers and reimbursements (excludes acquired fund fee reimbursements) | 0.90%(e) | 0.90% | 0.90% | 0.90%(e) | 0.90% | 0.90% | 0.90%(e) | |||||||
Ratio of net investment income to average net assets | 1.07%(e) | 1.59% | 1.26% | 0.19%(e) | 1.33% | 1.34% | 7.55%(e) | |||||||
Portfolio turnover rate(g) | 44% | 113% | 119% | 34% | 99% | 67% | 13% | |||||||
| ||||||||||||||
| (a) | Prior to January 1, 2012, the RiverFront Global Growth Fund was known as the RiverFront Long-Term Growth Fund. |
| (b) | Effective March 8, 2011, the Board approved changing the fiscal year-end of the Fund from December 31 to April 30. |
| (c) | Calculated using the average shares method. |
| (d) | Total returns are for the period indicated and have not been annualized. Total returns would have been lower had certain expenses not been waived during the period. Returns shown do not reflect the deduction of taxes that a shareholder would pay on Fund distributions or the redemption of Fund shares. |
| (e) | Annualized. |
| (f) | Prior to January 1, 2013, all acquired fund fees were reimbursed. |
| (g) | Portfolio turnover rate for periods less than one full year have not been annualized. |
See Notes to Financial Statements. |
| 123 | October 31, 2013 |
RiverFront Global Growth Fund – Investor Class | ||
Financial Highlights | ||
Selected data for a share of beneficial interest outstanding throughout the periods indicated: | ||
For the Six Months | For the Year April 30, 2013 | For the Year April 30, 2012 (a) | For the Period to April 30, 2011 (b) | For the Year Ended December 31, 2010 | For the Year Ended December 31, 2009 | For the Period October 28, 2008 (Inception) to December 31, 2008 | ||||||||
| ||||||||||||||
Net asset value, beginning of period | $14.82 | $13.32 | $15.59 | $14.59 | $13.19 | $10.49 | $10.00 | |||||||
INCOME/(LOSS) FROM INVESTMENT OPERATIONS: | ||||||||||||||
Net investment income(c) | 0.06 | 0.18 | 0.13 | 0.00(d) | 0.12 | 0.13 | 0.12 | |||||||
Net realized and unrealized gain/(loss) | 1.30 | 1.54 | (1.39) | 1.00 | 1.54 | 2.65 | 0.46 | |||||||
| ||||||||||||||
Total from investment operations | 1.36 | 1.72 | (1.26) | 1.00 | 1.66 | 2.78 | 0.58 | |||||||
| ||||||||||||||
DISTRIBUTIONS: | ||||||||||||||
From net investment income | – | (0.22) | (0.14) | – | (0.12) | (0.08) | (0.09) | |||||||
From net realized gains | – | – | (0.87) | – | (0.14) | – | – | |||||||
| ||||||||||||||
Total distributions | – | (0.22) | (1.01) | – | (0.26) | (0.08) | (0.09) | |||||||
| ||||||||||||||
Net increase/(decrease) in net asset value | 1.36 | 1.50 | (2.27) | 1.00 | 1.40 | 2.70 | 0.49 | |||||||
| ||||||||||||||
Net asset value, end of period | $16.18 | $14.82 | $13.32 | $15.59 | $14.59 | $13.19 | $10.49 | |||||||
| ||||||||||||||
| ||||||||||||||
TOTAL RETURN(e) | 9.18% | 13.07% | (7.47)% | 6.79% | 12.58% | 26.58% | 5.68% | |||||||
RATIOS/SUPPLEMENTAL DATA: | ||||||||||||||
Net assets, end of period (000s) | $8,756 | $9,174 | $10,133 | $21,270 | $23,556 | $13,882 | $426 | |||||||
Ratio of expenses to average net assets excluding fee waivers and reimbursements | 1.43%(f) | 1.50% | 1.93% | 1.53%(f) | 1.47% | 1.78% | 5.22%(f) | |||||||
Ratio of expenses to average net assets including fee waivers and reimbursements (includes acquired fund fee reimbursements) | N/A | 0.98%(g) | 0.92% | 0.89%(f) | 0.91% | N/A | N/A | |||||||
Ratio of expenses to average net assets including fee waivers and reimbursements (excludes acquired fund fee reimbursements) | 1.15%(f) | 1.15% | 1.15% | 1.15%(f) | 1.15% | 1.15% | 1.15%(f) | |||||||
Ratio of net investment income/ (loss) to average net assets | 0.81%(f) | 1.36% | 0.97% | (0.08)%(f) | 0.93% | 1.09% | 7.30%(f) | |||||||
Portfolio turnover rate(h) | 44% | 113% | 119% | 34% | 99% | 67% | 13% | |||||||
| ||||||||||||||
| (a) | Prior to January 1, 2012, the RiverFront Global Growth Fund was known as the RiverFront Long-Term Growth Fund. |
| (b) | Effective March 8, 2011, the Board approved changing the fiscal year-end of the Fund from December 31 to April 30. |
| (c) | Calculated using the average shares method. |
| (d) | Less than $0.005 per share. |
| (e) | Total returns are for the period indicated and have not been annualized. Total returns would have been lower had certain expenses not been waived during the period. Returns shown do not reflect the deduction of taxes that a shareholder would pay on Fund distributions or the redemption of Fund shares. |
| (f) | Annualized. |
| (g) | Prior to January 1, 2013, all acquired fund fees were reimbursed. |
| (h) | Portfolio turnover rate for periods less than one full year have not been annualized. |
See Notes to Financial Statements. |
| 124 | October 31, 2013 |
RiverFront Moderate Growth & Income Fund – Class A | ||
Financial Highlights | ||
Selected data for a share of beneficial interest outstanding throughout the periods indicated:
For the Six Months Ended October 31, 2013 (Unaudited) | For the Year Ended April 30, 2013 | For the Year Ended April 30, 2012 | For the Period August 2, 2010 (Inception) to April 30, 2011 | |||||
| ||||||||
Net asset value, beginning of period | $11.66 | $10.96 | $11.08 | $10.00 | ||||
INCOME/(LOSS) FROM INVESTMENT OPERATIONS: | ||||||||
Net investment income(a) | 0.08 | 0.24 | 0.17 | 0.15 | ||||
Net realized and unrealized gain/(loss) | 0.46 | 0.69 | (0.12) | 1.01 | ||||
| ||||||||
Total from investment operations | 0.54 | 0.93 | 0.05 | 1.16 | ||||
| ||||||||
DISTRIBUTIONS: | ||||||||
From net investment income | (0.08) | (0.23) | (0.17) | (0.08) | ||||
From net realized gains | – | – | – | (0.00)(b) | ||||
Tax return of capital | – | – | (0.00)(b) | – | ||||
| ||||||||
Total distributions | (0.08) | (0.23) | (0.17) | (0.08) | ||||
| ||||||||
Net increase/(decrease) in net asset value | 0.46 | 0.70 | (0.12) | 1.08 | ||||
| ||||||||
Net asset value, end of period | $12.12 | $11.66 | $10.96 | $11.08 | ||||
| ||||||||
TOTAL RETURN(c) | 4.62% | 8.59% | 0.55% | 11.70% | ||||
RATIOS/SUPPLEMENTAL DATA: | ||||||||
Net assets, end of period (000s) | $32,392 | $29,066 | $20,754 | $12,148 | ||||
Ratio of expenses to average net assets excluding fee waivers and reimbursements | 1.34%(d) | 1.40% | 1.50% | 1.64%(d) | ||||
Ratio of expenses to average net assets including fee waivers and reimbursements | 1.15%(d) | 1.19%(e) | 1.30% | 1.30%(d) | ||||
Ratio of net investment income to average net assets | 1.32%(d) | 2.17% | 1.65% | 1.89%(d) | ||||
Portfolio turnover rate(f) | 60% | 108% | 128% | 69% | ||||
| ||||||||
| (a) | Calculated using the average shares method. |
| (b) | Less than ($0.005) per share. |
| (c) | Total returns are for the period indicated and have not been annualized. Total returns would have been lower had certain expenses not been waived during the period. Returns shown do not reflect the deduction of taxes that a shareholder would pay on Fund distributions or the redemption of Fund shares. Returns shown exclude any applicable sales charges. |
| (d) | Annualized. |
| (e) | Contractual expense limitation change from 1.30% to 1.15% effective September 1, 2012. |
| (f) | Portfolio turnover rate for periods less than one full year have not been annualized. |
See Notes to Financial Statements. |
| 125 | October 31, 2013 |
RiverFront Moderate Growth & Income Fund – Class C | ||
Financial Highlights | ||
Selected data for a share of beneficial interest outstanding throughout the periods indicated:
For the Six Months Ended October 31, 2013 (Unaudited) | For the Year Ended April 30, 2013 | For the Year Ended April 30, 2012 | For the Period August 2, 2010 (Inception) to | |||||
| ||||||||
Net asset value, beginning of period | $11.62 | $10.92 | $11.06 | $10.00 | ||||
INCOME/(LOSS) FROM INVESTMENT OPERATIONS: | ||||||||
Net investment income(a) | 0.03 | 0.16 | 0.09 | 0.10 | ||||
Net realized and unrealized gain/(loss) | 0.46 | 0.68 | (0.13) | 1.02 | ||||
| ||||||||
Total from investment operations | 0.49 | 0.84 | (0.04) | 1.12 | ||||
| ||||||||
DISTRIBUTIONS: | ||||||||
From net investment income | (0.04) | (0.14) | (0.10) | (0.06) | ||||
From net realized gains | – | – | – | (0.00)(b) | ||||
Tax return of capital | – | – | (0.00)(b) | – | ||||
| ||||||||
Total distributions | (0.04) | (0.14) | (0.10) | (0.06) | ||||
| ||||||||
Net increase/(decrease) in net asset value | 0.45 | 0.70 | (0.14) | 1.06 | ||||
| ||||||||
Net asset value, end of period | $12.07 | $11.62 | $10.92 | $11.06 | ||||
| ||||||||
TOTAL RETURN(c) | 4.23% | 7.83% | (0.37)% | 11.24% | ||||
RATIOS/SUPPLEMENTAL DATA: | ||||||||
Net assets, end of period (000s) | $59,202 | $52,579 | $39,015 | $24,061 | ||||
Ratio of expenses to average net assets excluding fee waivers and reimbursements | 2.09%(d) | 2.15% | 2.25% | 2.54%(d) | ||||
Ratio of expenses to average net assets including fee waivers and reimbursements | 1.90%(d) | 1.95%(e) | 2.05% | 2.05%(d) | ||||
Ratio of net investment income to average net assets | 0.54%(d) | 1.43% | 0.88% | 1.22%(d) | ||||
Portfolio turnover rate(f) | 60% | 108% | 128% | 69% | ||||
| ||||||||
| (a) | Calculated using the average shares method. |
| (b) | Less than ($0.005) per share. |
| (c) | Total returns are for the period indicated and have not been annualized. Total returns would have been lower had certain expenses not been waived during the period. Returns shown do not reflect the deduction of taxes that a shareholder would pay on Fund distributions or the redemption of Fund shares. Returns shown exclude any applicable sales charges. |
| (d) | Annualized. |
| (e) | Contractual expense limitation change from 2.05% to 1.90% effective September 1, 2012. |
| (f) | Portfolio turnover rate for periods less than one full year have not been annualized. |
See Notes to Financial Statements. |
| 126 | October 31, 2013 |
RiverFront Moderate Growth & Income Fund – Class I | ||
Financial Highlights | ||
Selected data for a share of beneficial interest outstanding throughout the periods indicated:
For the Six Months Ended October 31, 2013 (Unaudited) | For the Year Ended April 30, 2013 | For the Year Ended April 30, 2012 | For the Period August 2, 2010 (Inception) to April 30, 2011 | |||||
| ||||||||
Net asset value, beginning of period | $11.65 | $10.94 | $11.07 | $10.00 | ||||
INCOME/(LOSS) FROM INVESTMENT OPERATIONS: | ||||||||
Net investment income(a) | 0.09 | 0.26 | 0.20 | 0.17 | ||||
Net realized and unrealized gain/(loss) | 0.46 | 0.70 | (0.13) | 1.01 | ||||
| ||||||||
Total from investment operations | 0.55 | 0.96 | 0.07 | 1.18 | ||||
| ||||||||
DISTRIBUTIONS: | ||||||||
From net investment income | (0.09) | (0.25) | (0.19) | (0.11) | ||||
From net realized gains | – | – | – | (0.00)(b) | ||||
Tax return of capital | – | – | (0.01) | – | ||||
| ||||||||
Total distributions | (0.09) | (0.25) | (0.20) | (0.11) | ||||
| ||||||||
Net increase/(decrease) in net asset value | 0.46 | 0.71 | (0.13) | 1.07 | ||||
| ||||||||
Net asset value, end of period | $12.11 | $11.65 | $10.94 | $11.07 | ||||
| ||||||||
TOTAL RETURN(c) | 4.72% | 8.94% | 0.71% | 11.92% | ||||
RATIOS/SUPPLEMENTAL DATA: | ||||||||
Net assets, end of period (000s) | $34,244 | $25,898 | $12,880 | $7,535 | ||||
Ratio of expenses to average net assets excluding fee waivers and reimbursements | 1.09%(d) | 1.15% | 1.26% | 1.55%(d) | ||||
Ratio of expenses to average net assets including fee waivers and reimbursements | 0.90%(d) | 0.94%(e) | 1.05% | 1.05%(d) | ||||
Ratio of net investment income to average net assets | 1.55%(d) | 2.39% | 1.91% | 2.16%(d) | ||||
Portfolio turnover rate(f) | 60% | 108% | 128% | 69% | ||||
| ||||||||
| (a) | Calculated using the average shares method. |
| (b) | Less than ($0.005) per share. |
| (c) | Total returns are for the period indicated and have not been annualized. Total returns would have been lower had certain expenses not been waived during the period. Returns shown do not reflect the deduction of taxes that a shareholder would pay on Fund distributions or the redemption of Fund shares. |
| (d) | Annualized. |
| (e) | Contractual expense limitation change from 1.05% to 0.90% effective September 1, 2012. |
| (f) | Portfolio turnover rate for periods less than one full year have not been annualized. |
See Notes to Financial Statements. |
| 127 | October 31, 2013 |
| October 31, 2013 (Unaudited) | ||
1. ORGANIZATION
Financial Investors Trust (the “Trust”), a Delaware statutory trust, is an open-end management investment company registered under the Investment Company Act of 1940, as amended (“1940 Act”). As of October 31, 2013, the Trust had 28 registered funds. This semi-annual report describes the following funds: ALPS | Alerian MLP Infrastructure Index Fund, ALPS | CoreCommodity Management CompleteCommodities® Strategy Fund, ALPS | Kotak India Growth Fund, ALPS | Red Rocks Listed Private Equity Fund, ALPS | WMC Disciplined Value Fund, Clough China Fund, RiverFront Conservative Income Builder Fund, RiverFront Dynamic Equity Income Fund, RiverFront Global Allocation Fund, RiverFront Global Growth Fund and RiverFront Moderate Growth & Income Fund (each, a “Fund” and collectively, the “Funds”).
ALPS | Alerian MLP Infrastructure Index Fund seeks investment results that correspond (before fees and expenses) generally to the price and yield performance of its underlying index, the Alerian MLP Infrastructure Index. The ALPS | CoreCommodity Management CompleteCommodities® Strategy Fund seeks to maximize real returns, consistent with prudent investment management. ALPS | Kotak India Growth Fund seeks to achieve long-term capital appreciation. ALPS | Red Rocks Listed Private Equity Fund seeks to maximize total return, which consists of appreciation on its investments and a variable income stream. ALPS | WMC Disciplined Value Fund seeks long-term capital appreciation: dividend income may be a factor in portfolio selection but is secondary to the Fund’s principal objective. The Clough China Fund seeks to provide investors with long-term capital appreciation. The RiverFront Conservative Income Builder Fund seeks to provide current income and potential for that income to grow over time, primarily through investments in fixed-income securities, including high- and low-grade corporate debt, with the balance of the Fund (typically 20%-50%) invested in a diversified basket of dividend-paying stocks, including small-and mid-cap domestic and foreign securities. The RiverFront Dynamic Equity Income Fund seeks to achieve long-term growth and income through a combination of capital appreciation and rising dividend payments that exceed the average yield on global stocks generally. The RiverFront Global Allocation Fund seeks to provide high total investment return through a fully managed investment policy utilizing United States and foreign equity securities, debt and money market securities, the combination of which will be varied from time to time both with respect to types of securities and markets in response to changing market and economic trends. Total investment return means the combination of capital appreciation and investment income. The RiverFront Global Growth Fund seeks to achieve long-term capital appreciation through a fully managed investment policy utilizing United States and foreign equity securities, debt and money market securities, the combination of which will be varied from time to time both with respect to types of securities and markets in response to changing market and economic trends. The RiverFront Moderate Growth & Income Fund has two primary investment objectives: (1) seeks to provide a level of current income that exceeds the average yield on U.S. stocks in general and (2) to provide a growing stream of income over the years.
The classes of each fund differ principally in the applicable distribution and shareholder service fees. Shareholders of each class also bear certain expenses that pertain to that particular class. All shareholders bear the common expenses of the Fund and earn income and realized gains/losses from the Fund pro rata based on the average daily net assets of each class, without distinction between share classes. Dividends to shareholders are determined separately for each class based on income and expenses allocable to each class. Realized gain distributions to shareholders are allocated to each class pro rata based on the shares outstanding of each class on the date of distribution. Differences in per share dividend rates generally result from differences in separate class expenses, including distribution and shareholder service fees, if applicable.
Basis of Consolidation for the ALPS | Kotak India Growth Fund
ALPS | Kotak India Growth Fund, (the “Kotak Fund”) invests in the equity securities of Indian companies through its wholly owned, collective investment vehicle, the India Premier Equity Portfolio (the “Portfolio”). The Portfolio is registered with and regulated by the Mauritius Financial Services Commission. The Portfolio was formed for the purpose of facilitating the Kotak Fund’s purchase of securities of a wide selection of Indian companies, consistent with the Kotak Fund’s investment strategies. The Portfolio is a private company limited by shares incorporated under the Mauritius Companies Act 2001. As a wholly owned subsidiary of the Kotak Fund, financial statements of the Portfolio are included in the consolidated financial statements and financial highlights of the Kotak Fund. All investments held by the Portfolio are disclosed in the accounts of the Kotak Fund.
The Portfolio established residency in Mauritius allowing the Fund to receive the beneficial tax treatment under the Treaty between India and Mauritius. If the benefits of the Treaty are denied or if the Portfolio is held to have a permanent establishment in India, gains derived by the Portfolio due to the sale of securities, may be subject to taxation in India. India’s Finance Act of 2012 had introduced legislation on General Anti-Avoidance Rules (“GAAR”) into the Act which contains treaty override provisions. The GAAR may be used by the Indian tax authorities to declare any arrangement whose main purpose or one of the main purposes is to obtain a tax benefit, as an “impermissible avoidance arrangement”. Originally, GAAR was to be effective from April 1, 2012; however, subsequent to the 2013 amendments introduced to the Finance Act, GAAR has been deferred until April 1, 2015.
Basis of Consolidation for the ALPS | CoreCommodity Management CompleteCommodities® Strategy Fund
CoreCommodity Management Cayman Commodity Fund Ltd. (the “Subsidiary”), a Cayman Islands exempted company, was incorporated on April 23, 2010 and is a wholly owned subsidiary of the ALPS | CoreCommodity Management CompleteCommodities® Strategy Fund (the “CoreCommodity Fund”). The Subsidiary acts as an investment vehicle for the CoreCommodity Fund in order to effect certain commodity-related investments on behalf of the CoreCommodity Fund. CoreCommodity Fund is the sole shareholder of the Subsidiary pursuant to a subscription
| 128 | October 31, 2013 |
Notes to Financial Statements | ||
| October 31, 2013 (Unaudited) | ||
agreement dated as of June 14, 2010, and it is intended that the CoreCommodity Fund will remain the sole shareholder and will continue to wholly own and control the Subsidiary. Under the Articles of Association of the Subsidiary, shares issued by the Subsidiary confer upon a shareholder the right to vote at general meetings of the Subsidiary and certain rights in connection with any winding-up or repayment of capital, as well as the right to participate in the profits or assets of the Subsidiary. The CoreCommodity Fund may invest up to 25% of its total assets in shares of the Subsidiary. As a wholly owned subsidiary of the CoreCommodity Fund, the financial statements of the Subsidiary are included in the consolidated financial statements and financial highlights of the CoreCommodity Fund. All investments held by the Subsidiary are disclosed in the accounts of the CoreCommodity Fund. As of October 31, 2013, net assets of the CoreCommodity Fund were $366,734,962, of which $70,146,073, or 19.13%, represented the CoreCommodity Fund’s ownership of all issued shares and voting rights of the Subsidiary.
2. SIGNIFICANT ACCOUNTING POLICIES
The accompanying financial statements were prepared in accordance with accounting principles generally accepted in the United States of America (“U.S. GAAP”). The preparation of financial statements in conformity with U.S. GAAP requires management to make certain estimates and assumptions that affect the reported amounts of assets and liabilities and disclosures of contingent assets and liabilities at the date of the financial statements and the reported amounts of revenue and expenses during the period. Actual results could differ from those estimates. The following is a summary of significant accounting policies consistently followed by the Funds and subsidiaries, as applicable, in preparation of their financial statements.
Investment Valuation: The Funds generally value their securities based on market prices determined at the close of regular trading on the New York Stock Exchange (“NYSE”), normally 4:00 p.m. Eastern Time, on each day the NYSE is open for trading.
For equity securities and mutual funds that are traded on an exchange, the market price is usually the closing sale or official closing price on that exchange. In the case of equity securities not traded on an exchange, or if such closing prices are not otherwise available, the securities are valued at the mean of the most recent bid and ask prices on such day.
The market price for debt obligations is generally the price supplied by an independent third-party pricing service approved by the Board of Trustees (the “Board”), which may use a matrix, formula or other objective method that takes into consideration quotations from dealers, market transactions in comparable investments, market indices and yield curves. If vendors are unable to supply a price, or if the price supplied is deemed to be unreliable, the market price may be determined using quotations received from one or more brokers-dealers that make a market in the security. Short-term debt obligations that will mature in 60 days or less are valued at amortized cost; unless it is determined that using this method would not reflect an investment’s fair value. Investments in non-exchange traded funds are fair valued at their respective net asset values.
Futures contracts that are listed or traded on a national securities exchange, commodities exchange, contract market or comparable over the counter market, and that are freely transferable, are valued at their closing settlement price on the exchange on which they are primarily traded or based upon the current settlement price for a like instrument acquired on the day on which the instrument is being valued. A settlement price may not be used if the market makes a limit move with respect to a particular commodity. Over-the-counter swap contracts for which market quotations are readily available are valued based on quotes received from independent pricing services or one or more dealers that make markets in such securities.
Equity securities that are primarily traded on foreign securities exchanges are valued at the closing values of such securities on their respective foreign exchanges, except when an event occurs subsequent to the close of the foreign exchange and the close of the NYSE that was likely to have changed such value. In such an event, the fair value of those securities are determined in good faith through consideration of other factors in accordance with procedures established by and under the general supervision of the Board. The Funds will use a fair valuation model provided by an independent pricing service, which is intended to reflect fair value when a security’s value or a meaningful portion of the Fund’s portfolio is believed to have been materially affected by an valuation event that has occurred between the close of the exchange or market on which the security is traded and the close of the regular trading day on the NYSE. The Funds’ valuation procedures set forth certain triggers which instruct when to use the fair valuation model.
Forward currency exchange contracts have a market value determined by the prevailing foreign currency exchange daily rates and current foreign currency exchange forward rates. The foreign currency exchange forward rates are calculated using an automated system that estimates rates on the basis of the current day foreign currency exchange rates and forward foreign currency exchange rates supplied by a pricing service. Foreign exchange rates and forward foreign currency exchange rates may generally be obtained at the close of the NYSE, normally 4:00 p.m. Eastern Time.
When such prices or quotations are not available, or when the Fair Value Committee appointed by the Board believes that they are unreliable, securities may be priced using fair value procedures approved by the Board.
Fair Value Measurements: The Funds disclose the classification of their fair value measurements following a three-tier hierarchy based on the inputs used to measure fair value. Inputs refer broadly to the assumptions that market participants would use in pricing the asset or liability,
| 129 | October 31, 2013 |
Notes to Financial Statements | ||
| October 31, 2013 (Unaudited) | ||
including assumptions about risk. Inputs may be observable or unobservable. Observable inputs reflect the assumptions market participants would use in pricing the asset or liability that are developed based on market data obtained from sources independent of the reporting entity. Unobservable inputs reflect the reporting entity’s own assumptions about the assumptions market participants would use in pricing the asset or liability that are developed based on the best information available.
Various inputs are used in determining the value of each Fund’s investments as of the end of the reporting period. When inputs used fall into different levels of the fair value hierarchy, the level in the hierarchy within which the fair value measurement falls is determined based on the lowest level input that is significant to the fair value measurement in its entirety. The designated input levels are not necessarily an indication of the risk or liquidity associated with these investments. These inputs are categorized in the following hierarchy under applicable financial accounting standards:
Level 1 – | Unadjusted quoted prices in active markets for identical investments, unrestricted assets or liabilities that a Fund has the ability to access at the measurement date; | |
Level 2 – | Quoted prices which are not active, quoted prices for similar assets or liabilities in active markets or inputs other than quoted prices that are observable (either directly or indirectly) for substantially the full term of the asset or liability; and | |
Level 3 – | Significant unobservable prices or inputs (including the Fund’s own assumptions in determining the fair value of investments) where there is little or no market activity for the asset or liability at the measurement date. | |
The following is a summary of each Fund’s investments/financial instruments in the fair value hierarchy as of October 31, 2013:
| Investments in Securities at Value | Level 1 - Unadjusted Quoted Prices | Level 2 - Other Significant Observable Inputs | Level 3 - Significant Unobservable Inputs | Total | ||||||||||||
| ||||||||||||||||
ALPS | Alerian MLP Infrastructure Index Fund |
| |||||||||||||||
Master Limited Partnerships Shares(a) | $ | 11,454,878 | $ | – | $ | – | $ | 11,454,878 | ||||||||
Short Term Investments | 456,597 | – | – | 456,597 | ||||||||||||
| ||||||||||||||||
Total | $ | 11,911,475 | $ | – | $ | – | $ | 11,911,475 | ||||||||
| ||||||||||||||||
| Investments in Securities at Value | Level 1 - Unadjusted Quoted Prices | Level 2 - Other Significant Observable Inputs | Level 3 - Significant Unobservable Inputs | Total | ||||||||||||
| ||||||||||||||||
ALPS | CoreCommodity Management CompleteCommodities® Strategy Fund |
| |||||||||||||||
Common Stocks(a) | $ | 140,147,835 | $ | – | $ | – | $ | 140,147,835 | ||||||||
Exchange Traded Funds | 5,072,304 | – | – | 5,072,304 | ||||||||||||
Warrants | 1 | – | – | 1 | ||||||||||||
Government Bonds | – | 162,220,295 | – | 162,220,295 | ||||||||||||
Purchased Options | 3,148,792 | – | – | 3,148,792 | ||||||||||||
Short Term Investments | 53,092,263 | – | – | 53,092,263 | ||||||||||||
| ||||||||||||||||
Total | $ | 201,461,195 | $ | 162,220,295 | $ | – | $ | 363,681,490 | ||||||||
| ||||||||||||||||
Other Financial Instruments |
| |||||||||||||||
| ||||||||||||||||
Assets |
| |||||||||||||||
Futures Contracts | $ | 1,377,780 | $ | – | $ | – | $ | 1,377,780 | ||||||||
Total Return Swap Contracts | – | 739,712 | – | 739,712 | ||||||||||||
Liabilities | ||||||||||||||||
Futures Contracts | (991,704 | ) | – | – | (991,704 | ) | ||||||||||
Total Return Swap Contracts | – | (5,203,188 | ) | – | (5,203,188 | ) | ||||||||||
Written Options | (223,000 | ) | – | – | (223,000 | ) | ||||||||||
| ||||||||||||||||
Total | $ | 163,076 | $ | (4,463,476 | ) | $ | – | $ | (4,300,400 | ) | ||||||
| ||||||||||||||||
| 130 | October 31, 2013 |
Notes to Financial Statements | ||
| October 31, 2013 (Unaudited) | ||
| Investments in Securities at Value | Level 1 - Unadjusted Quoted Prices | Level 2 - Other Significant Observable Inputs | Level 3 - Significant Unobservable Inputs | Total | ||||||||||||
| ||||||||||||||||
ALPS | Kotak India Growth Fund | ||||||||||||||||
Common Stocks | ||||||||||||||||
Consumer Discretionary | $ | – | $ | 841,715 | $ | – | $ | 841,715 | ||||||||
Consumer Staples | 73,241 | 761,702 | – | 834,943 | ||||||||||||
Energy | – | 593,844 | – | 593,844 | ||||||||||||
Financials | 60,439 | 1,652,283 | – | 1,712,722 | ||||||||||||
Health Care | – | 538,863 | – | 538,863 | ||||||||||||
Industrials | 241,314 | 270,231 | – | 511,545 | ||||||||||||
Information Technology | – | 986,727 | – | 986,727 | ||||||||||||
Materials | 72,394 | 273,542 | – | 345,936 | ||||||||||||
Telecommunication Services | – | 140,266 | – | 140,266 | ||||||||||||
Utilities | – | 118,578 | – | 118,578 | ||||||||||||
| ||||||||||||||||
Total | $ | 447,388 | $ | 6,177,751 | $ | – | $ | 6,625,139 | ||||||||
| ||||||||||||||||
| Investments in Securities at Value | Level 1 - Unadjusted Quoted Prices | Level 2 - Other Significant Observable Inputs | Level 3 - Significant Unobservable Inputs | Total | ||||||||||||
| ||||||||||||||||
ALPS | Red Rocks Listed Private Equity Fund |
| |||||||||||||||
Common Stocks(a) | $ | 341,202,014 | $ | – | $ | – | $ | 341,202,014 | ||||||||
Short Term Investments | 2,405,843 | – | – | 2,405,843 | ||||||||||||
| ||||||||||||||||
Total | $ | 343,607,857 | $ | – | $ | – | $ | 343,607,857 | ||||||||
| ||||||||||||||||
| Investments in Securities at Value | Level 1 - Unadjusted Quoted Prices | Level 2 - Other Significant Observable Inputs | Level 3 - Significant Unobservable Inputs | Total | ||||||||||||
| ||||||||||||||||
ALPS | WMC Disciplined Value Fund |
| |||||||||||||||
Common Stocks(a) | $ | 97,119,079 | $ | – | $ | – | $ | 97,119,079 | ||||||||
Short Term Investments | 500,399 | – | – | 500,399 | ||||||||||||
| ||||||||||||||||
Total | $ | 97,619,478 | $ | – | $ | – | $ | 97,619,478 | ||||||||
| ||||||||||||||||
| Investments in Securities at Value | Level 1 - Unadjusted Quoted Prices | Level 2 - Other Significant Observable Inputs | Level 3 - Significant Unobservable Inputs | Total | ||||||||||||
| ||||||||||||||||
Clough China Fund |
| |||||||||||||||
Common Stocks | ||||||||||||||||
Basic Materials | $ | – | $ | 1,116,978 | $ | – | $ | 1,116,978 | ||||||||
Communications | 532,529 | 11,404,717 | – | 11,937,246 | ||||||||||||
Consumer, Cyclical | – | 16,053,143 | – | 16,053,143 | ||||||||||||
Consumer, Non-Cyclical | 491,815 | 2,840,857 | – | 3,332,672 | ||||||||||||
Energy | – | 13,699,210 | – | 13,699,210 | ||||||||||||
Financials | – | 21,329,060 | – | 21,329,060 | ||||||||||||
Industrials | – | 12,768,236 | – | 12,768,236 | ||||||||||||
Technology | 430,729 | 970,512 | – | 1,401,241 | ||||||||||||
Short Term Investments | 2,860,001 | – | – | 2,860,001 | ||||||||||||
| ||||||||||||||||
Total | $ | 4,315,074 | $ | 80,182,713 | $ | – | $ | 84,497,787 | ||||||||
| ||||||||||||||||
| Investments in Securities at Value | Level 1 - Unadjusted Quoted Prices | Level 2 - Other Significant Observable Inputs | Level 3 - Significant Unobservable Inputs | Total | ||||||||||||
| ||||||||||||||||
RiverFront Conservative Income Builder Fund |
| |||||||||||||||
Common Stocks(a) | $ | 181,663 | $ | – | $ | – | $ | 181,663 | ||||||||
Exchange Traded Funds(a) | 4,235,349 | – | – | 4,235,349 | ||||||||||||
Exchange Traded Notes(a) | 49,821 | – | – | 49,821 | ||||||||||||
Short Term Investments | 275,765 | – | – | 275,765 | ||||||||||||
| ||||||||||||||||
Total | $ | 4,742,598 | $ | – | $ | – | $ | 4,742,598 | ||||||||
| ||||||||||||||||
| 131 | October 31, 2013 |
Notes to Financial Statements | ||
| October 31, 2013 (Unaudited) | ||
| Investments in Securities at Value | Level 1 - Unadjusted Quoted Prices | Level 2 - Other Significant Observable Inputs | Level 3 - Significant Unobservable Inputs | Total | ||||||||||||
| ||||||||||||||||
RiverFront Dynamic Equity Income Fund |
| |||||||||||||||
Common Stocks(a) | $ | 2,281,445 | $ | – | $ | – | $ | 2,281,445 | ||||||||
Exchange Traded Funds(a) | 41,613,345 | – | – | 41,613,345 | ||||||||||||
Exchange Traded Notes(a) | 488,008 | – | – | 488,008 | ||||||||||||
Short Term Investments | 1,935,784 | – | – | 1,935,784 | ||||||||||||
| ||||||||||||||||
Total | $ | 46,318,582 | $ | – | $ | – | $ | 46,318,582 | ||||||||
| ||||||||||||||||
| Investments in Securities at Value | Level 1 - Unadjusted Quoted Prices | Level 2 - Other Significant Observable Inputs | Level 3 - Significant Unobservable Inputs | Total | ||||||||||||
| ||||||||||||||||
RiverFront Global Allocation Fund |
| |||||||||||||||
Common Stocks(a) | $ | 1,281,819 | $ | – | $ | – | $ | 1,281,819 | ||||||||
Exchange Traded Funds(a) | 26,671,158 | – | – | 26,671,158 | ||||||||||||
Short Term Investments | 1,080,105 | – | – | 1,080,105 | ||||||||||||
| ||||||||||||||||
Total | $ | 29,033,082 | $ | – | $ | – | $ | 29,033,082 | ||||||||
| ||||||||||||||||
| Investments in Securities at Value | Level 1 - Unadjusted Quoted Prices | Level 2 - Other Significant Observable Inputs | Level 3 - Significant Unobservable Inputs | Total | ||||||||||||
| ||||||||||||||||
RiverFront Global Growth Fund |
| |||||||||||||||
Common Stocks(a) | $ | 3,282,982 | $ | – | $ | – | $ | 3,282,982 | ||||||||
Exchange Traded Funds(a) | 60,074,307 | – | – | 60,074,307 | ||||||||||||
Short Term Investments | 2,129,286 | – | – | 2,129,286 | ||||||||||||
| ||||||||||||||||
Total | $ | 65,486,575 | $ | – | $ | – | $ | 65,486,575 | ||||||||
| ||||||||||||||||
| Investments in Securities at Value | Level 1 - Unadjusted Quoted Prices | Level 2 - Other Significant Observable Inputs | Level 3 - Significant Unobservable Inputs | Total | ||||||||||||
| ||||||||||||||||
RiverFront Moderate Growth & Income Fund |
| |||||||||||||||
Common Stocks(a) | $ | 6,174,564 | $ | – | $ | – | $ | 6,174,564 | ||||||||
Exchange Traded Funds(a) | 112,081,896 | – | – | 112,081,896 | ||||||||||||
Exchange Traded Notes(a) | 1,342,801 | – | – | 1,342,801 | ||||||||||||
Short Term Investments | 7,299,604 | – | – | 7,299,604 | ||||||||||||
| ||||||||||||||||
Total | $ | 126,898,865 | $ | – | $ | – | $ | 126,898,865 | ||||||||
| ||||||||||||||||
| (a) | For detailed descriptions of country, sector and/or industry, see the accompanying Statement of Investments. |
The Funds recognize transfers between levels as of the end of the period. For the six months ended October 31, 2013, the Funds did not have any transfers between Level 1 and Level 2 securities, except the ALPS | Kotak India Growth Fund, which had securities with a total market value of $65,379, transfer from Level 1 to Level 2 and $218,281 from Level 2 to Level 1, due to the Fund’s utilization of a fair valuation service with respect to international securities with an earlier market closing than the Fund’s net asset value computation cutoff on October 31, 2013. The Funds did not have any securities that used significant unobservable inputs (Level 3) in determining fair value.
Offering Costs: The ALPS | Alerian MLP Infrastructure Index Fund and RiverFront Conservative Income Builder Fund incurred offering costs during the six months ended October 31, 2013. These offering costs, including fees for printing initial prospectuses, legal, and registration fees, are being amortized over the first twelve months from the inception date of each Fund. Amounts amortized through October 31, 2013 are shown on each Fund’s Statement of Operations and amounts that remain to be amortized are shown on each Fund’s Statement of Assets and Liabilities.
Fund and Class Expenses: Some expenses of the Trust can be directly attributed to a Fund or a specific share class of a Fund. Expenses which cannot be directly attributed are apportioned among all Funds in the Trust based on average net assets of each share class within a Fund.
Federal Income Taxes: The Funds, except for ALPS | Alerian MLP Infrastructure Index Fund, comply with the requirements under Subchapter M of the Internal Revenue Code of 1986 applicable to regulated investment companies and intend to distribute substantially all of their net taxable income and net capital gains, if any, each year. Those Funds are not subject to income taxes to the extent such distributions are made.
The ALPS | Alerian MLP Infrastructure Index Fund is taxed as a regular corporation (or so-called subchapter “C” corporation) for federal income tax purposes, and will be subject to tax on its taxable income at rates applicable to corporations. Currently, the maximum marginal regular federal
| 132 | October 31, 2013 |
Notes to Financial Statements | ||
| October 31, 2013 (Unaudited) | ||
income tax rate for a corporation is 34 percent. The ALPS | Alerian MLP Infrastructure Index Fund may be subject to a 20 percent federal alternative minimum tax on its federal alternative taxable income to the extent that its alternative minimum tax exceeds its regular federal income tax. This differs from most investment companies, which elect to be treated as “regulated investment companies” under the Code in order to avoid paying entity level income taxes. Under current law, the ALPS | Alerian MLP Infrastructure Index Fund is not eligible to elect treatment as a regulated investment company due to its investments, primarily in Master Limited Partnerships (“MLPs”) invested in energy assets. As a result, the ALPS | Alerian MLP Infrastructure Index Fund will be obligated to pay applicable federal and state corporate income taxes on its taxable income as opposed to most other investment companies which are not so obligated. As discussed below, the ALPS | Alerian MLP Infrastructure Index Fund expects that a portion of the distributions it receives from MLPs may be treated as a tax-deferred return of capital, thus reducing the Fund’s current tax liability. However, the amount of taxes currently paid by the ALPS | Alerian MLP Infrastructure Index Fund will vary depending on the amount of income and gains derived from investments and/or sales of MLP interests and such taxes will reduce the return from an investment in the Fund. See further disclosure regarding MLPs below.
As of and during the six months ended October 31, 2013, the Funds did not have a liability for any unrecognized tax benefits. The Funds file U.S. federal, state, and local tax returns as required. The Funds’ tax returns are subject to examination by the relevant tax authorities until expiration of the applicable statute of limitations which is generally three years after the filing of the tax return, but may extend to four years in certain jurisdictions. Tax returns for open years have incorporated no uncertain tax positions that require a provision for income taxes.
Distributions to Shareholders: Each Fund, except the ALPS | CoreCommodity Management CompleteCommodities® Strategy Fund, RiverFront Conservative Income Builder Fund, RiverFront Dynamic Equity Income Fund, and RiverFront Moderate Growth & Income Fund normally pays dividends and distributes capital gains, if any, on an annual basis. The ALPS | CoreCommodity Management CompleteCommodities® Strategy Fund, RiverFront Conservative Income Builder Fund, RiverFront Dynamic Equity Income Fund, and RiverFront Moderate Growth & Income Fund pay dividends, if any, on a quarterly basis and distribute capital gains annually. Income dividend distributions are derived from interest and other income the Fund receives from its investments, including distributions of short-term capital gains. Capital gain distributions are derived from gains realized when the Fund sells a security it has owned for more than a year. Each Fund may make additional distributions and dividends at other times if its portfolio manager or managers believe doing so may be necessary for the Fund to avoid or reduce taxes.
Distributions received from the ALPS | Alerian MLP Infrastructure Index Fund’s investments in MLPs generally are comprised of income and return of capital. The Fund records investment income and return of capital based on estimates made at the time such distributions are received. Such estimates are based on historical information available from each MLP and other industry sources. These estimates may subsequently be revised based on information received from MLPs after their tax reporting periods are concluded. Return of capital distributions are not taxable income to the shareholder, but reduce the investor’s tax basis in the investor’s Fund shares. Such a reduction in tax basis will result in larger taxable gains and/or lower tax losses on a subsequent sale of Fund shares. Shareholders who periodically receive the payment of dividends or other distributions consisting of a return of capital may be under the impression that they are receiving net profits from the Fund when, in fact, they are not. Shareholders should not assume that the source of the distributions is from the net profits of the Fund.
Cash distributions from MLPs to the ALPS | Alerian MLP Infrastructure Index Fund that exceed such Fund’s allocable share of such MLP’s net taxable income are considered a tax-deferred return of capital that will reduce the Fund’s adjusted tax basis in the equity securities of the MLP. These reductions in such Fund’s adjusted tax basis in the MLP equity securities will increase the amount of gain (or decrease the amount of loss) recognized by the Fund on a subsequent sale of the securities. The Fund will accrue deferred income taxes for any future tax liability associated with (i) that portion of MLP distributions considered to be a tax-deferred return of capital as well as (ii) capital appreciation of its investments. Upon the sale of an MLP security, the Fund may be liable for previously deferred taxes. The Fund will rely to some extent on information provided by the MLPs, which is not necessarily timely, to estimate deferred tax liability for purposes of financial statement reporting and determining the NAV. From time to time, ALPS Advisors, Inc. will modify the estimates or assumptions related to the Fund’s deferred tax liability as new information becomes available. The Fund will generally compute deferred income taxes based on the marginal regular federal income tax rate applicable to corporations and an assumed rate attributable to state taxes.
Investment Transactions and Investment Income: Investment transactions are accounted for on the date the investments are purchased or sold (trade date basis). Net realized gains and losses from investment transactions are reported on an identified cost basis. Interest income, which includes accretion of discounts and amortization of premiums, is accrued and recorded as earned. Dividend income is recognized on the ex-dividend date or for certain foreign securities, as soon as information is available to each Fund.
Foreign Securities: Each Fund may directly purchase securities of foreign issuers. Investing in securities of foreign issuers involves special risks not typically associated with investing in securities of U.S. issuers. The risks include possible reevaluation of currencies, the inability to repatriate foreign currency, less complete financial information about companies and possible future adverse political and economic developments.
Moreover, securities of many foreign issuers and their markets may be less liquid and their prices more volatile than those of securities of comparable U.S. issuers.
| 133 | October 31, 2013 |
Notes to Financial Statements | ||
| October 31, 2013 (Unaudited) | ||
Foreign Currency Translation: The books and records of the Funds are maintained in U.S. dollars. Investment valuations and other assets and liabilities initially expressed in foreign currencies are converted each business day into U.S. dollars based upon current exchange rates. The portion of realized and unrealized gains or losses on investments due to fluctuations in foreign currency exchange rates is not separately disclosed and is included in realized and unrealized gains or losses on investments, when applicable.
Foreign Currency Spot Contracts: The Funds may enter into foreign currency spot contracts to facilitate transactions in foreign securities or to convert foreign currency receipts into U.S. dollars. A foreign currency spot contract is an agreement between two parties to buy and sell currencies at the current market rate, for settlement generally within two business days. The U.S. dollar value of the contracts is determined using current currency exchange rates supplied by a pricing service. The contract is marked-to-market daily for settlements beyond one day and any change in market value is recorded as an unrealized gain or loss. When the contract is closed, the Fund records a realized gain or loss equal to the difference between the value on the open and close date. Losses may arise from changes in the value of the foreign currency, or if the counterparties do not perform under the contract’s terms. The maximum potential loss from such contracts is the aggregate face value in U.S. dollars at the time the contract was opened.
Real Estate Investment Trusts (“REITs”): The Funds may invest a portion of their assets in REITs and are subject to certain risks associated with direct investment in REITs. REITs may be affected by changes in the value of their underlying properties and by defaults by borrowers or tenants. REITs depend generally on their ability to generate cash flow to make distributions to shareowners, and certain REITs have self-liquidation provisions by which mortgages held may be paid in full and distributions of capital returns may be made at any time. In addition, the performance of a REIT may be affected by its failure to qualify for tax-free pass-through of income under the Internal Revenue Code of 1986, as amended (the “Code”), or its failure to maintain exemption from registration under the 1940 Act.
Treasury Inflation Protected-Securities: The Funds may invest in treasury inflation protected securities (“TIPS”), including structured bonds in which the principal amount is adjusted daily to keep pace with inflation, as measured by the U.S. Consumer Pricing Index for Urban Consumers. The adjustments to principal due to inflation/deflation are reflected as increases/decreases to interest income with a corresponding adjustment to cost. Such adjustments may have a significant impact on a Fund’s distributions and may result in a return of capital to shareholders. The repayment of the original bond principal upon maturity is guaranteed by the full faith and credit of the U.S. Government.
Master Limited Partnerships: MLPs are publicly traded partnerships engaged in the transportation, storage and processing of minerals and natural resources. By confining their operations to these specific activities, their interests, or units, are able to trade on public securities exchanges exactly like the shares of a corporation, without entity level taxation. Of the seventy MLPs eligible for inclusion in the Index, approximately two-thirds trade on the NYSE and the rest trade on the NASDAQ. To qualify as a MLP and to not be taxed as a corporation, a partnership must receive at least 90% of its income from qualifying sources as set forth in Section 7704(d) of the Internal Revenue Code of 1986, as amended (the “Code”). These qualifying sources include natural resource based activities such as the processing, transportation and storage of mineral or natural resources. MLPs generally have two classes of owners, the general partner and limited partners. The general partner of an MLP is typically owned by a major energy company, an investment fund, the direct management of the MLP, or is an entity owned by one or more of such parties. The general partner may be structured as a private or publicly traded corporation or other entity. The general partner typically controls the operations and management of the MLP through an up to 2% equity interest in the MLP plus, in many cases, ownership of common units and subordinated units. Limited partners typically own the remainder of the partnership, through ownership of common units, and have a limited role in the partnership’s operations and management. MLPs are typically structured such that common units and general partner interests have first priority to receive quarterly cash distributions up to an established minimum amount (“minimum quarterly distributions” or “MQD”). Common and general partner interests also accrue arrearages in distributions to the extent the MQD is not paid. Once common and general partner interests have been paid, subordinated units receive distributions of up to the MQD; however, subordinated units do not accrue arrearages. Distributable cash in excess of the MQD is paid to both common and subordinated units and is distributed to both common and subordinated units generally on a pro rata basis. The general partner is also eligible to receive incentive distributions if the general partner operates the business in a manner which results in distributions paid per common unit surpassing specified target levels. As the general partner increases cash distributions to the limited partners, the general partner receives an increasingly higher percentage of the incremental cash distributions.
Short Sales: Each Fund may make short sales of securities consistent with its strategies. A short sale is a transaction in which a Fund sells a security it does not own in anticipation that the market price of that security will decline. During the six months ended October 31, 2013, the Funds did not engage in short sales activity; therefore, there were no outstanding short sale positions at the period end.
When a Fund makes a short sale, it must borrow the security sold short and deliver it to the broker dealer through which it made the short sale as collateral for its obligation to deliver the security upon conclusion of the sale. The Fund may have to pay a fee to borrow particular securities and is often obligated to pay over any accrued interest and dividends on such borrowed securities.
| 134 | October 31, 2013 |
Notes to Financial Statements | ||
| October 31, 2013 (Unaudited) | ||
If the price of the security sold short increases between the time of the short sale and the time that a Fund replaces the borrowed security, the Fund will incur a loss; conversely, if the price declines, the Fund will realize a capital gain. Any gain will be decreased, and any loss increased, by the transaction costs described above. The successful use of short selling may be adversely affected by imperfect correlation between movements in the price of the security sold short and the securities being hedged.
To the extent that a Fund engages in short sales, it will provide collateral to the broker-dealer and (except in the case of short sales “against the box”) will maintain additional asset coverage in the form of segregated or “earmarked” assets determined to be liquid in accordance with procedures established by the Board and that is equal to the current market value of the securities sold short, or will ensure that such positions are covered by “offsetting” positions, until the Fund replaces the borrowed security. A short sale is “against the box” to the extent that the Fund contemporaneously owns, or has the right to obtain at no added cost, securities identical to those sold short. Each Fund may engage in short selling to the extent permitted by the federal securities laws and rules and interpretations thereunder. To the extent a Fund engages in short selling in foreign (non-U.S.) jurisdictions, the Fund will do so to the extent permitted by the laws and regulations of such jurisdiction.
3. DERIVATIVE INSTRUMENTS
As a part of their investment strategy, ALPS | Kotak India Growth Fund and ALPS | CoreCommodity Management CompleteCommodities® Strategy Fund permits the Funds to purchase investment securities, they also allow the Funds to enter in various types of derivatives contracts. The other funds including ALPS | Alerian MLP Infrastructure Index Fund, ALPS | Red Rocks Listed Private Equity Fund, ALPS | WMC Disciplined Value Fund, Clough China Fund, RiverFront Conservative Income Builder Fund, RiverFront Dynamic Equity Income Fund, RiverFront Global Allocation Fund, RiverFront Global Growth Fund and RiverFront Moderate Growth & Income Fund may invest to a lesser extent in derivatives contracts. In doing so, the Funds will employ strategies in differing combinations to permit them to increase, decrease, or change the level or types of exposure to market factors. Central to those strategies are features inherent in derivatives that make them more attractive for this purpose than equity or debt securities; they require little or no initial cash investment, they can focus exposure on only certain selected risk factors, and they may not require the ultimate receipt or delivery of the underlying security (or securities) to the contract. This may allow the Funds to pursue their objectives more quickly and efficiently than if they were to make direct purchases or sales of securities capable of affecting a similar response to market factors.
Risk of Investing in Derivatives: The Funds’ use of derivatives can result in losses due to unanticipated changes in the market risk factors and the overall market. In instances where the Funds are using derivatives to decrease, or hedge, exposures to market risk factors for securities held by the Funds, there are also risks that those derivatives may not perform as expected resulting in losses for the combined or hedged positions.
Derivatives may have little or no initial cash investment relative to their market value exposure and therefore can produce significant gains or losses in excess of their cost. This use of embedded leverage allows the Fund to increase its market value exposure relative to it net assets and can substantially increase the volatility of the Funds’ performance.
Additional associated risks from investing in derivatives also exist and potentially could have significant effects on the valuation of the derivative and the Funds. Typically, the associated risks are not the risks that the Funds are attempting to increase or decrease exposure to, per their investment objectives, but are the additional risks from investing in derivatives.
Examples of these associated risks are liquidity risk, which is the risk that the Funds will not be able to sell or close out the derivative in a timely manner, and counterparty credit risk, which is the risk that the counterparty will not fulfill its obligation to the Funds. In addition, use of derivatives may increase or decrease exposure to the following risk factors:
Equity Risk: Equity risk relates to the change in value of equity securities as they relate to increases or decreases in the general market. Associated risks can be different for each type of derivative and are discussed by each derivative type in the notes that follow.
Commodity Risk: Exposure to the commodities markets may subject the Fund to greater volatility than investments in traditional securities. Prices of various commodities may also be affected by factors, such as drought, floods, weather, livestock disease, embargoes, tariffs and other regulatory developments, which are unpredictable. The prices of commodities can also fluctuate widely due to supply and demand disruptions in major producing or consuming regions.
Foreign Currency Risk: Currency trading involves significant risks, including market risk, interest rate risk, country risk, counterparty credit risk and short sale risk. Market risk results from the price movement of foreign currency values in response to shifting market supply and demand.
Interest rate risk arises whenever a country changes its stated interest rate target associated with its currency. Country risk arises because virtually every country has interfered with international transactions in its currency.
| 135 | October 31, 2013 |
Notes to Financial Statements | ||
| October 31, 2013 (Unaudited) | ||
Interest Rate Risk: Interest rate risk is the risk that fixed income securities will decline in value because of changes in interest rates. As nominal interest rates rise, the value of fixed income securities held by the Fund are likely to decrease. Securities with longer durations tend to be more sensitive to changes in interest rates, and are usually more volatile than securities.
Swap Contracts: The CoreCommodity Fund may enter into swap transactions for hedging purposes or to seek to increase total return. At the present time, the CoreCommodity Fund primarily enters into swap transactions for the purpose of increasing total return. Risks may arise as a result of the failure of the counterparty to the swap contract to comply with the terms of the swap contract. The loss incurred by the failure of a counterparty is generally limited to the net payment to be received by the CoreCommodity Fund and/or the termination value at the end of the contract.
Therefore, the CoreCommodity Fund considers the creditworthiness of each counterparty to a contract in evaluating potential credit risk. Additionally, risks may arise from unanticipated movements in interest rates or in the value of the underlying reference asset or index. Entering into these agreements involves, to varying degrees, market risk, liquidity risk and elements of credit, legal and documentation risk that are not directly reflected in the amounts recognized in the Statements of Assets and Liabilities.
The CoreCommodity Fund may pay or receive cash as collateral on these contracts which may be recorded as an asset and/or liability. The CoreCommodity Fund must set aside liquid assets, or engage in other appropriate measures, to cover its obligations under these contracts. Swaps are marked to market daily using either pricing vendor quotations, counterparty prices or model prices and the change in value, if any, is recorded as an unrealized gain or loss. Upfront payments made and/or received by the CoreCommodity Fund are recorded as an asset and/or liability and realized gains or losses are recognized ratably over the contract’s term/event, with the exception of forward starting interest rate swaps, whose realized gains or losses are recognized ratably from the effective start date. Periodic payments received or made on swap contracts are recorded as realized gains or losses. Gains or losses are realized upon termination of a swap contract and are recorded on the Statement of Operations.
The CoreCommodity Fund invests in total return swaps to obtain exposure to a security or market without owning such security or investing directly in that market or to transfer the risk/return of one market (e.g., fixed income) to another market (e.g., equity) (equity risk and/or interest rate risk). Total return swaps are agreements in which there is an exchange of cash flows whereby one party commits to make payments based on the total return (coupons plus capital gains/losses) of an underlying instrument in exchange for fixed or floating rate interest payments. To the extent the total return of the instrument or index underlying the transaction exceeds or falls short of the offsetting interest rate obligation, the Fund will receive a payment from or make a payment to the counterparty. Swap agreements held at October 31, 2013 are disclosed after the Statement of Investments.
The number of swap contracts held at October 31, 2013 is representative of the swap contract activity for the six months ended October 31, 2013.
Futures: Certain Funds may invest in futures contracts in accordance with their investment objectives. Each Fund does so for a variety of reasons including for cash management, hedging or non-hedging purposes in an attempt to achieve investment returns consistent with the Fund’s investment objective. A futures contract provides for the future sale by one party and purchase by another party of a specified quantity of the security or other financial instrument at a specified price and time. A futures contract on an index is an agreement pursuant to which two parties agree to take or make delivery of an amount of cash equal to the difference between the value of the index at the close of the last trading day of the contract and the price at which the index contract was originally written. Futures transactions may result in losses in excess of the amount invested in the futures contract. There can be no guarantee that there will be a correlation between price movements in the hedging vehicle and in the portfolio securities being hedged. An incorrect correlation could result in a loss on both the hedged securities in a Fund and the hedging vehicle so that the portfolio return might have been greater had hedging not been attempted. There can be no assurance that a liquid market will exist at a time when a Fund seeks to close out a futures contract or a futures option position. Lack of a liquid market for any reason may prevent a Fund from liquidating an unfavorable position, and the Fund would remain obligated to meet margin requirements until the position is closed. In addition, a Fund could be exposed to risk if the counterparties to the contracts are unable to meet the terms of their contracts. With exchange traded futures, there is minimal counterparty credit risk to the Funds since futures are exchange traded and the exchange’s clearinghouse, as counterparty to all exchange traded futures, guarantees the futures against default.
When a purchase or sale of a futures contract is made by a Fund, the Fund is required to deposit with its custodian (or broker, if legally permitted) a specified amount of liquid assets (“initial margin”). The margin required for a futures contract is set by the exchange on which the contract is traded and may be modified during the term of the contract. The initial margin is in the nature of a performance bond or good faith deposit on the futures contract that is returned to a Fund upon termination of the contract, assuming all contractual obligations have been satisfied. Each day a Fund may pay or receive cash, called “variation margin,” equal to the daily change in value of the futures contract. Such payments or receipts are recorded for financial statement purposes as unrealized gains or losses by a Fund. Variation margin does not represent a borrowing or loan by a Fund but is instead a settlement between a Fund and the broker of the amount one would owe the other if the futures contract expired. When the contract is closed, a Fund records a realized gain or loss equal to the difference between the value of the contract at the time it was opened and the value at the time it was closed. As of October 31, 2013, the CoreCommodity Fund had futures contracts outstanding with a net unrealized appreciation of $386,076. The number of futures contracts held at October 31, 2013 is representative of futures contracts activity during the six months ended October 31, 2013.
| 136 | October 31, 2013 |
Notes to Financial Statements | ||
| October 31, 2013 (Unaudited) | ||
Option Contracts: Each Fund may enter into options transactions for hedging purposes and for non-hedging purposes such as seeking to enhance return. Each Fund may write covered put and call options on any stocks or stock indices, currencies traded on domestic and foreign securities exchanges, or futures contracts on stock indices, interest rates and currencies traded on domestic and, to the extent permitted by the CFTC, foreign exchanges. A call option on an asset written by a Fund obligates the Fund to sell the specified asset to the holder (purchaser) at a stated price (the exercise price) if the option is exercised before a specified date (the expiration date). A put option on an asset written by a Fund obligates the Fund to buy the specified asset from the purchaser at the exercise price if the option is exercised before the expiration date. Premiums received when writing options are recorded as liabilities and are subsequently adjusted to the current value of the options written. Premiums received from writing options that expire are treated as realized gains. Premiums received from writing options, which are either exercised or closed, are offset against the proceeds received or amount paid on the transaction to determine realized gains or losses which are recorded on the Statement of Operations.
The CoreCommodity Fund had the following transactions in written covered call/put options during the six months ended October 31, 2013:
| Number of Contracts | Premiums | |||||||||
| ||||||||||
Options Outstanding, at the beginning of year ended April 30, 2013 | – | $ | – | |||||||
Options written | (2,841 | ) | (595,054 | ) | ||||||
Options closed | 266 | 53,415 | ||||||||
Options exercised | 200 | 16,242 | ||||||||
Options expired | 1,800 | 297,324 | ||||||||
| ||||||||||
Options Outstanding, at the period ended October 31, 2013 | (575 | ) | $ | (228,073 | ) | |||||
| ||||||||||
Derivatives Instruments: The following tables disclose the amounts related to each Fund’s use of derivative instruments.
The effect of derivatives instruments on the Consolidated Statement of Assets and Liabilities as of October 31, 2013:
| Risk Exposure | Statement of Assets and Liabilities Location | Fair Value | Statement of Assets and Liabilities Location | Fair Value | ||||||||
| ||||||||||||
ALPS | CoreCommodity Management CompleteCommodities® Strategy Fund |
| |||||||||||
Equity Contracts | Investments at value | $ | 3,148,792 | N/A | $ | – | ||||||
Futures Contracts* | Receivable for variation margin | 386,076 | Payable for variation margin | – | ||||||||
Commodity Contracts | Unrealized appreciation on total return swap contracts | 739,712 | Unrealized depreciation on total return swap contracts | 5,203,188 | ||||||||
| ||||||||||||
Total | $ | 4,274,580 | $ | 5,203,188 | ||||||||
| ||||||||||||
* Risk Exposure to Fund | ||||||||||||
Commodity Contracts | $ | 1,362,745 | $ | – | ||||||||
Equity Contracts | (976,669 | ) | – | |||||||||
|
| |||||||||||
| $ | 386,076 | $ | – | |||||||||
|
| |||||||||||
| 137 | October 31, 2013 |
Notes to Financial Statements | ||
| October 31, 2013 (Unaudited) | ||
The effect of derivatives instruments on the Consolidated Statement of Operations for the six months ended October 31, 2013:
| Risk Exposure | Statement of Operations Location | Realized Gain/(Loss) on Derivatives Recognized in Income | Change in Unrealized Gain/(Loss) on Derivatives Recognized in Income | |||||||
| ||||||||||
ALPS | CoreCommodity Management CompleteCommodities® Strategy Fund |
| |||||||||
Equity Contracts | Net realized gain on investments/Net change in unrealized appreciation on investments | $ | 60,158 | $ | 479,514 | |||||
Equity Contracts | Net realized gain on written options/Net change in unrealized appreciation on written options | 264,753 | 5,073 | |||||||
Futures Contracts* | Net realized loss on futures contracts/Net change in unrealized apprecation on futures contracts | (4,095,750) | 2,301,003 | |||||||
Commodity Contracts | Net realized loss on total return swap contracts/Net change in unrealized apprecation on total return swap contracts | (4,209,889) | 553,946 | |||||||
| ||||||||||
Total | $ | (7,980,728) | $ | 3,339,536 | ||||||
| ||||||||||
*Risk Exposure to Fund | ||||||||||
Commodity Contracts | $ | (2,639,548) | $ | 2,855,779 | ||||||
Equity Contracts | (1,449,161) | (554,776) | ||||||||
Interest Rate Contracts | 8,269 | – | ||||||||
Foreign Currency Contracts | (15,310) | – | ||||||||
|
| |||||||||
| $ | (4,095,750) | $ | 2,301,003 | |||||||
|
| |||||||||
ALPS | Kotak India Growth Fund | ||||||||||
Equity Contracts Futures Contracts | Net realized loss on futures contracts | $ | 9,127 | $ | N/A | |||||
| ||||||||||
Total | $ | 9,127 | $ | N/A | ||||||
| ||||||||||
Certain derivative contracts are executed under either standardized netting agreements or, for exchange-traded derivatives, the relevant contracts for a particular exchange which contain enforceable netting provisions. A derivative netting arrangement creates an enforceable right of set-off that becomes effective, and affects the realization of settlement on individual assets, liabilities and collateral amounts, only following a specified event of default or early termination. Default events may include the failure to make payments or deliver securities timely, material adverse changes in financial condition or insolvency, the breach of minimum regulatory capital requirements, or loss of license, charter or other legal authorization necessary to perform under the contract.
| 138 | October 31, 2013 |
Notes to Financial Statements | ||
| October 31, 2013 (Unaudited) | ||
The following table presents financial instruments that are subject to enforceable netting arrangements or other similar agreements as of October 31, 2013:
ALPS | CoreCommodity Management CompleteCommodities® Strategy Fund Offsetting of Derivatives Assets | ||||||||||||||||||||||||
| ||||||||||||||||||||||||
| October 31, 2013 | ||||||||||||||||||||||||
| Gross Amounts Not Offset in the Statement of Financial Position | ||||||||||||||||||||||||
| Description | Gross Amounts of Recognized Assets | Gross Amounts Offset in the Statement of Financial Position | Net Amounts Presented in the Statement of | Financial Instruments(a) | Cash Collateral Pledged(a) | Net Amount | ||||||||||||||||||
| ||||||||||||||||||||||||
Total Return Swap Contracts | $ | 739,712 | $ | – | $ | 739,712 | $ | (739,712 | ) | $ | – | $ | – | |||||||||||
| ||||||||||||||||||||||||
Total | $ | 739,712 | $ | – | $ | 739,712 | $ | (739,712 | ) | $ | – | $ | – | |||||||||||
| ||||||||||||||||||||||||
ALPS | CoreCommodity Management CompleteCommodities® Strategy Fund Offsetting of Derivatives Liabilities | ||||||||||||||||||||||||
| ||||||||||||||||||||||||
| October 31, 2013 | ||||||||||||||||||||||||
| Gross Amounts Not Offset in the Statement of Financial Position | ||||||||||||||||||||||||
| Description | Gross Amounts of Recognized Liabilities | Gross Amounts Offset in the Statement of Financial Position | Net Amounts Presented in the Statement of | Financial Instruments(a) | Cash Collateral Pledged(a) | Net Amount | ||||||||||||||||||
| ||||||||||||||||||||||||
Tootal Return Swap Contracts | $ | 5,203,188 | $ | – | $ | 5,203,188 | $ | (5,203,188 | ) | $ | – | $ | – | |||||||||||
| ||||||||||||||||||||||||
Total | $ | 5,203,188 | $ | – | $ | 5,203,188 | $ | (5,203,188 | ) | $ | – | $ | – | |||||||||||
| ||||||||||||||||||||||||
| (a) | These amounts are limited to the derivative asset/liability balance and, accordingly, do not include excess collateral received/pledged. |
4. TAX BASIS INFORMATION
Tax Basis of Distributions to Shareholders: The character of distributions made during the year from net investment income or net realized gains may differ from its ultimate characterization for federal income tax purposes. Also, due to the timing of dividend distributions, the fiscal year in which amounts are distributed may differ from the fiscal year in which the income or realized gain were recorded by a Fund. The amounts and characteristics of tax basis distributions and composition of distributable earnings/(accumulated losses) are finalized at fiscal year-end. Accordingly, tax basis balances have not been determined as of October 31, 2013.
The tax character of distributions paid by the Funds for the fiscal year or period ended April 30, 2013 were as follows:
| Fund | Ordinary Income | Long-Term Capital Gain | Return of Capital | |||||||||
| ||||||||||||
ALPS | Alerian MLP Infrastructure Index Fund | $ | – | $ | – | $ | 49,338 | ||||||
ALPS | CoreCommodity Management CompleteCommodities® Strategy Fund | – | – | 1,317,510 | |||||||||
ALPS | Kotak India Growth Fund | – | – | – | |||||||||
ALPS | Red Rocks Listed Private Equity Fund | 3,300,025 | – | – | |||||||||
ALPS | WMC Disciplined Value Fund | 890,012 | – | – | |||||||||
Clough China Fund | 100,016 | – | – | |||||||||
RiverFront Conservative Income Builder Fund | 16,480 | – | – | |||||||||
RiverFront Dynamic Equity Income Fund | 511,037 | – | – | |||||||||
RiverFront Global Allocation Fund | 250,390 | – | – | |||||||||
RiverFront Global Growth Fund | 802,738 | – | – | |||||||||
RiverFront Moderate Growth & Income Fund | 1,511,757 | – | – | |||||||||
| 139 | October 31, 2013 |
Notes to Financial Statements | ||
| October 31, 2013 (Unaudited) | ||
The Fund elects to defer to the year ended April 30, 2014, late year ordinary losses in the amount of:
| Fund | Amount | |||
| ||||
RiverFront Global Allocation Fund | $ | 37,220 | ||
RiverFront Global Growth Fund | 75,400 | |||
Capital Losses: As of April 30, 2013 the following Funds had capital loss carryforwards which may reduce the Funds’ taxable income arising from future net realized gains on investments, if any, to the extent permitted by the Code and thus may reduce the amount of the distributions to shareholders which would otherwise be necessary to relieve the Funds of any liability for federal tax. Pursuant to the Code, such capital loss carryforwards will expire as follows:
Pre-Enactment Capital Losses:
| Fund | Expiring in 2016 | Expiring in 2017 | Expiring in 2018 | |||||||||
ALPS | Red Rocks Listed Private Equity Fund | $ | – | $ | – | $ | 8,281,739 | ||||||
ALPS | WMC Disciplined Value Fund | 3,561,757 | 2,780,282 | – | |||||||||
Under the recently enacted Regulated Investment Company Modernization Act of 2010, capital losses incurred by each fund in tax years beginning after December 22, 2010 will not be subject to expiration. In addition, such losses must be utilized prior to the losses incurred in the years preceding enactment.
Capital loss carryovers utilized during the period ended April 30, 2013, were:
| Fund | Amount | |||
ALPS | WMC Disciplined Value Fund | $ | 3,584,375 | ||
Post-Enactment Capital Losses*:
Capital losses deferred to next tax year were as follows:
| Fund | Short-Term | Long-Term | ||||||
ALPS | CoreCommodity Management CompleteCommodities® Strategy Fund | $ | 3,658,680 | $ | – | ||||
ALPS | Kotak India Growth Fund | 57,984 | 23,576 | ||||||
ALPS | Red Rocks Listed Private Equity Fund | 6,448,167 | 1,995,842 | ||||||
Clough China Fund | 2,201,190 | – | ||||||
Capital loss carryovers utilized during the period ended April 30, 2013, were:
| Fund | Short-Term | Long-Term | ||||||
ALPS | Kotak India Growth Fund | $ | 73,317 | $ | – | ||||
RiverFront Dynamic Equity Income Fund | 702,912 | – | ||||||
RiverFront Global Allocation Fund | 763,613 | 2,317 | ||||||
RiverFront Moderate Growth & Income Fund | 1,279,511 | – | ||||||
The Fund elects to defer to the year ended April 30, 2014, capital losses recognized during the period November 1, 2012 to April 30, 2013 in the amount of:
| Fund | Amount | |||
ALPS | Red Rocks Listed Private Equity Fund | $ | 33,992 | ||
| * | Post-Enactment Capital Losses arise in fiscal years beginning after December 22, 2010, and exclude any election for late year capital loss (during the period November 1st to December 31st) deferred for the current fiscal year. As a result of the enactment of the Regulated Investment Company Act of 2010, pre-enactment capital loss carryforwards may be more likely to expire unused. Additionally, post-enactment capital losses that are carried forward will retain their character as either short-term or long-term losses rather than being considered all short-term as under previous law. |
| 140 | October 31, 2013 |
Notes to Financial Statements | ||
| October 31, 2013 (Unaudited) | ||
Unrealized Appreciation and Depreciation on Investments: As of October 31, 2013, the costs of investments for federal income tax purposes and accumulated net unrealized appreciation/(depreciation) on investments were as follows:
| Fund | Gross Appreciation (excess of value over tax cost) | Gross Depreciation (excess of tax cost over value) | Net Appreciation/ (Depreciation) of Foreign Currency and Derivatives | Net Unrealized Appreciation/ (Depreciation) | Cost of Investments for Income Tax Purposes | |||||||||||||||
ALPS | Alerian MLP Infrastructure Index Fund | $ | 1,035,391 | $ | (8,299 | ) | $ | – | $ | 1,027,092 | $ | 10,884,383 | |||||||||
ALPS | CoreCommodity Management CompleteCommodities® Strategy Fund | 19,932,623 | (25,195,832 | ) | – | (5,263,209 | ) | 368,944,699 | |||||||||||||
ALPS | Kotak India Growth Fund | 251,230 | (604,748 | ) | – | (353,518 | ) | 6,978,657 | |||||||||||||
ALPS | Red Rocks Listed Private Equity Fund | 80,410,683 | (1,811,447 | ) | – | 78,599,236 | 265,008,621 | ||||||||||||||
ALPS | WMC Disciplined Value Fund | 31,109,039 | (1,232,962 | ) | – | 29,876,077 | 67,743,401 | ||||||||||||||
Clough China Fund | 13,604,300 | (855,807 | ) | – | 12,748,493 | 71,749,294 | ||||||||||||||
RiverFront Conservative Income Builder Fund | 180,402 | (2,607 | ) | – | 177,795 | 4,564,803 | ||||||||||||||
RiverFront Dynamic Equity Income Fund | 4,031,308 | (35,110 | ) | – | 3,996,198 | 42,322,384 | ||||||||||||||
RiverFront Global Allocation Fund | 3,431,541 | (27,847 | ) | – | 3,403,694 | 25,629,388 | ||||||||||||||
RiverFront Global Growth Fund | 9,645,336 | (53,615 | ) | – | 9,591,721 | 55,894,854 | ||||||||||||||
RiverFront Moderate Growth & Income Fund | 8,103,569 | (58,848 | ) | – | 8,044,721 | 118,854,144 | ||||||||||||||
Deferred Tax Liability for ALPS | Alerian MLP Infrastructure Index Fund
Since the ALPS | Alerian MLP Infrastructure Index Fund will be subject to taxation on its taxable income, the NAV of Fund shares will also be reduced by the accrual of any deferred tax liabilities. The Index however is calculated without any adjustments for taxes. As a result, the Fund’s after tax performance could differ significantly from the Index even if the pretax performance of the Fund and the performance of the Index are closely correlated.
The Fund’s income tax expense/(benefit) consists of the following:
| October 31, 2013 | Current | Deferred | Total | |||||||||||
| ||||||||||||||
Federal | $ | 9,500 | $ | 137,427 | $ | 146,927 | ||||||||
State | 682 | 9,864 | 10,546 | |||||||||||
| ||||||||||||||
Total tax expense | $ | 10,182 | $ | 147,291 | $ | 157,473 | ||||||||
| ||||||||||||||
Deferred income taxes reflect the net tax effect of temporary differences between the carrying amounts of assets and liabilities for financial reporting and tax purposes.
Components of the Fund’s deferred tax assets and liabilities are as follows:
| As of October 31, 2013 | ||||
| ||||
Non-current Deferred tax assets: | ||||
Net Operating Loss Carryforward | $ | – | ||
Capital Loss Carryforward | – | |||
Other | – | |||
Less Non-current Deferred tax liabilities: | ||||
Net unrealized gain on investment securities | $ | (373,238 | ) | |
|
| |||
Net Deferred tax liability | $ | (373,238 | ) | |
|
| |||
Although the Fund currently has a net deferred tax liability, it reviews the recoverability of its deferred tax assets based upon the weight of available evidence. When assessing the recoverability of its deferred tax assets, significant weight was given to the effects of potential future realized and unrealized gains on investments and the period over which these deferred tax assets can be realized. Currently, any capital losses that may be generated by the Fund in the future are eligible to be carried back up to three years and can be carried forward for five years to offset capital gains recognized by the fund in those years. Net operating losses that may be generated by the Fund in the future are eligible to be carried back up to two years and can be carried forward for 20 years to offset income generated by the Fund in those years.
Based upon the Fund’s assessment, it has determined that it is more likely than not that its deferred tax assets will be realized through future taxable income of the appropriate character. Accordingly, no valuation allowance has been established for the Fund’s deferred tax assets. The Fund will continue to assess the need for a valuation allowance in the future. Significant declines in the fair value of its portfolio of investments may
| 141 | October 31, 2013 |
Notes to Financial Statements | ||
| October 31, 2013 (Unaudited) | ||
change the Fund’s assessment of the recoverability of these assets and may result in the recording of a valuation allowance against all or a portion of the Fund’s gross deferred tax assets.
Total income tax benefit (current and deferred) differs from the amount computed by applying the federal statutory income tax rate of 34% to net investment and realized and unrealized gain/(losses) on investment before taxes as follows:
| For the Period January 2, 2013 (Commencement) to October 31, 2013 | ||||
| ||||
Income tax expense at statutory rate | $ | 146,927 | ||
State income taxes (net of federal benefit) | 10,546 | |||
|
| |||
Net income tax expense | $ | 157,473 | ||
|
| |||
The following is a tabular reconciliation of the total amounts of unrecognized tax benefits:
| Inception to October 31, 2013 | ||||
| ||||
Unrecognized tax benefit - Beginning | $ | 0 | ||
Gross increases - tax positions in prior period | 0 | |||
Gross decreases - tax positions in prior period | 0 | |||
Gross increases - tax positions in current period | 0 | |||
Settlement | 0 | |||
Lapse of statute of limitations | 0 | |||
| ||||
Unrecognized tax benefit - Ending | $ | 0 | ||
The Fund recognizes interest accrued related to unrecognized tax benefits and penalties as income tax expense. For the period from Inception to October 31, 2013, the Fund had no accrued penalties or interest.
The Fund recognizes the tax benefits of uncertain tax positions only where the position is “more likely than not” to be sustained assuming examination by tax authorities. Management has analyzed the Fund’s tax positions, and has concluded that no liability for unrecognized tax benefits should be recorded related to uncertain tax positions taken on U.S. tax returns and state tax returns filed since inception of the fund. No U.S. federal or state income tax returns are currently under examination. The Fund’s initial tax year will be for the period ended October 31, 2013 and this period remains subject to examination by tax authorities in the United States. Due to the nature of the Fund’s investments, the Fund may be required to file income tax returns in several states. The Fund is not aware of any tax positions for which it is reasonably possible that the total amounts of unrecognized tax benefits will change materially in the next 12 months.
5. SECURITIES TRANSACTIONS
Purchases and sales of securities, excluding short-term securities and U.S. Government Obligations during the six months ended October 31, 2013 were as follows:
| Fund | Purchases of Securities | Proceeds from Sales of Securities | ||||||
ALPS | Alerian MLP Infrastructure Index Fund | $ | 7,686,307 | $ | 484,648 | ||||
ALPS | CoreCommodity Management CompleteCommodities® Strategy Fund(a) | 33,480,236 | 8,818,607 | ||||||
ALPS | Kotak India Growth Fund(b) | 1,903,867 | 2,242,259 | ||||||
ALPS | Red Rocks Listed Private Equity Fund | 115,371,414 | 55,159,120 | ||||||
ALPS | WMC Disciplined Value Fund | 8,459,760 | 10,379,659 | ||||||
Clough China Fund | 98,329,805 | 85,975,908 | ||||||
RiverFront Conservative Income Builder Fund | 3,878,414 | 2,921,448 | ||||||
RiverFront Dynamic Equity Income Fund | 29,977,475 | 21,428,241 | ||||||
RiverFront Global Allocation Fund | 13,466,457 | 11,278,297 | ||||||
RiverFront Global Growth Fund | 28,271,380 | 25,076,989 | ||||||
RiverFront Moderate Growth & Income Fund | 78,141,425 | 66,643,489 | ||||||
Purchases and sales of U.S. Government Obligations during the six months ended October 31, 2013 were as follows:
| Fund | Purchases of Securities | Proceeds from Sales of Securities | ||||||
ALPS | CoreCommodity Management CompleteCommodities® Strategy Fund | $ | 0 | $ | 5,815,897 | ||||
| 142 | October 31, 2013 |
Notes to Financial Statements | ||
| October 31, 2013 (Unaudited) | ||
| (a) | Purchases and Sales for ALPS | CoreCommodity Management CompleteCommodities® Strategy Fund are consolidated and include the balances of CoreCommodity Management Cayman Commodity Fund, Ltd. (wholly owned subsidiary). |
| (b) | Purchases and Sales for ALPS | Kotak India Growth Fund are consolidated and include the balances of Kotak Mauritius Portfolio (wholly owned subsidiary). |
6. BENEFICIAL INTEREST TRANSACTIONS
Shares redeemed within 90 days of purchase for ALPS | Red Rocks Listed Private Equity Fund and 30 days of purchase for ALPS | CoreCommodity Management CompleteCommodities® Strategy Fund, ALPS | Kotak India Growth Fund, and Clough China Fund, may incur a 2% short-term redemption fee deducted from the redemption amount. The ALPS | Alerian MLP Infrastructure Index Fund, ALPS | WMC Disciplined Value Fund, RiverFront Conservative Income Builder Fund, RiverFront Dynamic Equity Income Fund, RiverFront Global Allocation Fund, RiverFront Global Growth Fund, and RiverFront Moderate Growth & Income Fund shares do not incur redemption fees.
For the six months ended October 31, 2013, the amounts listed below were retained by the Funds. These amounts are reflected in “Shares redeemed” in the Statements of Changes in Net Assets.
| Redemption Fee Retained | ||||||||
|
| |||||||
| Fund | For the Six Months Ended October 31, 2013 (Unaudited) | For the Year Ended April 30, 2013 | ||||||
| ||||||||
ALPS | CoreCommodity Management CompleteCommodities® Strategy Fund - Class A | $ 4,152 | $ 17,040 | ||||||
ALPS | CoreCommodity Management CompleteCommodities® Strategy Fund - Class C | 49 | 186 | ||||||
ALPS | CoreCommodity Management CompleteCommodities® Strategy Fund - Class I | 9,893 | 10,053 | ||||||
ALPS | Kotak India Growth Fund - Class A | 405 | 393 | ||||||
ALPS | Kotak India Growth Fund - Class I | – | 196 | ||||||
ALPS | Red Rocks Listed Private Equity Fund - Class A | 7,381 | 15,999 | ||||||
ALPS | Red Rocks Listed Private Equity Fund - Class C | 353 | 228 | ||||||
ALPS | Red Rocks Listed Private Equity Fund - Class I | 23,541 | 9,757 | ||||||
Clough China Fund - Class A | 2,854 | 564 | ||||||
Clough China Fund - Class C | 145 | 2 | ||||||
Clough China Fund - Class I | 6,795 | 22,029 | ||||||
Transactions in shares of capital stock were as follows:
| ALPS | Alerian MLP Infrastructure Index Fund | ||||||||
|
| |||||||
For the Six Months Ended | For the Period January 2, 2013 (Commencement) to April 30, 2013 | |||||||
| ||||||||
Class A | ||||||||
Shares sold | 588,813 | 82,771 | ||||||
Dividends reinvested | 2,465 | 806 | ||||||
Shares redeemed | (45,805) | (1) | ||||||
| ||||||||
Net increase in shares outstanding | 545,473 | 83,576 | ||||||
| ||||||||
| ||||||||
Class C | ||||||||
Shares sold | 96,675 | 50,001 | ||||||
Dividends reinvested | 1,568 | 758 | ||||||
Shares redeemed | – | (1) | ||||||
| ||||||||
Net increase in shares outstanding | 98,243 | 50,758 | ||||||
| ||||||||
| ||||||||
Class I | ||||||||
Shares sold | 20,978 | 200,001 | ||||||
Dividends reinvested | 6,197 | 3,031 | ||||||
Shares redeemed | – | (1) | ||||||
| ||||||||
Net increase in shares outstanding | 27,175 | 203,031 | ||||||
| ||||||||
| ||||||||
| 143 | October 31, 2013 |
Notes to Financial Statements | ||
| October 31, 2013 (Unaudited) | ||
ALPS | CoreCommodity Management CompleteCommodities® Strategy Fund | ||||||||
|
| |||||||
For the Six Months Ended October 31, 2013 (Unaudited) | For the Year Ended April 30, 2013 | |||||||
| ||||||||
Class A | ||||||||
Shares sold | 3,805,918 | 8,530,181 | ||||||
Dividends reinvested | – | 38,287 | ||||||
Shares redeemed | (4,161,301) | (6,220,651) | ||||||
| ||||||||
Net increase/(decrease) in shares outstanding | (355,383) | 2,347,817 | ||||||
| ||||||||
Class C | ||||||||
Shares sold | 339,136 | 806,811 | ||||||
Dividends reinvested | – | 4,974 | ||||||
Shares redeemed | (350,599) | (549,258) | ||||||
| ||||||||
Net increase/(decrease) in shares outstanding | (11,463) | 262,527 | ||||||
| ||||||||
Class I | ||||||||
Shares sold | 10,493,829 | 14,771,425 | ||||||
Dividends reinvested | – | 52,410 | ||||||
Shares redeemed | (3,815,007) | (4,279,108) | ||||||
| ||||||||
Net increase in shares outstanding | 6,678,822 | 10,544,727 | ||||||
| ||||||||
| ALPS | Kotak India Growth Fund | ||||||||
|
| |||||||
For the October 31, 2013 (Unaudited) | For the Year Ended April 30, 2013 | |||||||
| ||||||||
Class A | ||||||||
Shares sold | 168,524 | 358,458 | ||||||
Dividends reinvested | – | – | ||||||
Shares redeemed | (185,679) | (156,778) | ||||||
| ||||||||
Net increase/(decrease) in shares outstanding | (17,155) | 201,680 | ||||||
| ||||||||
Class C | ||||||||
Shares sold | 22,475 | 58,597 | ||||||
Dividends reinvested | – | – | ||||||
Shares redeemed | (40,033) | (13,079) | ||||||
| ||||||||
Net increase/(decrease) in shares outstanding | (17,558) | 45,518 | ||||||
| ||||||||
Class I | ||||||||
Shares sold | 36,244 | 86,660 | ||||||
Dividends reinvested | – | – | ||||||
Shares redeemed | (55,301) | (56,376) | ||||||
| ||||||||
Net increase/(decrease) in shares outstanding | (19,057) | 30,284 | ||||||
| ||||||||
| 144 | October 31, 2013 |
Notes to Financial Statements | ||
| October 31, 2013 (Unaudited) | ||
| ALPS | Red Rocks Listed Private Equity Fund | ||||||||
|
| |||||||
For the Six Months Ended October 31, 2013 (Unaudited) | For the Year Ended April 30, 2013 | |||||||
| ||||||||
Class A | ||||||||
Shares sold | 9,121,430 | 5,739,840 | ||||||
Dividends reinvested | – | 248,170 | ||||||
Shares redeemed | (2,442,276) | (6,914,956) | ||||||
| ||||||||
Net increase/(decrease) in shares outstanding | 6,679,154 | (926,946) | ||||||
| ||||||||
Class C | ||||||||
Shares sold | 291,705 | 237,926 | ||||||
Dividends reinvested | – | 6,033 | ||||||
Shares redeemed | (58,782) | (116,850) | ||||||
| ||||||||
Net increase in shares outstanding | 232,923 | 127,109 | ||||||
| ||||||||
Class I | ||||||||
Shares sold | 7,213,442 | 11,839,555 | ||||||
Dividends reinvested | – | 127,149 | ||||||
Shares redeemed | (5,299,959) | (5,867,506) | ||||||
| ||||||||
Net increase in shares outstanding | 1,913,483 | 6,099,198 | ||||||
| ||||||||
Class R | ||||||||
Shares sold | 20,691 | 29,401 | ||||||
Dividends reinvested | – | 178 | ||||||
Shares redeemed | (161) | (5,330) | ||||||
| ||||||||
Net increase in shares outstanding | 20,530 | 24,249 | ||||||
| ||||||||
| ALPS | WMC Disciplined Value Fund | ||||||||
|
| |||||||
For the Six Months Ended October 31, 2013 (Unaudited) | For the Year Ended April 30, 2013 | |||||||
| ||||||||
Class A | ||||||||
Shares sold | 23,882 | 237,314 | ||||||
Dividends reinvested | – | 53,334 | ||||||
Shares redeemed | (208,099) | (620,571) | ||||||
| ||||||||
Net decrease in shares outstanding | (184,217) | (329,923) | ||||||
| ||||||||
Class C | ||||||||
Shares sold | 241 | 653 | ||||||
Dividends reinvested | – | 57 | ||||||
Shares redeemed | (1,585) | – | ||||||
| ||||||||
Net increase/(decrease) in shares outstanding | (1,344) | 710 | ||||||
| ||||||||
Class I | ||||||||
Shares sold | 304,365 | 596,565 | ||||||
Dividends reinvested | – | 44,131 | ||||||
Shares redeemed | (357,005) | (815,605) | ||||||
| ||||||||
Net decrease in shares outstanding | (52,640) | (174,909) | ||||||
| ||||||||
| 145 | October 31, 2013 |
Notes to Financial Statements | ||
| October 31, 2013 (Unaudited) | ||
| Clough China Fund | ||||||||
|
| |||||||
For the Six Months Ended October 31, 2013 (Unaudited) | For the Year Ended April 30, 2013 | |||||||
| ||||||||
Class A | ||||||||
Shares sold | 314,551 | 403,248 | ||||||
Dividends reinvested | – | 1,259 | ||||||
Shares redeemed | (188,289) | (537,081) | ||||||
| ||||||||
Net increase/(decrease) in shares outstanding | 126,262 | (132,574) | ||||||
| ||||||||
Class C | ||||||||
Shares sold | 88,091 | 129,593 | ||||||
Dividends reinvested | – | – | ||||||
Shares redeemed | (108,852) | (190,104) | ||||||
| ||||||||
Net decrease in shares outstanding | (20,761) | (60,511) | ||||||
| ||||||||
Class I | ||||||||
Shares sold | 561,540 | 1,926,116 | ||||||
Dividends reinvested | – | 912 | ||||||
Shares redeemed | (116,266) | (2,279,485) | ||||||
| ||||||||
Net increase/(decrease) in shares outstanding | 445,274 | (352,457) | ||||||
| ||||||||
| RiverFront Conservative Income Builder Fund | ||||||||
|
| |||||||
For the Six Months Ended October 31, 2013 (Unaudited) | For the Period (Commencement) to April 30, 2013 | |||||||
| ||||||||
Class A | ||||||||
Shares sold | 28,408 | 57,836 | ||||||
Dividends reinvested | 212 | 47 | ||||||
Shares redeemed | (8,679) | – | ||||||
| ||||||||
Net increase in shares outstanding | 19,941 | 57,883 | ||||||
| ||||||||
Class C | ||||||||
Shares sold | 74,200 | 215,910 | ||||||
Dividends reinvested | 2,313 | 250 | ||||||
Shares redeemed | (62,783) | (658) | ||||||
| ||||||||
Net increase in shares outstanding | 13,730 | 215,502 | ||||||
| ||||||||
Class I | ||||||||
Shares sold | 130,384 | 74,254 | ||||||
Dividends reinvested | 1,153 | 1,217 | ||||||
Shares redeemed | (69,685) | (5,954) | ||||||
| ||||||||
Net increase in shares outstanding | 61,852 | 69,517 | ||||||
| ||||||||
| 146 | October 31, 2013 |
Notes to Financial Statements | ||
| October 31, 2013 (Unaudited) | ||
| RiverFront Dynamic Equity Income Fund | ||||||||
|
| |||||||
For the Six Months Ended October 31, 2013 (Unaudited) | For the Year Ended April 30, 2013 | |||||||
| ||||||||
Class A | ||||||||
Shares sold | 199,218 | 281,177 | ||||||
Dividends reinvested | 4,480 | 11,503 | ||||||
Shares redeemed | (57,367) | (264,787) | ||||||
| ||||||||
Net increase in shares outstanding | 146,331 | 27,893 | ||||||
| ||||||||
Class C | ||||||||
Shares sold | 354,125 | 407,618 | ||||||
Dividends reinvested | 5,882 | 16,294 | ||||||
Shares redeemed | (86,197) | (331,282) | ||||||
| ||||||||
Net increase in shares outstanding | 273,810 | 92,630 | ||||||
| ||||||||
Class I | ||||||||
Shares sold | 433,237 | 459,512 | ||||||
Dividends reinvested | 7,169 | 14,180 | ||||||
Shares redeemed | (150,661) | (230,931) | ||||||
| ||||||||
Net increase in shares outstanding | 289,745 | 242,761 | ||||||
| ||||||||
| RiverFront Global Allocation Fund | ||||||||
|
| |||||||
For the Six Months Ended (Unaudited) | For the Year Ended April 30, 2013 | |||||||
| ||||||||
Class A | ||||||||
Shares sold | 70,953 | 276,072 | ||||||
Dividends reinvested | – | 8,077 | ||||||
Shares redeemed | (83,968) | (126,146) | ||||||
| ||||||||
Net increase/(decrease) in shares outstanding | (13,015) | 158,003 | ||||||
| ||||||||
Class C | ||||||||
Shares sold | 182,427 | 224,493 | ||||||
Dividends reinvested | – | 6,887 | ||||||
Shares redeemed | (86,113) | (328,407) | ||||||
| ||||||||
Net increase/(decrease) in shares outstanding | 96,314 | (97,027) | ||||||
| ||||||||
Class I | ||||||||
Shares sold | 185,415 | 394,681 | ||||||
Dividends reinvested | – | 6,276 | ||||||
Shares redeemed | (69,630) | (159,373) | ||||||
| ||||||||
Net increase in shares outstanding | 115,785 | 241,584 | ||||||
| ||||||||
| 147 | October 31, 2013 |
Notes to Financial Statements | ||
| October 31, 2013 (Unaudited) | ||
| RiverFront Global Growth Fund | ||||||||
|
| |||||||
For the Six Months Ended October 31, 2013 (Unaudited) | For the Year Ended April 30, 2013 | |||||||
| ||||||||
Class A | ||||||||
Shares sold | 264,523 | 449,097 | ||||||
Dividends reinvested | – | 8,021 | ||||||
Shares redeemed | (89,982) | (276,448) | ||||||
| ||||||||
Net increase in shares outstanding | 174,541 | 180,670 | ||||||
| ||||||||
Class C | ||||||||
Shares sold | 145,038 | 171,120 | ||||||
Dividends reinvested | – | 5,393 | ||||||
Shares redeemed | (47,913) | (202,053) | ||||||
| ||||||||
Net increase/(decrease) in shares outstanding | 97,125 | (25,540) | ||||||
| ||||||||
Class I | ||||||||
Shares sold | 228,675 | 272,611 | ||||||
Dividends reinvested | – | 5,552 | ||||||
Shares redeemed | (61,035) | (207,050) | ||||||
| ||||||||
Net increase in shares outstanding | 167,640 | 71,113 | ||||||
| ||||||||
Class L | ||||||||
Shares sold | 75,608 | 206,678 | ||||||
Dividends reinvested | – | 27,327 | ||||||
Shares redeemed | (171,759) | (511,817) | ||||||
| ||||||||
Net decrease in shares outstanding | (96,151) | (277,812) | ||||||
| ||||||||
Investor Class | ||||||||
Shares sold | 5,171 | 16,623 | ||||||
Dividends reinvested | – | 8,789 | ||||||
Shares redeemed | (83,045) | (167,484) | ||||||
| ||||||||
Net decrease in shares outstanding | (77,874) | (142,072) | ||||||
| ||||||||
| RiverFront Moderate Growth & Income Fund | ||||||||
|
| |||||||
For the Six Months Ended October 31, 2013 (Unaudited) | For the Year Ended April 30, 2013 | |||||||
| ||||||||
Class A | ||||||||
Shares sold | 512,222 | 1,025,931 | ||||||
Dividends reinvested | 13,931 | 40,069 | ||||||
Shares redeemed | (346,436) | (467,697) | ||||||
| ||||||||
Net increase in shares outstanding | 179,717 | 598,303 | ||||||
| ||||||||
Class C | ||||||||
Shares sold | 820,659 | 1,700,686 | ||||||
Dividends reinvested | 13,573 | 44,339 | ||||||
Shares redeemed | (453,902) | (792,564) | ||||||
| ||||||||
Net increase in shares outstanding | 380,330 | 952,461 | ||||||
| ||||||||
Class I | ||||||||
Shares sold | 931,305 | 1,805,781 | ||||||
Dividends reinvested | 17,893 | 35,557 | ||||||
Shares redeemed | (345,122) | (795,302) | ||||||
| ||||||||
Net increase in shares outstanding | 604,076 | 1,046,036 | ||||||
| ||||||||
7. MANAGEMENT AND RELATED-PARTY TRANSACTIONS
ALPS Advisors, Inc. (“AAI” or “Advisor”), subject to the authority of the Board, is responsible for the overall management and administration of each Fund’s business affairs. AAI has delegated daily management of the Funds listed below to the corresponding Sub-Advisor listed in the table below. Each Sub-Advisor manages the investments of the Fund in accordance with its investment objective, policies and limitations and investment guidelines established jointly by the Advisor and the Board.
| 148 | October 31, 2013 |
Notes to Financial Statements | ||
| October 31, 2013 (Unaudited) | ||
| Fund | Sub-Advisor | |
ALPS | CoreCommodity Management CompleteCommodities® Strategy Fund | CoreCommodity Management, LLC (formerly CoreCommodity Asset Management, LLC) | |
ALPS | Kotak India Growth Fund | Kotak Mahindra (UK) Limited | |
ALPS | Red Rocks Listed Private Equity Fund | Red Rocks Capital LLC | |
ALPS | WMC Disciplined Value Fund | Wellington Management Company, LLP | |
Clough China Fund | Clough Capital Partners, LP | |
RiverFront Conservative Income Builder Fund | RiverFront Investment Group, LLC | |
RiverFront Dynamic Equity Income Fund | RiverFront Investment Group, LLC | |
RiverFront Global Allocation Fund | RiverFront Investment Group, LLC | |
RiverFront Global Growth Fund | RiverFront Investment Group, LLC | |
RiverFront Moderate Growth & Income Fund | RiverFront Investment Group, LLC |
Pursuant to the Investment Advisory Agreement (the “Advisory Agreement”), each Fund pays the Advisor an annual management fee which is based on the Fund’s average daily net assets. The management fee is paid on a monthly basis. The following table reflects the Funds’ contractual management fee rates (expressed as an annual rate).
| Fund | Contractual Management Fee | |||
ALPS | Alerian MLP Infrastructure Index Fund | 0.70% | |||
ALPS | CoreCommodity Management CompleteCommodities® Strategy Fund | 0.85% | |||
ALPS | Kotak India Growth Fund | 1.25% | |||
ALPS | Red Rocks Listed Private Equity Fund | 0.85% | |||
ALPS | WMC Disciplined Value Fund | 0.95%(a) | |||
Clough China Fund | 1.35% | |||
RiverFront Conservative Income Builder Fund | 0.85% | |||
RiverFront Dynamic Equity Income Fund | 0.85% | |||
RiverFront Global Allocation Fund | 0.85% | |||
RiverFront Global Growth Fund | 0.85% | |||
RiverFront Moderate Growth & Income Fund | 0.85% |
| (a) | The contractual management fee is 0.95% for the first $250 million of net assets, 0.85% for the next $250 million of net assets, and 0.75% for net assets in excess of $500 million. |
Pursuant to an Investment Sub-advisory Agreement, the Advisor pays each sub-advisor an annual sub-advisory management fee which is based on each Fund’s average daily assets. The Advisor is required to pay all fees due to each sub-advisor out of the management fee the Advisor receives from each Fund. The following table reflects the Funds’ contractual sub-advisory fee rates.
| Fund | Average Daily Net Assets of the Fund | Contractual Sub-Advisory Fee | ||
ALPS | CoreCommodity Management CompleteCommodities® Strategy Fund | All Asset Levels | 0.75% | ||
ALPS | Kotak India Growth Fund | First $50 Million | 1.15% | ||
| Over $50 Million | 1.05% | |||
ALPS | Red Rocks Listed Private Equity Fund | All Asset Levels | 0.57% | ||
ALPS | WMC Disciplined Value Fund | First $250 Million | 0.50% | ||
| $250 Million - $500 Million | 0.40% | |||
| Over $500 Million | 0.30% | |||
Clough China Fund | All Asset Levels | 0.90% | ||
RiverFront Conservative Income Builder Fund | All Asset Levels | 0.60% | ||
RiverFront Dynamic Equity Income Fund | All Asset Levels | 0.60% | ||
RiverFront Global Allocation Fund | All Asset Levels | 0.60% | ||
RiverFront Global Growth Fund | All Asset Levels | 0.60% | ||
RiverFront Moderate Growth & Income Fund | All Asset Levels | 0.60% |
| 149 | October 31, 2013 |
Notes to Financial Statements | ||
| October 31, 2013 (Unaudited) | ||
The Advisor and the Sub-Advisor have contractually agreed to limit the amount of each Fund’s total annual expenses, exclusive of distribution and service (12b-1) fees (except Clough China Class A, Class C and Class I shares), shareholder service fees (except ALPS | Red Rocks Listed Private Equity Class A shares, ALPS | WMC Disciplined Value Class A shares, and Clough China Class C shares), acquired fund fees and expenses, brokerage expenses, interest expense, short sale dividend expense, taxes and extraordinary expenses, that exceed the following annual rates below. These agreements are reevaluated on an annual basis based on the terms disclosed below.
| Fund | Class A | Class C | Class I | Class Inv | Class L | Class R | Term of Expense Limit Agreement | |||||||
ALPS | Alerian MLP Infrastructure Index Fund | 0.85% | 0.85% | 0.85% | N/A | N/A | N/A | 12/31/12 - 8/31/14 | |||||||
ALPS | CoreCommodity Management CompleteCommodities® Strategy Fund | 1.05% | 1.05% | 1.15% | N/A | N/A | N/A | 9/1/13 - 8/31/14 | |||||||
ALPS | Kotak India Growth Fund | 1.60% | 1.60% | 1.60% | N/A | N/A | N/A | 9/1/13 - 8/31/14 | |||||||
ALPS | Red Rocks Listed Private Equity Fund | 1.25% | 1.25% | 1.25% | N/A | N/A | 1.25% | 9/1/13 - 8/31/14 | |||||||
ALPS | WMC Disciplined Value Fund | 1.15% | 1.15% | 1.15% | N/A | N/A | N/A | 9/1/13 - 8/31/14 | |||||||
Clough China Fund | 1.95% | 2.70% | 1.70% | N/A | N/A | N/A | 9/1/13 - 8/31/14 | |||||||
RiverFront Conservative Income Builder Fund | 0.90% | 0.90% | 0.90% | N/A | N/A | N/A | 9/1/13 - 8/31/14 | |||||||
RiverFront Dynamic Equity Income Fund | 0.90%(a) | 0.90%(a) | 0.90%(a) | N/A | N/A | N/A | 9/1/13 - 8/31/14 | |||||||
RiverFront Global Allocation Fund | 0.90%(a) | 0.90%(a) | 0.90%(a) | N/A | N/A | N/A | 9/1/13 - 8/31/14 | |||||||
RiverFront Global Growth Fund | 0.90% | 0.90% | 0.90% | 0.90% | 0.90% | N/A | 9/1/13 - 8/31/14 | |||||||
RiverFront Moderate Growth & Income Fund | 0.90%(a) | 0.90%(a) | 0.90%(a) | N/A | N/A | N/A | 9/1/13 - 8/31/14 |
| (a) | Prior to September 1, 2012, the Advisor and the Sub-Advisor had contractually agreed to limit the amount of each Fund’s total annual expenses, to 1.05% for Class A, Class C and Class I, respectively. |
The Advisor and each Sub-Advisor are permitted to recover expenses they have waived or reimbursed, on a class-by-class basis, through the agreements described above to the extent that expenses in later periods fall below the annual limits set forth in these agreements. Clough China Fund is not obligated to pay any such waived or reimbursed fees and expenses more than one year after the end of the fiscal year in which the fees or expenses were waived or reimbursed. The ALPS | CoreCommodity Management CompleteCommodities® Strategy Fund is not obligated to pay any such waived or reimbursed fees and expenses more than two years after the end of the fiscal year in which the fees or expenses were waived or reimbursed. The ALPS | Alerian MLP Infrastructure Index Fund, ALPS | Kotak India Growth Fund, ALPS | Red Rocks Listed Private Equity Fund, ALPS | WMC Disciplined Value Fund, RiverFront Conservative Income Builder Fund, RiverFront Global Growth Fund, RiverFront Dynamic Equity Income Fund, RiverFront Global Allocation Fund and RiverFront Moderate Growth & Income Fund are not obligated to pay any such waived or reimbursed fees and expenses more than three years after the end of the fiscal year in which the fees or expenses were waived or reimbursed. At April 30, 2013, the Advisor and Sub-Advisor may seek reimbursement of previously waived and reimbursed fees as follows:
| Fund | Expires 2014 | Expires 2015 | Expires 2016 | Total | ||||||||||||
ALPS | Alerian MLP Infrastructure Index Fund | $ | N/A | $ | N/A | $ | 54,740 | $ | 54,740 | ||||||||
LPS | CoreCommodity Management CompleteCommodities® Strategy Fund | 248,300 | 130,091 | N/A | 378,391 | ||||||||||||
ALPS | Kotak India Growth Fund | 110,597 | 376,235 | 346,958 | 833,790 | ||||||||||||
ALPS | Red Rocks Listed Private Equity Fund | 210,227 | 296,218 | 34,598 | 541,043 | ||||||||||||
ALPS | WMC Disciplined Value Fund | 189,671 | 127,336 | 87,006 | 404,013 | ||||||||||||
Clough China Fund | 139,506 | N/A | N/A | 139,506 | ||||||||||||
RiverFront Conservative Income Builder Fund | N/A | N/A | 66,571 | 66,571 | ||||||||||||
RiverFront Dynamic Equity Income Fund | 54,560 | 100,877 | 108,866 | 264,303 | ||||||||||||
RiverFront Global Allocation Fund | 69,932 | 103,414 | 98,108 | 271,454 | ||||||||||||
RiverFront Global Growth Fund | 171,374 | 369,241 | 261,018 | 801,633 | ||||||||||||
RiverFront Moderate Growth & Income Fund | 69,535 | 117,687 | 180,370 | 367,592 | ||||||||||||
ALPS Portfolio Solutions Distributor, Inc. (the “Distributor”) acts as the distributor of the Funds’ shares pursuant to a Distribution Agreement with the Trust. Prior to April 30, 2013, the Distributor was ALPS Distributors, Inc. Shares are sold on a continuous basis by the Distributor, as agent for the Funds, and the Distributor has agreed to use its best efforts to solicit orders for the sale of Funds’ shares, although it is not obliged to sell any particular amount of shares. The Distributor is not entitled to any compensation for its services. The Distributor is registered as a broker-dealer with the Securities and Exchange Commission. The Funds’ Distributor is also the distributor of the Select Sector SPDR exchange traded funds (the
| 150 | October 31, 2013 |
Notes to Financial Statements | ||
| October 31, 2013 (Unaudited) | ||
“Underlying Sector ETFs”). As required by exemptive relief obtained by the Underlying Sector ETFs, the Advisor will reimburse any applicable Fund an amount equal to the distribution fee received by the Distributor from the Underlying Sector ETFs attributable to such Fund’s investment in the Underlying Sector ETFs, for so long as the Distributor acts as distributor to such Fund and the Underlying Sector ETFs.
Each Fund has adopted a Distribution and Services Plan (the “Plan”) pursuant to Rule 12b-1 of the 1940 Act for the Class A, Class C, Class R (ALPS | Red Rocks Listed Private Equity Fund only), and Investor Class (RiverFront Global Growth Fund only) shares. The Plan allows a Fund to use Class A, Class C, Class R and Investor Class assets to pay fees in connection with the distribution and marketing of Class A, Class C, Class R and Investor Class shares and/or the provision of shareholder services to Class A, Class C, Class R and Investor Class shareholders. The Plan permits payment for services in connection with the administration of plans or programs that use Class A, Class C, Class R and Investor Class shares of a Fund, if any, as their funding medium and for related expenses. The Plan permits a Fund to make total payments at an annual rate of up to 0.25% of a Fund’s average daily net assets attributable to its Class A and Investor Class shares, 0.75% of a Fund’s average daily net assets attributable to its Class C shares and 0.50% of the ALPS | Red Rocks Listed Private Equity Fund’s average daily net assets attributable to its Class R shares. Because these fees are paid out of a Fund’s Class A, Class C, Class R and Investor Class assets, if any, on an ongoing basis, over time they will increase the cost of an investment in Class A, Class C, Class R and Investor Class shares, if any, and Plan fees may cost an investor more than other types of sales charges.
The ALPS | Alerian MLP Infrastructure Index Fund Class A and Class C shares, ALPS | Kotak India Growth Fund Class A and Class C shares, ALPS | Red Rocks Listed Private Equity Fund Class A and Class C shares, ALPS | WMC Disciplined Value Fund Class C shares, Clough China Fund Class C shares, ALPS | CoreCommodity Management CompleteCommodities® Strategy Fund Class A and Class C shares, RiverFront Conservative Income Builder Fund Class C shares, RiverFront Dynamic Equity Income Fund Class C shares, RiverFront Global Allocation Fund Class C shares, RiverFront Global Growth Fund Class C Shares, and the RiverFront Moderate Growth & Income Fund Class C shares have adopted a shareholder services plan (“Shareholder Services Plan”). Under the Shareholder Services Plan for each Fund, the Funds are authorized to pay banks and their affiliates and other institutions, including broker-dealers and Fund affiliates (“Participating Organizations”), an aggregate fee in an amount not to exceed on an annual basis 0.15% for ALPS | Alerian MLP Infrastructure Index Fund Class A shares, ALPS | Kotak India Growth Fund Class A shares, ALPS | Red Rocks Listed Private Equity Fund Class A shares, and ALPS | CoreCommodity Management CompleteCommodities® Strategy Fund Class A shares, and not to exceed 0.25% for the ALPS | Alerian MLP Infrastructure Index Fund Class C shares, ALPS | Kotak India Growth Fund Class C shares, ALPS | Red Rocks Listed Private Equity Fund Class C shares, ALPS | WMC Disciplined Value Fund Class C shares, Clough China Fund Class C shares, ALPS | CoreCommodity Management CompleteCommodities® Strategy Fund Class C shares, RiverFront Conservative Income Builder Fund Class C shares, RiverFront Dynamic Equity Income Fund Class C shares, RiverFront Global Allocation Fund Class C shares, RiverFront Global Growth Fund Class C Shares, and the RiverFront Moderate Growth & Income Fund Class C shares of the average daily net asset value of the Class A shares and Class C shares, respectively, attributable to or held in the name of a Participating Organization for its clients as compensation for providing shareholder service activities, which do not include distribution services, pursuant to an agreement with a Participating Organization. Shareholder Services plan fees are included with distribution and service fees on the Statements of Operations.
Certain intermediaries may charge networking, omnibus account or other administrative fees with respect to transactions in shares of each Fund. Transactions may be processed through the National Securities Clearing Corporation or similar systems or processed on a manual basis. These fees are paid by the Fund to the Distributor, which uses such fees to reimburse intermediaries. In the event an intermediary receiving payments from the Distributor on behalf of the Fund converts from a networking structure to an omnibus account structure or otherwise experiences increased costs, fees borne by the Fund may increase. Networking fees are shown in the Statements of Operations, if applicable to the Fund.
ALPS Fund Services, Inc. (“ALPS”) serves as administrator to the Funds and the Funds have agreed to pay expenses incurred in connection with their administrative activities. Pursuant to an Administrative Agreement, ALPS provides operational services to the Funds including, but not limited to fund accounting and fund administration and generally assists in the Funds’ operations.
ALPS Price MeadowsSM (“APM”), a division of ALPS, provides administration services to the CoreCommodity Management Cayman Commodity Fund Ltd. and receives an annual fee of $50,000 for such services.
The Annual Administrative Fee is based on each Fund’s average daily net assets and will be billed monthly, at the following:
| Fund | Average Daily Net Assets of the Fund | Annual Administrative Fee | ||
ALPS | Alerian MLP Infrastructure Index Fund | All Asset Levels | 0.10% | ||
ALPS | CoreCommodity Management CompleteCommodities® StrategyFund | All Asset Levels | 0.10%* | ||
ALPS | Kotak India Growth Fund | All Asset Levels | 0.15%** | ||
ALPS | Red Rocks Listed Private Equity Fund | First $500 Million | 0.08% | ||
| $500 Million - $1 Billion | 0.06% | |||
| Over $1 Billion | 0.04% | |||
ALPS | WMC Disciplined Value Fund | All Asset Levels | 0.15% |
| 151 | October 31, 2013 |
Notes to Financial Statements | ||
| October 31, 2013 (Unaudited) | ||
| Fund | Average Daily Net Assets of the Fund | Annual Administrative Fee | ||
Clough China Fund | All Asset Levels | 0.15% | ||
RiverFront Conservative Income Builder Fund | All Asset Levels | 0.10% | ||
RiverFront Dynamic Equity Income Fund | All Asset Levels | 0.10% | ||
RiverFront Global Allocation Fund | All Asset Levels | 0.10% | ||
RiverFront Global Growth Fund | All Asset Levels | 0.10% | ||
RiverFront Moderate Growth & Income Fund | All Asset Levels | 0.10% |
| * | Subject to a minimum annual fee of $57,140. |
| ** | Subject to a minimum annual fee of $100,000. |
8. INDEMNIFICATIONS
Under the Trust’s organizational documents, its officers and Trustees are indemnified against certain liability arising out of the performance of their duties to the Trust. Additionally, in the normal course of business, the Trust enters into contracts with service providers that may contain general indemnification clauses which may permit indemnification to the extent permissible under applicable law. The Trust’s maximum exposure under these arrangements is unknown, as this would involve future claims that may be made against the Trust that have not yet occurred.
9. NEW ACCOUNTING PRONOUNCEMENTS
In June 2013, the Financial Accounting Standards Board (the “FASB”) issued Accounting Standards Update (“ASU”) No. 2013-08, Financial Services-Investment Companies (Topic 946): Amendments to the Scope, Measurement, and Disclosure Requirements. The FASB standard identifies characteristics a company must assess to determine whether it is considered an investment company for financial reporting purposes. This ASU is effective for fiscal years beginning after December 15, 2013. The Funds believe the adoption of this ASU will not have a material impact on their financial statements.
| 152 | October 31, 2013 |
| October 31, 2013 (Unaudited) | ||
1. FUND HOLDINGS
The Funds file their complete schedule of portfolio holdings with the Securities and Exchange Commission (the “SEC”) for the first and third quarters of each fiscal year on Form N-Q within 60 days after the end of the period. Copies of the Funds’ Form N-Q are available without charge on the SEC website at http://www.sec.gov. You may also review and copy the Form N-Q at the SEC’s Public Reference Room in Washington, D.C. For more information about the operation of the Public Reference Room, please call the SEC at 1-800-SEC-0330.
2. FUND PROXY VOTING POLICIES, PROCEDURES AND SUMMARIES
Fund policies and procedures used in determining how to vote proxies and information regarding how each of the Funds voted proxies relating to portfolio securities during the most recent prior 12-month period ending June 30 are available without charge, (1) upon request, by calling (toll-free) (866) 759-5679 and (2) on the SEC’s website at http://www.sec.gov.
3. DISCLOSURE REGARDING APPROVAL OF FUND ADVISORY AND SUB-ADVISORY AGREEMENTS
The ALPS | CoreCommodity Management CompleteCommodities® Strategy Fund (The “CoreCommodity Fund”)
On June 11, 2013, the Trustees met in person to discuss, among other things, the approval of the Investment Advisory Agreement between the Trust and ALPS Advisors, Inc. (“ALPS Advisors”) (the “CoreCommodity Advisory Agreement”), and the Investment Sub-Advisory Agreement among the Trust, ALPS Advisors and CoreCommodity Management, LLC (“CoreCommodity”) (the “CoreCommodity Sub-Advisory Agreement”), in accordance with Section 15(c) of the 1940 Act. The Independent Trustees met with independent legal counsel during executive session and discussed the CoreCommodity Advisory Agreement, the CoreCommodity Sub-Advisory Agreement and other related materials.
In renewing and approving the CoreCommodity Advisory Agreement with ALPS Advisors and the CoreCommodity Sub-Advisory Agreement with CoreCommodity, the Trustees, including the Independent Trustees, considered the following factors with respect to the CoreCommodity Fund:
Investment Advisory Fee Rate: The Trustees reviewed and considered the contractual annual advisory fee to be paid by (a) the Trust, on behalf of the CoreCommodity Fund, to ALPS Advisors of 0.85% of the CoreCommodity Fund’s daily average net assets and (b) by ALPS Advisors to CoreCommodity of (i) 0.75% of the CoreCommodity Fund’s daily average net assets, in light of the extent and quality of the advisory services provided by the ALPS Advisors and CoreCommodity to the CoreCommodity Fund.
The Board received and considered information comparing the CoreCommodity Fund’s contractual advisory fees and overall expenses with those of funds in both the relevant expense group and universe of funds provided by an independent provider of investment company data.
Based on such information, the Trustees further determined that the contractual annual advisory fees set forth above and the total expense ratio of 1.05% for Class A shares, 1.05% for Class C shares, and 1.15% for Class I shares of the CoreCommodity Fund, taking into account the contractual fee waivers in place, is comparable to others within such Fund’s peer universe.
Nature, Extent and Quality of the Services under the CoreCommodity Advisory Agreement and the CoreCommodity Sub-Advisory Agreement: The Trustees received and considered information regarding the nature, extent and quality of services provided to the CoreCommodity Fund under the CoreCommodity Advisory Agreement and the CoreCommodity Sub-Advisory Agreement. The Trustees reviewed certain background materials supplied by ALPS Advisors and CoreCommodity in each of their presentations, including their Forms ADV.
The Trustees reviewed and considered ALPS Advisors’ and CoreCommodity’s investment advisory personnel, their history as asset managers, their performance and the amount of assets currently under management by ALPS Advisors and CoreCommodity. The Trustees also reviewed the research and decision-making processes utilized by ALPS Advisors and CoreCommodity, including the methods adopted to seek to achieve compliance with the investment objectives, policies and restrictions of the CoreCommodity Fund.
The Trustees considered the background and experience of ALPS Advisors’ and CoreCommodity’s management in connection with the CoreCommodity Fund, including reviewing the qualifications, backgrounds and responsibilities of the management team primarily responsible for the day-to-day portfolio management of the CoreCommodity Fund and the extent of the resources devoted to research and analysis of actual and potential investments.
The Trustees also reviewed the accompanying compliance-related materials and noted that they have received reports on these services and compliance issues from ALPS Advisors and CoreCommodity at each regular Board meeting throughout the year related to the services rendered by ALPS Advisors and CoreCommodity with respect to the CoreCommodity Fund.
CoreCommodity Fund Performance: The Trustees reviewed performance information for the CoreCommodity Fund for the 1-year and 2-year periods ended April 30, 2013. The review included a comparison of the CoreCommodity Fund’s performance to the performance of a group of comparable funds selected by an independent provider of investment company data. The Trustees noted that the CoreCommodity Fund had
| 153 | October 31, 2013 |
Additional Information | ||
| October 31, 2013 (Unaudited) | ||
favorable performance for each of these periods when compared against comparable funds identified by an independent provider of investment company data. The Trustees also considered CoreCommodity’s performance and reputation generally and its investment techniques, risk management controls and decision-making processes.
The Advisers’ Profitability: The Trustees received and considered a profitability analysis prepared by ALPS Advisors and by CoreCommodity based on the fees payable under the CoreCommodity Advisory Agreement and CoreCommodity Sub-Advisory Agreement, respectively. In assessing the projected profitability analysis, the Trustees noted that the CoreCommodity Fund’s total fees and expenses were within an acceptable range of the median expenses of comparable funds identified by an independent provider of investment company data. The Board then reviewed and discussed ALPS Advisors’ and CoreCommodity’s financial statements in order to analyze the financial condition and stability and profitability of each adviser.
Economies of Scale: The Trustees considered whether economies of scale in the provision of services to the CoreCommodity Fund were being passed along to the shareholders. The Trustees considered whether any economies of scale, fall-out benefits or any other direct or indirect benefits would accrue to ALPS Advisors or CoreCommodity from their relationship with the Trust.
Other Benefits to the Adviser: The Trustees reviewed and considered any other benefits derived or to be derived by ALPS Advisors and CoreCommodity from their relationship with the CoreCommodity Fund, including soft dollar arrangements.
The Board summarized its deliberations with respect to the CoreCommodity Advisory Agreement with ALPS Advisors and the CoreCommodity Sub-Advisory Agreement with CoreCommodity. In selecting ALPS Advisors and CoreCommodity and approving the investment advisory and sub-advisory agreements and fees under such agreements, the Trustees concluded that no single factor reviewed by the Trustees was identified by the Trustees to be determinative as the principal factor in whether to approve the investment advisory and sub-advisory agreements. Further, the Independent Trustees were advised by separate independent legal counsel throughout the process. The Trustees, including all of the Independent Trustees, concluded that:
| • | the investment advisory fees to be received by ALPS Advisors with respect to the CoreCommodity Fund were comparable to others with in such Fund’s peer universe; |
| • | the nature, extent and quality of services rendered by ALPS Advisors under the CoreCommodity Advisory Agreement and by CoreCommodity under the CoreCommodity Sub-Advisory Agreement were adequate; |
| • | the performance of the CoreCommodity Fund was generally favorable to the performance of the funds in its performance peer universe; |
| • | the profit, if any, anticipated to be realized by ALPS Advisors and by CoreCommodity in connection with the operation of the CoreCommodity Fund is not unreasonable, especially in light of the fee waiver agreement between the Trust and CoreCommodity; and |
| • | there were no material economies of scale or other benefits accruing to either ALPS Advisors or CoreCommodity in connection with its relationship with the CoreCommodity Fund. |
Based on the Trustees’ deliberations and their evaluation of the information described above, the Trustees, including all of the Independent Trustees, concluded that ALPS Advisors’ and CoreCommodity’s compensation for investment advisory services is consistent with the best interests of the CoreCommodity Fund and its shareholders.
Approval of Interim and New Investment Sub-Advisory Agreements for the CoreCommodity Fund
On September 11, 2013, the ownership of CoreCommodity was expected to be transferred from Jefferies Group LLC to CoreCommodity Capital LLC, which was controlled by CoreCommodity’s senior management (the “Transaction”). Jefferies Group LLC was expected to retain an economic interest in CoreCommodity through an economic interest in CoreCommodity Capital LLC. The Transaction was expected to result in an assignment and termination of the then existing investment sub-advisory agreement among CoreCommodity, ALPS Advisors and the Trust with respect to the CoreCommodity Fund.
In anticipation of the Transaction and these related events, and in accordance with Rule 15a-4 of the 1940 Act, the Board was asked, at a meeting held in person on September 10, 2013, to approve an Interim Investment Sub-Advisory Agreement among the Trust, ALPS Advisors and CoreCommodity (the “Interim CoreCommodity Agreement”) to allow CoreCommodity to continue to serve as the investment sub-adviser to the CoreCommodity Fund under terms substantially similar to those of the current investment sub-advisory agreement. The Interim CoreCommodity Agreement was effective for 150 days from the date of the Meeting, or until a new Investment Sub-Advisory Agreement among the Trust, ALPS Advisors and CoreCommodity (the “New CoreCommodity Agreement”) is approved by shareholders, if sooner. To provide for continuity in the operation of the CoreCommodity Fund, the Board was asked to permit Trust management to seek shareholder approval of the New CoreCommodity Agreement at a special meeting of shareholders of the CoreCommodity Fund. Under the New CoreCommodity Agreement, CoreCommodity would continue to provide investment sub-advisory services to the CoreCommodity Fund, subject to the oversight of ALPS Advisors
| 154 | October 31, 2013 |
Additional Information | ||
| October 31, 2013 (Unaudited) | ||
and the Board of Trustees, under terms that are similar in all material respects to the current investment sub-advisory agreement and for the same fees that are currently in effect.
In renewing and approving the Interim CoreCommodity and New CoreCommodity Agreements with ALPS Advisors and CoreCommodity, the Trustees, including the Independent Trustees, considered the following factors with respect to the CoreCommodity Fund:
Sub-Investment Advisory Fee Rate: The Trustees reviewed and considered the contractual annual sub-advisory fee to be paid by ALPS Advisors to CoreCommodity of 0.75% of the CoreCommodity Fund’s daily average net assets, in light of the extent and quality of the advisory services provided by CoreCommodity to the CoreCommodity Fund.
The Board received and considered information comparing the CoreCommodity Fund’s contractual advisory fees and overall expenses with those of funds in both the relevant expense group and universe of funds provided by an independent provider of investment company data.
Based on such information, the Trustees further determined that the contractual annual advisory fees and the total expense ratio for the CoreCommodity Fund, taking into account the contractual fee waivers in place, were generally within an acceptable range of, if not more favorable than, those of others within such Fund’s peer universe.
Nature, Extent and Quality of the Services under the Interim CoreCommodity and New CoreCommodity Agreements: The Trustees received and considered information regarding the nature, extent and quality of services provided to the CoreCommodity Fund under the Interim CoreCommodity Agreement and the New CoreCommodity Agreement. The Trustees reviewed certain background materials supplied by CoreCommodity in its presentation, including its Form ADV Part 2.
The Trustees reviewed and considered CoreCommodity’s investment advisory personnel, is history as an asset manager, its performance and the amount of assets currently under management by CoreCommodity. The Trustees also reviewed the research and decision-making processes utilized by CoreCommodity, including the methods adopted to seek to achieve compliance with the investment objectives, policies and restrictions of the CoreCommodity Fund.
The Trustees considered the background and experience of CoreCommodity’s management in connection with the CoreCommodity Fund, including reviewing the qualifications, backgrounds and responsibilities of the management team primarily responsible for the day-to-day portfolio management of the CoreCommodity Fund and the extent of the resources devoted to research and analysis of actual and potential investments.
The Trustees also reviewed the accompanying compliance-related materials and noted that they have received reports on these services and compliance issues from ALPS Advisors and CoreCommodity at each regular Board meeting throughout the year related to the services rendered by CoreCommodity with respect to the CoreCommodity Fund.
CoreCommodity Fund Performance: The Trustees reviewed performance information for the CoreCommodity Fund 1-month, 3-month, 1-year and since inception for the period ended June 30, 2013. The review also included a comparison of the CoreCommodity Fund’s performance to the performance of a group of comparable funds selected by an independent provider of investment company data for the 1-year, 2-year and three-year periods ended July 31, 2013. The Trustees noted that the CoreCommodity Fund had generally favorable performance for each of those periods when compared against comparable funds identified by an independent provider of investment company data. The Trustees also considered CoreCommodity’s performance and reputation generally and its investment techniques, risk management controls and decision-making processes.
The Advisers’ Profitability: The Trustees received and considered a profitability analysis prepared by CoreCommodity based on the fees payable under the Interim CoreCommodity Agreement and New CoreCommodity Agreement. In assessing the projected profitability analysis, the Trustees noted that the CoreCommodity Fund’s total fees and expenses were within an acceptable range of the median expenses of comparable funds identified by an independent provider of investment company data.
Economies of Scale: The Trustees considered whether economies of scale in the provision of services to the CoreCommodity Fund were being passed along to the shareholders. The Trustees considered whether any economies of scale, fall-out benefits or any other direct or indirect benefits would accrue to CoreCommodity from its relationship with the Trust.
Other Benefits to the Sub-Adviser: The Trustees reviewed and considered any other benefits derived or to be derived by CoreCommodity from its relationship with the CoreCommodity Fund, including soft dollar arrangements.
The Trustees also reviewed and considered whether the scope and quality of services under the Interim CoreCommodity Agreement are at least equivalent to those under the current Sub-Advisory Agreement with CoreCommodity and whether the specific contractual requirements imposed
| 155 | October 31, 2013 |
Additional Information | ||
| October 31, 2013 (Unaudited) | ||
by Rule 15a-4 are in the best interests of the CoreCommodity Fund and its shareholders. The Board also reviewed and discussed the various additional conditions imposed on ALPS Advisors and CoreCommodity under Rule 15a-4.
The Board summarized its deliberations with respect to the Interim CoreCommodity Agreement and New CoreCommodity Agreement, in each case with CoreCommodity. In selecting CoreCommodity and approving the Interim CoreCommodity Agreement and New CoreCommodity Agreement and the fees under such agreements, the Trustees concluded that no single factor reviewed by the Trustees was identified by the Trustees to be determinative as the principal factor in whether to approve the agreements. Further, the Independent Trustees were advised by separate independent legal counsel throughout the process. The Trustees, including all of the Independent Trustees, concluded that:
| • | the contractual investment advisory fees to be received by ALPS Advisors with respect to the CoreCommodity Fund were generally favorable when compared to others within the CoreCommodity Fund’s peer universe, and the total expense ratios of each share class of the CoreCommodity Fund, taking into account the contractual fee waivers in place, were generally within an acceptable range of, if not more favorable than, those of others within the CoreCommodity Fund’s peer universe; |
| • | the nature, extent and quality of services to be rendered by CoreCommodity under the Interim CoreCommodity Agreement and New CoreCommodity Agreement were adequate; |
| • | the performance of the CoreCommodity Fund was either favorable to, or within an acceptable range of, the performance of the funds in its performance peer universe; |
| • | the profit, if any, anticipated to be realized by CoreCommodity in connection with the operation of the CoreCommodity Fund is not unreasonable, especially in light of the fee waiver agreement between the Trust and CoreCommodity; |
| • | there were no material economies of scale or other benefits accruing to CoreCommodity in connection with its relationship with the CoreCommodity Fund; and |
| • | the specific contractual requirements imposed by Rule 15a-4 are in the best interests of the CoreCommodity Fund and its shareholders. |
Based on the Trustees’ deliberations and their evaluation of the information described above, the Trustees, including all of the Independent Trustees, concluded that CoreCommodity’s compensation for investment sub-advisory services is consistent with the best interests of the CoreCommodity Fund and its shareholders.
The ALPS | Kotak India Growth Fund (The “India Fund”)
On June 11, 2013, the Trustees met in person to discuss, among other things, the approval of the Investment Advisory Agreement between the Trust and ALPS Advisors, Inc. (“ALPS Advisors”) (the “India Advisory Agreement”), and the Investment Sub-Advisory Agreement among the Trust, ALPS Advisors and Kotak Mahindra (UK) Limited (“Kotak”) (the “India Sub-Advisory Agreement”), in accordance with Section 15(c) of the 1940 Act. The Independent Trustees met with independent legal counsel during executive session and discussed the India Advisory Agreement, the India Sub-Advisory Agreement and other related materials.
In renewing and approving the India Advisory Agreement with ALPS Advisors and the India Sub-Advisory Agreement with Kotak, the Trustees, including the Independent Trustees, considered the following factors with respect to the India Fund:
Investment Advisory Fee Rate: The Trustees reviewed and considered the contractual annual advisory fee to be paid by (a) the Trust, on behalf of the India Fund, to ALPS Advisors of 1.25% of the India Fund’s daily average net assets and (b) by ALPS Advisors to Kotak of (i) 1.15% of the India Fund’s daily average net assets on the first $50 million and 1.05% of the India Fund’s daily average net assets over $50 million, in light of the extent and quality of the advisory services provided by the ALPS Advisors and Kotak to the India Fund.
The Board received and considered information comparing the India Fund’s contractual advisory fees and overall expenses with those of funds in both the relevant expense group and universe of funds provided by an independent provider of investment company data.
Based on such information, the Trustees further determined that the contractual annual advisory fees set forth above and the total expense ratio of 1.60% (exclusive of Rule 12b-1 fees and various other items) for Class A shares, Class C shares, and Class I shares of the India Fund, taking into account the contractual fee waivers in place, is comparable to others within such Fund’s peer universe.
Nature, Extent and Quality of the Services under the India Advisory Agreement and the India Sub-Advisory Agreement: The Trustees received and considered information regarding the nature, extent and quality of services provided to the India Fund under the India Advisory Agreement and the India Sub-Advisory Agreement. The Trustees reviewed certain background materials supplied by ALPS Advisors and Kotak in each of their presentations, including their Forms ADV.
The Trustees reviewed and considered ALPS Advisors’ and Kotak’s investment advisory personnel, their history as asset managers, their performance and the amount of assets currently under management by ALPS Advisors and Kotak. The Trustees also reviewed the research and
| 156 | October 31, 2013 |
Additional Information | ||
| October 31, 2013 (Unaudited) | ||
decision-making processes utilized by ALPS Advisors and Kotak, including the methods adopted to seek to achieve compliance with the investment objectives, policies and restrictions of the India Fund.
The Trustees considered the background and experience of ALPS Advisors’ and Kotak’s management in connection with the India Fund, including reviewing the qualifications, backgrounds and responsibilities of the management team primarily responsible for the day-to-day portfolio management of the India Fund and the extent of the resources devoted to research and analysis of actual and potential investments.
The Trustees also reviewed the accompanying compliance-related materials and noted that they have received reports on these services and compliance issues from ALPS Advisors and Kotak at each regular Board meeting through the year related to the services rendered by ALPS Advisors and Kotak with respect to the India Fund.
India Fund Performance: The Trustees reviewed performance information for the India Fund for the 1-year and 2-year periods ended April 30, 2013. The review included a comparison of the India Fund’s performance to the performance of a group of comparable funds selected by an independent provider of investment company data. The Trustees also considered Kotak’s performance and reputation generally and its investment techniques, risk management controls and decision-making processes.
The Advisers’ Profitability: The Trustees received and considered a profitability analysis prepared by ALPS Advisors and by Kotak based on the fees payable under the India Advisory Agreement and India Sub-Advisory Agreement, respectively. The Trustees considered the losses realized by ALPS Advisors and by Kotak in connection with the operation of the India Fund. The Trustees also considered the advisers’ statements regarding their continuing commitment to the India Fund despite these losses. In assessing the projected profitability analysis, the Trustees noted that the India Fund’s total fees and expenses were within an acceptable range of the median expenses of comparable funds identified by an independent provider of investment company data. The Board then reviewed and discussed ALPS Advisors’ and Kotak’s financial statements in order to analyze the financial condition and stability and profitability of each adviser.
Economies of Scale: The Trustees considered whether economies of scale in the provision of services to the India Fund were being passed along to the shareholders. The Trustees considered whether any economies of scale, fall-out benefits or any other direct or indirect benefits would accrue to ALPS Advisors or Kotak from their relationship with the Trust.
Other Benefits to the Adviser: The Trustees reviewed and considered any other benefits derived or to be derived by ALPS Advisors and Kotak from their relationship with the India Fund, including soft dollar arrangements.
The Board summarized its deliberations with respect to the India Advisory Agreement with ALPS Advisors and the India Sub-Advisory Agreement with Kotak. In selecting ALPS Advisors and Kotak and approving the investment advisory and sub-advisory agreements and fees under such agreements, the Trustees concluded that no single factor reviewed by the Trustees was identified by the Trustees to be determinative as the principal factor in whether to approve the investment advisory and sub-advisory agreements. Further, the Independent Trustees were advised by separate independent legal counsel throughout the process. The Trustees, including all of the Independent Trustees, concluded that:
| • | the investment advisory fees received by ALPS Advisors with respect to the India Fund were comparable to others within such Fund’s peer universe; |
| • | the nature, extent and quality of services rendered by ALPS Advisors under the India Advisory Agreement and by Kotak under the India Sub-Advisory Agreement were adequate; |
| • | the performance of the India Fund was generally favorable to the performance of the funds in its performance peer universe; |
| • | the profit, if any, anticipated to be realized by ALPS Advisors in connection with the operation of the India Fund is not unreasonable, especially in light of the fee waiver agreement among the Trust, ALPS Advisors and Kotak; and |
| • | there were no material economies of scale or other benefits accruing to ALPS Advisors or Kotak in connection with its relationship with the India Fund. |
Based on the Trustees’ deliberations and their evaluation of the information described above, the Trustees, including all of the Independent Trustees, concluded that ALPS Advisors’ and Kotak’s compensation for investment advisory services is consistent with the best interests of the India Fund and its shareholders.
ALPS | Red Rocks Listed Private Equity Fund (The “LPE Fund”)
On June 11, 2013, the Trustees met in person to discuss, among other things, the approval of the Investment Advisory Agreement between the Trust and ALPS Advisors, Inc. (“ALPS Advisors”) (the “LPE Advisory Agreement”), and the Investment Sub-Advisory Agreement among the Trust, ALPS Advisors and Red Rocks Capital LLC (“Red Rocks”) (the “LPE Sub-Advisory Agreement”), in accordance with Section 15(c) of the 1940 Act. The
| 157 | October 31, 2013 |
Additional Information | ||
| October 31, 2013 (Unaudited) | ||
Independent Trustees met with independent legal counsel during executive session and discussed the LPE Advisory Agreement, the LPE Sub-Advisory Agreement and other related materials.
In renewing and approving the LPE Advisory Agreement with ALPS Advisors and the LPE Sub-Advisory Agreement with Red Rocks, the Trustees, including the Independent Trustees, considered the following factors with respect to the LPE Fund:
Investment Advisory Fee Rate: The Trustees reviewed and considered the contractual annual advisory fee to be paid by (a) the Trust, on behalf of the LPE Fund, to ALPS Advisors of 0.85% of the LPE Fund’s daily average net assets and (b) by ALPS Advisors to Red Rocks of 0.57% based on the LPE Fund’s average net assets, in light of the extent and quality of the advisory services provided by the ALPS Advisors and Red Rocks to the LPE Fund.
The Board considered the information comparing the LPE Fund’s contractual advisory fees and overall expenses with those of funds in both the relevant expense group and universe of funds provided by an independent provider of investment company data.
Based on such information, the Trustees further determined that the contractual annual advisory fees set forth above and the total expense ratio (after waivers, subject to certain exclusions) of 1.25% for Class A, Class C, Class I and Class R shares, respectively, of the LPE Fund, taking into account the contractual fee waivers in place, is comparable to others within such Fund’s peer universe.
Nature, Extent and Quality of the Services under the LPE Advisory Agreement and the LPE Sub-Advisory Agreement: The Trustees received and considered information regarding the nature, extent and quality of services provided to the LPE Fund under the LPE Advisory Agreement and the LPE Sub-Advisory Agreement. The Trustees reviewed certain background materials supplied by ALPS Advisors and Red Rocks in each of their presentations, including their Forms ADV.
The Trustees reviewed and considered ALPS Advisors’ and Red Rocks’ investment advisory personnel, their history as asset managers, their performance and the amount of assets currently under management by ALPS Advisors and Red Rocks. The Trustees also reviewed the research and decision-making processes utilized by ALPS Advisors and Red Rocks, including the methods adopted to seek to achieve compliance with the investment objectives, policies and restrictions of the LPE Fund.
The Trustees considered the background and experience of ALPS Advisors’ and Red Rocks’ management in connection with the LPE Fund, including reviewing the qualifications, backgrounds and responsibilities of the management team primarily responsible for the day-to-day portfolio management of the LPE Fund and the extent of the resources devoted to research and analysis of actual and potential investments.
The Trustees also reviewed the accompanying compliance-related materials and further noted that they have received reports on these services and compliance issues from ALPS Advisors and Red Rocks at each regular Board meeting throughout the year related to the services rendered by ALPS Advisors and Red Rocks with respect to the LPE Fund.
LPE Fund Performance: The Trustees reviewed performance information for the LPE Fund for the 1-year, 2-year, 3-year, 4-year and 5-year periods ended April 30, 2013. That review included a comparison of the LPE Fund’s performance to the performance of a group of comparable funds selected by an independent provider of investment company data. The Trustees noted the favorable performance of the LPE Fund over the past 3-year and 4-year periods ended April 30, 2013 compared against funds identified by an independent provider of investment company data, and the comparable performance of the LPE Fund over other periods. The Trustees also considered Red Rocks’ discussion of the LPE Fund’s underlying portfolio diversification categories, its top contributors and top detractors, as well as Red Rocks’ performance and reputation generally and its investment techniques, risk management controls and decision-making processes.
The Advisers’ Profitability: The Trustees received and considered a projected profitability analysis prepared by ALPS Advisors and by Red Rocks based on the fees payable under the LPE Advisory Agreement and LPE Sub-Advisory Agreement, respectively. In assessing the projected profitability analysis, the Trustees noted that the LPE Fund’s total fees and expenses were within an acceptable range of the median expenses of comparable funds identified by an independent provider of investment company data. The Trustees considered the losses realized by Red Rocks in connection with the operation of the LPE Fund. The Trustees also considered Red Rocks’ statements regarding its continuing commitment to the LPE Fund despite these losses. The Board then reviewed and discussed ALPS Advisors’ and Red Rocks’ financial statements in order to analyze the financial condition and stability and profitability of each adviser.
Economies of Scale: The Trustees considered whether economies of scale in the provision of services to the LPE Fund were being passed along to the shareholders. The Trustees considered whether any economies of scale, fall-out benefits or any other direct or indirect benefits would accrue to ALPS Advisors or Red Rocks from their relationship with the Trust.
| 158 | October 31, 2013 |
Additional Information | ||
| October 31, 2013 (Unaudited) | ||
Other Benefits to the Advisers: The Trustees reviewed and considered any other benefits derived or to be derived by ALPS Advisors and Red Rocks from their relationship with the LPE Fund, including soft-dollar arrangements.
The Board summarized its deliberations with respect to the LPE Advisory Agreement with ALPS Advisors and the LPE Sub-Advisory Agreement with Red Rocks. In selecting ALPS Advisors and Red Rocks and approving the investment advisory and sub-advisory agreements and fees under such agreements, the Trustees concluded that no single factor reviewed by the Trustees was identified by the Trustees to be determinative as the principal factor in whether to approve the investment advisory and sub-advisory agreements. Further, the Independent Trustees were advised by separate independent legal counsel throughout the process. The Trustees, including all of the Independent Trustees, concluded that:
| • | the investment advisory fees to be received by ALPS Advisors with respect to the LPE Fund were comparable to others within such Fund’s peer universe; |
| • | the nature, extent and quality of services rendered by ALPS Advisors under the LPE Advisory Agreement and by Red Rocks under the LPE Sub-Advisory Agreement were adequate; |
| • | the performance of the LPE Fund was generally comparable, and in some cases favorable, to the performance of the funds in its performance peer universe; |
| • | the profit, if any, anticipated to be realized by ALPS Advisors and by Red Rocks in connection with the operation of the LPE Fund is not unreasonable, especially in light of the fee waiver agreement among the Trust, ALPS Advisors and Red Rocks; and |
| • | there were no material economies of scale or other benefits accruing to ALPS Advisors or Red Rocks in connection with its relationship with the LPE Fund. |
Based on the Trustees’ deliberations and their evaluation of the information described above, all of the Trustees, including all of the Independent Trustees in person at the Meeting, concluded that ALPS Advisors’ and Red Rocks’ compensation for investment advisory services is consistent with the best interests of the LPE Fund and its shareholders.
ALPS | WMC Disciplined Value Fund (The “WMC Fund”)
On June 11, 2013, the Trustees met in person to discuss, among other things, the approval of the Investment Advisory Agreement between the Trust and ALPS Advisors, Inc. (“ALPS Advisors”) (the “WMC Advisory Agreement”), and the Investment Sub-Advisory Agreement among the Trust, ALPS Advisors and Wellington Management Company, LLC (“Wellington”) (the “WMC Sub-Advisory Agreement”), in accordance with Section 15(c) of the 1940 Act. The Independent Trustees met with independent legal counsel during executive session and discussed the WMC Advisory Agreement, the WMC Sub-Advisory Agreement and other related materials.
In renewing and approving the WMC Advisory Agreement with ALPS Advisors and the WMC Sub-Advisory Agreement with Wellington, the Trustees, including the Independent Trustees, considered the following factors with respect to the WMC Fund:
Investment Advisory Fee Rate: The Trustees reviewed and considered the tiered contractual annual advisory fee to be paid by (a) the Trust, on behalf of the WMC Fund, to ALPS Advisors of (i) 0.95% of the WMC Fund’s daily average net assets of $0-$250M; (ii) 0.85% of the WMC Fund’s daily average net assets between $250M-$500M ; and (iii) 0.75% of the WMC Fund’s daily average net assets over $500M and (b) by ALPS Advisors to Wellington of (i) 0.50% of the WMC Fund’s daily average net assets of $0-$250M; (ii) 0.40% of the WMC Fund’s daily average net assets between $250M-$500M; and (iii) 0.30% of the WMC Fund’s daily average net assets over $500M, in light of the extent and quality of the advisory services provided by the ALPS Advisors and Wellington to the WMC Fund.
The Board received and considered information comparing the WMC Fund’s contractual advisory fees and overall expenses with those of funds in both the relevant expense group and universe of funds provided by an independent provider of investment company data.
Based on such information, the Trustees further determined that the tiered contractual annual advisory fees set forth above and the total expense ratio of 1.15% for the WMC Fund, taking into account the contractual fee waivers in place (subject to certain exclusions), are comparable to others within such Fund’s peer universe.
Nature, Extent and Quality of the Services under the WMC Advisory Agreement and the WMC Sub-Advisory Agreement: The Trustees received and considered information regarding the nature, extent and quality of services provided to the WMC Fund under the WMC Advisory Agreement and the WMC Sub-Advisory Agreement. The Trustees reviewed certain background materials supplied by ALPS Advisors and Wellington in each of their presentations, including their Forms ADV.
The Trustees reviewed and considered ALPS Advisors’ and Wellington’s investment advisory personnel, their history as asset managers, their performance and the amount of assets currently under management by ALPS Advisors and Wellington. The Trustees also reviewed the research
| 159 | October 31, 2013 |
Additional Information | ||
| October 31, 2013 (Unaudited) | ||
and decision-making processes utilized by ALPS Advisors and Wellington, including the methods adopted to seek to achieve compliance with the investment objectives, policies and restrictions of the WMC Fund.
The Trustees considered the background and experience of ALPS Advisors’ and Wellington’s management in connection with the WMC Fund, including reviewing the qualifications, backgrounds and responsibilities of the management team primarily responsible for the day-to-day portfolio management of the WMC Fund and the extent of the resources devoted to research and analysis of actual and potential investments. The Trustees also reviewed the accompanying compliance-related materials and noted that they have received reports on these services and compliance issues from ALPS Advisors and Wellington at each regular Board meeting throughout the year related to the services rendered by ALPS Advisors and Wellington with respect to the WMC Fund.
Performance: The Trustees reviewed performance information for the WMC Fund and the predecessor fund of the WMC Fund (December 31, 1999 inception) for the 1-year, 2-year, 3-year, 4-year, 5-year and 10-year periods ended April 30, 2013. That review included a comparison of the WMC Fund’s performance to the performance of a group of comparable funds selected by an independent provider of investment company data. The Trustees noted the generally favorable performance of the WMC Fund over those periods compared against funds identified by an independent provider of investment company data. The Trustees also considered Wellington’s discussion of the WMC Fund’s performance contributors and detractors and its portfolio position and outlook, as well as Wellington’s performance and reputation generally and its investment techniques, risk management controls and decision-making processes.
The Advisers’ Profitability: The Trustees received and considered a projected profitability analysis prepared by ALPS Advisors and by Wellington based on the fees payable under the WMC Advisory Agreement and WMC Sub-Advisory Agreement, respectively. In assessing the projected profitability analysis, the Trustees noted that the WMC Fund’s total fees and expenses were within an acceptable range of the median expenses of comparable funds identified by an independent provider of investment company data. The Board then reviewed and discussed ALPS Advisors’ and Wellington’s financial statements in order to analyze the financial condition and stability and profitability of each adviser.
Economies of Scale: The Trustees considered whether economies of scale in the provision of services to the WMC Fund were being passed along to the shareholders. The Trustees considered whether any economies of scale, fall-out benefits or any other direct or indirect benefits would accrue to ALPS Advisors or Wellington from their relationship with the Trust.
Other Benefits to the Advisers: The Trustees reviewed and considered any other benefits derived or to be derived by ALPS Advisors and Wellington from their relationship with the WMC Fund, including soft-dollar arrangements.
The Board summarized its deliberations with respect to the WMC Advisory Agreement with ALPS Advisors and the WMC Sub-Advisory Agreement with Wellington. In selecting ALPS Advisors and Wellington and approving the investment advisory and sub-advisory agreements and fees under such agreements, the Trustees concluded that no single factor reviewed by the Trustees was identified by the Trustees to be determinative as the principal factor in whether to approve the investment advisory and sub-advisory agreements. Further, the Independent Trustees were advised by separate independent legal counsel throughout the process. The Trustees, including all of the Independent Trustees, concluded that:
| • | the investment advisory fees to be received by ALPS Advisors with respect to the WMC Fund were comparable to others within such Fund’s peer universe; |
| • | the nature, extent and quality of services rendered by ALPS Advisors under the WMC Advisory Agreement and by Wellington under the WMC Sub-Advisory Agreement were adequate; |
| • | the performance of the WMC Fund was generally comparable, and in some cases favorable, to the performance of the funds in its performance peer universe; |
| • | the profit, if any, anticipated to be realized by ALPS Advisors and by Wellington in connection with the operation of the WMC Fund is not unreasonable, especially in light of the fee waiver agreement between the Trust and ALPS Advisors; and |
| • | there were no material economies of scale or other benefits accruing to either ALPS Advisors or Wellington in connection with its relationship with the WMC Fund. |
Based on the Trustees’ deliberations and their evaluation of the information described above, all of the Trustees, including all of the Independent Trustees in person at the Meeting, concluded that ALPS Advisors’ and Wellington’s compensation for investment advisory services is consistent with the best interests of the WMC Fund and its shareholders.
Clough China Fund (The “China Fund”)
On June 11, 2013, the Trustees met in person to discuss, among other things, the approval of the Investment Advisory Agreement between the Trust and ALPS Advisors, Inc. (“ALPS Advisors”) (the “China Advisory Agreement”), and the Investment Sub-Advisory Agreement among the Trust, ALPS Advisors and Clough Capital Partners, LP (“Clough Capital”) (the “China Sub-Advisory Agreement”), in accordance with Section 15(c) of the
| 160 | October 31, 2013 |
Additional Information | ||
| October 31, 2013 (Unaudited) | ||
1940 Act. The Independent Trustees met with independent legal counsel during executive session and discussed the China Advisory Agreement, the China Sub-Advisory Agreement and other related materials.
In renewing and approving the China Advisory Agreement with ALPS Advisors and the China Sub-Advisory Agreement with Clough Capital, the Trustees, including the Independent Trustees, considered the following factors with respect to the China Fund:
Investment Advisory Fee Rate: The Trustees reviewed and considered the tiered contractual annual advisory fee to be paid by (a) the Trust, on behalf of the China Fund, to ALPS Advisors of 1.35% of the China Fund’s daily average net assets and (b) ALPS Advisors to Clough Capital of 0.90% of the China Fund’s daily average net assets, in light of the extent and quality of the advisory services provided by the ALPS Advisors and Clough Capital to the China Fund.
The Board received and considered information comparing the China Fund’s contractual advisory fees and overall expenses with those of funds in both the relevant expense group and universe of funds provided by an independent provider of investment company data.
Based on such information, the Trustees further determined that the tiered contractual annual advisory fees set forth above and the total expense ratios (after waivers) of 1.95%, 2.70% and 1.70% for Class A, Class C and Class I, respectively, of the China Fund, taking into account the contractual fee waivers in place through August 31, 2013, though generally above the medians for their respective peer universes, are within a reasonable range of such peer universes when considered in light of particular services provided to the China Fund.
Nature, Extent and Quality of the Services under the China Advisory Agreement and the China Sub-Advisory Agreement: The Trustees received and considered information regarding the nature, extent and quality of services provided to the China Fund under the China Advisory Agreement and the China Sub-Advisory Agreement. The Trustees reviewed certain background materials supplied by ALPS Advisors and Clough Capital in each of their presentations, including their Forms ADV.
The Trustees reviewed and considered ALPS Advisors’ and Clough Capital’s investment advisory personnel, their history as asset managers, their performance and the amount of assets currently under management by ALPS Advisors and Clough Capital. The Trustees also reviewed the research and decision-making processes utilized by ALPS Advisors and Clough Capital, including the methods adopted to seek to achieve compliance with the investment objectives, policies and restrictions of the China Fund.
The Trustees considered the background and experience of ALPS Advisors’ and Clough Capital’s management in connection with the China Fund, including reviewing the qualifications, backgrounds and responsibilities of the management team primarily responsible for the day-to-day portfolio management of the China Fund and the extent of the resources devoted to research and analysis of actual and potential investments.
The Trustees also reviewed the accompanying compliance-related materials and noted that they have received reports on these services and compliance issues from ALPS Advisors and Clough Capital at each regular Board meeting throughout the year related to the services rendered by ALPS Advisors and Clough Capital with respect to the China Fund.
China Fund Performance: The Trustees reviewed performance information for the China Fund and the predecessor fund of the China Fund (December 30, 2005 inception) for the 1-year, 2-year, 3-year, 4-year and 5-year periods ended April 30, 2013. That review included a comparison of the China Fund’s performance to the performance of a group of comparable funds selected by an independent provider of investment company data. The Trustees noted the China Fund’s generally favorable performance over such periods ended April 30, 2013, compared against funds identified by an independent provider of investment company data. The Trustees also considered Clough Capital’s performance and reputation generally and its investment techniques, risk management controls and decision-making processes, as well as Clough Capital’s overview of the China market, the economic outlook for investing in China and the potential effects of certain political and economic issues on trading in Chinese stocks.
The Advisers’ Profitability: The Trustees received and considered a projected profitability analysis prepared by ALPS Advisors and by Clough Capital based on the fees payable under the China Advisory Agreement and China Sub-Advisory Agreement, respectively. In assessing the projected profitability analysis, the Trustees noted that the China Fund’s total fees and expenses were within an acceptable range of the median expenses of comparable funds identified by an independent provider of investment company data. The Trustees considered the losses realized by Clough Capital in connection with the operation of the China Fund. The Trustees also considered Clough Capital’s statements regarding its continuing commitment to the China Fund despite these losses. The Board then reviewed and discussed ALPS Advisors’ and Clough Capital’s financial statements in order to analyze the financial condition and stability and profitability of each adviser.
Economies of Scale: The Trustees considered whether economies of scale in the provision of services to the China Fund were being passed along to the shareholders. The Trustees considered whether any economies of scale, fall-out benefits or any other direct or indirect benefits would accrue to ALPS Advisors or Clough Capital from their relationship with the Trust.
| 161 | October 31, 2013 |
Additional Information | ||
| October 31, 2013 (Unaudited) | ||
Other Benefits to the Advisers: The Trustees reviewed and considered any other benefits derived or to be derived by ALPS Advisors and Clough Capital from their relationship with the China Fund, including soft-dollar arrangements.
The Board summarized its deliberations with respect to the China Advisory Agreement with ALPS Advisors and the China Sub-Advisory Agreement with Clough Capital. In selecting ALPS Advisors and Clough Capital and approving the investment advisory and sub-advisory agreements and fees under such agreements, the Trustees concluded that no single factor reviewed by the Trustees was identified by the Trustees to be determinative as the principal factor in whether to approve the investment advisory and sub-advisory agreements. Further, the Independent Trustees were advised by separate independent legal counsel throughout the process. The Trustees, including all of the Independent Trustees, concluded that:
| • | the investment advisory fees to be received by ALPS Advisors with respect to the China Fund were comparable to others within such Fund’s peer universe; |
| • | the nature, extent and quality of services rendered by ALPS Advisors under the Investment Advisory Agreement and by Clough Capital under the Sub-Advisory Agreement were adequate; |
| • | the performance of the China Fund was generally comparable, and in some cases favorable, to the performance of the funds in its performance peer universe; |
| • | the profit, if any, anticipated to be realized by ALPS Advisors and by Clough Capital in connection with the operation of the China Fund is not unreasonable, especially in light of the fee waiver agreement between the Trust and ALPS Advisors; and |
| • | there were no material economies of scale or other benefits accruing to either ALPS Advisors or Clough Capital in connection with its relationship with the China Fund. |
Based on the Trustees’ deliberations and their evaluation of the information described above, all of the Trustees, including all of the Independent Trustees in person at the Meeting, concluded that ALPS Advisors’ and Clough Capital’s compensation for investment advisory services is consistent with the best interests of the China Fund and its shareholders.
The RiverFront Global Growth, RiverFront Global Allocation, RiverFront Dynamic Equity Income And RiverFront Moderate Growth & Income Funds (The “RiverFront Funds”)
On June 11, 2013, the Trustees met in person to discuss, among other things, the approval of the Investment Advisory Agreement between the Trust and ALPS Advisors, Inc. (“ALPS Advisors”) (the “RiverFront Advisory Agreement”), and the Investment Sub-Advisory Agreement among the Trust, ALPS Advisors and RiverFront Investment Group, LLC (“RiverFront”) (the “RiverFront Sub-Advisory Agreement”), in accordance with Section 15(c) of the 1940 Act. The Independent Trustees met with independent legal counsel during executive session and discussed the RiverFront Advisory Agreement, the RiverFront Sub-Advisory Agreement and other related materials.
In renewing and approving the RiverFront Advisory Agreement with ALPS Advisors and the RiverFront Sub-Advisory Agreement with RiverFront, the Trustees, including the Independent Trustees, considered the following factors with respect to the RiverFront Funds:
Investment Advisory Fee Rate: The Trustees reviewed and considered the contractual annual advisory fee to be paid by (a) the Trust, on behalf of the RiverFront Funds, to ALPS Advisors of 0.85% of each of the RiverFront Fund’s daily average net assets and (b) by ALPS Advisors to RiverFront of 0.60% of each of the RiverFront Fund’s daily average net assets, in light of the extent and quality of the advisory services provided by the ALPS Advisors and RiverFront to the RiverFront Funds.
The Board received and considered information comparing the RiverFront Funds’ contractual advisory fees and overall expenses with those of funds in both the relevant expense group and universe of funds provided by an independent provider of investment company data.
Based on such information, the Trustees further determined that the contractual annual advisory fees set forth above and the total expense ratio of 0.90% for Class A, Class C, Class I, Class L and Investor Class shares of each of the RiverFront Funds, taking into account the contractual fee waivers in place (subject to certain exclusions), is comparable to others within such Fund’s peer universe.
Nature, Extent and Quality of the Services under the RiverFront Advisory Agreement and the RiverFront Sub-Advisory Agreement: The Trustees received and considered information regarding the nature, extent and quality of services provided to the RiverFront Funds under the RiverFront Advisory Agreement and the RiverFront Sub-Advisory Agreement. The Trustees reviewed certain background materials supplied by ALPS Advisors and RiverFront in each of their presentations, including their Forms ADV.
The Trustees reviewed and considered ALPS Advisors’ and RiverFront’s investment advisory personnel, their history as asset managers, their performance and the amount of assets currently under management by ALPS Advisors and RiverFront. The Trustees also reviewed the research and decision-making processes utilized by ALPS Advisors and RiverFront, including the methods adopted to seek to achieve compliance with the investment objectives, policies and restrictions of the RiverFront Funds.
| 162 | October 31, 2013 |
Additional Information | ||
| October 31, 2013 (Unaudited) | ||
The Trustees considered the background and experience of ALPS Advisors’ and RiverFront’s management in connection with the RiverFront Funds, including reviewing the qualifications, backgrounds and responsibilities of the management team primarily responsible for the day-to-day portfolio management of the RiverFront Funds and the extent of the resources devoted to research and analysis of actual and potential investments.
The Trustees also reviewed the accompanying compliance-related materials and noted that they have received reports on these services and compliance issues from ALPS Advisors and RiverFront at each regular Board meeting throughout the year related to the services rendered by ALPS Advisors and RiverFront with respect to the RiverFront Funds.
RiverFront Funds’ Performance: The Trustees reviewed performance information for each RiverFront Fund for the 1-year and 2-year periods ended April 30, 2013, as applicable. The review included a comparison of each of the RiverFront Fund’s performance to the performance of a group of comparable funds selected by an independent provider of investment company data. The Trustees noted that the net total return performance of the RiverFront Global Growth Fund generally exceeded that of the Fund’s performance universe average over the prior one-year and two-year periods. The Trustees also noted that, with respect to the remainder of the RiverFront Funds, while the net total return performance for each Fund was generally below the respective performance universe average, such performance was still within an acceptable range of the average and applicable benchmark. The Trustees also considered RiverFront’s performance and reputation generally and its investment techniques, risk management controls and decision-making processes.
The Advisers’ Profitability: The Trustees received and considered a profitability analysis prepared by ALPS Advisors and by RiverFront based on the fees payable under the RiverFront Advisory Agreement and RiverFront Sub-Advisory Agreement, respectively. In assessing the projected profitability analysis, the Trustees noted that the total fees and expenses for each of the RiverFront Funds were within an acceptable range of the median expenses of comparable funds identified by an independent provider of investment company data. The Board then reviewed and discussed ALPS Advisors’ and RiverFront’s financial statements in order to analyze the financial condition and stability and profitability of each adviser.
Economies of Scale: The Trustees considered whether economies of scale in the provision of services to the RiverFront Funds were being passed along to the shareholders. The Trustees considered whether any economies of scale, fall-out benefits or any other direct or indirect benefits would accrue to ALPS Advisors or RiverFront from their relationship with the Trust.
Other Benefits to the Adviser: The Trustees reviewed and considered any other benefits derived or to be derived by ALPS Advisors and RiverFront from their relationship with the RiverFront Funds, including soft dollar arrangements.
The Board summarized its deliberations with respect to the RiverFront Advisory Agreement with ALPS Advisors and the RiverFront Sub-Advisory Agreement with RiverFront. In selecting ALPS Advisors and RiverFront and approving the investment advisory and sub-advisory agreements and fees under such agreements, the Trustees concluded that no single factor reviewed by the Trustees was identified by the Trustees to be determinative as the principal factor in whether to approve the investment advisory and sub-advisory agreements. Further, the Independent Trustees were advised by separate independent legal counsel throughout the process. The Trustees, including all of the Independent Trustees, concluded that:
| • | the investment advisory fees to be received by ALPS Advisors with respect to the RiverFront Funds were comparable to others within each Fund’s peer universe; |
| • | the nature, extent and quality of services rendered by ALPS Advisors under the RiverFront Advisory Agreement and by RiverFront under the RiverFront Sub-Advisory Agreement were adequate; |
| • | the performance of each of the RiverFront Funds was generally within an acceptable range of the performance of the Funds in each Fund’s performance peer universe; |
| • | the profit, if any, anticipated to be realized by ALPS Advisors and by RiverFront in connection with the operation of the RiverFront Funds is not unreasonable, especially in light of the fee waiver agreement among the Trust, ALPS Advisors and RiverFront; and |
| • | there were no material economies of scale or other benefits accruing to either ALPS Advisors or RiverFront in connection with its relationship with the RiverFront Funds. |
Based on the Trustees’ deliberations and their evaluation of the information described above, the Trustees, including all of the Independent Trustees, concluded that ALPS Advisors’ and RiverFront’s compensation for investment advisory services is consistent with the best interests of each of the RiverFront Funds and its shareholders.
| 163 | October 31, 2013 |
This Page Intentionally Left Blank
TABLE OF CONTENTS
|
| PAGE | ||||
| 1 | ||||
| 4 | ||||
| 5 | ||||
| 7 | ||||
| 8 | ||||
| 9 | ||||
| 10 | ||||
| 12 | ||||
| 20 | ||||
| Aspen Managed Futures Strategy Fund | Manager Commentary | |
| October 31, 2013 (Unaudited) |
Market Conditions
Concerns over the domestic economy, rising interest rates, and the government shutdown did little to quell investor enthusiasm for stocks in the six-month period ending October 31st. Nearly every risk asset racked up impressive gains during this period, most notably international equities and technology stocks, both of which ended the quarter up double-digits. Bonds also advanced, thanks to Federal Reserve comments that signaled their reluctance to end their asset purchase program.
Fixed income markets put in a rather muted performance during this period. We anticipate further upward pressure on interest rates for the next several quarters, which will make for a difficult period for Treasury bonds relative to corporate and mortgage instruments.
Performance Results
For the six-month period ending October 31, 2013, the Class I shares of the Aspen Managed Futures Strategy Fund posted a loss of 1.28%. Per its mandate, the Fund maintained very tight correlation to the Aspen Managed Futures Beta Index1. The index uses a combination of trend and counter-trend algorithms to determine exposures to 23 futures markets. In following the index, the Fund can take long or short exposures to each of the eligible markets. A long position in a futures market will profit if the price of the futures contract rises, and a short position will profit if the price of the futures contract falls.
The Newedge CTA Index2, a managed futures benchmark, returned -5.6% in the same timeframe. Another benchmark, the Barclay BTOP50 Index3, returned -4.5%. It is important to note that there are substantive differences between the Fund and these indices in terms of construction. There were no significant changes to the Fund strategy during this period.
Explanation of Fund Performance
May (+0.7%) and June (+0.4%) were both positive performance months for the Fund, while we believe many Commodity Trading Advisors and managed futures mutual funds posted losses. In particular, the Fund handled the reversal in long-standing fixed income trends better than many competitors, absorbing only small losses before switching to short fixed income positions to capture the new up-trend in interest rates. Consequently, the Fund provided helpful diversification against losses in bonds (in both May and June) and stocks (in June); whereas many other managed futures alternatives did not. The Fund’s broad diversification helped here; if outsized concentrations in previously successful trends had been allowed, they would likely have caused greater losses in these months than other portions of the portfolio could have overcome.
July (-1.1%), August (-1.49%), and September (+0.4%) were all heavily whipsawed months. In each case, the Fund had substantial runups that were subsequently given back as the month continued. For example, the Fund experienced a 2.0% gain on the low-market-volume “zombie day“4 of July 5th, only to see those gains given back over the next four trading days. Similar patterns occurred repeatedly in the third quarter, resulting in the fund giving back a portion of its gains for the year. Only in September was the end-of-month drawdown insufficient to claw back all of the month’s earlier gains.
October was a quieter month for the fund. Markets handled the government shutdown in a relatively non-volatile fashion, providing little opportunity for trend-followers. Following the end of the shutdown, a relief rally provided strong returns for managed futures managers with heavy concentrations in “risk-on”5 positions, such as long equity trends. In this case, the Fund’s enforced diversification proved unhelpful, as gains in equity trends were insufficient to offset losses elsewhere in the portfolio. Losses for the month (-0.4%) exactly offset the gains from September.
Outlook
With impressive year-to-date returns, this year is proving to be a banner year for U.S. stocks. And it isn’t just a handful of stocks like Tesla (TSLA) that are propping up the market. Nearly nine in ten stocks are showing gains this year, making 2013 one of the broadest advances since 2003.
The reason for this market buoyancy, in our view, lies in how comprehensive the economic recovery has proven to be. Earnings have been robust in virtually all industry groups, including autos and other durable goods – key industries that, over time, should increase job growth and continue the trend of increased manufacturing in the United States. But how do these bullish developments augur for 2014?
As one might imagine, a long-term uptrend in the economy has reduced the number of companies that are attractive based solely on valuation. This is especially true in the junk bond sector, where premiums are so high that the only thing these instruments have to offer is their relatively high yield. In the event of an idiosyncratic market setback, there is little margin for error.
Fortunately, equities in other parts of the globe continue to offer compelling opportunities. Both Europe and Asia still sport stocks with attractive price/earnings ratios and generous dividends. We feel it is likely that cash-rich U.S. investors looking for new opportunities will find these markets particularly compelling in 2014.
The risks of rising rates brought about by increased economic activity should be taken into consideration. Although we do not see rates suddenly shooting higher, the total returns from fixed income seem likely to be less robust than the returns of the last few decades. This reality, in our view, makes investing in managed futures an increasingly relevant strategy.
Sincerely,
Bryan R. Fisher
William Ware Bush
| Semi-Annual Report | October 31, 2013 | 1 |
| Aspen Managed Futures Strategy Fund | Manager Commentary | |
| October 31, 2013 (Unaudited) |
The views and information discussed in this commentary are as of the date of publication, are subject to change, and may not reflect the writer’s current views. The views expressed represent an assessment of market conditions at a specific point in time, are opinions only and should not be relied upon as investment advice regarding a particular investment or markets in general. Such information does not constitute a recommendation to buy or sell specific securities or investment vehicles. It should not be assumed that any investment will be profitable or will equal the performance of the portfolios or any securities or any sectors mentioned herein. The subject matter contained herein has been derived from several sources believed to be reliable and accurate at the time of compilation. The Fund does not accept any liability for losses either direct or consequential caused by the use of this information.
| 1 | Aspen Managed Futures Beta Index – The Managed Futures Beta Index is constructed using a quantitative, rules-based model designed to replicate the trend-following and counter-trend exposure of futures markets by allocating assets to liquid futures contracts of certain financial and commodities futures markets. The Index therefore seeks to reflect the performance of strategies and exposures common to a broad universe of futures markets, i.e., managed futures beta. |
| 2 | The Newedge CTA Index provides the market with a reliable daily performance benchmark of major commodity trading advisors (CTAs). The Newedge CTA Index calculates the daily rate of return for a pool of CTAs selected from the larger managers that are open to new investment. Selection of the pool of qualified CTAs used in construction of the Index will be conducted annually, with re-balancing on January 1st of each year. A committee of industry professionals has been established to monitor the methodology of the index on a regular basis. You cannot invest directly in the index. |
| 3 | Barclay BTOP50 Index is an index of the largest investable CTA programs as measured by assets under management. The index is not actively managed and does not reflect any deduction for fees, expenses or taxes. |
| 4 | Zombie Day denotes the workday after a Thursday holiday, when companies allegedly like to dump depressing news on the populace. |
| 5 | During a market sentiment of ‘Risk on,’ the market is optimistic and more willing to take risk in exchange for possibly better returns. At this time there will be a greater interest in shares or stocks and commodities. When the market sentiment is ‘Risk off,’ there is pessimism in the market and it will favor perceived lower risk investments such as U.S. Treasuries or U.S. dollars. http://en.wikipedia.org. |
2 | www.aspenfuturesfund.com |
| Aspen Managed Futures Strategy Fund | Manager Commentary | |
| October 31, 2013 (Unaudited) |
Cumulative Total Return Performance as of October 31, 2013
| Aspen Managed Futures Strategy Fund | Calendar Year-to-Date | 1 Year | Since Inception* | ||||||||||||
Aspen Managed Futures Strategy Fund - Class A (NAV)1 | 2.69% | 3.15% | -3.83% | ||||||||||||
Aspen Managed Futures Strategy Fund - Class A (MOP)2 | -2.97% | -2.55% | -6.21% | ||||||||||||
Aspen Managed Futures Strategy Fund - Class I | 2.90% | 3.48% | -3.50% | ||||||||||||
Newedge CTA Index3 | -1.50% | -2.59% | -4.02% | ||||||||||||
Aspen Managed Futures Beta Index4 | 3.28% | 3.29% | -3.54% | ||||||||||||
Barclays US Managed Futures Industry Index5 | -1.08% | -0.32% | -2.49% | ||||||||||||
Performance data quoted represents past performance. Past performance does not guarantee future results. Investment return and principal value of an investment will fluctuate so that an investor’s shares, when sold or redeemed, may be worth more or less than the original cost. Current performance data may be higher or lower than actual data quoted. For the most current month-end performance data please call 1-855-845-9444.
The table does not reflect the deduction of taxes that a shareholder would pay on Fund distributions or the redemption of Fund shares.
| * | Fund Inception date of August 2, 2011. |
| 1 | Net Asset Value (NAV) is the share price without sales charges. |
| 2 | Maximum Offering Price (MOP) includes sales charges. Class A returns include effects of the Fund’s maximum sales charge of 5.50%. |
| 3 | The Newedge CTA Index provides the market with a reliable daily performance benchmark of major commodity trading advisors (CTAs). The Newedge CTA Index calculates the daily rate of return for a pool of CTAs selected from the larger managers that are open to new investment. Selection of the pool of qualified CTAs used in construction of the Index will be conducted annually, with re-balancing on January 1st of each year. A committee of industry professionals has been established to monitor the methodology of the index on a regular basis. You cannot invest directly in the index. |
| 4 | Aspen Managed Futures Beta Index – The Managed Futures Beta Index is constructed using a quantitative, rules-based model designed to replicate the trend-following and counter-trend exposure of futures markets by allocating assets to liquid futures contracts of certain financial and commodities futures markets. The Index therefore seeks to reflect the performance of strategies and exposures common to a broad universe of futures markets, i.e., managed futures beta. |
| 5 | The Barclays US Managed Futures Industry Index seeks to replicate the overall composition of the managed futures industry with regard to trading style and overall market exposure. The Barclays US Managed Futures Industry Index employs a top-down approach in selecting its constituents. The largest investable trading advisor programs, as measured by assets under management, are selected for inclusion in the Barclays US Managed Futures Industry Index. |
Portfolio Composition as of October 31, 2013 As a percentage of Net Assets
|
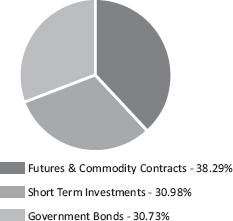
Performance of $10,000 Initial Investment (as of October 31, 2013)
Comparison of change in value of a $10,000 investment (includes applicable sales loads)
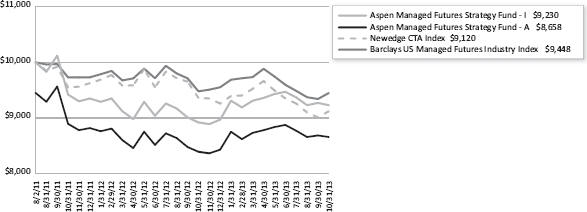
The chart represents historical performance of a hypothetical investment of $10,000 in the Fund since inception. Past performance does not guarantee future results. This chart does not reflect the deduction of taxes that a shareholder would pay on Fund distributions or the redemption of Fund shares.
The Aspen Managed Futures Beta Index and the Newedge CTA Index are not actively managed and do not reflect any deduction for fees, expenses or taxes. It is not possible to invest directly in an index.
| Semi-Annual Report | October 31, 2013 | 3 |
| Aspen Managed Futures Strategy Fund | Consolidated Disclosure of Fund Expenses | |
| October 31, 2013 (Unaudited) |
As a shareholder of a Fund, you incur two types of costs: (1) transaction costs, including applicable sales charges (loads), redemption fees, wire fees and low balance fees; and (2) ongoing costs, including management fees, distribution and service (12b-1) fees, shareholder services fees and other Fund expenses. This example is intended to help you understand your indirect costs, also referred to as “ongoing costs” (in dollars), of investing in the Fund and to compare these costs with the ongoing costs of investing in other mutual funds.
This example is based on an investment of $1,000 invested at the beginning of the period and held for the entire six-month period of May 1, 2013 through October 31, 2013.
Actual Expenses The first line of the table below provides information about actual account values and actual expenses. You may use the information in this line, together with the amount you invested at the beginning of the period, to estimate the expenses that you paid over the period. Simply divide your account value by $1,000 (for example, an $8,600 account value divided by $1,000 = 8.6), then multiply the result by the number in the first line under the heading “Expenses Paid During Period” to estimate the expenses you paid on your account during this period.
Hypothetical Example for Comparison Purposes The second line of the table provides information about hypothetical account values and hypothetical expenses based on the Fund’s actual expense ratio and an assumed rate of return of 5% per year before expenses, which is not the Fund’s actual return. The hypothetical account values and expenses may not be used to estimate the actual ending account balance or expenses you paid for the period. You may use this information to compare ongoing costs of investing in the Fund and other funds. To do so, compare this 5% hypothetical example with the 5% hypothetical examples that appear in the shareholder reports of other funds.
Please note that the expenses shown in the table are meant to highlight your ongoing costs only and do not reflect any transactional costs, such as applicable sales charges (loads), redemption fees, wire fees and low balance fees. Therefore, the second line of the table is useful in comparing ongoing costs only and will not help you determine the relative total costs of owning different funds. In addition, if these transaction costs were included, your costs would be higher.
| Beginning Account Value 5/1/13 | Ending Account Value 10/31/13 | Expense Ratio(a) | Expenses Paid During period 5/1/13 - 10/31/13(b) | |||||||||||||||||
Class A | ||||||||||||||||||||
Actual | $ | 1,000.00 | $ | 984.90 | 1.83% | $ | 9.16 | |||||||||||||
Hypothetical (5% return before expenses) | $ | 1,000.00 | $ | 1,015.98 | 1.83% | $ | 9.30 | |||||||||||||
Class I | ||||||||||||||||||||
Actual | $ | 1,000.00 | $ | 987.20 | 1.28% | $ | 6.41 | |||||||||||||
Hypothetical (5% return before expenses) | $ | 1,000.00 | $ | 1,018.75 | 1.28% | $ | 6.51 | |||||||||||||
| (a) | The Fund’s expense ratios have been based on the Fund’s most recent fiscal half-year expenses. |
| (b) | Expenses are equal to the Fund’s annualized expense ratio, multiplied by the average account value over the period, multiplied by the number of days in the most recent fiscal half-year (184)/365. |
4 | www.aspenfuturesfund.com |
| Aspen Managed Futures Strategy Fund | Consolidated Schedule of Investments | |
| October 31, 2013 (Unaudited) |
| Principal Amount/ Shares | Value (Note 2) | |||||||
| ||||||||
GOVERNMENT BONDS (30.73%) | ||||||||
U.S. TREASURY NOTES (30.73%) | ||||||||
0.250%, 04/30/2014 | $ | 6,495,000 | $ | 6,499,696 | ||||
0.250%, 08/31/2014 | 9,735,000 | 9,745,456 | ||||||
0.250%, 10/31/2014 | 5,000,000 | 5,006,350 | ||||||
0.250%, 11/30/2014 | 3,000,000 | 3,003,339 | ||||||
0.125%, 04/30/2015 | 5,005,000 | 4,998,158 | ||||||
0.250%, 05/31/2015 | 3,000,000 | 3,000,879 | ||||||
0.250%, 07/31/2015 | 3,000,000 | 2,999,706 | ||||||
0.250%, 08/15/2015 | 5,000,000 | 4,998,440 | ||||||
0.250%, 09/30/2015 | 8,014,000 | 8,007,268 | ||||||
TOTAL GOVERNMENT BONDS | ||||||||
|
| |||||||
(Cost $48,238,055) | 48,259,292 | |||||||
|
| |||||||
SHORT TERM INVESTMENTS (30.98%) | ||||||||
MONEY MARKET FUND (7.59%) | ||||||||
Dreyfus Treasury & Agency Cash Management Fund - Institutional Shares, 7-day yield, 0.010% | 11,912,609 | 11,912,609 | ||||||
|
| |||||||
U.S. TREASURY BILLS (23.39%) | ||||||||
0.056%, 01/09/2014(a) | $ | 10,000,000 | 9,999,500 | |||||
0.089%, 04/03/2014(a) | 10,000,000 | 9,997,660 | ||||||
0.082%, 07/24/2014(a) | 5,500,000 | 5,497,217 | ||||||
0.093%, 08/21/2014(a) | 5,500,000 | 5,496,700 | ||||||
0.119%, 09/18/2014(a) | 5,750,000 | 5,745,578 | ||||||
|
| |||||||
| 36,736,655 | ||||||||
|
| |||||||
TOTAL SHORT TERM INVESTMENTS | ||||||||
(Cost $48,644,040) | 48,649,264 | |||||||
|
| |||||||
TOTAL INVESTMENTS (61.71%) | ||||||||
(Cost $96,882,095) | $ | 96,908,556 | ||||||
|
| |||||||
Other Assets In Excess Of Liabilities (38.29%) | 60,138,729 | (b) | ||||||
|
| |||||||
NET ASSETS (100.00%) | $ | 157,047,285 | ||||||
|
| |||||||
| (a) | Rate shown represents the bond equivalent yield to maturity at date of purchase. |
| (b) | Includes cash which is being held as collateral for futures contracts. |
| Semi-Annual Report | October 31, 2013 | 5 |
| Aspen Managed Futures Strategy Fund | Consolidated Schedule of Investments | |
| October 31, 2013 (Unaudited) |
FUTURES CONTRACTS
At October 31, 2013, the Fund had outstanding futures contracts:
| Description | Position | Contracts | Expiration Date | Underlying Face Amount at Value | Unrealized Appreciation | |||||||||||
| ||||||||||||||||
Commodity Contracts | ||||||||||||||||
Corn Future | Short | 205 | 12/16/2013 | $ | (4,389,563) | $ | 352,874 | |||||||||
New York Harbor ULSD Future | Short | 19 | 12/02/2013 | (2,357,212) | 18,194 | |||||||||||
Soybean Future | Short | 104 | 01/15/2014 | (6,584,500) | 9,974 | |||||||||||
Equity Contracts | ||||||||||||||||
Euro STOXX 50® Index Future | Long | 304 | 12/23/2013 | 12,626,251 | 664,855 | |||||||||||
FTSE® 100 Index Future | Long | 118 | 12/23/2013 | 12,692,658 | 255,626 | |||||||||||
S&P 500® E-Mini Future | Long | 144 | 12/23/2013 | 12,607,200 | 263,587 | |||||||||||
Fixed Income Contracts | ||||||||||||||||
Canadian 10 Year Bond Future | Long | 66 | 12/19/2013 | 8,314,487 | 11,932 | |||||||||||
U.S. 10 Year Treasury Note Future | Short | 66 | 12/20/2013 | (8,405,720) | 11,127 | |||||||||||
Foreign Currency Contracts | ||||||||||||||||
Canadian Dollar Currency Future | Short | 99 | 12/18/2013 | (9,489,150) | 78,057 | |||||||||||
Euro FX Currency Future | Long | 165 | 12/17/2013 | 28,033,500 | 251,267 | |||||||||||
|
| |||||||||||||||
| $ | 43,047,951 | $ | 1,917,493 | |||||||||||||
|
| |||||||||||||||
| Description | Position | Contracts | Expiration Date | Underlying Face Amount at Value | Unrealized Depreciation | |||||||||||
| ||||||||||||||||
Commodity Contracts | ||||||||||||||||
Copper Future | Short | 54 | 12/30/2013 | $ | (4,455,675) | $ | (15,553) | |||||||||
Gold 100 Oz Future | Short | 16 | 12/30/2013 | (2,117,920) | (56,868) | |||||||||||
Silver Future | Short | 19 | 12/30/2013 | (2,077,365) | (47,770) | |||||||||||
Sugar No. 11 (World) Future | Long | 214 | 03/03/2014 | 4,390,938 | (80,933) | |||||||||||
WTI Crude Oil Future | Long | 24 | 11/21/2013 | 2,313,120 | (129,301) | |||||||||||
Equity Contracts | ||||||||||||||||
Nikkei 225 Index Future | Long | 118 | 12/13/2013 | 8,534,350 | (119,194) | |||||||||||
Fixed Income Contracts | ||||||||||||||||
Euro-Bund Future | Short | 42 | 12/09/2013 | (8,097,650) | (208,180) | |||||||||||
Long Gilt Future | Short | 47 | 12/30/2013 | (8,384,594) | (190,297) | |||||||||||
Foreign Currency Contracts | ||||||||||||||||
Australian Dollar Currency Future | Long | 476 | 12/17/2013 | 44,891,560 | (421,760) | |||||||||||
Japanese Yen Currency Future | Short | 203 | 12/17/2013 | (25,811,450) | (97,362) | |||||||||||
New Zealand Dollar Currency Future | Long | 429 | 12/17/2013 | 35,345,310 | (225,855) | |||||||||||
Swiss Franc Currency Future | Short | 255 | 12/17/2013 | (35,212,313) | (395,377) | |||||||||||
|
| |||||||||||||||
| $ | 9,318,311 | $ | (1,988,450) | |||||||||||||
|
| |||||||||||||||
Common Abbreviations:
FTSE - Financial Times and the London Stock Exchange
FX - Foreign
No. - Number
Oz - Ounce
S&P - Standard and Poor’s
ULSD - Ultra Low Sulfur Diesel
Holdings are subject to change.
For Fund compliance purposes, the Fund’s industry classifications refer to any one or more of the industry sub-classifications used by one or more widely recognized market indexes or ratings group indexes, and/or as defined by Fund management. This definition may not apply for purposes of this report, which may combine industry sub-classifications for reporting ease. Industries are shown as a percentage of net assets.
See Notes to Consolidated Financial Statements.
6 | www.aspenfuturesfund.com |
| Aspen Managed Futures Strategy Fund | Consolidated Statement of Assets & Liabilities | |
| October 31, 2013 (Unaudited) |
ASSETS: | ||||
Investments, at value | $ | 96,908,556 | ||
Foreign currency, at value (Cost $2,419,016) | 2,417,243 | |||
Deposit with broker for futures contracts (Note 3) | 57,847,422 | |||
Receivable for shares sold | 138,709 | |||
Interest receivable | 17,273 | |||
Prepaid and other assets | 28,582 | |||
| ||||
Total assets | 157,357,785 | |||
| ||||
LIABILITIES: | ||||
Payable to advisor | 100,818 | |||
Variation margin payable | 70,957 | |||
Payable for shares redeemed | 17,462 | |||
Payable for administration fees | 18,933 | |||
Payable for distribution and service fees | ||||
Class A | 3,137 | |||
Payable for transfer agency fees | 7,276 | |||
Payable for trustee fees and expenses | 9,432 | |||
Payable for audit fees | 20,612 | |||
Payable for legal fees | 7,311 | |||
Payable for chief compliance officer fees | 5,329 | |||
Payable for principal financial officer fees | 854 | |||
Payable for licensing fees | 33,008 | |||
Accrued expenses and other liabilities | 15,371 | |||
| ||||
Total liabilities | 310,500 | |||
| ||||
NET ASSETS | $ | 157,047,285 | ||
| ||||
NET ASSETS CONSIST OF: | ||||
Paid-in capital (Note 5) | $ | 158,379,238 | ||
Accumulated net investment loss | (1,981,280) | |||
Accumulated net realized gain on investments, futures contracts and foreign currency transactions | 695,596 | |||
Net unrealized depreciation on investments, futures contracts and foreign currency translations | (46,269) | |||
| ||||
NET ASSETS | $ | 157,047,285 | ||
| ||||
INVESTMENTS, AT COST | $ | 96,882,095 | ||
PRICING OF SHARES: | ||||
Class A: | ||||
Net Asset Value, offering and redemption price per share | $ | 9.15 | ||
Net Assets | $ | 10,993,678 | ||
Shares of beneficial interest outstanding | 1,200,867 | |||
Maximum offering price per share (NAV/0.9450), based on maximum sales charge of 5.50% of the offering price | $ | 9.68 | ||
Class I: | ||||
Net Asset Value, offering and redemption price per share | $ | 9.24 | ||
Net Assets | $ | 146,053,607 | ||
Shares of beneficial interest outstanding | 15,814,700 | |||
See Notes to Consolidated Financial Statements.
| Semi-Annual Report | October 31, 2013 | 7 |
| Aspen Managed Futures Strategy Fund | Consolidated Statement of Operations | |
| October 31, 2013 (Unaudited) |
| ||||
INVESTMENT INCOME: | ||||
Interest | $ | 39,358 | ||
Dividends | 506 | |||
| ||||
Total Investment Income | 39,864 | |||
| ||||
EXPENSES: | ||||
Investment advisory fees | 521,836 | |||
Recoupment of previously waived fees | ||||
Class A | 7,512 | |||
Administrative fees | 111,935 | |||
Distribution and service fees | ||||
Class A | 8,449 | |||
Transfer agency fees | 44,973 | |||
Legal and audit fees | 26,374 | |||
Custodian fees | 5,282 | |||
Trustee fees and expenses | 9,190 | |||
Principal financial officer fees | 2,521 | |||
Chief compliance officer fees | 15,829 | |||
Licensing fees | 120,888 | |||
Other | 34,092 | |||
| ||||
Total Net Expenses | 908,881 | |||
| ||||
NET INVESTMENT LOSS | (869,017) | |||
| ||||
Net realized gain on investments | 1,502 | |||
Net realized loss on futures contracts | (533,801) | |||
Net realized gain on foreign currency transactions | 48,815 | |||
Net change in unrealized appreciation of investments | 26,259 | |||
Net change in unrealized depreciation on futures contracts | (809,824) | |||
Net change in unrealized depreciation on translation of assets and liabilities denominated in foreign currency transactions | (1,710) | |||
| ||||
NET REALIZED AND UNREALIZED LOSS ON INVESTMENTS | (1,268,759) | |||
| ||||
NET DECREASE IN NET ASSETS RESULTING FROM OPERATIONS | $ | (2,137,776) | ||
| ||||
See Notes to Consolidated Financial Statements.
8 | www.aspenfuturesfund.com |
| Aspen Managed Futures Strategy Fund | Consolidated Statements |
| For the Six Months Ended October 31, 2013 (Unaudited) | For the Year Ended April 30, 2013 | |||||||
| ||||||||
OPERATIONS: | ||||||||
Net investment loss | $ | (869,017) | $ | (1,324,600) | ||||
Net realized gain/(loss) on investments, futures contracts and foreign currency transactions | (483,484) | 5,093,850 | ||||||
Net change in unrealized appreciation/(depreciation) on investments, futures contracts and foreign currency translations | (785,275) | 1,008,325 | ||||||
| ||||||||
Net increase/(decrease) in net assets resulting from operations | (2,137,776) | 4,777,575 | ||||||
| ||||||||
SHARE TRANSACTIONS (Note 5): | ||||||||
Class A | ||||||||
Proceeds from sales of shares | 10,130,101 | 2,819,184 | ||||||
Cost of shares redeemed | (2,332,069) | (830,242) | ||||||
Redemption fees | 6,860 | 455 | ||||||
Class I | ||||||||
Proceeds from sales of shares | 33,989,699 | 55,964,668 | ||||||
Cost of shares redeemed | (6,729,733) | (30,316,921) | ||||||
Redemption fees | 399 | 1,069 | ||||||
| ||||||||
Net increase from share transactions | 35,065,257 | 27,638,213 | ||||||
| ||||||||
Net increase in net assets | 32,927,481 | 32,415,788 | ||||||
| ||||||||
NET ASSETS: | ||||||||
Beginning of period | 124,119,804 | 91,704,016 | ||||||
| ||||||||
End of period* | $ | 157,047,285 | $ | 124,119,804 | ||||
| ||||||||
*Includes accumulated net investment loss of: | $ | (1,981,280) | $ | (1,112,263) | ||||
Other Information: | ||||||||
SHARE TRANSACTIONS: | ||||||||
Class A | ||||||||
Sold | 1,091,401 | 311,862 | ||||||
Redeemed | (251,234) | (91,293) | ||||||
| ||||||||
Net increase in shares outstanding | 840,167 | 220,569 | ||||||
| ||||||||
Class I | ||||||||
Sold | 3,632,489 | 6,129,373 | ||||||
Redeemed | (717,825) | (3,306,806) | ||||||
| ||||||||
Net increase in shares outstanding | 2,914,664 | 2,822,567 | ||||||
| ||||||||
See Notes to Consolidated Financial Statements.
| Semi-Annual Report | October 31, 2013 | 9 |
| Aspen Managed Futures Strategy Fund – Class A | Consolidated Financial Highlights | |
| For a share outstanding throughout the periods presented. |
| For the Six Months Ended October 31, 2013 (Unaudited)(a) | For the Year Ended April 30, 2013(a) | For the Period August 2, 2011 (Inception) to April 30, 2012(a) | ||||||||||
| ||||||||||||
NET ASSET VALUE, BEGINNING OF PERIOD | $ | 9.29 | $ | 8.95 | $ | 10.00 | ||||||
INCOME/(LOSS) FROM OPERATIONS: | ||||||||||||
Net investment loss(b) | (0.08) | (0.16) | (0.13) | |||||||||
Net realized and unrealized gain/(loss) on investments | (0.07) | 0.50 | (0.92) | |||||||||
| ||||||||||||
Total from investment operations | (0.15) | 0.34 | (1.05) | |||||||||
| ||||||||||||
REDEMPTION FEES ADDED TO PAID IN CAPITAL | 0.01 | 0.00 | (c) | – | ||||||||
| ||||||||||||
INCREASE/(DECREASE) IN NET ASSET VALUE | (0.14) | 0.34 | (1.05) | |||||||||
| ||||||||||||
NET ASSET VALUE, END OF PERIOD | $ | 9.15 | $ | 9.29 | $ | 8.95 | ||||||
| ||||||||||||
TOTAL RETURN(d) | (1.51%) | (e) | 3.80% | (10.50%) | (e) | |||||||
RATIOS AND SUPPLEMENTAL DATA: | ||||||||||||
Net assets, end of period (000’s) | $ | 10,994 | $ | 3,350 | $ | 1,254 | ||||||
RATIOS TO AVERAGE NET ASSETS: | ||||||||||||
Operating expenses excluding fee waivers/reimbursements | 1.83% | (f) | 1.80% | 2.53% | (f) | |||||||
Operating expenses including fee waivers/reimbursements | 1.83% | (f) | 1.80% | 1.80% | (f) | |||||||
Net investment loss including fee waivers/reimbursements | (1.76%) | (f) | (1.75%) | (1.79%) | (f) | |||||||
PORTFOLIO TURNOVER RATE | 16% | (e) | 0% | 0% | (e) | |||||||
| (a) | Per share amounts and ratios to average net assets include income and expenses of the Aspen Futures Fund Ltd. (subsidiary), exclusive of the subsidiary’s management fee. |
| (b) | Per share numbers have been calculated using the average shares method. |
| (c) | Less than $0.005 per share. |
| (d) | Total return does not reflect the effect of sales charges. |
| (e) | Not annualized. |
| (f) | Annualized. |
See Notes to Consolidated Financial Statements.
10 | www.aspenfuturesfund.com |
| Aspen Managed Futures Strategy Fund – Class I | Consolidated Financial Highlights | |
| For a share outstanding throughout the periods presented. |
| For the Six Months Ended October 31, 2013 (Unaudited)(a) | For the Year Ended April 30, 2013(a) | For the Period August 2, 2011 (Inception) to April 30, 2012(a) | ||||||||||
| ||||||||||||
NET ASSET VALUE, BEGINNING OF PERIOD | $ | 9.36 | $ | 8.98 | $ | 10.00 | ||||||
INCOME/(LOSS) FROM OPERATIONS: | ||||||||||||
Net investment loss(b) | (0.06) | (0.11) | (0.11) | |||||||||
Net realized and unrealized gain/(loss) on investments | (0.06) | 0.49 | (0.91) | |||||||||
| ||||||||||||
Total from investment operations | (0.12) | 0.38 | (1.02) | |||||||||
| ||||||||||||
REDEMPTION FEES ADDED TO PAID IN CAPITAL | 0.00 | (c) | 0.00 | (c) | 0.00 | (c) | ||||||
| ||||||||||||
INCREASE/(DECREASE) IN NET ASSET VALUE | (0.12) | 0.38 | (1.02) | |||||||||
| ||||||||||||
NET ASSET VALUE, END OF PERIOD | $ | 9.24 | $ | 9.36 | $ | 8.98 | ||||||
| ||||||||||||
TOTAL RETURN | (1.28%) | (d) | 4.23% | (10.20%) | (d) | |||||||
RATIOS AND SUPPLEMENTAL DATA: | ||||||||||||
Net assets, end of period (000’s) | $ | 146,054 | $ | 120,769 | $ | 90,450 | ||||||
RATIOS TO AVERAGE NET ASSETS: | ||||||||||||
Operating expenses excluding fee waivers/reimbursements | 1.28% | (e) | 1.25% | 1.75% | (e) | |||||||
Operating expenses including fee waivers/reimbursements | 1.28% | (e) | 1.25% | 1.55% | (e) | |||||||
Net investment loss including fee waivers/reimbursements | (1.23%) | (e) | (1.20%) | (1.54%) | (e) | |||||||
PORTFOLIO TURNOVER RATE | 16% | (d) | 0% | 0% | (d) | |||||||
| (a) | Per share amounts and ratios to average net assets include income and expenses of the Aspen Futures Fund Ltd. (subsidiary), exclusive of the subsidiary’s management fee. |
| (b) | Per share numbers have been calculated using the average shares method. |
| (c) | Less than $0.005 per share. |
| (d) | Not annualized. |
| (e) | Annualized. |
See Notes to Consolidated Financial Statements.
| Semi-Annual Report | October 31, 2013 | 11 |
| Aspen Managed Futures Strategy Fund | Notes to Consolidated | |
| October 31, 2013 (Unaudited) |
1. ORGANIZATION
Financial Investors Trust (the “Trust”), a Delaware statutory trust, is an open-end management investment company registered under the Investment Company Act of 1940, as amended (“1940 Act”). As of October 31, 2013, the Trust had 27 registered funds. This semi-annual report describes the Aspen Managed Futures Strategy Fund (the “Fund”). The Fund seeks investment results that replicate as closely as possible, before fees and expenses, the price and yield performance of the Aspen Managed Futures Beta Index (the “MFBI” or “Index”). The Aspen Managed Futures Strategy Fund offers Class A and Class I shares. All classes of shares have identical rights to earnings, assets and voting privileges, except for class specific expenses and exclusive rights to vote on matters affecting only individual classes.
Basis of Consolidation for the Aspen Futures Fund, Ltd.
Aspen Futures Fund, Ltd. (the “Subsidiary”), a Cayman Islands exempted company, is a wholly owned subsidiary of the Fund. The Subsidiary’s investment objective is designed to enhance the ability of the Fund to obtain exposure to equities, financial, currency and commodities markets consistent with the limits of the U.S. federal tax law requirements applicable to registered investment companies. The Subsidiary is subject to substantially the same investment policies and investment restrictions as the Fund. The Subsidiary acts as an investment vehicle for the Fund in order to effect certain commodity-related investments on behalf of the Fund. Investments in the Subsidiary are expected to provide the Fund with exposure to the commodity markets within the limitations of Subchapter M of the Internal Revenue Code of 1986, as amended (the “Code”), and recent IRS revenue rulings, as discussed below under “Federal Income Taxes”. The Fund is the sole shareholder of the Subsidiary pursuant to a subscription agreement dated as of August 2, 2011, and it is intended that the Fund will remain the sole shareholder and will continue to control the Subsidiary. Under the Articles of Association of the Subsidiary, shares issued by the Subsidiary confer upon a shareholder the right to wholly own and vote at general meetings of the Subsidiary and certain rights in connection with any winding-up or repayment of capital, as well as the right to participate in the profits or assets of the Subsidiary. The Fund may invest up to 25% of its total assets in shares of the Subsidiary. As a wholly owned subsidiary of the Fund, all assets and liabilities, income and expenses of the Subsidiary are consolidated in the financial statements and financial highlights of the Fund. All investments held by the Subsidiary are disclosed in the accounts of the Fund. As of October 31, 2013, net assets of the Fund were $157,047,285, of which $29,183,509 or 18.58%, represented the Fund’s ownership of all issued shares and voting rights of the Subsidiary.
2. SIGNIFICANT ACCOUNTING POLICIES
The accompanying financial statements were prepared in accordance with accounting principles generally accepted in the United States of America (“U.S. GAAP”). The preparation of financial statements in conformity with U.S. GAAP requires management to make certain estimates and assumptions that affect the reported amounts of assets and liabilities and disclosures of contingent assets and liabilities at the date of the financial statements and the reported amounts of revenue and expenses during the period. Actual results could differ from those estimates. The following is a summary of significant accounting policies consistently followed by the Fund and subsidiary in preparation of the financial statements.
Investment Valuation: The Fund generally values its securities based on market prices determined at the close of regular trading on the New York Stock Exchange (“NYSE”), normally 4:00 p.m. Eastern Time, on each day the NYSE is open for trading.
For equity securities and mutual funds that are traded on an exchange, the market price is usually the closing sale or official closing price on that exchange. In the case of equity securities not traded on an exchange, or if such closing prices are not otherwise available, the securities are valued at the mean of the most recent bid and ask prices on such day. Redeemable securities issued by open-end registered investment companies are valued at the investment company’s applicable net asset value, with the exception of exchange-traded open-end investment companies, which are priced as equity securities.
The market price for debt obligations is generally the price supplied by an independent third-party pricing service approved by the Board of Trustees (the “Board”), which may use a matrix, formula or other objective method that takes into consideration quotations from dealers, market transactions in comparable investments, market indices and yield curves. If vendors are unable to supply a price, or if the price supplied is deemed to be unreliable, the market price may be determined using quotations received from one or more brokers–dealers that make a market in the security. Short–term debt obligations that will mature in 60 days or less are valued at amortized cost, unless it is determined that using this method would not reflect an investment’s fair value.
Futures contracts that are listed or traded on a national securities exchange, commodities exchange, contract market or comparable over-the-counter market, and that are freely transferable, are valued at their closing settlement price on the exchange on which they are primarily traded or based upon the current settlement price for a like instrument acquired on the day on which the instrument is being valued. A settlement price may not be used if the market makes a limit move with respect to a particular commodity.
Forward currency exchange contracts have a market value determined by the prevailing foreign currency exchange daily rates and current foreign currency exchange forward rates. The foreign currency exchange forward rates are calculated using an automated system that estimates rates on the basis of the current day foreign currency exchange rates and forward foreign currency exchange rates supplied by a pricing service.
12 | www.aspenfuturesfund.com |
| Aspen Managed Futures Strategy Fund | Notes to Consolidated Financial Statements | |
| October 31, 2013 (Unaudited) |
Investment securities that are primarily traded on foreign securities exchanges are valued at the preceding closing values of such securities on their respective exchanges, except when an occurrence subsequent to the time a value was so established is likely to have changed such value. In such an event, the fair value of those securities are determined in good faith through consideration of other factors in accordance with procedures established by and under the general supervision of the Board.
When such prices or quotations are not available, or when the Fair Value Committee appointed by the Board believes that they are unreliable, securities may be priced using fair value procedures approved by the Board.
Fair Value Measurements: The Fund discloses the classification of its fair value measurements following a three-tier hierarchy based on the inputs used to measure fair value. Inputs refer broadly to the assumptions that market participants would use in pricing the asset or liability, including assumptions about risk. Inputs may be observable or unobservable. Observable inputs reflect the assumptions market participants would use in pricing the asset or liability that are developed based on market data obtained from sources independent of the reporting entity. Unobservable inputs reflect the reporting entity’s own assumptions about the assumptions market participants would use in pricing the asset or liability that are developed based on the best information available.
Various inputs are used in determining the value of the Fund’s investments as of the end of the reporting period. When inputs used fall into different levels of the fair value hierarchy, the level in the hierarchy within which the fair value measurement falls is determined based on the lowest level input that is significant to the fair value measurement in its entirety. The designated input levels are not necessarily an indication of the risk or liquidity associated with these investments. These inputs are categorized in the following hierarchy under applicable financial accounting standards:
Level 1 – | Unadjusted quoted prices in active markets for identical investments, unrestricted assets or liabilities that the Fund has the ability to access at the measurement date; | |
Level 2 – | Quoted prices which are not active, quoted prices for similar assets or liabilities in active markets or inputs other than quoted prices that are observable (either directly or indirectly) for substantially the full term of the asset or liability; and | |
Level 3 – | Significant unobservable prices or inputs (including the Fund’s own assumptions in determining the fair value of investments) where there is little or no market activity for the asset or liability at the measurement date. | |
The following is a summary of each input used to value the Fund as of October 31, 2013:
| Investments in Securities at Value | Level 1 - Quoted Prices | Level 2 - Other Significant Observable Inputs | Level 3 - Significant Unobservable Inputs | Total | ||||||||||||
| ||||||||||||||||
Government Bonds | $ | – | $ | 48,259,292 | $ | – | $ | 48,259,292 | ||||||||
Short Term Investments | 11,912,609 | 36,736,655 | – | 48,649,264 | ||||||||||||
| ||||||||||||||||
TOTAL | $ | 11,912,609 | $ | 84,995,947 | $ | – | $ | 96,908,556 | ||||||||
| ||||||||||||||||
Other Financial Instruments | ||||||||||||||||
Assets: | ||||||||||||||||
Futures Contracts | ||||||||||||||||
Commodity Contracts | $ | 381,042 | $ | – | $ | – | $ | 381,042 | ||||||||
Equity Contracts | 1,184,068 | – | – | 1,184,068 | ||||||||||||
Fixed Income Contracts | 23,059 | – | – | 23,059 | ||||||||||||
Foreign Currency Contracts | $ | 329,324 | $ | – | $ | – | $ | 329,324 | ||||||||
Liabilities: | ||||||||||||||||
Futures Contracts | ||||||||||||||||
Commodity Contracts | (330,425 | ) | – | – | (330,425 | ) | ||||||||||
Equity Contracts | (119,194 | ) | – | – | (119,194 | ) | ||||||||||
Fixed Income Contracts | (398,477 | ) | – | – | (398,477 | ) | ||||||||||
Foreign Currency Contracts | (1,140,354 | ) | – | – | (1,140,354 | ) | ||||||||||
| ||||||||||||||||
TOTAL | $ | (70,957 | ) | $ | – | $ | – | $ | (70,957 | ) | ||||||
| ||||||||||||||||
The Fund recognizes transfers between levels as of the end of the period. For the six months ended October 31, 2013, the Fund did not have any transfers between Level 1 and Level 2 securities. For the six months ended October 31, 2013, the Fund did not have any securities that used significant unobservable inputs (Level 3) in determining fair value.
| Semi-Annual Report | October 31, 2013 | 13 |
| Aspen Managed Futures Strategy Fund | Notes to Consolidated Financial Statements | |
| October 31, 2013 (Unaudited) |
Investment Transactions and Investment Income: Investment transactions are accounted for on the date the investments are purchased or sold (trade date). Realized gains and losses from investment transactions are reported on an identified cost basis. Interest income, which includes accretion of discounts, is accrued and recorded as earned. Dividend income is recognized on the ex-dividend date or for certain foreign securities, as soon as information is available to the Fund. All of the realized and unrealized gains and losses and net investment income, are allocated daily to each class in proportion to its average daily net assets.
Foreign Securities: The Fund may directly purchase securities of foreign issuers. Investing in securities of foreign issuers involves special risks not typically associated with investing in securities of U.S. issuers. The risks include possible reevaluation of currencies, the inability to repatriate foreign currency, less complete financial information about companies and possible future adverse political and economic developments. Moreover, securities of many foreign issuers and their markets may be less liquid and their prices more volatile than those of securities of comparable U.S. issuers.
Foreign Currency Translation: The books and records of the Fund are maintained in U.S. dollars. Investment valuations and other assets and liabilities initially expressed in foreign currencies are converted each business day into U.S. dollars based upon current exchange rates. Prevailing foreign exchange rates may generally be obtained at the close of the NYSE (normally, 4:00 p.m. Eastern Time). The portion of realized and unrealized gains or losses on investments due to fluctuations in foreign currency exchange rates is not separately disclosed and is included in realized and unrealized gains or losses on investments, when applicable.
Foreign Currency Spot Contracts: The Fund may enter into foreign currency spot contracts to facilitate transactions in foreign securities or to convert foreign currency receipts into U.S. dollars. A foreign currency spot contract is an agreement between two parties to buy and sell currencies at the current market rate, for settlement generally within two business days. The U.S. dollar value of the contracts is determined using current currency exchange rates supplied by a pricing service. The contract is marked-to-market daily for settlements beyond one day and any change in market value is recorded as an unrealized gain or loss. When the contract is closed, the Fund records a realized gain or loss equal to the difference between the value on the open and close date. Losses may arise from changes in the value of the foreign currency, or if the counterparties do not perform under the contract’s terms. The maximum potential loss from such contracts is the aggregate face value in U.S. dollars at the time the contract was opened.
Trust Expenses: Some expenses of the Trust can be directly attributed to the Fund. Expenses which cannot be directly attributed to the Fund are apportioned among all funds in the Trust based on average net assets of each fund.
Fund and Class Expenses: Expenses that are specific to a class of shares of the Fund are charged directly to that share class. All expenses of the Fund, other than class specific expenses, are allocated daily to each class in proportion to its average daily net assets. Fees provided under the distribution (Rule 12b-1) for a particular class of the Fund are charged to the operations of such class.
Federal Income Taxes: The Fund complies with the requirements under Subchapter M of the Internal Revenue Code of 1986, as amended, applicable to regulated investment companies and intends to distribute substantially all of their net taxable income and net capital gains, if any, each year so that it will not be subject to excise tax on distributed income and gains. The Fund is not subject to income taxes to the extent such distributions are made.
As of and during the six months ended October 31, 2013, the Fund did not have a liability for any unrecognized tax benefits. The Fund files U.S. federal, state, and local tax returns as required. The Fund’s tax returns are subject to examination by the relevant tax authorities until expiration of the applicable statute of limitations, which is generally three years after the filing of the tax return for federal purposes and four years for most state returns. Tax returns for open years have incorporated no uncertain tax positions that require a provision for income taxes.
Distributions to Shareholders: The Fund normally pays dividends and distributes capital gains, if any, on an annual basis. Income dividend distributions are derived from interest and other income the Fund receives from its investments, including short term capital gains. Long term capital gains distributions are derived from gains realized when the Fund sells a security it has owned for more than a year. The Fund may make additional distributions and dividends at other times if the portfolio manager believes doing so may be necessary for the Fund to avoid or reduce taxes.
3. DERIVATIVE INSTRUMENTS
The Fund uses derivatives (including futures) to pursue its investment objective. The Fund’s use of derivative instruments involves risks different from, or possibly greater than, the risks associated with investing directly in securities and other traditional investments. These risks may include (i) the risk that the counterparty to a derivative transaction may not fulfill its contractual obligations, (ii) risk of mispricing or improper valuation, and (iii) the risk that changes in the value of the derivative may not correlate perfectly with the underlying asset, rate or index. These risks could cause the Fund to lose more than the principal amount invested. In addition, investments in derivatives involve leverage, which means a small percentage of assets invested in derivatives can have a disproportionately large impact on the Fund.
14 | www.aspenfuturesfund.com |
| Aspen Managed Futures Strategy Fund | Notes to Consolidated Financial Statements | |
| October 31, 2013 (Unaudited) |
The Fund’s use of derivatives can result in losses due to unanticipated changes in the market risk factors and the overall market. In instances where the Fund is using derivatives to decrease, or hedge, exposures to market risk factors for securities held by the Fund, there are also risks that those derivatives may not perform as expected resulting in losses for the combined or hedged positions. Derivatives may have little or no initial cash investment relative to their market value exposure and therefore can produce significant gains or losses in excess of their cost. This use of embedded leverage allows the Fund to increase its market value exposure relative to its net assets and can substantially increase the volatility of the Fund’s performance.
In addition, use of derivatives may increase or decrease exposure to the following risk factors:
| — | Equity Risk: Equity risk relates to the change in value of equity securities as they relate to increases or decreases in the general market. |
| — | Fixed Income Risk: When the Fund invests in fixed-income securities or derivatives, the value of an investment in the Fund will fluctuate with changes in interest rates. Typically, a rise in interest rates causes a decline in the value of fixed-income securities or derivatives owned by the Fund. In general, the market price of debt securities with longer maturities will increase or decrease more in response to changes in interest rates than shorter-term securities. Other risk factors include credit risk (the debtor may default) and prepayment risk (the debtor may pay its obligation early, reducing the amount of interest payments). |
| — | Foreign Currency Risk: Currency trading involves significant risks, including market risk, interest rate risk, country risk, counterparty credit risk and short sale risk. Market risk results from the price movement of foreign currency values in response to shifting market supply and demand. Interest rate risk arises whenever a country changes its stated interest rate target associated with its currency. Country risk arises because virtually every country has interfered with international transactions in its currency. Counterparty credit risk arises when the counterparty will not fulfill its obligations to the Fund. Short sale risk arises from the sale of a security that is not owned, or any sale that is completed by the delivery of a security borrowed. |
| — | Commodity Risk: Exposure to the commodities markets may subject the Fund to greater volatility than investments in traditional securities. Commodity prices are influenced by unfavorable weather, animal and plant disease, geologic and environmental factors, as well as changes in government regulation such as tariffs, embargoes or burdensome production rules and restrictions. |
Futures: The Fund and the Subsidiary may enter into futures contracts. Futures contracts are agreements between two parties to buy and sell a particular commodity, instrument or index for a specified price on a specified future date. When the Fund or the Subsidiary enters into a futures contract, it is required to deposit with (or for the benefit of) its broker an amount of cash or short-term high-quality securities as “initial margin”. The margin requirements are set by the exchange on which the contract is traded and may be modified during the term of the contract. The initial margin is in the nature of a performance bond or good faith deposit on the futures contract that is returned to the Fund upon termination of the contract, assuming all contractual obligations have been satisfied. As the value of the contract changes, the value of the futures contract position increases or declines. Subsequent payments, known as “variation margin”, are made or received by the Fund or the Subsidiary, depending on the price fluctuations in the fair value of the contract and the value of cash or securities on deposit with the broker. The aggregate principal amounts of the contracts are not recorded in the financial statements. Fluctuations in the value of the contracts are recorded in the Consolidated Statements of Assets and Liabilities as an asset (liability) and in the Consolidated Statements of Operations as unrealized appreciation (depreciation) until the contracts are closed, when they are recorded as realized gains (losses). Realized gain or loss on a futures position is equal to the difference between the value of the contract at the time it was opened and the value at the time it was closed, minus brokerage commissions. When the Fund or the Subsidiary enters into a futures contract certain risks may arise, such as illiquidity in the futures market, which may limit the Fund’s or the Subsidiary’s ability to close out a futures contract prior to settlement date, and unanticipated movements in the value of securities, commodities or interest rates. Futures contracts are exchange-traded. Exchange-traded futures are standardized contracts and are settled through a clearing house with fulfillment supported by the credit of the exchange. Therefore, counterparty credit risk to the Fund and the Subsidiary is reduced. In addition, the Fund could be exposed to risk if the counterparties to the contracts are unable to meet the terms of their contracts. With exchange traded futures, there is minimal counterparty credit risk to the Funds since futures are exchange traded and the exchange’s clearinghouse, as a counterparty to all exchange traded futures, guarantees the futures against default.
| Semi-Annual Report | October 31, 2013 | 15 |
| Aspen Managed Futures Strategy Fund | Notes to Consolidated Financial Statements | |
| October 31, 2013 (Unaudited) |
Balance Sheet – Fair Value of Derivative Instruments as of October 31, 2013(a):
| Derivatives Instruments | Asset Derivatives Balance Sheet Location | Fair Value | Liabilities Derivatives Balance Sheet Location | Fair Value | ||||||||
| ||||||||||||
Futures Contracts* | Variation Margin Receivable | $ | – | Variation Margin Payable | $ | (70,957) | ||||||
|
|
|
| |||||||||
| $ | – | $ | (70,957) | |||||||||
|
|
|
| |||||||||
| *Risk Exposure to Fund | ||||||||||||
Commodity Contracts | $ | 50,617 | ||||||||||
Equity Contracts | 1,064,874 | |||||||||||
Fixed Income Contracts | (375,418) | |||||||||||
Foreign Currency Contracts | (811,030) | |||||||||||
|
| |||||||||||
| $ | (70,957) | |||||||||||
|
| |||||||||||
| (a) | For open derivative instruments as of October 31, 2013, see the Consolidated Schedule of Investments, which is also indicative of the activity for the six months ended October 31, 2013. |
Consolidated Statement of Operations – The effect of Derivative Instruments for the six months ended October 31, 2013:
| Derivatives Instruments | Location of Gain/ (Loss) on Derivatives Recognized in Income | Realized Gain/ (Loss) on Derivatives Recognized in Income | Change in Unrealized Gain/ (Loss) on Derivatives | |||||||
| ||||||||||
Futures Contracts* | Net realized loss on futures contracts/Net change in unrealized depreciation on futures contracts | $ | (533,801) | $ | (809,824) | |||||
|
| |||||||||
| $ | (533,801) | $ | (809,824) | |||||||
|
| |||||||||
*Risk Exposure to Fund |
| |||||||||
Commodity Contracts | $ | (590,309) | $ | 693,939 | ||||||
Equity Contracts | (120,405) | (123,393) | ||||||||
Fixed Income Contracts | 2,624,084 | (1,156,625) | ||||||||
Foreign Currency Contracts | (2,447,171) | (223,745) | ||||||||
|
| |||||||||
| $ | (533,801) | $ | (809,824) | |||||||
|
| |||||||||
4. TAX BASIS INFORMATION
Tax Basis of Investments: As of October 31, 2013, the aggregate cost of investments, gross unrealized appreciation/(depreciation) and net unrealized appreciation for Federal tax purposes was as follows:
| Cost of Investments | Gross Appreciation (excess of value over tax cost) | Gross Depreciation (excess of tax cost over value) | Net Depreciation on Investments | |||||||||||||||||
| Aspen Managed Futures Strategy Fund | $ | 96,993,086 | $ | 1,254,855 | $ | (1,339,385 | ) | $ | (84,530 | ) | ||||||||||
Tax Basis of Distributions to Shareholders: Distributions are determined in accordance with federal income tax regulations, which differ from GAAP, and, therefore, may differ significantly in amount or character from net investment income and realized gains for financial reporting purposes. Financial reporting records are adjusted for permanent book/tax differences to reflect tax character but are not adjusted for temporary differences. During the six months ended October 31, 2013 and the year ended April 30, 2013, the Fund did not make any distributions.
5. SHARES OF BENEFICIAL INTEREST
The capitalization of the Trust consists of an unlimited number of shares of beneficial interest with no par value per share. Holders of the shares of the Fund of the Trust have one vote for each share held and a proportionate fraction of a vote for each fractional share. All shares issued and outstanding are fully paid and are non-assessable, transferable and redeemable at the option of the shareholder. Shares have no pre-emptive rights.
Fund shares redeemed within 30 days of purchase may incur a 2% short-term redemption fee deducted from the redemption amount. The amount of redemption fees received during the period are presented in the Consolidated Statement of Changes in Net Assets.
16 | www.aspenfuturesfund.com |
| Aspen Managed Futures Strategy Fund | Notes to Consolidated Financial Statements | |
| October 31, 2013 (Unaudited) |
6. MANAGEMENT AND RELATED-PARTY TRANSACTIONS
Aspen Partners Ltd. (the “Adviser” or “Aspen”), subject to the authority of the Board, is responsible for the overall management and administration of the Fund’s business affairs. The Adviser manages the investments of the Fund in accordance with the Fund’s investment objective, policies and limitations and investment guidelines established jointly by the Adviser and the Board. Pursuant to the Investment Advisory Agreement, (the “Advisory Agreement”), the Fund will pay the Adviser an annual management fee of 0.75%, based on the Fund’s average daily net assets. The management fee is paid on a monthly basis.
The Subsidiary has entered into a separate advisory agreement (the “Subsidiary Advisory Agreement”) with Aspen, the Subsidiary’s investment adviser and the Fund’s investment adviser, for the management of the Subsidiary’s portfolio pursuant to which the Subsidiary is obligated to pay the Adviser a management fee at the same rate that the Fund pays the Adviser for investment advisory services provided to the Fund. The Adviser has agreed to waive the advisory fee it receives from the Fund in an amount equal to the management fee paid by the Subsidiary. This waiver may not be terminated or modified without the consent of the Board.
The Adviser has contractually agreed to waive and/or reimburse fees or expenses in order to limit total annual fund operating expenses after fee waiver/expense reimbursements (excluding distribution and service (12b-1) fees, shareholder services fees, acquired fund fees and expenses, brokerage expenses, interest expenses, taxes and extraordinary expenses) to 1.55% of the Fund’s average daily net assets. This agreement is in effect through August 31, 2016. This agreement may not be terminated or modified prior to this date except with the approval of the Board.
Pursuant to this agreement, the Fund will reimburse the Adviser for any fee waivers and expense reimbursements made by the Adviser, provided that any such reimbursements made by the Fund to the Adviser will not cause the Fund’s expense limitation to exceed expense limitations in existence at the time the expense was incurred, or at the time of the reimbursement, whichever is lower, and the reimbursement is made within three years after the expenses were incurred.
For the six months ended October 31, 2013, the fee waivers and/or reimbursements were as follows:
| Fund | Fees Waived/Reimbursed By Adviser | Recoupment of Previously Waived Fees By Adviser | ||||||||
Aspen Managed Futures Strategy Fund - Class A | $ | – | $ | 7,512 | ||||||
Aspen Managed Futures Strategy Fund - Class I | $ | – | $ | – | ||||||
As of October 31, 2013, the balances of recoupable expenses for the Fund were as follows:
| Fund | 2015 | 2016 | TOTAL | |||||||||
Aspen Managed Futures Strategy Fund - Class A | $ | 13,354 | $ | – | $ | 13,354 | ||||||
Aspen Managed Futures Strategy Fund - Class I | – | – | – | |||||||||
Fund Accounting Fees and Expenses
ALPS Fund Services, Inc. (“ALPS” and the “Administrator”) (an affiliate of ALPS Distributors, Inc.) serves as administrator to the Fund and Subsidiary. The Fund has agreed to pay expenses incurred in connection with its administrative activities. Pursuant to the Administration, Bookkeeping and Pricing Services Agreement (the “Agreement”), ALPS will provide operational services to the Fund including, but not limited to fund accounting and fund administration and generally assist in the Fund’s operations.
The Fund’s administration fee is accrued on a daily basis, and paid on a monthly basis following the end of the month, based on the greater of (a) an annual total fee of $165,000, subject to a 5% increase per annum, from the first to the last, or projected last, day of the then current year of service under the Administration Agreement; or (b) the following basis point fee schedule:
| Average Total Net Assets | Contractual Fee | |
Between $0-$500M | 0.05% | |
$500M-$1B | 0.03% | |
Above $1B | 0.02% |
The Subsidiary’s administration fee is based on an annual rate of $45,000.
The Administrator is also reimbursed by the Fund for certain out-of-pocket expenses.
| Semi-Annual Report | October 31, 2013 | 17 |
| Aspen Managed Futures Strategy Fund | Notes to Consolidated Financial Statements | |
| October 31, 2013 (Unaudited) |
Transfer Agent
ALPS serves as transfer, dividend paying and shareholder servicing agent for the Fund. ALPS is compensated based upon a $20,000 annual base fee, subject to a 5% increase per annum for the Fund, and annually $9 per direct open account and $7 per open account through the National Securities Clearing Corporation. ALPS is also reimbursed by the Fund for certain out-of-pocket expenses.
Compliance Services
ALPS provides services as the Fund’s Chief Compliance Officer to assist the Trust’s Chief Compliance Officer in monitoring and testing the policies and procedures of the Trust in conjunction with requirements under Rule 38a-1 under the 1940 Act and receives an annual base fee of $30,000, subject to a 5% increase per annum.
Principal Financial Officer
ALPS receives an annual fee of $5,000 for providing Principal Financial Officer services to the Fund.
Distributor
ALPS Distributors, Inc. (“ADI” or the “Distributor”) (an affiliate of ALPS) acts as the distributor of the Fund’s shares pursuant to a Distribution Agreement with the Trust. Shares are sold on a continuous basis by ADI as agent for the Fund, and ADI has agreed to use its best efforts to solicit orders for the sale of the Fund’s shares, although it is not obliged to sell any particular amount of shares. ADI is not entitled to any compensation for its services as Distributor. ADI is registered as a broker-dealer with the Securities and Exchange Commission.
The Fund has adopted a plan of distribution for Class A shares pursuant to Rule 12b-1 under the 1940 Act (the “Plan”). The Plan allows the Fund to use Class A assets to pay fees in connection with the distribution and marketing of Class A shares and/or the provision of shareholder services to Class A shareholders. The Plan permits payment for services in connection with the administration of plans or programs that use Class A shares as their funding medium and for related expenses. The Plan permits the Fund to use its Class A assets to make total payments at an annual rate of up to 0.25% of the Fund’s average daily net assets attributable to its Class A shares. The expenses of the plan are reflected as distribution and service fees in the Consolidated Statement of Operations.
Effective October 11, 2013, the Fund has adopted a shareholder service plan (a “Shareholder Services Plan” for Class A shares. Under the Shareholder Services Plan the Fund is authorized to pay banks and their affiliates and other institutions, including broker-dealers and Fund affiliates (“Participating Organizations”), an aggregate fee in an amount not to exceed on an annual basis 0.15% for Class A shares of the average daily net asset value of the Class A shares, respectively, attributable to or held in the name of a Participating Organization for its clients as compensation for providing shareholder service activities, which do not include distribution services, pursuant to an agreement with a Participating Organization. Any amount of such payment not paid during the Fund’s fiscal year for such service activities shall be reimbursed to the Fund. Shareholder Services Plan fees are included with distribution and service fees on the Statement of Operations.
Index Licensing Services
As of July 1, 2013, the Fund has adopted an Index Licensing Agreement with Quantitative Equity Strategies, LLC (“QES”) and the Adviser, joint owners of the Index, pursuant to which the Fund pays QES a monthly annualized licensing fee of 0.25%, based on the Fund’s average daily net assets for the right to use the Index in connection with the Fund.
7. SECURITIES TRANSACTIONS
The cost of purchases and proceeds from sales of U.S. Government securities (excluding short-term securities) during the six months ended October 31, 2013 were as follows:
| Aspen Managed Futures Strategy Fund | ||||
Cost of Investments Purchased | $ | 0 | ||
Proceeds from Investments Sold | $ | 0 | ||
8. INDEMNIFICATIONS
Under the Trust’s organizational documents, its officers and Trustees are indemnified against certain liability arising out of the performance of their duties to the Trust. Additionally, in the normal course of business, the Trust enters into contracts with service providers that may contain general indemnification clauses, which may permit indemnification to the extent permissible under applicable law. The Trust’s maximum exposure under these arrangements is unknown, as this would involve future claims that may be made against the Trust that have not yet occurred.
18 | www.aspenfuturesfund.com |
| Aspen Managed Futures Strategy Fund | Notes to Consolidated Financial Statements | |
| October 31, 2013 (Unaudited) |
9. NEW ACCOUNTING PRONOUNCEMENTS
In June 2013, the Financial Accounting Standards Board (the “FASB”) issued Accounting Standards Update (“ASU”) No. 2013-08, Financial Services-Investment Companies (Topic 946): Amendments to the Scope, Measurement, and Disclosure Requirements. The FASB standard identifies characteristics a company must assess to determine whether it is considered an investment company for financial reporting purposes. This ASU is effective for fiscal years beginning after December 15, 2013. The Funds believe the adoption of this ASU will not have a material impact on their financial statements.
| Semi-Annual Report | October 31, 2013 | 19 |
| Aspen Managed Futures Strategy Fund | Additional Information | |
| October 31, 2013 (Unaudited) |
1. FUND HOLDINGS
The Fund files its complete schedule of portfolio holdings with the Securities and Exchange Commission (the “SEC”) for the first and third quarters of each fiscal year on Form N-Q within 60 days after the end of the period. Copies of the Fund’s Form N-Q are available without charge on the SEC website at http://www.sec.gov. You may also review and copy the Form N-Q at the SEC’s Public Reference Room in Washington, DC. For more information about the operation of the Public Reference Room, please call the SEC at 1-800-SEC-0330.
2. FUND PROXY VOTING POLICIES, PROCEDURES AND SUMMARIES
The Fund’s policies and procedures used in determining how to vote proxies and information regarding how the Fund voted proxies relating to portfolio securities during the most recent prior 12-month period ending June 30 are available without charge, (1) upon request, by calling (toll-free) 1-855-845-9444 and (2) on the SEC’s website at http://www.sec.gov.
20 | www.aspenfuturesfund.com |

| 1 | ||||
| 5 | ||||
| 9 | ||||
| 11 | ||||
| 13 | ||||
| 15 | ||||
| 16 | ||||
| 17 | ||||
| 18 | ||||
| 20 | ||||
| 24 | ||||
| 28 | ||||
| 35 | ||||
| Emerald Banking and Finance Fund | Manager Commentary | |
| October 31, 2013 (Unaudited) |
Dear Shareholder:
Investment Results
Bank stocks outperformed the broad market during the second half of the fiscal year despite the benefits from increased mortgage banking activity subsiding earlier than we anticipated due to a steepening of the yield curve in the second half of the year. The SNL Small Cap U.S. Bank & Thrift Index1 gained 20.18% versus a 10.98% gain delivered by the S&P 500® Total Return Index2 and a gain of 19.83% for the Russell 2000® Index3. The Emerald Banking and Finance Fund Class A (without sales load) continued its outperformance of the broad market and the SNL Small Cap U.S. Bank & Thrift Index, having posted a 20.96% return for the six month period ended October 31, 2013. Larger sized banks have not led the market as they did in the first have of our fiscal year but they did outperform the broader market. In fact, the SNL Large Cap U.S. Bank & Thrift index4 was up 12.22% versus 10.98% for the S&P 500® Total Return Index.
Investment Analysis
The fact that smaller sized banks have outperformed the broader market is no surprise to us as we believe that banks and financials in general, should lead the market higher during a new bull market phase. Large cap financials tend to lead the market initially followed by outsized gains by small cap financials versus the large cap financials. We believe that the outperformance by the small cap financials versus the market and the large cap financials will continue into 2014, though we caution that the path to this outperformance will not be a straight line “up and to the right.” Having passed the five year anniversary of the beginning of the financial crisis, we believe the bull cycle in small community banks is still in its early stages.
The ten year U.S. Treasury note peaked during the calendar year third quarter at 2.98% but is down 44 basis points since then though it remains up 88 basis points from early May of this year. Generally, a steeper long end results from a strengthening economy but we believe the steepening yield curve resulted more from the anticipation of “tapering” than the strengthening economy. Regardless, if and when rates stabilize above the 3% level, we believe upward EPS (or “earnings per share”) revisions will follow. More important to earnings at community banks would be an increase in short term rates as many variable rate commercial and industrial loans are indexed off short term LIBOR which has decreased ever so slightly since the beginning of 2013 (LIBOR - the London Interbank Offered Rate - is the average interest rate estimated by leading banks in London that they would be charged if borrowing from other banks).
Market Outlook
We believe that continued loan growth leading to increased earnings growth and an increase in M&A (mergers and acquisitions) activity will increase forward earnings multiples in 2014 as the current rally in bank stocks continue. Loan growth continued in the second half of the fiscal year and in the calendar third quarter loan balances at community banks increased 1.3% according to the Federal Reserve’s latest H. 8 statistical release of U.S. Commercial Bank balance sheet data for the week ending October 30th 2013. We believe the loan growth continues to be mainly driven by C&I (commercial and industry) lending and we continue to forecast high single digit year-over-year C&I loan growth as the economy continues to improve in 2014. We anticipate banks maintaining their healthy loan pipeline guidance throughout the first half of 2014 with relative strength in certain geographies and lines of business which will create an environment of haves-and-have not, as it pertains to loan growth.
We continue to believe that regulatory expenses will increase the pace of acquisitions in 2014 but ironically, the pool of buyers is smaller simply because only banks with CAMELS ratings of one or two (regulatory speak for the highest quality) can acquire institutions and increasingly it is understood that the combined ratio after a merger can be no worse than a composite rating of three (The CAMELS ratings is a supervisory rating system originally developed in the U.S. to classify a bank’s overall condition. It’s applied to every bank and credit union in the U.S. and is also implemented outside the U.S. by various banking supervisory regulators). In the first three quarters of 2013, there were 166 acquisitions announced versus 192 announced in the same period in 2012, according to the SNL Data Dispatch “Bank M&A Q3’13 scoreboard; Large and expensive deals dominated third quarter.” However, total deal value is reported at $12.0 billion in the first three quarters of 2013 versus $12.5 billion in 2012, according to the SNL Data Dispatch “Bank M&A Q3’13 scoreboard; Large and expensive deals dominated third quarter” October 17, 2013.
We believe that the market remains in the early stages of a long term recovery in bank stocks and remain confident in our expectations for improved fundamentals and continued consolidation amongst the small-to-mid capitalization bank and thrift stocks. However, we continue to believe stock selection remains paramount as earnings power remains challenging due to increased capital requirements, regulatory burdens, and a slow loan growth environment. This type of “stock pickers market” falls directly into the strengths of Emerald’s Ten Step Research Process and this combined with any increase in short term interest rates which are more directly beneficial to revenue growth at community banks as many variable rate C&I loans are indexed off short term LIBOR will provide momentum for the bank fund in 2014.
| Semi-Annual Report | October 31, 2013 | 1 |
| Emerald Banking and Finance Fund | Manager Commentary | |
| October 31, 2013 (Unaudited) |
Top Five Contributors to Return Included: | Top Five Detractors to Return Included: | |
Home BancShares, Inc. (HOMB) | Health Insurance Innovations, Inc. Class A (HIIQ) | |
BofI Holding, Inc. (BOFI) | Walker & Dunlop, Inc. (WD) | |
Signature Bank (SBNY) | Glimcher Realty Trust (GRT) | |
Bank of the Ozarks, Inc. (OZRK) | Campus Crest Communities, Inc. (CCG) | |
SVB Financial Group (SIVB) | American Campus Communities, Inc. (ACC) | |
|
| |
Kenneth G. Mertz II, CFA | Steven E. Russell, Esq. | |
Chief Investment Officer | Portfolio Manager | |
Portfolio Manager | ||
Emerald Mutual Fund Advisers Trust | ||

| (1) | SNL Small Cap Bank & Thrift Index: Includes all publicly traded (NYSE, NYSE Amex, NASDAQ, OTC BB, Pink Sheets) Banks and Thrifts in SNL’s coverage universe with $250M to $1B Total Common Market Capitalization as of most recent pricing data. Source: SNL Financial, data as of October 31, 2013. |
| (2) | The S&P 500® Total Return Index is an unmanaged index of 500 common stocks chosen for the market size, liquidity and industry group representation. It is a market-value weighted index. The index is not actively managed and does not reflect any deduction for fees, expenses or taxes. An investor cannot invest directly into the index. |
| (3) | The Russell 2000® Index measures the performance of the small-cap segment of the U.S. equity universe. The Russell 2000® is a subset of the Russell 3000® Index representing approximately 10% of the total market capitalization of that index. It includes approximately 2000 of the smallest securities based on a combination of their market cap and current index membership. The index is not actively managed and does not reflect any deduction for fees, expenses or taxes. An investor cannot invest directly into the index. |
| (4) | SNL Large Cap U.S. Bank & Thrift Index: Includes all publicly traded (NYSE, NYSE Amex, NASDAQ, OTC BB, Pink Sheets) Banks and Thrifts in SNL’s coverage universe with greater than $5 billion Total Common Market Capitalization as of most recent pricing data. Source: SNL Financial, data as of October 31, 2013. An investor cannot invest directly into the index. |
2 | www.emeraldmutualfunds.com |
| Emerald Banking and Finance Fund | Manager Commentary | |
| October 31, 2013 (Unaudited) |
TOP TEN HOLDINGS (as a % of Net Assets)* | ||||||
Bank of the Ozarks, Inc. | 3.73% | |||||
Signature Bank | 2.59% | |||||
First NBC Bank Holding Co. | 2.58% | |||||
SVB Financial Group | 2.47% | |||||
Independent Bank Group, Inc. | 2.47% | |||||
Customers Bancorp, Inc. | 2.40% | |||||
PacWest Bancorp | 2.28% | |||||
EverBank Financial Corp. | 2.19% | |||||
ConnectOne Bancorp, Inc. | 2.13% | |||||
Home BancShares, Inc. | 2.12% | |||||
Top Ten Holdings | 24.96% | |||||
INDUSTRY SECTOR ALLOCATION (as a % of Net Assets) |
| |||||
Banks: Diversified | 77.38% | |||||
Banks: Savings, Thrift & Mortgage | 7.24% | |||||
Real Estate Investment Trusts (REITs) | 4.98% | |||||
Insurance: Property-Casualty | 2.82% | |||||
Leisure Equipment & Products | 1.27% | |||||
Financial Data & Systems | 1.06% | |||||
Consumer Lending | 0.99% | |||||
Asset Management & Custodian | 0.99% | |||||
Diversified Financial Services | 0.87% | |||||
Real Estate Management & Development | 0.30% | |||||
Insurance: Multi-Line | 0.15% | |||||
Cash, Cash Equivalents, & Other Net Assets | 1.95% | |||||
* Holdings are subject to change. Tables present indicative values only.
|
| |||||
GROWTH OF $10,000 INVESTMENT IN THE FUND (for the period ended October 31, 2013)
Comparison of change in value of a $10,000 investment (includes applicable sales loads)
The chart represents historical performance of a hypothetical investment of $10,000 in the Fund since inception. Past performance does not guarantee future results. This chart does not reflect the deduction of taxes that a shareholder would pay on Fund distributions or the redemption of Fund shares.
AVERAGE ANNUAL TOTAL RETURN (for the period ended October 31, 2013)
| Since | Expense Ratio | |||||||||||||||||||
| 1 Year | 3 Year | 5 Year | 10 Year | Inception1 | Gross2 | Net2 | ||||||||||||||
Class A (NAV) | 31.48% | 18.99% | 7.33% | 3.52% | 7.99% | 1.84% | 1.84% | |||||||||||||
Class A (MOP) | 25.21% | 17.07% | 6.29% | 3.02% | 7.67% | 1.84% | 1.84% | |||||||||||||
Russell 2000® Index† | 36.28% | 17.69% | 17.04% | 9.03% | 8.15% | |||||||||||||||
Class C (NAV) | 30.67% | 18.26% | 6.64% | 2.88% | 8.13% | 2.49% | 2.49% | |||||||||||||
Class C (CDSC) | 29.67% | 18.26% | 6.64% | 2.88% | 8.13% | 2.49% | 2.49% | |||||||||||||
Russell 2000® Index | 36.28% | 17.69% | 17.04% | 9.03% | 7.23% | |||||||||||||||
Investor Class | 31.49% | 17.26% | – | – | 12.66% | 1.84% | 1.84% | |||||||||||||
Russell 2000® Index | 36.28% | 17.69% | 17.04% | 9.03% | 15.75% | |||||||||||||||
Institutional Class | 31.98% | – | – | – | 24.48% | 1.44% | 1.44% | |||||||||||||
Russell 2000® Index | 36.28% | 17.69% | 17.04% | 9.03% | 20.01% | |||||||||||||||
The performance quoted represents past performance, does not guarantee future results and current performance may be lower or higher than the data quoted. The investment return and principal value of an investment will fluctuate so that shares, when redeemed, may be worth more or less than their original cost. Performance data current to the most recent month end may be obtained at www.emeraldmutualfunds.com.
Performance shown for periods prior to March 16, 2012, reflects the performance of the Forward Banking & Finance Fund, a series of Forward Funds (as a result of a reorganization of the Forward Banking & Finance Fund into the Emerald Banking & Finance Fund).
Maximum Offering Price (MOP) for Class A shares includes the Fund’s maximum sales charge of 4.75%. Performance shown at NAV does not include these sales charges and would have been lower had it been taken into account.
A Contingent Deferred Sales Charge (CDSC) of 1.00% may apply to Class C shares redeemed within the first 12 months after a purchase.
| Semi-Annual Report | October 31, 2013 | 3 |
| Emerald Banking and Finance Fund | Manager Commentary | |
| October 31, 2013 (Unaudited) |
| ||||
| 1 | Inception Dates - Class A: 02/18/1997, Class C: 07/01/2000, Class Institutional: 03/19/2012, Class Investor: 03/16/2010 |
| 2 | Emerald Mutual Fund Advisers Trust (“Emerald” or the “Adviser”) has agreed contractually to waive a portion of its fees and reimburse other expenses until August 31, 2014 in amounts necessary to limit the Fund’s operating expenses (exclusive of Acquired Fund Fees and Expenses, brokerage expenses, interest expenses, taxes and extraordinary expense) for Class A, Class C, Institutional Class, and Investor Class shares to an annual rate (as percentage of the Fund’s average daily net assets) of 1.84%, 2.49%, 1.54% and 1.89% respectively. The Adviser will be permitted to recover, on a class-by-class basis, expenses it has borne through the agreement described above to the extent that the Fund’s expenses in later periods fall below the annual rates set forth in the relevant agreement. The Fund will not be obligated to pay any such deferred fees and expenses more than three years after the year(s) in which the fees and expense were incurred. The Adviser may not discontinue this waiver prior to August 31, 2014, without the approval by the Fund’s Board of Trustees. |
| † | The Russell 2000® Index measures the performance of the small-cap segment of the U.S. equity universe. The Russell 2000® is a subset of the Russell 3000® Index representing approximately 10% of the total market capitalization of that index. It includes approximately 2000 of the smallest securities based on a combination of their market cap and current index membership. An investor cannot invest directly into an index. |
Important Risks
The views and information discussed in this commentary are as of the date of publication, are subject to change, and may not reflect the writer’s current views. The views expressed represent an assessment of market conditions at a specific point in time, are opinions only and should not be relied upon as investment advice regarding a particular investment or markets in general. Such information does not constitute a recommendation to buy or sell specific securities or investment vehicles. It should not be assumed that any investment will be profitable or will equal the performance of the Fund or any securities or any sectors mentioned herein. The subject matter contained herein has been derived from several sources believed to be reliable and accurate at the time of compilation. The Fund does not accept any liability for losses either direct or consequential caused by the use of this information.
A fund that concentrates in a particular industry will involve a greater degree of risk than a fund with a more diversified portfolio. Investing in smaller companies generally will present greater investment risks, including: greater price volatility, greater sensitivity to changing economic conditions and less liquidity than the securities of larger, more mature companies.
4 | www.emeraldmutualfunds.com |
| Emerald Growth Fund | Manager Commentary | |
| October 31, 2013 (Unaudited) |
Dear Shareholder:
Investment Results
The performance of the Emerald Growth Fund’s Class A shares (without sales load), for the six months ended October 31, 2013, reflected a gain of 26.28% outpacing the Russell 2000® Growth Index1 which gained 19.93%. On a year-to-date basis the Emerald Growth Fund’s Class A shares (without sales load) gained 42.24%, outperforming the Russell 2000® Growth Index, which increased 34.89%
The market melt-up continued throughout the October with advances recorded across all of the major market indices. Small capitalization stocks continue to outperform large capitalization stocks. The Russell 2000® Growth Index outperformed the Standard & Poor’s 500 Total Return Index2 by more than 450 basis points (or 4.50%) for the 6-month period. From a style perspective growth has been leading value across the capitalization spectrum the variance in performance however is much more pronounced within the mid and small capitalization components of the market. Not coincidentally, performance has been concentrated where earnings growth is also the greatest. Within small cap, the growth component of the index has been leading the charge, with the Russell 2000® Growth advancing 19.93% for the period and 34.89% on a year-to-date basis through October.
In an otherwise lackluster economic climate, we believe small capitalization growth stocks have been the largest source of innovation and growth in the marketplace.
Investment Analysis
Within the Emerald Growth Fund stock selection was the largest source of relative outperformance. At the sector level relative outperformance was driven by stock selection within the healthcare, energy and technology sectors, which offset relative underperformance within the consumer staples, producer durables and materials sectors. While stock selection has been the key factor contributing to the relative outperformance, it is the portfolio’s focus on investing in those companies that are driving organic revenue and earnings growth through innovation that is ultimately driving relative outperformance.
That cycle of innovation is playing out in the healthcare sector, particularly in biotechnology and pharmaceuticals. A renewed focus on drug development for rare diseases and targeted oncological indications has been the key to the resurgence in the industry over the last 12 months. The healthcare sector was the largest source of relative outperformance for the portfolio. At the stock level, shares of NPS Pharmaceuticals were the largest contributor to return. Patient and doctor adoption of Gattex for use in the treatment of short bowel syndrome has been better than expected with approximately 140 patients currently undergoing treatment.
The Emerald Growth Fund’s holdings within the energy sector have similarly been reaping the rewards of innovation. The industries adoption and pursuit of hydraulic fracturing, which has enabled access to oil and gas stored in the shale formations throughout the U.S., has dramatically changed the U.S. dependence on external oil. So much so, not only has the U.S. import of natural gas and crude oil fallen by 32% and 15% respectively over the past five years, the U.S. is on the verge of surpassing Russia as the world’s largest producer of oil and natural gas according to the statistics from International Energy Agency and as cited in an October 3, 2013 Wall Street Journal article. This is an extraordinary turn of events with far reaching ramifications. Emerald has been focused on identifying the highest growth companies in the most prolific oil and gas basins in the U.S. that are employing innovative drilling techniques to drive industry leading production growth. The performance and contribution of the shares of Magnum Hunter Resources Corporation are a case in point.
Innovation can come in many forms. In many cases the portfolio has benefitted from participation in the success of companies that have developed innovative approaches to serve niche markets within the consumer discretionary, technology, financial services, materials and producer durables sectors as well.
The outperformance of the aforementioned was partially offset by relative underperformance within the producer durables, consumer staples and materials sectors. The relative underperformance was largely the result of the portfolio’s underweight position relative to the benchmark within these sectors.
Market Outlook
Since the market began to recover in mid-2009, Emerald has been discussing the favorable outlook for growth oriented stocks and in particular small capitalization growth stocks based on what we view as a renewed cycle of innovation. Our optimism then and today is predicated on the breadth of the opportunity set, from biotechnology, medical devices, exploration and production, software (cloud delivery) and security to new retail and restaurant concepts coming to market and everything in between. Encouragingly, innovation in our view continues to thrive. One measure, the initial public offering market, has started to pick-up meaningfully, with 143 transactions raising nearly $15 billion completed through September 30, according to a recent report from Bank of America Merrill Lynch. This places 2013 on track to be largest for initial public offerings since 2004. Small capitalization stocks, in our opinion, have, and continue to be, at the epicenter of this innovation cycle.
| Semi-Annual Report | October 31, 2013 | 5 |
| Emerald Growth Fund | Manager Commentary | |
| October 31, 2013 (Unaudited) |
As always Emerald remains focused on utilizing its fundamental bottom-up research process to identify the best growth opportunities within the small capitalization universe.
| Top Five Contributors to Return Included | Top Five Detractors to Return Included | |||
| NPS Pharmaceuticals, Inc. (NPSP) | Infinity Pharmaceuticals, Inc. (INFI) | |||
| Alnylam Pharmaceuticals (ALNY) | Aruba Networks, Inc. (ARUN) | |||
| Insys Therapeutics (INSY) | BioScrip, Inc. (BIOS) | |||
| Infoblox Inc. (BLOX) | Francesca’s Holdings Corporation (FRAN) | |||
| Exacttarget, Inc. (ET) | Uni-Pixel, Inc. (UNXL) | |||
 |  |  | ||
| Kenneth G. Mertz II, CFA | Stacey L. Sears | Joseph W. Garner | ||
| Chief Investment Officer | Portfolio Manager | Portfolio Manager | ||
| Portfolio Manager | ||||
| Emerald Mutual Fund Advisers Trust | ||||
| (1) | The Russell 2000® Growth Index measures the performance of the small-cap growth segment of the U.S. equity universe. It includes those Russell 2000® Index companies with higher price-to-value ratios and higher forecasted growth values. An investor cannot invest directly into the index. |
| (2) | The S&P 500® Total Return Index is an unmanaged index of 500 common stocks chosen for the market size, liquidity and industry group representation. It is a market-value weighted index. The index is not actively managed and does not reflect any deduction for fees, expenses or taxes. An investor cannot invest directly into the index. |
6 | www.emeraldmutualfunds.com |
| Emerald Growth Fund | Manager Commentary | |
| October 31, 2013 (Unaudited) |
TOP TEN HOLDINGS (as a % of Net Assets)* | ||||||
MWI Veterinary Supply, Inc. | 2.84% | |||||
NPS Pharmaceuticals, Inc. | 2.64% | |||||
Trex Co., Inc. | 2.54% | |||||
Spirit Airlines, Inc. | 2.19% | |||||
Akorn, Inc. | 1.95% | |||||
Diamondback Energy, Inc. | 1.92% | |||||
Infoblox, Inc. | 1.91% | |||||
Bank of the Ozarks, Inc. | 1.85% | |||||
Acadia Healthcare Co., Inc. | 1.79% | |||||
SVB Financial Group | 1.68% | |||||
Top Ten Holdings | 21.31% | |||||
INDUSTRY SECTOR ALLOCATION (as a % of Net Assets) |
| |||||
Health Care | 25.30% | |||||
Technology | 22.61% | |||||
Consumer Discretionary | 16.57% | |||||
Financial Services | 9.32% | |||||
Producer Durables | 7.71% | |||||
Energy | 6.38% | |||||
Materials & Processing | 5.85% | |||||
Utilities | 1.42% | |||||
Cash, Cash Equivalents, & Other Net Assets | 4.84% | |||||
* Holdings are subject to change. Tables present indicative values only.
|
| |||||
GROWTH OF $10,000 INVESTMENT IN THE FUND (for the period ended October 31, 2013)
Comparison of change in value of a $10,000 investment (includes applicable sales loads)
The chart represents historical performance of a hypothetical investment of $10,000 in the Fund since inception. Past performance does not guarantee future results. This chart does not reflect the deduction of taxes that a shareholder would pay on Fund distributions or the redemption of Fund shares.
AVERAGE ANNUAL TOTAL RETURN (for the period ended October 31, 2013)
| Since | Expense Ratio | |||||||||||||||||||
| 1 Year | 3 Year | 5 Year | 10 Year | Inception1 | Gross2 | Net2 | ||||||||||||||
Class A (NAV) | 46.41% | 22.79% | 21.06% | 8.96% | 11.56% | 1.33% | 1.29% | |||||||||||||
Class A (MOP) | 39.46% | 20.82% | 19.89% | 8.43% | 11.31% | 1.33% | 1.29% | |||||||||||||
Russell 2000® Growth Index† | 39.84% | 19.00% | 19.27% | 9.14% | 8.14% | |||||||||||||||
Class C (NAV) | 45.47% | 22.01% | 20.33% | 8.30% | 5.27% | 1.98% | 1.94% | |||||||||||||
Class C (CDSC) | 44.47% | 22.01% | 20.33% | 8.30% | 5.27% | 1.98% | 1.94% | |||||||||||||
Russell 2000® Growth Index | 39.84% | 19.00% | 19.27% | 9.14% | 3.90% | |||||||||||||||
Investor Class | 46.33% | – | – | – | 14.93% | 1.38% | 1.34% | |||||||||||||
Russell 2000® Growth Index | 39.84% | 19.00% | 19.27% | 9.14% | 12.56% | |||||||||||||||
Institutional Class | 46.88% | 23.15% | 21.46% | – | 20.23% | 1.02% | 0.99% | |||||||||||||
Russell 2000® Growth Index | 39.84% | 19.00% | 19.27% | 9.14% | 19.18% | |||||||||||||||
The performance quoted represents past performance, does not guarantee future results and current performance may be lower or higher than the data quoted. The investment return and principal value of an investment will fluctuate so that shares, when redeemed, may be worth more or less than their original cost. Performance data current to the most recent month end may be obtained at www.emeraldmutualfunds.com.
Performance shown for periods prior to March 16, 2012, reflects the performance of the Forward Growth Fund, a series of Forward Funds (as a result of a reorganization of the Forward Growth Fund into the Emerald Growth Fund).
| Semi-Annual Report | October 31, 2013 | 7 |
| Emerald Growth Fund | Manager Commentary | |
| October 31, 2013 (Unaudited) |
| ||||
Maximum Offering Price (MOP) for Class A shares includes the Fund’s maximum sales charge of 4.75%. Performance shown at NAV does not include these sales charges and would have been lower had it been taken into account.
A Contingent Deferred Sales Charge (CDSC) of 1.00% may apply to Class C shares redeemed within the first 12 months after a purchase.
| 1 | Inception Dates - Class A: 10/01/1992, Class C: 07/01/2000, Class Institutional: 10/21/2008, Class Investor: 05/01/2011 |
| 2 | Emerald Mutual Fund Advisers Trust (“Emerald” or the “Adviser”) has agreed contractually to waive a portion of its fees and reimburse other expenses until August 31, 2014 in amounts necessary to limit the Fund’s operating expenses (exclusive of Acquired Fund Fees and Expenses, brokerage expenses, interest expenses, taxes and extraordinary expense) for Class A, Class C, Institutional Class, and Investor Class shares to an annual rate (as percentage of the Fund’s average daily net assets) of 1.29%, 1.94%, 0.99% and 1.34% respectively. The Adviser will be permitted to recover, on a class-by-class basis, expenses it has borne through the agreement described above to the extent that the Fund’s expenses in later periods fall below the annual rates set forth in the relevant agreement. The Fund will not be obligated to pay any such deferred fees and expenses more than three years after the year(s) in which the fees and expense were incurred. The Adviser may not discontinue this waiver prior to August 31, 2014, without the approval by the Fund’s Board of Trustees. |
| † | The Russell 2000® Growth Index measures the performance of the small-cap growth segment of the U.S. equity universe. It includes those Russell 2000® Index companies with higher price-to-value ratios and higher forecasted growth values. The index is not actively managed and does not reflect any deduction for fees, expenses or taxes. An Investor cannot invest directly into an index. |
Important Risks
The views and information discussed in this commentary are as of the date of publication, are subject to change, and may not reflect the writer’s current views. The views expressed represent an assessment of market conditions at a specific point in time, are opinions only and should not be relied upon as investment advice regarding a particular investment or markets in general. Such information does not constitute a recommendation to buy or sell specific securities or investment vehicles. It should not be assumed that any investment will be profitable or will equal the performance of the Fund or any securities or any sectors mentioned herein. The subject matter contained herein has been derived from several sources believed to be reliable and accurate at the time of compilation. The Fund does not accept any liability for losses either direct or consequential caused by the use of this information.
Investing in smaller companies generally will present greater investment risks, including: greater price volatility, greater sensitivity to changing economic conditions and less liquidity than the securities of larger, more mature companies.
8 | www.emeraldmutualfunds.com |
| Emerald Funds | Disclosure of Fund Expenses | |
| October 31, 2013 (Unaudited) |
As a shareholder of the Funds, you incur two types of costs: (1) transaction costs, including applicable sales charges (loads); and (2) ongoing costs, including management fees, distribution and service (12b-1) fees, shareholder services fees and other Fund expenses. This example is intended to help you understand your ongoing costs (in dollars) of investing in the Funds and to compare these costs with the ongoing costs of investing in other mutual funds. The example is based on an investment of $1,000 invested at the beginning of the (six-month) period and held for the entire period May 1, 2013 through October 31, 2013.
Actual Expenses
The first line for each share class of each Fund in the table provides information about actual account values and actual expenses. You may use this information, together with the amount you invested, to estimate the expenses that you paid over the period. Simply divide your account value by $1,000 (for example, an $8,600 account value divided by $1,000 = 8.6), then multiply the result by the number in the applicable line under the heading entitled “Expenses Paid During Period” to estimate the expenses you paid on your account during this period.
Hypothetical Example For Comparison Purposes
The second line for each share class of each Fund in the table below provides information about hypothetical account values and hypothetical expenses based on the Fund’s actual expense ratio and an assumed rate of return of 5% per year before expenses, which is not the Fund’s actual return. The hypothetical account values and expenses may not be used to estimate the actual ending account balance or expenses you paid for the period. You may use this information to compare the ongoing costs of investing in the Funds and other funds. To do so, compare this 5% hypothetical example with the 5% hypothetical examples that appear in the shareholder reports of other funds.
Please note that the expenses shown in the table below are meant to highlight your ongoing costs only and do not reflect any transactional costs, such as sales charges (loads), redemption fees or exchange fees. Therefore, the second line for each share class of each Fund within the table is useful in comparing ongoing costs only, and will not help you determine the relative total costs of owning different funds. If these transactional costs were included, your costs would have been higher.
| EMERALD BANKING AND FINANCE FUND | BEGINNING 05/01/13 | ENDING ACCOUNT VALUE 10/31/13 | EXPENSE RATIO(a) | Expense Paid During Period 5/01/13 -10/31/13(b) | ||||
| ||||||||
Class A | ||||||||
Actual | $ 1,000.00 | $ 1,189.70 | 1.84% | $ 10.16 | ||||
Hypothetical (5% return before expenses)
| $ 1,000.00
| $ 1,015.93
| 1.84%
| $ 9.35
| ||||
| ||||||||
Class C | ||||||||
Actual | $ 1,000.00 | $ 1,186.30 | 2.49% | $ 13.72 | ||||
Hypothetical (5% return before expenses)
| $ 1,000.00
| $ 1,012.65
| 2.49%
| $ 12.63
| ||||
| ||||||||
Institutional Class | ||||||||
Actual | $ 1,000.00 | $ 1,192.10 | 1.44% | $ 7.96 | ||||
Hypothetical (5% return before expenses)
| $ 1,000.00
| $ 1,017.95
| 1.44%
| $ 7.32
| ||||
| ||||||||
Investor Class | ||||||||
Actual | $ 1,000.00 | $ 1,189.80 | 1.84% | $ 10.16 | ||||
Hypothetical (5% return before expenses) | $ 1,000.00 | $ 1,015.93 | 1.84% | $ 9.35 | ||||
| (a) | The Fund’s expense ratios have been based on the Fund’s most recent fiscal half-year expenses. |
| (b) | Expenses are equal to the Fund’s annualized expense ratio multiplied by the average account value over the period, multiplied by the number of days in the most recent fiscal half-year (184)/365 (to reflect the half-year period). |
| Semi-Annual Report | October 31, 2013 | 9 |
| Emerald Funds | Disclosure of Fund Expenses | |
| October 31, 2013 (Unaudited) |
| EMERALD GROWTH FUND | BEGINNING ACCOUNT VALUE 05/01/13 | ENDING ACCOUNT VALUE 10/31/13 | EXPENSE RATIO(a) | Expense Paid During Period 5/01/13 - 10/31/13(b) | ||||
| ||||||||
Class A | ||||||||
Actual | $ 1,000.00 | $ 1,262.80 | 1.29% | $ 7.36 | ||||
Hypothetical (5% return before expenses)
| $ 1,000.00
| $ 1,018.70
| 1.29%
| $ 6.56
| ||||
| ||||||||
Class C | ||||||||
Actual | $ 1,000.00 | $ 1,258.70 | 1.94% | $ 11.04 | ||||
Hypothetical (5% return before expenses)
| $ 1,000.00
| $ 1,015.43
| 1.94%
| $ 9.86
| ||||
| ||||||||
Institutional Class | ||||||||
Actual | $ 1,000.00 | $ 1,264.80 | 0.99% | $ 5.65 | ||||
Hypothetical (5% return before expenses)
| $ 1,000.00
| $ 1,020.21
| 0.99%
| $ 5.04
| ||||
| ||||||||
Investor Class | ||||||||
Actual | $ 1,000.00 | $ 1,262.70 | 1.34% | $ 7.64 | ||||
Hypothetical (5% return before expenses) | $ 1,000.00 | $ 1,018.45 | 1.34% | $ 6.82 | ||||
| (a) | The Fund’s expense ratios have been based on the Fund’s most recent fiscal half-year expenses. |
| (b) | Expenses are equal to the Fund’s annualized expense ratio multiplied by the average account value over the period, multiplied by the number of days in the most recent fiscal half-year (184)/365 (to reflect the half-year period). |
10 | www.emeraldmutualfunds.com |
| Emerald Banking and Finance Fund | Schedule of Investments | |
| October 31, 2013 (Unaudited) |
| Shares | Value (Note 2) | |||||
| ||||||
COMMON STOCKS: 98.05% | ||||||
| ||||||
Consumer Discretionary: 1.27% | ||||||
| ||||||
Leisure Equipment & Products: 1.27% |
| |||||
53,830 | Diamond Resorts International, Inc.(a) | $
| 1,027,076
|
| ||
| ||||||
Financial Services: 96.78% | ||||||
| ||||||
Asset Management & Custodian: 0.99% |
| |||||
1,000 | Artisan Partners Asset Management, Inc., Class A | 59,870 | ||||
50,000 | Silvercrest Asset Management Group, Inc., Class A(a) | 738,500 | ||||
|
| 798,370
|
| ||||
| ||||||
Banks: Diversified: 77.38% | ||||||
13,542 | Access National Corp. | 196,765 | ||||
25,432 | American Business Bank(a) | 750,244 | ||||
54,320 | Ameris Bancorp(a) | 994,056 | ||||
31,650 | Atlas Financial Holdings, | 386,446 | ||||
60,968 | Bank of the Ozarks, Inc. | 3,016,697 | ||||
36,750 | BankUnited, Inc. | 1,130,797 | ||||
26,770 | Bofl Holding, Inc.(a) | 1,617,443 | ||||
38,500 | Bridge Bancorp, Inc. | 888,965 | ||||
18,290 | Bryn Mawr Bank Corp. | 509,559 | ||||
56,489 | California Republic Bancorp(a) | 1,330,316 | ||||
15,510 | Capital Bank Financial Corp., | 344,632 | ||||
23,110 | Cardinal Financial Corp. | 381,315 | ||||
71,800 | Cascade Bancorp(a) | 371,206 | ||||
54,424 | Center Bancorp, Inc. | 814,183 | ||||
34,580 | Central Valley Community Bancorp | 366,548 | ||||
7,571 | Citizens Financial Services, Inc. | 355,837 | ||||
136,753 | CoBiz Financial, Inc. | 1,483,770 | ||||
45,280 | ConnectOne Bancorp, Inc.(a) | 1,721,093 | ||||
922 | Consumers Bancorp, Inc. | 15,711 | ||||
19,926 | Cortland Bancorp | 189,297 | ||||
77,229 | CU Bancorp(a) | 1,436,459 | ||||
116,075 | Customers Bancorp, Inc.(a) | 1,944,256 | ||||
48,390 | Eagle Bancorp, Inc.(a) | 1,279,915 | ||||
23,220 | East West Bancorp, Inc. | 782,282 | ||||
4,400 | Enterprise Financial Services Corp. | 79,332 | ||||
8,450 | Evans Bancorp, Inc. | 175,168 | ||||
117,085 | EverBank Financial Corp. | 1,770,325 | ||||
104,453 | Farmers National Banc Corp. | 650,742 | ||||
36,640 | First BanCorp(a) | 203,352 | ||||
25,125 | First Business Financial Services, Inc. | 884,903 | ||||
21,150 | First Financial Bankshares, Inc. | 1,300,937 | ||||
21,682 | First Financial Holdings, Inc. | 1,299,402 | ||||
13,070 | First Internet Bancorp | 288,716 | ||||
78,450 | First NBC Bank Holding Co.(a) | 2,090,693 | ||||
26,150 | First of Long Island Corp. | 1,029,003 | ||||
34,860 | FirstMerit Corp. | 782,956 | ||||
101,280 | Flagstar Bancorp, Inc.(a) | 1,641,749 | ||||
22,506 | Guaranty Bancorp | 303,831 | ||||
106,537 | Heritage Oaks Bancorp(a) | 729,778 | ||||
| Shares | Value (Note 2) | |||||
| ||||||
Banks: Diversified (continued) | ||||||
50,540 | Home BancShares, Inc. | $ | 1,712,295 | |||
16,003 | HopFed Bancorp, Inc. | 173,633 | ||||
17,591 | Horizon Bancorp | 381,901 | ||||
59,296 | Howard Bancorp, Inc.(a) | 501,644 | ||||
15,250 | Independent Bank Corp. | 547,170 | ||||
50,000 | Independent Bank Corp.(a) | 486,000 | ||||
53,000 | Independent Bank Group, Inc. | 1,999,690 | ||||
34,233 | Investors Bancorp, Inc. | 811,664 | ||||
27,563 | Lakeland Financial Corp. | 980,967 | ||||
20,777 | Meridian Interstate Bancorp, Inc.(a) | 493,246 | ||||
29,870 | Meta Financial Group, Inc. | 1,111,761 | ||||
18,787 | Monarch Financial Holdings, Inc. | 223,002 | ||||
52,180 | Northeast Bancorp | 522,322 | ||||
6,224 | Oak Valley Bancorp(a) | 50,726 | ||||
73,550 | OFG Bancorp | 1,089,276 | ||||
73,738 | Old Line Bancshares, Inc. | 983,665 | ||||
6,700 | Old National Bancorp | 97,418 | ||||
10,392 | Orrstown Financial Services, Inc.(a) | 173,858 | ||||
120,532 | Pacific Premier Bancorp, | 1,676,600 | ||||
48,600 | PacWest Bancorp | 1,849,230 | ||||
22,050 | Park Sterling Corp. | 143,546 | ||||
16,002 | Peoples Bancorp, Inc. | 358,765 | ||||
2,860 | Peoples Financial Corp. | 35,721 | ||||
24,300 | Pinnacle Financial Partners, Inc.(a) | 753,300 | ||||
12,080 | Prosperity Bancshares, Inc. | 754,396 | ||||
5,909 | QCR Holdings, Inc. | 102,580 | ||||
12,860 | Renasant Corp. | 368,825 | ||||
18,620 | Republic Bancorp, Inc., | 428,632 | ||||
84,050 | Shore Bancshares, Inc.(a) | 769,058 | ||||
20,590 | Signature Bank(a) | 2,096,474 | ||||
20,598 | Southern National Bancorp of Virginia, Inc. | 200,831 | ||||
20,878 | SVB Financial Group(a) | 1,999,695 | ||||
3,490 | Texas Capital Bancshares, Inc.(a) | 181,655 | ||||
7,520 | Tompkins Financial Corp. | 370,886 | ||||
49,456 | Tristate Capital Holdings, | 618,695 | ||||
124,973 | United Community Financial Corp.(a) | 499,892 | ||||
11,900 | Virginia Heritage Bank(a) | 191,590 | ||||
24,349 | Washington Banking Co. | 414,176 | ||||
38,229 | Western Alliance Bancorp(a) | 808,543 | ||||
24,650 | Xenith Bankshares, Inc.(a) | 141,738 | ||||
|
| 62,643,745
|
| ||||
| ||||||
Banks: Savings, Thrift & Mortgage: 7.24% |
| |||||
41,600 | Banc of California, Inc. | 586,976 | ||||
10,750 | Bridge Capital Holdings(a) | 189,092 | ||||
48,225 | Capitol Federal Financial, Inc. | 611,011 | ||||
20,000 | Chemical Financial Corp. | 585,800 | ||||
11,200 | Doral Financial Corp.(a) | 189,280 | ||||
32,875 | Elmira Savings Bank | 742,317 | ||||
12,500 | Flushing Financial Corp. | 251,125 | ||||
14,850 | Heritage Financial Corp. | 239,531 | ||||
21,460 | Heritage Financial Group, Inc. | 368,683 | ||||
| Semi-Annual Report | October 31, 2013 | 11 |
| Emerald Banking and Finance Fund | Schedule of Investments | |
| October 31, 2013 (Unaudited) |
| Shares | Value (Note 2) | |||||
| ||||||
Banks: Savings, Thrift & Mortgage (continued) | ||||||
3,300 | Hingham Institution for Savings | $239,976 | ||||
11,680 | Home Bancorp, Inc.(a) | 212,226 | ||||
26,413 | Mackinac Financial Corp. | 244,584 | ||||
69,740 | Provident New York Bancorp(a) | 817,353 | ||||
7,809 | Teche Holding Co. | 392,793 | ||||
8,830 | Territorial Bancorp, Inc. | 192,582 | ||||
| 5,863,329 | ||||||
| ||||||
Consumer Lending: 0.99% | ||||||
27,087 | Tree.com, Inc. | 799,338 | ||||
| ||||||
Diversified Financial Services: 0.87% | ||||||
13,960 | Evercore Partners, Inc., Class A | 704,561 | ||||
| ||||||
Financial Data & Systems: 1.06% | ||||||
15,022 | Cass Information Systems, Inc. | 861,211 | ||||
| ||||||
Insurance: Multi-Line: 0.15% | ||||||
10,000 | Health Insurance Innovations, Inc., Class A(a) | 121,400 | ||||
| ||||||
Insurance: Property-Casualty: 2.82% | ||||||
32,030 | Amtrust Financial Services, Inc. | 1,228,671 | ||||
10,520 | Hilltop Holdings, Inc.(a) | 182,417 | ||||
98,165 | United Insurance Holdings Corp. | 873,668 | ||||
| 2,284,756 | ||||||
| ||||||
Real Estate Investment Trusts | ||||||
8,720 | American Campus Communities, Inc. | 301,363 | ||||
20,000 | Armada Hoffler Properties, Inc. | 192,400 | ||||
44,538 | CapitalSource, Inc. | 582,557 | ||||
21,230 | CubeSmart | 387,872 | ||||
27,780 | DiamondRock Hospitality Co. | 316,414 | ||||
63,190 | Glimcher Realty Trust, REIT | 647,697 | ||||
44,350 | Hersha Hospitality Trust, Priority A Shares | 251,464 | ||||
28,010 | Physicians Realty Trust | 351,806 | ||||
5,060 | Saul Centers, Inc. | 237,820 | ||||
5,290 | Tanger Factory Outlet Centers, Inc. | 184,357 | ||||
22,180 | Urstadt Biddle Properties, Inc., Class A | 437,833 | ||||
10,250 | Whitestone, Class B | 141,348 | ||||
| 4,032,931 | ||||||
| ||||||
Real Estate Management & Development: 0.30% | ||||||
18,140 | Marcus & Millichap, Inc.(a) | 243,439 | ||||
Total Common Stocks (Cost $57,427,885) | 79,380,156 | |||||
| Shares | Value (Note 2) | |||||
| ||||||
| SHORT TERM INVESTMENTS: 2.13% | ||||||
1,722,118 | Dreyfus Government Cash Management Fund - Institutional Class 0.010% (7-Day Yield) | $1,722,118 | ||||
Total Short Term Investments (Cost $ 1,722,118) | 1,722,118 | |||||
Total Investments: 100.18% (Cost $ 59,150,003) | 81,102,274 | |||||
Liabilities In Excess Of Other Assets: (0.18)% | (143,155) | |||||
| Net Assets: 100.00% | $80,959,119 | |||||
| (a) | Non-income producing security. |
Holdings are subject to change.
For Fund compliance purposes, the Fund’s industry classifications refer to any one or more of the industry sub-classifications used by one or more widely recognized market indexes or ratings group indexes, and/or as defined by Fund management. This definition may not apply for purposes of this report, which may combine industry sub- classifications for reporting ease. Industries are shown as a percentage of net assets.
See Notes to Financial Statements.
12 | www.emeraldmutualfunds.com |
| Emerald Growth Fund | Schedule of Investments | |
| October 31, 2013 (Unaudited) |
| Shares | Value (Note 2) | |||||
| ||||||
COMMON STOCKS: 95.16% | ||||||
| ||||||
Consumer Discretionary: 16.57% | ||||||
121,930 | Black Diamond, Inc.(a) | $1,817,976 | ||||
40,038 | Carmike Cinemas, Inc.(a) | 916,470 | ||||
29,419 | Chuy’s Holdings, Inc.(a) | 1,106,154 | ||||
22,790 | Control4 Corp.(a) | 374,895 | ||||
62,093 | Diversified Restaurant Holdings, Inc.(a) | 429,063 | ||||
95,320 | Fifth & Pacific Cos., Inc.(a) | 2,525,027 | ||||
41,499 | Five Below, Inc.(a) | 2,002,742 | ||||
90,300 | HomeAway, Inc.(a) | 2,677,395 | ||||
28,587 | Jack in the Box, Inc.(a) | 1,162,919 | ||||
17,919 | Lithia Motors, Inc., Class A | 1,126,209 | ||||
16,315 | Lumber Liquidators Holdings, Inc.(a) | 1,863,010 | ||||
36,969 | Meritage Homes Corp.(a) | 1,678,023 | ||||
87,041 | Multimedia Games Holding Co., Inc.(a) | 2,829,703 | ||||
36,075 | Penske Automotive Group, Inc. | 1,429,291 | ||||
29,728 | Red Robin Gourmet Burgers, Inc.(a) | 2,264,679 | ||||
12,544 | Restoration Hardware Holdings, Inc.(a) | 874,819 | ||||
99,633 | Sinclair Broadcast Group, Inc., Class A | 3,194,234 | ||||
75,296 | Standard Pacific Corp.(a) | 597,097 | ||||
62,549 | Taylor Morrison Home Corp., Class A(a) | 1,391,090 | ||||
93,358 | Tile Shop Holdings, Inc.(a) | 2,084,684 | ||||
47,382 | Tilly’s, Inc., Class A(a) | 689,882 | ||||
| 33,035,362 | ||||||
| ||||||
Energy: 6.38% | ||||||
74,039 | Diamondback Energy, Inc.(a) | 3,824,114 | ||||
24,750 | Goodrich Petroleum Corp.(a) | 578,902 | ||||
39,555 | Gulfport Energy Corp.(a) | 2,321,483 | ||||
418,943 | Magnum Hunter Resources Corp.(a) | 2,987,064 | ||||
108,373 | Rex Energy Corp.(a) | 2,330,020 | ||||
23,390 | Sanchez Energy Corp.(a) | 666,849 | ||||
| 12,708,432 | ||||||
| ||||||
Financial Services: 9.32% | ||||||
62,145 | Amtrust Financial Services, Inc. | 2,383,882 | ||||
74,562 | Bank of the Ozarks, Inc. | 3,689,328 | ||||
51,469 | Blackhawk Network Holdings, Inc.(a) | 1,176,581 | ||||
154,180 | CoBiz Financial, Inc. | 1,672,853 | ||||
70,030 | Customers Bancorp, Inc.(a) | 1,173,002 | ||||
34,616 | Evercore Partners, Inc., Class A | 1,747,070 | ||||
12,912 | Financial Engines, Inc. | 721,393 | ||||
71,394 | Glimcher Realty Trust, REIT | 731,789 | ||||
24,846 | Health Insurance Innovations, Inc., Class A(a) | 301,630 | ||||
118,203 | Howard Bancorp, Inc.(a) | 999,997 | ||||
45,359 | Pacific Premier Bancorp, Inc.(a) | 630,944 | ||||
35,001 | SVB Financial Group(a) | 3,352,396 | ||||
| 18,580,865 | ||||||
| ||||||
Health Care: 25.30% | ||||||
82,441 | Acadia Healthcare Co., Inc.(a) | 3,574,642 | ||||
20,255 | Aegerion Pharmaceuticals, Inc.(a) | 1,677,519 | ||||
| Shares | Value (Note 2) | |||||
| ||||||
Health Care (continued) | ||||||
189,931 | Akorn, Inc.(a) | $3,882,190 | ||||
57,845 | Alnylam Pharmaceuticals, Inc.(a) | 3,332,450 | ||||
94,052 | BIND Therapeutics, Inc.(a) | 1,231,141 | ||||
171,419 | Cambrex Corp.(a) | 2,883,268 | ||||
15,381 | Celldex Therapeutics, Inc.(a) | 352,379 | ||||
47,141 | Cepheid, Inc.(a) | 1,919,582 | ||||
40,730 | Cynosure, Inc., Class A(a) | 880,175 | ||||
39,180 | Greatbatch, Inc.(a) | 1,493,542 | ||||
58,267 | Insys Therapeutics, Inc.(a) | 2,324,271 | ||||
24,276 | Intercept Pharmaceuticals, Inc.(a) | 1,316,730 | ||||
55,910 | Intrexon Corp.(a) | 1,185,292 | ||||
58,977 | Isis Pharmaceuticals, Inc.(a) | 1,962,165 | ||||
9,930 | Jazz Pharmaceuticals PLC(a) | 901,048 | ||||
40,032 | LDR Holding Corp.(a) | 829,063 | ||||
59,365 | LipoScience, Inc.(a) | 294,450 | ||||
25,096 | MacroGenics, Inc.(a) | 676,086 | ||||
35,631 | MWI Veterinary Supply, Inc.(a) | 5,652,502 | ||||
115,187 | NanoString Technologies, Inc.(a) | 1,185,274 | ||||
183,153 | NPS Pharmaceuticals, Inc.(a) | 5,271,143 | ||||
38,934 | Omnicell, Inc.(a) | 898,207 | ||||
45,130 | Organovo Holdings, Inc.(a) | 328,095 | ||||
38,924 | Portola Pharmaceuticals, Inc.(a) | 862,167 | ||||
47,046 | Sarepta Therapeutics, Inc.(a) | 1,831,971 | ||||
12,570 | Surgical Care Affiliates, Inc.(a) | 329,962 | ||||
18,846 | Synageva BioPharma Corp.(a) | 957,377 | ||||
55,660 | Thoratec Corp.(a) | 2,403,955 | ||||
| 50,436,646 | ||||||
| ||||||
Materials & Processing: 5.85% | ||||||
19,080 | Acuity Brands, Inc. | 1,917,731 | ||||
31,853 | Apogee Enterprises, Inc. | 996,362 | ||||
61,577 | PolyOne Corp. | 1,865,783 | ||||
72,048 | Trex Co., Inc.(a) | 5,059,211 | ||||
66,875 | USG Corp.(a) | 1,826,356 | ||||
| 11,665,443 | ||||||
| ||||||
Producer Durables: 7.71% | ||||||
4,795 | Chart Industries, Inc.(a) | 515,319 | ||||
31,929 | FARO Technologies, Inc.(a) | 1,516,627 | ||||
57,811 | H&E Equipment Services, Inc.(a) | 1,447,009 | ||||
103,817 | Roadrunner Transportation Systems, Inc.(a) | 2,751,151 | ||||
101,353 | Spirit Airlines, Inc.(a) | 4,373,382 | ||||
12,292 | Middleby Corp.(a) | 2,798,274 | ||||
23,100 | WESCO International, Inc.(a) | 1,974,126 | ||||
| 15,375,888 | ||||||
| ||||||
Technology: 22.61% | ||||||
21,485 | 3D Systems Corp.(a) | 1,337,226 | ||||
83,940 | Applied Optoelectronics, Inc.(a) | 1,064,359 | ||||
101,140 | Aruba Networks, Inc.(a) | 1,897,386 | ||||
144,940 | Brightcove, Inc.(a) | 2,213,234 | ||||
| Semi-Annual Report | October 31, 2013 | 13 |
| Emerald Growth Fund | Schedule of Investments | |
| October 31, 2013 (Unaudited) |
| Shares | Value (Note 2) | |||||
| ||||||
Technology (continued) | ||||||
90,430 | CalAmp Corp.(a) | $2,127,818 | ||||
37,106 | Cavium, Inc.(a) | 1,495,743 | ||||
13,930 | ChannelAdvisor Corp.(a) | 485,600 | ||||
83,240 | Ciena Corp.(a) | 1,936,995 | ||||
24,698 | Cornerstone OnDemand, Inc.(a) | 1,169,944 | ||||
84,481 | EPAM Systems, Inc.(a) | 3,165,503 | ||||
15,040 | FireEye, Inc.(a) | 569,264 | ||||
42,805 | Gigamon, Inc.(a) | 1,317,538 | ||||
23,780 | Guidewire Software, Inc.(a) | 1,206,122 | ||||
24,710 | Imperva, Inc.(a) | 947,381 | ||||
85,568 | Infoblox, Inc.(a) | 3,803,498 | ||||
97,784 | Inphi Corp.(a) | 1,441,336 | ||||
25,549 | IPG Photonics Corp. | 1,693,132 | ||||
120,489 | Ixia, Inc.(a) | 1,708,534 | ||||
40,444 | Jive Software, Inc.(a) | 440,435 | ||||
44,510 | Methode Electronics, Inc. | 1,138,566 | ||||
19,815 | Microsemi Corp.(a) | 497,951 | ||||
114,860 | Neonode, Inc.(a) | 621,393 | ||||
53,852 | PDF Solutions, Inc.(a) | 1,236,980 | ||||
89,680 | Proofpoint, Inc.(a) | 2,837,475 | ||||
83,107 | Qlik Technologies, Inc.(a) | 2,105,931 | ||||
76,191 | Rally Software Development Corp.(a) | 2,044,205 | ||||
15,020 | RetailMeNot, Inc.(a) | 489,952 | ||||
125,261 | Saba Software, Inc.(a) | 1,453,028 | ||||
3,615 | Transact Technologies, Inc. | 49,851 | ||||
16,640 | Ultimate Software Group, Inc.(a) | 2,570,547 | ||||
| 45,066,927 | ||||||
| ||||||
Utilities: 1.42% | ||||||
246,297 | 8x8, Inc.(a) | 2,822,564 | ||||
| 2,822,564 | ||||||
Total Common Stocks (Cost $125,686,378) | 189,692,127 | |||||
| ||||||
WARRANTS: 0.00% | ||||||
41,894 | Magnum Hunter Resources Corp., Strike Price $8.50 | 0 | ||||
Total Warrants (Cost $0) | 0 | |||||
| Shares | Value (Note 2) | |||||
| ||||||
SHORT TERM INVESTMENTS: 3.45% | ||||||
6,877,646 | Dreyfus Government Cash Management Fund - Institutional Class | $6,877,646 | ||||
Total Short Term Investments (Cost $6,877,646) | 6,877,646 | |||||
Total Investments: 98.61% (excluding investments purchased with cash collateral from securities loaned) (Cost $132,564,024) | 196,569,773 | |||||
| ||||||
| INVESTMENTS PURCHASED WITH CASH COLLATERAL FROM SECURITIES LOANED: 0.01% | ||||||
22,051 | Short-Term Investments Trust, Liquid Assets Portfolio Institutional Class, | 22,051 | ||||
Total Investments Purchased with Cash Collateral From Securities Loaned (Cost $22,051) | 22,051 | |||||
Total Investments: 98.62% (Cost $132,586,075) | 196,591,824 | |||||
|
| |||||
Other Assets In Excess Of Liabilities: 1.38% | 2,748,122 | |||||
|
| |||||
Net Assets: 100.00% | $199,339,946 | |||||
| (a) | Non-income producing security. |
| (b) | Security, or portion of security, is currently on loan. |
| (c) | The security has been segregated to satisfy the commitment to return the cash collateral received in securities lending transactions upon the borrower’s return of the securities loaned. (Note 2). |
Holdings are subject to change.
For Fund compliance purposes, the Fund’s industry classifications refer to any one or more of the industry sub-classifications used by one or more widely recognized market indexes or ratings group indexes, and/or as defined by Fund management. This definition may not apply for purposes of this report, which may combine industry sub-classifications for reporting ease. Industries are shown as a percentage of net assets.
See Notes to Financial Statements.
14 | www.emeraldmutualfunds.com |
| Emerald Funds | Statements of Assets and Liabilities | |
October 31, 2013 (Unaudited) |
EMERALD FUND | EMERALD FUND | |||||||
ASSETS: | ||||||||
Investments, at value(a) | $ | 81,102,274 | $ | 196,591,824 | ||||
Cash | – | 17 | ||||||
Receivable for investments sold | 168,325 | 3,175,254 | ||||||
Receivable for shares sold | 52,162 | 259,701 | ||||||
Interest and dividends receivable | 42,638 | 10,102 | ||||||
Other assets | 23,349 | 33,635 | ||||||
|
|
|
| |||||
Total Assets | 81,388,748 | 200,070,533 | ||||||
|
|
|
| |||||
LIABILITIES: | ||||||||
Payable for investments purchased | 256,368 | 436,101 | ||||||
Payable for shares redeemed | 1,545 | 32,686 | ||||||
Payable for collateral upon return of securities loaned | – | 22,051 | ||||||
Investment advisory fees payable | 75,119 | 121,972 | ||||||
Payable to fund accounting and administration | 6,118 | 13,473 | ||||||
Payable for distribution and service fees | 44,923 | 50,955 | ||||||
Payable for trustee fees and expenses | 1,461 | 3,493 | ||||||
Payable for transfer agency fees | 16,815 | 8,972 | ||||||
Payable for chief compliance officer fee | 1,061 | 2,437 | ||||||
Payable for principal financial officer fee | 265 | 609 | ||||||
Payable for audit fee | 10,757 | 10,863 | ||||||
Accrued expenses and other liabilities | 15,197 | 26,975 | ||||||
|
|
|
| |||||
Total Liabilities | 429,629 | 730,587 | ||||||
|
|
|
| |||||
NET ASSETS | $ | 80,959,119 | $ | 199,339,946 | ||||
|
|
|
| |||||
NET ASSETS CONSIST OF: | ||||||||
Paid-in capital (Note 6) | $ | 67,932,281 | $ | 118,533,982 | ||||
Accumulated net investment loss | (181,647) | (1,158,255) | ||||||
Accumulated net realized gain/(loss) on investments | (8,743,786) | 17,958,470 | ||||||
Net unrealized appreciation on investments | 21,952,271 | 64,005,749 | ||||||
|
|
|
| |||||
NET ASSETS | $ | 80,959,119 | $ | 199,339,946 | ||||
|
|
|
| |||||
INVESTMENTS, AT COST | $ | 59,150,003 | $ | 132,586,075 | ||||
PRICING OF SHARES | ||||||||
Class A: (b) | ||||||||
Net Asset Value, offering and redemption price per share | $ | 23.89 | $ | 19.70 | ||||
Net Assets | $ | 37,353,562 | $ | 61,098,574 | ||||
Shares of beneficial interest outstanding | 1,563,639 | 3,101,362 | ||||||
Maximum offering price per share (NAV/.9525, based on maximum sales charge of | $ | 25.08 | $ | 20.68 | ||||
Class C: (b) | ||||||||
Net Asset Value, offering and redemption price per share | $ | 21.90 | $ | 17.71 | ||||
Net Assets | $ | 22,255,735 | $ | 8,478,976 | ||||
Shares of beneficial interest outstanding | 1,016,388 | 478,863 | ||||||
Institutional Class: | ||||||||
Net Asset Value, offering and redemption price per share | $ | 24.02 | $ | 20.06 | ||||
Net Assets | $ | 11,251,142 | $ | 120,309,725 | ||||
Shares of beneficial interest outstanding | 468,473 | 5,998,087 | ||||||
Investor Class: | ||||||||
Net Asset Value, offering and redemption price per share | $ | 22.88 | $ | 19.66 | ||||
Net Assets | $ | 10,098,680 | $ | 9,452,671 | ||||
Shares of beneficial interest outstanding | 441,368 | 480,732 | ||||||
| (a) | At October 31, 2013, securities with a market value of $- and $0, respectively, were on loan to brokers. |
| (b) | Redemption price per share may be reduced for any applicable contingent deferred sales charge. For a description of a possible sales charge, please see the Funds’ Prospectus. |
See Notes to Financial Statements.
| Semi-Annual Report | October 31, 2013 | 15 |
| Emerald Funds | Statements of Operations | |
| For the Six Months Ended October 31, 2013 (Unaudited) |
EMERALD FUND | EMERALD FUND | |||||||
INVESTMENT INCOME: | ||||||||
Dividends | $ | 493,218 | $ | 177,494 | ||||
Securities lending income | – | 34 | ||||||
|
|
|
| |||||
Total Investment Income | 493,218 | 177,528 | ||||||
|
|
|
| |||||
EXPENSES: | ||||||||
Investment advisory fee (Note 7) | 339,376 | 624,421 | ||||||
Recoupment of previously waived fees | 29,428 | – | ||||||
Administration fee | 32,252 | 75,009 | ||||||
Custodian fee | 3,636 | 10,006 | ||||||
Legal and audit fee | 9,542 | 10,728 | ||||||
Transfer agent fee | 46,469 | 32,776 | ||||||
Trustee fees and expenses | 1,387 | 3,409 | ||||||
Registration/filing fees | 20,677 | 20,580 | ||||||
Reports to shareholder and printing fees | 5,396 | 10,453 | ||||||
Distribution and service fees | ||||||||
Class A | 55,438 | 95,257 | ||||||
Class C | 101,421 | 32,144 | ||||||
Institutional Class | 1,263 | 21,027 | ||||||
Investor Class | 16,331 | 9,672 | ||||||
Chief compliance officer fee | 5,838 | 14,326 | ||||||
Principal financial officer fee | 1,459 | 3,582 | ||||||
Other | 4,952 | 8,691 | ||||||
|
|
|
| |||||
Total expenses before waiver | 674,865 | 972,081 | ||||||
Less fees waived/reimbursed by investment adviser (Note 7) | – | (27,196) | ||||||
|
|
|
| |||||
Total Net Expenses | 674,865 | 944,885 | ||||||
|
|
|
| |||||
NET INVESTMENT LOSS: | (181,647) | (767,357) | ||||||
|
|
|
| |||||
Net realized gain on investments | 2,476,830 | 12,678,756 | ||||||
Net change in unrealized appreciation on investments | 9,143,377 | 25,825,190 | ||||||
|
|
|
| |||||
NET REALIZED AND UNREALIZED GAIN ON INVESTMENTS | 11,620,207 | 38,503,946 | ||||||
|
|
|
| |||||
NET INCREASE IN NET ASSETS RESULTING FROM OPERATIONS | $ | 11,438,560 | $ | 37,736,589 | ||||
|
|
|
| |||||
See Notes to Financial Statements.
16 | www.emeraldmutualfunds.com |
| Emerald Banking and Finance Fund | Statements of Changes in Net Assets | |
| For the Six Months Ended October 31, 2013 (Unaudited) | Year Ended April 30, 2013 | For the Period January 1, 2012 to April 30, 2012 (a)(b) | ||||||||||
OPERATIONS: | ||||||||||||
Net investment loss | $ | (181,647) | $ | (119,902) | $ | (55,289) | ||||||
Net realized gain on investments | 2,476,830 | 5,057,984 | 377,708 | |||||||||
Net change in unrealized appreciation on investments | 9,143,377 | 2,441,099 | 3,624,786 | |||||||||
|
|
|
|
|
| |||||||
Net increase in net assets resulting from operations | 11,438,560 | 7,379,181 | 3,947,205 | |||||||||
|
|
|
|
|
| |||||||
SHARE TRANSACTIONS (NOTE 6): | ||||||||||||
Class A | ||||||||||||
Proceeds from sale of shares | 9,198,828 | 16,828,917 | 558,884 | |||||||||
Cost of shares redeemed | (2,771,514) | (16,569,563) | (1,955,508) | |||||||||
|
|
|
|
|
| |||||||
Net increase/(decrease) from share transactions | 6,427,314 | 259,354 | (1,396,624) | |||||||||
|
|
|
|
|
| |||||||
Class C | ||||||||||||
Proceeds from sale of shares | 2,250,935 | 3,125,343 | 289,945 | |||||||||
Cost of shares redeemed | (1,088,372) | (2,586,830) | (833,416) | |||||||||
|
|
|
|
|
| |||||||
Net increase/(decrease) from share transactions | 1,162,563 | 538,513 | (543,471) | |||||||||
|
|
|
|
|
| |||||||
Institutional Class | ||||||||||||
Proceeds from sale of shares | 5,905,499 | 4,004,050 | 7,500 | |||||||||
Cost of shares redeemed | (223,022) | (26,445) | – | |||||||||
|
|
|
|
|
| |||||||
Net increase from share transactions | 5,682,477 | 3,977,605 | 7,500 | |||||||||
|
|
|
|
|
| |||||||
Investor Class | ||||||||||||
Proceeds from sale of shares | 2,979,799 | 4,980,596 | 553,960 | |||||||||
Cost of shares redeemed | (508,318) | (111,720) | (38,595) | |||||||||
|
|
|
|
|
| |||||||
Net increase from share transactions | 2,471,481 | 4,868,876 | 515,365 | |||||||||
|
|
|
|
|
| |||||||
Net increase in net assets | $ | 27,182,395 | $ | 17,023,529 | $ | 2,529,975 | ||||||
|
|
|
|
|
| |||||||
NET ASSETS: | ||||||||||||
Beginning of period | 53,776,724 | 36,753,195 | 34,223,220 | |||||||||
|
|
|
|
|
| |||||||
End of period (including accumulated net investment income/(loss) of $(181,647), $0 and $0, respectively) | $ | 80,959,119 | $ | 53,776,724 | $ | 36,753,195 | ||||||
|
|
|
|
|
| |||||||
Other Information: | ||||||||||||
SHARE TRANSACTIONS: | ||||||||||||
Class A | ||||||||||||
Sold | 420,526 | 900,183 | 34,567 | |||||||||
Redeemed | (126,802) | (889,933) | (121,170) | |||||||||
|
|
|
|
|
| |||||||
Net increase/(decrease) in shares outstanding | 293,724 | 10,250 | (86,603) | |||||||||
|
|
|
|
|
| |||||||
Class C | ||||||||||||
Sold | 110,408 | 179,911 | 19,157 | |||||||||
Redeemed | (52,936) | (156,661) | (55,919) | |||||||||
|
|
|
|
|
| |||||||
Net increase/(decrease) in shares outstanding | 57,472 | 23,250 | (36,762) | |||||||||
|
|
|
|
|
| |||||||
Institutional Class | ||||||||||||
Sold | 263,979 | 215,452 | 445 | |||||||||
Redeemed | (9,991) | (1,412) | – | |||||||||
|
|
|
|
|
| |||||||
Net increase in shares outstanding | 253,988 | 214,040 | 445 | |||||||||
|
|
|
|
|
| |||||||
Investor Class | ||||||||||||
Sold | 140,246 | 289,184 | 35,715 | |||||||||
Redeemed | (24,173) | (6,528) | (2,485) | |||||||||
|
|
|
|
|
| |||||||
Net increase in shares outstanding | 116,073 | 282,656 | 33,230 | |||||||||
|
|
|
|
|
| |||||||
| (a) | The Fund began offering Institutional Class shares on March 16, 2012. |
| (b) | Effective March 13, 2012, the Board approved changing the fiscal year-end of the Fund from December 31 to April 30. |
See Notes to Financial Statements.
| Semi-Annual Report | October 31, 2013 | 17 |
| Emerald Growth Fund | Statements of Changes in Net Assets | |
| For the Six Months Ended October 31, 2013 (Unaudited) | Year Ended April 30, 2013 | For the Period January 1, 2012 to April 30, 2012 (a) | ||||||||||
OPERATIONS: | ||||||||||||
Net investment loss | $ | (767,357) | $ | (1,027,711) | $ | (343,635) | ||||||
Net realized gain on investments | 12,678,756 | 11,995,509 | 4,975,489 | |||||||||
Net change in unrealized appreciation on investments | 25,825,190 | 148,175 | 17,806,862 | |||||||||
|
|
|
|
|
| |||||||
Net increase in net assets resulting from operations | 37,736,589 | 11,115,973 | 22,438,716 | |||||||||
|
|
|
|
|
| |||||||
DISTRIBUTIONS TO SHAREHOLDERS (NOTE 4): | ||||||||||||
From net realized gains on investments | ||||||||||||
Class A | – | (4,685,787) | – | |||||||||
Class C | – | (490,319) | – | |||||||||
Institutional Class | – | (8,763,223) | – | |||||||||
Investor Class | – | (164,347) | – | |||||||||
|
|
|
|
|
| |||||||
Net decrease in net assets from distributions | – | (14,103,676) | – | |||||||||
|
|
|
|
|
| |||||||
SHARE TRANSACTIONS (NOTE 6): | ||||||||||||
Class A | ||||||||||||
Proceeds from sale of shares | 5,373,985 | 8,448,904 | 1,322,264 | |||||||||
Issued to shareholders in reinvestment of distributions | – | 4,124,748 | – | |||||||||
Cost of shares redeemed | (3,264,967) | (7,040,533) | (4,049,586) | |||||||||
|
|
|
|
|
| |||||||
Net increase/(decrease) from share transactions | 2,109,018 | 5,533,119 | (2,727,322) | |||||||||
|
|
|
|
|
| |||||||
Class C | ||||||||||||
Proceeds from sale of shares | 2,363,057 | 2,232,832 | 160,186 | |||||||||
Issued to shareholders in reinvestment of distributions | – | 398,442 | – | |||||||||
Cost of shares redeemed | (222,623) | (635,817) | (440,586) | |||||||||
|
|
|
|
|
| |||||||
Net increase/(decrease) from share transactions | 2,140,434 | 1,995,457 | (280,400) | |||||||||
|
|
|
|
|
| |||||||
Institutional Class | ||||||||||||
Proceeds from sale of shares | 17,703,830 | 11,472,743 | 6,741,602 | |||||||||
Issued to shareholders in reinvestment of distributions | – | 8,744,099 | – | |||||||||
Cost of shares redeemed | (6,584,448) | (15,124,866) | (2,499,170) | |||||||||
|
|
|
|
|
| |||||||
Net increase from share transactions | 11,119,382 | 5,091,976 | 4,242,432 | |||||||||
|
|
|
|
|
| |||||||
Investor Class | ||||||||||||
Proceeds from sale of shares | 6,782,815 | 773,551 | 24,856 | |||||||||
Issued to shareholders in reinvestment of distributions | – | 164,347 | – | |||||||||
Cost of shares redeemed | (179,673) | (190,984) | (6,289) | |||||||||
|
|
|
|
|
| |||||||
Net increase from share transactions | 6,603,142 | 746,914 | 18,567 | |||||||||
|
|
|
|
|
| |||||||
Net increase in net assets | $ | 59,708,565 | $ | 10,379,763 | $ | 23,691,993 | ||||||
|
|
|
|
|
| |||||||
NET ASSETS: | ||||||||||||
Beginning of period | 139,631,381 | 129,251,618 | 105,559,625 | |||||||||
|
|
|
|
|
| |||||||
End of period (including accumulated net investment income/(loss) of $(1,158,255), $(390,898) and $0, respectively) | $ | 199,339,946 | $ | 139,631,381 | $ | 129,251,618 | ||||||
|
|
|
|
|
| |||||||
18 | www.emeraldmutualfunds.com |
| Emerald Growth Fund | Statements of Changes in Net Assets | |
| For the Six Months Ended October 31, 2013 (Unaudited) | Year Ended April 30, 2013 | For the Period January 1, 2012 to April 30, 2012 (a) | ||||||||||
Other Information: | ||||||||||||
SHARE TRANSACTIONS: | ||||||||||||
Class A | ||||||||||||
Sold | 294,716 | 563,949 | 86,928 | |||||||||
Distributions reinvested | – | 297,172 | – | |||||||||
Redeemed | (180,928) | (465,853) | (263,330) | |||||||||
|
|
|
|
|
| |||||||
Net increase/(decrease) in shares outstanding | 113,788 | 395,268 | (176,402) | |||||||||
|
|
|
|
|
| |||||||
Class C | ||||||||||||
Sold | 141,071 | 163,382 | 10,962 | |||||||||
Distributions reinvested | – | 31,748 | – | |||||||||
Redeemed | (13,745) | (46,882) | (30,490) | |||||||||
|
|
|
|
|
| |||||||
Net increase/(decrease) in shares outstanding | 127,326 | 148,248 | (19,528) | |||||||||
|
|
|
|
|
| |||||||
Institutional Class | ||||||||||||
Sold | 918,656 | 745,549 | 428,209 | |||||||||
Distributions reinvested | – | 620,149 | – | |||||||||
Redeemed | (358,557) | (1,001,795) | (160,803) | |||||||||
|
|
|
|
|
| |||||||
Net increase in shares outstanding | 560,099 | 363,903 | 267,406 | |||||||||
|
|
|
|
|
| |||||||
Investor Class | ||||||||||||
Sold | 371,776 | 51,913 | 1,619 | |||||||||
Distributions reinvested | – | 11,857 | – | |||||||||
Redeemed | (9,376) | (12,514) | (400) | |||||||||
|
|
|
|
|
| |||||||
Net increase in shares outstanding | 362,400 | 51,256 | 1,219 | |||||||||
|
|
|
|
|
| |||||||
| (a) | Effective March 13, 2012, the Board approved changing the fiscal year-end of the Fund from December 31 to April 30. |
See Notes to Financial Statements.
| Semi-Annual Report | October 31, 2013 | 19 |
| Emerald Banking and Finance Fund | Financial Highlights | |
| For a share outstanding throughout the periods presented |
| CLASS A | ||||||||||||||||||||||||||||
For the Six Months Ended October 31, 2013 | Year Ended April 30, 2013 | For the Period 2012 to April 30, | Year Ended December 31, 2011 | Year Ended December 31, 2010 | Year Ended December 31, 2009 | Year Ended December 31, 2008 (c) | ||||||||||||||||||||||
NET ASSET VALUE, BEGINNING OF PERIOD | $ | 20.08 | $ | 16.96 | $ | 15.16 | $ | 15.89 | $ | 13.62 | $ | 15.39 | $ | 19.61 | ||||||||||||||
INCOME/(LOSS) FROM OPERATIONS: (d) | ||||||||||||||||||||||||||||
Net investment income/(loss) | (0.04) | (e) | (0.01) | (e) | (0.01) | (e) | (0.03) | (e) | (0.04) | 0.02(e) | 0.08 | |||||||||||||||||
Net realized and unrealized gain/(loss) on investments | 3.85 | 3.13 | 1.81 | (0.70) | 2.31 | (1.76) | (4.28) | |||||||||||||||||||||
|
|
|
|
|
|
|
|
|
|
|
|
|
| |||||||||||||||
Total from Investment Operations | 3.81 | 3.12 | 1.80 | (0.73) | 2.27 | (1.74) | (4.20) | |||||||||||||||||||||
|
|
|
|
|
|
|
|
|
|
|
|
|
| |||||||||||||||
LESS DISTRIBUTIONS: | ||||||||||||||||||||||||||||
From investment income | – | – | – | – | – | (0.03) | (0.02) | |||||||||||||||||||||
|
|
|
|
|
|
|
|
|
|
|
|
|
| |||||||||||||||
Total Distributions | – | – | – | – | – | (0.03) | (0.02) | |||||||||||||||||||||
|
|
|
|
|
|
|
|
|
|
|
|
|
| |||||||||||||||
NET INCREASE/(DECREASE) IN NET ASSET VALUE | 3.81 | 3.12 | 1.80 | (0.73) | 2.27 | (1.77) | (4.22) | |||||||||||||||||||||
|
|
|
|
|
|
|
|
|
|
|
|
|
| |||||||||||||||
NET ASSET VALUE, END OF PERIOD | $ | 23.89 | $ | 20.08 | $ | 16.96 | $ | 15.16 | $ | 15.89 | $ | 13.62 | $ | 15.39 | ||||||||||||||
|
|
|
|
|
|
|
|
|
|
|
|
|
| |||||||||||||||
TOTAL RETURN(f) | 18.97 | %(g) | 18.40 | % | 11.87 | %(g) | (4.59) | % | 16.67 | % | (11.29) | % | (21.41) | % | ||||||||||||||
RATIOS/SUPPLEMENTAL DATA: | ||||||||||||||||||||||||||||
Net Assets, End of Period (000s) | $ | 37,354 | $ | 25,496 | $ | 21,363 | $ | 20,412 | $ | 26,756 | $ | 22,675 | $ | 48,460 | ||||||||||||||
RATIOS TO AVERAGE NET ASSETS: | ||||||||||||||||||||||||||||
Net Investment income/(loss) | (0.38) | %(h) | (0.06) | % | (0.24) | %(h) | (0.22) | % | (0.22) | % | 0.15 | % | 0.36 | % | ||||||||||||||
Operating expenses excluding reimbursement/waiver | 1.84 | %(h) | 1.88 | % | 1.96 | %(h) | 1.90 | % | 1.95 | % | 1.88 | % | 1.65 | % | ||||||||||||||
Operating expenses including reimbursement/ | 1.84 | %(h) | 1.84 | % | 1.85 | %(h) | n/a | n/a | n/a | n/a | ||||||||||||||||||
PORTFOLIO TURNOVER RATE | 17 | %(g) | 53 | % | 9 | %(g) | 27 | % | 48 | % | 43 | % | 61 | % | ||||||||||||||
| (a) | Prior to its March 16, 2012 reorganization with and into the Emerald Banking and Finance Fund, the Fund was known as the Forward Banking and Finance Fund. |
| (b) | Effective March 13, 2012 the Board approved changing the fiscal year-end of the Fund from December 31 to April 30. |
| (c) | Prior to May 1, 2008, the Forward Banking and Finance Fund was known as the Forward Emerald Banking and Finance Fund. |
| (d) | The amount shown for a share outstanding throughout the period may not correlate with the Statement of Operations for the period due to the timing of sales and redemptions of Fund shares in relation to income earned and/or fluctuating market value of the investments of the Fund. |
| (e) | Per share amounts are based upon average shares outstanding. |
| (f) | Total return does not reflect the effect of sales charges. |
| (g) | Not Annualized. |
| (h) | Annualized. |
See Notes to Financial Statements.
20 | www.emeraldmutualfunds.com |
| Emerald Banking and Finance Fund | Financial Highlights | |
| For a share outstanding throughout the periods presented |
| CLASS C | ||||||||||||||||||||||||||||
For the Six Months October 31, (Unaudited) | Year Ended April 30, 2013 | For the Period January 1, 2012 to April 30, 2012 (a)(b) | Year Ended December 31, 2011 | Year Ended December 31, 2010 | Year Ended December 31, 2009 | Year Ended December 31, 2008 (c) | ||||||||||||||||||||||
NET ASSET VALUE, BEGINNING OF PERIOD | $ | 18.46 | $ | 15.70 | $ | 14.06 | $ | 14.82 | $ | 12.77 | $ | 14.52 | $ | 18.60 | ||||||||||||||
INCOME/(LOSS) FROM OPERATIONS: (d) | ||||||||||||||||||||||||||||
Net investment loss | (0.11)(e) | (0.11)(e) | (0.04)(e) | (0.11)(e) | (0.18) | (0.19) | (0.19) | |||||||||||||||||||||
Net realized and unrealized gain/(loss) on investments | 3.55 | 2.87 | 1.68 | (0.65) | 2.23 | (1.56) | (3.89) | |||||||||||||||||||||
|
|
|
|
|
|
|
|
|
|
|
|
|
| |||||||||||||||
Total from Investment Operations | 3.44 | 2.76 | 1.64 | (0.76) | 2.05 | (1.75) | (4.08) | |||||||||||||||||||||
|
|
|
|
|
|
|
|
|
|
|
|
|
| |||||||||||||||
NET INCREASE/(DECREASE) IN NET ASSET VALUE | 3.44 | 2.76 | 1.64 | (0.76) | 2.05 | (1.75) | (4.08) | |||||||||||||||||||||
|
|
|
|
|
|
|
|
|
|
|
|
|
| |||||||||||||||
NET ASSET VALUE, END OF PERIOD | $ | 21.90 | $ | 18.46 | $ | 15.70 | $ | 14.06 | $ | 14.82 | $ | 12.77 | $ | 14.52 | ||||||||||||||
|
|
|
|
|
|
|
|
|
|
|
|
|
| |||||||||||||||
TOTAL RETURN(f) | 18.63 | %(g) | 17.58 | % | 11.66 | %(g) | (5.13) | % | 16.05 | % | (12.05) | % | (21.94) | % | ||||||||||||||
RATIOS/SUPPLEMENTAL DATA: | ||||||||||||||||||||||||||||
Net Assets, End of Period (000s) | $ | 22,256 | $ | 17,705 | $ | 14,690 | $ | 13,675 | $ | 17,872 | $ | 16,907 | $ | 23,486 | ||||||||||||||
RATIOS TO AVERAGE NET ASSETS: | ||||||||||||||||||||||||||||
Net Investment loss | (1.03) | %(h) | (0.68) | % | (0.82) | %(h) | (0.77) | % | (0.77) | % | (0.47) | % | (0.30) | % | ||||||||||||||
Operating expenses excluding reimbursement/ | 2 .49 | %(h) | 2 .54 | % | 2 .55 | %(h) | 2 .45 | % | 2 .50 | % | 2 .49 | % | 2 .30 | % | ||||||||||||||
Operating expenses including reimbursement/waiver | 2 .49 | %(h) | 2 .49 | % | 2 .44 | %(h) | n/a | n/a | n/a | n/a | ||||||||||||||||||
PORTFOLIO TURNOVER RATE | 17 | %(g) | 53 | % | 9 | %(g) | 27 | % | 48 | % | 43 | % | 61 | % | ||||||||||||||
| (a) | Prior to its March 16, 2012 reorganization with and into the Emerald Banking and Finance Fund, the Fund was known as the Forward Banking and Finance Fund. |
| (b) | Effective March 13, 2012 the Board approved changing the fiscal year-end of the Fund from December 31 to April 30. |
| (c) | Prior to May 1, 2008, the Forward Banking and Finance Fund was known as the Forward Emerald Banking and Finance Fund. |
| (d) | The amount shown for a share outstanding throughout the period may not correlate with the Statement of Operations for the period due to the timing of sales and redemptions of Fund shares in relation to income earned and/or fluctuating market value of the investments of the Fund. |
| (e) | Per share amounts are based upon average shares outstanding. |
| (f) | Total return does not reflect the effect of sales charges. |
| (g) | Not Annualized. |
| (h) | Annualized. |
See Notes to Financial Statements.
| Semi-Annual Report | October 31, 2013 | 21 |
| Emerald Banking and Finance Fund | Financial Highlights | |
| For a share outstanding throughout the periods presented |
| INSTITUTIONAL CLASS | ||||||||||||
For the Six Months Ended October 31, 2013 (Unaudited) | Year Ended April 30, 2013 | For the Period March 16, 2012 to April 30, 2012 (a) | ||||||||||
NET ASSET VALUE, BEGINNING OF PERIOD | $ | 20.15 | $ | 16.96 | $ | 16.85 | ||||||
INCOME/(LOSS) FROM OPERATIONS: | ||||||||||||
Net investment income/(loss)(b) | (0.00) | (c) | 0.01 | (0.01) | ||||||||
Net realized and unrealized gain on investments | 3.87 | 3.18 | 0.12 | |||||||||
|
|
|
|
|
| |||||||
Total from Investment Operations | 3.87 | 3.19 | 0.11 | |||||||||
|
|
|
|
|
| |||||||
NET INCREASE IN NET ASSET VALUE | 3.87 | 3.19 | 0.11 | |||||||||
|
|
|
|
|
| |||||||
NET ASSET VALUE, END OF PERIOD | $ | 24.02 | $ | 20.15 | $ | 16.96 | ||||||
|
|
|
|
|
| |||||||
TOTAL RETURN | 19.21% | (d) | 18.81 | % | 0.65% | (d) | ||||||
RATIOS/SUPPLEMENTAL DATA: | ||||||||||||
Net Assets, End of Period (000s) | $ | 11,251 | $ | 4,321 | $ | 8 | ||||||
RATIOS TO AVERAGE NET ASSETS: | ||||||||||||
Net Investment income/(loss) | (0.01)% | (e) | 0.06 | % | (0.27)% | (e) | ||||||
Operating expenses excluding reimbursement/waiver | 1.44% | (e) | 1.62 | % | 1.83% | (e) | ||||||
Operating expenses including reimbursement/waiver | 1.44% | (e) | 1.54 | % | 1.53% | (e) | ||||||
PORTFOLIO TURNOVER RATE | 17 % | (d) | 53 | % | 9%(d) | (f) | ||||||
| (a) | The Fund began offering Institutional Class shares on March 16, 2012. |
| (b) | Per share amounts are based upon average shares outstanding. |
| (c) | Less than $0.005 per share. |
| (d) | Not Annualized. |
| (e) | Annualized. |
| (f) | Portfolio turnover rate is calculated at the Fund level and represents the period ended April 30, 2012. |
See Notes to Financial Statements.
22 | www.emeraldmutualfunds.com |
| Emerald Banking and Finance Fund | Financial Highlights | |
| For a share outstanding throughout the periods presented |
| INVESTOR CLASS | ||||||||||||||||||||
| For the Six Months Ended October 31, 2013 (Unaudited) | Year Ended April 30, 2013 | For the Period January 1, 2012 to April 30, 2012 (a)(b) | Year Ended December 31, 2011 | Period Ended December 31, 2010 (c) | ||||||||||||||||
NET ASSET VALUE, BEGINNING OF PERIOD | $ | 19.23 | $ | 16.25 | $ | 14.50 | $ | 15.14 | $ | 14.85 | ||||||||||
INCOME/(LOSS) FROM OPERATIONS:(d) | ||||||||||||||||||||
Net investment income/(loss)(e) | (0.04) | (0.01) | (0.00) | (f) | 0.07 | (0.02) | ||||||||||||||
Net realized and unrealized gain/(loss) on investments | 3.69 | 2.99 | 1.75 | (0.71) | 0.31 | |||||||||||||||
|
|
|
|
|
|
|
|
|
| |||||||||||
Total from Investment Operations | 3.65 | 2.98 | 1.75 | (0.64) | 0.29 | |||||||||||||||
|
|
|
|
|
|
|
|
|
| |||||||||||
NET INCREASE/(DECREASE) IN NET ASSET VALUE | 3.65 | 2.98 | 1.75 | (0.64) | 0.29 | |||||||||||||||
|
|
|
|
|
|
|
|
|
| |||||||||||
NET ASSET VALUE, END OF PERIOD | $ | 22.88 | $ | 19.23 | $ | 16.25 | $ | 14.50 | $ | 15.14 | ||||||||||
|
|
|
|
|
|
|
|
|
| |||||||||||
TOTAL RETURN | 18.98% | (g) | 18.34 | % | 12.07% | (g) | (4.23) | % | 1.95% | (g) | ||||||||||
RATIOS/SUPPLEMENTAL DATA: | ||||||||||||||||||||
Net Assets, End of Period (000s) | $ | 10,099 | $ | 6,255 | $ | 693 | $ | 136 | $ | 4 | ||||||||||
RATIOS TO AVERAGE NET ASSETS: | ||||||||||||||||||||
Net Investment income/(loss) | (0.39)% | (h) | (0.08) | % | (0.07)% | (h) | 0.47 | % | (0.20)% | (h) | ||||||||||
Operating expenses excluding reimbursement/waiver | 1.84% | (h) | 1.94 | % | 1.88% | (h) | 1.48 | % | 1.83% | (h) | ||||||||||
Operating expenses including reimbursement/waiver | 1.84% | (h) | 1.89 | % | 1.72% | (h) | n/ | a | n/ | a | ||||||||||
PORTFOLIO TURNOVER RATE | 17 % | (g) | 53 | % | 9% | (g) | 27 | % | 48 % | (i) | ||||||||||
| (a) | Prior to its March 16, 2012 reorganization with and into the Emerald Banking and Finance Fund, the Fund was known as the Forward Banking and Finance Fund. |
| (b) | Effective March 13, 2012 the Board approved changing the fiscal year-end of the Fund from December 31 to April 30. |
| (c) | The Fund began offering Investor Class shares on March 16, 2010. |
| (d) | The amount shown for a share outstanding throughout the period may not correlate with the Statement of Operations for the period due to the timing of sales and redemptions of Fund shares in relation to income earned and/or fluctuating market value of the investments of the Fund. |
| (e) | Per share amounts are based upon average shares outstanding. |
| (f) | Less than $0.005 per share. |
| (g) | Not Annualized. |
| (h) | Annualized. |
| (i) | Portfolio turnover rate is calculated at the Fund level and represents the year ended December 31, 2010. |
See Notes to Financial Statements.
| Semi-Annual Report | October 31, 2013 | 23 |
| Emerald Growth Fund | Financial Highlights | |
| For a share outstanding throughout the periods presented |
| CLASS A | ||||||||||||||||||||||||||||
| For the Six Months Ended October 31, 2013 (Unaudited) | Year Ended April 30, 2013 | For the April 30, 2012 (a)(b) | Year Ended | Year Ended | Year Ended | Year Ended | ||||||||||||||||||||||
NET ASSET VALUE, BEGINNING OF PERIOD | $ | 15.60 | $ | 16.20 | $ | 13.37 | $ | 13.57 | $ | 10.63 | $ | 7.99 | $ | 12.73 | ||||||||||||||
INCOME/(LOSS) FROM OPERATIONS: | ||||||||||||||||||||||||||||
Net investment loss | (0.10) | (d) | (0.15) | (d) | (0.05) | (d) | (0.14) | (d) | (0.12) | (0.11) | (0.11) | |||||||||||||||||
Net realized and unrealized gain/(loss) on investments | 4.20 | 1.40 | 2.88 | (0.06) | 3.06 | 2.75 | (4.59) | |||||||||||||||||||||
|
|
|
|
|
|
|
|
|
|
|
|
|
| |||||||||||||||
Total from Investment Operations | 4.10 | 1.25 | 2.83 | (0.20) | 2.94 | 2.64 | (4.70) | |||||||||||||||||||||
|
|
|
|
|
|
|
|
|
|
|
|
|
| |||||||||||||||
LESS DISTRIBUTIONS: | ||||||||||||||||||||||||||||
From capital gains | – | (1.85) | – | – | – | – | (0.04) | |||||||||||||||||||||
|
|
|
|
|
|
|
|
|
|
|
|
|
| |||||||||||||||
Total Distributions | – | (1.85) | – | – | – | – | (0.04) | |||||||||||||||||||||
|
|
|
|
|
|
|
|
|
|
|
|
|
| |||||||||||||||
NET INCREASE/(DECREASE) IN NET ASSET VALUE | 4.10 | (0.60) | 2.83 | (0.20) | 2.94 | 2.64 | (4.74) | |||||||||||||||||||||
|
|
|
|
|
|
|
|
|
|
|
|
|
| |||||||||||||||
NET ASSET VALUE, END OF PERIOD | $ | 19.70 | $ | 15.60 | $ | 16.20 | $ | 13.37 | $ | 13.57 | $ | 10.63 | $ | 7.99 | ||||||||||||||
|
|
|
|
|
|
|
|
|
|
|
|
|
| |||||||||||||||
TOTAL RETURN(e) | 26.28% | (f) | 9.14 | % | 21.17% | (f) | (1.47) | % | 27.66 | % | 33.04 | % | (36.91) | % | ||||||||||||||
RATIOS/SUPPLEMENTAL DATA: | ||||||||||||||||||||||||||||
Net Assets, End of Period (000s) | $ | 61,099 | $ | 46,605 | $ | 41,991 | $ | 37,008 | $ | 46,785 | $ | 51,177 | $ | 92,675 | ||||||||||||||
RATIOS TO AVERAGE NET ASSETS: | ||||||||||||||||||||||||||||
Net Investment loss | (1.08)% | (g) | (1.01) | % | (1.02)% | (g) | (1.03) | % | (0.85) | % | (1.03) | % | (0.95) | % | ||||||||||||||
Operating expenses excluding reimbursement/waiver | 1.33% | (g) | 1.38 | % | 1.36% | (g) | 1.36 | % | 1.41 | % | 1.38 | % | 1.35 | % | ||||||||||||||
Operating expenses including reimbursement/waiver | 1.29% | (g) | 1.29 | % | 1.29% | (g) | 1.29 | % | 1.29 | % | 1.29% | (h) | n/ | a | ||||||||||||||
PORTFOLIO TURNOVER RATE | 43% | (f) | 78 | % | 28% | (f) | 75 | % | 78 | % | 113 | % | 108 | % | ||||||||||||||
| (a) | Prior to its March 16, 2012 reorganization with and into the Emerald Growth Fund, the Fund was known as the Forward Growth Fund. |
| (b) | Effective March 13, 2012 the Board approved changing the fiscal year-end of the Fund from December 31 to April 30. |
| (c) | Prior to May 1, 2008, the Forward Growth Fund was known as the Forward Emerald Growth Fund. |
| (d) | Per share amounts are based upon average shares outstanding. |
| (e) | Total return does not reflect the effect of sales charges. |
| (f) | Not Annualized. |
| (g) | Annualized. |
| (h) | Effective January 1, 2009, the Advisor agreed to limit expenses at 1.29%. |
See Notes to Financial Statements.
24 | www.emeraldmutualfunds.com |
| Emerald Growth Fund | Financial Highlights | |
| For a share outstanding throughout the periods presented |
| CLASS C | ||||||||||||||||||||||||||||
| For the Six Months Ended October 31, 2013 (Unaudited) | Year | For the Period April 30, | Year Ended | Year Ended | Year Ended | Year Ended | ||||||||||||||||||||||
NET ASSET VALUE, BEGINNING OF PERIOD | $ | 14.07 | $ | 14.89 | $ | 12.31 | $ | 12.58 | $ | 9.92 | $ | 7.49 | $ | 12.03 | ||||||||||||||
INCOME/(LOSS) FROM OPERATIONS: | ||||||||||||||||||||||||||||
Net investment loss | (0.14) | (d) | (0.23) | (d) | (0.08) | (d) | (0.22) | (d) | (0.03) | (0.36) | (0.48) | |||||||||||||||||
Net realized and unrealized gain/(loss) on investments | 3.78 | 1.26 | 2.66 | (0.05) | 2.69 | 2.79 | (4.02) | |||||||||||||||||||||
|
|
|
|
|
|
|
|
|
|
|
|
|
| |||||||||||||||
Total from Investment Operations | 3.64 | 1.03 | 2.58 | (0.27) | 2.66 | 2.43 | (4.50) | |||||||||||||||||||||
|
|
|
|
|
|
|
|
|
|
|
|
|
| |||||||||||||||
LESS DISTRIBUTIONS: | ||||||||||||||||||||||||||||
From capital gains | – | (1.85) | – | – | – | – | (0.04) | |||||||||||||||||||||
|
|
|
|
|
|
|
|
|
|
|
|
|
| |||||||||||||||
Total Distributions | – | (1.85) | – | – | – | – | (0.04) | |||||||||||||||||||||
|
|
|
|
|
|
|
|
|
|
|
|
|
| |||||||||||||||
NET INCREASE/(DECREASE) INNET ASSET VALUE | 3.64 | (0.82) | 2.58 | (0.27) | 2.66 | 2.43 | (4.54) | |||||||||||||||||||||
|
|
|
|
|
|
|
|
|
|
|
|
|
| |||||||||||||||
NET ASSET VALUE, END OF PERIOD | $ | 17.71 | $ | 14.07 | $ | 14.89 | $ | 12.31 | $ | 12.58 | $ | 9.92 | $ | 7.49 | ||||||||||||||
|
|
|
|
|
|
|
|
|
|
|
|
|
| |||||||||||||||
TOTAL RETURN(e) | 25.87% | (f) | 8.43 | % | 20.96% | (f) | (2.15) | % | 26.81 | % | 32.44 | % | (37.40) | % | ||||||||||||||
RATIOS/SUPPLEMENTAL DATA: | ||||||||||||||||||||||||||||
Net Assets, End of Period (000s) | $ | 8,479 | $ | 4,946 | $ | 3,026 | $ | 2,743 | $ | 2,812 | $ | 2,555 | $ | 2,623 | ||||||||||||||
RATIOS TO AVERAGE NET ASSETS: | ||||||||||||||||||||||||||||
Net Investment loss | (1.73)% | (g) | (1.65) | % | (1.67)% | (g) | (1.68) | % | (1.48) | % | (1.68) | % | (1.65) | % | ||||||||||||||
Operating expenses excluding reimbursement/waiver | 1.98% | (g) | 2.03 | % | 2.01% | (g) | 2.01 | % | 2.06 | % | 2.04 | % | 2.04 | % | ||||||||||||||
Operating expenses including reimbursement/waiver | 1.94% | (g) | 1.94 | % | 1.94% | (g) | 1.94 | % | 1.94 | % | 1.94% | (h) | n/ | a | ||||||||||||||
PORTFOLIO TURNOVER RATE | 43% | (f) | 78 | % | 28% | (f) | 75 | % | 78 | % | 113 | % | 108 | % | ||||||||||||||
| (a) | Prior to its March 16, 2012 reorganization with and into the Emerald Growth Fund, the Fund was known as the Forward Growth Fund. |
| (b) | Effective March 13, 2012 the Board approved changing the fiscal year-end of the Fund from December 31 to April 30. |
| (c) | Prior to May 1, 2008, the Forward Growth Fund was known as the Forward Emerald Growth Fund. |
| (d) | Per share amounts are based upon average shares outstanding. |
| (e) | Total return does not reflect the effect of sales charges. |
| (f) | Not Annualized. |
| (g) | Annualized. |
| (h) | Effective January 1, 2009, the Advisor agreed to limit expenses at 1.94%. |
See Notes to Financial Statements.
| Semi-Annual Report | October 31, 2013 | 25 |
| Emerald Growth Fund | Financial Highlights | |
| For a share outstanding throughout the periods presented |
| INSTITUTIONAL CLASS | ||||||||||||||||||||||||||||
For the Six Months | Year Ended | For the Period April 30, | Year Ended | Year Ended | Year Ended | Period Ended | ||||||||||||||||||||||
NET ASSET VALUE, BEGINNING OF PERIOD | $ | 15.86 | $ | 16.39 | $ | 13.51 | $ | 13.67 | $ | 10.68 | $ | 8.00 | $ | 9.03 | ||||||||||||||
INCOME/(LOSS) FROM OPERATIONS: | ||||||||||||||||||||||||||||
Net investment loss | (0.07) | (e) | (0.11) | (e) | (0.04) | (e) | (0.10) | (e) | (0.06) | (0.17) | (0.01) | |||||||||||||||||
Net realized and unrealized gain/(loss) on investments | 4.27 | 1.43 | 2.92 | (0.06) | 3.05 | 2.85 | (0.98) | |||||||||||||||||||||
|
|
|
|
|
|
|
|
|
|
|
|
|
| |||||||||||||||
Total from Investment Operations | 4.20 | 1.32 | 2.88 | (0.16) | 2.99 | 2.68 | (0.99) | |||||||||||||||||||||
|
|
|
|
|
|
|
|
|
|
|
|
|
| |||||||||||||||
LESS DISTRIBUTIONS: | ||||||||||||||||||||||||||||
From capital gains | – | (1.85) | – | – | – | – | (0.04) | |||||||||||||||||||||
|
|
|
|
|
|
|
|
|
|
|
|
|
| |||||||||||||||
Total Distributions | – | (1.85) | – | – | – | – | (0.04) | |||||||||||||||||||||
|
|
|
|
|
|
|
|
|
|
|
|
|
| |||||||||||||||
NET INCREASE/(DECREASE) IN NET ASSET VALUE | 4.20 | (0.53) | 2.88 | (0.16) | 2.99 | 2.68 | (1.03) | |||||||||||||||||||||
|
|
|
|
|
|
|
|
|
|
|
|
|
| |||||||||||||||
NET ASSET VALUE, END OF PERIOD | $ | 20.06 | $ | 15.86 | $ | 16.39 | $ | 13.51 | $ | 13.67 | $ | 10.68 | $ | 8.00 | ||||||||||||||
|
|
|
|
|
|
|
|
|
|
|
|
|
| |||||||||||||||
TOTAL RETURN | 26.48% | (f) | 9.47 | % | 21.32% | (f) | (1.17) | % | 28.00 | % | 33.50 | % | (10.95)% | (f) | ||||||||||||||
RATIOS/SUPPLEMENTAL DATA: | ||||||||||||||||||||||||||||
Net Assets, End of Period (000s) | $ | 120,310 | $ | 86,238 | $ | 83,149 | $ | 64,930 | $ | 64,880 | $ | 47,091 | $ | 908 | ||||||||||||||
RATIOS TO AVERAGE NET ASSETS: | ||||||||||||||||||||||||||||
Net Investment loss | (0.78)% | (g) | (0.71) | % | (0.72)% | (g) | (0.72) | % | (0.52) | % | (0.73) | % | (0.45)% | (g) | ||||||||||||||
Operating expenses excluding reimbursement/waiver | 1.02% | (g) | 1.08 | % | 1.06% | (g) | 1.06 | % | 1.11 | % | 1.08 | % | 1.08% | (g) | ||||||||||||||
Operating expenses including reimbursement/waiver | 0.99% | (g) | 0.99 | % | 0.99% | (g) | 0.99 | % | 0.99 | % | 0.99% | (h) | n/ | a | ||||||||||||||
PORTFOLIO TURNOVER RATE | 43% | (f) | 78 | % | 28% | (f) | 75 | % | 78 | % | 113 | % | 108% | (i) | ||||||||||||||
| (a) | Prior to its March 16, 2012 reorganization with and into the Emerald Growth Fund, the Fund was known as the Forward Growth Fund. |
| (b) | Effective March 13, 2012 the Board approved changing the fiscal year-end of the Fund from December 31 to April 30. |
| (c) | The Fund began offering Institutional Class shares on October 21, 2008. |
| (d) | Prior to May 1, 2008, the Forward Growth Fund was known as the Forward Emerald Growth Fund. |
| (e) | Per share amounts are based upon average shares outstanding. |
| (f) | Not Annualized. |
| (g) | Annualized. |
| (h) | Effective January 1, 2009, the Advisor agreed to limit expenses at 0.99%. |
| (i) | Portfolio turnover rate is calculated at the Fund level and represents the year ended December 31, 2008. |
See Notes to Financial Statements.
26 | www.emeraldmutualfunds.com |
| Emerald Growth Fund | Financial Highlights | |
| For a share outstanding throughout the periods presented |
| INVESTOR CLASS | ||||||||||||||||
For the Six Months | Year Ended April 30, 2013 | For the Period January 1, 2012 to April 30, 2012 (a)(b) | Period Ended December 31, 2011 (c) | |||||||||||||
NET ASSET VALUE, BEGINNING OF PERIOD | $ | 15.57 | $ | 16.18 | $ | 13.35 | $ | 15.74 | ||||||||
INCOME/(LOSS) FROM OPERATIONS: | ||||||||||||||||
Net investment loss(d) | (0.11) | (0.16) | (0.05) | (0.09) | ||||||||||||
Net realized and unrealized gain/(loss) on investments | 4.20 | 1.40 | 2.88 | (2.30) | ||||||||||||
|
|
|
|
|
|
|
| |||||||||
Total from Investment Operations | 4.09 | 1.24 | 2.83 | (2.39) | ||||||||||||
|
|
|
|
|
|
|
| |||||||||
LESS DISTRIBUTIONS: | ||||||||||||||||
From capital gains | – | (1.85) | – | – | ||||||||||||
|
|
|
|
|
|
|
| |||||||||
Total Distributions | – | (1.85) | – | – | ||||||||||||
|
|
|
|
|
|
|
| |||||||||
NET INCREASE/(DECREASE) IN NET ASSET VALUE | 4.09 | (0.61) | 2.83 | (2.39) | ||||||||||||
|
|
|
|
|
|
|
| |||||||||
NET ASSET VALUE, END OF PERIOD | $ | 19.66 | $ | 15.57 | $ | 16.18 | $ | 13.35 | ||||||||
|
|
|
|
|
|
|
| |||||||||
TOTAL RETURN | 26.27% | (e) | 9.08 | % | 21.20% | (e) | (15.18)% | (e) | ||||||||
RATIOS/SUPPLEMENTAL DATA: | ||||||||||||||||
Net Assets, End of Period (000s) | $ | 9,453 | $ | 1,842 | $ | 1,085 | $ | 879 | ||||||||
RATIOS TO AVERAGE NET ASSETS: | ||||||||||||||||
Net Investment loss | (1.14)% | (f) | (1.05) | % | (1.07)% | (f) | (1.00)% | (f) | ||||||||
Operating expenses excluding reimbursement/waiver | 1.38% | (f) | 1.43 | % | 1.41% | (f) | 1.43% | (f) | ||||||||
Operating expenses including reimbursement/waiver | 1.34% | (f) | 1.34 | % | 1.34% | (f) | 1.34% | (f) | ||||||||
PORTFOLIO TURNOVER RATE | 43% | (e) | 78 | % | 28% | (e) | 75% | (g) | ||||||||
| (a) | Prior to its March 16, 2012 reorganization with and into the Emerald Growth Fund, the Fund was known as the Forward Growth Fund. |
| (b) | Effective March 13, 2012 the Board approved changing the fiscal year-end of the Fund from December 31 to April 30. |
| (c) | The Fund began offering Investor Class shares on May 2, 2011. |
| (d) | Per share amounts are based upon average shares outstanding. |
| (e) | Not Annualized. |
| (f) | Annualized. |
| (g) | Portfolio turnover is calculated at the Fund level and represents the year ended December 31, 2011. |
See Notes to Financial Statements.
| Semi-Annual Report | October 31, 2013 | 27 |
| Emerald Funds | Notes to Financial Statements | |
| October 31, 2013 (Unaudited) |
1. ORGANIZATION
Financial Investors Trust (the “Trust”), a Delaware statutory trust, is an open-end management investment company registered under the Investment Company Act of 1940, as amended (the “1940 Act”). As of October 31, 2013, the Trust had 27 registered funds. This semi-annual report describes the Emerald Banking and Finance Fund and Emerald Growth Fund (each a “Fund” and collectively, the “Funds”). Prior to March 16, 2012, the Emerald Banking and Finance Fund was known as the Forward Banking and Finance Fund and the Emerald Growth Fund was known as the Forward Growth Fund. Effective March 13, 2012, the Board of Trustees (the “Board”) approved changing the fiscal year end of the Funds from December 31 to April 30.
The Emerald Banking and Finance Fund seeks to achieve long term growth through capital appreciation with income as a secondary objective and invests primarily in equity securities of companies principally engaged in the banking or financial services industries.
The Emerald Growth Fund seeks to achieve long-term growth through capital appreciation and invests in equity securities, including common stocks, preferred stocks, and securities convertible into common or preferred stocks.
2. SIGNIFICANT ACCOUNTING POLICIES
The accompanying financial statements were prepared in accordance with accounting principles generally accepted in the United States of America (“U.S. GAAP”). The preparation of financial statements in conformity with U.S. GAAP requires management to make certain estimates and assumptions that affect the reported amounts of assets and liabilities and disclosures of contingent assets and liabilities at the date of the financial statements and the reported amounts of revenue and expenses during the period. Actual results could differ from those estimates. The following is a summary of significant accounting policies consistently followed by the Funds in preparation of their financial statements.
Investment Valuation: The Funds generally value their securities based on market prices determined at the close of regular trading on the New York Stock Exchange (“NYSE”), normally, 4:00 p.m. Eastern time, on each business day the NYSE is open for trading.
For equity securities and mutual funds that are traded on an exchange, the market price is usually the closing sale or official closing price on that exchange. In the case of equity securities not traded on an exchange, or if such closing prices are not otherwise available, the securities are valued at the mean of the most recent bid and ask prices on such day. Redeemable securities issued by open-end registered investment companies are valued at the investment company’s applicable net asset value.
The market price for debt obligations is generally the price supplied by an independent third-party pricing service approved by the Board of Trustees (the “Board”), which may use a matrix, formula or other objective method that takes into consideration quotations from dealers, market transactions in comparable investments, market indices and yield curves. If vendors are unable to supply a price, or if the price supplied is deemed to be unreliable, the market price may be determined using quotations received from one or more brokers–dealers that make a market in the security. Short–term debt obligations that will mature in 60 days or less are valued at amortized cost, unless it is determined that using this method would not reflect an investment’s fair value. Investments in non-exchange traded funds are fair valued at their respective net asset values.
Equity securities that are primarily traded on foreign securities exchanges are valued at the preceding closing values of such securities on their respective exchanges, except when an occurrence subsequent to the time a value was so established is likely to have changed such value. In such an event, the fair values of those securities are determined in good faith through consideration of other factors in accordance with procedures established by and under the general supervision of the Board.
When such prices or quotations are not available, or when the Fair Value Committee appointed by the Board believes that they are unreliable, securities may be priced using fair value procedures approved by the Board.
Fair Value Measurements: A three-tier hierarchy has been established to classify fair value measurements for disclosure purposes. Inputs refer broadly to the assumptions that market participants would use in pricing the asset or liability, including assumptions about risk. Inputs may be observable or unobservable. Observable inputs are inputs that reflect the assumptions market participants would use in pricing the asset or liability that are developed based on market data obtained from sources independent of the reporting entity. Unobservable inputs are inputs that reflect the reporting entity’s own assumptions about the assumptions market participants would use in pricing the asset or liability that are developed based on the best information available. Various inputs are used in determining the value of each Fund’s investments as of the reporting period end. The designated input levels are not necessarily an indication of the risk or liquidity associated with these investments. These inputs are categorized in the following hierarchy under applicable financial accounting standards:
| Level 1 – | Unadjusted quoted prices in active markets for identical investments, unrestricted assets or liabilities that the Funds have the ability to access at the measurement date; |
28 | www.emeraldmutualfunds.com |
| Emerald Funds | Notes to Financial Statements | |
| October 31, 2013 (Unaudited) |
| Level 2 – | Quoted prices which are not active, quoted prices for similar assets or liabilities in active markets or inputs other than quoted prices that are observable (either directly or indirectly) for substantially the full term of the asset or liability; and |
| Level 3 – | Significant unobservable prices or inputs (including the Funds’ own assumptions in determining the fair value of investments) where there is little or no market activity for the asset or liability at the measurement date. |
The following is a summary of each input used to value the Funds as of October 31, 2013:
| Investments in Securities at Value | Level 1 - Quoted Prices | Level 2 - Other Significant Observable Inputs | Level 3 - Significant Unobservable Inputs | Total | ||||||||||||||||
Emerald Banking and Finance Fund | ||||||||||||||||||||
Common Stocks | ||||||||||||||||||||
Asset Management & Custodian | $ | 798,370 | $ | – | $ | – | $ | 798,370 | ||||||||||||
Banks: Diversified | 61,704,204 | 939,541 | – | 62,643,745 | ||||||||||||||||
Banks: Savings, Thrift & Mortgage | 5,863,329 | – | – | 5,863,329 | ||||||||||||||||
Consumer Lending | 799,338 | – | – | 799,338 | ||||||||||||||||
Diversified Financial Services | 704,561 | – | – | 704,561 | ||||||||||||||||
Financial Data & Systems | 861,211 | – | – | 861,211 | ||||||||||||||||
Insurance: Multi-Line | 121,400 | – | – | 121,400 | ||||||||||||||||
Insurance: Property-Casualty | 2,284,756 | – | – | 2,284,756 | ||||||||||||||||
Leisure Equipment & Products | 1,027,076 | – | – | 1,027,076 | ||||||||||||||||
Real Estate Investment Trusts (REITs) | 4,032,931 | – | – | 4,032,931 | ||||||||||||||||
Real Estate Management & Development | 243,439 | – | – | 243,439 | ||||||||||||||||
Short Term Investments | 1,722,118 | – | – | 1,722,118 | ||||||||||||||||
TOTAL | $ | 80,162,733 | $ | 939,541 | $ | – | $ | 81,102,274 | ||||||||||||
| Investments in Securities at Value | Level 1 - Quoted Prices | Level 2 - Other Significant | Level 3 - Significant Unobservable Inputs | Total | ||||||||||||||||
Emerald Growth Fund | ||||||||||||||||||||
Common Stocks(a) | $ | 189,692,127 | $ | – | $ | – | $ | 189,692,127 | ||||||||||||
Warrants | – | – | – | – | ||||||||||||||||
Short Term Investments | 6,877,646 | – | – | 6,877,646 | ||||||||||||||||
Investments Purchased with Cash Collateral From Securities Loaned | 22,051 | – | – | 22,051 | ||||||||||||||||
TOTAL | $ | 196,591,824 | $ | – | $ | – | $ | 196,591,824 | ||||||||||||
(a) For detailed descriptions of sector and industry, see the accompanying Schedule of Investments.
The Funds recognize transfers between levels as of the end of the period. For the six month ended October 31, 2013, the Emerald Banking and Finance Fund had a security with a market value of $189,297 transfer from Level 1 to Level 2 due to the Funds’ use of closing market prices. For the six months ended October 31, 2013, the Emerald Growth Fund did not have any transfers between Level 1 and Level 2 securities.
For the six months ended October 31, 2013, the Funds did not have any securities that used significant unobservable inputs (Level 3) in determining fair value.
Investment Transactions and Investment Income: Investment transactions are accounted for on the date the investments are purchased or sold (trade date). Realized gains and losses from investment transactions are reported on an identified cost basis, which is the same basis the Funds use for federal income tax purposes. Interest income, which includes accretion of discounts, is accrued and recorded as earned. Dividend income is recognized on the ex-dividend date or for certain foreign securities, as soon as information is available to the Funds. All of the realized and unrealized gains and losses and net investment income, are allocated daily to each class in proportion to its average daily net assets.
Real Estate Investment Trusts (“REITs”): The Funds may invest a portion of their assets in REITs and are subject to certain risks associated with direct investment in REITs. REITs may be affected by changes in the value of their underlying properties and by defaults by borrowers or tenants.
| Semi-Annual Report | October 31, 2013 | 29 |
| Emerald Funds | Notes to Financial Statements | |
| October 31, 2013 (Unaudited) |
REITs depend generally on their ability to generate cash flow to make distributions to shareowners, and certain REITs have self-liquidation provisions by which mortgages held may be paid in full and distributions of capital returns may be made at any time. In addition, the performance of a REIT may be affected by its failure to qualify for tax-free pass-through of income under the Internal Revenue Code of 1986, as amended (the “Code”), or its failure to maintain exemption from registration under the Investment Company Act of 1940, as amended (the “1940 Act”).
Lending of Portfolio Securities: Prior to March 16, 2012, each Fund from time to time had lent portfolio securities to broker-dealers, banks or institutional borrowers of securities. The loans were secured by collateral in the form of cash that was equal to at least 102% of the fair value of the securities loaned plus accrued interest, if any. Upon lending its securities to third parties, a Fund receives compensation in the form of income on the investment of the cash collateral. Gain or loss in the fair value of the securities loaned that may occur during the term of the loan will be for the account of the Fund. The Fund has the right under the lending agreement to recover the securities from the borrower on demand, and loans are subject to termination by the lending Fund or the borrower at any time. While the lending Fund does not have the right to vote securities on loan, it intends, to the extent practicable, to terminate the loan and regain the right to vote if the matter to be voted upon is considered significant with respect to the investment. Additionally, the Fund does not have the right to sell or repledge collateral received in the form of securities unless the borrower goes into default. Each Fund receives cash collateral which is invested in the Short-Term Investment Trust Liquid Assets Portfolio Institutional Class. The risks to a Fund of securities lending are that the borrower may not provide additional collateral when required or return the securities when due. This collateral must be valued daily and should the market value of the loaned securities increase, the borrower must furnish additional collateral to the lending Fund. The Fund bears the risk of any income or gains and losses from investing and reinvesting cash pledged as collateral. During the time portfolio securities are on loan, the borrower pays the lending Fund the economic equivalent of any dividends or interest paid on such securities. In the event the borrower defaults on its obligation to the lending Fund, the lending Fund could experience delays in recovering its securities and possible capital losses. Prior to its expiration date of October 14, 2013, the security on loan (Magnum Hunter Resources Corp. Warrants) was held at the custodian Brown Brothers Harriman & Co. (“BBH”). As of October 31, 2013, the Emerald Growth Fund had securities on loan valued at $0 and received cash collateral with a value of $22,051. The current security on loan (Magnum Hunter Resources Corp. Warrants) is held at BBH, and the warrants are due to expire on April 15, 2016. Once this warrant expires, BBH can recall and transfer the current quantity to Union Bank of California.
Trust Expenses: Some expenses of the Trust can be directly attributed to the Funds. Expenses which cannot be directly attributed to the Funds are apportioned among all funds in the Trust based on average net assets of each fund.
Fund and Class Expenses: Expenses that are specific to a Fund or class of shares of a Fund are charged directly to that Fund or share class. All expenses of the Fund, other than class specific expenses, are allocated daily to each class in proportion to its average daily net assets. Expenses that are common to the Funds generally are allocated among the Funds in proportion to their average daily net assets. Fees provided under the distribution (Rule 12b-1) and/or shareholder service plans for a particular class of the Funds are charged to the operations of such class.
Federal Income Taxes: Each Fund complies with the requirements under Subchapter M of the Internal Revenue Code of 1986, as amended, applicable to regulated investment companies and intends to distribute substantially all of its net taxable income and net capital gains, if any, each year so that the Funds will not be subject to excise tax on undistributed income and gains. The Funds are not subject to income taxes to the extent such distributions are made.
As of and during the six months ended October 31, 2013, the Funds did not have a liability for any unrecognized tax benefits. The Funds file U.S. federal, state, and local tax returns as required. The Funds’ tax returns are subject to examination by the relevant tax authorities until expiration of the applicable statute of limitations, which is generally three years after the filing of the tax return for federal purposes and four years for most state returns. Tax returns for open years have incorporated no uncertain tax positions that require a provision for income taxes.
Distributions to Shareholders: Each Fund normally pays dividends and distributes capital gains, if any, on an annual basis. Income dividend distributions are derived from interest and other income each Fund receives from its investments, including short-term capital gains. Long term capital gain distributions are derived from gains realized when each Fund sells a security it has owned for more than a year. Each Fund may make additional distributions and dividends at other times if the portfolio manager believes doing so may be necessary for each Fund to avoid or reduce taxes.
30 | www.emeraldmutualfunds.com |
| Emerald Funds | Notes to Financial Statements | |
| October 31, 2013 (Unaudited) |
3. OFFSETTING ARRANGEMENTS
The Emerald Growth Fund manages counterparty risk by entering into enforceable collateral arrangements with counterparties to repurchase agreements and securities lending agreements. These agreements mitigate counterparty credit risk by providing for a single net settlement with a counterparty of all financial transactions covered by the agreement in an event of default as defined under such agreement. The following table presents repurchase agreement instruments and securities lending agreements that are subject to collateral arrangements as of October 31, 2013.
Emerald Growth Fund Offsetting of Derivatives Liabilities | ||||||||||||
October 31, 2013 | ||||||||||||
Gross Amounts Not Offset in the Statement of Financial Position | ||||||||||||
| Description | Gross Amounts of Recognized Liabilities | Gross Amounts Offset in the Statement of Financial Position | Net Amounts Presented in the Statement of Financial Position | Financial Instruments | Cash Collateral Pledged | Net Amount | ||||||
Securities Lending Collateral | $22,051 | $– | $22,051 | $(22,051) | $– | $– | ||||||
Total | $22,051 | $– | $22,051 | $(22,051) | $– | $– | ||||||
4. TAX BASIS INFORMATION
Tax Basis of Investments: As of October 31, 2013 the aggregate cost of investments, gross unrealized appreciation/(depreciation) and net unrealized appreciation/(depreciation) for Federal tax purposes was as follows:
| Gross Appreciation (excess of value over tax cost) | Gross Depreciation (excess of tax cost over value) | Net Unrealized Appreciation | Cost of Investments for Income Tax Purposes | |||||||||||||
Emerald Banking and Finance Fund | $ | 22,391,598 | $ | (461,767 | ) | $ | 21,929,831 | $ | 59,172,443 | |||||||
Emerald Growth Fund | 66,403,537 | (2,598,913 | ) | 63,804,624 | 132,787,200 | |||||||||||
Tax Basis of Distributions to Shareholders: The character of distributions made during the year from net investment income or net realized gains may differ from its ultimate characterization for federal income tax purposes. Also, due to the timing of dividend distributions, the fiscal year in which amounts are distributed may differ from the fiscal year in which the income or realized gain were recorded by each Fund.
The tax character of distributions paid by the Funds for the fiscal year ended April 30, 2013, were as follows:
| Ordinary Income | Long-Term Capital Gain | |||||||
Emerald Banking and Finance Fund | $ | – | $ | – | ||||
Emerald Growth Fund | – | 14,103,676 | ||||||
During the period ended April 30, 2012 and the six months ended October 31, 2013, the Funds did not make any distributions.
5. SECURITIES TRANSACTIONS
The cost of purchases and proceeds from sales of securities (excluding short-term securities) during the six months ended October 31, 2013, was as follows:
| Funds | Cost of Investments Purchased | Proceeds from Investments Sold | ||||||||
Emerald Banking and Finance Fund | $ | 26,894,429 | $ | 11,528,644 | ||||||
Emerald Growth Fund | 81,636,004 | 68,853,446 | ||||||||
6. SHARES OF BENEFICIAL INTEREST
The capitalization of the Trust consists of an unlimited number of shares of beneficial interest with no par value per share. Holders of the shares of the Funds of the Trust have one vote for each share held and a proportionate fraction of a vote for each fractional share. All shares issued and outstanding are fully paid and are non-assessable, transferable and redeemable at the option of the shareholder. Shares have no pre-emptive rights.
| Semi-Annual Report | October 31, 2013 | 31 |
| Emerald Funds | Notes to Financial Statements | |
| October 31, 2013 (Unaudited) |
7. MANAGEMENT AND RELATED-PARTY TRANSACTIONS
Emerald Mutual Fund Advisers Trust, (“the Adviser”), subject to the authority of the Board, is responsible for the overall management and administration of the Funds’ business affairs. The Adviser manages the investments of the Funds in accordance with the Funds’ investment objective, policies and limitations and investment guidelines established jointly by the Adviser and the Trustees. Pursuant to the Advisory Agreement, the Funds pay the Adviser fees for the services and facilities it provides payable on a monthly basis at the annual rate set forth below of the Funds’ average daily net assets.
Emerald Banking and Finance Fund Average Total Net Assets | Contractual Fee | |||
Between $0-$100M | 1.00% | |||
Above $100M | 0.90% | |||
Emerald Growth Fund Average Total Net Assets | Contractual Fee | |||
Between $0-$250M | 0.75% | |||
$250M-$500M | 0.65% | |||
$500M-$750M | 0.55% | |||
Above $750M | 0.45% | |||
The Adviser has contractually agreed to limit the total amount of “Management Fees” and “Other Expenses” that it is entitled to receive from both Funds through August 31, 2014, with respect to the Funds’ different classes, to the extent the Total Annual Fund Operating Expenses of a Fund (exclusive of acquired fund fees and expenses, brokerage expenses, interest expense, taxes and extraordinary expenses) exceed the annual rates (as a percentage of each Funds average daily net assets) set forth on the tables below. The Adviser will reduce the fee payable with respect to such Fund to the extent of such excess, and/or shall reimburse the Fund (or class) by the amount of such excess. The waiver or reimbursement shall be allocated to each class of the Fund in the same manner as the underlying expenses or fees were allocated.
Emerald Banking and Finance Fund | ||||||
| Class A | Class C | Institutional Class | Investor Class | |||
1.84% | 2.49% | 1.54% | 1.89% | |||
Emerald Growth Fund | ||||||
| Class A | Class C | Institutional Class | Investor Class | |||
1.29% | 1.94% | 0.99% | 1.34% | |||
For the six months ended October 31, 2013, the fee waivers and/or reimbursements were as follows:
| Fund | Fees Waived/Reimbursed by Adviser | Recoupment of Past Waived Fees by Adviser | ||||||||
Emerald Banking and Finance Fund | ||||||||||
Class A | $ | – | $ | 16,092 | ||||||
Class C | – | 10,217 | ||||||||
Institutional Class | – | 1,065 | ||||||||
Investor Class | – | 2,054 | ||||||||
Emerald Growth Fund | ||||||||||
Class A | $ | 10,122 | $ | – | ||||||
Class C | 1,216 | – | ||||||||
Institutional Class | 15,002 | – | ||||||||
Investor Class | 856 | – | ||||||||
32 | www.emeraldmutualfunds.com |
| Emerald Funds | Notes to Financial Statements | |
| October 31, 2013 (Unaudited) |
As of October 31, 2013, the balances of recoupable expenses for each Fund were as follows:
| Fund | Expires 2015 | Expires 2016 | Total | ||||||||||||
Emerald Banking and Finance Fund | |||||||||||||||
Class A | $ | 7,504 | $ | 9,691 | $ | 17,195 | |||||||||
Class C | 5,168 | 7,599 | 12,767 | ||||||||||||
Institutional Class | 2 | 1,062 | 1,064 | ||||||||||||
Investor Class | 228 | 1,826 | 2,054 | ||||||||||||
Emerald Growth Fund | |||||||||||||||
Class A | $ | 6,877 | $ | 37,509 | $ | 44,386 | |||||||||
Class C | 518 | 3,189 | 3,707 | ||||||||||||
Institutional Class | 13,614 | 70,871 | 84,485 | ||||||||||||
Investor Class | 177 | 1,267 | 1,444 | ||||||||||||
The Emerald Banking and Finance and Emerald Growth Funds will not be obligated to pay any such deferred fees and expenses more than three years after the year(s) in which the fees and expense were incurred.
Distributor: ALPS Distributors, Inc. (“ADI” or the “Distributor”) (an affiliate of ALPS Fund Services Inc. (“ALPS”)) acts as the distributor of the Funds’ shares pursuant to a Distribution Agreement with the Trust. Shares are sold on a continuous basis by ADI as agent for the Funds, and ADI has agreed to use its best efforts to solicit orders for the sale of Funds’ shares, although it is not obliged to sell any particular amount of shares. ADI is not entitled to any compensation for its services as Distributor. ADI is registered as a broker-dealer with the Securities and Exchange Commission.
Each Fund has adopted a separate Distribution and Services Plan (each a “Plan” and collectively, the “Plans”) pursuant to Rule 12b-1 of the 1940 Act. The Plans allow each Fund, as applicable, to use each Fund’s assets to pay fees in connection with the distribution and marketing of the Funds’ shares and/or the provision of shareholder services to the Funds’ shareholders. The Plan permits payment for services in connection with the administration of plans or programs that use shares of each Fund as their funding medium and for related expenses. The Plans permit each Fund to make total payments at an annual rate of up to 0.35%, 0.75% and 0.25% of the average daily net asset value of Class A, Class C and Investor Class, respectively. Because these fees are paid out of the Funds’ assets on an ongoing basis, over time they will increase the cost of an investment in the Funds, and Plan fees may cost an investor more than other types of sales charges.
Each Fund has adopted a Shareholder Services Plan (a “Shareholder Services Plan”) with respect to its shares. Under the Shareholder Services Plan, each Fund is authorized to pay banks and their affiliates and other institutions, including broker-dealers and Fund affiliates (“Participating Organizations”), an aggregate fee in an amount not to exceed on an annual basis 0.25%, 0.05% and 0.15% of the average daily net asset value of Class C, Institutional Class and Investor Class, respectively, of the Funds attributable to or held in the name of a Participating Organization for its clients as compensation for providing services pursuant to an agreement with a Participating Organization. Any amount of such payment not paid during the Funds’ fiscal year for such service activities shall be reimbursed to the Funds as soon as practicable after the end of the fiscal year. Shareholder Services Plan fees are included with distribution and service fees on the Statement of Operations.
Administrator: ALPS (an affiliate of ADI) serves as administrator to the Funds, and each Fund has agreed to pay expenses incurred in connection with its administrative activities. Pursuant to the Administration, Bookkeeping and Pricing Services Agreement (the “Agreement”), ALPS will provide operational services to the Funds including, but not limited to, fund accounting and fund administration and generally assist in each Fund’s operations.
The annual administrative fee, billed monthly in total and allocated to each Fund, in the amount of the greater of (a) the annual minimum for all Funds of $140,000 in Year 1 of operations and $200,000 in subsequent years or (b) following basis point fee schedule:
| Average Total Net Assets | Contractual Fee | ||||
Between $0-$500M | 0.06 | % | |||
$500M-$1B | 0.04 | % | |||
Above $1B | 0.025 | % | |||
The Administrator is also reimbursed by the Funds for certain out-of-pocket expenses.
Transfer Agent: ALPS serves as transfer, dividend paying and shareholder servicing agent for the Funds. ALPS is compensated based upon a $25,000 annual base fee per Fund, and annually $9 per direct open account and $7 per open account through NSCC. ALPS is also reimbursed by the Funds for certain out-of-pocket expenses.
| Semi-Annual Report | October 31, 2013 | 33 |
| Emerald Funds | Notes to Financial Statements | |
| October 31, 2013 (Unaudited) |
Compliance Services: ALPS provides services which assist the Trust’s Chief Compliance Officer, in monitoring and testing the policies and procedures of the Trust in conjunction with requirements under Rule 38a-1 under the 1940 Act and receives an annual base fee for all Funds of $40,000. ALPS is reimbursed for certain out-of-pocket expenses. The annual fee is billed monthly in total and allocated to each Fund.
Principal Financial Officer: ALPS receives an annual fee for both Funds of $10,000 for providing Principal Financial Officer (“PFO”) services to the Funds. The annual fee is billed monthly in total and allocated to each Fund.
8. INDEMNIFICATIONS
Under the Trust’s organizational documents, its officers and Trustees are indemnified against certain liability arising out of the performance of their duties to the Trust. Additionally, in the normal course of business, the Trust enters into contracts with service providers that may contain general indemnification clauses, which may permit indemnification to the extent permissible under applicable law. The Trust’s maximum exposure under these arrangements is unknown, as this would involve future claims that may be made against the Trust that have not yet occurred.
9. NEW ACCOUNTING PRONOUNCEMENTS
In June 2013, the Financial Accounting Standards Board (the “FASB”) issued Accounting Standards Update (“ASU”) No. 2013-08, Financial Services-Investment Companies (Topic 946): Amendments to the Scope, Measurement, and Disclosure Requirements. The FASB standard identifies characteristics a company must assess to determine whether it is considered an investment company for financial reporting purposes. This ASU is effective for fiscal years beginning after December 15, 2013. The Funds believe the adoption of this ASU will not have a material impact on their financial statements.
34 | www.emeraldmutualfunds.com |
| Emerald Funds | Additional Information | |
| October 31, 2013 (Unaudited) |
1. FUND HOLDINGS
The Funds file their complete schedule of portfolio holdings with the Securities and Exchange Commission (the “SEC”) for the first and third quarters of each fiscal year on Form N-Q within 60 days after the end of the period. Copies of the Funds’ Form N-Q are available without charge on the SEC website at http://www.sec.gov. You may also review and copy the Form N-Q at the SEC’s Public Reference Room in Washington, DC. For more information about the operation of the Public Reference Room, please call the SEC at 1-800-SEC-0330.
2. FUND PROXY VOTING POLICIES, PROCEDURES AND SUMMARIES
Each Fund’s policies and procedures used in determining how to vote proxies and information regarding how the Funds voted proxies relating to portfolio securities during the most recent prior 12-month period ending June 30 are available without charge, (1) upon request, by calling (toll-free) (855) 828-9909 and (2) on the SEC’s website at http://www.sec.gov.
| Semi-Annual Report | October 31, 2013 | 35 |
| ||||
| TABLE OF CONTENTS | ||||
| 1 | ||||
| 9 | ||||
| 15 | ||||
| 17 | ||||
| 26 | ||||
| 40 | ||||
| 49 | ||||
| 51 | ||||
| 53 | ||||
| 54 | ||||
| 57 | ||||
| 59 | ||||
| 60 | ||||
| 63 | ||||
| 65 | ||||
| 74 | ||||
| 79 | ||||

| Grandeur Peak Funds® | Shareholder Letter | |
| October 31, 2013 (Unaudited) |

Dear Fellow Investors,
Over twenty years ago, in August of 1991, I traveled to Boston for the annual summer conference of Adams Harkness and Hill, a small boutique brokerage firm that covered small and microcap companies. Because we have five children, my wife Susie has rarely traveled with me on research trips, but that summer we got a baby sitter and Susie accompanied me to Boston. While I was seeing company presentations, Susie walked the Freedom Trail and saw many of the Boston sites. We enjoyed the evenings together and I particularly remember the incredible lobster and pizza. Boston is one of my favorite cities to visit in the world.
As is my custom whenever going to a conference, I screened the surrounding areas to try to tag on some company visits to my trip. In this case, I found a very interesting company, called Idexx Laboratories, located in Portland Maine, a few hours from Boston. The company had recently had its Initial Public Offering (IPO) and had excellent numbers. The conference ended on Thursday, so I set up a meeting on Friday afternoon to meet with the Idexx Chief Financial Officer.
Susie was also researching things to do that Friday. She discovered that Robert Frost had lived in Vermont. I agreed to drive in the morning to Robert Frost’s home in Vermont and she agreed to accompany me over to Portland for my late afternoon meeting with Idexx.
I enjoyed the visit to Robert Frost’s home. What I did not anticipate was that half of New York was vacationing in Maine and New Hampshire. The roads to Portland were bumper-to-bumper. We didn’t make it and I had to cancel the meeting. We also didn’t have a hotel to stay in and we couldn’t find a room anywhere, so we ultimately ended up sleeping in our car at a rest area exit!
It took me a long time to circle back on Idexx. I got busy, the stock was never cheap and I forgot about it for a while. This was one of the biggest investment mistakes I have made in my career, maybe the biggest. The stock went on to be a “ten bagger” and more. As I sit down and write this update for you, I’ve gone back and calculated that Idexx is up over 51 fold since its IPO in 1991. The reason it is such a bad miss is that it was the perfect investment for our style of investing. It
| Semi-Annual Report | October 31, 2013 | 1 |
| Grandeur Peak Funds® | Shareholder Letter | |
| October 31, 2013 (Unaudited) |
had all the characteristics we look for in a company: headroom to grow, steady results, margin expansion, recurring revenue, dominant market position, fragmented market, great management.
Over the years I have frequently reminded Susie that I love her so much that I passed up a ten bagger for her to go see Robert Frost’s home. Now I realize that actually it was a 50 bagger that I missed, so I’m going to now tell her how much more I love her.
In addition to being a good conference for seeing microcap companies, one of the thrills for me was to see the famed Fidelity Magellan Fund Manager, Peter Lynch, who never seemed to miss this conference. He was a hero of mine and I have studied his way of investing considerably over the years. He is still an important influence on my investment approach today.
I’m not sure if it was Peter Lynch who coined the term “ten bagger.” But it was in his book One Up on Wall Street where I first learned the term. As Peter Lynch put it, “a ten bagger is the baseball equivalent of two home runs and a double.”
In less than two years, Grandeur Peak can report that we’ve recorded our first ten bagger. And proudly, I can tell you that it was the very first new stock we bought after leaving Wasatch. The name of the company is Magellan Financial Group, an Australian-based asset manager which we found in the summer of 2011 as an undiscovered sub $200 million market cap company. It hasn’t gone unnoticed by me that it carries the same name as Lynch’s famed fund!
While I missed Idexx because of it, the trip to Robert Frost’s home was truly valuable. In addition to making Susie happy, Frost’s poem “The Road not Taken” has been an inspiring poem for me all my life. Some think it overly quoted, but it was an inspiration in the founding and now the running of Grandeur Peak Global Advisors.
The Road Not Taken
By Robert Frost
Two roads diverged in a yellow wood,
And sorry I could not travel both
And be one traveler, long I stood
And looked down one as far as I could
To where it bent in the undergrowth;
Then took the other, as just as fair,
And having perhaps the better claim
Because it was grassy and wanted wear;
Though as for that the passing there
Had worn them really about the same,
And both that morning equally lay
In leaves no feet had trodden black.
Oh, I kept the first for another day!
Yet knowing how way leads on to way,
I doubted if I should ever come back.
2 | 1.855.377.7325 | www.GrandeurPeakGlobal.com |
| Grandeur Peak Funds® | Shareholder Letter | |
| October 31, 2013 (Unaudited) |
I shall be telling this with a sigh
Somewhere ages and ages hence:
Two roads diverged in a wood, and I,
I took the one less traveled by,
And that has made all the difference.
As Eric, Blake and I contemplated the founding of Grandeur Peak, we asked ourselves whether the world needed another money manager? And would it be worth leaving our very comfortable situations to try to build something unique and special? “Long [we] stood” looking down two paths. The longer we contemplated the question, the more convinced we became that this was our path. Now that we are more than two years down this path, let me tell you a little more about the unique road we have taken.
First, asset managers are generally divided into two buckets: domestic managers and international managers. There are many firms that do both, but in most cases the domestic team and international team are not integrated and might as well be in separate firms. At Grandeur Peak we are one global team. From the CEO (me) down to the most junior analyst, we are all global analysts. Amy Sunderland, our senior analyst in Hong Kong, is not our Asian analyst, rather she is our global consumer analyst who visits companies across the globe. Certainly, she helps us disproportionately in Asia, but her first responsibility is finding and analyzing the most interesting consumer companies wherever they are located.
The world is getting smaller and the competitive dynamics are global. By being one integrated global team we believe we can better connect the dots and be better investors. We think this gives us a significant competitive advantage, which will only get stronger over time. We aim to prove to the world that the best long-term performance can be garnered by global mandates. As such, our flagship funds are global funds, and they’re off to a nice start.
Global portfolios also have more flexibility. The positive of this flexibility can be seen in this year’s market. We lowered our position in emerging markets a year or so ago and increased our weight in the U.S. This allowed us to better capture the nice run in the U.S. market this year, while reducing our pain as emerging markets have struggled. These were not macro calls, they were bottom up stock selections. The growth of our emerging market companies was slowing and cost pressures were rising, so it was simply a natural time to reduce our positions there. We won’t always make these calls correctly, but the flexibility to move to wherever we are finding the most interesting opportunities is a great advantage.
We do offer an international product (i.e. excluding the U.S.), and soon we will have an emerging markets product, to align with specific interests of some of our clients. We believe our global view will make us better investors in these sub-segments—because we better understand the full competitive and customer landscapes facing companies in these specific markets.
We are taking the road less traveled by being a firm truly organized with one global team. It requires a lot from each member of our team. The global gene has to be in the DNA of our team members and their spouses. I have talked with a number of friends who are domestic asset managers. They believe in the power of what we are doing, but they won’t change their personal lifestyle to try to tackle the global opportunity. We are following the road less traveled.
| Semi-Annual Report | October 31, 2013 | 3 |
| Grandeur Peak Funds® | Shareholder Letter | |
| October 31, 2013 (Unaudited) |
A second unique and equally important feature of Grandeur Peak is our primary focus on micro and small cap companies. The global universe of small and microcap companies is extremely exciting. The IPO market in the US has been somewhat curtailed over the past decade due to Sarbanes Oxley regulation, which increased the costs and burdens on companies coming public. Meanwhile, the international IPO market has been booming. There have been over 12,000 IPOs globally over the last decade, and almost 90% of them have been outside of the U.S.1 While this universe of new public companies does contain a lot of sketchy companies taking advantage of the good capital markets to come public (one reason you may not want to buy ETFs (Exchange Traded Funds)), there is a rich supply of great small and microcap firms across the globe that meet our high quality standards.
Another great aspect to our investment universe is how few managers are looking here. As we travel the globe we find very few small cap managers, even among local asset managers. Back home in the US there are barely a handful of managers focused on global small caps, and only a couple of dozen international small cap managers. And micro caps are barely even on the institutional radar in most markets. So we feel like we’re fishing at a well-stocked lake that few other fishermen are willing to hike to. This is what it felt like in 1995 when I launched the Wasatch Microcap Fund.
It’s worth noting that given the number of sucker fish in the lake you do have to know your fish if you are going to fish here. We are very fortunate to have a team with extensive experience and talent in investing in small and microcap companies. Our eight senior analysts have great individual skill and have gelled really nicely as a team. I’m thrilled to have Zach Larkin and Liping Cai join our senior team this year, and hope you get a chance to meet them. In addition, our junior team continues to grow and get better. As I’ve mentioned, we plan to grow people from within, so we are committed to training and developing our junior analysts.
Third is our absolute commitment to close our funds at what we believe is the appropriate asset level in order to preserve our ability to buy, in desired size, small and microcap companies where we believe market inefficiencies exist.
To be clear, we do invest selectively in bigger companies, and we hope to ride some of our micro and small companies into midcap territory or bigger, but we feel the greatest source of performance can come in the small and microcap space where the companies are less discovered and can grow faster.
If you look at the median market caps of our portfolios, you will find them at the low end of any competitive set. You get great exposure to small and microcap companies in our portfolios. We don’t view $2.5b market cap companies as undiscovered small caps. We feel companies this big are distinctly in the midcap bucket and immensely more discovered than our microcap names. Our sweet spot is $100M - $1B, but you’ll also find sub $100m market cap names in our portfolios.
| 1 | Source: Bloomberg as of 9/30/13. |
4 | 1.855.377.7325 | www.GrandeurPeakGlobal.com |
| Grandeur Peak Funds® | Shareholder Letter | |
| October 31, 2013 (Unaudited) |
It is vital that we preserve our ability to invest in these small and microcap names by keeping our overall assets small. With our asset growth this year we’ve quickly come to a cross roads at which most successful small cap managers ultimately arrive. Do we really have to close our funds? It’s so tempting to keep them open. We’ve worked our whole careers to garner assets and be successful, to then abruptly turn them off is a hard thing to do for most. Reminds me again of the opening stanza:
Two roads diverged in a yellow wood,
And sorry I could not travel both
And be one traveler, long I stood
And looked down one as far as I could
To where it bent in the undergrowth;
We are staring down the path of asset growth, all the way until it bends in the undergrowth, and oh how tempting it is to just grow assets and grow assets and take the road that most small cap asset managers seem to take.
I want to reaffirm to you now that we will not take this road.
We’ve analyzed capacity and feel that across our seven planned small and microcap products our maximum capacity is around $3B in this space. Having already reached $1.3B2, yet still having the desire to open 4 more products in this niche, we may need to more tightly limit assets in our original products. We may also close new strategies at lower levels than we had originally planned. We are of course pleased with the success and growth of the original funds, but our commitment to capping our overall capacity will not change.
As part of our ten-year plan we talk about Grandeur Peak 2.0. We’ve talked about how we might leverage our industry teams, our global perspective, and our investing experience beyond small and micro caps at some point. But let me assure you, our plan and commitment is to have no more than roughly $3B in total small and micro cap assets ever. And our foremost interest as a firm is to be a premier global small and microcap boutique.
I’ve highlighted the three most important ways we are taking the road less traveled, but there are a number of other aspects of our firm that I think also make us unique. They are frequently not the easy way, but we feel they are the right way for us to create something special and lasting.
We have an enduring investment process and philosophy. We have recommitted ourselves to those principles. Focus on quality. Buy good companies with competitive advantages, headroom to grow, good management teams, good business models, strong balance sheets and don’t overpay for them. This takes discipline. We’ve been so successful out of the chute that it would be easy to ease up and rest on our laurels for a bit. We remind ourselves that we’re two miles into the marathon and that the fact that we’re towards the front of the pack means nothing. We’re actually raising the bar to have a more comprehensive disciplined process. Warren Buffet said, “We don’t have to be smarter than the others, just more disciplined.” We subscribe to this thinking (though we hope we’re smarter too ).
).
| 2 | As of 10/31/13. |
| Semi-Annual Report | October 31, 2013 | 5 |
| Grandeur Peak Funds® | Shareholder Letter | |
| October 31, 2013 (Unaudited) |
We value collaborative teamwork. We are not a star system here. We value having multiple minds looking at each company from many different angles and experiences. But we are not a committee either. We want to be in the sweet spot between these two extremes. We’ve had no turnover in our senior team and we extended firm ownership to a broad group so that we will all share in the success of the firm.
We eat our own cooking. I am among the largest shareholders in each of our funds. Most of the team has a greater percentage of their net worth in the funds than I do, so we are broadly and heavily invested because we all believe in what we’re doing.
Our mission is bigger than us. We set out to make a difference in the world. Not just with our clients and our team, but in the world in which we live. We’re donating a meaningful amount of our profits to support organizations making a positive impact in our local community and/or across the globe. You can see on our website the organizations we have already supported. Each year our team nominates and jointly selects the organizations that we will support.
We recently became sponsors of Choice Humanitarian, an organization working in five countries (Kenya, Nepal, Bolivia, Guatemala and Mexico) to end extreme poverty and improve sustainable quality of life. As a celebration of reaching $1 billion in assets under management, we are planning to go as a firm on a Choice Humanitarian expedition to one of these countries and use our hands and heart to help make a difference.
We believe we are taking the road less traveled. It’s not an easy endeavor. We will have challenges and we will fall short at times, but we are committed to this path because we believe it will be a great journey.
Earlier this month we made our annual trek up to the top of Grandeur Peak. It was a beautiful autumn morning. The colors were changing, and the views of the valley below were again spectacular. It takes us about two hours to reach the top, and each year the more seasoned members of our team recognize the wisdom we had in selecting Grandeur Peak for our name, as opposed to say Mt. McKinley. Grandeur Peak is not even the highest peak surrounding the Salt Lake valley, but it’s a nice analogy for what we set out to do with our firm. We do not aspire to be the biggest; instead, we aspire to be among the best. And to be great investors going forward we believe investors will have to be willing to climb to the top of the peak to see the global view.
As we were gathered at the top of the peak we again reflected on the year, each of us sharing our annual highs and lows. As in my letter last year, I would again like to take you to the top of the mountain with us so that you can hear directly from the team. The highs and lows are a nice tradition that provides insightful reflection.
It would have been easy for everyone to simply say the high for this year was performance and/or asset growth. No doubt these have been highs, but the primary focus of the highs revolved around the team. It has been amazing how well our team has come together and how cohesively we are rowing in the same direction. Everyone feels it. It’s a great culture and amazing team. Each member loves their individual role, but is even more passionate about what we are trying to do together. Personally, I would add how thrilled I have been with our team—not just how we are working together, but the true impact being made by everyone on the senior team, and now even the junior team. We were right not to name the firm Gardiner Investments. I am not managing
6 | 1.855.377.7325 | www.GrandeurPeakGlobal.com |
| Grandeur Peak Funds® | Shareholder Letter | |
| October 31, 2013 (Unaudited) |
your money. Our team is managing it together, and every one of our analysts has had a significant impact on our performance. Amy Hu Sunderland, Randy Pearce, and Spencer Stewart were named Associate Portfolio Managers in June with the launch of the Global Reach Fund. This title recognizes the tremendous role each is playing on the team, and it is well deserved.
The lows coming from the research team were almost universally consistent—that we can/should be doing more. Last year I mentioned in my letter how we had done a great job getting out to visit companies, but we still had lots to do to tighten up the back-end of the process. Well, we have continued our extraordinary efforts on the front-end with over 1200 company touches this past year, and although we’ve made good progress on the back-end thanks to our junior team, we are not there yet. But we are all committed to getting there so that we can avoid dropping too many balls and making too many mistakes. We recently added resources to help me and Rob on the Director of Research team—both Zach Larkin and Juliette Douglas are now spending part of their day helping drive these initiatives.
Foreign registrations have continued to be a battle for us. We did finally get the Global Opportunities and International Opportunities Funds registered in India, but we’re still working on India for Global Reach. Meanwhile, Vietnam was another lengthy and frustrating registration—we finally received the green light there this month. Related to this and other processes that haven’t gone as smoothly or efficiently as we would have liked, we are in the process of changing the global custodian for all of our assets this fall. The move to Brown Brother Harriman (BBH) will officially happen in mid-December. There will be no noticeable impact to our clients with this change, but behind the scenes we expect it to be a nice improvement that will ultimately benefit our clients. BBH is a premier global custodian, and we are pleased to be in a position so early in our firm’s history to be able to add them as a partner for the years ahead.
Despite a struggling global economy, the market overall continues to rise. Valuations are getting richer and we’re becoming more conservative in our portfolio construction. Fortunately, we’re still finding a long list of companies that we think have great potential. I don’t know all that the future will bring. The market can be so humbling at times. I’m not sure we can do as well in the next 24 miles of the marathon as we have done in the first two miles. And I’m certain at least one of the miles between now and then will be a poor one for us. We may even have a tough period between the time I write this and the time you receive it. But I want you to know, on behalf of our team, that we will give it our very best and we will try at every step to do things the right way, with a lot of careful thought, and with the highest integrity. If we fail it won’t be for lack of effort or lack of a solid game plan. We remain confident in our chance of long-term success, and appreciate you joining us down the road less traveled.
Sincerely,
Robert Gardiner
Chief Executive Officer & Portfolio Manager
The objective of all Grandeur Peak Funds is long-term growth of capital.
RISKS of the Grandeur Peak Funds and the Wasatch Micro Cap Fund: Mutual fund investing involves risks and loss of principal is possible. Investing in small and micro cap funds will be more volatile and loss of principal could be greater than investing in large cap or more diversified funds. Investing in foreign securities entails special risks, such as currency fluctuations and political uncertainties, which
| Semi-Annual Report | October 31, 2013 | 7 |
| Grandeur Peak Funds® | Shareholder Letter | |
| October 31, 2013 (Unaudited) |
are described in more detail in the prospectus. Investments in emerging markets are subject to the same risks as other foreign securities and may be subject to greater risks than investments in foreign countries with more established economies and securities markets.
An investor should consider investment objectives, risks, charges, and expenses carefully before investing. To obtain a Grandeur Peak Funds prospectus, containing this and other information, visit www.grandeurpeakglobal.com or call 1-855-377-PEAK (7325). Please read it carefully before investing.
An investor should consider investment objectives, risks, charges, and expenses carefully before investing. To obtain a Wasatch Funds prospectus, containing this and other information, visit www.wasatchfunds.com or call 1-800.551.1700. Please read it carefully before investing.
The views and information discussed in this commentary are as of the date of publication, are subject to change, and may not reflect the writer’s current views. The views expressed represent an assessment of market conditions at a specific point in time, are opinions only and should not be relied upon as investment advice regarding a particular investment or markets in general. Such information does not constitute a recommendation to buy or sell specific securities or investment vehicles. It should not be assumed that any investment will be profitable or will equal the performance of the Funds or any securities or any sectors mentioned herein. The subject matter contained herein has been derived from several sources believed to be reliable and accurate at the time of compilation. The Funds do not accept any liability for losses either direct or consequential caused by the use of this information.
CFA® is trademark owned by CFA Institute.
ALPS Distributors, Inc. is the Distributor for the Grandeur Peak Funds.
8 | 1.855.377.7325 | www.GrandeurPeakGlobal.com |
| Grandeur Peak Global Opportunities Fund | Performance Update | |
| October 31, 2013 (Unaudited) |
| Cumulative Total Return Performance for the periods ended October 31, 2013 | ||||||||||
| Since | Expense Ratio | |||||||||
| 6 months | 1 Year | Inception* | Gross | Net** | ||||||
Grandeur Peak Global Opportunities Fund – Investor (GPGOX) | 18.41% | 38.86% | 28.73% | 1.72% | 1.72% | |||||
Grandeur Peak Global Opportunities Fund – Institutional (GPGIX) | 18.28% | 39.31% | 29.20% | 1.49% | 1.49% | |||||
Russell Global Small Cap Index | 10.06% | 27.28% | 19.29% | |||||||
Russell Global Index | 9.54% | 25.00% | 18.87% | |||||||
| * | Fund inception date of October 17, 2011. |
| ** | Grandeur Peak Global Advisors, LLC (the “Adviser”), has agreed to waive and/or reimburse fees or expenses in order to limit Total Annual Fund Operating Expenses After Fee Waiver/Expense Reimbursement (excluding acquired fund fees and expenses, brokerage expenses, interest expenses, taxes and extraordinary expenses) to 1.75% of the Fund’s average daily net assets for the Investor Class and 1.50% of the Fund’s average daily net assets for the Institutional Class. This agreement is in effect through August 31, 2014. The Fund may have to repay some of these waivers and reimbursements to the Adviser in the following three years. This agreement may not be terminated or modified prior to this date except with the approval of the Fund’s Board of Trustees. |
Returns for periods greater than 1 year are annualized.
The returns shown above do not reflect the deduction of taxes a shareholder would pay on Fund distributions or redemption of Fund shares.
Performance data quoted represents past performance. Past performance does not guarantee future results. Investment return and principal value of an investment will fluctuate so that an investor’s shares, when sold or redeemed, may be worth more or less than the original cost. Current performance data may be higher or lower than actual data quoted. For the most current month-end performance data, please call 1-855-377-PEAK (7325).
Growth of $10,000 for the period ended October 31, 2013
| Semi-Annual Report | October 31, 2013 | 9 |
| Grandeur Peak Global Opportunities Fund | Performance Update | |
| October 31, 2013 (Unaudited) |
The graphs shown above represent a hypothetical investment of $10,000 in the Fund’s Investor Class shares for the period from inception to 10/31/2013. All returns reflect reinvested dividends, but do not reflect the deduction of taxes that an investor would pay on distributions or redemptions.
The Russell Global Small Cap Index and Russell Global Index are not actively managed and do not reflect any deduction for fees, expenses or taxes. It is not possible to invest directly in an index.
The Fund also offers Institutional Class shares, performance for which is not reflected in the graphs above. The performance of Institutional Class shares may be higher or lower than the performance of the Investor Class shares shown in the graphs above based upon differences in fees paid by shareholders investing in the Investor Class shares and Institutional Class shares.
| Regional Allocation (as a % of Net Assets)* | ||||||
North America | 37.4% | |||||
Asia ex Japan | 21.4% | |||||
Europe | 19.3% | |||||
Australia/New Zealand | 3.9% | |||||
Latin America | 3.6% | |||||
Japan | 3.3% | |||||
Africa/Middle East | 1.8% | |||||
Cash, Cash Equivalents, & Other Net Assets | 9.3% | |||||
Total | 100.0% | |||||
| Industry Sector Allocation (as a % of Net Assets)* | ||||||
Technology | 20.9% | |||||
Industrials | 20.5% | |||||
Financials | 18.5% | |||||
Consumer | 13.5% | |||||
Health Care | 11.1% | |||||
Energy & Materials | 5.5% | |||||
Exchange Traded Funds | 0.7% | |||||
Cash, Cash Equivalents, & Other Net Assets | 9.3% | |||||
Total | 100.0% | |||||
| Top 10 Holdings (as a % of Net Assets)* | ||||||
Magellan Financial Group, Ltd. | 2.6% | |||||
First Republic Bank | 2.5% | |||||
Clinigen Group PLC | 2.4% | |||||
Roadrunner Transportation Systems, Inc. | 2.0% | |||||
Melexis NV | 2.0% | |||||
RPS Group PLC | 1.6% | |||||
Universal Truckload Services, Inc. | 1.5% | |||||
China Medical System Holdings, Ltd. | 1.2% | |||||
Hy-Lok Corp. | 1.1% | |||||
Home Capital Group, Inc. | 1.0% | |||||
Total | 17.9% | |||||
| * | Holdings are subject to change. Tables present indicative values only. |
10 | 1.855.377.7325 | www.GrandeurPeakGlobal.com |
| Grandeur Peak Global Reach Fund | Performance Update | |
| October 31, 2013 (Unaudited) |
| Cumulative Total Return Performance for the periods ended October 31, 2013 | ||||||||
| Since | Expense Ratio | |||||||
| Quarter | Inception* | Gross | Net** | |||||
Grandeur Peak Global Reach Fund – Investor (GPROX) | 9.02% | 14.90% | 2.29% | 1.60% | ||||
Grandeur Peak Global Reach Fund – Institutional (GPRIX) | 9.02% | 14.80% | 2.22% | 1.35% | ||||
Russell Global Small Cap Index | 8.19% | 10.71% | ||||||
Russell Global Index | 7.44% | 10.00% | ||||||
| * | Fund inception date of June 19, 2013. |
| ** | Grandeur Peak Global Advisors, LLC (the “Adviser”), has agreed to waive and/or reimburse fees or expenses in order to limit Total Annual Fund Operating Expenses After Fee Waiver/Expense Reimbursement (excluding acquired fund fees and expenses, brokerage expenses, interest expenses, taxes and extraordinary expenses) to 1.60% of the Fund’s average daily net assets for the Investor Class and 1.35% of the Fund’s average daily net assets for the Institutional Class. This agreement is in effect through August 31, 2014. The Fund may have to repay some of these waivers and reimbursements to the Adviser in the following three years. This agreement may not be terminated or modified prior to this date except with the approval of the Fund’s Board of Trustees. |
Returns for periods greater than 1 year are annualized.
The returns shown above do not reflect the deduction of taxes a shareholder would pay on Fund distributions or redemption of Fund shares.
Performance data quoted represents past performance. Past performance does not guarantee future results. Investment return and principal value of an investment will fluctuate so that an investor’s shares, when sold or redeemed, may be worth more or less than the original cost. Current performance data may be higher or lower than actual data quoted. For the most current month-end performance data, please call 1-855-377-PEAK (7325).
Growth of $10,000 for the period ended October 31, 2013
| Semi-Annual Report | October 31, 2013 | 11 |
| Grandeur Peak Global Reach Fund | Performance Update | |
| October 31, 2013 (Unaudited) |
The graphs shown above represent a hypothetical investment of $10,000 in the Fund’s Investor Class shares for the period from inception to 10/31/2013. All returns reflect reinvested dividends, but do not reflect the deduction of taxes that an investor would pay on distributions or redemptions.
The Russell Global Small Cap Index and Russell Global Index are not actively managed and do not reflect any deduction for fees, expenses or taxes. It is not possible to invest directly in an index.
The Fund also offers Institutional Class shares, performance for which is not reflected in the graphs above. The performance of Institutional Class shares may be higher or lower than the performance of the Investor Class shares shown in the graphs above based upon differences in fees paid by shareholders investing in the Investor Class shares and Institutional Class shares.
| Regional Allocation (as a % of Net Assets)* | ||||||
North America | 30.2% | |||||
Asia ex Japan | 29.6% | |||||
Europe | 18.0% | |||||
Japan | 5.1% | |||||
Latin America | 3.4% | |||||
Australia/New Zealand | 3.3% | |||||
Africa/Middle East | 3.1% | |||||
Cash, Cash Equivalents, & Other Net Assets | 7.5% | |||||
Total | 100.0% | |||||
| Industry Sector Allocation (as a % of Net Assets)* | ||||||
Industrials | 22.1% | |||||
Technology | 18.2% | |||||
Financials | 17.8% | |||||
Consumer | 16.1% | |||||
Health Care | 11.8% | |||||
Energy & Materials | 5.7% | |||||
Exchange Traded Funds | 0.8% | |||||
Cash, Cash Equivalents, & Other Net Assets | 7.5% | |||||
Total | 100.0% | |||||
| Top 10 Holdings (as a % of Net Assets)* | ||||||
Magellan Financial Group, Ltd. | 2.2% | |||||
Roadrunner Transportation Systems, Inc. | 2.0% | |||||
Clinigen Group PLC | 1.5% | |||||
China Medical System Holdings, Ltd. | 1.5% | |||||
Labixiaoxin Snacks Group, Ltd. | 1.3% | |||||
First Republic Bank | 1.3% | |||||
Vitasoy International Holdings, Ltd. | 1.0% | |||||
Hy-Lok Corp. | 1.0% | |||||
Trancom Co., Ltd. | 0.9% | |||||
iMarketKorea, Inc. | 0.9% | |||||
Total | 13.6% | |||||
| * | Holdings are subject to change. Tables present indicative values only. |
12 | 1.855.377.7325 | www.GrandeurPeakGlobal.com |
| Grandeur Peak International Opportunities Fund | Performance Update | |
| October 31, 2013 (Unaudited) |
Cumulative Total Return Performance for the periods ended October 31, 2013
| Since | Expense Ratio | |||||||||
| 6 months | 1 Year | Inception* | Gross | Net** | ||||||
Grandeur Peak International Opportunities Fund – Investor (GPIOX) | 15.19% | 36.35% | 27.58% | 1.75% | 1.75% | |||||
Grandeur Peak International Opportunities Fund – Institutional (GPIIX) | 15.14% | 36.32% | 27.83% | 1.50% | 1.50% | |||||
Russell Global ex-U.S. Small Cap Index | 6.18% | 22.23% | 14.80% | |||||||
| * | Fund inception date of October 17, 2011. |
| ** | Grandeur Peak Global Advisors, LLC (the “Adviser”),has agreed to waive and/or reimburse fees or expenses in order to limit Total Annual Fund Operating Expenses After Fee Waiver/Expense Reimbursement (excluding acquired fund fees and expenses, brokerage expenses, interest expenses, taxes and extraordinary expenses) to 1.75% of the Fund’s average daily net assets for the Investor Class and 1.50% of the Fund’s average daily net assets for the Institutional Class. This agreement is in effect through August 31, 2014. The Fund may have to repay some of these waivers and reimbursements to the Adviser in the following three years. This agreement may not be terminated or modified prior to this date except with the approval of the Fund’s Board of Trustees. |
Returns for periods greater than 1 year are annualized.
The returns shown above do not reflect the deduction of taxes a shareholder would pay on Fund distributions or redemption of Fund shares.
Performance data quoted represents past performance. Past performance does not guarantee future results. Investment return and principal value of an investment will fluctuate so that an investor’s shares, when sold or redeemed, may be worth more or less than the original cost. Current performance data may be higher or lower than actual data quoted. For the most current month-end performance data, please call 1-855-377-PEAK (7325).
Growth of $10,000 for the period ended October 31, 2013
| Semi-Annual Report | October 31, 2013 | 13 |
| Grandeur Peak International Opportunities Fund | Performance Update | |
| October 31, 2013 (Unaudited) |
The graphs shown above represent a hypothetical investment of $10,000 in the Fund’s Investor Class shares for the period from inception to 10/31/2013. All returns reflect reinvested dividends, but do not reflect the deduction of taxes that an investor would pay on distributions or redemptions.
The Russell Global ex-U.S. Small Cap Index is not actively managed and does not reflect any deduction for fees, expenses ortaxes. It is not possible to invest directly in an index.
The Fund also offers Institutional Class shares, performance for which is not reflected in the graphs above. The performance of Institutional Class shares may be higher or lower than the performance of the Investor Class shares shown in the graphs above based upon differences in fees paid by shareholders investing in the Investor Class shares and Institutional Class shares.
Regional Allocation (as a % of Net Assets)* | ||||
Asia ex Japan | 37.4 | % | ||
Europe | 26.3 | % | ||
North America | 9.5 | % | ||
Japan | 6.4 | % | ||
Latin America | 4.8 | % | ||
Africa/Middle East | 4.6 | % | ||
Australia/New Zealand | 4.3 | % | ||
Cash, Cash Equivalents, & Other Net Assets | 6.7 | % | ||
Total | 100.0 | % | ||
Industry Sector Allocation (as a % of Net Assets)* | ||||
Industrials | 21.0 | % | ||
Technology | 19.7 | % | ||
Consumer | 18.5 | % | ||
Financials | 14.9 | % | ||
Health Care | 11.6 | % | ||
Energy & Materials | 5.9 | % | ||
Exchange Traded Funds | 1.7 | % | ||
Cash, Cash Equivalents, & Other Net Assets | 6.7 | % | ||
Total | 100.0 | % | ||
Top 10 Holdings (as a % of Net Assets)* | ||||
Clinigen Group PLC | 2.9 | % | ||
Magellan Financial Group, Ltd. | 2.8 | % | ||
China Medical System Holdings, Ltd. | 2.0 | % | ||
Melexis NV | 2.0 | % | ||
RPS Group PLC | 1.9 | % | ||
WisdomTree® India Earnings Fund | 1.6 | % | ||
Hy-Lok Corp. | 1.6 | % | ||
Home Capital Group, Inc. | 1.4 | % | ||
CETIP SA - Mercados Organizados | 1.3 | % | ||
Sporton International, Inc. | 1.3 | % | ||
Total | 18.8 | % | ||
| * | Holdings are subject to change. Tables present indicative values only. |
14 | 1.855.377.7325 | www.GrandeurPeakGlobal.com |
| Grandeur Peak Funds® | Disclosure of Fund Expenses | |
| October 31, 2013 (Unaudited) |
As a shareholder of a Fund, you incur two types of costs: direct costs, such as short-term redemption fees and wire fees, and indirect costs, including management fees, and other fund operating expenses. This example is intended to help you understand your indirect costs, also referred to as “ongoing costs” (in dollars), of investing in the Fund and to compare these costs with the ongoing costs of investing in other mutual funds.
This example is based on an investment of $1,000 invested at the beginning of the period and held for the entire six-month period of May 1, 2013 through October 31, 2013.
Actual Expenses The first line of the table below provides information about actual account values and actual expenses. You may use the information in this line, together with the amount you invested at the beginning of the period, to estimate the expenses that you paid over the period. Simply divide your account value by $1,000 (for example, an $8,600 account value divided by $1,000 = 8.6), then multiply the result by the number in the first line under the heading “Expenses Paid During Period” to estimate the expenses you paid on your account during this period.
Hypothetical Example for Comparison Purposes The second line of the table provides information about hypothetical account values and hypothetical expenses based on the Fund’s actual expense ratio and an assumed rate of return of 5% per year before expenses, which is not the Fund’s actual return. The hypothetical account values and expenses may not be used to estimate the actual ending account balance or expenses you paid for the period. You may use this information to compare ongoing costs of investing in the Fund and other funds. To do so, compare this 5% hypothetical example with the 5% hypothetical examples that appear in the shareholder reports of other funds.
Please note that the expenses shown in the table are meant to highlight your ongoing costs only and do not reflect any direct costs, such as wire fees or low balance fees. Therefore, the second line of the table is useful in comparing ongoing costs only and will not help you determine the relative total costs of owning different funds. In addition, if these direct costs were included, your costs would be higher.
Beginning Account May 1, 2013 | Ending Account October 31, 2013 | Expense Ratio(a) | Expenses Paid During period May 1, 2013 - October 31, 2013(b) | |||||
Grandeur Peak Global Opportunities | ||||||||
Investor Class | ||||||||
Actual | $ 1,000.00 | $ 1,184.10 | 1.72% | $ 9.47 | ||||
Hypothetical (5% return before expenses) | $ 1,000.00 | $ 1,016.53 | 1.72% | $ 8.74 | ||||
Institutional Class | ||||||||
Actual | $ 1,000.00 | $ 1,182.80 | 1.49% | $ 8.20 | ||||
Hypothetical (5% return before expenses) | $ 1,000.00 | $ 1,017.69 | 1.49% | $ 7.58 | ||||
| Semi-Annual Report | October 31, 2013 | 15 |
| Grandeur Peak Funds® | Disclosure of Fund Expenses | |
| October 31, 2013 (Unaudited) |
Beginning Account May 1, 2013 | Ending Account Value October 31, 2013 | Expense Ratio(a) | Expenses Paid During period May 1, 2013 - October 31, 2013(b) | |||||
Grandeur Peak Global Reach | ||||||||
Investor Class | ||||||||
Actual | $ 1,000.00 | $ 1,149.00 | 1.60% | $ 6.31 | ||||
Hypothetical (5% return before expenses) | $ 1,000.00 | $ 1,012.48 | 1.60% | $ 5.91 | ||||
Institutional Class | ||||||||
Actual | $ 1,000.00 | $ 1,148.00 | 1.35% | $ 5.32 | ||||
Hypothetical (5% return before expenses) | $ 1,000.00 | $ 1,013.40 | 1.35% | $ 4.99 | ||||
Beginning Account May 1, 2013 | Ending Account October 31, 2013 | Expense Ratio(a) | Expenses Paid May 1, 2013 - October | |||||
Grandeur Peak International Opportunities | ||||||||
Investor Class | ||||||||
Actual | $ 1,000.00 | $ 1,151.90 | 1.75% | $ 9.49 | ||||
Hypothetical (5% return before expenses) | $ 1,000.00 | $ 1,016.38 | 1.75% | $ 8.89 | ||||
Institutional Class | ||||||||
Actual | $ 1,000.00 | $ 1,151.40 | 1.50% | $ 8.13 | ||||
Hypothetical (5% return before expenses) | $ 1,000.00 | $ 1,017.64 | 1.50% | $ 7.63 | ||||
| (a) | The Fund’s expense ratios have been annualized based on the Fund’s most recent fiscal half-year expenses. |
| (b) | Expenses are equal to the Fund’s annualized expense ratio, multiplied by the average account value over the period, multiplied by the number of days in the most recent fiscal half-year 184/365. |
16 | 1.855.377.7325 | www.GrandeurPeakGlobal.com |
| Grandeur Peak Global Opportunities Fund | Portfolio of Investments | |
| October 31, 2013 (Unaudited) |
| Shares | Value (Note 2) | |||||||
| ||||||||
COMMON STOCKS (89.66%) | ||||||||
Australia (3.87%) | ||||||||
ALS, Ltd. | 89,322 | $ | 846,762 | |||||
Countplus, Ltd. | 315,836 | 531,354 | ||||||
CTI Logistics, Ltd. | 1,210,000 | 2,287,270 | ||||||
Magellan Financial Group, Ltd. | 1,421,583 | 14,981,286 | ||||||
Super Retail Group, Ltd. | 194,522 | 2,459,953 | ||||||
Webjet, Ltd. | 309,300 | 920,858 | ||||||
|
| |||||||
| 22,027,483 | ||||||||
|
| |||||||
Austria (0.29%) | ||||||||
Palfinger AG | 43,935 | 1,622,561 | ||||||
|
| |||||||
Belgium (1.97%) | ||||||||
Melexis NV | 344,434 | 11,209,736 | ||||||
|
| |||||||
Brazil (3.24%) | ||||||||
All America Latina Logistica SA | 358,300 | 1,282,727 | ||||||
Banco Daycoval SA | 1,330,400 | 5,285,492 | ||||||
CETIP SA - Mercados Organizados | 486,688 | 5,396,541 | ||||||
Tegma Gestao Logistica | 392,500 | 3,898,368 | ||||||
Valid Solucoes SA | 168,000 | 2,591,769 | ||||||
|
| |||||||
| 18,454,897 | ||||||||
|
| |||||||
Britain (8.71%) | ||||||||
Abcam PLC | 147,565 | 1,193,685 | ||||||
Bank of Georgia Holdings PLC | 56,600 | 1,791,467 | ||||||
Blinkx PLC(a) | 2,133,694 | 5,610,753 | ||||||
Bovis Homes Group PLC | 247,494 | 3,115,154 | ||||||
Brammer PLC | 399,279 | 3,098,610 | ||||||
Clinigen Group PLC | 1,764,565 | 13,495,879 | ||||||
Halma PLC | 87,270 | 767,515 | ||||||
Hunting PLC | 208,000 | 2,974,906 | ||||||
N Brown Group PLC | 142,580 | 1,199,083 | ||||||
Premier Oil PLC | 716,255 | 3,983,980 | ||||||
Robert Walters PLC | 209,483 | 1,091,635 | ||||||
RPS Group PLC | 1,971,684 | 9,168,123 | ||||||
Ted Baker PLC | 43,070 | 1,178,836 | ||||||
Ultra Electronics Holdings PLC | 29,735 | 922,082 | ||||||
|
| |||||||
| 49,591,708 | ||||||||
|
| |||||||
| Semi-Annual Report | October 31, 2013 | 17 |
| Grandeur Peak Global Opportunities Fund | Portfolio of Investments | |
| October 31, 2013 (Unaudited) |
| Shares | Value (Note 2) | |||||||
| ||||||||
Canada (4.78%) | ||||||||
Atrium Innovations, Inc.(a) | 101,705 | $ | 1,852,374 | |||||
Caracal Energy, Inc.(a) | 308,400 | 2,373,563 | ||||||
Gildan Activewear, Inc. | 19,770 | 952,995 | ||||||
Gran Tierra Energy, Inc.(a) | 652,275 | 4,950,768 | ||||||
Halogen Software, Inc.(a) | 115,600 | 1,538,894 | ||||||
Home Capital Group, Inc. | 73,664 | 5,846,349 | ||||||
Parex Resources, Inc.(a) | 323,000 | 1,868,019 | ||||||
Richelieu Hardware, Ltd. | 66,055 | 2,913,604 | ||||||
ShawCor, Ltd. | 66,645 | 2,801,564 | ||||||
Stantec, Inc. | 35,464 | 2,107,466 | ||||||
|
| |||||||
| 27,205,596 | ||||||||
|
| |||||||
China (3.85%) | ||||||||
Airtac International Group | 132,950 | 963,881 | ||||||
China Medical System Holdings, Ltd. | 7,654,927 | 6,881,832 | ||||||
Labixiaoxin Snacks Group, Ltd. | 8,950,000 | 4,652,199 | ||||||
Montage Technology Group, Ltd.(a) | 87,715 | 1,235,027 | ||||||
NQ Mobile, Inc., ADR(a) | 85,103 | 1,225,483 | ||||||
O2Micro International, Ltd., ADR(a) | 533,250 | 1,583,753 | ||||||
Pacific Online, Ltd. | 3,598,853 | 1,680,362 | ||||||
Tao Heung Holdings, Ltd. | 1,971,300 | 1,512,864 | ||||||
WuXi PharmaTech Cayman, Inc., ADR(a) | 75,500 | 2,208,375 | ||||||
|
| |||||||
| 21,943,776 | ||||||||
|
| |||||||
France (0.97%) | ||||||||
Audika Groupe(a) | 40,667 | 546,637 | ||||||
Neurones | 45,508 | 674,733 | ||||||
Prodware(a) | 189,600 | 1,928,153 | ||||||
Sartorius Stedim Biotech | 7,313 | 1,099,666 | ||||||
Thermador Groupe | 13,992 | 1,254,228 | ||||||
|
| |||||||
| 5,503,417 | ||||||||
|
| |||||||
Germany (2.58%) | ||||||||
Bertrandt AG | 34,055 | 4,455,526 | ||||||
CompuGroup Medical AG | 83,265 | 2,170,061 | ||||||
Gerry Weber International AG | 23,300 | 967,261 | ||||||
Nexus AG | 150,658 | 2,115,116 | ||||||
Softing AG | 63,599 | 1,204,608 | ||||||
Wirecard AG | 104,085 | 3,795,200 | ||||||
|
| |||||||
| 14,707,772 | ||||||||
|
| |||||||
18 | 1.855.377.7325 | www.GrandeurPeakGlobal.com |
| Grandeur Peak Global Opportunities Fund | Portfolio of Investments | |
| October 31, 2013 (Unaudited) |
| Shares | Value (Note 2) | |||||||
| ||||||||
Hong Kong (2.14%) | ||||||||
ASR Holdings, Ltd. | 6,264,200 | $ | 816,051 | |||||
Far East Horizon, Ltd. | 3,522,000 | 2,575,744 | ||||||
Le Saunda Holdings, Ltd. | 4,088,600 | 1,866,844 | ||||||
Man Wah Holdings, Ltd. | 3,153,600 | 5,434,296 | ||||||
Vitasoy International Holdings, Ltd. | 1,135,483 | 1,464,572 | ||||||
|
| |||||||
| 12,157,507 | ||||||||
|
| |||||||
India (2.78%) | ||||||||
Bajaj Corp., Ltd. | 374,496 | 1,492,378 | ||||||
Bajaj Finance, Ltd. | 67,475 | 1,485,592 | ||||||
City Union Bank, Ltd. | 801,867 | 626,306 | ||||||
Crisil, Ltd. | 46,700 | 850,638 | ||||||
eClerx Services, Ltd. | 131,800 | 2,149,484 | ||||||
KPIT Cummins Infosystems, Ltd. | 860,350 | 2,056,552 | ||||||
Mahindra & Mahindra Financial Services, Ltd. | 491,100 | 2,257,118 | ||||||
MakeMyTrip, Ltd.(a) | 79,300 | 1,189,500 | ||||||
Persistent Systems, Ltd. | 140,000 | 1,852,315 | ||||||
Vakrangee Software, Ltd. | 1,677,900 | 1,852,502 | ||||||
|
| |||||||
| 15,812,385 | ||||||||
|
| |||||||
Indonesia (1.61%) | ||||||||
Arwana Citramulia Tbk PT | 16,772,000 | 1,339,082 | ||||||
Astra Graphia Tbk PT | 4,932,000 | 726,292 | ||||||
Express Transindo Utama Tbk PT(a) | 14,487,500 | 1,927,811 | ||||||
Lippo Cikarang Tbk PT(a) | 3,683,000 | 2,205,389 | ||||||
Ultrajaya Milk Industry & Trading Co. Tbk PT(a) | 6,843,500 | 2,989,952 | ||||||
|
| |||||||
| 9,188,526 | ||||||||
|
| |||||||
Ireland (1.29%) | ||||||||
Beazley PLC | 774,000 | 2,839,502 | ||||||
Kentz Corp., Ltd. | 525,100 | 4,496,022 | ||||||
|
| |||||||
| 7,335,524 | ||||||||
|
| |||||||
Israel (0.72%) | ||||||||
Caesar Stone Sdot Yam, Ltd.(a) | 26,700 | 1,125,939 | ||||||
Camtek, Ltd.(a) | 100,000 | 183,000 | ||||||
SodaStream International, Ltd.(a) | 51,800 | 2,769,746 | ||||||
|
| |||||||
| 4,078,685 | ||||||||
|
| |||||||
Japan (3.32%) | ||||||||
AIT Corp. | 199,200 | 1,545,709 | ||||||
| Semi-Annual Report | October 31, 2013 | 19 |
| Grandeur Peak Global Opportunities Fund | Portfolio of Investments | |
| October 31, 2013 (Unaudited) |
| Shares | Value (Note 2) | |||||||
| ||||||||
Japan (continued) | ||||||||
Benefit One, Inc. | 184,000 | $ | 1,830,082 | |||||
CMIC Co., Ltd. | 72,020 | 984,388 | ||||||
Create SD Holdings Co., Ltd. | 47,500 | 1,726,965 | ||||||
CyberAgent, Inc. | 46,300 | 1,259,560 | ||||||
Future Architect, Inc. | 256,100 | 1,497,585 | ||||||
GCA Savvian Corp. | 193,000 | 2,117,838 | ||||||
Hiday Hidaka Corp. | 77,500 | 1,652,776 | ||||||
Seria Co., Ltd. | 40,000 | 1,334,283 | ||||||
Trancom Co., Ltd. | 127,770 | 3,995,655 | ||||||
Watts Co., Ltd. | 104,500 | 969,226 | ||||||
|
| |||||||
| 18,914,067 | ||||||||
|
| |||||||
Luxembourg (0.51%) | ||||||||
L’Occitane International SA | 1,285,953 | 2,915,911 | ||||||
|
| |||||||
Malaysia (2.03%) | ||||||||
AEON Credit Service M Bhd | 607,480 | 3,126,389 | ||||||
Berjaya Food Bhd | 1,793,000 | 940,380 | ||||||
JobStreet Corp. Bhd | 755,200 | 514,547 | ||||||
Kossan Rubber Industries | 346,400 | 701,461 | ||||||
My EG Services Bhd | 4,371,500 | 3,213,982 | ||||||
Padini Holdings Bhd | 4,037,650 | 2,264,784 | ||||||
Uzma Bhd | 537,500 | 806,535 | ||||||
|
| |||||||
| 11,568,078 | ||||||||
|
| |||||||
Mexico (0.38%) | ||||||||
Genomma Lab Internacional SAB de CV, Class B(a) | 807,000 | 2,149,361 | ||||||
|
| |||||||
Norway (0.55%) | ||||||||
Opera Software ASA | 261,200 | 3,159,120 | ||||||
|
| |||||||
Philippines (0.63%) | ||||||||
Security Bank Corp. | 1,106,700 | 3,560,086 | ||||||
|
| |||||||
Russia (0.53%) | ||||||||
MD Medical Group Investments PLC, GDR(b) | 40,900 | 490,800 | ||||||
QIWI PLC, ADR | 62,200 | 2,517,856 | ||||||
|
| |||||||
| 3,008,656 | ||||||||
|
| |||||||
Singapore (1.69%) | ||||||||
ARA Asset Management, Ltd. | 908,488 | 1,342,035 | ||||||
20 | 1.855.377.7325 | www.GrandeurPeakGlobal.com |
| Grandeur Peak Global Opportunities Fund | Portfolio of Investments | |
| October 31, 2013 (Unaudited) |
| Shares | Value (Note 2) | |||||||
Singapore (continued) | ||||||||
Breadtalk Group, Ltd. | 1,488,625 | $ | 1,102,508 | |||||
CSE Global, Ltd. | 1,510,550 | 1,149,146 | ||||||
Goodpack, Ltd. | 1,221,800 | 1,883,551 | ||||||
Parkson Retail Asia, Ltd. | 1,155,000 | 985,590 | ||||||
Petra Foods, Ltd. | 740,000 | 2,114,796 | ||||||
Riverstone Holdings, Ltd. | 1,756,600 | 1,032,296 | ||||||
|
| |||||||
| 9,609,922 | ||||||||
|
| |||||||
South Africa (0.95%) | ||||||||
Clicks Group, Ltd. | 128,785 | 802,441 | ||||||
Ellies Holdings, Ltd.(a) | 310,000 | 203,810 | ||||||
EOH Holdings, Ltd. | 153,300 | 1,241,518 | ||||||
Foschini Group, Ltd. | 69,035 | 795,033 | ||||||
Super Group, Ltd.(a) | 959,307 | 2,350,786 | ||||||
|
| |||||||
| 5,393,588 | ||||||||
|
| |||||||
South Korea (3.34%) | ||||||||
Able C&C Co., Ltd. | 27,300 | 802,979 | ||||||
Daum Communications Corp. | 28,400 | 2,369,456 | ||||||
Duksan Hi-Metal Co., Ltd.(a) | 19,600 | 387,103 | ||||||
Handsome Co., Ltd. | 38,700 | 1,109,102 | ||||||
Hy-Lok Corp. | 239,250 | 6,022,130 | ||||||
Koh Young Technology, Inc. | 59,410 | 1,772,639 | ||||||
Kolao Holdings | 43,500 | 1,273,321 | ||||||
KONA@I Co., Ltd. | 90,900 | 2,827,905 | ||||||
KT Skylife Co., Ltd. | 46,000 | 1,218,572 | ||||||
LG Fashion Corp. | 40,350 | 1,236,271 | ||||||
|
| |||||||
| 19,019,478 | ||||||||
|
| |||||||
Sweden (1.84%) | ||||||||
AddTech AB, Class B | 55,409 | 2,526,733 | ||||||
Beijer Alma AB | 105,000 | 2,746,507 | ||||||
HIQ International AB | 141,118 | 818,827 | ||||||
Indutrade AB | 35,564 | 1,391,266 | ||||||
Moberg Pharma AB(a) | 180,000 | 930,548 | ||||||
Opus Group AB | 1,619,100 | 2,073,831 | ||||||
|
| |||||||
| 10,487,712 | ||||||||
|
| |||||||
Switzerland (0.18%) | ||||||||
VZ Holding AG | 5,826 | 1,046,606 | ||||||
|
| |||||||
| Semi-Annual Report | October 31, 2013 | 21 |
| Grandeur Peak Global Opportunities Fund | Portfolio of Investments | |
| October 31, 2013 (Unaudited) |
| Shares | Value (Note 2) | |||||||
Taiwan (1.92%) | ||||||||
Cub Elecparts, Inc. | 180,000 | $ | 592,454 | |||||
Leadtrend Technology Corp. | 238,000 | 312,694 | ||||||
Pacific Hospital Supply Co. | 500,150 | 1,864,103 | ||||||
Polyronics Tech Corp. | 1,027,200 | 2,090,797 | ||||||
Power Mate Technology Co., Ltd. | 100,000 | 155,040 | ||||||
Sporton International, Inc. | 1,073,596 | 3,873,489 | ||||||
Taiwan Hon Chuan Enterprise Co., Ltd. | 371,000 | 782,927 | ||||||
Test Research, Inc. | 944,708 | 1,286,214 | ||||||
|
| |||||||
| 10,957,718 | ||||||||
|
| |||||||
Thailand (0.68%) | ||||||||
Coastal Energy Co. (Toronto Exchange)(a) | 107,000 | 1,902,633 | ||||||
Premier Marketing PCL | 7,028,000 | 1,941,873 | ||||||
|
| |||||||
| 3,844,506 | ||||||||
|
| |||||||
Turkey (0.68%) | ||||||||
Albaraka Turk Katilim Bankasi AS(a) | 1,530,683 | 1,364,867 | ||||||
Emlak Konut Gayrimenkul Yatirim Ortakligi AS, REIT | 778,000 | 1,110,733 | ||||||
TAV Havalimanlari Holding AS | 195,500 | 1,420,037 | ||||||
|
| |||||||
| 3,895,637 | ||||||||
|
| |||||||
United Arab Emirates (0.10%) | ||||||||
Aramex PJSC | 755,100 | 557,125 | ||||||
|
| |||||||
United States (31.53%) | ||||||||
Abaxis, Inc. | 99,130 | 3,541,915 | ||||||
ABIOMED, Inc.(a) | 197,300 | 4,731,254 | ||||||
Allegiant Travel Co. | 18,455 | 1,924,303 | ||||||
Altisource Residential Corp. | 68,300 | 1,814,731 | ||||||
Amsurg Corp.(a) | 33,230 | 1,425,235 | ||||||
Ares Capital Corp. | 152,747 | 2,653,215 | ||||||
Big 5 Sporting Goods Corp. | 71,650 | 1,354,901 | ||||||
Cardica, Inc.(a) | 650,000 | 780,000 | ||||||
Cardtronics, Inc.(a) | 47,450 | 1,862,412 | ||||||
Cempra, Inc.(a) | 221,300 | 2,513,968 | ||||||
Colony Financial, Inc., REIT | 93,000 | 1,881,390 | ||||||
Computer Task Group, Inc. | 92,900 | 1,591,377 | ||||||
Covance, Inc.(a) | 27,832 | 2,484,284 | ||||||
CRA International, Inc.(a) | 106,473 | 2,028,311 | ||||||
Diamond Hill Investment Group, Inc. | 16,482 | 1,817,470 | ||||||
Dice Holdings, Inc.(a) | 256,100 | 1,890,018 | ||||||
22 | 1.855.377.7325 | www.GrandeurPeakGlobal.com |
| Grandeur Peak Global Opportunities Fund | Portfolio of Investments | |
| October 31, 2013 (Unaudited) |
| Shares | Value (Note 2) | |||||||
United States (continued) | ||||||||
Ellie Mae, Inc.(a) | 90,200 | $ | 2,606,780 | |||||
EPAM Systems, Inc.(a) | 105,500 | 3,953,085 | ||||||
ExamWorks Group, Inc.(a) | 43,050 | 1,112,842 | ||||||
ExlService Holdings, Inc.(a) | 81,000 | 2,341,710 | ||||||
First Cash Financial Services, Inc.(a) | 48,800 | 2,951,912 | ||||||
First Republic Bank | 281,205 | 14,361,139 | ||||||
Fox Factory Holding Corp.(a) | 26,400 | 459,888 | ||||||
Geospace Technologies Corp.(a) | 23,100 | 2,250,402 | ||||||
Grand Canyon Education, Inc.(a) | 45,300 | 2,141,331 | ||||||
ICU Medical, Inc.(a) | 19,700 | 1,217,460 | ||||||
Integrated Silicon Solution, Inc.(a) | 194,100 | 2,092,398 | ||||||
Jones Energy, Inc., Class A(a) | 230,500 | 3,690,305 | ||||||
Knight Transportation, Inc. | 191,595 | 3,251,367 | ||||||
Littelfuse, Inc. | 47,000 | 3,996,410 | ||||||
LSB Industries, Inc.(a) | 55,900 | 2,052,648 | ||||||
Manitex International, Inc.(a) | 208,055 | 2,690,151 | ||||||
Manning & Napier, Inc. | 234,850 | 3,898,510 | ||||||
MarketAxess Holdings, Inc. | 59,900 | 3,907,277 | ||||||
Maxim Integrated Products, Inc. | 112,675 | 3,346,448 | ||||||
MaxLinear, Inc., Class A(a) | 296,500 | 2,567,690 | ||||||
Meridian Bioscience, Inc. | 78,700 | 1,945,464 | ||||||
Micrel, Inc. | 174,719 | 1,607,415 | ||||||
Microchip Technology, Inc. | 102,245 | 4,392,445 | ||||||
Misonix, Inc.(a) | 53,211 | 222,422 | ||||||
MiX Telematics, Ltd., ADR(a) | 88,600 | 1,155,344 | ||||||
Myriad Genetics, Inc.(a) | 41,095 | 1,001,896 | ||||||
Navigant Consulting, Inc.(a) | 96,910 | 1,681,389 | ||||||
NorthStar Realty Finance Corp., REIT | 200,100 | 1,866,933 | ||||||
Nu Skin Enterprises, Inc., Class A | 17,100 | 1,999,503 | ||||||
Pegasystems, Inc. | 72,250 | 2,749,835 | ||||||
Pericom Semiconductor Corp.(a) | 337,960 | 2,730,717 | ||||||
Polypore International, Inc.(a) | 60,650 | 2,741,380 | ||||||
Portfolio Recovery Associates, Inc.(a) | 32,365 | 1,924,099 | ||||||
Power Integrations, Inc. | 65,175 | 3,743,652 | ||||||
RealPage, Inc.(a) | 107,000 | 2,624,710 | ||||||
Redwood Trust, Inc., REIT | 122,000 | 2,137,440 | ||||||
Resources Connection, Inc. | 209,975 | 2,679,281 | ||||||
RG Barry Corp. | 17,574 | 335,312 | ||||||
Roadrunner Transportation Systems, Inc.(a) | 440,400 | 11,670,600 | ||||||
SEI Investments Co. | 56,200 | 1,865,278 | ||||||
Silicon Laboratories, Inc.(a) | 53,140 | 2,137,291 | ||||||
| Semi-Annual Report | October 31, 2013 | 23 |
| Grandeur Peak Global Opportunities Fund | Portfolio of Investments | |
| October 31, 2013 (Unaudited) |
| Shares | Value (Note 2) | |||||||
United States (continued) | ||||||||
Sonus Networks, Inc.(a) | 424,100 | $ | 1,272,300 | |||||
Staar Surgical Co.(a) | 266,800 | 3,532,432 | ||||||
Syntel, Inc. | 48,000 | 4,120,320 | ||||||
Tilly’s, Inc., Class A(a) | 341,846 | 4,977,278 | ||||||
Universal Truckload Services, Inc. | 323,973 | 8,637,120 | ||||||
Vocera Communications, Inc.(a) | 94,500 | 1,590,435 | ||||||
WageWorks, Inc.(a) | 20,000 | 1,024,200 | ||||||
Whitestone, REIT | 143,750 | 1,982,313 | ||||||
|
| |||||||
| 179,533,341 | ||||||||
|
| |||||||
TOTAL COMMON STOCKS (Cost $404,432,179) | 510,460,485 | |||||||
|
| |||||||
PREFERRED STOCKS (0.32%) | ||||||||
Brazil (0.32%) | ||||||||
Banco ABC Brasil SA | 295,393 | 1,818,351 | ||||||
|
| |||||||
TOTAL PREFERRED STOCKS (Cost $1,739,778) | 1,818,351 | |||||||
|
| |||||||
EXCHANGE TRADED FUNDS (0.68%) | ||||||||
WisdomTree® India Earnings Fund | 231,018 | 3,876,482 | ||||||
TOTAL EXCHANGE TRADED FUNDS (Cost $4,134,195) | 3,876,482 | |||||||
|
| |||||||
SHORT TERM INVESTMENTS (7.70%) | ||||||||
BlackRock Liquidity Funds Treasury Trust Fund | 43,827,593 | 43,827,593 | ||||||
|
| |||||||
TOTAL SHORT TERM INVESTMENTS (Cost $43,827,593) | 43,827,593 | |||||||
|
| |||||||
24 | 1.855.377.7325 | www.GrandeurPeakGlobal.com |
| Grandeur Peak Global Opportunities Fund | Portfolio of Investments | |
| October 31, 2013 (Unaudited) |
TOTAL INVESTMENTS (98.36%) (Cost $454,133,745) | $ | 559,982,911 | ||
Assets In Excess Of Other Liabilities (1.64%) | 9,344,590 | |||
|
| |||
NET ASSETS (100.00%) | $ | 569,327,501 | ||
|
| |||
| (a) | Non-Income Producing Security. |
| (b) | Security was purchased pursuant to Regulation S under the Securities Act of 1933, which exempts securities offered and sold outside of the United States from registration. Such security cannot be sold in the United States without either an effective registration statement filed pursuant to the Securities Act of 1933, or pursuant to an exemption from registration. The security has been deemed liquid under guidelines approved by the Fund’s Board of Trustees. As of October 31, 2013, the aggregate market value of those securities was $490,800, representing 0.09% of net assets. |
| (c) | Less than 0.0005% 7 Day Yield. |
Common Abbreviations:
AB - Aktiebolag is the Swedish equivalent of the term corporation.
ADR - American Depositary Receipt.
AG - Aktiengesellschaft is a German term that refers to a corporation that is limited by shares, i.e., owned by shareholders.
AS - Aktieselskab is the Danish term for a stock-based corporation.
ASA - Allmennaksjeselskap is the Norwegian term for public limited company.
Bhd - Berhad is the Malaysian term for public limited company.
GDR - Global Depositary Receipt.
Ltd. - Limited.
NV - Naamloze Vennootschap is the Dutch term for a public limited liability corporation.
PCL - Public Company Limited.
PLC - Public Limited Company.
PJSC - Public Joint Stock Company.
REIT - Real Estate Investment Trust.
SA - Generally designates corporations in various countries, mostly those employing the civil law.
SAB de CV - A variable capital company.
Tbk PT - Terbuka Perseroan Terbatas is an Indonesian term for a limited liability company.
Holdings are subject to change.
For Fund compliance purposes, the Fund’s geographical classifications refer to any one or more of the country sub-classifications used by one or more widely recognized market indexes or ratings group indexes, and/or as defined by Fund management. This definition may not apply for purposes of this report, which may combine sub-classifications for reporting ease. Geographical regions are shown as a percentage of net assets.
See Notes to Financial Statements.
| Semi-Annual Report | October 31, 2013 | 25 |
| Grandeur Peak Global Reach Fund | Portfolio of Investments | |
| October 31, 2013 (Unaudited) |
| Shares | Value (Note 2) | |||||||
COMMON STOCKS (91.59%) | ||||||||
Australia (3.28%) | ||||||||
ALS, Ltd. | 3,600 | $ | 34,128 | |||||
Countplus, Ltd. | 66,900 | 112,551 | ||||||
CTI Logistics, Ltd. | 103,602 | 195,839 | ||||||
Lycopodium, Ltd. | 7,000 | 32,419 | ||||||
Magellan Financial Group, Ltd. | 103,100 | 1,086,514 | ||||||
Medical Developments International, Ltd. | 14,728 | 17,679 | ||||||
Navitas, Ltd. | 7,350 | 40,292 | ||||||
Super Retail Group, Ltd. | 1,525 | 19,285 | ||||||
Webjet, Ltd. | 36,100 | 107,478 | ||||||
|
| |||||||
| 1,646,185 | ||||||||
|
| |||||||
Austria (0.13%) | ||||||||
Palfinger AG | 1,750 | 64,629 | ||||||
|
| |||||||
Belgium (0.69%) | ||||||||
Melexis NV | 10,600 | 344,981 | ||||||
|
| |||||||
Brazil (3.17%) | ||||||||
All America Latina Logistica SA | 14,200 | 50,836 | ||||||
Arezzo Industria e Comercio SA | 1,800 | 26,917 | ||||||
Banco Daycoval SA | 91,000 | 361,530 | ||||||
Brazil Fast Food Corp.(a) | 7,100 | 110,050 | ||||||
CETIP SA - Mercados Organizados | 24,900 | 276,098 | ||||||
Cia de Locacao das Americas | 60,600 | 229,935 | ||||||
Even Construtora e Incorporadora SA | 9,500 | 35,410 | ||||||
Fleury SA | 5,900 | 45,695 | ||||||
Odontoprev SA | 24,600 | 101,686 | ||||||
Qualicorp SA(a) | 4,800 | 44,953 | ||||||
Raia Drogasil SA | 4,400 | 32,172 | ||||||
Tegma Gestao Logistica | 13,300 | 132,098 | ||||||
Totvs SA | 4,400 | 74,597 | ||||||
Valid Solucoes SA | 4,300 | 66,337 | ||||||
|
| |||||||
| 1,588,314 | ||||||||
|
| |||||||
Britain (8.20%) | ||||||||
Abcam PLC | 6,400 | 51,771 | ||||||
Aberdeen Asset Management PLC | 17,050 | 121,081 | ||||||
Advanced Medical Solutions Group PLC | 73,100 | 114,572 | ||||||
Afren PLC(a) | 40,000 | 101,143 | ||||||
Anglo American PLC | 3,712 | 88,385 | ||||||
26 | 1.855.377.7325 | www.GrandeurPeakGlobal.com |
| Grandeur Peak Global Reach Fund | Portfolio of Investments | |
| October 31, 2013 (Unaudited) |
| Shares | Value (Note 2) | |||||||
Britain (continued) | ||||||||
Bank of Georgia Holdings PLC | 7,100 | $ | 224,725 | |||||
Blinkx PLC(a) | 74,400 | 195,642 | ||||||
Bovis Homes Group PLC | 11,000 | 138,455 | ||||||
Brammer PLC | 27,400 | 212,638 | ||||||
Brooks Macdonald Group PLC | 1,314 | 29,971 | ||||||
Clinigen Group PLC | 99,500 | 761,003 | ||||||
CVS Group PLC | 11,400 | 48,668 | ||||||
Dotdigital Group PLC(a) | 290,300 | 99,471 | ||||||
Globo PLC(a) | 70,000 | 76,322 | ||||||
Halma PLC | 2,022 | 17,783 | ||||||
Hargreaves Lansdown PLC | 5,200 | 99,219 | ||||||
Hunting PLC | 17,800 | 254,583 | ||||||
IDOX PLC | 359,200 | 218,859 | ||||||
IG Group Holdings PLC | 22,126 | 217,652 | ||||||
Lancashire Holdings, Ltd. | 3,413 | 44,436 | ||||||
Premier Oil PLC | 21,900 | 121,813 | ||||||
RPS Group PLC | 80,000 | 371,992 | ||||||
Sthree PLC | 6,800 | 39,197 | ||||||
Ted Baker PLC | 4,200 | 114,955 | ||||||
Topps Tiles PLC | 105,000 | 148,997 | ||||||
Tracsis PLC | 15,000 | 44,495 | ||||||
Ultra Electronics Holdings PLC | 1,250 | 38,763 | ||||||
WANdisco PLC(a) | 6,300 | 117,076 | ||||||
|
| |||||||
| 4,113,667 | ||||||||
|
| |||||||
Canada (3.30%) | ||||||||
Atrium Innovations, Inc.(a) | 8,000 | 145,706 | ||||||
Caracal Energy, Inc.(a) | 28,200 | 217,038 | ||||||
Contrans Group, Inc., Class A | 4,200 | 54,059 | ||||||
Descartes Systems Group, Inc.(a) | 7,900 | 96,756 | ||||||
Gildan Activewear, Inc. | 350 | 16,872 | ||||||
Gran Tierra Energy, Inc.(a) | 27,400 | 207,966 | ||||||
Halogen Software, Inc.(a) | 5,100 | 67,892 | ||||||
Home Capital Group, Inc. | 3,025 | 240,079 | ||||||
Parex Resources, Inc.(a) | 27,300 | 157,885 | ||||||
Richelieu Hardware, Ltd. | 1,600 | 70,574 | ||||||
ShawCor, Ltd. | 4,050 | 170,250 | ||||||
Stantec, Inc. | 800 | 47,541 | ||||||
Symbility Solutions, Inc.(a) | 89,000 | 39,265 | ||||||
| Semi-Annual Report | October 31, 2013 | 27 |
| Grandeur Peak Global Reach Fund | Portfolio of Investments | |
| October 31, 2013 (Unaudited) |
| Shares | Value (Note 2) | |||||||
Canada (continued) | ||||||||
TransForce, Inc. | 5,700 | $ | 126,229 | |||||
|
| |||||||
| 1,658,112 | ||||||||
|
| |||||||
China (5.22%) | ||||||||
AAC Technologies Holdings, Inc. | 16,000 | 70,682 | ||||||
Bolina Holding Co., Ltd. | 449,500 | 191,326 | ||||||
CapitaRetail China Trust, REIT | 82,000 | 92,087 | ||||||
China Medical System Holdings, Ltd. | 840,000 | 755,166 | ||||||
Cowealth Medical Holding Co., Ltd. | 45,000 | 134,022 | ||||||
Labixiaoxin Snacks Group, Ltd. | 1,287,000 | 668,981 | ||||||
Mindray Medical International, Ltd., ADR | 2,400 | 90,264 | ||||||
Montage Technology Group, Ltd.(a) | 10,405 | 146,502 | ||||||
NQ Mobile, Inc., ADR(a) | 7,351 | 105,854 | ||||||
O2Micro International, Ltd., ADR(a) | 21,150 | 62,816 | ||||||
Pacific Online, Ltd. | 240,000 | 112,060 | ||||||
Tao Heung Holdings, Ltd. | 98,000 | 75,210 | ||||||
WuXi PharmaTech Cayman, Inc., ADR(a) | 3,985 | 116,561 | ||||||
|
| |||||||
| 2,621,531 | ||||||||
|
| |||||||
Denmark (0.03%) | ||||||||
Trifork AS | 7,000 | 15,610 | ||||||
|
| |||||||
Finland (0.22%) | ||||||||
BasWare OYJ | 1,400 | 40,868 | ||||||
Revenio Group OYJ | 4,550 | 71,539 | ||||||
|
| |||||||
| 112,407 | ||||||||
|
| |||||||
France (1.91%) | ||||||||
1000mercis(a) | 1,650 | 104,308 | ||||||
Audika Groupe(a) | 3,474 | 46,697 | ||||||
Esker SA | 7,100 | 129,273 | ||||||
GameLoft SE(a) | 12,600 | 133,782 | ||||||
ID Logistics Group(a) | 900 | 64,765 | ||||||
NetGem SA | 11,800 | 45,181 | ||||||
Norbert Dentressangle SA | 1,000 | 113,372 | ||||||
Prodware(a) | 17,900 | 182,036 | ||||||
Sartorius Stedim Biotech | 760 | 114,282 | ||||||
Thermador Groupe | 300 | 26,892 | ||||||
|
| |||||||
| 960,588 | ||||||||
|
| |||||||
28 | 1.855.377.7325 | www.GrandeurPeakGlobal.com |
| Grandeur Peak Global Reach Fund | Portfolio of Investments | |
| October 31, 2013 (Unaudited) |
| Shares | Value (Note 2) | |||||||
Germany (2.21%) | ||||||||
2G Energy AG | 3,050 | $ | 113,882 | |||||
Adler Modemaerkte AG | 5,400 | 70,019 | ||||||
Aurelius AG | 3,300 | 112,642 | ||||||
Bertrandt AG | 860 | 112,517 | ||||||
CompuGroup Medical AG | 3,800 | 99,036 | ||||||
Gerry Weber International AG | 1,150 | 47,740 | ||||||
Joyou AG(a) | 6,500 | 123,114 | ||||||
LPKF Laser & Electronics AG | 4,700 | 98,115 | ||||||
Nexus AG | 8,750 | 122,843 | ||||||
Softing AG | 3,800 | 71,975 | ||||||
Tomorrow Focus AG | 17,100 | 102,622 | ||||||
Wirecard AG | 1,000 | 36,462 | ||||||
|
| |||||||
| 1,110,967 | ||||||||
|
| |||||||
Hong Kong (3.73%) | ||||||||
ASR Holdings, Ltd. | 2,079,000 | 270,836 | ||||||
China Shineway Pharmaceutical Group, Ltd. | 68,000 | 105,250 | ||||||
Far East Horizon, Ltd. | 313,000 | 228,906 | ||||||
Le Saunda Holdings, Ltd. | 236,000 | 107,757 | ||||||
Man Wah Holdings, Ltd. | 167,200 | 288,120 | ||||||
SPT Energy Group, Inc. | 326,000 | 179,546 | ||||||
Trigiant Group, Ltd. | 128,000 | 48,373 | ||||||
Tsui Wah Holdings, Ltd. | 56,000 | 38,499 | ||||||
Value Partners Group, Ltd. | 188,000 | 114,211 | ||||||
Vitasoy International Holdings, Ltd. | 380,000 | 490,133 | ||||||
|
| |||||||
| 1,871,631 | ||||||||
|
| |||||||
India (0.10%) | ||||||||
MakeMyTrip, Ltd.(a) | 3,245 | 48,675 | ||||||
|
| |||||||
Indonesia (2.20%) | ||||||||
Arwana Citramulia Tbk PT | 468,000 | 37,365 | ||||||
Astra Graphia Tbk PT | 416,000 | 61,261 | ||||||
Bank Tabungan Pensiunan Nasional Tbk PT(a) | 196,500 | 76,264 | ||||||
BFI Finance Indonesia Tbk PT(a) | 80,000 | 17,742 | ||||||
Express Transindo Utama Tbk PT(a) | 1,610,000 | 214,238 | ||||||
Hexindo Adiperkasa Tbk PT | 379,000 | 105,908 | ||||||
Lippo Cikarang Tbk PT(a) | 344,000 | 205,988 | ||||||
Tempo Scan Pacific Tbk PT | 188,000 | 65,043 | ||||||
| Semi-Annual Report | October 31, 2013 | 29 |
| Grandeur Peak Global Reach Fund | Portfolio of Investments | |
| October 31, 2013 (Unaudited) |
| Shares | Value (Note 2) | |||||||
Indonesia (continued) | ||||||||
Ultrajaya Milk Industry & Trading Co. Tbk PT(a) | 727,500 | $ | 317,848 | |||||
|
| |||||||
| 1,101,657 | ||||||||
|
| |||||||
Ireland (0.97%) | ||||||||
Beazley PLC | 32,800 | 120,330 | ||||||
Kentz Corp., Ltd. | 43,000 | 368,176 | ||||||
|
| |||||||
| 488,506 | ||||||||
|
| |||||||
Israel (1.41%) | ||||||||
Caesar Stone Sdot Yam, Ltd.(a) | 1,115 | 47,020 | ||||||
Camtek, Ltd.(a) | 17,000 | 31,110 | ||||||
Clicksoftware Technologies, Ltd. | 5,500 | 39,820 | ||||||
Magic Software Enterprises, Ltd. | 19,400 | 119,892 | ||||||
Sarin Technologies, Ltd. | 151,000 | 230,961 | ||||||
SodaStream International, Ltd.(a) | 4,500 | 240,615 | ||||||
|
| |||||||
| 709,418 | ||||||||
|
| |||||||
Italy (0.10%) | ||||||||
Cosmo Pharmaceuticals SpA(a) | 700 | 48,834 | ||||||
|
| |||||||
Japan (5.09%) | ||||||||
AIT Corp. | 16,000 | 124,153 | ||||||
Benefit One, Inc. | 20,600 | 204,890 | ||||||
CMIC Co., Ltd. | 3,200 | 43,738 | ||||||
Create SD Holdings Co., Ltd. | 1,500 | 54,536 | ||||||
CyberAgent, Inc. | 2,200 | 59,849 | ||||||
Daikokutenbussan Co. | 1,800 | 53,929 | ||||||
Future Architect, Inc. | 34,100 | 199,405 | ||||||
GCA Savvian Corp. | 20,000 | 219,465 | ||||||
Gurunavi, Inc. | 5,000 | 107,546 | ||||||
Hiday Hidaka Corp. | 4,200 | 89,570 | ||||||
Jin Co., Ltd. | 1,300 | 51,429 | ||||||
Monogatari Corp. | 3,700 | 154,465 | ||||||
Nakanishi, Inc. | 400 | 56,870 | ||||||
Next Co., Ltd. | 1,000 | 30,255 | ||||||
Seria Co., Ltd. | 1,000 | 33,357 | ||||||
Shaklee Global Group, Inc.(a) | 6,000 | 97,081 | ||||||
Syuppin Co., Ltd. | 6,700 | 71,681 | ||||||
Teikoku Electric Manufacturing Co., Ltd. | 8,200 | 192,470 | ||||||
Trancom Co., Ltd. | 15,200 | 475,338 | ||||||
Vector, Inc. | 1,600 | 56,870 | ||||||
30 | 1.855.377.7325 | www.GrandeurPeakGlobal.com |
| Grandeur Peak Global Reach Fund | Portfolio of Investments | |
| October 31, 2013 (Unaudited) |
| Shares | Value (Note 2) | |||||||
Japan (continued) | ||||||||
Watts Co., Ltd. | 12,300 | $ | 114,081 | |||||
WirelessGate, Inc.(a) | 2,000 | 61,019 | ||||||
|
| |||||||
| 2,551,997 | ||||||||
|
| |||||||
Kazakhstan (0.23%) | ||||||||
Zhaikmunai LP, GDR(b) | 8,700 | 113,100 | ||||||
|
| |||||||
Luxembourg (0.49%) | ||||||||
L’Occitane International SA | 108,500 | 246,025 | ||||||
|
| |||||||
Malaysia (2.33%) | ||||||||
AEON Credit Service M Bhd | 36,000 | 185,273 | ||||||
Berjaya Food Bhd | 180,000 | 94,405 | ||||||
CB Industrial Product Holding Bhd | 204,000 | 189,419 | ||||||
Freight Management Holdings Bhd | 71,900 | 36,456 | ||||||
JobStreet Corp. Bhd | 115,000 | 78,354 | ||||||
Kossan Rubber Industries | 52,500 | 106,313 | ||||||
Malaysia Building Society | 61,400 | 54,482 | ||||||
My EG Services Bhd | 225,000 | 165,423 | ||||||
Padini Holdings Bhd | 159,500 | 89,466 | ||||||
Perisai Petroleum Teknologi Bhd(a) | 120,000 | 53,620 | ||||||
Power Root Bhd | 190,000 | 113,799 | ||||||
|
| |||||||
| 1,167,010 | ||||||||
|
| |||||||
Mexico (0.53%) | ||||||||
Genomma Lab Internacional SAB de CV, Class B(a) | 63,100 | 168,060 | ||||||
Grupo Lala SAB de CV(a) | 20,000 | 44,408 | ||||||
Medica Sur SAB de CV | 20,838 | 55,101 | ||||||
|
| |||||||
| 267,569 | ||||||||
|
| |||||||
Netherlands (0.28%) | ||||||||
Aalberts Industries NV | 1,800 | 53,865 | ||||||
Brunel International NV | 1,500 | 88,267 | ||||||
|
| |||||||
| 142,132 | ||||||||
|
| |||||||
Norway (0.35%) | ||||||||
Medistim ASA | 11,250 | 43,465 | ||||||
Opera Software ASA | 11,100 | 134,251 | ||||||
|
| |||||||
| 177,716 | ||||||||
|
| |||||||
| Semi-Annual Report | October 31, 2013 | 31 |
| Grandeur Peak Global Reach Fund | Portfolio of Investments | |
| October 31, 2013 (Unaudited) |
| Shares | Value (Note 2) | |||||||
Philippines (2.57%) | ||||||||
COL Financial Group, Inc. | 240,000 | $ | 94,423 | |||||
GT Capital Holdings, Inc. | 4,800 | 95,089 | ||||||
Pepsi-Cola Products Philippines, Inc. | 2,173,200 | 243,926 | ||||||
Puregold Price Club, Inc. | 131,000 | 136,730 | ||||||
RFM Corp. | 3,203,600 | 407,771 | ||||||
Security Bank Corp. | 97,000 | 312,034 | ||||||
|
| |||||||
| 1,289,973 | ||||||||
|
| |||||||
Russia (0.23%) | ||||||||
MD Medical Group Investments PLC, GDR(b) | 9,455 | 113,460 | ||||||
|
| |||||||
Singapore (2.85%) | ||||||||
ARA Asset Management, Ltd. | 95,000 | 140,336 | ||||||
Breadtalk Group, Ltd. | 49,000 | 36,290 | ||||||
CSE Global, Ltd. | 219,000 | 166,604 | ||||||
Goodpack, Ltd. | 98,200 | 151,387 | ||||||
Midas Holdings, Ltd. | 297,000 | 119,546 | ||||||
Parkson Retail Asia, Ltd. | 63,000 | 53,759 | ||||||
Petra Foods, Ltd. | 108,000 | 308,646 | ||||||
Riverstone Holdings, Ltd. | 264,400 | 155,379 | ||||||
Super Group, Ltd. | 28,000 | 94,896 | ||||||
Technovator International, Ltd.(a) | 166,000 | 67,659 | ||||||
United Envirotech, Ltd. | 129,000 | 86,713 | ||||||
Wing Tai Holdings, Ltd. | 26,000 | 46,257 | ||||||
|
| |||||||
| 1,427,472 | ||||||||
|
| |||||||
South Africa (1.46%) | ||||||||
Clicks Group, Ltd. | 8,800 | 54,832 | ||||||
Ellies Holdings, Ltd.(a) | 238,700 | 156,934 | ||||||
EOH Holdings, Ltd. | 6,600 | 53,451 | ||||||
Foschini Group, Ltd. | 3,200 | 36,852 | ||||||
Italtile, Ltd. | 15,000 | 10,982 | ||||||
OneLogix Group, Ltd. | 468,238 | 168,848 | ||||||
Pinnacle Technology Holdings, Ltd. | 22,500 | 55,047 | ||||||
Super Group, Ltd.(a) | 54,600 | 133,798 | ||||||
Value Group, Ltd. | 90,000 | 61,322 | ||||||
|
| |||||||
| 732,066 | ||||||||
|
| |||||||
South Korea (4.09%) | ||||||||
Able C&C Co., Ltd. | 2,000 | 58,826 | ||||||
Daum Communications Corp. | 1,350 | 112,632 | ||||||
32 | 1.855.377.7325 | www.GrandeurPeakGlobal.com |
| Grandeur Peak Global Reach Fund | Portfolio of Investments | |
| October 31, 2013 (Unaudited) |
| Shares | Value (Note 2) | |||||||
South Korea (continued) | ||||||||
Duksan Hi-Metal Co., Ltd.(a) | 6,000 | $ | 118,501 | |||||
ENF Technology Co., Ltd. | 10,000 | 92,576 | ||||||
Global Display Co., Ltd. | 2,700 | 50,526 | ||||||
Hy-Lok Corp. | 19,000 | 478,246 | ||||||
iMarketKorea, Inc. | 19,000 | 452,274 | ||||||
Koh Young Technology, Inc. | 2,400 | 71,610 | ||||||
Kolao Holdings | 1,200 | 35,126 | ||||||
KONA@I Co., Ltd. | 4,800 | 149,328 | ||||||
KT Skylife Co., Ltd. | 2,800 | 74,174 | ||||||
LEENO Industrial, Inc. | 6,100 | 122,489 | ||||||
LG Fashion Corp. | 1,500 | 45,958 | ||||||
MKTrend Co., Ltd. | 3,364 | 24,610 | ||||||
Vieworks Co., Ltd. | 1,400 | 36,823 | ||||||
Wins Technet Co., Ltd. | 7,500 | 130,097 | ||||||
|
| |||||||
| 2,053,796 | ||||||||
|
| |||||||
Spain (0.09%) | ||||||||
Let’s GOWEX SA | 3,600 | 45,067 | ||||||
|
| |||||||
Sweden (1.79%) | ||||||||
AddTech AB, Class B | 3,000 | 136,804 | ||||||
Beijer Alma AB | 9,000 | 235,415 | ||||||
HIQ International AB | 2,500 | 14,506 | ||||||
IAR Systems Group AB | 6,800 | 47,327 | ||||||
Moberg Pharma AB(a) | 13,700 | 70,825 | ||||||
Nibe Industrier AB, Class B | 3,200 | 61,382 | ||||||
Odd Molly International AB | 8,120 | 44,359 | ||||||
Opus Group AB | 161,835 | 207,287 | ||||||
Vitec Software Group AB, Class B | 6,000 | 77,546 | ||||||
|
| |||||||
| 895,451 | ||||||||
|
| |||||||
Switzerland (0.32%) | ||||||||
VZ Holding AG | 900 | 161,680 | ||||||
|
| |||||||
Taiwan (3.98%) | ||||||||
Cleanaway Co., Ltd. | 14,000 | 87,680 | ||||||
Coland Holdings, Ltd. | 16,000 | 50,648 | ||||||
Cub Elecparts, Inc. | 5,000 | 16,457 | ||||||
DYNACOLOR, Inc. | 68,000 | 158,083 | ||||||
FLEXium Interconnect, Inc. | 25,496 | 79,492 | ||||||
Global Mixed Mode Technology, Inc. | 18,000 | 47,911 | ||||||
| Semi-Annual Report | October 31, 2013 | 33 |
| Grandeur Peak Global Reach Fund | Portfolio of Investments | |
| October 31, 2013 (Unaudited) |
| Shares | Value (Note 2) | |||||||
Taiwan (continued) | ||||||||
Gourmet Master Co., Ltd. | 18,000 | $ | 120,084 | |||||
Leadtrend Technology Corp. | 22,000 | 28,905 | ||||||
Ledlink Optics, Inc. | 12,888 | 35,971 | ||||||
Materials Analysis Technology, Inc. | 21,000 | 50,392 | ||||||
Novatek Microelectronics Corp. | 20,000 | 79,307 | ||||||
Pacific Hospital Supply Co. | 32,000 | 119,267 | ||||||
Polyronics Tech Corp. | 149,000 | 303,279 | ||||||
Power Mate Technology Co., Ltd. | 27,000 | 41,861 | ||||||
Richtek Technology Corp. | 22,000 | 99,219 | ||||||
Sporton International, Inc. | 102,540 | 369,960 | ||||||
Test Research, Inc. | 90,440 | 123,133 | ||||||
TSC Auto ID Technology Co., Ltd. | 29,000 | 184,584 | ||||||
|
| |||||||
| 1,996,233 | ||||||||
|
| |||||||
Thailand (1.28%) | ||||||||
Coastal Energy Co. (Toronto Exchange)(a) | 9,300 | 165,369 | ||||||
Jubilee Enterprise(a) | 146,000 | 115,393 | ||||||
LPN Development PCL | 70,000 | 49,253 | ||||||
LPN Development PCL | 157,000 | 110,467 | ||||||
Premier Marketing PCL | 727,900 | 201,123 | ||||||
|
| |||||||
| 641,605 | ||||||||
|
| |||||||
Turkey (1.19%) | ||||||||
Albaraka Turk Katilim Bankasi AS(a) | 130,000 | 115,917 | ||||||
Emlak Konut Gayrimenkul Yatirim Ortakligi AS, REIT | 103,000 | 147,051 | ||||||
Is Girisim Sermayesi Yatirim Ortakligi AS | 30,000 | 42,830 | ||||||
Katmerciler Arac Ustu Ekipman Sanayi ve Ticaret AS(a) | 15,000 | 26,825 | ||||||
Koza Altin Isletmeleri AS | 4,600 | 81,573 | ||||||
TAV Havalimanlari Holding AS | 13,300 | 96,606 | ||||||
Uyum Gida Ihtiyac Maddeleri Sanayi ve Ticaret AS(a) | 82,200 | 83,590 | ||||||
|
| |||||||
| 594,392 | ||||||||
|
| |||||||
United States (25.57%) | ||||||||
Abaxis, Inc. | 7,400 | 264,402 | ||||||
ABIOMED, Inc.(a) | 15,350 | 368,093 | ||||||
Accenture PLC, Class A | 600 | 44,100 | ||||||
Allegiant Travel Co. | 875 | 91,236 | ||||||
Altisource Residential Corp. | 7,700 | 204,589 | ||||||
Ambarella, Inc.(a) | 4,250 | 87,337 | ||||||
Arbor Realty Trust, Inc., REIT | 13,900 | 92,435 | ||||||
34 | 1.855.377.7325 | www.GrandeurPeakGlobal.com |
| Grandeur Peak Global Reach Fund | Portfolio of Investments | |
| October 31, 2013 (Unaudited) |
| Shares | Value (Note 2) | |||||||
| ||||||||
United States (continued) | ||||||||
Ares Capital Corp. | 6,950 | $ | 120,721 | |||||
Atwood Oceanics, Inc.(a) | 2,250 | 119,542 | ||||||
Big 5 Sporting Goods Corp. | 3,750 | 70,912 | ||||||
Carbonite, Inc.(a) | 10,300 | 136,372 | ||||||
Cardica, Inc.(a) | 88,700 | 106,440 | ||||||
Cardtronics, Inc.(a) | 900 | 35,325 | ||||||
Carter’s, Inc. | 400 | 27,660 | ||||||
CBOE Holdings, Inc. | 1,900 | 92,150 | ||||||
Cempra, Inc.(a) | 13,500 | 153,360 | ||||||
ChemoCentryx, Inc.(a) | 8,700 | 43,065 | ||||||
Colony Financial, Inc., REIT | 3,520 | 71,210 | ||||||
Computer Task Group, Inc. | 6,236 | 106,823 | ||||||
Covance, Inc.(a) | 1,050 | 93,723 | ||||||
CPI Aerostructures, Inc.(a) | 1,900 | 23,560 | ||||||
CRA International, Inc.(a) | 2,500 | 47,625 | ||||||
Destination Maternity Corp. | 1,450 | 45,298 | ||||||
Diamond Hill Investment Group, Inc. | 860 | 94,832 | ||||||
Dice Holdings, Inc.(a) | 18,800 | 138,744 | ||||||
Ellie Mae, Inc.(a) | 3,600 | 104,040 | ||||||
Enanta Pharmaceuticals, Inc.(a) | 2,200 | 43,912 | ||||||
Endologix, Inc.(a) | 6,750 | 121,972 | ||||||
EPAM Systems, Inc.(a) | 2,800 | 104,916 | ||||||
Esperion Therapeutics, Inc.(a) | 6,050 | 94,803 | ||||||
Exact Sciences Corp.(a) | 8,950 | 98,629 | ||||||
ExamWorks Group, Inc.(a) | 2,485 | 64,237 | ||||||
ExlService Holdings, Inc.(a) | 5,250 | 151,777 | ||||||
First Cash Financial Services, Inc.(a) | 2,375 | 143,664 | ||||||
First of Long Island Corp. | 2,450 | 96,407 | ||||||
First Republic Bank | 12,550 | 640,929 | ||||||
Fox Factory Holding Corp.(a) | 2,640 | 45,989 | ||||||
Francesca’s Holdings Corp.(a) | 1,360 | 24,466 | ||||||
Fresh Market, Inc.(a) | 1,000 | 50,910 | ||||||
Geospace Technologies Corp.(a) | 1,310 | 127,620 | ||||||
Grand Canyon Education, Inc.(a) | 2,700 | 127,629 | ||||||
HCC Insurance Holdings, Inc. | 2,690 | 122,799 | ||||||
Healthways, Inc.(a) | 3,050 | 29,372 | ||||||
HeartWare International, Inc.(a) | 600 | 43,536 | ||||||
HFF, Inc., Class A | 1,850 | 45,418 | ||||||
Hibbett Sports, Inc.(a) | 1,625 | 94,786 | ||||||
Home BancShares, Inc. | 2,950 | 99,946 | ||||||
Hudson Technologies, Inc.(a) | 11,400 | 24,282 | ||||||
| Semi-Annual Report | October 31, 2013 | 35 |
| Grandeur Peak Global Reach Fund | Portfolio of Investments | |
| October 31, 2013 (Unaudited) |
| Shares | Value (Note 2) | |||||||
| ||||||||
United States (continued) | ||||||||
ICU Medical, Inc.(a) | 1,500 | $ | 92,700 | |||||
InnerWorkings, Inc.(a) | 9,700 | 92,829 | ||||||
Integrated Silicon Solution, Inc.(a) | 6,800 | 73,304 | ||||||
InvenSense, Inc.(a) | 1,600 | 27,024 | ||||||
Jones Energy, Inc., Class A(a) | 18,900 | 302,589 | ||||||
KEYW Holding Corp.(a) | 7,040 | 80,960 | ||||||
Knight Transportation, Inc. | 2,900 | 49,213 | ||||||
Linear Technology Corp. | 1,400 | 57,596 | ||||||
Littelfuse, Inc. | 2,125 | 180,689 | ||||||
LSB Industries, Inc.(a) | 2,850 | 104,652 | ||||||
Manitex International, Inc.(a) | 13,400 | 173,262 | ||||||
Manning & Napier, Inc. | 12,785 | 212,231 | ||||||
MarketAxess Holdings, Inc. | 3,705 | 241,677 | ||||||
Matrix Service Co.(a) | 1,100 | 22,869 | ||||||
Maxim Integrated Products, Inc. | 4,835 | 143,600 | ||||||
MaxLinear, Inc., Class A(a) | 18,600 | 161,076 | ||||||
Medical Properties Trust, Inc., REIT | 3,600 | 46,944 | ||||||
Meridian Bioscience, Inc. | 1,900 | 46,968 | ||||||
Micrel, Inc. | 12,450 | 114,540 | ||||||
Microchip Technology, Inc. | 3,925 | 168,618 | ||||||
Micronet Enertec Technologies, Inc.(a) | 10,045 | 49,622 | ||||||
MiX Telematics, Ltd., ADR(a) | 11,000 | 143,440 | ||||||
Myriad Genetics, Inc.(a) | 1,900 | 46,322 | ||||||
Navigant Consulting, Inc.(a) | 2,900 | 50,315 | ||||||
NorthStar Realty Finance Corp., REIT | 20,400 | 190,332 | ||||||
Nu Skin Enterprises, Inc., Class A | 445 | 52,034 | ||||||
NxStage Medical, Inc.(a) | 3,400 | 45,118 | ||||||
Pegasystems, Inc. | 600 | 22,836 | ||||||
Perficient, Inc.(a) | 1,500 | 27,135 | ||||||
Performant Financial Corp.(a) | 26,200 | 261,214 | ||||||
Pericom Semiconductor Corp.(a) | 10,150 | 82,012 | ||||||
Polypore International, Inc.(a) | 4,365 | 197,298 | ||||||
Portfolio Recovery Associates, Inc.(a) | 1,155 | 68,665 | ||||||
Power Integrations, Inc. | 3,010 | 172,894 | ||||||
RealPage, Inc.(a) | 7,075 | 173,550 | ||||||
Redwood Trust, Inc., REIT | 6,830 | 119,662 | ||||||
Resources Connection, Inc. | 7,300 | 93,148 | ||||||
Roadrunner Transportation Systems, Inc.(a) | 38,800 | 1,028,200 | ||||||
Ruckus Wireless, Inc.(a) | 7,450 | 108,025 | ||||||
SEI Investments Co. | 4,450 | 147,696 | ||||||
Signature Bank(a) | 1,225 | 124,730 | ||||||
36 | 1.855.377.7325 | www.GrandeurPeakGlobal.com |
| Grandeur Peak Global Reach Fund | Portfolio of Investments | |
| October 31, 2013 (Unaudited) |
| Shares | Value (Note 2) | |||||||
| ||||||||
United States (continued) | ||||||||
Silicon Laboratories, Inc.(a) | 800 | $ | 32,176 | |||||
Sonus Networks, Inc.(a) | 19,400 | 58,200 | ||||||
Spirit Airlines, Inc.(a) | 1,100 | 47,465 | ||||||
Staar Surgical Co.(a) | 22,100 | 292,604 | ||||||
Streamline Health Solutions, Inc.(a) | 5,800 | 47,270 | ||||||
Syntel, Inc. | 1,800 | 154,512 | ||||||
Tandy Leather Factory, Inc.(a) | 11,100 | 92,130 | ||||||
THL Credit, Inc. | 7,450 | 121,063 | ||||||
Tilly’s, Inc., Class A(a) | 15,000 | 218,400 | ||||||
Universal Truckload Services, Inc. | 10,500 | 279,930 | ||||||
Virtus Investment Partners, Inc.(a) | 275 | 55,968 | ||||||
Vocera Communications, Inc.(a) | 5,400 | 90,882 | ||||||
Wesco Aircraft Holdings, Inc.(a) | 19,425 | 355,866 | ||||||
Whitestone, REIT | 10,520 | 145,071 | ||||||
World Fuel Services Corp. | 300 | 11,445 | ||||||
Zumiez, Inc.(a) | 1,680 | 49,795 | ||||||
|
| |||||||
| 12,831,959 | ||||||||
|
| |||||||
TOTAL COMMON STOCKS (Cost $43,259,348) | 45,954,415 | |||||||
|
| |||||||
PREFERRED STOCKS (0.18%) | ||||||||
Brazil (0.18%) | ||||||||
Banco ABC Brasil SA | 14,237 | 87,639 | ||||||
|
| |||||||
TOTAL PREFERRED STOCKS (Cost $78,669) | 87,639 | |||||||
|
| |||||||
EXCHANGE TRADED FUNDS (0.76%) | ||||||||
WisdomTree® India Earnings Fund | 22,750 | 381,745 | ||||||
TOTAL EXCHANGE TRADED FUNDS (Cost $357,629) | 381,745 | |||||||
|
| |||||||
| Semi-Annual Report | October 31, 2013 | 37 |
| Grandeur Peak Global Reach Fund | Portfolio of Investments | |
| October 31, 2013 (Unaudited) |
| Shares | Value (Note 2) | |||||||
| ||||||||
RIGHTS (0.00%)(c) | ||||||||
China (0.00%)(c) | ||||||||
CapitaRetail China, Rights, Strike Price 1.30 SGD (expiring 11/13/13)(a) | 4,920 | $ | 376 | |||||
|
| |||||||
TOTAL RIGHTS (Cost $0) | 376 | |||||||
|
| |||||||
SHORT TERM INVESTMENTS (9.10%) | ||||||||
BlackRock Liquidity Funds Treasury Trust Fund Portfolio - Institutional Class (7 Day Yield 0.000%)(d) | 4,568,172 | 4,568,172 | ||||||
|
| |||||||
TOTAL SHORT TERM INVESTMENTS (Cost $4,568,172) | 4,568,172 | |||||||
|
| |||||||
TOTAL INVESTMENTS (101.63%) (Cost $48,263,818) | $ | 50,992,347 | ||||||
Liabilities In Excess Of Other Assets (-1.63%) | (815,542) | |||||||
|
| |||||||
NET ASSETS (100.00%) | $ | 50,176,805 | ||||||
|
| |||||||
| (a) | Non-Income Producing Security. |
| (b) | Security was purchased pursuant to Regulation S under the Securities Act of 1933, which exempts securities offered and sold outside of the United States from registration. Such security cannot be sold in the United States without either an effective registration statement filed pursuant to the Securities Act of 1933, or pursuant to an exemption from registration. The security has been deemed liquid under guidelines approved by the Fund’s Board of Trustees. As of October 31, 2013, the aggregate market value of those securities was $226,560, representing 0.45% of net assets. |
| (c) | Less than 0.005% of net assets. |
| (d) | Less than 0.0005% 7 Day Yield. |
Common Abbreviations:
AB - Aktiebolag is the Swedish equivalent of the term corporation.
ADR - American Depositary Receipt.
AG - Aktiengesellschaft is a German term that refers to a corporation that is limited by shares, i.e., owned by shareholders.
AS - Aktieselskab is the Danish term for a stock-based corporation.
ASA - Allmennaksjeselskap is the Norwegian term for public limited company.
Bhd - Berhad is the Malaysian term for public limited company.
GDR - Global Depositary Receipt.
38 | 1.855.377.7325 | www.GrandeurPeakGlobal.com |
| Grandeur Peak Global Reach Fund | Portfolio of Investments | |
| October 31, 2013 (Unaudited) |
Ltd. - Limited.
NV - Naamloze Vennootschap is the Dutch term for a public limited liability corporation.
OYJ - Julkinen Osakeyhtiö is the Finnish term for a public limited company.
PCL - Public Company Limited.
PLC - Public Limited Company.
REIT - Real Estate Investment Trust.
SA - Generally designates corporations in various countries, mostly those employing the civil law.
SAB de CV - A variable capital company.
SE - A European Company which can operate on a Europe-wide basis and be governed by community law directly applicable in all member states.
SGD - Singapore Dollar.
SpA - Societa` Per Azioni is an Italian shared company.
Tbk PT - Terbuka Perseroan Terbatas is an Indonesian term for a limited liability company.
Holdings are subject to change.
For Fund compliance purposes, the Fund’s geographical classifications refer to any one or more of the country sub-classifications used by one or more widely recognized market indexes or ratings group indexes, and/or as defined by Fund management. This definition may not apply for purposes of this report, which may combine sub-classifications for reporting ease. Geographical regions are shown as a percentage of net assets.
See Notes to Financial Statements.
| Semi-Annual Report | October 31, 2013 | 39 |
| Grandeur Peak International Opportunities Fund | Portfolio of Investments | |
| October 31, 2013 (Unaudited) |
| Shares | Value (Note 2) | |||||||
| ||||||||
COMMON STOCKS (91.21%) | ||||||||
Australia (4.30%) | ||||||||
ALS, Ltd. | 114,486 | $ | 1,085,314 | |||||
Countplus, Ltd. | 664,752 | 1,118,360 | ||||||
CTI Logistics, Ltd. | 1,338,234 | 2,529,671 | ||||||
Magellan Financial Group, Ltd. | 1,499,867 | 15,806,279 | ||||||
Medical Developments International, Ltd. | 576,538 | 692,044 | ||||||
Super Retail Group, Ltd. | 158,000 | 1,998,091 | ||||||
Webjet, Ltd. | 435,318 | 1,296,042 | ||||||
|
| |||||||
| 24,525,801 | ||||||||
|
| |||||||
Belgium (2.03%) | ||||||||
Melexis NV | 356,090 | 11,589,085 | ||||||
|
| |||||||
Brazil (4.40%) | ||||||||
All America Latina Logistica SA | 518,600 | 1,856,607 | ||||||
Banco Daycoval SA | 1,550,600 | 6,160,316 | ||||||
Brazil Fast Food Corp.(a) | 29,300 | 454,150 | ||||||
CETIP SA - Mercados Organizados | 667,895 | 7,405,817 | ||||||
Even Construtora e Incorporadora SA | 604,000 | 2,251,317 | ||||||
Tegma Gestao Logistica | 391,144 | 3,884,901 | ||||||
Valid Solucoes SA | 201,600 | 3,110,122 | ||||||
|
| |||||||
| 25,123,230 | ||||||||
|
| |||||||
Britain (11.98%) | ||||||||
Abcam PLC | 240,010 | 1,941,492 | ||||||
Advanced Medical Solutions Group PLC | 1,900,000 | 2,977,937 | ||||||
Bank of Georgia Holdings PLC | 70,000 | 2,215,595 | ||||||
Blinkx PLC(a) | 2,379,500 | 6,257,123 | ||||||
Bovis Homes Group PLC | 238,788 | 3,005,573 | ||||||
Brammer PLC | 451,617 | 3,504,780 | ||||||
Clinigen Group PLC | 2,131,110 | 16,299,317 | ||||||
Globo PLC(a) | 2,880,500 | 3,140,667 | ||||||
Halma PLC | 243,371 | 2,140,379 | ||||||
Hunting PLC | 319,500 | 4,569,628 | ||||||
N Brown Group PLC | 226,495 | 1,904,800 | ||||||
Premier Oil PLC | 733,880 | 4,082,014 | ||||||
Robert Walters PLC | 162,161 | 845,035 | ||||||
RPS Group PLC | 2,383,090 | 11,081,118 | ||||||
Ted Baker PLC | 78,378 | 2,145,225 | ||||||
Tracsis PLC | 253,100 | 750,774 | ||||||
40 | 1.855.377.7325 | www.GrandeurPeakGlobal.com |
| Grandeur Peak International Opportunities Fund | Portfolio of Investments | |
| October 31, 2013 (Unaudited) |
| Shares | Value (Note 2) | |||||||
| ||||||||
Britain (continued) | ||||||||
Ultra Electronics Holdings PLC | 49,740 | $ | 1,542,437 | |||||
|
| |||||||
| 68,403,894 | ||||||||
|
| |||||||
Canada (6.08%) | ||||||||
Atrium Innovations, Inc.(a) | 145,605 | 2,651,934 | ||||||
Caracal Energy, Inc.(a) | 338,900 | 2,608,302 | ||||||
Gildan Activewear, Inc. | 16,500 | 795,368 | ||||||
Gran Tierra Energy, Inc.(a) | 697,950 | 5,297,441 | ||||||
Halogen Software, Inc.(a) | 136,700 | 1,819,782 | ||||||
Home Capital Group, Inc. | 103,230 | 8,192,857 | ||||||
Parex Resources, Inc.(a) | 347,600 | 2,010,289 | ||||||
Richelieu Hardware, Ltd. | 93,850 | 4,139,607 | ||||||
ShawCor, Ltd. | 68,045 | 2,860,416 | ||||||
Stantec, Inc. | 47,576 | 2,827,228 | ||||||
TransForce, Inc. | 67,000 | 1,483,748 | ||||||
|
| |||||||
| 34,686,972 | ||||||||
|
| |||||||
China (5.92%) | ||||||||
Airtac International Group | 180,660 | 1,309,776 | ||||||
China Medical System Holdings, Ltd. | 12,930,123 | 11,624,269 | ||||||
Cowealth Medical Holding Co., Ltd. | 695,000 | 2,069,896 | ||||||
Labixiaoxin Snacks Group, Ltd. | 9,850,000 | 5,120,018 | ||||||
Montage Technology Group, Ltd.(a) | 104,600 | 1,472,768 | ||||||
NQ Mobile, Inc., ADR(a) | 151,666 | 2,183,990 | ||||||
O2Micro International, Ltd., ADR(a) | 572,414 | 1,700,070 | ||||||
Pacific Online, Ltd. | 6,136,152 | 2,865,068 | ||||||
Tao Heung Holdings, Ltd. | 3,019,700 | 2,317,453 | ||||||
WuXi PharmaTech Cayman, Inc., ADR(a) | 106,900 | 3,126,825 | ||||||
|
| |||||||
| 33,790,133 | �� | |||||||
|
| |||||||
Denmark (0.07%) | ||||||||
Trifork AS | 175,000 | 390,252 | ||||||
|
| |||||||
Finland (0.46%) | ||||||||
BasWare OYJ | 39,743 | 1,160,167 | ||||||
Revenio Group OYJ | 95,000 | 1,493,666 | ||||||
|
| |||||||
| 2,653,833 | ||||||||
|
| |||||||
France (2.12%) | ||||||||
Audika Groupe(a) | 120,755 | 1,623,161 | ||||||
Esker SA | 72,000 | 1,310,939 | ||||||
| Semi-Annual Report | October 31, 2013 | 41 |
| Grandeur Peak International Opportunities Fund | Portfolio of Investments | |
| October 31, 2013 (Unaudited) |
| Shares | Value (Note 2) | |||||||
| ||||||||
France (continued) | ||||||||
GameLoft SE(a) | 184,000 | $ | 1,953,646 | |||||
Neurones | 79,220 | 1,174,570 | ||||||
Prodware(a) | 255,700 | 2,600,363 | ||||||
Sartorius Stedim Biotech | 14,012 | 2,107,003 | ||||||
Thermador Groupe | 14,765 | 1,323,520 | ||||||
|
| |||||||
| 12,093,202 | ||||||||
|
| |||||||
Germany (3.54%) | ||||||||
2G Energy AG | 40,300 | 1,504,732 | ||||||
Bertrandt AG | 34,600 | 4,526,830 | ||||||
CompuGroup Medical AG | 100,700 | 2,624,454 | ||||||
Gerry Weber International AG | 36,495 | 1,515,030 | ||||||
Nexus AG | 337,908 | 4,743,953 | ||||||
Softing AG | 90,391 | 1,712,067 | ||||||
Wirecard AG | 98,770 | 3,601,402 | ||||||
|
| |||||||
| 20,228,468 | ||||||||
|
| |||||||
Hong Kong (3.22%) | ||||||||
ASR Holdings, Ltd. | 18,535,000 | 2,414,595 | ||||||
Far East Horizon, Ltd. | 6,359,000 | 4,650,526 | ||||||
Le Saunda Holdings, Ltd. | 4,592,400 | 2,096,878 | ||||||
Man Wah Holdings, Ltd. | 2,653,700 | 4,572,866 | ||||||
SPT Energy Group, Inc. | 4,000,000 | 2,203,018 | ||||||
Vitasoy International Holdings, Ltd. | 1,903,338 | 2,454,970 | ||||||
|
| |||||||
| 18,392,853 | ||||||||
|
| |||||||
India (2.75%) | ||||||||
Bajaj Corp., Ltd. | 476,500 | 1,898,867 | ||||||
Bajaj Finance, Ltd. | 108,200 | 2,382,231 | ||||||
City Union Bank, Ltd. | 838,865 | 655,203 | ||||||
Crisil, Ltd. | 56,500 | 1,029,145 | ||||||
KPIT Cummins Infosystems, Ltd. | 1,155,721 | 2,762,597 | ||||||
Mahindra & Mahindra Financial Services, Ltd. | 534,800 | 2,457,965 | ||||||
MakeMyTrip, Ltd.(a) | 80,700 | 1,210,500 | ||||||
Persistent Systems, Ltd. | 97,000 | 1,283,389 | ||||||
Vakrangee Software, Ltd. | 1,805,600 | 1,993,491 | ||||||
|
| |||||||
| 15,673,388 | ||||||||
|
| |||||||
Indonesia (2.02%) | ||||||||
Arwana Citramulia Tbk PT | 21,672,000 | 1,730,299 | ||||||
Astra Graphia Tbk PT | 2,677,000 | 394,218 | ||||||
42 | 1.855.377.7325 | www.GrandeurPeakGlobal.com |
| Grandeur Peak International Opportunities Fund | Portfolio of Investments | |
| October 31, 2013 (Unaudited) |
| Shares | Value (Note 2) | |||||||
| ||||||||
Indonesia (continued) | ||||||||
Express Transindo Utama Tbk PT(a) | 21,424,500 | $ | 2,850,898 | |||||
Lippo Cikarang Tbk PT(a) | 5,170,000 | 3,095,808 | ||||||
Ultrajaya Milk Industry & Trading Co. Tbk PT(a) | 7,977,500 | 3,485,402 | ||||||
|
| |||||||
| 11,556,625 | ||||||||
|
| |||||||
Ireland (1.38%) | ||||||||
Beazley PLC | 689,700 | 2,530,238 | ||||||
Kentz Corp., Ltd. | 625,400 | 5,354,813 | ||||||
|
| |||||||
| 7,885,051 | ||||||||
|
| |||||||
Israel (1.28%) | ||||||||
Caesar Stone Sdot Yam, Ltd.(a) | 33,100 | 1,395,827 | ||||||
Camtek, Ltd.(a) | 266,296 | 487,322 | ||||||
Sarin Technologies, Ltd. | 1,149,000 | 1,757,446 | ||||||
SodaStream International, Ltd.(a) | 68,400 | 3,657,348 | ||||||
|
| |||||||
| 7,297,943 | ||||||||
|
| |||||||
Japan (6.45%) | ||||||||
AIT Corp. | 247,800 | 1,922,825 | ||||||
Benefit One, Inc. | 350,800 | 3,489,092 | ||||||
CMIC Co., Ltd. | 93,755 | 1,281,468 | ||||||
Create SD Holdings Co., Ltd. | 73,800 | 2,683,159 | ||||||
CyberAgent, Inc. | 46,600 | 1,267,721 | ||||||
Daikokutenbussan Co. | 40,000 | 1,198,413 | ||||||
Future Architect, Inc. | 383,300 | 2,241,406 | ||||||
GCA Savvian Corp. | 243,000 | 2,666,501 | ||||||
Gurunavi, Inc. | 99,000 | 2,129,411 | ||||||
Hiday Hidaka Corp. | 113,000 | 2,409,855 | ||||||
Monogatari Corp. | 45,000 | 1,878,623 | ||||||
Nakanishi, Inc. | 9,800 | 1,393,308 | ||||||
Next Co., Ltd. | 43,000 | 1,300,976 | ||||||
Seria Co., Ltd. | 82,000 | 2,735,279 | ||||||
Trancom Co., Ltd. | 206,090 | 6,444,897 | ||||||
Watts Co., Ltd. | 191,500 | 1,776,142 | ||||||
|
| |||||||
| 36,819,076 | ||||||||
|
| |||||||
Luxembourg (0.43%) | ||||||||
L’Occitane International SA | 1,077,362 | 2,442,928 | ||||||
|
| |||||||
Malaysia (3.61%) | ||||||||
AEON Credit Service M Bhd | 766,140 | 3,942,930 | ||||||
| Semi-Annual Report | October 31, 2013 | 43 |
| Grandeur Peak International Opportunities Fund | Portfolio of Investments | |
| October 31, 2013 (Unaudited) |
| Shares | Value (Note 2) | |||||||
| ||||||||
Malaysia (continued) | ||||||||
Berjaya Food Bhd | 2,639,800 | $ | 1,384,503 | |||||
CB Industrial Product Holding Bhd | 1,337,400 | 1,241,806 | ||||||
JobStreet Corp. Bhd | 766,000 | 521,906 | ||||||
Kossan Rubber Industries | 544,000 | 1,101,602 | ||||||
My EG Services Bhd | 7,175,700 | 5,275,665 | ||||||
Padini Holdings Bhd | 6,274,050 | 3,519,218 | ||||||
Uzma Bhd | 2,394,200 | 3,592,571 | ||||||
|
| |||||||
| 20,580,201 | ||||||||
|
| |||||||
Mexico (0.51%) | ||||||||
Genomma Lab Internacional SAB de CV, Class B(a) | 1,100,000 | 2,929,736 | ||||||
|
| |||||||
Netherlands (0.29%) | ||||||||
Aalberts Industries NV | 56,169 | 1,680,853 | ||||||
|
| |||||||
Norway (0.97%) | ||||||||
Medistim ASA | 417,000 | 1,611,107 | ||||||
Opera Software ASA | 325,400 | 3,935,596 | ||||||
|
| |||||||
| 5,546,703 | ||||||||
|
| |||||||
Oman (0.35%) | ||||||||
Al Anwar Ceramic Tile Co. | 1,400,000 | 1,978,182 | ||||||
|
| |||||||
Philippines (2.16%) | ||||||||
COL Financial Group, Inc. | 2,849,000 | 1,120,875 | ||||||
Pepsi-Cola Products Philippines, Inc. | 17,666,700 | 1,982,955 | ||||||
Puregold Price Club, Inc. | 1,432,000 | 1,494,636 | ||||||
RFM Corp. | 20,104,700 | 2,559,034 | ||||||
Security Bank Corp. | 1,605,800 | 5,165,614 | ||||||
|
| |||||||
| 12,323,114 | ||||||||
|
| |||||||
Russia (0.69%) | ||||||||
MD Medical Group Investments PLC, GDR(b) | 157,000 | 1,884,000 | ||||||
QIWI PLC, ADR | 51,100 | 2,068,528 | ||||||
|
| |||||||
| 3,952,528 | ||||||||
|
| |||||||
Singapore (2.96%) | ||||||||
ARA Asset Management, Ltd. | 1,548,212 | 2,287,047 | ||||||
Breadtalk Group, Ltd. | 2,580,375 | 1,911,081 | ||||||
CSE Global, Ltd. | 3,810,055 | 2,898,488 | ||||||
Goodpack, Ltd. | 1,887,000 | 2,909,036 | ||||||
44 | 1.855.377.7325 | www.GrandeurPeakGlobal.com |
| Grandeur Peak International Opportunities Fund | Portfolio of Investments | |
| October 31, 2013 (Unaudited) |
| Shares | Value (Note 2) | |||||||
| ||||||||
Singapore (continued) | ||||||||
Parkson Retail Asia, Ltd. | 2,251,000 | $ | 1,920,834 | |||||
Petra Foods, Ltd. | 1,259,000 | 3,598,012 | ||||||
Riverstone Holdings, Ltd. | 2,385,000 | 1,401,586 | ||||||
|
| |||||||
| 16,926,084 | ||||||||
|
| |||||||
South Africa (2.74%) | ||||||||
Clicks Group, Ltd. | 178,485 | 1,112,114 | ||||||
Ellies Holdings, Ltd.(a) | 2,599,240 | 1,708,876 | ||||||
EOH Holdings, Ltd. | 294,856 | 2,387,926 | ||||||
Foschini Group, Ltd. | 124,270 | 1,431,140 | ||||||
Italtile, Ltd. | 3,554,051 | 2,602,144 | ||||||
OneLogix Group, Ltd. | 2,450,980 | 883,830 | ||||||
Pinnacle Technology Holdings, Ltd. | 655,600 | 1,603,938 | ||||||
Super Group, Ltd.(a) | 1,316,797 | 3,226,817 | ||||||
Value Group, Ltd. | 1,017,368 | 693,194 | ||||||
|
| |||||||
| 15,649,979 | ||||||||
|
| |||||||
South Korea (6.54%) | ||||||||
Able C&C Co., Ltd. | 40,860 | 1,201,822 | ||||||
Daum Communications Corp. | 43,000 | 3,587,556 | ||||||
Duksan Hi-Metal Co., Ltd.(a) | 107,100 | 2,115,244 | ||||||
ENF Technology Co., Ltd. | 144,600 | 1,338,649 | ||||||
Handsome Co., Ltd. | 67,900 | 1,945,944 | ||||||
Hy-Lok Corp. | 357,628 | 9,001,808 | ||||||
iMarketKorea, Inc. | 85,600 | 2,037,615 | ||||||
Koh Young Technology, Inc. | 64,400 | 1,921,527 | ||||||
Kolao Holdings | 62,200 | 1,820,702 | ||||||
KONA@I Co., Ltd. | 137,100 | 4,265,190 | ||||||
Korean Reinsurance Co. | 127,100 | 1,425,869 | ||||||
KT Skylife Co., Ltd. | 55,400 | 1,467,584 | ||||||
LEENO Industrial, Inc. | 95,220 | 1,912,030 | ||||||
LG Fashion Corp. | 63,470 | 1,944,638 | ||||||
Wins Technet Co., Ltd. | 77,100 | 1,337,393 | ||||||
|
| |||||||
| 37,323,571 | ||||||||
|
| |||||||
Sweden (2.46%) | ||||||||
AddTech AB, Class B | 73,130 | 3,334,838 | ||||||
Beijer Alma AB | 105,000 | 2,746,507 | ||||||
HIQ International AB | 210,000 | 1,218,509 | ||||||
Indutrade AB | 55,450 | 2,169,208 | ||||||
Moberg Pharma AB(a) | 260,000 | 1,344,125 | ||||||
| Semi-Annual Report | October 31, 2013 | 45 |
| Grandeur Peak International Opportunities Fund | Portfolio of Investments | |
| October 31, 2013 (Unaudited) |
| Shares | Value (Note 2) | |||||||
| ||||||||
Sweden (continued) | ||||||||
Odd Molly International AB | 72,938 | $ | 398,454 | |||||
Opus Group AB | 2,216,200 | 2,838,629 | ||||||
|
| |||||||
| 14,050,270 | ||||||||
|
| |||||||
Switzerland (0.21%) | ||||||||
VZ Holding AG | 6,600 | 1,185,651 | ||||||
|
| |||||||
Taiwan (5.46%) | ||||||||
Coland Holdings, Ltd. | 618,000 | 1,956,262 | ||||||
Cub Elecparts, Inc. | 455,000 | 1,497,592 | ||||||
Global Mixed Mode Technology, Inc. | 549,500 | 1,462,615 | ||||||
Leadtrend Technology Corp. | 1,075,000 | 1,412,380 | ||||||
Ledlink Optics, Inc. | 249,613 | 696,685 | ||||||
Pacific Hospital Supply Co. | 849,700 | 3,166,907 | ||||||
Polyronics Tech Corp. | 2,314,300 | 4,710,602 | ||||||
Power Mate Technology Co., Ltd. | 1,158,400 | 1,795,984 | ||||||
Richtek Technology Corp. | 355,000 | 1,601,031 | ||||||
Sporton International, Inc. | 1,982,530 | 7,152,885 | ||||||
Taiwan Hon Chuan Enterprise Co., Ltd. | 441,800 | 932,337 | ||||||
Test Research, Inc. | 1,237,252 | 1,684,511 | ||||||
TSC Auto ID Technology Co., Ltd. | 486,000 | 3,093,382 | ||||||
|
| |||||||
| 31,163,173 | ||||||||
|
| |||||||
Thailand (0.96%) | ||||||||
Coastal Energy Co. (Toronto Exchange)(a) | 152,000 | 2,702,805 | ||||||
Premier Marketing PCL | 10,052,000 | 2,777,420 | ||||||
|
| |||||||
| 5,480,225 | ||||||||
|
| |||||||
Turkey (1.31%) | ||||||||
Albaraka Turk Katilim Bankasi AS(a) | 2,808,000 | 2,503,815 | ||||||
Emlak Konut Gayrimenkul Yatirim Ortakligi AS, REIT | 1,329,800 | 1,898,525 | ||||||
TAV Havalimanlari Holding AS | 422,500 | 3,068,879 | ||||||
|
| |||||||
| 7,471,219 | ||||||||
|
| |||||||
United Arab Emirates (0.20%) | ||||||||
Aramex PJSC | 1,561,000 | 1,151,732 | ||||||
|
| |||||||
United States (1.36%) | ||||||||
First Cash Financial Services, Inc.(a) | 53,100 | 3,212,019 | ||||||
MiX Telematics, Ltd., ADR(a) | 106,300 | 1,386,152 | ||||||
46 | 1.855.377.7325 | www.GrandeurPeakGlobal.com |
| Grandeur Peak International Opportunities Fund | Portfolio of Investments | |
| October 31, 2013 (Unaudited) |
| Shares | Value (Note 2) | |||||||
| ||||||||
United States (continued) | ||||||||
Nu Skin Enterprises, Inc., Class A | 27,000 | $ | 3,157,110 | |||||
|
| |||||||
| 7,755,281 | ||||||||
|
| |||||||
TOTAL COMMON STOCKS (Cost $426,032,250) | 520,701,236 | |||||||
|
| |||||||
PREFERRED STOCKS (0.35%) | ||||||||
Brazil (0.35%) | ||||||||
Banco ABC Brasil SA | 327,379 | 2,015,247 | ||||||
|
| |||||||
TOTAL PREFERRED STOCKS (Cost $1,916,172) | 2,015,247 | |||||||
|
| |||||||
EXCHANGE TRADED FUNDS (1.71%) | ||||||||
Market Vectors® India Small-Cap Index ETF | 23,942 | 656,250 | ||||||
WisdomTree® India Earnings Fund | 540,500 | 9,069,590 | ||||||
|
| |||||||
TOTAL EXCHANGE TRADED FUNDS (Cost $10,741,459) | 9,725,840 | |||||||
|
| |||||||
SHORT TERM INVESTMENTS (4.52%) | ||||||||
BlackRock Liquidity Funds Treasury Trust Fund Portfolio - Institutional Class (7 Day Yield 0.000%)(c) | 25,793,198 | 25,793,198 | ||||||
|
| |||||||
TOTAL SHORT TERM INVESTMENTS (Cost $25,793,198) | 25,793,198 | |||||||
|
| |||||||
TOTAL INVESTMENTS (97.79%) (Cost $464,483,079) | $ | 558,235,521 | ||||||
Assets In Excess Of Other Liabilities (2.21%) | 12,630,504 | |||||||
|
| |||||||
NET ASSETS (100.00%) | $ | 570,866,025 | ||||||
|
| |||||||
|
| |||||||
| Semi-Annual Report | October 31, 2013 | 47 |
| Grandeur Peak International Opportunities Fund | Portfolio of Investments | |
| October 31, 2013 (Unaudited) |
| (a) | Non-Income Producing Security. |
| (b) | Security was purchased pursuant to Regulation S under the Securities Act of 1933, which exempts securities offered and sold outside of the United States from registration. Such security cannot be sold in the United States without either an effective registration statement filed pursuant to the Securities Act of 1933, or pursuant to an exemption from registration. The security has been deemed liquid under guidelines approved by the Fund’s Board of Trustees. As of October 31, 2013, the aggregate market value of those securities was $1,884,000, representing 0.33% of net assets. |
| (c) | Less than 0.0005% 7 Day Yield. |
Common Abbreviations:
AB - Aktiebolag is the Swedish equivalent of the term corporation.
ADR - American Depositary Receipt.
AG - Aktiengesellschaft is a German term that refers to a corporation that is limited by shares, i.e., owned by shareholders.
AS - Aktieselskab is the Danish term for a stock-based corporation.
ASA - Allmennaksjeselskap is the Norwegian term for public limited company.
Bhd - Berhad is the Malaysian term for public limited company.
ETF - Exchange Traded Fund.
GDR - Global Depositary Receipt.
Ltd. - Limited.
NV - Naamloze Vennootschap is the Dutch term for a public limited liability corporation.
OYJ - Julkinen Osakeyhtiö is the Finnish term for a public limited company.
PCL - Public Company Limited.
PLC - Public Limited Company.
PJSC - Public Joint Stock Company.
REIT - Real Estate Investment Trust.
SA - Generally designates corporations in various countries, mostly those employing the civil law.
SAB de CV - A variable capital company.
SE - A European Company which can operate on a Europe-wide basis and be governed by community law directly applicable in all member states.
Tbk PT - Terbuka Perseroan Terbatas is an Indonesian term for a limited liability company.
Holdings are subject to change.
For Fund compliance purposes, the Fund’s geographical classifications refer to any one or more of the country sub-classifications used by one or more widely recognized market indexes or ratings group indexes, and/or as defined by Fund management. This definition may not apply for purposes of this report, which may combine sub-classifications for reporting ease. Geographical regions are shown as a percentage of net assets.
See Notes to Financial Statements.
48 | 1.855.377.7325 | www.GrandeurPeakGlobal.com |
| Grandeur Peak Funds® | Statements of Assets and Liabilities | |
| October 31, 2013 (Unaudited) |
| Grandeur Peak Global Opportunities | Grandeur Peak Global Reach | Grandeur Peak International Opportunities | ||||||||||
| ||||||||||||
ASSETS | ||||||||||||
Investments, at value (Cost - see below) | $ | 559,982,911 | $ | 50,992,347 | $ | 558,235,521 | ||||||
Foreign cash, at value | 10,387,573 | 395,744 | 13,825,869 | |||||||||
Dividends and interest receivable | 470,398 | 30,525 | 462,706 | |||||||||
Receivable for investments sold | 4,225,005 | 468,333 | 1,823,036 | |||||||||
Receivable for fund shares subscribed | 1,433,543 | 233,737 | 423,865 | |||||||||
Receivable due from advisor | – | 954 | – | |||||||||
Deferred offering cost | – | 25,245 | – | |||||||||
Prepaid and other assets | 37,093 | 964 | 44,347 | |||||||||
| ||||||||||||
Total assets | 576,536,523 | 52,147,849 | 574,815,344 | |||||||||
| ||||||||||||
LIABILITIES | ||||||||||||
Payable for investments purchased | 6,366,250 | 1,881,000 | 2,312,518 | |||||||||
Payable for fund shares redeemed | 83,334 | 4,196 | 858,347 | |||||||||
Advisory fees payable | 588,630 | 24,136 | 630,515 | |||||||||
Administration fees payable | 22,986 | 5,900 | 21,992 | |||||||||
Custodian fees payable | 54,270 | 33,486 | 54,937 | |||||||||
Payable for trustee fees and expenses | 3,674 | 135 | 2,705 | |||||||||
Payable for chief compliance officer fee | 4,132 | 78 | 3,740 | |||||||||
Payable for principal financial officer fees | 952 | 16 | 758 | |||||||||
Distribution and service fees payable | 38,631 | 2,990 | 23,998 | |||||||||
Payable for transfer agency fees | 8,985 | 2,222 | 8,183 | |||||||||
Accrued expenses and other liabilities | 37,178 | 16,885 | 31,626 | |||||||||
| ||||||||||||
Total liabilities | 7,209,022 | 1,971,044 | 3,949,319 | |||||||||
| ||||||||||||
NET ASSETS | $ | 569,327,501 | $ | 50,176,805 | $ | 570,866,025 | ||||||
| ||||||||||||
| ||||||||||||
NET ASSETS CONSISTS OF | ||||||||||||
Paid-in capital (Note 5) | $ | 439,947,223 | $ | 47,086,355 | $ | 459,148,732 | ||||||
Accumulated net investment income/(loss) | (531,455) | 43,098 | 1,173,346 | |||||||||
Accumulated net realized gain on investments and foreign currency transactions | 23,983,118 | 323,153 | 16,819,593 | |||||||||
Net unrealized appreciation on investments and translation of assets and liabilities in foreign currencies | 105,928,615 | 2,724,199 | 93,724,354 | |||||||||
| ||||||||||||
NET ASSETS | $ | 569,327,501 | $ | 50,176,805 | $ | 570,866,025 | ||||||
| ||||||||||||
| ||||||||||||
| Semi-Annual Report | October 31, 2013 | 49 |
| Grandeur Peak Funds® | Statements of Assets and Liabilities | |
| October 31, 2013 (Unaudited) |
| Grandeur Peak Global Opportunities | Grandeur Peak Global Reach | Grandeur Peak International Opportunities | ||||||||||
| ||||||||||||
INVESTMENTS, AT COST | $ | 454,133,745 | $ | 48,263,818 | $ | 464,483,079 | ||||||
PRICING OF SHARES | ||||||||||||
Investor Class | ||||||||||||
Net Assets | $ | 188,006,554 | $ | 23,352,398 | $ | 115,853,833 | ||||||
Net Asset Value, offering and redemption price per share | $ | 3.28 | $ | 11.49 | $ | 3.26 | ||||||
Shares of beneficial interest outstanding | 57,288,721 | 2,033,060 | 35,533,289 | |||||||||
Institutional Class | ||||||||||||
Net Assets | $ | 381,320,947 | $ | 26,824,407 | $ | 455,012,192 | ||||||
Net Asset Value, offering and redemption price per share | $ | 3.30 | $ | 11.48 | $ | 3.27 | ||||||
Shares of beneficial interest outstanding | 115,431,872 | 2,335,677 | 139,167,736 | |||||||||
See Notes to Financial Statements.
50 | 1.855.377.7325 | www.GrandeurPeakGlobal.com |
| Grandeur Peak Funds® | Statements of Operations | |
| For the Six Months Ended October 31, 2013 (Unaudited) |
| Grandeur Peak Global Opportunities | Grandeur Peak Global Reach | Grandeur Peak International Opportunities | ||||||||||
| ||||||||||||
INVESTMENT INCOME | ||||||||||||
Dividends | $ | 4,090,228 | $ | 179,111 | $ | 6,065,414 | ||||||
Interest | 4,074 | – | 342 | |||||||||
Foreign taxes withheld | (316,189) | (12,449) | (583,334) | |||||||||
| ||||||||||||
Total investment income | 3,778,113 | 166,662 | 5,482,422 | |||||||||
| ||||||||||||
EXPENSES | ||||||||||||
Investment advisor fees (Note 6) | 2,736,220 | 96,151 | 2,947,871 | |||||||||
Recoupment of previously waived fees | 208,559 | – | 250,777 | |||||||||
Administrative fees | 99,411 | 8,237 | 106,283 | |||||||||
Distribution and service fees - Investor Class | 197,026 | 5,624 | 127,967 | |||||||||
Transfer agent fees | 36,432 | 9,693 | 30,965 | |||||||||
Legal fees | 5,704 | 76 | 5,421 | |||||||||
Printing fees | 10,753 | 1,061 | 6,360 | |||||||||
Registration fees | 33,120 | 4,440 | 48,960 | |||||||||
Audit and tax preparation fees | 11,115 | 9,187 | 11,088 | |||||||||
Custodian fees | 75,058 | 33,486 | 101,351 | |||||||||
Trustee fees and expenses | 7,994 | 135 | 7,654 | |||||||||
Chief compliance officer fees | 7,961 | 209 | 7,850 | |||||||||
Principal financial officer fees | 2,525 | 60 | 2,474 | |||||||||
Offering costs | – | 24,098 | – | |||||||||
Other expenses | 11,948 | 3,318 | 10,391 | |||||||||
| ||||||||||||
Total expenses | 3,443,826 | 195,775 | 3,665,412 | |||||||||
Less fees waived/reimbursed by investment advisor | ||||||||||||
Investor Class | – | (15,458) | – | |||||||||
Institutional Class | – | (56,753) | – | |||||||||
| ||||||||||||
Total net expenses | 3,443,826 | 123,564 | 3,665,412 | |||||||||
| ||||||||||||
NET INVESTMENT INCOME | 334,287 | 43,098 | 1,817,010 | |||||||||
| ||||||||||||
REALIZED AND UNREALIZED GAIN/(LOSS) ON INVESTMENTS | ||||||||||||
Net realized gain on investments | 21,122,112 | 341,373 | 14,810,767 | |||||||||
Net realized loss on foreign currency transactions | (87,597) | (18,220) | (224,435) | |||||||||
Net change in unrealized appreciation on investments | 54,310,872 | 2,728,529 | 55,059,972 | |||||||||
Net change in unrealized appreciation/(depreciation) on translation of assets and liabilities in foreign currencies | 45,113 | (4,330) | 30,844 | |||||||||
| Semi-Annual Report | October 31, 2013 | 51 |
| Grandeur Peak Funds® | Statements of Operations | |
| For the Six Months Ended October 31, 2013 (Unaudited) |
| Grandeur Peak Global Opportunities | Grandeur Peak Global Reach | Grandeur Peak International Opportunities | ||||||||||
| ||||||||||||
NET REALIZED AND UNREALIZED GAIN ON INVESTMENTS AND FOREIGN CURRENCY TRANSACTIONS | 75,390,500 | 3,047,352 | 69,677,148 | |||||||||
| ||||||||||||
NET INCREASE IN NET ASSETS RESULTING FROM OPERATIONS | $ | 75,724,787 | $ | 3,090,450 | $ | 71,494,158 | ||||||
| ||||||||||||
| ||||||||||||
See Notes to Financial Statements.
52 | 1.855.377.7325 | www.GrandeurPeakGlobal.com |
| Grandeur Peak Global Opportunities Fund | Statements of Changes in Net Assets | |
| For the Six Months Ended October 31, 2013 (Unaudited) | For the Year Ended April 30, 2013 | |||||||
| ||||||||
OPERATIONS | ||||||||
Net investment income | $ | 334,287 | $ | 608,061 | ||||
Net realized gain on investments and foreign currency transactions | 21,034,515 | 5,510,252 | ||||||
Net change in unrealized appreciation on investments and foreign currency translations | 54,355,985 | 43,088,931 | ||||||
| ||||||||
Net increase in net assets resulting from operations | 75,724,787 | 49,207,244 | ||||||
| ||||||||
DISTRIBUTIONS TO SHAREHOLDERS (NOTE 3) | ||||||||
Net investment income | ||||||||
Investor Class | – | (499,095) | ||||||
Institutional Class | – | (815,023) | ||||||
Net realized gains on investments | ||||||||
Investor Class | – | (1,304,234) | ||||||
Institutional Class | – | (1,691,595) | ||||||
| ||||||||
Net decrease in net assets from distributions | – | (4,309,947) | ||||||
| ||||||||
CAPITAL SHARE TRANSACTIONS (NOTE 5) | ||||||||
Investor Class | ||||||||
Proceeds from sales of shares | 40,135,738 | 54,013,215 | ||||||
Distributions reinvested | – | 1,777,862 | ||||||
Cost of shares redeemed | (11,468,974) | (15,078,229) | ||||||
Redemption fees | 2,145 | 6,976 | ||||||
| ||||||||
Net increase from capital shares transactions | 28,668,909 | 40,719,824 | ||||||
| ||||||||
Institutional Class | ||||||||
Proceeds from sales of shares | 125,851,307 | 119,663,878 | ||||||
Distributions reinvested | – | 2,431,109 | ||||||
Cost of shares redeemed | (11,259,374) | (8,266,338) | ||||||
Redemption fees | 4,205 | 682 | ||||||
| ||||||||
Net increase from capital shares transactions | 114,596,138 | 113,829,331 | ||||||
| ||||||||
Net increase in net assets | 218,989,834 | 199,446,452 | ||||||
| ||||||||
NET ASSETS | ||||||||
Beginning of period | 350,337,667 | 150,891,215 | ||||||
| ||||||||
End of period* | $ | 569,327,501 | $ | 350,337,667 | ||||
| ||||||||
| ||||||||
*Including accumulated net investment loss of: | $ | (531,455) | $ | (865,742) | ||||
| Semi-Annual Report | October 31, 2013 | 53 |
| Grandeur Peak Global Opportunities Fund | Statements of Changes in Net Assets | |
| For the Six Months Ended October 31, 2013 (Unaudited) | For the Year Ended April 30, 2013 | |||||||
| ||||||||
OTHER INFORMATION | ||||||||
Shares Transactions | ||||||||
Investor Class | ||||||||
Issued | 13,328,780 | 21,496,144 | ||||||
Issued in lieu of cash distributions | – | 725,658 | ||||||
Redeemed | (3,817,067) | (6,120,849) | ||||||
| ||||||||
Net increase in share transactions | 9,511,713 | 16,100,953 | ||||||
| ||||||||
| ||||||||
Institutional Class | ||||||||
Issued | 40,919,372 | 47,178,631 | ||||||
Issued in lieu of cash distributions | – | 988,256 | �� | |||||
Redeemed | (3,722,462) | (3,450,605) | ||||||
| ||||||||
Net increase in share transactions | 37,196,910 | 44,716,282 | ||||||
| ||||||||
| ||||||||
See Notes to Financial Statements.
54 | 1.855.377.7325 | www.GrandeurPeakGlobal.com |
| Grandeur Peak Global Reach Fund | Statements of Changes in Net Assets | |
| For the Period June 19, 2013 (Inception) to October 31, 2013 (Unaudited) | ||||
| ||||
OPERATIONS | ||||
Net investment income | $ | 43,098 | ||
Net realized gain on investments and foreign currency transactions | 323,153 | |||
Net change in unrealized appreciation on investments and foreign currency translations | 2,724,199 | |||
| ||||
Net increase in net assets resulting from operations | 3,090,450 | |||
| ||||
DISTRIBUTIONS TO SHAREHOLDERS (NOTE 3) | ||||
Net investment income | ||||
Investor Class | – | |||
Institutional Class | – | |||
Net realized gains on investments | ||||
Investor Class | – | |||
Institutional Class | – | |||
CAPITAL SHARE TRANSACTIONS (NOTE 5) | ||||
Investor Class | ||||
Proceeds from sales of shares | 23,262,243 | |||
Cost of shares redeemed | (670,858 | ) | ||
Redemption fees | 3,683 | |||
| ||||
Net increase from capital shares transactions | 22,595,068 | |||
| ||||
Institutional Class | ||||
Proceeds from sales of shares | 24,741,174 | |||
Cost of shares redeemed | (250,821 | ) | ||
Redemption fees | 934 | |||
| ||||
Net increase from capital shares transactions | 24,491,287 | |||
| ||||
Net increase in net assets | 50,176,805 | |||
| ||||
NET ASSETS | ||||
Beginning of period | – | |||
| ||||
End of period* | $ | 50,176,805 | ||
| ||||
| ||||
*Including accumulated net investment income of: | $ | 43,098 | ||
| Semi-Annual Report | October 31, 2013 | 55 |
| Grandeur Peak Global Reach Fund | Statements of Changes in Net Assets | |
| For the Period June 19, 2013 (Inception) to October 31, 2013 (Unaudited) | ||||
| ||||
OTHER INFORMATION | ||||
Shares Transactions | ||||
Investor Class | ||||
Issued | 2,094,761 | |||
Redeemed | (61,701) | |||
| ||||
Net increase in share transactions | 2,033,060 | |||
| ||||
| ||||
Institutional Class | ||||
Issued | 2,358,224 | |||
Redeemed | (22,547) | |||
| ||||
Net increase in share transactions | 2,335,677 | |||
| ||||
| ||||
See Notes to Financial Statements.
56 | 1.855.377.7325 | www.GrandeurPeakGlobal.com |
| Grandeur Peak International Opportunities Fund | Statements of Changes in Net Assets | |
For the Six Months Ended | For the Year Ended | |||||||
| ||||||||
OPERATIONS | ||||||||
Net investment income | $ | 1,817,010 | $ | 628,938 | ||||
Net realized gain on investments and foreign currency transactions | 14,586,332 | 2,834,127 | ||||||
Net change in unrealized appreciation on investments and foreign currency translations | 55,090,816 | 35,271,629 | ||||||
| ||||||||
Net increase in net assets resulting from operations | 71,494,158 | 38,734,694 | ||||||
| ||||||||
DISTRIBUTIONS TO SHAREHOLDERS (NOTE 3) | ||||||||
Net investment income | ||||||||
Investor Class | – | (130,100) | ||||||
Institutional Class | – | (937,970) | ||||||
Net realized gains on investments | ||||||||
Investor Class | – | (53,171) | ||||||
Institutional Class | – | (333,531) | ||||||
| ||||||||
Net decrease in net assets from distributions | – | (1,454,772) | ||||||
| ||||||||
CAPITAL SHARE TRANSACTIONS (NOTE 5) | ||||||||
Investor Class | ||||||||
Proceeds from sales of shares | 20,340,905 | 85,888,034 | ||||||
Distributions reinvested | – | 161,260 | ||||||
Cost of shares redeemed | (15,919,007) | (6,392,115) | ||||||
Redemption fees | 4,780 | 16,442 | ||||||
| ||||||||
Net increase from capital shares transactions | 4,426,678 | 79,673,621 | ||||||
| ||||||||
Institutional Class | ||||||||
Proceeds from sales of shares | 155,781,004 | 170,464,416 | ||||||
Distributions reinvested | – | 1,149,105 | ||||||
Cost of shares redeemed | (8,357,581) | (5,787,933) | ||||||
Redemption fees | 9,750 | 1,265 | ||||||
| ||||||||
Net increase from capital shares transactions | 147,433,173 | 165,826,853 | ||||||
| ||||||||
Net increase in net assets | 223,354,009 | 282,780,396 | ||||||
| ||||||||
NET ASSETS | ||||||||
Beginning of period | 347,512,016 | 64,731,620 | ||||||
| ||||||||
End of period* | $ | 570,866,025 | $ | 347,512,016 | ||||
| ||||||||
*Including accumulated net investment income/(loss) of: | $ | 1,173,346 | $ | (643,664) | ||||
| Semi-Annual Report | October 31, 2013 | 57 |
| Grandeur Peak International Opportunities Fund | Statements of Changes in Net Assets | |
For the Six Months Ended | For the Year Ended April 30, 2013 | |||||||
| ||||||||
OTHER INFORMATION | ||||||||
Shares Transactions | ||||||||
Investor Class | ||||||||
Issued | 6,844,441 | 32,421,152 | ||||||
Issued in lieu of cash distributions | – | 63,992 | ||||||
Redeemed | (5,397,980) | (2,456,449) | ||||||
| ||||||||
Net increase in share transactions | 1,446,461 | 30,028,695 | ||||||
| ||||||||
Institutional Class | ||||||||
Issued | 53,465,261 | 66,055,460 | ||||||
Issued in lieu of cash distributions | – | 455,994 | ||||||
Redeemed | (2,770,964) | (2,280,523) | ||||||
| ||||||||
Net increase in share transactions | 50,694,297 | 64,230,931 | ||||||
| ||||||||
See Notes to Financial Statements.
58 | 1.855.377.7325 | www.GrandeurPeakGlobal.com |
| Grandeur Peak Global Opportunities Fund | Financial Highlights | |
| For a share outstanding throughout the periods presented. |
| Investor Class | For the Six Months Ended | Year Ended April 30, 2013 | For the Period October 17, 2011 (Inception) to April 30, 2012 | |||||||||
| ||||||||||||
NET ASSET VALUE, BEGINNING OF PERIOD | $ | 2.77 | $ | 2.31 | $ | 2.00 | ||||||
INCOME FROM INVESTMENT OPERATIONS | ||||||||||||
Net investment income/(loss)(a) | 0.00 | (b) | 0.00 | (b) | (0.00) | (b) | ||||||
Net realized and unrealized gain on investments | 0.51 | 0.51 | 0.31 | |||||||||
| ||||||||||||
Total income from investment operations | 0.51 | 0.51 | 0.31 | |||||||||
| ||||||||||||
DISTRIBUTIONS | ||||||||||||
From net investment income | – | (0. 01) | – | |||||||||
From net realized gain on investments | – | (0. 04) | – | |||||||||
| ||||||||||||
Total distributions | – | (0.05) | – | |||||||||
| ||||||||||||
REDEMPTION FEES ADDED TO PAID-IN CAPITAL | 0.00 | (b) | 0.00 | (b) | 0.00 | (b) | ||||||
| ||||||||||||
INCREASE IN NET ASSET VALUE | 0.51 | 0.46 | 0.31 | |||||||||
| ||||||||||||
NET ASSET VALUE, END OF PERIOD | $ | 3.28 | $ | 2.77 | $ | 2.31 | ||||||
| ||||||||||||
TOTAL RETURN | 18.41% | (c) | 22.34% | 15.50% | (c) | |||||||
RATIOS AND SUPPLEMENTAL DATA | ||||||||||||
Net assets, end of period (in 000s) | $ | 188,007 | $ | 132,384 | $ | 73,154 | ||||||
RATIOS TO AVERAGE NET ASSETS | ||||||||||||
Expenses (excluding fees waived/reimbursed by investment advisor) | 1.72% | (d) | 1.76% | 2.30% | (d) | |||||||
Expenses (including fees waived/reimbursed by investment advisor) | 1.72% | (d) | 1.75% | 1.75% | (d) | |||||||
Net investment income/(loss) | 0.01% | (d) | 0.19% | (0.04)% | (d) | |||||||
PORTFOLIO TURNOVER RATE | 23% | (c) | 35% | 42% | (c) | |||||||
| (a) | Per share numbers have been calculated using the average shares method. |
| (b) | Less than $0.005 per share. |
| (c) | Not Annualized. |
| (d) | Annualized. |
See Notes to Financial Statements.
| Semi-Annual Report | October 31, 2013 | 59 |
| Grandeur Peak Global Opportunities Fund | Financial Highlights | |
| For a share outstanding throughout the periods presented. |
| Institutional Class | For the Six Months Ended | Year Ended April 30, 2013 | For the Period October 17, 2011 (Inception) to April 30, 2012 | |||||||||
| ||||||||||||
NET ASSET VALUE, BEGINNING OF PERIOD | $ | 2.79 | $ | 2.32 | $ | 2.00 | ||||||
INCOME FROM INVESTMENT OPERATIONS | ||||||||||||
Net investment income(a) | 0.00 | (b) | 0.01 | 0. 00 | (b) | |||||||
Net realized and unrealized gain on investments | 0.51 | 0.52 | 0.32 | |||||||||
| ||||||||||||
Total income from investment operations | 0.51 | 0.53 | 0.32 | |||||||||
| ||||||||||||
DISTRIBUTIONS | ||||||||||||
From net investment income | – | (0. 02 | ) | – | ||||||||
From net realized gain on investments | – | (0. 04 | ) | – | ||||||||
| ||||||||||||
Total distributions | – | (0.06 | ) | – | ||||||||
| ||||||||||||
REDEMPTION FEES ADDED TO PAID-IN CAPITAL | 0.00 | (b) | 0.00 | (b) | 0.00 | (b) | ||||||
| ||||||||||||
INCREASE IN NET ASSET VALUE | 0.51 | 0.47 | 0.32 | |||||||||
| ||||||||||||
NET ASSET VALUE, END OF PERIOD | $ | 3.30 | $ | 2.79 | $ | 2.32 | ||||||
| ||||||||||||
TOTAL RETURN | 18.28% | (c) | 22.86% | 16.00% | (c) | |||||||
RATIOS AND SUPPLEMENTAL DATA | ||||||||||||
Net assets, end of period (in 000s) | $ | 381,321 | $ | 217,953 | $ | 77,737 | ||||||
RATIOS TO AVERAGE NET ASSETS | ||||||||||||
Expenses (excluding fees waived/ reimbursed by investment advisor) | 1.49% | (d) | 1.51% | 2.03% | (d) | |||||||
Expenses (including fees waived/ reimbursed by investment advisor) | 1.49% | (d) | 1.50% | 1.50% | (d) | |||||||
Net investment income | 0.23% | (d) | 0.37% | 0.40% | (d) | |||||||
PORTFOLIO TURNOVER RATE | 23% | (c) | 35% | 42% | (c) | |||||||
| (a) | Per share numbers have been calculated using the average shares method. |
| (b) | Less than $0.005 per share. |
| (c) | Not Annualized. |
| (d) | Annualized. |
See Notes to Financial Statements.
60 | 1.855.377.7325 | www.GrandeurPeakGlobal.com |
| Grandeur Peak Global Reach Fund | Financial Highlights | |
| For a share outstanding throughout the period presented. |
| Investor Class | For the Period June 19, 2013 (Inception) to October 31, 2013 (Unaudited) | |||
| ||||
NET ASSET VALUE, BEGINNING OF PERIOD | $ | 10.00 | ||
INCOME FROM INVESTMENT OPERATIONS | ||||
Net investment income(a) | 0.01 | |||
Net realized and unrealized gain on investments | 1.47 | |||
| ||||
Total income from investment operations | 1.48 | |||
| ||||
REDEMPTION FEES ADDED TO PAID-IN CAPITAL | 0.01 | |||
| ||||
INCREASE IN NET ASSET VALUE | 1.49 | |||
| ||||
NET ASSET VALUE, END OF PERIOD | $ | 11.49 | ||
| ||||
TOTAL RETURN | 14.90% | (b) | ||
RATIOS AND SUPPLEMENTAL DATA | ||||
Net assets, end of period (in 000s) | $ | 23,352 | ||
RATIOS TO AVERAGE NET ASSETS | ||||
Expenses (excluding fees waived/reimbursed by investment advisor) | 2.29% | (c) | ||
Expenses (including fees waived/reimbursed by investment advisor) | 1.60% | (c) | ||
Net investment income | 0.14% | (c) | ||
PORTFOLIO TURNOVER RATE | 20% | (b) | ||
| (a) | Per share numbers have been calculated using the average shares method. |
| (b) | Not Annualized. |
| (c) | Annualized. |
See Notes to Financial Statements.
| Semi-Annual Report | October 31, 2013 | 61 |
| Grandeur Peak Global Reach Fund | Financial Highlights | |
| For a share outstanding throughout the period presented. |
| Institutional Class | For the Period June 19, 2013 (Inception) to October 31, 2013 (Unaudited) | |||
| ||||
NET ASSET VALUE, BEGINNING OF PERIOD | $ | 10.00 | ||
INCOME FROM INVESTMENT OPERATIONS | ||||
Net investment income(a) | 0.02 | |||
Net realized and unrealized gain on investments | 1.46 | |||
| ||||
Total income from investment operations | 1.48 | |||
| ||||
REDEMPTION FEES ADDED TO PAID-IN CAPITAL | 0.00 | (b) | ||
| ||||
INCREASE IN NET ASSET VALUE | 1.48 | |||
| ||||
NET ASSET VALUE, END OF PERIOD | $ | 11.48 | ||
| ||||
TOTAL RETURN | 14.80% | (c) | ||
RATIOS AND SUPPLEMENTAL DATA | ||||
Net assets, end of period (in 000s) | $ | 26,824 | ||
RATIOS TO AVERAGE NET ASSETS | ||||
Expenses (excluding fees waived/reimbursed by investment advisor) | 2.22% | (d) | ||
Expenses (including fees waived/reimbursed by investment advisor) | 1.35% | (d) | ||
Net investment income | 0.61% | (d) | ||
PORTFOLIO TURNOVER RATE | 20% | (c) | ||
| (a) | Per share numbers have been calculated using the average shares method. |
| (b) | Less than $0.005 per share. |
| (c) | Not Annualized. |
| (d) | Annualized. |
See Notes to Financial Statements.
62 | 1.855.377.7325 | www.GrandeurPeakGlobal.com |
| Grandeur Peak International Opportunities Fund | Financial Highlights | |
| For a share outstanding throughout the periods presented. |
| Investor Class | For the Six Months Ended | Year Ended April 30, 2013 | For the Period October 17, 2011 (Inception) to April 30, 2012 | |||||||||
| ||||||||||||
NET ASSET VALUE, BEGINNING OF PERIOD | $ | 2.83 | $ | 2.29 | $ | 2.00 | ||||||
INCOME FROM INVESTMENT OPERATIONS | ||||||||||||
Net investment income(a) | 0.01 | 0.01 | 0. 00 | (b) | ||||||||
Net realized and unrealized gain on investments | 0.42 | 0.55 | 0.29 | |||||||||
| ||||||||||||
Total income from investment operations | 0.43 | 0.56 | 0.29 | |||||||||
| ||||||||||||
DISTRIBUTIONS | ||||||||||||
From net investment income | – | (0. 01 | ) | – | ||||||||
From net realized gain on investments | – | (0. 01 | ) | – | ||||||||
| ||||||||||||
Total distributions | – | (0.02 | ) | – | ||||||||
| ||||||||||||
REDEMPTION FEES ADDED TO PAID-IN CAPITAL | 0.00 | (b) | 0.00 | (b) | 0.00 | (b) | ||||||
| ||||||||||||
INCREASE IN NET ASSET VALUE | 0.43 | 0.54 | 0.29 | |||||||||
| ||||||||||||
NET ASSET VALUE, END OF PERIOD | $ | 3.26 | $ | 2.83 | $ | 2.29 | ||||||
| ||||||||||||
TOTAL RETURN | 15.19% | (c) | 24.57% | 14.50% | (c) | |||||||
RATIOS AND SUPPLEMENTAL DATA | ||||||||||||
Net assets, end of period (in 000s) | $ | 115,854 | $ | 96,550 | $ | 9,274 | ||||||
RATIOS TO AVERAGE NET ASSETS | ||||||||||||
Expenses (excluding fees waived/ reimbursed by investment advisor) | 1.75% | (d) | 1.88% | 2.94% | (d) | |||||||
Expenses (including fees waived/ reimbursed by investment advisor) | 1.75% | (d) | 1.75% | 1.75% | (d) | |||||||
Net investment income | 0.60% | (d) | 0.26% | 0.33% | (d) | |||||||
PORTFOLIO TURNOVER RATE | 21% | (c) | 52% | 24% | (c) | |||||||
| (a) | Per share numbers have been calculated using the average shares method. |
| (b) | Less than $0.005 per share. |
| (c) | Not Annualized. |
| (d) | Annualized. |
See Notes to Financial Statements.
| Semi-Annual Report | October 31, 2013 | 63 |
| Grandeur Peak International Opportunities Fund | Financial Highlights | |
| For a share outstanding throughout the periods presented. |
| Institutional Class | For the Six Months Ended | Year Ended April 30, 2013 | For the Period October 17, 2011 (Inception) to April 30, 2012 | |||||||||
| ||||||||||||
NET ASSET VALUE, BEGINNING OF PERIOD | $ | 2.84 | $ | 2.29 | $ | 2.00 | ||||||
INCOME FROM INVESTMENT OPERATIONS | ||||||||||||
Net investment income(a) | 0.01 | 0.01 | 0.01 | |||||||||
Net realized and unrealized gain on investments | 0.42 | 0.57 | 0.28 | |||||||||
| ||||||||||||
Total income from investment operations | 0.43 | 0.58 | 0.29 | |||||||||
| ||||||||||||
DISTRIBUTIONS | ||||||||||||
From net investment income | – | (0. 02 | ) | – | ||||||||
From net realized gain on investments | – | (0. 01 | ) | – | ||||||||
| ||||||||||||
Total distributions | – | (0.03 | ) | – | ||||||||
| ||||||||||||
REDEMPTION FEES ADDED TO PAID-IN CAPITAL | 0.00 | (b) | 0.00 | (b) | 0.00 | (b) | ||||||
| ||||||||||||
INCREASE IN NET ASSET VALUE | 0.43 | 0.55 | 0.29 | |||||||||
| ||||||||||||
NET ASSET VALUE, END OF PERIOD | $ | 3.27 | $ | 2.84 | $ | 2.29 | ||||||
| ||||||||||||
TOTAL RETURN | 15.14% | (c) | 25.11% | 14.50% | (c) | |||||||
RATIOS AND SUPPLEMENTAL DATA | ||||||||||||
Net assets, end of period (in 000s) | $ | 455,012 | $ | 250,962 | $ | 55,458 | ||||||
RATIOS TO AVERAGE NET ASSETS | ||||||||||||
Expenses (excluding fees waived/ reimbursed by investment advisor) | 1.50% | (d) | 1.59% | 2.50% | (d) | |||||||
Expenses (including fees waived/ reimbursed by investment advisor) | 1.50% | (d) | 1.50% | 1.50% | (d) | |||||||
Net investment income | 0.82% | (d) | 0.51% | 0.56% | (d) | |||||||
PORTFOLIO TURNOVER RATE | 21% | (c) | 52% | 24% | (c) | |||||||
| (a) | Per share numbers have been calculated using the average shares method. |
| (b) | Less than $0.005 per share. |
| (c) | Not Annualized. |
| (d) | Annualized. |
See Notes to Financial Statements.
64 | 1.855.377.7325 | www.GrandeurPeakGlobal.com |
| Grandeur Peak Funds® | Notes to Financial Statements | |
| October 31, 2013 (Unaudited) |
1. ORGANIZATION
Financial Investors Trust (the “Trust”), a Delaware statutory trust, is an open-end management investment company registered under the Investment Company Act of 1940, as amended (“1940 Act”). As of October 31, 2013, the Trust had 27 registered funds. This semi-annual report describes the Grandeur Peak Global Opportunities Fund, Grandeur Peak Global Reach Fund, and Grandeur Peak International Opportunity Fund (individually a “Fund” and collectively, the “Funds”). The Grandeur Peak Global Reach Fund’s inception date was June 19, 2013. The Grandeur Peak Global Opportunities Fund seeks long-term growth of capital and invests primarily in foreign and domestic small and micro cap companies. The Grandeur Peak Global Reach Fund seeks long-term growth of capital and invests primarily in foreign and domestic small and micro cap companies. The Grandeur Peak International Opportunities Fund seeks long-term growth of capital and invests primarily in foreign small and micro cap companies. The Funds offer Investor Class and Institutional Class shares. All classes of shares have identical rights to earnings, assets and voting privileges, except for class specific expenses and exclusive rights to vote on matters affecting only individual classes.
2. SIGNIFICANT ACCOUNTING POLICIES
The accompanying financial statements were prepared in accordance with accounting principles generally accepted in the United States of America (“U.S. GAAP”). The preparation of financial statements in conformity with U.S. GAAP requires management to make certain estimates and assumptions that affect the reported amounts of assets and liabilities and disclosures of contingent assets and liabilities at the date of the financial statements and the reported amounts of revenue and expenses during the period. Actual results could differ from those estimates. The following is a summary of significant accounting policies consistently followed by the Funds in preparation of their financial statements.
Investment Valuation: The Funds generally value their securities based on market prices determined at the close of regular trading on the New York Stock Exchange (“NYSE”), normally 4:00 p.m. Eastern Time, on each day the NYSE is open for trading.
For equity securities and mutual funds that are traded on an exchange, the market price is usually the closing sale or official closing price on that exchange. In the case of equity securities not traded on an exchange, or if such closing prices are not otherwise available, the securities are valued at the mean of the most recent bid and ask prices on such day. Redeemable securities issued by open-end registered investment companies are valued at the investment company’s applicable net asset value.
Equity securities that are primarily traded on foreign securities exchanges are valued at the closing values of such securities on their respective foreign exchanges, except when an event occurs subsequent to the close of the foreign exchange and the close of the NYSE that was likely to have changed such value. In such an event, the fair value of those securities are determined in good faith through consideration of other factors in accordance with procedures established by and under the general supervision of the Board of Trustees (the “Board”). The Funds will use a fair valuation model provided by an independent pricing service, which is intended to reflect fair value when a security’s value or a meaningful portion of each Fund’s portfolio is believed to have been materially affected by a valuation event that has occurred between the close of the exchange or market on which the security is traded and the close of the regular trading day on the NYSE. The Funds’ valuation procedures set forth certain triggers which instruct when to use the fair valuation model.
| Semi-Annual Report | October 31, 2013 | 65 |
| Grandeur Peak Funds® | Notes to Financial Statements | |
| October 31, 2013 (Unaudited) |
Forward currency exchange contracts have a market value determined by the prevailing foreign currency exchange daily rates and current foreign currency exchange forward rates. The foreign currency exchange forward rates are calculated using an automated system that estimates rates on the basis of the current day foreign currency exchange rates and forward foreign currency exchange rates supplied by a pricing service.
When such prices or quotations are not available, or when the Fair Value Committee appointed by the Board believes that they are unreliable, securities may be priced using fair value procedures approved by the Board.
Fair Value Measurements: The Funds disclose the classification of their fair value measurements following a three-tier hierarchy based on the inputs used to measure fair value. Inputs refer broadly to the assumptions that market participants would use in pricing the asset or liability, including assumptions about risk. Inputs may be observable or unobservable. Observable inputs reflect the assumptions market participants would use in pricing the asset or liability that are developed based on market data obtained from sources independent of the reporting entity. Unobservable inputs reflect the reporting entity’s own assumptions about the assumptions market participants would use in pricing the asset or liability that are developed based on the best information available.
Various inputs are used in determining the value of the Funds’ investments as of the end of the reporting period. When inputs used fall into different levels of the fair value hierarchy, the level in the hierarchy within which the fair value measurement falls is determined based on the lowest level input that is significant to the fair value measurement in its entirety. The designated input levels are not necessarily an indication of the risk or liquidity associated with these investments. These inputs are categorized in the following hierarchy under applicable financial accounting standards:
Level 1 – | Unadjusted quoted prices in active markets for identical investments, unrestricted assets or liabilities that the Funds have the ability to access at the measurement date; | |
Level 2 – | Quoted prices which are not active, quoted prices for similar assets or liabilities in active markets or inputs other than quoted prices that are observable (either directly or indirectly) for substantially the full term of the asset or liability; and | |
Level 3 – | Significant unobservable prices or inputs (including the Funds’ own assumptions in determining the fair value of investments) where there is little or no market activity for the asset or liability at the measurement date. | |
66 | 1.855.377.7325 | www.GrandeurPeakGlobal.com |
| Grandeur Peak Funds® | Notes to Financial Statements | |
| October 31, 2013 (Unaudited) |
The following is a summary of each Fund’s investments in the fair value hierarchy as of October 31, 2013:
| Investments in Securities at Value(a) | Level 1 - Quoted and Unadjusted Prices | Level 2 - Other Significant Observable Inputs | Level 3 - Significant Unobservable Inputs | Total | ||||||||||||
| ||||||||||||||||
Grandeur Peak Global Opportunities Fund | ||||||||||||||||
Common Stocks | $ | 510,460,485 | $ | – | $ | – | $ | 510,460,485 | ||||||||
Preferred Stocks | 1,818,351 | – | – | 1,818,351 | ||||||||||||
Exchange Traded Funds | 3,876,482 | – | – | 3,876,482 | ||||||||||||
Short Term Investments | 43,827,593 | – | – | 43,827,593 | ||||||||||||
| ||||||||||||||||
Total | $ | 559,982,911 | $ | – | $ | – | $ | 559,982,911 | ||||||||
| ||||||||||||||||
| (a) | For detailed descriptions of countries, see the accompanying Portfolio of Investments. |
| Investments in Securities at Value(a) | Level 1 - Quoted and Unadjusted Prices | Level 2 - Other Significant Observable Inputs | Level 3 - Significant Unobservable Inputs | Total | ||||||||||||
| ||||||||||||||||
Grandeur Peak Global Reach Fund | ||||||||||||||||
Common Stocks | $ | 45,954,415 | $ | – | $ | – | $ | 45,954,415 | ||||||||
Preferred Stocks | 87,639 | – | – | 87,639 | ||||||||||||
Exchange Traded Funds | 381,745 | – | – | 381,745 | ||||||||||||
Rights | – | 376 | – | 376 | ||||||||||||
Short Term Investments | 4,568,172 | – | – | 4,568,172 | ||||||||||||
| ||||||||||||||||
Total | $ | 50,991,971 | $ | 376 | $ | – | $ | 50,992,347 | ||||||||
| ||||||||||||||||
| (a) | For detailed descriptions of countries, see the accompanying Portfolio of Investments. |
| Investments in Securities at Value(a) | Level 1 - Quoted and Unadjusted Prices | Level 2 - Other Significant Observable Inputs | Level 3 - Significant Unobservable Inputs | Total | ||||||||||||
| ||||||||||||||||
Grandeur Peak International Opportunities Fund |
| |||||||||||||||
Common Stocks | $ | 520,701,236 | $ | – | $ | – | $ | 520,701,236 | ||||||||
Preferred Stocks | 2,015,247 | – | – | 2,015,247 | ||||||||||||
Exchange Traded Funds | 9,725,840 | – | – | 9,725,840 | ||||||||||||
Short Term Investments | 25,793,198 | – | – | 25,793,198 | ||||||||||||
| ||||||||||||||||
Total | $ | 558,235,521 | $ | – | $ | – | $ | 558,235,521 | ||||||||
| ||||||||||||||||
| (a) | For detailed descriptions of countries, see the accompanying Portfolio of Investments. |
The Funds recognize transfers between levels as of the end of the period. For the six months ended October 31, 2013, the Funds did not have any transfers between Level 1 and Level 2 securities. For the six months ended October 31, 2013, the Funds did not have any securities that used significant unobservable inputs (Level 3) in determining fair value.
| Semi-Annual Report | October 31, 2013 | 67 |
| Grandeur Peak Funds® | Notes to Financial Statements | |
| October 31, 2013 (Unaudited) |
Investment Transactions and Investment Income: Investment transactions are accounted for on the date the investments are purchased or sold (trade date). Realized gains and losses from investment transactions are reported on an identified cost basis. Interest income, which includes accretion of discounts and amortization of premiums, is accrued and recorded as earned. Dividend income is recognized on the ex-dividend date or for certain foreign securities, as soon as information is available to the Funds. All of the realized and unrealized gains and losses and net investment income, are allocated daily to each class in proportion to its average daily net assets.
Foreign Securities: The Funds may directly purchase securities of foreign issuers. Investing in securities of foreign issuers involves special risks not typically associated with investing in securities of U.S. issuers. The risks include possible reevaluation of currencies, the inability to repatriate foreign currency, less complete financial information about companies and possible future adverse political and economic developments. Moreover, securities of many foreign issuers and their markets may be less liquid and their prices more volatile than those of securities of comparable U.S. issuers.
Foreign Currency Translation: The books and records of the Funds are maintained in U.S. dollars. Investment valuations and other assets and liabilities initially expressed in foreign currencies are converted each business day into U.S. dollars based upon current exchange rates. Prevailing foreign exchange rates may generally be obtained at the close of the NYSE (normally, 4:00 p.m. Eastern Time). The portion of realized and unrealized gains or losses on investments due to fluctuations in foreign currency exchange rates is not separately disclosed and is included in realized and unrealized gains or losses on investments, when applicable.
Foreign Currency Spot Contracts: The Funds may enter into foreign currency spot contracts to facilitate transactions in foreign securities or to convert foreign currency receipts into U.S. dollars. A foreign currency spot contract is an agreement between two parties to buy and sell currencies at the current market rate, for settlement generally within two business days. The U.S. dollar value of the contracts is determined using current currency exchange rates supplied by a pricing service. The contract is marked-to-market daily for settlements beyond one day and any change in market value is recorded as an unrealized gain or loss. When the contract is closed, a realized gain or loss is recorded equal to the difference between the value on the open and close date. Losses may arise from changes in the value of the foreign currency, or if the counterparties do not perform under the contract’s terms. The maximum potential loss from such contracts is the aggregate face value in U.S. dollars at the time the contract was opened.
Trust Expenses: Some expenses of the Trust can be directly attributed to the Funds. Expenses which cannot be directly attributed to the Funds are apportioned among all funds in the Trust based on average net assets of each fund.
Fund and Class Expenses: Expenses that are specific to a Fund or class of shares of a Fund are charged directly to that Fund or share class. Expenses that are common to all Funds generally are allocated among the Funds in proportion to their average daily net assets. Fees provided under the distribution (Rule 12b-1) and/or shareholder service plans for a particular class of the Funds are charged to the operations of such class.
Federal Income Taxes: The Funds comply with the requirements under Subchapter M of the Internal Revenue Code of 1986, as amended, applicable to regulated investment companies and intend to distribute substantially all of their net taxable income and net capital gains, if any, each
68 | 1.855.377.7325 | www.GrandeurPeakGlobal.com |
| Grandeur Peak Funds® | Notes to Financial Statements | |
| October 31, 2013 (Unaudited) |
year so that it will not be subject to excise tax on undistributed income and gains. The Funds are not subject to income taxes to the extent such distributions are made.
As of and during the six months ended October 31, 2013, the Funds did not have a liability for any unrecognized tax benefits. The Funds file U.S. federal, state, and local tax returns as required. The Funds’ tax returns are subject to examination by the relevant tax authorities until expiration of the applicable statute of limitations, which is generally three years after the filing of the tax return for federal purposes and four years for most state returns. Tax returns for open years have incorporated no uncertain tax positions that require a provision for income taxes.
Distributions to Shareholders: Each Fund normally pays dividends and distributes capital gains, if any, on an annual basis. Income dividend distributions are derived from interest and other income each Fund receives from their investments, including short term capital gains. Long term capital gain distributions are derived from gains realized when each Fund sells a security it has owned for more than a year. Each Fund may make additional distributions and dividends at other times if the portfolio manager believes doing so may be necessary for each Fund to avoid or reduce taxes.
3. TAX BASIS INFORMATION
Tax Basis of Investments: As of October 31, 2013, the aggregate cost of investments, gross unrealized appreciation/ (depreciation) and net unrealized appreciation for Federal tax purposes was as follows:
| Gross Appreciation (excess of value over tax cost) | Gross Depreciation (excess of tax cost over value) | Net Unrealized Appreciation | Cost of Investments for Income Tax Purposes | |||||||||||||||
Grandeur Peak Global Opportunities | $ | 119,422,732 | $ | (13,713,750 | ) | $ | 105,708,982 | $ | 454,273,929 | |||||||||
Grandeur Peak Global Reach | 3,702,269 | (1,025,518 | ) | 2,676,751 | 48,315,596 | |||||||||||||
Grandeur Peak International Opportunities | 111,494,776 | (18,012,764 | ) | 93,482,012 | 464,753,509 | |||||||||||||
Tax Basis of Distributions to Shareholders: The character of distributions made during the year from net investment income or net realized gains may differ from its ultimate characterization for federal income tax purposes. Also, due to the timing of dividend distributions, the fiscal year in which amounts are distributed may differ from the fiscal year in which the income or realized gain were recorded by the Funds.
The tax character of distributions paid by the Funds for the fiscal year ended April 30, 2013 were as follows:
| Ordinary Income | Long-Term Capital Gain | |||||||||
Grandeur Peak Global Opportunities Fund | $ | 4,298,437 | $ | 11,510 | ||||||
Grandeur Peak International Opportunities Fund | 1,378,397 | 76,375 | ||||||||
During the six months ended October 31, 2013, the Funds did not make any distributions.
| Semi-Annual Report | October 31, 2013 | 69 |
| Grandeur Peak Funds | Notes to Financial Statements | |
| October 31, 2013 (Unaudited) |
4. SECURITIES TRANSACTIONS
The cost of purchases and proceeds from sales of securities (excluding short term securities) during the six months ended October 31, 2013 were as follows:
| Fund | Purchases of Securities | Proceeds From Sales of Securities | ||||||||
Grandeur Peak Global Opportunities Fund | $ 213,298,791 | $ | 94,301,630 | |||||||
Grandeur Peak Global Reach Fund | 48,066,655 | 4,712,258 | ||||||||
Grandeur Peak International Opportunities Fund | 241,652,064 | 87,916,401 | ||||||||
5. SHARES OF BENEFICIAL INTEREST
The capitalization of the Trust consists of an unlimited number of shares of beneficial interest with no par value per share. Holders of the shares of the Funds of the Trust have one vote for each share held and a proportionate fraction of a vote for each fractional share. All shares issued and outstanding are fully paid and are non-assessable, transferable and redeemable at the option of the shareholder. Shares have no pre-emptive rights.
Shares redeemed within 60 days of purchase may incur a 2% short-term redemption fee deducted from the redemption amount. For the six months ended October 31, 2013 and the year ended April 30, 2013, the redemption fees charged by the Funds are presented in the Statements of Changes in Net Assets.
6. MANAGEMENT AND RELATED-PARTY TRANSACTIONS
Grandeur Peak Global Advisors, LLC (the “Adviser” or “Grandeur Peak Global Advisors”), subject to the authority of the Board, is responsible for the overall management and administration of the Funds’ business affairs. The Adviser manages the investments of the Funds in accordance with the Funds’ investment objective, policies and limitations and investment guidelines established jointly by the Adviser and the Trustees. Pursuant to the Advisory Agreement, (the “Advisory Agreement”), each Fund pays the Adviser an annual management fee based on each Fund’s average daily net assets. The management fee is paid on a monthly basis. The following table reflects the Funds’ advisory fee rates.
| Fund | Advisory Fee | |||
Grandeur Peak Global Opportunities Fund | 1.25 | % | ||
Grandeur Peak Global Reach Fund | 1.25 | % | ||
Grandeur Peak International Opportunities Fund | 1.10 | % | ||
With respect to the Grandeur Peak Global Opportunities Fund and the Grandeur Peak International Opportunities Fund, the Adviser has contractually agreed to limit certain of each Fund’s expenses to 1.75% of the Fund’s average daily net assets in the Investor Class shares and 1.50% of the Fund’s average daily net assets in the Institutional Class shares until August 31, 2014. With respect to the Grandeur Peak Global Reach Fund, the Adviser has contractually agreed to limit certain of the Fund’s expenses to 1.60% of the Fund’s average daily net assets in the Investor Class shares and 1.35% of the Fund’s average daily net assets in the Institutional Class shares until August 31, 2014. Pursuant to these agreements, each Fund will reimburse the Adviser for any fee waivers and expense reimbursements made by the Adviser, provided that any such reimbursements made by the Funds to the Adviser will not cause the Funds’ expense limitation to
70 | 1.855.377.7325 | www.GrandeurPeakGlobal.com |
| Grandeur Peak Funds® | Notes to Financial Statements | |
| October 31, 2013 (Unaudited) |
exceed expense limitations in existence at the time the expense was incurred, or at the time of the reimbursement, whichever is lower, and the reimbursement is made within three years after the expenses were incurred.
For the six months ended October 31, 2013, the fee waivers and/or reimbursements were as follows:
| Fund | Fees Waived/ Reimbursed By Advisor | Recoupment of Previously Waived Fees By Advisor | Total | ||||||||||||
Grandeur Peak Global Opportunities Fund | |||||||||||||||
Investor Class | $ | – | $ | 66,162 | $ | 66,162 | |||||||||
Institutional Class | – | 142,397 | 142,397 | ||||||||||||
Grandeur Peak Global Reach Fund | |||||||||||||||
Investor Class | $ | 15,458 | $ | – | $ | 15,458 | |||||||||
Institutional Class | 56,753 | – | 56,753 | ||||||||||||
Grandeur Peak International Opportunities Fund | |||||||||||||||
Investor Class | $ | – | $ | 56,759 | $ | 56,759 | |||||||||
Institutional Class | – | 194,018 | 194,018 | ||||||||||||
As of October 31, 2013, the balances of recoupable expenses for each Fund were as follows: |
| ||||||||||||||
| Fund | Expires 2015 | Expires 2016 | Total | ||||||||||||
Grandeur Peak Global Opportunities Fund | |||||||||||||||
Investor Class | $ | 57,387 | $ | 8,775 | $ | 66,162 | |||||||||
Institutional Class | 130,976 | 11,427 | 142,402 | ||||||||||||
Grandeur Peak Global Reach Fund | |||||||||||||||
Investor Class | $ | – | $ | – | $ | – | |||||||||
Institutional Class | – | – | – | ||||||||||||
Grandeur Peak International Opportunities Fund | |||||||||||||||
Investor Class | $ | 42,227 | $ | 33,942 | $ | 76,169 | |||||||||
Institutional Class | 102,671 | 103,002 | 205,673 | ||||||||||||
Fund Accounting Fees and Expenses
ALPS Fund Services, Inc. (“ALPS” and the “Administrator”) (an affiliate of ALPS Distributors, Inc.) serves as administrator to the Funds, and each Fund has agreed to pay expenses incurred in connection with its administrative activities. Pursuant to the Administration, Bookkeeping and Pricing Services Agreement (the “Agreement”), ALPS will provide operational services to the Funds including, but not limited to fund accounting and fund administration and generally assist in each Fund’s operations.
| Semi-Annual Report | October 31, 2013 | 71 |
| Grandeur Peak Funds® | Notes to Financial Statements | |
| October 31, 2013 (Unaudited) |
Prior to the June 19, 2013 commencement of the Grandeur Peak Global Reach Fund, the Annual Administrative Fee was billed monthly in total and allocated to each Fund in the amount of the greater of (a) the annual minimum for both Funds of $205,000 or (b) following basis point fee schedule:
| Average Total Net Assets | Contractual Fee | |||
Between $0-$500M | 0.05% | |||
$500M-$1B | 0.03% | |||
Above $1B | 0.02% |
The minimum annual total fee of $205,000 was increased to $285,000 with the commencement of the Grandeur Peak Global Reach Fund on June 19, 2013.
The Administrator is also reimbursed by the Funds for certain out-of-pocket expenses.
Transfer Agent
ALPS serves as transfer, dividend paying and shareholder servicing agent for the Funds (“Transfer Agent”). ALPS is compensated based upon a $25,000 annual base fee per Fund, and annually $9 per direct open account and $7 per open account through NSCC. The Transfer Agent is also reimbursed by the Funds for certain out-of-pocket expenses.
Compliance Services
ALPS provides services which assist the Trust’s Chief Compliance Officer in monitoring and testing the policies and procedures of the Trust in conjunction with requirements under Rule 38a-1 under the 1940 Act. Prior to the June 19, 2013 initiation of the Grandeur Peak Global Reach Fund, ALPS was paid an annual base fee for Grandeur Peak Global Opportunities Fund and Grandeur Peak International Opportunities Fund of $30,000 which was thereafter increased to $40,000 for all 3 Funds. ALPS is reimbursed for certain out-of-pocket expenses. The annual fee is billed monthly in total and allocated to each Fund.
Principal Financial Officer
ALPS receives an annual fee for both Funds of $10,000 for providing Principal Financial Officer (“PFO”) services to the Funds. The annual fee is billed monthly in total and allocated to each Fund.
Distributor: ALPS Distributors, Inc. (“ADI” or the “Distributor”) (an affiliate of ALPS) acts as the distributor of the Funds’ shares pursuant to a Distribution Agreement with the Trust. Shares are sold on a continuous basis by ADI as agent for the Funds, and ADI has agreed to use its best efforts to solicit orders for the sale of each Fund’s shares, although it is not obliged to sell any particular amount of shares. ADI is not entitled to any compensation for its services as Distributor. ADI is registered as a broker-dealer with the Securities and Exchange Commission.
Each Fund has adopted a Distribution and Services (12b-1) Plan pursuant to Rule 12b 1 of the 1940 Act (the “Plan”) for its Investor Class shares. The Plan allows the Funds to use Investor Class assets to pay fees in connection with the distribution and marketing of Investor Class shares and/or the provision of shareholder services to Investor Class shareholders. The Plan permits payment for services in connection with the administration of plans or programs that use Investor Class shares of each Fund as their funding medium and for related expenses. The Plan permits the Funds to make total payments at an annual rate of up to 0.25% of each Fund’s average daily net assets
72 | 1.855.377.7325 | www.GrandeurPeakGlobal.com |
| Grandeur Peak Funds® | Notes to Financial Statements | |
| October 31, 2013 (Unaudited) |
attributable to its Investor Class shares. The expenses of the Plan are reflected as distribution and service fees in the Statement of Operations.
7. INDEMNIFICATIONS
Under the Trust’s organizational documents, its officers and Trustees are indemnified against certain liability arising out of the performance of their duties to the Trust. Additionally, in the normal course of business, the Trust enters into contracts with service providers that may contain general indemnification clauses, which may permit indemnification to the extent permissible under applicable law. The Trust’s maximum exposure under these arrangements is unknown, as this would involve future claims that may be made against the Trust that have not yet occurred.
8. NEW ACCOUNTING PRONOUNCEMENTS
In June 2013, the Financial Accounting Standards Board (the “FASB”) issued Accounting Standards Update (“ASU”) No. 2013-08, Financial Services-Investment Companies (Topic 946): Amendments to the Scope, Measurement, and Disclosure Requirements. The FASB standard identifies characteristics a company must assess to determine whether it is considered an investment company for financial reporting purposes. This ASU is effective for fiscal years beginning after December 15, 2013. The Funds believe the adoption of this ASU will not have a material impact on their financial statements.
| Semi-Annual Report | October 31, 2013 | 73 |
| Grandeur Peak Funds® | Disclosure Regarding Approval of Fund Advisory Agreements | |
| October 31, 2013 (Unaudited) |
GRANDEUR PEAK GLOBAL OPPORTUNITIES FUND AND GRANDEUR PEAK INTERNATIONAL OPPORTUNITIES FUND (THE “GRANDEUR PEAK FUNDS”)
On September 10, 2013, the Trustees met in person to discuss, among other things, the approval of the Investment Advisory Agreement between the Trust and Grandeur Peak Global Advisors, LLC (“Grandeur Peak”) (the “Grandeur Peak Advisory Agreement”) in accordance with Section 15(c) of the 1940 Act. The Independent Trustees met with independent legal counsel during executive session and discussed the Grandeur Peak Advisory Agreement and other related materials.
In renewing and approving the Grandeur Peak Advisory Agreement with Grandeur Peak, the Trustees, including the Independent Trustees, considered the following factors with respect to the Grandeur Peak Funds:
Investment Advisory Fee Rate: The Trustees reviewed and considered the contractual annual advisory fee to be paid by the Trust, on behalf of the Grandeur Peak Funds, to Grandeur Peak of 1.25% of each the Grandeur Peak Funds’ daily average net assets, in light of the extent and quality of the advisory services to be provided by Grandeur Peak to the Grandeur Peak Funds.
The Trustees considered the information they received comparing the Grandeur Peak Funds’ contractual annual advisory fee and overall net expenses with those of funds in both the relevant expense peer group provided by an independent provider of investment company data.
Based on such information, the Trustees further determined that the contractual annual advisory fee of 1.25% of each of the Grandeur Peak Funds and the total net expense ratio of 1.75% and 1.50% for the Investor Class and Institutional Class, respectively, of each of the Grandeur Peak Funds, although generally greater than each respective peer group median, were reasonable in light of the generally favorable performance of each Fund compared to their peer groups.
Nature, Extent and Quality of the Services under the Grandeur Peak Advisory Agreement: The Trustees received and considered information regarding the nature, extent and quality of services provided to the Grandeur Peak Funds under the Grandeur Peak Advisory Agreement. The Trustees reviewed certain background materials supplied by Grandeur Peak in its presentation, including its Form ADV Part 2.
The Trustees reviewed and considered Grandeur Peak’s investment advisory personnel, its history as an asset manager, its performance and the amount of assets currently under management by Grandeur Peak. The Trustees also reviewed the research and decision-making processes utilized by Grandeur Peak, including the methods adopted to seek to achieve compliance with the investment objectives, policies and restrictions of the Grandeur Peak Funds.
The Trustees considered the background and experience of Grandeur Peak’s management in connection with the Grandeur Peak Funds, including reviewing the qualifications, backgrounds and responsibilities of the management team primarily responsible for the day-to-day portfolio management of the Grandeur Peak Funds and the extent of the resources devoted to research and analysis of actual and potential investments.
74 | 1.855.377.7325 | www.GrandeurPeakGlobal.com |
| Grandeur Peak Funds® | Disclosure Regarding Approval of Fund Advisory Agreements | |
| October 31, 2013 (Unaudited) |
The Trustees also reviewed the accompanying compliance-related materials and further noted that they have received reports on these services and compliance issues at each regular Board meeting throughout the year related to the services rendered by Grandeur Peak with respect to the Grandeur Peak Funds.
Performance: The Trustees reviewed performance information for each Grandeur Peak Fund for the three-month and 1-year periods ended June 30, 2013. That review included a comparison of each Grandeur Peak Fund’s performance to the performance of a universe of comparable funds selected by an independent provider of investment company data. The Trustees noted the generally favorable performance of the each Grandeur Peak Fund compared against funds identified by an independent provider of investment company data.
The Adviser’s Profitability: The Trustees received a profitability analysis prepared by Grandeur Peak based on the fees payable under the Grandeur Peak Advisory Agreement. The Trustees considered the recent profits realized by Grandeur Peak in connection with the operation of the Grandeur Peak Funds. The Board then reviewed Grandeur Peak’s financial statements in order to analyze the financial condition and stability and profitability of the adviser.
Economies of Scale: The Trustees considered whether economies of scale in the provision of services to the Grandeur Peak Funds will be passed along to the shareholders under the proposed agreement.
Other Benefits to the Adviser: The Trustees reviewed and considered any other benefits derived or to be derived by Grandeur Peak from its relationship with the Grandeur Peak Funds, including soft dollar arrangements.
The Board summarized its deliberations with respect to the Grandeur Peak Advisory Agreement with Grandeur Peak. In selecting Grandeur Peak and approving the investment advisory agreement and fees under such agreement, the Trustees concluded that no single factor reviewed by the Trustees was identified by the Trustees to be determinative as the principal factor in whether to approve the investment advisory agreement. Further, the Independent Trustees were advised by separate independent legal counsel throughout the process. The Trustees, including all of the Independent Trustees, concluded that:
| — | the investment advisory fees to be received by Grandeur Peak with respect to the Grandeur Peak Funds were, although higher than applicable peer group medians, within an acceptable range of the median when considered in light of each Grandeur Peak Fund’s performance relative to its peer group; |
| — | the nature, extent and quality of services rendered by Grandeur Peak under the Grandeur Peak Advisory Agreement were adequate; |
| — | the performance of the Grandeur Peak Funds was generally favorable compared with the performance of the funds in the applicable peer universe; |
| — | the profit, if any, anticipated to be realized by Grandeur Peak in connection with the operation of the Grandeur Peak Funds is fair to the Trust; and |
| — | there were no material economies of scale or other benefits accruing to Grandeur Peak in connection with its relationship with the Grandeur Peak Funds. |
| Semi-Annual Report | October 31, 2013 | 75 |
| Grandeur Peak Funds® | Disclosure Regarding Approval of Fund Advisory Agreements | |
| October 31, 2013 (Unaudited) |
Based on the Trustees’ deliberations and their evaluation of the information described above, the Trustees, including all of the Independent Trustees, concluded that Grandeur Peak’s compensation for investment advisory services is consistent with the best interests of the Grandeur Peak Funds and their shareholders.
APPROVAL OF GRANDEUR PEAK GLOBAL REACH FUND
On March 12, 2013, the Trustees met in person to discuss, among other things, the approval of the Investment Advisory Agreement between the Trust and Grandeur Peak Global Advisors, LLC (“Grandeur Peak”) (the “Grandeur Peak Advisory Agreement”) in accordance with Section 15(c) of the 1940 Act. The Independent Trustees met with independent legal counsel during executive session and discussed the Grandeur Peak Advisory Agreement and other related materials.
In renewing and approving the Grandeur Peak Advisory Agreement with Grandeur Peak, the Trustees, including the Independent Trustees, considered the following factors with respect to the Grandeur Peak Global Reach Fund:
Investment Advisory Fee Rate: The Trustees reviewed and considered the contractual annual advisory fee to be paid by the Trust, on behalf of the Grandeur Peak Global Reach Fund, to Grandeur Peak of 1.10% of the Grandeur Peak Global Reach Fund’s daily average net assets, in light of the extent and quality of the advisory services to be provided by Grandeur Peak to the Grandeur Peak Global Reach Fund.
The Trustees considered the information they received comparing the Grandeur Peak Global Reach Fund’s contractual annual advisory fee and overall expenses with those of funds in both the relevant expense group and universe of funds provided by an independent provider of investment company data.
Based on such information, the Trustees further determined that the contractual annual advisory fee of 1.10% and the total expense ratio of 1.35% and 1.60% for the Institutional Class and Investors Class Shares, respectively, of the Grandeur Peak Global Reach Fund, taking into account the contractual fee waiver in place, are comparable to others within each Fund’s anticipated peer universe.
Nature, Extent and Quality of the Services under the Investment Advisory Agreement: The Trustees received and considered information regarding the nature, extent and quality of services to be provided to the Grandeur Peak Global Reach Fund under the Investment Advisory Agreement. The Trustees reviewed certain background materials supplied by Grandeur Peak in its presentation, including its Form ADV.
The Trustees reviewed and considered Grandeur Peak’s investment advisory personnel, its history as an asset manager and its performance and the amount of assets currently under management. The Trustees also reviewed the research and decision-making processes utilized by Grandeur Peak, including the methods adopted to seek to achieve compliance with the investment objectives, policies and restrictions of the Grandeur Peak Global Reach Fund.
76 | 1.855.377.7325 | www.GrandeurPeakGlobal.com |
| Grandeur Peak Funds® | Disclosure Regarding Approval of Fund Advisory Agreements | |
| October 31, 2013 (Unaudited) |
The Trustees considered the background and experience of Grandeur Peak’s management in connection with the Grandeur Peak Global Reach Fund, including reviewing the qualifications, backgrounds and responsibilities of the management team primarily responsible for the day-today portfolio management of the Grandeur Peak Global Reach Fund and the extent of the resources devoted to research and analysis of actual and potential investments.
The Trustees also reviewed, among other things, Grandeur Peak’s insider trading policies and procedures and its Code of Ethics.
Performance: The Trustees noted that since the Grandeur Peak Global Reach Fund had not yet begun operations, there was no fund performance to be reviewed or analyzed at the time. The Trustees also considered the limitations on the comparability of performance information for certain related funds and accounts. The Trustees considered Grandeur Peak’s reputation generally and its investment techniques, risk management controls and decision-making processes.
The Adviser’s Profitability: The Trustees received and considered a projected profitability analysis prepared by Grandeur Peak based on the fees payable under the Investment Advisory Agreement. The Trustees considered the profits, if any, anticipated to be realized by Grandeur Peak in connection with the operation of the Grandeur Peak Global Reach Fund. The Board then reviewed and discussed Grandeur Peak’s financial statements in order to analyze the financial condition and stability and profitability of the adviser.
Economies of Scale: The Trustees considered whether economies of scale in the provision of services to the Grandeur Peak Global Reach Fund will be passed along to the shareholders under the proposed agreement.
Other Benefits to the Adviser: The Trustees reviewed and considered any other incidental benefits derived or to be derived by Grandeur Peak from its relationship with the Grandeur Peak Global Reach Fund, including soft dollar arrangements.
The Board summarized its deliberations with respect to the Investment Advisory Agreement with Grandeur Peak. In selecting Grandeur Peak and the fees charged under the Investment Advisory Agreement, the Trustees concluded that no single factor reviewed by the Trustees was identified by the Trustees to be determinative as the principal factor in whether to approve the Investment Advisory Agreement. Further, the Independent Trustees were advised by separate independent legal counsel throughout the process. The Trustees, including all of the Independent Trustees, concluded that:
| — | the investment advisory fees to be received by Grandeur Peak with respect to the Grandeur Peak Global Reach Fund were comparable to others within the Fund’s peer universe; |
| — | the nature, extent and quality of services to be rendered by Grandeur Peak under the Investment Advisory Agreement were adequate; |
| — | there was no performance history for the Grandeur Peak Global Reach Fund for the Board to consider; |
| — | the terms of the proposed fee waiver and expense limitation agreement between the Trust, on behalf of the Grandeur Peak Global Reach Fund, and Grandeur Peak, were not unreasonable; |
| Semi-Annual Report | October 31, 2013 | 77 |
| Grandeur Peak Funds® | Disclosure Regarding Approval of Fund Advisory Agreements | |
| October 31, 2013 (Unaudited) |
| — | the profit, if any, anticipated to be realized by Grandeur Peak in connection with the operation of the Grandeur Peak Global Reach Fund is not unreasonable to the Fund; and |
| — | there were no material economies of scale or other incidental benefits accruing to Grandeur Peak in connection with its relationship to the Grandeur Peak Global Reach Fund. |
Based on the Trustees’ deliberations and their evaluation of the information described above, the Trustees, including all of the Independent Trustees, concluded that Grandeur Peak’s compensation for investment advisory services is consistent with the best interests of the Grandeur Peak Global Reach Fund and its shareholders.
78 | 1.855.377.7325 | www.GrandeurPeakGlobal.com |
| Grandeur Peak Funds® | Additional Information | |
| October 31, 2013 (Unaudited) |
1. FUND HOLDINGS
The Funds file their complete schedule of portfolio holdings with the Securities and Exchange Commission (the “SEC”) for the first and third quarters of each fiscal year on Form N-Q within 60 days after the end of the period. Copies of the Funds’ Form N-Q are available without charge on the SEC website at http://www.sec.gov. You may also review and copy the Form N-Q at the SEC’s Public Reference Room in Washington, DC. For more information about the operation of the Public Reference Room, please call the SEC at 1-800-SEC-0330.
2. FUND PROXY VOTING POLICIES, PROCEDURES AND SUMMARIES
The Funds’ policies and procedures used in determining how to vote proxies and information regarding how the Funds voted proxies relating to portfolio securities during the most recent prior 12-month period ending June 30 are available without charge, (1) upon request, by calling (toll-free) 855-377-PEAK(7325) and (2) on the SEC’s website at http://www.sec.gov.
| Semi-Annual Report | October 31, 2013 | 79 |
Page Intentionally Left Blank

| 1 | ||||
| 5 | ||||
| 8 | ||||
| 11 | ||||
| 14 | ||||
| 16 | ||||
| 17 | ||||
| 18 | ||||
| 19 | ||||
| 20 | ||||
| 21 | ||||
| 22 | ||||
| 23 | ||||
| 24 | ||||
| 25 | ||||
| 26 | ||||
| 27 | ||||
| 36 | ||||
| Shareholder Letter | ||
| October 31, 2013 (Unaudited) |
November 4, 2013
Dear Shareholder:
With 15 months now since the launch of the funds, we’ve seen assets steadily ramping up in each fund and we continue to attract interest as we spread the news of the Pathway offerings and how we can help those still contributing to their 401k’s. The table below summarizes the performance year-to-date through the end of October 2013.
| Year-To-Date Through 10/31/13 | ||
Pathway Advisors Conservative Fund | 3.35% | |
Pathway Advisors Growth & Income Fund | 8.56% | |
Pathway Advisors Aggressive Growth Fund | 16.25% |
The performance data quoted represents past performance. Past performance does not guarantee future results. The investment return and principal value of an investment will fluctuate so that an Investor’s shares, when redeemed, may not be worth more or less than their original cost and current performance may be lower or higher than the performance quoted. To obtain the most recent month-end performance data, please call 1-888-288-1121 or visit www.pathwayadvisorsfunds.com.
Hanson McClain Strategic Advisors, Inc. (the “Adviser”) has agreed contractually to limit the amount of each Fund’s total annual expenses, exclusive of Acquired Fund Fees and Expenses, brokerage expenses, interest expenses, taxes and extraordinary expenses, to 1.98% prior to October 1, 2013 and 1.88% subsequently, of each Fund’s average daily net assets. This agreement is in effect through August 31, 2015. The Adviser will be permitted to recover expenses it has borne through the agreement described above to the extent that each Fund’s expenses in later periods fall below the annual rates set forth in the relevant agreement. The Funds will not be obligated to pay any such deferred fees and expenses more than three years after the end of the fiscal year in which the fees and expense were deferred. The Adviser may not discontinue this waiver without the approval by the Funds’ Board of Trustees.
From the beginning of April through the end of October, it was largely a tale of two markets – the bond or fixed income markets and the equity markets. While, for the most part, equity markets regularly surged to multi-year or all-time highs, bond investors experienced the largest declines in years, with the yield on the 10-year Treasury bond surging from 1.64% in early May to 2.98% in early September. Rates have since backed down to 2.54% as of October 31, 2013. This easing of rates notwithstanding, investors exposed to a high degree of longer duration fixed income suffered declines. The rise in rates was primarily due to concerns of tapering of the Federal Reserve’s quantitative easing program, currently $85 billion in monthly purchases of treasuries and mortgage-backed securities. In the end, the central bank determined that the economy did not strengthen enough, particularly on the unemployment front, to warrant tapering and has since reiterated recently that it is not tapering. We see the tapering being data dependent on the continual recovery of the economy. As long as growth is low, inflation is low, and unemployment is above the Fed’s target, we believe tapering will be pushed back to a later date or the amount of tapering targeted will be reduced. This low growth and low inflation environment also reinforces our belief that the Fed’s control of short-term borrowing rates, the Fed Funds Rate, will likely stay at the 0-0.25% rate for a considerable time before it increases. While the equity markets see this as more free lunch in “kicking the can down the road” so long as earnings and valuations can be somewhat justified, the bond markets appear to be gradually discounting the eventual taper into
Semi-Annual Report | October 31, 2013 |
1 |
Pathway Advisors Funds | Shareholder Letter | |
| October 31, 2013 (Unaudited) |
rates. With the nomination of Janet Yellen to serve as the first Fed Chairwoman, however, long term rates are perhaps less likely to increase at the pace we witnessed between May and September. We also don’t believe, however, that rates will go back down to the record low levels we saw in Spring any time soon, barring a major catalyst or event that would drive a large flight to quality.
Despite the increased perceived risk with owning high quality bonds, particularly in this environment, we like to evaluate fixed income of all varying risks under the lens of what is best for the portfolio for the long term. While most of the attention is currently focused on interest rate or duration risk, the risk that bonds will decline in value due to a corresponding increase in varying levels of interest rates, we also need to look at liquidity risk, credit risk, and spread risk. Let’s look at each for a moment. Liquidity risk can be viewed, for all intents and purposes, as the risk that one may not be able to easily sell a security in an adverse market. Credit risk is generally related to the issuer’s ability to pay interest and principal back to investors and, conversely, the likelihood that it will default on its debt covenants. It’s also related to the degree to which prices decrease/yields increase due to a credit event such as a downgrade by a credit rating agency. Spread risk is related to credit risk, but focuses on the difference between the yield on the credit security, such as corporate bond, and that of a virtually credit risk-free government bond of the same maturity. When spreads widen, credit securities may decline in value, not necessarily due to a credit event such as a downgrade or default, but as the perceived risk of holding the credit issue has increased relative to holding a safer perceived security such as a government bond.
While duration risk is often complementary to market risk in the equity markets, liquidity risk, credit risk, and spread risk may occur simultaneously in a declining equity market. For this reason, we believe investments that exhibit higher duration risk (relative to credit/spread risk) can often help provide good diversification in a balanced portfolio while investments that exhibit greater credit/spread risk don’t provide as good of diversification benefit due to their being more highly correlated with equities. 2008 and the early part of 2009 were excellent examples of how investments with greater duration risk (and lower credit/spread risk) helped to reduce the negative impact the Great Recession had on equity prices while those investments with higher credit or spread risk also suffered large declines along with equities. With this in mind, we continue to evaluate both these risks on their own as well as how they contribute to the overall portfolio. In this environment, we frankly don’t find long duration/high quality bonds attractive as we believe the valuations in many cases are too high (yields are too low and likely artificial due to quantitative easing). Yet, we also don’t see lower credit quality issues being really attractive as spreads are tighter than normal and absolute yields are low considering the credit risk that one is taking on. Because we find neither a great opportunity, we are more focused on balancing these risks along with the ability to generate a consistent total return and diversification, which helps us to minimize the risk of the portfolio.
From April through October, our best bond investment performers were the SPDR Barclays High Yield Bond ETF (up 2.73%) and Loomis Sayles Bond fund (up 2.83%), both with high exposures of High Yield bonds, which performed well relative to the bond portion of our blended benchmark, the Barclays US Aggregate Bond index (down 0.98%). The worst bond investments for the Pathway funds were PIMCO Real Return fund (down 6.72%), and PIMCO Total Return (down 1.56%). On the equity side, the iShares International Select Dividend ETF (up 16.07%) and the Akre Focus fund (up 16.94%) were the top performers, beating the equity portion of our blended benchmark, the MSCI ACWI IMI (up 11.97%). The largest detractors to performance on the equity side were the WisdomTree Emerging Markets Small Cap Dividend ETF (down 2.47%) and the Vanguard REIT
|
www.pathwayadvisorsfunds.com |
Pathway Advisors Funds | Shareholder Letter | |
| October 31, 2013 (Unaudited) |
Index ETF (down 0.25%). On another note, we did reduce our exposure to PIMCO Real Return in July and invest this into the Putnam Capital Spectrum fund and this move has added value to the shareholders of Pathway. From August through October, Putnam Capital Spectrum was up by 6.04% while PIMCO Real Return was up 0.64% for the same period.
We continue to evaluate the positioning of each of the underlying funds we’re using and will make adjustments as necessary, keeping the entire risk/reward function of the portfolio in mind for each fund and emphasizing global diversification. With some valuation measures indicating that US equities are becoming richer relative to the rest of the world and with earnings growth slowing down, we are underweight equities relative to our blended or neutral benchmark. While we don’t know how long we can keep seeing new highs for indices such as the S&P 500, we do believe that total returns from this point will likely be lower, on average, for the next several years. Despite this, we do believe that, over the long term, investors who have a globally diversified portfolio with some lower correlating asset classes will fare better than those who are less diversified, despite possibly outperforming in the current environment. We appreciate the trust you have placed with us and we will continue to work tirelessly to do all that we can to position the portfolios optimally to reach your goals.
Sincerely,
David Schauer
Chief Investment Officer
Semi-Annual Report | October 31, 2013 |
3 |
Pathway Advisors Funds | Shareholder Letter | |
| October 31, 2013 (Unaudited) |
This manager commentary represents an assessment of the market environment at a specific point in time and is not intended to be a forecast of future events or a guarantee of future results. This information should not be relied upon by the reader as research or investment advice. Investors should consider carefully the investment objectives, risks, and charges and expenses of the Funds before investing. Portfolio composition is subject to change at any time and references to specific securities, industries and sectors referenced in this letter are not recommendations to purchase or sell a particular security. Current and future portfolio holdings are subject to risk. See the Portfolio of Investments holdings included in this semi-annual report for the percent of assets of each Fund invested in particular securities.
The Pathway Aggressive Growth Fund invests in underlying funds that use investment techniques and financial instruments that may be considered aggressive, including the use of futures contracts, options on futures contracts, securities and indices, forward contracts, swap agreements and similar instruments, exposes an underlying fund to potentially dramatic changes (losses) in the value of certain of its portfolio holdings.
The Pathway Growth and Income Fund’s share price can move down in response to stock market conditions, changes in the economy or changes in a particular underlying fund’s share price. An underlying fund may decline in value even when the values of stocks or bonds in general are rising. An underlying fund’s investments in fixed-income securities may decline in value because of changes in interest rates. As nominal interest rates rise, the value of fixed income securities held by an underlying fund (and indirectly, by the Fund) are likely to decrease.
The Pathway Conservative Fund invests in underlying funds that invest long or short in fixed-income securities subjects the Fund to additional risks that include credit risk, interest risk, maturity risk, investment-grade securities risk, municipal securities risk and prepayment risk. These risks could affect the value of a particular investment by the Fund, possibly causing the Fund’s share price and total return to be reduced and fluctuate more than other types of investments.
The performance data quoted represents past performance. Past performance does not guarantee future results. The investment return and principal value of an investment will fluctuate so that an Investor’s shares, when redeemed, may not be worth more or less than their original cost and current performance may be lower or higher than the performance quoted.
The Pathway Advisors Funds are distributed by ALPS Distributors, Inc.
|
www.pathwayadvisorsfunds.com |
| Performance Update | ||
| October 31, 2013 (Unaudited) |
Cumulative Total Return for the period ended October 31, 2013
| YTD | One Year | Since Inception* | ||||||||
Pathway Advisors Conservative Fund | 3.35% | 4.41% | 4.98% | |||||||
S&P 500® Total Return Index1 | 25.30% | 27.18% | 23.54% | |||||||
Barclays Capital U.S. Aggregate Bond Index2 | -1.10% | -1.08% | -0.49% | |||||||
Russell 2000® Index3 | 30.90% | 36.28% | 31.84% | |||||||
| * | Fund inception date of July 30, 2012. |
Indexes are not actively managed and do not reflect any deduction for fees or expenses. You cannot invest directly in an index.
The returns shown above do not reflect the deduction of taxes a shareholder would pay on Fund distributions or redemption of Fund shares.
Performance data quoted represents past performance. Past performance does not guarantee future results. Investment return and principal value of an investment will fluctuate so that an investor’s shares, when sold or redeemed, may be worth more or less than the original cost. Current performance data may be higher or lower than actual data quoted. For the most current month-end performance data, please call 1-888-288-1121 or visit www.pathwayadvisorsfunds.com.
| 1 | The S&P 500® Total Return Index is an unmanaged index of 500 common stocks chosen for the market size, liquidity and industry group representation. It is a market-value weighted index. The index is not actively managed and does not reflect any deduction for fees, expenses or taxes. An investor cannot invest directly into the index. |
| 2 | The Barclays Capital U.S. Aggregate Bond Index is a market capitalization-weighted index, meaning the securities in the index are weighted according to the market size of each bond type. Most U.S. traded investment grade bonds are represented. Municipal bonds, and Treasury Inflation- Protected Securities are excluded, due to tax treatment issues. The index includes Treasury securities, Government agency bonds, Mortgage-backed bonds, Corporate bonds, and a small amount of foreign bonds traded in U.S. The index is not actively managed and does not reflect any deduction for fees, expenses or taxes. An investor cannot invest directly into the index. |
| 3 | The Russell 2000® Index measures the performance of the small-cap segment of the U.S. equity universe. The Russell 2000® Index is a subset of the Russell 3000® Index representing approximately 10% of the total market capitalization of that index. It includes approximately 2000 of the smallest securities based on a combination of their market cap and current index membership. The index is not actively managed and does not reflect any deduction for fees, expenses or taxes. An investor cannot invest directly into the index. |
Semi-Annual Report | October 31, 2013 |
5 |
Pathway Advisors Conservative Fund | Performance Update | |
| October 31, 2013 (Unaudited) |
Growth of $10,000 for the period ended October 31, 2013
The graphs shown above represent a hypothetical investment of $10,000 in the Fund’s Investor Class shares for the period from inception to 10/31/13. All returns reflect reinvested dividends, but do not reflect the deduction of taxes that an investor would pay on distributions or redemptions.
|
www.pathwayadvisorsfunds.com |
Pathway Advisors Conservative Fund | Performance Update | |
| October 31, 2013 (Unaudited) |
| Top Ten Long Holdings | (as a % of Net Assets)* | |
DoubleLine Total Return Bond Fund - Class I | 17.83% | |
PIMCO Total Return Fund - Institutional Class | 12.94% | |
Vanguard® Wellesley Income Fund - Class Admiral | 12.10% | |
Metropolitan West Total Return Bond Fund - Class I | 10.96% | |
Vanguard® Wellington Fund - Class Admiral | 9.10% | |
Vanguard® Total Stock Market ETF | 7.17% | |
Loomis Sayles Bond Fund - Institutional Class | 6.02% | |
Templeton Global Bond Fund - Advisor Class | 5.95% | |
iShares® Dow Jones International Select Dividend Index Fund | 3.05% | |
Vanguard® REIT ETF | 3.05% | |
Top Ten Holdings | 88.17% |
Portfolio Allocation (as a % of Net Assets)*
| * | Holdings are subject to change. Table and chart presents indicative values only. |
Semi-Annual Report | October 31, 2013 |
7 |
| Performance Update | ||
| October 31, 2013 (Unaudited) |
Cumulative Total Return for the period ended October 31, 2013
| YTD | One Year | Since Inception | * | |||||||||
Pathway Advisors Growth and Income Fund - NAV | 8.56 | % | 10.03% | 10.06% | ||||||||
S&P 500 Total Return Index1 | 25.30 | % | 27.18% | 23.54% | ||||||||
Barclays Capital U.S. Aggregate Bond Index2 | -1.10 | % | -1.08% | -0.49% | ||||||||
Russell 2000® Index3 | 30.90 | % | 36.28% | 31.84% |
| * | Fund inception date of July 30, 2012. |
Indexes are not actively managed and do not reflect any deduction for fees or expenses. You cannot invest directly in an index.
The returns shown above do not reflect the deduction of taxes a shareholder would pay on Fund distributions or redemption of Fund shares.
Performance data quoted represents past performance. Past performance does not guarantee future results. Investment return and principal value of an investment will fluctuate so that an investor’s shares, when sold or redeemed, may be worth more or less than the original cost. Current performance data may be higher or lower than actual data quoted. For the most current month-end performance data, please call 1-888-288-1121 or visit www.pathwayadvisorsfunds.com.
| 1 | The S&P 500® Total Return Index is an unmanaged index of 500 common stocks chosen for the market size, liquidity and industry group representation. It is a market-value weighted index. The index is not actively managed and does not reflect any deduction for fees, expenses or taxes. An investor cannot invest directly into the index. |
| 2 | The Barclays Capital U.S. Aggregate Bond Index is a market capitalization-weighted index, meaning the securities in the index are weighted according to the market size of each bond type. Most U.S. traded investment grade bonds are represented. Municipal bonds, and Treasury Inflation- Protected Securities are excluded, due to tax treatment issues. The index includes Treasury securities, Government agency bonds, Mortgage-backed bonds, Corporate bonds, and a small amount of foreign bonds traded in U.S. The index is not actively managed and does not reflect any deduction for fees, expenses or taxes. An investor cannot invest directly into the index. |
| 3 | The Russell 2000® Index measures the performance of the small-cap segment of the U.S. equity universe. The Russell 2000® Index is a subset of the Russell 3000® Index representing approximately 10% of the total market capitalization of that index. It includes approximately 2000 of the smallest securities based on a combination of their market cap and current index membership. The index is not actively managed and does not reflect any deduction for fees, expenses or taxes. An investor cannot invest directly into the index. |
|
www.pathwayadvisorsfunds.com |
Pathway Advisors Growth and Income Fund | Performance Update | |
| October 31, 2013 (Unaudited) |
Growth of $10,000 for the period ended October 31, 2013
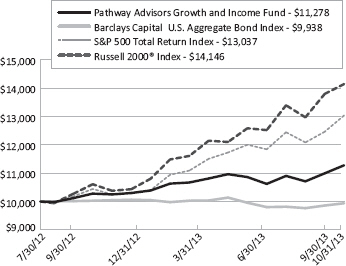
The graphs shown above represent a hypothetical investment of $10,000 in the Fund’s Investor Class shares for the period from inception to 10/31/13. All returns reflect reinvested dividends, but do not reflect the deduction of taxes that an investor would pay on distributions or redemptions.
Semi-Annual Report | October 31, 2013 |
9 |
Pathway Advisors Growth and Income Fund | Performance Update | |
| October 31, 2013 (Unaudited) |
| Top Ten Long Holdings | (as a % of Net Assets)* | |
SPDR® S&P 500® ETF Trust | 16.53% | |
DoubleLine Total Return Bond Fund - Class I | 16.49% | |
PIMCO Total Return Fund - Institutional Class | 10.72% | |
Vanguard® Wellington Fund - Class Admiral | 9.73% | |
T. Rowe Price Capital Appreciation Fund | 8.77% | |
iShares® Dow Jones International Select Dividend Index Fund | 7.71% | |
Metropolitan West Total Return Bond Fund - Class I | 4.87% | |
Vanguard® Large-Cap ETF | 4.86% | |
iShares® Dow Jones Select Dividend Index Fund | 4.86% | |
PIMCO Real Return Fund - Institutional Class | 3.89% | |
Top Ten Holdings | 88.43% |
Portfolio Allocation (as a % of Net Assets)*
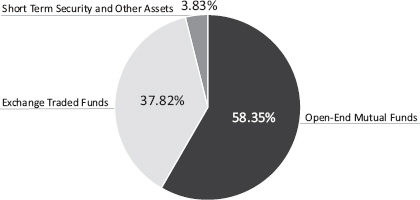
* Holdings are subject to change. Table and chart presents indicative values only.
|
www.pathwayadvisorsfunds.com |
| Performance Update | ||
| October 31, 2013 (Unaudited) |
Cumulative Total Return for the period ended October 31, 2013
| YTD | One Year | Since Inception* | |||||||||||||
Pathway Advisors Aggressive Growth Fund | 16.25% | 19.23% | 18.33% | ||||||||||||
MSCI EAFE® Index1 | 20.05% | 26.88% | 27.26% | ||||||||||||
S&P 500 Total Return Index2 | 25.30% | 27.18% | 23.54% | ||||||||||||
Russell 2000® Index3 | 30.90% | 36.28% | 31.84% | ||||||||||||
* Fund inception date of July 30, 2012.
Indexes are not actively managed and do not reflect any deduction for fees or expenses. You cannot invest directly in an index.
The returns shown above do not reflect the deduction of taxes a shareholder would pay on Fund distributions or redemption of Fund shares.
Performance data quoted represents past performance. Past performance does not guarantee future results. Investment return and principal value of an investment will fluctuate so that an investor’s shares, when sold or redeemed, may be worth more or less than the original cost. Current performance data may be higher or lower than actual data quoted. For the most current month-end performance data, please call 1-888-288-1121 or visit www.pathwayadvisorsfunds.com.
| 1 | MSCI EAFE® Index (Europe, Australasia, Far East) is a free float-adjusted market capitalization weighted index designed to measure developed market equity performance. The MSCI EAFE® Index is composed of companies representative of the market structure of Developed Market countries. The index includes reinvestment of dividends, net of foreign withholding taxes. The index is not actively managed and does not reflect any deduction for fees, expenses or taxes. An investor cannot invest directly into the index. |
| 2 | The S&P 500® Total Return Index is an unmanaged index of 500 common stocks chosen for the market size, liquidity and industry group representation. It is a market-value weighted index. The index is not actively managed and does not reflect any deduction for fees, expenses or taxes. An investor cannot invest directly into the index. |
| 3 | The Russell 2000® Index measures the performance of the small-cap segment of the U.S. equity universe. The Russell 2000® Index is a subset of the Russell 3000® Index representing approximately 10% of the total market capitalization of that index. It includes approximately 2000 of the smallest securities based on a combination of their market cap and current index membership. The index is not actively managed and does not reflect any deduction for fees, expenses or taxes. An investor cannot invest directly into the index. |
Source: MSCI. MSCI makes no express or implied warranties or representations and shall have no liability whatsoever with respect to any MSCI data contained herein. The MSCI data may not be further redistributed or used to create indices or financial products. This report is not approved or produced by MSCI.
Semi-Annual Report | October 31, 2013 |
11 |
Pathway Advisors Aggressive Growth Fund | Performance Update | |
| October 31, 2013 (Unaudited) |
Growth of $10,000 for the period ended October 31, 2013
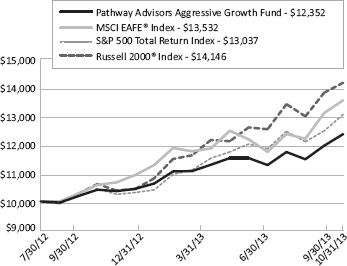
The graphs shown above represent a hypothetical investment of $10,000 in the Fund’s Investor Class shares for the period from inception to 10/31/13. All returns reflect reinvested dividends, but do not reflect the deduction of taxes that an investor would pay on distributions or redemptions.
|
www.pathwayadvisorsfunds.com |
Pathway Advisors Aggressive Growth Fund | Performance Update | |
| October 31, 2013 (Unaudited) |
| Top Ten Long Holdings | (as a % of Net Assets)* | ||||
iShares® Dow Jones International Select Dividend Index Fund | 15.90% | ||||
SPDR® S&P 500® ETF Trust | 14.16% | ||||
DoubleLine Total Return Bond Fund - Class I | 14.12% | ||||
Vanguard® Total Stock Market ETF | 13.20% | ||||
T. Rowe Price Capital Appreciation Fund | 8.51% | ||||
Mairs & Power Growth Fund - Investor Class | 7.55% | ||||
Akre Focus Fund - Institutional Class | 7.54% | ||||
Principal MidCap Fund - Institutional Class | 4.73% | ||||
Vanguard® FTSE Emerging Markets ETF | 3.75% | ||||
WisdomTree® Emerging Markets SmallCap Dividend Fund | 3.72% | ||||
Top Ten Holdings | 93.18% | ||||
Portfolio Allocation (as a % of Net Assets)*
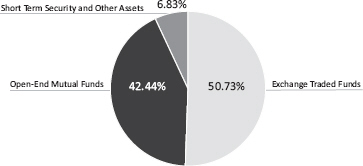
* Holdings are subject to change. Table and chart presents indicative values only.
Semi-Annual Report | October 31, 2013 |
13 |
| Disclosure of Fund Expenses | ||
| October 31, 2013 (Unaudited) |
As a shareholder of a Fund, you incur two types of costs: direct costs, such as short-term redemption fees and wire fees, and indirect costs, including management fees, and other fund operating expenses. This example is intended to help you understand your indirect costs, also referred to as “ongoing costs” (in dollars), of investing in the Fund and to compare these costs with the ongoing costs of investing in other mutual funds.
This example is based on an investment of $1,000 invested at the beginning of the period and held for the entire six-month period of May 1, 2013 through October 31, 2013.
Actual Expenses The first line of the table below provides information about actual account values and actual expenses. You may use the information in this line, together with the amount you invested at the beginning of the period, to estimate the expenses that you paid over the period. Simply divide your account value by $1,000 (for example, an $8,600 account value divided by $1,000 = 8.6), then multiply the result by the number in the first line under the heading “Expenses Paid During Period” to estimate the expenses you paid on your account during this period.
Hypothetical Example for Comparison Purposes The second line of the table provides information about hypothetical account values and hypothetical expenses based on the Fund’s actual expense ratio and an assumed rate of return of 5% per year before expenses, which is not the Fund’s actual return. The hypothetical account values and expenses may not be used to estimate the actual ending account balance or expenses you paid for the period. You may use this information to compare ongoing costs of investing in the Fund and other funds. To do so, compare this 5% hypothetical example with the 5% hypothetical examples that appear in the shareholder reports of other funds.
Please note that the expenses shown in the table are meant to highlight your ongoing costs only and do not reflect any direct costs, such as wire fees or low balance fees. Therefore, the second line of the table is useful in comparing ongoing costs only and will not help you determine the relative total costs of owning different funds. In addition, if these direct costs were included, your costs would be higher.
|
www.pathwayadvisorsfunds.com |
Pathway Advisors Funds | Disclosure of Fund Expenses | |
| October 31, 2013 (Unaudited) |
| BEGINNING ACCOUNT VALUE 05/01/13 | ENDING ACCOUNT VALUE 10/31/13 | EXPENSE RATIO(a) | EXPENSES PAID DURING PERIOD 05/01/13- 10/31/13(b) | |||||
Pathway Advisors Conservative Fund | ||||||||
Actual | $ 1,000.00 | $ 997.10 | 1.96% | $ 9.87 | ||||
Hypothetical (5% return before expenses) | $ 1,000.00 | $ 1,015.32 | 1.96% | $ 9.96 | ||||
Pathway Advisors Growth and Income Fund | ||||||||
Actual | $ 1,000.00 | $ 1,028.60 | 1.95% | $ 9.97 | ||||
Hypothetical (5% return before expenses) | $ 1,000.00 | $ 1,015.38 | 1.95% | $ 9.91 | ||||
Pathway Advisors Aggressive Growth Fund | ||||||||
Actual | $ 1,000.00 | $ 1,072.80 | 1.95% | $ 10.19 | ||||
Hypothetical (5% return before expenses) | $ 1,000.00 | $ 1,015.38 | 1.95% | $ 9.91 | ||||
| (a) | Annualized, based on the Funds’ most recent fiscal half year expenses. |
| (b) | Expenses are equal to the Funds’ annualized expense ratio multiplied by the average account value over the period, multiplied by the number of days in the most recent fiscal half-year (184)/365 (to reflect the half-year period). |
Semi-Annual Report | October 31, 2013 |
15 |
| Portfolio of Investments | ||
| October 31, 2013 (Unaudited) |
| Description | Shares | Value (Note 2) | ||||||||||
| ||||||||||||
EXCHANGE TRADED FUNDS (18.24%) | ||||||||||||
iShares® Dow Jones International Select Dividend Index Fund | 2,558 | $ | 97,230 | |||||||||
SPDR® Barclays Capital High Yield Bond ETF | 2,358 | 95,806 | ||||||||||
Vanguard® FTSE Emerging Markets ETF | 1,498 | 62,721 | ||||||||||
Vanguard® REIT ETF | 1,405 | 97,114 | ||||||||||
Vanguard® Total Stock Market ETF | 2,500 | 228,474 | ||||||||||
|
| |||||||||||
TOTAL EXCHANGE TRADED FUNDS (Cost $545,355) | 581,345 | |||||||||||
| ||||||||||||
OPEN-END MUTUAL FUNDS (80.86%) | ||||||||||||
DoubleLine Total Return Bond Fund - Class I | 51,760 | 568,328 | ||||||||||
Loomis Sayles Bond Fund - Institutional Class | 12,524 | 191,997 | ||||||||||
Metropolitan West Total Return Bond Fund - Class I | 32,614 | 349,299 | ||||||||||
PIMCO Real Return Fund - Institutional Class | 8,374 | 95,044 | ||||||||||
PIMCO Total Return Fund - Institutional Class | 37,832 | 412,368 | ||||||||||
Putnam Capital Spectrum Fund - Class Y | 2,833 | 95,460 | ||||||||||
Templeton Global Bond Fund - Advisor Class | 14,468 | 189,529 | ||||||||||
Vanguard® Wellesley Income Fund - Class Admiral | 6,281 | 385,623 | ||||||||||
Vanguard® Wellington Fund - Class Admiral | 4,368 | 289,929 | ||||||||||
TOTAL OPEN-END MUTUAL FUNDS (Cost $2,555,054) | 2,577,577 | |||||||||||
| ||||||||||||
| 7-Day Yield | Shares | Value (Note 2) | ||||||||||
| ||||||||||||
SHORT TERM INVESTMENTS (1.02%) | ||||||||||||
Dreyfus Cash Management, Institutional Shares | 0.040 | % | 32,478 | 32,478 | ||||||||
TOTAL SHORT TERM INVESTMENTS (Cost $32,478) | 32,478 | |||||||||||
| ||||||||||||
TOTAL INVESTMENTS (100.12%) (Cost $3,132,887) | $ | 3,191,400 | ||||||||||
Liabilities in Excess of Other Assets (-0.12%) | (3,734) | |||||||||||
| ||||||||||||
NET ASSETS (100.00%) | $ | 3,187,666 | ||||||||||
| ||||||||||||
Common Abbreviations:
ETF - Exchange Traded Fund.
FTSE - Financial Times and Stock Exchange.
PIMCO - Pacific Investment Management Company, LLC.
REIT - Real Estate Investment Trust.
SPDR - Standard & Poor’s Depository Receipts.
Holdings are subject to change.
See Notes to Financial Statements.
|
www.pathwayadvisorsfunds.com |
| Portfolio of Investments | ||
| October 31, 2013 (Unaudited) |
| Description | Shares | Value (Note 2) | ||||||||||
| ||||||||||||
EXCHANGE TRADED FUNDS (37.82%) | ||||||||||||
iShares® Dow Jones International Select Dividend Index Fund | 54,889 | $ | 2,086,331 | |||||||||
iShares® Dow Jones Select Dividend Index Fund | 18,824 | 1,313,915 | ||||||||||
SPDR® S&P 500® ETF Trust | 25,451 | 4,472,505 | ||||||||||
Vanguard® FTSE Emerging Markets ETF | 12,491 | 522,998 | ||||||||||
Vanguard® Large-Cap ETF | 16,292 | 1,315,905 | ||||||||||
WisdomTree® Emerging Markets SmallCap Dividend Fund | 10,728 | 518,162 | ||||||||||
TOTAL EXCHANGE TRADED FUNDS (Cost $9,599,256) | 10,229,816 | |||||||||||
| ||||||||||||
OPEN-END MUTUAL FUNDS (58.35%) | ||||||||||||
DoubleLine Total Return Bond Fund - Class I | 406,297 | 4,461,140 | ||||||||||
Metropolitan West Total Return Bond Fund - Class I | 123,066 | 1,318,040 | ||||||||||
PIMCO Real Return Fund - Institutional Class | 92,664 | 1,051,740 | ||||||||||
PIMCO Total Return Fund - Institutional Class | 266,031 | 2,899,734 | ||||||||||
Putnam Capital Spectrum Fund - Class Y | 31,133 | 1,048,878 | ||||||||||
T. Rowe Price Capital Appreciation Fund | 90,144 | 2,371,690 | ||||||||||
Vanguard® Wellington Fund - Class Admiral | 39,654 | 2,631,844 | ||||||||||
TOTAL OPEN-END MUTUAL FUNDS (Cost $15,580,839) | 15,783,066 | |||||||||||
| ||||||||||||
| 7-Day Yield | Shares | Value (Note 2) | ||||||||||
| ||||||||||||
SHORT TERM INVESTMENTS (2.74%) | ||||||||||||
Dreyfus Cash Management, Institutional Shares | 0.040 | % | 741,652 | 741,652 | ||||||||
TOTAL SHORT TERM INVESTMENTS (Cost $741,652) | 741,652 | |||||||||||
| ||||||||||||
TOTAL INVESTMENTS (98.91%) (Cost $25,921,747) | $ | 26,754,534 | ||||||||||
Other Assets In Excess Of Liabilities (1.09%) | 295,594 | |||||||||||
| ||||||||||||
NET ASSETS (100.00%) | $ | 27,050,128 | ||||||||||
| ||||||||||||
Common Abbreviations:
ETF - Exchange Traded Fund.
FTSE - Financial Times and Stock Exchange.
PIMCO - Pacific Investment Management Company, LLC.
S&P - Standard & Poor’s.
SPDR - Standard & Poor’s Depository Receipts.
Holdings are subject to change.
See Notes to Financial Statements.
Semi-Annual Report | October 31, 2013 |
17 |
| Portfolio of Investments | ||
| October 31, 2013 (Unaudited) |
| Description | Shares | Value (Note 2) | ||||||||||
| ||||||||||||
EXCHANGE TRADED FUNDS (50.73%) | ||||||||||||
iShares® Dow Jones International Select Dividend Index Fund | 43,853 | $ | 1,666,852 | |||||||||
SPDR® S&P 500® ETF Trust | 8,444 | 1,483,864 | ||||||||||
Vanguard® FTSE Emerging Markets ETF | 9,394 | 393,327 | ||||||||||
Vanguard® Total Stock Market ETF | 15,139 | 1,383,553 | ||||||||||
WisdomTree® Emerging Markets SmallCap Dividend Fund | 8,067 | 389,636 | ||||||||||
|
| |||||||||||
TOTAL EXCHANGE TRADED FUNDS (Cost $4,978,462) | 5,317,232 | |||||||||||
| ||||||||||||
OPEN-END MUTUAL FUNDS (42.44%) | ||||||||||||
Akre Focus Fund - Institutional Class | 39,327 | 790,080 | ||||||||||
DoubleLine Total Return Bond Fund - Class I | 134,793 | 1,480,032 | ||||||||||
Mairs & Power Growth Fund - Investor Class | 7,339 | 791,342 | ||||||||||
Principal MidCap Fund - Institutional Class | 24,590 | 495,497 | ||||||||||
T. Rowe Price Capital Appreciation Fund | 33,896 | 891,815 | ||||||||||
|
| |||||||||||
TOTAL OPEN-END MUTUAL FUNDS (Cost $4,256,437) | 4,448,766 | |||||||||||
| ||||||||||||
| 7-Day Yield | Shares | Value (Note 2) | ||||||||||
| ||||||||||||
SHORT TERM INVESTMENTS (1.80%) | ||||||||||||
Dreyfus Cash Management, Institutional Shares | 0.040 | % | 188,965 | 188,965 | ||||||||
|
| |||||||||||
TOTAL SHORT TERM INVESTMENTS (Cost $188,965) | 188,965 | |||||||||||
| ||||||||||||
TOTAL INVESTMENTS (94.97%) (Cost $9,423,864) | $ | 9,954,963 | ||||||||||
Other Assets In Excess Of Liabilities (5.03%) | 527,694 | |||||||||||
| ||||||||||||
NET ASSETS (100.00%) | $ | 10,482,657 | ||||||||||
| ||||||||||||
Common Abbreviations:
ETF - Exchange Traded Fund.
FTSE - Financial Times and Stock Exchange.
S&P - Standard & Poor’s.
SPDR - Standard & Poor’s Depository Receipts.
Holdings are subject to change.
See Notes to Financial Statements.
|
www.pathwayadvisorsfunds.com |
| Statements of Assets and Liabilities | ||
| October 31, 2013 (Unaudited) |
| PATHWAY ADVISORS CONSERVATIVE FUND | PATHWAY ADVISORS GROWTH AND INCOME FUND | PATHWAY ADVISORS AGGRESSIVE GROWTH FUND | ||||||||||
|
| |||||||||||
ASSETS | ||||||||||||
Investments, at value | $ | 3,191,400 | $ | 26,754,534 | $ | 9,954,963 | ||||||
Cash | – | 674,073 | 622,105 | |||||||||
Receivable due from advisor | 7,998 | – | 3,076 | |||||||||
Dividends receivable | 4,290 | 29,471 | 6,824 | |||||||||
Other assets | 10,562 | 10,918 | 10,679 | |||||||||
| ||||||||||||
Total assets | 3,214,250 | 27,468,996 | 10,597,647 | |||||||||
| ||||||||||||
LIABILITIES | ||||||||||||
Investment advisory fees payable | – | 5,931 | – | |||||||||
Distributions and service fees payable | 2,596 | 16,964 | 6,055 | |||||||||
Payable for investments purchased | – | 341,912 | 78,039 | |||||||||
Payable for trustee fees and expenses | 24 | 75 | 41 | |||||||||
Payable for chief compliance officer fees | 659 | 4,430 | 1,675 | |||||||||
Payable for principal financial officer fees | 165 | 1,108 | 419 | |||||||||
Payable for administration fees | 3,989 | 28,962 | 10,570 | |||||||||
Payable for transfer agency fees | 6,364 | 5,520 | 4,935 | |||||||||
Payable for professional fees | 9,761 | 10,477 | 9,838 | |||||||||
Payable for custody fees | 1,279 | 979 | 1,280 | |||||||||
Payable for reports to shareholders | 229 | 912 | 376 | |||||||||
Accrued expenses and other liabilities | 1,518 | 1,598 | 1,762 | |||||||||
| ||||||||||||
Total liabilities | 26,584 | 418,868 | 114,990 | |||||||||
| ||||||||||||
NET ASSETS | $ | 3,187,666 | $ | 27,050,128 | $ | 10,482,657 | ||||||
| ||||||||||||
| ||||||||||||
NET ASSETS CONSIST OF | ||||||||||||
Paid-in capital (Note 5) | $ | 3,108,638 | $ | 26,129,501 | $ | 9,882,217 | ||||||
Accumulated net investment income | 24,146 | 90,240 | 34,373 | |||||||||
Accumulated net realized gain/(loss) on investments | (3,631) | (2,400) | 34,968 | |||||||||
Net unrealized appreciation on investments | 58,513 | 832,787 | 531,099 | |||||||||
| ||||||||||||
NET ASSETS | $ | 3,187,666 | $ | 27,050,128 | $ | 10,482,657 | ||||||
| ||||||||||||
| ||||||||||||
INVESTMENTS, AT COST | $ | 3,132,887 | $ | 25,921,747 | $ | 9,423,864 | ||||||
| ||||||||||||
PRICING OF SHARES | ||||||||||||
Net Asset Value, offering and redemption price per share | $ | 10.48 | $ | 11.16 | $ | 12.23 | ||||||
Net Assets | $ | 3,187,666 | $ | 27,050,128 | $ | 10,482,657 | ||||||
Shares of beneficial interest outstanding | 304,292 | 2,424,553 | 857,048 | |||||||||
See Notes to Financial Statements.
Semi-Annual Report | October 31, 2013 |
19 |
| Statements of Operations | ||
For the Period July 31, 2012 (Commencement of Operations) to October 31, 2013 (Unaudited) | ||
| PATHWAY ADVISORS CONSERVATIVE FUND | PATHWAY ADVISORS GROWTH AND INCOME FUND | PATHWAY ADVISORS AGGRESSIVE GROWTH FUND | ||||||||||
|
| |||||||||||
INVESTMENT INCOME | ||||||||||||
Dividends | $ | 45,163 | $ | 235,612 | $ | 86,687 | ||||||
| ||||||||||||
Total investment income | 45,163 | 235,612 | 86,687 | |||||||||
| ||||||||||||
EXPENSES | ||||||||||||
Investment advisory fees | 12,748 | 75,891 | 26,927 | |||||||||
Administration fees | 15,787 | 83,552 | 29,526 | |||||||||
Transfer agency fees | 16,383 | 18,457 | 15,595 | |||||||||
Distribution and service fees | 5,783 | 35,458 | 12,305 | |||||||||
Legal fees | 78 | 1,032 | 311 | |||||||||
Audit and tax fees | 7,522 | 8,078 | 7,512 | |||||||||
Custody fees | 2,530 | 2,789 | 2,530 | |||||||||
Reports to shareholders | 93 | 980 | 285 | |||||||||
Trustee fees and expenses | 25 | 91 | 40 | |||||||||
Registration/filing fees | 6,461 | 7,187 | 6,987 | |||||||||
Chief compliance officer fees | 2,430 | 13,151 | 4,596 | |||||||||
Principal financial officer fees | 608 | 3,288 | 1,149 | |||||||||
Offering costs | 13,790 | 13,674 | 13,674 | |||||||||
Other | 2,217 | 3,095 | 2,125 | |||||||||
| ||||||||||||
Total expenses before waivers | 86,455 | 266,723 | 123,562 | |||||||||
Less fees waived/reimbursed by investment advisor | (61,485) | (118,558) | (71,038) | |||||||||
| ||||||||||||
Total net expenses | 24,970 | 148,165 | 52,524 | |||||||||
| ||||||||||||
NET INVESTMENT INCOME | 20,193 | 87,447 | 34,163 | |||||||||
| ||||||||||||
Net realized gain/(loss) on investments | (6,711) | (5,424) | 23,340 | |||||||||
Net change in unrealized appreciation on investments | 34,929 | 749,270 | 462,176 | |||||||||
| ||||||||||||
NET REALIZED AND UNREALIZED GAIN ON INVESTMENTS | 28,218 | 743,846 | 485,516 | |||||||||
| ||||||||||||
NET INCREASE IN NET ASSETS RESULTING FROM OPERATIONS | $ | 48,411 | $ | 831,293 | $ | 519,679 | ||||||
| ||||||||||||
| ||||||||||||
See Notes to Financial Statements.
|
www.pathwayadvisorsfunds.com |
Conservative Fund | Statements of Changes in Net Assets | |
| Six Months Ended October 31, 2013 (Unaudited) | For the Period April 30, 2013(a) | |||||||
| ||||||||
OPERATIONS | ||||||||
Net investment income | $ | 20,193 | $ | 5,904 | ||||
Net realized gain/(loss) on investments | (6,711) | 2,117 | ||||||
Long-term capital gain distributions from other investment companies | – | 1,489 | ||||||
Net change in unrealized appreciation on investments | 34,929 | 23,584 | ||||||
| ||||||||
Net increase in net assets resulting from operations | 48,411 | 33,094 | ||||||
| ||||||||
DISTRIBUTIONS | ||||||||
Net investment income | – | (3,846) | ||||||
Net realized gains on investments | – | (526) | ||||||
| ||||||||
Net decrease in net assets from distributions | – | (4,372) | ||||||
| ||||||||
BENEFICIAL INTEREST TRANSACTIONS (NOTE 5) | ||||||||
Shares sold | 2,160,321 | 1,332,626 | ||||||
Dividends reinvested | – | 4,372 | ||||||
Shares redeemed | (384,786) | (2,000) | ||||||
| ||||||||
Net increase in net assets derived from beneficial interest transactions | 1,775,535 | 1,334,998 | ||||||
| ||||||||
Net increase in Net Assets | 1,823,946 | 1,363,720 | ||||||
NET ASSETS: | ||||||||
Beginning of period | 1,363,720 | – | ||||||
| ||||||||
End of period* | $ | 3,187,666 | $ | 1,363,720 | ||||
| ||||||||
| ||||||||
* Includes accumulated net investment income of: | $ | 24,146 | $ | 3,953 | ||||
| (a) | The Fund commenced operations on July 31, 2012. |
See Notes to Financial Statements.
Semi-Annual Report | October 31, 2013 |
21 |
Growth and Income Fund | Statements of Changes in Net Assets | |
| Six Months Ended October 31, 2013 (Unaudited) | For the Period April 30, 2013(a) | |||||||
| ||||||||
OPERATIONS | ||||||||
Net investment income | $ | 87,447 | $ | 3,547 | ||||
Net realized gain/(loss) on investments | (5,424) | 2,331 | ||||||
Long-term capital gain distributions from other investment companies | – | 1,553 | ||||||
Net change in unrealized appreciation on investments | 749,270 | 83,517 | ||||||
| ||||||||
Net increase in net assets resulting from operations | 831,293 | 90,948 | ||||||
| ||||||||
DISTRIBUTIONS | ||||||||
Net investment income | – | (3,542) | ||||||
Net realized gains on investments | – | (860) | ||||||
| ||||||||
Net decrease in net assets from distributions | – | (4,402) | ||||||
| ||||||||
BENEFICIAL INTEREST TRANSACTIONS (NOTE 5) | ||||||||
Shares sold | 21,933,880 | 5,015,665 | ||||||
Dividends reinvested | – | 4,402 | ||||||
Shares redeemed | (821,658) | – | ||||||
| ||||||||
Net increase in net assets derived from beneficial interest transactions | 21,112,222 | 5,020,067 | ||||||
| ||||||||
Net increase in Net Assets | 21,943,515 | 5,106,613 | ||||||
NET ASSETS: | ||||||||
Beginning of period | 5,106,613 | – | ||||||
| ||||||||
End of period* | $ | 27,050,128 | $ | 5,106,613 | ||||
| ||||||||
| ||||||||
* Includes accumulated net investment income of: | $ | 90,240 | $ | 2,793 | ||||
| (a) | The Fund commenced operations on July 31, 2012. |
See Notes to Financial Statements.
|
www.pathwayadvisorsfunds.com |
Aggressive Growth Fund | Statements of Changes in Net Assets | |
| Six Months Ended October 31, 2013 (Unaudited) | For the Period Ended April 30, 2013(a) | |||||||
| ||||||||
OPERATIONS | ||||||||
Net investment income | $ | 34,163 | $ | 1,544 | ||||
Net realized gain on investments | 23,340 | 10,945 | ||||||
Long-term capital gain distributions from other investment companies | – | 1,722 | ||||||
Net change in unrealized appreciation on investments | 462,176 | 68,923 | ||||||
| ||||||||
Net increase in net assets resulting from operations | 519,679 | 83,134 | ||||||
| ||||||||
DISTRIBUTIONS | ||||||||
Net investment income | – | (3,440) | ||||||
Net realized gains on investments | – | (1,039) | ||||||
| ||||||||
Net decrease in net assets from distributions | – | (4,479) | ||||||
| ||||||||
BENEFICIAL INTEREST TRANSACTIONS (NOTE 5) | ||||||||
Shares sold | 8,541,508 | 1,601,209 | ||||||
Dividends reinvested | – | 4,479 | ||||||
Shares redeemed | (157,485) | (105,388) | ||||||
| ||||||||
Net increase in net assets derived from beneficial interest transactions | 8,384,023 | 1,500,300 | ||||||
| ||||||||
Net increase in Net Assets | 8,903,702 | 1,578,955 | ||||||
NET ASSETS: | ||||||||
Beginning of period | 1,578,955 | – | ||||||
| ||||||||
End of period* | $ | 10,482,657 | $ | 1,578,955 | ||||
| ||||||||
| ||||||||
* Includes accumulated net investment income of: | $ | 34,373 | $ | 210 | ||||
| (a) | The Fund commenced operations on July 31, 2012. |
See Notes to Financial Statements.
Semi-Annual Report | October 31, 2013 |
23 |
| Financial Highlights | ||
| For a share outstanding throughout the periods presented. |
For the Six Months Ended October 31, 2013 (Unaudited) | For the Period Ended April 30, 2013(a) | |||||||
| ||||||||
NET ASSET VALUE, BEGINNING OF PERIOD | $ | 10.51 | $ | 10.00 | ||||
INCOME/(LOSS) FROM OPERATIONS | ||||||||
Net investment income(b) | 0.08 | 0.14 | ||||||
Net realized and unrealized gain/(loss) on investments | (0.11) | 0.52 | ||||||
|
|
|
| |||||
Total from Investment Operations | (0.03) | 0.66 | ||||||
|
|
|
| |||||
LESS DISTRIBUTIONS | ||||||||
Net investment income | – | (0.13) | ||||||
Net realized gain on investments | – | (0.02) | ||||||
|
|
|
| |||||
Total Distributions | – | (0.15) | ||||||
|
|
|
| |||||
NET INCREASE/(DECREASE) IN NET ASSET VALUE | (0.03) | 0.51 | ||||||
|
|
|
| |||||
NET ASSET VALUE, END OF PERIOD | $ | 10.48 | $ | 10.51 | ||||
|
|
|
| |||||
TOTAL RETURN(c) | (0.29%) | 6.59% | ||||||
RATIOS/SUPPLEMENTAL DATA | ||||||||
Net assets, End of Period (000s) | $ | 3,188 | $ | 1,364 | ||||
RATIOS TO AVERAGE NET ASSETS: | ||||||||
Operating expenses excluding reimbursement/waiver(d) | 6.78%(e)(f) | 49.62%(e)(f) | ||||||
Operating expenses including reimbursement/waiver(d) | 1.96%(e)(f)(g) | 1.98%(e)(f) | ||||||
Net investment income including reimbursement/waiver(d) | 1.58%(e) | 1.83%(e) | ||||||
PORTFOLIO TURNOVER RATE | 24%(h) | 18%(h) | ||||||
| (a) | The Fund commenced operations on July 31, 2012. |
| (b) | Calculated using the average shares method. |
| (c) | Total investment return is calculated assuming a purchase of a common share at the opening of the first day and a sale at closing on the last day of each period reported. Dividends and distributions, if any, are assumed for purposes of this calculation to be reinvested at prices obtained under the Fund’s dividend reinvestment plan. Total returns would have been lower had certain expenses not been waived during the period. Total investment returns do not reflect brokerage commissions, if any, and are not annualized. |
| (d) | The ratios exclude the impact of expenses of the underlying funds in which the Fund invests as represented in the Portfolio of Investments. |
| (e) | Annualized. |
| (f) | Expense ratios before reductions for startup periods may not be representative of longer term operating periods. |
| (g) | Contractual expense limitation changed from 1.98% to 1.88% effective October 1, 2013. |
| (h) | Not Annualized. |
See Notes to Financial Statements.
|
www.pathwayadvisorsfunds.com |
| Financial Highlights | ||
| For a share outstanding throughout the periods presented. |
For the Six Months Ended October 31, 2013 (Unaudited) | For the Period Ended April 30, 2013(a) | |||||||
| ||||||||
NET ASSET VALUE, BEGINNING OF PERIOD | $ | 10.85 | $ | 10.00 | ||||
INCOME/(LOSS) FROM OPERATIONS | ||||||||
Net investment income(b) | 0.06 | 0.05 | ||||||
Net realized and unrealized gain on investments | 0.25 | 0.91 | ||||||
|
|
|
| |||||
Total from Investment Operations | 0.31 | 0.96 | ||||||
|
|
|
| |||||
LESS DISTRIBUTIONS | ||||||||
Net investment income | – | (0.09) | ||||||
Net realized gain on investments | – | (0.02) | ||||||
|
|
|
| |||||
Total Distributions | – | (0.11) | ||||||
|
|
|
| |||||
NET INCREASE IN NET ASSET VALUE | 0.31 | 0.85 | ||||||
|
|
|
| |||||
NET ASSET VALUE, END OF PERIOD | $ | 11.16 | $ | 10.85 | ||||
|
|
|
| |||||
TOTAL RETURN(c) | 2.86% | 9.65% | ||||||
RATIOS/SUPPLEMENTAL DATA | ||||||||
Net assets, End of Period (000s) | $ | 27,050 | $ | 5,107 | ||||
RATIOS TO AVERAGE NET ASSETS: | ||||||||
Operating expenses excluding reimbursement/waiver(d) | 3.51%(e)(f) | 33.89%(e)(f) | ||||||
Operating expenses including reimbursement/waiver(d) | 1.95%(e)(f)(g) | 1.98%(e)(f) | ||||||
Net investment income including reimbursement/waiver(d) | 1.15%(e) | 0.64%(e) | ||||||
PORTFOLIO TURNOVER RATE | 4%(h) | 5%(h) | ||||||
| (a) | The Fund commenced operations on July 31, 2012. |
| (b) | Calculated using the average shares method. |
| (c) | Total investment return is calculated assuming a purchase of a common share at the opening of the first day and a sale at closing on the last day of each period reported. Dividends and distributions, if any, are assumed for purposes of this calculation to be reinvested at prices obtained under the Fund’s dividend reinvestment plan. Total returns would have been lower had certain expenses not been waived during the period. Total investment returns do not reflect brokerage commissions, if any, and are not annualized. |
| (d) | The ratios exclude the impact of expenses of the underlying funds in which the Fund invests as represented in the Portfolio of Investments. |
| (e) | Annualized. |
| (f) | Expense ratios before reductions for startup periods may not be representative of longer term operating periods. |
| (g) | Contractual expense limitation changed from 1.98% to 1.88% effective October 1, 2013. |
| (h) | Not Annualized. |
See Notes to Financial Statements.
Semi-Annual Report | October 31, 2013 |
25 |
| Financial Highlights | ||
| For a share outstanding throughout the periods presented. |
For the Six Months Ended October 31, 2013 (Unaudited) | For the Period Ended April 30, 2013(a) | |||||||
| ||||||||
NET ASSET VALUE, BEGINNING OF PERIOD | $ | 11.40 | $ | 10.00 | ||||
INCOME/(LOSS) FROM OPERATIONS | ||||||||
Net investment income(b) | 0.07 | 0.03 | ||||||
Net realized and unrealized gain on investments | 0.76 | 1.47 | ||||||
|
|
|
| |||||
Total from Investment Operations | 0.83 | 1.50 | ||||||
|
|
|
| |||||
LESS DISTRIBUTIONS | ||||||||
Net investment income | – | (0.08) | ||||||
Net realized gain on investments | – | (0.02) | ||||||
|
|
|
| |||||
Total Distributions | – | (0.10) | ||||||
|
|
|
| |||||
NET INCREASE IN NET ASSET VALUE | 0.83 | 1.40 | ||||||
|
|
|
| |||||
NET ASSET VALUE, END OF PERIOD | $ | 12.23 | $ | 11.40 | ||||
|
|
|
| |||||
TOTAL RETURN(c) | 7.28% | 15.14% | ||||||
RATIOS/SUPPLEMENTAL DATA | ||||||||
Net assets, End of Period (000s) | $ | 10,483 | $ | 1,579 | ||||
RATIOS TO AVERAGE NET ASSETS: | ||||||||
Operating expenses excluding reimbursement/waiver(d) | 4.59%(e)(f) | 44.74%(e)(f) | ||||||
Operating expenses including reimbursement/waiver(d) | 1.95%(e)(f)(g) | 1.98%(e)(f) | ||||||
Net investment income including reimbursement/waiver(d) | 1.27%(e) | 0.39%(e) | ||||||
PORTFOLIO TURNOVER RATE | 3%(h) | 31%(h) | ||||||
| (a) | The Fund commenced operations on July 31, 2012. |
| (b) | Calculated using the average shares method. |
| (c) | Total investment return is calculated assuming a purchase of a common share at the opening of the first day and a sale at closing on the last day of each period reported. Dividends and distributions, if any, are assumed for purposes of this calculation to be reinvested at prices obtained under the Fund’s dividend reinvestment plan. Total returns would have been lower had certain expenses not been waived during the period. Total investment returns do not reflect brokerage commissions, if any, and are not annualized. |
| (d) | The ratios exclude the impact of expenses of the underlying funds in which the Fund invests as represented in the Portfolio of Investments. |
| (e) | Annualized. |
| (f) | Expense ratios before reductions for startup periods may not be representative of longer term operating periods. |
| (g) | Contractual expense limitation changed from 1.98% to 1.88% effective October 1, 2013. |
| (h) | Not Annualized. |
See Notes to Financial Statements.
|
www.pathwayadvisorsfunds.com |
| Notes to Financial Statements | ||
| October 31, 2013 (Unaudited) |
1. ORGANIZATION
Financial Investors Trust (the “Trust”), a Delaware statutory trust, is an open-end management investment company registered under the Investment Company Act of 1940, as amended (“1940 Act”). As of October 31, 2013, the Trust has 27 registered funds. This semi-annual report describes Pathway Advisors Conservative Fund, Pathway Advisors Growth and Income Fund and Pathway Advisors Aggressive Growth Fund (individually a “Fund” and collectively, the “Funds”). The Funds’ inception date was July 30, 2012 and operations commenced on July 31, 2012. The Pathway Advisors Conservative Fund seeks total return through a primary emphasis on income with a secondary emphasis on growth of capital. The Pathway Advisors Growth and Income Fund seeks total return through growth of capital and income. The Pathway Advisors Aggressive Growth Fund seeks total return through a primary emphasis on growth with a secondary emphasis on income.
Principal Investment Strategies of each Fund: Each Fund is structured as a fund-of-funds and under normal circumstances, the Funds pursue their objectives by investing primarily in managed portfolios of other open-end investment companies registered under the 1940 Act, that represent a variety of asset classes and investment styles. The Funds may also invest in closed-end funds and exchange-traded funds, which provide exposure to hedging or alternative strategies. Collectively, the investment companies in which the Funds may invest are referred to as “underlying funds”.
2. SIGNIFICANT ACCOUNTING POLICIES
The accompanying financial statements were prepared in accordance with accounting principles generally accepted in the United States of America (“U.S. GAAP”). The preparation of financial statements in conformity with U.S. GAAP requires management to make certain estimates and assumptions that affect the reported amounts of assets and liabilities and disclosures of contingent assets and liabilities at the date of the financial statements and the reported amounts of revenue and expenses during the period. Actual results could differ from those estimates. The following is a summary of significant accounting policies consistently followed by the Funds in preparation of their financial statements.
Investment Valuation: The Funds generally value their securities based on market prices determined at the close of regular trading on the New York Stock Exchange (“NYSE”), normally 4:00 p.m. Eastern Time, on each day the NYSE is open for trading.
For equity securities and mutual funds that are traded on an exchange, the market price is usually the closing sale or official closing price on that exchange. In the case of equity securities not traded on an exchange, or if such closing prices are not otherwise available, the securities are valued at the mean of the most recent bid and ask prices on such day. Redeemable securities issued by open-end registered investment companies are valued at the investment company’s applicable net asset value, with the exception of exchange-traded open-end investment companies, which are priced as equity securities.
The market price for debt obligations is generally the price supplied by an independent third-party pricing service approved by the Board of Trustees (the “Board”), which may use a matrix, formula or other objective method that takes into consideration quotations from dealers, market transactions in comparable investments, market indices and yield curves. If vendors are unable to
Semi-Annual Report | October 31, 2013 |
27 |
Pathway Advisors Funds | Notes to Financial Statements | |
| October 31, 2013 (Unaudited) |
supply a price, or if the price supplied is deemed to be unreliable, the market price may be determined using quotations received from one or more broker-dealers that make a market in the security. Short–term debt obligations that will mature in 60 days or less are valued at amortized cost, unless it is determined that using this method would not reflect an investment’s fair value.
When such prices or quotations are not available, or when the Fair Value Committee appointed by the Board believes that they are unreliable, securities may be priced using fair value procedures approved by the Board.
Fair Value Measurements: The Funds disclose the classification of their fair value measurements following a three-tier hierarchy based on the inputs used to measure fair value. Inputs refer broadly to the assumptions that market participants would use in pricing the asset or liability, including assumptions about risk. Inputs may be observable or unobservable. Observable inputs reflect the assumptions market participants would use in pricing the asset or liability that are developed based on market data obtained from sources independent of the reporting entity. Unobservable inputs reflect the reporting entity’s own assumptions about the assumptions market participants would use in pricing the asset or liability that are developed based on the best information available.
Various inputs are used in determining the value of the Funds’ investments as of the end of the reporting period. When inputs used fall into different levels of the fair value hierarchy, the level in the hierarchy within which the fair value measurement falls is determined based on the lowest level input that is significant to the fair value measurement in its entirety. The designated input levels are not necessarily an indication of the risk or liquidity associated with these investments. These inputs are categorized in the following hierarchy under applicable financial accounting standards:
Level 1 – | Unadjusted quoted prices in active markets for identical investments, unrestricted assets or liabilities that the Funds have the ability to access at the measurement date; | |
Level 2 – | Quoted prices which are not active, quoted prices for similar assets or liabilities in active markets or inputs other than quoted prices that are observable (either directly or indirectly) for substantially the full term of the asset or liability; and | |
Level 3 – | Significant unobservable prices or inputs (including the Funds’ own assumptions in determining the fair value of investments) where there is little or no market activity for the asset or liability at the measurement date. | |
The following is a summary of the inputs used to value the Funds’ investments as of October 31, 2013:
Pathway Advisors Conservative Fund
| Investments in Securities at Value | Level 1 - Quoted Prices | Level 2 - Other Significant Observable Inputs | Level 3 - Significant Unobservable Inputs | Total | ||||||||||||
| ||||||||||||||||
Exchange Traded Funds | $ | 581,345 | $ | – | $ | – | $ | 581,345 | ||||||||
Open-End Mutual Funds | 2,577,577 | – | – | 2,577,577 | ||||||||||||
Short Term Investments | 32,478 | – | – | 32,478 | ||||||||||||
| ||||||||||||||||
Total | $ | 3,191,400 | $ | – | $ | – | $ | 3,191,400 | ||||||||
| ||||||||||||||||
|
www.pathwayadvisorsfunds.com |
Pathway Advisors Funds | Notes to Financial Statements | |
| October 31, 2013 (Unaudited) |
Pathway Advisors Growth and Income Fund
| Investments in Securities at Value | Level 1 - Quoted Prices | Level 2 - Inputs | Level 3 - Inputs | Total | ||||||||||||
| ||||||||||||||||
Exchange Traded Funds | $ | 10,229,816 | $ | – | $ | – | $ | 10,229,816 | ||||||||
Open-End Mutual Funds | 15,783,066 | – | – | 15,783,066 | ||||||||||||
Short Term Investments | 741,652 | – | – | 741,652 | ||||||||||||
| ||||||||||||||||
Total | $ | 26,754,534 | $ | – | $ | – | $ | 26,754,534 | ||||||||
| ||||||||||||||||
Pathway Advisors Aggressive Growth Fund
| Investments in Securities at Value | Level 1 - Quoted Prices | Level 2 - Inputs | Level 3 - Inputs | Total | ||||||||||||
| ||||||||||||||||
Exchange Traded Funds | $ | 5,317,232 | $ | – | $ | – | $ | 5,317,232 | ||||||||
Open-End Mutual Funds | 4,448,766 | – | – | 4,448,766 | ||||||||||||
Short Term Investments | 188,965 | – | – | 188,965 | ||||||||||||
| ||||||||||||||||
Total | $ | 9,954,963 | $ | – | $ | – | $ | 9,954,963 | ||||||||
| ||||||||||||||||
The Funds recognize transfers between levels as of the end of the period. For the six months ended October 31, 2013, the Funds did not have any transfers between Level 1 and Level 2 securities. For the six months ended October 31, 2013, the Funds did not have any securities that used significant unobservable inputs (Level 3) in determining fair value.
Investment Transactions and Investment Income: Investment transactions are accounted for on the date the investments are purchased or sold (trade date basis). Net realized gains and losses from investment transactions are reported on an identified cost basis. Interest income, which includes accretion of discounts and amortization of premiums, is accrued and recorded as earned. Dividend income is recognized on the ex-dividend date or for certain foreign securities, as soon as information is available to the Funds.
Trust Expenses: Some expenses of the Trust can be directly attributed to the Funds. Expenses which cannot be directly attributed to the Funds are apportioned among all funds in the Trust based on average net assets of each fund.
Fund Expenses: Expenses that are specific to a Fund are charged directly to that Fund. Expenses which cannot be directly attributed are apportioned among all funds in the Trust based on average net assets of each Fund.
Semi-Annual Report | October 31, 2013 |
29 |
Pathway Advisors Funds | Notes to Financial Statements | |
| October 31, 2013 (Unaudited) |
Offering Costs: Offering costs, including costs of printing initial prospectuses, legal and registration fees, are being amortized over twelve months from the inception date of the Funds. As of October 31, 2013, all offering costs have been amortized by the Funds.
Federal Income Taxes: The Funds comply with the requirements under Subchapter M of the Internal Revenue Code of 1986, as amended, applicable to regulated investment companies and intend to distribute substantially all of their net taxable income and net capital gains, if any, each year, so that it will not be subject to excise tax on undistributed income and gains. The Funds are not subject to income taxes to the extent such distributions are made.
As of and during the six months ended October 31, 2013, the Funds did not have a liability for any unrecognized tax benefits. The Funds file U.S. federal, state, and local tax returns as required. The Funds’ tax returns are subject to examination by the relevant tax authorities until expiration of the applicable statute of limitations, which is generally three years after the filing of the tax return for federal purposes and four years for most state returns. Tax returns for open years have incorporated no uncertain tax positions that require a provision for income taxes.
Distributions to Shareholders: Each Fund normally pays dividends and distributes capital gains, if any, on an annual basis. Income dividend distributions are derived from interest and other income each Fund receives from its investments, including short-term capital gains. Long term capital gain distributions are derived from gains realized when each Fund sells a security it has owned for more than a year. Each Fund may make additional distributions and dividends at other times if the portfolio manager believes doing so may be necessary for each Fund to avoid or reduce taxes.
3. TAX BASIS INFORMATION
Tax Basis of Investments: As of October 31, 2013, the costs of investments for federal income tax purposes and accumulated net unrealized appreciation/(depreciation) on investments were as follows:
Gross (excess of value | Gross Depreciation (excess of tax cost over value) | Net Unrealized Appreciation | Cost of Income Tax | |||||||||||||
Pathway Advisors Conservative Fund | $ | 69,239 | $ | (23,514 | ) | $ | 45,725 | $ | 3,145,675 | |||||||
Pathway Advisors Growth and Income Fund | 937,692 | (135,188 | ) | 802,504 | 25,952,030 | |||||||||||
Pathway Advisors Aggressive Growth Fund | 562,250 | (31,600 | ) | 530,650 | 9,424,313 | |||||||||||
Tax Basis of Distributions to Shareholders: The character of distributions made during the period from net investment income or net realized gains may differ from its ultimate characterization for federal income tax purposes. Also, due to the timing of dividend distributions, the fiscal year in which amounts are distributed may differ from the fiscal year in which the income or realized gain were recorded by the Funds.
|
www.pathwayadvisorsfunds.com |
Pathway Advisors Funds | Notes to Financial Statements | |
| October 31, 2013 (Unaudited) |
The tax character of distributions paid by the Funds for the period ended April 30, 2013, were as follows:
| Ordinary Income | Long-Term Capital Gain | |||||||
| ||||||||
Pathway Advisors Conservative Fund | $ | 4,372 | $ | – | ||||
Pathway Advisors Growth and Income Fund | 4,402 | – | ||||||
Pathway Advisors Aggressive Growth Fund | 4,479 | – | ||||||
During the six months ended October 31, 2013, the Funds did not make any distributions.
4. SECURITIES TRANSACTIONS
Purchases and sales of securities (excluding short-term securities) during the six months ended October 31, 2013, were as follows:
| Fund | Purchases of Securities | Proceeds From Sales of Securities | ||||||
| ||||||||
Pathway Advisors Conservative Fund | $ | 2,619,071 | $ | 571,342 | ||||
Pathway Advisors Growth and Income Fund | 21,666,123 | 557,183 | ||||||
Pathway Advisors Aggressive Growth Fund | 7,956,796 | 177,141 | ||||||
5. BENEFICIAL SHARE TRANSACTIONS
The capitalization of the Trust consists of an unlimited number of shares of beneficial interest with no par value per share. Holders of the shares of the Funds of the Trust have one vote for each share held and a proportionate fraction of a vote for each fractional share. All shares issued and outstanding are fully paid and are non-assessable, transferable and redeemable at the option of the shareholder. Shares have no pre-emptive rights.
Transactions in shares of capital stock:
Pathway Advisors Conservative Fund
For the Six Months Ended October 31, 2013 | For the period July 31, 2012 (Commencement of Operations) to April 30, 2013 | |||||||
| ||||||||
Common Shares Outstanding - Beginning of Period | 129,714 | – | ||||||
Common Shares Sold | 212,087 | 129,476 | ||||||
Common Shares Issued as Reinvestment of Dividends | – | 432 | ||||||
Common Shares Redeemed | (37,509) | (194) | ||||||
| ||||||||
Common Shares Outstanding - End of Period | 304,292 | 129,714 | ||||||
| ||||||||
Semi-Annual Report | October 31, 2013 |
31 |
Pathway Advisors Funds | Notes to Financial Statements | |
| October 31, 2013 (Unaudited) |
Pathway Advisors Growth and Income Fund
For the Six Months Ended October 31, 2013 | For the period July 31, 2012 (Commencement of Operations) to April 30, 2013 | |||||||
| ||||||||
Common Shares Outstanding - Beginning of Period | 470,791 | – | ||||||
Common Shares Sold | 2,029,389 | 470,359 | ||||||
Common Shares Issued as Reinvestment of Dividends | – | 432 | ||||||
Common Shares Redeemed | (75,627) | – | ||||||
| ||||||||
Common Shares Outstanding - End of Period | 2,424,553 | 470,791 | ||||||
| ||||||||
Pathway Advisors Aggressive Growth Fund
For the Six Months Ended October 31, 2013 | For the period July 31, 2012 (Commencement of Operations) to April 30, 2013 | |||||||
| ||||||||
Common Shares Outstanding - Beginning of Period | 138,460 | – | ||||||
Common Shares Sold | 732,300 | 147,706 | ||||||
Common Shares Issued as Reinvestment of Dividends | – | 432 | ||||||
Common Shares Redeemed | (13,712) | (9,678) | ||||||
| ||||||||
Common Shares Outstanding - End of Period | 857,048 | 138,460 | ||||||
| ||||||||
6. MANAGEMENT AND RELATED PARTY TRANSACTIONS
Investment Advisory
Hanson McClain Strategic Advisors, Inc. (the “Adviser”), subject to the authority of the Board, is responsible for the overall management and administration of the Funds’ business affairs. The Adviser manages the investments of the Funds in accordance with the Funds’ investment objective, policies and limitations and investment guidelines established jointly by the Adviser and the Board. Pursuant to the Investment Advisory Agreement (“Advisory Agreement”), the Adviser is entitled to an investment advisory fee, computed daily and payable monthly of 1.00% of the average daily net assets for each Fund.
Prior to October 1, 2013, the Adviser had agreed contractually to limit the amount of each Fund’s total annual expenses to 1.98% of the Funds’ average daily net assets. Subsequently to October 1, 2013, the effective date of the amended agreement, the Adviser has agreed contractually to limit the amount of each Fund’s total annual expenses, exclusive of acquired fund fees and expenses, brokerage expenses, interest expenses, taxes and extraordinary expenses, to 1.88% of the Funds’ average daily net assets. This amended agreement is in effect through August 31, 2015. The Adviser will be permitted to recover expenses it has borne through the agreement described above to the extent that the Funds’ expenses in later periods fall below the annual rates set forth in the relevant agreement. The Funds will not be obligated to pay any such deferred fees and expenses more than three years after the end of the fiscal year in which the fees and expense were deferred. The Adviser may not discontinue this waiver without the approval by the Funds’ Board of Trustees.
|
www.pathwayadvisorsfunds.com |
Pathway Advisors Funds | Notes to Financial Statements | |
| October 31, 2013 (Unaudited) |
For the six months ended October 31, 2013, the fee waivers and/or reimbursements were as follows:
| Fund | Fees Waived/ Reimbursed | Recoupment of Past Waived Fees By Adviser | Total | |||||||
Pathway Advisors Conservative Fund | $ | 61,485 | $ – | $ | 61,485 | |||||
Pathway Advisors Growth and Income Fund | $ | 118,558 | – | $ | 118,558 | |||||
Pathway Advisors Aggressive Growth Fund | $ | 71,038 | – | $ | 71,038 | |||||
As of October 31, 2013, the balances of recoupable expenses for each Fund were as follows:
| Fund | 2012 | |||
Pathway Advisors Conservative Fund | $ | 153,925 | ||
Pathway Advisors Growth and Income Fund | $ | 176,190 | ||
Pathway Advisors Aggressive Growth Fund | $ | 167,248 | ||
Fund Accounting Fees and Expenses
ALPS Fund Services, Inc. (“ALPS” and the “Administrator”) (an affiliate of ALPS Distributors, Inc.) serves as administrator to the Funds, and each Fund has agreed to pay expenses incurred in connection with its administrative activities. Pursuant to the Administration, Bookkeeping and Pricing Services Agreement (the “Agreement”), ALPS will provide operational services to the Funds including, but not limited to fund accounting and fund administration and generally assist in each Fund’s operations.
Annual Administrative Fee, billed monthly in total and allocated to each Fund, in the amount of the greater of (a) the annual minimum for all Funds of $245,000 in year 1 of operations and $260,000 in year 2 and forward or (b) following basis point fee schedule:
| Average Total Net Assets | Contractual Fee | |
Between $0-$500 Million | 0.05% | |
$500M-$1 Billion | 0.03% | |
Above $1 Billion | 0.02% |
The Administrator is also reimbursed by the Funds for certain out of pocket expenses.
Transfer Agent
ALPS serves as transfer, dividend paying and shareholder servicing agent for the Funds under a Transfer Agency and Services Agreement with the Trust. Under this Agreement, ALPS is paid an annual base fee of $25,000 per Fund plus fees for open accounts and is reimbursed for certain out-of-pocket expenses.
Compliance Services
ALPS provides services that assist the Trust’s Chief Compliance Officer in monitoring and testing the policies and procedures of the Trust in conjunction with requirements under Rule 38a-1 of the 1940 Act within the Chief Compliance Officer Services Agreement. Under this Agreement, ALPS is paid an annual base fee for all Funds of $40,000 and is reimbursed for certain out-of-pocket expenses.
Semi-Annual Report | October 31, 2013 |
33 |
Pathway Advisors Funds | Notes to Financial Statements | |
| October 31, 2013 (Unaudited) |
Principal Financial Officer
ALPS receives an annual fee for all Funds of $10,000 for providing Principal Financial Officer (“PFO”) services to the Trust and is reimbursed for certain out-of-pocket expenses.
Distributor
ALPS Distributors, Inc. (“ADI” or the “Distributor”) (an affiliate of ALPS) acts as the distributor of the Funds’ shares pursuant to a Distribution Agreement with the Trust. Shares are sold on a continuous basis by ADI as agent for the Funds, and ADI has agreed to use its best efforts to solicit orders for the sale of Funds’ shares, although it is not obliged to sell any particular amount of shares. ADI is not entitled to any compensation for its services as Distributor. ADI is registered as a broker-dealer with the Securities and Exchange Commission.
Each Fund has adopted a separate Distribution and Services Plan (each a “Plan” and collectively, the “Plans”) pursuant to Rule 12b-1 of the 1940 Act. The Plans allow each Fund, as applicable, to use each Fund’s assets to pay fees in connection with the distribution and marketing of the Funds’ shares and/or the provision of shareholder services to the Funds’ shareholders. The Plan permits payment for services in connection with the administration of plans or programs that use shares of each Fund as their funding medium and for related expenses. Prior to October 1, 2013, the Plans permitted each Fund to make total payments at an annual rate of up to 0.35% of each Fund’s average daily net assets. Subsequently to October 1, 2013, the Plans permit each Fund to make total payments at an annual rate of up to 0.25% of each Funds’ average daily net assets. Because these fees are paid out of the Funds’ assets on an ongoing basis, over time they will increase the cost of an investment in the Funds, and Plan fees may cost an investor more than other types of sales charges.
Each Fund has adopted a Shareholder Services Plan (a “Shareholder Services Plan”) with respect to its shares. Under the Shareholder Services Plan, each Fund is authorized to pay banks and their affiliates and other institutions, including broker-dealers and Fund affiliates (“Participating Organizations”), an aggregate fee in an amount not to exceed on an annual basis 0.15% of the average daily net asset value of shares of the Funds attributable to or held in the name of a Participating Organization for its clients as compensation for providing services pursuant to an agreement with a Participating Organization. Any amount of such payment not paid during the Funds’ fiscal year for such service activities shall be reimbursed to the Funds as soon as practicable after the end of the fiscal year. Shareholder Services Plan fees are included within “Distribution and service fees” on the Statement of Operations.
7. INDEMNIFICATIONS
Under the Trust’s organizational documents, its officers and Trustees are indemnified against certain liability arising out of the performance of their duties to the Trust. Additionally, in the normal course of business, the Trust enters into contracts with service providers that may contain general indemnification clauses, which may permit indemnification to the extent permissible under applicable laws. The Trust’s maximum exposure under these arrangements is unknown, as this would involve future claims that may be made against the Trust that have not yet occurred.
8. NEW ACCOUNTING PRONOUNCEMENTS
In June 2013, the Financial Accounting Standards Board (the “FASB”) issued Accounting Standards Update (“ASU”) No. 2013-08, Financial Services-Investment Companies (Topic 946): Amendments to the Scope, Measurement, and Disclosure Requirements. The FASB standard identifies
|
www.pathwayadvisorsfunds.com |
Pathway Advisors Funds | Notes to Financial Statements | |
| October 31, 2013 (Unaudited) |
characteristics a company must assess to determine whether it is considered an investment company for financial reporting purposes. This ASU is effective for fiscal years beginning after December 15, 2013. The Funds believe the adoption of this ASU will not have a material impact on their financial statements.
Semi-Annual Report | October 31, 2013 |
35 |
| Additional Information | ||
| October 31, 2013 (Unaudited) |
1. FUND HOLDINGS
The Funds file their complete schedule of portfolio holdings with the Securities and Exchange Commission (the “SEC”) for the first and third quarters of each fiscal year on Form N-Q within 60 days after the end of the period. Copies of the Funds’ Form N-Q are available without charge on the SEC website at http://www.sec.gov. You may also review and copy the Form N-Q at the SEC’s Public Reference Room in Washington, DC. For more information about the operation of the Public Reference Room, please call the SEC at 1-800-SEC-0330.
2. FUND PROXY VOTING POLICIES, PROCEDURES AND SUMMARIES
The Funds’ policies and procedures used in determining how to vote proxies and information regarding how the Fund voted proxies relating to portfolio securities during the most recent prior 12-month period ending June 30 are available without charge, (1) upon request, by calling (toll-free) 888-288-1121 and (2) on the SEC’s website at http://www.sec.gov.
|
www.pathwayadvisorsfunds.com |

| PAGE | ||||
| 1 | ||||
| 5 | ||||
| 6 | ||||
| 7 | ||||
| 8 | ||||
| 21 | ||||
| 34 | ||||
| 35 | ||||
| 36 | ||||
| 38 | ||||
| 40 | ||||
| 41 | ||||
| 50 | ||||
| Redmont Funds | Shareholder Letter | |
| October 31, 2013 (Unaudited) |
Introduction:
The Funds performed well during the past six months, driven by strong performance in the long/short allocation. Long/short provided nearly 60% of the total return of the Funds during the period despite only representing 35% of the Funds’ allocation. All four managers performed well and contributed to the overall strong performance. The Tactical allocation produced 30% of the total return of the Funds as two of the managers had a strong quarter but were partially offset by weak performance from one manager. That manager’s more conservative strategy continues to struggle to keep pace in stronger stock markets. We continue to monitor their performance as well as their place in the portfolio and remain comfortable with them at this time. The opportunistic(xii) allocation was the weakest performing segment of the portfolio, contributing only 10% of the Funds’ total return despite a 35% allocation. Performance was mixed among the four managers in this allocation - two performed fairly well and two struggled.
We have spent a considerable amount of time and research on the opportunistic allocation to ensure the managers in that segment of the Funds are performing consistent with our expectations. Two of the managers have performed as we expected and we remain comfortable with them. At the same time, the other two managers have not performed as we anticipated (especially during the second quarter) and we have focused our resources on finding new managers to provide the exposure we want for the Funds and to complement the remaining two managers in the allocation. The section below provides further details.
REDMONT RESOLUTE FUND I
Table 1 notes the performance for Fund I as of quarter end under standard reporting (since inception) as well as of October 31st with the since inception being since initial funding on December 30, 2011.
Table 1 i .ii. iii. iv. v. vi.
Performance (amounts greater than one year are annualized)
Redmont Resolute Fund I | Standardized Performance Data As of September 30, 2013 | Non-Standardized Performance Data As of October 31, 2013 | ||||||||||
| YTD | 1-Year | Since Inception (12/30/11) | Year-to- Date | 1-Year | Since Funding (12/30/11) | |||||||
Resolute Fund I - I Class | 3.54% | 4.28% | 3.24% | 4.62% | 6.11% | 3.67% | ||||||
Resolute Fund I - A Class | 3.15% | 3.74% | 2.81% | 4.24% | 5.67% | 3.27% | ||||||
Load Adjusted | -2.51% | -1.97% | -0.44% | -1.49% | -0.10% | 0.15% | ||||||
HFRX Global Index | 4.29% | 5.13% | 4.46% | 5.54% | 6.95% | 4.93% | ||||||
S&P 500 Index | 19.79% | 19.34% | 20.69% | 25.30% | 27.18% | 22.63% | ||||||
Morningstar Multi-Alternative Universe | 1.49% | 1.98% | 2.50% | 2.65% | 3.69% | 3.01% | ||||||
Gross Expense Ratio | Less Expense Waivers | Net Expense Ratio | Net Ratio ex Dividend & Short Expense* | |||||||||
Resolute Fund I - I Class | 7.24% | -4.77% | 2.47% | 2.36% | ||||||||
Resolute Fund I - A Class | 7.64% | -4.77% | 2.87% | 2.76% | ||||||||
*Expense ratios per current prospectus dated August 31, 2013.
This performance analysis section shows the fund’s historical performance. Past performance is not indicative of future results. Investment return and value of shares will fluctuate. Upon redemption, shares may be worth more or less than their original cost. The current performance may be higher or lower than the quoted performance. Call 1-855-268-2242 or visit www.redmontfunds.com for the most recent month end performance results. The Fund has a redemption fee of 2.00% for shares redeemed within the first 90 days of purchase. Maximum Offering Price (MOP) for Class A includes the Fund’s maximum sales charge of 5.50%. Performance shown at NAV does not include these sales charges and would have been lower had it been taken into account.
| Semi-Annual Report | October 31, 2013 | 1 |
| Redmont Funds | Shareholder Letter | |
| October 31, 2013 (Unaudited) |
REDMONT RESOLUTE FUND II
Table 2 notes the performance for Fund II as of quarter end under standard reporting (since inception) as well as of October 31st with the since inception being since initial funding on December 30, 2011.
Table 2 i. ii. iii. iv. v. vi.
Performance (amounts greater than one year are annualized)
| Redmont Resolute Fund II | Standardized Performance Data As of September 30, 2013 | Non-Standardized Performance Data As of October 31, 2013 | ||||||||||
| YTD | 1-Year | Since Inception (12/30/11) | Year-to- Date | 1-Year | Since Funding (12/30/11) | |||||||
Resolute Fund II - I Class | 5.17% | 6.04% | 5.97% | 6.47% | 8.23% | 6.37% | ||||||
HFRX Global Index | 4.29% | 5.13% | 4.46% | 5.54% | 6.95% | 4.93% | ||||||
S&P 500 Index | 19.79% | 19.34% | 20.69% | 25.30% | 27.18% | 22.63% | ||||||
Morningstar Multi-Alternative Universe | 1.49% | 1.98% | 2.50% | 2.65% | 3.69% | 3.01% | ||||||
Gross Expense Ratio | Less Expense Waivers | Net Expense Ratio | Net Ratio ex Dividend & Short Expense* | |||||||||
Resolute Fund II - I Class | 2.68% | -1.39% | 1.29% | 1.18% | ||||||||
*Expense ratio per current prospectus dated August 31, 2013.
This performance analysis section shows the fund’s historical performance. Past performance is not indicative of future results. Investment return and value of shares will fluctuate. Upon redemption, shares may be worth more or less than their original cost. The current performance may be higher or lower than the quoted performance. Call 1-855-268-2242 or visit www.redmontfunds.com for the most recent month end performance results. The Fund has a redemption fee of 2.00% for shares redeemed within the first 90 days of purchase. Performance shown at NAV does not include these sales charges and would have been lower had it been taken into account.
Portfolio Changes:
The overall allocation has remained unchanged during 2013 but we have made several manager changes as a part of our planned transition from mutual funds (as underlying investments) to separate accounts. Within the long/short allocation we replaced Turner during September. The new long/short manager, Adar, has a more concentrated portfolio strategy and we believe this is an exposure that will benefit the portfolio long term. Within the opportunistic allocation we replaced both ASG positions, one during September and one during October. The new managers are driven more by fundamental security selection instead of ASG’s more quantitative-driven strategy. Stadion uses several option strategies to limit downside risk while Loeb seeks to hedge out the majority of their market exposure as they both isolate their fundamentally-based security selection.
Closing:
We are excited about the manager transitions and how they impact the Funds. We appreciate your investment in our Redmont Resolute Funds, please feel free to contact us with any questions
Sincerely,

R. Scott Graham, CFA & Michael T. Lytle, CFA
Portfolio Managers vii.
2 | www.redmontfunds.com |
| Redmont Funds | Shareholder Letter | |
| October 31, 2013 (Unaudited) |
IMPORTANT NOTES AND DISCLOSURES
The Funds’ investment objectives, risks, charges and expenses must be considered before investing. The prospectus contains this and other important information about the investment company, and may be obtained by calling 1-855-268-2242 or by visiting www.redmontfunds.com. Read it carefully before investing.
The views and information discussed in this commentary are as of the date of publication, are subject to change, and may not reflect the writer’s current views. The views expressed represent an assessment of market conditions at a specific point in time, are opinions only and should not be relied upon as investment advice regarding a particular investment or markets in general. Such information does not constitute a recommendation to buy or sell specific securities or investment vehicles. It should not be assumed that any investment will be profitable or will equal the performance of the Funds or any securities or any sectors mentioned herein. The subject matter contained herein has been derived from several sources believed to be reliable and accurate at the time of compilation. The Funds do not accept any liability for losses either direct or consequential caused by th use of this information.
RISKS:
The Funds seek to provide long-term total return with reduced volatility and reduced correlation to the conventional stock and bond markets. The Funds pursue their objectives primarily by allocating their assets among (i) investment sub-advisers (the “Sub-Advisers”) who manage alternative or hedging investment strategies, (ii) other open-end investment companies registered under the Investment Company Act of 1940, as amended (the “1940 Act”) that use alternative or hedging strategies, and (iii) derivatives, principally total return swaps on reference pools of securities which may be managed by unaffiliated parties, for the purposes of seeking economic exposure to alternative or hedging strategies.
There are certain risks associated with the use of a fund-of-funds structure. These risks include, but are not limited to higher expenses, allocation risk, underlying fund risk, and transparency risk. Investments such as mutual funds which focus on alternative strategies are subject to increased risk and loss of principal and are not suitable for all investors.
The Funds’ investments may subject the Funds to significantly greater volatility than investments in traditional securities and involve substantial risks, including risk of a significant portion on their principal value.
Another principal risk of investing in the Funds is equity risk, which is the risk that the value of the securities held by the Funds will fall due to general market and economic conditions, perceptions regarding the industries in which the issuers of securities held by the Funds participate or factors relating to specific companies in which the Funds invest.
Derivatives generally are more sensitive to changes in economic or market conditions than other types of investments; this could result in losses that significantly exceed the Funds’ original investment.
Short selling involves additional investment risks and transaction costs, and creates leverage, which can increase the risk and volatility of a fund.
The Funds are not suitable for all investors and are subject to investment risks, including possible loss of the principal amount invested.
| i. | Source: Factset |
| ii. | The HFRX Global Index is designed to be representative of the overall composition of the hedge fund universe, and includes convertible arbitrage, distressed securities, equity hedge, equity market neutral, event driven, macro, merger arbitrage, and relative value strategies. Investors cannot invest directly in an index. |
| iii. | The S&P 500 Index is an unmanaged index of 500 common stocks chosen for market size, liquidity, and industry group representation. It is a market-value weighted index. The S&P 500 Index figures do not reflect any fees, expenses, or taxes. Investors cannot invest directly in this index. |
| iv. | The Morningstar Multi-Alternative Universe is designed to represent the exposure to alternative investment tactics. Funds in this category have the majority of their assets exposed to alternative strategies. An investor’s exposure to different tactics may change slightly over time in response to market movements. Funds in this category include both funds with static allocations to alternative strategies and funds tactically allocating among alternative strategies and asset classes. The gross short exposure is greater than 20%. |
| v. | Performance since funding is calculated at the Fund’s net asset value (NAV) and is from January 17, 2012. This is the date in which the Fund received sufficient cash flow to invest the Fund in the underlying investments. Performance is also shown as of the actual inception/launch of the Fund on December 30, 2011. However, the Fund was invested in money markets from December 30, 2011 through January 17, 2012 until the initial cash flows were received. The Fund’s NAV remained at $10.00 from inception date to funding date; therefore, the return of the Fund during this period was 0.00%. |
| vi. | The expense ratio includes fees and expenses associated with acquired funds, which are based on estimated amounts for the current fiscal year. Please see the prospectus for a full disclosure of fees and expenses. Highland Associates, Inc. (the “Adviser”) has agreed, with respect to the Redmont Resolute Fund I’s Class A and Class I shares, contractually to waive the portion of its 1.50% Management Fee in excess of the sum of 0.50% plus any sub-advisory fees paid by the Adviser to sub-advisors in connection with the Fund, and/or reimburse the Fund(or class, as applicable) by the amount of such excess. In addition, after giving effect to the foregoing fee waiver and/or expense reimbursement for the |
| Semi-Annual Report | October 31, 2013 | 3 |
| Redmont Funds | Shareholder Letter | |
| October 31, 2013 (Unaudited) |
Fund’s Class A and Class I shares, to the extent the Fund’s total annual expenses (exclusive of Distribution and Service (12b-1) Fees, Shareholder Services Fees, Acquired Fund Fees and Expenses, Sub-Advisory Fees, brokerage expenses, interest expense, taxes and extraordinary expenses) exceed 1.90% of Fund I’s average daily net assets, the Adviser has contractually agreed to reduce the fee payable with respect to Fund I by the extent of such excess, and/or shall reimburse Fund I (or class, as applicable) by the amount of such excess. The Adviser will be permitted to recover, on a class-by-class basis, expenses it has borne through the agreement to the extent that the Funds’ expenses in later periods fall below the annual rates set forth in the relevant agreement. The Funds will not be obligated to pay any such deferred fees and expenses more than three years after the end of the fiscal year in which the fees and expense were deferred. With respect to Redmont Resolute Fund II, the Adviser has agreed to waive Fund II’s Class I share portion of its 1.50% Management Fee in excess of any sub-advisory fees paid by the Adviser to sub-advisors in connection with Fund II. The fee waivers and/or expense reimbursements for the Funds are in effect through August 31, 2017. The Adviser may not discontinue this agreement to waive fees and/or reimburse expenses without the approval by the Funds’ Board of Trustees. |
| vii. | ALPS Distributors, Inc. is the distributor for the Redmont Funds. R. Scott Graham and Michael T. Lytle are registered representatives of ALPS Distributors, Inc. CFA Institute Marks are trademarks owned by the CFA Institute. |
| viii. | The opportunistic classification consists of but is not limited to trading strategies, managed futures, arbitrage, distressed securities, etc. |
4 | www.redmontfunds.com |
| Redmont Resolute Fund I | Performance Update | |
| October 31, 2013 (Unaudited) |
Performance (for the period ended October 31, 2013)
Redmont Resolute Fund I
| Cumulative Total Return | Since | |||||
| (for the period ended October 31, 2013) | Year-to-Date | 1 Year | Inception* | |||
Class A (NAV)(a) | 4.24% | 5.67% | 3.27% | |||
Class I (NAV) | 4.62% | 6.11% | 3.67% | |||
HFRX Global Hedge Fund Index(d) | 5.52% | 6.93% | 4.92% | |||
S&P 500® Total Return Index(b) | 25.30% | 27.18% | 22.56% | |||
Dow Jones U.S. Select Dividend Index(c) | 25.31% | 25.26% | 19.57% |
| (a) | Net Asset Value (NAV) is the share price without sales charges. |
| (b) | The S&P 500® Total Return Index is the Standard & Poor’s composite index of 500 stocks, a widely recognized, unmanaged index of common stock prices. The index is not actively managed and does not reflect any deduction of fees, expenses or taxes. An investor may not invest directly in an index. |
| (c) | The Dow Jones U.S. Select Dividend Index represents the country’s top stocks by dividend yield, selected annually and subject to screening and buffering criteria. The index is not actively managed and does not reflect any deductions of fees, expenses or taxes. An investor may not invest directly in an index. |
| (d) | The HFRX Global Hedge Fund Index is designed to be representative of the overall composition of the hedge fund universe, and includes convertible arbitrage, distressed securities, equity hedge, equity market neutral, event driven, macro, merger arbitrage, and relative value strategies. The index is not actively managed and does not reflect any deduction of fees, expenses or taxes. An investor may not invest directly in an index. |
Performance data quoted represents past performance. Past performance does not guarantee future results. Investment return and principal value of an investment will fluctuate so that an investor’s shares, when sold or redeemed, may be worth more or less than the original cost. Current performance data may be higher or lower than actual data quoted. For the most current month-end performance data please call 1-855-268-2242.
The table does not reflect the deduction of taxes that a shareholder would pay on Fund distributions or the redemption of Fund shares.
| * | Fund inception date of 12/30/11. |
Performance of $10,000 Initial Investment (for the period ended October 31, 2013)
Comparison of change in value of a $10,000 investment (includes applicable sales loads)
Top Ten Holdings* (for the period ended October 31, 2013) |
| |||||
As a percentage of Net Assets | ||||||
| PIMCO Short-Term Fund, Institutional Class | 15.51% | ||||
PIMCO Global Multi-Asset Fund, Institutional Class | 12.01% | |||||
FPA Crescent Fund | 9.09% | |||||
BlackRock Global Allocation Fund, Inc., Class I | 9.06% | |||||
Diamond Hill Long-Short Fund, Class Y | 7.99% | |||||
MainStay Marketfield Fund, Class I | 7.90% | |||||
AQR Multi Strategy Alternative Fund, Class I | 6.31% | |||||
AQR Risk Parity Fund, Class I | 6.31% | |||||
Exxon Mobil Corp. | 0.11% | |||||
Occidental Petroleum Corp. | 0.09% | |||||
Top Ten Holdings | 74.38% | |||||
* Holdings are subject to change. Table presents indicative values only. |
| |||||
|
| |||||
|
| |||||
|
| |||||
|
|
| ||||
| ||||||
| ||||||
The chart represents historical performance of a hypothetical investment of $10,000 in the Fund since inception. Past performance does not guarantee future results. This chart does not reflect the deduction of taxes that a shareholder would pay on Fund distributions or the redemption of Fund shares.
| Semi-Annual Report | October 31, 2013 | 5 |
| Redmont Resolute Fund II | Performance Update | |
| October 31, 2013 (Unaudited) |
Performance (for the period ended October 31, 2013)
Redmont Resolute Fund II
Cumulative Total Return (for the period ended October 31, 2013) | Year-to-Date | 1 Year | Since Inception* | |||
Class I (NAV) | 6.41% | 8.23% | 6.37% | |||
HFRX Global Hedge Fund Index(c) | 5.52% | 6.93% | 4.92% | |||
S&P 500® Total Return Index(a) | 25.30% | 27.18% | 22.56% | |||
Dow Jones U.S. Select Dividend Index(b) | 25.31% | 25.26% | 19.57% |
| (a) | The S&P 500® Total Return Index is the Standard & Poor’s composite index of 500 stocks, a widely recognized, unmanaged index of common stock prices. The index is not actively managed and does not reflect any deduction of fees, expenses or taxes. An investor may not invest directly in an index. |
| (b) | The Dow Jones U.S. Select Dividend Index represents the country’s top stocks by dividend yield, selected annually and subject to screening and buffering criteria. The index is not actively managed and does not reflect any deductions of fees, expenses or taxes. An investor may not invest directly in an index. |
| (c) | The HFRX Global Hedge Fund Index is designed to be representative of the overall composition of the hedge fund universe and includes convertible arbitrage, distressed securities, equity hedge, equity market neutral, event driven, macro, merger arbitrage and relative value strategies. The index is not actively managed and does not reflect any deduction of fees, expenses or taxes. An investor may not invest directly in an index. |
Performance data quoted represents past performance. Past performance does not guarantee future results. Investment return and principal value of an investment will fluctuate so that an investor’s shares, when sold or redeemed, may be worth more or less than the original cost. Current performance data may be higher or lower than actual data quoted. For the most current month-end performance data please call 1-855-268-2242.
The table does not reflect the deduction of taxes that a shareholder would pay on Fund distributions or the redemption of Fund shares.
| * | Fund inception date of 12/30/11. |
Performance of $10,000 Initial Investment (for the period ended October 31, 2013)
Comparison of change in value of a $10,000 investment
| Top Ten Holdings* (for the period ended October 31, 2013) |
| ||||
As a percentage of Net Assets | ||||||
PIMCO Short-Term Fund, Institutional Class | 17.74% | |||||
PIMCO Global Multi-Asset Fund, Institutional Class | 11.99% | |||||
FPA Crescent Fund | 9.02% | |||||
BlackRock Global Allocation Fund, Inc., Class I | 8.98% | |||||
Diamond Hill Long-Short Fund, Class Y | 6.85% | |||||
MainStay Marketfield Fund, Class I | 6.84% | |||||
AQR Multi Strategy Alternative Fund, Class I | 4.89% | |||||
AQR Risk Parity Fund, Class I | 4.83% | |||||
Exxon Mobil Corp. | 0.12% | |||||
Occidental Petroleum Corp. | 0.10% | |||||
Top Ten Holdings | 71.36% | |||||
* Holdings are subject to change. Table presents indicative values only. |
| |||||
| ||||||
| ||||||
| ||||||
| ||||||
| ||||||
| ||||||
The chart represents historical performance of a hypothetical investment of $10,000 in the Fund since inception. Past performance does not guarantee future results. This chart does not reflect the deduction of taxes that a shareholder would pay on Fund distributions or the redemption of Fund shares.
6 | www.redmontfunds.com |
| Redmont Funds | Disclosure of Fund Expenses | |
| October 31, 2013 (Unaudited) |
As a shareholder of the Funds, you incur two types of costs: (1) transaction costs, including applicable sales charges (loads), redemption fees, wire fees and low balance fees; and (2) ongoing costs, including management fees, distribution and service (12b-1) fees, shareholder services fees and other Fund expenses. This example is intended to help you understand your indirect costs, also referred to as “ongoing costs” (in dollars), of investing in the Fund and to compare these costs with the ongoing costs of investing in other mutual funds.
This example is based on an investment of $1,000 invested at the beginning of the period and held for the six-month period of May 1, 2013 through October 31, 2013.
Actual Expenses The first line of the table below provides information about actual account values and actual expenses. You may use the information in this line, together with the amount you invested at the beginning of the period, to estimate the expenses that you paid over the period. Simply divide your account value by $1,000 (for example, an $8,600 account value divided by $1,000 = 8.6), then multiply the result by the number in the first line under the heading “Expenses Paid During Period” to estimate the expenses you paid on your account during this period.
Hypothetical Example for Comparison Purposes The second line of the table provides information about hypothetical account values and hypothetical expenses based on the Fund’s actual expense ratio and an assumed rate of return of 5% per year before expenses, which is not the Fund’s actual return. The hypothetical account values and expenses may not be used to estimate the actual ending account balance or expenses you paid for the period. You may use this information to compare ongoing costs of investing in the Fund and other funds. To do so, compare this 5% hypothetical example with the 5% hypothetical examples that appear in the shareholder reports of other funds.
Please note that the expenses shown in the table are meant to highlight your ongoing costs only and do not reflect any transactional costs, such as applicable sales charges (loads), redemption fees, wire fees and low balance fees. Therefore, the second line of the table is useful in comparing ongoing costs only and will not help you determine the relative total costs of owning different funds. In addition, if these transaction costs were included, your costs would be higher.
BEGINNING ACCOUNT VALUE 05/01/13 | ENDING ACCOUNT VALUE 10/31/13 | EXPENSE RATIO(a) | EXPENSES PAID DURING PERIOD 05/01/13-10/31/13(b) | |||||
Redmont Resolute Fund I | ||||||||
Class A | ||||||||
Actual | $ 1,000.00 | $ 995.30 | 2.27% | $ 11.42 | ||||
Hypothetical (5% return before expenses) | $ 1,000.00 | $ 1,013.76 | 2.27% | $ 11.52 | ||||
| ||||||||
Class I | ||||||||
Actual | $ 1,000.00 | $ 1,000.00 | 1.88% | $ 9.48 | ||||
Hypothetical (5% return before expenses) | $ 1,000.00 | $ 1,015.73 | 1.88% | $ 9.55 | ||||
Redmont Resolute Fund II | ||||||||
Class I | ||||||||
Actual | $ 1,000.00 | $ 1,006.30 | 0.27% | $ 1.37 | ||||
Hypothetical (5% return before expenses) | $ 1,000.00 | $ 1,023.84 | 0.27% | $ 1.38 | ||||
| (a) | Annualized, based on the Fund’s most recent fiscal half year expenses. |
| (b) | Expenses are equal to the Fund’s annualized expense ratio multiplied by the average account value over the period, multiplied by the number of days in the most recent fiscal half-year (184)/365 (to reflect the half-year period). |
| Semi-Annual Report | October 31, 2013 | 7 |
| Redmont Resolute Fund I | Schedule of Investments | |
| October 31, 2013 (Unaudited) |
| Value | ||||||||
| Description | Shares | (Note 2) | ||||||
COMMON STOCKS (7.74%) | ||||||||
ADVERTISING (0.05%) | ||||||||
Omnicom Group, Inc.(a) | 29 | $ | 1,975 | |||||
|
| |||||||
AEROSPACE & DEFENSE (0.31%) | ||||||||
Cubic Corp. | 23 | 1,208 | ||||||
Curtiss-Wright Corp.(a) | 22 | 1,095 | ||||||
Lockheed Martin Corp.(a) | 19 | 2,533 | ||||||
Northrop Grumman Corp.(a) | 15 | 1,613 | ||||||
Raytheon Co.(a) | 20 | 1,647 | ||||||
The Boeing Co. | 15 | 1,958 | ||||||
Triumph Group, Inc.(a) | 19 | 1,361 | ||||||
United Technologies Corp.(a) | 12 | 1,275 | ||||||
|
| |||||||
| 12,690 | ||||||||
|
| |||||||
AGRICULTURE (0.07%) | ||||||||
Lorillard, Inc.(a) | 24 | 1,224 | ||||||
Philip Morris International, Inc. | 16 | 1,426 | ||||||
|
| |||||||
| 2,650 | ||||||||
|
| |||||||
AUTO PARTS & EQUIPMENT (0.10%) | ||||||||
Lear Corp.(a) | 33 | 2,554 | ||||||
TRW Automotive Holdings Corp.(b) | 19 | 1,427 | ||||||
|
| |||||||
| 3,981 | ||||||||
|
| |||||||
BANKS (0.69%) | ||||||||
Bank of America Corp.(a) | 118 | 1,647 | ||||||
BB&T Corp.(a) | 53 | 1,800 | ||||||
Capital One Financial Corp.(a) | 36 | 2,472 | ||||||
CapitalSource, Inc. | 36 | 471 | ||||||
Citigroup, Inc.(a) | 55 | 2,683 | ||||||
Comerica, Inc. | 19 | 823 | ||||||
Fifth Third Bancorp(a) | 105 | 1,998 | ||||||
First NBC Bank Holding Co.(a)(b) | 22 | 586 | ||||||
Huntington Bancshares, Inc.(a) | 154 | 1,355 | ||||||
JPMorgan Chase & Co.(a) | 51 | 2,629 | ||||||
Morgan Stanley | 22 | 632 | ||||||
Regions Financial Corp.(a) | 157 | 1,512 | ||||||
State Street Corp.(a) | 28 | 1,962 | ||||||
SunTrust Banks, Inc.(a) | 41 | 1,379 | ||||||
The Goldman Sachs Group, Inc.(a) | 9 | 1,448 | ||||||
The PNC Financial Services Group, Inc.(a) | 15 | 1,103 | ||||||
US Bancorp(a) | 30 | 1,121 | ||||||
Wells Fargo & Co.(a) | 53 | 2,263 | ||||||
|
| |||||||
| 27,884 | ||||||||
|
| |||||||
BEVERAGES (0.03%) | ||||||||
Constellation Brands, Inc., Class A(a)(b) | 21 | 1,371 | ||||||
|
| |||||||
BIOTECHNOLOGY (0.03%) | ||||||||
Amgen, Inc. | 9 | 1,044 | ||||||
|
| |||||||
See Notes to Financial Statements.
8 | www.redmontfunds.com |
| Redmont Resolute Fund I | Schedule of Investments | |
| October 31, 2013 (Unaudited) |
| Description | Shares | Value (Note 2) | ||||||
CHEMICALS (0.21%) | ||||||||
Cytec Industries, Inc. | 10 | $ | 831 | |||||
HB Fuller Co.(a) | 50 | 2,393 | ||||||
Huntsman Corp.(a) | 88 | 2,043 | ||||||
LyondellBasell Industries NV, Class A(a) | 21 | 1,567 | ||||||
Minerals Technologies, Inc.(a) | 31 | 1,756 | ||||||
|
| |||||||
| 8,590 | ||||||||
|
| |||||||
COMMERCIAL SERVICES (0.42%) | ||||||||
Alliance Data Systems Corp.(b) | 6 | 1,422 | ||||||
Chemed Corp.(a) | 21 | 1,424 | ||||||
Emerge Energy Services LP | 20 | 759 | ||||||
Equifax, Inc. | 23 | 1,487 | ||||||
FTI Consulting, Inc.(a)(b) | 24 | 974 | ||||||
Global Payments, Inc. | 35 | 2,082 | ||||||
Manpowergroup, Inc.(a) | 31 | 2,421 | ||||||
Moody’s Corp.(a) | 18 | 1,272 | ||||||
Odyssey Marine Exploration, Inc.(b) | 113 | 245 | ||||||
Robert Half International, Inc.(a) | 34 | 1,310 | ||||||
Towers Watson & Co., Class A | 7 | 804 | ||||||
Vantiv, Inc., Class A(b) | 71 | 1,953 | ||||||
WEX, Inc.(a)(b) | 8 | 747 | ||||||
|
| |||||||
| 16,900 | ||||||||
|
| |||||||
COMPUTERS (0.27%) | ||||||||
Apple, Inc.(a) | 1 | 522 | ||||||
Brocade Communications Systems, Inc.(b) | 322 | 2,583 | ||||||
EMC Corp.(a) | 74 | 1,781 | ||||||
NetApp, Inc. | 54 | 2,096 | ||||||
Seagate Technology PLC(a) | 43 | 2,093 | ||||||
Western Digital Corp.(a) | 29 | 2,019 | ||||||
|
| |||||||
| 11,094 | ||||||||
|
| |||||||
DISTRIBUTION & WHOLESALE (0.08%) | ||||||||
Arrow Electronics, Inc.(a)(b) | 44 | 2,113 | ||||||
WESCO International, Inc.(b) | 15 | 1,282 | ||||||
|
| |||||||
| 3,395 | ||||||||
|
| |||||||
DIVERSIFIED FINANCIAL SERVICES (0.14%) | ||||||||
Discover Financial Services(a) | 26 | 1,349 | ||||||
Raymond James Financial, Inc.(a) | 24 | 1,096 | ||||||
SLM Corp. | 36 | 913 | ||||||
TD Ameritrade Holding Corp.(a) | 46 | 1,254 | ||||||
The Charles Schwab Corp.(a) | 51 | 1,155 | ||||||
|
| |||||||
| 5,767 | ||||||||
|
| |||||||
ELECTRIC (0.05%) | ||||||||
AES Corp.(a) | 135 | 1,902 | ||||||
|
| |||||||
ELECTRICAL COMPONENTS & EQUIPMENT (0.02%) | ||||||||
Hubbell, Inc., Class B(a) | 7 | 753 | ||||||
|
| |||||||
ELECTRONICS (0.27%) | ||||||||
Agilent Technologies, Inc. | 24 | 1,218 | ||||||
See Notes to Financial Statements.
| Semi-Annual Report | October 31, 2013 | 9 |
| Redmont Resolute Fund I | Schedule of Investments | |
| October 31, 2013 (Unaudited) |
| Description | Shares | Value (Note 2) | ||||||
ELECTRONICS (continued) | ||||||||
Avnet, Inc.(a) | 46 | $ | 1,826 | |||||
Flextronics International Ltd.(a)(b) | 285 | 2,249 | ||||||
Honeywell International, Inc.(a) | 14 | 1,214 | ||||||
Koninklijke Philips NV, NY Registered Shares | 53 | 1,877 | ||||||
TE Connectivity Ltd. | 24 | 1,236 | ||||||
Tyco International Ltd.(a) | 31 | 1,133 | ||||||
|
| |||||||
| 10,753 | ||||||||
|
| |||||||
ENGINEERING & CONSTRUCTION (0.04%) | ||||||||
ABB Ltd., ADR(a) | 31 | 790 | ||||||
Fluor Corp. | 10 | 742 | ||||||
|
| |||||||
| 1,532 | ||||||||
|
| |||||||
FOOD (0.11%) | ||||||||
Dean Foods Co.(b) | 61 | 1,190 | ||||||
Tyson Foods, Inc., Class A(a) | 87 | 2,407 | ||||||
Unilever NV, NY Registered Shares(a) | 25 | 993 | ||||||
|
| |||||||
| 4,590 | ||||||||
|
| |||||||
FOREST PRODUCTS & PAPER (0.06%) | ||||||||
International Paper Co.(a) | 51 | 2,275 | ||||||
|
| |||||||
HEALTHCARE - PRODUCTS (0.12%) | ||||||||
Boston Scientific Corp.(b) | 106 | 1,239 | ||||||
CareFusion Corp.(a)(b) | 25 | 969 | ||||||
Covidien PLC(a) | 31 | 1,987 | ||||||
Integra LifeSciences Holdings Corp.(a)(b) | 16 | 733 | ||||||
|
| |||||||
| 4,928 | ||||||||
|
| |||||||
HEALTHCARE - SERVICES (0.21%) | ||||||||
Cigna Corp.(a) | 15 | 1,155 | ||||||
DaVita HealthCare Partners, Inc.(a)(b) | 27 | 1,518 | ||||||
ICON PLC(b) | 16 | 647 | ||||||
Quest Diagnostics, Inc. | 22 | 1,318 | ||||||
Select Medical Holdings Corp. | 136 | 1,153 | ||||||
UnitedHealth Group, Inc. | 17 | 1,160 | ||||||
Universal Health Services, Inc., Class B(a) | 18 | 1,450 | ||||||
|
| |||||||
| 8,401 | ||||||||
|
| |||||||
HOME BUILDERS (0.02%) | ||||||||
NVR, Inc.(b) | 1 | 917 | ||||||
|
| |||||||
HOUSEWARES (0.04%) | ||||||||
Newell Rubbermaid, Inc.(a) | 58 | 1,718 | ||||||
|
| |||||||
INSURANCE (0.39%) | ||||||||
ACE Ltd.(a) | 17 | 1,623 | ||||||
Axis Capital Holdings Ltd.(a) | 34 | 1,612 | ||||||
Berkshire Hathaway, Inc., Class B(a)(b) | 14 | 1,611 | ||||||
Everest Re Group Ltd. | 6 | 922 | ||||||
MetLife, Inc.(a) | 30 | 1,419 | ||||||
Reinsurance Group of America, Inc.(a) | 16 | 1,139 | ||||||
See Notes to Financial Statements.
10 | www.redmontfunds.com |
| Redmont Resolute Fund I | Schedule of Investments | |
| October 31, 2013 (Unaudited) |
| Description | Shares | Value (Note 2) | ||||||
INSURANCE (continued) | ||||||||
The Allstate Corp. | 30 | $ | 1,592 | |||||
The Travelers Cos., Inc.(a) | 18 | 1,553 | ||||||
Torchmark Corp.(a) | 16 | 1,166 | ||||||
Validus Holdings Ltd.(a) | 43 | 1,698 | ||||||
WR Berkley Corp. | 36 | 1,581 | ||||||
|
| |||||||
| 15,916 | ||||||||
|
| |||||||
INTERNET (0.50%) | ||||||||
Baidu, Inc., ADR(b) | 11 | 1,770 | ||||||
CDW Corp.(b) | 51 | 1,121 | ||||||
Ctrip.com International Ltd., ADR(b) | 14 | 760 | ||||||
eBay, Inc.(a)(b) | 56 | 2,952 | ||||||
Expedia, Inc. | 27 | 1,590 | ||||||
Global Sources Ltd.(b) | 35 | 262 | ||||||
Google, Inc., Class A(a)(b) | 2 | 2,061 | ||||||
IAC/InterActiveCorp(a) | 45 | 2,403 | ||||||
NetEase, Inc., ADR | 26 | 1,755 | ||||||
Perfect World Co. Ltd., ADR | 33 | 578 | ||||||
SINA Corp.(b) | 11 | 919 | ||||||
Symantec Corp.(a) | 82 | 1,865 | ||||||
Travelzoo, Inc.(b) | 12 | 258 | ||||||
Yahoo!, Inc(b) | 62 | 2,042 | ||||||
|
| |||||||
| 20,336 | ||||||||
|
| |||||||
LEISURE TIME (0.01%) | ||||||||
Johnson Outdoors, Inc., Class A | 14 | 384 | ||||||
|
| |||||||
MACHINERY - DIVERSIFIED (0.11%) | ||||||||
AGCO Corp. | 13 | 759 | ||||||
CNH Industrial NV(b) | 58 | 683 | ||||||
Flowserve Corp. | 26 | 1,806 | ||||||
The Babcock & Wilcox Co.(a) | 40 | 1,289 | ||||||
|
| |||||||
| 4,537 | ||||||||
|
| |||||||
MEDIA (0.44%) | ||||||||
CBS Corp., Class B(a) | 21 | 1,242 | ||||||
Comcast Corp., Class A(a) | 42 | 1,998 | ||||||
EW Scripps Co., Class A(a)(b) | 41 | 813 | ||||||
Gannett Co., Inc.(a) | 46 | 1,273 | ||||||
Liberty Global PLC, Class A(b) | 13 | 1,019 | ||||||
Liberty Global PLC, Class C(b) | 29 | 2,171 | ||||||
Liberty Media Corp., Class A(a)(b) | 10 | 1,529 | ||||||
News Corp., Class A(b) | 100 | 1,760 | ||||||
The Walt Disney Co.(a) | 20 | 1,372 | ||||||
Time Warner Cable, Inc.(a) | 13 | 1,562 | ||||||
Time Warner, Inc.(a) | 19 | 1,306 | ||||||
Viacom, Inc., Class B(a) | 19 | 1,582 | ||||||
|
| |||||||
| 17,627 | ||||||||
|
| |||||||
METAL FABRICATE & HARDWARE (0.04%) | ||||||||
LB Foster Co., Class A(a) | 8 | 374 | ||||||
Timken Co.(a) | 27 | 1,426 | ||||||
|
| |||||||
| 1,800 | ||||||||
|
| |||||||
See Notes to Financial Statements.
| Semi-Annual Report | October 31, 2013 | 11 |
| Redmont Resolute Fund I | Schedule of Investments | |
| October 31, 2013 (Unaudited) |
| Description | Shares | Value (Note 2) | ||||||
MINING (0.01%) | ||||||||
Yamana Gold, Inc. | 53 | $ | 526 | |||||
|
| |||||||
MISCELLANEOUS MANUFACTURING (0.23%) | ||||||||
3M Co. | 8 | 1,007 | ||||||
Carlisle Cos., Inc.(a) | 13 | 945 | ||||||
Dover Corp. | 14 | 1,285 | ||||||
EnPro Industries, Inc.(b) | 8 | 477 | ||||||
Parker Hannifin Corp.(a) | 13 | 1,517 | ||||||
Siemens AG, ADR | 15 | 1,920 | ||||||
Standex International Corp. | 17 | 1,046 | ||||||
Textron, Inc. | 40 | 1,152 | ||||||
|
| |||||||
| 9,349 | ||||||||
|
| |||||||
OFFICE & BUSINESS EQUIPMENT (0.02%) | ||||||||
Xerox Corp.(a) | 74 | 736 | ||||||
|
| |||||||
OIL & GAS (0.74%) | ||||||||
Antero Resources Corp.(b) | 40 | 2,260 | ||||||
Canadian Natural Resources Ltd.(a) | 30 | 952 | ||||||
Devon Energy Corp. | 20 | 1,264 | ||||||
Diamondback Energy, Inc.(b) | 25 | 1,291 | ||||||
Energen Corp. | 36 | 2,820 | ||||||
Ensco PLC, Class A | 10 | 576 | ||||||
EOG Resources, Inc.(a) | 17 | 3,033 | ||||||
EQT Corp. | 26 | 2,226 | ||||||
Exxon Mobil Corp.(a) | 49 | 4,391 | ||||||
Gulfport Energy Corp.(b) | 25 | 1,467 | ||||||
Kosmos Energy Ltd.(b) | 62 | 661 | ||||||
Marathon Oil Corp. | 10 | 353 | ||||||
Occidental Petroleum Corp.(a) | 39 | 3,747 | ||||||
Phillips 66(a) | 39 | 2,513 | ||||||
Rosetta Resources, Inc.(b) | 21 | 1,259 | ||||||
Southwestern Energy Co.(b) | 25 | 931 | ||||||
|
| |||||||
| 29,744 | ||||||||
|
| |||||||
OIL & GAS SERVICES (0.12%) | ||||||||
Cameron International Corp.(a)(b) | 19 | 1,042 | ||||||
Halliburton Co.(a) | 37 | 1,962 | ||||||
Schlumberger Ltd.(a) | 19 | 1,781 | ||||||
|
| |||||||
| 4,785 | ||||||||
|
| |||||||
PACKAGING & CONTAINERS (0.25%) | ||||||||
Berry Plastics Group, Inc.(b) | 86 | 1,727 | ||||||
Crown Holdings, Inc.(a)(b) | 63 | 2,747 | ||||||
Graphic Packaging Holding Co.(a)(b) | 397 | 3,335 | ||||||
Owens-Illinois, Inc.(a)(b) | 69 | 2,193 | ||||||
|
| |||||||
| 10,002 | ||||||||
|
| |||||||
PHARMACEUTICALS (0.43%) | ||||||||
AbbVie, Inc.(a) | 35 | 1,696 | ||||||
AstraZeneca PLC, ADR | 40 | 2,114 | ||||||
Bayer AG, ADR | 11 | 1,372 | ||||||
Cardinal Health, Inc.(a) | 24 | 1,408 | ||||||
See Notes to Financial Statements.
12 | www.redmontfunds.com |
| Redmont Resolute Fund I | Schedule of Investments | |
| October 31, 2013 (Unaudited) |
| Description | Shares | Value (Note 2) | ||||||
PHARMACEUTICALS (continued) | ||||||||
Endo Health Solutions, Inc.(b) | 15 | $ | 656 | |||||
Express Scripts Holding Co.(a)(b) | 31 | 1,938 | ||||||
Johnson & Johnson | 10 | 926 | ||||||
McKesson Corp. | 10 | 1,563 | ||||||
Omnicare, Inc.(a) | 33 | 1,820 | ||||||
Pfizer, Inc.(a) | 35 | 1,074 | ||||||
Roche Holding AG, ADR | 12 | 832 | ||||||
Sanofi, ADR(a) | 35 | 1,872 | ||||||
|
| |||||||
| 17,271 | ||||||||
|
| |||||||
REAL ESTATE INVESTMENT TRUSTS (0.12%) | ||||||||
American Homes 4 Rent, Class A(b) | 61 | 944 | ||||||
American Residential Properties, Inc.(b) | 43 | 741 | ||||||
Boston Properties, Inc.(a) | 6 | 621 | ||||||
BRE Properties, Inc. | 18 | 983 | ||||||
Equity Residential(a) | 12 | 628 | ||||||
Post Properties, Inc. | 21 | 961 | ||||||
|
| |||||||
| 4,878 | ||||||||
|
| |||||||
RETAIL (0.27%) | ||||||||
Abercrombie & Fitch Co., Class A | 30 | 1,125 | ||||||
Bed Bath & Beyond, Inc.(a)(b) | 23 | 1,778 | ||||||
CVS Caremark Corp.(a) | 27 | 1,681 | ||||||
Foot Locker, Inc. | 32 | 1,110 | ||||||
Macy’s, Inc.(a) | 33 | 1,522 | ||||||
MSC Industrial Direct Co., Inc., Class A(a) | 14 | 1,069 | ||||||
Rite Aid Corp.(b) | 307 | 1,636 | ||||||
Target Corp. | 15 | 972 | ||||||
|
| |||||||
| 10,893 | ||||||||
|
| |||||||
SAVINGS & LOANS (0.02%) | ||||||||
First Niagara Financial Group, Inc.(a) | 69 | 761 | ||||||
|
| |||||||
SEMICONDUCTORS (0.30%) | ||||||||
Analog Devices, Inc.(a) | 33 | 1,627 | ||||||
Avago Technologies Ltd. | 35 | 1,590 | ||||||
LSI Corp.(a) | 276 | 2,340 | ||||||
NVIDIA Corp.(a) | 82 | 1,245 | ||||||
ON Semiconductor Corp.(a)(b) | 246 | 1,737 | ||||||
QUALCOMM, Inc.(a) | 22 | 1,528 | ||||||
Texas Instruments, Inc.(a) | 47 | 1,978 | ||||||
|
| |||||||
| 12,045 | ||||||||
|
| |||||||
SHIPBUILDING (0.04%) | ||||||||
Huntington Ingalls Industries, Inc.(a) | 23 | 1,646 | ||||||
|
| |||||||
SOFTWARE (0.17%) | ||||||||
Activision Blizzard, Inc.(a) | 149 | 2,479 | ||||||
AVG Technologies NV(b) | 32 | 643 | ||||||
CA, Inc.(a) | 52 | 1,652 | ||||||
Microsoft Corp.(a) | 59 | 2,086 | ||||||
|
| |||||||
| 6,860 | ||||||||
|
| |||||||
See Notes to Financial Statements.
| Semi-Annual Report | October 31, 2013 | 13 |
| Redmont Resolute Fund I | Schedule of Investments | |
| October 31, 2013 (Unaudited) |
| Description | Shares | Value (Note 2) | ||||||||
TELECOMMUNICATIONS (0.15%) | ||||||||||
Amdocs Ltd.(a) | 38 | $ | 1,461 | |||||||
Cisco Systems, Inc.(a) | 77 | 1,733 | ||||||||
Harris Corp. | 15 | 929 | ||||||||
Vodafone Group PLC, ADR | 27 | 994 | ||||||||
Windstream Holdings, Inc.(a) | 88 | 752 | ||||||||
|
| |||||||||
| 5,869 | ||||||||||
|
| |||||||||
TRANSPORTATION (0.04%) | ||||||||||
Norfolk Southern Corp.(a) | 17 | 1,462 | ||||||||
|
| |||||||||
TOTAL COMMON STOCKS (Cost $284,017) | 312,537 | |||||||||
| ||||||||||
OPEN-END MUTUAL FUNDS (74.17%) | ||||||||||
AQR Multi Strategy Alternative Fund, Class I | 25,241 | 254,931 | ||||||||
AQR Risk Parity Fund, Class I | 22,046 | 254,855 | ||||||||
BlackRock Global Allocation Fund, Inc., Class I | 16,673 | 365,970 | ||||||||
Diamond Hill Long-Short Fund, Class Y | 14,693 | 322,649 | ||||||||
FPA Crescent Fund | 11,131 | 367,214 | ||||||||
MainStay Marketfield Fund, Class I | 17,614 | 319,169 | ||||||||
PIMCO Global Multi-Asset Fund, Institutional Class | 46,468 | 485,127 | ||||||||
PIMCO Short-Term Fund, Institutional Class | 63,511 | 626,855 | ||||||||
|
| |||||||||
| 2,996,770 | ||||||||||
|
| |||||||||
TOTAL OPEN-END MUTUAL FUNDS (Cost $2,842,368) | 2,996,770 | |||||||||
| ||||||||||
| 7-Day Yield | Shares | Value (Note 2) | ||||||||
SHORT TERM INVESTMENTS (0.72%) | ||||||||||
Dreyfus Treasury Cash Management Fund, Institutional Class | 0.010% | 29,272 | 29,272 | |||||||
|
| |||||||||
TOTAL SHORT TERM INVESTMENTS (Cost $29,272) | 29,272 | |||||||||
| ||||||||||
TOTAL INVESTMENTS (82.63%) (Cost $3,155,657) | $ | 3,338,579 | ||||||||
SEGREGATED CASH WITH BROKERS (21.62%)(c) | 873,513 | |||||||||
SECURITIES SOLD SHORT (-3.84%) (Proceeds $144,870) | (155,292) | |||||||||
LIABILITIES IN EXCESS OF OTHER ASSETS (-0.41%) | (16,468) | |||||||||
| ||||||||||
NET ASSETS (100.00%) | $ | 4,040,332 | ||||||||
| ||||||||||
See Notes to Financial Statements.
14 | www.redmontfunds.com |
| Redmont Resolute Fund I | Schedule of Investments | |
| October 31, 2013 (Unaudited) |
SCHEDULE OF SECURITIES SOLD SHORT
| Shares | Value (Note 2) | ||||||
COMMON STOCKS (-3.84%) | ||||||||
APPAREL (-0.07%) | ||||||||
Deckers Outdoor Corp. | (18) | $ | (1,239) | |||||
Under Armour, Inc., Class A | (18) | (1,461) | ||||||
|
| |||||||
| (2,700) | ||||||||
|
| |||||||
AUTO MANUFACTURERS (-0.02%) | ||||||||
Oshkosh Corp. | (13) | (619) | ||||||
|
| |||||||
AUTO PARTS & EQUIPMENT (-0.03%) | ||||||||
Accuride Corp. | (86) | (387) | ||||||
American Axle & Manufacturing Holdings, Inc. | (31) | (577) | ||||||
Modine Manufacturing Co. | (11) | (146) | ||||||
|
| |||||||
| (1,110) | ||||||||
|
| |||||||
BANKS (-0.27%) | ||||||||
1st United Bancorp, Inc. | (16) | (122) | ||||||
Bank of Hawaii Corp. | (11) | (638) | ||||||
Cardinal Financial Corp. | (17) | (281) | ||||||
Community Bank System, Inc. | (29) | (1,053) | ||||||
CVB Financial Corp. | (76) | (1,105) | ||||||
First Financial Bankshares, Inc. | (14) | (861) | ||||||
HDFC Bank Ltd., ADR | (16) | (580) | ||||||
Northern Trust Corp. | (14) | (790) | ||||||
TCF Financial Corp. | (55) | (835) | ||||||
Trustmark Corp. | (34) | (923) | ||||||
UMB Financial Corp. | (13) | (766) | ||||||
United Bankshares, Inc. | (34) | (1,006) | ||||||
Valley National Bancorp | (64) | (624) | ||||||
Westamerica Bancorporation | (26) | (1,338) | ||||||
|
| |||||||
| (10,922) | ||||||||
|
| |||||||
BIOTECHNOLOGY (-0.02%) | ||||||||
Seattle Genetics, Inc. | (24) | (927) | ||||||
|
| |||||||
BUILDING MATERIALS (-0.11%) | ||||||||
Quanex Building Products Corp. | (34) | (604) | ||||||
Simpson Manufacturing Co., Inc. | (40) | (1,418) | ||||||
Texas Industries, Inc. | (3) | (161) | ||||||
Trex Co., Inc. | (16) | (1,124) | ||||||
Vulcan Materials Co. | (22) | (1,178) | ||||||
|
| |||||||
| (4,485) | ||||||||
|
| |||||||
CHEMICALS (-0.03%) | ||||||||
EI du Pont de Nemours & Co. | (17) | (1,041) | ||||||
Zep, Inc. | (8) | (159) | ||||||
|
| |||||||
| (1,200) | ||||||||
|
| |||||||
COMMERCIAL SERVICES (-0.10%) | ||||||||
Monro Muffler Brake, Inc. | (31) | (1,426) | ||||||
Ritchie Bros. Auctioneers, Inc. | (51) | (1,010) | ||||||
Rollins, Inc. | (36) | (995) | ||||||
Weight Watchers International, Inc. | (24) | (771) | ||||||
|
| |||||||
| (4,202) | ||||||||
|
| |||||||
COMPUTERS (-0.10%) | ||||||||
IHS, Inc., Class A | (10) | (1,090) | ||||||
Infosys Ltd., ADR | (27) | (1,433) | ||||||
Wipro Ltd., ADR | (131) | (1,454) | ||||||
|
| |||||||
| (3,977) | ||||||||
|
| |||||||
DISTRIBUTION & WHOLESALE (-0.07%) | ||||||||
Fastenal Co. | (33) | (1,643) | ||||||
See Notes to Financial Statements.
| Semi-Annual Report | October 31, 2013 | 15 |
| Redmont Resolute Fund I | Schedule of Investments | |
| October 31, 2013 (Unaudited) |
| Shares | Value (Note 2) | |||||||
DISTRIBUTION & WHOLESALE (-0.07%) (continued) | ||||||||
Fossil Group, Inc. | (8) | $ | (1,016) | |||||
|
| |||||||
| (2,659) | ||||||||
|
| |||||||
DIVERSIFIED FINANCIAL SERVICES (-0.04%) | ||||||||
Blackhawk Network Holdings, Inc. | (22) | (503) | ||||||
Greenhill & Co., Inc. | (19) | (975) | ||||||
|
| |||||||
| (1,478) | ||||||||
|
| |||||||
ELECTRIC (-0.08%) | ||||||||
NextEra Energy, Inc. | (9) | (763) | ||||||
Ormat Technologies, Inc. | (12) | (313) | ||||||
Pepco Holdings, Inc. | (53) | (1,022) | ||||||
TECO Energy, Inc. | (74) | (1,270) | ||||||
|
| |||||||
| (3,368) | ||||||||
|
| |||||||
ELECTRICAL COMPONENTS & EQUIPMENT (-0.03%) | ||||||||
Acuity Brands, Inc. | (14) | (1,407) | ||||||
|
| |||||||
ELECTRONICS (-0.06%) | ||||||||
Itron, Inc. | (30) | (1,280) | ||||||
National Instruments Corp. | (43) | (1,249) | ||||||
|
| |||||||
| (2,529) | ||||||||
|
| |||||||
FOOD (-0.16%) | ||||||||
Annie’s, Inc. | (18) | (850) | ||||||
Campbell Soup Co. | (17) | (724) | ||||||
Hillshire Brands Co. | (30) | (985) | ||||||
Snyders-Lance, Inc. | (34) | (1,020) | ||||||
Sysco Corp. | (42) | (1,358) | ||||||
United Natural Foods, Inc. | (22) | (1,572) | ||||||
|
| |||||||
| (6,509) | ||||||||
|
| |||||||
FOREST PRODUCTS & PAPER (-0.06%) | ||||||||
Fibria Celulose SA, ADR | (81) | (1,057) | ||||||
Resolute Forest Products, Inc. | (58) | (928) | ||||||
Wausau Paper Corp. | (49) | (573) | ||||||
|
| |||||||
| (2,558) | ||||||||
|
| |||||||
GAS (-0.03%) | ||||||||
NiSource, Inc. | (41) | (1,292) | ||||||
|
| |||||||
HAND & MACHINE TOOLS (-0.03%) | ||||||||
Kennametal, Inc. | (14) | (644) | ||||||
Regal-Beloit Corp. | (8) | (587) | ||||||
|
| |||||||
| (1,231) | ||||||||
|
| |||||||
HEALTHCARE - PRODUCTS (-0.09%) | ||||||||
ABIOMED, Inc. | (41) | (983) | ||||||
HeartWare International, Inc. | (10) | (726) | ||||||
IDEXX Laboratories, Inc. | (8) | (863) | ||||||
ResMed, Inc. | (17) | (879) | ||||||
|
| |||||||
| (3,451) | ||||||||
|
| |||||||
HEALTHCARE - SERVICES (-0.03%) | ||||||||
Health Net, Inc. | (37) | (1,125) | ||||||
|
| |||||||
HOME FURNISHINGS (-0.02%) | ||||||||
iRobot Corp. | (27) | (915) | ||||||
|
| |||||||
HOUSEHOLD PRODUCTS & WARES (-0.09%) | ||||||||
The Clorox Co. | (13) | (1,172) | ||||||
Kimberly-Clark Corp. | (11) | (1,188) | ||||||
See Notes to Financial Statements.
16 | www.redmontfunds.com |
| Redmont Resolute Fund I | Schedule of Investments | |
| October 31, 2013 (Unaudited) |
| Shares | Value (Note 2) | |||||||
HOUSEHOLD PRODUCTS & WARES (-0.09%) (continued) | ||||||||
The Scotts Miracle-Gro Co., Class A | (22) | $ | (1,292) | |||||
|
| |||||||
| (3,652) | ||||||||
|
| |||||||
HOUSEWARES (-0.01%) | ||||||||
The Toro Co. | (9) | (530) | ||||||
|
| |||||||
INTERNET (-0.38%) | ||||||||
Angie’s List, Inc. | (52) | (733) | ||||||
Bankrate, Inc. | (49) | (825) | ||||||
Blue Nile, Inc. | (30) | (1,232) | ||||||
Cogent Communications Group, Inc. | (32) | (1,124) | ||||||
E-Commerce China Dangdang, Inc., ADR, Class A | (151) | (1,336) | ||||||
Equinix, Inc. | (6) | (969) | ||||||
Giant Interactive Group, Inc., ADR | (123) | (1,088) | ||||||
Internap Network Services Corp. | (73) | (531) | ||||||
Netflix, Inc. | (4) | (1,290) | ||||||
Shutterstock, Inc. | (9) | (637) | ||||||
SouFun Holdings Ltd., ADR | (9) | (479) | ||||||
Vitacost.com, Inc. | (32) | (253) | ||||||
Yelp, Inc. | (17) | (1,152) | ||||||
Youku Tudou, Inc., ADR | (16) | (436) | ||||||
YY, Inc., ADR | (34) | (1,672) | ||||||
Zillow, Inc., Class A | (9) | (717) | ||||||
Zynga, Inc., Class A | (250) | (897) | ||||||
|
| |||||||
| (15,371) | ||||||||
|
| |||||||
MACHINERY - CONSTRUCTION & MINING (-0.02%) | ||||||||
Caterpillar, Inc. | (12) | (1,000) | ||||||
|
| |||||||
MACHINERY - DIVERSIFIED (-0.10%) | ||||||||
Altra Holdings, Inc. | (9) | (273) | ||||||
Briggs & Stratton Corp. | (59) | (1,082) | ||||||
Deere & Co. | (10) | (818) | ||||||
Manitex International, Inc. | (16) | (207) | ||||||
The Manitowoc Co., Inc. | (49) | (954) | ||||||
Roper Industries, Inc. | (7) | (888) | ||||||
|
| |||||||
| (4,222) | ||||||||
|
| |||||||
METAL FABRICATE & HARDWARE (-0.03%) | ||||||||
Sun Hydraulics Corp. | (26) | (1,032) | ||||||
|
| |||||||
MINING (-0.04%) | ||||||||
Compass Minerals International, Inc. | (16) | (1,192) | ||||||
US Silica Holdings, Inc. | (14) | (487) | ||||||
|
| |||||||
| (1,679) | ||||||||
|
| |||||||
MISCELLANEOUS MANUFACTURING (-0.14%) | ||||||||
Aptargroup, Inc. | (20) | (1,283) | ||||||
AZZ, Inc. | (26) | (1,168) | ||||||
Federal Signal Corp. | (28) | (383) | ||||||
Polypore International, Inc. | (22) | (994) | ||||||
Raven Industries, Inc. | (28) | (934) | ||||||
Trinity Industries, Inc. | (14) | (709) | ||||||
|
| |||||||
| (5,471) | ||||||||
|
| |||||||
OFFICE FURNISHINGS (-0.02%) | ||||||||
Interface, Inc. | (38) | (770) | ||||||
|
| |||||||
OIL & GAS (-0.30%) | ||||||||
Approach Resources, Inc. | (26) | (732) | ||||||
See Notes to Financial Statements.
| Semi-Annual Report | October 31, 2013 | 17 |
| Redmont Resolute Fund I | Schedule of Investments | |
| October 31, 2013 (Unaudited) |
| Shares | Value (Note 2) | |||||||
OIL & GAS (-0.30%) (continued) | ||||||||
Atwood Oceanics, Inc. | (19) | $ | (1,010) | |||||
Carrizo Oil & Gas, Inc. | (26) | (1,140) | ||||||
Chesapeake Energy Corp. | (29) | (811) | ||||||
Comstock Resources, Inc. | (37) | (633) | ||||||
ConocoPhillips | (18) | (1,319) | ||||||
Continental Resources, Inc. | (11) | (1,253) | ||||||
Goodrich Petroleum Corp. | (16) | (374) | ||||||
Halcon Resources Corp. | (96) | (497) | ||||||
HollyFrontier Corp. | (26) | (1,198) | ||||||
Oasis Petroleum, Inc. | (25) | (1,331) | ||||||
Ultra Petroleum Corp. | (65) | (1,193) | ||||||
Whiting Petroleum Corp. | (10) | (669) | ||||||
|
| |||||||
| (12,160) | ||||||||
|
| |||||||
OIL & GAS SERVICES (-0.03%) | ||||||||
Oceaneering International, Inc. | (10) | (859) | ||||||
RPC, Inc. | (29) | (532) | ||||||
|
| |||||||
| (1,391) | ||||||||
|
| |||||||
REAL ESTATE INVESTMENT TRUSTS (-0.16%) | ||||||||
FelCor Lodging Trust, Inc. | (114) | (766) | ||||||
HCP, Inc. | (20) | (830) | ||||||
Health Care REIT, Inc. | (16) | (1,038) | ||||||
Mack-Cali Realty Corp. | (44) | (905) | ||||||
Omega Healthcare Investors, Inc. | (31) | (1,030) | ||||||
Realty Income Corp. | (27) | (1,125) | ||||||
Rouse Properties, Inc. | (47) | (950) | ||||||
|
| |||||||
| (6,644) | ||||||||
|
| |||||||
RETAIL (-0.27%) | ||||||||
AutoNation, Inc. | (24) | (1,158) | ||||||
Darden Restaurants, Inc. | (25) | (1,288) | ||||||
Guess?, Inc. | (42) | (1,312) | ||||||
Jack in the Box, Inc. | (30) | (1,220) | ||||||
L Brands, Inc. | (18) | (1,127) | ||||||
Lululemon Athletica, Inc. | (19) | (1,312) | ||||||
Sally Beauty Holdings, Inc. | (53) | (1,395) | ||||||
Sonic Automotive, Inc., Class A | (32) | (713) | ||||||
Yum! Brands, Inc. | (19) | (1,285) | ||||||
|
| |||||||
| (10,810) | ||||||||
|
| |||||||
SAVINGS & LOANS (-0.02%) | ||||||||
Astoria Financial Corp. | (54) | (713) | ||||||
|
| |||||||
SEMICONDUCTORS (-0.10%) | ||||||||
Cirrus Logic, Inc. | (38) | (852) | ||||||
Hittite Microwave Corp. | (19) | (1,214) | ||||||
International Rectifier Corp. | (29) | (755) | ||||||
Skyworks Solutions, Inc. | (41) | (1,057) | ||||||
|
| |||||||
| (3,878) | ||||||||
|
| |||||||
SOFTWARE (-0.32%) | ||||||||
Acxiom Corp. | (29) | (964) | ||||||
Aspen Technology, Inc. | (15) | (574) | ||||||
athenahealth, Inc. | (12) | (1,602) | ||||||
Blackbaud, Inc. | (34) | (1,224) | ||||||
Concur Technologies, Inc. | (12) | (1,255) | ||||||
Jive Software, Inc. | (82) | (893) | ||||||
MSCI, Inc. | (26) | (1,060) | ||||||
NetSuite, Inc. | (7) | (706) | ||||||
See Notes to Financial Statements.
18 | www.redmontfunds.com |
| Redmont Resolute Fund I | Schedule of Investments | |
| October 31, 2013 (Unaudited) |
| Description | Shares | Value (Note 2) | ||||||
SOFTWARE (-0.32%) (continued) | ||||||||
Red Hat, Inc. | (23) | $ | (995) | |||||
Salesforce.com, Inc. | (25) | (1,334) | ||||||
Tyler Technologies, Inc. | (6) | (580) | ||||||
The Ultimate Software Group, Inc. | (9) | (1,390) | ||||||
VMware, Inc., Class A | (5) | (407) | ||||||
|
| |||||||
| (12,984) | ||||||||
|
| |||||||
TELECOMMUNICATIONS (-0.28%) | ||||||||
ADTRAN, Inc. | (26) | (610) | ||||||
America Movil SAB de CV, ADR | (53) | (1,135) | ||||||
CenturyLink, Inc. | (24) | (813) | ||||||
Ciena Corp. | (30) | (698) | ||||||
Finisar Corp. | (44) | (1,012) | ||||||
Infinera Corp. | (97) | (990) | ||||||
Level 3 Communications, Inc. | (50) | (1,527) | ||||||
NII Holdings, Inc. | (132) | (454) | ||||||
Palo Alto Networks, Inc. | (16) | (675) | ||||||
Sprint Corp. | (97) | (653) | ||||||
Telefonica SA, ADR | (48) | (839) | ||||||
Verizon Communications, Inc. | (15) | (758) | ||||||
ViaSat, Inc. | (17) | (1,124) | ||||||
|
| |||||||
| (11,288) | ||||||||
|
| |||||||
TRANSPORTATION (-0.08%) | ||||||||
Hub Group, Inc., Class A | (15) | (551) | ||||||
JB Hunt Transport Services, Inc. | (12) | (900) | ||||||
Kansas City Southern | (8) | (972) | ||||||
Old Dominion Freight Line, Inc. | (13) | (610) | ||||||
|
| |||||||
| (3,033) | ||||||||
|
| |||||||
TOTAL COMMON STOCKS (Proceeds $144,870) | (155,292) | |||||||
| ||||||||
TOTAL SECURITIES SOLD SHORT (Proceeds $144,870) | $ | (155,292) | ||||||
| ||||||||
See Notes to Financial Statements.
| Semi-Annual Report | October 31, 2013 | 19 |
| Redmont Resolute Fund I | Schedule of Investments | |
| October 31, 2013 (Unaudited) |
| (a) | All security positions either entirely or partially held in a segregated account as collateral for securities sold short aggregating a total market value of $153,601. |
| (b) | Non-income producing security. |
| (c) | Includes cash which is being held as collateral for securities sold short and total return swap contracts. |
Common Abbreviations:
ADR - American Depositary Receipt.
AG - Aktiengesellschaft is a German term that refers to a corporation that is limited by shares, i.e., owned by shareholders.
AQR - AQR Capital Management LLC.
FPA - First Pacific Advisors LLC.
LP - Limited Partnership.
Ltd. - Limited.
NV - Naamloze Vennootschap is the Dutch term for a public limited liability corporation.
PIMCO - Pacific Investment Management Company.
PLC - Public Limited Company.
SA - Generally designates corporations in various countries, mostly those employing the civil law.
SAB de CV - A variable capital company.
TOTAL RETURN SWAP CONTRACTS*
| Counterparty | Reference Obligation | Notional Amount | Rate Paid by the Fund | Termination Date | Unrealized Depreciation | |||||||||
| ||||||||||||||
Morgan Stanley | ADAR L/S Segregated Portfolio | $ | 447,914 | 1-Month LIBOR BBA | 09/02/2014 | $ | (2,181) | |||||||
Morgan Stanley | Loeb King Multistrategy | 449,847 | 1-Month LIBOR BBA | 09/02/2014 | (1,458) | |||||||||
Morgan Stanley | Trilogy Segregated Portfolio | 450,613 | 1-Month LIBOR BBA | 09/02/2014 | (820) | |||||||||
|
|
|
| |||||||||||
| $ | 1,348,374 | $ | (4,459) | |||||||||||
|
|
|
| |||||||||||
| * | The Fund receives monthly payments based on any positive monthly return of the Reference Obligation. The Fund makes payments on any negative monthly return of such Reference Obligation. |
| See Notes to Financial Statements. | ||
20 | www.redmontfunds.com | |
| Redmont Resolute Fund II | Schedule of Investments | |
| October 31, 2013 (Unaudited) |
| Description | Shares | Value (Note 2) | ||||||
| ||||||||
COMMON STOCKS (8.66%) | ||||||||
ADVERTISING (0.06%) | ||||||||
Omnicom Group, Inc.(a) | 4,733 | $ | 322,365 | |||||
|
| |||||||
AEROSPACE & DEFENSE (0.35%) | ||||||||
Cubic Corp. | 3,801 | 199,552 | ||||||
Curtiss-Wright Corp.(a) | 3,643 | 181,349 | ||||||
Lockheed Martin Corp.(a) | 3,106 | 414,154 | ||||||
Northrop Grumman Corp.(a) | 2,484 | 267,055 | ||||||
Raytheon Co.(a) | 3,303 | 272,068 | ||||||
The Boeing Co. | 2,397 | 312,808 | ||||||
Triumph Group, Inc.(a) | 3,041 | 217,888 | ||||||
United Technologies Corp.(a) | 1,901 | 201,981 | ||||||
|
| |||||||
| 2,066,855 | ||||||||
|
| |||||||
AGRICULTURE (0.07%) | ||||||||
Lorillard, Inc.(a) | 3,925 | 200,214 | ||||||
Philip Morris International, Inc. | 2,620 | 233,495 | ||||||
|
| |||||||
| 433,709 | ||||||||
|
| |||||||
AUTO PARTS & EQUIPMENT (0.11%) | ||||||||
Lear Corp.(a) | 5,364 | 415,120 | ||||||
TRW Automotive Holdings Corp.(b) | 3,038 | 228,184 | ||||||
|
| |||||||
| 643,304 | ||||||||
|
| |||||||
BANKS (0.77%) | ||||||||
Bank of America Corp.(a) | 19,173 | 267,655 | ||||||
BB&T Corp.(a) | 8,550 | 290,443 | ||||||
Capital One Financial Corp.(a) | 5,842 | 401,170 | ||||||
CapitalSource, Inc. | 5,882 | 76,937 | ||||||
Citigroup, Inc.(a) | 8,934 | 435,801 | ||||||
Comerica, Inc.(a) | 3,165 | 137,044 | ||||||
Fifth Third Bancorp(a) | 17,050 | 324,461 | ||||||
First NBC Bank Holding Co.(b) | 3,563 | 94,954 | ||||||
Huntington Bancshares, Inc.(a) | 25,076 | 220,669 | ||||||
JPMorgan Chase & Co.(a) | 8,359 | 430,823 | ||||||
Morgan Stanley | 3,589 | 103,112 | ||||||
Regions Financial Corp.(a) | 25,583 | 246,364 | ||||||
State Street Corp.(a) | 4,566 | 319,940 | ||||||
SunTrust Banks, Inc.(a) | 6,597 | 221,923 | ||||||
The Goldman Sachs Group, Inc.(a) | 1,452 | 233,569 | ||||||
The PNC Financial Services Group, Inc.(a) | 2,439 | 179,340 | ||||||
US Bancorp(a) | 4,840 | 180,822 | ||||||
Wells Fargo & Co.(a) | 8,613 | 367,689 | ||||||
|
| |||||||
| 4,532,716 | ||||||||
|
| |||||||
BEVERAGES (0.04%) | ||||||||
Constellation Brands, Inc., Class A(a)(b) | 3,462 | 226,069 | ||||||
|
| |||||||
BIOTECHNOLOGY (0.03%) | ||||||||
Amgen, Inc. | 1,451 | 168,316 | ||||||
|
| |||||||
| See Notes to Financial Statements. | ||
| Semi-Annual Report | October 31, 2013 | 21 |
| Redmont Resolute Fund II | Schedule of Investments | |
| October 31, 2013 (Unaudited) |
| Description | Shares | Value (Note 2) | ||||||
| ||||||||
CHEMICALS (0.24%) | ||||||||
Cytec Industries, Inc. | 1,554 | $ | 129,122 | |||||
HB Fuller Co.(a) | 8,203 | 392,678 | ||||||
Huntsman Corp.(a) | 14,372 | 333,718 | ||||||
LyondellBasell Industries NV, Class A(a) | 3,457 | 257,892 | ||||||
Minerals Technologies, Inc.(a) | 5,099 | 288,756 | ||||||
|
| |||||||
| 1,402,166 | ||||||||
|
| |||||||
COMMERCIAL SERVICES (0.46%) | ||||||||
Alliance Data Systems Corp.(b) | 952 | 225,681 | ||||||
Chemed Corp.(a) | 3,354 | 227,468 | ||||||
Emerge Energy Services LP(a) | 3,306 | 125,430 | ||||||
Equifax, Inc. | 3,754 | 242,771 | ||||||
FTI Consulting, Inc.(a)(b) | 3,973 | 161,224 | ||||||
Global Payments, Inc. | 5,635 | 335,170 | ||||||
Manpowergroup, Inc.(a) | 4,962 | 387,532 | ||||||
Moody’s Corp.(a) | 2,920 | 206,327 | ||||||
Odyssey Marine Exploration, Inc.(b) | 18,369 | 39,861 | ||||||
Robert Half International, Inc.(a) | 5,471 | 210,798 | ||||||
Towers Watson & Co., Class A | 1,097 | 125,947 | ||||||
Vantiv, Inc., Class A(b) | 11,499 | 316,222 | ||||||
WEX, Inc.(a)(b) | 1,323 | 123,502 | ||||||
|
| |||||||
| 2,727,933 | ||||||||
|
| |||||||
COMPUTERS (0.31%) | ||||||||
Apple, Inc. | 145 | 75,741 | ||||||
Brocade Communications Systems, Inc.(b) | 52,368 | 419,991 | ||||||
EMC Corp.(a) | 12,013 | 289,153 | ||||||
NetApp, Inc. | 8,781 | 340,791 | ||||||
Seagate Technology PLC | 6,939 | 337,790 | ||||||
Western Digital Corp.(a) | 4,761 | 331,508 | ||||||
|
| |||||||
| 1,794,974 | ||||||||
|
| |||||||
DISTRIBUTION & WHOLESALE (0.09%) | ||||||||
Arrow Electronics, Inc.(a)(b) | 7,083 | 340,126 | ||||||
WESCO International, Inc.(a)(b) | 2,375 | 202,967 | ||||||
|
| |||||||
| 543,093 | ||||||||
|
| |||||||
DIVERSIFIED FINANCIAL SERVICES (0.16%) | ||||||||
Discover Financial Services(a) | 4,267 | 221,372 | ||||||
Raymond James Financial, Inc.(a) | 3,913 | 178,628 | ||||||
SLM Corp. | 5,804 | 147,248 | ||||||
TD Ameritrade Holding Corp.(a) | 7,449 | 203,060 | ||||||
The Charles Schwab Corp.(a) | 8,234 | 186,500 | ||||||
|
| |||||||
| 936,808 | ||||||||
|
| |||||||
ELECTRIC (0.05%) | ||||||||
AES Corp.(a) | 21,958 | 309,388 | ||||||
|
| |||||||
ELECTRICAL COMPONENTS & EQUIPMENT (0.02%) | ||||||||
Hubbell, Inc., Class B(a) | 1,115 | 119,907 | ||||||
|
| |||||||
ELECTRONICS (0.30%) | ||||||||
Agilent Technologies, Inc. | 3,902 | 198,066 | ||||||
| See Notes to Financial Statements. | ||
22 | www.redmontfunds.com |
| Redmont Resolute Fund II | Schedule of Investments | |
| October 31, 2013 (Unaudited) |
| Description | Shares | Value (Note 2) | ||||||
| ||||||||
ELECTRONICS (continued) | ||||||||
Avnet, Inc.(a) | 7,449 | $ | 295,725 | |||||
Flextronics International Ltd.(a)(b) | 46,382 | 365,954 | ||||||
Honeywell International, Inc.(a) | 2,344 | 203,295 | ||||||
Koninklijke Philips NV, NY Registered Shares | 8,557 | 303,003 | ||||||
TE Connectivity Ltd. | 3,865 | 199,009 | ||||||
Tyco International Ltd.(a) | 4,963 | 181,398 | ||||||
|
| |||||||
| 1,746,450 | ||||||||
|
| |||||||
ENGINEERING & CONSTRUCTION (0.04%) | ||||||||
ABB Ltd., ADR(a) | 4,965 | 126,458 | ||||||
Fluor Corp.(a) | 1,648 | 122,315 | ||||||
|
| |||||||
| 248,773 | ||||||||
|
| |||||||
FOOD (0.13%) | ||||||||
Dean Foods Co.(b) | 9,909 | 193,225 | ||||||
Tyson Foods, Inc., Class A(a) | 14,107 | 390,341 | ||||||
Unilever NV, NY Registered Shares(a) | 4,050 | 160,866 | ||||||
|
| |||||||
| 744,432 | ||||||||
|
| |||||||
FOREST PRODUCTS & PAPER (0.06%) | ||||||||
International Paper Co.(a) | 8,361 | 372,984 | ||||||
|
| |||||||
HEALTHCARE - PRODUCTS (0.14%) | ||||||||
Boston Scientific Corp.(b) | 17,315 | 202,412 | ||||||
CareFusion Corp.(a)(b) | 3,995 | 154,886 | ||||||
Covidien PLC(a) | 4,986 | 319,653 | ||||||
Integra LifeSciences Holdings Corp.(b) | 2,686 | 122,965 | ||||||
|
| |||||||
| 799,916 | ||||||||
|
| |||||||
HEALTHCARE - SERVICES (0.23%) | ||||||||
Cigna Corp.(a) | 2,426 | 186,753 | ||||||
DaVita HealthCare Partners, Inc.(a)(b) | 4,351 | 244,570 | ||||||
ICON PLC(b) | 2,552 | 103,203 | ||||||
Quest Diagnostics, Inc. | 3,640 | 218,072 | ||||||
Select Medical Holdings Corp. | 22,132 | 187,679 | ||||||
UnitedHealth Group, Inc.(a) | 2,772 | 189,217 | ||||||
Universal Health Services, Inc., Class B(a) | 2,900 | 233,624 | ||||||
|
| |||||||
| 1,363,118 | ||||||||
|
| |||||||
HOME BUILDERS (0.03%) | ||||||||
NVR, Inc.(b) | 221 | 202,728 | ||||||
|
| |||||||
HOUSEWARES (0.05%) | ||||||||
Newell Rubbermaid, Inc.(a) | 9,451 | 280,033 | ||||||
|
| |||||||
INSURANCE (0.44%) | ||||||||
ACE Ltd.(a) | 2,836 | 270,668 | ||||||
Axis Capital Holdings Ltd.(a) | 5,540 | 262,707 | ||||||
Berkshire Hathaway, Inc., Class B(a)(b) | 2,274 | 261,692 | ||||||
Everest Re Group Ltd. | 1,022 | 157,122 | ||||||
MetLife, Inc.(a) | 4,888 | 231,251 | ||||||
Reinsurance Group of America, Inc.(a) | 2,675 | 190,407 | ||||||
| See Notes to Financial Statements. | ||
| Semi-Annual Report | October 31, 2013 | 23 |
| Redmont Resolute Fund II | Schedule of Investments | |
| October 31, 2013 (Unaudited) |
| Description | Shares | Value (Note 2) | ||||||
| ||||||||
INSURANCE (continued) | ||||||||
The Allstate Corp. | 4,891 | $ | 259,517 | |||||
The Travelers Cos., Inc.(a) | 2,967 | 256,052 | ||||||
Torchmark Corp.(a) | 2,670 | 194,536 | ||||||
Validus Holdings Ltd.(a) | 6,925 | 273,399 | ||||||
WR Berkley Corp. | 5,841 | 256,478 | ||||||
|
| |||||||
| 2,613,829 | ||||||||
|
| |||||||
INTERNET (0.57%) | ||||||||
Baidu, Inc., ADR(b) | 1,836 | 295,412 | ||||||
CDW Corp.(b) | 8,352 | 183,661 | ||||||
Ctrip.com International Ltd., ADR(b) | 2,307 | 125,155 | ||||||
eBay, Inc.(a)(b) | 9,029 | 475,919 | ||||||
Expedia, Inc. | 4,409 | 259,602 | ||||||
Global Sources Ltd.(b) | 5,759 | 43,135 | ||||||
Google, Inc., Class A(b) | 355 | 365,856 | ||||||
IAC/InterActiveCorp(a) | 7,338 | 391,776 | ||||||
NetEase, Inc., ADR | 4,244 | 286,512 | ||||||
Perfect World Co. Ltd., ADR | 5,438 | 95,328 | ||||||
SINA Corp.(a)(b) | 1,837 | 153,500 | ||||||
Symantec Corp.(a) | 13,391 | 304,511 | ||||||
Travelzoo, Inc.(b) | 1,965 | 42,306 | ||||||
Yahoo!, Inc(b) | 10,030 | 330,288 | ||||||
|
| |||||||
| 3,352,961 | ||||||||
|
| |||||||
LEISURE TIME (0.01%) | ||||||||
Johnson Outdoors, Inc., Class A | 2,346 | 64,351 | ||||||
|
| |||||||
MACHINERY - DIVERSIFIED (0.12%) | ||||||||
AGCO Corp. | 2,047 | 119,504 | ||||||
CNH Industrial NV(b) | 8,486 | 99,543 | ||||||
Flowserve Corp. | 4,192 | 291,218 | ||||||
The Babcock & Wilcox Co.(a) | 6,473 | 208,495 | ||||||
|
| |||||||
| 718,760 | ||||||||
|
| |||||||
MEDIA (0.49%) | ||||||||
CBS Corp., Class B(a) | 3,418 | 202,140 | ||||||
Comcast Corp., Class A(a) | 6,779 | 322,545 | ||||||
EW Scripps Co., Class A(b) | 6,710 | 132,992 | ||||||
Gannett Co., Inc.(a) | 7,545 | 208,770 | ||||||
Liberty Global PLC, Class A(b) | 2,094 | 164,107 | ||||||
Liberty Global PLC, Class C(b) | 4,707 | 352,366 | ||||||
Liberty Media Corp., Class A(a)(b) | 1,660 | 253,831 | ||||||
News Corp., Class A(b) | 16,225 | 285,560 | ||||||
The Walt Disney Co.(a) | 3,203 | 219,694 | ||||||
Time Warner Cable, Inc.(a) | 2,140 | 257,121 | ||||||
Time Warner, Inc.(a) | 3,085 | 212,063 | ||||||
Viacom, Inc., Class B(a) | 3,148 | 262,197 | ||||||
|
| |||||||
| 2,873,386 | ||||||||
|
| |||||||
METAL FABRICATE & HARDWARE (0.05%) | ||||||||
LB Foster Co., Class A | 1,308 | 61,149 | ||||||
Timken Co.(a) | 4,402 | 232,470 | ||||||
|
| |||||||
| 293,619 | ||||||||
|
| |||||||
See Notes to Financial Statements. | ||
24 | www.redmontfunds.com | |
| Redmont Resolute Fund II | Schedule of Investments | |
| October 31, 2013 (Unaudited) |
| Description | Shares | Value (Note 2) | ||||||
| ||||||||
MINING (0.01%) | ||||||||
Yamana Gold, Inc. | 8,677 | $ | 86,163 | |||||
|
| |||||||
MISCELLANEOUS MANUFACTURING (0.26%) | ||||||||
3M Co. | 1,302 | 163,857 | ||||||
Carlisle Cos., Inc.(a) | 2,113 | 153,573 | ||||||
Dover Corp.(a) | 2,327 | 213,595 | ||||||
EnPro Industries, Inc.(a)(b) | 1,328 | 79,242 | ||||||
Parker Hannifin Corp.(a) | 2,068 | 241,377 | ||||||
Siemens AG, ADR | 2,514 | 321,817 | ||||||
Standex International Corp. | 2,791 | 171,674 | ||||||
Textron, Inc.(a) | 6,445 | 185,552 | ||||||
|
| |||||||
| 1,530,687 | ||||||||
|
| |||||||
OFFICE & BUSINESS EQUIPMENT (0.02%) | ||||||||
Xerox Corp.(a) | 12,048 | 119,757 | ||||||
|
| |||||||
OIL & GAS (0.83%) | ||||||||
Antero Resources Corp.(b) | 6,472 | 365,603 | ||||||
Canadian Natural Resources Ltd.(a) | 4,908 | 155,829 | ||||||
Devon Energy Corp. | 3,271 | 206,793 | ||||||
Diamondback Energy, Inc.(a)(b) | 4,010 | 207,116 | ||||||
Energen Corp. | 5,910 | 462,871 | ||||||
Ensco PLC, Class A(a) | 1,705 | 98,293 | ||||||
EOG Resources, Inc.(a) | 2,802 | 499,877 | ||||||
EQT Corp. | 4,260 | 364,699 | ||||||
Exxon Mobil Corp.(a) | 8,042 | 720,724 | ||||||
Gulfport Energy Corp.(b) | 4,004 | 234,995 | ||||||
Kosmos Energy Ltd.(b) | 10,045 | 107,080 | ||||||
Marathon Oil Corp.(a) | 1,605 | 56,592 | ||||||
Occidental Petroleum Corp.(a) | 6,394 | 614,335 | ||||||
Phillips 66(a) | 6,313 | 406,747 | ||||||
Rosetta Resources, Inc.(b) | 3,450 | 206,793 | ||||||
Southwestern Energy Co.(a)(b) | 4,113 | 153,086 | ||||||
|
| |||||||
| 4,861,433 | ||||||||
|
| |||||||
OIL & GAS SERVICES (0.13%) | ||||||||
Cameron International Corp.(a)(b) | 3,036 | 166,555 | ||||||
Halliburton Co.(a) | 5,994 | 317,862 | ||||||
Schlumberger Ltd.(a) | 3,084 | 289,032 | ||||||
|
| |||||||
| 773,449 | ||||||||
|
| |||||||
PACKAGING & CONTAINERS (0.28%) | ||||||||
Berry Plastics Group, Inc.(b) | 13,919 | 279,494 | ||||||
Crown Holdings, Inc.(a)(b) | 10,271 | 447,816 | ||||||
Graphic Packaging Holding Co.(a)(b) | 64,566 | 542,354 | ||||||
Owens-Illinois, Inc.(a)(b) | 11,289 | 358,877 | ||||||
|
| |||||||
| 1,628,541 | ||||||||
|
| |||||||
PHARMACEUTICALS (0.48%) | ||||||||
AbbVie, Inc.(a) | 5,626 | 272,580 | ||||||
AstraZeneca PLC, ADR | 6,516 | 344,436 | ||||||
Bayer AG, ADR | 1,725 | 215,108 | ||||||
Cardinal Health, Inc.(a) | 3,973 | 233,056 | ||||||
See Notes to Financial Statements. | ||
| Semi-Annual Report | October 31, 2013 | 25 | |
| Redmont Resolute Fund II | Schedule of Investments | |
| October 31, 2013 (Unaudited) |
| Description | Shares | Value (Note 2) | ||||||
| ||||||||
PHARMACEUTICALS (continued) | ||||||||
Endo Health Solutions, Inc.(a)(b) | 2,465 | $ | 107,794 | |||||
Express Scripts Holding Co.(a)(b) | 5,048 | 315,601 | ||||||
Johnson & Johnson(a) | 1,590 | 147,250 | ||||||
McKesson Corp. | 1,646 | 257,336 | ||||||
Omnicare, Inc.(a) | 5,340 | 294,501 | ||||||
Pfizer, Inc.(a) | 5,686 | 174,446 | ||||||
Roche Holding AG, ADR(a) | 1,981 | 137,363 | ||||||
Sanofi, ADR(a) | 5,751 | 307,563 | ||||||
|
| |||||||
| 2,807,034 | ||||||||
|
| |||||||
REAL ESTATE INVESTMENT TRUSTS (0.14%) | ||||||||
American Homes 4 Rent, Class A(b) | 9,989 | 154,630 | ||||||
American Residential Properties, Inc.(b) | 7,003 | 120,662 | ||||||
Boston Properties, Inc.(a) | 1,013 | 104,845 | ||||||
BRE Properties, Inc. | 2,998 | 163,721 | ||||||
Equity Residential(a) | 1,921 | 100,583 | ||||||
Post Properties, Inc. | 3,355 | 153,458 | ||||||
|
| |||||||
| 797,899 | ||||||||
|
| |||||||
RETAIL (0.30%) | ||||||||
Abercrombie & Fitch Co., Class A | 4,948 | 185,451 | ||||||
Bed Bath & Beyond, Inc.(a)(b) | 3,691 | 285,388 | ||||||
CVS Caremark Corp.(a) | 4,417 | 275,002 | ||||||
Foot Locker, Inc.(a) | 5,261 | 182,557 | ||||||
Macy’s, Inc.(a) | 5,323 | 245,444 | ||||||
MSC Industrial Direct Co., Inc., Class A | 2,321 | 177,255 | ||||||
Rite Aid Corp.(b) | 49,973 | 266,356 | ||||||
Target Corp. | 2,403 | 155,690 | ||||||
|
| |||||||
| 1,773,143 | ||||||||
|
| |||||||
SAVINGS & LOANS (0.02%) | ||||||||
First Niagara Financial Group, Inc. | 11,251 | 124,098 | ||||||
|
| |||||||
SEMICONDUCTORS (0.33%) | ||||||||
Analog Devices, Inc.(a) | 5,369 | 264,692 | ||||||
Avago Technologies Ltd. | 5,682 | 258,133 | ||||||
LSI Corp.(a) | 44,955 | 381,218 | ||||||
NVIDIA Corp.(a) | 13,369 | 202,941 | ||||||
ON Semiconductor Corp.(a)(b) | 40,008 | 282,457 | ||||||
QUALCOMM, Inc.(a) | 3,514 | 244,118 | ||||||
Texas Instruments, Inc.(a) | 7,675 | 322,964 | ||||||
|
| |||||||
| 1,956,523 | ||||||||
|
| |||||||
SHIPBUILDING (0.05%) | ||||||||
Huntington Ingalls Industries, Inc.(a) | 3,756 | 268,742 | ||||||
|
| |||||||
SOFTWARE (0.19%) | ||||||||
Activision Blizzard, Inc.(a) | 24,209 | 402,838 | ||||||
AVG Technologies NV(b) | 5,201 | 104,540 | ||||||
CA, Inc.(a) | 8,505 | 270,119 | ||||||
Microsoft Corp.(a) | 9,538 | 337,168 | ||||||
|
| |||||||
| 1,114,665 | ||||||||
|
| |||||||
See Notes to Financial Statements. | ||
26 | www.redmontfunds.com | |
| Redmont Resolute Fund II | Schedule of Investments | |
| October 31, 2013 (Unaudited) |
| Description | Shares | Value (Note 2) | ||||||||
| ||||||||||
TELECOMMUNICATIONS (0.16%) | ||||||||||
Amdocs Ltd.(a) | 6,139 | $ | 236,045 | |||||||
Cisco Systems, Inc.(a) | 12,462 | 280,395 | ||||||||
Harris Corp. | 2,391 | 148,146 | ||||||||
Vodafone Group PLC, ADR | 4,320 | 159,062 | ||||||||
Windstream Holdings, Inc. | 14,351 | 122,701 | ||||||||
|
| |||||||||
| 946,349 | ||||||||||
|
| |||||||||
TRANSPORTATION (0.04%) | ||||||||||
Norfolk Southern Corp.(a) | 2,808 | 241,544 | ||||||||
|
| |||||||||
TOTAL COMMON STOCKS (Cost $46,335,959) | 50,932,970 | |||||||||
| ||||||||||
OPEN-END MUTUAL FUNDS (71.13%) | ||||||||||
AQR Multi Strategy Alternative Fund, Class I | 2,848,352 | 28,768,359 | ||||||||
AQR Risk Parity Fund, Class I | 2,460,341 | 28,441,539 | ||||||||
BlackRock Global Allocation Fund, Inc., Class I | 2,407,212 | 52,838,296 | ||||||||
Diamond Hill Long-Short Fund, Class Y | 1,834,363 | 40,282,615 | ||||||||
FPA Crescent Fund | 1,607,758 | 53,039,946 | ||||||||
MainStay Marketfield Fund, Class I | 2,220,825 | 40,241,354 | ||||||||
PIMCO Global Multi-Asset Fund, Institutional Class | 6,756,621 | 70,539,127 | ||||||||
PIMCO Short-Term Fund, Institutional Class | 10,573,003 | 104,355,538 | ||||||||
|
| |||||||||
| 418,506,774 | ||||||||||
|
| |||||||||
TOTAL OPEN-END MUTUAL FUNDS (Cost $397,009,037) | 418,506,774 | |||||||||
| ||||||||||
| 7-Day Yield | Shares | Value (Note 2) | ||||||||
| ||||||||||
SHORT TERM INVESTMENTS (1.29%) | ||||||||||
Dreyfus Treasury Cash Management Fund, Institutional Class | 0.010% | 7,585,416 | 7,585,416 | |||||||
|
| |||||||||
TOTAL SHORT TERM INVESTMENTS (Cost $7,585,416) | 7,585,416 | |||||||||
| ||||||||||
TOTAL INVESTMENTS (81.08%) (Cost $450,930,412) | $ | 477,025,160 | ||||||||
SEGREGATED CASH WITH BROKERS (24.31%)(c) | 143,048,379 | |||||||||
SECURITIES SOLD SHORT (-4.29%) (Proceeds $23,600,324) | (25,261,219 | ) | ||||||||
LIABILITIES IN EXCESS OF OTHER ASSETS (-1.10%) | (6,472,750 | ) | ||||||||
| ||||||||||
NET ASSETS (100.00%) | $ | 588,339,570 | ||||||||
| ||||||||||
See Notes to Financial Statements. | ||
| Semi-Annual Report | October 31, 2013 | 27 | |
| Redmont Resolute Fund II | Schedule of Investments | |
| October 31, 2013 (Unaudited) |
SCHEDULE OF SECURITIES SOLD SHORT
| Shares | Value (Note 2) | |||||||
| ||||||||
COMMON STOCKS (-4.29%) | ||||||||
APPAREL (-0.07%) | ||||||||
Deckers Outdoor Corp. | (2,954 | ) | $ | (203,324 | ) | |||
Under Armour, Inc., Class A | (2,869 | ) | (232,819 | ) | ||||
|
| |||||||
| (436,143 | ) | |||||||
|
| |||||||
AUTO MANUFACTURERS (-0.02%) | ||||||||
Oshkosh Corp. | (2,093 | ) | (99,606 | ) | ||||
|
| |||||||
AUTO PARTS & EQUIPMENT (-0.03%) | ||||||||
Accuride Corp. | (13,916 | ) | (62,622 | ) | ||||
American Axle & Manufacturing Holdings, Inc. | (4,978 | ) | (92,641 | ) | ||||
Modine Manufacturing Co. | (1,831 | ) | (24,389 | ) | ||||
|
| |||||||
| (179,652 | ) | |||||||
|
| |||||||
BANKS (-0.30%) | ||||||||
1st United Bancorp, Inc. | (2,642 | ) | (20,185 | ) | ||||
Bank of Hawaii Corp. | (1,834 | ) | (106,335 | ) | ||||
Cardinal Financial Corp. | (2,842 | ) | (46,893 | ) | ||||
Community Bank System, Inc. | (4,768 | ) | (173,126 | ) | ||||
CVB Financial Corp. | (12,345 | ) | (179,496 | ) | ||||
First Financial Bankshares, Inc. | (2,350 | ) | (144,549 | ) | ||||
HDFC Bank Ltd., ADR | (2,567 | ) | (93,054 | ) | ||||
Northern Trust Corp. | (2,308 | ) | (130,217 | ) | ||||
TCF Financial Corp. | (8,883 | ) | (134,844 | ) | ||||
Trustmark Corp. | (5,594 | ) | (151,933 | ) | ||||
UMB Financial Corp. | (2,187 | ) | (128,858 | ) | ||||
United Bankshares, Inc. | (5,522 | ) | (163,341 | ) | ||||
Valley National Bancorp | (10,339 | ) | (100,805 | ) | ||||
Westamerica Bancorporation | (4,158 | ) | (214,054 | ) | ||||
|
| |||||||
| (1,787,690 | ) | |||||||
|
| |||||||
BIOTECHNOLOGY (-0.02%) | ||||||||
Seattle Genetics, Inc. | (3,839 | ) | (148,301 | ) | ||||
|
| |||||||
BUILDING MATERIALS (-0.12%) | ||||||||
Quanex Building Products Corp. | (5,507 | ) | (97,915 | ) | ||||
Simpson Manufacturing Co., Inc. | (6,551 | ) | (232,233 | ) | ||||
Texas Industries, Inc. | (463 | ) | (24,863 | ) | ||||
Trex Co., Inc. | (2,615 | ) | (183,625 | ) | ||||
Vulcan Materials Co. | (3,516 | ) | (188,282 | ) | ||||
|
| |||||||
| (726,918 | ) | |||||||
|
| |||||||
CHEMICALS (-0.03%) | ||||||||
EI du Pont de Nemours & Co. | (2,710 | ) | (165,852 | ) | ||||
Zep, Inc. | (1,251 | ) | (24,882 | ) | ||||
|
| |||||||
| (190,734 | ) | |||||||
|
| |||||||
COMMERCIAL SERVICES (-0.12%) | ||||||||
Monro Muffler Brake, Inc. | (5,058 | ) | (232,668 | ) | ||||
Ritchie Bros. Auctioneers, Inc. | (8,371 | ) | (165,746 | ) | ||||
Rollins, Inc. | (5,847 | ) | (161,611 | ) | ||||
Weight Watchers International, Inc. | (3,846 | ) | (123,495 | ) | ||||
|
| |||||||
| (683,520 | ) | |||||||
|
| |||||||
COMPUTERS (-0.11%) | ||||||||
IHS, Inc., Class A | (1,674 | ) | (182,550 | ) | ||||
Infosys Ltd., ADR | (4,384 | ) | (232,615 | ) | ||||
Wipro Ltd., ADR | (21,325 | ) | (236,707 | ) | ||||
|
| |||||||
| (651,872 | ) | |||||||
|
| |||||||
DISTRIBUTION & WHOLESALE (-0.07%) | ||||||||
Fastenal Co. | (5,300 | ) | (263,940 | ) | ||||
See Notes to Financial Statements. | ||
28 | www.redmontfunds.com | |
| Redmont Resolute Fund II | Schedule of Investments | |
| October 31, 2013 (Unaudited) |
| Shares | Value (Note 2) | |||||||
| ||||||||
DISTRIBUTION & WHOLESALE (-0.07%) (continued) | ||||||||
Fossil Group, Inc. | (1,228) | $ | (155,882) | |||||
|
| |||||||
| (419,822) | ||||||||
|
| |||||||
DIVERSIFIED FINANCIAL SERVICES (-0.04%) | ||||||||
Blackhawk Network Holdings, Inc. | (3,573) | (81,679) | ||||||
Greenhill & Co., Inc. | (3,090) | (158,517) | ||||||
|
| |||||||
| (240,196) | ||||||||
|
| |||||||
ELECTRIC (-0.09%) | ||||||||
NextEra Energy, Inc. | (1,462) | (123,905) | ||||||
Ormat Technologies, Inc. | (1,923) | (50,133) | ||||||
Pepco Holdings, Inc. | (8,576) | (165,345) | ||||||
TECO Energy, Inc. | (12,084) | (207,482) | ||||||
|
| |||||||
| (546,865) | ||||||||
|
| |||||||
ELECTRICAL COMPONENTS & EQUIPMENT (-0.04%) | ||||||||
Acuity Brands, Inc. | (2,198) | (220,921) | ||||||
|
| |||||||
ELECTRONICS (-0.07%) | ||||||||
Itron, Inc. | (4,827) | (205,968) | ||||||
National Instruments Corp. | (7,007) | (203,554) | ||||||
|
| |||||||
| (409,522) | ||||||||
|
| |||||||
FOOD (-0.18%) | ||||||||
Annie’s, Inc. | (2,913) | (137,639) | ||||||
Campbell Soup Co. | (2,810) | (119,622) | ||||||
Hillshire Brands Co. | (4,833) | (158,667) | ||||||
Snyders-Lance, Inc. | (5,533) | (165,935) | ||||||
Sysco Corp. | (6,792) | (219,653) | ||||||
United Natural Foods, Inc. | (3,640) | (260,078) | ||||||
|
| |||||||
| (1,061,594) | ||||||||
|
| |||||||
FOREST PRODUCTS & PAPER (-0.07%) | ||||||||
Fibria Celulose SA, ADR | (13,125) | (171,281) | ||||||
Resolute Forest Products, Inc. | (9,431) | (150,802) | ||||||
Wausau Paper Corp. | (7,929) | (92,769) | ||||||
|
| |||||||
| (414,852) | ||||||||
|
| |||||||
GAS (-0.04%) | ||||||||
NiSource, Inc. | (6,615) | (208,505) | ||||||
|
| |||||||
HAND & MACHINE TOOLS (-0.03%) | ||||||||
Kennametal, Inc. | (2,326) | (106,996) | ||||||
Regal-Beloit Corp. | (1,271) | (93,202) | ||||||
|
| |||||||
| (200,198) | ||||||||
|
| |||||||
HEALTHCARE - PRODUCTS (-0.10%) | ||||||||
ABIOMED, Inc. | (6,697) | (160,594) | ||||||
HeartWare International, Inc. | (1,707) | (123,860) | ||||||
IDEXX Laboratories, Inc. | (1,291) | (139,248) | ||||||
ResMed, Inc. | (2,726) | (141,043) | ||||||
|
| |||||||
| (564,745) | ||||||||
|
| |||||||
HEALTHCARE - SERVICES (-0.03%) | ||||||||
Health Net, Inc. | (6,058) | (184,163) | ||||||
|
| |||||||
HOME FURNISHINGS (-0.02%) | ||||||||
iRobot Corp. | (4,313) | (146,081) | ||||||
|
| |||||||
HOUSEHOLD PRODUCTS & WARES (-0.10%) | ||||||||
The Clorox Co. | (2,085) | (188,046) | ||||||
Kimberly-Clark Corp. | (1,730) | (186,840) | ||||||
| See Notes to Financial Statements. | ||
| Semi-Annual Report | October 31, 2013 | 29 | |
| Redmont Resolute Fund II | Schedule of Investments | |
| October 31, 2013 (Unaudited) |
| Shares | Value (Note 2) | |||||||
| ||||||||
HOUSEHOLD PRODUCTS & WARES (-0.10%) (continued) | ||||||||
The Scotts Miracle-Gro Co., Class A | (3,617) | $ | (212,390) | |||||
|
| |||||||
| (587,276) | ||||||||
|
| |||||||
HOUSEWARES (-0.01%) | ||||||||
The Toro Co. | (1,407) | (82,929) | ||||||
|
| |||||||
INTERNET (-0.43%) | ||||||||
Angie’s List, Inc. | (8,426) | (118,722) | ||||||
Bankrate, Inc. | (7,990) | (134,552) | ||||||
Blue Nile, Inc. | (4,906) | (201,489) | ||||||
Cogent Communications Group, Inc. | (5,246) | (184,292) | ||||||
E-Commerce China Dangdang, Inc., ADR, Class A | (24,538) | (217,161) | ||||||
Equinix, Inc. | (917) | (148,077) | ||||||
Giant Interactive Group, Inc., ADR | (20,046) | (177,407) | ||||||
Internap Network Services Corp. | (11,817) | (85,910) | ||||||
Netflix, Inc. | (677) | (218,319) | ||||||
Shutterstock, Inc. | (1,495) | (105,846) | ||||||
SouFun Holdings Ltd., ADR | (1,533) | (81,602) | ||||||
Vitacost.com, Inc. | (5,185) | (41,013) | ||||||
Yelp, Inc. | (2,752) | (186,448) | ||||||
Youku Tudou, Inc., ADR | (2,646) | (72,077) | ||||||
YY, Inc., ADR | (5,535) | (272,156) | ||||||
Zillow, Inc., Class A | (1,504) | (119,764) | ||||||
Zynga, Inc., Class A | (40,682) | (146,048) | ||||||
|
| |||||||
| (2,510,883) | ||||||||
|
| |||||||
MACHINERY - CONSTRUCTION & MINING (-0.03%) | ||||||||
Caterpillar, Inc. | (1,975) | (164,636) | ||||||
|
| |||||||
MACHINERY - DIVERSIFIED (-0.12%) | ||||||||
Altra Holdings, Inc. | (1,429) | (43,399) | ||||||
Briggs & Stratton Corp. | (9,528) | (174,743) | ||||||
Deere & Co. | (1,632) | (133,563) | ||||||
Manitex International, Inc. | (2,614) | (33,799) | ||||||
The Manitowoc Co., Inc. | (7,979) | (155,271) | ||||||
Roper Industries, Inc. | (1,122) | (142,281) | ||||||
|
| |||||||
| (683,056) | ||||||||
|
| |||||||
METAL FABRICATE & HARDWARE (-0.03%) | ||||||||
Sun Hydraulics Corp. | (4,278) | (169,751) | ||||||
|
| |||||||
MINING (-0.05%) | ||||||||
Compass Minerals International, Inc. | (2,627) | (195,633) | ||||||
US Silica Holdings, Inc. | (2,267) | (78,937) | ||||||
|
| |||||||
| (274,570) | ||||||||
|
| |||||||
MISCELLANEOUS MANUFACTURING (-0.15%) | ||||||||
Aptargroup, Inc. | (3,244) | (208,135) | ||||||
AZZ, Inc. | (4,238) | (190,286) | ||||||
Federal Signal Corp. | (4,513) | (61,783) | ||||||
Polypore International, Inc. | (3,589) | (162,223) | ||||||
Raven Industries, Inc. | (4,507) | (150,353) | ||||||
Trinity Industries, Inc. | (2,293) | (116,095) | ||||||
|
| |||||||
| (888,875) | ||||||||
|
| |||||||
OFFICE FURNISHINGS (-0.02%) | ||||||||
Interface, Inc. | (6,153) | (124,598) | ||||||
|
| |||||||
OIL & GAS (-0.34%) | ||||||||
Approach Resources, Inc. | (4,309) | (121,298) | ||||||
| See Notes to Financial Statements. | ||
30 | www.redmontfunds.com | |
| Redmont Resolute Fund II | Schedule of Investments | |
| October 31, 2013 (Unaudited) |
| Shares | Value (Note 2) | |||||||
| ||||||||
OIL & GAS (-0.34%) (continued) | ||||||||
Atwood Oceanics, Inc. | (3,154) | $ | (167,572) | |||||
Carrizo Oil & Gas, Inc. | (4,164) | (182,550) | ||||||
Chesapeake Energy Corp. | (4,792) | (133,984) | ||||||
Comstock Resources, Inc. | (6,017) | (102,951) | ||||||
ConocoPhillips | (2,891) | (211,910) | ||||||
Continental Resources, Inc. | (1,745) | (198,756) | ||||||
Goodrich Petroleum Corp. | (2,675) | (62,568) | ||||||
Halcon Resources Corp. | (15,639) | (81,010) | ||||||
HollyFrontier Corp. | (4,302) | (198,150) | ||||||
Oasis Petroleum, Inc. | (4,064) | (216,408) | ||||||
Ultra Petroleum Corp. | (10,632) | (195,204) | ||||||
Whiting Petroleum Corp. | (1,645) | (110,034) | ||||||
|
| |||||||
| (1,982,395) | ||||||||
|
| |||||||
OIL & GAS SERVICES (-0.04%) | ||||||||
Oceaneering International, Inc. | (1,566) | (134,488) | ||||||
RPC, Inc. | (4,714) | (86,455) | ||||||
|
| |||||||
| (220,943) | ||||||||
|
| |||||||
REAL ESTATE INVESTMENT TRUSTS (-0.18%) | ||||||||
FelCor Lodging Trust, Inc. | (18,479) | (124,179) | ||||||
HCP, Inc. | (3,261) | (135,331) | ||||||
Health Care REIT, Inc. | (2,648) | (171,723) | ||||||
Mack-Cali Realty Corp. | (7,109) | (146,161) | ||||||
Omega Healthcare Investors, Inc. | (5,089) | (169,158) | ||||||
Realty Income Corp. | (4,361) | (181,636) | ||||||
Rouse Properties, Inc. | (7,728) | (156,260) | ||||||
|
| |||||||
| (1,084,448) | ||||||||
|
| |||||||
RETAIL (-0.30%) | ||||||||
AutoNation, Inc. | (3,866) | (186,457) | ||||||
Darden Restaurants, Inc. | (3,994) | (205,811) | ||||||
Guess?, Inc. | (6,791) | (212,219) | ||||||
Jack in the Box, Inc. | (4,881) | (198,559) | ||||||
L Brands, Inc. | (2,961) | (185,388) | ||||||
Lululemon Athletica, Inc. | (3,048) | (210,465) | ||||||
Sally Beauty Holdings, Inc. | (8,638) | (227,352) | ||||||
Sonic Automotive, Inc., Class A | (5,205) | (115,967) | ||||||
Yum! Brands, Inc. | (3,096) | (209,352) | ||||||
|
| |||||||
| (1,751,570) | ||||||||
|
| |||||||
SAVINGS & LOANS (-0.02%) | ||||||||
Astoria Financial Corp. | (8,733) | (115,363) | ||||||
|
| |||||||
SEMICONDUCTORS (-0.11%) | ||||||||
Cirrus Logic, Inc. | (6,109) | (137,025) | ||||||
Hittite Microwave Corp. | (3,149) | (201,190) | ||||||
International Rectifier Corp. | (4,736) | (123,325) | ||||||
Skyworks Solutions, Inc. | (6,693) | (172,546) | ||||||
|
| |||||||
| (634,086) | ||||||||
|
| |||||||
SOFTWARE (-0.36%) | ||||||||
Acxiom Corp. | (4,712) | (156,580) | ||||||
Aspen Technology, Inc. | (2,375) | (90,796) | ||||||
athenahealth, Inc. | (1,955) | (261,012) | ||||||
Blackbaud, Inc. | (5,454) | (196,344) | ||||||
Concur Technologies, Inc. | (1,996) | (208,782) | ||||||
Jive Software, Inc. | (13,330) | (145,164) | ||||||
MSCI, Inc. | (4,289) | (174,862) | ||||||
NetSuite, Inc. | (1,217) | (122,771) | ||||||
| See Notes to Financial Statements. | ||
| Semi-Annual Report | October 31, 2013 | 31 | |
| Redmont Resolute Fund II | Schedule of Investments | |
| October 31, 2013 (Unaudited) |
| Shares | Value (Note 2) | |||||||
| ||||||||
SOFTWARE (-0.36%) (continued) | ||||||||
Red Hat, Inc. | (3,748) | $ | (162,176) | |||||
Salesforce.com, Inc. | (4,084) | (217,922) | ||||||
Tyler Technologies, Inc. | (1,045) | (101,062) | ||||||
The Ultimate Software Group, Inc. | (1,398) | (215,963) | ||||||
VMware, Inc., Class A | (890) | (72,339) | ||||||
|
| |||||||
| (2,125,773) | ||||||||
|
| |||||||
TELECOMMUNICATIONS (-0.31%) | ||||||||
ADTRAN, Inc. | (4,277) | (100,424) | ||||||
America Movil SAB de CV, ADR | (8,628) | (184,726) | ||||||
CenturyLink, Inc. | (3,909) | (132,359) | ||||||
Ciena Corp. | (4,923) | (114,558) | ||||||
Finisar Corp. | (7,207) | (165,833) | ||||||
Infinera Corp. | (15,722) | (160,522) | ||||||
Level 3 Communications, Inc. | (8,142) | (248,738) | ||||||
NII Holdings, Inc. | (21,396) | (73,602) | ||||||
Palo Alto Networks, Inc. | (2,615) | (110,248) | ||||||
Sprint Corp. | (15,759) | (106,058) | ||||||
Telefonica SA, ADR | (7,887) | (137,786) | ||||||
Verizon Communications, Inc. | (2,382) | (120,315) | ||||||
ViaSat, Inc. | (2,704) | (178,788) | ||||||
|
| |||||||
| (1,833,957) | ||||||||
|
| |||||||
TRANSPORTATION (-0.09%) | ||||||||
Hub Group, Inc., Class A | (2,520) | (92,559) | ||||||
JB Hunt Transport Services, Inc. | (1,927) | (144,583) | ||||||
Kansas City Southern | (1,361) | (165,389) | ||||||
Old Dominion Freight Line, Inc. | (2,168) | (101,679) | ||||||
|
| |||||||
| (504,210) | ||||||||
|
| |||||||
TOTAL COMMON STOCKS (Proceeds $23,600,324) | (25,261,219) | |||||||
| ||||||||
TOTAL SECURITIES SOLD SHORT (Proceeds $23,600,324) | $ | (25,261,219) | ||||||
| ||||||||
SCHEDULE OF WRITTEN OPTIONS
| Number of Contracts | Exercise Price | Maturity Date | Value (Note 2) | |||||||||||
| ||||||||||||||
WRITTEN OPTIONS | ||||||||||||||
Call Options | ||||||||||||||
Cameron International Corp. | (9) | $ | 60.00 | 01/18/2014 | $ | (900) | ||||||||
Cameron International Corp. | (15) | 55.00 | 02/22/2014 | (5,250) | ||||||||||
EOG Resources, Inc. | (15) | 160.00 | 01/18/2014 | (32,438) | ||||||||||
EQT Corp. | (34) | 85.00 | 12/21/2013 | (11,900) | ||||||||||
Phillips 66 | (40) | 55.00 | 11/16/2013 | (38,600) | ||||||||||
|
| |||||||||||||
TOTAL WRITTEN OPTIONS (Proceeds $66,206) | $ (89,088) | |||||||||||||
|
| |||||||||||||
| (a) | All security positions either entirely or partially held in a segregated account as collateral for securities sold short and written options aggregating a total market value of $23,108,201. |
| (b) | Non-income producing security. |
| (c) | Includes cash which is being held as collateral for securities sold short and total return swap contracts. |
| See Notes to Financial Statements. | ||
32 | www.redmontfunds.com | |
| Redmont Resolute Fund II | Schedule of Investments | |
| October 31, 2013 (Unaudited) |
Common Abbreviations:
ADR - American Depositary Receipt.
AG - Aktiengesellschaft is a German term that refers to a corporation that is limited by shares, i.e., owned by shareholders.
AQR - AQR Capital Management LLC.
FPA - First Pacific Advisors LLC.
LP - Limited Partnership.
Ltd. - Limited.
NV - Naamloze Vennootschap is the Dutch term for a public limited liability corporation.
PIMCO - Pacific Investment Management Company.
PLC - Public Limited Company.
SA - Generally designates corporations in various countries, mostly those employing the civil law.
SAB de CV - A variable capital company.
TOTAL RETURN SWAP CONTRACTS*
| Counterparty | Reference Obligation | Notional Amount | Rate Paid by the Fund | Termination Date | Unrealized Depreciation | |||||||||
| ||||||||||||||
Morgan Stanley | ADAR L/S Segregated Portfolio | $ | 74,204,401 | 1-Month LIBOR BBA | 09/02/2014 | $ | (361,356) | |||||||
Morgan Stanley | Loeb King Multistrategy Segregated Portfolio | 74,524,638 | 1-Month LIBOR BBA | 09/02/2014 | (241,529) | |||||||||
Morgan Stanley | Trilogy Segregated Portfolio | 74,651,559 | 1-Month LIBOR BBA | 09/02/2014 | (135,788) | |||||||||
|
|
|
| |||||||||||
| $ | 223,380,598 | $ | (738,673) | |||||||||||
|
|
|
| |||||||||||
| * | The Fund receives monthly payments based on any positive monthly return of the Reference Obligation. The Fund makes payments on any negative monthly return of such Reference Obligation. |
| See Notes to Financial Statements. | ||
| Semi-Annual Report | October 31, 2013 | 33 |
| Redmont Funds | Statements of Assets and Liabilities | |
| October 31, 2013 (Unaudited) |
| REDMONT RESOLUTE FUND I | REDMONT RESOLUTE FUND II | |||||||
|
| |||||||
ASSETS | ||||||||
Investments, at value | $ | 3,338,579 | $ | 477,025,160 | ||||
Deposits with brokers for securities sold short and written options | 137,730 | 21,661,390 | ||||||
Deposits with brokers for total return swap contracts (Note 3) | 735,783 | 121,386,989 | ||||||
Receivable for investments sold | 3,325 | 1,124,251 | ||||||
Receivable due from adviser | 3,564 | – | ||||||
Receivable for dividends | 89 | 14,316 | ||||||
Other assets | 15,755 | 12,517 | ||||||
| ||||||||
Total assets | 4,234,825 | 621,224,623 | ||||||
| ||||||||
LIABILITIES | ||||||||
Securities sold short (Proceeds $144,870 and $23,600,324, respectively) | 155,292 | 25,261,219 | ||||||
Written options, at value (Premiums received $– and $66,206, respectively) | – | 89,088 | ||||||
Unrealized depreciation on total return swap contracts | 4,459 | 738,673 | ||||||
Investment advisory fees payable | – | 134,901 | ||||||
Distributions and service fees payable | 14 | N/A | ||||||
Payable for dividend expense on securities sold short | 129 | 20,909 | ||||||
Payable for investments purchased | 3,070 | 4,123,192 | ||||||
Trustee fees and expenses payable | 72 | 11,863 | ||||||
Chief compliance officer fee payable | 34 | 3,696 | ||||||
Principal financial officer fees payable | – | 1,169 | ||||||
Administration fees payable | 662 | 23,690 | ||||||
Transfer agent fees payable | 6,785 | 6,279 | ||||||
Payable due to broker on total return swap contracts | 14,665 | 2,429,518 | ||||||
Audit fees payable | 7,834 | 9,818 | ||||||
Custody fees payable | 142 | 12,439 | ||||||
Accrued expenses and other liabilities | 1,335 | 18,599 | ||||||
| ||||||||
Total liabilities | 194,493 | 32,885,053 | ||||||
| ||||||||
NET ASSETS | $ | 4,040,332 | $ | 588,339,570 | ||||
| ||||||||
| ||||||||
NET ASSETS CONSIST OF | ||||||||
Paid-in capital (Note 6) | $ | 3,868,299 | $ | 560,138,902 | ||||
Accumulated net investment income/(loss) | (35,466) | 1,188,490 | ||||||
Accumulated net realized gain on investments, securities sold short, written options, and total return swap contracts | 39,458 | 3,339,880 | ||||||
Net unrealized appreciation on investments, securities sold short, written options, and total return swap contracts | 168,041 | 23,672,298 | ||||||
| ||||||||
NET ASSETS | $ | 4,040,332 | $ | 588,339,570 | ||||
| ||||||||
| ||||||||
INVESTMENTS, AT COST | $ | 3,155,657 | $ | 450,930,412 | ||||
| ||||||||
PRICING OF SHARES | ||||||||
Class A: | ||||||||
Net Asset Value, offering and redemption price per share(a) | $ | 10.58 | N/A | |||||
Net Assets | $ | 27,521 | N/A | |||||
Shares of beneficial interest outstanding (unlimited number of shares, no par value common stock authorized) | 2,602 | N/A | ||||||
Maximum offering price per share ((NAV/0.9450), based on maximum sales charge of 5.50% of the offering price) | $ | 11.20 | N/A | |||||
Class I: | ||||||||
Net Asset Value, offering and redemption price per share | $ | 10.65 | $ | 11.12 | ||||
Net Assets | $ | 4,012,811 | $ | 588,339,570 | ||||
Shares of beneficial interest outstanding (unlimited number of shares, no par value common stock authorized) | 376,670 | 52,909,981 | ||||||
| (a) | Redemption price per share may be reduced for any applicable contingent deferred sales charge. For a description of a possible sales charge, please see the Fund’s Prospectus. |
| See Notes to Financial Statements. | ||
34 | www.redmontfunds.com | |
| Redmont Funds | Statements of Operations | |
| For the Six Months Ended October 31, 2013 (Unaudited) |
REDMONT RESOLUTE FUND I | REDMONT RESOLUTE FUND II | |||||||
|
| |||||||
INVESTMENT INCOME | ||||||||
Dividends | $ | 9,273 | $ | 1,433,702 | ||||
Foreign taxes withheld | (7) | (1,111) | ||||||
| ||||||||
Total investment income | 9,266 | 1,432,591 | ||||||
| ||||||||
EXPENSES | ||||||||
Investment advisory fees | 26,014 | 3,958,420 | ||||||
Interest on short sales | 366 | 58,275 | ||||||
Administration fees | 3,989 | 132,062 | ||||||
Transfer agency fees | 20,733 | 19,611 | ||||||
Distribution and service fees | ||||||||
Class A | 46 | N/A | ||||||
Legal fees | 165 | 20,209 | ||||||
Audit fees | 7,401 | 9,487 | ||||||
Custody fees | 3,370 | 27,473 | ||||||
Reports to shareholders and printing fees | 286 | 16,359 | ||||||
Trustee fees and expenses | 72 | 11,705 | ||||||
Registration/filing fees | 14,209 | 11,617 | ||||||
Chief compliance officer fees | 151 | 22,746 | ||||||
Principal financial officer fees | 23 | 5,308 | ||||||
Dividend expense on securities sold short | 1,032 | 162,449 | ||||||
Other | 1,940 | 7,031 | ||||||
| ||||||||
Total expenses before waivers | 79,797 | 4,462,752 | ||||||
Less fees waived/reimbursed by investment adviser | ||||||||
Class A | (206) | N/A | ||||||
Class I | (46,970) | (3,752,093) | ||||||
| ||||||||
Total net expenses | 32,621 | 710,659 | ||||||
| ||||||||
NET INVESTMENT INCOME/(LOSS) | (23,355) | 721,932 | ||||||
| ||||||||
Net realized gain on investments | 47,927 | 4,357,043 | ||||||
Net realized loss on securities sold short | (6,193) | (955,975) | ||||||
Net realized loss on written options | – | (486) | ||||||
Net realized loss on total return swap contracts | (2,882) | (477,529) | ||||||
Net change in unrealized appreciation on investments | 8,229 | 2,697,770 | ||||||
Net change in unrealized depreciation on securities sold short | (10,422) | (1,660,895) | ||||||
Net change in unrealized depreciation on written options | – | (22,882) | ||||||
Net change in unrealized depreciation on total return swap contracts | (4,459) | (738,673) | ||||||
| ||||||||
NET REALIZED AND UNREALIZED GAIN ON INVESTMENTS | 32,200 | 3,198,373 | ||||||
| ||||||||
NET INCREASE IN NET ASSETS RESULTING FROM OPERATIONS | $ | 8,845 | $ | 3,920,305 | ||||
| ||||||||
See Notes to Financial Statements.
| Semi-Annual Report | October 31, 2013 | 35 |
| Redmont Funds | Statements of Changes in Net Assets | |
| REDMONT RESOLUTE FUND I | ||||||||
|
| |||||||
|
| Six Months Ended October 31, 2013 (Unaudited) |
|
| For the Year Ended April 30, 2013 |
| |||
|
|
|
| |||||
OPERATIONS | ||||||||
Net investment loss | $ | (23,355) | $ | (4,460) | ||||
Net realized gain/(loss) on investments, securities sold short and total return swap contracts | 38,852 | (10,443) | ||||||
Long-term capital gain distributions from other investment companies | – | 11,634 | ||||||
Net change in unrealized appreciation/(depreciation) on investments, securities sold short and total return swap contracts | (6,652) | 163,454 | ||||||
| ||||||||
Net increase in net assets resulting from operations | 8,845 | 160,185 | ||||||
| ||||||||
DISTRIBUTIONS | ||||||||
Net investment income | ||||||||
Class A | – | (275) | ||||||
Class I | – | (7,274) | ||||||
Net realized gains on investments | ||||||||
Class A | – | (5) | ||||||
Class I | – | (98) | ||||||
| ||||||||
Net decrease in net assets from distributions | – | (7,652) | ||||||
| ||||||||
BENEFICIAL INTEREST TRANSACTIONS (NOTE 6) | ||||||||
Shares sold | ||||||||
Class A | 6,035 | 142,500 | ||||||
Class I | 918,125 | 2,373,333 | ||||||
Dividends reinvested | ||||||||
Class A | – | 280 | ||||||
Class I | – | 7,372 | ||||||
Shares redeemed, net of redemption fees | ||||||||
Class A | – | (127,534) | ||||||
Class I | (109,067) | (284,445) | ||||||
| ||||||||
Net increase in net assets derived from beneficial interest transactions | 815,093 | 2,111,506 | ||||||
| ||||||||
Net increase in Net Assets | 823,938 | 2,264,039 | ||||||
NET ASSETS: | ||||||||
Beginning of period | 3,216,394 | 952,355 | ||||||
| ||||||||
End of period* | $ | 4,040,332 | $ | 3,216,394 | ||||
| ||||||||
* Includes accumulated net investment loss of: | $ | (35,466) | $ | (12,111) | ||||
See Notes to Financial Statements.
36 | www.redmontfunds.com |
| Redmont Funds | Statements of Changes in Net Assets | |
| REDMONT RESOLUTE FUND II | ||||||||
|
| |||||||
|
| Six Months Ended October 31, 2013 (Unaudited) |
|
| For the Year Ended April 30, 2013 |
| |||
|
|
|
| |||||
OPERATIONS | ||||||||
Net investment income | $ | 721,932 | $ | 2,831,911 | ||||
Net realized gain/(loss) on investments, securities sold short, written options and total return swap contracts | 2,923,053 | (986,160) | ||||||
Long-term capital gain distributions from other investment companies | – | 1,545,786 | ||||||
Net change in unrealized appreciation on investments, securities sold short, written options and total return swap contracts | 275,320 | 21,817,523 | ||||||
| ||||||||
Net increase in net assets resulting from operations | 3,920,305 | 25,209,060 | ||||||
| ||||||||
DISTRIBUTIONS | ||||||||
Net investment income | ||||||||
Class I | – | (2,358,905) | ||||||
| ||||||||
Net decrease in net assets from distributions | – | (2,358,905) | ||||||
| ||||||||
BENEFICIAL INTEREST TRANSACTIONS (NOTE 6) | ||||||||
Shares sold | ||||||||
Class I | 146,100,010 | 347,412,602 | ||||||
Dividends reinvested | ||||||||
Class I | – | 2,358,905 | ||||||
Shares redeemed, net of redemption fees | ||||||||
Class I | (8,000,000) | (4,800,000) | ||||||
| ||||||||
Net increase in net assets derived from beneficial interest transactions | 138,100,010 | 344,971,507 | ||||||
| ||||||||
Net increase in Net Assets | 142,020,315 | 367,821,662 | ||||||
NET ASSETS: | ||||||||
Beginning of period | 446,319,255 | 78,497,593 | ||||||
| ||||||||
End of period* | $ | 588,339,570 | $ | 446,319,255 | ||||
| ||||||||
* Includes accumulated net investment income of: | $ | 1,188,490 | $ | 466,558 | ||||
See Notes to Financial Statements.
| Semi-Annual Report | October 31, 2013 | 37 |
| Redmont Resolute Fund I | Financial Highlights | |
| For a share outstanding throughout the periods presented |
| CLASS A | ||||||||||||
| ||||||||||||
|
| For the Six Months Ended October 31, 2013 (Unaudited) |
|
| For the Year Ended April 30, 2013 |
|
| For the Period Ended April 30, 2012 (a) |
| ||||
NET ASSET VALUE, BEGINNING OF PERIOD | $ | 10.63 | $ | 10.17 | $ | 10.00 | ||||||
INCOME/(LOSS) FROM OPERATIONS | ||||||||||||
Net investment loss(b) | (0.09) | (0.04) | (0.07) | |||||||||
Net realized and unrealized gain on investments | 0.04 | 0.52 | 0.24 | |||||||||
|
|
|
|
|
| |||||||
Total from Investment Operations | (0.05) | 0.48 | 0.17 | |||||||||
|
|
|
|
|
| |||||||
LESS DISTRIBUTIONS | ||||||||||||
Net investment income | – | (0.03) | – | |||||||||
Net realized gain on investments | – | (0.00)(c) | – | |||||||||
|
|
|
|
|
| |||||||
Total Distributions | – | (0.03) | – | |||||||||
|
|
|
|
|
| |||||||
REDEMPTION FEES ADDED TO PAID IN CAPITAL | – | 0.01 | – | |||||||||
|
|
|
|
|
| |||||||
NET INCREASE/(DECREASE) IN NET ASSET VALUE | (0.05) | 0.46 | 0.17 | |||||||||
|
|
|
|
|
| |||||||
NET ASSET VALUE, END OF PERIOD | $ | 10 .58 | $ | 10 .63 | $ | 10 .17 | ||||||
|
|
|
|
|
| |||||||
TOTAL RETURN(d) | (0.47) | % | 4.81 | % | 1.70 | % | ||||||
RATIOS/SUPPLEMENTAL DATA | ||||||||||||
Net assets, End of Period (000s) | $ | 28 | $ | 21 | $ | 1 | ||||||
RATIOS TO AVERAGE NET ASSETS: | ||||||||||||
Operating expenses excluding reimbursement/waiver(e) | 4.07%(f) | (g) | 6.47 | % | 689.76% | (f) | ||||||
Operating expenses including reimbursement/waiver(e) | 2.27%(f)(g) | (h) | 2.30 | % | 2.30% | (f) | ||||||
Net investment loss including reimbursement/waiver(e) | (1.74)% | (f) | (0.38) | % | (2.21)% | (f) | ||||||
PORTFOLIO TURNOVER RATE | 59% | (i) | 25 | % | 13% | (i) | ||||||
| (a) | The Fund’s inception was December 30, 2011. |
| (b) | Calculated using the average shares method. |
| (c) | Less than $0.005 per share. |
| (d) | Total investment return is calculated assuming a purchase of a common share at the opening of the first day and a sale at closing on the last day of each period reported. Dividends and distributions, if any, are assumed for purposes of this calculation to be reinvested at prices obtained under the Fund’s dividend reinvestment plan. Total returns would have been lower had certain expenses not been waived during the period. Total investment returns do not reflect brokerage commissions, if any, and are not annualized. |
| (e) | The ratios exclude the impact of expenses of the underlying funds in which the Fund invests as represented in the Schedule of Investments. |
| (f) | Annualized. |
| (g) | Dividend and interest expense on securities sold short totaled 0.08% of average net assets for the six months ended October 31, 2013. |
| (h) | Contractual expense limitation changed from 1.90% to 1.40% effective September 1, 2013. |
| (i) | Not Annualized. |
See Notes to Financial Statements.
38 | www.redmontfunds.com |
| Redmont Resolute Fund I | Financial Highlights | |
| For a share outstanding throughout the periods presented |
| CLASS I | ||||||||||||
| ||||||||||||
|
| For the Six Months Ended October 31, 2013 (Unaudited) |
|
| For the Year Ended April 30, 2013 |
|
| For the Period Ended April 30, 2012 (a) |
| ||||
NET ASSET VALUE, BEGINNING OF PERIOD | $ | 10.65 | $ | 10.18 | $ | 10.00 | ||||||
INCOME/(LOSS) FROM OPERATIONS | ||||||||||||
Net investment loss(b) | (0.07) | (0.02) | (0.06) | |||||||||
Net realized and unrealized gain on investments | 0.07 | 0.52 | 0.24 | |||||||||
|
|
|
|
|
| |||||||
Total from Investment Operations | 0.00 | 0.50 | 0.18 | |||||||||
|
|
|
|
|
| |||||||
LESS DISTRIBUTIONS | ||||||||||||
Net investment income | – | (0.03) | – | |||||||||
Net realized gain on investments | – | (0.00)(c) | – | |||||||||
|
|
|
|
|
| |||||||
Total Distributions | – | (0.03) | – | |||||||||
|
|
|
|
|
| |||||||
NET INCREASE IN NET ASSET VALUE | 0.00 | 0.47 | 0.18 | |||||||||
|
|
|
|
|
| |||||||
NET ASSET VALUE, END OF PERIOD | $ | 10 .65 | $ | 10 .65 | $ | 10 .18 | ||||||
|
|
|
|
|
| |||||||
TOTAL RETURN(d) | 0.00 | % | 4.96 | % | 1.80 | % | ||||||
RATIOS/SUPPLEMENTAL DATA | ||||||||||||
Net assets, End of Period (000s) | $ | 4,013 | $ | 3,195 | $ | 951 | ||||||
RATIOS TO AVERAGE NET ASSETS: | ||||||||||||
Operating expenses excluding reimbursement/waiver(e) | 4.60%(f) | (g) | 5.87 | % | 19.86% | (f) | ||||||
Operating expenses including reimbursement/waiver(e) | 1.88%(f)(g) | (h) | 1.90 | % | 1.90% | (f) | ||||||
Net investment loss including reimbursement/waiver(e) | (1.34)% | (f) | (0.23) | % | (1.78)% | (f) | ||||||
PORTFOLIO TURNOVER RATE | 59% | (i) | 25 | % | 13% | (i) | ||||||
| (a) | The Fund’s inception was December 30, 2011. |
| (b) | Calculated using the average shares method. |
| (c) | Less than $0.005 per share. |
| (d) | Total investment return is calculated assuming a purchase of a common share at the opening of the first day and a sale at closing on the last day of each period reported. Dividends and distributions, if any, are assumed for purposes of this calculation to be reinvested at prices obtained under the Fund’s dividend reinvestment plan. Total returns would have been lower had certain expenses not been waived during the period. Total investment returns do not reflect brokerage commissions, if any, and are not annualized. |
| (e) | The ratios exclude the impact of expenses of the underlying funds in which the Fund invests as represented in the Schedule of Investments. |
| (f) | Annualized. |
| (g) | Dividend and interest expense on securities sold short totaled 0.08% of average net assets for the six months ended October 31, 2013. |
| (h) | Contractual expense limitation changed from 1.90% to 1.40% effective September 1, 2013. |
| (i) | Not Annualized. |
See Notes to Financial Statements.
| Semi-Annual Report | October 31, 2013 | 39 |
| Redmont Resolute Fund II | Financial Highlights | |
| For a share outstanding throughout the periods presented |
| CLASS I | ||||||||||||
| ||||||||||||
|
| For the Six Months Ended October 31, 2013 (Unaudited) |
|
| For the Year Ended April 30, 2013 |
|
| For the Period Ended April 30, 2012 (a) |
| ||||
NET ASSET VALUE, BEGINNING OF PERIOD | $ | 11.05 | $ | 10.34 | $ | 10.00 | ||||||
INCOME/(LOSS) FROM OPERATIONS | ||||||||||||
Net investment income/(loss)(b) | 0.02 | 0.11 | (0.03) | |||||||||
Net realized and unrealized gain on investments | 0.05 | 0.68 | 0.37 | |||||||||
|
|
|
|
|
| |||||||
Total from Investment Operations | 0.07 | 0.79 | 0.34 | |||||||||
|
|
|
|
|
| |||||||
LESS DISTRIBUTIONS | ||||||||||||
Net investment income | – | (0.08) | – | |||||||||
|
|
|
|
|
| |||||||
Total Distributions | – | (0.08) | – | |||||||||
|
|
|
|
|
| |||||||
NET INCREASE IN NET ASSET VALUE | 0.07 | 0.71 | 0.34 | |||||||||
|
|
|
|
|
| |||||||
NET ASSET VALUE, END OF PERIOD | $ | 11.12 | $ | 11.05 | $ | 10.34 | ||||||
|
|
|
|
|
| |||||||
TOTAL RETURN(c) | 0.63 | % | 7.65 | % | 3.40 | % | ||||||
RATIOS/SUPPLEMENTAL DATA | ||||||||||||
Net assets, End of Period (000s) | $ | 588,340 | $ | 446,319 | $ | 78,498 | ||||||
RATIOS TO AVERAGE NET ASSETS: | ||||||||||||
Operating expenses excluding reimbursement/waiver(d) | 1.69%(e) | (f) | 1.32 | % | 1.63% | (e) | ||||||
Operating expenses including reimbursement/waiver(d) | 0.27%(e) | (f) | 0.22 | % | 1.13% | (e) | ||||||
Net investment income/(loss) including reimbursement/waiver(d) | 0.27% | (e) | 1.08 | % | (0.97)% | (e) | ||||||
PORTFOLIO TURNOVER RATE | 60% | (g) | 51 | % | 18% | (g) | ||||||
| (a) | The Fund’s inception was December 30, 2011. |
| (b) | Calculated using the average shares method. |
| (c) | Total investment return is calculated assuming a purchase of a common share at the opening of the first day and a sale at closing on the last day of each period reported. Dividends and distributions, if any, are assumed for purposes of this calculation to be reinvested at prices obtained under the Fund’s dividend reinvestment plan. Total returns would have been lower had certain expenses not been waived during the period. Total investment returns do not reflect brokerage commissions, if any, and are not annualized. |
| (d) | The ratios exclude the impact of expenses of the underlying funds in which the Fund invests as represented in the Schedule of Investments. |
| (e) | Annualized. |
| (f) | Dividend and interest expense on securities sold short totaled 0.08% of average net assets for the six months ended October 31, 2013. |
| (g) | Not Annualized. |
See Notes to Financial Statements.
40 | www.redmontfunds.com |
| Redmont Funds | Notes to Financial Statements | |
| October 31, 2013 (Unaudited) |
1. ORGANIZATION
Financial Investors Trust (the “Trust”), a Delaware statutory trust, is an open-end management investment company registered under the Investment Company Act of 1940, as amended (“1940 Act”). As of October 31, 2013, the Trust has 27 registered funds. This semi-annual report describes the Redmont Resolute Fund I and Redmont Resolute Fund II (each a “Fund” and collectively, the “Funds”). The Funds seek to provide long-term total return with reduced volatility and reduced correlation to the conventional stock and bond markets. The Funds pursue their objectives primarily by allocating their assets among (i) investment sub-advisers (the “Sub-Advisers”) who manage alternative or hedging investment strategies, (ii) other open-end investment companies registered under the Investment Company Act of 1940, as amended (the “1940 Act”) that use alternative or hedging strategies, and (iii) derivatives, principally total return swaps on reference pools of securities which may be managed by unaffiliated parties, for the purposes of seeking economic exposure to alternative or hedging strategies. The Redmont Resolute Fund I offers Class A and Class I shares and the Redmont Resolute Fund II offers Class I shares. All classes of shares of a particular Fund have identical rights to earnings, assets and voting privileges, except for class specific expenses and exclusive rights to vote on matters affecting only individual classes.
2. SIGNIFICANT ACCOUNTING POLICIES
The accompanying financial statements were prepared in accordance with accounting principles generally accepted in the United States of America (“U.S. GAAP”). The preparation of financial statements in conformity with U.S. GAAP requires management to make certain estimates and assumptions that affect the reported amounts of assets and liabilities and disclosures of contingent assets and liabilities at the date of the financial statements and the reported amounts of revenue and expenses during the period. Actual results could differ from those estimates. The following is a summary of significant accounting policies consistently followed by the Funds in preparation of their financial statements.
Investment Valuation: The Funds generally value their securities based on market prices determined at the close of regular trading on the New York Stock Exchange (“NYSE”), normally 4:00 p.m. Eastern Time, on each day the NYSE is open for trading.
For equity securities and mutual funds that are traded on an exchange, the market price is usually the closing sale or official closing price on that exchange. In the case of equity securities not traded on an exchange, or if such closing prices are not otherwise available, the securities are valued at the mean of the most recent bid and ask prices on such day. Redeemable securities issued by open-end registered investment companies are valued at the investment company’s applicable net asset value, with the exception of exchange-traded open-end investment companies, which are priced as equity securities.
The market price for debt obligations is generally the price supplied by an independent third-party pricing service approved by the Board of Trustees (the “Board”), which may use a matrix, formula or other objective method that takes into consideration quotations from dealers, market transactions in comparable investments, market indices and yield curves. If vendors are unable to supply a price, or if the price supplied is deemed to be unreliable, the market price may be determined using quotations received from one or more brokers–dealers that make a market in the security. Short–term debt obligations that will mature in 60 days or less are valued at amortized cost, unless it is determined that using this method would not reflect an investment’s fair value.
When such prices or quotations are not available, or when the Fair Value Committee appointed by the Board believes that they are unreliable, securities may be priced using fair value procedures approved by the Board.
Fair Value Measurements: The Funds disclose the classification of their fair value measurements following a three-tier hierarchy based on the inputs used to measure fair value. Inputs refer broadly to the assumptions that market participants would use in pricing the asset or liability, including assumptions about risk. Inputs may be observable or unobservable. Observable inputs reflect the assumptions market participants would use in pricing the asset or liability that are developed based on market data obtained from sources independent of the reporting entity. Unobservable inputs reflect the reporting entity’s own assumptions about the assumptions market participants would use in pricing the asset or liability that are developed based on the best information available.
Various inputs are used in determining the value of the Funds’ investments as of the end of the reporting period. When inputs used fall into different levels of the fair value hierarchy, the level in the hierarchy within which the fair value measurement falls is determined based on the lowest level input that is significant to the fair value measurement in its entirety. The designated input levels are not necessarily an indication of the risk or liquidity associated with these investments. These inputs are categorized in the following hierarchy under applicable financial accounting standards:
| Level 1 | – | Unadjusted quoted prices in active markets for identical investments, unrestricted assets or liabilities that the Funds have the ability to access at the measurement date; |
| Semi-Annual Report | October 31, 2013 | 41 |
| Redmont Funds | Notes to Financial Statements | |
| October 31, 2013 (Unaudited) |
| Level 2 | – | Quoted prices which are not active, quoted prices for similar assets or liabilities in active markets or inputs other than quoted prices that are observable (either directly or indirectly) for substantially the full term of the asset or liability; and | |||
Level 3 | – | Significant unobservable prices or inputs (including the Funds’ own assumptions in determining the fair value of investments) where there is little or no market activity for the asset or liability at the measurement date. | ||||
The following is a summary of the inputs used to value the Funds’ investments as of October 31, 2013:
Redmont Resolute Fund I | ||||||||||||||||
| Investments in Securities at Value | Level 1 - Quoted Prices | Level 2 - Other Significant Observable Inputs | Level 3 - Significant Unobservable Inputs | Total | ||||||||||||
| ||||||||||||||||
Common Stocks | $ | 312,537 | $ | – | $ | – | $ | 312,537 | ||||||||
Open-End Mutual Funds | 2,996,770 | – | – | 2,996,770 | ||||||||||||
Short Term Investments | 29,272 | – | – | 29,272 | ||||||||||||
| ||||||||||||||||
Total | $ | 3,338,579 | $ | – | $ | – | $ | 3,338,579 | ||||||||
| ||||||||||||||||
Other Financial Instruments | ||||||||||||||||
| ||||||||||||||||
Liabilities: | ||||||||||||||||
Securities Sold Short | $ | (155,292) | $ | – | $ | – | $ | (155,292) | ||||||||
Total Return Swap Contracts | – | (4,459) | – | (4,459) | ||||||||||||
| ||||||||||||||||
Total | $ | (155,292) | $ | (4,459) | $ | – | $ | (159,751) | ||||||||
| ||||||||||||||||
Redmont Resolute Fund II | ||||||||||||||||
| Investments in Securities at Value | Level 1 - Quoted Prices | Level 2 - Other Significant Observable Inputs | Level 3 - Significant Unobservable Inputs | Total | ||||||||||||
| ||||||||||||||||
Common Stocks | $ | 50,932,970 | $ | – | $ | – | $ | 50,932,970 | ||||||||
Open-End Mutual Funds | 418,506,774 | – | – | 418,506,774 | ||||||||||||
Short Term Investments | 7,585,416 | – | – | 7,585,416 | ||||||||||||
| ||||||||||||||||
Total | $ | 477,025,160 | $ | – | $ | – | $ | 477,025,160 | ||||||||
| ||||||||||||||||
Other Financial Instruments | ||||||||||||||||
| ||||||||||||||||
Liabilities: | ||||||||||||||||
Securities Sold Short | $ | (25,261,219) | $ | – | $ | – | $ | (25,261,219) | ||||||||
Total Return Swap Contracts | – | (738,673) | – | (738,673) | ||||||||||||
Written Options | (89,088) | – | – | (89,088) | ||||||||||||
| ||||||||||||||||
Total | $ | (25,350,307) | $ | (738,673) | $ | – | $ | (26,088,980) | ||||||||
| ||||||||||||||||
The Funds recognize transfers between levels as of the end of the period. For the six months ended October 31, 2013, the Funds did not have any transfers between Level 1 and Level 2 securities. There were no Level 3 securities held during the period.
Trust Expenses: Some expenses of the Trust can be directly attributed to the Funds. Expenses which cannot be directly attributed to the Funds are apportioned among all funds in the Trust based on average net assets of each fund.
Fund and Class Expenses: Expenses that are specific to a Fund or class of shares of a Fund are charged directly to that Fund or share class. Expenses that are common to all Funds generally are allocated among the Funds in proportion to their average daily net assets. Fees provided under the distribution (Rule 12b-1) and/or shareholder service plans for a particular class of the Fund are charged to the operations of such class.
Federal Income Taxes: The Funds comply with the requirements under Subchapter M of the Internal Revenue Code of 1986, as amended, applicable to regulated investment companies and intend to distribute substantially all of their net taxable income and net capital gains, if any, each year so that the Funds will not be subject to excise tax on undistributed income and gains. The Funds are not subject to income taxes to the extent such distributions are made.
42 | www.redmontfunds.com |
| Redmont Funds | Notes to Financial Statements | |
| October 31, 2013 (Unaudited) |
As of and during the six months ended October 31, 2013, the Funds did not have a liability for any unrecognized tax benefits. The Funds file U.S. federal, state, and local tax returns as required. The Funds’ tax returns are subject to examination by the relevant tax authorities until expiration of the applicable statute of limitations, which is generally three years after the filing of the tax return for federal purposes and four years for most state returns. Tax returns for open years have incorporated no uncertain tax positions that require a provision for income taxes.
Investment Transactions and Investment Income: Investment transactions are accounted for on the date the investments are purchased or sold (trade date basis). Net realized gains and losses from investment transactions are reported on an identified cost basis. Interest income, which includes accretion of discounts and amortization of premiums, is accrued and recorded as earned. Dividend income is recognized on the ex-dividend date or for certain foreign securities, as soon as information is available to the Funds. All of the realized and unrealized gains and losses and net investment income, are allocated daily to each class in proportion its average daily net assets.
Principal Investment Strategies of each Fund: The Funds pursue their objective primarily by allocating their assets among (i) investment sub-advisers (the “Sub-Advisers”) who manage alternative or hedging investment strategies, and (ii) other open-end investment companies registered under the Investment Company Act of 1940, as amended (the “1940 Act”) that use alternative or hedging strategies, and (iii) derivatives, principally total return swaps on reference pools of securities which may be managed by unaffiliated parties, for the purposes of seeking economic exposure to alternative or hedging strategies. The Funds may also invest in closed-end funds, exchange-traded funds and exchange-traded notes, which provide exposure to hedging or alternative strategies. Collectively, the open-end funds, closed-end funds and exchange-traded funds in which the Funds may invest are referred to as “Underlying Funds.”
Hedging strategies used by the Sub-Advisers and the Underlying Funds may include, among other techniques, the use of short selling, options, futures, derivatives or similar instruments. Alternative investment strategies may include, among others, long/short, market neutral and arbitrage strategies; commodities or commodity-linked investments; leverage; derivatives; distressed securities; and other investment techniques that are expected to achieve the Funds’ investment objective.
Short Sales: Each Fund may make short sales of securities consistent with its strategies. A short sale is a transaction in which a Fund sells a security it does not own in anticipation that the market price of that security will decline.
When a Fund makes a short sale, it must borrow the security sold short and deliver it to the broker dealer through which it made the short sale as collateral for its obligation to deliver the security upon conclusion of the sale. The Fund may have to pay a fee to borrow particular securities and is often obligated to pay over any accrued interest and dividends on such borrowed securities.
If the price of the security sold short increases between the time of the short sale and the time that a Fund replaces the borrowed security, the Fund will incur a loss; conversely, if the price declines, the Fund will realize a capital gain. Any gain will be decreased, and any loss increased, by the transaction costs described above. The successful use of short selling may be adversely affected by imperfect correlation between movements in the price of the security sold short and the securities being hedged.
To the extent that a Fund engages in short sales, it will provide collateral to the broker-dealer and (except in the case of short sales “against the box”) will maintain additional asset coverage in the form of segregated or “earmarked” assets determined to be liquid in accordance with procedures established by the Board and that is equal to the current market value of the securities sold short, or will ensure that such positions are covered by “offsetting” positions, until the Fund replaces the borrowed security. A short sale is “against the box” to the extent that the Fund contemporaneously owns, or has the right to obtain at no added cost, securities identical to those sold short. Each Fund may engage in short selling to the extent permitted by the federal securities laws and rules and interpretations thereunder. To the extent a Fund engages in short selling in foreign (non-U.S.) jurisdictions, the Fund will do so to the extent permitted by the laws and regulations of such jurisdiction.
Distributions to Shareholders: Each Fund normally pays dividends and distributes capital gains, if any, on an annual basis. Income dividend distributions are derived from interest and other income each Fund receives from their investments, including distributions of short term capital gains. Capital gain distributions are derived from gains realized when each Fund sells a security it has owned for more than a year. Each Fund may make additional distributions and dividends at other times if its portfolio manager or managers believe doing so may be necessary for each Fund to avoid or reduce taxes.
3. DERIVATIVE INSTRUMENTS
Swap Contracts: Each Fund may enter into swap transactions for hedging purposes or to seek to increase total return. At the present time, the Fund primarily enters into swap transactions for the purpose of increasing total return. Risks may arise as a result of the failure of the counterparty to the swap contract to comply with the terms of the swap contract. The loss incurred by the failure of a counterparty is generally limited to the net payment to be received by the Funds and/or the termination value at the end of the contract.
| Semi-Annual Report | October 31, 2013 | 43 |
| Redmont Funds | Notes to Financial Statements | |
| October 31, 2013 (Unaudited) |
Therefore, the Fund considers the creditworthiness of each counterparty to a contract in evaluating potential credit risk. Additionally, risks may arise from unanticipated movements in interest rates or in the value of the underlying reference asset or index. Entering into these agreements involves, to varying degrees, market risk, liquidity risk and elements of credit, legal and documentation risk that are not directly reflected in the amounts recognized in the Statements of Assets and Liabilities.
Each Fund may pay or receive cash as collateral on these contracts which may be recorded as an asset and/or liability. The Fund must set aside liquid assets, or engage in other appropriate measures, to cover its obligations under these contracts. Swaps are marked to market daily using either pricing vendor quotations, counterparty prices or model prices and the change in value, if any, is recorded as an unrealized gain or loss. Upfront payments made and/or received by the Fund are recorded as an asset and/or liability and realized gains or losses are recognized ratably over the contract’s term/event, with the exception of forward starting interest rate swaps, whose realized gains or losses are recognized ratably from the effective start date. Periodic payments received or made on swap contracts are recorded as realized gains or losses. Gains or losses are realized upon termination of a swap contract and are recorded on the Statements of Operations.
Each Fund invests in total return swaps to obtain exposure to a security or market without owning such security or investing directly in that market or to transfer the risk/return of one market (e.g., fixed income) to another market (e.g., equity) (equity risk and/or interest rate risk). Total return swaps are agreements in which there is an exchange of cash flows whereby one party commits to make payments based on the total return (coupons plus capital gains/losses) of an underlying instrument in exchange for fixed or floating rate interest payments. To the extent the total return of the instrument or index underlying the transaction exceeds or falls short of the offsetting interest rate obligation, the Fund will receive a payment from or make a payment to the counterparty. Swap agreements held at October 31, 2013 are disclosed in the Schedule of Investments.
International Swaps and Derivatives Association, Inc. Master Agreements (“ISDA Master Agreements”) govern OTC financial derivative transactions entered into by a Fund and those counterparties. The ISDA Master Agreements maintain provisions for general obligations, representations, agreements, collateral and events of default or termination. Events of termination include conditions that may entitle counterparties to elect to terminate early and cause settlement of all outstanding transactions under the applicable ISDA Master Agreement. Any election to early terminate could be material to the financial statements.
Option Contracts: Each Fund may enter into options transactions for hedging purposes and for non-hedging purposes such as seeking to enhance return. Each Fund may write covered put and call options on any stocks or stock indices, currencies traded on domestic and foreign securities exchanges, or futures contracts on stock indices, interest rates and currencies traded on domestic and, to the extent permitted by the CFTC, foreign exchanges. A call option on an asset written by a Fund obligates the Fund to sell the specified asset to the holder (purchaser) at a stated price (the exercise price) if the option is exercised before a specified date (the expiration date). A put option on an asset written by a Fund obligates the Fund to buy the specified asset from the purchaser at the exercise price if the option is exercised before the expiration date. Premiums received when writing options are recorded as liabilities and are subsequently adjusted to the current value of the options written. Premiums received from writing options that expire are treated as realized gains. Premiums received from writing options, which are either exercised or closed, are offset against the proceeds received or amount paid on the transaction to determine realized gains or losses which are recorded on the Statement of Operations.
Written option activity for the six months ended October 31, 2013 was as follows:
Redmont Resolute Fund II | ||||||||||||
|
| |||||||||||
| Written Call Options | Written Put Options | |||||||||||
| ||||||||||||
| Contracts | Premiums | Contracts | Premiums | |||||||||
| ||||||||||||
Outstanding, April 30, 2013 | – | $ | – | – | $ – | |||||||
Written | (118) | (68,741) | – | – | ||||||||
Exercised | – | – | – | – | ||||||||
Expired | – | – | – | – | ||||||||
Closed | 5 | 2,535 | – | – | ||||||||
| ||||||||||||
Outstanding, October 31, 2013 | (113) | $ | (66,206) | – | $ – | |||||||
| ||||||||||||
Market Value, October 31, 2013 | $ | 89,088 | $ – | |||||||||
| ||||||||||||
Risk Exposure: The following tables disclose the amounts related to each Fund’s use of derivative instruments.
The effect of derivatives instruments on the Statements of Assets and Liabilities as of October 31, 2013:
| Risk Exposure | Liability Derivatives Statements of Assets and Liabilities Location | Fair Value | ||||
| ||||||
| Redmont Resolute Fund I | ||||||
Equity Contracts | Unrealized depreciation on total return swap contracts | $ | 4,459 | |||
| ||||||
| Total | $ | 4,459 | ||||
| ||||||
44 | www.redmontfunds.com |
| Redmont Funds | Notes to Financial Statements | |
| October 31, 2013 (Unaudited) |
| Risk Exposure | Liability Derivatives Statements of Assets and Liabilities Location | Fair Value | ||||
| ||||||
| Redmont Resolute Fund II | ||||||
Equity Contracts | Unrealized depreciation on total return swap contracts | $ | 738,673 | |||
Equity Contracts (Written Options) | Written options, at value | 89,088 | ||||
| ||||||
Total | $ | 827,761 | ||||
| ||||||
The effect of derivatives instruments on the Statements of Operations for the six months ended October 31, 2013:
| Risk Exposure | Statement of Operations Location | Realized Gain/(Loss) on Derivatives Recognized in Income | Change in Unrealized Appreciation/(Depreciation) on Derivatives Recognized in Income | |||||||
| ||||||||||
Redmont Resolute Fund I | ||||||||||
Equity Contracts | Net realized loss on total return swap contracts/Net change in unrealized depreciation on total return swap contracts | $ | (2,882) | $ | (4,459) | |||||
| ||||||||||
Total | $ | (2,882) | $ | (4,459) | ||||||
| ||||||||||
Redmont Resolute Fund II | ||||||||||
Equity Contracts | Net realized loss on total return swap contracts/Net change in unrealized depreciation on total return swap contracts | $ | (477,529) | $ | (738,673) | |||||
Equity Contracts (Written Options) | Net realized loss on written options/Net change in unrealized depreciation on written options | (486) | (22,882) | |||||||
| ||||||||||
Total | $ | (478,015) | $ | (761,555) | ||||||
| ||||||||||
Certain derivative contracts and repurchase agreements are executed under either standardized netting agreements or, for exchange-traded derivatives, the relevant contracts for a particular exchange which contain enforceable netting provisions. A derivative netting arrangement creates an enforceable right of set-off that becomes effective, and affects the realization of settlement on individual assets, liabilities and collateral amounts, only following a specified event of default or early termination. Default events may include the failure to make payments or deliver securities timely, material adverse changes in financial condition or insolvency, the breach of minimum regulatory capital requirements, or loss of license, charter or other legal authorization necessary to perform under the contract.
The following table presents financial instruments that are subject to enforceable netting arrangements or other similar agreements as of October 31, 2013:
Redmont Resolute Fund I
Offsetting of Derivatives Liabilities
October 31, 2013
| Gross Amounts Not Offset in the Statement of Financial Position | ||||||||||||
| ||||||||||||
| Description | Gross Amounts of Recognized Liabilities | Gross Amounts Offset in the Statement of Financial Position | Net Amounts Presented in the Statement of Financial Position | Financial Instruments | Cash Collateral Pledged | Net Amount | ||||||
| ||||||||||||
Total Return Swap Contracts | $4,459 | $– | $4,459 | $– | $(4,459) | $– | ||||||
| ||||||||||||
Total | $4,459 | $– | $4,459 | $– | $(4,459) | $– | ||||||
| ||||||||||||
| Semi-Annual Report | October 31, 2013 | 45 |
| Redmont Funds | Notes to Financial Statements | |
| October 31, 2013 (Unaudited) |
Redmont Resolute Fund II
Offsetting of Derivatives Liabilities
October 31, 2013
| Gross Amounts Not Offset in the Statement of Financial Position | ||||||||||||
| ||||||||||||
| Description | Gross Amounts of Recognized Liabilities | Gross Amounts Offset in the Statement of Financial Position | Net Amounts Presented in the Statement of Financial Position | Financial Instruments | Cash Collateral Pledged | Net Amount | ||||||
| ||||||||||||
Total Return Swap Contracts | $738,673 | $– | $738,673 | $– | $(738,673) | $– | ||||||
| ||||||||||||
Total | $738,673 | $– | $738,673 | $– | $(738,673) | $– | ||||||
| ||||||||||||
4. TAX BASIS INFORMATION
Tax Basis of Investments: As of October 31, 2013, the aggregate cost of investments, gross unrealized appreciation/(depreciation) and net unrealized appreciation for Federal tax purposes were as follows:
Gross Appreciation over tax cost) | Gross Depreciation cost over value) | Net Unrealized Appreciation | Cost of Investments for Income Tax Purposes | |||||||||||||
| ||||||||||||||||
Redmont Resolute Fund I | $ | 212,425 | $ | (36,310 | ) | $ | 176,115 | $ | 3,162,464 | |||||||
Redmont Resolute Fund II | 32,016,103 | (6,705,399 | ) | 25,310,704 | 451,714,456 | |||||||||||
Tax Basis of Distributions to Shareholders: The character of distributions made during the year from net investment income or net realized gains may differ from its ultimate characterization for federal income tax purposes. Also, due to the timing of dividend distributions, the fiscal year in which amounts are distributed may differ from the fiscal year in which the income or realized gain were recorded by the Funds.
The tax character of distributions paid by the Funds for the fiscal year ended April 30, 2013, were as follows:
| Ordinary Income | ||||
| ||||
Redmont Resolute Fund I | $ | 7,652 | ||
Redmont Resolute Fund II | 2,358,905 | |||
For the six months ended October 31, 2013, there were no distributions paid.
5. SECURITIES TRANSACTIONS
Purchases and sales of securities, excluding short-term securities during the six months ended October 31, 2013 were as follows:
| Fund | Purchases of Securities | Proceeds From Sales of Securities | ||||||
| ||||||||
Redmont Resolute Fund I | $ | 1,947,278 | $ | 1,908,840 | ||||
Redmont Resolute Fund II | 317,253,041 | 294,214,872 | ||||||
6. BENEFICIAL SHARE TRANSACTIONS
The capitalization of the Trust consists of an unlimited number of shares of beneficial interest with no par value per share. Holders of the shares of the Funds of the Trust have one vote for each share held and a proportionate fraction of a vote for each fractional share. All shares issued and outstanding are fully paid and are non-assessable, transferable and redeemable at the option of the shareholder. Shares have no pre-emptive rights.
46 | www.redmontfunds.com |
| Redmont Funds | Notes to Financial Statements | |
| October 31, 2013 (Unaudited) |
Transactions in common shares were as follows:
Redmont Resolute Fund I | ||||||||
| Class A: | For the Six Months Ended October 31, 2013 (Unaudited) | For the Year Ended April 30, 2013 | ||||||
| ||||||||
Common Shares Outstanding - Beginning of Period | 2,016 | 101 | ||||||
Common Shares Sold | 586 | 14,144 | ||||||
Common Shares Issued as Reinvestment of Dividends | – | 27 | ||||||
Common Shares Redeemed | – | (12,256 | ) | |||||
| ||||||||
Common Shares Outstanding - End of Period | 2,602 | 2,016 | ||||||
| ||||||||
| Class I: | For the Six Months Ended October 31, 2013 (Unaudited) | For the Year Ended April 30, 2013 | ||||||
| ||||||||
Common Shares Outstanding - Beginning of Period | 299,893 | 93,449 | ||||||
Common Shares Sold | 87,201 | 233,443 | ||||||
Common Shares Issued as Reinvestment of Dividends | – | 724 | ||||||
Common Shares Redeemed | (10,424 | ) | (27,723 | ) | ||||
| ||||||||
Common Shares Outstanding - End of Period | 376,670 | 299,893 | ||||||
| ||||||||
Redmont Resolute Fund II | ||||||||
| Class I: | For the Six Months Ended October 31, 2013 (Unaudited) | For the Year Ended April 30, 2013 | ||||||
| ||||||||
Common Shares Outstanding - Beginning of Period | 40,383,121 | 7,591,661 | ||||||
Common Shares Sold | 13,268,939 | 33,012,452 | ||||||
Common Shares Issued as Reinvestment of Dividends | – | 225,485 | ||||||
Common Shares Redeemed | (742,079 | ) | (446,477 | ) | ||||
| ||||||||
Common Shares Outstanding - End of Period | 52,909,981 | 40,383,121 | ||||||
| ||||||||
Shares redeemed within 30 days of purchase may incur a 2% short-term redemption fee deducted from the redemption amount. Redemption fees are reflected in the “Shares redeemed, net of redemption fees” in the Statements of Changes in Net Assets. For the six months ended October 31, 2013 and the year ended April 30, 2013, the Funds retained fees as follows:
| Fund | For the six months ended October 31, 2013 (Unaudited) | For the year ended April 30, 2013 | ||
| ||||
Redmont Resolute Fund I | $ — | $51 | ||
Redmont Resolute Fund II | — | — | ||
7. MANAGEMENT AND RELATED PARTY TRANSACTIONS
Investment Advisory
Highland Associates, Inc. (“Highland” or the Adviser”), subject to the authority of the Board, is responsible for the overall management and administration of the Funds’ business affairs. Pursuant to the Investment Advisory Agreement (the “Advisory Agreement”), the Adviser is entitled to an investment advisory fee, computed daily and payable monthly of 1.50% of the average daily net assets for each Fund. Prior to December 5, 2012, the Adviser was entitled to an investment advisory fee, computed daily and payable monthly of 0.50% of the average daily net assets for each Fund.
As of April 1, 2013 the Adviser adopted an Investment Sub-Advisory Agreement (the “Sub-Advisory Agreement”) with Robeco Investment Management, Inc. (the “Sub-Adviser”) in accordance with the Funds’ investment objective, policies and limitations and investment guidelines established jointly by the Adviser and the Board. The Adviser determines the allocation of each Fund’s assets among the Sub-Adviser and Underlying Funds. The Funds are not required to invest with any minimum number of sub-advisers or Underlying Funds, and do not have minimum or maximum limitations with respect to allocations of assets to any Sub-Adviser, investment strategy or market sector. Highland may change the allocation of each of the Fund’s assets among the available investment options, and may add or remove sub-advisers, at any time. The Sub-Adviser
| Semi-Annual Report | October 31, 2013 | 47 |
| Redmont Funds | Notes to Financial Statements | |
| October 31, 2013 (Unaudited) |
is responsible for the day-to-day management of its allocated portion of Fund assets. Highland has ultimate responsibility, subject to the oversight of the Board of the Funds, to oversee the Sub-Adviser, and to recommend their hiring, termination and replacement.
Pursuant to the Sub-Advisory Agreement, the Adviser pays the Sub-Adviser an annual sub-advisory management fee which is based on each Fund’s average quarterly market value of the assets managed by the Sub-Adviser. The Adviser is required to pay all fees due to the Sub-Adviser out of the management fee the Adviser receives from each Fund. The following table reflects the Funds’ contractual sub-advisory fee rates.
| Sub-Adviser | Average Daily Market Value of the Fund | Contractual Sub-Advisory Fee | ||
| ||||
| First $50 Million | 1.25% | |||
Robeco Investment Management, Inc. | Over $50 Million | 1.00% | ||
The Adviser has agreed, with respect to Redmont Resolute Fund I’s Class A and Class I shares, to contractually to waive the portion of its 1.50% Management Fee in excess of the sum of 0.50% plus any sub-advisory fees paid by the Adviser to the Sub-Advisor, and/or reimburse the Fund (or class, as applicable) by the amount of such excess. In addition, after giving effect to the foregoing fee waiver and/or expense reimbursement, the Adviser has contractually agreed to limit the amount of the Fund’s total annual expenses (exclusive of Distribution and Service (12b-1) Fees, Shareholder Services Fees, acquired fund fees and expenses, Sub-Advisory Fees, brokerage expenses, interest expense, taxes and extraordinary expenses) to 1.40% of the average daily net assets. The agreement is in effect through August 31, 2017. Subsequently to August 31, 2013, the effective date of the latest amended agreement, the Adviser had contractually agreed to limit the amount of the Fund’s total annual expenses (exclusive of Distribution and Service (12b-1) Fees, Shareholder Services Fees, acquired fund fees and expenses, Sub-Advisory Fees, brokerage expenses, interest expense, taxes and extraordinary expenses) to 1.90% of the average daily net assets. Pursuant to this agreement, the Fund will reimburse the Adviser for any fee waivers and expense reimbursements made by the Adviser, provided that any such reimbursements made by the Fund to the Adviser will not cause the Fund’s expense limitation to exceed expense limitations in existence at the time the expense was incurred, or at the time of the reimbursement, whichever is lower, and the reimbursement is made within three years after the expenses were incurred.
For the six months ended October 31, 2013, the fee waivers and/or reimbursements were as follows:
| Fund | Fees Waived/Reimbursed By Advisor | Recoupment of Previously Waived Fees by Advisor | ||||
| ||||||
Redmont Resolute Fund I – Class A | $ | 206 | $ — | |||
Redmont Resolute Fund I – Class I | $ | 46,970 | $ — | |||
As of October 31, 2013, the balances of recoupable expenses for each Fund were as follows:
| Fund | April 30, 2013 | April 30, 2012 | Total | |||||||||
| ||||||||||||
Redmont Resolute Fund I – Class A | $ | 2,377 | $ | 2,270 | $ | 4,647 | ||||||
Redmont Resolute Fund I – Class I | 61,265 | 30,963 | 92,228 | |||||||||
The Adviser has agreed, with respect to the Redmont Resolute Fund II Class I shares, to waive the portion of its 1.50% Management Fee in excess of any sub-advisory fees paid by the Adviser to Sub-Advisor. This agreement is in effect through August 31, 2017. Prior to December 5, 2012, the Adviser had agreed contractually to waive the total amount of Redmont Resolute Fund II’s 0.50% management fees.
Fund Accounting Fees and Expenses
ALPS Fund Services, Inc. (“ALPS” and the “Administrator”) (an affiliate of ALPS Distributors, Inc.) provides administrative, fund accounting and other services to the Funds under the Administration, Bookkeeping and Pricing Services Agreement with the Trust. Prior to the April 1, 2013 initiation of the Sub-Advisory Agreement, ALPS was paid fees, accrued on a daily basis and billed on a monthly basis in total and allocated to each Fund, based on the greater of (a) an annual total fee for both Funds of $200,000 from the first to the last, or projected last, day of the then current year of service under the Agreement; or (b) following basis point fee schedule:
| Average Total Net Assets | Contractual Fee | |
| ||
Between $0-$500M | 0.05% | |
$500M-$1B | 0.03% | |
Above $1B | 0.02% | |
The minimum annual total fee of $200,000 was increased to $234,000 with the initiation of the Sub-Advisory Agreement on April 1, 2013.
The Administrator is also reimbursed by the Funds for certain out-of-pocket expenses.
48 | www.redmontfunds.com |
| Redmont Funds | Notes to Financial Statements | |
| October 31, 2013 (Unaudited) |
Transfer Agent
ALPS serves as transfer, dividend paying and shareholder servicing agent for the Funds under a Transfer Agency and Services Agreement with the Trust. Under this Agreement, ALPS is paid an annual base fee of $25,000 per Fund plus fees for open accounts and is reimbursed for certain out-of-pocket expenses.
Compliance Services
ALPS provides services that assist the Trust’s Chief Compliance Officer in monitoring and testing the policies and procedures of the Trust in conjunction with requirements under Rule 38a-1 under the 1940 Act under the Chief Compliance officer Services Agreement. Prior to the April 1, 2013 initiation of the Sub-Advisory Agreement, ALPS was paid an annual base fee for both Funds of $45,000 which was thereafter increased to $46,000. ALPS is reimbursed for certain out-of-pocket expenses. The annual fee is billed monthly in total and allocated to each Fund.
Principal Financial Officer
ALPS receives an annual fee for both Funds of $10,000 for providing Principal Financial Officer (“PFO”) services to the Trust. The annual fee is billed monthly in total and allocated to each Fund.
Distributor
ALPS Distributors, Inc. (“ADI” or the “Distributor”) (an affiliate of ALPS) acts as the distributor of the Funds’ shares pursuant to a Distribution Agreement with the Trust. Shares are sold on a continuous basis by ADI as agent for the Funds, and ADI has agreed to use its best efforts to solicit orders for the sale of Funds’ shares, although it is not obliged to sell any particular amount of shares. ADI is not entitled to any compensation for its services as Distributor. ADI is registered as a broker-dealer with the Securities and Exchange Commission.
The Redmont Resolute Fund I has adopted a Distribution and Services Plan (the “Plan”) pursuant to Rule 12b-1 of the 1940 Act for Class A shares. The Plan allows the Fund to use Class A assets to pay fees in connection with the distribution and marketing of Class A shares and/or the provision of shareholder services to Class A shareholders. The Plan permits payment for services in connection with the administration of plans or programs that use Class A shares of the Fund, if any, as their funding medium and for related expenses. The Plan permits the Fund to make total payments at an annual rate of up to 0.25% of the Fund’s average daily net assets attributable to its Class A shares. Because these fees are paid out of the Fund’s Class A assets, if any, on an ongoing basis, over time they will increase the cost of an investment in Class A shares, if any, and Plan fees may cost an investor more than other types of sales charges.
The Redmont Resolute Fund I has adopted a shareholder services plan (“Shareholder Services Plan”) for Class A shares. Under the Shareholder Services Plan the Fund is authorized to pay banks and their affiliates and other institutions, including broker-dealers and Fund affiliates (“Participating Organizations”), an aggregate fee in an amount not to exceed on an annual basis 0.15% for Class A shares of the average daily net asset value of the Class A shares, respectively, attributable to or held in the name of a Participating Organization for its clients as compensation for providing shareholder service activities, which do not include distribution services, pursuant to an agreement with a Participating Organization. Shareholder Services plan fees are included with distribution and service fees on the Statement of Operations.
8. INDEMNIFICATIONS
Under the Trust’s organizational documents, its officers and Trustees are indemnified against certain liability arising out of the performance of their duties to the Trust. Additionally, in the normal course of business, the Trust enters into contracts with service providers that may contain general indemnification clauses which may permit indemnification to the extent permissible under applicable law. The Trust’s maximum exposure under these arrangements is unknown, as this would involve future claims that may be made against the Trust that have not yet occurred.
9. NEW ACCOUNTING PRONOUNCEMENTS
In June 2013, the Financial Accounting Standards Board (the “FASB”) issued Accounting Standards Update (“ASU”) No. 2013-08, Financial Services-Investment Companies (Topic 946): Amendments to the Scope, Measurement, and Disclosure Requirements. The FASB standard identifies characteristics a company must assess to determine whether it is considered an investment company for financial reporting purposes. This ASU is effective for fiscal years beginning after December 15, 2013. The Funds believe the adoption of this ASU will not have a material impact on their financial statements.
| Semi-Annual Report | October 31, 2013 | 49 |
| Redmont Funds | Additional Information | |
| October 31, 2013 (Unaudited) |
1. FUND HOLDINGS
The Funds file their complete schedule of portfolio holdings with the Securities and Exchange Commission (the “SEC”) for the first and third quarters of each fiscal year on Form N-Q within 60 days after the end of the period. Copies of the Funds’ Form N-Q are available without charge on the SEC website at http:// www.sec.gov. You may also review and copy the Form N-Q at the SEC’s Public Reference Room in Washington, D.C. For more information about the operation of the Public Reference Room, please call the SEC at 1-800-SEC-0330.
2. FUND PROXY VOTING POLICIES, PROCEDURES AND SUMMARIES
Fund policies and procedures used in determining how to vote proxies and information regarding how each of the Funds voted proxies relating to portfolio securities during the most recent prior 12-month period ending June 30 are available without charge, (1) upon request, by calling (toll-free) (866) 759-5679 and (2) on the SEC’s website at http://www.sec.gov.
50 | www.redmontfunds.com |
| Redmont Funds | Notes | |
| ||
| Semi-Annual Report | October 31, 2013 | 51 |

| 1 | ||||
| 5 | ||||
| 14 | ||||
| 15 | ||||
| 20 | ||||
| 21 | ||||
| 22 | ||||
| 24 | ||||
| 26 | ||||
| 35 | ||||
Seafarer Overseas Growth and Income Fund | Letter to Shareholders | |
| October 31, 2013 |
LETTER TO SHAREHOLDERS
November 14, 2013
Dear Fellow Shareholders,
I am once again pleased to address you on behalf of the Seafarer Overseas Growth and Income Fund. This report addresses the first half of the Fund’s fiscal year (May 1 to October 31, 2013).
During the semi-annual period, the Fund’s Investor and Institutional shares gained 0.90% and 1.00%, respectively. The Fund’s benchmark, the MSCI Emerging Markets Total Return Index1, rose 1.42%. By way of broader comparison, the S&P 500® Total Return Index2 increased 11.14%.
The Fund’s two share classes began the fiscal year with net asset values of $11.91 per share. Near the end of June, each class paid a semi-annual distribution; $0.145 per share was paid to the Investor class, and $0.147 per share to the Institutional class. Those payments brought the cumulative distributions per share (as measured from the Fund’s inception3) to $0.256 and $0.269, respectively. The Investor Class finished the semi-annual period with a value of $11.86 per share, while the Institutional Class finished with $11.87 per share.
Time and Perspective
2013 has not been a particularly rewarding year for those investing in the emerging markets. Stocks in the developing world have been volatile, and when measured year-to-date, they have produced only modest gains. Emerging market bonds and currencies have fared worse. Economic performance and corporate profits have disappointed many investors, especially those that held outsized – if unrealistic – expectations for growth. The developing world has provided plenty of cause for frustration; yet the greatest source of dissatisfaction has been the implicit “opportunity cost” of sustaining an investment there. Equities in the developed markets have performed exceedingly well, led by the U.S. The foregone opportunity to invest in the U.S. has come at a high cost, especially when compensated by the anemic performance of the emerging markets.
Yet, as frustrating as this year has been, I do not think it matters much to the long-term investor with an objective perspective. I do not state this flippantly. I know that some investors cannot afford to wait for the ephemeral and eternally-rosy “long-term” to finally arrive. The global financial crisis of 2008 inflicted terrible damage on some investors’ portfolios, and their retirements loom. I will never lose sight of their predicament, even as I would never counsel that any of them try to make up for lost time by gambling on a short-term, high-risk investment in the emerging markets. Nevertheless, I believe investors are better off to preserve their patience and a sense of perspective.
Time and perspective are two of the most valuable tools that investors can possess (along with financial acumen). Perspective allows investors to put events in context, to frame decisions with data and facts, and to de-emphasize emotion and bias. Time allows sufficient room for careful decisions to operate as intended, usually for the better. Both are luxuries within the financial world, always in short supply.
Yet both are essential now: a great deal of change is taking place in the emerging markets; but the change is incremental and difficult to perceive. That difficulty is heightened by the modern world in which we live. Anyone modestly exposed to mass-market financial media is bombarded with headlines about the paucity of growth in the developing world (true, but in reality it has been so for several years) and the fragility of emerging market currencies versus the dollar (ditto). We are inundated with data and information, yet we perceive most of it without the benefit of substantive analysis. The constant barrage places us under a perverse sort of pressure. We may feel an imperative to profit by the abundance of data; we may be goaded into churning our portfolios, chasing whatever is performing well today. To do otherwise may be perceived as a type of negligence, a failure to safeguard our financial security.
Semi-Annual Report | October 31, 2013 |
1 |
Seafarer Overseas Growth and Income Fund | Letter to Shareholders | |
| October 31, 2013 |
This sort of data-rich / analysis-poor environment is the anathema of a disciplined investor. It impedes any sense of perspective or scale; it undermines patience. It also poses special challenges for the emerging market investor. While financial success is judged instantly, economic development unfolds slowly, in fits and starts. By definition, the emerging markets are situated in a basic state of development; investors seek to capitalize on their progress over time. Yet most of the advances that spur such progress are nearly imperceptible, frustratingly complex, and slow in gestation. So it has been this year in the developing world. Headlines have centered on slowing economies, frail currencies, distressed commodity markets, and riots in the streets. The resulting clamor masks the change that is underway.
A Change in the Model
As discussed at the outset of this letter, there are many reasons why emerging markets have struggled this year; but the most important of these is the paucity of growth. Certainly, there are a handful of smaller markets that seem to be expanding rapidly. Yet apart from these peripheral countries, the developing world is no longer growing as fast as it once did. In evidence of the deceleration, the International Monetary Federation (IMF) recently downgraded its 2013 growth forecast for the developing world to 4.5%.4 This was 0.5% lower than the original forecast; but more importantly, it signaled the slowest expansion in over a decade (except for the period immediately following the global financial crisis). The IMF cited “bottlenecks” in infrastructure, labor markets, and investment as reasons for the decline.5
I agree that “bottlenecks” are the proximate cause for the deceleration, but I go further still: the real reason that growth has slowed is because the economic model that spurred development is beginning to approach its natural limits. The developing world has realized a great deal of growth over the past two decades because successful countries chose (to varying degrees) to de-regulate their markets and open themselves to trade, competition and investment. In the process, such countries relied on an economic model that was either extraction-based (i.e., mining or cultivating natural resources) or manufacturing-based (i.e., export-oriented production). We all know the subsequent story: the emerging markets pulled themselves out of the depths of poverty by either making stuff, or by pulling stuff out of the ground, and then selling it to the rest of the world. Yet today, that economic model is constrained. Trade flows are highly integrated around the world; while further integration is certainly possible, the marginal benefit from doing so is likely in decline. Meanwhile, developing countries have realized substantial gains in their living standards; an export-oriented growth model that relies on cheap inputs, cheap capital, and cheap labor is increasingly outmoded and unviable. If the emerging markets are to expand at a rate anything near their former pace, the economic model must change.
What You See Is All There Is
Fortunately, I can attest that Seafarer’s research indicates important changes are underway. In brief: the emerging markets have begun to transition from an economic model that is highly dependent on external demand (i.e., exporting resources and manufactured goods) to one that emphasizes internal demand (domestic consumption, and especially domestic services). The transition is a complex one, and I have discussed it in other commentaries,6 so I won’t revisit it here.
Instead, I will discuss how difficult it is for most investors to observe the subtleties of the current transition. The shift from an export-oriented model to a domestic one does not occur quickly; it rarely makes headlines, and the gradual nature of transition means it does not suddenly dominate economic statistics. Yet change is taking place across much of the developing world. Even China, famous for its export-led growth, is shifting toward a new model.
Over the past decade, China’s tertiary (domestic services) sector has grown substantially faster than both the primary sector (agriculture and resources) and the secondary sector (manufacturing and construction). At the end of 2012, services already represented roughly 44% of the country’s total economic output. If the sector’s growth continues a few more years, services will soon eclipse manufacturing as the largest component of the Chinese economy.7 Yet China’s service-centric future is contrary to predominant economic narratives about the country, which emphasize the importance of
2 |
(855) 732-9220 | seafarerfunds.com |
Seafarer Overseas Growth and Income Fund | Letter to Shareholders | |
| October 31, 2013 |
the manufacturing and construction sectors. The challenge is for investors to possess sufficient time and perspective to observe the transition at work, rather than rely on outdated narratives.
That challenge is heightened in the context of stock markets. Within the developed world, investors routinely rely upon stock indices to convey information about the underlying market’s scale, performance and change. However, in the emerging markets, the prevailing benchmark indices are designed in a manner that does not capture structural change very well.
At a fundamental level, stock indices are supposed to serve two main functions: they are meant to represent the breadth and depth of a given market, and to measure that market’s performance. Unfortunately, indices for the emerging market are drawn up in a manner that subordinates these two classic objectives. They emphasize liquidity and scalability in place of representation and measurement.8 The upshot of this is that the indices might fail to pick up on the subtle shifts in an economy. Prevailing indices place special emphasis on liquid, scalable, large-capitalization companies; these are the same companies that were responsible for the historical growth of the emerging markets (i.e., resources, manufacturing, exports), and they are not necessarily the same ones that represent the future (consumption and services).
In his book Thinking, Fast and Slow, the eminent behavioral scientist Daniel Kahneman introduces a concept called “WYSIATI.” The acronym stands for “what you see is all there is.“9 WYSIATI refers to a fallacy of perception, whereby human beings naturally assume that what they initially see or perceive is all that matters. WYSIATI impairs judgment: it means that decisions are based on inadequate data, and conclusions are developed without sufficient context.
I think WYSIATI is inherent to some investors’ understanding of the prevailing benchmark indices. By design, such indices exclude a large portion of the market capitalization associated with the emerging markets. Yet those investors assume, based on WYSIATI, that the indices offer an unbiased representation of the depth and breadth of the market. The data suggest otherwise. The following table presents the portion of market capitalization that a major index10 purports to measure, versus Seafarer’s estimates of total, unadjusted capitalization.
| TOTAL CAPITALIZATION | MSCI EMERGING MARKETS INDEX | |||||||||||||||||||||||||||
|
| |||||||||||||||||||||||||||
| % Weight | Capitalization ($ Billion) | Number of Constituents | % Weight | Capitalization ($ Billion) | Number of Constituents | % of Total Capitalization Tracked | ||||||||||||||||||||||
|
| |||||||||||||||||||||||||||
Domestic Services | ||||||||||||||||||||||||||||
+ Non-Bank | ||||||||||||||||||||||||||||
Financial Services | ||||||||||||||||||||||||||||
+ Consumption | 46% | $5,418 | 1,855 | 42% | $1,611 | 408 | 30% | |||||||||||||||||||||
Commercial Banks | ||||||||||||||||||||||||||||
+ Property | 20% | $2,368 | 489 | 21% | $794 | 135 | 34% | |||||||||||||||||||||
Energy + | ||||||||||||||||||||||||||||
Commodities | 22% | $2,561 | 569 | 22% | $834 | 158 | 33% | |||||||||||||||||||||
Manufacturing + | ||||||||||||||||||||||||||||
Industrial Goods | 12% | $1,395 | 561 | 16% | $598 | 116 | 43% | |||||||||||||||||||||
|
| |||||||||||||||||||||||||||
Total | 100% | $11,743 | 3,474 | 100% | $3,837 | 817 | 33% | |||||||||||||||||||||
|
| |||||||||||||||||||||||||||
Sources: MSCI, Bloomberg, Factset, Seafarer. Data as of 11/19/13.
Note: “Total Capitalization” includes only companies with equity capitalizations in excess of $250 million. Excludes Chinese A-Shares; however, Hong Kong-listed companies with substantial exposure to China are included.
Semi-Annual Report | October 31, 2013 |
3 |
Seafarer Overseas Growth and Income Fund | Letter to Shareholders | |
| October 31, 2013 |
As is evident in the table, the index represents only 33% of the estimated total capitalization present in the developing world. Perhaps more importantly, the index captures only 30% of the category entitled “Domestic Services + Non-Bank Financial Services + Consumption” – the very category where I believe the greatest structural change is taking place, and which (arguably) represents the future of the developing world. The index is somewhat more representative of the other three categories; yet these three (arguably) represent the emerging markets’ past and not their future.
In conclusion, WYSIATI poses a serious challenge to the emerging market investor – especially right now, at a time of structural change. The current economic transition is too slow and subtle to be obvious. Meanwhile, any spillover effect on stocks may be partially (or wholly) obscured by the index; the industries at the forefront of transition might not receive adequate representation, at least not at the present time. I think investors must lean heavily on their most useful tools – time and perspective – if they wish to overcome the WYSIATI fallacy. Doing so will not be easy: it will require persistence and patience, sometimes in the face of disappointing returns. Seafarer is up for the challenge.
Thank you for entrusting us with your capital. We are honored to act as your investment adviser.
Andrew Foster
Chief Investment Officer
Seafarer Capital Partners, LLC
The views and information discussed in this commentary are as of the date of publication, are subject to change, and may not reflect the writer’s current views. The views expressed represent an assessment of market conditions at a specific point in time, are opinions only and should not be relied upon as investment advice regarding a particular investment or markets in general. Such information does not constitute a recommendation to buy or sell specific securities or investment vehicles. It should not be assumed that any investment will be profitable or will equal the performance of the portfolios or any securities or any sectors mentioned herein. The subject matter contained herein has been derived from several sources believed to be reliable and accurate at the time of compilation. Seafarer does not accept any liability for losses either direct or consequential caused by the use of this information.
| 1 | The MSCI Emerging Markets Total Return Index, Standard (Large+Mid Cap) Core, Gross (dividends reinvested), USD is a free float-adjusted market capitalization index designed to measure equity market performance of emerging markets. Index code: GDUEEGF. It is not possible to invest directly in this or any index. |
| 2 | The S&P 500® Total Return Index is a stock market index based on the market capitalizations of 500 large companies with common stock listed on the NYSE or NASDAQ. |
| 3 | The Fund’s inception date is February 15, 2012. |
| 4 | IMF, “Global Growth Patterns Shifting, Says IMF WEO,” 8 October 2013 (www.imf.org/external/pubs/ft/survey/so/2013/new100813a.htm). |
| 5 | IMF, “Global Growth Patterns Shifting, Says IMF WEO,” 8 October 2013 (www.imf.org/external/pubs/ft/survey/so/2013/new100813a.htm). |
| 6 | For further information on this transition, please see the Letter to Shareholders dated November 12, 2012 (www.seafarerfunds.com/fund/shareholder-letter/2012/10/semi-annual). |
| 7 | National Bureau of Statistics of China (www.stats.gov.cn/english). |
| 8 | MSCI Barra acknowledges that its indices place “a strong emphasis on investability” [whether a security can be purchased by a foreign investor without impediment] “and replicability” [whether a security can be purchased in large quantities] “through the use of size and liquidity screens.” Please see: MSCI Barra, “MSCI Global Investable Market Indices Methodology,” May 2013, page 10. |
| 9 | Daniel Kahneman, Thinking, Fast and Slow (2013), chapter 7, page 84. |
| 10 | The MSCI Standard Emerging Markets Index. |
4 |
(855) 732-9220 | seafarerfunds.com |
Seafarer Overseas Growth and Income Fund | Portfolio Review | |
| October 31, 2013 |
PORTFOLIO REVIEW
November 14, 2013
During the first half of the Fund’s fiscal year (May 1 to October 31, 2013), the Seafarer Overseas Growth and Income Fund gained 0.90% and 1.00% for the Investor and Institutional share classes, respectively. The Fund’s benchmark, the MSCI Emerging Markets Total Return Index, rose 1.42%. By way of broader comparison, the S&P 500® Total Return Index increased 11.14%.
The Fund’s two share classes began the fiscal year with net asset values of $11.91 per share. Near the end of June, each class paid a semi-annual distribution; $0.145 was paid to the Investor class, and $0.147 to the Institutional class. Those payments brought the cumulative distributions per share (as measured from the Fund’s inception1) to $0.256 and $0.269, respectively. The Investor Class finished the semi-annual period with a value of $11.86 per share, while the Institutional Class finished with $11.87.
Performance
The relatively muted performances of the Fund and the benchmark index belie what was in fact a volatile semi-annual period. Emerging market stocks, bonds and currencies all swung sharply lower, and there were few safe havens. To illustrate: between April 30 and June 24 – less than two months into the new fiscal year – the benchmark index fell over 14% in U.S. dollar terms.2 Though the index eventually recovered from that nadir, the last six months took investors on a wild ride.
The obvious trigger for the volatility was the May 22 testimony of Ben Bernanke, Chairman of the U.S. Federal Reserve. In remarks directed at a special committee of the U.S. Congress, Chairman Bernanke suggested that, if the U.S. economy continues to strengthen, and if the country’s unemployment continues to decline, the central bank might gradually curtail its large-scale asset purchase program (otherwise known as “quantitative easing”).3 Bernanke’s statement was carefully worded, reasonable, and expected by most observers; nevertheless, it sent shockwaves through financial markets, as investors interpreted the comments to mean that interest rates could soon lift off from their ultra-low levels.
The emerging markets took Bernanke’s comments badly, and all asset classes – especially currencies – plunged. The market’s verdict was clear; investors were unnerved by the mere prospect of higher rates. Yet why was this so? Rates go up, and rates go down. How could a modest increase in U.S. rates undermine the growth story of the developing world?
Bernanke’s words knocked the wind out of the emerging world for two reasons. First, growth in corporate revenues and profits has been tepid over the past few years, especially in the larger, so-called “BRIC” markets (Brazil, Russia, India and China). This weak corporate performance has disappointed investors, many of whom harbored high (and misplaced) expectations for growth in the developing world. Investors were already wary about the outlook for emerging markets; Bernanke’s words only intensified those concerns, as higher interest rates were deemed to be yet another impediment to growth.
Second, until recently, emerging market currencies had been in vogue, but their strength was deceptive. Bernanke’s testimony signaled only a modest change to Fed policy; yet that small shift was still enough to bolster the dollar and cause emerging currencies to swoon. The benchmark index also fell sharply after Bernanke’s speech; but what is perhaps less obvious is that over one-third of the decline was due to currency movements, as opposed to falling stock prices.4
Still, the index managed to finish the semi-annual period in positive territory because a handful of stock markets – mostly larger ones – managed to stage recoveries, even as the majority of the emerging markets remained mired in losses. China, Russia, South Africa and Korea all rallied from their lows, ultimately finishing higher; meanwhile, Chile, India, Indonesia, Thailand, Turkey and the Philippines all closed sharply lower.5
Semi-Annual Report | October 31, 2013 |
5 |
Seafarer Overseas Growth and Income Fund | Portfolio Review | |
| October 31, 2013 |
Amid the turmoil, China’s stock markets demonstrated the greatest strength, rising swiftly when investors were caught off-guard at the resilience of the Chinese economy. At the beginning of the year, numerous strategists forecast that China’s economy would grow around 8.5% during 2013. Those forecasts were decidedly wrong. Contrary to prediction, the economy began to slow during the first half; that deceleration, combined with reports of distress within the Chinese banking system, were enough to send Chinese stocks tumbling. Equity valuations suddenly reflected intense pessimism: I believe that some investors mistakenly anticipated a “hard landing,” in which growth might decelerate sharply (i.e., well below 6%), and which might trigger some sort of “credit event” (e.g., the collapse of a financial institution). Yet economic data released during the third quarter suggested that the economy was still holding up reasonably well, expanding around 7.8% per annum. That revelation caught the market off guard, and Chinese shares jumped higher in response.
Amid this volatile environment, the Fund underperformed its benchmark by a modest margin. Latin America was by far the Fund’s weakest area, causing a drag of roughly 2% on the Fund’s returns. By contrast, all other regions generated gains for the Fund. Within Latin America, losses for the semi-annual period were concentrated in one holding: Sociedad Quimica y Minera (SQM), a Chilean mining company. SQM suffered a sharp deterioration in the performance of its business, and other risks were manifest as well, and consequently the Fund had cause to quit the company’s shares.6
Meanwhile, Eastern Europe (led by Poland) and Asia (led by China, India, Vietnam and Malaysia) were the Fund’s bright spots. Though volatile, the Fund’s holdings in Poland ultimately performed well, gaining over the six-month period based on a modest improvement in investors’ perception of the country’s macro-economy. The Fund’s China holdings performed well in aggregate for similar reasons: as discussed above, Chinese shares rallied on signs that the economy was not in as dire shape as had been feared. Meanwhile, the Fund’s holdings in India substantially outperformed those of the benchmark index. India’s currency (the rupee) was one of those that swooned during the period; however, the Fund’s primary exposure was to Infosys, a software company that earns the bulk of its revenues in dollars. This feature of its business model has so far insulated its profitability from the wobbles of the rupee – and the shares rose based on perceptions that the company’s growth was accelerating. Lastly, the Fund’s holdings in Vietnam made a welcome contribution. Vietnam stocks have performed well this year, in recognition of forthcoming economic reforms, and because valuations on many Vietnam stocks are not demanding.
Allocation
At Seafarer, we invest from the bottom up, meaning that we evaluate each potential investment on its individual merits. This is in contrast to an investment system in which we might place heavy emphasis on economic forecasts, or make decisions based on macro themes, country allocations, or sector weightings.7 However, when we invest from the bottom up, we consider carefully how various “macro scenarios” might directly or indirectly impact the prospective investment at hand. One “macro” area where we do concentrate is currencies, mainly because they have the potential to rapidly destroy the Fund’s capital, and because their movements can permanently diminish vulnerable industries and business models.
We believe the recent retreat of emerging currencies was hastened because their original embrace was based on a false premise. For the past three years or so, investors have worried the Fed’s unorthodox monetary policies might debase the dollar (a legitimate, if exaggerated concern). That fear manifested itself in a natural desire to seek currencies that could serve as an alternate haven for capital. Unfortunately, investors employed faulty logic in their search: they assumed the dollar’s defects (lax monetary and fiscal policies), when inverted, would define other currencies’ strengths. Some commentators fueled this assumption by heralding the “solid fundamentals” and the “pristine balance sheets” of the developing world, implying debt from that part of the world might serve as an antidote to the dollar’s woes.8 Thus began the heady but flawed ascent of emerging currencies.
Over the past two years, Seafarer has rejected the prevailing view that emerging market currencies were somehow new or improved, and therefore could serve as a low-risk alternative to the dollar, or as a means to safely accrue extra fixed income.9 While we concur that some developing countries enjoy
6 |
(855) 732-9220 | seafarerfunds.com |
Seafarer Overseas Growth and Income Fund | Portfolio Review | |
| October 31, 2013 |
“solid fundamentals,” we believe that any resulting benefits will accrue only over long periods of time, and certainly do not confer short-term currency stability. Good fundamentals are simply no substitute for the depth, on-demand liquidity and stability that the U.S. dollar affords. Emerging currencies have made great strides over the past decade; but in our view it will be one or two more decades – if ever – before any could act as a meaningful surrogate for the dollar.
As of the autumn of 2013, it seems that the bulk of the currency-related “pain” that was latent in the emerging markets is now manifest. Surely, there are some countries that still face pronounced risks (India chief among them). Yet dramatic losses versus the dollar have already occurred; in our view, currency markets tend to overshoot in the short run, and analysts tend to amplify and overstate currency problems only after they have occurred.
We believe the chief problem that emerging markets face is a lack of growth; none face the sort of dire solvency problems that crushed Latin America in the mid-1990s or Asia in the late 1990s. Those currency implosions were caused by asset-liability mismatches. Essentially, financial institutions and other intermediaries in the emerging markets borrowed dollars on a short-term basis, and lent or invested long-term in (often dubious) projects that were denominated in local currencies. When the currencies collapsed, the projects’ financial viability collapsed, which caused the currencies to fall further, in a vicious cycle. For the most part, this is not an urgent problem today.
From a portfolio perspective, currency-related risks still present challenges for the Fund, but far less so than one year ago. Our main concern is still the paucity of growth in the developing world. We will continue to invest from the bottom up, on a company-by-company basis; but we will watch for central banks that understand the imperative to sustain growth with accommodative monetary policy – even if it causes their currencies to wobble against the dollar in the short run.
On a separate note, the Chinese stock market once again presents the Fund with promise and peril. The promise was visible during a recent trip to Hong Kong: we met a number of companies that are well-situated in service-based industries.10 Most of those industries are relatively new to China, and seem to be undergoing a small boom. You might call it a “boom-let.” The Fund will attempt to gain exposure to some of these companies, though the challenge is always sorting out faddish, concept stocks with high valuations from real companies that have the potential to grow steadily for the long-term. Amid a boom-let, it is possible to confuse the two groups.
Meanwhile, the peril arises from rolling liquidity crunches in China. I am disturbed at the rising levels of “accounts receivable” (essentially, un-collected revenues from customers), suggesting companies are not paid on a timely basis. Many of the deferred payments are ultimately traceable to the central government, provincial governments, or state-backed enterprises, which strikes me as both odd and worrisome. I think constrained liquidity within the corporate sector may prove more dangerous to China’s economic health than the country’s often-discussed property markets and “shadow banking system.“11 Our aim will be for the Fund to seek exposure to the aforementioned boom-let, while attempting to minimize exposure to China’s liquidity constrained corporate sector. It may prove to be a difficult, if not impossible, task.
Andrew Foster
Chief Investment Officer
Seafarer Capital Partners, LLC
The views and information discussed in this commentary are as of the date of publication, are subject to change, and may not reflect the writer’s current views. The views expressed represent an assessment of market conditions at a specific point in time, are opinions only and should not be relied upon as investment advice regarding a particular investment or markets in general. Such information does not constitute a recommendation to buy or sell specific securities or investment vehicles. It should not be assumed that any investment will be profitable or will equal the performance of the portfolios or any securities or any sectors mentioned herein. The subject matter contained herein has been derived from several sources believed to be reliable and accurate at the time of compilation. Seafarer does not accept any liability for losses either direct or consequential caused by the use of this information.
Semi-Annual Report | October 31, 2013 |
7 |
Seafarer Overseas Growth and Income Fund | Portfolio Review | |
| October 31, 2013 |
| 1 | The Fund’s inception date is February 15, 2012. |
| 2 | Based on the performance of the MSCI Daily Total Return Gross Emerging Markets Dollar index (ticker: GDUEEGF). Sources: MSCI, Bloomberg and Seafarer. |
| 3 | Ben Bernanke, “The Economic Outlook,” Testimony Before the Joint Economic Committee, U.S. Congress, 22 May 2013. |
| 4 | “Over one-third of that decline” is based on the relative performance of the MSCI Daily Total Return Gross Emerging Markets Dollar index (ticker: GDUEEGF) and the MSCI Daily Total Return Gross Emerging Markets Local Index (ticker: GDLEEGF) between April 30 and June 24, 2013. The former index fell -14.27% and the latter (which attempts to exclude the impact of currency movements) fell -9.19%. Sources: MSCI, Bloomberg and Seafarer. |
| 5 | Performance measurement based on performance of MSCI country indices between April 30 and October 31, 2013, measured in dollar terms. |
| 6 | For a detailed discussion of SQM, please see the Portfolio Review for the third calendar quarter of 2013 (www.seafarerfunds.com/fund/portfolio-review/2013/09/Q3). |
| 7 | For further discussion of Seafarer’s investment approach, please see the Letter to Shareholders dated May 15, 2013 (www.seafarerfunds.com/fund/shareholder-letter/2013/04/annual). |
| 8 | PIMCO, “The Caine Mutiny (Part 2),” 1 May 2011; and Franklin Templeton, “Franklin Templeton Investments Introduces Templeton Emerging Markets Bond Fund for U.S. Investors,” 3 April 2013. |
| 9 | For further information, please see “On the Brazilian Real,” April 2011 (www.seafarerfunds.com/commentary/ on-the-brazilian-real); “On Double Invoicing and the Yuan,” May 2011, Part 1 (www.seafarerfunds.com/commentary/on-double-invoicing-and-the-yuan-part-1) and Part 2 (www.seafarerfunds.com/commentary/on-double-invoicing-and-the-yuan-part-2); “Three Risks to Emerging Markets Investing,” Morningstar video, June 2011; and “On Teflon and Emerging Market Currencies,” October 2011 (www.seafarerfunds.com/commentary/on-teflon-and-emerging-market-currencies). |
| 10 | For further discussion of the potential of China’s underdeveloped services sector, please see the Letter to Shareholders dated November 12, 2012 (www.seafarerfunds.com/fund/shareholder-letter/2012/10/semi-annual). |
| 11 | Shadow banks are financial intermediaries that conduct maturity, credit, and liquidity transformation without explicit access to central bank liquidity or public sector credit guarantees. Source: Federal Reserve Bank of New York Staff Report, “Shadow Banking,” July 2010, revised February 2012. |
Seafarer Overseas Growth and Income Fund Performance
Total Return (As of October 31, 2013) | 1 Year | Since Inception* - Annualized | Net Expense Ratio** | |||||||
| ||||||||||
Investor Class (SFGIX) | 11.36% | 12.04% | 1.40% | |||||||
| ||||||||||
Institutional Class (SIGIX) | 11.53% | 12.16% | 1.25% | |||||||
| ||||||||||
MSCI Emerging Markets Total Return Index^ | 6.90% | 1.83% | ||||||||
| ||||||||||
Gross expense ratio: 1.98% for Investor Class; 1.85% for Institutional Class**
All performance is in U.S. dollars with gross (pre-tax) dividends and/or distributions reinvested. The performance data quoted represents past performance and does not guarantee future results. Future returns may be lower or higher. The investment return and principal value will fluctuate so that an investor’s shares, when redeemed, may be worth more or less than the original cost. Shares of the Fund redeemed or exchanged within 90 days of purchase are subject to a 2% redemption fee. Performance does not reflect this fee, which if deducted would reduce an individual’s return. To obtain the Fund’s most recent month-end performance, visit seafarerfunds.com or call (855) 732-9220.
| * | Inception Date: February 15, 2012. |
| ** | Seafarer Capital Partners, LLC has agreed contractually to waive and/or reimburse fees or expenses in order to limit Total Annual Fund Operating Expenses After Fee Waiver/Expense Reimbursements (excluding brokerage expenses, interest expenses, taxes and extraordinary expenses) to 1.40% and 1.25% of the Fund’s average daily net assets for the Investor and Institutional share classes, respectively. This agreement is in effect through August 31, 2014. |
8 |
(855) 732-9220 | seafarerfunds.com |
Seafarer Overseas Growth and Income Fund | Portfolio Review | |
| October 31, 2013 |
| ^ | The MSCI Emerging Markets Total Return Index, Standard (Large+Mid Cap) Core, Gross (dividends reinvested), USD is a free float-adjusted market capitalization index designed to measure equity market performance of emerging markets. Index code: GDUEEGF. It is not possible to invest directly in this or any index. |
Performance of a $10,000 Investment Since Inception
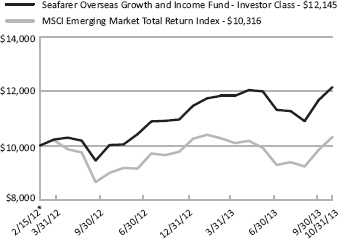
* Inception Date: February 15, 2012.
The chart shown above represents historical performance of a hypothetical investment of $10,000 in the Fund’s Investor Class shares for the period from inception to October 31, 2013. All returns reflect reinvested dividends and/or distributions, but do not reflect the deduction of taxes that an investor would pay on distributions or redemptions.
The Fund also offers Institutional Class shares, performance for which is not reflected in the chart above. The performance of Institutional Class shares may be higher or lower than the performance of the Investor Class shares shown above based upon differences in fees paid by shareholders investing in the Investor Class shares and Institutional Class shares.
Investment Objective
The Fund seeks to provide long-term capital appreciation along with some current income. The Fund seeks to mitigate adverse volatility in returns as a secondary objective.
Strategy
The Fund invests primarily in the securities of companies located in developing countries. The Fund invests in several asset classes including dividend-paying common stocks, preferred stocks, convertible bonds, and fixed-income securities.
The Fund seeks to offer investors a relatively stable means of participating in a portion of developing countries’ growth prospects, while providing some downside protection compared to a portfolio that invests only in the common stocks of those countries.
Semi-Annual Report | October 31, 2013 |
9 |
Seafarer Overseas Growth and Income Fund | Portfolio Review | |
| October 31, 2013 |
Fund Characteristics
Inception Date | February 15, 2012 | |||
Net Assets | $40.6M | |||
Portfolio Turnover1 | 38% |
| Investor Class | Institutional Class | |||||||||||||||||||
Ticker | SFGIX | SIGIX | ||||||||||||||||||
NAV | $11.86 | $11.87 | ||||||||||||||||||
30-Day SEC Yield | 1.68% | 1.87% | ||||||||||||||||||
Fund Distribution Yield | 1.74% | 1.97% | ||||||||||||||||||
Net Expense Ratio | 1.40% | 1.25% | ||||||||||||||||||
Redemption Fee (within 90 calendar days) | 2.00% | 2.00% | ||||||||||||||||||
Minimum Initial Investment | $2,500 | $100,000 | ||||||||||||||||||
Minimum Initial Investment (Retirement Account) | $1,000 | $100,000 | ||||||||||||||||||
Underlying Portfolio Holdings
Number of Holdings | 46 | |||||||||
% of Net Assets in Top 10 Holdings | 35% | |||||||||
Weighted Average Market Cap | $13.9B | |||||||||
Market Cap of Portfolio Median | $4.1B | |||||||||
Gross Portfolio Yield2,3 | 3.2% | |||||||||
Price / Book Value2 | 1.7 | |||||||||
Price / Earnings2,4 | 12.5 | |||||||||
Earnings Per Share Growth2,4 | 10% | |||||||||
Sources: ALPS Fund Services, Inc., Bloomberg, Seafarer.
Past performance does not guarantee future results.
| 1 | For the six months ended October 31, 2013. Portfolio Turnover is for a period less than one full year and is not annualized. |
| 2 | Calculated as a harmonic average of the underlying portfolio holdings. |
| 3 | Gross Portfolio Yield = gross yield for the underlying portfolio, estimated based on the dividend yield for common and preferred stocks and yield to maturity for bonds. This measure of yield does not account for offsetting Fund expenses and other costs, and consequently it should not be construed as the yield that an investor in the Fund would receive. |
| 4 | Based on consensus earnings estimates for next year. |
Price / Book Value: the value of a company’s common shares, divided by the company’s book value.
Price / Earnings: the market price of a company’s common shares divided by the earnings per common share as forecast for next year.
Earnings Per Share (EPS) Growth: forecast growth rate of earnings per common share next year, expressed as a percentage.
The “Underlying Portfolio Holdings” table presents indicative values only; Seafarer does not warrant the data’s accuracy, and disclaims any responsibility for its use for investment purposes.
10 |
(855) 732-9220 | seafarerfunds.com |
Seafarer Overseas Growth and Income Fund | Portfolio Review | |
| October 31, 2013 |
Top 10 Holdings
| Holding | Sector | Country | % Net Assets | Issuer Mkt Cap ($B) | Yield1 | Price / Book | Price / Earnings2 | EPS Growth2 | ||||||||||||||||||||||||||
| NTT DOCOMO, Inc. | Telecom. Services | Japan | 4.3 | % | $68.8 | 3.9 | % | 1.2 | 12 | 2% | ||||||||||||||||||||||||
| Keppel Corp. Ltd. | Industrials | Singapore | 3.9 | % | $15.9 | 3.4 | % | 2.2 | 12 | 8% | ||||||||||||||||||||||||
| Sindoh Co. Ltd.3 | Information Technology | South Korea | 3.8 | % | $0.7 | 3.6 | % | 0.9 | – | – | ||||||||||||||||||||||||
| Bank Pekao SA | Financials | Poland | 3.5 | % | $16.7 | 4.4 | % | 2.3 | 18 | 8% | ||||||||||||||||||||||||
| PGE Polska Grupa Energetyczna SA | Utilities | Poland | 3.4 | % | $11.3 | 4.8 | % | 0.8 | 13 | -24% | ||||||||||||||||||||||||
| Valid Solucoes | Industrials | Brazil | 3.4 | % | $0.9 | 3.1 | % | 3.6 | 15 | 25% | ||||||||||||||||||||||||
| Dongfang Electric Corp. Ltd. | Industrials | China / Hong Kong | 3.4 | % | $3.6 | 1.0 | % | 1.2 | 9 | 2% | ||||||||||||||||||||||||
| Cia Vale do Rio Doce, Pfd. | Materials | Brazil | 3.2 | % | $81.6 | 5.5 | % | 1.1 | 7 | -1% | ||||||||||||||||||||||||
| SIA Engineering Co., Ltd. | Industrials | Singapore | 3.1 | % | $4.5 | 4.4 | % | 4.0 | 19 | 6% | ||||||||||||||||||||||||
| Hang Lung Properties, Ltd. | Financials | China / Hong Kong | 3.0 | % | $14.8 | 2.9 | % | 1.0 | 20 | 35% | ||||||||||||||||||||||||
Cumulative Weight of Top 10 Holdings: | 35 | % | ||
Total Number of Holdings: | 46 |
Portfolio holdings are subject to change.
| 1 | Yield = dividend yield for common and preferred stocks and yield to maturity for bonds. |
| 2 | Based on consensus earnings estimates for next year. |
| 3 | Consensus estimates for earnings and EPS growth are not available for this security. |
Sources: ALPS Fund Services, Inc., Bloomberg, Seafarer.
The table above presents indicative values only; Seafarer does not warrant the data’s accuracy and disclaims any responsibility for its use for investment purposes.
Semi-Annual Report | October 31, 2013 |
11 |
Seafarer Overseas Growth and Income Fund | Portfolio Review | |
| October 31, 2013 |
Portfolio Composition
| Region/Country | % Net Assets | ||||
East & South Asia | 61 | ||||
China / Hong Kong | 14 | ||||
India | 5 | ||||
Indonesia | 3 | ||||
Japan | 7 | ||||
Malaysia | 4 | ||||
Singapore | 10 | ||||
South Korea | 7 | ||||
Taiwan | 5 | ||||
Thailand | 2 | ||||
Vietnam | 6 | ||||
Eastern Europe | 16 | ||||
Poland | 9 | ||||
Turkey | 7 | ||||
Latin America | 18 | ||||
Brazil | 11 | ||||
Chile | 2 | ||||
Mexico | 4 | ||||
Middle East & Africa | 2 | ||||
South Africa | 2 | ||||
Cash and Other Assets, Less Liabilities | 3 | ||||
Total | 100 | ||||
| Asset Class | % Net Assets | ||||
Common Stock | 86 | ||||
Preferred Stock | 6 | ||||
ADR | 3 | ||||
USD Convertible Bond | 2 | ||||
Cash and Other Assets, Less Liabilities | 3 | ||||
Total | 100 | ||||
| Market Capitalization of Issuer | % Net Assets | ||||
Large Cap (over $10 billion) | 30 | ||||
Mid Cap ($1 - $10 billion) | 44 | ||||
Small Cap (under $1 billion) | 23 | ||||
Cash and Other Assets, Less Liabilities | 3 | ||||
Total | 100 | ||||
Percentage values may not sum to 100% due to rounding.
| Sector | % Net Assets | ||||
Consumer Discretionary | 8 | ||||
Consumer Staples | 9 | ||||
Energy | 3 | ||||
Financials* | 21 | ||||
Health Care | 10 | ||||
Industrials | 20 | ||||
Information Technology | 13 | ||||
Materials | 6 | ||||
Telecommunication Services | 4 | ||||
Utilities | 3 | ||||
Cash and Other Assets, Less Liabilities | 3 | ||||
Total | 100 | ||||
| * | The Fund’s concentration in the Financials sector includes holdings in property-related stocks, which are classified within the “Financials sector” according to the Global Industry Classification Standard (GICS) methodology utilized herein. Property-related holdings comprised 5% of the Fund’s net assets as of October 31, 2013. |
12 |
(855) 732-9220 | seafarerfunds.com |
Seafarer Overseas Growth and Income Fund | Portfolio Review | |
| October 31, 2013 |
Greatest Performance Contributors and Detractors
For the six months ended October 31, 2013
| Contributors | % Net Assets1 | ||||||
Kingdee International Software Group Co. Ltd.2 | – | ||||||
Bank Pekao SA | 3.5 | ||||||
PetroVietnam Drilling and Well Services JSC | 1.7 | ||||||
Samsung Fire & Marine Insurance Co., Ltd., Pfd. | 1.7 | ||||||
Hartalega Holdings Bhd | 1.9 | ||||||
| Detractors | % Net Assets1 | ||||||
Odontoprev SA | 2.5 | ||||||
Thai Reinsurance PCL | 2.0 | ||||||
Taiwan Hon Chuan Enterprise Co., Ltd. | 2.3 | ||||||
Netas Telekomunikasyon AS | 1.8 | ||||||
Sociedad Quimica y Minera de Chile SA ADR2 | – | ||||||
| 1 | As of end of period. |
| 2 | As of October 31, 2013, the Fund had no economic interest in this security. |
Source: Bloomberg
The table above presents estimated values only; Seafarer does not warrant the data’s accuracy and disclaims any responsibility for its use for investment purposes.
Semi-Annual Report | October 31, 2013 |
13 |
Seafarer Overseas Growth and Income Fund | Disclosure of Fund Expenses | |
| October 31, 2013 (Unaudited) |
As a shareholder of the Fund you will incur two types of costs: (1) transaction costs, including applicable redemption fees; and (2) ongoing costs, including management fees and other Fund expenses. The following examples are intended to help you understand your ongoing costs (in dollars) of investing in the Fund and to compare these costs with the ongoing costs of investing in other mutual funds. The examples are based on an investment of $1,000 invested on May 1, 2013 and held until October 31, 2013.
Actual Expenses. The first line of each table below provides information about actual account values and actual expenses. You may use the information in this line, together with the amount you invested, to estimate the expenses that you paid over the period. Simply divide your account value by $1,000 (for example, an $8,600 account value divided by $1,000 = 8.6), then multiply the result by the number in the first line under the heading “Expenses Paid During Period” to estimate the expenses you paid on your account during this period.
Hypothetical Example for Comparison Purposes. The second line of the table below provides information about hypothetical account values and hypothetical expenses based on the Fund’s actual expense ratio and an assumed rate of return of 5% per year before expenses, which is not the Fund’s actual return. The hypothetical account values and expenses may not be used to estimate the actual ending account balance or expenses you paid for the period. You may use this information to compare the ongoing costs of investing in the Fund and other mutual funds. To do so, compare this 5% hypothetical example with the 5% hypothetical examples that appear in the shareholder reports of the other funds. The expenses shown in the table are meant to highlight ongoing Fund costs only and do not reflect transaction fees, such as redemption fees or exchange fees. Therefore, the second line of each table below is useful in comparing ongoing costs only, and may not help you determine the relative total costs of owning different funds. In addition, if these transactional costs were included, your costs would have been higher.
Beginning Account Value 05/01/13 | Ending Account Value 10/31/13 | Expense Ratio(a) | Expenses Paid During Period 05/01/13 -10/31/13(b) | |||||||||||||
| ||||||||||||||||
Investor Class | ||||||||||||||||
Actual | $ 1,000.00 | $ 1,009.00 | 1.40% | $ 7.09 | ||||||||||||
Hypothetical (5% return before expenses)
|
| $ 1,000.00
|
|
| $ 1,018.15
|
|
| 1.40%
|
| $ 7.12
| ||||||
| ||||||||||||||||
Institutional Class | ||||||||||||||||
Actual | $ 1,000.00 | $ 1,010.00 | 1.25% | $ 6.33 | ||||||||||||
Hypothetical (5% return before expenses) | $ 1,000.00 | $ 1,018.90 | 1.25% | $ 6.36 | ||||||||||||
| (a) | Annualized, based on the Fund’s most recent fiscal half year expenses. |
| (b) | Expenses are equal to the Fund’s annualized expense ratio multiplied by the average account value over the period, multiplied by the number of days in the most recent fiscal half year (184), then divided by 365. |
| 14 |
(855) 732-9220 | seafarerfunds.com |
Seafarer Overseas Growth and Income Fund | Portfolio of Investments | |
| October 31, 2013 (Unaudited) |
| Currency | Shares | Value | ||||||||
| ||||||||||
COMMON STOCKS (88.9%) | ||||||||||
Brazil (8.0%) | ||||||||||
Valid Solucoes e Servicos de Seguranca em Meios de Pagamento e Identificacao SA | BRL | 89,000 | $ | 1,373,020 | ||||||
Odontoprev SA | BRL | 245,000 | 1,012,722 | |||||||
Aliansce Shopping Centers SA | BRL | 87,500 | 846,409 | |||||||
|
| |||||||||
Total Brazil | 3,232,151 | |||||||||
|
| |||||||||
Chile (2.2%) | ||||||||||
Corpbanca SA | CLP | 59,535,716 | 668,172 | |||||||
Corpbanca SA ADR | USD | 13,376 | 230,067 | |||||||
|
| |||||||||
Total Chile | 898,239 | |||||||||
|
| |||||||||
China / Hong Kong (13.9%) | ||||||||||
Dongfang Electric Corp., Ltd. | HKD | 850,000 | 1,368,245 | |||||||
Hang Lung Properties, Ltd. | HKD | 370,000 | 1,219,334 | |||||||
Beijing Enterprises Holdings, Ltd. | HKD | 135,000 | 1,108,313 | |||||||
Shandong Weigao Group Medical Polymer Co., Ltd., Class H | HKD | 910,000 | 854,482 | |||||||
SinoMedia Holding, Ltd. | HKD | 625,000 | 582,033 | |||||||
Digital China Holdings, Ltd. | HKD | 400,000 | 525,216 | |||||||
|
| |||||||||
Total China / Hong Kong | 5,657,623 | |||||||||
|
| |||||||||
India (4.8%) | ||||||||||
Sun Pharma Advanced Research Co., Ltd.(a) | INR | 370,000 | 785,396 | |||||||
Infosys, Ltd. ADR | USD | 14,500 | 769,370 | |||||||
Navneet Education, Ltd. | INR | 450,638 | 400,005 | |||||||
|
| |||||||||
Total India | 1,954,771 | |||||||||
|
| |||||||||
Indonesia (2.8%) | ||||||||||
Astra International Tbk PT | IDR | 1,900,000 | 1,120,869 | |||||||
|
| |||||||||
Total Indonesia | 1,120,869 | |||||||||
|
| |||||||||
Japan (6.9%) | ||||||||||
NTT DOCOMO, Inc. | JPY | 110,000 | 1,745,144 | |||||||
Ajinomoto Co., Inc. | JPY | 76,000 | 1,061,202 | |||||||
|
| |||||||||
Total Japan | 2,806,346 | |||||||||
|
| |||||||||
Semi-Annual Report | October 31, 2013 |
15 |
Seafarer Overseas Growth and Income Fund | Portfolio of Investments | |
| October 31, 2013 (Unaudited) |
| Currency | Shares | Value | ||||||||
| ||||||||||
Malaysia (3.8%) | ||||||||||
AMMB Holdings Bhd | MYR | 340,000 | $ | 796,248 | ||||||
Hartalega Holdings Bhd | MYR | 330,060 | 756,234 | |||||||
|
| |||||||||
Total Malaysia | 1,552,482 | |||||||||
|
| |||||||||
Mexico (4.5%) | ||||||||||
Grupo Herdez SAB de CV | MXN | 306,093 | 1,079,177 | |||||||
Kimberly-Clark Mexico SAB de CV, Class A | MXN | 240,000 | 729,717 | |||||||
|
| |||||||||
Total Mexico | 1,808,894 | |||||||||
|
| |||||||||
Poland (9.1%) | ||||||||||
Bank Pekao SA | PLN | 22,500 | 1,409,743 | |||||||
PGE SA | PLN | 240,000 | 1,402,438 | |||||||
Asseco Poland SA | PLN | 54,000 | 881,958 | |||||||
|
| |||||||||
Total Poland | 3,694,139 | |||||||||
|
| |||||||||
Singapore (7.9%) | ||||||||||
Keppel Corp., Ltd. | SGD | 180,000 | 1,572,211 | |||||||
SIA Engineering Co., Ltd. | SGD | 315,000 | 1,280,591 | |||||||
Hong Leong Finance, Ltd. | SGD | 162,000 | 342,988 | |||||||
|
| |||||||||
Total Singapore | 3,195,790 | |||||||||
|
| |||||||||
South Africa (2.1%) | ||||||||||
Life Healthcare Group Holdings, Ltd. | ZAR | 130,000 | 530,942 | |||||||
Steinhoff International Holdings, Ltd.(a) | ZAR | 84,638 | 327,213 | |||||||
|
| |||||||||
Total South Africa | 858,155 | |||||||||
|
| |||||||||
South Korea (3.8%) | ||||||||||
Sindoh Co., Ltd. | KRW | 23,500 | 1,550,790 | |||||||
|
| |||||||||
Total South Korea | 1,550,790 | |||||||||
|
| |||||||||
Taiwan (4.8%) | ||||||||||
Taiwan Hon Chuan Enterprise Co., Ltd. | TWD | 452,000 | 953,862 | |||||||
Taiwan Semiconductor Manufacturing Co., Ltd. | TWD | 248,000 | 924,318 | |||||||
Taiwan Semiconductor Manufacturing Co., Ltd. ADR | USD | 5,000 | 92,050 | |||||||
|
| |||||||||
Total Taiwan | 1,970,230 | |||||||||
|
| |||||||||
16 |
(855) 732-9220 | seafarerfunds.com |
Seafarer Overseas Growth and Income Fund | Portfolio of Investments | |
| October 31, 2013 (Unaudited) |
| Currency | Shares | Value | ||||||||
| ||||||||||
Thailand (2.0%) | ||||||||||
Thai Reinsurance PCL(a) | THB | 6,493,602 | $ | 822,001 | ||||||
|
| |||||||||
Total Thailand | 822,001 | |||||||||
|
| |||||||||
Turkey (6.9%) | ||||||||||
Aselsan Elektronik Sanayi Ve Ticaret AS | TRY | 255,000 | 1,205,861 | |||||||
Arcelik AS | TRY | 135,000 | 862,242 | |||||||
Netas Telekomunikasyon AS | TRY | 195,000 | 726,762 | |||||||
|
| |||||||||
Total Turkey | 2,794,865 | |||||||||
|
| |||||||||
Vietnam (5.4%) | ||||||||||
PetroVietnam Drilling and Well Services JSC(a) | VND | 232,490 | 699,674 | |||||||
Nam Long Investment Corp.(a) | VND | 700,100 | 597,242 | |||||||
Bao Viet Holdings | VND | 250,000 | 471,564 | |||||||
Vietnam National Reinsurance Corp.(b) | VND | 225,800 | 237,015 | |||||||
Dry Cell & Storage Battery JSC | VND | 205,990 | 189,393 | |||||||
|
| |||||||||
Total Vietnam | 2,194,888 | |||||||||
|
| |||||||||
TOTAL COMMON STOCKS (Cost $34,171,080) | 36,112,233 | |||||||||
| ||||||||||
PREFERRED STOCKS (6.1%) | ||||||||||
Brazil (3.2%) | ||||||||||
Vale SA | BRL | 90,000 | 1,319,346 | |||||||
|
| |||||||||
Total Brazil | 1,319,346 | |||||||||
|
| |||||||||
South Korea (2.9%) | ||||||||||
Samsung Fire & Marine Insurance Co., Ltd. | KRW | 6,000 | 692,906 | |||||||
S-Oil Corp. | KRW | 9,174 | 475,673 | |||||||
|
| |||||||||
Total South Korea | 1,168,579 | |||||||||
|
| |||||||||
TOTAL PREFERRED STOCKS (Cost $2,289,640) | 2,487,925 | |||||||||
| ||||||||||
Semi-Annual Report | October 31, 2013 |
17 |
Seafarer Overseas Growth and Income Fund | Portfolio of Investments | |
| October 31, 2013 (Unaudited) |
| Currency | Rate | Maturity Date | Principal Amount | Value | ||||||||||||
| ||||||||||||||||
CONVERTIBLE CORPORATE BONDS (2.0%) | ||||||||||||||||
Singapore (2.0%) | ||||||||||||||||
Olam International, Ltd. | USD | 6.00% | 10/15/16 | $ | 800,000 | $ | 790,000 | |||||||||
|
| |||||||||||||||
Total Singapore | 790,000 | |||||||||||||||
|
| |||||||||||||||
TOTAL CONVERTIBLE CORPORATE BONDS (Cost $ 832,771) | 790,000 | |||||||||||||||
| ||||||||||||||||
TOTAL INVESTMENTS (Cost $ 37,293,491) (97.0%) | $ | 39,390,158 | ||||||||||||||
Cash and Other Assets, Less Liabilities (3.0%) | 1,225,400 | |||||||||||||||
| ||||||||||||||||
NET ASSETS (100.0%) | $ | 40,615,558 | ||||||||||||||
| ||||||||||||||||
| (a) | Non-income producing security. |
| (b) | Security determined to be illiquid under the procedures approved by the Fund’s Board of Trustees. Information related to the illiquid security is as follows: |
| Date(s) of Purchase | Security | Cost | Market Value | % of Net Assets | ||||||||
| ||||||||||||
05/03/13 - 09/26/13 | Vietnam National Reinsurance Corp. | $ | 233,413 | $ | 237,015 | 0.6% | ||||||
Certain securities were fair valued in good faith through consideration of other factors in accordance with procedures established by and under the general supervision of the Board of Trustees (Note 2).
18 |
(855) 732-9220 | seafarerfunds.com |
Seafarer Overseas Growth and Income Fund | Portfolio of Investments | |
| October 31, 2013 (Unaudited) |
Currency Abbreviations | ||||
BRL | - | Brazil Real | ||
CLP | - | Chile Peso | ||
HKD | - | Hong Kong Dollar | ||
IDR | - | Indonesia Rupiah | ||
INR | - | India Rupee | ||
JPY | - | Japan Yen | ||
KRW | - | South Korea Won | ||
MXN | - | Mexico Peso | ||
MYR | - | Malaysia Ringgit | ||
PLN | - | Poland Zloty | ||
SGD | - | Singapore Dollar | ||
THB | - | Thailand Baht | ||
TRY | - | Turkey Lira | ||
TWD | - | Taiwan New Dollar | ||
USD | - | United States Dollar | ||
VND | - | Vietnam Dong | ||
ZAR | - | South Africa Rand | ||
Common Abbreviations: | ||||
ADR | - | American Depositary Receipt. | ||
AS | - | Andonim Sirketi, Joint Stock Company in Turkey. | ||
Bhd | - | Berhad, Public Limited Company in Malaysia. | ||
JSC | - | Joint Stock Company. | ||
Ltd. | - | Limited. | ||
PCL | - | Public Company Limited. | ||
SA | - | Generally designates corporations in various countries, mostly those employing the civil law. This translates literally in all languages mentioned as anonymous company. | ||
SAB de CV | - | A variable capital company. | ||
Tbk PT | - | Terbuka is the Indonesian term for limited liability company. | ||
Holdings are subject to change.
For Fund compliance purposes, the Fund’s geographical classifications refer to any one or more of the sub-classifications used by one or more widely recognized market indexes or ratings group indexes, and/or as defined by Fund management. This definition may not apply for purposes of this report, which may combine sub-classifications for reporting ease. Geographical regions are shown as a percentage of net assets.
See Accompanying Notes to Financial Statements.
Semi-Annual Report | October 31, 2013 |
19 |
Seafarer Overseas Growth and Income Fund | Statement of Assets and Liabilities | |
| October 31, 2013 (Unaudited) |
ASSETS: | ||||
Investments, at value | $ | 39,390,158 | ||
Cash | 1,015,455 | |||
Foreign currency, at value (Cost $496,573) | 496,099 | |||
Receivable for shares sold | 26,575 | |||
Interest and dividends receivable | 90,749 | |||
Prepaid expenses and other assets | 10,755 | |||
| ||||
Total Assets | 41,029,791 | |||
| ||||
LIABILITIES: | ||||
Payable for investments purchased | 314,030 | |||
Administrative fees payable | 3,923 | |||
Co-administrative & shareholder servicing fees payable | 9,689 | |||
Payable for shares redeemed | 11,987 | |||
Investment advisory fees payable | 4,863 | |||
Trustee fees and expenses payable | 940 | |||
Audit and tax fees payable | 10,586 | |||
Accrued expenses and other liabilities | 58,215 | |||
| ||||
Total Liabilities | 414,233 | |||
| ||||
NET ASSETS | $ | 40,615,558 | ||
| ||||
NET ASSETS CONSIST OF: | ||||
Paid-in capital (Note 5) | $ | 37,385,311 | ||
Accumulated net investment income | 60,683 | |||
Accumulated net realized gain on investments and foreign currency transactions | 1,075,153 | |||
Net unrealized appreciation on investments and translation of assets and liabilities in foreign currencies | 2,094,411 | |||
| ||||
NET ASSETS | $ | 40,615,558 | ||
| ||||
INVESTMENTS, AT COST | $ | 37,293,491 | ||
PRICING OF SHARES | ||||
Investor Class: | ||||
Net Asset Value, offering and redemption price per share | $ | 11.86 | ||
Net Assets | $ | 26,893,844 | ||
Shares of beneficial interest outstanding | 2,267,338 | |||
Institutional Class: | ||||
Net Asset Value, offering and redemption price per share | $ | 11.87 | ||
Net Assets | $ | 13,721,714 | ||
Shares of beneficial interest outstanding | 1,155,543 | |||
See Accompanying Notes to Financial Statements.
20 |
(855) 732-9220 | seafarerfunds.com |
Seafarer Overseas Growth and Income Fund | Statement of Operations | |
| For the Six Months Ended October 31, 2013 (Unaudited) |
INVESTMENT INCOME: | ||||||
Dividends | $ | 765,488 | ||||
Foreign taxes withheld on dividends | (68,871) | |||||
Interest and other income | 9,013 | |||||
| ||||||
Total investment income | 705,630 | |||||
| ||||||
EXPENSES: | ||||||
Investment advisory fees | 154,039 | |||||
Administrative and transfer agency fees | 101,676 | |||||
Co-administrative & shareholder servicing fees | ||||||
Investor Class | 8,054 | |||||
Institutional Class | 2,043 | |||||
Trustee fees and expenses | 927 | |||||
Registration/filing fees | 16,227 | |||||
Shareholder service plan fees | ||||||
Investor Class | 14,855 | |||||
Institutional Class | 2,030 | |||||
Legal fees | 3,546 | |||||
Audit fees | 8,620 | |||||
Reports to shareholders and printing fees | 6,726 | |||||
Custody fees | 26,136 | |||||
Miscellaneous | 6,299 | |||||
| ||||||
Total expenses | 351,178 | |||||
Less fees waived/reimbursed by investment advisor | ||||||
Investor Class | (69,574) | |||||
Institutional Class | (37,117) | |||||
| ||||||
Total net expenses | 244,487 | |||||
| ||||||
NET INVESTMENT INCOME: | 461,143 | |||||
| ||||||
Net realized gain on investments | 434,824 | |||||
Net realized loss on foreign currency transactions | (65,143) | |||||
Net change in unrealized depreciation on investments (net of foreign capital gains tax of $(60,082)) | (701,137) | |||||
Net change in unrealized depreciation on translation of assets and liabilities in foreign currency transactions | (2,319) | |||||
| ||||||
NET REALIZED AND UNREALIZED LOSS ON INVESTMENTS AND FOREIGN CURRENCY TRANSLATIONS | (333,775) | |||||
| ||||||
NET INCREASE IN NET ASSETS RESULTING FROM OPERATIONS | $ | 127,368 | ||||
See Accompanying Notes to Financial Statements.
Semi-Annual Report | October 31, 2013 |
21 |
Seafarer Overseas Growth and Income Fund | Statements of Changes in Net Assets | |
For the Six Months October 31, 2013 | Year Ended April 30, 2013 | |||||||||
OPERATIONS: | ||||||||||
Net investment income | $ | 461,143 | $ | 193,701 | ||||||
Net realized gain on investments and foreign currency transactions | 369,681 | 691,065 | ||||||||
Net change in unrealized appreciation/(depreciation) on investments and foreign currency translations | (703,456) | 2,787,668 | ||||||||
| ||||||||||
Net increase in net assets resulting from operations | 127,368 | 3,672,434 | ||||||||
| ||||||||||
DISTRIBUTIONS TO SHAREHOLDERS: | ||||||||||
From net investment income | ||||||||||
Investor Class | (300,725) | (112,900) | ||||||||
Institutional Class | (160,232) | (49,868) | ||||||||
From net realized gains on investments | ||||||||||
Investor Class | – | (867) | ||||||||
Institutional Class | – | (254) | ||||||||
| ||||||||||
Net decrease in net assets from distributions | (460,957) | (163,889) | ||||||||
| ||||||||||
BENEFICIAL INTEREST TRANSACTIONS (NOTE 5): | ||||||||||
Shares sold | ||||||||||
Investor Class | $ | 10,920,081 | $ | 28,091,620 | ||||||
Institutional Class | 7,084,317 | 9,669,354 | ||||||||
Dividends reinvested | ||||||||||
Investor Class | 282,608 | 110,846 | ||||||||
Institutional Class | 150,917 | 46,662 | ||||||||
Shares redeemed, net of redemption fees | ||||||||||
Investor Class | (10,426,700) | (5,803,722) | ||||||||
Institutional Class | (4,895,696) | (579,535) | ||||||||
| ||||||||||
Net increase in net assets derived from beneficial interest transactions | 3,115,527 | 31,535,225 | ||||||||
| ||||||||||
Net increase in net assets | $ | 2,781,938 | $ | 35,043,770 | ||||||
NET ASSETS: | ||||||||||
Beginning of period | 37,833,620 | 2,789,850 | ||||||||
| ||||||||||
End of period (including accumulated net investment income of $60,683 and $60,497, respectively) | $ | 40,615,558 | $ | 37,833,620 | ||||||
22 |
(855) 732-9220 | seafarerfunds.com |
Seafarer Overseas Growth and Income Fund | Statements of Changes in Net Assets | |
For the Six Months Ended October 31, 2013 | Year Ended April 30, 2013 | |||||||||
Other Information: | ||||||||||
SHARE TRANSACTIONS: | ||||||||||
Investor Class | ||||||||||
Sold | 956,067 | 2,566,567 | ||||||||
Distributions reinvested | 25,809 | 10,140 | ||||||||
Redeemed | (927,449) | (505,665) | ||||||||
| ||||||||||
Net increase in shares outstanding | 54,427 | 2,071,042 | ||||||||
Institutional Class | ||||||||||
Sold | 617,755 | 878,414 | ||||||||
Distributions reinvested | 13,782 | 4,298 | ||||||||
Redeemed | (440,179) | (50,808) | ||||||||
| ||||||||||
Net increase in shares outstanding | 191,358 | 831,904 | ||||||||
See Accompanying Notes to Financial Statements.
Semi-Annual Report | October 31, 2013 |
23 |
Seafarer Overseas Growth and Income Fund | Financial Highlights | |
| For a share outstanding through the periods presented |
| Investor Class | For the Six Months | Year Ended April 30, 2013 | For the Period February 15, 2012 (Inception) to April 30, 2012 | |||||||||
| ||||||||||||
NET ASSET VALUE, BEGINNING OF PERIOD | $ | 11.91 | $ | 10.18 | $ | 10.00 | ||||||
INCOME FROM OPERATIONS: | ||||||||||||
Net investment income(a) | 0.14 | 0.10 | 0.05 | |||||||||
Net realized and unrealized gain/(loss) on investments | (0.04) | 1.74 | 0.13 | |||||||||
| ||||||||||||
Total from investment operations | 0.10 | 1.84 | 0.18 | |||||||||
| ||||||||||||
LESS DISTRIBUTIONS: | ||||||||||||
From net investment income | (0.15) | (0.11) | – | |||||||||
From net realized gains on investments | – | (0.00) | (b) | – | ||||||||
| ||||||||||||
Total distributions | (0.15) | (0.11) | – | |||||||||
| ||||||||||||
REDEMPTION FEES ADDED TO PAID IN CAPITAL | 0.00 | (c) | 0.00 | (c) | – | |||||||
| ||||||||||||
NET INCREASE/(DECREASE) IN NET ASSET VALUE | (0.05) | 1.73 | 0.18 | |||||||||
| ||||||||||||
NET ASSET VALUE, END OF PERIOD | $ | 11.86 | $ | 11.91 | $ | 10.18 | ||||||
| ||||||||||||
TOTAL RETURN(d) | 0.90% | 18.24% | 1.80% | |||||||||
RATIOS/SUPPLEMENTAL DATA: | ||||||||||||
Net assets, end of period (in 000s) | $ | 26,894 | $ | 26,348 | $ | 1,443 | ||||||
Operating expenses excluding reimbursement/waiver | 1.98% | (e) | 2.82% | 18.96% | (e) | |||||||
Operating expenses including reimbursement/waiver | 1.40% | (e)(f) | 1.49% | 1.60% | (e) | |||||||
Net investment income including reimbursement/waiver | 2.51% | (e) | 0.90% | 2.61% | (e) | |||||||
PORTFOLIO TURNOVER RATE(g) | 38% | 39% | 5% | |||||||||
| (a) | Calculated using the average shares method. |
| (b) | Less than $(0.005) per share. |
| (c) | Less than $0.005 per share. |
| (d) | Total returns are for the period indicated and have not been annualized. Total returns would have been lower had certain expenses not been waived during the period. Returns shown do not reflect the deduction of taxes that a shareholder would pay on Fund distributions or the redemption of Fund shares. |
| (e) | Annualized. |
| (f) | Contractual expense limitation changed from 1.60% to 1.40% effective August 31, 2013. |
| (g) | Portfolio turnover rate for periods less than one full year have not been annualized. |
See Accompanying Notes to Financial Statements.
24 |
(855) 732-9220 | seafarerfunds.com |
Seafarer Overseas Growth and Income Fund | Financial Highlights | |
| For a share outstanding through the periods presented |
| Institutional Class | For the Six Months | Year Ended April 30, 2013 | For the Period February 15, 2012 (Inception) to April 30, 2012 | |||||||||
| ||||||||||||
NET ASSET VALUE, BEGINNING OF PERIOD | $ | 11.91 | $ | 10.18 | $ | 10.00 | ||||||
INCOME FROM OPERATIONS: | ||||||||||||
Net investment income(a) | 0.15 | 0.14 | 0.04 | |||||||||
Net realized and unrealized gain/(loss) on investments | (0.04) | 1.71 | 0.14 | |||||||||
| ||||||||||||
Total from investment operations | 0.11 | 1.85 | 0.18 | |||||||||
| ||||||||||||
LESS DISTRIBUTIONS: | ||||||||||||
From net investment income | (0.15) | (0.12) | – | |||||||||
From net realized gains on investments | – | (0.00) | (b) | – | ||||||||
| ||||||||||||
Total distributions | (0.15) | (0.12) | – | |||||||||
| ||||||||||||
REDEMPTION FEES ADDED TO PAID IN CAPITAL | 0.00 | (c) | 0.00 | (c) | – | |||||||
| ||||||||||||
NET INCREASE/(DECREASE) IN NET ASSET VALUE | (0.04) | 1.73 | 0.18 | |||||||||
| ||||||||||||
NET ASSET VALUE, END OF PERIOD | $ | 11.87 | $ | 11.91 | $ | 10.18 | ||||||
| ||||||||||||
TOTAL RETURN(d) | 1.00% | 18.33% | 1.80% | |||||||||
RATIOS/SUPPLEMENTAL DATA: | ||||||||||||
Net assets, end of period (in 000s) | $ | 13,722 | $ | 11,486 | $ | 1,346 | ||||||
Operating expenses excluding reimbursement/waiver | 1.85% | (e) | 2.88% | 21.65% | (e) | |||||||
Operating expenses including reimbursement/waiver | 1.25% | (e)(f) | 1.35% | 1.45% | (e) | |||||||
Net investment income including reimbursement/waiver | 2.61% | (e) | 1.28% | 2.00% | (e) | |||||||
PORTFOLIO TURNOVER RATE(g) | 38% | 39% | 5% | |||||||||
| (a) | Calculated using the average shares method. |
| (b) | Less than $(0.005) per share. |
| (c) | Less than $0.005 per share. |
| (d) | Total returns are for the period indicated and have not been annualized. Total returns would have been lower had certain expenses not been waived during the period. Returns shown do not reflect the deduction of taxes that a shareholder would pay on Fund distributions or the redemption of Fund shares. |
| (e) | Annualized. |
| (f) | Contractual expense limitation changed from 1.45% to 1.25% effective August 31, 2013. |
| (g) | Portfolio turnover rate for periods less than one full year have not been annualized. |
See Accompanying Notes to Financial Statements.
Semi-Annual Report | October 31, 2013 |
25 |
| Seafarer Overseas Growth and Income Fund | Notes to Financial Statements | |
| October 31, 2013 (Unaudited) |
1. ORGANIZATION
Financial Investors Trust (the “Trust”), a Delaware statutory trust, is an open-end management investment company registered under the Investment Company Act of 1940, as amended (“1940 Act”). As of October 31, 2013, the Trust had 27 registered funds. This semi-annual report describes the Seafarer Overseas Growth and Income Fund (the “Fund”). The Fund seeks to provide long-term capital appreciation along with some current income; it also seeks to mitigate adverse volatility in returns. The Fund offers Investor Class and Institutional Class shares. All classes of shares have identical rights to earnings, assets and voting privileges, except for class specific expenses and exclusive rights to vote on matters affecting only individual classes.
2. SIGNIFICANT ACCOUNTING POLICIES
The accompanying financial statements were prepared in accordance with accounting principles generally accepted in the United States of America (“U.S. GAAP”). The preparation of financial statements in conformity with U.S. GAAP requires management to make certain estimates and assumptions that affect the reported amounts of assets and liabilities and disclosures of contingent assets and liabilities at the date of the financial statements and the reported amounts of revenue and expenses during the period. Actual results could differ from those estimates. The following is a summary of significant accounting policies consistently followed by the Fund in preparation of its financial statements.
Investment Valuation: The Fund generally values its securities based on market prices determined at the close of regular trading on the New York Stock Exchange (“NYSE”), normally 4:00 p.m. Eastern Time, on each day the NYSE is open for trading.
For equity securities and mutual funds that are traded on an exchange, the market price is usually the closing sale or official closing price on that exchange. In the case of equity securities not traded on an exchange, or if such closing prices are not otherwise available, the securities are valued at the mean of the most recent bid and ask prices on such day. Redeemable securities issued by open-end registered investment companies are valued at the investment company’s applicable net asset value, with the exception of exchange-traded open-end investment companies, which are priced as equity securities.
Equity securities that are primarily traded on foreign securities exchanges are valued at the closing values of such securities on their respective foreign exchanges, except when an event occurs subsequent to the close of the foreign exchange but before the close of the NYSE, such that the securities’ value would likely change. In such an event, the fair values of those securities are determined in good faith through consideration of other factors in accordance with procedures established by and under the general supervision of the Board of Trustees (the “Board”). The Fund will use a fair valuation model provided by an independent pricing service, which is intended to reflect fair value when a security’s value or a meaningful portion of the Fund’s portfolio is believed to have been materially affected by a valuation event that has occurred between the close of the exchange or market on which the security is traded and the close of the regular trading day on the NYSE. The Fund’s valuation procedures set forth certain triggers that inform the Fund when to use the fair valuation model.
The market price for debt obligations is generally the price supplied by an independent third-party pricing service approved by the Board which may use a matrix, formula or other objective method that takes into consideration quotations from dealers, market transactions in comparable investments, market indices and yield curves. If vendors are unable to supply a price, or if the price supplied is deemed to be
26 |
(855) 732-9220 | seafarerfunds.com |
| Seafarer Overseas Growth and Income Fund | Notes to Financial Statements | |
| October 31, 2013 (Unaudited) |
unreliable, the market price may be determined using quotations received from one or more broker–dealers that make a market in the security. Short–term debt obligations that will mature in 60 days or less are valued at amortized cost, unless it is determined that using this method would not reflect an investment’s fair value.
Forward currency exchange contracts have a market value determined by the prevailing foreign currency exchange daily rates and current foreign currency exchange forward rates. The foreign currency exchange forward rates are calculated using an automated system that estimates rates on the basis of the current day foreign currency exchange rates and forward foreign currency exchange rates supplied by a pricing service.
When such prices or quotations are not available, or when the Fair Value Committee appointed by the Board believes that they are unreliable, securities may be priced using fair value procedures approved by the Board.
Certain foreign countries impose a tax on capital gains which is accrued by the Fund based on unrealized appreciation, if any, on affected securities. The tax is paid when the gain is realized.
Fair Value Measurements: The Fund discloses the classification of its fair value measurements following a three-tier hierarchy based on the inputs used to measure fair value. Inputs refer broadly to the assumptions that market participants would use in pricing the asset or liability, including assumptions about risk. Inputs may be observable or unobservable. Observable inputs reflect the assumptions market participants would use in pricing the asset or liability that are developed based on market data obtained from sources independent of the reporting entity. Unobservable inputs reflect the reporting entity’s own assumptions about the assumptions market participants would use in pricing the asset or liability that are developed based on the best information available.
Various inputs are used in determining the value of the Fund’s investments as of the end of the reporting period. When inputs used fall into different levels of the fair value hierarchy, the level in the hierarchy within which the fair value measurement falls is determined based on the lowest level input that is significant to the fair value measurement in its entirety. The designated input levels are not necessarily an indication of the risk or liquidity associated with these investments. These inputs are categorized in the following hierarchy under applicable financial accounting standards:
Level 1 – | Unadjusted quoted prices in active markets for identical investments, unrestricted assets or liabilities that a Fund has the ability to access at the measurement date; | |
Level 2 – | Quoted prices which are not active, quoted prices for similar assets or liabilities in active markets or inputs other than quoted prices that are observable (either directly or indirectly) for substantially the full term of the asset or liability; and | |
Level 3 – | Significant unobservable prices or inputs (including the Fund’s own assumptions in determining the fair value of investments) where there is little or no market activity for the asset or liability at the measurement date. | |
Semi-Annual Report | October 31, 2013 |
27 |
| Seafarer Overseas Growth and Income Fund | Notes to Financial Statements | |
| October 31, 2013 (Unaudited) |
The following is a summary of each input used to value the Fund as of October 31, 2013:
| Investments in Securities at Value | Level 1 - Quoted Prices | Level 2 - Other Significant Observable Inputs | Level 3 - Significant Unobservable Inputs | Total | ||||||||||||
| ||||||||||||||||
Common Stocks | ||||||||||||||||
Brazil | $ | 3,232,151 | $ | – | $ | – | $ | 3,232,151 | ||||||||
Chile | 898,239 | – | – | 898,239 | ||||||||||||
China / Hong Kong | 5,657,623 | – | – | 5,657,623 | ||||||||||||
India | 1,954,771 | – | – | 1,954,771 | ||||||||||||
Indonesia | 1,120,869 | – | – | 1,120,869 | ||||||||||||
Japan | 2,806,346 | – | – | 2,806,346 | ||||||||||||
Malaysia | 1,552,482 | – | – | 1,552,482 | ||||||||||||
Mexico | 1,808,894 | – | – | 1,808,894 | ||||||||||||
Poland | 3,694,139 | – | – | 3,694,139 | ||||||||||||
Singapore | 3,195,790 | – | – | 3,195,790 | ||||||||||||
South Africa | 858,155 | – | – | 858,155 | ||||||||||||
South Korea | 1,550,790 | – | – | 1,550,790 | ||||||||||||
Taiwan | 1,970,230 | – | – | 1,970,230 | ||||||||||||
Thailand | 822,001 | – | – | 822,001 | ||||||||||||
Turkey | 2,794,865 | – | – | 2,794,865 | ||||||||||||
Vietnam | 2,194,888 | – | – | 2,194,888 | ||||||||||||
Preferred Stocks | ||||||||||||||||
Brazil | 1,319,346 | – | – | 1,319,346 | ||||||||||||
South Korea | 1,168,579 | – | – | 1,168,579 | ||||||||||||
Convertible Corporate Bonds(a) | – | 790,000 | – | 790,000 | ||||||||||||
| ||||||||||||||||
Total | $ | 38,600,158 | $ | 790,000 | $ | – | $ | 39,390,158 | ||||||||
| ||||||||||||||||
| ||||||||||||||||
| (a) | For detailed descriptions of countries, see the accompanying Portfolio of Investments. |
The Fund recognizes transfers between levels as of the end of the period. For the six months ended October 31, 2013, the Fund did not have any securities that used significant unobservable inputs (Level 3) in determining fair value.
Security amounts the Fund transferred between Levels 1 and 2 at October 31, 2013 were as follows:
Level 1 - Quoted Prices | Level 2 - Other Significant Observable Inputs | |||||||||||||
| Transfers In | Transfers (Out) | Transfers In | Transfers (Out) | |||||||||||
| ||||||||||||||
Common Stocks | $ | 18,152,690 | $ | – | $ | – | $ (18,152,690) | |||||||
Preferred Stocks | 1,168,579 | – | – | (1,168,579) | ||||||||||
| ||||||||||||||
Total | $ | 19,321,269 | $ | – | $ | – | $ (19,321,269) | |||||||
| ||||||||||||||
| ||||||||||||||
28 |
(855) 732-9220 | seafarerfunds.com |
Seafarer Overseas Growth and Income Fund | Notes to Financial Statements | |
| October 31, 2013 (Unaudited) |
The above transfers were due to the Fund utilizing a fair value evaluation service with respect to international securities with an earlier market closing than the Fund’s net asset value computation cutoff. When events trigger the use of the fair value evaluation service on a reporting date, it results in certain securities transferring from a Level 1 to a Level 2.
Investment Transactions and Investment Income: Investment transactions are accounted for on the date the investments are purchased or sold (trade date). Realized gains and losses from investment transactions are reported on an identified cost basis. Interest income, which includes accretion of discounts and amortization of premiums, is accrued and recorded as earned. Dividend income is recognized on the ex-dividend date or for certain foreign securities, as soon as information is available to the Fund. All of the realized and unrealized gains and losses and net investment income are allocated daily to each class in proportion to its average daily net assets.
Foreign Securities: The Fund may directly purchase securities of foreign issuers. Investing in securities of foreign issuers involves special risks not typically associated with investing in securities of U.S. issuers. The risks include possible reevaluation of currencies, the inability to repatriate foreign currency, less complete financial information about companies and possible future adverse political and economic developments. Moreover, securities of many foreign issuers and their markets may be less liquid and their prices more volatile than those of securities of comparable U.S. issuers.
Foreign Currency Translation: The books and records of the Fund are maintained in U.S. dollars. Investment valuations and other assets and liabilities initially expressed in foreign currencies are converted each business day into U.S. dollars based upon current exchange rates. Prevailing foreign exchange rates may generally be obtained at the close of the NYSE (normally, 4:00 p.m. Eastern time). The portion of realized and unrealized gains or losses on investments due to fluctuations in foreign currency exchange rates is not separately disclosed and is included in realized and unrealized gains or losses on investments, when applicable.
Foreign Currency Spot Contracts: The Fund may enter into foreign currency spot contracts to facilitate transactions in foreign securities or to convert foreign currency receipts into U.S. dollars. A foreign currency spot contract is an agreement between two parties to buy and sell currencies at the current market rate, for settlement generally within two business days. The U.S. dollar value of the contracts is determined using current currency exchange rates supplied by a pricing service. The contract is marked-to-market daily for settlements beyond one day and any change in market value is recorded as an unrealized gain or loss. When the contract is closed, the Fund records a realized gain or loss equal to the difference between the value on the open and close date. Losses may arise from changes in the value of the foreign currency, or if the counterparties do not perform under the contract’s terms. The maximum potential loss from such contracts is the aggregate face value in U.S. dollars at the time the contract was opened.
Trust Expenses: Some expenses of the Trust can be directly attributed to the Fund. Expenses which cannot be directly attributed to the Fund are apportioned among all funds in the Trust based on average net assets of each fund.
Fund and Class Expenses: Expenses that are specific to the Fund or class of shares of the Fund are charged directly to the Fund or share class. All expenses of the Fund, other than class specific expenses, are allocated daily to each class in proportion to its average daily net assets. Fees provided under the shareholder service plans for a particular class of the Fund are charged to the operations of such class.
Semi-Annual Report | October 31, 2013 |
29 |
Seafarer Overseas Growth and Income Fund | Notes to Financial Statements | |
| October 31, 2013 (Unaudited) |
Federal Income Taxes: The Fund complies with the requirements under Subchapter M of the Internal Revenue Code of 1986, as amended, applicable to regulated investment companies and intends to distribute substantially all of its net taxable income and net capital gains, if any, each year so that it will not be subject to excise tax on undistributed income and gains. The Fund is not subject to income taxes to the extent such distributions are made.
As of and during the six months ended October 31, 2013, the Fund did not have a liability for any unrecognized tax benefits. The Fund files U.S. federal, state, and local tax returns as required. The Fund’s tax returns are subject to examination by the relevant tax authorities until expiration of the applicable statute of limitations, which is generally three years after the filing of the tax return for federal purposes and four years for most state returns. Tax returns for open years have incorporated no uncertain tax positions that require a provision for income taxes.
Distributions to Shareholders: The Fund normally pays dividends from net investment income, if any, on a semi-annual basis. The Fund normally distributes capital gains, if any, on an annual basis. Income dividend distributions are derived from interest and other income the Fund receives from its investments, including short term capital gains. Long term capital gain distributions are derived from gains realized when the Fund sells a security it has owned for more than one year. The Fund may make additional distributions and dividends at other times if the adviser believes doing so may be necessary for the Fund to avoid or reduce taxes.
3. TAX BASIS INFORMATION
Tax Basis of Investments: As of October 31, 2013, the aggregate cost of investments, gross unrealized appreciation/ (depreciation) and net unrealized appreciation for Federal tax purposes were as follows:
| Cost of Investments | Gross Unrealized Appreciation | Gross Unrealized (Depreciation) | Net Unrealized Appreciation | |||||||||||||
Seafarer Overseas Growth and Income Fund | $ | 37,379,659 | $ | 3,225,823 | $ | (1,215,324 | ) | $ | 2,010,499 | |||||||
Tax Basis of Distributions to Shareholders: The character of distributions made during the year from net investment income or net realized gains may differ from its ultimate characterization for federal income tax purposes. Also, due to the timing of dividend distributions, the fiscal year in which amounts are distributed may differ from the fiscal year in which the income or realized gain is recorded by the Fund.
The tax character of distributions paid by the Fund for the fiscal year ended April 30, 2013, were as follows:
| Ordinary Income | Long-Term Capital Gain | |||||
Seafarer Overseas Growth and Income Fund | $ | 163,889 | $ – | |||
The amounts and characteristics of tax basis distributions and composition of distributable earnings/(accumulated losses) are finalized at fiscal year-end. Accordingly, tax basis balances have not been determined as of October 31, 2013.
30 |
(855) 732-9220 | seafarerfunds.com |
Seafarer Overseas Growth and Income Fund | Notes to Financial Statements | |
| October 31, 2013 (Unaudited) |
4. SECURITIES TRANSACTIONS
The cost of purchases and proceeds from sales of securities excluding short term securities during the six months ended October 31, 2013, were as follows:
Purchases of Securities | Proceeds From Sales of Securities | |||||||
Seafarer Overseas Growth and Income Fund | $ | 15,681,625 | $ | 13,192,767 | ||||
5. SHARES OF BENEFICIAL INTEREST
The capitalization of the Trust consists of an unlimited number of shares of beneficial interest with no par value per share. Holders of the shares of the Fund of the Trust have one vote for each share held and a proportionate fraction of a vote for each fractional share. All shares issued and outstanding are fully paid and are non-assessable, transferable and redeemable at the option of the shareholder. Shares have no pre-emptive rights.
Shares redeemed within 90 days of purchase may incur a 2% short-term redemption fee deducted from the redemption amount. The redemption fee is reflected in the “Shares redeemed, net of redemption fees” in the Statements of Changes in Net Assets. During the six months ended October 31, 2013 and the year ended April 30, 2013, the Fund retained the following redemption fees:
| Fund | For the Six Months Ended October 31, 2013 (Unaudited) | Year Ended April 30, 2013 | ||
| ||||
Seafarer Overseas Growth and Income Fund – Investor Class | $ 1,858 | $ 5,490 | ||
| ||||
Seafarer Overseas Growth and Income Fund – Institutional Class | $ 708 | $ 928 | ||
| ||||
6. MANAGEMENT AND RELATED-PARTY TRANSACTIONS
Seafarer Capital Partners, LLC (“Seafarer” or the “Adviser”), subject to the authority of the Board, is responsible for the overall management and administration of the Fund’s business affairs. The Adviser manages the investments of the Fund in accordance with the Fund’s investment objective, policies and limitations and investment guidelines established jointly by the Adviser and the Trustees. Pursuant to the Advisory Agreement, (the “Advisory Agreement”), the Fund pays the Adviser an annual management fee of 0.85%, based on the Fund’s average daily net assets. The management fee is paid on a monthly basis.
From the inception of the Fund through August 30, 2013, the Adviser had contractually agreed to limit certain Fund expenses to 1.60% and 1.45% of the Fund’s average daily net assets in the Investor and Institutional share classes, respectively. Effective January 15, 2013, the Adviser had also voluntarily agreed to limit certain Fund expenses to 1.40% and 1.25% of the Fund’s average daily net assets in the Investor and Institutional share classes, respectively. Effective August 31, 2013, the Adviser has contractually agreed to limit certain Fund expenses (exclusive of brokerage expenses, interest expenses, taxes and extraordinary expenses) to 1.40% and 1.25% of the Fund’s average daily net assets in the Investor and Institutional share classes, respectively, through August 31, 2014, at which point it may be extended further. The Fund may have to repay some of these waivers and reimbursements to the Adviser in the following three years. Pursuant to this agreement, the Fund will
Semi-Annual Report | October 31, 2013 |
31 |
Seafarer Overseas Growth and Income Fund | Notes to Financial Statements | |
| October 31, 2013 (Unaudited) |
reimburse the Adviser for any contractual fee waivers and expense reimbursements made by the Adviser, provided that any such reimbursements made by the Fund to the Adviser will not cause the Fund’s expense limitation to exceed expense limitations in existence at the time the expense was incurred, or at the time of the reimbursement, whichever is lower, and the reimbursement is made within three years after the end of the fiscal year in which fees or expenses were incurred.
For the six months ended October 31, 2013, the fee waivers and/or reimbursements were as follows:
| Fund | Fees Waived/ Reimbursed By Advisor | Recoupment of Previously Waived Fees By Advisor | Total | |||||||||
Seafarer Overseas Growth and Income Fund | ||||||||||||
Investor Class | $ | 69,574 | $ | – | $ | 69,574 | ||||||
Institutional Class | 37,117 | – | 37,117 | |||||||||
As of October 31, 2013, the balances of recoupable expenses for each class were as follows:
| Fund | Expires 2015 | Expires 2016 | Total | |||||||||
Seafarer Overseas Growth and Income Fund | ||||||||||||
Investor Class | $ | 22,136 | $ | 177,710 | $ | 199,846 | ||||||
Institutional Class | 51,869 | 78,354 | 130,223 | |||||||||
Fund Accounting Fees and Expenses
ALPS Fund Services, Inc. (“ALPS” and the “Administrator”) (an affiliate of ALPS Distributors, Inc.) provides administrative, fund accounting and other services to the Fund under the Administration, Bookkeeping and Pricing Services Agreement with the Trust. Under this Agreement, ALPS is paid fees by the Fund, accrued on a daily basis and paid on a monthly basis following the end of the month, based on the greater of (a) an annual total fee of $143,000 or (b) the following fee schedule:
| Average Total Net Assets | Contractual Fee | |||
Between $0-$500M | 0.05% | |||
$500M-$1B | 0.03% | |||
Above $1B | 0.02% |
The Administrator is also reimbursed by the Fund for certain out-of-pocket expenses.
Administrative and Shareholder Services
From the inception of the Fund through August 30, 2013, the Adviser provided administrative and shareholder services to the Fund under the Co-Administration and Shareholder Services Agreement with the Trust. Under this Agreement, the Adviser was entitled to fees, accrued on a daily basis and paid on a monthly basis following the end of the month, of 0.10% of the average daily net assets of the Investor Class and 0.05% of the average daily net assets of the Institutional Class, and was reimbursed for certain out-of-pocket expenses. As of August 31, 2013, the Co-Administration and Shareholder Services Agreement with the Trust was terminated with the approval of the Board of Trustees. Effective on August 31, 2013 and going forward, the Adviser continues to provide the administrative and shareholder services to the Fund that were described under the Agreement, but the Adviser does not receive an Administrative and Shareholder Servicing Fee for doing so.
32 |
(855) 732-9220 | seafarerfunds.com |
Seafarer Overseas Growth and Income Fund | Notes to Financial Statements | |
| October 31, 2013 (Unaudited) |
Transfer Agent
ALPS serves as transfer, dividend paying and shareholder servicing agent for the Fund (“Transfer Agent”). ALPS is compensated based upon a $25,000 annual base fee for the Fund, and annually $9 per direct open account and $7 per open account through NSCC. The Transfer Agent is also reimbursed by the Fund for certain out-of-pocket expenses.
Compliance Services
ALPS provides services that assist the Trust’s Chief Compliance Officer in monitoring and testing the policies and procedures of the Trust in conjunction with requirements under Rule 38a-1 under the 1940 Act under the Chief Compliance Officer Services Agreement with the Trust. Under this Agreement, the Adviser pays ALPS an annual base fee of $30,000 and reimburses ALPS for certain out-of-pocket expenses.
Principal Financial Officer
ALPS provides principal financial officer services to the Fund under the Principal Financial Officer Services Agreement with the Trust. Under this Agreement, the Adviser pays ALPS an annual base fee of $10,000 and reimburses ALPS for certain out-of-pocket expenses.
Distributor
ALPS Distributors, Inc. (“ADI” or the “Distributor”) (an affiliate of ALPS) acts as the distributor of the Fund’s shares pursuant to the Distribution Agreement with the Trust. Under this agreement, the Adviser pays ADI an annual base fee of $12,000 and reimburses ADI for certain out-of-pocket expenses. Shares are sold on a continuous basis by ADI as agent for the Fund, and ADI has agreed to use its best efforts to solicit orders for the sale of the Fund’s shares, although it is not obliged to sell any particular amount of shares. ADI is registered as a broker-dealer with the Securities and Exchange Commission.
Shareholder Service Plan for Investor Class and Institutional Class Shares
The Fund has adopted a shareholder service plan (a “Service Plan”) for each of its share classes. Under the Service Plan, the Fund is authorized to enter into shareholder service agreements with investment advisors, financial institutions and other service providers (“Participation Organizations”) to maintain and provide certain administrative and servicing functions in relation to the accounts of shareholders. The Service Plan will cause the Fund to pay an aggregate fee, not to exceed on an annual basis 0.15% and 0.05% of the average daily net asset value of the Investor and Institutional share classes, respectively. Such payment will be made on assets attributable to or held in the name of a Participating Organization, on behalf of its clients as compensation for providing service activities pursuant to an agreement with a Participating Organization. Any amount of such payment not paid during the Fund’s fiscal year for such service activities shall be reimbursed to the Fund as soon as practicable after the end of the fiscal year.
7. INDEMNIFICATIONS
Under the Trust’s organizational documents, its officers and Trustees are indemnified against certain liability arising out of the performance of their duties to the Trust. Additionally, in the normal course of business, the Trust enters into contracts with service providers that may contain general indemnification clauses, which may permit indemnification to the extent permissible under the applicable law. The Trust’s maximum exposure under these arrangements is unknown, as this would involve future claims that may be made against the Trust that have not yet occurred.
Semi-Annual Report | October 31, 2013 |
33 |
Seafarer Overseas Growth and Income Fund | Notes to Financial Statements | |
| October 31, 2013 (Unaudited) |
8. NEW ACCOUNTING PRONOUNCEMENTS
In June 2013, the Financial Accounting Standards Board (the “FASB”) issued Accounting Standards Update (“ASU”) No. 2013-08, Financial Services-Investment Companies (Topic 946): Amendments to the Scope, Measurement, and Disclosure Requirements. The FASB standard identifies characteristics a company must assess to determine whether it is considered an investment company for financial reporting purposes. This ASU is effective for fiscal years beginning after December 15, 2013. The Fund believes the adoption of this ASU will not have a material impact on its financial statements.
34 |
(855) 732-9220 | seafarerfunds.com |
Seafarer Overseas Growth and Income Fund | Additional Information | |
| October 31, 2013 (Unaudited) |
1. FUND HOLDINGS
The Fund files its complete schedule of portfolio holdings with the Securities and Exchange Commission (the “SEC”) for the first and third quarters of each fiscal year on Form N-Q within 60 days after the end of the period. Copies of the Fund’s Form N-Q are available without charge on the SEC website at http://www.sec.gov. You may also review and copy the Form N-Q at the SEC’s Public Reference Room in Washington, D.C. For more information about the operation of the Public Reference Room, please call the SEC at 1-800-SEC-0330.
2. FUND PROXY VOTING POLICIES, PROCEDURES AND SUMMARIES
The Fund’s policies and procedures used in determining how to vote proxies and information regarding how the Fund voted proxies relating to portfolio securities during the most recent prior 12-month period ending June 30 are available without charge, (1) upon request, by calling toll-free (855) 732-9220 and (2) on the SEC’s website at http://www.sec.gov.
Semi-Annual Report | October 31, 2013 |
35 |
Page Intentionally Left Blank.
| Table of Contents | ||
| October 31, 2013 |
| 1 | ||||
| 6 | ||||
| 7 | ||||
| 11 | ||||
| 12 | ||||
| 13 | ||||
| 15 | ||||
| 16 | ||||
| 22 | ||||
| Stonebridge Small-Cap Growth Fund | Letter to Shareholders | |
| October 31, 2013 (Unaudited) |
November 14, 2013
OVERVIEW
During the first ten months of 2013, the domestic equity indices have broadly rewarded investors with strong, positive returns. Several indices have even reached new all-time highs during the year. On the other hand, the performance returns of domestic bond indices have been challenged this calendar year. In particular, the yield curve has become steeper over the last five months, in part due to concerns that the Federal Reserve may taper its third round of quantitative easing in the near-term. As such, over this five month time period the performance between equities indices and bonds indices has diverged. Not surprisingly given a strong performing equity market, volatility, as measured by the Volatility Index® (VIX), has generally trended down since the beginning of the calendar year. However, there were several periods during 2013 when the Volatility Index® (VIX) rose in excess of 30%.
When analyzing the members of the S&P 500® Total Return Index in aggregate, financial engineering by means of share repurchases remains the preferred method of supplementing earnings per share growth as slower revenue growth persists. Merger and acquisition activity remains widespread as domestic companies take advantage of the relatively low interest rate environment, substantial cash hoards, and elevated stock prices. Economic improvement is slow and steady, supported by increased personal consumption, capital investment in software and equipment, and a strong residential construction market. Inflation is subdued and employment is moderately improving. While these broad themes provided a constructive backdrop to strong equity performance in 2013, the capital markets are always forward-looking. As such, an observer of the equity markets must attribute the currently robust returns to an increasingly positive outlook by investors regarding 2014 economic growth expectations.
One common point of view among Wall Street strategists cites the likelihood of a synchronous improvement in economic growth across the World in 2014. While this conclusion appears likely, there are some data points that may challenge the eventual outcome of these upbeat expectations and hence the performance of the equity markets going forward. First, the ratio of negative forward earnings guidance to positive forward earnings guidance amongst S&P 500® Total Return Index companies remains elevated. As such, the 500 largest U.S. companies have generally yet to see any accelerating growth appear in their order book or pipelines and so remain cautious. Second, total aggregated margin debt is at record levels. In the past, high absolute levels of margin debt corresponded with a peak in the equity markets. Third, aggregated net profit margins at S&P 500® Total Return Index companies are at record levels reflecting in part enhanced productivity and the low cost of debt service (low interest rates). So, while the Fund’s investment team remains positively biased regarding potential future economic growth, it is also cautious that some of this anticipated improvement is already being reflected in the equity markets.
While the Fund’s investments performed well from an absolute return perspective during the first half of the 2014 fiscal year, the Fund’s returns trailed the returns of its respective benchmark, the Russell 2000® Growth Index. A substantial portion of the Fund’s relative underperformance was a result of being underexposed to those economic sectors that performed well during this period and conversely being over-weighted in economic sectors that lagged. For example, the Fund was significantly overweight in technology yet its technology holdings only rose a little over 13% during the six month period. Energy also was an overweight position, yet the Fund’s energy stocks only
| Semi-Annual Report | October 31, 2013 | 1 |
| Stonebridge Small-Cap Growth Fund | Letter to Shareholders | |
| October 31, 2013 (Unaudited) |
rose approximately 2% over this time period. On the other hand, the Fund’s financial sector picks did very well, rising over 26% during the six month time period yet represented a small percentage of the portfolio. While disappointing on a relative basis, from a strategy perspective, the investment team believes the Fund is well positioned for future potential returns.
Stonebridge Small-Cap Growth Fund
For the fiscal year to date through October 31, 2013, the Stonebridge Small-Cap Growth Fund rose 9.15%, less than the 19.93% rise in the Russell 2000® Growth Index. During this six month period, the Fund kept its sector allocations relatively constant with the exception of the increased weighting towards the energy sector. The technology and health care sectors remain areas of focus for the Fund’s investment strategy, as the investment team continues to identify businesses that have strong growth profiles due to industry-leading innovation. Recently, the Fund has opportunistically increased its exposure to energy stocks as the Fund’s investment team believes oil prices will trend higher over the medium to long-term. The Fund continues to favor industrial companies with advanced technology in niche markets that benefit from long-term secular growth drivers. And while the Fund’s strategy remains cautious on the overall state of consumer spending, it does have investment positions in consumer companies with strong growth opportunities and market-leading positions.
Stonebridge Small-Cap Growth Fund (SBSGX) Sector Allocation
as a Percent of Net Assets as of October 31, 2013*
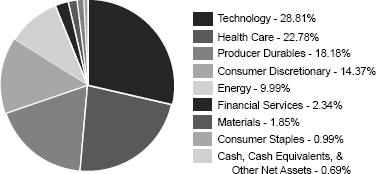
* These allocations may not reflect the current or future position of the portfolio.
2 | Stonebridge Small-Cap Growth Fund |
| Stonebridge Small-Cap Growth Fund | Letter to Shareholders | |
| October 31, 2013 (Unaudited) |
Change in value of a $10,000 investment in Stonebridge Small-Cap
Growth Fund (SBSGX) vs. the Russell 2000® Growth Index with Income
from October 31, 2003 to October 31, 2013
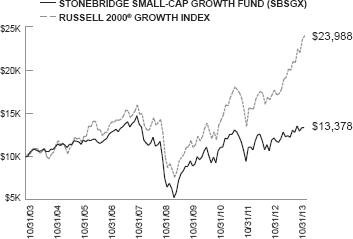
Average Annual Total Returns for the Years Ended October 31, 2013
| 1 Year | 5 Years | 10 Years | ||||||||||
Stonebridge Small-Cap Growth Fund (SBSGX) | 13.30 | % | 12.26% | 2.95% | ||||||||
Russell 2000® Growth Index | 39.84 | % | 19.27% | 9.14% | ||||||||
Average annual total returns reflect reinvestment of all dividends and capital gains distributions, any fee waivers in effect and any expense reimbursements. Without the fee waivers and expense reimbursements, the total return figures would be lower. Past performance is not indicative of future results and current performance may be lower or higher than the performance quoted. Investment return and principal value will fluctuate and shares, when redeemed, may be worth more or less than their original cost. The total returns shown do not reflect the deduction of taxes that a shareholder would pay on fund distributions or the redemption of fund shares. To obtain the most recent month-end performance, please call the Fund’s toll-free number at 1-800-639-3935.
Effective as of the close of business February 15, 2013, Stonebridge Small-Cap Growth Fund (SBAGX) (the “Acquired Fund”) and Stonebridge Institutional Small-Cap Growth Fund (SBSCX) (the “Acquiring Fund”), each a series of Stonebridge Funds Trust were reorganized into a newly created fund, which is named the Stonebridge Small-Cap Growth Fund (SBSGX) (the “Fund”), under the Financial Investors Trust. The Fund’s performance for periods prior to the close of business February 15, 2013 is that of the Acquiring Fund.
As of the Prospectus dated August 31, 2013, the gross annual expense ratio for the Stonebridge Small-Cap Growth Fund was 3.86%. At October 31, 2013, the Fund’s gross annual expense ratio was 2.30%.
| Semi-Annual Report | October 31, 2013 | 3 |
| Stonebridge Small-Cap Growth Fund | Letter to Shareholders | |
| October 31, 2013 (Unaudited) |
CONCLUSION
In managing the Fund in accordance with its strategy, we seek to identify strong businesses that we believe exhibit competitive advantages, growing market share, and healthy balance sheets, and that are poised to rapidly grow earnings in excess of market expectations. We are positioning the Fund toward those businesses and economic sectors that we believe contain the best opportunities for future growth and above average investment returns. Although we are most excited about the outlook for technology, health care and energy companies, we believe that we will continue to find opportunities for the Funds across sectors that can deliver above average performance results for shareholders.
Thank you for your investment in the Stonebridge Funds. Should you have any questions or concerns, please call a Shareholder Services Representative at 1-800-639-3935.
Sincerely,
Richard C. Barrett, CFA
Matthew W. Markatos, CFA
Portfolio Managers
Performance quoted above represents past performance. Past Performance does not guarantee future results.
The statements and opinions expressed are those of the Portfolio Managers and are as of the date of this report.
DEFINITIONS:
The Russell 2000® Growth Index is an unmanaged index that measures the performance of those Russell 2000® Index companies with higher price-to-book ratios and higher forecasted growth values. The Russell 2000® Index measures the performance of the 2,000 smallest companies in the Russell 3000® Index, which measures the performance of the 3,000 largest U.S. companies in terms of market capitalization. The Russell 2000® Growth Index is constructed to provide a comprehensive and unbiased barometer of the small-cap growth market. This is a total return index which reflects the reinvestment of income dividends and capital gain distributions, if any, but does not reflect fees, brokerage commissions, or other expenses of investing. An investor cannot invest directly in an index.
The S&P 500® Total Return Index is an unmanaged index of 500 common stocks chosen for market size, liquidity and industry group representation. It is a market-value weighted index. The S&P 500® Total Return Index is not actively managed and do not reflect any deduction for fees, expenses or taxes. An investor cannot invest directly in an index.
4 | Stonebridge Small-Cap Growth Fund |
| Stonebridge Small-Cap Growth Fund | Letter to Shareholders | |
| October 31, 2013 (Unaudited) |
The Russell 2000® Index measures the performance of the small-cap segment of the U.S. equity universe. The Russell 2000® is a subset of the Russell 3000® Index representing approximately 10% of the total market capitalization of that index. It includes approximately 2000 of the smallest securities based on a combination of their market cap and current index membership. The index is not actively managed and does not reflect any deduction for fees, expenses or taxes. An investor cannot invest directly in an index.
The Dow Jones Industrial Average is a price-weighted average of 30 significant stocks traded on the New York Stock Exchange and the Nasdaq.
Quantitative easing is an unconventional monetary policy in which a central bank purchases government securities or other securities from the market in order to lower interest rates and increase the money supply.
The Volatility Index® (VIX) is an index which measures expectations of volatility, or fluctuations in price, of the S&P 500® Total Return Index. Higher values for the volatility index indicate that investors expect the value of the S&P 500® Total Return Index to fluctuate wildly – up, down, or both – in the next 30 days.
| Semi-Annual Report | October 31, 2013 | 5 |
| Stonebridge Small-Cap Growth Fund | Disclosure of Fund Expenses | |
| October 31, 2013 (Unaudited) |
As a shareholder of a Fund, you incur two types of costs: (1) transaction costs (such as the 2% fee on redemption of Fund shares made within 30 days of purchase); and (2) ongoing costs, including management fees and other Fund expenses. The following examples are intended to help you understand your ongoing costs (in dollars) of investing in a Fund and to compare these costs with the ongoing costs of investing in other mutual funds. The examples are based on an investment of $1,000 invested on May 1, 2013 and held until October 31, 2013.
Actual Return — The first line of the following tables provides information about actual account values and actual expenses. You may use the information in this line, together with the amount you invested, to estimate the expenses that you paid over the period. Simply divide your account value by $1,000 (for example, an $8,600 account value divided by $1,000 = 8.6), then multiply the result by the number in the first line under the heading “Expense Paid During Period” to estimate the expenses you paid on your account during this period.
Hypothetical 5% Return — The second line of the following tables provides information about hypothetical account values and hypothetical expenses based on each Fund’s actual expense ratio and an assumed rate of return of 5% per year before expenses, which is not the Fund’s actual return. The hypothetical account values and expenses may not be used to estimate the actual ending account balance or expenses you paid for the period. You may use this information to compare the ongoing costs of investing in a Fund and other mutual funds. To do so, compare this 5% hypothetical example with the 5% hypothetical examples that appear in the shareholder reports of the other funds.
The expenses shown in the table are meant to highlight ongoing Fund costs only and do not reflect transaction fees, such as redemption fees. Therefore, the second line of the table is useful in comparing ongoing costs only, and may not help you determine the relative total costs of owning different funds. If the transaction fees were included, your costs would be higher.
Stonebridge Small-Cap Growth Fund
Beginning Account Value at 5/01/13 | Ending Account Value at 10/31/13 | Expense Paid During Period* 5/01/13 to 10/31/13 | |||||||||||||
Actual Fund Return | $ | 1,000.00 | $ | 1,091.50 | $ | 12.12 | |||||||||
Hypothetical Fund Return (5% return before expenses) | $ | 1,000.00 | $ | 1,013.61 | $ | 11.67 | |||||||||
| * | Expenses are equal to the Fund’s annualized expense ratio of 2.30%, multiplied by the average account value over the period, multiplied by the number of days in the most recent fiscal half-year (184)/365 (to reflect the half-year period). |
6 | Stonebridge Small-Cap Growth Fund |
| Stonebridge Small-Cap Growth Fund | Statement of Investments | |
| October 31, 2013 (Unaudited) |
| Shares | Market Value | |||||||
COMMON STOCKS (99.31%) | ||||||||
CONSUMER DISCRETIONARY - (14.37%) | ||||||||
Advertising Agencies (1.11%) | ||||||||
Constant Contact, Inc.** | 8,000 | $ | 207,280 | |||||
|
| |||||||
Consumer Services (3.83%) | ||||||||
Outerwall, Inc.** | 8,000 | 519,840 | ||||||
Steiner Leisure Ltd.** | 3,500 | 196,070 | ||||||
|
| |||||||
| 715,910 | ||||||||
|
| |||||||
Education Services (1.52%) | ||||||||
K12, Inc.** | 15,500 | 283,340 | ||||||
|
| |||||||
Homebuilding (3.38%) | ||||||||
TRI Pointe Homes, Inc.** | 39,750 | 632,820 | ||||||
|
| |||||||
Household Furnishings (2.99%) | ||||||||
Select Comfort Corp.** | 30,500 | 558,760 | ||||||
|
| |||||||
Textiles, Apparel & Shoes (1.54%) | ||||||||
Vera Bradley, Inc.** | 13,000 | 287,950 | ||||||
|
| |||||||
TOTAL CONSUMER DISCRETIONARY | 2,686,060 | |||||||
|
| |||||||
CONSUMER STAPLES - (0.99%) | ||||||||
Foods (0.99%) | ||||||||
Chefs’ Warehouse, Inc.** | 7,750 | 185,690 | ||||||
|
| |||||||
TOTAL CONSUMER STAPLES | 185,690 | |||||||
|
| |||||||
ENERGY - (9.99%) | ||||||||
Exploration & Production (2.84%) | ||||||||
Halcon Resources Corp.** | 65,000 | 336,700 | ||||||
Kodiak Oil & Gas Corp.** | 15,000 | 194,550 | ||||||
|
| |||||||
| 531,250 | ||||||||
|
| |||||||
Offshore Drilling & Other Services (1.34%) | ||||||||
Atwood Oceanics, Inc.** | 4,700 | 249,711 | ||||||
|
| |||||||
Oil Well Equipment & Services (2.93%) | ||||||||
McDermott International, Inc.** | 77,500 | 547,925 | ||||||
|
| |||||||
Oilfield Services (0.88%) | ||||||||
Acorn Energy, Inc. | 44,000 | 165,440 | ||||||
|
| |||||||
See Notes to Financial Statements. | ||
| Semi-Annual Report | October 31, 2013 | 7 |
| Stonebridge Small-Cap Growth Fund | Statement of Investments | |
| October 31, 2013 (Unaudited) |
| Shares | Market Value | |||||||
Shipping (2.00%) | ||||||||
Gulfmark Offshore, Inc. Class A | 7,500 | $ | 373,350 | |||||
|
| |||||||
TOTAL ENERGY | 1,867,676 | |||||||
|
| |||||||
FINANCIAL SERVICES - (2.34%) | ||||||||
Financial Data & Systems (2.34%) | ||||||||
Higher One Holdings, Inc.** | 55,000 | 437,250 | ||||||
|
| |||||||
TOTAL FINANCIAL SERVICES | 437,250 | |||||||
|
| |||||||
HEALTH CARE - (22.78%) | ||||||||
Biotechnology (3.39%) | ||||||||
Endocyte, Inc.** | 34,000 | 354,620 | ||||||
ImmunoGen, Inc.** | 17,000 | 279,820 | ||||||
|
| |||||||
| 634,440 | ||||||||
|
| |||||||
Health Care Facilities (1.48%) | ||||||||
VCA Antech, Inc.** | 9,750 | 277,388 | ||||||
|
| |||||||
Health Care Services (3.65%) | ||||||||
HMS Holdings Corp.** | 32,250 | 681,442 | ||||||
|
| |||||||
Medical & Dental Instruments & Supplies (2.08%) | ||||||||
Align Technology, Inc.** | 3,250 | 185,445 | ||||||
Merit Medical Systems, Inc.** | 12,700 | 203,073 | ||||||
|
| |||||||
| 388,518 | ||||||||
|
| |||||||
Medical Equipment (12.18%) | ||||||||
Cepheid, Inc.** | 11,000 | 447,920 | ||||||
Genomic Health, Inc.** | 16,050 | 480,216 | ||||||
Luminex Corp.** | 30,000 | 585,000 | ||||||
Masimo Corp. | 22,000 | 563,640 | ||||||
Volcano Corp.** | 10,500 | 201,285 | ||||||
|
| |||||||
| 2,278,061 | ||||||||
|
| |||||||
TOTAL HEALTH CARE | 4,259,849 | |||||||
|
| |||||||
MATERIALS - (1.85%) | ||||||||
Metals & Mining (1.85%) | ||||||||
Allied Nevada Gold Corp.** | 85,000 | 346,800 | ||||||
|
| |||||||
TOTAL MATERIALS | 346,800 | |||||||
|
| |||||||
See Notes to Financial Statements. | ||
8 | Stonebridge Small-Cap Growth Fund |
| Stonebridge Small-Cap Growth Fund | Statement of Investments | |
| October 31, 2013 (Unaudited) |
| Shares | Market Value | |||||||
PRODUCER DURABLES - (18.18%) | ||||||||
Auction Services (2.30%) | ||||||||
Ritchie Bros Auctioneers, Inc. | 21,750 | $ | 430,650 | |||||
|
| |||||||
Construction (5.47%) | ||||||||
Aegion Corp.** | 26,500 | 543,250 | ||||||
Great Lakes Dredge & Dock Corp. | 59,000 | 479,080 | ||||||
|
| |||||||
| 1,022,330 | ||||||||
|
| |||||||
Engineering & Contracting Services (3.34%) | ||||||||
Mistras Group, Inc.** | 34,000 | 624,240 | ||||||
|
| |||||||
Machinery: Agricultural (3.18%) | ||||||||
Titan International, Inc. | 41,000 | 594,500 | ||||||
|
| |||||||
Machinery: Industrial (1.02%) | ||||||||
Woodward, Inc. | 4,750 | 190,428 | ||||||
|
| |||||||
Scientific Instruments: Gauges & Meters (1.71%) | ||||||||
Itron, Inc.** | 7,500 | 320,025 | ||||||
|
| |||||||
Truckers (1.16%) | ||||||||
Quality Distribution, Inc.** | 21,000 | 215,880 | ||||||
|
| |||||||
TOTAL PRODUCER DURABLES | 3,398,053 | |||||||
|
| |||||||
TECHNOLOGY - (28.81%) | ||||||||
Communications Technology (3.81%) | ||||||||
Riverbed Technology, Inc.** | 48,000 | 711,360 | ||||||
|
| |||||||
Computer Services Software & Systems (9.62%) | ||||||||
BroadSoft, Inc.** | 10,250 | 335,380 | ||||||
Jive Software, Inc.** | 27,750 | 302,197 | ||||||
LogMeIn, Inc.** | 2,500 | 80,750 | ||||||
Marin Software, Inc.** | 16,000 | 185,440 | ||||||
Palo Alto Networks, Inc.** | 8,000 | 337,280 | ||||||
PTC, Inc.** | 13,250 | 367,290 | ||||||
Tangoe, Inc.** | 10,000 | 191,000 | ||||||
|
| |||||||
| 1,799,337 | ||||||||
|
| |||||||
Computer Technology (5.45%) | ||||||||
Dolby Laboratories, Inc., Class A | 10,750 | 384,205 | ||||||
Fusion-io, Inc.** | 59,000 | 634,250 | ||||||
|
| |||||||
| 1,018,455 | ||||||||
|
| |||||||
See Notes to Financial Statements. | ||
| Semi-Annual Report | October 31, 2013 | 9 |
| Stonebridge Small-Cap Growth Fund | Statement of Investments | |
| October 31, 2013 (Unaudited) |
Shares | Market Value | |||||||
Electronic Components (0.98%) | ||||||||
Tech Data Corp.** | 3,500 | $ | 182,210 | |||||
|
| |||||||
Electronics (3.54%) | ||||||||
IPG Photonics Corp. | 10,000 | 662,700 | ||||||
|
| |||||||
Semiconductors & Components (5.41%) | ||||||||
Cirrus Logic, Inc.** | 16,250 | 364,488 | ||||||
EZchip Semiconductor Ltd.** | 25,000 | 647,500 | ||||||
|
| |||||||
| 1,011,988 | ||||||||
|
| |||||||
TOTAL TECHNOLOGY | 5,386,050 | |||||||
|
| |||||||
TOTAL COMMON STOCKS | ||||||||
(Cost $ 17,786,832) | 18,567,428 | |||||||
|
| |||||||
MONEY MARKET MUTUAL FUNDS (1.95%) | ||||||||
Fidelity® Institutional Money Market Government Portfolio - Class I (0.01% 7 Day Yield) | 364,819 | 364,819 | ||||||
|
| |||||||
TOTAL MONEY MARKET MUTUAL FUNDS | ||||||||
(Cost $ 364,819) | 364,819 | |||||||
|
| |||||||
TOTAL INVESTMENTS (101.26%) (Cost $ 18,151,651) | $ | 18,932,247 | ||||||
LIABILITIES IN EXCESS OF OTHER ASSETS (-1.26%) | (235,912 | ) | ||||||
|
| |||||||
NET ASSETS (100.00%) | $ | 18,696,335 | ||||||
|
| |||||||
| ** | Non-Income Producing Security. |
Common Abbreviations:
Ltd. - Limited.
Holdings are subject to change.
For Fund compliance purposes, the Fund’s industry classifications refer to any one or more of the industry sub-classifications used by one or more widely recognized market indexes or ratings group indexes, and/or as defined by Fund management. This definition may not apply for purposes of this report, which may combine industry sub-classifications for reporting ease. Industries are shown as a percentage of net assets.
| See Notes to Financial Statements. | ||
10 | Stonebridge Small-Cap Growth Fund |
| Stonebridge Small-Cap Growth Fund | Statement of Assets and Liabilities | |
| October 31, 2013 (Unaudited) |
ASSETS: | ||||
Investments, at value | $ | 18,932,247 | ||
Dividends receivable | 3 | |||
Prepaid and other assets | 22,523 | |||
|
| |||
Total assets | 18,954,773 | |||
|
| |||
LIABILITIES: | ||||
Payable for investments purchased | 209,356 | |||
Advisory fees payable | 12,102 | |||
Administration and fund accounting fees payable | 6,805 | |||
Payable for transfer agent fees | 2,927 | |||
Payable for legal fees | 89 | |||
Payable for audit fees | 19,331 | |||
Payable for trustee fees and expenses | 315 | |||
Payable for chief compliance officer fees | 3,443 | |||
Accrued expenses and other liabilities | 4,070 | |||
|
| |||
Total liabilities | 258,438 | |||
|
| |||
Net Assets | $ | 18,696,335 | ||
|
| |||
COMPOSITION OF NET ASSETS: | ||||
Paid-in capital (Note 5) | $ | 17,167,748 | ||
Accumulated net investment loss | (355,244 | ) | ||
Accumulated net realized gain on investments | 1,103,235 | |||
Net unrealized appreciation in value of investments | 780,596 | |||
|
| |||
Net Assets | $ | 18,696,335 | ||
|
| |||
NET ASSET VALUE PER SHARE: | ||||
Net Assets | $ | 18,696,335 | ||
Shares outstanding | 1,959,309 | |||
Net asset value and redemption price per share* | $ | 9.54 | ||
|
| |||
Investments, at cost | $ | 18,151,651 | ||
|
| |||
| * | A charge of 2% is imposed on the redemption proceeds of shares held 30 days or less. |
See Notes to Financial Statements. | ||
| Semi-Annual Report | October 31, 2013 | 11 |
| Stonebridge Small-Cap Growth Fund | Statement of Operations | |
| For the Six Months Ended October 31, 2013 (Unaudited) |
INCOME: | ||||
Dividends | $ | 16,018 | ||
Foreign taxes withheld on dividends | (957 | ) | ||
|
| |||
Total Income | 15,061 | |||
|
| |||
EXPENSES: | ||||
Investment advisory fees | 71,211 | |||
Administration fees | 37,808 | |||
Transfer agent fees | 37,009 | |||
Fund accounting fees and expenses | 1,493 | |||
Custodian fees | 2,671 | |||
Legal fees | 3,163 | |||
Printing fees | 11,831 | |||
Registration fees | 8,844 | |||
Audit fees | 15,902 | |||
Trustee fees and expenses | 303 | |||
Chief compliance officer fees | 10,110 | |||
Proxy voting fees | 180 | |||
Insurance | 15,543 | |||
Other | 2,438 | |||
|
| |||
Total Expenses | 218,506 | |||
|
| |||
Net Investment Loss | (203,445 | ) | ||
|
| |||
REALIZED AND UNREALIZED GAIN ON INVESTMENTS: | ||||
Net realized gain on investments | 1,347,713 | |||
Change in net unrealized appreciation of investments | 481,491 | |||
|
| |||
Net Realized and Unrealized Gain on Investments | 1,829,204 | |||
|
| |||
Net Increase in Net Assets Resulting From Operations | $ | 1,625,759 | ||
|
| |||
See Notes to Financial Statements. | ||
12 | Stonebridge Small-Cap Growth Fund | |
| Stonebridge Small-Cap Growth Fund | Statements of Changes in Net Assets | |
For the Six Months Ended October 31, 2013 (Unaudited) | For the Six Months Ended April 30, 2013 | For the Year Ended October 31, 2012 | ||||||||||
| ||||||||||||
OPERATIONS: | ||||||||||||
Net investment loss | $ | (203,445) | $ | (258,687) | $ | (448,620) | ||||||
Net realized gain on investments | 1,347,713 | 1,105,564 | 1,426,818 | |||||||||
Change in net unrealized appreciation/(depreciation) of investments | 481,491 | (599,341) | (192,178) | |||||||||
|
| |||||||||||
Increase in Net Assets Resulting from Operations | 1,625,759 | 247,536 | 786,020 | |||||||||
|
| |||||||||||
CAPITAL SHARE TRANSACTIONS (NOTE 5): | ||||||||||||
Net increase/(decrease) in shareholder activity derived from beneficial interest transactions, net of redemption fees | (771,103) | 4,921,322 | (569,776) | |||||||||
|
| |||||||||||
NET INCREASE IN NET ASSETS | 854,656 | 5,168,858 | 216,244 | |||||||||
NET ASSETS: | ||||||||||||
Beginning of year | 17,841,679 | 12,672,821 | 12,456,577 | |||||||||
|
| |||||||||||
End of period* | $ | 18,696,335 | $ | 17,841,679 | $ | 12,672,821 | ||||||
|
| |||||||||||
*Includes accumulated net investment loss of: | $ | (355,244) | $ | (151,799) | $ | (381,403) | ||||||
| See Notes to Financial Statements. | ||
| Semi-Annual Report | October 31, 2013 | 13 |
| Stonebridge Small-Cap Growth Fund (SBSGX) | ||
| For a share outstanding through the periods presented |
| ||
PER SHARE DATA | ||
| Net asset value, beginning of year | ||
| INCOME/(LOSS) FROM INVESTMENT OPERATIONS: | ||
| Net investment loss | ||
| Net realized and unrealized gain/(loss) on investments | ||
| Total Income/(Loss) from Investment Operations | ||
| DISTRIBUTIONS TO SHAREHOLDERS: | ||
| From net realized gain on investments | ||
| Total Distributions to Shareholders | ||
| Net Increase/(Decrease) in Net Asset Value | ||
| Net asset value, end of year | ||
| Total Return | ||
| Ratios & Supplemental Data: | ||
| Net assets, end of year (in 000s) | ||
| Ratios to average net assets: | ||
Expenses (excluding fee waivers) | ||
Expenses (including fee waivers) | ||
Net investment loss (including fee waivers) | ||
| Portfolio Turnover Rate | ||
| (1) | The Fund’s fiscal year end changed from October 31st to April 30th. See Note 1. |
| (2) | Calculated using the average shares method. |
| (3) | Total return not annualized for periods less than one full year. |
| (4) | Annualized. |
| (5) | Expense ratios before reductions for startup periods may not be representative of longer term operating periods. |
See Notes to Financial Statements. | ||
14 | Stonebridge Small-Cap Growth Fund | |
| Financial Highlights | ||
Six Months Ended October 31, 2013 (Unaudited) | Six Months Ended April 30, 2013(1) | Year Ended October 31, 2012 | Year Ended October 31, 2011 | Year Ended October 31, 2010 | Year Ended October 31, 2009 | Year Ended October 31, 2008 | ||||||
| ||||||||||||
| $8.74 | $8.42 | $7.90 | $7.91 | $6.38 | $5.35 | $11.62 | ||||||
| ||||||||||||
| (0.10) | (0.15)(2) | (0.30) | (0.26) | (0.24) | (0.18) | (0.21) | ||||||
| 0.90 | 0.47 | 0.82 | 0.25 | 1.77 | 1.21 | (5.02) | ||||||
| ||||||||||||
| 0.80 | 0.32 | 0.52 | (0.01) | 1.53 | 1.03 | (5.23) | ||||||
| ||||||||||||
| – | – | – | – | – | – | (1.04) | ||||||
| ||||||||||||
| – | – | – | – | – | – | (1.04) | ||||||
| ||||||||||||
| 0.80 | 0.32 | 0.52 | (0.01) | 1.53 | 1.03 | (6.27) | ||||||
| ||||||||||||
| $9.54 | $8.74 | $8.42 | $7.90 | $7.91 | $6.38 | $5.35 | ||||||
| ||||||||||||
| 9.15%(3) | 3.80%(3) | 6.58% | (0.13)% | 23.98% | 19.25% | (49.06)% | ||||||
| ||||||||||||
| $18,696 | $17,842 | $12,673 | $12,457 | $13,492 | $11,767 | $10,583 | ||||||
| ||||||||||||
| N/A | N/A | N/A | N/A | 3.48% | N/A | N/A | ||||||
| ||||||||||||
| 2.30%(4) | 3.86%(4)(5) | 3.89% | 3.36% | 3.40% | 3.85% | 2.86% | ||||||
| ||||||||||||
| (2.14)%(4) | (3.52)%(4) | (3.58)% | (2.96)% | (3.19)% | (3.34)% | (2.43)% | ||||||
| ||||||||||||
| 72% | 89% | 222% | 195% | 115% | 137% | 145% | ||||||
| ||||||||||||
| Semi-Annual Report | October 31, 2013 | 15 |
| Stonebridge Small-Cap Growth Fund | Notes to Financial Statements | |
| October 31, 2013 (Unaudited) |
1. ORGANIZATION
Financial Investors Trust (the “Trust”), a Delaware statutory trust, is an open-end management investment company registered under the Investment Company Act of 1940, as amended (“1940 Act”). As of October 31, 2013, the Trust had 27 registered funds. This semi-annual report describes the Stonebridge Small-Cap Growth Fund (prior to the close of business on February 15, 2013 known as the Stonebridge Institutional Small-Cap Growth Fund) (the “Fund”). The Fund seeks long-term capital growth by investing primarily in common stocks of companies that Stonebridge Capital Management, Inc. (the “Adviser”), the investment adviser of the Fund, believes have good prospects for above average earnings growth.
The Fund is a successor to a previously operational fund which was a series of the Stonebridge Funds Trust, a Delaware statutory trust, and was organized into a series of the Trust effective as of the close of business on February 15, 2013. As a result, the Fund’s fiscal year end changed from October 31st to April 30th.
2. SIGNIFICANT ACCOUNTING POLICIES
The accompanying financial statements were prepared in accordance with accounting principles generally accepted in the United States of America (“U.S. GAAP”). The preparation of financial statements in conformity with U.S. GAAP requires management to make certain estimates and assumptions that affect the reported amounts of assets and liabilities and disclosures of contingent assets and liabilities at the date of the financial statements and the reported amounts of revenue and expenses during the period. Actual results could differ from those estimates. The following is a summary of significant accounting policies consistently followed by the Fund in preparation of its financial statements.
Investment Valuation: The Fund generally values its securities based on market prices determined at the close of regular trading on the New York Stock Exchange (“NYSE”), normally 4:00 p.m. Eastern Time, on each day the NYSE is open for trading.
For equity securities and mutual funds that are traded on an exchange, the market price is usually the closing sale or official closing price on that exchange. In the case of equity securities not traded on an exchange, or if such closing prices are not otherwise available, the securities are valued at the mean of the most recent bid and ask prices on such day. Redeemable securities issued by open-end registered investment companies are valued at the investment company’s applicable net asset value, with the exception of exchange-traded open-end investment companies, which are priced as equity securities.
Short–term debt obligations that will mature in 60 days or less are valued at amortized cost, unless it is determined that using this method would not reflect an investment’s fair value. Investments in non-exchange traded funds are fair valued at their respective net asset values.
When such prices or quotations are not available, or when the Fair Value Committee appointed by the Board of Trustees (the “Board”) believes that they are unreliable, securities may be priced using fair value procedures approved by the Board.
Fair Value Measurements: The Fund discloses the classification of its fair value measurements following a three-tier hierarchy based on the inputs used to measure fair value. Inputs refer broadly to the assumptions that market participants would use in pricing the asset or liability,
16 | Stonebridge Small-Cap Growth Fund |
| Stonebridge Small-Cap Growth Fund | Notes to Financial Statements | |
| October 31, 2013 (Unaudited) |
including assumptions about risk. Inputs may be observable or unobservable. Observable inputs reflect the assumptions market participants would use in pricing the asset or liability that are developed based on market data obtained from sources independent of the reporting entity.
Unobservable inputs reflect the reporting entity’s own assumptions about the assumptions market participants would use in pricing the asset or liability that are developed based on the best information available.
Various inputs are used in determining the value of the Fund’s investments as of the end of the reporting period. When inputs used fall into different levels of the fair value hierarchy, the level in the hierarchy within which the fair value measurement falls is determined based on the lowest level input that is significant to the fair value measurement in its entirety. The designated input levels are not necessarily an indication of the risk or liquidity associated with these investments. These inputs are categorized in the following hierarchy under applicable financial accounting standards:
Level 1 | – | Unadjusted quoted prices in active markets for identical investments, unrestricted assets or liabilities that the Fund has the ability to access at the measurement date; | ||
Level 2 | – | Quoted prices which are not active, quoted prices for similar assets or liabilities in active markets or inputs other than quoted prices that are observable (either directly or indirectly) for substantially the full term of the asset or liability; and | ||
Level 3 | – | Significant unobservable prices or inputs (including the Fund’s own assumptions in determining the fair value of investments) where there is little or no market activity for the asset or liability at the measurement date. | ||
The following is a summary of each input used to value the Fund as of October 31, 2013:
| Valuation Inputs | ||||||||||||||||
|
| |||||||||||||||
| Investments in Securities at Value* | Level 1 | Level 2 | Level 3 | Total | ||||||||||||
| ||||||||||||||||
Common Stocks | $ | 18,567,428 | $ | – | $ | – | $ | 18,567,428 | ||||||||
Money Market Mutual Funds | 364,819 | – | – | 364,819 | ||||||||||||
| ||||||||||||||||
Total | $ | 18,932,247 | $ | – | $ | – | $ | 18,932,247 | ||||||||
| ||||||||||||||||
*For detailed Industry descriptions, see the accompanying Statement of Investments.
The Fund recognizes transfers between levels as of the end of the period. For the six months ended October 31, 2013, the Fund did not have any transfers between Level 1 and Level 2 securities. For the six months ended October 31, 2013, the Fund did not have any securities that used significant unobservable inputs (Level 3) in determining fair value.
Investment Transactions and Investment Income: Investment transactions are accounted for on the date the investments are purchased or sold (trade date). Realized gains and losses from investment transactions are reported on an identified cost basis. Interest income, which includes accretion of discounts, is accrued and recorded as earned. Dividend income is recognized on the ex-dividend date or for certain foreign securities, as soon as information is available to the Fund.
Trust Expenses: Some expenses of the Trust can be directly attributed to the Fund. Expenses which cannot be directly attributed to the Fund are apportioned among all funds in the Trust based on average net assets of each fund.
| Semi-Annual Report | October 31, 2013 | 17 |
| Stonebridge Small-Cap Growth Fund | Notes to Financial Statements | |
| October 31, 2013 (Unaudited) |
Fund Expenses: Expenses that are specific to the Fund are charged directly to the Fund.
Federal Income Taxes: The Fund complies with the requirements under Subchapter M of the Internal Revenue Code of 1986, as amended (the “Code”), applicable to regulated investment companies and intends to distribute substantially all of their net taxable income and net capital gains, if any, each year so that it will not be subject to excise tax on undistributed income and gains. The Fund is not subject to income taxes to the extent such distributions are made.
As of and during the six months ended October 31, 2013, the Fund did not have a liability for any unrecognized tax benefits. The Fund files U.S. federal, state, and local tax returns as required. The Fund’s tax returns are subject to examination by the relevant tax authorities until expiration of the applicable statute of limitations, which is generally three years after the filing of the tax return for federal purposes and four years for most state returns. Tax returns for open years have incorporated no uncertain tax positions that require a provision for income taxes.
Distributions to Shareholders: The Fund normally pays dividends and distributes capital gains, if any, on an annual basis. Income dividend distributions are derived from interest and other income the Fund receives from its investments, including short term capital gains. Long term capital gain distributions are derived from gains realized when the Fund sells a security it has owned for more than a year. The Fund may make additional distributions and dividends at other times if the portfolio manager believes doing so may be necessary for the Fund to avoid or reduce taxes.
3. TAX BASIS INFORMATION
Tax Basis of Investments: As of October 31, 2013, the aggregate cost of investments, gross unrealized appreciation/(depreciation) and net unrealized appreciation for Federal tax purposes was as follows:
Gross appreciation (excess of value over tax cost) | $ | 1,959,624 | ||||
Gross depreciation (excess of tax cost over value) | (1,283,448) | |||||
| ||||||
Net unrealized appreciation | $ | 676,176 | ||||
| ||||||
Cost of investments for income tax purposes | $ | 18,256,071 | ||||
| ||||||
Capital Losses: As of April 30, 2013, the Fund had capital loss carryforwards which may reduce its taxable income arising from future net realized gains on investments, if any, to the extent permitted by the Code and thus may reduce the amount of the distributions to shareholders which would otherwise be necessary to relieve the Fund of any liability for federal tax. Pursuant to the Code, such capital loss carryforwards will expire as follows:
Pre-Enactment Capital Losses:
| Amount | ||||||
Expiring 2016 | $ | 141,131 | ||||
Tax Basis of Distributions to Shareholders: The character of distributions made during the year from net investment income or net realized gains may differ from its ultimate characterization for federal income tax purposes. Also, due to the timing of dividend distributions, the fiscal year in which amounts are distributed may differ from the fiscal year in which the income or realized gain was recorded by the Fund.
18 | Stonebridge Small-Cap Growth Fund |
| Stonebridge Small-Cap Growth Fund | Notes to Financial Statements | |
| October 31, 2013 (Unaudited) |
No distributions were paid during the six months ended October 31, 2013, the period ended April 30, 2013 and the year ended October 31, 2012.
4. SECURITIES TRANSACTIONS
The cost of purchases and proceeds from sales of securities (excluding short-term securities) during the six months ended October 31, 2013, was as follows:
| Purchases | Sales | |||||||||
Stonebridge Small-Cap Growth Fund | $ | 13,289,529 | $ | 14,341,000 | ||||||
5. SHARES OF BENEFICIAL INTEREST
The capitalization of the Trust consists of an unlimited number of shares of beneficial interest with no par value per share. Holdersof the shares of the Fund of the Trust have one vote for each share held and a proportionate fraction of a vote for each fractional share. All shares issued and outstanding are fully paid and are non-assessable, transferable and redeemable at the option of the shareholder. Shares have no pre-emptive rights.
Stonebridge Small-Cap Growth Fund
| Six Months Ended October 31, 2013 Shares (Unaudited) | Six Months Ended October 31, 2013 (Unaudited) | Six Months 2013 | Six Months Ended April 30, 2013 Amount | Year Ended October 31, 2012 Shares | Year Ended October 31, 2012 Amount | |||||||||||||||||||
| ||||||||||||||||||||||||
Shares sold | 2,604 | $ | 24,110 | 5,072 | $ | 42,935 | 83,169 | $ | 720,844 | |||||||||||||||
Acquisition (Note 8) | – | – | 625,439 | 5,698,600 | – | – | ||||||||||||||||||
| ||||||||||||||||||||||||
Total | 2,604 | 24,110 | 630,511 | 5,741,535 | 83,169 | 720,844 | ||||||||||||||||||
| ||||||||||||||||||||||||
Less shares redeemed, net of redemption fees | (84,229) | (795,213) | (94,616) | (820,213) | (154,689) | (1,290,620) | ||||||||||||||||||
| ||||||||||||||||||||||||
Net Increase/ (Decrease) | (81,625) | $ | (771,103) | 535,895 | $ | 4,921,322 | (71,520) | $ | (569,776) | |||||||||||||||
| ||||||||||||||||||||||||
Shares redeemed within 30 days of purchase will incur a 2% short-term redemption fee deducted from the redemption amount. Redemption fees are reflected in the “Shares redeemed, net of redemption fees” in the Statements of Changes in Net Assets.
For the six months ended October 31, 2013, the period ended April 30, 2013 and the year ended October 31, 2012, the Fund retained fees in the amounts of $0, $0 and $1, respectively.
6. MANAGEMENT AND RELATED-PARTY TRANSACTIONS
The Trust has entered into an advisory agreement with Stonebridge Capital Management, Inc. (the “Adviser”) with respect to the Fund. The advisory agreement has been approved by the Board and shareholders. Pursuant to the advisory agreement with the Trust, the Adviser is entitled to
| Semi-Annual Report | October 31, 2013 | 19 |
| Stonebridge Small-Cap Growth Fund | Notes to Financial Statements | |
| October 31, 2013 (Unaudited) |
investment advisory fees, computed daily and payable monthly at an annual rate of 0.75% of the average daily net assets of the Fund.
Fund Accounting Fees and Expenses
ALPS Fund Services, Inc. (“ALPS” and the “Administrator”) (an affiliate of ALPS Distributors, Inc.) serves as administrator to the Fund, and the Fund has agreed to pay expenses incurred in connection with its administrative activities. Pursuant to the Administration, Bookkeeping and Pricing Services Agreement (the “Agreement”), ALPS will provide operational services to the Fund including, but not limited to fund accounting and fund administration and generally assist in the Fund’s operations.
Annual Administrative Fee, billed monthly, in the amount of the greater of (a) the annual minimum $75,000 or (b) following basis point fee schedule:
| Average Total Net Assets | Contractual Fee | |||
Between $0-$500M | 0.05% | |||
$500M-$1B | 0.03% | |||
Above $1B | 0.02% |
The Administrator is also reimbursed by the Fund for certain out-of-pocket expenses.
Transfer Agent
ALPS serves as transfer, dividend paying and shareholder servicing agent for the Fund. ALPS is compensated based upon a $25,000 annual base fee for the Fund, and annually $9 per direct open account and $7 per open account through the National Securities Clearing Corporation. ALPS is also reimbursed by the Fund for certain out-of-pocket expenses.
Compliance Services
ALPS provides services which assist the Trust’s Chief Compliance Officer in monitoring and testing the policies and procedures of the Trust in conjunction with requirements under Rule 38a-1 under the 1940 Act and receives an annual base fee of $20,000. ALPS is reimbursed for certain out-of-pocket expenses.
Principal Financial Officer
ALPS provides Principal Financial Officer (“PFO”) services to the Fund at no annual fee.
Distributor
ALPS Distributors, Inc. (“ADI” or the “Distributor”) (an affiliate of ALPS) acts as the distributor of the Fund’s shares pursuant to a Distribution Agreement with the Trust. Shares are sold on a continuous basis by ADI as agent for the Fund, and ADI has agreed to use its best efforts to solicit orders for the sale of the Fund’s shares, although it is not obliged to sell any particular amount of shares. ADI is not entitled to any compensation for its services as Distributor. ADI is registered as a broker-dealer with the Securities and Exchange Commission.
7. INDEMNIFICATIONS
Under the Trust’s organizational documents, its officers and Trustees are indemnified against certain liability arising out of the performance of their duties to the Trust. Additionally, in the normal course of business, the Trust enters into contracts with service providers that may contain general indemnification clauses, which may permit indemnification to the extent permissible
20 | Stonebridge Small-Cap Growth Fund |
| Stonebridge Small-Cap Growth Fund | Notes to Financial Statements | |
| October 31, 2013 (Unaudited) |
under applicable law. The Trust’s maximum exposure under these arrangements is unknown, as this would involve future claims that may be made against the Trust that have not yet occurred.
8. NEW ACCOUNTING PRONOUNCEMENTS
In June 2013, the Financial Accounting Standards Board (the “FASB”) issued Accounting Standards Update (“ASU”) No. 2013-08, Financial Services-Investment Companies (Topic 946): Amendments to the Scope, Measurement, and Disclosure Requirements. The FASB standard identifies characteristics a company must assess to determine whether it is considered an investment company for financial reporting purposes. This ASU is effective for fiscal years beginning after December 15, 2013. The Funds believe the adoption of this ASU will not have a material impact on their financial statements.
| Semi-Annual Report | October 31, 2013 | 21 |
| Stonebridge Small-Cap Growth Fund | Additional Information | |
| October 31, 2013 (Unaudited) |
1. FUND HOLDINGS
The Fund files its complete schedule of portfolio holdings with the Securities and Exchange Commission (the “SEC”) for the first and third quarters of each fiscal year on Form N-Q within 60 days after the end of the period. Copies of the Fund’s Form N-Q are available without charge on the SEC website at http://www.sec.gov. You may also review and copy the Form N-Q at the SEC’s Public Reference Room in Washington, DC. For more information about the operation of the Public Reference Room, please call the SEC at 1-800-SEC-0330.
2. FUND PROXY VOTING POLICIES, PROCEDURES AND SUMMARIES
The Fund’s policies and procedures used in determining how to vote proxies and information regarding how the Fund voted proxies relating to portfolio securities during the most recent prior 12-month period ending June 30 are available without charge, (1) upon request, by calling (toll-free) 800-639-3935 and (2) on the SEC’s website at http://www.sec.gov.
22 | Stonebridge Small-Cap Growth Fund |
Page Intentionally Left Blank


| ||||
| ||||
| 1 | ||||||||
| 3 | ||||||||
| 5 | ||||||||
| 6 | ||||||||
| 15 | ||||||||
| 16 | ||||||||
| 17 | ||||||||
| 18 | ||||||||
| 19 | ||||||||
| 26 | ||||||||
| 28 | ||||||||
The Disciplined Growth Investors Fund | Shareholder Letter | |
| October 31, 2013 (Unaudited) |
Dear shareholders,
PORTFOLIO & MARKET PERFORMANCE:
As of October 31, 2013, The Disciplined Growth Investors Fund has $76.6 million in total assets. The Fund’s total performance for the first half of this fiscal year was 9.27%. Equities in the portfolio returned 14.52% while bonds returned -1.43% for the trailing six month period. Our stated benchmark, the S&P 500® Total Return Index, returned 11.14% during the same period. Positive year-to-date performance through October lifted this reference stock index to a trailing one year return of 27.18% and an annualized trailing three-year return of 16.56%. Despite this long period of market-wide positive stock returns, we still conclude that sustainability of successive, high returns remains the unanswered question.
CURRENT ASSET MIX:
The Disciplined Growth Investors Fund is a balanced fund, invested with a significant exposure to both stocks and bonds. As we stated in the previous shareholder letter (in the 4/30/13 annual report), our research shows the expected return from our portfolio of stocks over the next seven years is likely to be considerably higher than the expected return from our bond portfolio. Therefore, we are maintaining the stock exposure in the Fund at the high end of the target range; about 70%. We are maintaining tight maturity and credit control over the bonds in the fund. Indeed, this tactical shift in allocation has limited – within our stated constraints – exposure to bonds’ recent negative returns.
THE ROLE OF BONDS IN THE DGI FUND:
“Why do we own bonds in the mutual fund?
Bonds play three different roles in a portfolio of liquid assets. Bonds are a primary source of current income in the portfolio. Second, bonds are typically less volatile than stocks over short time periods, so bonds can mitigate annual portfolio volatility. Third, bonds are dissimilar to stocks, so bonds prices often move opposite stock prices. This further reduces annual portfolio volatility.
In the present market environment the expected long-term returns from the fund’s equity portfolio significantly exceed the expected returns from the bond portfolio. Accordingly, the portfolio exposure to stocks is at the highest level possible under the portfolio guidelines and the bond portfolio is at the lowest possible level.
As of October 31, 2013 the bond portfolio has a current yield of 5.00%. This is not high enough to provide much protection if U.S. inflation were to increase to moderate levels. Within the bond portfolio itself we are maintaining tight control over the maturities of the bonds, reducing the risk of principal price declines if interest rates rise.
If the expected long-term return differential between stocks and bonds returns to a more normal level, the portfolio would likely shift the allocation more towards bonds.”
INVESTMENT OUTLOOK: YOU’VE GOTTA KNOW WHEN TO HOLD EM
In 1978 Kenny Rogers imparted his wisdom thorough lyrics in the song “The Gambler”. The title of our next article, “You got to know when to hold ‘em”, is derived from this song. The purpose of this article is to outline a mega trend that came and left over the last 30 years and point out one
Semi-Annual Report | October 31, 2013 |
1 |
The Disciplined Growth Investors Fund | Shareholder Letter | |
| October 31, 2013 (Unaudited) |
that is still developing. We think that the clashing of trends that took place in the last decade may have obscured what is seemingly obvious. So we hope to be as clear as possible in articulating what we believe will be the winning investment strategy for the foreseeable future. To give credit, where credit is due, Kenny Roger’s famous anthem also reminded us that “If you’re gonna play the game, boy, ya gotta learn to play it right.”
Sincerely,
Fred Martin, CFA
President & Chief Investment Officer
Disciplined Growth Investors
The views and information discussed in this commentary are as of the date of publication, are subject to change, and may not reflect the writer’s current views. The views expressed represent an assessment of market conditions at a specific point in time, are opinions only and should not be relied upon as investment advice regarding a particular investment or markets in general. Such information does not constitute a recommendation to buy or sell specific securities or investment vehicles. It should not be assumed that any investment will be profitable or will equal the performance of the Fund or any securities or any sectors mentioned herein. The subject matter contained herein has been derived from several sources believed to be reliable and accurate at the time of compilation. The Fund does not accept any liability for losses either direct or consequential caused by the use of this information.
The index is not actively managed and does not reflect any deductions for fees, expenses or taxes. An investor may not invest directly in an index.
Fred Martin is a registered representative of ALPS Distributors, Inc.
Evan Almeroth is a registered representative of ALPS Distributors, Inc.
ALPS Distributors, Inc. is the Distributor for The Disciplined Growth Investors Fund.
|
1-855-DGI-FUND (344-3863) | www.DGIfund.com |
The Disciplined Growth Investors Fund | Performance Update | |
| October 31, 2013 (Unaudited) |
Cumulative Total Return Performance (for the period ended October 31, 2013)
| 1 month | 3 month | 6 month | YTD | 1 Year | Since Inception* | |||||||
Disciplined Growth Investors Fund | 1.41% | 4.50% | 9.27% | 16.24% | 18.76% | 18.64% | ||||||
S&P 500® Total Return Index(1) | 4.60% | 4.75% | 11.14% | 25.30% | 27.18% | 22.35% |
| * | Fund Inception date of August 12, 2011 |
| (1) | The S&P 500® Total Return Index is an unmanaged index of 500 common stocks chosen for market size, liquidity and industry group representation. It is a market-value weighted index. The S&P 500® Total Return Index is not actively managed and do not reflect any deduction for fees, expenses or taxes. It is not possible to invest directly in an index. |
The returns shown above do not reflect the deductions of taxes a shareholder would pay on Fund distributions or redemptions of Fund shares.
Returns less than one year are cumulative.
Performance data quoted represents past performance. Past performance does not guarantee future results. Investment return and principal value of an investment will fluctuate so that an investor’s shares, when sold or redeemed, may be worth more or less than the original cost. Current performance data may be higher or lower than actual data quoted. For the most current month-end performance data please call 1.855.DGI.FUND.
Semi-Annual Report | October 31, 2013 |
3 |
The Disciplined Growth Investors Fund | Performance Update | |
| October 31, 2013 (Unaudited) |
Growth of $10,000 Investment in the Fund (for the period ended October 31, 2013)
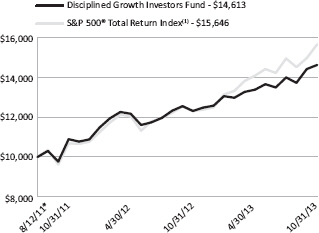
The chart represents historical performance of a hypothetical investment of $10,000 in the Fund since inception. Past performance does not guarantee future results. This chart does not reflect the deduction of taxes that a shareholder would pay on Fund distributions or the redemption of Fund shares.
Investing in the Fund is subject to investment risks, including possible loss of the principal amount invested.
Industry Sector Allocation (as a % of Net Assets)* | ||||||
Technology | 23.56 | % | ||||
Consumer Discretionary | 22.24 | % | ||||
Producer Durables | 10.86 | % | ||||
Utilities | 1.31 | % | ||||
Health Care | 6.30 | % | ||||
Energy | 1.70 | % | ||||
Consumer, Non-cyclical | 1.23 | % | ||||
Financial Services | 3.73 | % | ||||
Industrials | 0.83 | % | ||||
Asset/Mortgage Backed Securities | 0.24 | % | ||||
Corporate Bond | 23.04 | % | ||||
Foreign Government Bonds | 0.66 | % | ||||
Government & Agency Obligations | 0.27 | % | ||||
Other Assets in Excess of Liabilities | 4.03 | % |
* Holdings are subject to change. Tables present indicative values only.
Top Ten Holdings (as a % of Net Assets)* | ||||||
TJX Cos., Inc. | 5.11 | % | ||||
Intuit, Inc. | 3.60 | % | ||||
Middleby Corp. | 3.00 | % | ||||
Seagate Technology PLC | 2.98 | % | ||||
Eaton Corp. PLC | 2.83 | % | ||||
Limited Brands, Inc. | 2.69 | % | ||||
Plexus Corp. | 2.66 | % | ||||
Cabela’s, Inc. | 2.39 | % | ||||
Open Text Corp. | 2.26 | % | ||||
Edwards Lifesciences Corp. | 2.21 | % | ||||
Top Ten Holdings | 29.73 | % |
|
1-855-DGI-FUND (344-3863) | www.DGIfund.com |
The Disciplined Growth Investors Fund | Disclosure of Fund Expenses | |
| October 31, 2013 (Unaudited) |
As a shareholder of a Fund, you incur two types of costs: direct costs, such as short-term redemption fees and wire fees, balance fees, and indirect costs, including management fees, and other fund operating expenses. This example is intended to help you understand your indirect costs, also referred to as “ongoing costs” (in dollars), of investing in the Fund and to compare these costs with the ongoing costs of investing in other mutual funds.
This example is based on an investment of $1,000 invested at the beginning of the period and held for the entire six-month period of May 1, 2013 through October 31, 2013.
Actual Expenses The first line of the table below provides information about actual account values and actual expenses. You may use the information in this line, together with the amount you invested at the beginning of the period, to estimate the expenses that you paid over the period. Simply divide your account value by $1,000 (for example, an $8,600 account value divided by $1,000 = 8.6), then multiply the result by the number in the first line under the heading “Expenses Paid During Period” to estimate the expenses you paid on your account during this period.
Hypothetical Example for Comparison Purposes The second line of the table provides information about hypothetical account values and hypothetical expenses based on the Fund’s actual expense ratio and an assumed rate of return of 5% per year before expenses, which is not the Fund’s actual return. The hypothetical account values and expenses may not be used to estimate the actual ending account balance or expenses you paid for the period. You may use this information to compare ongoing costs of investing in the Fund and other funds. To do so, compare this 5% hypothetical example with the 5% hypothetical examples that appear in the shareholder reports of other funds.
Please note that the expenses shown in the table are meant to highlight your ongoing costs only and do not reflect any direct costs, such as wire fees or low balance fees. Therefore, the second line of the table is useful in comparing ongoing costs only and will not help you determine the relative total costs of owning different funds. In addition, if these direct costs were included, your costs would be higher.
Beginning Account 5/1/2013 | Ending Account 10/31/13 | Expense Ratio(a) | Expenses Paid During period 5/1/2013 - 10/31/13(b) | |||||||||||||||||
Actual | $ 1,000.00 | $ 1,092.70 | 0.78 | % | $ 4.11 | |||||||||||||||
Hypothetical (5% return before expenses) | $ 1,000.00 | $ 1,021.27 | 0.78 | % | $ 3.97 | |||||||||||||||
| (a) | The Fund’s expense ratios have been annualized based on the Fund’s most recent fiscal half-year expenses. |
| (b) | Expenses are equal to the Fund’s annualized expense ratio, multiplied by the average account value over the period, multiplied by the number of days in the most recent fiscal half-year 184/365. |
Semi-Annual Report | October 31, 2013 |
5 |
The Disciplined Growth Investors Fund | Portfolio of Investments | |
| October 31, 2013 (Unaudited) |
| Shares | Value (Note 2) | |||||||
| ||||||||
COMMON STOCKS (71.76%) | ||||||||
CONSUMER DISCRETIONARY (22.24%) | ||||||||
Auto & Auto Parts (1.56%) | ||||||||
Gentex Corp. | 40,600 | $ | 1,195,264 | |||||
|
| |||||||
Commercial Services (1.53%) | ||||||||
Corporate Executive Board Co. | 16,025 | 1,168,222 | ||||||
|
| |||||||
Consumer Products (5.51%) | ||||||||
Ethan Allen Interiors, Inc. | 38,444 | 1,024,148 | ||||||
Garmin Ltd. | 21,938 | 1,025,601 | ||||||
Ralph Lauren Corp. | 7,831 | 1,297,127 | ||||||
Select Comfort Corp.(a) | 47,461 | 869,486 | ||||||
|
| |||||||
| 4,216,362 | ||||||||
|
| |||||||
Consumer Services (0.26%) | ||||||||
Nutrisystem, Inc. | 10,757 | 202,232 | ||||||
|
| |||||||
Leisure (2.08%) | ||||||||
Cheesecake Factory, Inc. | 12,350 | 583,537 | ||||||
Royal Caribbean Cruises Ltd. | 24,100 | 1,013,164 | ||||||
|
| |||||||
| 1,596,701 | ||||||||
|
| |||||||
Media (1.10%) | ||||||||
DreamWorks Animation SKG, Inc. - Class A(a) | 24,587 | 841,859 | ||||||
|
| |||||||
Retail (10.20%) | ||||||||
Cabela’s, Inc.(a) | 30,900 | 1,832,988 | ||||||
Limited Brands, Inc. | 32,905 | 2,060,182 | ||||||
TJX Cos., Inc. | 64,425 | 3,916,396 | ||||||
|
| |||||||
| 7,809,566 | ||||||||
|
| |||||||
TOTAL CONSUMER DISCRETIONARY | 17,030,206 | |||||||
|
| |||||||
CONSUMER, NON-CYCLICAL (1.23%) | ||||||||
Biotechnology (0.50%) | ||||||||
Myriad Genetics, Inc.(a) | 15,600 | 380,328 | ||||||
|
| |||||||
Household Products/Wares (0.73%) | ||||||||
Tumi Holdings, Inc.(a) | 26,300 | 561,505 | ||||||
|
| |||||||
TOTAL CONSUMER, NON-CYCLICAL | 941,833 | |||||||
|
| |||||||
|
1-855-DGI-FUND (344-3863) | www.DGIfund.com |
The Disciplined Growth Investors Fund | Portfolio of Investments | |
| October 31, 2013 (Unaudited) |
| Shares | Value (Note 2) | |||||||
| ||||||||
ENERGY (1.70%) | ||||||||
Energy Equipment & Services (1.21%) | ||||||||
Noble Corp. | 24,507 | $ | 923,914 | |||||
|
| |||||||
Oil & Gas (0.49%) | ||||||||
Ultra Petroleum Corp.(a) | 20,625 | 378,675 | ||||||
|
| |||||||
TOTAL ENERGY | 1,302,589 | |||||||
|
| |||||||
FINANCIAL SERVICES (3.73%) | ||||||||
Banks (0.66%) | ||||||||
TCF Financial Corp. | 33,325 | 505,874 | ||||||
|
| |||||||
Consumer Finance & Credit Services (1.80%) | ||||||||
FactSet Research Systems, Inc. | 12,694 | 1,382,884 | ||||||
|
| |||||||
Investment Banking & Brokerage (1.27%) | ||||||||
E*Trade Financial Corp.(a) | 25,796 | 436,210 | ||||||
Janus Capital Group, Inc. | 54,225 | 535,201 | ||||||
|
| |||||||
| 971,411 | ||||||||
|
| |||||||
TOTAL FINANCIAL SERVICES | 2,860,169 | |||||||
|
| |||||||
HEALTH CARE (6.30%) | ||||||||
Medical Equipment & Services (5.04%) | ||||||||
Edwards Lifesciences Corp.(a) | 25,950 | 1,691,680 | ||||||
Intuitive Surgical, Inc.(a) | 3,162 | 1,174,683 | ||||||
Varian Medical Systems, Inc.(a) | 13,675 | 992,532 | ||||||
|
| |||||||
| 3,858,895 | ||||||||
|
| |||||||
Medical Specialties (1.19%) | ||||||||
Align Technology, Inc.(a) | 15,950 | 910,107 | ||||||
|
| |||||||
Pharmaceuticals & Biotech (0.07%) | ||||||||
Incyte Corp. Ltd.(a) | 1,400 | 54,600 | ||||||
|
| |||||||
TOTAL HEALTH CARE | 4,823,602 | |||||||
|
| |||||||
Semi-Annual Report | October 31, 2013 |
7 |
The Disciplined Growth Investors Fund | Portfolio of Investments | |
| October 31, 2013 (Unaudited) |
| Shares | Value (Note 2) | |||||||
| ||||||||
INDUSTRIALS (0.83%) | ||||||||
Machinery-Diversified (0.83%) | ||||||||
Graco, Inc. | 8,200 | $ | 633,532 | |||||
|
| |||||||
TOTAL INDUSTRIALS | 633,532 | |||||||
|
| |||||||
PRODUCER DURABLES (10.86%) | ||||||||
Machinery (3.00%) | ||||||||
Middleby Corp.(a) | 10,093 | 2,297,671 | ||||||
|
| |||||||
Manufacturing & Production (2.83%) | ||||||||
Eaton Corp. PLC | 30,714 | 2,167,180 | ||||||
|
| |||||||
Scientific Instruments & Services (2.43%) | ||||||||
Brady Corp. - Class A | 11,100 | 324,009 | ||||||
Trimble Navigation Ltd.(a) | 53,750 | 1,535,637 | ||||||
|
| |||||||
| 1,859,646 | ||||||||
|
| |||||||
Software (0.61%) | ||||||||
Paychex, Inc. | 11,075 | 468,030 | ||||||
|
| |||||||
Transportation & Freight (1.99%) | ||||||||
JetBlue Airways Corp.(a) | 69,825 | 495,059 | ||||||
Landstar System, Inc. | 18,550 | 1,025,630 | ||||||
|
| |||||||
| 1,520,689 | ||||||||
|
| |||||||
TOTAL PRODUCER DURABLES | 8,313,216 | |||||||
|
| |||||||
TECHNOLOGY (23.56%) | ||||||||
Computers (0.61%) | ||||||||
IHS, Inc. - Class A(a) | 4,275 | 466,189 | ||||||
Imation Corp.(a) | 800 | 3,720 | ||||||
|
| |||||||
| 469,909 | ||||||||
|
| |||||||
Electronics (7.11%) | ||||||||
ARM Holdings PLC ADR | 19,062 | 899,536 | ||||||
Microchip Technology, Inc. | 18,150 | 779,724 | ||||||
Open Text Corp. | 23,556 | 1,727,597 | ||||||
Plexus Corp.(a) | 53,225 | 2,037,453 | ||||||
|
| |||||||
| 5,444,310 | ||||||||
|
| |||||||
|
1-855-DGI-FUND (344-3863) | www.DGIfund.com |
The Disciplined Growth Investors Fund | Portfolio of Investments | |
| October 31, 2013 (Unaudited) |
| Shares | Value (Note 2) | |||||||
| ||||||||
TECHNOLOGY (continued) | ||||||||
Information Technology (13.76%) | ||||||||
Akamai Technologies, Inc.(a) | 30,775 | $ | 1,376,873 | |||||
Apple, Inc. | 1,193 | 623,164 | ||||||
Autodesk, Inc.(a) | 35,350 | 1,410,818 | ||||||
Dolby Laboratories, Inc. - Class A | 13,475 | 481,597 | ||||||
Intuit, Inc. | 38,625 | 2,758,211 | ||||||
Seagate Technology PLC | 46,812 | 2,278,808 | ||||||
Yahoo!, Inc.(a) | 48,825 | 1,607,807 | ||||||
|
| |||||||
| 10,537,278 | ||||||||
|
| |||||||
Telecommunications (2.08%) | ||||||||
Aviat Networks, Inc.(a) | 43,500 | 89,610 | ||||||
Plantronics, Inc. | 24,875 | 1,068,133 | ||||||
ViaSat, Inc.(a) | 6,569 | 434,342 | ||||||
|
| |||||||
| 1,592,085 | ||||||||
|
| |||||||
TOTAL TECHNOLOGY | 18,043,582 | |||||||
|
| |||||||
UTILITIES (1.31%) | ||||||||
Utilities (1.31%) | ||||||||
tw telecom, Inc.(a) | 31,725 | 999,972 | ||||||
|
| |||||||
TOTAL UTILITIES | 999,972 | |||||||
|
| |||||||
TOTAL COMMON STOCKS (Cost $41,377,749) | 54,948,701 | |||||||
|
| |||||||
| Principal Amount | Value (Note 2) | |||||||
| ||||||||
ASSET/MORTGAGE BACKED SECURITIES (0.24%) | ||||||||
Government National Mortgage Association, Series 2005-93 | ||||||||
5.500% 12/20/2034 | $ | 176,137 | 187,106 | |||||
|
| |||||||
TOTAL ASSET/MORTGAGE BACKED SECURITIES (Cost $194,189) | 187,106 | |||||||
|
| |||||||
CORPORATE BONDS (23.04%) | ||||||||
Affiliated Computer Services, Inc. | ||||||||
5.125% 06/01/2015 | 120,000 | 127,119 | ||||||
Ameren Illinois Co. | ||||||||
9.750% 11/15/2018 | 164,000 | 220,099 | ||||||
Semi-Annual Report | October 31, 2013 |
9 |
The Disciplined Growth Investors Fund | Portfolio of Investments | |
| October 31, 2013 (Unaudited) |
| Principal Amount | Value (Note 2) | |||||||
| ||||||||
CORPORATE BONDS (continued) | ||||||||
American Express Co. | ||||||||
5.500% 09/12/2016 | $ | 180,000 | $ | 201,943 | ||||
American International Group, Inc. | ||||||||
5.850% 01/16/2018 | 175,000 | 202,314 | ||||||
Anheuser-Busch InBev Worldwide, Inc. | ||||||||
5.375% 01/15/2020 | 218,000 | 252,211 | ||||||
Arizona Public Service Co. | ||||||||
8.750% 03/01/2019 | 187,000 | 243,021 | ||||||
AT&T, Inc. | ||||||||
5.500% 02/01/2018 | 415,000 | 473,691 | ||||||
BB&T Corp. | ||||||||
5.700% 04/30/2014 | 200,000 | 205,123 | ||||||
BP Capital Markets PLC | ||||||||
3.125% 10/01/2015 | 190,000 | 198,846 | ||||||
Burlington Northern Santa Fe LLC | ||||||||
4.875% 01/15/2015 | 222,000 | 233,298 | ||||||
Coca-Cola HBC Finance BV | ||||||||
5.500% 09/17/2015 | 223,000 | 239,260 | ||||||
Comcast Cable Communications Holdings, Inc. | ||||||||
9.455% 11/15/2022 | 164,000 | 233,169 | ||||||
Commonwealth Edison Co. | ||||||||
5.800% 03/15/2018 | 110,000 | 128,511 | ||||||
Connecticut Light & Power Co., Series 09-A | ||||||||
5.500% 02/01/2019 | 115,000 | 133,230 | ||||||
Consolidated Edison Co. of New York, Inc. | ||||||||
7.125% 12/01/2018 | 384,000 | 478,416 | ||||||
Corporacion Andina de Fomento | ||||||||
5.750% 01/12/2017 | 1,000 | 1,112 | ||||||
8.125% 06/04/2019 | 184,000 | 227,215 | ||||||
CSX Corp. | ||||||||
7.375% 02/01/2019 | 105,000 | 129,852 | ||||||
Diageo Capital PLC | ||||||||
5.750% 10/23/2017 | 416,000 | 481,703 | ||||||
Dominion Resources, Inc. | ||||||||
2.250% 09/01/2015 | 765,000 | 785,555 | ||||||
El Paso Natural Gas Co. LLC | ||||||||
5.950% 04/15/2017 | 180,000 | 203,186 | ||||||
Emerson Electric Co. | ||||||||
5.000% 04/15/2019 | 133,000 | 151,843 | ||||||
Energy Transfer Partners LP | ||||||||
9.700% 03/15/2019 | 102,000 | 133,990 | ||||||
Enterprise Products Operating LLC | ||||||||
3.700% 06/01/2015 | 215,000 | 224,472 | ||||||
|
1-855-DGI-FUND (344-3863) | www.DGIfund.com |
The Disciplined Growth Investors Fund | Portfolio of Investments | |
| October 31, 2013 (Unaudited) |
| Principal Amount | Value (Note 2) | |||||||
| ||||||||
CORPORATE BONDS (continued) | ||||||||
Fluor Corp. | ||||||||
3.375% 09/15/2021 | $ | 133,000 | $ | 133,648 | ||||
General Electric Capital Corp. | ||||||||
5.875% 01/14/2038 | 230,000 | 260,316 | ||||||
Health Care REIT, Inc. | ||||||||
6.200% 06/01/2016 | 180,000 | 201,538 | ||||||
Hewlett-Packard Co. | ||||||||
3.750% 12/01/2020 | 155,000 | 154,009 | ||||||
International Business Machines Corp. | ||||||||
7.625% 10/15/2018 | 372,000 | 473,611 | ||||||
Johnson & Johnson | ||||||||
5.850% 07/15/2038 | 186,000 | 227,155 | ||||||
Joy Global, Inc. | ||||||||
6.000% 11/15/2016 | 431,000 | 482,835 | ||||||
JPMorgan Chase & Co. | ||||||||
3.700% 01/20/2015 | 422,000 | 437,296 | ||||||
Lockheed Martin Corp. | ||||||||
4.250% 11/15/2019 | 218,000 | 238,807 | ||||||
Lubrizol Corp. | ||||||||
8.875% 02/01/2019 | 159,000 | 211,306 | ||||||
McDonald’s Corp. | ||||||||
6.300% 03/01/2038 | 173,000 | 217,394 | ||||||
Merck & Co., Inc | ||||||||
5.950% 12/01/2028 | 107,000 | 130,665 | ||||||
MetLife, Inc. | ||||||||
6.750% 06/01/2016 | 170,000 | 194,929 | ||||||
Mondelez International, Inc. | ||||||||
5.375% 02/10/2020 | 223,000 | 253,387 | ||||||
National Rural Utilities Cooperative Finance Corp. | ||||||||
10.375% 11/01/2018 | 342,000 | 469,663 | ||||||
Nevada Power Co. | ||||||||
7.125% 03/15/2019 | 174,000 | 216,483 | ||||||
News America, Inc. | ||||||||
6.900% 03/01/2019 | 117,000 | 142,353 | ||||||
Nisource Finance Corp. | ||||||||
6.800% 01/15/2019 | 117,000 | 138,277 | ||||||
Noble Energy, Inc. | ||||||||
8.250% 03/01/2019 | 188,000 | 236,812 | ||||||
North American Development Bank | ||||||||
2.400% 10/26/2022 | 253,000 | 230,056 | ||||||
Ohio Power Co., Series M | ||||||||
5.375% 10/01/2021 | 195,000 | 221,441 | ||||||
Oncor Electric Delivery Co. LLC | ||||||||
7.000% 09/01/2022 | 183,000 | 225,086 | ||||||
Semi-Annual Report | October 31, 2013 |
11 |
The Disciplined Growth Investors Fund | Portfolio of Investments | |
| October 31, 2013 (Unaudited) |
| Principal Amount | Value (Note 2) | |||||||
| ||||||||
CORPORATE BONDS (continued) | ||||||||
ONEOK Partners LP | ||||||||
6.150% 10/01/2016 | $ | 345,000 | $ | 388,925 | ||||
Pepsi Bottling Group, Inc., Series B | ||||||||
7.000% 03/01/2029 | 159,000 | 204,221 | ||||||
Plains All American Pipeline LP / Plains All American Finance Corp. | ||||||||
3.950% 09/15/2015 | 21,000 | 22,211 | ||||||
8.750% 05/01/2019 | 155,000 | 200,317 | ||||||
PSEG Power LLC | ||||||||
5.320% 09/15/2016 | 440,000 | 486,710 | ||||||
5.500% 12/01/2015 | 180,000 | 196,289 | ||||||
Republic Services, Inc. | ||||||||
5.500% 09/15/2019 | 121,000 | 138,033 | ||||||
Rio Tinto Finance USA Ltd. | ||||||||
9.000% 05/01/2019 | 166,000 | 217,607 | ||||||
Royal Bank of Scotland Group PLC, Series 1 | ||||||||
9.118% Perpetual Maturity (b) | 3,000 | 3,053 | ||||||
Safeway, Inc. | ||||||||
5.625% 08/15/2014 | 33,000 | 33,938 | ||||||
Sempra Energy | ||||||||
6.500% 06/01/2016 | 430,000 | 487,622 | ||||||
Southern Co., Series A | ||||||||
2.375% 09/15/2015 | 913,000 | 938,271 | ||||||
TCI Communications, Inc. | ||||||||
8.750% 08/01/2015 | 691,000 | 787,062 | ||||||
Texas Gas Transmission LLC | ||||||||
4.600% 06/01/2015 | 185,000 | 194,879 | ||||||
TransCanada PipeLines Ltd. | ||||||||
7.250% 08/15/2038 | 181,000 | 235,525 | ||||||
Unilever Capital Corp. | ||||||||
4.800% 02/15/2019 | 120,000 | 136,451 | ||||||
United Parcel Service, Inc. | ||||||||
6.200% 01/15/2038 | 175,000 | 218,718 | ||||||
US Bank | ||||||||
3.778% 04/29/2020 (c) | 227,000 | 236,413 | ||||||
4.800% 04/15/2015 | 71,000 | 75,184 | ||||||
Verizon Communications, Inc. | ||||||||
3.000% 04/01/2016 | 192,000 | 200,664 | ||||||
Viacom, Inc. | ||||||||
4.250% 09/15/2015 | 464,000 | 491,536 | ||||||
Wal-Mart Stores, Inc. | ||||||||
6.200% 04/15/2038 | 183,000 | 222,785 | ||||||
|
1-855-DGI-FUND (344-3863) | www.DGIfund.com |
The Disciplined Growth Investors Fund | Portfolio of Investments | |
| October 31, 2013 (Unaudited) |
| Principal Amount | Value (Note 2) | |||||||||||
| ||||||||||||
CORPORATE BONDS (continued) | ||||||||||||
Waste Management, Inc. | ||||||||||||
7.375% 03/11/2019 | $ | 102,000 | $ | 124,563 | ||||||||
|
| |||||||||||
TOTAL CORPORATE BONDS (Cost $17,654,449) | 17,647,223 | |||||||||||
|
| |||||||||||
FOREIGN GOVERNMENT BONDS (0.66%) | ||||||||||||
Israel Government AID Bonds | ||||||||||||
5.500% 12/04/2023 | 184,000 | 220,148 | ||||||||||
Israel Government AID Bonds, Series 8-Z, Zero Coupon | ||||||||||||
02/15/2020 | 68,000 | 59,515 | ||||||||||
Province of Quebec Canada, Series NN | ||||||||||||
7.125% 02/09/2024 | 176,000 | 227,874 | ||||||||||
|
| |||||||||||
TOTAL FOREIGN GOVERNMENT BONDS (Cost $525,473) | 507,537 | |||||||||||
|
| |||||||||||
GOVERNMENT & AGENCY OBLIGATIONS (0.27%) | ||||||||||||
Tennessee Valley Authority, Series B | ||||||||||||
4.700% 07/15/2033 | 55,000 | 57,414 | ||||||||||
U.S. Treasury Bonds | ||||||||||||
4.750% 05/15/2014 | 75,000 | 76,873 | ||||||||||
6.500% 11/15/2026 | 28,000 | 38,986 | ||||||||||
U.S. Treasury Notes | ||||||||||||
4.500% 11/15/2015 | 16,000 | 17,362 | ||||||||||
4.500% 02/15/2016 | 13,000 | 14,226 | ||||||||||
|
| |||||||||||
TOTAL GOVERNMENT & AGENCY OBLIGATIONS (Cost $212,776) | 204,861 | |||||||||||
|
| |||||||||||
| 7-Day Yield | Shares | Value (Note 2) | ||||||||||
| ||||||||||||
SHORT TERM INVESTMENTS (3.75%) | ||||||||||||
Fidelity Institutional Money Market Government Portfolio - Class I | 0.01 | % | 2,868,933 | 2,868,933 | ||||||||
|
| |||||||||||
TOTAL SHORT TERM INVESTMENTS (Cost $2,868,933) | 2,868,933 | |||||||||||
|
| |||||||||||
Semi-Annual Report | October 31, 2013 |
13 |
The Disciplined Growth Investors Fund | Portfolio of Investments | |
| October 31, 2013 (Unaudited) |
Value (Note 2) | ||||||
| ||||||
TOTAL INVESTMENTS (99.72%) (Cost $62,833,569) | $ | 76,364,361 | ||||
Other Assets In Excess Of Liabilities (0.28%) | 210,611 | |||||
|
| |||||
NET ASSETS (100.00%) | $ | 76,574,972 | ||||
|
| |||||
|
| |||||
| (a) | Non-Income Producing Security. |
| (b) | This security has no contractual maturity date, is not redeemable and contractually pays an indefinite stream of interest. |
| (c) | The coupon rate shown on floating or adjustable rate securities represents the rate at period end. |
Common Abbreviations:
ADR - American Depositary Receipt.
AID - Agency for International Development.
BV - Besloten Vennootschap is the Dutch term for private limited liability company.
LLC - Limited Liability Company.
LP - Limited Partnership.
Ltd. - Limited.
PLC - Public Limited Company.
Holdings are subject to change.
For Fund compliance purposes, the Fund’s industry classifications refer to any one or more of the industry sub-classifications used by one or more widely recognized market indexes or ratings group indexes, and/or as defined by Fund management. This definition may not apply for purposes of this report, which may combine industry sub-classifications for reporting ease. Industries are shown as a percent of net assets.
See Notes to Financial Statements.
|
1-855-DGI-FUND (344-3863) | www.DGIfund.com |
The Disciplined Growth Investors Fund | Statement of Assets and Liabilities | |
| October 31, 2013 (Unaudited) |
| ||||
ASSETS | ||||
Investments, at value | $ | 76,364,361 | ||
Receivable for shares sold | 10,000 | |||
Dividends and interest receivable | 251,167 | |||
| ||||
Total assets | 76,625,528 | |||
| ||||
LIABILITIES | ||||
Payable to adviser | 50,556 | |||
| ||||
Total liabilities | 50,556 | |||
| ||||
NET ASSETS | $ | 76,574,972 | ||
| ||||
| ||||
NET ASSETS CONSIST OF | ||||
Paid-in capital (Note 5) | $ | 62,745,150 | ||
Accumulated net investment income | 18,640 | |||
Accumulated net realized gain on investments | 280,390 | |||
Net unrealized appreciation on investments | 13,530,792 | |||
| ||||
NET ASSETS | $ | 76,574,972 | ||
| ||||
| ||||
INVESTMENTS, AT COST | $ | 62,833,569 | ||
PRICING OF SHARES | ||||
Net Asset Value, offering and redemption price per share | $ | 14.35 | ||
Shares of beneficial interest outstanding | 5,335,571 | |||
See Notes to Financial Statements.
Semi-Annual Report | October 31, 2013 |
15 |
The Disciplined Growth Investors Fund | Statement of Operations | |
For the Six Months Ended October 31, 2013 (Unaudited) | ||||||
| ||||||
INVESTMENT INCOME | ||||||
Dividends | $ | 280,553 | ||||
Foreign taxes withheld | (3,711) | |||||
Interest | 203,257 | |||||
| ||||||
Total investment income | 480,099 | |||||
| ||||||
EXPENSES | ||||||
Investment advisory fees (Note 6) | 280,468 | |||||
| ||||||
Total expenses | 280,468 | |||||
| ||||||
NET INVESTMENT INCOME | 199,631 | |||||
| ||||||
REALIZED AND UNREALIZED GAIN ON INVESTMENTS | ||||||
Net realized gain on investments | 75,180 | |||||
Net change in unrealized appreciation on investments | 6,070,851 | |||||
| ||||||
NET REALIZED AND UNREALIZED GAIN ON INVESTMENTS | 6,146,031 | |||||
| ||||||
NET INCREASE IN NET ASSETS RESULTING FROM OPERATIONS | $ | 6,345,662 | ||||
| ||||||
See Notes to Financial Statements.
|
1-855-DGI-FUND (344-3863) | www.DGIfund.com |
The Disciplined Growth Investors Fund | Statements of Changes in Net Assets | |
For the Six Months Ended October 31, 2013 (Unaudited) | For the Year Ended April 30, 2013 | |||||||||
| ||||||||||
OPERATIONS | ||||||||||
Net investment income | $ | 199,631 | $ | 415,008 | ||||||
Net realized gain on investments | 75,180 | 261,618 | ||||||||
Net change in unrealized appreciation on investments | 6,070,851 | 4,182,524 | ||||||||
| ||||||||||
Net increase in net assets resulting from operations | 6,345,662 | 4,859,150 | ||||||||
| ||||||||||
DISTRIBUTIONS (Note 3) | ||||||||||
From net investment income | (199,197) | (383,921) | ||||||||
From net realized gains on investments | – | (176,427) | ||||||||
| ||||||||||
Net decrease in net assets from distributions | (199,197) | (560,348) | ||||||||
| ||||||||||
CAPITAL SHARE TRANSACTIONS (Note 5) | ||||||||||
Proceeds from sales of shares | 4,912,827 | 29,863,013 | ||||||||
Issued to shareholders in reinvestment of distributions | 197,707 | 560,205 | ||||||||
Cost of shares redeemed, net of redemption fees | (1,649,413) | (3,432,700) | ||||||||
| ||||||||||
Net increase from capital share transactions | 3,461,121 | 26,990,518 | ||||||||
| ||||||||||
Net increase in net assets | 9,607,586 | 31,289,320 | ||||||||
| ||||||||||
NET ASSETS | ||||||||||
Beginning of period | 66,967,386 | 35,678,066 | ||||||||
| ||||||||||
End of period* | $ | 76,574,972 | $ | 66,967,386 | ||||||
| ||||||||||
*Including accumulated net investment income of: | $ | 18,640 | $ | 18,206 | ||||||
OTHER INFORMATION | ||||||||||
Share Transactions | ||||||||||
Issued | 356,572 | 2,376,536 | ||||||||
Issued in lieu of cash distributions | 14,513 | 45,306 | ||||||||
Redeemed | (120,284) | (277,179) | ||||||||
| ||||||||||
Net increase in share transactions | 250,801 | 2,144,663 | ||||||||
| ||||||||||
See Notes to Financial Statements.
Semi-Annual Report | October 31, 2013 |
17 |
The Disciplined Growth Investors Fund | Financial Highlights | |
| For a share outstanding during the periods presented |
For the Six Months Ended October 31, 2013 (Unaudited) | For the Year Ended April 30, 2013 | For the Period August 12, 2011 (Inception) to April 30, 2012 | ||||||||||
| ||||||||||||
NET ASSET VALUE, BEGINNING OF PERIOD | $ | 13.17 | $ | 12.13 | $ | 10.00 | ||||||
INCOME FROM OPERATIONS | ||||||||||||
Net investment income(a) | 0.04 | 0.11 | 0.05 | |||||||||
Net realized and unrealized gain on investments | 1.18 | 1.09 | 2.11 | |||||||||
| ||||||||||||
Total from investment operations | 1.22 | 1.20 | 2.16 | |||||||||
| ||||||||||||
DISTRIBUTIONS | ||||||||||||
From net investment income | (0.04) | (0.11) | (0.03) | |||||||||
From net realized gain on investments | – | (0.05) | – | |||||||||
| ||||||||||||
Total distributions | (0.04) | (0.16) | (0.03) | |||||||||
| ||||||||||||
REDEMPTION FEES ADDED TO PAID-IN CAPITAL | – | – | – | |||||||||
| ||||||||||||
INCREASE IN NET ASSET VALUE | 1.18 | 1.04 | 2.13 | |||||||||
| ||||||||||||
NET ASSET VALUE, END OF PERIOD | $ | 14.35 | $ | 13.17 | $ | 12.13 | ||||||
| ||||||||||||
TOTAL RETURN | 9.27%(b) | 9.93% | 21.65%(b) | |||||||||
RATIOS AND SUPPLEMENTAL DATA | ||||||||||||
Net assets, end of period (000’s) | $ | 76,575 | $ | 66,967 | $ | 35,678 | ||||||
RATIOS TO AVERAGE NET ASSETS | ||||||||||||
Expenses | 0.78%(c) | 0.78% | 0.77%(c) | |||||||||
Net investment income | 0.56%(c) | 0.90% | 0.60%(c) | |||||||||
PORTFOLIO TURNOVER RATE | 3%(b) | 10% | 6%(b) | |||||||||
| (a) | Per share numbers have been calculated using the average shares method. |
| (b) | Not annualized. |
| (c) | Annualized. |
See Notes to Financial Statements.
|
1-855-DGI-FUND (344-3863) | www.DGIfund.com |
The Disciplined Growth Investors Fund | Notes to Financial Statements | |
| October 31, 2013 (Unaudited) |
1. ORGANIZATION
Financial Investors Trust (the “Trust”), a Delaware statutory trust, is an open-end management investment company registered under the Investment Company Act of 1940, as amended (“1940 Act”). As of October 31, 2013, the Trust had 27 registered funds. This semi-annual report describes The Disciplined Growth Investors Fund (the “Fund”). The Fund seeks long-term capital growth and as a secondary objective, modest income with reasonable risk. The Fund pursues its investment objective by normally investing approximately 60% of its assets in equity securities and approximately 40% in fixed-income securities and cash equivalents.
2. SIGNIFICANT ACCOUNTING POLICIES
The accompanying financial statements were prepared in accordance with accounting principles generally accepted in the United States of America (“U.S. GAAP”). The preparation of financial statements in conformity with U.S. GAAP requires management to make certain estimates and assumptions that affect the reported amounts of assets and liabilities and disclosures of contingent assets and liabilities at the date of the financial statements and the reported amounts of revenue and expenses during the period. Actual results could differ from those estimates. The following is a summary of significant accounting policies consistently followed by the Fund in preparation of their financial statements.
Investment Valuation: The Fund generally values its securities based on market prices determined at the close of regular trading on the New York Stock Exchange (“NYSE”), normally 4:00 p.m. Eastern Time, on each day the NYSE is open for trading.
For equity securities and mutual funds that are traded on an exchange, the market price is usually the closing sale or official closing price on that exchange. In the case of equity securities not traded on an exchange, or if such closing prices are not otherwise available, the securities are valued at the mean of the most recent bid and ask prices on such day. Redeemable securities issued by open-end registered investment companies are valued at the investment company’s applicable net asset value, with the exception of exchange-traded open-end investment companies, which are priced as equity securities.
The market price for debt obligations is generally the price supplied by an independent third-party pricing service approved by the Board of Trustees (the “Board”), which may use a matrix, formula or other objective method that takes into consideration quotations from dealers, market transactions in comparable investments, market indices and yield curves. If vendors are unable to supply a price, or if the price supplied is deemed to be unreliable, the market price may be determined using quotations received from one or more broker–dealers that make a market in the security. Short–term debt obligations that will mature in 60 days or less are valued at amortized cost, unless it is determined that using this method would not reflect an investment’s fair value.
When such prices or quotations are not available, or when the Fair Value Committee appointed by the Board believes that they are unreliable, securities may be priced using fair value procedures approved by the Board.
Semi-Annual Report | October 31, 2013 |
19 |
The Disciplined Growth Investors Fund | Notes to Financial Statements | |
| October 31, 2013 (Unaudited) |
Fair Value Measurements: The Fund discloses the classification of its fair value measurements following a three-tier hierarchy based on the inputs used to measure fair value. Inputs refer broadly to the assumptions that market participants would use in pricing the asset or liability, including assumptions about risk. Inputs may be observable or unobservable. Observable inputs reflect the assumptions market participants would use in pricing the asset or liability that are developed based on market data obtained from sources independent of the reporting entity. Unobservable inputs reflect the reporting entity’s own assumptions about the assumptions market participants would use in pricing the asset or liability that are developed based on the best information available.
Various inputs are used in determining the value of the Fund’s investments as of the end of the reporting period. When inputs used fall into different levels of the fair value hierarchy, the level in the hierarchy within which the fair value measurement falls is determined based on the lowest level input that is significant to the fair value measurement in its entirety. The designated input levels are not necessarily an indication of the risk or liquidity associated with these investments. These inputs are categorized in the following hierarchy under applicable financial accounting standards:
Level 1 – | Unadjusted quoted prices in active markets for identical investments, unrestricted assets or liabilities that the Fund has the ability to access at the measurement date; | |
Level 2 – | Quoted prices which are not active, quoted prices for similar assets or liabilities in active markets or inputs other than quoted prices that are observable (either directly or indirectly) for substantially the full term of the asset or liability; and | |
Level 3 – | Significant unobservable prices or inputs (including the Fund’s own assumptions in determining the fair value of investments) where there is little or no market activity for the asset or liability at the measurement date. | |
The following is a summary of each input used to value the Fund as of October 31, 2013:
| Investments in Securities at Value | Level 1 - Unadjusted Quoted Prices | Level 2 - Other Significant Observable Inputs | Level 3 - Significant Unobservable Inputs | Total | ||||||||||||
| ||||||||||||||||
Common Stocks(a) | $ | 54,948,701 | $ | – | $ | – | $ | 54,948,701 | ||||||||
Asset/Mortgage Backed Securities | – | 187,106 | – | 187,106 | ||||||||||||
Corporate Bonds | – | 17,647,223 | – | 17,647,223 | ||||||||||||
Foreign Government Bonds | – | 507,537 | – | 507,537 | ||||||||||||
Government & Agency Obligations | – | 204,861 | – | 204,861 | ||||||||||||
Short Term Investments | 2,868,933 | – | – | 2,868,933 | ||||||||||||
| ||||||||||||||||
TOTAL | $ | 57,817,634 | $ | 18,546,727 | $ | – | $ | 76,364,361 | ||||||||
| ||||||||||||||||
| (a) | For detailed descriptions of the underlying industries, see the accompanying Portfolio of Investments. |
|
1-855-DGI-FUND (344-3863) | www.DGIfund.com |
The Disciplined Growth Investors Fund | Notes to Financial Statements | |
| October 31, 2013 (Unaudited) |
The Fund recognizes transfers between levels as of the end of the period. For the six months ended October 31, 2013, the Fund did not have any transfers between Level 1 and Level 2 securities. For the six months ended October 31, 2013, the Fund did not have any securities that used unobservable inputs (Level 3) in determining fair value.
Investment Transactions and Investment Income: Investment transactions are accounted for on the date the investments are purchased or sold (trade date). Realized gains and losses from investment transactions are reported on an identified cost basis. Interest income, which includes accretion of discounts, is accrued and recorded as earned. Dividend income is recognized on the ex-dividend date or for certain foreign securities, as soon as information is available to the Fund.
Trust Expenses: Some expenses of the Trust can be directly attributed to the Fund. Expenses which cannot be directly attributed to the Fund are apportioned among all funds in the Trust based on average net assets of each fund.
Fund Expenses: Expenses that are specific to the Fund are charged directly to the Fund.
Federal Income Taxes: The Fund complies with the requirements under Subchapter M of the Internal Revenue Code of 1986, as amended, applicable to regulated investment companies and intends to distribute substantially all of their net taxable income and net capital gains, if any, each year so that it will not be subject to excise tax on undistributed income and gains. The Fund is not subject to income taxes to the extent such distributions are made.
As of and during the six months ended October 31, 2013, the Fund did not have a liability for any unrecognized tax benefits. The Fund files U.S. federal, state, and local tax returns as required. The Fund’s tax returns are subject to examination by the relevant tax authorities until expiration of the applicable statute of limitations, which is generally three years after the filing of the tax return for federal purposes and four years for most state returns. Tax returns for open years have incorporated no uncertain tax positions that require a provision for income taxes.
Distributions to Shareholders: The Fund normally pays dividends, if any, quarterly and distributes capital gains, if any, on an annual basis. Income dividend distributions are derived from interest and other income the Fund receives from its investments, including short term capital gains. Long term capital gain distributions are derived from gains realized when the Fund sells a security it has owned for more than a year. The Fund may make additional distributions and dividends at other times if the portfolio manager believes doing so may be necessary for the Fund to avoid or reduce taxes.
Semi-Annual Report | October 31, 2013 |
21 |
The Disciplined Growth Investors Fund | Notes to Financial Statements | |
| October 31, 2013 (Unaudited) |
3. TAX BASIS INFORMATION
Tax Basis of Investments: As of October 31, 2013, the aggregate cost of investments, gross unrealized appreciation/(depreciation) and net unrealized appreciation for Federal tax purposes was as follows:
| Disciplined Growth Investors Fund | ||||
| ||||
Gross appreciation (excess of value over tax cost) | $ | 14,872,437 | ||
Gross depreciation (excess of tax cost over value) | (1,341,645) | |||
| ||||
Net unrealized appreciation | $ | 13,530,792 | ||
| ||||
Cost of investments for income tax purposes | $ | 62,833,569 | ||
| ||||
Tax Basis of Distributions to Shareholders: The character of distributions made during the year from net investment income or net realized gains may differ from its ultimate characterization for federal income tax purposes. Also, due to the timing of dividend distributions, the fiscal year in which amounts are distributed may differ from the fiscal year in which the income or realized gain was recorded by the Fund, accordingly, tax basis balances have not been determined as of October 31, 2013.
The tax character of distributions paid during the year ended April 30, 2013, were as follows:
| Ordinary Income | Long-Term Capital Gain | |||||||
| ||||||||
The Disciplined Growth Investors Fund | $ | 560,348 | $ | – | ||||
The amounts and characteristics of tax basis distributions and composition of distributable earnings/(accumulated losses) are finalized at fiscal year-end. Accordingly, tax basis balances have not been determined as of October 31, 2013.
4. SECURITY TRANSACTIONS
During the six months ended October 31, 2013, equity holdings, asset/mortgage backed securities and fixed income securities were transferred in-kind. The intent of the transfers was to save on equity transaction costs both for the new shareholders at the institution they transferred from and for the Fund on the addition of assets. The assets of two separate accounts were transferred-in-kind into the Fund in the amount of $881,768.
|
1-855-DGI-FUND (344-3863) | www.DGIfund.com |
The Disciplined Growth Investors Fund | Notes to Financial Statements | |
| October 31, 2013 (Unaudited) |
The cost of purchases and proceeds from sales of securities (excluding short-term securities, transfers-in-kind, and U.S. Government Obligations) during the six months ended October 31, 2013, were as follows:
| Fund | Purchases of Securities | Proceeds From Sales of Securities | ||
| ||||
The Disciplined Growth Investors Fund | $ 3,485,189 | $ 1,588,198 | ||
Investment transactions in U.S. government and agency securities (excluding transfers-in-kind) for the period ended October 31, 2013 were as follows:
| ||||
| Fund | Purchases of Securities | Proceeds From Sales of Securities | ||
| ||||
The Disciplined Growth Investors Fund | $ – | $ 277,702 | ||
5. SHARES OF BENEFICIAL INTEREST
The capitalization of the Trust consists of an unlimited number of shares of beneficial interest with no par value per share. Holders of the shares of the Fund of the Trust have one vote for each share held and a proportionate fraction of a vote for each fractional share. All shares issued and outstanding are fully paid and are non-assessable, transferable and redeemable at the option of the shareholder. Shares have no pre-emptive rights.
Shares redeemed within 90 days of purchase may incur a 2% short-term redemption fee deducted from the redemption amount. For the six months ended October 31, 2013, the Fund did not receive any redemption fees.
6. MANAGEMENT AND RELATED-PARTY TRANSACTIONS
Disciplined Growth Investors, Inc. (the “Adviser” or “DGI”), subject to the authority of the Board, is responsible for the overall management and administration of the Fund’s business affairs. DGI manages the investments of the Fund in accordance with the Fund’s investment objective, policies and limitations and investment guidelines established jointly by the Adviser and the Trustees. Pursuant to the Advisory Agreement, the Fund pays the Adviser a unitary fee for the services and facilities it provides payable on a monthly basis at the annual rate of 0.78% of the Fund’s average daily net assets.
Out of the unitary management fee, the Adviser pays substantially all expenses of the Fund, including the cost of transfer agency, custody, fund administration, legal, audit and other services, except for interest expenses, distribution fees, brokerage expenses, taxes and extraordinary expenses not incurred in the ordinary course of the Fund’s business. Also included are Trustee fees which were $1,520 for the six months ended October 31, 2013.
Fund Accounting Fees and Expenses
ALPS Fund Services, Inc. (“ALPS” and the “Administrator”) (an affiliate of ALPS Distributors, Inc.) serves as administrator to the Fund, and has agreed to pay expenses incurred in connection with its administrative activities. Pursuant to the Administration, Bookkeeping and Pricing Services Agreement (the “Agreement”), ALPS will provide operational services to the Fund including,
Semi-Annual Report | October 31, 2013 |
23 |
The Disciplined Growth Investors Fund | Notes to Financial Statements | |
| October 31, 2013 (Unaudited) |
but not limited to fund accounting and fund administration and generally assist in the Fund’s operations.
Annual Administrative Fee, billed monthly, in the amount of the greater of (a) $150,000 annual minimum or (b) following basis point fee schedule:
| Average Total Net Assets | Contractual Fee | |||
| ||||
Between $0-$500M | 0.05% | |||
$500M-$1B | 0.03% | |||
Above $1B | 0.02% | |||
The Administrator is also reimbursed by the Fund for certain out-of-pocket expenses. The administrative fee and out-of-pocket expenses are included in the unitary fee paid to the Adviser.
Transfer Agent
ALPS serves as transfer, dividend paying and shareholder servicing agent for the Fund under a Transfer Agency and Services Agreement with the Trust. Under this Agreement, ALPS is paid an annual base fee of $25,000 plus fees for open accounts and is reimbursed for certain out-of-pocket expenses. The fee is included in the unitary fee paid to the Advisor.
Compliance Services
ALPS provides services that assist the Trust’s Chief Compliance Officer in monitoring and testing the policies and procedures of the Trust in conjunction with requirements under Rule 38a-1 under the 1940 Act under the Chief Compliance Officer Services Agreement with the Trust. Under this Agreement, ALPS is paid an annual base fee of $30,000 and is reimbursed for certain out-of-pocket expenses. The fee is included in the unitary fee paid to the Advisor.
Principal Financial Officer
ALPS receives an annual fee of $10,000 for providing Principal Financial Officer (“PFO”) services to the Fund. The fee is included in the unitary fee paid to the Adviser.
Distributor: ALPS Distributors, Inc. (“ADI” or the “Distributor”) (an affiliate of ALPS) acts as the distributor of the Fund’s shares pursuant to a Distribution Agreement with the Trust. Shares are sold on a continuous basis by ADI as agent for the Fund, and ADI has agreed to use its best efforts to solicit orders for the sale of the Fund’s shares, although it is not obliged to sell any particular amount of shares. ADI is not entitled to any compensation for its services as Distributor. ADI is registered as a broker-dealer with the Securities and Exchange Commission.
7. INDEMNIFICATIONS
Under the Trust’s organizational documents, its officers and Trustees are indemnified against certain liability arising out of the performance of their duties to the Trust. Additionally, in the normal course of business, the Trust enters into contracts with service providers that may contain general indemnification clauses, which may permit indemnification to the extent permissible under applicable law. The Trust’s maximum exposure under these arrangements is unknown, as this would involve future claims that may be made against the Trust that have not yet occurred.
|
1-855-DGI-FUND (344-3863) | www.DGIfund.com |
The Disciplined Growth Investors Fund | Notes to Financial Statements | |
| October 31, 2013 (Unaudited) |
8. NEW ACCOUNTING PRONOUNCEMENTS
In June 2013, the Financial Accounting Standards Board (the “FASB”) issued Accounting Standards Update (“ASU”) No. 2013-08, Financial Services-Investment Companies ( Topic 946): Amendments to the Scope, Measurement, and Disclosure Requirements. The FASB standard identifies characteristics a company must assess to determine whether it is considered an investment company for financial reporting purposes. This ASU is effective for fiscal years beginning after December 15, 2013. The Funds believe the adoption of this ASU will not have a material impact on their financial statements.
Semi-Annual Report | October 31, 2013 |
25 |
The Disciplined Growth Investors Fund | Disclosure Regarding Approval of Fund Advisory Agreements | |
| October 31, 2013 (Unaudited) |
THE DISCIPLINED GROWTH INVESTORS FUND (THE “DGI FUND”)
On June 11, 2013, the Trustees met in person to discuss, among other things, the approval of the Investment Advisory Agreement between the Trust and Disciplined Growth Investors, Inc. (“DGI”) (the “DGI Advisory Agreement”) in accordance with Section 15(c) of the 1940 Act. The Independent Trustees met with independent legal counsel during executive session and discussed the DGI Advisory Agreement and other related materials.
In renewing and approving the DGI Advisory Agreement, the Trustees, including the Independent Trustees, considered the following factors with respect to the DGI Fund:
Investment Advisory Fee Rate: The Trustees reviewed and considered the contractual annual unitary advisory fee to be paid by the Trust, on behalf of the DGI Fund, to DGI of 0.78% of the DGI Fund’s daily average net assets, in light of the extent and quality of the advisory services to be provided by DGI to the DGI Fund.
The Trustees considered the information they received comparing the DGI Fund’s contractual annual unitary advisory fee and overall expenses with those of funds in both the relevant expense group and universe of funds provided by an independent provider of investment company data.
Based on such information, the Trustees further determined that the contractual annual unitary advisory fee of 0.78% and the total expense ratio of 0.78% for the DGI Fund is comparable to others within the DGI Fund’s anticipated peer universe.
Nature, Extent and Quality of the Services under the DGI Advisory Agreement: The Trustees received and considered information regarding the nature, extent and quality of services provided to the DGI Fund under the DGI Advisory Agreement. The Trustees reviewed certain background materials supplied by DGI in its presentation, including its Form ADV.
The Trustees reviewed and considered DGI’s investment advisory personnel, its history as an asset manager, its performance and the amount of assets currently under management by DGI. The Trustees also reviewed the research and decision-making processes utilized by DGI, including the methods adopted to seek to achieve compliance with the investment objectives, policies and restrictions of the DGI Fund.
The Trustees considered the background and experience of DGI’s management in connection with the DGI Fund, including reviewing the qualifications, backgrounds and responsibilities of the management team primarily responsible for the day-to-day portfolio management of the DGI Fund and the extent of the resources devoted to research and analysis of actual and potential investments.
The Trustees also reviewed the accompanying compliance-related materials and further noted that they have received reports on these services and compliance issues at each regular Board meeting throughout the year related to the services rendered by DGI with respect to the DGI Fund.
|
1-855-DGI-FUND (344-3863) | www.DGIfund.com |
The Disciplined Growth Investors Fund | Disclosure Regarding Approval of Fund Advisory Agreements | |
| October 31, 2013 (Unaudited) |
Performance: The Trustees reviewed performance information for the DGI Fund for the three-month and 1-year periods ended March 31, 2013. That review included a comparison of the DGI Fund’s performance to the performance of a group of comparable funds selected by an independent provider of research data. The Trustees noted the comparable performance of the DGI Fund compared against funds identified by an independent provider of research data. The Trustees also considered DGI’s discussion of the DGI Fund’s underlying portfolio diversification categories, its top contributors and top detractors, as well as DGI’s performance and reputation generally and its investment techniques, risk management controls and decision-making processes.
The Adviser’s Profitability: The Trustees received a profitability analysis prepared by DGI based on the fees payable under the Advisory Agreement. The Trustees considered the losses realized by DGI in connection with the operation of the DGI Fund. The Trustees also considered DGI’s statements regarding its continuing commitment to the DGI Fund despite these losses. The Board then reviewed DGI’s financial statements in order to analyze the financial condition and stability and profitability of the adviser.
Economies of Scale: The Trustees considered whether economies of scale in the provision of services to the DGI Fund will be passed along to the shareholders under the proposed agreements.
Other Benefits to the Adviser: The Trustees reviewed and considered any other benefits derived or to be derived by DGI from its relationship with the DGI Fund, including soft dollar arrangements.
The Board summarized its deliberations with respect to the DGI Advisory Agreement with DGI. In retaining DGI and approving the investment advisory agreement and fees under such agreement, the Trustees concluded that no single factor reviewed by the Trustees was identified by the Trustees to be determinative as the principal factor in whether to approve the investment advisory agreement. Further, the Independent Trustees were advised by separate independent legal counsel throughout the process. The Trustees, including all of the Independent Trustees, concluded that:
| — | the investment advisory fees to be received by DGI with respect to the DGI Fund were comparable to others with in the Fund’s peer universe; |
| — | the nature, extent and quality of services rendered by DGI under the DGI Advisory Agreement were adequate; |
| — | the performance of the DGI Fund was generally comparable to the performance of the funds in its peer group; |
| — | the profit, if any, anticipated to be realized by DGI in connection with the operation of the DGI Fund is fair to the Trust, especially in light of the unitary fee arrangement; and |
| — | there were no material economies of scale or other benefits accruing to DGI in connection with its relationship with the DGI Fund. |
Based on the Trustees’ deliberations and their evaluation of the information described above, the Trustees, including all of the Independent Trustees, concluded that DGI’s compensation for investment advisory services is consistent with the best interests of the DGI Fund and its shareholders.
Semi-Annual Report | October 31, 2013 |
27 |
The Disciplined Growth Investors Fund | Additional Information | |
| October 31, 2013 (Unaudited) |
1. FUND HOLDINGS
The Fund files its complete schedule of portfolio holdings with the Securities and Exchange Commission (the “SEC”) for the first and third quarters of each fiscal year on Form N-Q within 60 days after the end of the period. Copies of the Fund’s Form N-Q are available without charge on the SEC website at http://www.sec.gov. You may also review and copy the Form N-Q at the SEC’s Public Reference Room in Washington, DC. For more information about the operation of the Public Reference Room, please call the SEC at 1-800-SEC-0330.
2. FUND PROXY VOTING POLICIES, PROCEDURES AND SUMMARIES
The Fund’s policies and procedures used in determining how to vote proxies and information regarding how the Fund voted proxies relating to portfolio securities during the most recent prior 12-month period ending June 30 are available without charge, (1) upon request, by calling (toll free) 855-DGI-FUND and (2) on the SEC’s website at http://www.sec.gov.
|
1-855-DGI-FUND (344-3863) | www.DGIfund.com |


| CONTENTS | PAGE | ||||
| 1 | |||||
| 6 | |||||
| 9 | |||||
| 8 | |||||
| 11 | |||||
| 12 | |||||
| 15 | |||||
| 18 | |||||
| 19 | |||||
| 20 | |||||
| 22 | |||||
| 25 | |||||
| 26 | |||||
| 34 | |||||
| www.vulcanvaluepartners.com |
| Shareholder Letter | ||
| October 31, 2013 (Unaudited) |
PORTFOLIO REVIEW
General
We are very pleased with our results for the period ended October 31, 2013. During the period, Vulcan Value Partners Fund and Vulcan Value Partners Small Cap Fund delivered double-digit returns. Vulcan Value Partners Fund beat both its primary and secondary benchmark index. Within this context we are gratified that both the Vulcan Value Partners Fund and Vulcan Value Partners Small Cap Fund received a 5-Star Overall Morningstar Rating™. (As of October 31, 2013, out of 1,484 Large Growth, and 599 Small Blend Funds, respectively, derived from a weighted average of the Fund’s three–, five– and ten–year (if applicable) Morningstar metrics, which are based on risk-adjusted return performance.)1
As we have often said, we place no weight on short-term results, good or bad, and neither should you. In fact, we have and will continue to willingly make decisions that negatively impact short-term performance when we think we can lower risk and improve our long-term returns. We encourage you to place more weight on our longer-term historical results and a great deal of weight on our long-term prospects.
We have some good news to share with you regarding internal developments at Vulcan Value Partners. Please join me in welcoming four new partners as owners in Vulcan. They are Leighton DeBray, Candace Edwards, Anne Jones, and Mac Dunbar. Many of you know Leighton as she leads our client service team from “home” while Adam McClain, another partner in our firm, is on the road keeping you updated about your investments with us. Candace Edwards, Manager of Fund Accounting, does an outstanding job making sure we provide accurate and timely information. She also works closely with Anne Jones providing data that helps us manage the funds. Anne Jones is our Head Trader. Unlike many of our peers, she is integrated into our research team and allows us to execute our capital allocation decisions. She is the only trader I have ever met who has a copy of Security Analysis on her desk. Mac Dunbar joined us three years ago after completing his MBA and working as an investment banker. We felt confident that he had all of the attributes necessary to become an outstanding analyst at Vulcan Value Partners when he joined us and we were right. We are fortunate to be associated with such outstanding people and look forward to continuing to work with them to execute our investment philosophy.
We spend 90% of our time on bottom-up analysis and 10% of our time on macro issues impacting our businesses. Given what has been going on in Washington recently we wish it was 99% and 1%. Stated simply, we believe the U.S. economy has the potential to grow real Gross Domestic Product (GDP) at 4% after rebounding from the deep recession of 2008 and 2009. Instead, we are slogging along at 2%, despite a highly accommodative monetary policy and record deficits over the last few years. We believe the biggest reason for this slow growth is dysfunction in Washington. Decision makers we talk to in the private economy are cautious because of a lack in confidence in both parties and the result is a reluctance to invest and create jobs. Europe is barely growing and the developing economies are slowing down. Putting it all together, the macro economy is only O.K. when it could and should be a lot better. The good news is that we own, what we believe to be, an outstanding collection of businesses that are compounding their estimated values at double-digit rates in spite of a sub-par global economic environment.
| Semi-Annual Report | October 31, 2013 | 1 |
| Shareholder Letter | ||
| October 31, 2013 (Unaudited) |
Robert Shiller and Eugene Fama recently won the Nobel Prize for economics. Robert Shiller is one of the few macro economists we pay attention to. In fact, he is one of our heroes. During the bubble years of the late 1990’s he was one of the few voices of reason we could find. His macro work confirmed my bottom-up work that markets in general were wildly overvalued and that, in fact, bubbles do exist. He later correctly identified the housing bubble that led to the financial crisis. Eugene Fama was one of the most eloquent advocates of the efficient markets hypothesis (EMH) in the 1960’s and 1970’s. In the late 1980’s he recanted, more or less, and published a ground breaking paper identifying certain factors that consistently lead to outperformance over long periods of time. One of them was, you guessed it, valuation. He never asked us but we would have referred him to Benjamin Graham’s writings in the 1930’s and saved him all of the trouble. It is interesting to note that Fama was involved in founding Dimensional Fund Advisors (DFA), an actively managed, quantitatively driven firm that invests money based on his factor models. He has become wealthy doing what he originally said could not be done.
It is doubtful that Eugene Fama would have won the Nobel Prize for his work with DFA. He became well known for his work on EMH. Regarding EMH, Robert Shiller said, it is “one of the most remarkable errors in the history of economic thought.” What does the award of the Nobel Prize to these two gentlemen with diametrically opposed views about market efficiency mean to us as value investors? From a behavioral point of view, Robert Shiller is fiercely independent in his thinking and is suspicious of crowds. Eugene Fama’s work on EMH can be thought of as “follow the crowd, it efficiently and rationally prices assets most, if not all of the time.” From an academic point of view, there is a lot of controversy and confusion about how markets work and how assets are priced. From a competitive point of view there is a tremendous amount of money that is being invested on the basis of EMH. In addition to index funds, Exchange Traded Funds (ETF) have gained favor over the last decade. Many advisors are using passive and semi-passive ETF’s to make short-term sector “bets” in the name of asset allocation while charging active management fees.
We are firmly in Robert Shiller’s camp. We are independent thinkers and are often but not mindlessly contrarian in our thinking. We think it is a competitive advantage to be located in Birmingham away from the noise of the crowds in New York and London. We love visiting and we have many friends in both places but we can be still and think in Birmingham. We benefit greatly from the crowd following tendencies of EMH based strategies. We believe the resulting mispricings are more frequent, more pronounced, and last longer. We benefit from ETF’s being used as speculative, short-term trading vehicles. We benefit from intellectual and financial capital being dedicated to top-down and sector based investment strategies. We will continue to spend 90% of our time on bottom-up analysis and invest with a five-year time horizon. To paraphrase Warren Buffett describing share repurchases and saying, What if you owned the last share? What if we were the last value investor and you were our client?
In the discussion that follows, we generally define material contributors and detractors as companies having a greater than 1% impact on the portfolio.
Vulcan Value Partners Fund Review
We had an outstanding period and not a lot of activity. We reallocated capital among companies in the portfolio whose price to value ratios shifted materially. As always, our goal is to mitigate risk by driving our weighted average price to value ratio as low as possible. Secondarily, we will increase diversification when larger discounts are not available to us. Our preference is to have
2 | www.vulcanvaluepartners.com |
| Shareholder Letter | ||
| October 31, 2013 (Unaudited) |
deeper discounts but we are realistic about the opportunities the market gives us. Sometimes the opportunities are plentiful, such as in 2008. Sometimes, opportunities are few and far between, such as in 2007. Right now it feels like we are in the middle. It is as close to “normal” as any I can remember.
There were three material contributors and no detractors to performance in the period.
We bought five new positions and sold one position during the period.
New purchases include Marriott International Inc. (4.2%), Starwood Hotels & Resorts (5.2%), Express Scripts Holding Company (2.72%), LVMH Moet Hennessy Louis Vuitton (1.31%) and Qualcomm (4.63%). We have followed all of these companies for many years and watched their values grow steadily. All have strong balance sheets, produce high levels of free cash flow, and are leaders in their respective industries. They are rarely ever discounted. We are pleased to be able to add what we feel are exceptional businesses to our portfolios at discounts that improve our margin of safety.
We sold one position, Microsoft. We believe that Microsoft will continue to dominate its markets in the PC industry. Unfortunately for Microsoft, the PC is under increasing competitive assault from tablets and even smart phones. When a company’s competitive position begins to erode we sell it. Microsoft is a fine company and it was a good investment for us. As always, mitigating risk is our first priority. We are pleased to have been able to reallocate capital from a company whose risk is increasing into companies with greater margins of safety and higher prospective rates of return.
Apple (6.97%), our largest position, gained 21% in the period. We have written extensively about Apple in recent letters. They are doing exactly what we thought they would do operationally and they are exceeding our expectations in terms of capital allocation. We think Apple has a bright future and that it is priced to have no future at all. It is too soon to say, “We told you so” but we are pleased with Apple’s progress and the margin of safety we have if we are wrong.
Vulcan Value Partners Small Cap Fund Review
Turnover was materially higher in Vulcan Value Partners Small Cap Fund than in Vulcan Value Partners Fund during the period. What we said in the second quarter’s mutual fund letter remains true for this period:
“In the Small Cap Fund, prices have risen faster than values so that the margin of safety has decreased and risk has increased for the broader market as a whole. We have responded by selling companies that have reached our estimate of fair value and reducing our position in companies whose prices have risen faster than their values. We have reallocated capital to more discounted companies with larger margins of safety. We have also increased diversification throughout the year as price to value ratios have become less attractive in the aggregate. All of the above refers to marginal rates of change.” We best characterize market conditions to be “normal” and are neither deeply discounted nor overly elevated. However, we do have a deeper bench of attractively priced companies that meet our quality criteria in Large Cap as opposed to Small Cap.
There were six material contributors and one detractor to performance in the period.
We bought nine new positions during the period and sold nine positions.
| Semi-Annual Report | October 31, 2013 | 3 |
| Shareholder Letter | ||
| October 31, 2013 (Unaudited) |
Recent purchases include Ashmore (3.68%), Lindsay (4.07%), Montpelier RE (4.13%), and Insperity (4.07%). All of these companies are competitively entrenched, produce high levels of free cash flow, have strong balance sheets, and, with the exception of Montpelier RE, are materially more discounted than the companies we sold to pay for them.
Montpelier RE was paid for by selling Endurance Specialty Holdings at a similar price to value ratio. Montpelier RE is a very well managed Bermuda-based insurer. As we wrote in our second quarter mutual fund letter regarding Endurance Specialty Holdings: “We sold Endurance Specialty Holdings because of a CEO transition that created more risk than we are comfortable with accepting. The odds favor a positive outcome but we want more than acceptable odds. Endurance is about to embark in a direction that is different from when we bought it. We made a good return on our investment and prefer to mitigate risk rather than participate with the company in a new direction that might or might not prove profitable.”
Recent sales include Interval Leisure Group, Lincoln Electric, Sonic Corp., and Mistras. Mistras was a mistake. We define a mistake as a company whose value has fallen, not a company whose stock price declines. After Mistras’ value dropped we reassessed the company and determined that it was not as competitively entrenched as we had originally thought. All of the other companies we sold were excellent investments for us and we only sold them so that we could redeploy capital into more discounted companies with higher margins of safety.
I want to take a moment and recognize the outstanding research productivity of our research team. Turnover in Small Cap has been higher than we would like but the alternative would be accepting more risk and higher price to value ratios. We have had a number of our companies approach or reach our estimates of fair value this year. We have been able to replace them with outstanding businesses at discounted prices. Without the excellent work of our research team, Small Cap’s margin of safety would be eroded. As it is, Small Cap’s price to value ratio is similar to Large Cap’s and is in the mid-70’s, which is the mid-point of what we would expect over a market cycle.
Closing
We are gratified to have been able to make material progress during the period towards our goal of mitigating risk and producing exceptional long-term risk adjusted returns2. We are also pleased to be adding building blocks for the future through the promotion of our new partners. We thank you, our client partners, for providing stable capital and for your long-term time horizon that matches our own.
We hope you are enjoying cooler temperatures, fall leaves, and (we cannot resist) fall football (we are, some more than others, depending on your team of choice).
Thank you for the confidence you have placed in us. We look forward to updating you again in the New Year.
Sincerely,
C.T. Fitzpatrick
Chief Investment Officer
4 | www.vulcanvaluepartners.com |
| Shareholder Letter | ||
| October 31, 2013 (Unaudited) |
| 1 | For each fund with at least a three-year history, Morningstar calculates a Morningstar Rating™ based on a Morningstar Risk-Adjusted Return measure that accounts for variation in a fund’s monthly performance (including the effects of sales charges, loads, and redemption fees), placing more emphasis on downward variations and rewarding consistent performance. The top 10% of funds in each category receive 5 stars, the next 22.5% receive 4 stars, the next 35% receive 3 stars, the next 22.5% receive 2 stars and the bottom 10% receive 1 star. (Each share class is counted as a fraction of one fund within this scale and rated separately, which may cause slight variations in the distribution percentages.) The Overall Morningstar Rating for a fund is derived from a weighted average of the performance figures associated with its three-, five- and ten-year (if applicable) Morningstar Rating metrics, as of October 31, 2013. Morningstar Rating is for the retail share class only; other classes may have different performance characteristics. © 2013 Morningstar, Inc. All Rights Reserved. The information contained herein: (1) is proprietary to Morningstar and/or its content providers; (2) may not be copied or distributed; and (3) is not warranted to be accurate, complete or timely. Neither Morningstar nor its content providers are responsible for any damages or losses arising from any use of this information. Vulcan Value Partners (VVPLX) was rated 5 Stars out of 1484 for the 3-year period against Large Growth Funds. Vulcan Value Partners (VVPSX) was rated 5 Stars out of 599 for the 3-year period against Small Blend Funds. All information in this report is as of the date shown in the upper right hand corner unless otherwise indicated. |
| ² | Please see page 6 and 9 for 1 year and inception to date returns for the Vulcan Value Partners Fund and Vulcan Value Small Cap Fund, respectively. |
Margin of Safety is a favorable difference between the price of a company’s shares and the estimated intrinsic value of those shares.
Free Cash Flow is a measure of how much a business generates after accounting for capital expenditures. It is calculated as operating cash flow less capital expenditures.
Price to value ratio is a calculation that compares the price of a company’s stock to our appraisal of the company’s intrinsic value. Fair or intrinsic value is our estimate of the price a willing buyer would pay and a willing seller would accept, assuming neither was compelled to enter into a transaction.
The views and information discussed in this commentary are as of the date of publication, are subject to change, and may not reflect the writer’s current views. The views expressed represent an assessment of market conditions at a specific point in time, are opinions only and should not be relied upon as investment advice regarding a particular investment or markets in general. Such information does not constitute a recommendation to buy or sell specific securities or investment vehicles. It should not be assumed that any investment will be profitable or will equal the performance of the Funds or any securities or any sectors mentioned herein. The subject matter contained herein has been derived from several sources believed to be reliable and accurate at the time of compilation. The Funds do not accept any liability for losses either direct or consequential caused by the use of this information.
The primary and secondary benchmark indexes are not actively managed and do not reflect any deductions for fees, expenses or taxes. An investor may not invest directly in an index.
Leighton Debray, Anne Jones, Mac Dunbar and Adam McClaine are registered representatives of ALPS Distributors, Inc.
| Semi-Annual Report | October 31, 2013 | 5 |
| Fund Overview | ||
| October 31, 2013 (Unaudited) |
Average Annual Total Returns (as of 10/31/13)
| Since | Expense Ratios | |||||||||||||||||||||
| 1 Year | Inception* | Gross | Net** | |||||||||||||||||||
Vulcan Value Partners Fund | 32.10% | 16.64% | 1.09% | 1.09% | ||||||||||||||||||
S&P 500® Total Return Index*** | 27.18% | 14.67% | ||||||||||||||||||||
Russell 1000® Value Index*** | 28.29% | 14.79% | ||||||||||||||||||||
Performance data quoted represents past performance. Past performance does not guarantee future results. Investment return and principal value of an investment will fluctuate so that an investor’s shares, when sold or redeemed, may be worth more or less than the original cost. The Fund imposes a 2.00% redemption fee on shares held for less that 90 days. Current performance data may be higher or lower than actual data quoted. For the most current month-end performance data, please call 1-877-421-5078.
The table does not reflect the deduction of taxes that a shareholder would pay on Fund distributions or the redemption of Fund shares.
Subject to investment risks, including possible loss of the principal amount invested.
| * | Fund inception date of 12/30/09. |
| ** | Vulcan Value Partners, LLC (“Vulcan” or the “Adviser”) has given a contractual agreement to the Fund that to the extent the Total Annual Fund Operating Expenses (as defined in Item 3 of Form N-1A) with respect to the Fund (exclusive of Acquired Fund Fees and Expenses (if any), brokerage expenses, interest expense, taxes and extraordinary expenses) (“Designated Annual Fund Operating Expenses”) exceed 1.25% of the Fund’s average daily net assets for a particular fiscal year of the Fund, the Adviser will reduce the Management Fee and/or Other Expenses otherwise payable to the Adviser with respect to the Fund for the fiscal year by an amount equal to such excess, and/or the Adviser shall reimburse the Fund by the amount of such excess. This agreement is in effect through August 31, 2014. Without this agreement, expenses could be higher. If the Adviser foregoes any fees and/or reimburses the Fund pursuant to this letter agreement with respect to a particular fiscal year, then the Adviser shall be entitled to recover from the Fund the amount foregone or reimbursed to the extent Designated Annual Fund Operating Expenses are less than 1.25% of the Fund’s average daily net assets if within three years after the expenses were incurred. |
| *** | Indices are not actively managed and do not reflect any deduction for fees, expenses or taxes. An investor may not invest directly in an index. |
6 | www.vulcanvaluepartners.com |
| Fund Overview | ||
| October 31, 2013 (Unaudited) |
Performance of $10,000 Initial Investment (for the period ended October 31, 2013)
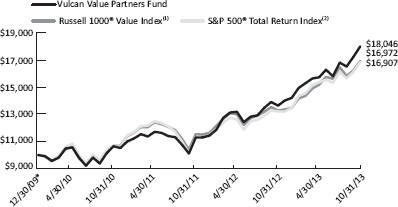
The chart above represents historical performance of a hypothetical investment of $10,000 in the Fund since inception. Past performance does not guarantee future results. This chart does not reflect the deduction of taxes that a shareholder would pay on Fund distributions or the redemption of Fund shares.
| * | Fund inception date of 12/30/09. |
| (1) | The Russell 1000® Value Index measures the performance of the large-cap value segment of the U.S. equity universe. It includes those Russell 1000® companies with lower price-to-book ratios and lower expected growth values. |
| (2) | The S&P 500® Total Return Index is an unmanaged index of 500 common stocks chosen for market size, liquidity and industry group representation. It is a market-value weighted index. |
Indices are not actively managed and do not reflect any deduction for fees, expenses or taxes. It is not possible to invest directly in an index.
Investing in the Fund is subject to investment risks, including possible loss of the principal amount invested.
Industry Allocation (as a % of Net Assets)†
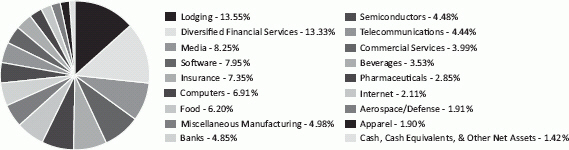
| † | Chart presents indicative values only. |
| Semi-Annual Report | October 31, 2013 | 7 |
| Disclosure of Fund Expenses | ||
| October 31, 2013 (Unaudited) |
As a shareholder of the Vulcan Value Partners Fund (the “Fund”), you will incur two types of costs: (1) transaction costs, including applicable redemption fees; and (2) ongoing costs, including management fees and other Fund expenses. The following examples are intended to help you understand your ongoing costs (in dollars) of investing in the Fund and to compare these costs with the ongoing costs of investing in other mutual funds. The examples are based on an investment of $1,000 invested on May 1, 2013 and held until October 31, 2013.
Actual Expenses. The first line of each table below provides information about actual account values and actual expenses. You may use the information in this line, together with the amount you invested, to estimate the expenses that you paid over the period. Simply divide your account value by $1,000 (for example, an $8,600 account value divided by $1,000 = 8.6), then multiply the result by the number in the first line under the heading “Expenses Paid During Period” to estimate the expenses you paid on your account during this period.
Hypothetical Example for Comparison Purposes. The second line of the table below provides information about hypothetical account values and hypothetical expenses based on the Fund’s actual expense ratio and an assumed rate of return of 5% per year before expenses, which is not the Fund’s actual return. The hypothetical account values and expenses may not be used to estimate the actual ending account balance or expenses you paid for the period. You may use this information to compare the ongoing costs of investing in the Fund and other mutual funds. To do so, compare this 5% hypothetical example with the 5% hypothetical examples that appear in the shareholder reports of the other funds. The expenses shown in the table are meant to highlight ongoing Fund costs only and do not reflect transaction fees, such as redemption fees or exchange fees. Therefore, the second line of each table below is useful in comparing ongoing costs only, and may not help you determine the relative total costs of owning different funds. In addition, if these transactional costs were included, your costs would have been higher.
Beginning Account 5/1/13 | Ending Account 10/31/13 | Expense Ratio(a) | Expenses Paid During period 5/1/13 - 10/31/13(b) | |||||||||||||||||
Actual | $ | 1,000.00 | $ | 1,145.30 | 1.09 | % | $ | 5.89 | ||||||||||||
Hypothetical | $ | 1,000.00 | $ | 1,019.71 | 1.09 | % | $ | 5.55 | ||||||||||||
| (a) | The Fund’s expense ratios have been annualized based on the Fund’s most recent fiscal half-year expenses. |
| (b) | Expenses are equal to the Fund’s annualized expense ratio, multiplied by the average account value over the period, multiplied by the number of days in the most recent fiscal half-year (184)/365. |
8 | www.vulcanvaluepartners.com |
| Fund Overview | ||
| October 31, 2013 (Unaudited) |
VULCAN VALUE PARTNERS SMALL CAP FUND
Average Annual Total Returns (as of 10/31/13)
| Since | Expense Ratios | |||||||||||||||||||||
| 1 Year | Inception* | Gross | Net** | |||||||||||||||||||
Vulcan Value Partners Small Cap Fund | 35.00% | 21.19% | 1.30% | 1.25% | ||||||||||||||||||
Russell 2000® Value Index*** | 32.83% | 15.53% | ||||||||||||||||||||
Russell 2000® Index*** | 36.28% | 17.03% | ||||||||||||||||||||
Performance data quoted represents past performance. Past performance does not guarantee future results. Investment return and principal value of an investment will fluctuate so that an investor’s shares, when sold or redeemed, may be worth more or less than the original cost. The Fund imposes a 2.00% redemption fee on shares held for less than 90 days. Current performance data may be higher or lower than actual data quoted. For the most current month-end performance data, please call 1-877-421-5078.
The table does not reflect the deduction of taxes that a shareholder would pay on Fund distributions or the redemption of Fund shares.
Subject to investment risks, including possible loss of the principal amount invested.
| * | Fund inception date of 12/30/09. |
| ** | Vulcan Value Partners, LLC (“Vulcan” or the “Adviser”) has given a contractual agreement to the Fund that to the extent the Total Annual Fund Operating Expenses (as defined in Item 3 of Form N-1A) with respect to the Fund (exclusive of Acquired Fund Fees and Expenses (if any), brokerage expenses, interest expense, taxes and extraordinary expenses) (“Designated Annual Fund Operating Expenses”) exceed 1.25% of such Fund’s average daily net assets for a particular fiscal year of the Fund, the Adviser will reduce the Management Fee and/or Other Expenses otherwise payable to the Adviser with respect to the Fund for such fiscal year by an amount equal to such excess, and/or the Adviser shall reimburse the Fund by the amount of such excess. This agreement is in effect through August 31, 2014. Without this agreement, expenses could be higher. If the Adviser foregoes any fees and/or reimburses the Fund pursuant to this letter agreement with respect to a particular fiscal year, then the Adviser shall be entitled to recover from the Fund the amount foregone or reimbursed to the extent Designated Annual Fund Operating Expenses are less than 1.25% of the Fund’s average daily net assets if within three years after the expenses were incurred. |
| *** | Indices are not actively managed and do not reflect any deduction for fees, expenses or taxes. An investor may not invest directly in an index. |
| Semi-Annual Report | October 31, 2013 | 9 |
| Fund Overview | ||
| October 31, 2013 (Unaudited) |
Performance of $10,000 Initial Investment (for the period ended October 31, 2013)
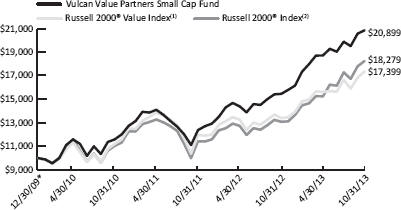
The chart above represents historical performance of a hypothetical investment of $10,000 in the Fund since inception. Past performance does not guarantee future results. This chart does not reflect the deduction of taxes that a shareholder would pay on Fund distributions or the redemption of Fund shares.
| * | Fund inception date of 12/30/09. |
| (1) | The Russell 2000® Value Index measures the performance of small-cap value segment of the U.S. equity universe. It includes those Russell 2000® companies with lower price-to-book ratios and lower forecasted growth values. |
| (2) | The Russell 2000® Index measures the performance of the small-cap segment of the U.S. equity universe. The Russell 2000® Index is a subset of the Russell 3000® Index representing approximately 8% of the total market capitalization of that index. It includes approximately 2,000 of the smallest securities based on a combination of their market cap and current index membership. |
Indices are not actively managed and do not reflect any deduction for fees, expenses or taxes. An investor may not invest directly in an index.
Investing in the Fund is subject to investment risks, including possible loss of the principal amount invested.
Industry Allocation (as a % of Net Assets)†
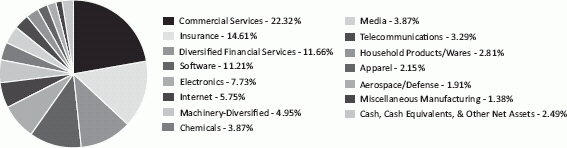
| † | Chart presents indicative values only. |
10 | www.vulcanvaluepartners.com |
| Disclosure of Fund Expenses | ||
| October 31, 2013 (Unaudited) |
As a shareholder of the Vulcan Value Partners Small Cap Fund (the “Fund”), you will incur two types of costs: (1) transaction costs, including applicable redemption fees; and (2) ongoing costs, including management fees and other Fund expenses. The following examples are intended to help you understand your ongoing costs (in dollars) of investing in the Fund and to compare these costs with the ongoing costs of investing in other mutual funds. The examples are based on an investment of $1,000 invested on May 1, 2013 and held until October 31, 2013.
Actual Expenses. The first line of each table below provides information about actual account values and actual expenses. You may use the information in this line, together with the amount you invested, to estimate the expenses that you paid over the period. Simply divide your account value by $1,000 (for example, an $8,600 account value divided by $1,000 = 8.6), then multiply the result by the number in the first line under the heading “Expenses Paid During Period” to estimate the expenses you paid on your account during this period.
Hypothetical Example for Comparison Purposes. The second line of the table below provides information about hypothetical account values and hypothetical expenses based on the Fund’s actual expense ratio and an assumed rate of return of 5% per year before expenses, which is not the Fund’s actual return. The hypothetical account values and expenses may not be used to estimate the actual ending account balance or expenses you paid for the period. You may use this information to compare the ongoing costs of investing in the Fund and other mutual funds. To do so, compare this 5% hypothetical example with the 5% hypothetical examples that appear in the shareholder reports of the other funds. The expenses shown in the table are meant to highlight ongoing Fund costs only and do not reflect transaction fees, such as redemption fees or exchange fees. Therefore, the second line of each table below is useful in comparing ongoing costs only, and may not help you determine the relative total costs of owning different funds. In addition, if these transactional costs were included, your costs would have been higher.
Vulcan Value Partn ers Small Cap Fund
Beginning Account Value 5/1/13 | Ending Account 10/31/13 | Expense Ratio(a) | Expenses Paid During period 5/1/13 - 10/31/13(b) | |||||||||||||||||
Actual | $ | 1,000.00 | $ | 1,114.30 | 1.25 | % | $ | 6.66 | ||||||||||||
Hypothetical | $ | 1,000.00 | $ | 1,018.90 | 1.25 | % | $ | 6.36 | ||||||||||||
| (a) | The Fund’s expense ratios have been annualized based on the Fund’s most recent fiscal half-year expenses. |
| (b) | Expenses are equal to the Fund’s annualized expense ratio, multiplied by the average account value over the period, multiplied by the number of days in the most recent fiscal half-year (184)/365. |
| Semi-Annual Report | October 31, 2013 | 11 |
| Statement of Investments | Vulcan Value Partners Fund | |
| October 31, 2013 (Unaudited) |
| Shares | Value (Note 2) | |||||||
| ||||||||
COMMON STOCKS (98.58%) | ||||||||
Communications (14.80%) | ||||||||
Internet (2.11%) | ||||||||
Google, Inc., Class A(a) | 14,755 | $ | 15,206,208 | |||||
|
| |||||||
Media (8.25%) | ||||||||
Discovery Communications, Inc., Class C(a) | 338,553 | 28,001,719 | ||||||
Time Warner, Inc. | 200,944 | 13,812,891 | ||||||
The Walt Disney Co. | 258,994 | 17,764,398 | ||||||
|
| |||||||
| 59,579,008 | ||||||||
|
| |||||||
Telecommunications (4.44%) | ||||||||
Cisco Systems, Inc. | 1,423,615 | 32,031,337 | ||||||
|
| |||||||
TOTAL COMMUNICATIONS | 106,816,553 | |||||||
|
| |||||||
Consumer, Cyclical (15.45%) | ||||||||
Apparel (1.90%) | ||||||||
LVMH Moet Hennessy Louis Vuitton, SA | 71,069 | 13,670,122 | ||||||
|
| |||||||
Lodging (13.55%) | ||||||||
Intercontinental Hotels Group PLC, ADR | 1,047,409 | 30,741,466 | ||||||
Marriott International, Inc., Class A | 656,405 | 29,590,737 | ||||||
Starwood Hotels & Resorts Worldwide, Inc. | 509,038 | 37,475,378 | ||||||
|
| |||||||
| 97,807,581 | ||||||||
|
| |||||||
TOTAL CONSUMER, CYCLICAL | 111,477,703 | |||||||
|
| |||||||
Consumer, Non-cyclical (16.57%) | ||||||||
Beverages (3.53%) | ||||||||
The Coca-Cola Co. | 644,822 | 25,515,607 | ||||||
|
| |||||||
Commercial Services (3.99%) | ||||||||
Mastercard, Inc., Class A | 40,155 | 28,795,150 | ||||||
|
| |||||||
Food (6.20%) | ||||||||
Tesco PLC | 5,353,223 | 31,262,822 | ||||||
Unilever NV, New York Registry Shares | 339,450 | 13,482,954 | ||||||
|
| |||||||
| 44,745,776 | ||||||||
|
| |||||||
12 | www.vulcanvaluepartners.com |
| Vulcan Value Partners Fund | Statement of Investments | |
| October 31, 2013 (Unaudited) |
| Shares | Value (Note 2) | |||||||
| ||||||||
Pharmaceuticals (2.85%) | ||||||||
Express Scripts Holding Co.(a) | 329,073 | $ | 20,573,644 | |||||
|
| |||||||
TOTAL CONSUMER, NON-CYCLICAL | 119,630,177 | |||||||
|
| |||||||
Financial (25.53%) | ||||||||
Banks (4.85%) | ||||||||
The Bank of New York Mellon Corp. | 1,101,422 | 35,025,220 | ||||||
|
| |||||||
Diversified Financial Services (13.33%) | ||||||||
CME Group, Inc. | 130,670 | 9,697,021 | ||||||
Franklin Resources, Inc. | 660,044 | 35,549,970 | ||||||
The NASDAQ OMX Group, Inc. | 842,748 | 29,858,561 | ||||||
Visa, Inc., Class A | 107,127 | 21,068,667 | ||||||
|
| |||||||
| 96,174,219 | ||||||||
|
| |||||||
Insurance (7.35%) | ||||||||
The Chubb Corp. | 221,335 | 20,380,527 | ||||||
Everest Re Group, Ltd. | 212,642 | 32,691,581 | ||||||
|
| |||||||
| 53,072,108 | ||||||||
|
| |||||||
TOTAL FINANCIAL | 184,271,547 | |||||||
|
| |||||||
Industrial (6.89%) | ||||||||
Aerospace/Defense (1.91%) | ||||||||
United Technologies Corp. | 129,531 | 13,762,669 | ||||||
|
| |||||||
Miscellaneous Manufacturing (4.98%) | ||||||||
Dover Corp. | 228,798 | 21,001,368 | ||||||
Parker Hannifin Corp. | 128,259 | 14,970,391 | ||||||
|
| |||||||
| 35,971,759 | ||||||||
|
| |||||||
TOTAL INDUSTRIAL | 49,734,428 | |||||||
|
| |||||||
Technology (19.34%) | ||||||||
Computers (6.91%) | ||||||||
Apple, Inc. | 95,476 | 49,871,888 | ||||||
|
| |||||||
Semiconductors (4.48%) | ||||||||
QUALCOMM, Inc. | 465,572 | 32,343,287 | ||||||
|
| |||||||
Software (7.95%) | ||||||||
Check Point Software Technologies, Ltd.(a) | 232,916 | 13,513,786 | ||||||
| Semi-Annual Report | October 31, 2013 | 13 |
| Statement of Investments | Vulcan Value Partners Fund | |
| October 31, 2013 (Unaudited) |
| Shares | Value (Note 2) | |||||||||||
| ||||||||||||
Software (continued) | ||||||||||||
Oracle Corp. | 1,308,139 | $ | 43,822,657 | |||||||||
|
| |||||||||||
| 57,336,443 | ||||||||||||
|
| |||||||||||
TOTAL TECHNOLOGY | 139,551,618 | |||||||||||
|
| |||||||||||
TOTAL COMMON STOCKS (Cost $581,123,765) | 711,482,026 | |||||||||||
| ||||||||||||
| 7-Day Yield | Shares | Value (Note 2) | ||||||||||
| ||||||||||||
SHORT TERM INVESTMENTS (2.26%) | ||||||||||||
Money Market Fund (2.26%) | ||||||||||||
Dreyfus Treasury Prime Cash Management Fund, Institutional Shares | 0.010 | % | 16,357,340 | 16,357,340 | ||||||||
|
| |||||||||||
TOTAL SHORT TERM INVESTMENTS (Cost $16,357,340) | 16,357,340 | |||||||||||
| ||||||||||||
TOTAL INVESTMENTS (100.84%) (Cost $597,481,105) | $ | 727,839,366 | ||||||||||
Liabilities In Excess Of Other Assets (-0.84%) | (6,093,540) | |||||||||||
| ||||||||||||
NET ASSETS (100.00%) | $ | 721,745,826 | ||||||||||
| ||||||||||||
| (a) | Non-Income Producing Security. |
Common Abbreviations:
ADR - American Depositary Receipt.
Ltd. - Limited.
NV - Naamloze Vennootschap is the Dutch term for a public limited liability corporation.
PLC - Public Limited Company.
SA - Generally designates corporations in various countries, mostly those employing the civil law.
Holdings are subject to change.
For Fund compliance purposes, the Fund’s industry classifications refer to any one or more of the industry sub-classifications used by one or more widely recognized market indexes or ratings group indexes, and/or as defined by Fund management. This definition may not apply for purposes of this report, which may combine industry sub-classifications for reporting ease. Industries are shown as a percentage of net assets.
See Accompanying Notes to Financial Statements.
14 | www.vulcanvaluepartners.com |
| Vulcan Value Partners Small Cap Fund | Statement of Investments | |
| October 31, 2013 (Unaudited) |
| Shares | Value (Note 2) | |||||||
| ||||||||
COMMON STOCKS (97.51%) | ||||||||
Basic Materials (3.87%) | ||||||||
Chemicals (3.87%) | ||||||||
KMG Chemicals, Inc. | 998,503 | $ | 19,950,090 | |||||
NewMarket Corp. | 22,100 | 6,881,056 | ||||||
|
| |||||||
| 26,831,146 | ||||||||
|
| |||||||
TOTAL BASIC MATERIALS | 26,831,146 | |||||||
|
| |||||||
Communications (12.91%) | ||||||||
Internet (5.75%) | ||||||||
ValueClick, Inc.(a) | 2,077,198 | 39,902,974 | ||||||
|
| |||||||
Media (3.87%) | ||||||||
John Wiley & Sons, Inc., Class A | 532,942 | 26,801,653 | ||||||
|
| |||||||
Telecommunications (3.29%) | ||||||||
NeuStar, Inc., Class A(a) | 497,286 | 22,835,373 | ||||||
|
| |||||||
TOTAL COMMUNICATIONS | 89,540,000 | |||||||
|
| |||||||
Consumer, Cyclical (2.15%) | ||||||||
Apparel (2.15%) | ||||||||
Iconix Brand Group, Inc.(a) | 413,967 | 14,940,069 | ||||||
|
| |||||||
TOTAL CONSUMER, CYCLICAL | 14,940,069 | |||||||
|
| |||||||
Consumer, Non-cyclical (25.13%) | ||||||||
Commercial Services (22.32%) | ||||||||
Chemed Corp. | 525,793 | 35,659,281 | ||||||
Global Payments, Inc. | 264,865 | 15,754,170 | ||||||
Heartland Payment Systems, Inc. | 659,297 | 26,668,564 | ||||||
Insperity, Inc. | 715,389 | 27,664,092 | ||||||
Live Nation Entertainment, Inc.(a) | 1,465,656 | 28,492,353 | ||||||
Universal Technical Institute, Inc. | 1,549,569 | 20,593,772 | ||||||
|
| |||||||
| 154,832,232 | ||||||||
|
| |||||||
Household Products/Wares (2.81%) | ||||||||
Tupperware Brands Corp. | 216,996 | 19,453,692 | ||||||
|
| |||||||
TOTAL CONSUMER, NON-CYCLICAL | 174,285,924 | |||||||
|
| |||||||
| Semi-Annual Report | October 31, 2013 | 15 |
| Statement of Investments | Vulcan Value Partners Small Cap Fund | |
| October 31, 2013 (Unaudited) |
| Shares | Value (Note 2) | |||||||
| ||||||||
Financial (26.27%) | ||||||||
Diversified Financial Services (11.66%) | ||||||||
Ashmore Group PLC | 4,241,525 | $ | 27,509,690 | |||||
Eaton Vance Corp. | 609,966 | 25,502,678 | ||||||
The NASDAQ OMX Group, Inc. | 785,195 | 27,819,459 | ||||||
|
| |||||||
| 80,831,827 | ||||||||
|
| |||||||
Insurance (14.61%) | ||||||||
Everest Re Group, Ltd. | 205,000 | 31,516,700 | ||||||
Montpelier Re Holdings, Ltd. | 962,290 | 26,568,827 | ||||||
The Navigators Group, Inc.(a) | 544,521 | 30,623,861 | ||||||
ProAssurance Corp. | 278,934 | 12,641,289 | ||||||
|
| |||||||
| 101,350,677 | ||||||||
|
| |||||||
TOTAL FINANCIAL | 182,182,504 | |||||||
|
| |||||||
Industrial (15.97%) | ||||||||
Aerospace/Defense (1.91%) | ||||||||
Curtiss-Wright Corp. | 266,412 | 13,261,989 | ||||||
|
| |||||||
Electronics (7.73%) | ||||||||
Ituran Location and Control, Ltd. | 1,122,798 | 20,547,204 | ||||||
PerkinElmer, Inc. | 327,321 | 12,451,291 | ||||||
Woodward, Inc. | 514,092 | 20,609,948 | ||||||
|
| |||||||
| 53,608,443 | ||||||||
|
| |||||||
Machinery-Diversified (4.95%) | ||||||||
Lindsay Corp. | 374,218 | 28,444,310 | ||||||
Nordson Corp. | 81,740 | 5,892,637 | ||||||
|
| |||||||
| 34,336,947 | ||||||||
|
| |||||||
Miscellaneous Manufacturing (1.38%) | ||||||||
Donaldson Co., Inc. | 240,516 | 9,526,839 | ||||||
|
| |||||||
TOTAL INDUSTRIAL | 110,734,218 | |||||||
|
| |||||||
Technology (11.21%) | ||||||||
Software (11.21%) | ||||||||
ACI Worldwide, Inc.(a) | 498,430 | 27,473,462 | ||||||
Fair Isaac Corp. | 412,362 | 23,620,095 | ||||||
MSCI, Inc.(a) | 338,015 | 13,780,871 | ||||||
16 | www.vulcanvaluepartners.com |
| Vulcan Value Partners Small Cap Fund | Statement of Investments | |
| October 31, 2013 (Unaudited) |
| Shares | Value (Note 2) | |||||||||||
| ||||||||||||
Software (continued) | ||||||||||||
Open Text Corp. | 175,629 | $ | 12,880,631 | |||||||||
|
| |||||||||||
| 77,755,059 | ||||||||||||
|
| |||||||||||
TOTAL TECHNOLOGY | 77,755,059 | |||||||||||
|
| |||||||||||
TOTAL COMMON STOCKS (Cost $600,284,836) | 676,268,920 | |||||||||||
| ||||||||||||
| 7-Day Yield | Shares | Value (Note 2) | ||||||||||
| ||||||||||||
SHORT TERM INVESTMENTS (2.89%) | ||||||||||||
Money Market Fund (2.89%) | ||||||||||||
Dreyfus Treasury Prime Cash Management Fund, Institutional Shares | 0.010 | % | 20,017,516 | 20,017,516 | ||||||||
|
| |||||||||||
TOTAL SHORT TERM INVESTMENTS (Cost $20,017,516) | 20,017,516 | |||||||||||
| ||||||||||||
TOTAL INVESTMENTS (100.40%) (Cost $620,302,352) | $ | 696,286,436 | ||||||||||
Liabilities In Excess Of Other Assets (-0.40%) | (2,748,627) | |||||||||||
| ||||||||||||
NET ASSETS (100.00%) | $ | 693,537,809 | ||||||||||
| ||||||||||||
| (a) | Non-Income Producing Security. |
Common Abbreviations:
Ltd. - Limited.
PLC - Public Limited Company.
Holdings are subject to change.
For Fund compliance purposes, the Fund’s industry classifications refer to any one or more of the industry sub-classifications used by one or more widely recognized market indexes or ratings group indexes, and/or as defined by Fund management. This definition may not apply for purposes of this report, which may combine industry sub-classifications for reporting ease. Industries are shown as a percentage of net assets.
See Accompanying Notes to Financial Statements.
| Semi-Annual Report | October 31, 2013 | 17 |
| Statements of Assets and Liabilities | ||
| October 31, 2013 (Unaudited) |
| Vulcan Value Partners Fund | Vulcan Value Partners Small Cap Fund | |||||||
| ||||||||
ASSETS: | ||||||||
Investments, at value | $ | 727,839,366 | $ | 696,286,436 | ||||
Cash | – | 640,012 | ||||||
Receivable for shares sold | 154,882 | 2,407,880 | ||||||
Dividends receivable | 523,121 | 157,384 | ||||||
Other assets | 27,507 | 25,834 | ||||||
| ||||||||
Total assets | 728,544,876 | 699,517,546 | ||||||
| ||||||||
LIABILITIES: | ||||||||
Payable for investments purchased | 6,014,044 | 5,136,412 | ||||||
Payable for shares redeemed | 90,136 | 219,520 | ||||||
Payable to adviser | 592,812 | 541,943 | ||||||
Payable for administration fees | 20,663 | 19,903 | ||||||
Payable for transfer agency fees | 7,331 | 15,562 | ||||||
Payable for audit and tax fees | 11,286 | 10,867 | ||||||
Payable for trustee fees and expenses | 11,605 | 8,949 | ||||||
Accrued expenses and other liabilities | 51,173 | 26,581 | ||||||
| ||||||||
Total liabilities | 6,799,050 | 5,979,737 | ||||||
| ||||||||
NET ASSETS | $ | 721,745,826 | $ | 693,537,809 | ||||
| ||||||||
NET ASSETS CONSIST OF: | ||||||||
Paid-in capital (Note 5) | $ | 569,677,724 | $ | 581,222,301 | ||||
Accumulated net investment income/(loss) | 3,291,262 | (1,110,246) | ||||||
Accumulated net realized gain on investments | 18,418,579 | 37,441,670 | ||||||
Net unrealized appreciation in value of investments | 130,358,261 | 75,984,084 | ||||||
| ||||||||
NET ASSETS | $ | 721,745,826 | $ | 693,537,809 | ||||
| ||||||||
INVESTMENTS, AT COST | $ | 597,481,105 | $ | 620,302,352 | ||||
PRICING OF SHARES: | ||||||||
Net Asset Value, offering and redemption price per share | $ | 17.50 | $ | 18.91 | ||||
Shares of beneficial interest outstanding (unlimited number of shares, no par value common stock authorized) | 41,251,765 | 36,680,249 | ||||||
See Accompanying Notes to Financial Statements.
18 | www.vulcanvaluepartners.com |
| Statements of Operations | ||
| For the Six Months Ended October 31, 2013 (Unaudited) |
| Vulcan Value Partners Fund | Vulcan Value Partners Small Cap Fund | |||||||
| ||||||||
INVESTMENT INCOME: | ||||||||
Dividends | $ | 6,119,896 | $ | 2,797,587 | ||||
Foreign taxes withheld | (127,569) | (88,915) | ||||||
| ||||||||
Total investment income | 5,992,327 | 2,708,672 | ||||||
| ||||||||
EXPENSES: | ||||||||
Investment advisory fees (Note 6) | 2,873,796 | 3,192,488 | ||||||
Administrative fees | 108,981 | 105,558 | ||||||
Transfer agency fees | 36,380 | 212,527 | ||||||
Legal and audit fees | 15,986 | 14,519 | ||||||
Custodian fees | 23,046 | 17,097 | ||||||
Trustee fees and expenses | 11,584 | 9,162 | ||||||
Other | 49,536 | 45,745 | ||||||
| ||||||||
Total expenses before waiver | 3,119,309 | 3,597,096 | ||||||
Less fees waived/reimbursed by investment advisor | – | (127,001) | ||||||
| ||||||||
Total net expenses | 3,119,309 | 3,470,095 | ||||||
| ||||||||
NET INVESTMENT INCOME/(LOSS) | 2,873,018 | (761,423) | ||||||
| ||||||||
Net realized gain on investments | 14,388,218 | 23,639,620 | ||||||
Net realized loss on foreign currency transactions | (7,308) | – | ||||||
Net change in unrealized appreciation of investments | 62,205,423 | 35,463,617 | ||||||
| ||||||||
NET REALIZED AND UNREALIZED GAIN ON INVESTMENTS | 76,586,333 | 59,103,237 | ||||||
| ||||||||
NET INCREASE IN NET ASSETS RESULTING FROM OPERATIONS | $ | 79,459,351 | $ | 58,341,814 | ||||
| ||||||||
See Accompanying Notes to Financial Statements.
| Semi-Annual Report | October 31, 2013 | 19 |
| Statements of Changes in Net Assets |
| Vulcan Value Partners Fund | ||||||||
| For the Six Months Ended October 31, 2013 (Unaudited) | For the Year Ended April 30, 2013 | |||||||
| ||||||||
OPERATIONS: | ||||||||
Net investment income | $ | 2,873,018 | $ | 3,290,462 | ||||
Net realized gain on investments and foreign currency transactions | 14,380,910 | 16,601,840 | ||||||
Net change in unrealized appreciation on investments | 62,205,423 | 46,424,045 | ||||||
| ||||||||
Net increase in net assets resulting from operations | 79,459,351 | 66,316,347 | ||||||
| ||||||||
DISTRIBUTIONS TO SHAREHOLDERS (Note 3): | ||||||||
From net investment income | – | (2,967,613) | ||||||
From net realized gains on investments | – | (2,972,698) | ||||||
| ||||||||
Net decrease in net assets from distributions | – | (5,940,311) | ||||||
| ||||||||
SHARE TRANSACTIONS: (Note 5) | ||||||||
Proceeds from sales of shares | 217,050,728 | 346,215,896 | ||||||
Issued to shareholders in reinvestment of distributions | – | 5,574,795 | ||||||
Cost of shares redeemed, net of redemption fees | (22,061,443) | (89,956,685) | ||||||
| ||||||||
Net increase from share transactions | 194,989,285 | 261,834,006 | ||||||
| ||||||||
Net increase in net assets | 274,448,636 | 322,210,042 | ||||||
| ||||||||
NET ASSETS: | ||||||||
Beginning of year | 447,297,190 | 125,087,148 | ||||||
| ||||||||
End of period* | $ | 721,745,826 | $ | 447,297,190 | ||||
| ||||||||
*Includes accumulated net investment income of: | $ | 3,291,262 | $ | 418,244 | ||||
See Accompanying Notes to Financial Statements.
20 | www.vulcanvaluepartners.com |
| Statements of Changes in Net Assets |
| Vulcan Value Partners Small Cap Fund | ||||||||
| For the Six Months Ended October 31, 2013 (Unaudited) | For the Year Ended April 30, 2013 | |||||||
| ||||||||
OPERATIONS: | ||||||||
Net investment income/(loss) | $ | (761,423) | $ | 347,998 | ||||
Net realized gain on investments | 23,639,620 | 15,172,626 | ||||||
Net change in unrealized appreciation on investments | 35,463,617 | 35,892,359 | ||||||
| ||||||||
Net increase in net assets resulting from operations | 58,341,814 | 51,412,983 | ||||||
| ||||||||
DISTRIBUTIONS TO SHAREHOLDERS (Note 3): | ||||||||
From net investment income | – | (764,307) | ||||||
From net realized gains on investments | – | (1,181,796) | ||||||
| ||||||||
Net decrease in net assets from distributions | – | (1,946,103) | ||||||
| ||||||||
SHARE TRANSACTIONS: (Note 5) | ||||||||
Proceeds from sales of shares | 281,046,790 | 355,116,824 | ||||||
Issued to shareholders in reinvestment of distributions | – | 1,713,133 | ||||||
Cost of shares redeemed, net of redemption fees | (71,002,999) | (21,247,646) | ||||||
| ||||||||
Net increase from share transactions | 210,043,791 | 335,582,311 | ||||||
| ||||||||
Net increase in net assets | 268,385,605 | 385,049,191 | ||||||
| ||||||||
NET ASSETS: | ||||||||
Beginning of year | 425,152,204 | 40,103,013 | ||||||
| ||||||||
End of period* | $ | 693,537,809 | $ | 425,152,204 | ||||
| ||||||||
*Includes accumulated net investment loss of: | $ | (1,110,246) | $ | (348,823) | ||||
See Accompanying Notes to Financial Statements.
| Semi-Annual Report | October 31, 2013 | 21 |
| Financial Highlights | ||
| For a share outstanding throughout the periods presented. |
| ||
NET ASSET VALUE, BEGINNING OF PERIOD | ||
| ||
INCOME/(LOSS) FROM OPERATIONS: | ||
Net investment income/(loss) | ||
Net realized and unrealized gain on investments | ||
| ||
Total from investment operations | ||
| ||
LESS DISTRIBUTIONS TO SHAREHOLDERS: | ||
From net investment income | ||
Distributions from net realized gain on investments | ||
| ||
Total distributions | ||
| ||
Redemption fees added to paid-in capital | ||
| ||
Increase in net asset value | ||
| ||
NET ASSET VALUE, END OF PERIOD | ||
| ||
Total return | ||
RATIOS AND SUPPLEMENTAL DATA: | ||
Net assets, end of period (000’s) | ||
Ratio of expenses to average net assets without fee waivers/ reimbursements | ||
Ratio of expenses to average net assets including fee waivers/ reimbursements | ||
Net investment income/ (loss) to average net assets including fee waivers/ reimbursements | ||
Portfolio turnover rate | ||
| (a) | Per share numbers have been calculated using the average shares method. |
| (b) | Less than $(0.005) per share. |
| (c) | Less than $0.005 per share. |
| (d) | Not annualized. |
| (e) | Annualized. |
See Accompanying Notes to Financial Statements.
22 | www.vulcanvaluepartners.com |
| Vulcan Value Partners Fund |
| For the Six Months Ended October 31, 2013 (Unaudited) | For the Year Ended April 30, 2013 | For the Year Ended April 30, 2012 | For the Year Ended April 30, 2011 | For the Period December 30, 2009 (Inception) to April 30, 2010 | ||||
| ||||||||
| $ 15.28 | $ 13.03 | $ 11.66 | $ 10.57 | $ 10.00 | ||||
| ||||||||
| 0.08(a) | 0.15(a) | 0.02(a) | 0.01(a) | (0.00)(b) | ||||
| 2.14 | 2.35 | 1.45 | 1.13 | 0.57 | ||||
| ||||||||
| 2.22 | 2.50 | 1.47 | 1.14 | 0.57 | ||||
| ||||||||
| – | (0.12) | (0.01) | (0.01) | – | ||||
| – | (0.13) | (0.09) | (0.04) | – | ||||
| ||||||||
| – | (0.25) | (0.10) | (0.05) | – | ||||
| ||||||||
| 0.00(c) | 0.00(c) | 0.00(c) | 0.00(c) | 0.00 (c) | ||||
| ||||||||
| 2.22 | 2.25 | 1.37 | 1.09 | 0.57 | ||||
| ||||||||
| $ 17.50 | $ 15.28 | $ 13.03 | $ 11.66 | $ 10.57 | ||||
| ||||||||
| 14.53%(d) | 19.33% | 12.73% | 10.82% | 5.70%(d) | ||||
| $ 721,746 | $ 447,297 | $ 125,087 | $ 48,757 | $ 12,807 | ||||
| 1.09%(e) | 1.18% | 1.51% | 2.01% | 4.97%(e) | ||||
| 1.09%(e) | 1.18% | 1.50% | 1.50% | 1.50%(e) | ||||
| 1.00%(e) | 1.06% | 0.16% | 0.07% | (0.06%)(e) | ||||
| 19%(d) | 24% | 49% | 44% | 24%(d) | ||||
| Semi-Annual Report | October 31, 2013 | 23 |
| Financial Highlights | ||
| For a share outstanding throughout the periods presented. |
| ||
NET ASSET VALUE, BEGINNING OF PERIOD | ||
| ||
INCOME/(LOSS) FROM OPERATIONS: | ||
Net investment income/(loss) | ||
Net realized and unrealized gain on investments | ||
| ||
Total from investment operations | ||
| ||
LESS DISTRIBUTIONS TO SHAREHOLDERS: | ||
From net investment income | ||
Distributions from net realized gain on investments | ||
| ||
Total distributions | ||
| ||
Redemption fees added to paid-in capital | ||
| ||
Increase/(decrease) in net asset value | ||
| ||
NET ASSET VALUE, END OF PERIOD | ||
| ||
Total return | ||
RATIOS AND SUPPLEMENTAL DATA: | ||
Net assets, end of period (000’s) | ||
Ratio of expenses to average net assets without fee waivers/ reimbursements | ||
Ratio of expenses to average net assets including fee waivers/ reimbursements | ||
Net investment income/ (loss) to average net assets including fee waivers/ reimbursements | ||
Portfolio turnover rate | ||
| (a) | Per share numbers have been calculated using the average shares method. |
| (b) | Less than $(0.005) per share. |
| (c) | Less than $0.005 per share. |
| (d) | Not annualized. |
| (e) | Annualized. |
See Accompanying Notes to Financial Statements.
24 | www.vulcanvaluepartners.com |
| Vulcan Value Partners Small Cap Fund |
| For the Six Months Ended October 31, 2013 (Unaudited) | For the Year Ended April 30, 2013 | For the Year Ended April 30, 2012 | For the Year Ended April 30, 2011 | For the Period December 30, 2009 (Inception) to April 30, 2010 | ||||
| ||||||||
| $ 16.97 | $ 13.18 | $ 13.72 | $ 11.60 | $ 10.00 | ||||
| ||||||||
| (0.02)(a) | 0.03(a) | 0.02(a) | (0.09)(a) | (0.00)(b) | ||||
| 1.96 | 3.91 | 0.17 | 2.55 | 1.60 | ||||
| ||||||||
| 1.94 | 3.94 | 0.19 | 2.46 | 1.60 | ||||
| ||||||||
| – | (0.06) | – | – | – | ||||
| – | (0.09) | (0.73) | (0.34) | – | ||||
| ||||||||
| – | (0.15) | (0.73) | (0.34) | – | ||||
| ||||||||
| 0.00(c) | 0.00(c) | 0.00(c) | 0.00(c) | – | ||||
| ||||||||
| 1.94 | 3.79 | (0.54) | 2.12 | 1.60 | ||||
| ||||||||
| $ 18.91 | $ 16.97 | $ 13.18 | $ 13.72 | $ 11.60 | ||||
| ||||||||
| 11.43%(d) | 30.07% | 2.10% | 21.75% | 16.00%(d) | ||||
| $ 693,538 | $ 425,152 | $ 40,103 | $ 36,363 | $ 7,225 | ||||
| 1.30%(e) | 1.38% | 1.86% | 2.50% | 7.31%(e) | ||||
| 1.25%(e) | 1.28% | 1.50% | 1.50% | 1.50%(e) | ||||
| (0.27%)(e) | 0.21% | 0.15% | (0.71%) | (0.57%)(e) | ||||
| 34%(d) | 57% | 57% | 60% | 33%(d) | ||||
| Semi-Annual Report | October 31, 2013 | 25 |
| Notes to Financial Statements | ||
| October 31, 2013 (Unaudited) |
1. ORGANIZATION
Financial Investors Trust (the “Trust”) is organized as a Delaware statutory trust and is registered as an open-end management investment company under the Investment Company Act of 1940, as amended (“1940 Act”). As of October 31, 2013, the Trust had 27 registered funds. This semi-annual report describes the Vulcan Value Partners Fund and Vulcan Value Partners Small Cap Fund (each a “Fund” and collectively, the “Funds”). The Vulcan Value Partners Fund seeks to achieve long-term capital appreciation by investing primarily in publicly traded mid- and large-capitalization U.S. companies believed to be both undervalued and possessing a sustainable competitive advantage. The Vulcan Value Partners Small Cap Fund seeks to achieve long-term capital appreciation by investing primarily in publicly traded small-capitalization U.S. companies believed to be both undervalued and possessing a sustainable competitive advantage.
2. SIGNIFICANT ACCOUNTING POLICIES
The accompanying financial statements were prepared in accordance with accounting principles generally accepted in the United States of America (“U.S. GAAP”). The preparation of financial statements in conformity with U.S. GAAP requires management to make certain estimates and assumptions that affect the reported amounts of assets and liabilities and disclosures of contingent assets and liabilities at the date of the financial statements and the reported amounts of revenue and expenses during the period. Actual results could differ from those estimates. The following is a summary of significant accounting policies consistently followed by the Funds in preparation of their financial statements.
Investment Valuation: The Funds generally value their securities based on market prices determined at the close of regular trading on the New York Stock Exchange (“NYSE”), normally 4:00 p.m. Eastern Time, on each day the NYSE is open for trading.
For equity securities and mutual funds that are traded on an exchange, the market price is usually the closing sale or official closing price on that exchange. In the case of equity securities not traded on an exchange, or if such closing prices are not otherwise available, the securities are valued at the mean of the most recent bid and ask prices on such day. Redeemable securities issued by open-end registered investment companies are valued at the investment company’s applicable net asset value.
The market price for debt obligations is generally the price supplied by an independent third-party pricing service approved by the Board of Trustees (the “Board”), which may use a matrix, formula or other objective method that takes into consideration quotations from dealers, market transactions in comparable investments, market indices and yield curves. If vendors are unable to supply a price, or if the price supplied is deemed to be unreliable, the market price may be determined using quotations received from one or more broker–dealers that make a market in the security. Short-term debt obligations that will mature in 60 days or less are valued at amortized cost, unless it is determined that using this method would not reflect an investment’s fair value.
26 | www.vulcanvaluepartners.com |
| Notes to Financial Statements | ||
| October 31, 2013 (Unaudited) |
When such prices or quotations are not available, or when the Fair Value Committee appointed by the Board believes that they are unreliable, securities may be priced using fair value procedures approved by the Board.
Fair Value Measurements: A three-tier hierarchy has been established to classify fair value measurements for disclosure purposes. Inputs refer broadly to the assumptions that market participants would use in pricing the asset or liability, including assumptions about risk. Inputs may be observable or unobservable. Observable inputs are inputs that reflect the assumptions market participants would use in pricing the asset or liability that are developed based on market data obtained from sources independent of the reporting entity. Unobservable inputs are inputs that reflect the reporting entity’s own assumptions about the assumptions market participants would use in pricing the asset or liability that are developed based on the best information available. Various inputs are used in determining the value of each Fund’s investments as of the reporting period end. The designated input levels are not necessarily an indication of the risk or liquidity associated with these investments. These inputs are categorized in the following hierarchy under applicable financial accounting standards:
Level 1 – | Unadjusted quoted prices in active markets for identical investments, unrestricted assets or liabilities that the Funds have the ability to access at the measurement date; | |
Level 2 – | Quoted prices which are not active, quoted prices for similar assets or liabilities in active markets or inputs other than quoted prices that are observable (either directly or indirectly) for substantially the full term of the asset or liability; and | |
Level 3 – | Significant unobservable prices or inputs (including the Funds’ own assumptions in determining the fair value of investments) where there is little or no market activity for the asset or liability at the measurement date. | |
The following is a summary of each input used to value each Fund’s investments as of October 31, 2013.
Vulcan Value Partners Fund:
| Investments in Securities at Value | Level 1 - Unadjusted Quoted Prices | Level 2 - Other Significant Observable Inputs | Level 3 - Significant Inputs | Total | ||||||||||||
| ||||||||||||||||
Common Stocks(a) | $ | 711,482,026 | $ | – | $ | – | $ | 711,482,026 | ||||||||
Short Term Investments | 16,357,340 | – | – | 16,357,340 | ||||||||||||
| ||||||||||||||||
TOTAL | $ | 727,839,366 | $ | – | $ | – | $ | 727,839,366 | ||||||||
| ||||||||||||||||
| (a) | For detailed descriptions, see the accompanying Statements of Investments. |
| Semi-Annual Report | October 31, 2013 | 27 |
| Notes to Financial Statements | ||
| October 31, 2013 (Unaudited) |
Vulcan Value Partners Small Cap Fund:
| Investments in Securities at Value | Level 1 - Unadjusted Quoted Prices | Level 2 - Other Significant Observable Inputs | Level 3 - Significant Unobservable Inputs | Total | ||||||||||||
| ||||||||||||||||
Common Stocks(a) | $ | 676,268,920 | $ | – | $ | – | $ | 676,268,920 | ||||||||
Short Term Investments | 20,017,516 | – | – | 20,017,516 | ||||||||||||
| ||||||||||||||||
TOTAL | $ | 696,286,436 | $ | – | $ | – | $ | 696,286,436 | ||||||||
| ||||||||||||||||
| (a) | For detailed descriptions, see the accompanying Statements of Investments. |
The Funds recognize transfers between levels as of the end of period. For the six months ended October 31, 2013, the Funds did not have any transfers between Level 1 and Level 2 securities. For the six months ended October 31, 2013, the Funds did not have any securities that used significant unobservable inputs (Level 3) in determining fair value.
Investment Transactions and Investment Income: Investment transactions are accounted for on the date the investments are purchased or sold (trade date). Realized gains and losses from investment transactions are reported on an identified cost basis, which is the same basis the Funds use for federal income tax purposes. Interest income, which includes accretion of discounts and amortization of premiums, is accrued and recorded as earned. Dividend income is recognized on the ex-dividend date or for certain foreign securities, as soon as information is available to the Funds. All of the realized and unrealized gains and losses and net investment income, are allocated daily to each class in proportion to its average daily net assets.
Foreign Securities: The Funds may directly purchase securities of foreign issuers. Investing in securities of foreign issuers involves special risks not typically associated with investing in securities of U.S. issuers. The risks include possible reevaluation of currencies, the inability to repatriate foreign currency, less complete financial information about companies and possible future adverse political and economic developments. Moreover, securities of many foreign issuers and their markets may be less liquid and their prices more volatile than those of securities of comparable U.S. issuers.
Trust Expenses: Some expenses of the Trust can be directly attributed to the Funds. Expenses which cannot be directly attributed are apportioned among all funds in the Trust based on average net assets of each fund.
Fund Expenses: Expenses that are specific to a Fund are charged directly to that Fund. Expenses that are common to both Funds generally are allocated among the Funds in proportion to their average daily net assets.
Federal Income Taxes: Each Fund complies with the requirements under Subchapter M of the Internal Revenue Code of 1986, as amended, applicable to regulated investment companies and intends to distribute substantially all of its net taxable income and net capital gains, if any, each
28 | www.vulcanvaluepartners.com |
| Notes to Financial Statements | ||
| October 31, 2013 (Unaudited) |
year so that it will not be subject to excise tax on undistributed income and gains. The Funds are not subject to income taxes to the extent such distributions are made.
As of and during the six months ended October 31, 2013, the Funds did not have a liability for any unrecognized tax benefits. The Funds file U.S. federal, state, and local tax returns as required. The Fund’s tax returns are subject to examination by the relevant tax authorities until expiration of the applicable statute of limitations, which is generally three years after the filing of the tax return for federal purposes and four years for most state returns. Tax returns for open years have incorporated no uncertain tax positions that require a provision for income taxes.
Distributions to Shareholders: Each Fund normally pays dividends and distributes capital gains, if any, on an annual basis. Income dividend distributions are derived from interest and other income each Fund receives from its investments, including short-term capital gains. Long term capital gain distributions are derived from gains realized when each Fund sells a security it has owned for more than a year. Each Fund may make additional distributions and dividends at other times if the portfolio manager believes doing so may be necessary for each Fund to avoid or reduce taxes.
3. TAX BASIS INFORMATION:
Tax Basis of Investments: As of October 31, 2013, the aggregate cost of investments, gross unrealized appreciation/(depreciation) and net unrealized appreciation for federal tax purposes was as follows:
Vulcan Value Partners Fund | Vulcan Value Partners Small Cap Fund | |||||||
| ||||||||
Gross appreciation | $ | 133,387,736 | $ | 92,887,007 | ||||
Gross depreciation | (3,127,415 | ) | (16,954,953 | ) | ||||
| ||||||||
Net unrealized appreciation | $ | 130,260,321 | $ | 75,932,054 | ||||
| ||||||||
Cost of investments for income tax purposes | $ | 597,579,045 | $ | 620,354,382 | ||||
| ||||||||
Tax Basis of Distributions to Shareholders: The character of distributions made during the year from net investment income or net realized gains may differ from its ultimate characterization for federal income tax purposes. Also, due to the timing of dividend distributions, the fiscal year in which amounts are distributed may differ from the fiscal year in which the income or realized gain were recorded by each Fund.
| Semi-Annual Report | October 31, 2013 | 29 |
| Notes to Financial Statements | ||
| October 31, 2013 (Unaudited) |
The tax character of distributions paid by the Funds for the fiscal year ended April 30, 2013 were as follows:
| Ordinary Income | Long-Term Capital Gain | |||||||
| ||||||||
2013 | ||||||||
Vulcan Value Partners Fund | $ | 5,269,193 | $ | 671,118 | ||||
Vulcan Value Partners Small Cap Fund | 1,042,621 | 903,482 | ||||||
There were no distributions paid by the Funds during the six months ended October 31, 2013.
4. SECURITIES TRANSACTIONS
During the six months ended October 31, 2013, equity holdings, asset/mortgage backed securities and fixed income securities were transferred in-kind. The intent of the transfers was to save on equity transaction costs both for the new shareholders at the institution they transferred from and for the Vulcan Value Partners Fund on the addition of assets. The assets of two separate accounts were transferred-in-kind into the Fund in the amount of $33,602,536.
The cost of purchases and proceeds from sales of securities (excluding short-term securities and transfers-in-kind) during the six months ended October 31, 2013 were as follows:
| Fund | Purchase of Securities | Proceeds From Sales of Securities | ||||||
| ||||||||
Vulcan Value Partners Fund | $ | 331,276,155 | $ | 106,539,683 | ||||
Vulcan Value Partners Small Cap Fund | 426,823,706 | 176,618,614 | ||||||
5. CAPITAL SHARE TRANSACTIONS
The capitalization of the Trust consists of an unlimited number of shares of beneficial interest with no par value per share. Holders of the shares of the Funds of the Trust have one vote for each share held and a proportionate fraction of a vote for each fractional share. All shares issued and outstanding are fully paid and are non-assessable, transferable and redeemable at the option of the shareholder. Shares have no pre-emptive rights.
Shares redeemed within 90 days of purchase may incur a 2% short-term redemption fee deducted from the redemption amount. The Vulcan Value Partners Fund and the Vulcan Value Partners Small Cap Fund retained $22,081 and $49,406, respectively, for the six months ended October 31, 2013, and $16,178 and $34,963, respectively, for the year ended April 30, 2013, which is reflected in the “Cost of shares redeemed, net of redemption fees” in the Statements of Changes in Net Assets.
30 | www.vulcanvaluepartners.com |
| Notes to Financial Statements | ||
| October 31, 2013 (Unaudited) |
Transactions in shares of capital stock for the dates listed below were as follows:
| Vulcan Value Partners Fund | ||||||||
For the Six Months Ended (Unaudited) | For the Year Ended April 30, 2013 | |||||||
| ||||||||
Shares Sold | 13,379,633 | 25,326,792 | ||||||
Shares Issued in Reinvestment of Dividends | – | 402,869 | ||||||
Less Shares Redeemed | (1,398,463 | ) | (6,062,055 | ) | ||||
| ||||||||
Net Increase | 11,981,170 | 19,667,606 | ||||||
| ||||||||
| Vulcan Value Partners Small Cap Fund | ||||||||
| For the Six Months Ended October 31, 2013 (Unaudited) | For the Year Ended April 30, 2013 | |||||||
| ||||||||
Shares Sold | 15,583,465 | 23,292,608 | ||||||
Shares Issued in Reinvestment of Dividends | – | 117,898 | ||||||
Less Shares Redeemed | (3,960,825 | ) | (1,395,277 | ) | ||||
| ||||||||
Net Increase | 11,622,640 | 22,015,229 | ||||||
| ||||||||
6. MANAGEMENT AND RELATED-PARTY TRANSACTIONS
Vulcan Value Partners, LLC (“Vulcan” or the “Adviser”), subject to the authority of the Board, is responsible for the overall management and administration of the Funds’ business affairs. Vulcan manages the investments of the Funds in accordance with each Fund’s investment objective, policies and limitations and investment guidelines established jointly by the Adviser and the Board. Pursuant to the Investment Advisory Agreement (the “Advisory Agreement”), the Funds pay Vulcan an annual management fee of 1.00% and 1.15% for Vulcan Value Partners Fund and Vulcan Value Partners Small Cap Fund, respectively, based on each Fund’s average daily net assets.
Vulcan has contractually agreed with the Funds to limit the amount of each Fund’s total annual expenses (exclusive of distribution and service (12b-1) fees, acquired fund fees and expenses, brokerage expenses, interest expense, taxes and extraordinary expenses) to 1.25% of each Fund’s average daily net assets. This agreement is in effect through August 31, 2014 and is reevaluated on an annual basis. Without this agreement, expenses could be higher. The Adviser is permitted to recover expenses it has borne through the agreement described above to the extent that each Fund’s expenses in later periods fall below the annual rates set forth in the relevant agreement. If the Adviser foregoes any fees and/or reimburses the Funds pursuant to this agreement with respect to a particular fiscal year, then the Adviser shall be entitled to recover from the Funds the amount forgone or reimbursed to the extent annual fund operating expenses are less than 1.25% of the Funds’ average daily net assets during any fiscal year following such fiscal year.
Pursuant to this agreement, each Fund will reimburse the Adviser for any fee waivers and expense reimbursements made by the Adviser, provided that any such reimbursements made by the Funds
| Semi-Annual Report | October 31, 2013 | 31 |
| Notes to Financial Statements | ||
| October 31, 2013 (Unaudited) |
to the Adviser will not cause the Funds’ expense limitation to exceed expense limitations in existence at the time the expense was incurred, or at the time of the reimbursement, whichever is lower, and the reimbursement is made within three years after the expenses were incurred.
For the six months ended October 31, 2013, the fee waivers and/or reimbursements were as follows:
| Fund | Fees Waived/Reimbursed By Advisor | Recoupment of Previously Waived Fees by Advisor | ||||||
| ||||||||
Vulcan Value Partners Fund | $ | – | $ | – | ||||
Vulcan Value Partners Small Cap Fund | 127,001 | – | ||||||
As of October 31, 2013, the balances of recoupable expenses for each Fund were as follows: |
| |||||||
| Fund | 2013 | 2012 | 2011 | Total | ||||||||||||
| ||||||||||||||||
Vulcan Value Partners Fund | $ | – | $ | – | $ | – | $ | – | ||||||||
Vulcan Value Partners Small Cap Fund | 161,158 | 124,024 | 199,532 | 484,714 | ||||||||||||
Distributor: ALPS Distributors, Inc. (“ADI” or the “Distributor”) (an affiliate of ALPS Fund Services, Inc.) acts as the distributor of each Fund’s shares pursuant to a Distribution Agreement with the Trust. Shares are sold on a continuous basis by ADI as agent for the Funds, and ADI has agreed to use its best efforts to solicit orders for the sale of each Fund’s shares, although it is not obliged to sell any particular amount of shares. ADI is not entitled to any compensation for its services as Distributor. ADI is registered as a broker-dealer with the Securities and Exchange Commission.
Principal Financial Officer: ALPS receives an annual fee of $10,000 for both Funds for providing Principal Financial Officer services to the Funds. The annual fee is billed monthly in total and allocated to each Fund. Vulcan pays this fee on behalf of the Funds.
Compliance Services: ALPS provides services that assist the Trust’s Chief Compliance Officer in monitoring and testing the policies and procedures of the Trust in conjunction with requirements under Rule 38a-1 under the 1940 Act under the Chief Compliance Officer Services Agreement with the Trust. Under this Agreement, ALPS is paid an annual base fee of $60,000 (subject to a 5% increase per annum) and is reimbursed for certain out-of-pocket expenses. Vulcan pays this fee on behalf of the Funds.
Transfer Agent: ALPS serves as transfer, dividend paying and shareholder servicing agent for the Fund (“Transfer Agent”). ALPS is compensated based upon a $25,000 annual base fee per Fund, and annually $9 per direct open account and $7 per open account through NSCC. The Transfer Agent is also reimbursed by the Fund for certain out-of-pocket expenses.
Administrator: ALPS Fund Services, Inc. (“ALPS” and the “Administrator”) (an affiliate of ADI) serves as administrator to the Funds, and each Fund has agreed to pay expenses incurred in connection with its administrative activities. Pursuant to the Administration, Bookkeeping and Pricing Services Agreement (the “Agreement”), ALPS will provide operational services to the Funds
32 | www.vulcanvaluepartners.com |
| Notes to Financial Statements | ||
| October 31, 2013 (Unaudited) |
including, but not limited to fund accounting and fund administration and generally assist in each Fund’s operations.
Annual Administrative Fee, billed monthly in total and allocated to each Fund, in the amount of the greater of (a) $231,525 minimum (subject to a 5% increase per annum) or (b) following basis point fee schedule:
| Average Total Net Assets | Contractual Fee | |
Between $0-$500M | 0.05% | |
$500M-$1B | 0.03% | |
Above $1B | 0.02% |
The Administrator is also reimbursed by the Funds for certain out-of-pocket expenses.
7. INDEMNIFICATIONS
Under the Trust’s organizational documents, its Officers and Trustees are indemnified against certain liability arising out of the performance of their duties to the Trust. Additionally, in the normal course of business, the Trust enters into contracts with service providers that may contain general indemnification clauses which may permit indemnification to the extent permissible under applicable law. The Trust’s maximum exposure under these arrangements is unknown, as this would involve future claims that may be made against the Trust that have not yet occurred.
8. NEW ACCOUNTING PRONOUNCEMENTS
In June 2013, the Financial Accounting Standards Board (the “FASB”) issued Accounting Standards Update (“ASU”) No. 2013-08, Financial Services-Investment Companies (Topic 946): Amendments to the Scope, Measurement, and Disclosure Requirements. The FASB standard identifies characteristics a company must assess to determine whether it is considered an investment company for financial reporting purposes. This ASU is effective for fiscal years beginning after December 15, 2013. The Funds believe the adoption of this ASU will not have a material impact on their financial statements.
| Semi-Annual Report | October 31, 2013 | 33 |
| Additional Information | ||
| October 31, 2013 (Unaudited) |
1. FUND HOLDINGS
The Funds file their complete schedule of portfolio holdings with the Securities and Exchange Commission (the “SEC”) for the first and third quarters of each fiscal year on Form N-Q within 60 days after the end of the period. Copies of the Funds’ Form N-Q are available without charge on the SEC website at http://www.sec.gov. You may also review and copy the Form N-Q at the SEC’s Public Reference Room in Washington, DC. For more information about the operation of the Public Reference Room, please call the SEC at 1-800-SEC-0330.
2. FUND PROXY VOTING POLICIES, PROCEDURES AND SUMMARIES
Each Fund’s policies and procedures used in determining how to vote proxies and information regarding how the Funds voted proxies relating to portfolio securities during the most recent prior 12-month period ending June 30 are available without charge, (1) upon request, by calling (toll-free) (866) 759-5679 and (2) on the SEC’s website at http://www.sec.gov.
34 | www.vulcanvaluepartners.com |
This page left intentionally blank.
This page left intentionally blank.

| Item 2. | Code of Ethics. |
Not applicable to this Report.
| Item 3. | Audit Committee Financial Expert. |
Not applicable to this Report.
| Item 4. | Principal Accountant Fees and Services. |
Not applicable to this Report.
| Item 5. | Audit Committee of Listed Registrants. |
Not applicable to Registrant.
| Item 6. | Investments. |
| (a) | Schedule of Investments is included as part of the Reports to Stockholders filed under Item 1 of this Form N-CSR. |
| (b) | Not applicable. |
| Item 7. | Disclosure of Proxy Voting Policies and Procedures for Closed-End Management Investment Companies. |
Not applicable to Registrant.
| Item 8. | Portfolio Managers of Closed-End Management Investment Companies. |
Not applicable to Registrant.
| Item 9. | Purchases of Equity Securities by Closed-End Management Investment Company and Affiliated Purchasers. |
Not applicable to Registrant.
| Item 10. | Submission of Matters to a Vote of Security Holders. |
There have been no material changes to the procedures by which shareholders may recommend nominees to the Registrant’s Board of Trustees, where those changes were implemented after the Registrant last provided disclosure in response to the requirements of Item 407(c)(2)(iv) of Regulation S-K, or this Item.
| Item 11. | Controls and Procedures. |
| (a) | The Registrant’s principal executive officer and principal financial officer have concluded that the Registrant’s disclosure controls and procedures (as defined in Rule 30a-3(c) under the Investment Company Act of 1940, as amended) are effective based on their evaluation of these controls and procedures as of a date within 90 days of the filing date of this report. |
| (b) | There was no change in the Registrant’s internal control over financial reporting (as defined in Rule 30a-3(d) under the Investment Company Act of 1940, as amended) that occurred during the second fiscal quarter of the period covered by this report that has materially affected, or is reasonably likely to materially affect, the Registrant’s internal control over financial reporting. |
| Item 12. | Exhibits. |
| (a)(1) | Not applicable to this Report. |
| (a)(2) | The certifications required by Rule 30a-2(a) of the Investment Company Act of 1940, as amended, and Section 302 of the Sarbanes-Oxley Act of 2002 are attached hereto as Exhibit 99.Cert. |
| (a)(3) | Not applicable to Registrant. |
| (b) | The certifications by the Registrant’s principal executive officer and principal financial officer, as required by Rule 30a-2(b) of the Investment Company Act of 1940, as amended, and Section 906 of the Sarbanes-Oxley Act of 2002 are attached hereto as Exhibit 99.906Cert. |
SIGNATURES
Pursuant to the requirements of the Securities Exchange Act of 1934 and the Investment Company Act of 1940, the Registrant has duly caused this report to be signed on its behalf by the undersigned, thereunto duly authorized.
| FINANCIAL INVESTORS TRUST | ||
| By: | /s/ Edmund J. Burke | |
| Edmund J. Burke (Principal Executive Officer) | ||
| President | ||
| Date: | January 3, 2014 | |
Pursuant to the requirements of the Securities Exchange Act of 1934 and the Investment Company Act of 1940, this report has been signed below by the following persons on behalf of the Registrant and in the capacities and on the dates indicated.
| FINANCIAL INVESTORS TRUST | ||
| By: | /s/ Edmund J. Burke | |
| Edmund J. Burke (Principal Executive Officer) | ||
| President | ||
| Date: | January 3, 2014 | |
| By: | /s/ Kimberly R. Storms | |
| Kimberly R. Storms (Principal Financial Officer) | ||
| Treasurer | ||
| Date: | January 3, 2014 | |