Table of Contents
UNITED STATES
SECURITIES AND EXCHANGE COMMISSION
Washington, D.C. 20549
FORM N-CSR
CERTIFIED SHAREHOLDER REPORT OF REGISTERED
MANAGEMENT INVESTMENT COMPANIES
Investment Company Act file number: 811-8194
FINANCIAL INVESTORS TRUST
(exact name of Registrant as specified in charter)
1290 Broadway, Suite 1100, Denver, Colorado 80203
(Address of principal executive offices) (Zip code)
JoEllen L. Legg, Secretary
Financial Investors Trust
1290 Broadway, Suite 1100
Denver, Colorado 80203
(Name and address of agent for service)
Registrant’s telephone number, including area code: 303-623-2577
Date of fiscal year end: April 30
Date of reporting period: May 1, 2011 - October 31, 2011
Table of Contents
Item 1. Reports to Stockholders.
Table of Contents
Table of Contents
| October 31, 2011 (Unaudited) |
Table of Contents
| October 31, 2011 (Unaudited)
| |||
Performance
During the six-month period ended 10/31/2011, the Indian equity markets fell along with the global markets with broader Indian indices like CNX 5001 returning -17.06% in the period, large cap index (Nifty) returning -15.88% and midcap index (CNX Midcap) returning -19.54% (all in USD terms). The investment environment during this period was impacted by the following, with August marking the worst monthly decline (CNX 500 returned -4.73% in May, 1.79% in June, -1.38% in July, -12.47% in August, -6.20% in September, and 5.33% in October).
| » | The worsening debt situation in Europe, S&P downgrade of long term US sovereign rating, and deteriorating global economic growth have impacted investor sentiment, resulting in a sell-off in equity markets worldwide. On the domestic side, increasing interest rates, persistent high levels of inflation, weakening GDP growth, and lack of significant reform activities also resulted in increased pessimism in the Indian market. |
| » | Currency has been a big spoiler for international investors investing in India. The Indian Rupee depreciated 10.12% during the 6-month period against the USD. India’s twin deficits, current account & fiscal account, are negatively affecting the Indian currency harder than any previous cycle. The issue is getting compounded by still elevated commodity prices and the global deleveraging by European banks which is affecting the capital flows. Historically, the current account deficit has been funded by the capital flows but in the current environment, it seems challenging to expect capital flows to compensate for trade deficit. |
| » | During the period, the market witnessed corporate India announcing their earning results. Revenue and earnings growth have been subdued as a result of the weakening environment, high interest costs, and inflation. |
| » | For the quarter ending September 2012, real GDP growth number came in at 6.9%, lower than previous quarter’s number of 7.7% and last year’s 8.4%, with Manufacturing and Mining sector leading the decline. In our view, it is clear that growth for 2012 as a whole is unlikely to exceed 7%. Also the likelihood of further revisions to growth estimates for 2013 is high. Investment growth continues to show signs of weakness as the lag impact of the high interest rates are felt and the likelihood of a significant slowdown in export growth appears large. The trends in GDP growth by aggregate demand also clearly reflect the impact of higher interest rates on demand with the declining growth trajectory in the case of private consumption expenditure and the fact that Gross Fixed Capital Formation has recorded negative growth in the quarter. Going forward, |
we believe that proactive government policies are needed to restore private corporate sentiment and to boost investments leading to capital formation. |
| » | During the period, the inflation number has been persistently above 9% with the highest inflation number recorded in the month of August (9.78%). The inflation number also marked the tenth consecutive month of inflation above 9%. Fuel & Power inflation rose significantly during the period reflecting the rising oil price and significant rupee depreciation (as India is a major importer of Oil) |
| » | The Central bank in its October credit policy increased the interest rate by another 25 basis points (bps), in line with expectation, bringing the repo2 and reverse repo rate to 8.50% and 7.50% respectively. In the policy note, RBI (Reserve Bank of India) also hinted that this may be the last interest rate hike for the year. RBI also lowered its 2012 GDP growth forecast to 7.6% (v/s 8.0% previously), acknowledging the fact that its anti-inflationary monetary policy measures of increasing interest rate has dented growth. Nevertheless, RBI maintained its inflation target of 7% for March 2012 citing that inflation will start declining significantly December onwards. |
| » | Post the state elections in 2011, government announced several reforms activities such as increase in diesel price, introduction of Land Acquisition, Rehabilitation, and Resettlement bill (LARR), and deregulation of saving bank deposit rates. While these initiatives signal some policy activity by the government, big reform activities have not yet been initiated. Policy inaction remains the single largest concern for the Indian economy in a deteriorating global environment, as the current policy blocks do not infuse much confidence for significant capital formation. |
Portfolio Composition
The portfolio is constructed to potentially benefit from the strong macro-economic growth in the Indian economy across four broad themes in India – Consumption lead by favourable demographics, Financial services, Infrastructure and Outsourcing. The Fund has the flexibility to invest across market capitalizations – depending on market conditions, valuation differential, earnings growth, liquidity, etc.
For the 6-month period ending 10/31/2011, sectorally the key changes have been in Consumer staples (added 350 bps), Oil & Gas (added 350 bps), Information Technology (added 180 bps), Metals (reduced 110 bps), Aviation (reduced 100 bps), and Capital goods (reduced 75 bps). Thematically, Consumption (at about 25%), Financials (at about 22%) are the largest themes in the portfolio while Infrastructure exposure is less than 10% due to poor policy initiatives by the government. Over the last
| 2 | October 31, 2011 |
Table of Contents
ALPS | Kotak India Growth Fund | ||||
Management Commentary
| October 31, 2011 (Unaudited)
| |||
6 month, exposure to mid-cap and small-cap companies in the fund has moved up from 17.21% in April 2011 to 26.79% in July 2011, then down to 20.76% in October 2011.
Sectorally, the portfolio is overweight Oil & Gas, Media, Infrastructure while underweight Financials, Auto, Capital goods, Consumer staples, and Utilities as of 10/31/2011.
Market Outlook
For international investors, Indian equities have been one of the worst performing markets, with depressed equity returns exacerbated by weak currency. We feel that the major reasons of this under-performance can be attributed to:
| » | Persistence of high inflation and subsequent tightening of interest rates |
| » | High oil prices impacting Indian fiscal deficit |
| » | Policy paralysis by the government |
| » | Global concerns on sovereign debt |
While inflation has begun to ease off and the RBI has signaled its intent on focusing on growth rather than inflation, the government continues to be bound by political compulsions with hardly any policy decision to improve investment climate in India. While monetary policy will increasingly become more accommodative towards growth, participants will be watchful of government policy initiatives (especially as it presents its annual budget in Feb 2012).
If inflation was the biggest concern at the start of 2011, we enter 2012 with concerns on growth. As of October 2011, S&P CNX Nifty is trading at consensus Bloomberg estimates of 14.9x 2012 earnings per share and CNX Midcap index is trading at 11.9x 2012 earnings per share, which in our opinion factors a slowing economic growth. However, we believe despite attractive valuations, market participants will wait to see government policy in action before a significant re-rating of the Indian equities.
| 1 | CNX 500- The S & P’s CNX 500 is India’s first broad based stock market index |
| 2 | REPO- A form of short term barrowing for dealers in government securities. The dealers sells the securities to the investor usually on an overnight basis, and buys them back the following day Reverse REPO- The purchase of a securities with the agreement to sell them at a high price at a specific future date. (investopedia) |
Past performance does not guarantee future results.
| 3 | October 31, 2011 |
Table of Contents
ALPS | Kotak India Growth Fund | ||||
Management Commentary
| October 31, 2011 (Unaudited)
| |||
Performance of $10,000 Initial Investment (as of October 31, 2011)
Comparison of change in value of a $10,000 investment (includes applicable sales loads of 5.50%)
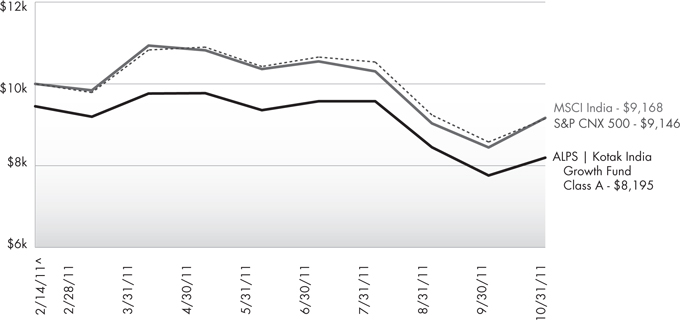
The chart above represents historical performance of a hypothetical investment of $10,000 in the Fund since inception. Past performance does not guarantee future results. This chart does not reflect the deduction of taxes that a shareholder would pay on Fund distributions or the redemption of Fund shares.
| 4 | October 31, 2011 |
Table of Contents
ALPS | Kotak India Growth Fund | ||||
Management Commentary
| October 31, 2011 (Unaudited)
| |||
Cumulative Return (as of October 31, 2011)
| Since Inception^ | Total Expense Ratio | What You Pay* | ||||
Class A (NAV)1 | -13.30% | 69.97% | 2.01% | |||
Class A (MOP)2 | -18.05% | |||||
Class C (NAV)1 | -13.80% | 69.65% | 2.61% | |||
Class C (CDSC)2 | -14.66% | |||||
Class I | -13.10% | 96.68% | 1.61% | |||
S&P CNX 500 Index3 | -8.54% | |||||
MSCI India Index4 | -8.32% |
Performance data quoted represents past performance. Past performance does not guarantee future results. Investment return and principal value of an investment will fluctuate so that an investor’s shares, when sold or redeemed, may be worth more or less than the original cost. Current performance data may be higher or lower than actual data quoted. The Fund imposes a 2.00% redemption fee on shares held for less than 30 days. The Fund imposes a maximum Contingent Deferred Sales Charge (“CDSC”) of 1.00% to shares redeemed within the first 12 months after a purchase in excess of $1 million. Performance data does not reflect the redemption fee or the CDSC, which if reflected would reduce the performance quoted. For the most current month-end performance data please call (866) 759-5679.
Investing in the Fund is subject to investment risks, including possible loss of the principal amount invested. Derivatives generally are more sensitive to changes in economic or market conditions than other types of investments; this could result in losses that significantly exceed the funds original investment.
| 1 | Net Asset Value (NAV) is the share price without sales charges. |
| 2 | Maximum Offering Price (MOP) includes sales charges. Class A returns include effects of the Fund’s maximum sales charge of 5.50%; Class C returns include the 1.00% CDSC. |
| 3 | S&P CNX 500 - India’s first broad based benchmark of the Indian capital market. The S&P CNX 500 companies are disaggregated into 72 industry indices. Industry weightages in the market. The index is not actively managed and does not reflect any deduction for fees, expenses or taxes. An investor may not invest directly in an index. |
| 4 | MSCI India Index - a free float weighted equity index. It was developed with a base value of 100 as-of December 31, 1992. The index is not actively managed and does not reflect any deduction for fees, expenses or taxes. An investor may not invest directly in an index. |
| ^ | Fund inception date of 2/14/2011. |
| * | What You Pay reflects the Adviser’s and Sub-Adviser’s decision to contractually limit expenses through August 31, 2012. Please see the prospectus for additional information. |
The table does not reflect the deduction of taxes that a shareholder would pay on Fund distributions or the redemption of Fund shares.
The Fund is less than a year old and has limited operating history. This Fund is not suitable for all investors. Subject to investment risks, including possible loss of the principal amount invested.
Investing in India involves risk and considerations not present when investing in more established securities markets. The Fund may be more susceptible to economic, market, political and local risks of the region than a fund that is more geographically diversified.
Top Ten Long Holdings (as a % of Net Assets) †
Reliance Industries, Ltd. | 7.59% | |
Infosys, Ltd. | 6.22% | |
ICICI Bank, Ltd. | 4.22% | |
Tata Consultancy Services, Ltd. | 3.91% | |
ITC, Ltd. | 3.80% | |
HDFC Bank, Ltd. | 3.72% | |
Housing Development Finance Corp. | 3.03% | |
Larsen & Toubro, Ltd. | 2.75% | |
Dr Reddy’s Laboratories, Ltd. | 2.27% | |
Mahindra & Mahindra, Ltd. | 2.25% | |
Top Ten Long Holdings | 39.76% |
| † | Holdings are subject to change. |
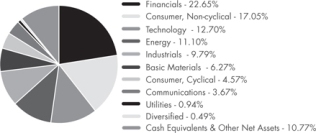
Industry Sector Allocation (Long Positions as a % of Net Assets)
| 5 | October 31, 2011 |
Table of Contents
ALPS | Kotak India Growth Fund | ||||
| October 31, 2011 (Unaudited)
| |||
As a shareholder of the Fund, you will incur two types of costs: (1) transaction costs, including applicable sales charges (loads) and redemption fees; and (2) ongoing costs, including management fees, distribution and service (12b-1) fees, shareholder service fees and other Fund expenses. The following examples are intended to help you understand your ongoing costs (in dollars) of investing in the Fund and to compare these costs with the ongoing costs of investing in other mutual funds. The examples are based on an investment of $1,000 invested on May 1, 2011 and held until October 31, 2011.
Actual Expenses. The first line of the table on the next page provides information about actual account values and actual expenses. You may use the information in this line, together with the amount you invested, to estimate the expenses that you paid over the period. Simply divide your account value by $1,000 (for example, an $8,600 account value divided by $1,000 = 8.6), then multiply the result by the number in the first line under the heading “Expense Paid During Period” to estimate the expenses you paid on your account during this period.
Hypothetical Example for Comparison Purposes. The second line of the table on the next page provides information about hypothetical account values and hypothetical expenses based on the Fund’s actual expense ratio and an assumed rate of return of 5% per year before expenses, which is not the Fund’s actual return. The hypothetical account values and expenses may not be used to estimate the actual ending account balance or expenses you paid for the period. You may use this information to compare the ongoing costs of investing in the Fund and other mutual funds. To do so, compare this 5% hypothetical example with the 5% hypothetical examples that appear in the shareholder reports of the other funds.
The expenses shown in the table are meant to highlight ongoing Fund costs only and do not reflect transaction fees, such as sales charges or exchange fees. Therefore, the second line of the table on the next page is useful in comparing ongoing costs only, and may not help you determine the relative total costs of owning different funds. In addition, if these transactional costs were included, your costs would have been higher.
| Beginning Account Value 5/1/11 | Ending Account Value 10/31/11 | Expense Ratio(a) | Expense Paid During Period(b) 5/1/11 - 10/31/11 | |||||||||||||||||
Class A | ||||||||||||||||||||
Actual | $ | 1,000.00 | $ | 838.50 | 2.00 | % | $ | 9.24 | ||||||||||||
Hypothetical (5% return before expenses) | $ | 1,000.00 | $ | 1,015.08 | 2.00 | % | $ | 10.13 | ||||||||||||
Class C | ||||||||||||||||||||
Actual | $ | 1,000.00 | $ | 835.30 | 2.60 | % | $ | 11.99 | ||||||||||||
Hypothetical (5% return before expenses) | $ | 1,000.00 | $ | 1,012.07 | 2.60 | % | $ | 13.15 | ||||||||||||
Class I | ||||||||||||||||||||
Actual | $ | 1,000.00 | $ | 839.60 | 1.60 | % | $ | 7.40 | ||||||||||||
Hypothetical (5% return before expenses) | $ | 1,000.00 | $ | 1,017.09 | 1.60 | % | $ | 8.11 | ||||||||||||
| (a) | The Fund’s expense ratios have been based on the Fund’s most recent fiscal half-year expenses. |
| (b) | Expenses are equal to the Fund’s annualized expense ratio multiplied by the average account value over the period, multiplied by the number of days in the most recent fiscal half year (184), then divided by 366. |
| 6 | October 31, 2011 |
Table of Contents
ALPS | Kotak India Growth Fund | ||||
| October 31, 2011 (Unaudited)
| |||
| Shares | Value (Note 1) | |||||||
COMMON STOCKS (89.23%) |
| |||||||
Basic Materials (6.27%) | ||||||||
Chemicals (2.01%) | ||||||||
Asian Paints, Ltd. | 650 | $42,109 | ||||||
Gujarat State Fertilisers & Chemicals, Ltd. | 3,850 | 37,372 | ||||||
|
| |||||||
| 79,481 | ||||||||
|
| |||||||
Iron & Steel (1.41%) | ||||||||
Jindal Steel & Power, Ltd. | 4,846 | 55,524 | ||||||
|
| |||||||
Mining (2.85%) | ||||||||
Hindustan Zinc, Ltd. | 29,290 | 74,986 | ||||||
Sterlite Industries India, Ltd. | 14,450 | 37,791 | ||||||
|
| |||||||
| 112,777 | ||||||||
|
| |||||||
TOTAL BASIC MATERIALS | 247,782 | |||||||
|
| |||||||
Communications (3.67%) | ||||||||
Media (1.86%) | ||||||||
Dish TV India, Ltd.(a) | 17,000 | 26,318 | ||||||
Jagran Prakashan, Ltd. | 21,295 | 47,442 | ||||||
|
| |||||||
| 73,760 | ||||||||
|
| |||||||
Telecommunications (1.81%) |
| |||||||
Bharti Airtel, Ltd. | 8,921 | 71,424 | ||||||
|
| |||||||
TOTAL COMMUNICATIONS | 145,184 | |||||||
|
| |||||||
Consumer, Cyclical (4.57%) | ||||||||
Auto Manufacturers (2.25%) |
| |||||||
Mahindra & Mahindra, Ltd. | 5,050 | 89,117 | ||||||
|
| |||||||
Leisure Time (1.41%) | ||||||||
Bajaj Auto, Ltd. | 1,579 | 55,831 | ||||||
|
| |||||||
Textiles (0.91%) | ||||||||
Raymond, Ltd. | 4,500 | 35,779 | ||||||
|
| |||||||
TOTAL CONSUMER, CYCLICAL |
| 180,727 | ||||||
|
| |||||||
Consumer, Non-cyclical (17.05%) |
| |||||||
Agriculture (3.80%) | ||||||||
ITC, Ltd. | 34,500 | 150,431 | ||||||
|
| |||||||
Beverages (0.53%) | ||||||||
United Spirits, Ltd. | 1,175 | 21,059 | ||||||
|
| |||||||
Commercial Services (1.98%) |
| |||||||
Gujarat Pipavav Port, Ltd.(a) | 12,000 | 17,556 | ||||||
Mundra Port and Special | ||||||||
Economic Zone, Ltd. | 18,150 | 60,827 | ||||||
|
| |||||||
| 78,383 | ||||||||
|
| |||||||
| Shares | Value (Note 1) | |||||||
Food (2.03%) | ||||||||
GlaxoSmithKline Consumer Healthcare, Ltd. | 764 | $36,974 | ||||||
Shree Renuka Sugars, Ltd. | 36,880 | 43,079 | ||||||
|
| |||||||
| 80,053 | ||||||||
|
| |||||||
Household Products & Wares (3.39%) |
| |||||||
Godrej Consumer Products, Ltd. | 4,222 | 37,770 | ||||||
Hindustan Unilever, Ltd. | 7,643 | 58,857 | ||||||
Marico, Ltd. | 11,800 | 37,363 | ||||||
|
| |||||||
| 133,990 | ||||||||
|
| |||||||
Pharmaceuticals (5.32%) |
| |||||||
Divi’s Laboratories, Ltd. | 4,045 | 63,837 | ||||||
Dr Reddy’s Laboratories, Ltd. | 2,648 | 89,696 | ||||||
Lupin, Ltd. | 5,900 | 56,751 | ||||||
|
| |||||||
| 210,284 | ||||||||
|
| |||||||
TOTAL CONSUMER, NON-CYCLICAL |
| 674,200 | ||||||
|
| |||||||
Diversified (0.49%) | ||||||||
Holding Companies-Diversified Operations (0.49%) |
| |||||||
Sintex Industries, Ltd. | 8,000 | 19,230 | ||||||
|
| |||||||
TOTAL DIVERSIFIED |
| 19,230 | ||||||
|
| |||||||
Energy (11.10%) | ||||||||
Oil & Gas (11.10%) |
| |||||||
Hindustan Petroleum Corp., Ltd. | 10,410 | 71,221 | ||||||
Oil & Natural Gas Corp., Ltd. | 11,885 | 67,520 | ||||||
Reliance Industries, Ltd. | 16,765 | 300,147 | ||||||
|
| |||||||
TOTAL ENERGY | 438,888 | |||||||
|
| |||||||
Financials (22.65%) | ||||||||
Banks (16.02%) | ||||||||
Allahabad Bank | 11,485 | 35,137 | ||||||
Axis Bank, Ltd. | 1,760 | 41,584 | ||||||
Bank of Baroda | 3,425 | 53,916 | ||||||
HDFC Bank, Ltd. | 14,740 | 146,956 | ||||||
ICICI Bank, Ltd. | 8,849 | 166,831 | ||||||
IndusInd Bank, Ltd. | 8,380 | 49,066 | ||||||
State Bank of India | 1,239 | 48,177 | ||||||
Union Bank of India | 7,182 | 33,179 | ||||||
Yes Bank, Ltd. | 9,183 | 58,829 | ||||||
|
| |||||||
| 633,675 | ||||||||
|
| |||||||
Diversified Financial Services (5.83%) |
| |||||||
Bajaj Finance, Ltd. | 3,754 | 52,493 | ||||||
Housing Development Finance Corp. | 8,510 | 119,723 | ||||||
Power Finance Corp., Ltd. | 19,050 | 58,339 | ||||||
|
| |||||||
| 230,555 | ||||||||
|
| |||||||
| 7 | October 31, 2011 |
Table of Contents
ALPS | Kotak India Growth Fund | ||||
Statement of Investments
| October 31, 2011 (Unaudited)
| |||
| Shares | Value (Note 1) | |||||||
Real Estate (0.80%) |
| |||||||
Phoenix Mills, Ltd. | 7,704 | $31,612 | ||||||
|
| |||||||
TOTAL FINANCIALS | 895,842 | |||||||
|
| |||||||
Industrials (9.79%) | ||||||||
Building Materials (1.93%) |
| |||||||
Shree Cement, Ltd. | 1,965 | 76,454 | ||||||
|
| |||||||
Electrical Components & Equipment (2.21%) |
| |||||||
Bharat Heavy Electricals, Ltd. | 7,620 | 49,472 | ||||||
V-Guard Industries, Ltd. | 9,188 | 38,000 | ||||||
|
| |||||||
| 87,472 | ||||||||
|
| |||||||
Engineering & Construction (4.31%) |
| |||||||
IRB Infrastructure Developers, Ltd. | 18,400 | 61,675 | ||||||
Larsen & Toubro, Ltd. | 3,771 | 108,746 | ||||||
|
| |||||||
| 170,421 | ||||||||
|
| |||||||
Machinery Diversified (0.92%) |
| |||||||
Thermax, Ltd. | 3,841 | 36,394 | ||||||
|
| |||||||
Packaging & Containers (0.42%) |
| |||||||
Ess Dee Aluminium, Ltd. | 4,293 | 16,399 | ||||||
|
| |||||||
TOTAL INDUSTRIALS | 387,140 | |||||||
|
| |||||||
Technology (12.70%) | ||||||||
Computers (11.71%) |
| |||||||
Infosys, Ltd. | 4,206 | 246,052 | ||||||
Redington India, Ltd. | 31,968 | 62,155 | ||||||
Tata Consultancy Services, Ltd. | 6,802 | 154,683 | ||||||
|
| |||||||
| 462,890 | ||||||||
|
| |||||||
Software (0.99%) |
| |||||||
HCL Technologies, Ltd. | 4,342 | 39,225 | ||||||
|
| |||||||
TOTAL TECHNOLOGY | 502,115 | |||||||
|
| |||||||
Utilities (0.94%) | ||||||||
Electric (0.94%) |
| |||||||
NTPC, Ltd. | 10,150 | 37,184 | ||||||
|
| |||||||
TOTAL UTILITIES | 37,184 | |||||||
|
| |||||||
TOTAL COMMON STOCKS (Cost $3,823,181) |
| 3,528,292 | ||||||
|
| |||||||
| 7-Day Yield | Shares | Value (Note 1) | ||||||||||
SHORT TERM INVESTMENTS (0.24%) |
| |||||||||||
Money Market Fund (0.24%) |
| |||||||||||
Dreyfus Cash Advantage Fund, Institutional Class | 0.067 | % | 9,491 | $9,491 | ||||||||
|
| |||||||||||
TOTAL SHORT TERM INVESTMENTS (Cost $9,491) |
| 9,491 | ||||||||||
|
| |||||||||||
TOTAL INVESTMENTS (89.47%) (Cost $3,832,672) |
| $ | 3,537,783 | |||||||||
Other Assets In Excess Of |
| 416,280 | ||||||||||
|
| |||||||||||
NET ASSETS (100.00%) |
| $ | 3,954,063 | |||||||||
|
| |||||||||||
| (a) | Non-Income Producing Security. |
Common Abbreviations:
Ltd. - Limited.
For Fund compliance purposes, the Fund’s industry classifications refer to any one or more of the industry subclassifications used by one or more widely recognized market indexes or ratings group indexes, and/or as defined by Fund management. This definition may not apply for purposes of this report, which may combine industry sub-classifications for reporting ease. Industries are shown as a percent of net assets. These industry classifications are based on third party definitions and are unaudited. The definitions are industry terms and do not reflect the legal status of any of the investments or the companies in which the Fund has invested.
FUTURES CONTRACTS
At October 31, 2011, the Fund had outstanding futures contracts:
| Description | Position | Contracts | Expiration Date | Value (Note 1) | Unrealized Appreciation | |||||||||
Induslnd Bank Future | Long | 3 | 11/25/11 | $ | 858,000 | $ | 678 | |||||||
S&P CNX NIFTY Future | Long | 33 | 11/25/11 | 8,822,715 | 2,134 | |||||||||
|
|
|
| |||||||||||
| $ | 9,680,715 | $ | 2,812 | |||||||||||
|
|
|
| |||||||||||
See Notes to Financial Statements.
| 8 | October 31, 2011 |
Table of Contents
| October 31, 2011 (Unaudited)
| |||
Overview
What happens when you mix fear with uncertainty? You get a very anxious, volatile environment. In the case of the world equity markets, you get volatile equity values. Exactly what we experienced in the semi-annual period ending October 31, 2011…and private equity was not immune.
The period started off on a fairly stable, if not upbeat, tone. Yes, there were unresolved problems: ballooning US federal deficits, concern surrounding Greece and the unity of the Euro, gridlock on the political/policy front, stagnating employment, lackluster consumer spending and pockets of input inflation. On the other hand, corporations as a whole were doing well: most were seeing modest revenue growth, some were getting squeezed with higher input costs, but overall margins were stable and bottom line profitability looked good. It was the calm before the storm. What ensued next was overwhelming. The combination of political gridlock in the US over the federal debt level and the lack of a unified approach to resolving the sovereign debt crisis in Europe spelled fear and uncertainty with investors. The new focus: fault lines in the credit markets, widening credit spreads and the soundness of the banking community. The equity, debt, and commodity markets around the globe acted accordingly; a swift and volatile sell-off. The “R” word (as in Recession) was now part of the conversation.
And the private equity markets? How did the asset class fare? Not so well. What had started out as another robust year for growth within their portfolio of private businesses, increases in valuations, good M&A activity and strong realizations, quickly came to an end for most private equity firms. The music had stopped. Not because their portfolio of businesses had seen a reversal in fortune. No, it was the declining equity markets that dragged everything down with it. Like it or not, we live in a very correlated world and private equity, at least in the short term, is not immune to this correlation.
Listed private equity companies, with few exceptions, saw their share price decline significantly. Discounts to stated net asset value widened out to levels not seen since 2009. The performance of the Red Rocks Listed Private Equity Fund (LPEIX) went from +11.13% for the six month period ended June 30, 2011 to -23.34% for the six month period ended October 31, 2011.
What’s perplexing to us is that when we look at listed private equity today vs. 2-3 years ago, we’re seeing the following in the private businesses/investments:
| » | Lower debt levels (leverage) to Earnings Before Taxes, Depreciation and Amortization (EBITDA); |
| » | Debt maturities have been extended with flexible terms; and |
| » | Stable to growing revenue and EBITDA. |
In addition, the listed private equity companies themselves (the holding company level) look equally as healthy:
| » | Commitment levels are much lower and very manageable; |
| » | Credit facilities have been re-negotiated with flexible terms; |
| » | Cash levels are high; |
| » | Valuations are conservative, with uplifts being the norm; and |
| » | Realizations have been quite strong. |
In summary, we believe that things look pretty good. Yet the public markets don’t seem to care or are signaling tough times (very tough times?) ahead for private equity.
Portfolio Review
For the six month period ended October 31, 2011, the Fund’s Class A Shares, LPEFX, returned -23.45% at Net Asset Value, (Class A delivered a net return of -27.61% at MOP), compared with -11.32% and -22.18% for the MSCI World Index and the S&P Listed Private Equity Index, respectively.
During the period we exited seven holdings: Aker ASA, China Merchants, Dinamia, HAL Trust, Investor AB, JAFCO and Marfin. We added six holdings as well: Aurelius, Brookfield Infrastructure Partners, Fosun, Harbourvest, RHJ International and Softbank Corp.
While the share price of most every holding in Fund was negatively impacted during the period, the underlying fundamentals continue to appear quite good. The private businesses are performing well with strong uplifts in values and ongoing liquidity events. Hence, we continue to be pleased with the portfolio.
Net contributors to performance for the period included:
| » | IP Group PLC |
| » | Aurelius AG |
| » | Graphite Enterprise Trust |
Net detractors to performance for the period included:
| » | Euarzeo |
| » | KKR & Co. |
| » | Ratos AB |
| 9 | October 31, 2011 |
Table of Contents
ALPS | Red Rocks Listed Private Equity Fund | ||||
Management Commentary
| October 31, 2011 (Unaudited)
| |||
Looking Ahead
It’s our view that until the issues in the US and Europe are resolved (mainly government policy in nature), we will continue to experience a very nervous equity market; private equity included. Our hope is that more rational minds prevail and our elected officials can fix the self-induced problems and restore confidence.
As always, we appreciate your continued support and interest in Red Rocks and the Listed Private Equity strategy.
Adam Goldman, Co-Portfolio Manager
Past Performance does not guarantee future results.
Performance of $10,000 Initial Investment (as of October 31, 2011)
Comparison of change in value of a $10,000 investment (includes applicable sales loads)
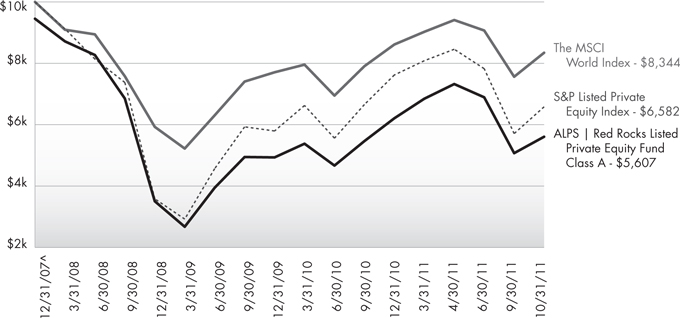
Source: Morningstar
The chart above represents historical performance of a hypothetical investment of $10,000 in the Fund since inception. Past performance does not guarantee future results. This chart does not reflect the deduction of taxes that a shareholder would pay on Fund distributions or the redemption of Fund shares.
| ^ | Fund inception date of 12/31/2007. |
| 10 | October 31, 2011 |
Table of Contents
ALPS | Red Rocks Listed Private Equity Fund | ||||
Management Commentary
| October 31, 2011 (Unaudited)
| |||
| Average Annual Total Returns (as of October 31, 2011) | ||||||||
| 1 Year | Since Inception^ | Total Expense Ratio | What You Pay* | |||||
Class A (NAV)1 | -5.00% | -12.73% | 1.71% | 1.51% | ||||
Class A (MOP)2 | -10.18% | -14.00% | ||||||
Class C (NAV)1 | -5.73% | -13.50% | 2.32% | 2.26% | ||||
Class C (CDSC)2 | -6.62% | -13.50% | ||||||
Class I | -4.66% | -12.46% | 1.37% | 1.26% | ||||
Class R | -5.29% | -13.17% | 1.88% | 1.76% | ||||
MSCI World Index3 | -7.45% | -10.33% | ||||||
S&P LPE Index4 | 1.76% | -4.61% | ||||||
Performance data quoted represents past performance. Past performance does not guarantee future results. Investment return and principal value of an investment will fluctuate so that an investor’s shares, when sold or redeemed, may be worth more or less than the original cost. Current performance data may be higher or lower than actual data quoted. The Fund imposes a 2.00% redemption fee on shares held for less than 90 days. The Fund imposes a maximum Contingent Deferred Sales Charge (“CDSC”) of 1.00% to shares redeemed within the first 12 months after a purchase in excess of $1 million. Performance data does not reflect the redemption fee or the CDSC, which if reflected would reduce the performance quoted. For the most current month-end performance data, please call (866) 759-5679.
Performance shown for Class C shares prior to June 30, 2010 reflects the historical performance of the Fund’s Class A shares, calculated using the fees and expenses of Class C shares.
| 1 | Net Asset Value (NAV) is the share price without sales charges. The performance data shown does not reflect the decution of the sales load or the redemption fee or CDSC, and that, if reflected, the load or fee would reduce the performance quoted. |
| 2 | Maximum Offering Price (MOP) for Class A shares includes the Fund’s maximum sales charge of 5.50%. CDSC performance for Class C shares includes a 1% contingent deferred sales charge (CDSC) on C shares redeemed within 12 months of purchase. Performance shown at NAV does not include these sales charges and would have been lower had it been taken into account. |
| 3 | MSCI World Index: Morgan Stanley Capital International’s market capitalization weighted index is composed of companies representative of the market structure of 22 developed market countries in North America, Europe and the Asia/Pacific Region. The index is not actively managed and does not reflect any deduction for fees, expenses or taxes. An investor may not invest directly in an index. |
| 4 | S&P Listed Private Equity Index: The S&P Listed Private Equity Index is comprised of 30 leading listed private equity companies that meet size, liquidity, exposure, and activity requirements. The index is designed to provide tradable exposure to the leading publicly listed companies in the private equity space. The index is not actively managed and does not reflect any deduction for fees, expenses or taxes. An investor may not invest directly in an index. |
| ^ | Fund inception date of 12/31/2007. |
| * | What You Pay reflects the Adviser’s and Sub-Adviser’s decision to contractually limit expenses through August 31, 2012. Please see the prospectus for additional information. |
The table does not reflect the deduction of taxes that a shareholder would pay on Fund distributions or the redemption of Fund shares.
Listed Private Equity Companies are subject to various risks depending on their underlying investments, which could include, but are not limited to, additional liquidity risk, industry risk, non-U.S. security risk, currency risk, credit risk, managed portfolio risk and derivatives risk (derivatives risk is the risk that the value of the Listed Private Equity Companies’ derivative investments will fall because of pricing difficulties or lack of correlation with the underlying investment).
There are inherent risks in investing in private equity companies, which encompass financial institutions or vehicles whose principal business is to invest in and lend capital to privately held companies. Generally, little public information exists for private and thinly traded companies, and there is a risk that investors may not be able to make a fully informed investment decision.
Listed Private Equity Companies may have relatively concentrated investment portfolios, consisting of a relatively small number of holdings. A consequence of this limited number of investments is that the aggregate returns realized may be adversely impacted by the poor performance of a small number of investments, or even a single investment, particularly if a company experiences the need to write down the value of an investment.
Certain of the Fund’s investments may be exposed to liquidity risk due to low trading volume, lack of a market maker or legal restrictions limiting the ability of the Fund to sell particular securities at an advantageous price and/or time. As a result, these securities may be more difficult to value. Foreign investing involves special risks, such as currency fluctuations and political uncertainty. The Fund invests in derivatives and is subject to the risk that the value of those derivative investments will fall because of pricing difficulties or lack of correlation with the underlying investment.
| 11 | October 31, 2011 |
Table of Contents
ALPS | Red Rocks Listed Private Equity Fund | ||||
Management Commentary
| October 31, 2011 (Unaudited)
| |||
Top Ten Holdings (as a % of Net Assets) † | ||||||
3i Group PLC | 4.71 | % | ||||
KKR & Co. LP | 4.56 | % | ||||
Conversus Capital LP | 4.43 | % | ||||
Eurazeo | 4.42 | % | ||||
Wendel Investissement | 4.38 | % | ||||
Blackstone Group LP | 4.30 | % | ||||
SVG Capital PLC | 3.78 | % | ||||
AP Alternative Assets LP | 3.74 | % | ||||
Onex Corp. | 3.73 | % | ||||
Electra Private Equity PLC | 3.58 | % | ||||
Top Ten Holdings | 41.63 | % | ||||
| † | Holdings are subject to change. |
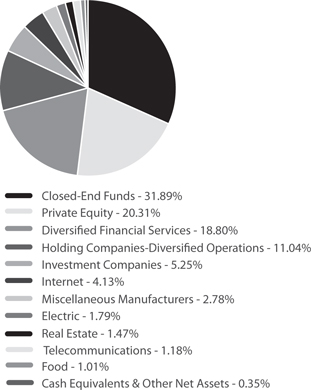
Industry Sector Allocation (as a % of Net Assets)
| 12 | October 31, 2011 |
Table of Contents
ALPS | Red Rocks Listed Private Equity Fund | ||||
| October 31, 2011 (Unaudited)
| |||
As a shareholder of the Fund, you will incur two types of costs: (1) transaction costs, including applicable sales charges (loads) and redemption fees; and (2) ongoing costs, including management fees, distribution and service (12b-1) fees, shareholder service fees and other Fund expenses. The following examples are intended to help you understand your ongoing costs (in dollars) of investing in the Fund and to compare these costs with the ongoing costs of investing in other mutual funds. The examples are based on an investment of $1,000 invested on May 1, 2011 and held until October 31, 2011.
Actual Expenses. The first line of the table on the next page provides information about actual account values and actual expenses. You may use the information in this line, together with the amount you invested, to estimate the expenses that you paid over the period. Simply divide your account value by $1,000 (for example, an $8,600 account value divided by $1,000 = 8.6), then multiply the result by the number in the first line under the heading “Expense Paid During Period” to estimate the expenses you paid on your account during this period.
Hypothetical Example for Comparison Purposes. The second line of the table on the next page provides information about hypothetical account values and hypothetical expenses based on the Fund’s actual expense ratio and an assumed rate of return of 5% per year before expenses, which is not the Fund’s actual return. The hypothetical account values and expenses may not be used to estimate the actual ending account balance or expenses you paid for the period. You may use this information to compare the ongoing costs of investing in the Fund and other mutual funds. To do so, compare this 5% hypothetical example with the 5% hypothetical examples that appear in the shareholder reports of the other funds.
The expenses shown in the table are meant to highlight ongoing Fund costs only and do not reflect transaction fees, such as sales charges, redemption fees, or exchange fees. Therefore, the second line of the table on the next page is useful in comparing ongoing costs only, and may not help you determine the relative total costs of owning different funds. In addition, if these transactional costs were included, your costs would have been higher.
| Beginning Account Value 5/1/11 | Ending Account Value 10/31/11 | Expense Ratio(a) | Expense Paid During Period(b) 5/1/11 - 10/31/11 | |||||||||||||
Class A | ||||||||||||||||
Actual | $ | 1,000.00 | $ | 765.50 | 1.50 | % | $ | 6.66 | ||||||||
Hypothetical (5% return before expenses) | $ | 1,000.00 | $ | 1,017.60 | 1.50 | % | $ | 7.61 | ||||||||
Class C | ||||||||||||||||
Actual | $ | 1,000.00 | $ | 761.80 | 2.25 | % | $ | 9.96 | ||||||||
Hypothetical (5% return before expenses) | $ | 1,000.00 | $ | 1,013.83 | 2.25 | % | $ | 11.39 | ||||||||
Class I | ||||||||||||||||
Actual | $ | 1,000.00 | $ | 766.60 | 1.25 | % | $ | 5.55 | ||||||||
Hypothetical (5% return before expenses) | $ | 1,000.00 | $ | 1,018.85 | 1.25 | % | $ | 6.34 | ||||||||
Class R | ||||||||||||||||
Actual | $ | 1,000.00 | $ | 763.30 | 1.75 | % | $ | 7.76 | ||||||||
Hypothetical (5% return before expenses) | $ | 1,000.00 | $ | 1,016.34 | 1.75 | % | $ | 8.87 | ||||||||
| (a) | The Fund’s expense ratios have been based on the Fund’s most recent fiscal half-year expenses. |
| (b) | Expenses are equal to the Fund’s annualized expense ratio multiplied by the average account value over the period, multiplied by the number of days in the most recent fiscal half year (184), then divided by 366. |
| 13 | October 31, 2011 |
Table of Contents
ALPS | Red Rocks Listed Private Equity Fund | ||||
| October 31, 2011 (Unaudited)
| |||
| Shares | Value (Note 1) | |||||||
COMMON STOCKS (99.65%) |
| |||||||
Communications (5.31%) |
| |||||||
Internet (4.13%) |
| |||||||
Internet Capital Group, Inc.(a) | 207,000 | $2,233,530 | ||||||
Safeguard Scientifics, Inc.(a) | 199,000 | 3,365,090 | ||||||
|
| |||||||
| 5,598,620 | ||||||||
|
| |||||||
Telecommunications (1.18%) |
| |||||||
Softbank Corp. | 48,200 | 1,595,569 | ||||||
|
| |||||||
TOTAL COMMUNICATIONS | 7,194,189 | |||||||
|
| |||||||
Consumer, Non-cyclical (1.01%) |
| |||||||
Food (1.01%) |
| |||||||
Orkla ASA | 157,000 | 1,367,277 | ||||||
|
| |||||||
TOTAL CONSUMER, NON-CYCLICAL | 1,367,277 | |||||||
|
| |||||||
Diversified (11.04%) | ||||||||
Holding Companies-Diversified Operations (11.04%) |
| |||||||
Ackermans & van Haaren N.V. | 28,200 | 2,285,031 | ||||||
Leucadia National Corp. | 94,500 | 2,535,435 | ||||||
Remgro, Ltd. | 128,000 | 1,943,671 | ||||||
Schouw & Co. | 103,332 | 2,257,793 | ||||||
Wendel Investissement | 79,500 | 5,935,824 | ||||||
|
| |||||||
TOTAL DIVERSIFIED | 14,957,754 | |||||||
|
| |||||||
Financials (77.72%) |
| |||||||
Closed-End Funds (31.89%) |
| |||||||
AP Alternative Assets LP | 524,835 | 5,064,658 | ||||||
ARC Capital Holdings, Ltd.(a) | 2,469,000 | 1,754,718 | ||||||
Candover Investments PLC(a) | 148,000 | 1,166,048 | ||||||
Castle Private Equity, Ltd.(a) | 212,000 | 2,089,086 | ||||||
Conversus Capital LP | 294,000 | 5,997,600 | ||||||
Electra Private Equity PLC(a) | 199,267 | 4,850,871 | ||||||
Graphite Enterprise Trust PLC | 574,797 | 3,484,290 | ||||||
HarbourVest Global Private Equity, Ltd.(a) | 94,000 | 629,800 | ||||||
HBM BioVentures AG, Class A(a) | 41,784 | 1,999,234 | ||||||
HgCapital Trust PLC | 154,648 | 2,541,287 | ||||||
HgCapital Trust PLC(a) | 57,520 | 106,239 | ||||||
Pantheon International Participations PLC(a) | 203,389 | 2,125,687 | ||||||
Pantheon International Participations PLC(a) | 129,000 | 1,306,739 | ||||||
Princess Private Equity Holding, Ltd. | 469,388 | 4,007,367 | ||||||
Standard Life European Private Equity Trust PLC | 482,308 | 946,113 | ||||||
SVG Capital PLC(a) | 1,515,000 | 5,125,271 | ||||||
|
| |||||||
| 43,195,008 | ||||||||
|
| |||||||
| Shares | Value (Note 1) | |||||||
Diversified Financial Services (18.80%) |
| |||||||
Blackstone Group LP | 395,700 | $5,820,747 | ||||||
GP Investments, Ltd.(a) | 748,000 | 2,021,563 | ||||||
Intermediate Capital Group PLC | 1,090,000 | 4,286,881 | ||||||
KKR & Co. LP | 458,000 | 6,173,840 | ||||||
Onex Corp. | 152,500 | 5,056,559 | ||||||
Partners Group Holding AG | 11,200 | 2,098,883 | ||||||
|
| |||||||
| 25,458,473 | ||||||||
|
| |||||||
Investment Companies (5.25%) |
| |||||||
LMS Capital PLC(a) | 1,322,446 | 1,254,551 | ||||||
Ratos AB, B Shares | 345,000 | 4,615,916 | ||||||
RHJ International SA(a) | 232,776 | 1,124,102 | ||||||
THL Credit, Inc. | 10,378 | 119,866 | ||||||
|
| |||||||
| 7,114,435 | ||||||||
|
| |||||||
Private Equity (20.31%) |
| |||||||
3i Group PLC | 1,930,000 | 6,380,268 | ||||||
Altamir Amboise(a) | 316,000 | 2,925,197 | ||||||
Apollo Global Management LLC, Class A | 219,000 | 2,901,750 | ||||||
Aurelius AG | 40,259 | 1,638,325 | ||||||
Bure Equity AB(a) | 359,000 | 1,063,100 | ||||||
Deutsche Beteiligungs AG | 81,900 | 1,756,538 | ||||||
Eurazeo | 124,800 | 5,989,606 | ||||||
GIMV N.V. | 75,200 | 3,844,804 | ||||||
IP Group PLC(a) | 902,376 | 1,015,650 | ||||||
|
| |||||||
| 27,515,238 | ||||||||
|
| |||||||
Real Estate (1.47%) |
| |||||||
Brookfield Asset Management, Inc., Class A | 68,800 | 1,995,200 | ||||||
|
| |||||||
TOTAL FINANCIALS | 105,278,354 | |||||||
|
| |||||||
Industrials (2.78%) |
| |||||||
Miscellaneous Manufacturers (2.78%) |
| |||||||
Fosun International, Ltd. | 6,563,000 | 3,767,761 | ||||||
|
| |||||||
TOTAL INDUSTRIALS | 3,767,761 | |||||||
|
| |||||||
Utilities (1.79%) |
| |||||||
Electric (1.79%) |
| |||||||
Brookfield Infrastructure Partners LP | 96,800 | 2,428,712 | ||||||
|
| |||||||
TOTAL UTILITIES | 2,428,712 | |||||||
|
| |||||||
TOTAL COMMON STOCKS (Cost $135,864,659) |
| 134,994,047 | ||||||
|
| |||||||
| 14 | October 31, 2011 |
Table of Contents
ALPS | Red Rocks Listed Private Equity Fund | ||||
Statement of Investments
| October 31, 2011 (Unaudited)
| |||
| 7-Day Yield | Shares | Value (Note 1) | |||||||||
SHORT TERM INVESTMENTS (0.24%) |
| |||||||||||
Money Market Fund (0.24%) |
| |||||||||||
Dreyfus Treasury Prime Cash Management, Investor Shares | 0.00004 | % | 322,282 | $322,282 | ||||||||
|
| |||||||||||
TOTAL SHORT TERM INVESTMENTS (Cost $322,282) |
| 322,282 | ||||||||||
|
| |||||||||||
TOTAL INVESTMENTS (99.89%) (Cost $136,186,941) |
| $ | 135,316,329 | |||||||||
Other Assets In Excess Of Liabilities (0.11%) |
| 148,485 | ||||||||||
|
| |||||||||||
NET ASSETS (100.00%) |
| $ | 135,464,814 | |||||||||
|
| |||||||||||
| (a) | Non-Income Producing Security. |
Common Abbreviations:
| AB | - Aktiebolag is the Swedish equivalent of the term corporation. |
| AG | - Aktiengesellschaft is a German term that refers to a corporation that is |
| limited | by shares, i.e., owned by shareholders. |
| ASA | - Allmennaksjeselskap is the Norwegian term for a public company. |
| LLC | - Limited Liability Company. |
| LP | - Limited Partnership. |
| Ltd. | - Limited. |
| N.V. | - Naamloze Vennootschap is the Dutch term for a public limited liability |
| corporation. |
| PLC | - Public Limited Company. |
| SA | - Generally designates corporations in various countries, mostly those |
| employing | the civil law. This translates literally in all languages |
| mentioned | as anonymous company. |
For Fund compliance purposes, the Fund’s industry classifications refer to any one or more of the industry sub-classifications used by one or more widely recognized market indexes or ratings group indexes, and/ or as defined by Fund management. This definition may not apply for purposes of this report, which may combine industry sub-classifications for reporting ease. Industries are shown as a percent of net assets. These industry classifications are based on third party definitions and are unaudited. The definitions are industry terms and do not reflect the legal status of any of the investments or the companies in which the Fund has invested.
See Notes to Financial Statements.
| 15 | October 31, 2011 |
Table of Contents
| October 31, 2011 (Unaudited)
| |||
Market Comment
Upheaval shook global asset markets during the period as prices for most risk assets fell sharply starting in late July. Investors transitioned from excitement over economic strength and the recovery in corporate earnings to apprehension over the risks to global growth. The primary catalysts behind this shift were the European sovereign debt crisis, US political gridlock, falling consumer confidence, and concerns over sustained growth in emerging markets. Markets rallied in the final month of the period as improving US economic data and optimism related to a resolution of the ongoing European debt crisis lifted investor sentiment, but this was not enough to offset negative returns earlier in the period.
Within the Russell 1000 Value Index, eight of ten sectors posted negative returns, with the traditionally defensive Utilities and Consumer Staples sectors managing gains. Materials -17.7%, Financials -17.1%, and Industrials -13.5% were the worst performing sectors for the period.
Fund Review
The Portfolio underperformed its benchmark for the period, posting positive relative results in two out of ten broad market sectors. Overall, stock selection was negative relative to the Russell 1000 Value Index, as decisions in Financials, Utilities, and Materials more than offset positive relative performance in Information Technology and Consumer Staples.
Detractors to performance for the period included Intel (Information Technology), Bank of America (Financials), and Hartford Financial Services (Financials). Intel, a leading manufacturer of semiconductors for computing and communications, rose over the period as solid global PC sales and the company’s manufacturing advantages were perceived positively by investors. Not owning the stock detracted from relative results. Bank of America, a large US-based multinational financial services firm, declined amid negative headlines regarding litigation uncertainty related to its ownership of Countrywide Financial. Hartford Financial Services, a provider of insurance and financial services products, declined over the period as the firm’s results disappointed due to higher-than-normal catastrophe losses and a large reserve charge.
Top contributors to relative performance included Citigroup (Financials), Apple (Information Technology), and Kimberly-Clark (Consumer Staples). Citigroup, a global financial services company, reduced estimates on higher expenses and saw continued growth weakness in securities/banking and domestic consumer banking. Not holding the stock during the period contributed to performance. Apple is a designer, manufacturer, and retailer of a range of personal electronics products. The company remains a dominant leader in personal communication devices, and we believe longer-term opportunities such as expanded distribution in China, an expanding tablet market, and the potential to enter the Smart TV market should continue to support outperformance in the stock. Kimberly-Clark, a global manufacturer of consumer products, benefited from the company’s relatively stable revenue and earnings profile in a weak market environment, as well as a modest pullback in pulp prices. Our overweight position contributed to performance during the period.
Outlook
Equity markets struggled for the period, and the overhangs that caused much of the market turmoil still exist. The European sovereign debt crisis and US budget deficit issues have raised concerns about the economy falling into a double dip recession. These fears are exacerbated by concerns surrounding the overall health of the banking system.
We believe that both the European sovereign debt crisis and the US budget deficit will eventually have positive outcomes. However, the combination of these two overhangs will likely mean that developed economies are going to grow at a slower pace than they have in the past. We believe emerging economies are in reasonably good health and should continue to grow. From a global perspective, considering both developed and emerging economies, economic growth could be similar to what it was in the past; the difference being that the growth is now coming from emerging markets and not from developed markets.
| 16 | October 31, 2011 |
Table of Contents
ALPS | WMC Value Intersection Fund | ||||
Management Commentary
| October 31, 2011 (Unaudited)
| |||
Performance of $10,000 Initial Investment (as of October 31, 2011)
Comparison of change in value of a $10,000 investment (includes applicable sales loads)

Source: Morningstar
The chart above represents historical performance of a hypothetical investment of $10,000 in the Fund since inception. Past performance does not guarantee future results. This chart does not reflect the deduction of taxes that a shareholder would pay on Fund distributions or the redemption of Fund shares.
| 17 | October 31, 2011 |
Table of Contents
ALPS | WMC Value Intersection Fund | ||||
Management Commentary
| October 31, 2011 (Unaudited)
| |||
Average Annual Total Returns (as of October 31, 2011)
| 1 Year | 5 Year | 10 Year | Total Expense Ratio | What You Pay* | ||||||
Class A (NAV)1 | 4.76% | -2.07% | 3.75% | 1.71% | 1.40% | |||||
Class A (MOP)2 | -1.04% | -3.17% | 3.16% | |||||||
Class C (NAV)1 | 3.85% | -2.80% | 2.98% | 2.49% | 2.15% | |||||
Class C (CDSC)2 | 2.85% | -2.80% | 2.98% | |||||||
Class I | 5.01% | -1.86% | 3.91% | 1.46% | 1.15% | |||||
Russell 1000 Value Index3 | 6.16% | -2.05% | 4.57% | |||||||
S&P 500 Index4 | 8.09% | 0.25% | 3.69% |
Performance data quoted represents past performance. Past performance does not guarantee future results. Investment return and principal value of an investment will fluctuate so that an investor’s shares, when sold or redeemed, may be worth more or less than the original cost. Current performance data may be higher or lower than actual data quoted. The Fund imposes a maximum Contingent Deferred Sales Charge (“CDSC”) of 1.00% to shares redeemed within the first 12 months after a purchase in excess of $1 million. Performance data does not reflect the CDSC, which if reflected would reduce the performance quoted. For the most current month-end performance data, please call (866) 759-5679.
Performance shown for Class C shares prior to June 30, 2010 reflects the historical performance of the Fund’s Class A shares, calculated using the fees and expenses of Class C shares.
The performance shown for the ALPS | WMC Value Intersection Fund (the “Fund”) for periods prior to August 29, 2009, reflects the performance of the Activa Mutual Funds Trust – Activa Value Fund (as result of a prior reorganization of Activa Mutual Funds Trust – Activa Value Fund into the Fund).
| 1 | Net Asset Value (NAV) is the share price without sales charges. |
| 2 | Maximum Offering Price (MOP) for Class A shares includes the Fund’s maximum sales charge of 5.50%. CDSC performance for Class C shares includes a 1% CDSC on C shares redeemed within 12 months of purchase. Performance shown at NAV does not include these sales charges and would have been lower had it been taken into account. |
| 3 | The Russell 1000 Value Index measures the performance of those Russell 1000 companies with lower price-to-book ratios and lower forecasted growth values. The index is not actively managed and does not reflect any deduction for fees, expenses or taxes. An investor may not invest directly in an index. |
| 4 | The S&P 500 Index is the Standard & Poor’s composite index of 500 stocks, a widely recognized, unmanaged index of common stock prices. The index is not actively managed and does not reflect any deduction for fees, expenses or taxes. An investor may not invest directly in an index. |
| * | What You Pay reflects the Adviser’s decision to contractually limit expenses through August 31, 2012. Please see the prospectus for additional information. |
The table does not reflect the deduction of taxes that a shareholder would pay on Fund distributions or the redemption of Fund shares.
Mutual funds, annuities and other investments are not insured or guaranteed by the FDIC or by any other government agency or government sponsored agency of the federal government or any state, not deposits, obligations or guaranteed by any bank or its affiliates and are subject to investment risks, including possible loss of the principal amount invested.
There is no guarantee that the Fund will continue to hold any one particular security or stay invested in any one particular company. The composition of the Fund’s top holdings is subject to change. Performance figures are historical and reflect the change in share price, reinvested distributions, changes in net asset value, sales charges and capital gains distributions, if any.
Investing in the Fund is subject to investment risks, including possible loss of the principal amount invested. Derivatives generally are more sensitive to changes in economic or market conditions than other types of investments; this could result in losses that significantly exceed the Fund’s original investment.
| 18 | October 31, 2011 |
Table of Contents
ALPS | WMC Value Intersection Fund | ||||
Management Commentary
| October 31, 2011 (Unaudited)
| |||
Top Ten Holdings (as a % of Net Assets) †
Chevron Corp. | 3.25 | % | ||||
Wells Fargo & Co. | 2.97 | % | ||||
JPMorgan Chase & Co. | 2.85 | % | ||||
Pfizer, Inc. | 2.75 | % | ||||
Merck & Co., Inc. | 2.67 | % | ||||
Cisco Systems, Inc. | 2.12 | % | ||||
AT&T, Inc. | 2.09 | % | ||||
Occidental Petroleum Corp. | 1.89 | % | ||||
Kimberly-Clark Corp. | 1.78 | % | ||||
Bank of America Corp. | 1.63 | % | ||||
Top Ten Holdings | 24.00 | % |
| † | Holdings are subject to change. |
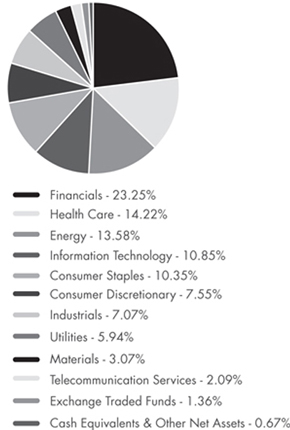
Industry Sector Allocation (as a % of Net Assets)
| 19 | October 31, 2011 |
Table of Contents
ALPS | WMC Value Intersection Fund | ||||
| October 31, 2011 (Unaudited)
| |||
As a shareholder of the Fund, you will incur two types of costs: (1) transaction costs, including applicable sales charges (loads); and (2) ongoing costs, including management fees, distribution and service (12b-1) fees, shareholder service fees and other Fund expenses. The following examples are intended to help you understand your ongoing costs (in dollars) of investing in the Fund and to compare these costs with the ongoing costs of investing in other mutual funds. The examples are based on an investment of $1,000 invested on May 1, 2011 and held until October 31, 2011.
Actual Expenses. The first line of the table on the next page provides information about actual account values and actual expenses. You may use the information in this line, together with the amount you invested, to estimate the expenses that you paid over the period. Simply divide your account value by $1,000 (for example, an $8,600 account value divided by $1,000 = 8.6), then multiply the result by the number in the first line under the heading “Expense Paid During Period” to estimate the expenses you paid on your account during this period.
Hypothetical Example for Comparison Purposes. The second line of the table on the next page provides information about hypothetical account values and hypothetical expenses based on the Fund’s actual expense ratio and an assumed rate of return of 5% per year before expenses, which is not the Fund’s actual return. The hypothetical account values and expenses may not be used to estimate the actual ending account balance or expenses you paid for the period. You may use this information to compare the ongoing costs of investing in the Fund and other mutual funds. To do so, compare this 5% hypothetical example with the 5% hypothetical examples that appear in the shareholder reports of the other funds.
The expenses shown in the table are meant to highlight ongoing Fund costs only and do not reflect transaction fees, such as sales charges or exchange fees. Therefore, the second line of the table on the next page is useful in comparing ongoing costs only, and may not help you determine the relative total costs of owning different funds. In addition, if these transactional costs were included, your costs would have been higher.
| Beginning Account Value 5/1/11 | Ending Account Value 10/31/11 | Expense Ratio(a) | Expense Paid During Period(b) 5/1/11 - 10/31/11 | |||||||||||||||||
Class A | ||||||||||||||||||||
Actual | $ | 1,000.00 | $ | 881.90 | 1.40 | % | $ | 6.62 | ||||||||||||
Hypothetical (5% return before expenses) | $ | 1,000.00 | $ | 1,018.10 | 1.40 | % | $ | 7.10 | ||||||||||||
Class C | ||||||||||||||||||||
Actual | $ | 1,000.00 | $ | 878.20 | 2.15 | % | $ | 10.15 | ||||||||||||
Hypothetical (5% return before expenses) | $ | 1,000.00 | $ | 1,014.33 | 2.15 | % | $ | 10.89 | ||||||||||||
Class I | ||||||||||||||||||||
Actual | $ | 1,000.00 | $ | 882.90 | 1.15 | % | $ | 5.44 | ||||||||||||
Hypothetical (5% return before expenses) | $ | 1,000.00 | $ | 1,019.36 | 1.15 | % | $ | 5.84 | ||||||||||||
| (a) | The Fund’s expense ratios have been based on the Fund’s most recent fiscal half-year expenses. |
| (b) | Expenses are equal to the Fund’s annualized expense ratio multiplied by the average account value over the period, multiplied by the number of days in the most recent fiscal half year (184), then divided by 366. |
| 20 | October 31, 2011 |
Table of Contents
ALPS | WMC Value Intersection Fund | ||||
| October 31, 2011 (Unaudited)
| |||
| Shares | Value (Note 1) | ||||||
COMMON STOCKS (97.97%) |
| |||||||
Consumer Discretionary (7.55%) |
| |||||||
Automobiles & Components (1.73%) |
| |||||||
Ford Motor Co.(a) | 55,200 | $644,736 | ||||||
TRW Automotive Holdings | 12,820 | 539,722 | ||||||
|
| |||||||
| 1,184,458 | ||||||||
|
| |||||||
Consumer Durables & Apparel (1.06%) |
| |||||||
PVH Corp. | 9,680 | 720,289 | ||||||
|
| |||||||
Consumer Services (0.82%) |
| |||||||
Carnival Corp. | 15,990 | 563,008 | ||||||
|
| |||||||
Media (1.07%) |
| |||||||
News Corp., Class A | 41,500 | 727,080 | ||||||
|
| |||||||
Retailing (2.87%) |
| |||||||
Abercrombie & Fitch Co., Class A | 8,660 | 644,304 | ||||||
Lowe’s Cos., Inc. | 28,270 | 594,235 | ||||||
TJX Cos., Inc. | 12,260 | 722,482 | ||||||
|
| |||||||
| 1,961,021 | ||||||||
|
| |||||||
TOTAL CONSUMER DISCRETIONARY |
| 5,155,856 | ||||||
|
| |||||||
Consumer Staples (10.35%) |
| |||||||
Food & Staples Retailing (1.27%) |
| |||||||
CVS Caremark Corp. | 23,930 | 868,659 | ||||||
|
| |||||||
Food Beverage & Tobacco (6.12%) |
| |||||||
Altria Group, Inc. | 32,140 | 885,457 | ||||||
Dr Pepper Snapple Group, Inc. | 15,630 | 585,343 | ||||||
The JM Smucker Co. | 10,060 | 774,821 | ||||||
Lorillard, Inc. | 9,400 | 1,040,204 | ||||||
Philip Morris International, Inc. | 12,785 | 893,288 | ||||||
|
| |||||||
| 4,179,113 | ||||||||
|
| |||||||
Household & Personal Products (2.96%) |
| |||||||
Energizer Holdings, Inc.(a) | 10,850 | 800,622 | ||||||
Kimberly-Clark Corp. | 17,440 | 1,215,742 | ||||||
|
| |||||||
| 2,016,364 | ||||||||
|
| |||||||
TOTAL CONSUMER STAPLES |
| 7,064,136 | ||||||
|
| |||||||
| Shares | Value (Note 1) | ||||||
Energy (13.58%) |
| |||||||
Energy (13.58%) |
| |||||||
Anadarko Petroleum Corp. | 13,200 | $1,036,200 | ||||||
Baker Hughes, Inc. | 12,000 | 695,880 | ||||||
Chesapeake Energy Corp. | 21,500 | 604,580 | ||||||
Chevron Corp. | 21,119 | 2,218,551 | ||||||
Exxon Mobil Corp. | 12,564 | 981,123 | ||||||
Hess Corp. | 11,100 | 694,416 | ||||||
Marathon Oil Corp. | 24,700 | 642,941 | ||||||
Marathon Petroleum Corp. | 12,350 | 443,365 | ||||||
National Oilwell Varco, Inc. | 9,275 | 661,585 | ||||||
Occidental Petroleum Corp. | 13,900 | 1,291,866 | ||||||
|
| |||||||
TOTAL ENERGY | 9,270,507 | |||||||
|
| |||||||
Financials (23.25%) |
| |||||||
Banks (6.59%) |
| |||||||
BB&T Corp. | 27,610 | 644,418 | ||||||
PNC Financial Services Group, Inc. | 13,400 | 719,714 | ||||||
US Bancorp | 43,270 | 1,107,279 | ||||||
Wells Fargo & Co. | 78,200 | 2,026,162 | ||||||
|
| |||||||
| 4,497,573 | ||||||||
|
| |||||||
Diversified Financials (10.18%) |
| |||||||
Ameriprise Financial, Inc. | 20,400 | 952,272 | ||||||
Bank of America Corp. | 162,862 | 1,112,347 | ||||||
BlackRock, Inc. | 1,900 | 299,801 | ||||||
The Goldman Sachs Group, Inc. | 9,880 | 1,082,354 | ||||||
Invesco, Ltd. | 28,200 | 565,974 | ||||||
JPMorgan Chase & Co. | 55,900 | 1,943,084 | ||||||
The NASDAQ OMX Group, Inc.(a) | 23,020 | 576,651 | ||||||
SLM Corp. | 30,500 | 416,935 | ||||||
|
| |||||||
| 6,949,418 | ||||||||
|
| |||||||
Insurance (5.50%) |
| |||||||
ACE, Ltd. | 15,300 | 1,103,895 | ||||||
Allied World Assurance Co. Holdings, Ltd. | 8,900 | 517,090 | ||||||
Hartford Financial Services Group, Inc. | 34,860 | 671,055 | ||||||
MetLife, Inc. | 14,000 | 492,240 | ||||||
Prudential Financial, Inc. | 11,400 | 617,880 | ||||||
Unum Group | 14,800 | 352,832 | ||||||
|
| |||||||
| 3,754,992 | ||||||||
|
| |||||||
Real Estate (0.98%) |
| |||||||
Forest City Enterprises, Inc., Class A(a) | 49,100 | 671,688 | ||||||
|
| |||||||
TOTAL FINANCIALS | 15,873,671 | |||||||
|
| |||||||
| 21 | October 31, 2011 |
Table of Contents
ALPS | WMC Value Intersection Fund | ||||
Statement of Investments
| October 31, 2011 (Unaudited)
| |||
| Shares | Value (Note 1) | ||||||
Health Care (14.22%) |
| |||||||
Health Care Equipment & Services (4.06%) |
| |||||||
Aetna, Inc. | 15,700 | $624,232 | ||||||
Covidien PLC | 12,030 | 565,891 | ||||||
McKesson Corp. | 5,970 | 486,853 | ||||||
UnitedHealth Group, Inc. | 22,830 | 1,095,612 | ||||||
|
| |||||||
| 2,772,588 | ||||||||
|
| |||||||
Pharmaceuticals, Biotechnology & Life Sciences (10.16%) |
| |||||||
Amgen, Inc. | 16,190 | 927,201 | ||||||
Forest Laboratories, Inc.(a) | 12,228 | 382,737 | ||||||
Gilead Sciences, Inc.(a) | 9,510 | 396,187 | ||||||
Merck & Co., Inc. | 52,870 | 1,824,015 | ||||||
Pfizer, Inc. | 97,623 | 1,880,219 | ||||||
Thermo Fisher Scientific, | 13,760 | 691,715 | ||||||
Watson Pharmaceuticals, Inc.(a) | 12,450 | 836,142 | ||||||
|
| |||||||
| 6,938,216 | ||||||||
|
| |||||||
TOTAL HEALTH CARE |
| 9,710,804 | ||||||
|
| |||||||
Industrials (7.07%) |
| |||||||
Capital Goods (6.03%) |
| |||||||
3M Co. | 5,980 | 472,540 | ||||||
The Boeing Co. | 8,070 | 530,925 | ||||||
Caterpillar, Inc. | 6,080 | 574,317 | ||||||
Dover Corp. | 10,150 | 563,629 | ||||||
Northrop Grumman Corp. | 10,400 | 600,600 | ||||||
Parker Hannifin Corp. | 6,270 | 511,319 | ||||||
United Technologies Corp. | 11,050 | 861,679 | ||||||
|
| |||||||
| 4,115,009 | ||||||||
|
| |||||||
Commercial & Professional Services (1.04%) |
| |||||||
Towers Watson & Co., Class A | 10,830 | 711,531 | ||||||
|
| |||||||
TOTAL INDUSTRIALS | 4,826,540 | |||||||
|
| |||||||
Information Technology (10.85%) |
| |||||||
Semiconductors & Semiconductor Equipment (0.51%) |
| |||||||
Xilinx, Inc. | 10,420 | 348,653 | ||||||
|
| |||||||
Software & Services (6.98%) |
| |||||||
Accenture PLC, Class A | 12,310 | 741,801 | ||||||
Activision Blizzard, Inc. | 46,150 | 617,948 | ||||||
eBay, Inc.(a) | 25,550 | 813,256 | ||||||
Oracle Corp. | 18,780 | 615,421 | ||||||
Solera Holdings, Inc. | 9,430 | 515,161 | ||||||
Teradata Corp.(a) | 8,080 | 482,053 | ||||||
Visa, Inc., Class A | 6,440 | 600,594 | ||||||
The Western Union Co. | 21,680 | 378,750 | ||||||
|
| |||||||
| 4,764,984 | ||||||||
|
| |||||||
| Shares | Value (Note 1) | ||||||
Technology Hardware & Equipment (3.36%) |
| |||||||
Apple, Inc.(a) | 2,090 | $845,990 | ||||||
Cisco Systems, Inc. | 78,280 | 1,450,529 | ||||||
|
| |||||||
| 2,296,519 | ||||||||
|
| |||||||
TOTAL INFORMATION TECHNOLOGY |
| 7,410,156 | ||||||
|
| |||||||
Materials (3.07%) |
| |||||||
Materials (3.07%) |
| |||||||
The Dow Chemical Co. | 37,788 | 1,053,530 | ||||||
The Mosaic Co. | 6,520 | 381,811 | ||||||
Newmont Mining Corp. | 9,871 | 659,679 | ||||||
|
| |||||||
TOTAL MATERIALS |
| 2,095,020 | ||||||
|
| |||||||
Telecommunication Services (2.09%) |
| |||||||
Telecommunication Services (2.09%) |
| |||||||
AT&T, Inc. | 48,675 | 1,426,664 | ||||||
|
| |||||||
TOTAL TELECOMMUNICATION SERVICES |
| 1,426,664 | ||||||
|
| |||||||
Utilities (5.94%) |
| |||||||
Utilities (5.94%) |
| |||||||
American Electric Power Co., Inc | 21,600 | 848,448 | ||||||
NextEra Energy, Inc. | 19,030 | 1,073,292 | ||||||
PG&E Corp. | 25,240 | 1,082,796 | ||||||
Xcel Energy, Inc. | 40,680 | 1,051,578 | ||||||
|
| |||||||
TOTAL UTILITIES | 4,056,114 | |||||||
|
| |||||||
TOTAL COMMON STOCKS (Cost $61,391,960) |
| 66,889,468 | ||||||
|
| |||||||
EXCHANGE TRADED FUNDS (1.36%) |
| |||||||
Equity Fund (1.36%) |
| |||||||
iShares® Russell 1000® Value Index Fund | 14,710 | 927,759 | ||||||
|
| |||||||
TOTAL EXCHANGE TRADED FUNDS (Cost $878,021) |
| 927,759 | ||||||
|
| |||||||
7-Day Yield | Shares | Value (Note 1) | ||||||
SHORT TERM INVESTMENTS (0.25%) |
| |||||||
Money Market Fund (0.25%) |
| |||||||
Fidelity Institutional Money Market Portfolio - Class I 0.149% | 169,609 | 169,609 | ||||||
|
| |||||||
TOTAL SHORT TERM INVESTMENTS (Cost $169,609) |
| 169,609 | ||||||
|
| |||||||
| 22 | October 31, 2011 |
Table of Contents
ALPS | WMC Value Intersection Fund | ||||
Statement of Investments
| October 31, 2011 (Unaudited)
| |||
| Value (Note 1) | |||
TOTAL INVESTMENTS (99.58%) (Cost $62,439,590) | $ | 67,986,836 | ||
Other Assets In Excess Of Liabilities (0.42%) | 286,409 | |||
|
| |||
NET ASSETS (100.00%) | $ | 68,273,245 | ||
|
| |||
| (a) | Non-Income Producing Security. |
Common Abbreviations:
Ltd. - Limited.
PLC - Public Limited Company.
For Fund compliance purposes, the Fund’s industry classifications refer to any one or more of the industry subclassifications used by one or more widely recognized market indexes or ratings group indexes, and/or as defined by Fund management. This definition may not apply for purposes of this report, which may combine industry sub-classifications for reporting ease. Industries are shown as a percent of net assets. These industry classifications are based on third party definitions and are unaudited. The definitions are industry terms and do not reflect the legal status of any of the investments or the companies in which the Fund has invested.
See Notes to Financial Statements.
| 23 | October 31, 2011 |
Table of Contents
| October 31, 2011 (Unaudited)
| |||
During the six month period under review ending October 31, the Clough Capital China Fund fell 18.11% or roughly in line with the MSCI China index which declined 18.50% over the same period.
Investment Environment
With investors becoming more and more concerned about the financial turmoil in Europe and the US economic recovery being hampered by high unemployment, fears of global contagion and risk aversion severely pressured stock markets all around the world. China was no exception particularly as specific concerns over Chinese economic growth and the health of its financial system emerged. The fact that some of these concerns were sometimes contradictory added to market’s volatility. For instance, doubts on the government’s ability to rein in inflation and property price increases were quickly replaced by fears that Beijing’s policy tightening was too harsh, and that a sharp slowdown in economic growth due to lower external demand depressing exports and delayed capital spending on infrastructure projects such as new nuclear power plants, after the Fukushima disaster in Japan, and high speed railway expansion, post the train accident last July would trigger an economic “hard landing”. Reports of investment trust financing of real estate projects also grabbed market attention and spread concerns over “shadow” banking and the opacity of real debts in the system. The challenges faced by many small and midsize enterprises (SMEs) to secure access to bank lending – not a new problem, but one that became more acute recently – further undermined sentiment for equities.
In fact, we see this as the primary issue hampering Chinese equity markets. Investor sentiment is extremely poor at present, dominated by macro fears while corporate fundamentals are seemingly disregarded. Trading volumes have been weak and mainly made up of derivatives and warrants while institutional interest remains low and “real” investors either defensively withdraw funds or remain on the side lines.
In terms of sectors, all cyclical industries such as steel, cement, but also financials and property were the major victims of the market downturn. Lately, some consumer related equities also declined after some reports by retailers that consumers had become a bit more cautious in their daily spending, in particular on luxury goods.
The Clough China Fund was consistently underweight banks, cyclical and property stocks during the period under review, whereas we continued to focus on our consumption themes by overweighting the consumer sector.
Looking at individual stocks, the three major positive contributors to the Fund’s performance were China Telecom, Lenovo and China Shenhua. China Telecom is China’s largest
wireline telephone company gradually penetrating mobile telecom and data system areas. It is recording strong 2G and 3G wireless subscriber additions. The rapidly growing wireless business is driving revenue acceleration. Earnings growth is well supported by cost control and a strong management team. The telecom sector also benefited from being considered as defensive. Lenovo, the world’s third largest personal computer vendor behind HP and Dell, is the fastest growing PC company in the world. We believe a dominant position in fast growing China and the Emerging Markets should vault Lenovo to second place in terms of global market share by year end. Rapid revenue growth and improving margins have driven earnings above market expectations and should serve to support a higher valuation for this company, which also supports a strong balance sheet with net cash equivalent to more than 50% of its market capitalization. China Shenhua, the largest thermal coal producer in China, benefits from a fully integrated business model, including mining, coal trading, railway network, power generation and port facilities. The company generates strong cash flow and high profit margins. Attractive coal industry fundamentals and a high quality management team support good visibility for Shenhua’s profit outlook.
On the other hand, financial companies were the major detractors for the Fund’s performance, with Industrial & Commercial Bank of China (ICBC), China Life and Bank of China (BOC) performing poorly. ICBC, largest commercial bank in China and, in our view, the most conservatively managed, as well as BOC were severely penalized by lingering questions on the consequences of the weakening property market on their balance sheets and the risk of rising NPLs (non-performing loans) in coming months and years. China Life is the largest life insurance company in China and has seen its fundamentals deteriorate a bit. Given the consistent deceleration in premium growth over the last few months, we decided to remove the shares from the portfolio.
Our view of China’s economy and investment outlook differ from what has become a “bearish consensus” view. Inflation has started to recede, from the peak of 6.5% in July to 6.2% in August, 6.1% in September and 5.5% in October. Inflation is undoubtedly trending lower now, and this is important. Further, economic growth is holding up well. Gross Domestic Product (GDP) growth was 9.1% year over year in 3Q and 9.4% for the year. Fixed asset investments have risen 24.9% for the year through October. Power production rose 11.5% in September and 9.3% in October and retail sales increased 17.2% in October, only a slight decline from 17.7% in September. Household consumption continues to be supported by robust real income gains which have increased 7.8% for urban dwellers and 13.6% in rural areas so far in 2011. Import growth, another sign of strong domestic demand, is accelerating and increased 28.7% in October up from 20.9% the previous month (NBS1, CEIC2). Exports are decelerating,
| 24 | October 31, 2011 |
Table of Contents
Clough China Fund | ||||
Management Commentary
| October 31, 2011 (Unaudited)
| |||
up 15.9% in October vs. 22% for the year and the trade surplus through October is down 17% to $124 billion, though China’s economy is much less export dependent today than in the past. In 2007, net exports contributed 18% to GDP growth. Today that contribution is virtually nil (CLSA3). So far, what we are seeing is a soft landing in China, at worse and certainly no signs of the much feared hard landing. In fact, our recent visits to the mainland actually revealed no landing at all. On the financial side, bank lending has started to rebound after several months of decline; new loans in October rebounded strongly by 24.8% over September (CEIC2, CLSA3). Further, we believe the decision to let local governments issue bonds should improve the transparency on local governments’ financial conditions.
Outlook
In our view, concerns over China’s growth and the risk of contagion from Europe’s financial problems seem to be reflected, if not overly discounted in Chinese equities. Indeed, valuations are very cheap in China, by almost any measure and sit below the trough suffered during the US-led global financial crisis in 2008. Price-to-earnings ratios (valuation ratio of a company’s current share price compared to its per-share earnings) for 2011 and 2012 have fallen to 9.5x and 8.5x for the MSCI China index despite expectations for double digit earnings growth next year (CS4, Bloomberg). The price-to-book ratio (ratio used to compare a stock’s market value to its book value) for 2012 is below 1.5x (CS4, Bloomberg). The Central Government recently adopted fiscal measures to help SMEs’ cash flows and has encouraged commercial banks to lend more to smaller companies, which are at the heart of China’s growth in our opinion. We see more fiscal stimulus being implemented in the coming months. In sharp contrast to Western governments and policy, China’s sound fiscal balance (deficit below 2% of GDP)(BNS5, CLSA3) leaves plenty of room to support the economy and we expect some selective policy easing such as cuts in the banking systems’ Reserve Requirement Ratio, which will relieve some liquidity tightness for corporates and investors.
We expect a soft landing in China, in line with a report by the World Bank just released on November 22, forecasting a 9.1% GDP growth in 2011 and some 8 to 8.5% growth next year with some “fine tuning” of the government policy as reiterated recently by Prime Minister Wen Jia Bao. Inflation is expected to come down sharply according to most private market forecasts. Consumer Price Index (CPI) should be below 5% by year end and could be as low as 3.5% by June according to ISI China Research. The decline in inflation will be well welcomed by investors and should serve to improve sentiment. On the other hand, we do not expect any relaxation on the residential property sector in the near term as the government has clearly given the priority to social housing construction. Further, residential property prices have only recently started to
decline, so more is needed to improve affordability. Investors should remember that the top concern of Chinese governments has always been to generate and protect a steady economic growth, above 8% per year, to maintain employment and social stability (CLSA3, UBS6). We have little doubt in our mind that this will prevail again in 2012 and in the following years.
The mix in growth in China is evolving and, at the margin, should be led by increasing consumption and decelerating fixed asset investment. In terms of strategy, the Fund intends to continue to strike a balance between a cautious approach given global negative trends and some high beta (a measure of the systematic risk of a security in comparison to the market as a whole) exposure for when the first serious signals of policy easing in China reach the market and wake up investors’ appetite. The domestic consumer area, with diversified interests in retail, autos, IT, telecoms, financials and banks remain our favorite investment theme where your managers can seek to select high quality, well managed growth stocks at reasonable prices.
| 1 | NBS - National Bureau of Statistics of China |
| 2 | CEIC - CEIC China Database is a leading economic time series database, focusing exclusively on the China market (CEIC website) |
| 3 | CLSA - Asia-Pacific Markets is Asia’s leading and longest running independent brokerage and investment group. The company provides investment-banking, equity-broking and asset-management services to global corporate and institutional clients. (CLSA website) |
| 4 | CS - Credit Suisse financial services company |
| 5 | BNP - Global bank based in France |
| 6 | UBS - A Swiss global financial services company |
| 25 | October 31, 2011 |
Table of Contents
Clough China Fund | ||||
Management Commentary
| October 31, 2011 (Unaudited)
| |||
Performance of $10,000 Initial Investment (as of October 31, 2011)
Comparison of change in value of a $10,000 investment (includes applicable sales loads)
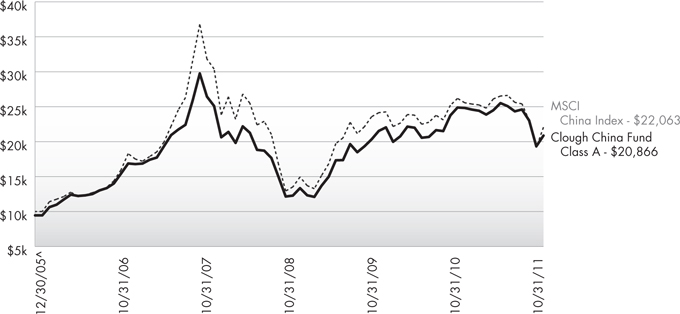
The chart above represents historical performance of a hypothetical investment of $10,000 in the Fund since inception. Past performance does not guarantee future results. This chart does not reflect the deduction of taxes that a shareholder would pay on Fund distributions or the redemption of Fund shares.
Average Annual Total Returns (as of October 31, 2011)
| 1 Year | 3 Year | 5 Year | Since Inception^ | Total Expense Ratio | What You Pay* | ||||||
Class A (NAV)1 | -16.15% | 19.74% | 8.28% | 14.53% | 2.16% | 1.98% | ||||||
Class A (MOP)2 | -20.77% | 17.49% | 7.07% | 13.43% | ||||||||
Class C (NAV)1 | -16.76% | 18.82% | 7.48% | 13.70% | 2.89% | 2.73% | ||||||
Class C (CDSC)2 | -17.59% | 18.82% | 7.48% | 13.70% | ||||||||
Class I3 | -15.93% | 20.24% | 8.80% | 15.10% | 2.05% | 1.73% | ||||||
MSCI China Index4 | -15.76% | 19.47% | 8.93% | 14.52% |
Performance data quoted represents past performance. Past performance does not guarantee future results. Investment return and principal value of an investment will fluctuate so that an investor’s shares, when sold or redeemed, may be worth more or less than the original cost. Current performance data may be higher or lower than actual data quoted. The Fund imposes a 2.00% redemption fee on shares held for less than 30 days. The Fund imposes a maximum Contingent Deferred Sales Charge (“CDSC”) of 1.00% to shares redeemed within the first 12 months after a purchase in excess of $1 million. Performance data does not reflect the redemption fee or the CDSC, which if reflected would reduce the performance quoted. For the most current month end performance data, please call (877) 256-8445.
The performance shown for the Clough China Fund for periods prior to January 15, 2010, reflects the performance of the Old Mutual China Fund, a series of Old Mutual Funds I (as a result of a prior reorganization of the Old Mutual China Fund into the Clough China Fund).
| 1 | Net Asset Value (NAV) is the share price without sales charges. |
| 2 | Maximum Offering Price (MOP) includes sales charges. Class A returns include effects of the Fund’s maximum sales charge of 5.50%; Class C returns include the 1.00% CDSC. |
| 3 | Prior to close of business on January 15, 2010, Class I was known as Institutional Class of the Old Mutual China Fund. |
| 4 | The Morgan Stanley Capital International (“MSCI”) China Index is constructed according to the MSCI Global Investable Market Index (GIMI) family. The MSCI China Index is part of the MSCI Emerging Markets Index. The index is not actively managed and does not reflect any deduction for fees, expenses or taxes. An investor may not invest directly in an index. |
| ^ | Fund Inception date of 12/30/2005. |
| * | What You Pay reflects the Adviser’s decision to contractually limit expenses through August 31, 2012. Please see the prospectus for additional information. |
| 26 | October 31, 2011 |
Table of Contents
Clough China Fund | ||||
Management Commentary
| October 31, 2011 (Unaudited)
| |||
The table does not reflect the deduction of taxes that a shareholder would pay on Fund distributions or the redemption of Fund shares.
Investing in the Fund is subject to investment risks, including possible loss of the principal amount invested.
Investing in China, Hong Kong and Taiwan involves risk and considerations not present when investing in more established securities markets. The Fund may be more susceptible to the economic, market, political and local risks of these regions than a fund that is more geographically diversified.
This Fund is not suitable for all investors.
Top Ten Holdings (as a % of Net Assets) †
| ||||
Industrial & Commercial Bank of China, Class H | 7.22 | % | ||
China Construction Bank Corp., Class H | 6.21 | % | ||
China Shenhua Energy Co., Ltd., Class H | 4.66 | % | ||
Lenovo Group, Ltd. | 4.38 | % | ||
Bank of China, Ltd., Class H | 3.81 | % | ||
China Mobile, Ltd. | 3.66 | % | ||
Shenguan Holdings Group, Ltd. | 3.60 | % | ||
China Telecom Corp., Ltd., Class H | 3.41 | % | ||
Tencent Holdings, Ltd. | 3.13 | % | ||
VTech Holdings, Ltd. | 2.79 | % | ||
Top Ten Holdings | 42.87 | % | ||
† Holdings are subject to change. | ||||
Industry Sector Allocation (as a % of Net Assets)
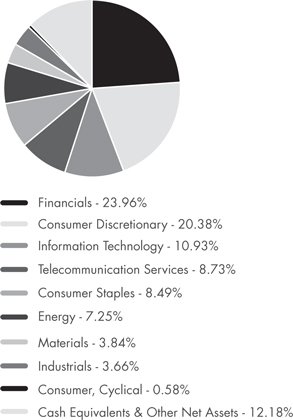
| 27 | October 31, 2011 |
Table of Contents
Clough China Fund | ||||
| October 31, 2011 (Unaudited)
| |||
As a shareholder of the Fund you will incur two types of costs: (1) transaction costs, including applicable sales charges (loads) and redemption fees; and (2) ongoing costs, including management fees, distribution and service (12b-1) fees, shareholder service fees and other Fund expenses. The following examples are intended to help you understand your ongoing costs (in dollars) of investing in the Fund and to compare these costs with the ongoing costs of investing in other mutual funds. The examples are based on an investment of $1,000 invested on May 1, 2011 and held until October 31, 2011.
Actual Expenses. The first line of the table on the next page provides information about actual account values and actual expenses. You may use the information in this line, together with the amount you invested, to estimate the expenses that you paid over the period. Simply divide your account value by $1,000 (for example, an $8,600 account value divided by $1,000 = 8.6), then multiply the result by the number in the first line under the heading “Expense Paid During Period” to estimate the expenses you paid on your account during this period.
Hypothetical Example for Comparison Purposes. The second line of the table on the next page provides information about hypothetical account values and hypothetical expenses based on the Fund’s actual expense ratio and an assumed rate of return of 5% per year before expenses, which is not the Fund’s actual return. The hypothetical account values and expenses may not be used to estimate the actual ending account balance or expenses you paid for the period. You may use this information to compare the ongoing costs of investing in the Fund and other mutual funds. To do so, compare this 5% hypothetical example with the 5% hypothetical examples that appear in the shareholder reports of the other funds.
The expenses shown in the table are meant to highlight ongoing Fund costs only and do not reflect transaction fees, such as sales charges, redemption fees or exchange fees. Therefore, the second line of the table on the next page is useful in comparing ongoing costs only, and may not help you determine the relative total costs of owning different funds. In addition, if these transactional costs were included, your costs would have been higher.
Beginning Account Value | Ending Account Value 10/31/11 | Expense Ratio(a) | Expense Paid During Period(b) 5/1/11 - 10/31/11 | |||||||||||||||||
Class A | ||||||||||||||||||||
Actual | $ | 1,000.00 | $ | 817.80 | 1.95 | % | $ | 8.91 | ||||||||||||
Hypothetical (5% return before expenses) | $ | 1,000.00 | $ | 1,015.33 | 1.95 | % | $ | 9.88 | ||||||||||||
Class C | ||||||||||||||||||||
Actual | $ | 1,000.00 | $ | 814.90 | 2.70 | % | $ | 12.32 | ||||||||||||
Hypothetical (5% return before expenses) | $ | 1,000.00 | $ | 1,011.56 | 2.70 | % | $ | 13.65 | ||||||||||||
Class I | ||||||||||||||||||||
Actual | $ | 1,000.00 | $ | 818.80 | 1.70 | % | $ | 7.77 | ||||||||||||
Hypothetical (5% return before expenses) | $ | 1,000.00 | $ | 1,016.59 | 1.70 | % | $ | 8.62 | ||||||||||||
| (a) | The Fund’s expense ratios have been based on the Fund’s most recent fiscal half-year expenses. |
| (b) | Expenses are equal to the Fund’s annualized expense ratio multiplied by the average account value over the period, multiplied by the number of days in the most recent fiscal half year (184), then divided by 366. |
| 28 | October 31, 2011 |
Table of Contents
Clough China Fund | ||||
| October 31, 2011 (Unaudited)
| |||
| Shares | Value (Note 1) | |||||||
COMMON STOCKS (87.82%) |
| |||||||
Consumer Discretionary (20.38%) |
| |||||||
Automobiles (4.59%) |
| |||||||
Brilliance China Automotive Holdings, Ltd.(a) | 700,000 | $ | 750,443 | |||||
Dongfeng Motor | 404,000 | 659,021 | ||||||
Great Wall | 1,507,500 | 2,047,053 | ||||||
|
| |||||||
| 3,456,517 | ||||||||
|
| |||||||
Multiline Retail (3.33%) |
| |||||||
Golden Eagle Retail Group, Ltd. | 421,000 | 1,058,051 | ||||||
Lifestyle International Holdings, Ltd. | 540,500 | 1,446,940 | ||||||
|
| |||||||
| 2,504,991 | ||||||||
|
| |||||||
Specialty Retail (6.39%) |
| |||||||
Belle International Holdings, Ltd. | 980,000 | 1,922,002 | ||||||
Giordano International, Ltd. | 1,636,000 | 1,234,009 | ||||||
Hengdeli Holdings, Ltd. | 892,000 | 399,899 | ||||||
Oriental Watch Holdings | 2,167,600 | 1,250,622 | ||||||
|
| |||||||
| 4,806,532 | ||||||||
|
| |||||||
Textiles, Apparel & Luxury Goods (6.07%) |
| |||||||
China Lilang, Ltd. | 1,072,000 | 1,128,418 | ||||||
Shenzhou International Group Holdings, Ltd. | 1,237,000 | 1,591,317 | ||||||
Texwinca Holdings, Ltd. | 678,000 | 858,968 | ||||||
Trinity, Ltd. | 1,092,000 | 989,745 | ||||||
|
| |||||||
| 4,568,448 | ||||||||
|
| |||||||
TOTAL CONSUMER DISCRETIONARY | 15,336,488 | |||||||
|
| |||||||
Consumer Staples (8.49%) |
| |||||||
Food & Staples Retailing (4.89%) |
| |||||||
China Resources Enterprise, Ltd. | 574,000 | 2,096,276 | ||||||
Lianhua Supermarket Holdings Co., Ltd. - Class H | 429,000 | 690,281 | ||||||
Wumart Stores, Inc., Class H | 444,000 | _896,110 | ||||||
|
| |||||||
| 3,682,667 | ||||||||
|
| |||||||
Food Products (3.60%) |
| |||||||
Shenguan Holdings Group, Ltd. | 5,038,600 | 2,707,016 | ||||||
|
| |||||||
TOTAL CONSUMER STAPLES | 6,389,683 | |||||||
|
| |||||||
Consumer, Cyclical (0.58%) |
| |||||||
Lodging (0.58%) | ||||||||
Shangri-La Asia, Ltd. | 218,000 | 437,859 | ||||||
|
| |||||||
TOTAL CONSUMER, CYCLICAL | 437,859 | |||||||
|
| |||||||
| Shares | Value (Note 1) | |||||||
Energy (7.25%) |
| |||||||
Oil, Gas & Consumable Fuels (7.25%) |
| |||||||
China Petroleum & | 2,059,000 | $ | 1,947,259 | |||||
China Shenhua | 767,000 | 3,508,866 | ||||||
|
| |||||||
TOTAL ENERGY | 5,456,125 | |||||||
|
| |||||||
Financials (23.96%) |
| |||||||
Commercial Banks (19.33%) |
| |||||||
Agricultural | 1,689,000 | 758,050 | ||||||
Bank of China, Ltd., | 8,051,300 | 2,865,529 | ||||||
China Construction | 6,363,080 | 4,675,179 | ||||||
Chongqing Rural Commercial Bank, Class H(a) | 1,847,000 | 817,177 | ||||||
Industrial & Commercial | 8,695,967 | 5,430,312 | ||||||
|
| |||||||
| 14,546,247 | ||||||||
|
| |||||||
Insurance (2.58%) |
| |||||||
Ping An Insurance | 261,500 | 1,939,388 | ||||||
|
| |||||||
Real Estate Management & Development (2.05%) |
| |||||||
Sino Land Co., Ltd. | 494,000 | 720,274 | ||||||
Sun Hung Kai Properties, Ltd. | 60,000 | 826,127 | ||||||
|
| |||||||
| 1,546,401 | ||||||||
|
| |||||||
TOTAL FINANCIALS | 18,032,036 | |||||||
|
| |||||||
Industrials (3.66%) | ||||||||
Airlines (1.17%) |
| |||||||
Air China, Ltd., | 1,128,000 | 876,501 | ||||||
|
| |||||||
Commercial Services & Supplies (1.43%) |
| |||||||
China Everbright International, Ltd. | 3,739,000 | 1,079,471 | ||||||
|
| |||||||
Industrial Conglomerates (1.06%) |
| |||||||
Hutchison Whampoa, Ltd. | 87,000 | 795,741 | ||||||
|
| |||||||
TOTAL INDUSTRIALS | 2,751,713 | |||||||
|
| |||||||
| 29 | October 31, 2011 |
Table of Contents
Clough China Fund | ||||
Statement of Investments
| October 31, 2011 (Unaudited)
| |||
| Shares | Value (Note 1) | |||||||
Information Technology (10.93%) |
| |||||||
Communications Equipment (2.79%) |
| |||||||
VTech Holdings, Ltd. | 224,800 | $ | 2,099,024 | |||||
|
| |||||||
Computers & Peripherals (4.38%) |
| |||||||
Lenovo Group, Ltd. | 4,900,000 | 3,294,292 | ||||||
|
| |||||||
Internet Software & Services (3.13%) |
| |||||||
Tencent Holdings, Ltd. | 102,000 | 2,359,013 | ||||||
|
| |||||||
Software (0.63%) | ||||||||
Kingsoft Corp., Ltd. | 1,067,000 | 471,433 | ||||||
|
| |||||||
TOTAL INFORMATION TECHNOLOGY |
| 8,223,762 | ||||||
|
| |||||||
Materials (3.84%) |
| |||||||
Construction Materials (2.26%) |
| |||||||
Anhui Conch Cement Co., Ltd., Class H | 224,000 | 814,522 | ||||||
Asia Cement China Holdings Corp. | 1,876,000 | 887,185 | ||||||
|
| |||||||
| 1,701,707 | ||||||||
|
| |||||||
Metals & Mining (1.58%) |
| |||||||
Zhaojin Mining Industry Co., Ltd., Class H | 663,000 | 1,183,710 | ||||||
|
| |||||||
TOTAL MATERIALS | 2,885,417 | |||||||
|
| |||||||
Telecommunication Services (8.73%) |
| |||||||
Diversified Telecommunication (3.88%) |
| |||||||
China Telecom Corp., Ltd., Class H | 4,162,000 | 2,569,649 | ||||||
China Unicom Hong Kong, Ltd. | 174,000 | 349,847 | ||||||
|
| |||||||
| 2,919,496 | ||||||||
|
| |||||||
Wireless Telecommunication Services (4.85%) |
| |||||||
China Mobile, Ltd. | 289,900 | 2,755,309 | ||||||
SmarTone Telecommunications Holdings, Ltd. | 482,000 | 890,240 | ||||||
|
| |||||||
| 3,645,549 | ||||||||
|
| |||||||
TOTAL TELECOMMUNICATION SERVICES |
| 6,565,045 | ||||||
|
| |||||||
TOTAL COMMON STOCKS (Cost $65,315,532) |
| 66,078,128 | ||||||
|
| |||||||
7-Day Yield | Shares | Value (Note 1) | ||||||||||
SHORT TERM INVESTMENTS (3.38%) |
| |||||||||||
Money Market Fund (3.38%) |
| |||||||||||
Dreyfus Cash Management Fund, Institutional Class | 0.050% | 2,542,637 | $ | 2,542,637 | ||||||||
|
| |||||||||||
TOTAL SHORT TERM INVESTMENTS (Cost $2,542,637) | 2,542,637 | |||||||||||
|
| |||||||||||
TOTAL INVESTMENTS (91.20%) (Cost $67,858,169) | $ | 68,620,765 | ||||||||||
Other Assets In Excess Of | 6,625,283 | |||||||||||
|
| |||||||||||
NET ASSETS (100.00%) | $ | 75,246,048 | ||||||||||
|
| |||||||||||
(a) Non-Income Producing Security. |
| |||||||||||
Common Abbreviations:
Ltd. - Limited.
For Fund compliance purposes, the Fund’s industry classifications refer to any one or more of the industry sub-classifications used by one or more widely recognized market indexes or ratings group indexes, and/or as defined by Fund management. This definition may not apply for purposes of this report, which may combine industry subclassifications for reporting ease. Industries are shown as a percent of net assets. These industry classifications are based on third party definitions and are unaudited. The definitions are industry terms and do not reflect the legal status of any of the investments or the companies in which the Fund has invested.
See Notes to Financial Statements.
| 30 | October 31, 2011 |
Table of Contents
Jefferies Asset Management Commodity Strategy Allocation Fund | ||||
| October 31, 2011 (Unaudited)
| |||
The six month period ending on October 31, 2011 was broadly negative for most commodities. Most recently, commodity prices, as measured by the diversified Thomson Reuters/Jefferies CRB Index, were down 6.49% for the three month period ended October 31, 2011. Commodities were not singled out for selling; the S&P 500 Index was down 2.47% in the same time frame. Corporate debt markets and emerging market equities also suffered. Commodity equities were particularly hard hit, down 8.87% as measured by the Thomson Reuters/Jefferies CRB Global In the Ground Index, during the quarter. The Jefferies Asset Management Commodity Strategy Allocation Fund (JCRIX) delivered a net negative return of -8.22% (JCRAX was -8.33% at MOP and JCRCX was down 8.42% with CDSC).
The Fund’s largest equity holdings at the end of October 2011 included Potash (POT) (-7.88% YTD, +62.37% Inception to date), Exxon Mobil (XOM) (+8.73% YTD +40.66% ITD), Monsanto (MON) (+6.19% YTD +57.99% ITD), Deere (DE) (-7.25% YTD + 40.14% ITD), AGCO Corp (AGCO) (-13.48 YTD +61.73% ITD), CNOOC Limited (883 HK) (-14.57% YTD +19.96% ITD), Xstrata (XTA LN) (-29.42% YTD +17.25% ITD), Transocean (RIG) (-15.55% YTD +25.38% ITD), and National Oilwell Varco Inc (NOV) (+ 6.56% YTD +117.95% ITD).
U.S. Treasury Inflation Protected Securities or TIPS are held by the Fund to invest excess cash and as collateral for commodity futures related investments held in our Cayman Island subsidiary. We believe that we may be nearing the end of what has been a significant rally in US treasury prices, both nominal and TIPS, and as a result, we continue to limit our duration exposure. At the end of October, our weighted average maturity was approximately 2.1 years.
The Fund’s Class I shares underperformed its benchmark, the Thomson Reuters/Jefferies CRB Index, by approximately 173 basis points during this period (measured against the performance of the “I”shares). The decline in commodity equity prices, referred to in the previous paragraph, was the primary reason for the underperformance. The Fund employs a strategy that combines an actively managed portfolio of commodity futures related exposure (collateralized by U.S. Treasury Inflation Protected Securities – TIPS), commodity equities, and physical commodity ETF’s. Throughout most of the early part of the quarter, the Fund allocated approximately 70% of its assets toward commodity futures related investments and approximately 30% of its assets in commodity equities. As the market prices of commodity equities accelerated downward in mid to late September, the Fund added to its commodity equity exposure. The Fund’s exposure to commodity equities was increased to nearly 40% by the end of September, while reducing the commodity futures related investment to approximately 60%. With the steep decline in prices, we took advantage of more favorable valuations for commodity equities, relative commodity futures related investments. Additionally, holding equities may help reduce the contango (or costs associated with replacing expiring futures contacts when new contacts are more expensive)
present in many of the component commodity futures. The Fund also raised a small amount of cash defensively in that recent downturn. The Fund temporarily held approximately 5% in cash, consciously choosing to underinvest its notional asset base. As of October end, the Fund sold a substantial portion of its commodity equity position to take advantage of the significant rebound in commodity equity prices. By the end of the October, the Fund had reduced its commodity equity holdings to approximately 25% and held about 75% in commodity futures related investments. Excess cash, which was raised during the more volatile period in late August and September, was gradually put back to work in the Fund. The Fund was fully invested by the end of October.
In hindsight, we can assemble a number of contributing factors for the declines. June 30, 2011 marked the end of the so called second round of Quantitive Easing (QE2) policy of the Federal Reserve. As the deadline approached, the reports from the Federal Open Market Committee (FOMC) were cautiously upbeat, forecasting improvements in the economy for the fourth quarter. However, the tone and message emanating from the FOMC changed abruptly and dramatically as global events and economic numbers turned negative. Ongoing mortgage and real estate problems, exacerbated by high unemployment levels, plagued the financial institutions in the US. Sovereign debt issues pressured the European Union and their currency. Both areas of the world had been strapped with below target growth rates as they struggled in the aftermath of the financial crisis of ‘07-’08. Ratings agencies lowered the credit worthiness of the US and certain constituent countries within the EU. Equity and sovereign debt markets declined and volatility increased as investor anxiety grew. Commodity prices as a whole also suffered. Economic forecasters, including the FOMC, lowered expectations for growth in the next few quarters for the US, the EU, and globally because of the difficulties encountered in the developed world. We feel it is important to note that these were short term projections.
We strongly believe that the long term fundamental drivers of commodity demand and ultimately higher prices are still in place. Population growth is likely to remain unabated regardless of the economic environment in the US and Europe. Birth rates are higher in the developing world generally. A billion more people will be added to the world population over the next decade. The trend of wealth distribution to the developing world as those economies grow at rapid rates relative to the slow or negative growth occurring in the developed countries is contributing to ever increasing demand for raw materials. Incremental gains in disposable income in the developing nations have led to competition for the commodities needed for more complex and costly lifestyles. In a world with limited supplies of food, fuel, building materials, and other necessities of life, price may become the ultimate allocator. Additionally, the aggressively accommodative monetary policies pursued by central banks globally will make commodities more attractive over time as currencies, including the US Dollar, may decline in value.
The relationship between percentage changes and basis points can be summarized as follows: 1% change = 100 basis points, and 0.01% = 1 basis point.
Duration: a measurement of how long, in years, it takes for the price of a bond to be repaid by its internal cash flows.
| 31 | October 31, 2011 |
Table of Contents
Jefferies Asset Management Commodity Strategy Allocation Fund | ||||
Management Commentary
| October 31, 2011 (Unaudited)
| |||
Performance of $10,000 Initial Investment (as of October 31, 2011)
Comparison of change in value of a $10,000 investment (includes applicable sales loads)
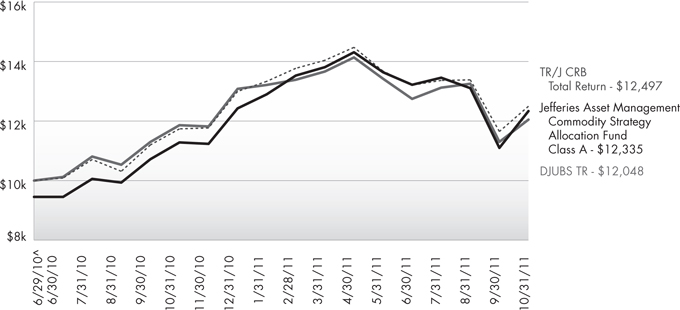
The chart above represents historical performance of a hypothetical investment of $10,000 in the Fund since inception. Past performance does not guarantee future results. This chart does not reflect the deduction of taxes that a shareholder would pay on Fund distributions or the redemption of Fund shares.
| 32 | October 31, 2011 |
Table of Contents
Jefferies Asset Management Commodity Strategy Allocation Fund | ||||
Management Commentary
| October 31, 2011 (Unaudited)
| |||
Cumulative Return (as of October 31, 2011)
| 1 Year | Since Inception^ | Total Expense Ratio | What You Pay* | |||||
Class A (NAV)1 | 9.33% | 21.99% | 2.61% | 1.47% | ||||
Class A (MOP)2 | 3.36% | 16.96% | ||||||
Class C (NAV)1 | 8.60% | 21.47% | 4.02% | 2.07% | ||||
Class C (CDSC)2 | 7.60% | 21.47% | ||||||
Class I | 9.54% | 22.38% | 2.06% | 1.17% | ||||
TR/J CRB Total Return Index3 | 6.46% | 18.10% | ||||||
DJUBS Commodity TR3 | 1.58% | 14.92% |
Performance data quoted represents past performance. Past performance does not guarantee future results. Investment return and principal value of an investment will fluctuate so that an investor’s shares, when sold or redeemed, may be worth more or less than the original cost. Current performance data may be higher or lower than actual data quoted. The Fund imposes a 2.00% redemption fee on shares held for less than 30 days. The Fund imposes a maximum Contingent Deferred Sales Charge (“CDSC”) of 1.00% to shares redeemed within the first 12 months after a purchase in excess of $1 million. Performance data does not reflect the redemption fee or the CDSC, which if reflected would reduce the performance quoted. For the most current month-end performance data, please call (866) 759-5679.
| 1 | Net Asset Value (NAV) is the share price without sales charges. |
| 2 | Maximum Offering Price (MOP) includes sales charges. Class A returns include effects of the Fund’s maximum sales charge of 5.50%; Class C returns include the 1.00% CDSC. |
| 3 | Thomson Reuters / Jefferies CRB Index and the Dow Jones-UBS Commodity Index are unmanaged indices used as a measurement of change in commodity market conditions based on the performance of a basket of different commodities. The index is not actively managed and does not reflect any deduction for fees, expenses or taxes. An investor may not invest directly in an index. |
| ^ | Fund inception date of 6/29/2010. |
| * | What You Pay reflects the Sub-Adviser’s decision to contractually limit expenses through August 31, 2012. Please see the prospectus for additional information. |
The table does not reflect the deduction of taxes that a shareholder would pay on Fund distributions or the redemption of Fund shares.
This Fund is not suitable for all investors. Subject to investment risks, including possible loss of the principal amount invested.
Investing in Commodity-Related securities involves risk and considerations not present when investing in more conventional securities. The Fund may be more susceptible to high volatility of commodity markets.
Derivatives generally are more sensitive to changes in economic or market conditions than other types of investments; this could result in losses that significantly exceed the Fund’s original investment.
Top Ten Holdings (as a % of Net Assets) †
Potash Corp. of Saskatchewan, Inc. | 1.69 | % | ||
Exxon Mobil Corp. | 1.56 | % | ||
Monsanto Co. | 1.22 | % | ||
Deere & Co. | 1.21 | % | ||
AGCO Corp. | 1.13 | % | ||
CNOOC, Ltd. | 1.12 | % | ||
Xstrata PLC | 1.11 | % | ||
Transocean, Ltd. | 1.10 | % | ||
National Oilwell Varco, Inc. | 1.08 | % | ||
Weatherford International, Ltd. | 1.06 | % | ||
Top Ten Holdings | 12.28 | % |
| † | Holdings are subject to change. |
Industry Sector Allocation (as a % of Net Assets)
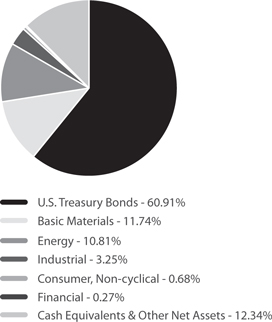
| 33 | October 31, 2011 |
Table of Contents
Jefferies Asset Management Commodity Strategy Allocation Fund | ||||
| October 31, 2011 (Unaudited)
| |||
As a shareholder of the Fund you will incur two types of costs: (1) transaction costs, including applicable sales charges (loads) and redemption fees; and (2) ongoing costs, including management fees, distribution and service (12b-1) fees, shareholder service fees and other Fund expenses. The following examples are intended to help you understand your ongoing costs (in dollars) of investing in the Fund and to compare these costs with the ongoing costs of investing in other mutual funds. The examples are based on an investment of $1,000 invested on May 1, 2011 and held until October 31, 2011.
Actual Expenses. The first line of the table on the next page provides information about actual account values and actual expenses. You may use the information in this line, together with the amount you invested, to estimate the expenses that you paid over the period. Simply divide your account value by $1,000 (for example, an $8,600 account value divided by $1,000 = 8.6), then multiply the result by the number in the first line under the heading “Expense Paid During Period” to estimate the expenses you paid on your account during this period.
Hypothetical Example for Comparison Purposes. The second line of the table on the next page provides information about hypothetical account values and hypothetical expenses based on the Fund’s actual expense ratio and an assumed rate of return of 5% per year before expenses, which is not the Fund’s actual return. The hypothetical account values and expenses may not be used to estimate the actual ending account balance or expenses you paid for the period. You may use this information to compare the ongoing costs of investing in the Fund and other mutual funds. To do so, compare this 5% hypothetical example with the 5% hypothetical examples that appear in the shareholder reports of the other funds.
The expenses shown in the table are meant to highlight ongoing Fund costs only and do not reflect transaction fees, such as sales charges, redemption fees or exchange fees. Therefore, the second line of the table on the next page is useful in comparing ongoing costs only, and may not help you determine the relative total costs of owning different funds. In addition, if these transactional costs were included, your costs would have been higher.
| Beginning Account Value 5/1/11 | Ending Account Value 10/31/11 | Expense Ratio(a) | Expense Paid During Period(b) 5/1/11 - 10/31/11 | |||||||||||||||||
Class A | ||||||||||||||||||||
Actual | $ | 1,000.00 | $ | 861.90 | 1.45 | % | $ | 6.79 | ||||||||||||
Hypothetical (5% return before expenses) | $ | 1,000.00 | $ | 1,017.85 | 1.45 | % | $ | 7.35 | ||||||||||||
Class C | ||||||||||||||||||||
Actual | $ | 1,000.00 | $ | 860.00 | 2.05 | % | $ | 9.58 | ||||||||||||
Hypothetical (5% return before expenses) | $ | 1,000.00 | $ | 1,014.83 | 2.05 | % | $ | 10.38 | ||||||||||||
Class I | ||||||||||||||||||||
Actual | $ | 1,000.00 | $ | 863.80 | 1.15 | % | $ | 5.39 | ||||||||||||
Hypothetical (5% return before expenses) | $ | 1,000.00 | $ | 1,019.36 | 1.15 | % | $ | 5.84 | ||||||||||||
| (a) | The Fund’s expense ratios have been based on the Fund’s most recent fiscal half-year expenses. |
| (b) | Expenses are equal to the Fund’s annualized expense ratio multiplied by the average account value over the period, multiplied by the number of days in the most recent fiscal half year (184), then divided by 366. |
| 34 | October 31, 2011 |
Table of Contents
Jefferies Asset Management Commodity Strategy Allocation Fund | ||||
| October 31, 2011 (Unaudited)
| |||
| Shares |
Value (Note 1) | |||||||
COMMON STOCKS (26.75%) |
| |||||||
Australia (0.87%) | ||||||||
Nufarm, Ltd.(a) | 225,900 | $ | 1,126,095 | |||||
Canada (4.71%) | ||||||||
Inmet Mining Corp. | 22,984 | 1,372,007 | ||||||
Potash Corp. of Saskatchewan, Inc. | 46,429 | 2,197,662 | ||||||
Suncor Energy, Inc. | 42,356 | 1,349,188 | ||||||
Viterra, Inc. | 115,571 | 1,189,625 | ||||||
|
| |||||||
| 6,108,482 | ||||||||
|
| |||||||
China (0.52%) | ||||||||
Jiangxi Copper Co., Ltd., Class H | 271,958 | 675,624 | ||||||
Germany (0.78%) | ||||||||
ThyssenKrupp AG | 35,056 | 1,011,613 | ||||||
Hong Kong (1.12%) | ||||||||
CNOOC, Ltd. | 739,999 | 1,453,556 | ||||||
Israel (0.27%) | ||||||||
The Israel Corp., Ltd. | 467 | 343,970 | ||||||
Japan (0.31%) | ||||||||
Inpex Corp. | 59 | 396,956 | ||||||
Mexico (0.07%) | ||||||||
Grupo Mexico SAB de CV, Series B | 32,615 | 90,403 | ||||||
Norway (0.47%) | ||||||||
Norsk Hydro ASA | 116,763 | 609,488 | ||||||
South Africa (0.35%) | ||||||||
Sasol, Ltd. | 10,114 | 456,255 | ||||||
Spain (0.97%) | ||||||||
Repsol YPF SA | 41,397 | 1,254,454 | ||||||
Switzerland (3.18%) | ||||||||
Syngenta AG(a) | 4,299 | 1,314,971 | ||||||
Transocean, Ltd. | 24,982 | 1,427,721 | ||||||
Weatherford International, Ltd.(a) | 88,656 | 1,374,168 | ||||||
|
| |||||||
| 4,116,860 | ||||||||
|
| |||||||
United Kingdom (1.71%) | ||||||||
BP PLC | 105,305 | 780,564 | ||||||
Xstrata PLC | 85,792 | 1,442,213 | ||||||
|
| |||||||
| 2,222,777 | ||||||||
|
| |||||||
| Shares/ Principal Amount | Value (Note 1) | |||||||
United States (11.42%) |
| |||||||
AGCO Corp.(a) | 33,400 | $1,463,922 | ||||||
Alcoa, Inc. | 118,113 | 1,270,896 | ||||||
Archer-Daniels-Midland Co. | 30,296 | 876,766 | ||||||
Chevron Corp. | 11,258 | 1,182,653 | ||||||
Coeur d’Alene Mines Corp.(a) | 30,845 | 788,707 | ||||||
Deere & Co. | 20,625 | 1,565,438 | ||||||
Exxon Mobil Corp. | 25,838 | 2,017,689 | ||||||
Hecla Mining Co.(a) | 204,877 | 1,284,579 | ||||||
Monsanto Co. | 21,660 | 1,575,765 | ||||||
National Oilwell Varco, Inc. | 19,707 | 1,405,700 | ||||||
Valero Energy Corp. | 55,807 | 1,372,852 | ||||||
|
| |||||||
| 14,804,967 | ||||||||
|
| |||||||
TOTAL COMMON STOCKS (Cost $32,791,215) |
| 34,671,500 | ||||||
|
| |||||||
EXCHANGE TRADED FUNDS (5.96%) |
| |||||||
iShares® Gold Trust(a) | 276,478 | 4,636,536 | ||||||
SPDR® Gold Trust(a) | 18,476 | 3,091,774 | ||||||
|
| |||||||
TOTAL EXCHANGE TRADED FUNDS (Cost $6,524,750) |
| 7,728,310 | ||||||
|
| |||||||
WARRANTS (0.00%)(b) |
| |||||||
Canada (0.00%)(b) | ||||||||
Kinross Gold Corp., strike price $21.30, Expires 9/17/14(a) | 19 | 46 | ||||||
|
| |||||||
United States (0.00%) |
| |||||||
Magnum Hunter Resources Corp. | 629 | 0 | ||||||
|
| |||||||
TOTAL WARRANTS (Cost $69) | 46 | |||||||
|
| |||||||
GOVERNMENT BONDS (60.91%) |
| |||||||
U.S. Treasury Bonds (60.91%) |
| |||||||
United States Treasury Inflation Indexed Bonds |
| |||||||
3.375%, 1/15/12 | $809,733 | 815,174 | ||||||
2.000%, 4/15/12 | 1,395,400 | 1,409,354 | ||||||
0.625%, 4/15/13 | 25,400,133 | 26,017,280 | ||||||
1.875%, 7/15/13 | 2,195,381 | 2,314,755 | ||||||
2.000%, 1/15/14 | 14,300,823 | 15,326,464 | ||||||
1.250%, 4/15/14 | 17,447,031 | 18,488,409 | ||||||
2.000%, 7/15/14 | 9,223,355 | 10,049,131 | ||||||
1.625%, 1/15/15 | 2,034,556 | 2,216,870 | ||||||
0.500%, 4/15/15 | 1,850,146 | 1,951,615 | ||||||
1.875%, 7/15/15 | 337,731 | 375,594 | ||||||
|
| |||||||
TOTAL GOVERNMENT BONDS (Cost $78,661,772) |
| 78,964,646 | ||||||
|
| |||||||
| 35 | October 31, 2011 |
Table of Contents
Jefferies Asset Management Commodity Strategy Allocation Fund | ||||
Statement of Investments
| October 31, 2011 (Unaudited)
| |||
| 7-Day Yield | Shares | Value (Note 1) | ||||||||
SHORT TERM INVESTMENTS (3.28%) | ||||||||||
Money Market Fund (3.28%) | ||||||||||
Dreyfus Treasury | 0.00004 | % | 4,248,441 | $4,248,441 | ||||||
| ||||||||||
TOTAL SHORT TERM INVESTMENTS |
| 4,248,441 | ||||||||
| ||||||||||
TOTAL INVESTMENTS (96.90%) |
| $125,612,943 | ||||||||
Other Assets In Excess Of |
| 4,014,753 | ||||||||
| ||||||||||
NET ASSETS - 100.00% |
| $129,627,696 | ||||||||
| ||||||||||
| (a) | Non-Income Producing Security. |
| (b) | Less than 0.005%. |
Common Abbreviations:
| AG | - Aktiengesellschaft is a German term that refers to a corporation that is limited by shares, i.e., owned by shareholders. |
| ASA | - Allmennaksjeselskap is the Norwegian term for public limited company. |
| Ltd. | - Limited. |
| PLC | - Public Limited Co. |
| SA | - Generally designated corporations in various countries, mostly those employing the civil law. |
| SAB | de CV - A variable capital company. |
For Fund compliance purposes, the Fund’s industry classifications refer to any one or more of the industry sub-classifications used by one or more widely recognized market indexes or ratings group indexes, and/ or as defined by Fund management. This definition may not apply for purposes of this report, which may combine industry sub-classifications for reporting ease. Industries are shown as a percent of net assets. These industry classifications are based on third party definitions and are unaudited. The definitions are industry terms and do not reflect the legal status of any of the investments or the companies in which the Fund has invested.
FUTURES CONTRACTS
At October 31, 2011, the Fund had outstanding futures contracts:
| Description | Position | Contracts | Expiration Date | Value | Unrealized Appreciation | |||||||||||
WTI Crude Future | Long | 195 | 12/20/11 | $ | 18,150,600 | $ | 134,372 | |||||||||
WTI Crude Future | Long | 10 | 3/20/12 | 928,300 | 19,205 | |||||||||||
|
| |||||||||||||||
| $ | 19,078,900 | $ | 153,577 | |||||||||||||
|
| |||||||||||||||
| Description | Position | Contracts | Expiration Date | Value | Unrealized Depreciation | |||||||||||
ICE West Texas Future | Short | 205 | 2/18/12 | $ | (19,048,600 | ) | $ | (1,492,073 | ) | |||||||
|
| |||||||||||||||
| TOTAL RETURN SWAP CONTRACTS(a) | ||||||||||||||||
| Swap Counterparty | Reference Obligation | Notional Amount | Rate Paid by the Fund | Termination Date | Unrealized Appreciation | |||||||||||
Bank of America - Merrill Lynch | CRB 3 Month Forward Total Return Index | $ | 92,684,065 | 0.48% | 6/29/12 | $ | 5,509,099 | |||||||||
Bank of America - Merrill Lynch | LME Zinc 3 Month | 191,400 | N/A | 1/11/12 | 8,392 | |||||||||||
Bank of America - Merrill Lynch | S&P MLCX 3 Month Natural Gas | (4,952,761 | ) | 0.10% | 6/29/12 | 89,696 | ||||||||||
|
| |||||||||||||||
| $ | 5,607,187 | |||||||||||||||
|
| |||||||||||||||
| Swap Counterparty | Reference Obligation | Notional Amount | Rate Paid by the Fund | Termination Date | Unrealized Depreciation | |||||||||||
Bank of America - Merrill Lynch | LME Zinc 3 Month | $ | (194,350 | ) | N/A | 1/11/12 | $ | (5,442 | ) | |||||||
Bank of America - Merrill Lynch | MLCX GoldT-F3 | (5,965,323 | ) | 0.10% | 6/29/12 | (378,576 | ) | |||||||||
|
| |||||||||||||||
| $ | (384,018 | ) | ||||||||||||||
|
| |||||||||||||||
| (a) | The Fund receives monthly payments based on any positive monthly return of the Reference Obligation. The Fund makes payments on any negative monthly return of such Reference Obligation. |
See Notes to Financial Statements.
| 36 | October 31, 2011 |
Table of Contents
| October 31, 2011 (Unaudited)
| |||
RiverFront Long-Term Growth Fund | RiverFront Long-Term Growth & Income Fund | RiverFront Moderate Growth Fund | RiverFront Moderate Growth & Income Fund
A Tough 3rd Quarter – Pessimism Excessive
As the second quarter drew to a close in June, we did not anticipate that one of the worst quarters for global stocks, large and small, in the past 40 years was about to unfold. However, we did react fairly quickly to policy blunders in both the US and Europe early in the quarter, reducing risk in all strategies, especially our more conservative ones; but this was not enough to avoid losses. As a general rule, the more volatile the market, the worse it did during the quarter. International stocks, as measured by the MSCI World ex-US index, fell 19% on a total return basis, US mid- and small-cap stocks fell 20%, and German, Chinese, and Korean stocks fell more than 30% in US dollar terms. The large cap S&P 500’s 14% decline was ‘less bad,’ in part because most foreign currencies fell relative to the US dollar.
Our overweight in high-quality US stocks helped the relative performance of both our growth and growth & income portfolios. However our growth strategies suffered from the large declines in smaller US stocks and emerging markets, despite our significant underweight to Europe. Maintaining a longer-term perspective in this environment is difficult, especially when we are cautious about the economic outlook, but following such a bad quarter we believe we can offer some solace. Because stocks were not overvalued at the start of the quarter, in our view, and because they still declined so much, a good deal of bad news is likely priced in. Also, history suggests well-above-even odds of positive 6- and 12-month returns following a quarterly price decline of 15 to 20%. In our view, a multi-month low in October is likely, but any subsequent rally will persist only if the global economy avoids another crisis of confidence. We expect that some of the asset classes that have fallen the most will deliver the best returns, hence our willingness to maintain weightings and even look for selected buying opportunities, which brings us to the issue of timing.
Since we believe the growing pessimism regarding the global economy has been the driving force behind stock market weakness, we are watching for a point of maximum pessimism that would mark a multi-month low in stock prices. The Crowd Sentiment Poll1 from Ned Davis Research has indicated deep levels of pessimism since early August, but has yet to reach the extreme lows of 2008 – 09. We now regard investor pessimism as a positive for the market, but our respect for the primary trend prevents us from becoming aggressive buyers. The 200-day moving average is probably the most widely followed indicator of the primary trend. Since 1928, our research shows that the S&P 500 has risen by about a 13% annualized rate when its 200-day moving average was rising and has fallen by about 9% during periods when the 200-day moving average was falling. The S&P 500’s 200-day moving average2 has yet to turn down decisively, but looks increasingly likely to do so. Furthermore, only 16% of global stock markets currently have rising 200-day moving averages and just 2% are above their average. When fewer than 30% of global stock markets have rising 200-day moving averages, the MSCI World Index has
fallen at an annualized rate of 12%, according to Ned Davis Research. 11203 has been important support for the S&P 500 over the last two months because it has been tested three times; given the break below that level early this week, we expect the next level of technical support between 1000 and 1040. Thus, while a buying opportunity may present itself in October some further short-term weakness seems likely.
Our large cap stock selection proved to be a positive contributor during the quarter. Individual names inside the Consumer Staples, Industrials, Technology and Financial sectors added to performance during the period. Tactical allocations that contributed positively included being underweight Developed International and Emerging Markets as well as being overweight Cash.
Negative contributors in the quarter included individual stock selection in Small/Mid Cap Energy as well as ETF selection in emerging markets debt and currencies. Lastly, being underweight Treasuries hurt our balanced strategies during the quarter.
RiverFront Long-Term Growth Fund
For the six-month period ended October 31, 2011, the RiverFront Long-Term Growth Fund underperformed the S&P 500 Total Return Index by approximately 6.6%. Our large cap stock selection proved to be a positive contributor. Individual names inside the Consumer Staples, Industrials, Technology and Financial sectors added to performance during the period. Tactical tilts that contributed positively included being underweight Developed International and Emerging Markets as well as being overweight Cash.
Negative contributors in the period included individual stock selection in Small/Mid Cap Energy as well as ETF selection in emerging markets debt and currencies.
RiverFront Long-Term Growth & Income Fund
For the six-month period ended October 31, 2011, the RiverFront Long-Term Growth & Income Fund underperformed the S&P 500 Total Return Index by approximately 1.4%. Our large cap stock selection proved to be a positive contributor. Individual names inside the Consumer Staples, Industrials, Technology and Financial sectors added to performance during the period. Tactical tilts that contributed positively included being underweight Developed International and Emerging Markets as well as being overweight Cash.
Negative contributors in the period included individual stock selection in Small/Mid Cap Energy as well as ETF selection in emerging markets debt and currencies. Lastly, being underweight Treasuries hurt our balanced strategies.
| 37 | October 31, 2011 |
Table of Contents
RiverFront Funds | ||||
Management Commentary
| October 31, 2011 (Unaudited)
| |||
RiverFront Moderate Growth Fund
For the six-month period ended October 31, 2011, the RiverFront Moderate Growth Fund underperformed the S&P 500 Total Return Index by approximately 4.9%. Our large cap stock selection proved to be a positive contributor. Individual names inside the Consumer Staples, Industrials, Technology and Financial sectors added to performance during the period. Tactical tilts that contributed positively included being underweight Developed International and Emerging Markets as well as being overweight Cash.
Negative contributors in the period included individual stock selection in Small/Mid Cap Energy as well as ETF selection in emerging markets debt and currencies. Lastly, being underweight Treasuries hurt our balanced strategies.
RiverFront Moderate Growth & Income Fund
For the six-month period ended October 31, 2011, the RiverFront Moderate Growth & Income Fund outperformed the S&P 500 Total Return Index by approximately 2.3%. Our large cap stock selection proved to be a positive contributor. Individual
names inside the Consumer Staples, Industrials, Technology and Financial sectors added to performance during the period. Tactical tilts that contributed positively included being underweight Developed International and Emerging Markets as well as being overweight Cash.
Negative contributors in the period included individual stock selection in Small/Mid Cap Energy as well as ETF selection in emerging markets debt and currencies. Lastly, being underweight Treasuries hurt our balanced strategies.
| 1 | The Crowd Sentiment Poll - Ned Davis Research, refers to the tone of the market, indicators are used to express optimism or pessimism of the stock market |
| 2 | The S&P 500’s 200 day moving average - The average value of the S&P 500 over a 200 day period |
| 3 | 1120 - a significant technical level used to track the S&P 500 Index and what some see as the bottom threshold of the index. |
Performance Update
Performance of $10,000 Initial Investment (as of October 31, 2011)
Comparison of change in value of a $10,000 investment (includes applicable sales loads)
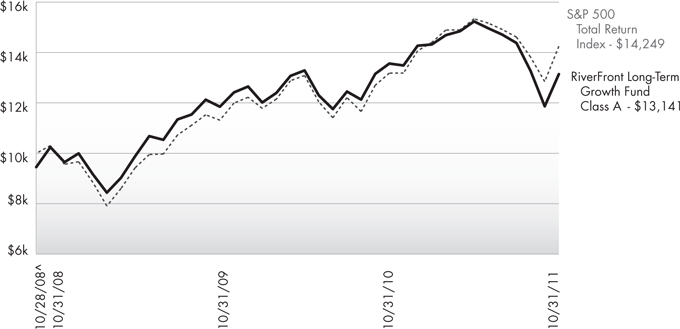
The chart above represents historical performance of a hypothetical investment of $10,000 in the Fund since inception. Past performance does not guarantee future results. This chart does not reflect the deduction of taxes that a shareholder would pay on Fund distributions or the redemption of Fund shares.
| 38 | October 31, 2011 |
Table of Contents
| October 31, 2011 (Unaudited)
| |||
Average Annual Total Returns (as of October 31, 2011)
| 1 Year | 3 Year | Since Inception^ | Total Expense Ratio | What You Pay* | ||||||
Investor (NAV)2 | -2.98% | 8.60% | 11.53% | 1.53% | 1.15% | |||||
Class L (NAV)1, 3 | -2.83% | 8.88% | 11.81% | 1.28% | 0.90% | |||||
Class A (NAV)1 | -3.10% | 8.65% | 11.58% | 1.58% | 1.15% | |||||
Class A (MOP)2 | -8.46% | 6.62% | 9.51% | |||||||
Class C (NAV)1 | -3.77% | 7.84% | 10.74% | 2.33% | 1.90% | |||||
Class C (CDSC)2 | -4.71% | 7.84% | 10.74% | |||||||
Class I | -2.71% | 8.92% | 11.85% | 1.30% | 0.90% | |||||
S&P 500 Total Return Index4 | 8.09% | 11.41% | 12.49% |
Performance data quoted represents past performance. Past performance does not guarantee future results. Investment return and principal value of an investment will fluctuate so that an investor’s shares, when sold or redeemed, may be worth more or less than the original cost. Current performance data may be higher or lower than actual data quoted. The Fund imposes a maximum Contingent Deferred Sales Charge (“CDSC”) of 1.00% to shares redeemed within the first 12 months after a purchase in excess of $1 million. Performance data does not reflect the CDSC, which if reflected would reduce the performance quoted. For the most current month-end performance data, please call (866) 759-5679.
The Class A, C, I and L shares performance shown for periods prior to September 27, 2010 reflects the performance of the Baird Funds, Inc. – RiverFront Long-Term Growth Fund’s Institutional Class shares (as result of the reorganization of the Baird Funds, Inc. – RiverFront Long-Term Growth Fund into the Fund).
The Investor Class performance shown for periods prior to September 27, 2010 reflects the performance of the Baird Funds, Inc. – RiverFront Long-Term Growth Fund’s Investor Class shares (as result of the reorganization of the Baird Funds, Inc. – RiverFront Long-Term Growth Fund into the Fund). The table does not reflect the deduction of taxes that a shareholder would pay on Fund distributions or the redemption of Fund shares. This Fund is not suitable for all investors. Subject to investment risks, including possible loss of the principal amount invested.
| 1 | Net Asset Value (NAV) is the share price without sales charges. |
| 2 | Maximum Offering Price (MOP) includes sales charges. Class A returns include effects of the Fund’s maximum sales charge of 5.50%; Class C returns include the 1.00% CDSC. |
| 3 | Prior to close of business on September 24, 2010, Class L was known as Institutional Class of the Baird Funds, Inc. - RiverFront Long-Term Growth Fund. |
| 4 | S&P 500 Total Return Index is the Standard & Poor’s composite index of 500 stocks, a widely recognized, unmanaged index of common stock prices. The index is not actively managed and does not reflect any deduction for fees, expenses or taxes. An investor may not invest directly in an index. |
| ^ | Fund inception date of 10/28/2008. |
| * | What You Pay reflects the Adviser’s and Sub-Adviser’s decision to contractually limit expenses through December 31, 2012. Please see the prospectus for additional information. |
Top Ten Holdings(as a % of Net Assets) †
Vanguard MSCI Emerging Markets ETF | 11.34 | % | ||
Vanguard MSCI EAFE ETF | 10.21 | % | ||
Vanguard MSCI European ETF | 6.06 | % | ||
Wilshire Micro-Cap ETF | 3.87 | % | ||
db-X MSCI EAFE Currency-Hedged Equity Fund | 2.90 | % | ||
WisdomTree Emerging Markets Small-Cap Dividend Fund | 2.25 | % | ||
PowerShares International Dividend Achievers Portfolio | 2.21 | % | ||
WisdomTree LargeCap Dividend Fund | 2.13 | % | ||
Vanguard Dividend Appreciation ETF | 2.00 | % | ||
iShares® MSCI ACWI Index Fund | 1.95 | % | ||
Top Ten Holdings | 44.92 | % |
| † | Holdings are subject to change. |
Portfolio Composition (as a % of Net Assets)
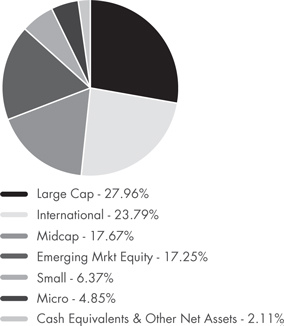
| 39 | October 31, 2011 |
Table of Contents
RiverFront Long-Term Growth Fund | ||||
| October 31, 2011 (Unaudited)
| |||
As a shareholder of the Fund you will incur two types of costs: (1) transaction costs, including applicable sales charges (loads) and (2) ongoing costs, including management fees, distribution and service (12b-1) fees, shareholder service fees and other Fund expenses. The following examples are intended to help you understand your ongoing costs (in dollars) of investing in the Fund and to compare these costs with the ongoing costs of investing in other mutual funds. The examples are based on an investment of $1,000 invested on May 1, 2011 and held until October 31, 2011.
Actual Expenses. The first line of the table on the next page provides information about actual account values and actual expenses. You may use the information in this line, together with the amount you invested, to estimate the expenses that you paid over the period. Simply divide your account value by $1,000 (for example, an $8,600 account value divided by $1,000 = 8.6), then multiply the result by the number in the first line under the heading “Expense Paid During Period” to estimate the expenses you paid on your account during this period.
Hypothetical Example for Comparison Purposes. The second line of the table on the next page provides information about hypothetical account values and hypothetical expenses based on the Fund’s actual expense ratio and an assumed rate of return of 5% per year before expenses, which is not the Fund’s actual return. The hypothetical account values and expenses may not be used to estimate the actual ending account balance or expenses you paid for the period. You may use this information to compare the ongoing costs of investing in the Fund and other mutual funds. To do so, compare this 5% hypothetical example with the 5% hypothetical examples that appear in the shareholder reports of the other funds.
The expenses shown in the table are meant to highlight ongoing Fund costs only and do not reflect transaction fees, such as sales charges, redemption fees or exchange fees. Therefore, the second line of the table on the next page is useful in comparing ongoing costs only, and may not help you determine the relative total costs of owning different funds. In addition, if these transactional costs were included, your costs would have been higher.
| Beginning Account Value 5/1/11 | Ending Account Value 10/31/11 | Expense Ratio(a) | Expense Paid During Period(b) 5/1/11 to 10/31/11 | |||||||||||
Class A | ||||||||||||||
Actual | $ | 1,000.00 | $ | 862.60 | 1.15 | % | $ 5.38 | |||||||
Hypothetical (5% return before expenses) | $ | 1,000.00 | $ | 1,019.36 | 1.15 | % | $ 5.84 | |||||||
Class C | ||||||||||||||
Actual | $ | 1,000.00 | $ | 859.00 | 1.90 | % | $ 8.88 | |||||||
Hypothetical (5% return before expenses) | $ | 1,000.00 | $ | 1,015.58 | 1.90 | % | $ 9.63 | |||||||
Class I | ||||||||||||||
Actual | $ | 1,000.00 | $ | 863.40 | 0.90 | % | $ 4.22 | |||||||
Hypothetical (5% return before expenses) | $ | 1,000.00 | $ | 1,020.61 | 0.90 | % | $ 4.57 | |||||||
Class L | ||||||||||||||
Actual | $ | 1,000.00 | $ | 863.30 | 0.90 | % | $ 4.22 | |||||||
Hypothetical (5% return before expenses) | $ | 1,000.00 | $ | 1,020.61 | 0.90 | % | $ 4.57 | |||||||
Investor Class | ||||||||||||||
Actual | $ | 1,000.00 | $ | 863.30 | 1.15 | % | $ 5.39 | |||||||
Hypothetical (5% return before expenses) | $ | 1,000.00 | $ | 1,019.36 | 1.15 | % | $ 5.84 | |||||||
| (a) | The Fund’s expense ratios have been based on the Fund’s most recent fiscal half-year expenses. |
| (b) | Expenses are equal to the Fund’s annualized expense ratio multiplied by the average account value over the period, multiplied by the number of days in the most recent fiscal half year (184), then divided by 366. |
| 40 | October 31, 2011 |
Table of Contents
RiverFront Long-Term Growth Fund | ||||
| October 31, 2011 (Unaudited)
| |||
| Shares | Value (Note 1) | |||||||
COMMON STOCKS (39.00%) |
| |||||||
Basic Materials (0.98%) |
| |||||||
Chemicals (0.40%) |
| |||||||
Sensient Technologies Corp. | 6,105 | $225,641 | ||||||
|
| |||||||
Forest Products & Paper (0.58%) |
| |||||||
MeadWestvaco Corp. | 11,671 | 325,737 | ||||||
|
| |||||||
TOTAL BASIC MATERIALS |
| 551,378 | ||||||
|
| |||||||
Communications (4.18%) |
| |||||||
Internet (0.77%) |
| |||||||
VeriSign, Inc. | 13,420 | 430,648 | ||||||
|
| |||||||
Media (0.62%) |
| |||||||
Time Warner Cable, Inc. | 5,482 | 349,148 | ||||||
|
| |||||||
Telecommunications (2.79%) |
| |||||||
Anixter International, Inc.(a) | 7,822 | 459,073 | ||||||
BCE, Inc. | 9,374 | 371,304 | ||||||
QUALCOMM, Inc. | 8,207 | 423,481 | ||||||
Verizon | 8,483 | 313,702 | ||||||
|
| |||||||
| 1,567,560 | ||||||||
|
| |||||||
TOTAL COMMUNICATIONS |
| 2,347,356 | ||||||
|
| |||||||
Consumer Staples (0.71%) |
| |||||||
Food & Staples Retailing (0.71%) |
| |||||||
Wal-Mart Stores, Inc. | 7,018 | 398,061 | ||||||
|
| |||||||
TOTAL CONSUMER STAPLES |
| 398,061 | ||||||
|
| |||||||
Consumer, Cyclical (5.10%) |
| |||||||
Hotels, Restaurants & Leisure (1.14%) |
| |||||||
Darden Restaurants, Inc. | 5,802 | 277,800 | ||||||
Penn National Gaming, Inc.(a) | 10,080 | 362,880 | ||||||
|
| |||||||
| 640,680 | ||||||||
|
| |||||||
Leisure Equipment & Products (0.80%) |
| |||||||
Hasbro, Inc. | 11,704 | 445,454 | ||||||
|
| |||||||
Multiline Retail (0.35%) |
| |||||||
Dollar Tree, Inc.(a) | 2,474 | 197,821 | ||||||
|
| |||||||
Retail (2.81%) |
| |||||||
Cracker Barrel Old Country Store, Inc. | 6,099 | 258,537 | ||||||
Family Dollar Stores, Inc. | 5,855 | 343,279 | ||||||
The Gap, Inc. | 13,416 | 253,562 | ||||||
McDonald’s Corp. | 4,978 | 462,207 | ||||||
| Shares | Value (Note 1) | |||||||
PF Chang’s China Bistro, Inc. | 8,402 | $261,302 | ||||||
|
| |||||||
| 1,578,887 | ||||||||
|
| |||||||
TOTAL CONSUMER, CYCLICAL |
| 2,862,842 | ||||||
|
| |||||||
Consumer, Non-cyclical (5.82%) |
| |||||||
Chemicals (0.38%) |
| |||||||
The Scotts Miracle-Gro Co., | 4,355 | 211,261 | ||||||
|
| |||||||
Commercial Services (1.17%) |
| |||||||
Iron Mountain, Inc. | 14,622 | 452,259 | ||||||
Moody’s Corp. | 5,798 | 205,771 | ||||||
|
| |||||||
| 658,030 | ||||||||
|
| |||||||
Commercial Services & Supplies (0.36%) |
| |||||||
Manpower, Inc. | 4,610 | 198,875 | ||||||
|
| |||||||
Health Care Providers & Services (2.21%) |
| |||||||
CareFusion Corp.(a) | 17,867 | 457,395 | ||||||
Henry Schein, Inc.(a) | 6,421 | 445,104 | ||||||
PSS World Medical, Inc.(a) | 15,194 | 338,066 | ||||||
|
| |||||||
| 1,240,565 | ||||||||
|
| |||||||
Health Care Products (0.72%) |
| |||||||
Hologic, Inc.(a) | 25,184 | 405,966 | ||||||
|
| |||||||
Pharmaceuticals (0.98%) |
| |||||||
Pfizer, Inc. | 28,667 | 552,127 | ||||||
|
| |||||||
TOTAL CONSUMER, |
| 3,266,824 | ||||||
|
| |||||||
Energy (5.67%) | ||||||||
Energy Equipment & Services (0.61%) |
| |||||||
Superior Energy Services, Inc.(a) | 12,246 | 344,357 | ||||||
|
| |||||||
Oil & Gas (3.69%) |
| |||||||
Carrizo Oil & Gas, Inc.(a) | 9,403 | 255,761 | ||||||
Chevron Corp. | 7,272 | 763,924 | ||||||
Cimarex Energy Co. | 4,346 | 278,144 | ||||||
ConocoPhillips | 5,500 | 383,075 | ||||||
Exxon Mobil Corp. | 5,030 | 392,793 | ||||||
|
| |||||||
| 2,073,697 | ||||||||
|
| |||||||
Oil & Gas Services (1.37%) |
| |||||||
Complete Production Services, Inc.(a) | 9,901 | 324,753 | ||||||
Halliburton Co. | 4,348 | 162,441 | ||||||
Oil States International, | 4,024 | 280,111 | ||||||
|
| |||||||
| 767,305 | ||||||||
|
| |||||||
TOTAL ENERGY | 3,185,359 | |||||||
|
| |||||||
| 41 | October 31, 2011 |
Table of Contents
RiverFront Long-Term Growth Fund | ||||
Statement of Investments
| October 31, 2011 (Unaudited)
| |||
| Shares | Value (Note 1) | ||||||
Financials (5.85%) | ||||||||
Banks (0.79%) |
| |||||||
East West Bancorp, Inc. | 22,818 | $444,267 | ||||||
|
| |||||||
Diversified Financial Services (2.13%) |
| |||||||
American Express Co. | 7,846 | 397,165 | ||||||
CME Group, Inc. | 1,355 | 373,384 | ||||||
Invesco Ltd. | 21,261 | 426,708 | ||||||
|
| |||||||
| 1,197,257 | ||||||||
|
| |||||||
Insurance (0.79%) |
| |||||||
HCC Insurance Holdings, Inc. | 16,699 | 444,360 | ||||||
|
| |||||||
Real Estate Investment Trusts (1.31%) |
| |||||||
Corporate Office Properties Trust | 10,121 | 245,434 | ||||||
DuPont Fabros Technology, Inc. | 11,417 | 237,360 | ||||||
Weingarten Realty Investors | 10,830 | 251,364 | ||||||
|
| |||||||
| 734,158 | ||||||||
|
| |||||||
Savings & Loans (0.83%) |
| |||||||
People’s United Financial, Inc. | 36,551 | 466,025 | ||||||
|
| |||||||
TOTAL FINANCIALS | 3,286,067 | |||||||
|
| |||||||
Industrials (5.43%) | ||||||||
Aerospace & Defense (1.27%) |
| |||||||
Esterline Technologies Corp.(a) | 7,779 | 434,846 | ||||||
L-3 Communications Holdings, Inc. | 4,079 | 276,475 | ||||||
|
| |||||||
| 711,321 | ||||||||
|
| |||||||
Containers & Packaging (1.07%) |
| |||||||
Ball Corp. | 17,454 | 603,385 | ||||||
|
| |||||||
Electrical Components & Equipment (0.25%) |
| |||||||
EnerSys(a) | 6,295 | 141,826 | ||||||
Engineering & Construction (0.46%) |
| |||||||
Aecom Technology Corp.(a) | 12,443 | 260,308 | ||||||
|
| |||||||
Hand & Machine Tools (0.62%) |
| |||||||
Snap-on, Inc. | 6,436 | 345,420 | ||||||
|
| |||||||
Machinery, Construction & Mining (0.58%) |
| |||||||
Caterpillar, Inc. | 3,459 | 326,737 | ||||||
|
| |||||||
Machinery-Diversified (0.56%) |
| |||||||
Cummins, Inc. | 3,150 | 313,204 | ||||||
|
| |||||||
| Shares | Value (Note 1) | ||||||
Pharmaceuticals (0.62%) |
| |||||||
PerkinElmer, Inc. | 16,701 | $345,210 | ||||||
|
| |||||||
TOTAL INDUSTRIALS | 3,047,411 | |||||||
|
| |||||||
Technology (5.26%) | ||||||||
Computers & Peripherals (2.48%) |
| |||||||
Apple, Inc.(a) | 877 | 354,992 | ||||||
International Business Machines Corp. | 3,808 | 703,071 | ||||||
Synopsys, Inc.(a) | 12,593 | 337,618 | ||||||
|
| |||||||
| 1,395,681 | ||||||||
|
| |||||||
Semiconductors & Semiconductor Equipment (1.47%) |
| |||||||
KLA-Tencor Corp. | 9,285 | 437,231 | ||||||
Microchip Technology, Inc. | 10,800 | 390,528 | ||||||
|
| |||||||
| 827,759 | ||||||||
|
| |||||||
Software (1.31%) |
| |||||||
BMC Software, | 9,673 | 336,233 | ||||||
Microsoft Corp. | 14,933 | 397,666 | ||||||
|
| |||||||
| 733,899 | ||||||||
|
| |||||||
TOTAL TECHNOLOGY | 2,957,339 | |||||||
|
| |||||||
TOTAL COMMON STOCKS (Cost $20,192,572) |
| 21,902,637 | ||||||
|
| |||||||
EXCHANGE TRADED FUNDS (59.12%) |
| |||||||
Aggressive Growth (4.13%) |
| |||||||
Vanguard Dividend Appreciation ETF | 21,047 | 1,124,752 | ||||||
WisdomTree LargeCap Dividend Fund | 25,132 | 1,195,278 | ||||||
|
| |||||||
| 2,320,030 | ||||||||
|
| |||||||
Emerging Markets (13.59%) |
| |||||||
iShares® MSCI Emerging Markets Index Fund | 17,631 | 719,345 | ||||||
PowerShares FTSE RAFI Emerging Markets Portfolio | 24,892 | 542,397 | ||||||
Vanguard MSCI Emerging Markets ETF | 153,458 | 6,366,972 | ||||||
|
| |||||||
| 7,628,714 | ||||||||
|
| |||||||
Equity (21.22%) |
| |||||||
Consumer Discretionary Select Sector SPDR® Fund(b) | 20,216 | 789,637 | ||||||
db-X MSCI EAFE Currency- Hedged Equity Fund(a) | 71,591 | 1,625,832 | ||||||
Global X China Consumer ETF | 14,921 | 221,428 | ||||||
| 42 | October 31, 2011 |
Table of Contents
RiverFront Long-Term Growth Fund | ||||
Statement of Investments
| October 31, 2011 (Unaudited)
| |||
| Shares | Value (Note 1) | |||||||
Global X FTSE ASEAN 40 ETF(a) | 38,095 | $591,615 | ||||||
Health Care Select Sector SPDR® Fund(b) | 17,222 | 578,487 | ||||||
iShares® MSCI ACWI Index Fund | 28,084 | 1,094,714 | ||||||
PowerShares International Dividend Achievers Portfolio | 81,667 | 1,242,155 | ||||||
PowerShares S&P Small-Cap Health Care Portfolio | 13,355 | 407,194 | ||||||
Vanguard Consumer Staples ETF | 8,787 | 699,884 | ||||||
Vanguard MSCI European ETF | 74,554 | 3,404,136 | ||||||
WisdomTree Emerging Markets Small-Cap Dividend Fund | 29,090 | 1,261,342 | ||||||
|
| |||||||
| 11,916,424 | ||||||||
|
| |||||||
Financial Services (1.29%) |
| |||||||
Financial Select Sector SPDR® Fund(b) | 53,455 | 722,712 | ||||||
|
| |||||||
Growth (3.87%) |
| |||||||
Wilshire Micro-Cap ETF | 134,160 | 2,172,050 | ||||||
|
| |||||||
Growth Mid-Cap (1.42%) |
| |||||||
SPDR® S&P Mid-Cap 400 | 4,944 | 797,962 | ||||||
|
| |||||||
International Equity (10.72%) |
| |||||||
iShares® MSCI Canada Index Fund | 10,167 | 287,116 | ||||||
Vanguard MSCI EAFE ETF | 173,389 | 5,733,974 | ||||||
|
| |||||||
| 6,021,090 | ||||||||
|
| |||||||
Micro-Cap (0.99%) |
| |||||||
First Trust Dow Jones Select Micro-Cap Index Fund | 27,523 | 557,891 | ||||||
|
| |||||||
Technology (0.89%) |
| |||||||
Vanguard Information Technology Index ETF | 7,871 | 501,619 | ||||||
|
| |||||||
Value (1.00%) |
| |||||||
PowerShares Dividend Achievers Portfolio | 38,393 | 559,770 | ||||||
|
| |||||||
TOTAL EXCHANGE TRADED FUNDS (Cost $32,173,513) |
| 33,198,262 | ||||||
|
| |||||||
7-day Yield | Shares | Value (Note 1) | ||||||||||
SHORT TERM INVESTMENTS (2.12%) |
| |||||||||||
Money Market Fund (2.12%) |
| |||||||||||
Dreyfus | 0.050 | % | 1,192,542 | $ | 1,192,542 | |||||||
|
| |||||||||||
TOTAL SHORT TERM INVESTMENTS (Cost $1,192,542) |
| 1,192,542 | ||||||||||
|
| |||||||||||
TOTAL INVESTMENTS (100.24%) (Cost $53,558,627) |
| $ | 56,293,441 | |||||||||
Liabilities In Excess Of Other |
| (134,137 | ) | |||||||||
|
| |||||||||||
NET ASSETS (100.00%) |
| $ | 56,159,304 | |||||||||
|
| |||||||||||
| (a) | Non-Income Producing Security. |
| (b) | Affiliated Company. See Note 6 to Financial Statements. |
Common Abbreviations:
ACWI - All Country World Index.
ASEAN - Association of Southeast Asian Nations.
EAFE - Europe, Australia, and Far East.
ETF - Exchange Traded Fund.
FTSE - Financial Times and the London Stock Exchange.
MSCI - Morgan Stanley Capital International.
RAFI - Research Affiliates Fundamental Index.
S&P - Standard and Poor’s.
SPDR - Standard and Poor’s Depositary Receipt.
For Fund compliance purposes, the Fund’s industry classifications refer to any one or more of the industry sub-classifications used by one or more widely recognized market indexes or ratings group indexes, and/or as defined by Fund management. This definition may not apply for purposes of this report, which may combine industry subclassifications for reporting ease. Industries are shown as a percent of net assets. These industry classifications are based on third party definitions and are unaudited. The definitions are industry terms and do not reflect the legal status of any of the investments or the companies in which the Fund has invested.
See Notes to Financial Statements.
| 43 | October 31, 2011 |
Table of Contents
| October 31, 2011 (Unaudited)
| |||
Performance of $10,000 Initial Investment (as of October 31, 2011)
Comparison of change in value of a $10,000 investment (includes applicable sales loads)
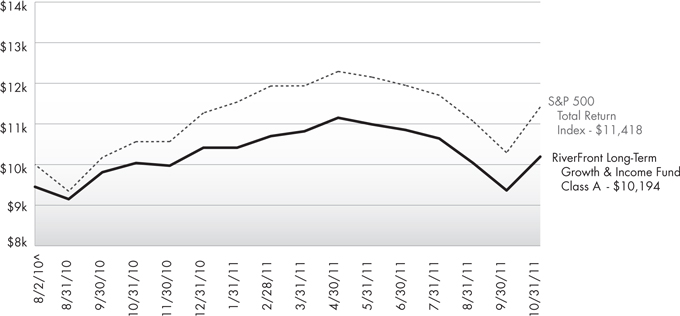
The chart above represents historical performance of a hypothetical investment of $10,000 in the Fund since inception. Past performance does not guarantee future results. This chart does not reflect the deduction of taxes that a shareholder would pay on Fund distributions or the redemption of Fund shares.
Cumulative Return (as of October 31, 2011)
| 1 Year | Since Inception^ | Gross Expense Ratio | What You Pay* | |||||
Class A (NAV)1 | 1.55% | 6.25% | 2.46% | 1.59% | ||||
Class A (MOP)2 | -4.05% | 1.55% | ||||||
Class C (NAV)1 | 0.73% | 5.39% | 3.39% | 2.34% | ||||
Class C (CDSC)2 | -0.27% | 5.39% | ||||||
Class I | 1.81% | 6.46% | 2.73% | 1.34% | ||||
S&P 500 Total Return Index3 | 8.09% | 11.22% |
Performance data quoted represents past performance. Past performance does not guarantee future results. Investment return and principal value of an investment will fluctuate so that an investor’s shares, when sold or redeemed, may be worth more or less than the original cost. Current performance data may be higher or lower than actual data quoted. The Fund imposes a maximum Contingent Deferred Sales Charge (“CDSC”) of 1.00% to shares redeemed within the first 12 months after a purchase in excess of $1 million. Performance data does not reflect the CDSC, which if reflected would reduce the performance quoted. For the most current month-end performance data, please call (866) 759-5679.
| 1 | Net Asset Value (NAV) is the share price without sales charges. |
| 2 | Maximum Offering Price (MOP) includes sales charges. Class A returns include effects of the Fund’s maximum sales charge of 5.50%; Class C returns include the 1.00% CDSC. |
| 3 | S&P 500 Total Return Index is the Standard & Poor’s composite index of 500 stocks, a widely recognized, unmanaged index of common stock prices. The index is not actively managed and does not reflect any deduction for fees, expenses or taxes. An investor may not invest directly in an index. |
| ^ | Fund inception date of 8/2/2010. |
| * | What You Pay reflects the Adviser’s and Sub-Adviser’s decision to contractually limit expenses through August 31, 2012. Please see the prospectus for additional information. |
The table does not reflect the deduction of taxes that a shareholder would pay on Fund distributions or the redemption of Fund shares.
The Fund is less than a year old and has limited operating history. This Fund is not suitable for all investors. Subject to investment risks, including possible loss of the principal amount invested.
| 44 | October 31, 2011 |
Table of Contents
RiverFront Long-Term Growth & Income Fund | ||||
Performance Update
| October 31, 2011 (Unaudited)
| |||
Top Ten Holdings (as a % of Net Assets)† |
SPDR® Barclays Capital High Yield Bond ETF | 8.65 | % | ||
Vanguard MSCI Emerging Markets ETF | 7.96 | % | ||
Vanguard MSCI European ETF | 5.17 | % | ||
PowerShares S&P 500 Low Volatility Portfolio | 4.68 | % | ||
PowerShares International Dividend Achievers Portfolio | 4.49 | % | ||
WisdomTree LargeCap Dividend Fund | 4.24 | % | ||
PowerShares Fundamental High Yield Corporate Bond Portfolio | 3.67 | % | ||
Vanguard MSCI EAFE ETF | 3.18 | % | ||
Chevron Corp. | 2.62 | % | ||
Vanguard Dividend Appreciation ETF | 2.40 | % | ||
Top Ten Holdings | 47.06 | % | ||
† Holdings are subject to change. | ||||
Portfolio Composition (as a % of Net Assets)
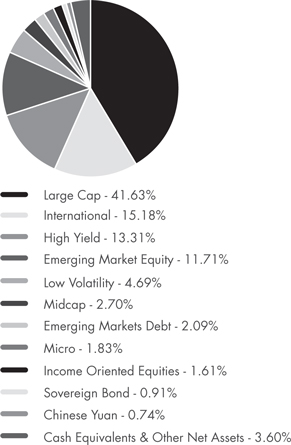
| 45 | October 31, 2011 |
Table of Contents
RiverFront Long-Term Growth & Income Fund | ||||
| October 31, 2011 (Unaudited)
| |||
As a shareholder of the Fund you will incur two types of costs: (1) transaction costs, including applicable sales charges (loads); and (2) ongoing costs, including management fees, distribution and service (12b-1) fees, shareholder service fees and other Fund expenses. The following examples are intended to help you understand your ongoing costs (in dollars) of investing in the Fund and to compare these costs with the ongoing costs of investing in other mutual funds. The examples are based on an investment of $1,000 invested on May 1, 2011 and held until October 31, 2011.
Actual Expenses. The first line of the table on the next page provides information about actual account values and actual expenses. You may use the information in this line, together with the amount you invested, to estimate the expenses that you paid over the period. Simply divide your account value by $1,000 (for example, an $8,600 account value divided by $1,000 = 8.6), then multiply the result by the number in the first line under the heading “Expense Paid During Period” to estimate the expenses you paid on your account during this period.
Hypothetical Example for Comparison Purposes. The second line of the table on the next page provides information about hypothetical account values and hypothetical expenses based on the Fund’s actual expense ratio and an assumed rate of return of 5% per year before expenses, which is not the Fund’s actual return. The hypothetical account values and expenses may not be used to estimate the actual ending account balance or expenses you paid for the period. You may use this information to compare the ongoing costs of investing in the Fund and other mutual funds. To do so, compare this 5% hypothetical example with the 5% hypothetical examples that appear in the shareholder reports of the other funds.
The expenses shown in the table are meant to highlight ongoing Fund costs only and do not reflect transaction fees, such as sales charges, redemption fees or exchange fees. Therefore, the second line of the table on the next page is useful in comparing ongoing costs only, and may not help you determine the relative total costs of owning different funds. In addition, if these transactional costs were included, your costs would have been higher.
| Beginning Account Value 5/1/11 | Ending Account Value 10/31/11 | Expense Ratio(a) | Expense Paid During Period(b) 5/1/11 to 10/31/11 | |||||||||||||||||
Class A | ||||||||||||||||||||
Actual | $ | 1,000.00 | $ | 914.10 | 1.30% | $ | 6.25 | |||||||||||||
Hypothetical (5% return before expenses) | $ | 1,000.00 | $ | 1,018.60 | 1.30% | $ | 6.60 | |||||||||||||
Class C | ||||||||||||||||||||
Actual | $ | 1,000.00 | $ | 910.10 | 2.05% | $ | 9.84 | |||||||||||||
Hypothetical (5% return before expenses) | $ | 1,000.00 | $ | 1,014.83 | 2.05% | $ | 10.38 | |||||||||||||
Class I | ||||||||||||||||||||
Actual | $ | 1,000.00 | $ | 914.70 | 1.05% | $ | 5.05 | |||||||||||||
Hypothetical (5% return before expenses) | $ | 1,000.00 | $ | 1,019.86 | 1.05% | $ | 5.33 | |||||||||||||
| (a) | The Fund’s expense ratios have been based on the Fund’s most recent fiscal half-year expenses. |
| (b) | Expenses are equal to the Fund’s annualized expense ratio multiplied by the average account value over the period, multiplied by the number of days in the most recent fiscal half year (184), then divided by 366. |
| 46 | October 31, 2011 |
Table of Contents
RiverFront Long-Term Growth & Income Fund | ||||
| October 31, 2011 (Unaudited) | ||||
| Shares | Value (Note 1) | ||||||
COMMON STOCKS (32.89%) |
| |||||||
Basic Materials (1.08%) |
| |||||||
Forest Products & Paper (1.08%) |
| |||||||
MeadWestvaco Corp. | 8,835 | $246,585 | ||||||
|
| |||||||
TOTAL BASIC MATERIALS |
| 246,585 | ||||||
|
| |||||||
Communications (4.96%) |
| |||||||
Media (1.01%) | ||||||||
Time Warner Cable, Inc. | 3,624 | 230,813 | ||||||
|
| |||||||
Telecommunications (3.95%) |
| |||||||
BCE, Inc. | 7,872 | 311,810 | ||||||
QUALCOMM, Inc. | 7,100 | 366,360 | ||||||
Verizon Communications, Inc. | 5,976 | 220,992 | ||||||
|
| |||||||
| 899,162 | ||||||||
|
| |||||||
TOTAL COMMUNICATIONS |
| 1,129,975 | ||||||
|
| |||||||
Consumer Staples (1.26%) |
| |||||||
Retail (1.26%) | ||||||||
Wal-Mart Stores, Inc. | 5,050 | 286,436 | ||||||
|
| |||||||
TOTAL CONSUMER STAPLES |
| 286,436 | ||||||
|
| |||||||
Consumer, Cyclical (5.26%) |
| |||||||
Retail (5.26%) | ||||||||
Darden Restaurants, Inc. | 2,723 | 130,377 | ||||||
The Gap, Inc. | 7,393 | 139,728 | ||||||
McDonald’s Corp. | 4,934 | 458,122 | ||||||
Nordstrom, Inc. | 2,596 | 131,591 | ||||||
Tiffany & Co. | 4,246 | 338,534 | ||||||
|
| |||||||
TOTAL CONSUMER, CYCLICAL |
| 1,198,352 | ||||||
|
| |||||||
Consumer, Non-cyclical (4.26%) |
| |||||||
Commercial Services (2.55%) |
| |||||||
Iron Mountain, Inc. | 9,249 | 286,072 | ||||||
Moody’s Corp. | 8,352 | 296,412 | ||||||
|
| |||||||
| 582,484 | ||||||||
|
| |||||||
Pharmaceuticals (1.71%) | ||||||||
Pfizer, Inc. | 20,216 | 389,360 | ||||||
|
| |||||||
TOTAL CONSUMER, NON-CYCLICAL |
| 971,844 | ||||||
|
| |||||||
Energy (4.78%) | ||||||||
Oil & Gas (3.84%) | ||||||||
Chevron Corp. | 5,674 | 596,054 | ||||||
ConocoPhillips | 4,005 | 278,948 | ||||||
|
| |||||||
| 875,002 | ||||||||
|
| |||||||
| Shares | Value (Note 1) | |||||||
Pipelines (0.94%) | ||||||||
ONEOK, Inc. | 2,823 | $214,689 | ||||||
|
| |||||||
TOTAL ENERGY | 1,089,691 | |||||||
|
| |||||||
Financials (3.19%) | ||||||||
Diversified Financial Services (2.00%) |
| |||||||
American Express Co. | 3,685 | 186,535 | ||||||
CME Group, Inc. | 978 | 269,497 | ||||||
|
| |||||||
| 456,032 | ||||||||
|
| |||||||
Savings & Loans (1.19%) |
| |||||||
People’s United Financial, Inc. | 21,165 | 269,854 | ||||||
|
| |||||||
TOTAL FINANCIALS | 725,886 | |||||||
|
| |||||||
Industrials (2.30%) | ||||||||
Machinery, Construction & Mining (1.10%) |
| |||||||
Caterpillar, Inc. | 2,647 | 250,036 | ||||||
|
| |||||||
Machinery-Diversified (1.20%) | ||||||||
Cummins, Inc. | 2,750 | 273,432 | ||||||
|
| |||||||
TOTAL INDUSTRIALS | 523,468 | |||||||
|
| |||||||
Technology (5.80%) | ||||||||
Computers (3.23%) | ||||||||
Apple, Inc.(a) | 658 | 266,345 | ||||||
International Business Machines Corp. | 2,541 | 469,145 | ||||||
|
| |||||||
| 735,490 | ||||||||
|
| |||||||
Semiconductors (1.36%) |
| |||||||
KLA-Tencor Corp. | 6,568 | 309,287 | ||||||
|
| |||||||
Software (1.21%) | ||||||||
Microsoft Corp. | 10,415 | 277,351 | ||||||
|
| |||||||
TOTAL TECHNOLOGY | 1,322,128 | |||||||
|
| |||||||
TOTAL COMMON STOCKS (Cost $7,006,080) |
| 7,494,365 | ||||||
|
| |||||||
EXCHANGE TRADED FUNDS (61.80%) |
| |||||||
Aggressive Growth (6.64%) |
| |||||||
Vanguard Dividend Appreciation ETF | 10,212 | 545,729 | ||||||
WisdomTree LargeCap Dividend Fund | 20,331 | 966,943 | ||||||
|
| |||||||
| 1,512,672 | ||||||||
|
| |||||||
Asset Allocation (0.74%) |
| |||||||
WisdomTree Dreyfus Chinese Yuan Fund(a) | 6,605 | 169,220 | ||||||
|
| |||||||
| 47 | October 31, 2011 |
Table of Contents
RiverFront Long-Term Growth & Income Fund | ||||
Statement of Investments
| October 31, 2011 (Unaudited)
| |||
| Shares | Value (Note 1) | |||||||
Consumer Staples (0.78%) |
| |||||||
Vanguard Consumer Staples ETF | 2,217 | $176,584 | ||||||
|
| |||||||
Debt (3.96%) |
| |||||||
iShares® iBoxx $ High Yield Corporate Bond Fund | 2,456 | 219,272 | ||||||
iShares® JPMorgan USD Emerging Markets Bond Fund | 4,310 | 475,824 | ||||||
WisdomTree Asia Local Debt Fund | 4,023 | 206,822 | ||||||
|
| |||||||
| 901,918 | ||||||||
|
| |||||||
Emerging Market Equity (10.70%) |
| |||||||
Global X China Consumer ETF | 5,861 | 86,977 | ||||||
Vanguard MSCI Emerging Markets ETF | 43,739 | 1,814,731 | ||||||
WisdomTree Emerging Markets Small-Cap Dividend Fund | 12,372 | 536,450 | ||||||
|
| |||||||
| 2,438,158 | ||||||||
|
| |||||||
Equity (18.11%) |
| |||||||
Global X FTSE ASEAN 40 ETF(a) | 14,596 | 226,676 | ||||||
Health Care Select Sector SPDR® Fund(b) | 13,196 | 443,254 | ||||||
iShares® MSCI ACWI ex US Index Fund | 10,719 | 417,826 | ||||||
iShares® MSCI Canada Index Fund | 3,936 | 111,153 | ||||||
PowerShares International Dividend Achievers Portfolio | 67,303 | 1,023,678 | ||||||
Vanguard MSCI EAFE ETF | 21,918 | 724,828 | ||||||
Vanguard MSCI European ETF | 25,792 | 1,177,663 | ||||||
|
| |||||||
| 4,125,078 | ||||||||
|
| |||||||
Fixed Income / High Yield (12.33%) |
| |||||||
PowerShares Fundamental High Yield Corporate Bond Portfolio | 45,905 | 837,307 | ||||||
SPDR Barclays Capital High Yield Bond ETF | 50,601 | 1,971,921 | ||||||
|
| |||||||
| 2,809,228 | ||||||||
|
| |||||||
Growth (4.68%) |
| |||||||
PowerShares S&P 500 Low Volatility Portfolio | 42,620 | 1,067,205 | ||||||
|
| |||||||
Micro-Cap (1.83%) |
| |||||||
PowerShares Zacks | 20,447 | 208,560 | ||||||
Wilshire Micro-Cap ETF | 12,912 | 209,045 | ||||||
|
| |||||||
| 417,605 | ||||||||
|
| |||||||
Real Estate Investment Trusts (2.03%) |
| |||||||
iShares® Dow Jones U.S. Real Estate Index Fund | 8,095 | 463,358 | ||||||
|
| |||||||
| Shares | Value (Note 1) | |||||||
TOTAL EXCHANGE TRADED FUNDS (Cost $14,449,531) |
| $ | 14,081,026 | |||||
|
| |||||||
EXCHANGE TRADED NOTES (1.61%) |
| |||||||
Master Limited Partnerships (MLPs) (1.61%) |
| |||||||
JPMorgan Alerian MLP Index ETN | 9,800 | 367,304 | ||||||
|
| |||||||
TOTAL EXCHANGE TRADED NOTES (Cost $346,176) |
| 367,304 | ||||||
|
| |||||||
7-Day Yield | Shares | Value (Note 1) | ||||||||||
SHORT TERM INVESTMENTS (3.58%) |
| |||||||||||
Money Market Fund (3.58%) |
| |||||||||||
Dreyfus Cash Management Fund, Institutional Class | 0.050 | % | 816,502 | 816,502 | ||||||||
|
| |||||||||||
TOTAL SHORT TERM INVESTMENTS (Cost $816,502) | 816,502 | |||||
|
| |||||
TOTAL INVESTMENTS (99.88%) (Cost $22,618,289) | $ | 22,759,197 | ||||
Other Assets In Excess Of | 26,578 | |||||
|
| |||||
NET ASSETS (100.00%) | $ | 22,785,775 | ||||
|
| |||||
| (a) | Non-Income Producing Security. |
| (b) | Affiliated Company. See Note 6 to Financial Statements. |
Common Abbreviations:
ACWI - All Country World Index.
ASEAN - Association of Southeast Asian Nations.
EAFE - Europe, Australia, and Far East.
ETF - Exchange Traded Fund.
ETN - Exchange Traded Note.
FTSE - Financial Times and the London Stock Exchange.
MLP - Master Limited Partnership.
MSCI - Morgan Stanley Capital International.
S&P - Standard and Poor’s.
SPDR - Standard and Poor’s Depositary Receipt.
For Fund compliance purposes, the Fund’s industry classifications refer to any one or more of the industry sub-classifications used by one or more widely recognized market indexes or ratings group indexes, and/or as defined by Fund management. This definition may not apply for purposes of this report, which may combine industry subclassifications for reporting ease. Industries are shown as a percent of net assets. These industry classifications are based on third party definitions and are unaudited. The definitions are industry terms and do not reflect the legal status of any of the investments or the companies in which the Fund has invested.
See Notes to Financial Statements.
| 48 | October 31, 2011 |
Table of Contents
| October 31, 2011 (Unaudited)
| |||
Performance of $10,000 Initial Investment (as of October 31, 2011)
Comparison of change in value of a $10,000 investment (includes applicable sales loads)
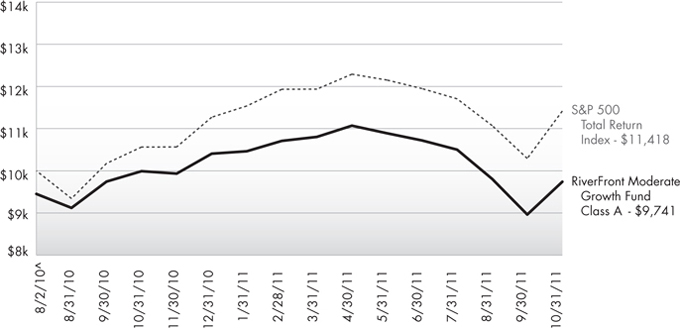
The chart above represents historical performance of a hypothetical investment of $10,000 in the Fund since inception. Past performance does not guarantee future results. This chart does not reflect the deduction of taxes that a shareholder would pay on Fund distributions or the redemption of Fund shares.
Cumulative Return (as of October 31, 2011)
| 1 Year | Since Inception^ | Total Expense Ratio | What You Pay* | |||||
Class A (NAV)1 | -2.50% | 2.45% | 3.31% | 1.61% | ||||
Class A (MOP)2 | -7.90% | -2.08% | ||||||
Class C (NAV)1 | -3.31% | 1.69% | 3.52% | 2.36% | ||||
Class C (CDSC)2 | -4.27% | 1.69% | ||||||
Class I | -2.32% | 2.68% | 4.99% | 1.36% | ||||
S&P 500 Total Return Index3 | 8.09% | 11.22% |
Performance data quoted represents past performance. Past performance does not guarantee future results. Investment return and principal value of an investment will fluctuate so that an investor’s shares, when sold or redeemed, may be worth more or less than the original cost. Current performance data may be higher or lower than actual data quoted. The Fund imposes a maximum Contingent Deferred Sales Charge (“CDSC”) of 1.00% to shares redeemed within the first 12 months after a purchase in excess of $1 million. Performance data does not reflect the CDSC, which if reflected would reduce the performance quoted. For the most current month-end performance data, please call (866) 759-5679.
| 1 | Net Asset Value (NAV) is the share price without sales charges. |
| 2 | Maximum Offering Price (MOP) includes sales charges. Class A returns include effects of the Fund’s maximum sales charge of 5.50%; Class C returns include the 1.00% CDSC. |
| 3 | S&P 500 Total Return Index is the Standard & Poor’s composite index of 500 stocks, a widely recognized, unmanaged index of common stock prices. The index is not actively managed and does not reflect any deduction for fees, expenses or taxes. An investor may not invest directly in an index. |
| ^ | Fund inception date of 8/2/2010. |
| * | What You Pay reflects the Adviser’s and Sub-Adviser’s decision to contractually limit expenses through August 31, 2012. Please see the prospectus for additional information. |
The table does not reflect the deduction of taxes that a shareholder would pay on Fund distributions or the redemption of Fund shares.
The Fund is less than a year old and has limited operating history. This Fund is not suitable for all investors. Subject to investment risks, including possible loss of the principal amount invested.
| 49 | October 31, 2011 |
Table of Contents
RiverFront Moderate Growth Fund | ||||
Performance Update
| October 31, 2011 (Unaudited)
| |||
Top Ten Holdings (as a % of Net Assets) †
SPDR® Barclays Capital High Yield Bond ETF | 9.07 | % | ||
Vanguard MSCI Emerging Markets ETF | 8.81 | % | ||
Vanguard MSCI European ETF | 6.06 | % | ||
PowerShares Fundamental High Yield Corporate Bond Portfolio | 3.43 | % | ||
Vanguard MSCI EAFE ETF | 3.42 | % | ||
PowerShares Dividend Achievers Portfolio | 3.31 | % | ||
PowerShares International Dividend Achievers Portfolio | 2.54 | % | ||
PowerShares S&P 500 Low Volatility Portfolio | 2.24 | % | ||
WisdomTree Emerging Markets | 2.24 | % | ||
WisdomTree LargeCap Dividend Fund | 2.24 | % | ||
Top Ten Holdings | 43.36 | % |
| † | Holdings are subject to change. |
Portfolio Composition (as a % of Net Assets)
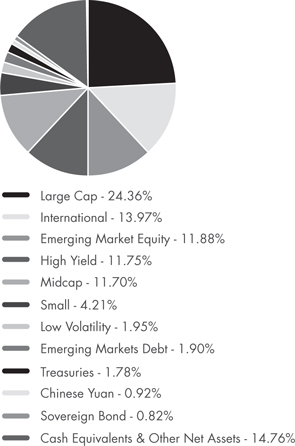
| 50 | October 31, 2011 |
Table of Contents
RiverFront Moderate Growth Fund | ||||
| October 31, 2011 (Unaudited)
| |||
As a shareholder of the Fund you will incur two types of costs: (1) transaction costs, including applicable sales charges (loads); and (2) ongoing costs, including management fees, distribution and service (12b-1) fees, shareholder service fees and other Fund expenses. The following examples are intended to help you understand your ongoing costs (in dollars) of investing in the Fund and to compare these costs with the ongoing costs of investing in other mutual funds. The examples are based on an investment of $1,000 invested on May 1, 2011 and held until October 31, 2011.
Actual Expenses. The first line of the table on the next page provides information about actual account values and actual expenses. You may use the information in this line, together with the amount you invested, to estimate the expenses that you paid over the period. Simply divide your account value by $1,000 (for example, an $8,600 account value divided by $1,000 = 8.6), then multiply the result by the number in the first line under the heading “Expense Paid During Period” to estimate the expenses you paid on your account during this period.
Hypothetical Example for Comparison Purposes. The second line of the table on the next page provides information about hypothetical account values and hypothetical expenses based on the Fund’s actual expense ratio and an assumed rate of return of 5% per year before expenses, which is not the Fund’s actual return. The hypothetical account values and expenses may not be used to estimate the actual ending account balance or expenses you paid for the period. You may use this information to compare the ongoing costs of investing in the Fund and other mutual funds. To do so, compare this 5% hypothetical example with the 5% hypothetical examples that appear in the shareholder reports of the other funds.
The expenses shown in the table are meant to highlight ongoing Fund costs only and do not reflect transaction fees, such as sales charges, redemption fees or exchange fees. Therefore, the second line of the table on the next page is useful in comparing ongoing costs only, and may not help you determine the relative total costs of owning different funds. In addition, if these transactional costs were included, your costs would have been higher.
| Beginning Account Value 5/1/11 | Ending Account Value 10/31/11 | Expense Ratio(a) | Expense Paid During Period(b) 5/1/11 to 10/31/11 | |||||||||||||||||
Class A | ||||||||||||||||||||
Actual | $ | 1,000.00 | $ | 879.90 | 1.30 | % | $ | 6.14 | ||||||||||||
Hypothetical (5% return before expenses) | $ | 1,000.00 | $ | 1,018.60 | 1.30 | % | $ | 6.60 | ||||||||||||
Class C | ||||||||||||||||||||
Actual | $ | 1,000.00 | $ | 876.30 | 2.05 | % | $ | 9.67 | ||||||||||||
Hypothetical (5% return before expenses) | $ | 1,000.00 | $ | 1,014.83 | 2.05 | % | $ | 10.38 | ||||||||||||
Class I | ||||||||||||||||||||
Actual | $ | 1,000.00 | $ | 881.80 | 1.05 | % | $ | 4.97 | ||||||||||||
Hypothetical (5% return before expenses) | $ | 1,000.00 | $ | 1,019.86 | 1.05 | % | $ | 5.33 | ||||||||||||
| (a) | The Fund’s expense ratios have been based on the Fund’s most recent fiscal half-year expenses. |
| (b) | Expenses are equal to the Fund’s annualized expense ratio multiplied by the average account value over the period, multiplied by the number of days in the most recent fiscal half year (184), then divided by 366. |
| 51 | October 31, 2011 |
Table of Contents
RiverFront Moderate Growth Fund | ||||
| October 31, 2011 (Unaudited)
| |||
| Shares | Value (Note 1) | |||||||
COMMON STOCKS (33.26%) |
| |||||||
Basic Materials (0.91%) |
| |||||||
Chemicals (0.30%) | ||||||||
Sensient Technologies Corp. | 1,863 | $68,857 | ||||||
|
| |||||||
Forest Products & Paper (0.61%) |
| |||||||
MeadWestvaco Corp. | 5,053 | 141,029 | ||||||
|
| |||||||
TOTAL BASIC MATERIALS |
| 209,886 | ||||||
|
| |||||||
Communications (3.90%) |
| |||||||
Internet (0.57%) | ||||||||
VeriSign, Inc. | 4,095 | 131,409 | ||||||
|
| |||||||
Media (0.72%) | ||||||||
Time Warner Cable, Inc. | 2,600 | 165,594 | ||||||
|
| |||||||
Telecommunications (2.61%) |
| |||||||
Anixter International, Inc.(a) | 2,485 | 145,845 | ||||||
BCE, Inc. | 3,460 | 137,051 | ||||||
QUALCOMM, Inc. | 3,501 | 180,651 | ||||||
Verizon Communications, Inc. | 3,624 | 134,015 | ||||||
|
| |||||||
| 597,562 | ||||||||
|
| |||||||
TOTAL COMMUNICATIONS |
| 894,565 | ||||||
|
| |||||||
Consumer Staples (0.65%) |
| |||||||
Retail (0.65%) |
| |||||||
Wal-Mart Stores, Inc. | 2,641 | 149,797 | ||||||
|
| |||||||
TOTAL CONSUMER STAPLES |
| 149,797 | ||||||
|
| |||||||
Consumer, Cyclical (4.22%) |
| |||||||
Entertainment (0.54%) |
| |||||||
Penn National Gaming, Inc.(a) | 3,455 | 124,380 | ||||||
|
| |||||||
Retail (3.10%) |
| |||||||
Cracker Barrel Old Country Store, Inc. | 1,889 | 80,075 | ||||||
Darden Restaurants, Inc. | 1,900 | 90,972 | ||||||
Dollar Tree, Inc.(a) | 960 | 76,762 | ||||||
Family Dollar Stores, Inc. | 1,883 | 110,400 | ||||||
The Gap, Inc. | 5,047 | 95,388 | ||||||
McDonald’s Corp. | 1,805 | 167,594 | ||||||
PF Chang’s China Bistro, Inc. | 2,899 | 90,159 | ||||||
|
| |||||||
| 711,350 | ||||||||
|
| |||||||
Toys, Games & Hobbies (0.58%) |
| |||||||
Hasbro, Inc. | 3,512 | 133,667 | ||||||
|
| |||||||
TOTAL CONSUMER, CYCLICAL |
| 969,397 | ||||||
| �� |
|
| ||||||
| Shares | Value (Note 1) | |||||||
Consumer, Non-cyclical (5.15%) |
| |||||||
Commercial Services (1.52%) |
| |||||||
Iron Mountain, Inc. | 6,558 | $202,839 | ||||||
Manpower, Inc. | 1,380 | 59,533 | ||||||
Moody’s Corp. | 2,425 | 86,063 | ||||||
|
| |||||||
| 348,435 | ||||||||
|
| |||||||
Health Care Products (2.35%) |
| |||||||
CareFusion | 7,629 | 195,302 | ||||||
Henry Schein, | 1,767 | 122,489 | ||||||
Hologic, Inc.(a) | 7,889 | 127,171 | ||||||
PSS World Medical, Inc.(a) | 4,301 | 95,697 | ||||||
|
| |||||||
| 540,659 | ||||||||
|
| |||||||
Household Products & Wares (0.27%) |
| |||||||
The Scotts Miracle-Gro Co., Class A | 1,262 | 61,220 | ||||||
|
| |||||||
Pharmaceuticals (1.01%) |
| |||||||
Pfizer, Inc. | 12,085 | 232,757 | ||||||
|
| |||||||
TOTAL CONSUMER, NON-CYCLICAL |
| 1,183,071 | ||||||
|
| |||||||
Energy (4.94%) | ||||||||
Oil & Gas (3.52%) |
| |||||||
Carrizo Oil & Gas, Inc.(a) | 2,869 | 78,037 | ||||||
Chevron Corp. | 3,161 | 332,063 | ||||||
Cimarex Energy Co. | 1,366 | 87,424 | ||||||
ConocoPhillips | 2,081 | 144,941 | ||||||
Exxon Mobil Corp. | 2,120 | 165,551 | ||||||
|
| |||||||
| 808,016 | ||||||||
|
| |||||||
Oil & Gas Services (1.42%) |
| |||||||
Complete Production Services, Inc.(a) | 2,921 | 95,809 | ||||||
Halliburton Co. | 1,367 | 51,071 | ||||||
Oil States International, Inc.(a) | 1,174 | 81,722 | ||||||
Superior Energy Services, Inc.(a) | 3,437 | 96,649 | ||||||
|
| |||||||
| 325,251 | ||||||||
|
| |||||||
TOTAL ENERGY |
| 1,133,267 | ||||||
|
| |||||||
Financials (4.47%) |
| |||||||
Banks (0.59%) | ||||||||
East West Bancorp, Inc. | 6,963 | 135,570 | ||||||
|
| |||||||
Diversified Financial Services (1.80%) |
| |||||||
American Express Co. | 2,855 | 144,520 | ||||||
CME Group, Inc. | 521 | 143,567 | ||||||
Invesco Ltd. | 6,248 | 125,397 | ||||||
|
| |||||||
| 413,484 | ||||||||
|
| |||||||
| 52 | October 31, 2011 |
Table of Contents
RiverFront Moderate Growth Fund | ||||
Statement of Investments
| October 31, 2011 (Unaudited)
| |||
| Shares | Value (Note 1) | ||||||
Insurance (0.53%) |
| |||||||
HCC Insurance Holdings, Inc. | 4,555 | $121,209 | ||||||
|
| |||||||
Real Estate Investment Trusts (0.94%) |
| |||||||
Corporate Office | 3,058 | 74,156 | ||||||
DuPont Fabros Technology, Inc. | 3,413 | 70,956 | ||||||
Weingarten Realty Investors | 3,046 | 70,698 | ||||||
|
| |||||||
| 215,810 | ||||||||
|
| |||||||
Savings & Loans (0.61%) |
| |||||||
People’s United Financial, Inc. | 10,910 | 139,102 | ||||||
|
| |||||||
TOTAL FINANCIALS | 1,025,175 | |||||||
|
| |||||||
Industrials (4.24%) | ||||||||
Aerospace & Defense (0.88%) |
| |||||||
Esterline Technologies Corp.(a) | 2,159 | 120,688 | ||||||
L-3 Communications | 1,180 | 79,980 | ||||||
|
| |||||||
| 200,668 | ||||||||
|
| |||||||
Electrical Components & Equipment (0.19%) |
| |||||||
EnerSys(a) | 1,954 | 44,024 | ||||||
|
| |||||||
Electronics (0.46%) |
| |||||||
PerkinElmer, Inc. | 5,066 | 104,714 | ||||||
|
| |||||||
Engineering & Construction (0.34%) |
| |||||||
Aecom Technology Corp.(a) | 3,689 | 77,174 | ||||||
|
| |||||||
Hand & Machine Tools (0.44%) |
| |||||||
Snap-on, Inc. | 1,888 | 101,329 | ||||||
|
| |||||||
Machinery, Construction & Mining (0.61%) |
| |||||||
Caterpillar, Inc. | 1,483 | 140,084 | ||||||
|
| |||||||
Machinery-Diversified (0.51%) |
| |||||||
Cummins, Inc. | 1,183 | 117,626 | ||||||
|
| |||||||
Packaging & Containers (0.81%) |
| |||||||
Ball Corp. | 5,403 | 186,782 | ||||||
|
| |||||||
TOTAL INDUSTRIALS | 972,401 | |||||||
|
| |||||||
Technology (4.78%) |
| |||||||
Computers (2.18%) |
| |||||||
Apple, Inc.(a) | 438 | 177,294 | ||||||
International Business | 1,170 | 216,017 | ||||||
Synopsys, Inc.(a) | 3,957 | 106,087 | ||||||
|
| |||||||
| 499,398 | ||||||||
|
| |||||||
| Shares | Value (Note 1) | |||||||
Semiconductors (1.32%) |
| |||||||
KLA-Tencor Corp. | 3,896 | $ | 183,463 | |||||
Microchip Technology, Inc. | 3,332 | 120,485 | ||||||
|
| |||||||
| 303,948 | ||||||||
|
| |||||||
Software (1.28%) |
| |||||||
BMC Software, Inc.(a) | 3,526 | 122,564 | ||||||
Microsoft Corp. | 6,398 | 170,378 | ||||||
|
| |||||||
| 292,942 | ||||||||
|
| |||||||
TOTAL TECHNOLOGY |
| 1,096,288 | ||||||
|
| |||||||
TOTAL COMMON STOCKS (Cost $7,745,656) |
| 7,633,847 | ||||||
|
| |||||||
EXCHANGE TRADED FUNDS (64.91%) |
| |||||||
Aggressive Growth (2.24%) |
| |||||||
WisdomTree LargeCap | 10,787 | 513,030 | ||||||
|
| |||||||
Asset Allocation (1.06%) |
| |||||||
WisdomTree Dreyfus Chinese | 9,456 | 242,263 | ||||||
|
| |||||||
Debt (6.22%) |
| |||||||
iShares® Barclays 20+ Year | 4,058 | 470,241 | ||||||
iShares® iBoxx $ High Yield | 2,662 | 237,663 | ||||||
iShares® JPMorgan USD | 4,554 | 502,762 | ||||||
WisdomTree Asia Local | 4,200 | 215,922 | ||||||
|
| |||||||
| 1,426,588 | ||||||||
|
| |||||||
Emerging Market Equity (10.42%) |
| |||||||
Global X China Consumer ETF | 6,113 | 90,717 | ||||||
iShares® MSCI Emerging | 6,839 | 279,031 | ||||||
Vanguard MSCI Emerging | 48,741 | 2,022,264 | ||||||
|
| |||||||
| 2,392,012 | ||||||||
|
| |||||||
Equity (19.48%) |
| |||||||
Consumer Discretionary Select Sector SPDR® | 7,803 | 304,785 | ||||||
db-X MSCI EAFE Currency- Hedged Equity Fund(a) | 16,580 | 376,532 | ||||||
Global X FTSE ASEAN 40 | 14,957 | 232,282 | ||||||
Health Care Select Sector | 7,288 | 244,804 | ||||||
iShares® MSCI ACWI ex US | 11,319 | 441,215 | ||||||
| 53 | October 31, 2011 |
Table of Contents
RiverFront Moderate Growth Fund | ||||
Statement of Investments
| October 31, 2011 (Unaudited)
| |||
| Shares | Value (Note 1) | |||||||
PowerShares International Dividend Achievers Portfolio | 38,275 | $582,163 | ||||||
PowerShares S&P Small-Cap Health Care Portfolio | 4,187 | 127,662 | ||||||
Vanguard Consumer Staples ETF | 3,205 | 255,278 | ||||||
Vanguard MSCI European ETF | 30,477 | 1,391,580 | ||||||
WisdomTree Emerging Markets Small-Cap Dividend Fund | 11,846 | 513,642 | ||||||
|
| |||||||
| 4,469,943 | ||||||||
|
| |||||||
Financial Services (1.32%) |
| |||||||
Financial Select Sector SPDR® Fund(b) | 22,462 | 303,686 | ||||||
|
| |||||||
Fixed Income / High Yield (12.50%) |
| |||||||
PowerShares Fundamental High Yield Corporate Bond Portfolio | 43,179 | 787,585 | ||||||
SPDR® Barclays Capital High Yield Bond ETF | 53,416 | 2,081,621 | ||||||
|
| |||||||
| 2,869,206 | ||||||||
|
| |||||||
Growth (2.24%) |
| |||||||
PowerShares S&P 500 Low Volatility Portfolio | 20,537 | 514,246 | ||||||
|
| |||||||
Growth Mid-Cap (1.39%) |
| |||||||
SPDR® S&P Mid-Cap 400 ETF Trust | 1,981 | 319,733 | ||||||
|
| |||||||
International Equity (3.92%) |
| |||||||
iShares® MSCI Canada Index Fund | 4,123 | 116,434 | ||||||
Vanguard MSCI EAFE ETF | 23,707 | 783,990 | ||||||
|
| |||||||
| 900,424 | ||||||||
|
| |||||||
Large-Cap (3.31%) |
| |||||||
PowerShares Dividend Achievers Portfolio | 52,093 | 759,516 | ||||||
|
| |||||||
Technology (0.81%) |
| |||||||
Vanguard Information Technology ETF | 2,935 | 187,048 | ||||||
|
| |||||||
TOTAL EXCHANGE TRADED FUNDS (Cost $15,225,662) |
| 14,897,695 | ||||||
|
| |||||||
| 7-Day Yield | Shares | Value (Note 1) | ||||||||||
SHORT TERM INVESTMENTS (17.01%) |
| |||||||||||
Money Market Fund (17.01%) |
| |||||||||||
Dreyfus Cash Management Fund, Institutional Class | 0.050 | % | 3,904,055 | $3,904,055 | ||||||||
|
| |||||||||||
TOTAL SHORT TERM INVESTMENTS (Cost $3,904,055) |
| 3,904,055 | ||||||||||
|
| |||||||||||
TOTAL INVESTMENTS (115.18%) (Cost $26,875,373) |
| $ | 26,435,597 | |||||||||
Liabilities In Excess Of Other |
| (3,483,973 | ) | |||||||||
|
| |||||||||||
NET ASSETS (100.00%) |
| $ | 22,951,624 | |||||||||
|
| |||||||||||
| (a) | Non-Income Producing Security. |
| (b) | Affiliated Company. See Note 6 to Financial Statements. |
Common Abbreviations:
ASEAN - Association of Southeast Asian Nations.
ACWI - All Country World Index.
EAFE - Europe, Australia, and Far East.
ETF - Exchange Traded Fund.
FTSE - Financial Times and the London Stock Exchange.
MSCI - Morgan Stanley Capital International.
S&P - Standard and Poor’s.
SPDR - Standard and Poor’s Depositary Receipt.
For Fund compliance purposes, the Fund’s industry classifications refer to any one or more of the industry sub-classifications used by one or more widely recognized market indexes or ratings group indexes, and/or as defined by Fund management. This definition may not apply for purposes of this report, which may combine industry subclassifications for reporting ease. Industries are shown as a percent of net assets. These industry classifications are based on third party definitions and are unaudited. The definitions are industry terms and do not reflect the legal status of any of the investments or the companies in which the Fund has invested.
See Notes to Financial Statements.
| 54 | October 31, 2011 |
Table of Contents
| October 31, 2011 (Unaudited)
| |||
Performance of $10,000 Initial Investment (as of October 31, 2011)
Comparison of change in value of a $10,000 investment (includes applicable sales loads)
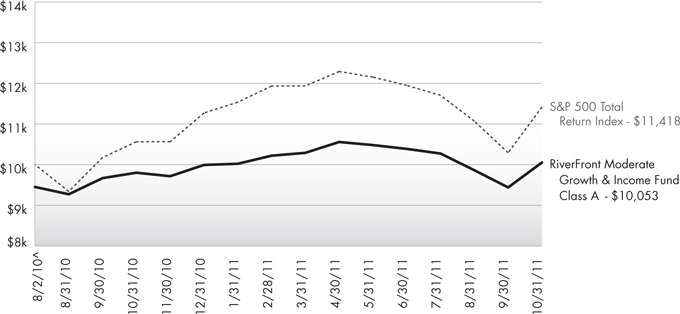
The chart above represents historical performance of a hypothetical investment of $10,000 in the Fund since inception. Past performance does not guarantee future results. This chart does not reflect the deduction of taxes that a shareholder would pay on Fund distributions or the redemption of Fund shares.
Cumulative Return (as of October 31, 2011)
| 1 Year | Since Inception^ | Total Expense Ratio | What You Pay* | ||||
Class A (NAV)1 | 2.57% | 5.07% | 1.92% | 1.58% | ||||
Class A (MOP)2 | -3.04% | 0.43% | ||||||
Class C (NAV)1 | 1.84% | 4.40% | 2.82% | 2.33% | ||||
Class C (CDSC)2 | 0.84% | 4.40% | ||||||
Class I | 2.80% | 5.35% | 1.83% | 1.33% | ||||
S&P 500 Total Return Index3 | 8.09% | 11.22% |
Performance data quoted represents past performance. Past performance does not guarantee future results. Investment return and principal value of an investment will fluctuate so that an investor’s shares, when sold or redeemed, may be worth more or less than the original cost. Current performance data may be higher or lower than actual data quoted. The Fund imposes a maximum Contingent Deferred Sales Charge (“CDSC”) of 1.00% to shares redeemed within the first 12 months after a purchase in excess of $1 million. Performance data does not reflect the CDSC, which if reflected would reduce the performance quoted. For the most current month-end performance data, please call (866) 759-5679.
| 1 | Net Asset Value (NAV) is the share price without sales charges. |
| 2 | Maximum Offering Price (MOP) includes sales charges. Class A returns include effects of the Fund’s maximum sales charge of 5.50%; Class C returns include the 1.00% CDSC. |
| 3 | S&P 500 Total Return Index is the Standard & Poor’s composite index of 500 stocks, a widely recognized, unmanaged index of common stock prices. The index is not actively managed and does not reflect any deduction for fees, expenses or taxes. An investor may not invest directly in an index. |
| ^ | Fund inception date of 8/2/2010. |
| * | What You Pay reflects the Adviser’s and Sub-Adviser’s decision to contractually limit expenses through August 31, 2012. Please see the prospectus for additional information. |
The table does not reflect the deduction of taxes that a shareholder would pay on Fund distributions or the redemption of Fund shares.
The Fund is less than a year old and has limited operating history. This Fund is not suitable for all investors. Subject to investment risks, including possible loss of the principal amount invested.
| 55 | October 31, 2011 |
Table of Contents
RiverFront Moderate Growth & Income Fund | ||||
Performance Update
| October 31, 2011 (Unaudited)
| |||
Top Ten Holdings (as a % of Net Assets) †
SPDR® Barclays Capital High Yield Bond ETF | 11.69 | % | ||
Vanguard Short-Term Corporate Bond ETF | 8.05 | % | ||
Vanguard MSCI Emerging Markets ETF | 6.58 | % | ||
PowerShares S&P 500 Low Volatility Portfolio | 6.16 | % | ||
PowerShares Fundamental High Yield Corporate Bond Portfolio | 5.67 | % | ||
Vanguard MSCI European ETF | 5.05 | % | ||
PowerShares International Dividend Achievers Portfolio | 5.04 | % | ||
iShares® Barclays 20+ Year Treasury Bond Fund | 4.37 | % | ||
iShares® JPMorgan USD Emerging Markets Bond Fund | 3.04 | % | ||
JPMorgan Alerian MLP Index ETN | 2.55 | % | ||
Top Ten Holdings | 58.20 | % |
| † | Holdings are subject to change. |
Portfolio Composition (as a % of Net Assets)
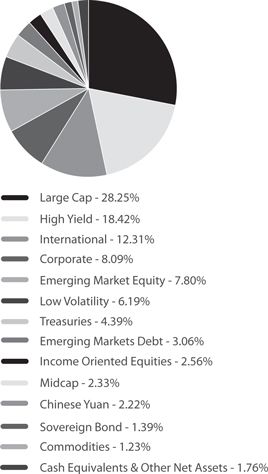
| 56 | October 31, 2011 |
Table of Contents
RiverFront Moderate Growth & Income Fund | ||||
| October 31, 2011 (Unaudited)
| |||
As a shareholder of the Fund you will incur two types of costs: (1) transaction costs, including applicable sales charges (loads); and (2) ongoing costs, including management fees, distribution and service (12b-1) fees, shareholder service fees and other Fund expenses. The following examples are intended to help you understand your ongoing costs (in dollars) of investing in the Fund and to compare these costs with the ongoing costs of investing in other mutual funds. The examples are based on an investment of $1,000 invested on May 1, 2011 and held until October 31, 2011.
Actual Expenses. The first line of the table on the next page provides information about actual account values and actual expenses. You may use the information in this line, together with the amount you invested, to estimate the expenses that you paid over the period. Simply divide your account value by $1,000 (for example, an $8,600 account value divided by $1,000 = 8.6), then multiply the result by the number in the first line under the heading “Expense Paid During Period” to estimate the expenses you paid on your account during this period.
Hypothetical Example for Comparison Purposes. The second line of the table on the next page provides information about hypothetical account values and hypothetical expenses based on the Fund’s actual expense ratio and an assumed rate of return of 5% per year before expenses, which is not the Fund’s actual return. The hypothetical account values and expenses may not be used to estimate the actual ending account balance or expenses you paid for the period. You may use this information to compare the ongoing costs of investing in the Fund and other mutual funds. To do so, compare this 5% hypothetical example with the 5% hypothetical examples that appear in the shareholder reports of the other funds.
The expenses shown in the table are meant to highlight ongoing Fund costs only and do not reflect transaction fees, such as sales charges, redemption fees or exchange fees. Therefore, the second line of the table on the next page is useful in comparing ongoing costs only, and may not help you determine the relative total costs of owning different funds. In addition, if these transactional costs were included, your costs would have been higher.
| Beginning Account Value 5/1/11 | Ending Account Value 10/31/11 | Expense Ratio(a) | Expense Paid During Period(b) 5/1/11 to 10/31/11 | ||||||||||||
Class A | ||||||||||||||||
Actual | $ | 1,000.00 | $ | 952.20 | 1.30 | % | $ 6.38 | |||||||||
Hypothetical (5% return before expenses) | $ | 1,000.00 | $ | 1,018.60 | 1.30 | % | $ 6.60 | |||||||||
Class C | ||||||||||||||||
Actual | $ | 1,000.00 | $ | 948.50 | 2.05 | % | $ 10.04 | |||||||||
Hypothetical (5% return before expenses) | $ | 1,000.00 | $ | 1,014.83 | 2.05 | % | $ 10.38 | |||||||||
Class I | ||||||||||||||||
Actual | $ | 1,000.00 | $ | 953.40 | 1.05 | % | $ 5.16 | |||||||||
Hypothetical (5% return before expenses) | $ | 1,000.00 | $ | 1,019.86 | 1.05 | % | $ 5.33 | |||||||||
| (a) | The Fund’s expense ratios have been based on the Fund’s most recent fiscal half-year expenses. |
| (b) | Expenses are equal to the Fund’s annualized expense ratio multiplied by the average account value over the period, multiplied by the number of days in the most recent fiscal half year (184), then divided by 366. |
| 57 | October 31, 2011 |
Table of Contents
RiverFront Moderate Growth & Income Fund | ||||
Statement of Investments
| October 31, 2011 (Unaudited)
| |||
| Shares | Value (Note 1) | |||||||
COMMON STOCKS (28.14%) |
| |||||||
Basic Materials (0.88%) |
| |||||||
Forest Products & Paper (0.88%) |
| |||||||
MeadWestvaco Corp. | 18,399 | $513,516 | ||||||
|
| |||||||
TOTAL BASIC MATERIALS |
| 513,516 | ||||||
|
| |||||||
Communications (4.48%) |
| |||||||
Media (0.85%) | ||||||||
Time Warner Cable, Inc. | 7,816 | 497,801 | ||||||
|
| |||||||
Telecommunications (3.63%) |
| |||||||
BCE, Inc. | 19,237 | 761,978 | ||||||
QUALCOMM, Inc. | 15,505 | 800,058 | ||||||
Verizon Communications, Inc. | 15,293 | 565,535 | ||||||
|
| |||||||
| 2,127,571 | ||||||||
|
| |||||||
TOTAL COMMUNICATIONS |
| 2,625,372 | ||||||
|
| |||||||
Consumer Staples (1.05%) |
| |||||||
Retail (1.05%) | ||||||||
Wal-Mart Stores, Inc. | 10,910 | 618,815 | ||||||
|
| |||||||
TOTAL CONSUMER STAPLES |
| 618,815 | ||||||
|
| |||||||
Consumer, Cyclical (4.49%) |
| |||||||
Retail (4.49%) | ||||||||
Darden Restaurants, Inc. | 6,061 | 290,201 | ||||||
The Gap, Inc. | 16,074 | 303,799 | ||||||
McDonald’s Corp. | 11,034 | 1,024,507 | ||||||
Nordstrom, Inc. | 5,625 | 285,131 | ||||||
Tiffany & Co. | 9,117 | 726,898 | ||||||
|
| |||||||
TOTAL CONSUMER, |
| 2,630,536 | ||||||
|
| |||||||
Consumer, Non-cyclical (3.68%) |
| |||||||
Commercial Services (2.24%) |
| |||||||
Iron Mountain, Inc. | 21,894 | 677,181 | ||||||
Moody’s Corp. | 18,016 | 639,388 | ||||||
|
| |||||||
| 1,316,569 | ||||||||
|
| |||||||
Pharmaceuticals (1.44%) |
| |||||||
Pfizer, Inc. | 43,744 | 842,510 | ||||||
|
| |||||||
TOTAL CONSUMER, |
| 2,159,079 | ||||||
|
| |||||||
Energy (3.78%) | ||||||||
Oil & Gas (2.91%) |
| |||||||
Chevron Corp. | 10,532 | 1,106,387 | ||||||
ConocoPhillips | 8,591 | 598,363 | ||||||
|
| |||||||
| 1,704,750 | ||||||||
|
| |||||||
| Shares | Value (Note 1) | |||||||
Pipelines (0.87%) |
| |||||||
ONEOK, Inc. | 6,692 | $508,926 | ||||||
|
| |||||||
TOTAL ENERGY | 2,213,676 | |||||||
|
| |||||||
Financials (2.64%) |
| |||||||
Diversified Financial Services (1.68%) |
| |||||||
American Express Co. | 7,869 | 398,329 | ||||||
CME Group, Inc. | 2,128 | 586,391 | ||||||
|
| |||||||
| 984,720 | ||||||||
|
| |||||||
Savings & Loans (0.96%) |
| |||||||
People’s United Financial, Inc. | 44,013 | 561,166 | ||||||
|
| |||||||
TOTAL FINANCIALS |
| 1,545,886 | ||||||
|
| |||||||
Industrials (1.90%) | ||||||||
Machinery, Construction & Mining (0.90%) |
| |||||||
Caterpillar, Inc. | 5,587 | 527,748 | ||||||
|
| |||||||
Machinery-Diversified (1.00%) |
| |||||||
Cummins, Inc. | 5,876 | 584,251 | ||||||
|
| |||||||
TOTAL INDUSTRIALS |
| 1,111,999 | ||||||
|
| |||||||
Technology (5.24%) |
| |||||||
Computers (3.12%) |
| |||||||
Apple, Inc.(a) | 1,493 | 604,337 | ||||||
International Business Machines Corp. | 6,641 | 1,226,128 | ||||||
|
| |||||||
| 1,830,465 | ||||||||
|
| |||||||
Semiconductors (1.10%) |
| |||||||
KLA-Tencor Corp. | 13,635 | 642,072 | ||||||
|
| |||||||
Software (1.02%) |
| |||||||
Microsoft Corp. | 22,502 | 599,228 | ||||||
|
| |||||||
TOTAL TECHNOLOGY |
| 3,071,765 | ||||||
|
| |||||||
TOTAL COMMON STOCKS (Cost $15,270,188) |
| 16,490,644 | ||||||
|
| |||||||
EXCHANGE TRADED FUNDS (67.06%) |
| |||||||
Asset Allocation (2.21%) |
| |||||||
WisdomTree Dreyfus Chinese Yuan | 50,527 | 1,294,502 | ||||||
|
| |||||||
Commodity (1.22%) |
| |||||||
SPDR® Gold Shares(a) | 4,270 | 714,542 | ||||||
|
| |||||||
| 58 | October 31, 2011 |
Table of Contents
RiverFront Moderate Growth & Income Fund | ||||
| October 31, 2011 (Unaudited)
| |||
| Shares | Value (Note 1) | ||||||
Consumer Staples (0.68%) |
| |||||||
Vanguard Consumer Staples ETF | 5,029 | $400,560 | ||||||
|
| |||||||
Debt (9.75%) |
| |||||||
iShares® Barclays 20+ Year Treasury Bond Fund | 22,104 | 2,561,411 | ||||||
iShares® iBoxx $ High Yield Corporate Bond Fund | 6,318 | 564,071 | ||||||
iShares® JPMorgan USD Emerging Markets Bond Fund | 16,137 | 1,781,525 | ||||||
WisdomTree Asia Local Debt Fund | 15,725 | 808,422 | ||||||
|
| |||||||
| 5,715,429 | ||||||||
|
| |||||||
Emerging Market Equity (7.76%) |
| |||||||
Global X China Consumer ETF | 15,178 | 225,241 | ||||||
Vanguard MSCI Emerging Markets ETF | 92,959 | 3,856,869 | ||||||
WisdomTree Emerging Markets Small-Cap Dividend Fund | 10,724 | 464,993 | ||||||
|
| |||||||
| 4,547,103 | ||||||||
|
| |||||||
Equity (13.86%) |
| |||||||
Health Care Select Sector | 28,149 | 945,525 | ||||||
iShares® MSCI EAFE Index Fund | 24,072 | 1,260,651 | ||||||
PowerShares International Dividend Achievers Portfolio | 194,184 | 2,953,538 | ||||||
Vanguard MSCI European ETF | 64,792 | 2,958,403 | ||||||
|
| |||||||
| 8,118,117 | ||||||||
|
| |||||||
Fixed Income / Corporate Bonds (8.05%) |
| |||||||
Vanguard Short-Term Corporate Bond ETF | 60,387 | 4,716,225 | ||||||
|
| |||||||
Fixed Income / High Yield (17.37%) |
| |||||||
PowerShares Fundamental High Yield Corporate Bond Portfolio | 182,268 | 3,324,568 | ||||||
SPDR® Barclays Capital High Yield Bond ETF | 175,807 | 6,851,199 | ||||||
|
| |||||||
| 10,175,767 | ||||||||
|
| |||||||
Growth (6.16%) |
| |||||||
PowerShares S&P 500 Low Volatility Portfolio | 144,231 | 3,611,544 | ||||||
|
| |||||||
TOTAL EXCHANGE TRADED FUNDS |
| |||||||
(Cost $39,018,737) |
| 39,293,789 | ||||||
|
| |||||||
| Shares | Value (Note 1) | ||||||||||
EXCHANGE TRADED NOTES (2.55%) |
| |||||||||||
Master Limited Partnerships (MLPs) (2.55%) | ||||||||||||
JPMorgan Alerian MLP Index ETN | 39,837 | $1,493,091 | ||||||||||
|
| |||||||||||
TOTAL EXCHANGE TRADED NOTES (Cost $1,435,231) |
| 1,493,091 | ||||||||||
|
| |||||||||||
7-Day Yield | Shares | Value (Note 1) | ||||||||||
SHORT TERM INVESTMENTS (1.81%) |
| |||||||||||
Money Market Fund (1.81%) |
| |||||||||||
Dreyfus Cash | 0.050 | % | 1,060,311 | 1,060,311 | ||||||||
|
| |||||||||||
TOTAL SHORT TERM INVESTMENTS (Cost $1,060,311) |
| 1,060,311 | ||||||||||
|
| |||||||||||
TOTAL INVESTMENTS (99.56%) (Cost $56,784,467) |
| $58,337,835 | ||||||||||
Other Assets In Excess Of |
| 260,493 | ||||||||||
|
| |||||||||||
NET ASSETS (100.00%) |
| $58,598,328 | ||||||||||
|
| |||||||||||
| (a) | Non-Income Producing Security. |
| (b) | Affiliated Company. See Note 6 to Financial Statements. |
Common Abbreviations:
EAFE - Europe, Australia, and Far East.
ETF - Exchange Traded Fund.
ETN - Exchange Traded Note.
MLP - Master Limited Partnership.
MSCI - Morgan Stanley Capital International.
S&P - Standard and Poor’s.
SPDR - Standard and Poor’s Depositary Receipt.
For Fund compliance purposes, the Fund’s industry classifications refer to any one or more of the industry sub-classifications used by one or more widely recognized market indexes or ratings group indexes, and/or as defined by Fund management. This definition may not apply for purposes of this report, which may combine industry subclassifications for reporting ease. Industries are shown as a percent of net assets. These industry classifications are based on third party definitions and are unaudited. The definitions are industry terms and do not reflect the legal status of any of the investments or the companies in which the Fund has invested.
See Notes to Financial Statements.
| 59 | October 31, 2011 |
Table of Contents
October 31, 2011 (Unaudited)
| ||||
| ALPS | Red Rocks Listed Private Equity Fund | ALPS | WMC Value Intersection Fund | Clough China Fund | |||||||||
ASSETS | ||||||||||||
Investments, at value | $ | 135,316,329 | $ | 67,986,836 | $ | 68,620,765 | ||||||
Foreign currency, at value (Cost $485,145 and $6,626,283, respectively) | 477,615 | – | 6,656,071 | |||||||||
Receivable for investments sold | 221,766 | 1,167,605 | 2,736,084 | |||||||||
Receivable for shares sold | 92,718 | 360 | 48,700 | |||||||||
Dividends and interest receivable | 128,883 | 52,775 | 115 | |||||||||
Prepaid expenses and other assets | 30,399 | 18,422 | 20,665 | |||||||||
Total Assets | 136,267,710 | 69,225,998 | 78,082,400 | |||||||||
LIABILITIES | ||||||||||||
Payable for investments purchased | 528,615 | 839,874 | 2,608,249 | |||||||||
Payable for shares redeemed | 108,407 | 5,455 | 60,201 | |||||||||
Investment advisory fees payable | 32,048 | 40,852 | 70,138 | |||||||||
Administration and transfer agency fees payable | 20,486 | 16,909 | 16,652 | |||||||||
Distribution and services fees payable | 25,547 | 8,448 | 16,664 | |||||||||
Directors’ fees and expenses payable | 1,966 | 3,618 | 1,825 | |||||||||
Overdraft payable to custodian | 19 | – | – | |||||||||
Accrued expenses and other liabilities | 85,808 | 37,597 | 62,623 | |||||||||
Total Liabilities | 802,896 | 952,753 | 2,836,352 | |||||||||
NET ASSETS | $ | 135,464,814 | $ | 68,273,245 | $ | 75,246,048 | ||||||
NET ASSETS CONSIST OF | ||||||||||||
Paid-in capital | $ | 158,465,966 | $ | 73,329,935 | $ | 77,143,032 | ||||||
Undistributed/(overdistributed) net investment income | (6,200,916 | ) | 443,540 | 394,581 | ||||||||
Accumulated net realized loss on investments and foreign currency transactions | (15,930,263 | ) | (11,047,476 | ) | (3,083,714 | ) | ||||||
Net unrealized appreciation/(depreciation) on investments and translation of assets and liabilities denominated in foreign currencies | (869,973 | ) | 5,547,246 | 792,149 | ||||||||
NET ASSETS | $ | 135,464,814 | $ | 68,273,245 | $ | 75,246,048 | ||||||
INVESTMENTS, AT COST | $ | 136,186,941 | $ | 62,439,590 | $ | 67,858,169 | ||||||
See Notes to Financial Statements.
| 60 | October 31, 2011 |
Table of Contents
Statements of Assets and Liabilities | ||||
October 31, 2011 (Unaudited)
| ||||
| ALPS | Red Rocks Listed Private Equity Fund | ALPS | WMC Value Fund | Clough China Fund | |||||||||
PRICING OF SHARES | ||||||||||||
Class A: | ||||||||||||
| Net Asset Value, offering and redemption price per share(a) | $ | 4.93 | $ | 7.62 | $ | 17.18 | ||||||
| Net Assets | $ | 73,320,332 | $ | 41,448,818 | $ | 31,029,455 | ||||||
Shares of beneficial interest outstanding | 14,871,656 | 5,439,972 | 1,806,358 | |||||||||
Maximum offering price per share ((NAV/0.9450), | $ | 5.22 | $ | 8.06 | $ | 18.18 | ||||||
Class C: | ||||||||||||
| Net Asset Value, offering and redemption price per share(a) | $ | 4.86 | $ | 7.57 | $ | 16.75 | ||||||
| Net Assets | $ | 2,786,235 | $ | 11,895 | $ | 12,589,640 | ||||||
Shares of beneficial interest outstanding | 573,133 | 1,571 | 751,473 | |||||||||
Class I: | ||||||||||||
| Net Asset Value, offering and redemption price per share | $ | 4.96 | $ | 7.69 | $ | 17.43 | ||||||
| Net Assets | $ | 59,251,093 | $ | 26,812,532 | $ | 31,626,953 | ||||||
Shares of beneficial interest outstanding | 11,953,077 | 3,488,312 | 1,815,006 | |||||||||
Class R: | ||||||||||||
| Net Asset Value, offering and redemption price per share | 4.45 | N/A | N/A | |||||||||
| Net Assets | 107,154 | N/A | N/A | |||||||||
Shares of beneficial interest outstanding | 24,066 | N/A | N/A | |||||||||
| (a) | Redemption price per share may be reduced for any applicable contingent deferred sales charge. For a description of a possible sales charge, please see the Fund’s Prospectus. |
See Notes to Financial Statements.
| 61 | October 31, 2011 |
Table of Contents
Statements of Assets and Liabilities | ||||
October 31, 2011 (Unaudited)
| ||||
| RiverFront Long-Term Growth Fund | RiverFront Long-Term Growth & Income Fund | RiverFront Moderate Growth Fund | RiverFront Moderate Growth & Income Fund | ||||||||||||
ASSETS | ||||||||||||||||
Investments, at value | $ | 54,202,605 | $ | 22,315,943 | $ | 25,582,322 | $ | 57,392,310 | ||||||||
Investments in affiliates, at value | 2,090,836 | 443,254 | 853,275 | 945,525 | ||||||||||||
Cash | 213 | – | 55 | – | ||||||||||||
Receivable for shares sold | – | 29,021 | 15,925 | 319,070 | ||||||||||||
Dividends and interest receivable | 25,916 | 11,971 | 7,869 | 35,335 | ||||||||||||
Prepaid expenses and other assets | 40,385 | 25,574 | 24,393 | 30,794 | ||||||||||||
Total Assets | 56,359,955 | 22,825,763 | 26,483,839 | 58,723,034 | ||||||||||||
LIABILITIES | ||||||||||||||||
Payable for investments purchased | – | – | 3,492,637 | – | ||||||||||||
Payable for shares redeemed | 145,397 | 3,721 | – | 9,409 | ||||||||||||
Investment advisory fees payable | 23,937 | 9,096 | 5,401 | 30,799 | ||||||||||||
Administration and transfer agency fees payable | 5,899 | 2,313 | 1,835 | 4,960 | ||||||||||||
Distribution and services fees payable | 9,434 | 10,522 | 9,870 | 29,544 | ||||||||||||
Directors’ fees and expenses payable | 1,147 | 98 | 1,152 | 898 | ||||||||||||
Overdraft payable to custodian | – | 25 | – | 33,446 | ||||||||||||
Accrued expenses and other liabilities | 14,837 | 14,213 | 21,320 | 15,650 | ||||||||||||
Total Liabilities | 200,651 | 39,988 | 3,532,215 | 124,706 | ||||||||||||
NET ASSETS | $ | 56,159,304 | $ | 22,785,775 | $ | 22,951,624 | $ | 58,598,328 | ||||||||
NET ASSETS CONSIST OF | ||||||||||||||||
Paid-in capital | $ | 50,885,180 | $ | 23,428,960 | $ | 24,208,740 | $ | 58,549,170 | ||||||||
Undistributed net investment income | 190,435 | 28,088 | 15,244 | 62,852 | ||||||||||||
Accumulated net realized gain/(loss) on investments | 2,348,875 | (812,181 | ) | (832,584 | ) | (1,567,062 | ) | |||||||||
Net unrealized appreciation/(depreciation) on investments | 2,734,814 | 140,908 | (439,776 | ) | 1,553,368 | |||||||||||
NET ASSETS | $ | 56,159,304 | $ | 22,785,775 | $ | 22,951,624 | $ | 58,598,328 | ||||||||
INVESTMENTS, AT COST | $ | 51,404,149 | $ | 22,153,921 | $ | 26,000,584 | $ | 55,796,644 | ||||||||
INVESTMENTS IN AFFILIATES, AT COST | $ | 2,154,478 | $ | 464,368 | $ | 874,789 | $ | 987,823 | ||||||||
See Notes to Financial Statements.
| 62 | October 31, 2011 |
Table of Contents
Statements of Assets and Liabilities | ||||
October 31, 2011 (Unaudited)
| ||||
RiverFront Long-Term Growth Fund | RiverFront Long-Term Growth & Income Fund | RiverFront Moderate Growth Fund | RiverFront Moderate Growth & Income Fund | |||||||||||||
PRICING OF SHARES | ||||||||||||||||
Class A: | ||||||||||||||||
Net Asset Value, offering and redemption price per share(a) | $ | 13.50 | $ | 10.69 | $ | 10.26 | $ | 10.49 | ||||||||
Net Assets | $ | 6,401,659 | $ | 5,782,649 | $ | 8,977,628 | $ | 14,762,258 | ||||||||
Shares of beneficial interest outstanding (unlimited number of shares, no par value common stock authorized) | 474,233 | 541,098 | 875,102 | 1,406,692 | ||||||||||||
Maximum offering price pre share ((NAV/.9450), based on maximum sales change of 5.50% of the offering price) | $ | 14.29 | $ | 11.31 | $ | 10.86 | $ | 11.10 | ||||||||
Class C: | ||||||||||||||||
Net Asset Value, offering and redemption price per share(a) | $ | 13.41 | $ | 10.60 | $ | 10.20 | $ | 10.47 | ||||||||
Net Assets | $ | 6,955,926 | $ | 11,321,192 | $ | 10,219,921 | $ | 33,122,769 | ||||||||
Shares of beneficial interest outstanding (unlimited number of shares, no par value common stock authorized) | 518,739 | 1,068,094 | 1,001,482 | 3,164,638 | ||||||||||||
Class I: | ||||||||||||||||
Net Asset Value, offering and redemption price per share | $ | 13.53 | $ | 10.62 | $ | 10.07 | $ | 10.48 | ||||||||
Net Assets | $ | 5,179,852 | $ | 5,681,934 | $ | 3,754,075 | $ | 10,713,301 | ||||||||
Shares of beneficial interest outstanding (unlimited number of shares, no par value common stock authorized) | 382,863 | 535,158 | 372,920 | 1,021,957 | ||||||||||||
Class L: | ||||||||||||||||
Net Asset Value, offering and redemption price per share | $ | 13.51 | N/A | N/A | N/A | |||||||||||
Net Assets | $ | 25,656,442 | N/A | N/A | N/A | |||||||||||
Shares of beneficial interest outstanding (unlimited number of shares, no par value common stock authorized) | 1,898,567 | N/A | N/A | N/A | ||||||||||||
Investor Class: | ||||||||||||||||
Net Asset Value, offering and redemption price per share | $ | 13.45 | N/A | N/A | N/A | |||||||||||
Net Assets | $ | 11,965,425 | N/A | N/A | N/A | |||||||||||
Shares of beneficial interest outstanding (unlimited number of shares, no par value common stock authorized) | 889,810 | N/A | N/A | N/A | ||||||||||||
| (a) | Redemption price per share may be reduced for any applicable contingent deferred sales charge. For a description of a possible sales charge, please see the Fund’s Prospectus. |
See Notes to Financial Statements.
| 63 | October 31, 2011 |
Table of Contents
Consolidated Statements of Assets and Liabilities | ||||
October 31, 2011 (Unaudited)
| ||||
ALPS | Kotak India Growth Fund(a) | Jefferies Asset Management Commodity Strategy Allocation Fund(b) | |||||||
ASSETS | ||||||||
Investments, at value | $ | 3,537,783 | $ | 125,612,943 | ||||
Cash | 41,524 | 64,282 | ||||||
Foreign currency, at value (Cost $375,678 and $158,565, respectively) | 376,229 | 153,687 | ||||||
Foreign currency held at broker for futures contracts(Cost $59,866 and $0, respectively) | 58,027 | – | ||||||
Unrealized appreciation on total return swap contracts | – | 5,607,187 | ||||||
Receivable for investments sold | 103,333 | 2,265,060 | ||||||
Receivable for shares sold | – | 771,836 | ||||||
Variation margin receivable | 2,812 | 153,577 | ||||||
Deposit held with broker for futures contracts | – | 1,464,921 | ||||||
Dividends and interest receivable | 2,698 | 209,685 | ||||||
Prepaid offering costs | 26,866 | – | ||||||
Prepaid expenses and other assets | 35,595 | 34,671 | ||||||
Total Assets | 4,184,867 | 136,337,849 | ||||||
LIABILITIES | ||||||||
Payable for investments purchased | 139,978 | 4,506,587 | ||||||
Payable for variation margin | – | 1,492,073 | ||||||
Payable due to broker for futures contracts | 2,870 | – | ||||||
Payable for shares redeemed | – | 57,909 | ||||||
Unrealized depreciation on total return swap contracts | – | 384,018 | ||||||
Total return swap payable | – | 32,501 | ||||||
Investment advisory fees payable | – | 73,485 | ||||||
Administration and transfer agency fees payable | 23,442 | 16,774 | ||||||
Distribution and services fees payable | 1,062 | 35,454 | ||||||
Directors’ fees and expenses payable | 1,209 | – | ||||||
Accrued expenses and other liabilities | 62,243 | 111,352 | ||||||
Total Liabilities | 230,804 | 6,710,153 | ||||||
NET ASSETS | $ | 3,954,063 | $ | 129,627,696 | ||||
NET ASSETS CONSIST OF | ||||||||
Paid-in capital | $ | 4,438,817 | $ | 141,447,758 | ||||
Undistributed/(overdistributed) net investment income | (841 | ) | 2,282,930 | |||||
Accumulated net realized loss on investments, futures contracts, swap contracts and foreign currency transactions | (190,275 | ) | (21,336,958 | ) | ||||
Net unrealized appreciation/(depreciation) on investments, futures contracts, swap contracts and translation of assets and liabilities denominated in foreign currencies | (293,638 | ) | 7,233,966 | |||||
NET ASSETS | $ | 3,954,063 | $ | 129,627,696 | ||||
INVESTMENTS, AT COST | $ | 3,832,672 | $ | 122,226,247 | ||||
See Notes to Financial Statements.
| 64 | October 31, 2011 |
Table of Contents
Consolidated Statements of Assets and Liabilities | ||||
October 31, 2011 (Unaudited)
| ||||
| ALPS | Kotak India Growth Fund(a) | Jefferies Asset Management Commodity Strategy Allocation Fund(b) | |||||||
PRICING OF SHARES | ||||||||
Class A: | ||||||||
Net Asset Value, offering and redemption price per share(c) | $ | 8.67 | $ | 11.77 | ||||
Net Assets | $ | 1,472,084 | $ | 41,169,143 | ||||
Shares of beneficial interest outstanding | 169,786 | 3,496,392 | ||||||
Maximum offering price per share ((NAV/0.9450), | $ | 9.17 | $ | 12.46 | ||||
Class C: | ||||||||
Net Asset Value, offering and redemption price per share(c) | $ | 8.62 | $ | 11.69 | ||||
Net Assets | $ | 794,897 | $ | 12,840,079 | ||||
Shares of beneficial interest outstanding | 92,222 | 1,098,363 | ||||||
Class I: | ||||||||
Net Asset Value, offering and redemption price per share | $ | 8.69 | $ | 11.74 | ||||
Net Assets | $ | 1,687,082 | $ | 75,618,474 | ||||
Shares of beneficial interest outstanding | 194,215 | 6,440,628 | ||||||
| (a) | Consolidated Statement of Assets and Liabilities for ALPS | Kotak India Growth Fund is consolidated and includes the balances of Kotak Mauritius Portfolio (wholly owned subsidiary). Accordingly, all interfund balances have been eliminated. |
| (b) | Consolidated Statement of Assets and Liabilities for Jefferies Asset Management Commodity Strategy Allocation Fund is consolidated and includes the balances of Jefferies Asset Management Cayman Trust (wholly-owned subsidiary). Accordingly, all interfund balances have been eliminated. |
| (c) | Redemption price per share may be reduced for any applicable contingent deferred sales charge. For a description of a possible sales charge, please see the Fund’s Prospectus. |
See Notes to Financial Statements.
| 65 | October 31, 2011 |
Table of Contents
For the Six Months Ended October 31, 2011 (Unaudited)
| ||||
| ALPS | Red Rocks Listed Private Equity Fund | ALPS | WMC Value Intersection Fund | Clough China Fund | ||||||||||
INVESTMENT INCOME | ||||||||||||
Dividends | $ | 2,683,144 | $ | 735,327 | $ | 1,505,743 | ||||||
Foreign taxes withheld on dividends | (194,180 | ) | – | (83,742 | ) | |||||||
Interest and other income | – | 403 | 868 | |||||||||
Total Investment Income | 2,488,964 | 735,730 | 1,422,869 | |||||||||
EXPENSES | ||||||||||||
Investment advisory fee | 705,818 | 334,681 | 604,532 | |||||||||
Administrative and transfer agency fee | 127,174 | 83,350 | 78,778 | |||||||||
Distribution and service fees | ||||||||||||
Class A | 201,338 | 54,425 | 47,469 | |||||||||
Class C | 14,790 | 61 | 75,281 | |||||||||
Class R | 298 | N/A | N/A | |||||||||
Legal fees | 4,338 | 708 | 2,936 | |||||||||
Audit fees | 16,917 | 8,913 | 12,489 | |||||||||
Networking fees | ||||||||||||
Class A | 15,070 | – | 6,409 | |||||||||
Class C | 1,021 | – | 5,495 | |||||||||
Class I | 37,584 | – | 10,109 | |||||||||
Class R | 47 | N/A | N/A | |||||||||
Reports to shareholders and printing fees | 31,505 | 12,693 | 18,490 | |||||||||
State registration fees | 35,450 | 17,667 | 20,670 | |||||||||
Insurance | 6,432 | 3,278 | 4,122 | |||||||||
Custody fees | 71,411 | 5,050 | 46,844 | |||||||||
Directors’ fees and expenses | 10,463 | 6,881 | 5,812 | |||||||||
Repayment of previously waived fees | 3,417 | – | – | |||||||||
Miscellaneous | 23,376 | 4,626 | 7,231 | |||||||||
Total Expenses | 1,306,449 | 532,333 | 946,667 | |||||||||
Less fees waived/reimbursed by investment advisor | ||||||||||||
Class A | (84,156 | ) | (44,844 | ) | (23,389 | ) | ||||||
Class C | (1,585 | ) | (13 | ) | (12,337 | ) | ||||||
Class I | (41,757 | ) | (27,852 | ) | (26,929 | ) | ||||||
Class R | (60 | ) | N/A | N/A | ||||||||
Net Expenses | 1,178,891 | 459,624 | 884,012 | |||||||||
Net Investment Income | 1,310,073 | 276,106 | 538,857 | |||||||||
Net realized gain/(loss) on investments | 106,721 | 1,665,984 | (2,518,960 | ) | ||||||||
Net realized gain/(loss) on foreign currency transactions | 2,037,612 | – | (79,575 | ) | ||||||||
Net change in unrealized depreciation on investments | (51,099,932 | ) | (11,073,789 | ) | (16,291,429 | ) | ||||||
Net change in unrealized appreciation/(depreciation) on translation of assets and liabilities denominated in foreign currencies | (6,892 | ) | – | 25,749 | ||||||||
NET REALIZED AND UNREALIZED LOSS ON INVESTMENTS | (48,962,491 | ) | (9,407,805 | ) | (18,864,215 | ) | ||||||
NET DECREASE IN NET ASSETS RESULTING FROM OPERATIONS | $ | (47,652,418 | ) | $ | (9,131,699 | ) | $ | (18,325,358 | ) | |||
See Notes to Financial Statements.
| 66 | October 31, 2011 |
Table of Contents
Statements of Operations | ||
For the Six Months Ended October 31, 2011 (Unaudited) |
RiverFront Long-Term Growth Fund | RiverFront Long-Term Growth & Income Fund | RiverFront Moderate Growth Fund | RiverFront Moderate Growth & Income Fund | |||||||||||||
INVESTMENT INCOME | ||||||||||||||||
Dividends | $ | 479,058 | $ | 246,990 | $ | 161,956 | $ | 638,275 | ||||||||
Dividends from affiliated securities | 11,534 | 4,263 | 3,259 | 8,533 | ||||||||||||
Foreign taxes withheld on dividends | – | (1,141 | ) | – | (2,609 | ) | ||||||||||
Interest and other income | 836 | 294 | 326 | 910 | ||||||||||||
Total Investment Income | 491,428 | 250,406 | 165,541 | 645,109 | ||||||||||||
EXPENSES | ||||||||||||||||
Investment advisory fee | 311,714 | 94,458 | 80,456 | 226,687 | ||||||||||||
Administrative and transfer agent fee | 40,287 | 13,231 | 11,666 | 28,762 | ||||||||||||
Distribution and service fees | ||||||||||||||||
Class A | 11,737 | 8,647 | 6,876 | 16,643 | ||||||||||||
Class C | 32,869 | 51,471 | 49,556 | 143,014 | ||||||||||||
Investor Class | 20,125 | N/A | N/A | N/A | ||||||||||||
Legal fees | 548 | 1,366 | 1,177 | 3,141 | ||||||||||||
Audit fees | 8,844 | 8,698 | 8,698 | 8,698 | ||||||||||||
Reports to shareholders and printing fees | 9,276 | 3,244 | 3,102 | 7,438 | ||||||||||||
State registration fees | 22,044 | 16,225 | 16,329 | 18,518 | ||||||||||||
Insurance | 4,593 | 64 | 43 | 138 | ||||||||||||
Custody fees | 10,260 | 9,764 | 22,218 | 9,319 | ||||||||||||
Directors’ fees and expenses | 4,321 | 2,204 | 2,029 | 2,182 | ||||||||||||
Miscellaneous | 8,337 | 3,434 | 3,898 | 5,545 | ||||||||||||
Total Expenses | 484,955 | 212,806 | 206,048 | 470,085 | ||||||||||||
Less fees waived/reimbursed by investment advisor | ||||||||||||||||
Class A | (22,500 | ) | (13,807 | ) | (17,145 | ) | (12,026 | ) | ||||||||
Class C | (16,301 | ) | (20,830 | ) | (30,855 | ) | (26,101 | ) | ||||||||
Class I | (11,872 | ) | (7,851 | ) | (7,751 | ) | (7,832 | ) | ||||||||
Class L | (78,320 | ) | N/A | N/A | N/A | |||||||||||
Investor Class | (38,758 | ) | N/A | N/A | N/A | |||||||||||
Net Expenses | 317,204 | 170,318 | 150,297 | 424,126 | ||||||||||||
Net Investment Income | 174,224 | 80,088 | 15,244 | 220,983 | ||||||||||||
Net realized loss on investments | (985,809 | ) | (791,631 | ) | (841,939 | ) | (1,519,433 | ) | ||||||||
Net realized loss on investments - affilated securities | (62,360 | ) | (1,641 | ) | (454 | ) | – | |||||||||
Net change in unrealized appreciation/ (depreciation) on investments | (10,683,170 | ) | (1,151,167 | ) | (1,355,498 | ) | (919,464 | ) | ||||||||
NET REALIZED AND UNREALIZED LOSS ON INVESTMENTS | (11,731,339 | ) | (1,944,439 | ) | (2,197,891 | ) | (2,438,897 | ) | ||||||||
NET DECREASE IN NET ASSETS RESULTING FROM OPERATIONS | $ | (11,557,115 | ) | $ | (1,864,351 | ) | $ | (2,182,647 | ) | $ | (2,217,914 | ) | ||||
See Notes to Financial Statements.
| 67 | October 31, 2011 |
Table of Contents
Consolidated Statements of Operations | ||
For the Six Months Ended October 31, 2011 (Unaudited) |
ALPS | Kotak India Growth Fund(a) | Jefferies Asset Management Commodity Strategy Allocation Fund(b) | |||||||
INVESTMENT INCOME | ||||||||
Dividends | $ | 32,693 | $ | 443,197 | ||||
Foreign taxes withheld on dividends | – | (37,962 | ) | |||||
Interest and other income | – | 1,571,337 | ||||||
Total Investment Income | 32,693 | 1,976,572 | ||||||
EXPENSES | ||||||||
Investment advisory fee | 19,562 | 543,253 | ||||||
Administrative and transfer agency fee | 66,022 | 113,623 | ||||||
Distribution and service fees | ||||||||
Class A | 2,484 | 82,274 | ||||||
Class C | 2,669 | 49,288 | ||||||
Legal fees | 1,449 | 4,517 | ||||||
Audit fees | 18,950 | 24,495 | ||||||
Networking fees | ||||||||
Class I | – | 38,415 | ||||||
Reports to shareholders and printing fees | 2,033 | 9,210 | ||||||
State registration fees | 6,064 | 20,653 | ||||||
Insurance | – | 513 | ||||||
Custody fees | 50,664 | 27,913 | ||||||
Directors’ fees and expenses | 2,982 | 9,422 | ||||||
Offering costs | 46,657 | 16,156 | ||||||
Miscellaneous | 6,827 | 6,803 | ||||||
Total Expenses | 226,363 | 946,535 | ||||||
Less fees waived/reimbursed by investment advisor | ||||||||
Class A | (77,853 | ) | (33,852 | ) | ||||
Class C | (33,860 | ) | (8,236 | ) | ||||
Class I | (84,459 | ) | (63,391 | ) | ||||
Net Expenses | 30,191 | 841,056 | ||||||
Net Investment Income | 2,502 | 1,135,516 | ||||||
Net realized loss on investments | (143,239 | ) | (6,608,669 | ) | ||||
Net realized gain/(loss) on futures contracts | (26,906 | ) | 1,271,830 | |||||
Net realized loss on total return swap contracts | – | (15,860,634 | ) | |||||
Net realized loss on foreign currency transactions | (23,602 | ) | (322,274 | ) | ||||
Net change in unrealized depreciation on investments | (330,354 | ) | (1,057,154 | ) | ||||
Net change in unrealized appreciation/(depreciation) on futures contracts | 8,037 | (1,566,124 | ) | |||||
Net change in unrealized appreciation on total return swap contracts | – | 4,684,659 | ||||||
Net change in unrealized appreciation/(depreciation) on translation of assets and liabilities denominated in foreign currencies | (2,021 | ) | 359 | |||||
NET REALIZED AND UNREALIZED LOSS ON INVESTMENTS | (518,085 | ) | (19,458,007 | ) | ||||
NET DECREASE IN NET ASSETS RESULTING FROM OPERATIONS | $ | (515,583 | ) | $ | (18,322,491 | ) | ||
| (a) | Consolidated Statement of Operations for ALPS | Kotak India Growth Fund is consolidated and includes the balances of Kotak Mauritius Portfolio (wholly owned subsidiary). Accordingly, all interfund balances have been eliminated. |
| (b) | Consolidated Statement of Operations for Jefferies Asset Management Commodity Strategy Allocation Fund is consolidated and includes the balances of Jefferies Asset Management Cayman Trust (wholly-owned subsidiary). Accordingly, all interfund balances have been eliminated. |
See Notes to Financial Statements.
| 68 | October 31, 2011 |
Table of Contents
| ||
ALPS | Red Rocks Listed Private Equity Fund | ||||||||
For the Six Months Ended October 31, 2011 (Unaudited) | For the Year Ended April 30, 2011 | |||||||
OPERATIONS | ||||||||
Net investment income | $ | 1,310,073 | $ | 981,581 | ||||
Net realized gain on investments and foreign currency transactions | 2,144,333 | 13,298,911 | ||||||
Net change in unrealized appreciation/(depreciation) on investments and translation of assets and liabilities denominated in foreign currencies | (51,106,824 | ) | 29,987,149 | |||||
Net Increase/(Decrease) in Net Assets Resulting from Operations | (47,652,418 | ) | 44,267,641 | |||||
DISTRIBUTIONS | ||||||||
Dividends to shareholders from net investment income | ||||||||
Class A | – | (5,899,806 | ) | |||||
Class C(a) | – | (94,035 | ) | |||||
Class I | – | (3,002,644 | ) | |||||
Class R | – | (3,513 | ) | |||||
Net Decrease in Net Assets from Distributions | – | (8,999,998 | ) | |||||
BENEFICIAL INTEREST TRANSACTIONS (NOTE 4) | ||||||||
Shares sold | ||||||||
Class A | 19,681,392 | 43,946,883 | ||||||
Class C(a) | 1,291,945 | 2,116,008 | ||||||
Class I | 20,433,632 | 31,556,257 | ||||||
Class R | 30,592 | 133,223 | ||||||
Dividends reinvested | ||||||||
Class A | – | 5,477,003 | ||||||
Class C(a) | – | 68,533 | ||||||
Class I | – | 1,434,792 | ||||||
Class R | – | 3,513 | ||||||
Shares redeemed | ||||||||
Class A | (41,385,806 | ) | (14,394,569 | ) | ||||
Class C(a) | (244,550 | ) | (5,350 | ) | ||||
Class I | (11,094,464 | ) | (23,491,255 | ) | ||||
Class R | (15,027 | ) | (47,561 | ) | ||||
Net Increase/(Decrease) in Net Assets Derived from Beneficial Interest Transactions | (11,302,286 | ) | 46,797,477 | |||||
Net increase/(decrease) in net assets | (58,954,704 | ) | 82,065,120 | |||||
NET ASSETS | ||||||||
Beginning of period | 194,419,518 | 112,354,398 | ||||||
End of period * | $ | 135,464,814 | $ | 194,419,518 | ||||
*Including overdistributed net investment income of: | $ | (6,200,916 | ) | $ | (7,510,989 | ) | ||
| (a) | Class C shares commenced operations on July 2, 2010 for the ALPS | Red Rocks Listed Private Equity Fund. |
See Notes to Financial Statements.
| 69 | October 31, 2011 |
Table of Contents
Statements of Changes in Net Assets | ||
ALPS | WMC Value Intersection Fund(a) | Clough China Fund | |||||||||||||||
| For the Six Months Ended October 31,2011 (Unaudited) | For the Year Ended | For the Six Months Ended October 31,2011 (Unaudited) | For the Year Ended April 30, 2011 | |||||||||||||
OPERATIONS | ||||||||||||||||
Net investment income/(loss) | $ | 276,106 | $ | 497,340 | $ | 538,857 | $ | (231,606 | ) | |||||||
Net realized gain/(loss) on investments and foreign currency transactions | 1,665,984 | 2,229,121 | (2,598,535 | ) | 4,642,130 | |||||||||||
Net change in unrealized appreciation/ (depreciation) on investments and translation of assets and liabilities denominated in foreign currencies | (11,073,789 | ) | 7,881,516 | (16,265,680 | ) | 7,698,970 | ||||||||||
Net Increase/(Decrease) in Net Assets Resulting from Operations | (9,131,699 | ) | 10,607,977 | (18,325,358 | ) | 12,109,494 | ||||||||||
DISTRIBUTIONS | ||||||||||||||||
Dividends to shareholders from net investment income | ||||||||||||||||
Class A | – | (401,895 | ) | – | (199,271 | ) | ||||||||||
Class C(b) | – | (68 | ) | – | (3,157 | ) | ||||||||||
Class I | – | (173,038 | ) | – | (225,291 | ) | ||||||||||
Net Decrease in Net Assets from Distributions | – | (575,001 | ) | – | (427,719 | ) | ||||||||||
BENEFICIAL INTEREST TRANSACTIONS (NOTE 4) |
| |||||||||||||||
Shares sold | ||||||||||||||||
Class A | 220,974 | 1,830,732 | 2,556,469 | 24,544,347 | ||||||||||||
Class C(b) | – | 10,070 | 1,426,308 | 11,178,373 | ||||||||||||
Class I | 1,950,760 | 12,722,957 | 2,548,791 | 24,427,700 | ||||||||||||
Dividends reinvested | ||||||||||||||||
Class A | – | 384,676 | – | 132,703 | ||||||||||||
Class C(b) | – | 68 | – | 1,344 | ||||||||||||
Class I | – | 173,038 | – | 103,992 | ||||||||||||
Shares redeemed | ||||||||||||||||
Class A | (1,938,662 | ) | (5,419,274 | ) | (8,355,363 | ) | (14,519,282 | ) | ||||||||
Class C(b) | – | (68 | ) | (2,578,024 | ) | (3,597,895 | ) | |||||||||
Class I | (992,140 | ) | (3,685,425 | ) | (4,544,370 | ) | (2,794,871 | ) | ||||||||
Net Increase/(Decrease) in Net Assets Derived from Benefical Interest Transactions | (759,068 | ) | 6,016,774 | (8,946,189 | ) | 39,476,411 | ||||||||||
Net increase/(decrease) in net assets | (9,890,767 | ) | 16,049,750 | (27,271,547 | ) | 51,158,186 | ||||||||||
NET ASSETS | ||||||||||||||||
Beginning of period | 78,164,012 | 62,114,262 | 102,517,595 | 51,359,409 | ||||||||||||
End of period * | $ | 68,273,245 | $ | 78,164,012 | $ | 75,246,048 | $ | 102,517,595 | ||||||||
*Including undistributed/(overdistributed) net investment income of: | $ | 443,540 | $ | 167,434 | $ | 394,581 | $ | (144,276 | ) | |||||||
| (a) | Prior to August 31, 2010, the ALPS | WMC Value Intersection Fund was known as the Activa Value Fund. |
| (b) | Class C shares commenced operations on July 2, 2010 for the ALPS | WMC Value Intersection Fund. |
See Notes to Financial Statements.
| 70 | October 31, 2011 |
Table of Contents
Statements of Changes in Net Assets | ||||
RiverFront Long-Term Growth Fund | ||||||||||||||||||
| For the Six Months Ended October 31, 2011 (Unaudited) | For the Period April 30, 2011(a) | For the Year Ended | ||||||||||||||||
OPERATIONS | ||||||||||||||||||
Net investment income | $ | 174,224 | $ | 16,211 | $ | 677,810 | ||||||||||||
Net realized gain/(loss) on investments | (985,809 | ) | 2,595,174 | 1,387,125 | ||||||||||||||
Net realized gain/(loss) on investments - affiliated securities | (62,360 | ) | 81,251 | (410 | ) | |||||||||||||
Net change in unrealized appreciation/(depreciation) on investments | (10,683,170 | ) | 2,761,426 | 5,485,730 | ||||||||||||||
Net Increase/(Decrease) in Net Assets Resulting from Operations | (11,557,115 | ) | 5,454,062 | 7,550,255 | ||||||||||||||
DISTRIBUTIONS | ||||||||||||||||||
Dividends to shareholders from net investment income | ||||||||||||||||||
Class A | – | – | (17,765 | ) | ||||||||||||||
Class C | – | – | (16,050 | ) | ||||||||||||||
Class I | – | – | (7,114 | ) | ||||||||||||||
Class L | – | – | (433,125 | ) | ||||||||||||||
Investor Class | – | – | (189,956 | ) | ||||||||||||||
Dividends to shareholders from net realized gains | ||||||||||||||||||
Class A | – | – | (17,553 | ) | ||||||||||||||
Class C | – | – | (17,494 | ) | ||||||||||||||
Class I | – | – | (6,746 | ) | ||||||||||||||
Class L | – | – | (401,355 | ) | ||||||||||||||
Investor Class | – | – | (221,742 | ) | ||||||||||||||
Dividends to shareholders from tax return of capital | ||||||||||||||||||
Class A | – | – | – | |||||||||||||||
Class C | – | – | – | |||||||||||||||
Class I | – | – | – | |||||||||||||||
Class L | – | – | – | |||||||||||||||
Investor Class | – | – | – | |||||||||||||||
Net Decrease in Net Assets from Distributions | – | – | (1,328,900 | ) | ||||||||||||||
BENEFICIAL INTEREST TRANSACTIONS (NOTE 4) | ||||||||||||||||||
Shares sold | ||||||||||||||||||
Class A | 1,797,817 | 9,892,152 | 1,873,880 | |||||||||||||||
Class C | 2,217,586 | 4,004,850 | 1,977,787 | |||||||||||||||
Class I | 2,114,790 | 2,025,191 | 2,241,130 | |||||||||||||||
Class L | 2,380,263 | 3,420,948 | 17,118,139 | |||||||||||||||
Investor Class | 202,102 | 680,249 | 10,282,445 | |||||||||||||||
Dividends reinvested | ||||||||||||||||||
Class A | – | – | 30,821 | |||||||||||||||
Class C | – | – | 32,260 | |||||||||||||||
Class I | – | – | 10,823 | |||||||||||||||
Class L | – | – | 803,434 | |||||||||||||||
Investor Class | – | – | 372,558 | |||||||||||||||
Shares redeemed | ||||||||||||||||||
Class A | (5,967,911 | ) | (110,731 | ) | (8,866 | ) | ||||||||||||
Class C | (458,422 | ) | (189,168 | ) | – | |||||||||||||
Class I | (758,587 | ) | (62,593 | ) | – | |||||||||||||
Class L | (14,281,442 | ) | (6,570,126 | ) | (6,407,084 | ) | ||||||||||||
Investor Class | (6,747,420 | ) | (4,386,252 | ) | (3,134,097 | ) | ||||||||||||
Net Increase/(Decrease) in Net Assets Derived from Beneficial Interest Transcations | (19,501,224 | ) | 8,704,520 | 25,193,230 | ||||||||||||||
Net increase/(decrease) in net assets | (31,058,339 | ) | 14,158,582 | 31,414,585 | ||||||||||||||
Net Assets | ||||||||||||||||||
Beginning of period | 87,217,643 | 73,059,061 | 41,644,476 | |||||||||||||||
End of period * | $ | 56,159,304 | $ | 87,217,643 | $ | 73,059,061 | ||||||||||||
*Including undistributed net investment income of : | $ | 190,435 | $ | 16,211 | $ | 12,313 | ||||||||||||
| (a) | Effective March 8, 2011, the Board approved changing the fiscal year end of the Fund from December 31 to April 30. |
See Notes to Financial Statements.
| 71 | October 31, 2011 |
Table of Contents
Statements of Changes in Net Assets | ||
| RiverFront Long-Term Growth & Income Fund | ||||||||
| For the Six Months Ended October 31, 2011 (Unaudited) | For the Period August 2, 2010 (Inception) to April 30, 2011 | |||||||
OPERATIONS | ||||||||
Net investment income | $ | 80,088 | $ | 57,899 | ||||
Net realized loss on investments | (791,631 | ) | (20,246 | ) | ||||
Net realized loss on investments-affiliated securities | (1,641 | ) | – | |||||
Net change in unrealized appreciation/(depreciation) on investments | (1,151,167 | ) | 1,292,075 | |||||
Net Increase/(Decrease) in Net Assets Resulting from Operations | (1,864,351 | ) | 1,329,728 | |||||
DISTRIBUTIONS | ||||||||
Dividends to shareholders from net investment income | ||||||||
Class A | (21,037 | ) | (15,716 | ) | ||||
Class C | (19,760 | ) | (17,218 | ) | ||||
Class I | (11,203 | ) | (21,546 | ) | ||||
Dividends to shareholders from net realized gains | ||||||||
Class A | – | (824 | ) | |||||
Class C | – | (1,199 | ) | |||||
Class I | – | (382 | ) | |||||
Dividends to shareholders from tax return of capital | ||||||||
Class A | – | (542 | ) | |||||
Class C | – | (593 | ) | |||||
Class I | – | (743 | ) | |||||
Net Decrease in Net Assets from Distributions | (52,000 | ) | (58,763 | ) | ||||
BENEFICIAL INTEREST TRANSACTIONS (NOTE 4) | ||||||||
Shares sold | ||||||||
Class A | 3,690,207 | 5,357,498 | ||||||
Class C | 3,469,340 | 8,597,674 | ||||||
Class I | 3,220,341 | 3,066,587 | ||||||
Dividends reinvested | ||||||||
Class A | 20,480 | 16,672 | ||||||
Class C | 18,587 | 18,501 | ||||||
Class I | 11,055 | 22,175 | ||||||
Shares redeemed | ||||||||
Class A | (2,917,579 | ) | (45,073 | ) | ||||
Class C | (466,762 | ) | (41,242 | ) | ||||
Class I | (590,493 | ) | (16,807 | ) | ||||
Net Increase in Net Assets Derived from Beneficial Interest Transcations | 6,455,176 | 16,975,985 | ||||||
Net increase in net assets | 4,538,825 | 18,246,950 | ||||||
Net Assets | ||||||||
Beginning of period | 18,246,950 | – | ||||||
End of period* | $ | 22,785,775 | $ | 18,246,950 | ||||
*Including undistributed net investment income of: | $ | 28,088 | $ | – | ||||
See Notes to Financial Statements.
| 72 | October 31, 2011 |
Table of Contents
Statements of Changes in Net Assets | ||
| RiverFront Moderate Growth Fund | RiverFront Moderate Growth & Income Fund | |||||||||||||||
| For the Six Months Ended October 31, 2011 (Unaudited) | For the Period August 2, 2010 (Inception) to April 30, 2011 | For the Six Months Ended October 31, 2011 (Unaudited) | For the Period August 2, 2010 (Inception) to April 30, 2011 | |||||||||||||
OPERATIONS | ||||||||||||||||
Net investment income | $ | 15,244 | $ | 24,069 | $ | 220,983 | $ | 241,925 | ||||||||
Net realized gain/(loss) on investments | (841,939 | ) | 13,320 | (1,519,433 | ) | (53,228 | ) | |||||||||
Net realized gain/(loss) on investments - affiliated securities | (454 | ) | 3,246 | – | – | |||||||||||
Net change in unrealized appreciation/ (depreciation) on investments | (1,355,498 | ) | 915,722 | (919,464 | ) | 2,472,832 | ||||||||||
Net Increase/(Decrease) in Net Assets Resulting from Operations | (2,182,647 | ) | 956,357 | (2,217,914 | ) | 2,661,529 | ||||||||||
DISTRIBUTIONS | ||||||||||||||||
Dividends to shareholders from net investment income | ||||||||||||||||
Class A | – | (11,628 | ) | (77,441 | ) | (63,382 | ) | |||||||||
Class C | – | (2,887 | ) | (51,226 | ) | (88,032 | ) | |||||||||
Class I | – | (16,490 | ) | (57,818 | ) | (54,282 | ) | |||||||||
Dividends to shareholders from net realized gains | ||||||||||||||||
Class A | – | – | – | (1,103 | ) | |||||||||||
Class C | – | – | – | (2,552 | ) | |||||||||||
Class I | – | – | – | (720 | ) | |||||||||||
Dividends to shareholders from tax return of capital | ||||||||||||||||
Class A | – | – | – | – | ||||||||||||
Class C | – | – | – | – | ||||||||||||
Class I | – | – | – | – | ||||||||||||
Net Decrease in Net Assets from Distributions | – | (31,005 | ) | (186,485 | ) | (210,071 | ) | |||||||||
BENEFICIAL INTEREST TRANSACTIONS (NOTE 4) | ||||||||||||||||
Shares sold | ||||||||||||||||
Class A | 5,830,923 | 4,504,410 | 7,823,848 | 12,858,464 | ||||||||||||
Class C | 3,236,079 | 8,470,366 | 11,503,547 | 23,157,729 | ||||||||||||
Class I | 2,588,039 | 1,882,771 | 5,055,672 | 7,392,425 | ||||||||||||
Dividends reinvested | ||||||||||||||||
Class A | – | 10,502 | 70,325 | 57,036 | ||||||||||||
Class C | – | 2,839 | 41,475 | 73,322 | ||||||||||||
Class I | – | 16,490 | 52,313 | 52,429 | ||||||||||||
Shares redeemed | ||||||||||||||||
Class A | (876,497 | ) | (161,953 | ) | (4,625,125 | ) | (1,394,094 | ) | ||||||||
Class C | (653,774 | ) | (32,609 | ) | (1,159,986 | ) | (576,368 | ) | ||||||||
Class I | (508,110 | ) | (100,557 | ) | (1,503,337 | ) | (328,406 | ) | ||||||||
Net Increase in Net Assets Derived from Beneficial Interest Transactions | 9,616,660 | 14,592,259 | 17,258,732 | 41,292,537 | ||||||||||||
Net increase in net assets | 7,434,013 | 15,517,611 | 14,854,333 | 43,743,995 | ||||||||||||
Net Assets | ||||||||||||||||
Beginning of period | 15,517,611 | – | 43,743,995 | – | ||||||||||||
End of period * | $ | 22,951,624 | $ | 15,517,611 | $ | 58,598,328 | $ | 43,743,995 | ||||||||
*Including undistributed net investment income of: | $ | 15,244 | $ | – | $ | 62,852 | $ | 28,354 | ||||||||
See Notes to Financial Statements.
| 73 | October 31, 2011 |
Table of Contents
Consolidated Statements of Changes in Net Assets | ||
| ALPS | Kotak India Growth Fund(a) | Jefferies Asset Management Commodity Strategy Allocation Fund(b) | |||||||||||||||
| For the Six Months Ended October 31, 2011 (Unaudited) | For the Period February 14, 2011 (Inception) to April 30, 2011 | For the Six Months Ended October 31, 2011 (Unaudited) | For the Period June 29, 2010, (Inception) to April 30, 2011 | |||||||||||||
OPERATIONS | ||||||||||||||||
Net investment income/(loss) | $ | 2,502 | $ | (3,001 | ) | $ | 1,135,516 | $ | 332,214 | |||||||
Net realized gain/(loss) on investments, futures contracts, swap contracts and foreign currency transactions | (193,747 | ) | 2,518 | (21,519,747 | ) | 8,730,347 | ||||||||||
Net change in unrealized appreciation/ (depreciation) on investments, futures contracts, swap contracts and translation of assets and liabilities denominated in foreign currencies | (324,338 | ) | 30,700 | 2,061,740 | 5,172,226 | |||||||||||
Net Increase/(Decrease) in Net Assets Resulting from Operations | (515,583 | ) | 30,217 | (18,322,491 | ) | 14,234,787 | ||||||||||
DISTRIBUTIONS | ||||||||||||||||
Dividends to shareholders from net investment income | ||||||||||||||||
Class A | – | – | (1,743,726 | ) | (528,187 | ) | ||||||||||
Class C | – | – | (399,871 | ) | (173,053 | ) | ||||||||||
Class I | – | – | (3,443,154 | ) | (1,491,694 | ) | ||||||||||
Net Decrease in Net Assets from Distributions | – | – | (5,586,751 | ) | (2,192,934 | ) | ||||||||||
BENEFICIAL INTEREST TRANSACTIONS (NOTE 4) | ||||||||||||||||
Shares sold | ||||||||||||||||
Class A | 918,313 | 920,378 | 21,893,633 | 40,033,145 | ||||||||||||
Class C | 411,344 | 452,986 | 7,691,194 | 7,949,510 | ||||||||||||
Class I | 1,346,113 | 568,500 | 24,934,791 | 69,266,578 | ||||||||||||
Dividends reinvested | ||||||||||||||||
Class A | – | – | 1,406,931 | 468,992 | ||||||||||||
Class C | – | – | 285,723 | 132,186 | ||||||||||||
Class I | – | – | 2,550,793 | 916,223 | ||||||||||||
Shares redeemed | ||||||||||||||||
Class A | (152,980 | ) | (3,827 | ) | (11,324,229 | ) | (6,229,163 | ) | ||||||||
Class C | – | – | (784,561 | ) | (1,406,988 | ) | ||||||||||
Class I | (21,398 | ) | – | (11,159,347 | ) | (5,130,326 | ) | |||||||||
Net Increase in Net Assets Derived from Beneficial Interest Transactions | 2,501,392 | 1,938,037 | 35,494,928 | 106,000,157 | ||||||||||||
Net increase in net assets | 1,985,809 | 1,968,254 | 11,585,686 | 118,042,010 | ||||||||||||
NET ASSETS | ||||||||||||||||
Beginning of period | 1,968,254 | – | 118,042,010 | – | ||||||||||||
End of period * | $ | 3,954,063 | $ | 1,968,254 | $ | 129,627,696 | $ | 118,042,010 | ||||||||
*Including undistributed/(overdistributed) net investment income of: | $ | (841 | ) | $ | (3,343 | ) | $ | 2,282,930 | $ | 6,734,165 | ||||||
| (a) | Consolidated Statement of Changes for ALPS | Kotak India Growth Fund is consolidated and includes the balances of Kotak Mauritius Portfolio (wholly owned subsidiary). Accordingly, all interfund balances have been eliminated. |
| (b) | Consolidated Statement of Changes for Jefferies Asset Management Commodity Strategy Allocation Fund is consolidated and includes the balances of Jefferies Asset Management Cayman Trust (wholly owned subsidiary). Accordingly, all interfund balances have been eliminated. |
See Notes to Financial Statements.
| 74 | October 31, 2011 |
Table of Contents
| ||
Selected data for a share of beneficial interest outstanding throughout the periods indicated: |
| ALPS | Red Rocks Listed Private Equity Fund - Class A | ||||||||||||||||||||
| For the Six Months Ended October 31, 2011 (Unaudited) | For the Year Ended April 30, 2011 | For the Year Ended April 30, 2010 | For the Year Ended April 30, 2009 | For the Period December 31, 2007 (Inception) to April 30, 2008 | ||||||||||||||||
Net asset value, beginning of period | $ | 6.44 | $ | 5.17 | $ | 3.56 | $ | 9.47 | $ | 10.00 | ||||||||||
INCOME/(LOSS) FROM INVESTMENT OPERATIONS: | ||||||||||||||||||||
Net investment income | 0.04 | (a) | 0.04 | (a) | 0.14 | 0.08 | (a) | 0.11 | ||||||||||||
Net realized and unrealized gain/(loss) | (1.55 | ) | 1.61 | 1.99 | (5.97 | ) | (0.64 | ) | ||||||||||||
Total from investment operations | (1.51 | ) | 1.65 | 2.13 | (5.89 | ) | (0.53 | ) | ||||||||||||
DISTRIBUTIONS: | ||||||||||||||||||||
From net investment income | – | (0.38 | ) | (0.52 | ) | (0.03 | ) | – | ||||||||||||
From net realized gains | – | – | – | (0.00 | )(b) | – | ||||||||||||||
Total distributions | – | (0.38 | ) | (0.52 | ) | (0.03 | ) | – | ||||||||||||
REDEMPTION FEES ADDED TO PAID-IN CAPITAL (NOTE 4) | 0.00 | (b) | 0.00 | (b) | 0.00 | (b) | 0.01 | – | ||||||||||||
Net increase/(decrease) in net asset value | (1.51 | ) | 1.27 | 1.61 | (5.91 | ) | (0.53 | ) | ||||||||||||
Net asset value, end of period | $ | 4.93 | $ | 6.44 | $ | 5.17 | $ | 3.56 | $ | 9.47 | ||||||||||
TOTAL RETURN(c) | (23.45 | )% | 33.22 | % | 61.68 | % | (62.01 | )% | (5.30 | )% | ||||||||||
RATIOS/SUPPLEMENTAL DATA: | ||||||||||||||||||||
Net assets, end of period (000s) | $ | 73,320 | $ | 124,874 | $ | 67,192 | $ | 27,860 | $ | 832 | ||||||||||
Ratio of net investment income to average net assets | 1.52 | %(d) | 0.67 | % | 0.42 | % | 2.16 | % | 4.68 | %(d) | ||||||||||
Ratio of expenses to average net assets including fee waivers and reimbursements/ repayment of previously waived fees | 1.50 | %(d) | 1.50 | % | 1.44 | %(e) | 1.25 | % | 1.25 | %(d) | ||||||||||
Ratio of expenses to average net assets excluding fee waivers and reimbursements/ repayment of previously waived fees | 1.67 | %(d) | 1.70 | % | 1.71 | % | 2.08 | % | 39.07 | %(d) | ||||||||||
Portfolio turnover rate(f) | 38 | % | 43 | % | 54 | % | 59 | % | 15 | % | ||||||||||
| (a) | Calculated using the average shares method. |
| (b) | Less than $0.005 and $(0.005) per share. |
| (c) | Total returns are for the period indicated and have not been annualized. Total returns would have been lower had certain expenses not been waived during the period. Returns shown do not reflect the deduction of taxes that a shareholder would pay on Fund distributions or the redemption of Fund shares. Returns shown exclude any applicable sales charges. |
| (d) | Annualized. |
| (e) | Effective September 1, 2009, the net expense ratio limitation changed from 1.00% to 1.25%. |
| (f) | Portfolio turnover rate for periods less than one full year have not been annualized. |
See Notes to Financial Statements.
| 75 | October 31, 2011 |
Table of Contents
Financial Highlights | ||
Selected data for a share of beneficial interest outstanding throughout the periods indicated: |
| ALPS | Red Rocks Listed Private Equity Fund - Class C | ||||||||
| For the Six Months Ended October 31, 2011 (Unaudited) | For the Period July 2, 2010 (Inception) to April 30, 2011 | |||||||
Net asset value, beginning of period | $ | 6.37 | $ | 4.39 | ||||
INCOME/(LOSS) FROM INVESTMENT OPERATIONS: | ||||||||
Net investment income/(loss) | 0.02 | (a) | (0.01 | )(a) | ||||
Net realized and unrealized gain/(loss) | (1.53 | ) | 2.36 | |||||
Total from investment operations | (1.51 | ) | 2.35 | |||||
DISTRIBUTIONS: | ||||||||
From net investment income | – | (0.37 | ) | |||||
Total distributions | – | (0.37 | ) | |||||
REDEMPTION FEES ADDED TO PAID-IN CAPITAL (NOTE 4) | 0.00 | (b) | 0.00 | (b) | ||||
Net increase/(decrease) in net asset value | (1.51 | ) | 1.98 | |||||
Net asset value, end of period | $ | 4.86 | $ | 6.37 | ||||
TOTAL RETURN(c) | (23.82 | )% | 55.32 | % | ||||
RATIOS/SUPPLEMENTAL DATA: | ||||||||
Net assets, end of period (000s) | $ | 2,786 | $ | 2,566 | ||||
Ratio of net investment income/(loss) to average net assets | 0.71 | %(d) | (0.19 | )%(d) | ||||
Ratio of expenses to average net assets including fee waivers and reimbursements/repayment of previously waived fees | 2.25 | %(d) | 2.25 | %(d) | ||||
Ratio of expenses to average net assets excluding fee waivers and reimbursements/ repayment of previously waived fees | 2.36 | %(d) | 2.31 | %(d) | ||||
Portfolio turnover rate(e) | 38 | % | 43 | %(f) | ||||
| (a) | Calculated using the average shares method. |
| (b) | Less than $0.005 per share. |
| (c) | Total returns are for the period indicated and have not been annualized. Total returns would have been lower had certain expenses not been waived during the period. Returns shown do not reflect the deduction of taxes that a shareholder would pay on Fund distributions or the redemption of Fund shares. Returns shown exclude any applicable sales charges. |
| (d) | Annualized. |
| (e) | Portfolio turnover rate for periods less than one full year have not been annualized. |
| (f) | Portfolio turnover rate is calculated at the Fund level and represents the year ended April 30, 2011. |
See Notes to Financial Statements.
| 76 | October 31, 2011 |
Table of Contents
Financial Highlights | ||
Selected data for a share of beneficial interest outstanding throughout the periods indicated: |
| ALPS | Red Rocks Listed Private Equity Fund - Class I | ||||||||||||||||||||
| For the Six Months Ended October 31, 2011 (Unaudited) | For the Year Ended April 30, 2011 | For the Year Ended April 30, 2010 | For the Year Ended April 30, 2009 | For the Period December 31, 2007 (Inception) to April 30, 2008 | ||||||||||||||||
Net asset value, beginning of period | $ | 6.47 | $ | 5.19 | $ | 3.57 | $ | 9.47 | $ | 10.00 | ||||||||||
INCOME/(LOSS) FROM INVESTMENT OPERATIONS: | ||||||||||||||||||||
Net investment income | 0.05 | (a) | 0.05 | (a) | 0.28 | 0.10 | (a) | 0.13 | ||||||||||||
Net realized and unrealized gain/(loss) | (1.56 | ) | 1.62 | 1.87 | (5.97 | ) | (0.66 | ) | ||||||||||||
Total from investment operations | (1.51 | ) | 1.67 | 2.15 | (5.87 | ) | (0.53 | ) | ||||||||||||
DISTRIBUTIONS: | ||||||||||||||||||||
From net investment income | – | (0.39 | ) | (0.53 | ) | (0.05 | ) | – | ||||||||||||
From net realized gains | – | – | – | (0.00 | )(b) | – | ||||||||||||||
Total distributions | – | (0.39 | ) | (0.53 | ) | (0.05 | ) | – | ||||||||||||
REDEMPTION FEES ADDED TO PAID IN CAPITAL (NOTE 4) | 0.00 | (b) | 0.00 | (b) | 0.00 | (b) | 0.02 | – | ||||||||||||
Net increase/(decrease) in net asset value | (1.51 | ) | 1.28 | 1.62 | (5.90 | ) | (0.53 | ) | ||||||||||||
Net asset value, end of period | $ | 4.96 | $ | 6.47 | $ | 5.19 | $ | 3.57 | $ | 9.47 | ||||||||||
TOTAL RETURN(c) | (23.34 | )% | 33.47 | % | 62.09 | % | (61.79 | )% | (5.30 | )% | ||||||||||
RATIOS/SUPPLEMENTAL DATA: | ||||||||||||||||||||
Net assets, end of period (000s) | $ | 59,251 | $ | 66,854 | $ | 45,144 | $ | 12,938 | $ | 21 | ||||||||||
Ratio of net investment income to average net assets | 1.72 | %(d) | 0.91 | % | 0.78 | % | 2.56 | % | 6.11 | %(d) | ||||||||||
Ratio of expenses to average net assets including fee waivers and reimbursements/ repayment of previously waived fees | 1.25 | %(d) | 1.25 | % | 1.19 | %(e) | 1.00 | % | 1.00 | %(d) | ||||||||||
Ratio of expenses to average net assets excluding fee waivers and reimbursements/ repayment of previously waived fees | 1.38 | %(d) | 1.36 | % | 1.47 | % | 2.05 | % | 35.33 | %(d) | ||||||||||
Portfolio turnover rate(f) | 38 | % | 43 | % | 54 | % | 59 | % | 15 | % | ||||||||||
| (a) | Calculated using the average shares method. |
| (b) | Less than $0.005 and $(0.005) per share. |
| (c) | Total returns are for the period indicated and have not been annualized. Total returns would have been lower had certain expenses not been waived during the period. Returns shown do not reflect the deduction of taxes that a shareholder would pay on Fund distributions or the redemption of Fund shares. Returns shown exclude any applicable sales charges. |
| (d) | Annualized. |
| (e) | Effective September 1, 2009, the net expense ratio limitation changed from 1.00% to 1.25%. |
| (f) | Portfolio turnover rate for periods less than one full year have not been annualized. |
See Notes to Financial Statements.
| 77 | October 31, 2011 |
Table of Contents
Financial Highlights | ||
Selected data for a share of beneficial interest outstanding throughout the periods indicated: |
| ALPS | Red Rocks Listed Private Equity Fund - Class R | ||||||||||||||||||||
| For the Six Months Ended October 31, 2011 (Unaudited) | For the Year Ended April 30, 2011 | For the Year Ended April 30, 2010 | For the Year Ended April 30, 2009 | For the Period December 31, 2007 (Inception) to April 30, 2008 | ||||||||||||||||
Net asset value, beginning of period | $ | 5.82 | $ | 4.73 | $ | 3.31 | $ | 9.46 | $ | 10.00 | ||||||||||
INCOME/(LOSS) FROM INVESTMENT OPERATIONS: | ||||||||||||||||||||
Net investment income/(loss) | 0.03 | (a) | 0.03 | (a) | (0.09 | ) | 0.15 | (a) | 0.12 | |||||||||||
Net realized and unrealized gain/(loss) | (1.40 | ) | 1.43 | 2.02 | (6.05 | ) | (0.66 | ) | ||||||||||||
Total from investment operations | (1.37 | ) | 1.46 | 1.93 | (5.90 | ) | (0.54 | ) | ||||||||||||
DISTRIBUTIONS: | ||||||||||||||||||||
From net investment income | – | (0.37 | ) | (0.51 | ) | (0.26 | ) | – | ||||||||||||
From net realized gains | – | – | – | (0.00 | )(b) | – | ||||||||||||||
Total distributions | – | (0.37 | ) | (0.51 | ) | (0.26 | ) | – | ||||||||||||
REDEMPTION FEES ADDED TO PAID IN CAPITAL (NOTE 4) | – | – | – | 0.01 | – | |||||||||||||||
Net increase/(decrease) in net asset value | (1.37 | ) | 1.09 | 1.42 | (6.15 | ) | (0.54 | ) | ||||||||||||
Net asset value, end of period | $ | 4.45 | $ | 5.82 | $ | 4.73 | $ | 3.31 | $ | 9.46 | ||||||||||
TOTAL RETURN(c) | (23.67 | )% | 32.47 | % | 60.92 | % | (62.10 | )% | (5.40 | )% | ||||||||||
RATIOS/SUPPLEMENTAL DATA: | ||||||||||||||||||||
Net assets, end of period (000s) | $ | 107 | $ | 125 | $ | 18 | $ | – | (d) | $ | 1 | |||||||||
Ratio of net investment income/(loss) to average net assets | 1.21 | %(e) | 0.66 | % | (0.24 | )% | 2.72 | % | 3.90 | %(e) | ||||||||||
Ratio of expenses to average net assets including fee waivers and reimbursements/ repayment of previously waived fees | 1.75 | %(e) | 1.75 | % | 1.75 | %(f) | 1.50 | % | 1.50 | %(e) | ||||||||||
Ratio of expenses to average net assets excluding fee waivers and reimbursements/repayment of previously waived fees | 1.85 | %(e) | 1.87 | % | 2.27 | % | 6.08 | % | 43.39 | %(e) | ||||||||||
Portfolio turnover rate(g) | 38 | % | 43 | % | 54 | % | 59 | % | 15 | % | ||||||||||
| (a) | Calculated using the average shares method. |
| (b) | Less than $(0.005) per share. |
| (c) | Total returns are for the period indicated and have not been annualized. Total returns would have been lower had certain expenses not been waived during the period. Returns shown do not reflect the deduction of taxes that a shareholder would pay on Fund distributions or the redemption of Fund shares. Returns shown exclude any applicable sales charges. |
| (d) | Less than $500. |
| (e) | Annualized. |
| (f) | Effective September 1, 2009, the net expense ratio limitation changed from 1.50% to 1.75%. |
| (g) | Portfolio turnover rate for periods less than one full year have not been annualized. |
See Notes to Financial Statements.
| 78 | October 31, 2011 |
Table of Contents
Financial Highlights | ||
Selected data for a share of beneficial interest outstanding throughout the periods indicated: |
ALPS | WMC Value Intersection Fund(a) - Class A | ||||||||||||||||||||||||||||
| For the Six Months Ended October 31, 2011 | For the Year Ended April 30, | For the Period January 1, 2010 to April 30, | For the Years Ended December 31, | |||||||||||||||||||||||||
| (Unaudited) | 2011 | 2010(b) | 2009 | 2008 | 2007 | 2006 | ||||||||||||||||||||||
Net asset value, beginning of period | $ | 8.64 | $ | 7.43 | $ | 6.92 | $ | 5.86 | $ | 9.35 | $ | 9.81 | $ | 8.65 | ||||||||||||||
INCOME/ (LOSS) FROM INVESTMENT OPERATIONS: | ||||||||||||||||||||||||||||
Net investment income | 0.03 | (c) | 0.06 | (c) | 0.03 | 0.07 | 0.08 | 0.14 | 0.13 | |||||||||||||||||||
Net realized and unrealized gain/(loss) | (1.05 | ) | 1.22 | 0.48 | 1.06 | (3.49 | ) | 0.09 | 1.49 | |||||||||||||||||||
Total from investment operations | (1.02 | ) | 1.28 | 0.51 | 1.13 | (3.41 | ) | 0.23 | 1.62 | |||||||||||||||||||
DISTRIBUTIONS: | ||||||||||||||||||||||||||||
From net investment income | – | (0.07 | ) | – | (0.07 | ) | (0.08 | ) | (0.14 | ) | (0.13 | ) | ||||||||||||||||
From net realized gains | – | – | – | – | – | (0.55 | ) | (0.33 | ) | |||||||||||||||||||
Total distributions | – | (0.07 | ) | – | (0.07 | ) | (0.08 | ) | (0.69 | ) | (0.46 | ) | ||||||||||||||||
Net increase/(decrease) in net asset value | (1.02 | ) | 1.21 | 0.51 | 1.06 | (3.49 | ) | (0.46 | ) | 1.16 | ||||||||||||||||||
Net asset value, end of period | $ | 7.62 | $ | 8.64 | $ | 7.43 | $ | 6.92 | $ | 5.86 | $ | 9.35 | $ | 9.81 | ||||||||||||||
TOTAL RETURN(d) | (11.81 | )% | 17.34 | % | 7.22 | % | 19.24 | % | (36.45 | )% | 2.43 | % | 18.80 | % | ||||||||||||||
RATIOS/SUPPLEMENTAL DATA: | ||||||||||||||||||||||||||||
Net assets, end of period (000s) | $ | 41,449 | $ | 48,899 | $ | 45,300 | $ | 62,264 | $ | 53,841 | $ | 88,679 | $ | 125,459 | ||||||||||||||
Ratio of net investment income to average net assets | 0.69 | %(e) | 0.77 | % | 0.60 | %(e) | 1.12 | % | 1.1 | % | 1.4 | % | 1.4 | % | ||||||||||||||
Ratio of expenses to average net assets including fee waivers and reimbursements | 1.40 | %(e) | 1.40 | % | 1.40 | %(e) | 1.62 | % | 1.5 | % | 1.2 | % | 1.1 | % | ||||||||||||||
Ratio of expenses to average net assets excluding fee waivers and reimbursements | 1.61 | %(e) | 1.71 | % | 1.70 | %(e) | N/A | N/A | N/A | N/A | ||||||||||||||||||
Portfolio turnover rate(f) | 28 | % | 44 | % | 11 | % | 56 | % | 83 | % | 52 | % | 64 | % | ||||||||||||||
| (a) | Prior to August 31, 2010, the ALPS | WMC Value Intersection Fund was known as the Activa Value Fund. |
| (b) | Effective March 9, 2010, the Board approved changing the fiscal year-end of the Fund from December 31 to April 30. |
| (c) | Calculated using the average shares method. |
| (d) | Total returns are for the period indicated and have not been annualized. Total returns would have been lower had certain expenses not been waived during the period. Returns shown do not reflect the deduction of taxes that a shareholder would pay on Fund distributions or the redemption of Fund shares. Returns shown exclude any applicable sales charges. |
| (e) | Annualized. |
| (f) | Portfolio turnover rate for periods less than one full year have not been annualized. |
See Notes to Financial Statements.
| 79 | October 31, 2011 |
Table of Contents
Financial Highlights | ||
Selected data for a share of beneficial interest outstanding throughout the periods indicated: |
| ALPS | WMC Value Intersection Fund(a) - Class C | ||||||||
For the Six Months Ended | For the Period July 2, 2010 (Inception) to April 30, 2011 | |||||||
Net asset value, beginning of period | $ | 8.62 | $ | 6.40 | ||||
INCOME/(LOSS) FROM INVESTMENT OPERATIONS: | ||||||||
Net investment loss(b) | (0.00 | )(c) | (0.01 | ) | ||||
Net realized and unrealized gain/(loss) | (1.05 | ) | 2.27 | |||||
Total from investment operations | (1.05 | ) | 2.26 | |||||
DISTRIBUTIONS: | ||||||||
From net investment income | – | (0.04 | ) | |||||
Total distributions | – | (0.04 | ) | |||||
Net increase/(decrease) in net asset value | (1.05 | ) | 2.22 | |||||
Net asset value, end of period | $ | 7.57 | $ | 8.62 | ||||
TOTAL RETURN(d) | (12.18 | )% | 35.44 | % | ||||
RATIOS/SUPPLEMENTAL DATA: | ||||||||
Net assets, end of period (000s) | $ | 12 | $ | 14 | ||||
Ratio of net investment loss to average net assets | (0.06 | )%(e) | (0.09 | )%(e) | ||||
Ratio of expenses to average net assets including fee waivers and reimbursements | 2.15 | %(e) | 2.15 | %(e) | ||||
Ratio of expenses to average net assets excluding fee waivers and reimbursements | 2.36 | %(e) | 2.49 | %(e) | ||||
Portfolio turnover rate(f) | 28 | % | 44 | %(g) | ||||
| (a) | Prior to August 31, 2010, the ALPS | WMC Value Intersection Fund was known as the Activa Value Fund. |
| (b) | Calculated using the average shares method. |
| (c) | Less than $(0.005) per share. |
| (d) | Total returns are for the period indicated and have not been annualized. Total returns would have been lower had certain expenses not been waived during the period. Returns shown do not reflect the deduction of taxes that a shareholder would pay on Fund distributions or the redemption of Fund shares. Returns shown exclude any applicable sales charges. |
| (e) | Annualized. |
| (f) | Portfolio turnover rate for periods less than one full year have not been annualized. |
| (g) | Portfolio turnover rate is calculated at the Fund level and represents the year ended April 30, 2011. |
See Notes to Financial Statements.
| 80 | October 31, 2011 |
Table of Contents
Financial Highlights | ||
Selected data for a share of beneficial interest outstanding throughout the periods indicated: |
| ALPS WMC Value Intersection Fund(a) - Class I(b) | ||||||||||||||||||||||||||||
For the Six Months | For the Year Ended April 30, | For the Period January 1, 2010 to April 30, | For the Years Ended December 31, | |||||||||||||||||||||||||
| (Unaudited) | 2011 | 2010(c) | 2009 | 2008 | 2007 | 2006 | ||||||||||||||||||||||
Net asset value, beginning of period | $ | 8.71 | $ | 7.48 | $ | 6.96 | $ | 5.89 | $ | 9.41 | $ | 9.86 | $ | 8.69 | ||||||||||||||
INCOME/(LOSS) FROM INVESTMENT OPERATIONS: | ||||||||||||||||||||||||||||
Net investment income | 0.04 | (d) | 0.07 | (d) | 0.02 | 0.07 | 0.09 | 0.15 | 0.14 | |||||||||||||||||||
Net realized and unrealized gain/(loss) | (1.06 | ) | 1.24 | 0.50 | 1.08 | (3.52 | ) | 0.10 | 1.50 | |||||||||||||||||||
Total from investment operations | (1.02 | ) | 1.31 | 0.52 | 1.15 | (3.43 | ) | 0.25 | 1.64 | |||||||||||||||||||
DISTRIBUTIONS: | ||||||||||||||||||||||||||||
From net investment income | – | (0.08 | ) | – | (0.08 | ) | (0.09 | ) | (0.15 | ) | (0.14 | ) | ||||||||||||||||
From net realized gains | – | – | – | – | – | (0.55 | ) | (0.33 | ) | |||||||||||||||||||
Total distributions | – | (0.08 | ) | – | (0.08 | ) | (0.09 | ) | (0.70 | ) | (0.47 | ) | ||||||||||||||||
Net increase/(decrease) in net asset value | (1.02 | ) | 1.23 | 0.52 | 1.07 | (3.52 | ) | (0.45 | ) | 1.17 | ||||||||||||||||||
Net asset value, end of period | $ | 7.69 | $ | 8.71 | $ | 7.48 | $ | 6.96 | $ | 5.89 | $ | 9.41 | $ | 9.86 | ||||||||||||||
TOTAL RETURN(e) | (11.71 | )% | 17.67 | % | 7.47 | % | 19.59 | % | (36.38 | )% | 2.59 | % | 18.89 | % | ||||||||||||||
RATIOS/SUPPLEMENTAL DATA: | ||||||||||||||||||||||||||||
Net assets, end of period (000s) | $ | 26,813 | $ | 29,251 | $ | 16,814 | $ | 16,465 | $ | 3,658 | $ | 5,422 | $ | 4,956 | ||||||||||||||
Ratio of net investment income to average net assets | 0.94 | %(f) | 0.95 | % | 0.77 | %(f) | 1.17 | % | 1.3 | % | 1.4 | % | 1.4 | % | ||||||||||||||
Ratio of expenses to average net assets including fee waivers and reimbursements | 1.15 | %(f) | 1.15 | % | 1.15 | %(f) | 1.46 | % | 1.4 | % | 1.1 | % | 1.1 | % | ||||||||||||||
Ratio of expenses to average net assets excluding fee waivers and reimbursements | 1.36 | %(f) | 1.46 | % | 1.49 | %(f) | N/A | N/A | N/A | N/A | ||||||||||||||||||
Portfolio turnover rate(g) | 28 | % | 44 | % | 11 | % | 56 | % | 83 | % | 52 | % | 64 | % | ||||||||||||||
| (a) | Prior to August 31, 2010, the ALPS | WMC Value Intersection Fund was known as the Activa Value Fund. |
| (b) | Prior to close of business on August 28, 2009, Class I was known as Class R of the Predecessor Fund. |
| (c) | Effective March 9, 2010, the Board approved changing the fiscal year-end of the Fund from December 31 to April 30. |
| (d) | Calculated using the average shares method. |
| (e) | Total returns are for the period indicated and have not been annualized. Total returns would have been lower had certain expenses not been waived during the period. Returns shown do not reflect the deduction of taxes that a shareholder would pay on Fund distributions or the redemption of Fund shares. Returns shown exclude any applicable sales charges. |
| (f) | Annualized. |
| (g) | Portfolio turnover rate for periods less than one full year have not been annualized. |
See Notes to Financial Statements.
| 81 | October 31, 2011 |
Table of Contents
Financial Highlights | ||
Selected data for a share of beneficial interest outstanding throughout the periods indicated: |
| Clough China Fund - Class A^ | ||||||||||||
For the Six | For the | For the Period | ||||||||||
Net asset value, beginning of period | $ | 21.02 | $ | 18.21 | $ | 16.32 | ||||||
INCOME/(LOSS) FROM INVESTMENT OPERATIONS: | ||||||||||||
Net investment income/(loss) | 0.12 | (b) | (0.04 | )(b) | 0.10 | |||||||
Net realized and unrealized gain/(loss) | (3.96 | ) | 2.94 | 1.85 | ||||||||
Total from investment operations | (3.84 | ) | 2.90 | 1.95 | ||||||||
DISTRIBUTIONS: | ||||||||||||
From net investment income | – | (0.09 | ) | (0.07 | ) | |||||||
From net realized gains | – | – | – | |||||||||
Total distributions | – | (0.09 | ) | (0.07 | ) | |||||||
REDEMPTION FEES ADDED TO PAID IN CAPITAL (NOTE 4) | 0.00 | (d) | 0.00 | (b)(d) | 0.01 | |||||||
Net increase/(decrease) in net asset value | (3.84 | ) | 2.81 | 1.89 | ||||||||
Net asset value, end of period | $ | 17.18 | $ | 21.02 | $ | 18.21 | ||||||
TOTAL RETURN(e) | (18.22 | )% | 16.00 | % | 12.07 | % | ||||||
RATIOS/SUPPLEMENTAL DATA: | ||||||||||||
Net assets, end of period (000s) | $ | 31,029 | $ | 44,616 | $ | 28,695 | ||||||
Ratio of net investment income/(loss) to average net assets | 1.27 | %(f) | (0.22 | )% | (0.53 | )%(f) | ||||||
Ratio of expenses to average net assets including fee waivers and reimbursements | 1.95 | %(f) | 1.89 | %(i) | 1.87 | %(f)(g) | ||||||
Ratio of expenses to average net assets excluding fee waivers and reimbursements | 2.07 | %(f) | 2.07 | % | 2.24 | %(f) | ||||||
Portfolio turnover rate(h) | 101 | % | 170 | % | 110 | % | ||||||
| ^ | Prior to the close of business on January 15, 2010, the Clough China Fund was known as the Old Mutual China Fund. |
| (a) | Effective March 9, 2010, the Board approved changing the fiscal year-end of the Fund from July 31 to April 30. |
| (b) | Calculated using the average shares method. |
| (c) | Impact of payment by the affiliate was less than $0.01 per share and 0.01% respectively (See Note 2). |
| (d) | Less than $0.005 per share. |
| (e) | Total returns are for the period indicated and have not been annualized. Total returns would have been lower had certain expenses not been waived during the period. Returns shown do not reflect the deduction of taxes that a shareholder would pay on Fund distributions or the redemption of Fund shares. Returns shown exclude any applicable sales charges. |
| (f) | Annualized. |
| (g) | Effective January 1,2010, the net expense ratio limitation changed from 1.95% to 1.85%. |
| (h) | Portfolio turnover rate for periods less than one full year have not been annualized. |
| (i) | Effective January 1, 2011, the net expense ratio limitation changed from 1.85% to 1.95%. |
See Notes to Financial Statements.
| 82 | October 31, 2011 |
Table of Contents
Financial Highlights | ||
Selected data for a share of beneficial interest outstanding throughout the periods indicated: |
| For the Years Ended July 31, | For the Period December 30, 2005 (Inception) to | |||||||||||||
| 2009 | 2008 | 2007 | July 31, 2006 | |||||||||||
| $ | 15.81 | $ | 22.46 | $ | 13.23 | $ | 10.00 | |||||||
| 0.09 | (b) | (0.01 | )(b) | 0.06 | (b) | 0.01 | (b) | |||||||
| 0.62 | (c) | (1.73 | ) | 9.59 | 3.22 | |||||||||
| 0.71 | (1.74 | ) | 9.65 | 3.23 | ||||||||||
| (0.20 | ) | (0.03 | ) | (0.05 | ) | – | ||||||||
| – | (4.88 | ) | (0.37 | ) | – | |||||||||
| (0.20 | ) | (4.91 | ) | (0.42 | ) | – | ||||||||
| 0.00 | (b)(d) | – | – | – | ||||||||||
| 0.51 | (6.65 | ) | 9.23 | 3.23 | ||||||||||
| $ | 16.32 | $ | 15.81 | $ | 22.46 | $ | 13.23 | |||||||
| 5.00 | %(c) | (13.91 | )% | 73.81 | % | 32.30 | % | |||||||
| $ | 15,069 | $ | 17,927 | $ | 25,976 | $ | 2,532 | |||||||
| 0.70 | % | (0.06 | )% | 0.31 | % | 0.12 | %(f) | |||||||
| 1.95 | % | 2.02 | % | 2.10 | % | 2.10 | %(f) | |||||||
| 2.62 | % | 2.34 | % | 2.42 | % | 6.65 | %(f) | |||||||
| 120 | % | 178 | % | 193 | % | 51 | % | |||||||
See Notes to Financial Statements.
| 83 | October 31, 2011 |
Table of Contents
Financial Highlights | ||
Selected data for a share of beneficial interest outstanding throughout the periods indicated: |
Clough China Fund - Class C^ |
| |||||||||||
| For the Six Months Ended October 31, 2011 | For the Year Ended | For the Period August 1, 2009 to | ||||||||||
| (Unaudited) | April 30, 2011 | April 30, 2010(a) | ||||||||||
Net asset value, beginning of period | $ | 20.58 | $ | 17.89 | $ | 16.08 | ||||||
INCOME/(LOSS) FROM INVESTMENT OPERATIONS: | ||||||||||||
Net investment gain/(loss) | 0.05 | (b) | (0.21 | )(b) | (0.17 | ) | ||||||
Net realized and unrealized gain/(loss) | (3.88 | ) | 2.90 | 1.98 | ||||||||
Total from investment operations | (3.83 | ) | 2.69 | 1.81 | ||||||||
DISTRIBUTIONS: | ||||||||||||
From net investment income | – | (0.00 | )(d) | – | ||||||||
From net realized gains | – | – | – | |||||||||
Total distributions | – | (0.00 | )(d) | – | ||||||||
REDEMPTION FEES ADDED TO PAID IN CAPITAL (NOTE 4) | 0.00 | (d) | 0.00 | (d) | – | |||||||
Net increase/(decrease) in net asset value | (3.83 | ) | 2.69 | 1.81 | ||||||||
Net asset value, end of period | $ | 16.75 | $ | 20.58 | $ | 17.89 | ||||||
TOTAL RETURN(e) | (18.51 | )% | 15.13 | % | 11.26 | % | ||||||
RATIOS/SUPPLEMENTAL DATA: | ||||||||||||
Net assets, end of period (000s) | $ | 12,590 | $ | 16,848 | $ | 7,594 | ||||||
Ratio of net investment income/(loss) to average net assets | 0.49 | %(f) | (1.10 | )% | (1.26 | )%(f) | ||||||
Ratio of expenses to average net assets including fee waivers and reimbursements | 2.70 | %(f) | 2.70 | % | 2.70 | %(f) | ||||||
Ratio of expenses to average net assets excluding fee waivers and reimbursements | 2.86 | %(f) | 2.86 | % | 3.18 | %(f) | ||||||
Portfolio turnover rate(g) | 101 | % | 170 | % | 110 | % | ||||||
| ^ | Prior to the close of business on January 15, 2010, the Clough China Fund was known as the Old Mutual China Fund. |
| (a) | Effective March 9, 2010, the Board approved changing the fiscal year-end of the Fund from July 31 to April 30. |
| (b) | Calculated using the average shares method. |
| (c) | Impact of payment by the affiliate was less than $0.01 per share and 0.01% respectively (See Note 2). |
| (d) | Less than $0.005 per share and $(0.005) per share. |
| (e) | Total returns are for the period indicated and have not been annualized. Total returns would have been lower had certain expenses not been waived during the period. Returns shown do not reflect the deduction of taxes that a shareholder would pay on Fund distributions or the redemption of Fund shares. Returns shown exclude any applicable sales charges. |
| (f) | Annualized. |
| (g) | Portfolio turnover rate for periods less than one full year have not been annualized. |
See Notes to Financial Statements.
| 84 | October 31, 2011 |
Table of Contents
Financial Highlights | ||
Selected data for a share of beneficial interest outstanding throughout the periods indicated: |
| For the Years Ended July 31, | For the Period December 30, 2005 (Inception) to | |||||||||||||
| 2009 | 2008 | 2007 | July 31, 2006 | |||||||||||
| $ | 15.48 | $ | 22.26 | $ | 13.18 | $ | 10.00 | |||||||
| (0.01 | )(b) | (0.17 | )(b) | (0.06 | )(b) | (0.06 | )(b) | |||||||
| 0.65 | (c) | (1.64 | ) | 9.52 | 3.24 | |||||||||
| 0.64 | (1.81 | ) | 9.46 | 3.18 | ||||||||||
| (0.04 | ) | (0.09 | ) | (0.02 | ) | – | ||||||||
| – | (4.88 | ) | (0.37 | ) | – | |||||||||
| (0.04 | ) | (4.97 | ) | (0.39 | ) | – | ||||||||
| – | – | 0.01 | – | |||||||||||
| 0.60 | (6.78 | ) | 9.08 | 3.18 | ||||||||||
| $ | 16.08 | $ | 15.48 | $ | 22.26 | $ | 13.18 | |||||||
| 4.21 | %(c) | (14.49 | )% | 76.27 | % | 31.80 | % | |||||||
| $ | 8,267 | $ | 9,991 | $ | 15,497 | $ | 793 | |||||||
| (0.05 | )% | (0.85 | )% | (0.33 | )% | (0.76 | )%(f) | |||||||
| 2.70 | % | 2.77 | % | 2.85 | % | 2.85 | %(f) | |||||||
| 3.43 | % | 3.15 | % | 3.33 | % | 11.53 | %(f) | |||||||
| 120 | % | 178 | % | 193 | % | 51 | % | |||||||
See Notes to Financial Statements.
| 85 | October 31, 2011 |
Table of Contents
Financial Highlights | ||
Selected data for a share of beneficial interest outstanding throughout the periods indicated: |
| Clough China Fund - Class I(a) | ||||||||||||
| For the Six Months Ended October 31, 2011 | For the Year Ended | For the Period August 1, 2009 to | ||||||||||
| (Unaudited) | April 30, 2011 | April 30, 2010(b) | ||||||||||
Net asset value, beginning of period | $ | 21.30 | $ | 18.41 | $ | 16.52 | ||||||
INCOME/(LOSS) FROM INVESTMENT OPERATIONS: | ||||||||||||
Net investment income/(loss) | 0.14 | (c) | (0.01 | )(c) | 0.01 | |||||||
Net realized and unrealized gain/(loss) | (4.01 | ) | 3.03 | 2.03 | ||||||||
Total from investment operations | (3.87 | ) | 3.02 | 2.04 | ||||||||
DISTRIBUTIONS: | ||||||||||||
From net investment income | – | (0.13 | ) | (0.15 | ) | |||||||
From net realized gains | – | – | – | |||||||||
Total distributions | – | (0.13 | ) | (0.15 | ) | |||||||
REDEMPTION FEES ADDED TO PAID IN CAPITAL (NOTE 4) | 0.00 | (e) | 0.00 | (e) | – | |||||||
Net increase/(decrease) in net asset value | (3.87 | ) | 2.89 | 1.89 | ||||||||
Net asset value, end of period | $ | 17.43 | $ | 21.30 | $ | 18.41 | ||||||
TOTAL RETURN(f) | �� | (18.12 | )% | 16.45 | % | 12.36 | % | |||||
RATIOS/SUPPLEMENTAL DATA: | ||||||||||||
Net assets, end of period (000s) | $ | 31,627 | $ | 41,054 | $ | 15,071 | ||||||
Ratio of net investment income/(loss) to average net assets | 1.43 | %(g) | (0.03 | )% | 0.08 | %(g) | ||||||
Ratio of expenses to average net assets including fee waivers and reimbursements | 1.70 | %(g) | 1.53 | %(i) | 1.40 | %(g) | ||||||
Ratio of expenses to average net assets excluding fee waivers and reimbursements | 1.85 | %(g) | 1.85 | % | 1.86 | %(g) | ||||||
Portfolio turnover rate(h) | 101 | % | 170 | % | 110 | % | ||||||
| (a) | Prior to the close of business on January 15, 2010, Class I of the Clough China Fund was known as Institutional Class of the Old Mutual China Fund. |
| (b) | Effective March 9, 2010, the Board approved changing the fiscal year-end of the Fund from July 31 to April 30. |
| (c) | Calculated using the average shares method. |
| (d) | Impact of payment by the affiliate was less than $0.01 per share and 0.01%, respectively (See Note 2). |
| (e) | Less than $0.005 per share. |
| (f) | Total returns are for the period indicated and have not been annualized. Total returns would have been lower had certain expenses not been waived during the period. Returns shown do not reflect the deduction of taxes that a shareholder would pay on Fund distributions or the redemption of Fund shares. Returns shown exclude any applicable sales charges. |
| (g) | Annualized. |
| (h) | Portfolio turnover rate for periods less than one full year have not been annualized. |
| (i) | Effective January 1, 2011, the net expense ratio limitation changed from 1.40% to 1.70% |
See Notes to Financial Statements.
| 86 | October 31, 2011 |
Table of Contents
Financial Highlights | ||
Selected data for a share of beneficial interest outstanding throughout the periods indicated: |
| For the Years Ended July 31, | For the Period December 30, 2005 (Inception) to | |||||||||||||
| 2009 | 2008 | 2007 | July 31, 2006 | |||||||||||
| $ | 15.48 | $ | 22.26 | $ | 13.18 | $ | 10.00 | |||||||
| (0.01 | )(b) | (0.17 | )(b) | (0.06 | )(b) | (0.06 | )(b) | |||||||
| 0.65 | (c) | (1.64 | ) | 9.52 | 3.24 | |||||||||
| 0.64 | (1.81 | ) | 9.46 | 3.18 | ||||||||||
| (0.04 | ) | (0.09 | ) | (0.02 | ) | – | ||||||||
| – | (4.88 | ) | (0.37 | ) | – | |||||||||
| (0.04 | ) | (4.97 | ) | (0.39 | ) | – | ||||||||
| – | – | 0.01 | – | |||||||||||
| 0.60 | (6.78 | ) | 9.08 | 3.18 | ||||||||||
| $ | 16.08 | $ | 15.48 | $ | 22.26 | $ | 13.18 | |||||||
| 4.21 | %(c) | (14.49 | )% | 76.27 | % | 31.80 | % | |||||||
| $ | 8,267 | $ | 9,991 | $ | 15,497 | $ | 793 | |||||||
| (0.05 | )% | (0.85 | )% | (0.33 | )% | (0.76 | )%(f) | |||||||
| 2.70 | % | 2.77 | % | 2.85 | % | 2.85 | %(f) | |||||||
| 3.43 | % | 3.15 | % | 3.33 | % | 11.53 | %(f) | |||||||
| 120 | % | 178 | % | 193 | % | 51 | % | |||||||
See Notes to Financial Statements.
| 87 | October 31, 2011 |
Table of Contents
Financial Highlights | ||
Selected data for a share of beneficial interest outstanding throughout the periods indicated: |
| RiverFront Long-Term Growth Fund - Class A | ||||||||||||
| For the Six Months Ended October 31, 2011 (Unaudited) | For the Period January 1, 2011 to April 30, 2011(a) | For the Period September 27, 2010 (Inception) to December 31, 2010 | ||||||||||
Net asset value, beginning of period | $ | 15.65 | $ | 14.66 | $ | 13.68 | ||||||
INCOME/(LOSS) FROM INVESTMENT OPERATIONS: | ||||||||||||
Net investment income after reimbursements(b) | 0.03 | 0.00 | (c) | 0.23 | ||||||||
Net realized and unrealized gain/(loss) | (2.18 | ) | 0.99 | 1.03 | ||||||||
Total from investment operations | (2.15 | ) | 0.99 | 1.26 | ||||||||
DISTRIBUTIONS: | ||||||||||||
From net investment income after reimbursements | – | – | (0.14 | ) | ||||||||
From net realized gains | – | – | (0.14 | ) | ||||||||
Total distributions | – | – | (0.28 | ) | ||||||||
Net increase/(decrease) in net asset value | (2.15 | ) | 0.99 | 0.98 | ||||||||
Net asset value, end of period | $ | 13.50 | $ | 15.65 | $ | 14.66 | ||||||
TOTAL RETURN(d) | (13.74 | )% | 6.75 | % | 9.22 | % | ||||||
RATIOS/SUPPLEMENTAL DATA: | ||||||||||||
Net assets, end of period (000s) | $ | 6,402 | $ | 12,307 | $ | 1,934 | ||||||
Ratio of net investment income after reimbursements to average net assets | 0.46 | %(e) | 0.06 | %(e) | 6.20 | %(e) | ||||||
Ratio of expenses to average net assets including fee waivers and reimbursements (includes acquired fund fee reimbursements) | 0.98 | %(e) | 0.81 | %(e) | 0.91 | %(e) | ||||||
Ratio of expenses to average net assets including fee waivers and reimbursements (excludes acquired fund fee reimbursements) | 1.15 | %(e) | 1.15 | %(e) | 1.15 | %(e) | ||||||
Ratio of expenses to average net assets excluding fee waivers and reimbursements | 1.46 | %(e) | 1.58 | %(e) | 2.15 | %(e) | ||||||
Portfolio turnover rate(f) | 62 | % | 34 | % | 99 | % | ||||||
| (a) | Effective March 8, 2011, the Board approved changing the fiscal year-end of the Fund from December 31 to April 30. |
| (b) | Calculated using the average shares method. |
| (c) | Less than $0.005 per share. |
| (d) | Total returns are for the period indicated and have not been annualized. Total returns would have been lower had certain expenses not been waived during the period. Returns shown do not reflect the deduction of taxes that a shareholder would pay on Fund distributions or the redemption of Fund shares. Returns shown exclude any applicable sales charges. |
| (e) | Annualized. |
| (f) | Portfolio turnover rate for periods less than one full year have not been annualized. |
See Notes to Financial Statements.
| 88 | October 31, 2011 |
Table of Contents
Financial Highlights | ||
Selected data for a share of beneficial interest outstanding throughout the periods indicated: |
| RiverFront Long-Term Growth Fund - Class C | ||||||||||||
| For the Six Months Ended October 31, 2011 (Unaudited) | For the Period January 1, 2011 to April 30, 2011(a) | For the Period September 27, 2010 (Inception) to December 31, 2010 | ||||||||||
Net asset value, beginning of period | $ | 15.60 | $ | 14.63 | $ | 13.68 | ||||||
INCOME/(LOSS) FROM INVESTMENT OPERATIONS: | ||||||||||||
Net investment income/(loss) after reimbursements(b) | (0.02 | ) | (0.04 | ) | 0.20 | |||||||
Net realized and unrealized gain/(loss) | (2.17 | ) | 1.01 | 1.02 | ||||||||
Total from investment operations | (2.19 | ) | 0.97 | 1.22 | ||||||||
DISTRIBUTIONS: | ||||||||||||
From net investment income after reimbursements | – | – | (0.13 | ) | ||||||||
From net realized gains | – | – | (0.14 | ) | ||||||||
Total distributions | – | – | (0.27 | ) | ||||||||
Net increase/(decrease) in net asset value | (2.19 | ) | 0.97 | 0.95 | ||||||||
Net asset value, end of period | $ | 13.41 | $ | 15.60 | $ | 14.63 | ||||||
TOTAL RETURN(c) | (14.10 | )% | 6.63 | % | 8.91 | % | ||||||
RATIOS/SUPPLEMENTAL DATA: | ||||||||||||
Net assets, end of period (000s) | $ | 6,956 | $ | 6,156 | $ | 2,050 | ||||||
Ratio of net investment income/(loss) after reimbursements to average net assets | (0.30 | )%(d) | (0.72 | )%(d) | 5.36 | %(d) | ||||||
Ratio of expenses to average net assets including fee waivers and reimbursements (includes acquired fund fee reimbursements) | 1.73 | %(d) | 1.55 | %(d) | 1.66 | %(d) | ||||||
Ratio of expenses to average net assets including fee waivers and reimbursements (excludes acquired fund fee reimbursements) | 1.90 | %(d) | 1.90 | %(d) | 1.90 | %(d) | ||||||
Ratio of expenses to average net assets excluding fee waivers and reimbursements | 2.22 | %(d) | 2.33 | %(d) | 2.89 | %(d) | ||||||
Portfolio turnover rate(e) | 62 | % | 34 | % | 99 | % | ||||||
| (a) | Effective March 8, 2011, the Board approved changing the fiscal year-end of the Fund from December 31 to April 30. |
| (b) | Calculated using the average shares method. |
| (c) | Total returns are for the period indicated and have not been annualized. Total returns would have been lower had certain expenses not been waived during the period. Returns shown do not reflect the deduction of taxes that a shareholder would pay on Fund distributions or the redemption of Fund shares. Returns shown exclude any applicable sales charges. |
| (d) | Annualized. |
| (e) | Portfolio turnover rate for periods less than one full year have not been annualized. |
See Notes to Financial Statements.
| 89 | October 31, 2011 |
Table of Contents
Financial Highlights | ||
Selected data for a share of beneficial interest outstanding throughout the periods indicated: |
| RiverFront Long-Term Growth Fund - Class I | ||||||||||||
| For the Six Months Ended October 31, 2011 (Unaudited) | For the Period January 1, 2011 to April 30, 2011(a) | For the Period September 27, 2010 (Inception) to December 31, 2010 | ||||||||||
Net asset value, beginning of period | $ | 15.67 | $ | 14.65 | $ | 13.68 | ||||||
INCOME/(LOSS) FROM INVESTMENT OPERATIONS: | ||||||||||||
Net investment income after reimbursements(b) | 0.05 | 0.01 | 0.17 | |||||||||
Net realized and unrealized gain/(loss) | (2.19 | ) | 1.01 | 1.09 | ||||||||
Total from investment operations | (2.14 | ) | 1.02 | 1.26 | ||||||||
DISTRIBUTIONS: | ||||||||||||
From net investment income after reimbursements | – | – | (0.15 | ) | ||||||||
From net realized gains | – | – | (0.14 | ) | ||||||||
Total distributions | – | – | (0.29 | ) | ||||||||
Net increase/(decrease) in net asset value | (2.14 | ) | 1.02 | 0.97 | ||||||||
Net asset value, end of period | $ | 13.53 | $ | 15.67 | $ | 14.65 | ||||||
TOTAL RETURN(c) | (13.66 | )% | 7.04 | % | 9.12 | % | ||||||
RATIOS/SUPPLEMENTAL DATA: | ||||||||||||
Net assets, end of period (000s) | $ | 5,180 | $ | 4,508 | $ | 2,280 | ||||||
Ratio of net investment income after reimbursements to average net assets | 0.66 | %(d) | 0.23 | %(d) | 4.70 | %(d) | ||||||
Ratio of expenses to average net assets including fee waivers and reimbursements (includes acquired fund fee reimbursements) | 0.73 | %(d) | 0.61 | %(d) | 0.66 | %(d) | ||||||
Ratio of expenses to average net assets including fee waivers and reimbursements (excludes acquired fund fee reimbursements) | 0.90 | %(d) | 0.90 | %(d) | 0.90 | %(d) | ||||||
Ratio of expenses to average net assets excluding fee waivers and reimbursements | 1.23 | %(d) | 1.30 | %(d) | 1.74 | %(d) | ||||||
Portfolio turnover rate(e) | 62 | % | 34 | % | 99 | % | ||||||
| (a) | Effective March 8, 2011, the Board approved changing the fiscal year-end of the Fund from December 31 to April 30. |
| (b) | Calculated using the average shares method. |
| (c) | Total returns are for the period indicated and have not been annualized. Total returns would have been lower had certain expenses not been waived during the period. Returns shown do not reflect the deduction of taxes that a shareholder would pay on Fund distributions or the redemption of Fund shares. |
| (d) | Annualized. |
| (e) | Portfolio turnover rate for periods less than one full year have not been annualized. |
See Notes to Financial Statements.
| 90 | October 31, 2011 |
Table of Contents
Financial Highlights | ||
Selected data for a share of beneficial interest outstanding throughout the periods indicated: |
| RiverFront Long-Term Growth Fund - Class L^ | ||||||||||||||||||||
| For the Six Months Ended October 31, 2011 (Unaudited) | For the Period January 1, 2011 to April 30, 2011(a) | For the Year Ended December 31, 2010 | For the Year Ended December 31, 2009 | For the Period 2008 (Inception) to | ||||||||||||||||
Net asset value, beginning of period | $ | 15.65 | $ | 14.63 | $ | 13.22 | $ | 10.49 | $ | 10.00 | ||||||||||
INCOME/(LOSS) FROM INVESTMENT OPERATIONS: | ||||||||||||||||||||
Net investment income after reimbursements(b) | 0.05 | 0.01 | 0.18 | 0.16 | 0.12 | |||||||||||||||
Net realized and unrealized gain/(loss) | (2.19 | ) | 1.01 | 1.52 | 2.66 | 0.46 | ||||||||||||||
Total from investment operations | (2.14 | ) | 1.02 | 1.70 | 2.82 | 0.58 | ||||||||||||||
DISTRIBUTIONS: | ||||||||||||||||||||
From net investment income after reimbursements | – | – | (0.15 | ) | (0.09 | ) | (0.09 | ) | ||||||||||||
From net realized gains | – | – | (0.14 | ) | – | – | ||||||||||||||
Total distributions | – | – | (0.29 | ) | (0.09 | ) | (0.09 | ) | ||||||||||||
Net increase/(decrease) in net asset value | (2.14 | ) | 1.02 | 1.41 | 2.73 | 0.49 | ||||||||||||||
Net asset value, end of period | $ | 13.51 | $ | 15.65 | $ | 14.63 | $ | 13.22 | $ | 10.49 | ||||||||||
TOTAL RETURN(c) | (13.67 | )% | 6.97 | % | 12.87 | % | 26.86 | % | 5.81 | % | ||||||||||
RATIOS/SUPPLEMENTAL DATA: | ||||||||||||||||||||
Net assets, end of period (000s) | $ | 25,656 | $ | 42,977 | $ | 43,240 | $ | 27,763 | $ | 7,439 | ||||||||||
Ratio of net investment income after reimbursements to average net assets | 0.69 | %(d) | 0.19 | %(d) | 1.33 | % | 1.34 | % | 7.55 | %(d) | ||||||||||
Ratio of expenses to average net assets including fee waivers and reimbursements (includes acquired fund fee reimbursements) | 0.73 | %(d) | 0.64 | %(d) | 0.66 | % | N/A | N/A | ||||||||||||
Ratio of expenses to average net assets including fee waivers and reimbursements (excludes acquired fund fee reimbursements) | 0.90 | %(d) | 0.90 | %(d) | 0.90 | % | 0.90 | % | 0.90 | %(d) | ||||||||||
Ratio of expenses to average net assets excluding fee waivers and reimbursements | 1.21 | %(d) | 1.28 | %(d) | 1.22 | % | 1.53 | % | 4.97 | %(d) | ||||||||||
Portfolio turnover rate(e) | 62 | % | 34 | % | 99 | % | 67 | % | 13 | % | ||||||||||
| ^ | Prior to close of business on September 24, 2010, Class L was known as Institutional Class of the Baird Funds, Inc. - RiverFront Long-Term Growth Fund. |
| (a) | Effective March 8, 2011, the Board approved changing the fiscal year-end of the Fund from December 31 to April 30. |
| (b) | Calculated using the average shares method. |
| (c) | Total returns are for the period indicated and have not been annualized. Total returns would have been lower had certain expenses not been waived during the period. Returns shown do not reflect the deduction of taxes that a shareholder would pay on Fund distributions or the redemption of Fund shares. |
| (d) | Annualized. |
| (e) | Portfolio turnover rate for periods less than one full year have not been annualized. |
See Notes to Financial Statements.
| 91 | October 31, 2011 |
Table of Contents
Financial Highlights | ||
Selected data for a share of beneficial interest outstanding throughout the periods indicated: |
| RiverFront Long-Term Growth Fund - Investor Class^ | ||||||||||||||||||||
| For the Six Months Ended October 31, 2011 (Unaudited) | For the Period January 1, 2011 to April 30, 2011(a) | For the Year Ended December 31, 2010 | For the Year Ended December 31, 2009 | For the Period October 28, 2008 (Inception) to December 31, 2008 | ||||||||||||||||
Net asset value, beginning of period | $ | 15.59 | $ | 14.59 | $ | 13.19 | $ | 10.49 | $ | 10.00 | ||||||||||
INCOME/(LOSS) FROM INVESTMENT OPERATIONS: | ||||||||||||||||||||
Net investment income/(loss) after reimbursements(b) | 0.03 | (0.00 | )(c) | 0.12 | 0.13 | 0.12 | ||||||||||||||
Net realized and unrealized gain/(loss) | (2.17 | ) | 1.00 | 1.54 | 2.65 | 0.46 | ||||||||||||||
Total from investment operations | (2.14 | ) | 1.00 | 1.66 | 2.78 | 0.58 | ||||||||||||||
DISTRIBUTIONS: | ||||||||||||||||||||
From net investment income after reimbursements | – | – | (0.12 | ) | (0.08 | ) | (0.09 | ) | ||||||||||||
From net realized gains | – | – | (0.14 | ) | – | – | ||||||||||||||
Total distributions | – | – | (0.26 | ) | (0.08 | ) | (0.09 | ) | ||||||||||||
Net increase/(decrease) in net asset value | (2.14 | ) | 1.00 | 1.40 | 2.70 | 0.49 | ||||||||||||||
Net asset value, end of period | $ | 13.45 | $ | 15.59 | $ | 14.59 | $ | 13.19 | $ | 10.49 | ||||||||||
TOTAL RETURN(d) | 13.67 | % | 6.79 | % | 12.58 | % | 26.58 | % | 5.68 | % | ||||||||||
RATIOS/SUPPLEMENTAL DATA: | ||||||||||||||||||||
Net assets, end of period (000s) | $ | 11,965 | $ | 21,270 | $ | 23,556 | $ | 13,882 | $ | 426 | ||||||||||
Ratio of net investment income/(loss) after reimbursements to average net assets | 0.44 | %(e) | (0.08 | )%(e) | 0.93 | % | 1.09 | % | 7.30 | %(e) | ||||||||||
Ratio of expenses to average net assets including fee waivers and reimbursements (includes acquired fund fee reimbursements) | 0.98 | %(e) | 0.89 | %(e) | 0.91 | % | N/A | N/A | ||||||||||||
Ratio of expenses to average net assets including fee waivers and reimbursements (excludes acquired fund fee reimbursements) | 1.15 | %(e) | 1.15 | %(e) | 1.15 | % | 1.15 | % | 1.15 | %(e) | ||||||||||
Ratio of expenses to average net assets excluding fee waivers and reimbursements | 1.46 | %(e) | 1.53 | %(e) | 1.47 | % | 1.78 | % | 5.22 | %(e) | ||||||||||
Portfolio turnover rate(f) | 62 | % | 34 | % | 99 | % | 67 | % | 13 | % | ||||||||||
| ^ | Prior to close of business on September 24, 2010, Investor Class was known as Baird Funds, Inc. - RiverFront Long-Term Growth Fund. |
| (a) | Effective March 8, 2011, the Board approved changing the fiscal year-end of the Fund from December 31 to April 30. |
| (b) | Calculated using the average shares method. |
| (c) | Less than $(0.005) per share. |
| (d) | Total returns are for the period indicated and have not been annualized. Total returns would have been lower had certain expenses not been waived during the period. Returns shown do not reflect the deduction of taxes that a shareholder would pay on Fund distributions or the redemption of Fund shares. Returns shown exclude any applicable sales charges. |
| (e) | Annualized. |
| (f) | Portfolio turnover rate for periods less than one full year have not been annualized. |
See Notes to Financial Statements.
| 92 | October 31, 2011 |
Table of Contents
Financial Highlights | ||
Selected data for a share of beneficial interest outstanding throughout the periods indicated: |
| RiverFront Long-Term Growth & Income Fund - Class A | ||||||||
For the Six Months Ended | For the Period August 2, 2010 (Inception) to April 30, 2011 | |||||||
Net asset value, beginning of period | $ | 11.73 | $ | 10.00 | ||||
INCOME/(LOSS) FROM INVESTMENT OPERATIONS: | ||||||||
Net investment income(a) | 0.06 | 0.12 | ||||||
Net realized and unrealized gain/(loss) | (1.07 | ) | 1.67 | |||||
Total from investment operations | (1.01 | ) | 1.79 | |||||
DISTRIBUTIONS: | ||||||||
From net investment income | (0.03 | ) | (0.06 | ) | ||||
From net realized gains | – | (0.00 | )(b) | |||||
Tax return of capital | – | (0.00 | )(b) | |||||
Total distributions | (0.03 | ) | (0.06 | ) | ||||
Net increase/(decrease) in net asset value | (1.04 | ) | 1.73 | |||||
Net asset value, end of period | $ | 10.69 | $ | 11.73 | ||||
TOTAL RETURN(c) | (8.59 | )% | 17.99 | % | ||||
RATIOS/SUPPLEMENTAL DATA: | ||||||||
Net assets, end of period (000s) | $ | 5,783 | $ | 5,723 | ||||
Ratio of net investment income to average net assets | 1.11 | %(d) | 1.48 | %(d) | ||||
Ratio of expenses to average net assets including fee waivers and reimbursements | 1.30 | %(d) | 1.30 | %(d) | ||||
Ratio of expenses to average net assets excluding fee waivers and reimbursements | 1.70 | %(d) | 2.17 | %(d) | ||||
Portfolio turnover rate(e) | 76 | % | 66 | % | ||||
| (a) | Calculated using the average shares method. |
| (b) | Less than $0.005 per share. |
| (c) | Total returns are for the period indicated and have not been annualized. Total returns would have been lower had certain expenses not been waived during the period. Returns shown do not reflect the deduction of taxes that a shareholder would pay on Fund distributions or the redemption of Fund shares. Returns shown exclude any applicable sales charges. |
| (d) | Annualized. |
| (e) | Portfolio turnover rate for periods less than one full year have not been annualized. |
See Notes to Financial Statements.
| 93 | October 31, 2011 |
Table of Contents
Financial Highlights | ||
Selected data for a share of beneficial interest outstanding throughout the periods indicated: |
| RiverFront Long-Term Growth & Income Fund - Class C | ||||||||
For the Six Months Ended | For the Period August 2, 2010 (Inception) to April 30, 2011 | |||||||
Net asset value, beginning of period | $ | 11.67 | $ | 10.00 | ||||
INCOME/(LOSS) FROM INVESTMENT OPERATIONS: | ||||||||
Net investment income(a) | 0.02 | 0.05 | ||||||
Net realized and unrealized gain/(loss) | (1.07 | ) | 1.67 | |||||
Total from investment operations | (1.05 | ) | 1.72 | |||||
DISTRIBUTIONS: | ||||||||
From net investment income | (0.02 | ) | (0.05 | ) | ||||
From net realized gains | – | (0.00 | )(b) | |||||
Tax return of capital | – | (0.00 | )(b) | |||||
Total distributions | (0.02 | ) | (0.05 | ) | ||||
Net increase/(decrease) in net asset value | (1.07 | ) | 1.67 | |||||
Net asset value, end of period | $ | 10.60 | $ | 11.67 | ||||
TOTAL RETURN(c) | (8.99 | )% | 17.32 | % | ||||
RATIOS/SUPPLEMENTAL DATA: | ||||||||
Net assets, end of period (000s) | $ | 11,321 | $ | 9,223 | ||||
Ratio of net investment income to average net assets | 0.34 | %(d) | 0.65 | %(d) | ||||
Ratio of expenses to average net assets including fee waivers and reimbursements | 2.05 | %(d) | 2.05 | %(d) | ||||
Ratio of expenses to average net assets excluding fee waivers and reimbursements | 2.45 | %(d) | 3.10 | %(d) | ||||
Portfolio turnover rate(e) | 76 | % | 66 | % | ||||
| (a) | Calculated using the average shares method. |
| (b) | Less than $0.005 per share. |
| (c) | Total returns are for the period indicated and have not been annualized. Total returns would have been lower had certain expenses not been waived during the period. Returns shown do not reflect the deduction of taxes that a shareholder would pay on Fund distributions or the redemption of Fund shares. |
| (d) | Annualized. |
| (e) | Portfolio turnover rate for periods less than one full year have not been annualized. |
See Notes to Financial Statements.
| 94 | October 31, 2011 |
Table of Contents
Financial Highlights | ||
Selected data for a share of beneficial interest outstanding throughout the periods indicated: |
| RiverFront Long-Term Growth & Income Fund - Class I | ||||||||
For the Six Months Ended | For the Period August 2, 2010 (Inception) to April 30, 2011 | |||||||
Net asset value, beginning of period | $ | 11.64 | $ | 10.00 | ||||
INCOME/(LOSS) FROM INVESTMENT OPERATIONS: | ||||||||
Net investment income(a) | 0.07 | 0.12 | ||||||
Net realized and unrealized gain/(loss) | (1.05 | ) | 1.68 | |||||
Total from investment operations | (0.98 | ) | 1.80 | |||||
DISTRIBUTIONS: | ||||||||
From net investment income | (0.04 | ) | (0.15 | ) | ||||
From net realized gains | – | (0.00 | )(b) | |||||
Tax return of capital | – | (0.01 | ) | |||||
Total distributions | (0.04 | ) | (0.16 | ) | ||||
Net increase/(decrease) in net asset value | (1.02 | ) | 1.64 | |||||
Net asset value, end of period | $ | 10.62 | $ | 11.64 | ||||
TOTAL RETURN(c) | (8.53 | )% | 18.21 | % | ||||
RATIOS/SUPPLEMENTAL DATA: | ||||||||
Net assets, end of period (000s) | $ | 5,682 | $ | 3,301 | ||||
Ratio of net investment income to average net assets | 1.27 | %(d) | 1.49 | %(d) | ||||
Ratio of expenses to average net assets including fee waivers and reimbursements | 1.05 | %(d) | 1.05 | %(d) | ||||
Ratio of expenses to average net assets excluding fee waivers and reimbursements | 1.47 | %(d) | 2.44 | %(d) | ||||
Portfolio turnover rate(e) | 76 | % | 66 | % | ||||
| (a) | Calculated using the average shares method. |
| (b) | Less than $0.005 per share. |
| (c) | Total returns are for the period indicated and have not been annualized. Total returns would have been lower had certain expenses not been waived during the period. Returns shown do not reflect the deduction of taxes that a shareholder would pay on Fund distributions or the redemption of Fund shares. |
| (d) | Annualized. |
| (e) | Portfolio turnover rate for periods less than one full year have not been annualized. |
See Notes to Financial Statements.
| 95 | October 31, 2011 |
Table of Contents
Financial Highlights | ||
Selected data for a share of beneficial interest outstanding throughout the periods indicated: |
| RiverFront Moderate Growth Fund - Class A | ||||||||
For the Six Months Ended | For the Period August 2, 2010 (Inception) to April 30, 2011 | |||||||
Net asset value, beginning of period | $ | 11.66 | $ | 10.00 | ||||
INCOME/(LOSS) FROM INVESTMENT OPERATIONS: | ||||||||
Net investment income(a) | 0.03 | 0.10 | ||||||
Net realized and unrealized gain/(loss) | (1.43 | ) | 1.61 | |||||
Total from investment operations | (1.40 | ) | 1.71 | |||||
DISTRIBUTIONS: | ||||||||
From net investment income | – | (0.05 | ) | |||||
Total distributions | – | (0.05 | ) | |||||
Net increase/(decrease) in net asset value | (1.40 | ) | 1.66 | |||||
Net asset value, end of period | $ | 10.26 | $ | 11.66 | ||||
TOTAL RETURN(b) | (12.01 | )% | 17.12 | % | ||||
RATIOS/SUPPLEMENTAL DATA: | ||||||||
Net assets, end of period (000s) | $ | 8,978 | $ | 4,686 | ||||
Ratio of net investment income to average net assets | 0.56 | %(c) | 1.16 | %(c) | ||||
Ratio of expenses to average net assets including fee waivers and reimbursements | 1.30 | %(c) | 1.30 | %(c) | ||||
Ratio of expenses to average net assets excluding fee waivers and reimbursements | 1.92 | %(c) | 3.00 | %(c) | ||||
Portfolio turnover rate(d) | 75 | % | 77 | % | ||||
| (a) | Calculated using the average shares method. |
| (b) | Total returns are for the period indicated and have not been annualized. Total returns would have been lower had certain expenses not been waived during the period. Returns shown do not reflect the deduction of taxes that a shareholder would pay on Fund distributions or the redemption of Fund shares. Returns shown exclude any applicable sales charges. |
| (c) | Annualized. |
| (d) | Portfolio turnover rate for periods less than one full year have not been annualized. |
See Notes to Financial Statements.
| 96 | October 31, 2011 |
Table of Contents
Financial Highlights | ||
Selected data for a share of beneficial interest outstanding throughout the periods indicated: |
| RiverFront Moderate Growth Fund - Class C | ||||||||
| For the Six Months Ended October 31, 2011 (Unaudited) | For the Period August 2, 2010 (Inception) to April 30, 2011 | |||||||
Net asset value, beginning of period | $ | 11.64 | $ | 10.00 | ||||
INCOME/(LOSS) FROM INVESTMENT OPERATIONS: | ||||||||
Net investment loss(a) | (0.01 | ) | 0.00 | (b) | ||||
Net realized and unrealized gain/(loss) | (1.43 | ) | 1.65 | |||||
Total from investment operations | (1.44 | ) | 1.65 | |||||
DISTRIBUTIONS: | ||||||||
From net investment income | – | (0.01 | ) | |||||
Total distributions | – | (0.01 | ) | |||||
Net increase/(decrease) in net asset value | (1.44 | ) | 1.64 | |||||
Net asset value, end of period | $ | 10.20 | $ | 11.64 | ||||
TOTAL RETURN(c) | (12.37 | )% | 16.52 | % | ||||
RATIOS/SUPPLEMENTAL DATA: | ||||||||
Net assets, end of period (000s) | $ | 10,220 | $ | 8,926 | ||||
Ratio of net investment income/(loss) to average net assets | (0.19 | )%(d) | 0.04 | %(d) | ||||
Ratio of expenses to average net assets including fee waivers and reimbursements | 2.05 | %(d) | 2.05 | %(d) | ||||
Ratio of expenses to average net assets excluding fee waivers and reimbursements | 2.67 | %(d) | 3.21 | %(d) | ||||
Portfolio turnover rate(e) | 75 | % | 77 | % | ||||
| (a) | Calculated using the average shares method. |
| (b) | Less than $0.005 per share. |
| (c) | Total returns are for the period indicated and have not been annualized. Total returns would have been lower had certain expenses not been waived during the period. Returns shown do not reflect the deduction of taxes that a shareholder would pay on Fund distributions or the redemption of Fund shares. |
| (d) | Annualized. |
| (e) | Portfolio turnover rate for periods less than one full year have not been annualized. |
See Notes to Financial Statements.
| 97 | October 31, 2011 |
Table of Contents
Financial Highlights | ||
Selected data for a share of beneficial interest outstanding throughout the periods indicated: |
| RiverFront Moderate Growth Fund - Class I | ||||||||
For the Six Months Ended | For the Period August 2, 2010 (Inception) to April 30, 2011 | |||||||
Net asset value, beginning of period | $ | 11.42 | $ | 10.00 | ||||
INCOME/(LOSS) FROM INVESTMENT OPERATIONS: | ||||||||
Net investment income(a) | 0.04 | 0.08 | ||||||
Net realized and unrealized gain/(loss) | (1.39 | ) | 1.62 | |||||
Total from investment operations | (1.35 | ) | 1.70 | |||||
DISTRIBUTIONS: | ||||||||
From net investment income | – | (0.28 | ) | |||||
Total distributions | – | (0.28 | ) | |||||
Net increase/(decrease) in net asset value | (1.35 | ) | 1.42 | |||||
Net asset value, end of period | $ | 10.07 | $ | 11.42 | ||||
TOTAL RETURN(b) | (11.82 | )% | 17.20 | % | ||||
RATIOS/SUPPLEMENTAL DATA: | ||||||||
Net assets, end of period (000s) | $ | 3,754 | $ | 1,905 | ||||
Ratio of net investment income to average net assets | 0.77 | %(c) | 0.98 | %(c) | ||||
Ratio of expenses to average net assets including fee waivers and reimbursements | 1.05 | %(c) | 1.05 | %(c) | ||||
Ratio of expenses to average net assets excluding fee waivers and reimbursements | 1.68 | %(c) | 4.68 | %(c) | ||||
Portfolio turnover rate(d) | 75 | % | 77 | % | ||||
| (a) | Calculated using the average shares method. |
| (b) | Total returns are for the period indicated and have not been annualized. Total returns would have been lower had certain expenses not been waived during the period. Returns shown do not reflect the deduction of taxes that a shareholder would pay on Fund distributions or the redemption of Fund shares. |
| (c) | Annualized. |
| (d) | Portfolio turnover rate for periods less than one full year have not been annualized. |
See Notes to Financial Statements.
| 98 | October 31, 2011 |
Table of Contents
Financial Highlights | ||
Selected data for a share of beneficial interest outstanding throughout the periods indicated: |
| RiverFront Moderate Growth & Income Fund - Class A | ||||||||
For the Six Months Ended | For the Period August 2, 2010 (Inception) to April 30, 2011 | |||||||
Net asset value, beginning of period | $ | 11.08 | $ | 10.00 | ||||
INCOME/(LOSS) FROM INVESTMENT OPERATIONS: | ||||||||
Net investment income(a) | 0.07 | 0.15 | ||||||
Net realized and unrealized gain/(loss) | (0.60 | ) | 1.01 | |||||
Total from investment operations | (0.53 | ) | 1.16 | |||||
DISTRIBUTIONS: | ||||||||
From net investment income | (0.06 | ) | (0.08 | ) | ||||
From net realized gains | – | (0.00 | )(b) | |||||
Total distributions | (0.06 | ) | (0.08 | ) | ||||
Net increase/(decrease) in net asset value | (0.59 | ) | 1.08 | |||||
Net asset value, end of period | $ | 10.49 | $ | 11.08 | ||||
TOTAL RETURN(c) | (4.78 | )% | 11.70 | % | ||||
RATIOS/SUPPLEMENTAL DATA: | ||||||||
Net assets, end of period (000s) | $ | 14,762 | $ | 12,148 | ||||
Ratio of net investment income to average net assets | 1.28 | %(d) | 1.89 | %(d) | ||||
Ratio of expenses to average net assets including fee waivers and reimbursements | 1.30 | %(d) | 1.30 | %(d) | ||||
Ratio of expenses to average net assets excluding fee waivers and reimbursements | 1.48 | %(d) | 1.64 | %(d) | ||||
Portfolio turnover rate(e) | 76 | % | 69 | % | ||||
| (a) | Calculated using the average shares method. |
| (b) | Less than $(0.005) per share. |
| (c) | Total returns are for the period indicated and have not been annualized. Total returns would have been lower had certain expenses not been waived during the period. Returns shown do not reflect the deduction of taxes that a shareholder would pay on Fund distributions or the redemption of Fund shares. Returns shown exclude any applicable sales charges. |
| (d) | Annualized. |
| (e) | Portfolio turnover rate for periods less than one full year have not been annualized. |
See Notes to Financial Statements.
| 99 | October 31, 2011 |
Table of Contents
Financial Highlights | ||
Selected data for a share of beneficial interest outstanding throughout the periods indicated: |
| RiverFront Moderate Growth & Income Fund - Class C | ||||||||
For the Six Months Ended | For the Period August 2, 2010 (Inception) to April 30, 2011 | |||||||
Net asset value, beginning of period | $ | 11.06 | $ | 10.00 | ||||
INCOME/(LOSS) FROM INVESTMENT OPERATIONS: | ||||||||
Net investment income(a) | 0.03 | 0.10 | ||||||
Net realized and unrealized gain/(loss) | (0.60 | ) | 1.02 | |||||
Total from investment operations | (0.57 | ) | 1.12 | |||||
DISTRIBUTIONS: | ||||||||
From net investment income | (0.02 | ) | (0.06 | ) | ||||
From net realized gains | – | (0.00 | )(b) | |||||
Total distributions | (0.02 | ) | (0.06 | ) | ||||
Net increase/(decrease) in net asset value | (0.59 | ) | 1.06 | |||||
Net asset value, end of period | $ | 10.47 | $ | 11.06 | ||||
TOTAL RETURN(c) | (5.15 | )% | 11.24 | % | ||||
RATIOS/SUPPLEMENTAL DATA: | ||||||||
Net assets, end of period (000s) | $ | 33,123 | $ | 24,061 | ||||
Ratio of net investment income to average net assets | 0.50 | %(d) | 1.22 | %(d) | ||||
Ratio of expenses to average net assets including fee waivers and reimbursements | 2.05 | %(d) | 2.05 | %(d) | ||||
Ratio of expenses to average net assets excluding fee waivers and reimbursements | 2.23 | %(d) | 2.54 | %(d) | ||||
Portfolio turnover rate(e) | 76 | % | 69 | % | ||||
| (a) | Calculated using the average shares method. |
| (b) | Less than $(0.005) per share. |
| (c) | Total returns are for the period indicated and have not been annualized. Total returns would have been lower had certain expenses not been waived during the period. Returns shown do not reflect the deduction of taxes that a shareholder would pay on Fund distributions or the redemption of Fund shares. |
| (d) | Annualized. |
| (e) | Portfolio turnover rate for periods less than one full year have not been annualized. |
See Notes to Financial Statements.
| 100 | October 31, 2011 |
Table of Contents
Financial Highlights | ||
Selected data for a share of beneficial interest outstanding throughout the periods indicated: |
| RiverFront Moderate Growth & Income Fund - Class I | ||||||||||
For the Six Months Ended | For the Period August 2, 2010 (Inception) to April 30, 2011 | |||||||||
Net asset value, beginning of period | $ | 11.07 | $ | 10.00 | ||||||
INCOME/(LOSS) FROM INVESTMENT OPERATIONS: | ||||||||||
Net investment income(a) | 0.08 | 0.17 | ||||||||
Net realized and unrealized gain/(loss) | (0.60 | ) | 1.01 | |||||||
Total from investment operations | (0.52 | ) | 1.18 | |||||||
DISTRIBUTIONS: | ||||||||||
From net investment income | (0.07 | ) | (0.11 | ) | ||||||
From net realized gains | – | (0.00 | )(b) | |||||||
Total distributions | (0.07 | ) | (0.11 | ) | ||||||
Net increase/(decrease) in net asset value | (0.59 | ) | 1.07 | |||||||
Net asset value, end of period | $ | 10.48 | $ | 11.07 | ||||||
TOTAL RETURN(c) | (4.66 | )% | 11.92 | % | ||||||
RATIOS/SUPPLEMENTAL DATA: | ||||||||||
Net assets, end of period (000s) | $ | 10,713 | $ | 7,535 | ||||||
Ratio of net investment income to average net assets | 1.50 | %(d) | 2.16 | %(d) | ||||||
Ratio of expenses to average net assets including fee waivers and reimbursements | 1.05 | %(d) | 1.05 | %(d) | ||||||
Ratio of expenses to average net assets excluding fee waivers and reimbursements | 1.24 | %(d) | 1.55 | %(d) | ||||||
Portfolio turnover rate(e) | 76 | % | 69 | % | ||||||
| (a) | Calculated using the average shares method. |
| (b) | Less than $(0.005) per share. |
| (c) | Total returns are for the period indicated and have not been annualized. Total returns would have been lower had certain expenses not been waived during the period. Returns shown do not reflect the deduction of taxes that a shareholder would pay on Fund distributions or the redemption of Fund shares. |
| (d) | Annualized. |
| (e) | Portfolio turnover rate for periods less than one full year have not been annualized. |
See Notes to Financial Statements.
| 101 | October 31, 2011 |
Table of Contents
Consolidated Financial Highlights | ||
Selected data for a share of beneficial interest outstanding throughout the periods indicated: |
| ALPS | Kotak India Growth Fund - Class A | ||||||||||
For the Six Months Ended | For the Period February 14, 2011 (Inception) to April 30, 2011 | |||||||||
Net asset value, beginning of period | $ | 10.35 | $ | 10.00 | ||||||
INCOME/(LOSS) FROM INVESTMENT OPERATIONS: | ||||||||||
Net investment income/(loss)(a) | 0.00 | (b) | (0.04 | ) | ||||||
Net realized and unrealized gain/(loss) | (1.68 | ) | 0.39 | |||||||
Total from investment operations | (1.68 | ) | 0.35 | |||||||
REDEMPTION FEES ADDED TO PAID-IN CAPITAL (NOTE 4) | 0.00 | (b) | 0.00 | (b) | ||||||
Net increase/(decrease) in net asset value | (1.68 | ) | 0.35 | |||||||
Net asset value, end of period | $ | 8.67 | $ | 10.35 | ||||||
TOTAL RETURN(c) | (16.15 | )% | 3.40 | % | ||||||
RATIOS/SUPPLEMENTAL DATA: | ||||||||||
Net assets, end of period (000s) | $ | 1,472 | $ | 935 | ||||||
Ratio of net investment income/(loss) to average net assets | 0.09 | %(d) | (1.82 | )%(d) | ||||||
Ratio of expenses to average net assets including fee waivers and reimbursements | 2.00 | %(d) | 2.00 | %(d) | ||||||
Ratio of expenses to average net assets excluding fee waivers and reimbursements | 14.54 | %(d) | 69.96 | %(d) | ||||||
Portfolio turnover rate(e) | 48 | % | 9 | % | ||||||
| (a) | Calculated using the average shares method. |
| (b) | Less than $0.005 per share. |
| (c) | Total returns are for the period indicated and have not been annualized. Total returns would have been lower had certain expenses not been waived during the period. Returns shown do not reflect the deduction of taxes that a shareholder would pay on Fund distributions or the redemption of Fund shares. Returns shown exclude any applicable sales charges. |
| (d) | Annualized. |
| (e) | Portfolio turnover rate for periods less than one full year have not been annualized. |
See Notes to Financial Statements.
| 102 | October 31, 2011 |
Table of Contents
Consolidated Financial Highlights | ||
Selected data for a share of beneficial interest outstanding throughout the periods indicated: |
| ALPS | Kotak India Growth Fund - Class C | ||||||||||
For the Six Months Ended | For the Period February 14, 2011 (Inception) to April 30, 2011 | |||||||||
Net asset value, beginning of period | $ | 10.32 | $ | 10.00 | ||||||
INCOME/(LOSS) FROM INVESTMENT OPERATIONS: | ||||||||||
Net investment loss(a) | (0.02 | ) | (0.05 | ) | ||||||
Net realized and unrealized gain/(loss) | (1.68 | ) | 0.37 | |||||||
Total from investment operations | (1.70 | ) | 0.32 | |||||||
Net increase/(decrease) in net asset value | (1.70 | ) | 0.32 | |||||||
Net asset value, end of period | $ | 8.62 | $ | 10.32 | ||||||
TOTAL RETURN(b) | (16.47 | )% | 3.20 | % | ||||||
RATIOS/SUPPLEMENTAL DATA: | ||||||||||
Net assets, end of period (000s) | $ | 795 | $ | 466 | ||||||
Ratio of net investment loss to average net assets | (0.51 | )%(c) | (2.42 | )%(c) | ||||||
Ratio of expenses to average net assets including fee waivers and reimbursements | 2.60 | %(c) | 2.60 | %(c) | ||||||
Ratio of expenses to average net assets excluding fee waivers and reimbursements | 15.29 | %(c) | 69.64 | %(c) | ||||||
Portfolio turnover rate(d) | 48 | % | 9 | % | ||||||
| (a) | Calculated using the average shares method. |
| (b) | Total returns are for the period indicated and have not been annualized. Total returns would have been lower had certain expenses not been waived during the period. Returns shown do not reflect the deduction of taxes that a shareholder would pay on Fund distributions or the redemption of Fund shares. Returns shown exclude any applicable sales charges. |
| (c) | Annualized. |
| (d) | Portfolio turnover rate for periods less than one full year have not been annualized. |
See Notes to Financial Statements.
| 103 | October 31, 2011 |
Table of Contents
Consolidated Financial Highlights | ||
Selected data for a share of beneficial interest outstanding throughout the periods indicated: |
| ALPS | Kotak India Growth Fund - Class I | ||||||||||
For the Six Months Ended | For the Period February 14, 2011 (Inception) to April 30, 2011 | |||||||||
Net asset value, beginning of period | $ | 10.34 | $ | 10.00 | ||||||
INCOME/(LOSS) FROM INVESTMENT OPERATIONS: | ||||||||||
Net investment income/(loss)(a) | 0.02 | (0.03 | ) | |||||||
Net realized and unrealized gain/(loss) | (1.67 | ) | 0.37 | |||||||
Total from investment operations | (1.65 | ) | 0.34 | |||||||
Net increase/(decrease) in net asset value | (1.65 | ) | 0.34 | |||||||
Net asset value, end of period | $ | 8.69 | $ | 10.34 | ||||||
TOTAL RETURN(b) | (16.04 | )% | 3.50 | % | ||||||
RATIOS/SUPPLEMENTAL DATA: | ||||||||||
Net assets, end of period (000s) | $ | 1,687 | $ | 568 | ||||||
Ratio of net investment loss to average net assets | 0.49 | %(c) | (1.36 | )%(c) | ||||||
Ratio of expenses to average net assets including fee waivers and reimbursements | 1.60 | %(c) | 1.60 | %(c) | ||||||
Ratio of expenses to average net assets excluding fee waivers and reimbursements | 14.07 | %(c) | 96.67 | %(c) | ||||||
Portfolio turnover rate(d) | 48 | % | 9 | % | ||||||
| (a) | Calculated using the average shares method. |
| (b) | Total returns are for the period indicated and have not been annualized. Total returns would have been lower had certain expenses not been waived during the period. Returns shown do not reflect the deduction of taxes that a shareholder would pay on Fund distributions or the redemption of Fund shares. |
| (c) | Annualized. |
| (d) | Portfolio turnover rate for periods less than one full year have not been annualized. |
See Notes to Financial Statements.
| 104 | October 31, 2011 |
Table of Contents
Consolidated Financial Highlights | ||
Selected data for a share of beneficial interest outstanding throughout the periods indicated: |
Jefferies Asset Management Commodity Strategy Allocation Fund - Class A | ||||||||||
For the Six Months Ended | For the Period June 29, 2010 (Inception) to April 30, 2011 | |||||||||
Net asset value, beginning of period | $ | 14.28 | $ | 10.00 | ||||||
INCOME/(LOSS) FROM INVESTMENT OPERATIONS: | ||||||||||
Net investment income(a) | 0.10 | 0.12 | ||||||||
Net realized and unrealized gain/(loss) | (2.07 | ) | 4.87 | |||||||
Total from investment operations | (1.97 | ) | 4.99 | |||||||
DISTRIBUTIONS: | ||||||||||
From net investment income | (0.54 | ) | (0.71 | ) | ||||||
Total distributions | (0.54 | ) | (0.71 | ) | ||||||
REDEMPTION FEES ADDED TO PAID-IN CAPITAL (NOTE 4) | 0.00 | (b) | 0.00 | (b) | ||||||
Net increase/(decrease) in net asset value | (2.51 | ) | 4.28 | |||||||
Net asset value, end of period | $ | 11.77 | $ | 14.28 | ||||||
TOTAL RETURN(c) | (13.81 | )% | 51.41 | % | ||||||
RATIOS/SUPPLEMENTAL DATA: | ||||||||||
Net assets, end of period (000s) | $ | 41,169 | $ | 37,060 | ||||||
Ratio of net investment income to average net assets | 1.64 | %(d) | 1.08 | %(d) | ||||||
Ratio of expenses to average net assets including fee waivers and reimbursements | 1.45 | %(d) | 1.45 | %(d) | ||||||
Ratio of expenses to average net assets excluding fee waivers and reimbursements | 1.61 | %(d) | 2.59 | %(d) | ||||||
Portfolio turnover rate(e) | 84 | % | 59 | % | ||||||
| (a) | Calculated using the average shares method. |
| (b) | Less than $0.005 per share. |
| (c) | Total returns are for the period indicated and have not been annualized. Total returns would have been lower had certain expenses not been waived during the period. Returns shown do not reflect the deduction of taxes that a shareholder would pay on Fund distributions or the redemption of Fund shares. Returns shown exclude any applicable sales charges. |
| (d) | Annualized. |
| (e) | Portfolio turnover rate for periods less than one full year have not been annualized. |
See Notes to Financial Statements.
| 105 | October 31, 2011 |
Table of Contents
Consolidated Financial Highlights | ||
Selected data for a share of beneficial interest outstanding throughout the periods indicated: |
| Jefferies Asset Management Commodity Strategy Allocation Fund - Class C | ||||||||||
For the Six Months Ended October 31, 2011 (Unaudited) | For the Period June 29, 2010 (Inception) to April 30, 2011 | |||||||||
Net asset value, beginning of period | $ | 14.19 | $ | 10.00 | ||||||
INCOME/(LOSS) FROM INVESTMENT OPERATIONS: | ||||||||||
Net investment income(a) | 0.05 | 0.08 | ||||||||
Net realized and unrealized gain/(loss) | (2.05 | ) | 4.87 | |||||||
Total from investment operations | (2.00 | ) | 4.95 | |||||||
DISTRIBUTIONS: | ||||||||||
From net investment income | (0.50 | ) | (0.76 | ) | ||||||
Total distributions | (0.50 | ) | (0.76 | ) | ||||||
REDEMPTION FEES ADDED TO PAID-IN CAPITAL (NOTE 4) | 0.00 | (b) | 0.00 | (b) | ||||||
Net increase/(decrease) in net asset value | (2.50 | ) | 4.19 | |||||||
Net asset value, end of period | $ | 11.69 | $ | 14.19 | ||||||
TOTAL RETURN(c) | (14.00 | )% | 50.90 | % | ||||||
RATIOS/SUPPLEMENTAL DATA: | ||||||||||
Net assets, end of period (000s) | $ | 12,840 | $ | 7,352 | ||||||
Ratio of net investment income to average net assets | 0.82 | %(d) | 0.72 | %(d) | ||||||
Ratio of expenses to average net assets including fee waivers and reimbursements | 2.05 | %(d) | 2.05 | %(d) | ||||||
Ratio of expenses to average net assets excluding fee waivers and reimbursements | 2.22 | %(d) | 4.00 | %(d) | ||||||
Portfolio turnover rate(e) | 84 | % | 59 | % | ||||||
| (a) | Calculated using the average shares method. |
| (b) | Less than $0.005 per share. |
| (c) | Total returns are for the period indicated and have not been annualized. Total returns would have been lower had certain expenses not been waived during the period. Returns shown do not reflect the deduction of taxes that a shareholder would pay on Fund distributions or the redemption of Fund shares. Returns shown exclude any applicable sales charges. |
| (d) | Annualized. |
| (e) | Portfolio turnover rate for periods less than one full year have not been annualized. |
See Notes to Financial Statements.
| 106 | October 31, 2011 |
Table of Contents
Consolidated Financial Highlights | ||
Selected data for a share of beneficial interest outstanding throughout the periods indicated: |
| Jefferies Asset Management Commodity Strategy Allocation Fund - Class I | ||||||||||
For the Six Months Ended | For the Period June 29, 2010 (Inception) to April 30, 2011 | |||||||||
Net asset value, beginning of period | $ | 14.25 | $ | 10.00 | ||||||
INCOME/(LOSS) FROM INVESTMENT OPERATIONS: | ||||||||||
Net investment income(a) | 0.12 | 0.13 | ||||||||
Net realized and unrealized gain/(loss) | (2.07 | ) | 4.89 | |||||||
Total from investment operations | (1.95 | ) | 5.02 | |||||||
DISTRIBUTIONS: | ||||||||||
From net investment income | (0.56 | ) | (0.77 | ) | ||||||
Total distributions | (0.56 | ) | (0.77 | ) | ||||||
REDEMPTION FEES ADDED TO PAID-IN CAPITAL (NOTE 4) | 0.00 | (b) | 0.00 | (b) | ||||||
Net increase/(decrease) in net asset value | (2.51 | ) | 4.25 | |||||||
Net asset value, end of period | $ | 11.74 | $ | 14.25 | ||||||
TOTAL RETURN(c) | (13.62 | )% | 51.74 | % | ||||||
RATIOS/SUPPLEMENTAL DATA: | ||||||||||
Net assets, end of period (000s) | $ | 75,618 | $ | 73,630 | ||||||
Ratio of net investment income to average net assets | 1.97 | %(d) | 1.19 | %(d) | ||||||
Ratio of expenses to average net assets including fee waivers and reimbursements | 1.15 | %(d) | 1.15 | %(d) | ||||||
Ratio of expenses to average net assets excluding fee waivers and reimbursements | 1.32 | %(d) | 2.04 | %(d) | ||||||
Portfolio turnover rate(e) | 84 | % | 59 | % | ||||||
| (a) | Calculated using the average shares method. |
| (b) | Less than $0.005 per share. |
| (c) | Total returns are for the period indicated and have not been annualized. Total returns would have been lower had certain expenses not been waived during the period. Returns shown do not reflect the deduction of taxes that a shareholder would pay on Fund distributions or the redemption of Fund shares. |
| (d) | Annualized. |
| (e) | Portfolio turnover rate for periods less than one full year have not been annualized. |
See Notes to Financial Statements.
| 107 | October 31, 2011 |
Table of Contents
October 31, 2011 (Unaudited)
| ||||
1. ORGANIZATION
Financial Investors Trust (the “Trust”) was organized as a Delaware statutory trust on November 30, 1993 and registered as an open-end management investment company under the Investment Company Act of 1940, as amended (“1940 Act”). ALPS | Kotak India Growth Fund, ALPS | Red Rocks Listed Private Equity Fund, ALPS | WMC Value Intersection Fund (formerly Activa Value Fund), Clough China Fund, Jefferies Asset Management Commodity Strategy Allocation Fund, RiverFront Long-Term Growth Fund, RiverFront Long-Term Growth & Income Fund, RiverFront Moderate Growth Fund, and RiverFront Moderate Growth & Income Fund (each, a “Fund” and collectively, the “Funds”) are nine of fifteen separate funds offered to the public under the Trust as of October 31, 2011.
Basis of Consolidation for the Kotak Fund
The Kotak Fund invests in the equity securities of Indian companies by investing in shares of a wholly owned, collective investment vehicle. The Kotak Mauritius Portfolio (the “Portfolio”) is registered with and regulated by the Mauritius Financial Services Commission. The Portfolio was formed for the purpose of facilitating the Kotak Fund’s purchase of securities of a wide selection of Indian companies, consistent with the Kotak Fund’s investment strategies. The Portfolio is a private company limited by shares incorporated under the Mauritius Companies Act 2001. As a wholly owned subsidiary of the Kotak Fund, all assets and liabilities, income and expenses of the Portfolio are consolidated in the financial statements and financial highlights of the Kotak Fund. All investments held by the Portfolio are disclosed in the accounts of the Kotak Fund.
The Portfolio prices its portfolio investments pursuant to the same pricing and valuation methodologies and procedures used by the Kotak Fund, which require, among other things, that each of the Portfolio’s investments be marked-to-market (that is, the value on the Portfolio’s books changes) each business day to reflect changes in the market value of each investment. The value of shares of the Portfolio fluctuates with the value of the Portfolio’s portfolio investments.
Basis of Consolidation for the Jefferies Asset Management Commodity Strategy Allocation Fund
Jefferies Asset Management Cayman Commodity Fund Ltd. (the “Subsidiary”), a Cayman Islands exempted company, was incorporated on April 23, 2010 and is a wholly owned subsidiary of the Jefferies Asset Management Commodity Strategy Fund. The Subsidiary acts as an investment vehicle for the Fund in order to effect certain commodity-related investments on behalf of the Fund. The Fund is the sole shareholder of the Subsidiary pursuant to a subscription agreement dated as of June 14, 2010, and it is intended that the Fund will remain the sole shareholder and will continue to control the Subsidiary. Under the Articles of Association of the Subsidiary, shares issued by the Subsidiary
confer upon a shareholder the right to vote at general meetings of the Subsidiary and certain rights in connection with any winding up or repayment of capital, as well as the right to participate in the profits or assets of the Subsidiary. The Fund may invest up to 25% of its total assets in shares of the Subsidiary. As a wholly owned subsidiary of the Jefferies Asset Management Commodity Strategy Allocation Fund, all assets and liabilities, income and expenses of the Subsidiary are consolidated in the financial statements and financial highlights of the Fund. All investments held by the Subsidiary are disclosed in the accounts of the Jefferies Asset Management Commodity Strategy Allocation Fund.
The Subsidiary prices its portfolio investments pursuant to the same pricing and valuation methodologies and procedures used by the Fund, which require, among other things, that each of the Subsidiary’s portfolio investments be marked-to-market (that is, the value on the Subsidiary’s books changes) each business day to reflect changes in the market value of each investment. The value of shares of the Subsidiary fluctuates with the value of the Subsidiary’s portfolio investments.
2. SIGNIFICANT ACCOUNTING POLICIES
The following is a summary of significant accounting policies consistently followed by the Funds. These policies are in conformity with accounting principles generally accepted in the United States of America (“GAAP”).
The preparation of Statement of Investments in conformity with GAAP requires management to make certain estimates and assumptions that affect the reported amounts in the Statement of Investments during the reporting period. Management believes the estimates and security valuations are appropriate; however, actual results may differ from those estimates, and the security valuations reflected in the Schedule of Investments may differ from the value the Funds ultimately realize upon sale of the securities. The Portfolio of Investments have been prepared as of the close of the New York Stock Exchange (“NYSE”) on October 31, 2011.
Investment Valuation: The Funds generally value their securities based on market prices determined at the close of regular trading on the New York Stock Exchange (“NYSE”), normally 4:00 p.m. Eastern Time, on each day the NYSE is open for trading. A Fund’s net asset value (“NAV”) is computed by dividing the value of all assets of the Fund (including accrued interest and dividends), less all liabilities (including accrued expenses and dividends declared but unpaid), by the total number of shares outstanding.
For equity securities and funds that are traded on an exchange, the market price is usually the closing sale or official closing price on that exchange. In the case of equity securities not traded on an exchange, or if such closing prices are not otherwise available, the market price is typically determined by independent third party pricing vendors approved by the Board of Trustees (the “Board”)
| 108 | October 31, 2011 |
Table of Contents
Notes to Financial Statements | ||||
October 31, 2011 (Unaudited)
| ||||
using a variety of pricing techniques and methodologies. The market price for debt obligations is generally the price supplied by an independent third-party pricing service approved by the Board, which may use a matrix, formula or other objective method that takes into consideration market indices, yield curves and other specific adjustments. Short–term debt obligations that will mature in 60 days or less are valued at amortized cost, unless it is determined that using this method would not reflect an investment’s fair value. If vendors are unable to supply a price, or if the price supplied is deemed to be unreliable, the market price may be determined using quotations received from one or more brokers–dealers that make a market in the security. Investments in non-exchange traded funds are fair valued at their respective net asset values.
Futures and swap contracts that are listed or traded on a national securities exchange, commodities exchange, contract market or comparable over the counter market, and that are freely transferable, are valued at their closing settlement price on the exchange on which they are primarily traded or based upon the current settlement price for a like instrument acquired on the day on which the instrument is being valued. A settlement price may not be used if the market makes a limit move with respect to a particular commodity. Over-the-counter futures and swap contracts for which market quotations are readily available are valued based on quotes received from independent pricing services or one or more dealers that make markets in such securities.
Forward currency exchange contracts have a market value determined by the prevailing foreign currency exchange daily rates and current foreign currency exchange forward rates. The foreign currency exchange forward rates are calculated using an automated system that estimates rates on the basis of the current day foreign currency exchange rates and forward foreign currency exchange rates supplied by a pricing service. Foreign exchange rates and forward foreign currency exchange rates may generally be obtained at the close of the NYSE, normally 4:00 p.m. Eastern Time.
Redeemable securities issued by open-end registered investment companies and offshore affiliated subsidiaries are valued at the investment company’s or subsidiary’s applicable net asset value, with the exception of exchange-traded open-end investment companies, which are priced as equity securities.
Investment securities that are primarily traded on foreign securities exchanges are valued at the preceding closing values of such securities on their respective exchanges, except when an occurrence subsequent to the time a value was so established is likely to have changed such value. In such an event, the fair value of those securities are determined in good faith through consideration of other factors in accordance with procedures established by and under the general supervision of the Board of Trustees. The Funds will use a fair valuation model provided by an independent pricing service, which is intended to reflect fair value when a security’s value or a meaningful portion of the
Fund’s portfolio is believed to have been materially affected by an valuation event that has occurred between the close of the exchange or market on which the security is traded and the close of the regular trading day on the NYSE. The Funds’ valuation procedures set forth certain triggers which instruct when to use the fair valuation model. The value assigned to a security by the fair valuation model is a determination of fair value made under the Funds’ valuation procedures and under the supervision of the Board of Trustees. In such a case, a Fund’s value for a security may be different from the last sales price (or the latest closing price) and there is no guarantee that a fair valued security will be sold at the price at which a Fund is valuing the security.
When such prices or quotations are not available, or when the Fair Value Committee appointed by the Board believes that they are unreliable, securities may be priced using fair value procedures approved by the Board. The Funds may also use fair value procedures if the Fair Value Committee determines that a significant event has occurred between the time at which a market price is determined and the time at which a Fund’s NAV is calculated. In particular, the value of non-U.S. securities may be materially affected by events occurring after the close of the foreign exchange on which they are traded, but before a Fund prices its shares.
Investment Transactions: Investment and shareholder transactions are accounted for on the date the investments are purchased or sold (trade date). Realized gains and losses from investment transactions are reported on an identified cost basis. Interest income, which includes accretion of discounts, is accrued and recorded as earned. Dividend income is recognized on the ex-dividend date or for certain foreign securities, as soon as information is available to the Fund.
Foreign Securities: Each Fund may directly purchase securities of foreign issuers. Investing in securities of foreign issuers involves special risks not typically associated with investing in securities of U.S. issuers. The risks include possible reevaluation of currencies, the inability to repatriate foreign currency, less complete financial information about companies and possible future adverse political and economic developments. Moreover, securities of many foreign issuers and their markets may be less liquid and their prices more volatile than those of securities of comparable U.S. issuers.
Foreign Currency Translation: The books and records of the Funds are maintained in U.S. dollars. Investment valuations and other assets and liabilities initially expressed in foreign currencies are converted each business day into U.S. dollars based upon current exchange rates. Prevailing foreign exchange rates may generally be obtained at the close of the NYSE (normally, 4:00 p.m. Eastern time). The portion of realized and unrealized gains or losses on investments due to fluctuations in foreign currency exchange rates is not separately disclosed and is included in realized and unrealized gains or losses on investments, when applicable.
| 109 | October 31, 2011 |
Table of Contents
Notes to Financial Statements | ||||
October 31, 2011 (Unaudited)
| ||||
Foreign Currency Spot Contracts: The Funds may enter into foreign currency spot contracts to facilitate transactions in foreign securities or to convert foreign currency receipts into U.S. dollars. A foreign currency spot contract is an agreement between two parties to buy and sell currencies at the current market rate, for settlement generally within two business days. The U.S. dollar value of the contracts is determined using current currency exchange rates supplied by a pricing service. The contract is marked-to-market daily for settlements beyond one day and any change in market value is recorded as an unrealized gain or loss. When the contract is closed, the Fund records a realized gain or loss equal to the difference between the value on the open and close date. Losses may arise from changes in the value of the foreign currency, or if the counterparties do not perform under the contract’s terms. The maximum potential loss from such contracts is the aggregate face value in U.S. dollars at the time the contract was opened.
Treasury Inflation Protected-Securities: The Funds may invest in treasury inflation protected securities (“TIPS”), including structured bonds in which the principal amount is adjusted daily to keep pace with inflation, as measured by the U.S. Consumer Pricing Index for Urban Consumers. The adjustments to principal due to inflation/ deflation are reflected as increases/decreases to interest income with a corresponding adjustment to cost. Such adjustments may have a significant impact on a Fund’s distributions and may result in a return of capital to shareholders. The repayment of the original bond principal upon maturity is guaranteed by the full faith and credit of the U.S. Government.
Fair Value Measurements: The Funds disclose the classification of their fair value measurements following a three-tier hierarchy based on the inputs used to measure fair value. Inputs refer broadly to the assumptions that market participants would
use in pricing the asset or liability, including assumptions about risk. Inputs may be observable or unobservable. Observable inputs reflect the assumptions market participants would use in pricing the asset or liability that are developed based on market data obtained from sources independent of the reporting entity. Unobservable inputs reflect the reporting entity’s own assumptions about the assumptions market participants would use in pricing the asset or liability that are developed based on the best information available.
Various inputs are used in determining the value of each Fund’s investments as of the end of the reporting period. When inputs used fall into different levels of the fair value hierarchy, the level in the hierarchy within which the fair value measurement falls is determined based on the lowest level input that is significant to the fair value measurement in its entirety. The designated input levels are not necessarily an indication of the risk or liquidity associated with these investments. These inputs are categorized in the following hierarchy under applicable financial accounting standards:
Level 1 – Unadjusted quoted prices in active markets for identical investments, unrestricted assets or liabilities that a Fund has the ability to access at the measurement date;
Level 2 – Quoted prices which are not active, quoted prices for similar assets or liabilities in active markets or inputs other than quoted prices that are observable (either directly or indirectly) for substantially the full term of the asset or liability; and
Level 3 – Significant unobservable prices or inputs (including the Fund’s own assumptions in determining the fair value of investments) where there is little or no market activity for the asset or liability at the measurement date.
The following is a summary of each inputs used to value the Fund’ as of October 31, 2011:
| Investments in Securities at Value | Level 1 – Unadjusted Quoted Prices | Level 2 – Other Significant | Level 3 – Significant Unobservable Inputs | Total | ||||||||||||
ALPS | Kotak India Growth Fund(a) | ||||||||||||||||
Common Stocks - Basic Materials | $ | 37,791 | $ | 209,991 | $ | – | $ | 247,782 | ||||||||
Common Stocks - Consumer, Non-cyclical | 36,974 | 637,226 | – | 674,200 | ||||||||||||
Common Stocks - Energy | 71,221 | 367,667 | – | 438,888 | ||||||||||||
Other Common Stocks(b) | 2,167,422 | – | 2,167,422 | |||||||||||||
Short Term Investments | 9,491 | – | – | 9,491 | ||||||||||||
Total | $ | 155,477 | $ | 3,382,306 | $ | – | $ | 3,537,783 | ||||||||
Other Financial Instruments | ||||||||||||||||
Assets: | ||||||||||||||||
Futures Contracts(c) | $ | 2,812 | $ | – | $ | – | $ | 2,812 | ||||||||
Total | $ | 2,812 | $ | – | $ | – | $ | 2,812 | ||||||||
| 110 | October 31, 2011 |
Table of Contents
Notes to Financial Statements | ||||
October 31, 2011 (Unaudited)
| ||||
| Investments in Securities at Value | Level 1 – Unadjusted Quoted Prices | Level 2 – Other Significant Observable Inputs | Level 3 – Significant | Total | ||||||||||||
ALPS | Red Rocks Listed Private Equity Fund |
| |||||||||||||||
Common Stocks(b) | $ | 134,994,047 | $ | – | $ | – | $ | 134,994,047 | ||||||||
Short Term Investments | 322,282 | – | – | 322,282 | ||||||||||||
Total | $ | 135,316,329 | $ | – | $ | – | $ | 135,316,329 | ||||||||
ALPS | WMC Value Intersection Fund |
| |||||||||||||||
Common Stocks(b) | $ | 66,889,468 | $ | – | $ | – | $ | 66,889,468 | ||||||||
Exchange Traded Funds | 927,759 | – | – | 927,759 | ||||||||||||
Short Term Investments | 169,609 | – | – | 169,609 | ||||||||||||
Total | $ | 67,986,836 | $ | – | $ | – | $ | 67,986,836 | ||||||||
Clough China Fund |
| |||||||||||||||
Common Stocks - Financials | $ | 720,274 | $ | 17,311,762 | $ | – | $ | 18,032,036 | ||||||||
Other Common Stocks(b) | – | 48,046,092 | – | 48,046,092 | ||||||||||||
Short Term Investments | 2,542,637 | – | – | 2,542,637 | ||||||||||||
Total | $ | 3,262,911 | $ | 65,357,854 | $ | – | $ | 68,620,765 | ||||||||
Jefferies Asset Management Commodity Strategy Allocation Fund(d) |
| |||||||||||||||
Common Stocks(b) | $ | 34,671,500 | $ | – | $ | – | $ | 34,671,500 | ||||||||
Exchange Traded Funds | 7,728,310 | 7,728,310 | ||||||||||||||
Warrants | 46 | – | – | 46 | ||||||||||||
Government Bonds | – | 78,964,646 | – | 78,964,646 | ||||||||||||
Short Term Investments | 4,248,441 | – | – | 4,248,441 | ||||||||||||
Total | $ | 46,648,297 | $ | 78,964,646 | $ | – | $ | 125,612,943 | ||||||||
Other Financial Instruments |
| |||||||||||||||
Assets: | ||||||||||||||||
Futures Contracts(c) | $ | 153,577 | $ | – | $ | – | $ | 153,577 | ||||||||
Total Return Swap Contracts | – | 5,607,187 | – | 5,607,187 | ||||||||||||
Liabilities: | ||||||||||||||||
Futures Contracts(c) | (1,492,073) | – | – | (1,492,073) | ||||||||||||
Total Return Swap Contracts | – | (384,018) | (384,018) | |||||||||||||
Total | $ | (1,338,496) | $ | 5,223,169 | $ | – | $ | 3,884,673 | ||||||||
RiverFront Long-Term Growth Fund |
| |||||||||||||||
Common Stocks(b) | $ | 21,902,637 | $ | – | $ | – | $ | 21,902,637 | ||||||||
Exchange Traded Funds | 33,198,262 | – | – | 33,198,262 | ||||||||||||
Short Term Investments | 1,192,542 | – | – | 1,192,542 | ||||||||||||
Total | $ | 56,293,441 | $ | – | $ | – | $ | 56,293,441 | ||||||||
RiverFront Long-Term Growth & Income Fund |
| |||||||||||||||
Common Stocks(b) | $ | 7,494,365 | $ | – | $ | – | $ | 7,494,365 | ||||||||
Exchange Traded Funds | 14,081,026 | – | – | 14,081,026 | ||||||||||||
Exchange Traded Notes | 367,304 | �� | – | – | 367,304 | |||||||||||
Short Term Investments | 816,502 | – | – | 816,502 | ||||||||||||
Total | $ | 22,759,197 | $ | – | $ | – | $ | 22,759,197 | ||||||||
RiverFront Moderate Growth Fund |
| |||||||||||||||
Common Stocks(b) | $ | 7,633,847 | $ | – | $ | – | $ | 7,633,847 | ||||||||
Exchange Traded Funds | 14,897,695 | – | – | 14,897,695 | ||||||||||||
Short Term Investments | 3,904,055 | – | – | 3,904,055 | ||||||||||||
Total | $ | 26,435,597 | $ | – | $ | – | $ | 26,435,597 | ||||||||
RiverFront Moderate Growth & Income Fund |
| |||||||||||||||
Common Stocks(b) | $ | 16,490,644 | $ | – | $ | – | $ | 16,490,644 | ||||||||
Exchange Traded Funds | 39,293,789 | – | – | 39,293,789 | ||||||||||||
Exchange Traded Notes | 1,493,091 | – | – | 1,493,091 | ||||||||||||
Short Term Investments | 1,060,311 | – | – | 1,060,311 | ||||||||||||
Total | $ | 58,337,835 | $ | – | $ | – | $ | 58,337,835 | ||||||||
| (a) | Consolidated fair value measurements for ALPS | Kotak India Growth Fund is consolidated and includes the balances of Kotak Mauritius Portfolio (wholly owned subsidiary). Accordingly, all interfund balances have been eliminated. |
| 111 | October 31, 2011 |
Table of Contents
Notes to Financial Statements | ||||
October 31, 2011 (Unaudited)
| ||||
| (b) | For detailed descriptions of sector and industry, see the accompanying Statement of Investments. |
| (c) | Only current day’s variation margin is reported within the Statement of Assets and Liabilities. The variation margin is included in the open futures cumulative appreciation/(depreciation) of $2,812 and $(1,338,496) for the ALPS | Kotak India Growth Fund and the Jefferies Asset Management Commodity Strategy Allocation Fund, respectively. |
| (d) | Consolidated fair value measurements for Jefferies Asset Management Commodity Strategy Allocation Fund is consolidated and includes the balances of Jefferies Asset Management Cayman Trust (wholly owned subsidiary). Accordingly, all interfund balances have been eliminated. |
For the six months ended October 31, 2011, the Funds did not have any significant transfers between Level 1 and Level 2 securities, except the Clough China Fund. The Clough China Fund utilizes a fair value evaluation service with respect to international securities with an earlier market closing than the Fund’s net asset value computation cutoff. As such, international securities can transfer between Level 1 and Level 2 based on triggers being met without disclosure detailing the transfers into and out of Level 1 and Level 2.
Risk Exposure and the Use of Derivative Instruments:
The Funds’ investment objectives not only permit the Funds to purchase investment securities, they also allow the Funds to enter in various types of derivatives contracts. In doing so, the Funds will employ strategies in differing combinations to permit them to increase, decrease, or change the level or types of exposure to market factors. Central to those strategies are features inherent in derivatives that make them more attractive for this purpose than equity or debt securities; they require little or no initial cash investment, they can focus exposure on only certain selected risk factors, and they may not require the ultimate receipt or delivery of the underlying security (or securities) to the contract. This may allow the Funds to pursue their objectives more quickly and efficiently than if they were to make direct purchases or sales of securities capable of affecting a similar response to market factors.
Risk of Investing in Derivatives: The Funds’ use of derivatives can result in losses due to unanticipated changes in the market risk factors and the overall market. In instances where the Funds are using derivatives to decrease, or hedge, exposures to market risk factors for securities held by the Funds, there are also risks that those derivatives may not perform as expected resulting in losses for the combined or hedged positions.
Derivatives may have little or no initial cash investment relative to their market value exposure and therefore can produce significant gains or losses in excess of their cost. This use of embedded leverage allows a Fund to increase its market value exposure relative to it net assets and can substantially increase the volatility of the Funds’ performance.
Additional associated risks from investing in derivatives also exist and potentially could have significant effects on the valuation of the derivative and the Funds. Typically, the associated risks are not the risks that the Funds are attempting to increase or decrease exposure to, per their investment objectives, but are the additional risks from investing in derivatives.
Examples of these associated risks are liquidity risk, which is the risk that the Funds will not be able to sell or close out the derivative in a timely manner, and counterparty credit risk, which is the risk that the counterparty will not fulfill its obligation to the Funds. In addition, use of deriatives may increase or decrease exposure to the following risk factors:
Foreign Exchange Rate Risk: Foreign exchange rate risk relates to the change in the U.S. dollar value of a security held that is denominated in a foreign currency. The U.S. dollar value of a foreign currency denominated security will decrease as the dollar appreciates against the currency, while the U.S. dollar value will increase as the dollar depreciates against the currency.
Equity Risk: Equity risk relates to the change in value of equity securities as they relate to increases or decreases in the general market. Associated risks can be different for each type of derivative and are discussed by each derivative type in the notes that follow.
Swap Contracts: The Jefferies Asset Management Commodity Strategy Allocation Fund may enter into swap transactions for hedging purposes or to seek to increase total return. At the present time, the Jefferies Asset Management Commodity Strategy Allocation Fund primarily enters into swap transactions for the purpose of increasing total return. Risks may arise as a result of the failure of the counterparty to the swap contract to comply with the terms of the swap contract. The loss incurred by the failure of a counterparty is generally limited to the net payment to be received by the Jefferies Asset Management Commodity Strategy Allocation Fund and/or the termination value at the end of the contract.
Therefore, the Jefferies Asset Management Commodity Strategy Allocation Fund considers the creditworthiness of each counterparty to a contract in evaluating potential credit risk. Additionally, risks may arise from unanticipated movements in interest rates or in the value of the underlying reference asset or index. Entering into these agreements involves, to varying degrees, market risk, liquidity risk and elements of credit, legal and documentation risk that are not directly reflected in the amounts recognized in the Statements of Assets and Liabilities.
| 112 | October 31, 2011 |
Table of Contents
Notes to Financial Statements | ||||
October 31, 2011 (Unaudited)
| ||||
The Jefferies Asset Management Commodity Strategy Allocation Fund may pay or receive cash as collateral on these contracts which may be recorded as an asset and/or liability. The Jefferies Asset Management Commodity Strategy Allocation Fund must set aside liquid assets, or engage in other appropriate measures, to cover its obligations under these contracts. Swaps are marked to market daily using either pricing vendor quotations, counterparty prices or model prices and the change in value, if any, is recorded as an unrealized gain or loss. Upfront payments made and/or received by the Jefferies Asset Management Commodity Strategy Allocation Fund are recorded as an asset and/or liability and realized gains or losses are recognized ratably over the contract’s term/event, with the exception of forward starting interest rate swaps, whose realized gains or losses are recognized ratably from the effective start date. Periodic payments received or made on swap contracts are recorded as realized gains or losses. Gains or losses are realized upon termination of a swap contract and are recorded on the Statements of Operations.
The Jefferies Asset Management Commodity Strategy Allocation Fund invests in total return swaps. A total return swap is an agreement that gives a fund the right to receive the appreciation in the value of a specified security, index or other instrument in
return for a fee paid to the counterparty, which will typically be an agreed upon interest rate. If the underlying asset declines in value over the term of the swap, a fund may also be required to pay the dollar value of that decline to the counterparty. Swap agreements held at October 31, 2011 are disclosed in the Statement of Investments.
The number of swap contracts held at October 31, 2011 is representative of swap contract activity during the six months ended October 31, 2011.
Forward Foreign Currency Transactions: Each Fund may engage in currency transactions with counterparties to hedge the value of portfolio securities denominated in particular currencies against fluctuations in relative value, to gain or reduce exposure to certain currencies, or to generate income or gains. All commitments are marked to market daily at the applicable exchange rates and any resulting unrealized gains or losses are recorded in the Fund’s financial statements. Each Fund records realized gains or losses at the time a forward contract is offset by entry into a closing transaction or extinguished by delivery of the currency. None of the Funds had open forward foreign currency contracts at October 31, 2011.
Derivatives Instruments: The following tables disclose the amounts related to each Fund’s use of derivative instruments.
The effect of derivatives instruments on the Balance Sheet as of October 31, 2011:
| Asset Derivatives | Liability Derivatives | |||||||||||
| Derivative Instruments |
Balance Sheet Location | Fair Value | Balance Sheet Location | Fair Value | ||||||||
ALPS | Kotak India Growth Fund(a) | ||||||||||||
Equity Contracts (futures) | Variation margin receivable | $ | 2,812 | N/A | $ | – | ||||||
Total | $ | 2,812 | $ | – | ||||||||
Jefferies Asset Management Commodity Strategy Allocation Fund(b) |
| |||||||||||
Equity Contracts (futures) | Variation margin receivable | $ | 153,577 | Payable for variation margin | $ | 1,492,073 | ||||||
Equity Contracts (swaps) | Unrealized appreciation on total return swap contracts | 5,607,187 | Unrealized depreciation on total return swap contracts | 384,018 | ||||||||
Total | $ | 5,760,764 | $ | 1,876,091 | ||||||||
The effect of derivatives instruments on the Statement of Operations for the six months ended October 31, 2011:
| Derivative Instruments | Location of Gain/(Loss) On Derivatives Recognized in Income | Realized Gain/ (Loss) On Derivatives Recognized in Income | Change in Unrealized Appreciation/ (Depreciation) on Derivatives Recognized in Income | |||||||
ALPS | Kotak India Growth Fund(a) | ||||||||||
Equity Contracts (futures) | Net realized gain/(loss) on futures contracts/ Net change in unrealized appreciation/ (depreciation) on futures contracts | $ | (26,906 | ) | $ | 8,037 | ||||
Total | $ | (26,906 | ) | $ | 8,037 | |||||
| 113 | October 31, 2011 |
Table of Contents
Notes to Financial Statements | ||||
October 31, 2011 (Unaudited)
| ||||
| Derivative Instruments | Location of Gain/(Loss) On Derivatives Recognized in Income | Realized Gain/ (Loss) On Derivatives Recognized in Income | Change in Unrealized Appreciation/ (Depreciation) on Derivatives Recognized in Income | |||||||
Jefferies Asset Management Commodity Strategy Allocation Fund(b) | ||||||||||
Equity Contracts (futures) | Net realized gain/(loss) on futures contracts/ Net change in unrealized appreciation/ (depreciation) on futures contracts | $ | 1,271,830 | $ | (1,566,124 | ) | ||||
Equity Contracts (swaps) | Net realized loss on total return swap contracts/ Net change in unrealized appreciation on total return swap contracts | (15,860,634 | ) | 4,715,999 | ||||||
Total | $ | (14,588,804 | ) | $ | 3,149,875 | |||||
| (a) | Consolidated derivative instruments for ALPS | Kotak India Growth Fund is consolidated and includes the balances of Kotak Mauritius Portfolio (wholly-owned subsidiary). Accordingly, all interfund balances have been eliminated. |
| (b) | Consolidated derivative instruments for Jefferies Asset Management Commodity Strategy Allocation Fund is consolidated and includes the balances of Jefferies Asset Management Cayman Trust (wholly-owned subsidiary). Accordingly, all interfund balances have been eliminated. |
Futures: Certain Funds may invest in futures contracts in accordance with their investment objectives. Each Fund does so for a variety of reasons including for cash management, hedging or non-hedging purposes in an attempt to achieve investment returns consistent with the Fund’s investment objective. A futures contract provides for the future sale by one party and purchase by another party of a specified quantity of the security or other financial instrument at a specified price and time. A futures contract on an index is an agreement pursuant to which two parties agree to take or make delivery of an amount of cash equal to the difference between the value of the index at the close of the last trading day of the contract and the price at which the index contract was originally written. Futures transactions may result in losses in excess of the amount invested in the futures contract. There can be no guarantee that there will be a correlation between price movements in the hedging vehicle and in the portfolio securities being hedged. An incorrect correlation could result in a loss on both the hedged securities in a Fund and the hedging vehicle so that the portfolio return might have been greater had hedging not been attempted. There can be no assurance that a liquid market will exist at a time when a Fund seeks to close out a futures contract or a futures option position. Lack of a liquid market for any reason may prevent a Fund from liquidating an unfavorable position, and the Fund would remain obligated to meet margin requirements until the position is closed. In addition, a Fund could be exposed to risk if the counterparties to the contracts are unable to meet the terms of their contracts. With exchange traded futures, there is minimal counterparty credit risk to the Funds since futures are exchange traded and the exchange’s clearinghouse, as counterparty to all exchange traded futures, guarantees the futures against default.
When a purchase or sale of a futures contract is made by a Fund, the Fund is required to deposit with its custodian (or broker, if legally permitted) a specified amount of liquid assets (“initial margin”). The margin required for a futures contract is set by the exchange on which the contract is traded and may be modified during the term of the contract. The initial margin is in the nature of a performance bond or good faith deposit on the futures contract that is returned to a Fund upon termination of the contract, assuming all contractual obligations have been satisfied. Each day a Fund may pay or receive cash, called “variation margin,” equal to the daily change in value of the futures contract. Such payments or receipts are recorded for financial statement purposes as unrealized gains or losses by a Fund. Variation margin does not represent a borrowing or loan by a Fund but is instead a settlement between a Fund and the broker of the amount one would owe the other if the futures contract expired. When the contract is closed, a Fund records a realized gain or loss equal to the difference between the value of the contract at the time it was opened and the value at the time it was closed. As of October 31, 2011, ALPS| Kotak India Growth Fund and the Jefferies Asset Management Commodity Strategy Allocation Fund had futures contracts outstanding with unrealized appreciation of $2,812 and net unrealized depreciation of ($1,338,496), respectively. The other Funds held no futures contracts at October 31, 2011. The number of futures contracts held at October 31, 2011 is representative of futures contracts activity during the six months ended October 31, 2011.
| 114 | October 31, 2011 |
Table of Contents
Notes to Financial Statements | ||||
October 31, 2011 (Unaudited)
| ||||
Trust Expenses: Some expenses of the Trust can be directly attributed to a Fund or a specific share class of a Fund. Expenses which cannot be directly attributed are apportioned among all Funds in the Trust based on average net assets of each share class within a Fund.
Payment by Affiliates: During the year ended July 31, 2009, the predecessor China Fund was reimbursed $1,000 by Clay Finlay LLC (the predecessor China Fund’s former sub-adviser) for a trading error.
During the year ended April 30, 2011, the ALPS | Red Rocks Listed Private Equity Fund was reimbursed $2,088 by Red Rocks Capital LLC for a trading error.
Federal Income Taxes: The Funds comply with the requirements under Subchapter M of the Internal Revenue Code applicable to regulated investment companies and intend to distribute substantially all of their net taxable income and net capital gains, if any, each year. The Funds are not subject to income taxes to the extent such distributions are made.
As of and during the fiscal year ended April 30, 2011, the Funds did not have a liability for any unrecognized tax benefits in the accompanying financial statements. The Funds file income tax returns in the U.S. federal jurisdiction and Colorado. For the years ended December 31, 2006 through April 30, 2011 for the U.S. federal jurisdiction, for the years ended December 31, 2005 through December 31, 2008 for Michigan, and for the year ended April 30, 2011 for Colorado, the predecessor Activa Fund’s and the current
ALPS | WMC Value Intersection Fund’s returns are still open to examination by the appropriate taxing authority. For the periods ended December 31, 2008 through December 31, 2010, the predecessor RiverFront Fund’s returns are still open to examination by the appropriate taxing authority.
Distributions to Shareholders: Each Fund, except the Jefferies Asset Management Commodity Strategy Allocation Fund, normally pays dividends and distributes capital gains, if any, on an annual basis. The Jefferies Asset Management Commodity Strategy Allocation Fund pays dividends, if any, on a quarterly basis and distributes capital gains annually. Income dividend distributions are derived from interest and other income each Fund receives from its investments, including distributions of short-term capital gains. Capital gain distributions are derived from gains realized when a Fund sells a security it has owned for more than a year. Each Fund may make additional distributions and dividends at other times if the portfolio manager believes doing so may be necessary for the Fund to avoid or reduce taxes. Net investment income/(loss) and net realized gain/(loss) may differ for financial statement and tax purposes. The character of distributions made during the year from net investment income or net realized gains may differ from its ultimate characterization for federal income tax purposes. Also, due to the timing of dividend distributions, the fiscal year in which amounts are distributed may differ from the fiscal year in which the income or realized gain were recorded by a Fund. The amount and characteristics of the tax basis distributions and composition of distributable earnings/(accumulated losses) are finalized at fiscal year end; accordingly, tax basis balances have not been determined as of October 31, 2011.
The tax character of distributions paid by the Funds for the fiscal year or period ended April 30, 2011 is as follows:
| Distributions paid from: | |||||||||||||||
| Fund | Ordinary Income | Long-Term Capital Gain | Return of Capital | ||||||||||||
ALPS | Kotak India Growth Fund | $ | – | $ | – | $ | – | |||||||||
ALPS | Red Rocks Listed Private Equity Fund | 8,999,998 | – | – | ||||||||||||
ALPS | WMC Value Intersection Fund | 575,001 | – | – | ||||||||||||
Clough China Fund | 352,105 | 75,614 | – | ||||||||||||
Jefferies Asset Management Commodity Strategy Allocation Fund | 2,192,934 | – | – | ||||||||||||
RiverFront Long-Term Growth Fund | – | – | – | ||||||||||||
RiverFront Long-Term Growth & Income Fund | 56,880 | 5 | 1,878 | ||||||||||||
RiverFront Moderate Growth Fund | 31,005 | – | – | ||||||||||||
RiverFront Moderate Growth & Income Fund | 210,053 | 18 | – | ||||||||||||
| 115 | October 31, 2011 |
Table of Contents
Notes to Financial Statements | ||||
October 31, 2011 (Unaudited)
| ||||
Unrealized Appreciation and Depreciation on Investments: As of October 31, 2011, the costs of investments for federal income tax purposes and accumulated net unrealized appreciation/(depreciation) on investments were as follows:
| Fund | Gross Appreciation (excess of value over tax cost) | Gross Depreciation (excess of tax cost over value) | Net Unrealized Appreciation | Cost of Investments for Income Tax Purposes | ||||||||||||
ALPS | Kotak India Growth Fund | 65,647 | (392,461) | (326,814) | 3,864,597 | ||||||||||||
ALPS | Red Rocks Listed Private Equity Fund | 6,422,898 | (14,348,408) | (7,925,510) | 143,241,839 | ||||||||||||
ALPS | WMC Value Intersection Fund | 9,194,127 | (3,975,067) | 5,219,060 | 62,767,776 | ||||||||||||
Clough China Fund | 2,116,014 | (4,008,572) | (1,892,558) | 70,513,323 | ||||||||||||
Jefferies Asset Management Commodity Strategy Allocation Fund | 2,166,732 | (3,978,662) | (1,811,930) | 127,424,873 | ||||||||||||
RiverFront Long-Term Growth Fund | 4,660,205 | (2,215,380) | 2,444,825 | 53,848,616 | ||||||||||||
RiverFront Long-Term Growth & Income Fund | 813,611 | (764,052) | 49,559 | 22,709,638 | ||||||||||||
RiverFront Moderate Growth Fund | 477,119 | (995,376) | (518,257) | 26,953,854 | ||||||||||||
RiverFront Moderate Growth & Income Fund | 2,434,879 | (972,201) | 1,462,678 | 56,875,157 | ||||||||||||
3. SECURITIES TRANSACTIONS
Purchases and sales of securities, excluding short-term securities for the six months ended October 31, 2011 were as follows:
| Fund | Purchases of Securities | Proceeds from Sales of Securities | ||||||
ALPS | Kotak India Growth Fund(a) | $ | 3,987,240 | $ | 1,357,005 | ||||
ALPS | Red Rocks Listed Private Equity Fund | 63,104,201 | 71,604,185 | ||||||
ALPS | WMC Value Intersection Fund | 19,766,122 | 20,245,539 | ||||||
Clough China Fund | 79,185,203 | 86,999,088 | ||||||
Jefferies Asset Management Commodity Strategy Allocation Fund(b) | 84,540,718 | 83,237,382 | ||||||
RiverFront Long-Term Growth Fund | 42,142,090 | 59,934,461 | ||||||
RiverFront Long-Term Growth & Income Fund | 21,415,862 | 15,202,192 | ||||||
RiverFront Moderate Growth Fund | 23,024,218 | 13,016,690 | ||||||
RiverFront Moderate Growth & Income Fund | 53,520,458 | 36,210,018 | ||||||
Investment Transactions in U.S. Government Obligations for the six months ended October 31, 2011 were as follows:
| Fund | Purchases of Securities | Proceeds from Sales of Securities | ||||||
Jefferies Asset Management Commodity Strategy Allocation Fund(b) | $ | 31,762,551 | $ | 18,459,696 | ||||
| (a) | Purchases and Sales for ALPS | Kotak India Growth Fund is consolidated and includes the balances of Kotak Mauritius Portfolio (wholly owned subsidiary). Accordingly, all interfund balances have been eliminated. |
| (b) | Purchases and Sales for Jefferies Asset Management Commodity Strategy Allocation Fund is consolidated and includes the balances of Jefferies Asset Management Cayman Trust (wholly owned subsidiary). Accordingly, all interfund balances have been eliminated. |
4. CAPITAL SHARE TRANSACTIONS
Shares redeemed within 90 days of purchase may incur a 2% short-term redemption fee deducted from the redemption amount for the ALPS | Red Rocks Listed Private Equity Fund and shares redeemed within 30 days of purchase may incur a 2% short-term redemption fee deducted from the redemption amount for ALPS | Kotak India Growth Fund, Clough China Fund and Jefferies Asset Management Commodity Strategy Allocation Fund shares. For the period ended October 31, 2011, the amounts listed below were retained by the Funds. These amounts are reflected in “Shares redeemed” in the Statement of Changes in Net Assets.
| Fund | Redemption Fee Retained | ||||
ALPS | Kotak India Growth Fund - Class A Shares | $ | 450 | |||
ALPS | Red Rocks Listed Private Equity Fund - Class A Shares | 12,468 | ||||
ALPS | Red Rocks Listed Private Equity Fund - Class C Shares | 1,796 | ||||
ALPS | Red Rocks Listed Private Equity Fund - Class I Shares | 4,897 | ||||
Clough China Fund - Class A Shares | 279 | ||||
| 116 | October 31, 2011 |
Table of Contents
Notes to Financial Statements | ||||
October 31, 2011 (Unaudited)
| ||||
| Fund | Redemption Fee Retained | ||||
Clough China Fund - Class C Shares | 15 | ||||
Clough China Fund - Class I Shares | 61 | ||||
Jefferies Asset Management Commodity Strategy Allocation Fund - Class A | 6,049 | ||||
Jefferies Asset Management Commodity Strategy Allocation Fund - Class C | 300 | ||||
Jefferies Asset Management Commodity Strategy Allocation Fund - Class I | 1,602 | ||||
Transactions in shares of capital stock were as follows:
| ALPS | Red Rocks Listed Private Equity Fund | ||||||||||
For the Six Months Ended October 31, 2011 (Unaudited) | For the Year Ended April 30, 2011 | |||||||||
Class A | ||||||||||
Shares sold | 3,585,815 | 8,117,147 | ||||||||
Dividends reinvested | – | 1,008,656 | ||||||||
Shares redeemed | (8,109,397 | ) | (2,716,528 | ) | ||||||
Net increase/(decrease) in shares outstanding | (4,523,582 | ) | 6,409,275 | |||||||
Class C(a) | ||||||||||
Shares sold | 215,414 | 390,859 | ||||||||
Dividends reinvested | – | 12,715 | ||||||||
Shares redeemed | (44,891 | ) | (964 | ) | ||||||
Net increase in shares outstanding | 170,523 | 402,610 | ||||||||
Class I | ||||||||||
Shares sold | 3,717,114 | 5,769,906 | ||||||||
Dividends reinvested | – | 263,265 | ||||||||
Shares redeemed | (2,100,643 | ) | (4,392,609 | ) | ||||||
Net increase in shares outstanding | 1,616,471 | 1,640,562 | ||||||||
Class R | ||||||||||
Shares sold | 6,155 | 28,026 | ||||||||
Dividends reinvested | – | 716 | ||||||||
Shares redeemed | (3,597 | ) | (11,145 | ) | ||||||
Net increase in shares outstanding | 2,558 | 17,597 | ||||||||
| (a) | The Fund’s Class C shares commenced operations on July 2, 2010. |
| ALPS | WMC Value Intersection Fund(a) | ||||||||||
For the Six Months Ended October 31, 2011 (Unaudited) | For the Year Ended April 30, 2011 | |||||||||
Class A | ||||||||||
Shares sold | 30,505 | 229,623 | ||||||||
Dividends reinvested | – | 49,572 | ||||||||
Shares redeemed | (248,658 | ) | (715,760 | ) | ||||||
Net decrease in shares outstanding | (218,153 | ) | (436,565 | ) | ||||||
Class C(b) | ||||||||||
Shares sold | – | 1,572 | ||||||||
Dividends reinvested | – | 9 | ||||||||
Shares redeemed | – | (10 | ) | |||||||
Net increase in shares outstanding | – | 1,571 | ||||||||
Class I | ||||||||||
Shares sold | 254,302 | 1,578,339 | ||||||||
Dividends reinvested | – | 22,156 | ||||||||
Shares redeemed | (125,389 | ) | (489,424 | ) | ||||||
Net increase in shares outstanding | 128,913 | 1,111,071 | ||||||||
| (a) | Prior to August 31, 2010, the ALPS | WMC Value Intersection Fund was known as the Activa Value Fund. |
| (b) | The Fund’s Class C shares commenced operations on July 2, 2010. |
| 117 | October 31, 2011 |
Table of Contents
Notes to Financial Statements | ||||
October 31, 2011 (Unaudited)
| ||||
| Clough China Fund | ||||||||||
For the Six Months Ended October 31, 2011 (Unaudited) | For the Year Ended April 30, 2011 | |||||||||
Class A | ||||||||||
Shares sold | 130,302 | 1,302,276 | ||||||||
Dividends reinvested | – | 6,645 | ||||||||
Shares redeemed | (446,379 | ) | (762,675 | ) | ||||||
Net increase/(decrease) in shares outstanding | (316,077 | ) | 546,246 | |||||||
Class C | ||||||||||
Shares sold | 74,610 | 578,312 | ||||||||
Dividends reinvested | – | 69 | ||||||||
Shares redeemed | (141,846 | ) | (184,236 | ) | ||||||
Net increase/(decrease) in shares outstanding | (67,236 | ) | 394,145 | |||||||
Class I | ||||||||||
Shares sold | 131,995 | 1,242,194 | ||||||||
Dividends reinvested | – | 5,145 | ||||||||
Shares redeemed | (244,740 | ) | (138,307 | ) | ||||||
Net increase/(decrease) in shares outstanding | (112,745 | ) | 1,109,032 | |||||||
| RiverFront Long-Term Growth Fund | |||||||||||||||
For the Six Months Ended October 31, 2011 (Unaudited) | For the Period January 1, 2011 to April 30, 2011(a) | For the Year Ended December 31, 2010 | |||||||||||||
Class A | |||||||||||||||
Shares sold | 125,993 | 661,721 | 130,462 | ||||||||||||
Dividends reinvested | – | – | 2,115 | ||||||||||||
Shares redeemed | (438,040 | ) | (7,391 | ) | (627 | ) | |||||||||
Net increase/(decrease) in shares outstanding | (312,047 | ) | 654,330 | 131,950 | |||||||||||
Class C | |||||||||||||||
Shares sold | 156,640 | 267,185 | 137,900 | ||||||||||||
Dividends reinvested | – | – | 2,219 | ||||||||||||
Shares redeemed | (32,541 | ) | (12,664 | ) | – | ||||||||||
Net increase in shares outstanding | 124,099 | 254,521 | 140,119 | ||||||||||||
Class I | |||||||||||||||
Shares sold | 151,877 | 136,221 | 154,892 | ||||||||||||
Dividends reinvested | – | – | 744 | ||||||||||||
Shares redeemed | (56,721 | ) | (4,150 | ) | – | ||||||||||
Net increase in shares outstanding | 95,156 | 132,071 | 155,636 | ||||||||||||
Class L | |||||||||||||||
Shares sold | 162,757 | 230,991 | 1,286,522 | ||||||||||||
Dividends reinvested | – | – | 55,257 | ||||||||||||
Shares redeemed | (1,010,135 | ) | (440,408 | ) | (486,215 | ) | |||||||||
Net increase/(decrease) in shares outstanding | (847,378 | ) | (209,417 | ) | 855,564 | ||||||||||
Investor Class | |||||||||||||||
Shares sold | 14,297 | 45,758 | 771,332 | ||||||||||||
Dividends reinvested | – | – | 25,694 | ||||||||||||
Shares redeemed | (488,508 | ) | (296,425 | ) | (234,795 | ) | |||||||||
Net increase/(decrease) in shares outstanding | (474,211 | ) | (250,667 | ) | 562,231 | ||||||||||
| (a) | Effective March 8, 2011, the Board approved changing the fiscal year-end of the Fund from December 31 to April 30. |
| 118 | October 31, 2011 |
Table of Contents
Notes to Financial Statements | ||||
October 31, 2011 (Unaudited)
| ||||
| RiverFront Long-Term Growth & Income Fund | ||||||||||
For the Six Months Ended October 31, 2011 (Unaudited) | For the Period August 2, 2010 (Inception) to April 30, 2011 | |||||||||
Class A | ||||||||||
Shares sold | 331,213 | 490,350 | ||||||||
Dividends reinvested | 1,862 | 1,515 | ||||||||
Shares redeemed | (279,814 | ) | (4,028 | ) | ||||||
Net increase in shares outstanding | 53,261 | 487,837 | ||||||||
Class C | ||||||||||
Shares sold | 318,693 | 792,427 | ||||||||
Dividends reinvested | 1,699 | 1,704 | ||||||||
Shares redeemed | (42,702 | ) | (3,727 | ) | ||||||
Net increase in shares outstanding | 277,690 | 790,404 | ||||||||
Class I | ||||||||||
Shares sold | 306,070 | 283,008 | ||||||||
Dividends reinvested | 1,012 | 2,023 | ||||||||
Shares redeemed | (55,426 | ) | (1,529 | ) | ||||||
Net increase in shares outstanding | 251,656 | 283,502 | ||||||||
| RiverFront Moderate Growth Fund | ||||||||||
For the Six Months Ended October 31, 2011 (Unaudited) | For the Period August 2, 2010 (Inception) to April 30, 2011 | |||||||||
Class A | ||||||||||
Shares sold | 560,901 | 415,659 | ||||||||
Dividends reinvested | – | 963 | ||||||||
Shares redeemed | (87,835 | ) | (14,586 | ) | ||||||
Net increase in shares outstanding | 473,066 | 402,036 | ||||||||
Class C | ||||||||||
Shares sold | 298,823 | 769,684 | ||||||||
Dividends reinvested | – | 260 | ||||||||
Shares redeemed | (64,347 | ) | (2,938 | ) | ||||||
Net increase in shares outstanding | 234,476 | 767,006 | ||||||||
Class I | ||||||||||
Shares sold | 256,949 | 174,619 | ||||||||
Dividends reinvested | – | 1,544 | ||||||||
Shares redeemed | (50,841 | ) | (9,351 | ) | ||||||
Net increase in shares outstanding | 206,108 | 166,812 | ||||||||
| RiverFront Moderate Growth & Income Fund | ||||||||||
For the Six Months Ended October 31, 2011 (Unaudited) | For the Period August 2, 2010 (Inception) to April 30, 2011 | |||||||||
Class A | ||||||||||
Shares sold | 749,927 | 1,221,781 | ||||||||
Dividends reinvested | 6,835 | 5,387 | ||||||||
Shares redeemed | (446,114 | ) | (131,124 | ) | ||||||
Net increase in shares outstanding | 310,648 | 1,096,044 | ||||||||
Class C | ||||||||||
Shares sold | 1,096,649 | 2,223,222 | ||||||||
Dividends reinvested | 3,920 | 6,978 | ||||||||
Shares redeemed | (112,228 | ) | (53,903 | ) | ||||||
Net increase in shares outstanding | 988,341 | 2,176,297 | ||||||||
Class I | ||||||||||
Shares sold | 481,308 | 706,293 | ||||||||
Dividends reinvested | 5,096 | 4,959 | ||||||||
Shares redeemed | (144,863 | ) | (30,836 | ) | ||||||
Net increase in shares outstanding | 341,541 | 680,416 | ||||||||
| 119 | October 31, 2011 |
Table of Contents
Notes to Financial Statements | ||||
October 31, 2011 (Unaudited)
| ||||
| ALPS | Kotak India Growth Fund | ||||||||||
For the Six Months Ended October 31, 2011 (Unaudited) | For the Period February 14, 2011 (Inception) to April 30, 2011 | |||||||||
Class A | ||||||||||
Shares sold | 97,519 | 90,726 | ||||||||
Shares redeemed | (18,079 | ) | (380 | ) | ||||||
Net increase in shares outstanding | 79,440 | 90,346 | ||||||||
Class C | ||||||||||
Shares sold | 47,118 | 45,104 | ||||||||
Net increase in shares outstanding | 47,118 | 45,104 | ||||||||
Class I | ||||||||||
Shares sold | 141,770 | 54,915 | ||||||||
Shares redeemed | (2,470 | ) | – | |||||||
Net increase in shares outstanding | 139,300 | 54,915 | ||||||||
| Jefferies Asset Management Commodity Strategy Allocation Fund | ||||||||||
For the Six Months Ended October 31, 2011 (Unaudited) | For the Period June 29, 2010 (Inception) to April 30, 2011 | |||||||||
Class A | ||||||||||
Shares sold | 1,725,575 | 3,046,349 | ||||||||
Dividends reinvested | 119,263 | 36,215 | ||||||||
Shares redeemed | (943,487 | ) | (487,523 | ) | ||||||
Net increase in shares outstanding | 901,351 | 2,595,041 | ||||||||
Class C | ||||||||||
Shares sold | 619,245 | 622,478 | ||||||||
Dividends reinvested | 24,405 | 10,639 | ||||||||
Shares redeemed | (63,483 | ) | (114,921 | ) | ||||||
Net increase in shares outstanding | 580,167 | 518,196 | ||||||||
Class I | ||||||||||
Shares sold | 2,004,533 | 5,511,506 | ||||||||
Dividends reinvested | 220,332 | 71,054 | ||||||||
Shares redeemed | (952,123 | ) | (414,674 | ) | ||||||
Net increase in shares outstanding | 1,272,742 | 5,167,886 | ||||||||
5. MANAGEMENT AND
RELATED-PARTY TRANSACTIONS
ALPS Advisors, Inc. (“AAI” or “Adviser”), subject to the authority of the Board, is responsible for the overall management and administration of each Fund’s business affairs. AAI has delegated daily management of the Funds listed below to the corresponding sub-adviser listed in the table below. Each Sub-Adviser manages the investments of the Fund in accordance with its investment objective, policies and limitations and investment guidelines established jointly by the Adviser and the Board.
| Fund | Sub-Adviser | |
| ALPS | Kotak India Growth Fund | Kotak Mahindra (UK) Limited | |
| ALPS | Red Rocks Listed Private Equity Fund | Red Rocks Capital LLC | |
| ALPS | WMC Value Intersection Fund | Wellington Management Company, LLP | |
| Clough China Fund | Clough Capital Partners, LP | |
| Jefferies Asset Management Commodity Strategy Allocation Fund | Jefferies Asset Management, Inc. | |
| RiverFront Long-Term Growth Fund | RiverFront Investment Group, LLC | |
| RiverFront Long-Term Growth & Income Fund | RiverFront Investment Group, LLC | |
| RiverFront Moderate Growth Fund | RiverFront Investment Group, LLC | |
| RiverFront Moderate Growth & Income Fund | RiverFront Investment Group, LLC |
| 120 | October 31, 2011 |
Table of Contents
Notes to Financial Statements | ||||
October 31, 2011 (Unaudited)
| ||||
Pursuant to the Investment Advisory Agreement (the “Advisory Agreement”), each Fund pays the Adviser an annual management fee which is based on the Fund’s average daily net assets. The management fee is paid on a monthly basis. The following table reflects the Funds’ contractual management fee rates (expressed as an annual rate).
| Fund | Contractual Management Fee | |
ALPS | Kotak India Growth Fund | 1.25% | |
ALPS | Red Rocks Listed Private Equity Fund | 0.85% | |
ALPS | WMC Value Intersection Fund | 0.95%* | |
Clough China Fund | 1.35% | |
Jefferies Asset Management Commodity Strategy Allocation Fund | 0.85% | |
RiverFront Long-Term Growth Fund | 0.90% | |
RiverFront Long-Term Growth & Income Fund | 0.90% | |
RiverFront Moderate Growth Fund | 0.90% | |
RiverFront Moderate Growth & Income Fund | 0.90% |
| * | The contractual management fee is 0.95% for the first $250 million of net assets, 0.85% for the next $250 million of net assets, and 0.75% for net assets in excess of $500 million. |
Pursuant to an Investment Sub-advisory Agreement, the Adviser pays each sub-adviser an annual sub-advisory management fee which is based on each Fund’s average daily assets. The Adviser is required to pay all fees due to each sub-adviser out of the management fee the Adviser receives from each Fund. The following table reflects the Funds’ contractual sub-advisory fee rates.
| Fund | Average Daily Net Assets of the Fund | Contractual Fee | ||
ALPS | Kotak India | First $50 Million | 1.15% | ||
Growth Fund | Over $50 Million | 1.05% | ||
ALPS | Red Rocks | All Asset Levels | 0.57% | ||
ALPS | WMC Value | First $250 Million | 0.50% | ||
Intersection Fund | $250 Million - $500 Million | 0.40% | ||
| Over $500 Million | 0.30% | |||
Clough China Fund | All Asset Levels | 0.90% | ||
Jefferies Asset | All Asset Levels | 0.75% | ||
RiverFront Long-Term Growth Fund | All Asset Levels | 0.60% | ||
RiverFront Long-Term Growth & Income Fund | All Asset Levels | 0.60% | ||
RiverFront Moderate Growth Fund | All Asset Levels | 0.60% | ||
RiverFront Moderate Growth & Income Fund | All Asset Levels | 0.60% |
The Adviser and/or Sub-Adviser have contractually agreed to limit the amount of each Fund’s total annual expenses (exclusive of distribution and service (12b-1) fees (except Clough China Class A, Class C, and Class I shares), shareholder service fees (except ALPS | Red Rocks Listed Private Equity Class A shares, ALPS | WMC Value Intersection Class A shares, and Clough China Class C shares), acquired fund fees and expenses, brokerage expenses, interest expense, short sale dividend expense, taxes and extraordinary expenses) that exceed the following annual rates below. These agreements are reevaluated on an annual basis. Without these agreements, expenses could be higher.
| Fund | Expense Limit % | Term of Expense Limit Agreement | ||
ALPS | Kotak India | 1.60% | 2/14/11- 8/31/12 | ||
ALPS | Red Rocks Listed | 1.25% | 6/28/11 - 8/31/12 | ||
ALPS | WMC Value | 1.15% | 8/31/11 - 8/31/12 | ||
Clough China Fund - | 1.95% | 1/1/11 - 8/31/12 | ||
Clough China Fund - | 2.70% | 1/1/11 - 8/31/12 | ||
Clough China Fund - | 1.70% | 1/1/11 - 8/31/12 | ||
Jefferies Asset Management Commodity Strategy | 1.05% | 9/11/11 - 8/31/12 | ||
Jefferies Asset Management Commodity Strategy | 1.15% | 6/28/11 - 8/31/12 | ||
RiverFront Long-Term | 0.90% | 9/27/10 -12/31/12 | ||
RiverFront Long-Term | 1.05% | 8/2/10 - 8/31/12 | ||
RiverFront Moderate | 1.05% | 8/2/10 - 8/31/12 | ||
RiverFront Moderate | 1.05% | 8/2/10 - 8/31/12 |
The Adviser and Sub-Adviser have contractually agreed to reimburse Acquired Fund Fees and Expenses of the RiverFront Long-Term Growth Fund.
The Adviser and the Sub-Adviser are permitted to recover expenses they have waived or reimbursed, on a class-by-class basis, through the agreements described above to the extent that expenses in later periods fall below the annual limits set forth in these agreements. The ALPS | WMC Value Intersection Fund and Clough China Fund are not obligated to pay any such waived or reimbursed fees and expenses more than one year after the end of the fiscal year in which the fees or expenses were waived or reimbursed. The Jefferies Asset Management Commodity Strategy Allocation Fund is not obligated to pay any such waived or reimbursed fees
| 121 | October 31, 2011 |
Table of Contents
| Notes to Financial Statements | ||||
October 31, 2011 (Unaudited)
| ||||
and expenses more than two years after the end of the fiscal year in which the fees or expenses were waived or reimbursed. The ALPS | Kotak India Growth Fund, ALPS | Red Rocks Listed Private Equity Fund, RiverFront Long-Term Growth Fund, RiverFront Long-Term Growth & Income Fund, RiverFront Moderate Growth Fund and RiverFront Moderate Growth & Income Fund are not obligated to pay any such waived or reimbursed fees and expenses more than three years after the end of the fiscal year in which the fees or expenses were waived or reimbursed. At April 30, 2011, the Adviser and Sub-Adviser may seek reimbursement of previously waived and reimbursed fees as follows:
| Fund | Expires 2012 | Expires 2013 | Expires 2014 | Total | ||||
ALPS | Kotak | N/A | N/A | $110,596 | $110,596 | ||||
ALPS | Red | $213,644 | N/A | N/A | 213,644 | ||||
ALPS | WMC | 189,671 | N/A | N/A | 189,671 | ||||
Clough | 185,083 | N/A | N/A | 185,083 | ||||
Jefferies Asset Management Commodity Strategy | N/A | N/A | 298,479 | 298,479 | ||||
RiverFront | N/A | 151,401 | 171,374 | 322,775 | ||||
RiverFront | N/A | N/A | 57,541 | 57,541 | ||||
RiverFront | N/A | N/A | 72,197 | 72,197 | ||||
RiverFront | N/A | N/A | 70,572 | 70,572 |
ALPS Fund Services, Inc. (“AFS”) serves as administrator to the RiverFront Long Term Growth & Income Fund, RiverFront Moderate Growth Fund, and RiverFront Moderate Growth & Income Fund (collectively the “RiverFront Funds”). AFS has contractually agreed to waive its administrative fees, billed monthly at a rate of 0.10%, based on each RiverFront Fund’s average daily net assets, annualized, pursuant to an Administrative Agreement. The Administrative Agreement is currently in effect with ALPS through August 31, 2012 and will be reevaluated on an annual basis thereafter.
ALPS Distributors, Inc. (an affiliate of ALPS and AAI) (“ADI” or the “Distributor”) acts as the distributor of the Funds’ shares pursuant to a Distribution Agreement with the Trust. Shares are sold on a continuous basis by ADI as agent for the Funds, and ADI has agreed to use its best efforts to solicit orders for the sale of Funds’ shares, although it is not obliged to sell any particular amount of shares. ADI is not entitled to any compensation for its services as Distributor. ADI is registered as a broker-dealer with the Securities and Exchange Commission.
Each Fund has adopted a Distribution and Services Plan (the “Plan”) pursuant to Rule 12b-1 of the 1940 Act for the Class A, Class C, Class R (ALPS | Red Rocks Listed Private Equity Fund only), and Investor Class (RiverFront Long-Term Growth Fund only) shares. The Plan allows a Fund to use Class A, Class C, Class R and Investor Class assets to pay fees in connection with the distribution and marketing of Class A, Class C, Class R and Investor Class shares and/or the provision of shareholder services to Class A, Class C, Class R and Investor Class shareholders. The Plan permits payment for services in connection with the administration of plans or programs that use Class A, Class C, Class R and Investor Class shares of a Fund, if any, as their funding medium and for related expenses. The Plan permits a Fund to make total payments at an annual rate of up to 0.25% of a Fund’s average daily net assets attributable to its Class A and Investor Class shares, 0.75% of a Fund’s average daily net assets attributable to its Class C shares and 0.50% of the ALPS | Red Rocks Listed Private Equity Fund’s average daily net assets attributable to its Class R shares. Because these fees are paid out of a Fund’s Class A, Class C, Class R and Investor Class assets, if any, on an ongoing basis, over time they will increase the cost of an investment in Class A, Class C, Class R and Investor Class shares, if any, and Plan fees may cost an investor more than other types of sales charges.
The ALPS | Kotak India Growth Fund Class A and Class C shares, ALPS | Red Rocks Listed Private Equity Fund Class A and Class C shares, ALPS | WMC Value Intersection Fund Class C shares, Clough China Fund Class C shares, Jefferies Commodity Strategy Allocation Fund Class A and Class C shares, RiverFront Long-Term Growth Fund Class C shares, RiverFront Long-Term Growth & Income Fund Class C shares, RiverFront Moderate Growth Fund Class C shares, and the RiverFront Moderate Growth & Income Fund Class C shares have adopted a shareholder services plan (“Shareholder Services Plan”). Under the Shareholder Services Plan for each Fund, the Funds are authorized to pay banks and their affiliates and other institutions, including broker-dealers and Fund affiliates (“Participating Organizations”), an aggregate fee in an amount not to exceed on an annual basis 0.15% for ALPS | Kotak India Growth Fund Class A shares, ALPS | Red Rocks Listed Private Equity Fund Class A shares, and Jefferies Commodity Strategy Allocation Fund Class A shares, and not to exceed 0.25% for the ALPS | Kotak India Growth Fund Class C shares, ALPS | Red Rocks Listed Private Equity Fund Class C shares, ALPS | WMC Value Intersection Fund Class C shares, Clough China Fund Class C shares, Jefferies Commodity Strategy
| 122 | October 31, 2011 |
Table of Contents
Notes to Financial Statements | ||||
October 31, 2011 (Unaudited)
| ||||
Allocation Fund Class C shares, RiverFront Long-Term Growth Fund Class C shares, RiverFront Long-Term Growth & Income Fund Class C shares, RiverFront Moderate Growth Fund Class C shares, and RiverFront Moderate Growth & Income Fund Class C shares of the average daily net asset value of the Class A shares and Class C shares, respectively, attributable to or held in the name of a Participating Organization for its clients as compensation for providing shareholder service activities, which do not include distribution services, pursuant to an agreement with a Participating Organization. Shareholder Services plan fees are included with distribution and service fees on the Statement of Operations.
ALPS Fund Services, Inc. (“ALPS”) (an affiliate of ADI and AAI) serves as administrator to the Funds and the Funds have agreed to pay expenses incurred in connection with its administrative activities. Pursuant to an Administrative Agreement, ALPS provides operational services to the Funds including, but not limited to fund accounting and fund administration and generally assists in the Funds’ operations.
The Annual Administrative Fee is based on each Fund’s average daily net assets and will be billed monthly, at the following:
| Fund | Average Daily Net Assets of the Fund | Annual Administrative Fee | ||||
ALPS | Kotak India Growth Fund | All Asset Levels | 0.15% | ||||
ALPS | Red Rocks Listed Private Equity Fund | First $500 Million | 0.08% | ||||
| $500 Million - $1 Billion | 0.06% | |||||
| Over $1 Billion | 0.04% | |||||
ALPS | WMC Value Intersection Fund | All Asset Levels | 0.15% | ||||
Clough China Fund | All Asset Levels | 0.15% | ||||
Jefferies Asset Management Commodity Strategy Allocation Fund | All Asset Levels | 0.10% | ||||
RiverFront Long-Term Growth Fund | All Asset Levels | 0.10% | ||||
RiverFront Long-Term Growth & Income Fund | All Asset Levels | 0.10% | ||||
RiverFront Moderate Growth Fund | All Asset Levels | 0.10% | ||||
RiverFront Moderate Growth & Income Fund | All Asset Levels | 0.10% |
| 6. | TRANSACTIONS WITH AFFILIATES |
For the six months ending October 31, 2011, the following Funds recorded distributions from affiliated investment companies as affiliated dividend income, and had the following affiliated purchases and sales:
RiverFront Long-Term Growth Fund
| Security Name | Share Balance May 1, 2011 | Purchases | Sales | Share Balance October 31, 2011 | Dividend Income | Realized Gain/(Loss) | Market Value | |||||||||||||||||||||
Consumer Discretionary Select Sector SPDR® Fund | – | 21,085 | 869 | 20,216 | $ | – | $ | 100 | $ | 789,637 | ||||||||||||||||||
Financial Select Sector SPDR® Fund | 38,418 | 30,829 | 15,792 | 53,455 | 4,714 | (44,362 | ) | 722,712 | ||||||||||||||||||||
Health Care Select Sector SPDR® Fund | – | 23,262 | 6,040 | 17,222 | 6,820 | (18,098 | ) | 578,487 | ||||||||||||||||||||
Total | $ | 11,534 | $ | (62,360 | ) | $ | 2,090,836 | |||||||||||||||||||||
RiverFront Long-Term Growth & Income Fund
| Security Name | Share Balance May 1, 2011 | Purchases | Sales | Share Balance October 31, 2011 | Dividend Income | Realized Loss | Market Value October 31, 2011 | |||||||||||||||||||||
Health Care Select Sector SPDR® Fund | – | 13,505 | 309 | 13,196 | $ | 4,263 | $ | (1,641) | $ | 443,254 | ||||||||||||||||||
Total | $ | 4,263 | $ | (1,641) | $ | 443,254 | ||||||||||||||||||||||
| 123 | October 31, 2011 |
Table of Contents
Notes to Financial Statements | ||||
October 31, 2011 (Unaudited)
| ||||
RiverFront Moderate Growth Fund
| Security Name | Share Balance May 1, 2011 | Purchases | Sales | Share Balance October 31, 2011 | Dividend Income | Realized Loss | Market Value 2011 | |||||||||||||||||||||
Consumer Discretionary Select Sector SPDR® Fund | – | 7,879 | 76 | 7,803 | $ | – | $ | (84 | ) | $ | 304,785 | |||||||||||||||||
Financial Select Sector SPDR® Fund | 7,128 | 15,371 | 37 | 22,462 | 1,379 | (190 | ) | 303,686 | ||||||||||||||||||||
Health Care Select Sector SPDR® Fund | – | 7,324 | 36 | 7,288 | 1,880 | (180 | ) | 244,804 | ||||||||||||||||||||
Total | $ | 3,259 | $ | (454 | ) | $ | 853,275 | |||||||||||||||||||||
RiverFront Moderate Growth & Income Fund
| Security Name | Share Balance May 1, 2011 | Purchases | Sales | Share Balance October 31, 2011 | Dividend Income | Realized Gain | Market Value October 31, 2011 | |||||||||||||||||||
Health Care Select Sector SPDR® Fund | – | 28,149 | – | 28,149 | $ | 8,533 | $ | – | $ | 945,525 | ||||||||||||||||
Total | $ | 8,533 | $ | – | $ | 945,525 | ||||||||||||||||||||
The above securities are deemed affiliated investment companies because the Fund’s Distributor is also the distributor of the Select Sector SPDR exchange traded funds (the “Underlying Sector ETFs”). As required by exemptive relief obtained by the Underlying Sector ETFs, the Adviser will reimburse the Fund an amount equal to the distribution fee received by ADI from the Underlying Sector ETFs attributable to the Fund’s investment in the Underlying Sector ETFs, for so long as ADI acts as the distributor to the Fund and the Underlying Sector ETFs.
| 7. | INDEMNIFICATIONS |
Under the Trust’s organizational documents, its officers and Trustees are indemnified against certain liability arising out of the performance of their duties to the Trust. Additionally, in the normal course of business, the Trust enters into contracts with service providers that may contain general indemnification clauses. The Trust’s maximum exposure under these arrangements is unknown, as this would involve future claims that may be made against the Trust that have not yet occurred.
| 8. | SUBSEQUENT EVENTS |
Management has evaluated whether any events or transactions occurred subsequent to October 31, 2011 through the date of issuance of the Funds’ financial statements and determined that there were no other material events or transactions that would require recognition or disclosure in the Funds’ financial statements. However, the following are details relating to subsequent events through the date the financial statements were issued.
RiverFront Global Allocation Series:
On December 16, 2011 the Board of Trustees approved, on behalf of the RiverFront Global Allocation Series: (i) a change of name of the Funds that will be effective January 1, 2012; (ii) a change of investment objective that will be effective February 15, 2012. For further details, please visit the SEC website at www.sec.gov.
| 124 | October 31, 2011 |
Table of Contents
October 31, 2011 (Unaudited)
| ||||
| 1. | FUND HOLDINGS |
The Funds file their complete schedule of portfolio holdings with the Securities and Exchange Commission (the “SEC”) for the first and third quarters of each fiscal year on Form N-Q within 60 days after the end of the period. Copies of the Funds’ Form N-Q are available without charge on the SEC website at http:// www.sec.gov. You may also review and copy the Form N-Q at the SEC’s Public Reference Room in Washington, D.C. For more information about the operation of the Public Reference Room, please call the SEC at 1-800-SEC-0330.
| 2. | FUND PROXY VOTING POLICIES, PROCEDURES AND SUMMARIES |
Fund policies and procedures used in determining how to vote proxies and information regarding how each of the Funds voted proxies relating to portfolio securities during the most recent prior 12-month period ending June 30 will be available without charge, (1) upon request, by calling (866) 759-5679 and (2) on the SEC’s website at http://www.sec.gov.
| 3. | DISCLOSURE REGARDING APPROVAL OF FUND ADVISORY AGREEMENTS |
ALPS/Red Rocks Listed Private Equity Fund
On July 26, 2011, the Trustees met in person to discuss, among other things, the renewal and approval of the Investment Advisory and Management Agreement between the Trust and ALPS Advisors (the “LPE Fund Advisory Agreement”) and the Investment Sub-Advisory Agreement among the Trust, ALPS Advisors and Red Rocks Capital LLC (“Red Rocks”), the sub-adviser for the ALPS/Red Rocks Listed Private Equity Fund (the “LPE Fund Sub-Advisory Agreement, together with the LPE Fund Advisory Agreement, the “LPE Fund Advisory Agreements”) in accordance with Section 15(c) of the 1940 Act. The Independent Trustees met with independent legal counsel during executive session and discussed the LPE Fund Advisory Agreements and other related materials.
In renewing and approving the LPE Fund Advisory Agreements, the Trustees, including the Independent Trustees, considered the following factors with respect to the LPE Fund:
Investment Advisory Fee Rate: The Trustees reviewed and considered the contractual annual advisory fee to be paid by (a) the Trust, on behalf of the LPE Fund, to ALPS Advisors of 0.85% of the LPE Fund’s daily average net assets and (b) by ALPS Advisors to Red Rocks of 0.57% based on the LPE Fund’s average net assets, in light of the extent and quality of the advisory services provided by the ALPS Advisors and Red Rocks to the LPE Fund.
The Board received and considered information comparing the LPE Fund’s contractual advisory fees and overall expenses with those of funds in both the relevant expense group and universe of funds provided by an independent provider of investment company data, as well as the LPE Fund’s direct competitors and similar products advised by ALPS Advisors and by Red Rocks.
Based on such information, the Trustees further determined that the contractual annual advisory fees set forth above and the total expense ratio (after waivers) of 1.65%, 2.40%, 1.40% and 1.90% for Class A, Class C, Class I and Class R shares, respectively, of the LPE Fund, taking into account the contractual fee waivers in place, is comparable to others within such Fund’s peer universe.
Nature, Extent and Quality of the Services under the LPE Fund Advisory Agreements: The Trustees received and considered information regarding the nature, extent and quality of services provided to the LPE Fund under the LPE Fund Advisory Agreements. The Trustees reviewed certain background materials supplied by ALPS Advisors and Red Rocks in each of their presentations, including their Forms ADV.
The Trustees reviewed and considered ALPS Advisors’ and Red Rocks’ investment advisory personnel, their history as asset managers, their performance and the amount of assets currently under management by ALPS Advisors and Red Rocks. The Trustees also reviewed the research and decision-making processes utilized by ALPS Advisors and Red Rocks, including the methods adopted to seek to achieve compliance with the investment objectives, policies and restrictions of the LPE Fund.
The Trustees considered the background and experience of ALPS Advisors’ and Red Rocks’ management in connection with the LPE Fund, including reviewing the qualifications, backgrounds and responsibilities of the management team primarily responsible for the day-to-day portfolio management of the LPE Fund and the extent of the resources devoted to research and analysis of actual and potential investments.
The Trustees also reviewed the accompanying compliance-related materials and further noted that they have received reports on these services and compliance issues from ALPS Advisors and Red Rocks at each regular Board meeting throughout the year related to the services rendered by ALPS Advisors and Red Rocks with respect to the LPE Fund.
LPE Fund Performance: The Trustees reviewed performance information for the LPE Fund for the three-month, 1-year and 3-year periods ended March 31, 2011. That review included a comparison of the LPE Fund’s performance to the performance of a group of comparable funds selected by an independent research firm. The Trustees noted the favorable performance of the LPE Fund over the past 1-year period ended March 31, 2011 compared against funds identified by an independent research
| 125 | October 31, 2011 |
Table of Contents
Additional Information | ||||
October 31, 2011 (Unaudited)
| ||||
firm. The Trustees also considered Red Rocks’ discussion of the LPE Fund’s underlying portfolio diversification categories, its top contributors and top detractors, as well as Red Rocks’ performance and reputation generally and its investment techniques, risk management controls and decision-making processes.
The Advisers’ Profitability: The Trustees received and considered a projected profitability analysis prepared by ALPS Advisors and by Red Rocks based on the fees payable under the LPE Fund Advisory Agreements. The Trustees noted that the LPE Fund’s total fees and expenses were within an acceptable range of the median expenses of comparable funds identified by an independent research firm. The Trustees considered the losses realized by ALPS Advisors and by Red Rocks in connection with the operation of the LPE Fund. The Trustees also considered the advisers’ statements regarding their continuing commitment to the LPE Fund despite these losses. The Board then reviewed and discussed ALPS Advisors’ and Red Rocks’ financial statements in order to analyze the financial condition and stability and profitability of each adviser.
Economies of Scale: The Trustees considered whether economies of scale in the provision of services to the LPE Fund were being passed along to the shareholders. The Trustees considered whether any economies of scale, fall-out benefits or any other direct or indirect benefits would accrue to ALPS Advisors or Red Rocks from their relationship with the Trust.
Other Benefits to the Advisers: The Trustees reviewed and considered any other benefits derived or to be derived by ALPS Advisors and Red Rocks from their relationship with the LPE Fund, including soft-dollar arrangements.
The Board summarized its deliberations with respect to the LPE Fund Advisory Agreements. In selecting ALPS Advisors and Red Rocks and approving the LPE Fund Advisory Agreements and fees under such agreements, the Trustees concluded that no single factor reviewed by the Trustees was identified by the Trustees to be determinative as the principal factor in whether to approve the LPE Fund Advisory Agreements. Further, the Independent Trustees were advised by separate independent legal counsel throughout the process. The Trustees, including all of the Independent Trustees, concluded that:
| » | the investment advisory fees to be received by ALPS Advisors with respect to the LPE Fund were comparable to others within such Fund’s peer universe, as well as similar products advised by ALPS Advisors and by Red Rocks; |
| » | the nature, extent and quality of services rendered by ALPS Advisors under the LPE Fund Advisory Agreement and by Red Rocks under the LPE Fund Sub-Advisory Agreement were adequate; |
| » | the performance of the LPE Fund was generally comparable to the performance of the funds in its peer group, although the peer group was composed of several funds that, although in the financial sector, have very different investment theses than the LPE Fund; |
| » | the profit, if any, anticipated to be realized by ALPS Advisors and by Red Rocks in connection with the operation of the LPE Fund is not unreasonable, especially in light of the fee waiver agreement among the Trust, ALPS Advisors and Red Rocks; and |
| » | there were no material economies of scale or other incidental benefits accruing to ALPS Advisors or Red Rocks in connection with its relationship with the LPE Fund. |
Based on the Trustees’ deliberations and their evaluation of the information described above, all of the Trustees, including all of the Independent Trustees in person at the Meeting, concluded that ALPS Advisors’ and Red Rocks’ compensation for investment advisory services is consistent with the best interests of the LPE Fund and its shareholders.
ALPS/WMC Value Intersection Fund
On July 26, 2011, the Trustees met in person to discuss, among other things, the renewal and approval of the Investment Advisory Agreement between the Trust and ALPS Advisors (the “WMC Fund Advisory Agreement”) and the Investment Sub-Advisory Agreement among the Trust, ALPS Advisors and Wellington, the sub-adviser for the WMC Fund (the “WMC Fund Sub-Advisory Agreement, together with the WMC Fund Advisory Agreement, the “WMC Fund Advisory Agreements”) in accordance with Section 15(c) of the 1940 Act. The Independent Trustees met with independent legal counsel during executive session and discussed the WMC Fund Advisory Agreements and other related materials.
In renewing and approving the WMC Fund Advisory Agreements, the Trustees, including the Independent Trustees, considered the following factors with respect to the WMC Fund:
Investment Advisory Fee Rate: The Trustees reviewed and considered the tiered contractual annual advisory fee to be paid by (a) the Trust, on behalf of the WMC Fund, to ALPS Advisors of (i) 0.95% of the WMC Fund’s daily average net assets of $0-$250M; (ii) 0.85% of the WMC Fund’s daily average net assets between $250M-$500M ; and (iii) 0.75% of the WMC Fund’s daily average net assets over $500M and (b) by ALPS Advisors to Wellington of (i) 0.50% of the WMC Fund’s daily average net assets of $0-$250M; (ii) 0.40% of the WMC Fund’s daily average net assets between $250M-$500M; and (iii) 0.30% of the WMC Fund’s daily average net assets over $500M, in light of the extent and quality of the advisory services provided by the ALPS Advisors and Wellington to the WMC Fund.
| 126 | October 31, 2011 |
Table of Contents
Additional Information | ||||
October 31, 2011 (Unaudited)
| ||||
The Board received and considered information comparing the WMC Fund’s contractual advisory fees and overall expenses with those of funds in both the relevant expense group and universe of funds provided by an independent provider of investment company data, as well as the WMC Fund’s direct competitors.
Based on such information, the Trustees further determined that the tiered contractual annual advisory fees set forth above and the total expense ratio of 1.40%, 2.15% and 1.15% for Class A, Class C and Class I, respectively, of the WMC Fund, taking into account the contractual fee waivers in place, is comparable to others within such Fund’s peer universe.
Nature, Extent and Quality of the Services under the WMC Fund Advisory Agreements: The Trustees received and considered information regarding the nature, extent and quality of services provided to the WMC Fund under the WMC Fund Advisory Agreements. The Trustees reviewed certain background materials supplied by ALPS Advisors and Wellington in each of their presentations, including their Forms ADV.
The Trustees reviewed and considered ALPS Advisors’ and Wellington’s investment advisory personnel, their history as asset managers, their performance and the amount of assets currently under management by ALPS Advisors and Wellington. The Trustees also reviewed the research and decision-making processes utilized by ALPS Advisors and Wellington, including the methods adopted to seek to achieve compliance with the investment objectives, policies and restrictions of the WMC Fund.
The Trustees considered the background and experience of ALPS Advisors’ and Wellington’s management in connection with the WMC Fund, including reviewing the qualifications, backgrounds and responsibilities of the management team primarily responsible for the day-to-day portfolio management of the WMC Fund and the extent of the resources devoted to research and analysis of actual and potential investments.
The Trustees also reviewed the accompanying compliance related materials and also noted that they have received reports on these services and compliance issues from ALPS Advisors and Wellington at each regular Board meeting throughout the year related to the services rendered by ALPS Advisors and Wellington with respect to the WMC Fund.
WMC Fund Performance: The Trustees reviewed performance information for the WMC Fund and the predecessor fund of the WMC Fund (December 31, 1999 inception) for the three month, 1-year, 3-year and 5-year periods ended March 31, 2011. That review included a comparison of the WMC Fund’s performance to the performance of a group of comparable funds selected by an independent research firm. The Trustees noted the favorable performance of the WMC Fund over the past
1-year period ended March 31, 2011 compared against funds identified by an independent research firm and Wellington’s observation that the WMC Fund’s three-month performance for the quarter ended March 31, 2011 outperformed the WMC Fund’s benchmark. The Trustees also considered Wellington’s discussion of the WMC Fund’s performance contributors and detractors and its portfolio position and outlook, as well as Wellington’s performance and reputation generally and its investment techniques, risk management controls and decision making processes.
The Advisers’ Profitability: The Trustees received and considered a projected profitability analysis prepared by ALPS Advisors and by Wellington based on the fees payable under the WMC Fund Advisory Agreements. The Trustees noted that the WMC Fund’s total fees and expenses were within an acceptable range of the median expenses of comparable funds identified by an independent research firm. The Trustees considered the losses realized by ALPS Advisors and by Wellington in connection with the operation of the WMC Fund. The Trustees also considered the advisers’ statements regarding their continuing commitment to the WMC Fund despite these losses. The Board then reviewed and discussed ALPS Advisors’ and Wellington’s financial statements in order to analyze the financial condition and stability and profitability of each adviser.
Economies of Scale: The Trustees considered whether economies of scale in the provision of services to the WMC Fund were being passed along to the shareholders. The Trustees considered whether any economies of scale, fall-out benefits or any other direct or indirect benefits would accrue to ALPS Advisors or Wellington from their relationship with the Trust.
Other Benefits to the Advisers: The Trustees reviewed and considered any other benefits derived or to be derived by ALPS Advisors and Wellington from their relationship with the WMC Fund, including soft-dollar arrangements.
The Board summarized its deliberations with respect to the WMC Fund Advisory Agreement with ALPS Advisors and the WMC Fund Sub-Advisory Agreement with Wellington. In selecting ALPS Advisors and Wellington and approving the investment advisory and sub-advisory agreements and fees under such agreements, the Trustees concluded that no single factor reviewed by the Trustees was identified by the Trustees to be determinative as the principal factor in whether to approve the WMC Fund Advisory Agreements. Further, the Independent Trustees were advised by separate independent legal counsel throughout the process. The Trustees, including all of the Independent Trustees, concluded that:
| » | the investment advisory fees to be received by ALPS Advisors with respect to the WMC Fund were comparable to others within such Fund’s peer universe, as well as similar products advised by ALPS Advisors and by Wellington; |
| 127 | October 31, 2011 |
Table of Contents
Additional Information | ||||
October 31, 2011 (Unaudited)
| ||||
| » | the nature, extent and quality of services rendered by ALPS Advisors under the WMC Fund Advisory Agreement and by Wellington under the WMC Fund Sub-Advisory Agreement were adequate; |
| » | the performance of the WMC Fund was generally comparable to the performance of the funds in its peer group; |
| » | the profit, if any, anticipated to be realized by ALPS Advisors and by Wellington in connection with the operation of the WMC Fund is not unreasonable, especially in light of the fee waiver agreement between the Trust and ALPS Advisors; and |
| » | there were no material economies of scale or other incidental benefits accruing to ALPS Advisors or Wellington in connection with its relationship with the WMC Fund. |
Based on the Trustees’ deliberations and their evaluation of the information described above, all of the Trustees, including all of the Independent Trustees in person at the Meeting, concluded that ALPS Advisors’ and Wellington’s compensation for investment advisory services is consistent with the best interests of the WMC Fund and its shareholders.
Clough China Fund
On July 26, 2011, the Trustees met in person to discuss, among other things, the renewal and approval of the Investment Advisory Agreement between the Trust and ALPS Advisors (the “China Fund Advisory Agreement”) and the Investment Sub-Advisory Agreement among the Trust, ALPS Advisors and Clough Capital, the sub-adviser for the China Fund (the “China Fund Sub-Advisory Agreement, together with the China Fund Advisory Agreement, the “China Fund Advisory Agreements”) in accordance with Section 15(c) of the 1940 Act. The Independent Trustees met with independent legal counsel during executive session and discussed the China Fund Advisory Agreements and other related materials.
In renewing and approving the China Fund Advisory Agreements, the Trustees, including the Independent Trustees, considered the following factors with respect to the China Fund:
Investment Advisory Fee Rate: The Trustees reviewed and considered the tiered contractual annual advisory fee to be paid by (a) the Trust, on behalf of the China Fund, to ALPS Advisors of 1.35% of the China Fund’s daily average net assets and (b) ALPS Advisors to Clough Capital of 0.90% of the China Fund’s daily average net assets, in light of the extent and quality of the advisory services provided by the ALPS Advisors and Clough Capital to the China Fund.
The Board received and considered information comparing the China Fund’s contractual advisory fees and overall expenses with those of funds in both the relevant expense group and universe of funds provided by an independent provider of investment company data.
Based on such information, the Trustees further determined that the tiered contractual annual advisory fees set forth above and the total expense ratio (after waivers) of 1.85%, 2.45% and 1.40% for Class A, Class C and Class I, respectively, of the China Fund, taking into account the contractual fee waivers in place, is comparable to others within such Fund’s peer universe.
Nature, Extent and Quality of the Services under the China Fund Advisory Agreements: The Trustees received and considered information regarding the nature, extent and quality of services provided to the China Fund under the China Fund Advisory Agreements. The Trustees reviewed certain background materials supplied by ALPS Advisors and Clough Capital in each of their presentations, including their Forms ADV.
The Trustees reviewed and considered ALPS Advisors’ and Clough Capital’s investment advisory personnel, their history as asset managers, their performance and the amount of assets currently under management by ALPS Advisors and Clough Capital. The Trustees also reviewed the research and decisionmaking processes utilized by ALPS Advisors and Clough Capital, including the methods adopted to seek to achieve compliance with the investment objectives, policies and restrictions of the China Fund.
The Trustees considered the background and experience of ALPS Advisors’ and Clough Capital’s management in connection with the China Fund, including reviewing the qualifications, backgrounds and responsibilities of the management team primarily responsible for the day-to-day portfolio management of the China Fund and the extent of the resources devoted to research and analysis of actual and potential investments.
The Trustees also reviewed the accompanying compliance related materials and also noted that they have received reports on these services and compliance issues from ALPS Advisors and Clough Capital at each regular Board meeting throughout the year related to the services rendered by ALPS Advisors and Clough Capital with respect to the China Fund.
China Fund Performance: The Trustees reviewed performance information for the China Fund and the predecessor fund of the China Fund (December 30, 2005 inception) for the three month, 1-year, 3-year and 5-year periods ended March 31, 2011. That review included a comparison of the China Fund’s performance to the performance of a group of comparable funds selected by an independent research firm. The Trustees noted the China Fund’s performance over the past 1-year period ended
| 128 | October 31, 2011 |
Table of Contents
Additional Information | ||||
October 31, 2011 (Unaudited)
| ||||
March 31, 2011, but also took into account the China Fund’s favorable performance over the past 3-year and 5-year periods compared against funds identified by an independent research firm and the China Fund’s improving performance relative to the median over the three months ended March 31, 2011. The Trustees also considered Clough Capital’s performance and reputation generally and its investment techniques, risk management controls and decision-making processes, as well as Clough Capital’s overview of the China market, the economic outlook for investing in China and the potential effects of certain political and economic issues on trading in Chinese stocks.
The Advisers’ Profitability: The Trustees received and considered a projected profitability analysis prepared by ALPS Advisors and by Clough Capital based on the fees payable under the China Fund Advisory Agreements. The Trustees noted that the China Fund’s total fees and expenses were within an acceptable range of the median expenses of comparable funds identified by an independent research firm. The Trustees considered the losses realized by ALPS Advisors and by Clough Capital in connection with the operation of the China Fund. The Trustees also considered the advisers’ statements regarding their continuing commitment to the China Fund despite these losses. The Board then reviewed and discussed ALPS Advisors’ and Clough Capital’s financial statements in order to analyze the financial condition and stability and profitability of each adviser.
Economies of Scale: The Trustees considered whether economies of scale in the provision of services to the China Fund were being passed along to the shareholders. The Trustees considered whether any economies of scale, fall-out benefits or any other direct or indirect benefits would accrue to ALPS Advisors or Clough Capital from their relationship with the Trust.
Other Benefits to the Advisers: The Trustees reviewed and considered any other benefits derived or to be derived by ALPS Advisors and Clough Capital from their relationship with the China Fund, including soft-dollar arrangements.
The Board summarized its deliberations with respect to the China Fund Advisory Agreement with ALPS Advisors and the China Fund Sub-Advisory Agreement with Clough Capital. In selecting ALPS Advisors and Clough Capital and approving the investment advisory and sub-advisory agreements and fees under such agreements, the Trustees concluded that no single factor reviewed by the Trustees was identified by the Trustees to be determinative as the principal factor in whether to approve the China Fund Advisory Agreements. Further, the Independent Trustees were advised by separate independent legal counsel throughout the process. The Trustees, including all of the Independent Trustees, concluded that:
| » | the investment advisory fees to be received by ALPS Advisors with respect to the China Fund were comparable to others within such Fund’s peer universe, as well as similar products advised by ALPS Advisors and by Clough Capital; |
| » | the nature, extent and quality of services rendered by ALPS Advisors under the China Fund Advisory Agreement and by Clough Capital under the China Fund Sub-Advisory Agreement were adequate; |
| » | the performance of the China Fund was generally comparable to the performance of the funds in its peer group; |
| » | the profit, if any, anticipated to be realized by ALPS Advisors and by Clough Capital in connection with the operation of the China Fund is not unreasonable, especially in light of the fee waiver agreement between the Trust and ALPS Advisors; and |
| » | there were no material economies of scale or other incidental benefits accruing to ALPS Advisors or Clough Capital in connection with its relationship with the China Fund. |
Based on the Trustees’ deliberations and their evaluation of the information described above, all of the Trustees, including all of the Independent Trustees in person at the Meeting, concluded that ALPS Advisors’ and Clough Capital’s compensation for investment advisory services is consistent with the best interests of the China Fund and its shareholders.
Jefferies Asset Management Commodity Strategy Allocation Fund
On July 26, 2011, the Trustees met in person to discuss, among other things, the renewal and approval of the Investment Advisory Agreement between the Trust and ALPS Advisors (the “JAM Fund Advisory Agreement”) and the Investment Sub-Advisory Agreement among the Trust, ALPS Advisors and Jefferies, the sub-adviser for the JAM Fund (the “JAM Fund Sub-Advisory Agreement, together with the JAM Fund Advisory Agreement, the “JAM Fund Advisory Agreements”) in accordance with Section 15(c) of the 1940 Act. The Independent Trustees met with independent legal counsel during executive session and discussed the JAM Fund Advisory Agreements and other related materials.
In renewing and approving the JAM Fund Advisory Agreements, the Trustees, including the Independent Trustees, considered the following factors with respect to the JAM Fund:
Investment Advisory Fee Rate: The Trustees reviewed and considered the contractual annual advisory fee to be paid by (a) the Trust, on behalf of the JAM Fund, to ALPS Advisors of 0.85% of the JAM Fund’s daily average net assets and (b) by ALPS Advisors to Jefferies of (i) 0.75% of the JAM Fund’s daily average net assets, in light of the extent and quality of the advisory services provided by the ALPS Advisors and Jefferies to the JAM Fund.
| 129 | October 31, 2011 |
Table of Contents
Additional Information | ||||
October 31, 2011 (Unaudited)
| ||||
The Board received and considered information comparing the JAM Fund’s contractual advisory fees and overall expenses with those of funds in both the relevant expense group and universe of funds provided by an independent provider of investment company data, as well as the JAM Fund’s direct competitors and similar products advised by ALPS Advisors and Jefferies.
Based on such information, the Trustees further determined that the contractual annual advisory fees set forth above and the total expense ratio of 1.45% for Class A shares, 2.05% for Class C shares, and 1.15% for Class I shares of the JAM Fund, taking into account the contractual fee waivers in place, is comparable to others within such Fund’s peer universe.
Nature, Extent and Quality of the Services under the JAM Fund Advisory Agreements: The Trustees received and considered information regarding the nature, extent and quality of services provided to the JAM Fund under the JAM Fund Advisory Agreements. The Trustees reviewed certain background materials supplied by ALPS Advisors and Jefferies in each of their presentations, including their Forms ADV.
The Trustees reviewed and considered ALPS Advisors’ and Jefferies’ investment advisory personnel, their history as asset managers, their performance and the amount of assets currently under management by ALPS Advisors and Jefferies. The Trustees also reviewed the research and decision-making processes utilized by ALPS Advisors and Jefferies, including the methods adopted to seek to achieve compliance with the investment objectives, policies and restrictions of the JAM Fund.
The Trustees considered the background and experience of ALPS Advisors’ and Jefferies’ management in connection with the JAM Fund, including reviewing the qualifications, backgrounds and responsibilities of the management team primarily responsible for the day-to-day portfolio management of the JAM Fund and the extent of the resources devoted to research and analysis of actual and potential investments.
The Trustees also reviewed the accompanying compliance-related materials and also noted that they have received reports on these services and compliance issues from ALPS Advisors and Jefferies at each regular Board meeting throughout the year related to the services rendered by ALPS Advisors and Jefferies with respect to the JAM Fund.
JAM Fund Performance: The Trustees reviewed performance information for the JAM Fund for the three-month and since inception (June 29, 2010) periods ended March 31, 2011. The review included a comparison of the JAM Fund’s performance to the performance of a group of comparable funds selected by an independent research firm. The Trustees observed that the JAM Fund had limited performance history data available at the time of the Meeting, due to the Fund’s inception date of June 29, 2010.
The Trustees noted, however, that the JAM Fund had above median performance for the three months ended March 31, 2011, compared against comparable funds identified by an independent research firm. The Trustees also considered Jefferies’ performance and reputation generally and its investment techniques, risk management controls and decision-making processes.
The Advisers’ Profitability: The Trustees received and considered a profitability analysis prepared by ALPS Advisors and by Jefferies based on the fees payable under the JAM Fund Advisory Agreements. The Trustees considered the losses realized by ALPS Advisors and by Jefferies in connection with the operation of the JAM Fund. The Trustees also considered the advisers’ statements regarding their continuing commitment to the JAM Fund despite these losses. The Trustees noted that the JAM Fund’s total fees and expenses were within an acceptable range of the median expenses of comparable funds identified by an independent research firm. The Board then reviewed and discussed ALPS Advisors’ and Jefferies’ financial statements in order to analyze the financial condition and stability and profitability of each adviser.
Economies of Scale: The Trustees considered whether economies of scale in the provision of services to the JAM Fund were being passed along to the shareholders. The Trustees considered whether any economies of scale, fall-out benefits or any other direct or indirect benefits would accrue to ALPS Advisors or Jefferies from their relationship with the Trust.
Other Benefits to the Advisers: The Trustees reviewed and considered any other benefits derived or to be derived by ALPS Advisors and Jefferies from their relationship with the JAM Fund, including soft dollar arrangements.
The Board summarized its deliberations with respect to the JAM Fund Advisory Agreement with ALPS Advisors and the JAM Fund Sub-Advisory Agreement with Jefferies. In selecting ALPS Advisors and Jefferies and approving the investment advisory and subadvisory agreements and fees under such agreements, the Trustees concluded that no single factor reviewed by the Trustees was identified by the Trustees to be determinative as the principal factor in whether to approve the investment advisory and sub-advisory agreements. Further, the Independent Trustees were advised by separate independent legal counsel throughout the process. The Trustees, including all of the Independent Trustees, concluded that:
| » | the investment advisory fees to be received by ALPS Advisors with respect to the JAM Fund were comparable to others with in such Fund’s peer universe, as well as similar products advised by ALPS Advisors and Jefferies; |
| » | the nature, extent and quality of services rendered by ALPS Advisors under the JAM Fund Advisory Agreement and by Jefferies under the JAM Fund Sub-Advisory Agreement were adequate; |
| 130 | October 31, 2011 |
Table of Contents
Additional Information | ||||
October 31, 2011 (Unaudited)
| ||||
| » | the performance of the JAM Fund was generally comparable to the performance of the funds in its peer group; |
| » | the profit, if any, anticipated to be realized by ALPS Advisors and by Jefferies in connection with the operation of the JAM Fund is not unreasonable, especially in light of the fee waiver agreement between the Trust and Jefferies; and |
| » | there were no material economies of scale or other incidental benefits accruing to ALPS Advisors or Jefferies in connection with its relationship with the JAM Fund. |
Based on the Trustees’ deliberations and their evaluation of the information described above, the Trustees, including all of the Independent Trustees, concluded that ALPS Advisors’ and Jefferies’ compensation for investment advisory services is consistent with the best interests of the JAM Fund and its shareholders.
RiverFront Long-Term Growth Fund; RiverFront Moderate Growth Fund; RiverFront Long-Term Growth & Income Fund; and RiverFront Moderate Growth & Income Fund
On July 26, 2011, the Trustees met in person to discuss, among other things, the renewal and approval of the Investment Advisory Agreements between the Trust and ALPS Advisors regarding the RiverFront Funds (the “RiverFront Fund Investment Advisory Agreements”) and the Investment Sub-Advisory Agreement among the Trust, ALPS Advisors and RiverFront, the sub-adviser for the RiverFront Funds (the “RiverFront Fund Sub-Advisory Agreement, together with the RiverFront Fund Investment Advisory Agreements, the “RiverFront Fund Advisory Agreements”) in accordance with Section 15(c) of the 1940 Act. The Independent Trustees met with independent legal counsel during executive session and discussed the RiverFront Fund Advisory Agreements and other related materials.
In renewing and approving the RiverFront Fund Advisory Agreements, the Trustees, including the Independent Trustees, considered the following factors with respect to the RiverFront Fund:
Investment Advisory Fee Rate: The Trustees reviewed and considered the contractual annual advisory fee to be paid by (a) the Trust, on behalf of the RiverFront Funds, to ALPS Advisors of 0.90% of each of the RiverFront Fund’s daily average net assets and (b) by ALPS Advisors to RiverFront of 0.60% of each of the RiverFront Fund’s daily average net assets, in light of the extent and quality of the advisory services provided by the ALPS Advisors and RiverFront to the RiverFront Funds.
The Board received and considered information comparing the RiverFront Funds’ contractual advisory fees and overall expenses with those of funds in both the relevant expense group
and universe of funds provided by an independent provider of investment company data, as well as each of the RiverFront Fund’s direct competitors.
Based on such information, the Trustees further determined that the contractual annual advisory fees set forth above and the total expense ratio of 1.30%, 2.05%, 1.05%, 0.90% and 1.15% for Class A, Class C, Class I, Class L and Investor Class shares of the RiverFront Funds, taking into account the contractual fee waivers in place, is comparable to others within such Fund’s peer universe.
Nature, Extent and Quality of the Services under the RiverFront Fund Advisory Agreements: The Trustees received and considered information regarding the nature, extent and quality of services provided to the RiverFront Funds under the RiverFront Fund Advisory Agreements. The Trustees reviewed certain background materials supplied by ALPS Advisors and RiverFront in each of their presentations, including their Forms ADV.
The Trustees reviewed and considered ALPS Advisors’ and RiverFront’s investment advisory personnel, their history as asset managers, their performance and the amount of assets currently under management by ALPS Advisors and RiverFront. The Trustees also reviewed the research and decision-making processes utilized by ALPS Advisors and RiverFront, including the methods adopted to seek to achieve compliance with the investment objectives, policies and restrictions of the RiverFront Funds.
The Trustees considered the background and experience of ALPS Advisors’ and RiverFront’s management in connection with the RiverFront Funds, including reviewing the qualifications, backgrounds and responsibilities of the management team primarily responsible for the day-to-day portfolio management of the RiverFront Funds and the extent of the resources devoted to research and analysis of actual and potential investments.
The Trustees also reviewed the accompanying compliance related materials and also noted that they have received reports on these services and compliance issues from ALPS Advisors and RiverFront at each regular Board meeting throughout the year related to the services rendered by ALPS Advisors and RiverFront with respect to the RiverFront Funds.
RiverFront Funds’ Performance: The Trustees reviewed performance information for (i) the RiverFront Long-Term Growth Fund and the predecessor fund of the RiverFront Long-Term Growth Fund (October 28, 2008 inception) and (ii) the RiverFront Moderate Growth Fund, the RiverFront Long-Term Growth & Income Fund and the RiverFront Moderate Growth & Income Fund (August 2, 2010 inception), for the three-month, 1-year, 3-year, 5-year and since inception periods ended March 31, 2011. The review included a comparison of the each of the
| 131 | October 31, 2011 |
Table of Contents
Additional Information | ||||
October 31, 2011 (Unaudited)
| ||||
RiverFront Fund’s performance to the performance of a group of comparable funds selected by an independent research firm. The Trustees also considered RiverFront’s performance and reputation generally and its investment techniques, risk management controls and decision-making processes.
With respect to the RiverFront Long Term Growth Fund, the Trustees noted that performance was near or below the median for the past one-year period ending March 31, 2011 against comparable funds identified by an independent research firm, but also noted the RiverFront Long-Term Growth Fund’s improving performance relative to the median for the three months ended March 31, 2011 and relative to comparable funds. The Trustees also noted that the performance history of the RiverFront Long-Term Growth Fund reflects, in part, performance of its predecessor prior to reorganization as a series of the Trust, for which predecessor fund RiverFront also provided advisory services.
With respect to the RiverFront Long Term Growth & Income Fund, the RiverFront Moderate Growth Fund and the RiverFront Moderate Growth & Income Fund, the Trustees noted that each fund had a limited performance history due to their inception date of August 2, 2010.
The Advisers’ Profitability: The Trustees received and considered a profitability analysis prepared by ALPS Advisors and by RiverFront based on the fees payable under the RiverFront Fund Advisory Agreements. The Trustees considered the losses realized by ALPS Advisors and by RiverFront in connection with the operation of the RiverFront Funds. The Trustees also considered the advisers’ statements regarding their continuing commitment to the RiverFront Funds despite these losses. The Trustees noted that the total fees and expenses for each of the RiverFront Funds were within an acceptable range of the median expenses of comparable funds identified by an independent research firm. The Board then reviewed and discussed ALPS Advisors’ and RiverFront’s financial statements in order to analyze the financial condition and stability and profitability of each adviser.
Economies of Scale: The Trustees considered whether economies of scale in the provision of services to the RiverFront Funds were being passed along to the shareholders. The Trustees considered whether any economies of scale, fall-out benefits or any other direct or indirect benefits would accrue to ALPS Advisors or RiverFront from their relationship with the Trust.
Other Benefits to the Advisers: The Trustees reviewed and considered any other benefits derived or to be derived by ALPS Advisors and RiverFront from their relationship with the RiverFront Funds, including soft dollar arrangements.
The Board summarized its deliberations with respect to the RiverFront Fund Investment Advisory Agreement with ALPS Advisors and the RiverFront Fund Sub-Advisory Agreement with RiverFront. In selecting ALPS Advisors and RiverFront and
approving the investment advisory and sub-advisory agreements and fees under such agreements, the Trustees concluded that no single factor reviewed by the Trustees was identified by the Trustees to be determinative as the principal factor in whether to approve the investment advisory and sub-advisory agreements. Further, the Independent Trustees were advised by separate independent legal counsel throughout the process. The Trustees, including all of the Independent Trustees, concluded that:
| » | the investment advisory fees to be received by ALPS Advisors with respect to the RiverFront Funds were comparable to others with in each Fund’s peer universe, as well as similar products advised by ALPS Advisors and RiverFront; |
| » | the nature, extent and quality of services rendered by ALPS Advisors under the RiverFront Fund Investment Advisory Agreement and by RiverFront under the RiverFront Fund Sub-Advisory Agreement were adequate; |
| » | the performance of each of the RiverFront Funds was generally comparable to the performance of the funds in each Fund’s peer group; |
| » | the profit, if any, anticipated to be realized by ALPS Advisors and by RiverFront in connection with the operation of the RiverFront Funds is not unreasonable, especially in light of the fee waiver agreement among the Trust, ALPS Advisors and RiverFront; and |
| » | there were no material economies of scale or other incidental benefits accruing to ALPS Advisors or RiverFront in connection with its relationship with the RiverFront Funds. |
Based on the Trustees’ deliberations and their evaluation of the information described above, the Trustees, including all of the Independent Trustees, concluded that ALPS Advisors’ and RiverFront’s compensation for investment advisory services is consistent with the best interests of each of the RiverFront Funds and its shareholders.
ALPS/Kotak India Growth Fund
On July 26, 2011, the Trustees met in person to discuss, among other things, the renewal and approval of the Investment Advisory Agreements between the Trust and ALPS Advisors regarding the ALPS/Kotak India Growth Fund (the “Indian Fund Advisory Agreement”) and the Investment Sub-Advisory Agreement among the Trust, ALPS Advisors and Kotak, the sub-adviser for the India Fund (the “India Fund Sub-Advisory Agreement, together with the India Fund Advisory Agreement, the “India Fund Advisory Agreements”) in accordance with Section 15(c) of the 1940 Act. The Independent Trustees met with independent legal counsel during executive session and discussed the India Fund Advisory Agreements and other related materials.
| 132 | October 31, 2011 |
Table of Contents
Additional Information | ||||
October 31, 2011 (Unaudited)
| ||||
In renewing and approving the India Fund Advisory Agreements, the Trustees, including the Independent Trustees, considered the following factors with respect to the India Fund:
Investment Advisory Fee Rate: The Trustees reviewed and considered the contractual annual advisory fee to be paid by (a) the Trust, on behalf of the India Fund, to ALPS Advisors of 1.25% of the India Fund’s daily average net assets and (b) by ALPS Advisors to Kotak of (i) 1.15% of the India Fund’s daily average net assets on the first $50 million and 1.05% of the India Fund’s daily average net assets over $50 million, in light of the extent and quality of the advisory services provided by the ALPS Advisors and Kotak to the India Fund.
The Board received and considered information comparing the India Fund’s contractual advisory fees and overall expenses with those of funds in both the relevant expense group and universe of funds provided by an independent provider of investment company data, as well as the India Fund’s direct competitors and similar products advised by ALPS Advisors and by Kotak.
Based on such information, the Trustees further determined that the contractual annual advisory fees set forth above and the total expense ratio of 1.75% (exclusive of Rule 12b-1 fees and various other items) for Class A shares, Class C shares, and Class I shares of the India Fund, taking into account the contractual fee waivers in place, is comparable to others within such Fund’s peer universe.
Nature, Extent and Quality of the Services under the India Fund Advisory Agreements: The Trustees received and considered information regarding the nature, extent and quality of services provided to the India Fund under the India Fund Advisory Agreements. The Trustees reviewed certain background materials supplied by ALPS Advisors and Kotak in each of their presentations, including their Forms ADV.
The Trustees reviewed and considered ALPS Advisors’ and Kotak’s investment advisory personnel, their history as asset managers, their performance and the amount of assets currently under management by ALPS Advisors and Kotak. The Trustees also reviewed the research and decision-making processes utilized by ALPS Advisors and Kotak, including the methods adopted to seek to achieve compliance with the investment objectives, policies and restrictions of the India Fund.
The Trustees considered the background and experience of ALPS Advisors’ and Kotak’s management in connection with the India Fund, including reviewing the qualifications, backgrounds and responsibilities of the management team primarily responsible for the day-to-day portfolio management of the India Fund and the extent of the resources devoted to research and analysis of actual and potential investments.
The Trustees also reviewed the accompanying compliance related materials and also noted that they have received reports on these services and compliance issues from ALPS Advisors and Kotak at each regular Board meeting through the year related to the services rendered by ALPS Advisors and Kotak with respect to the India Fund.
India Fund Performance: The Trustees reviewed performance information for the India Fund since inception (February 14, 2011) through the period ended March 31, 2011. The review included a comparison of the India Fund’s performance to the performance of a group of comparable funds selected by an independent research firm. The Trustees noted that the India Fund had limited performance history data available at the time of the meeting, due to the India Fund’s inception date of February 14, 2011. The Trustees also considered Kotak’s performance and reputation generally and its investment techniques, risk management controls and decision-making processes.
The Advisers’ Profitability: The Trustees received and considered a profitability analysis prepared by ALPS Advisors and by Kotak based on the fees payable under the India Fund Advisory Agreements. The Trustees considered the losses realized by ALPS Advisors and by Kotak in connection with the operation of the India Fund. The Trustees also considered the advisers’ statements regarding their continuing commitment to the India Fund despite these losses. The Trustees noted that the India Fund’s total fees and expenses were within an acceptable range of the median expenses of comparable funds identified by an independent research firm. The Board then reviewed and discussed ALPS Advisors’ and Kotak’s financial statements in order to analyze the financial condition and stability and profitability of each adviser.
Economies of Scale: The Trustees considered whether economies of scale in the provision of services to the India Fund were being passed along to the shareholders. The Trustees considered whether any economies of scale, fall-out benefits or any other direct or indirect benefits would accrue to ALPS Advisors or Kotak from their relationship with the Trust.
Other Benefits to the Advisers: The Trustees reviewed and considered any other benefits derived or to be derived by ALPS Advisors and Kotak from their relationship with the India Fund, including soft dollar arrangements.
The Board summarized its deliberations with respect to the India Fund Advisory Agreement with ALPS Advisors and the India Fund Sub-Advisory Agreement with Kotak. In selecting ALPS Advisors and Red Rocks and approving the investment advisory and sub-advisory agreements and fees under such agreements, the Trustees concluded that no single factor reviewed by the Trustees was identified by the Trustees to be determinative as the principal factor in whether to approve the investment advisory and sub-advisory agreements. Further, the Independent Trustees were advised by separate independent legal counsel throughout the process. The Trustees, including all of the Independent Trustees, concluded that:
| » | the investment advisory fees received by ALPS Advisors with respect to the India Fund were comparable to others within such Fund’s peer universe, as well as similar products advised by ALPS Advisors and by Kotak; |
| 133 | October 31, 2011 |
Table of Contents
Additional Information | ||||
October 31, 2011 (Unaudited)
| ||||
| » | the nature, extent and quality of services rendered by ALPS Advisors under the India Fund Advisory Agreement and by Kotak under the India Fund Sub-Advisory Agreement were adequate; |
| » | the performance of the India Fund was generally comparable to the performance of the funds in its peer group; |
| » | the profit, if any, anticipated to be realized by ALPS Advisors in connection with the operation of the India Fund is not unreasonable, especially in light of the fee waiver agreement among the Trust, ALPS Advisors and Kotak; and |
| » | there were no material economies of scale or other incidental benefits accruing to ALPS Advisors or Kotak in connection with its relationship with the India Fund. |
Based on the Trustees’ deliberations and their evaluation of the information described above, the Trustees, including all of the Independent Trustees, concluded that ALPS Advisors’ and Kotak’s compensation for investment advisory services is consistent with the best interests of the India Fund and its shareholders.
| 3. | SHAREHOLDER MEETING |
A Special Meeting of Shareholders of the ALPS/Red Rocks Listed Private Equity Fund, ALPS/WMC Value Intersection Fund, Clough China Fund, Jefferies Asset Management Commodity Strategy Allocation Fund, RiverFront Long-Term Growth Fund, RiverFront Moderate Growth Fund, RiverFront Long-Term Growth & Income Fund, RiverFront Moderate Growth & Income Fund and ALPS/Kotak India Growth Fund (each, a “Fund” and together, the “Funds”) was held on October 14, 2011 (the “Meeting”) and adjourned and reconvened to October 28, 2011 and November 1, 2011. At the meetings, the following matters were voted on and approved by the Shareholders. Each vote reported represents one dollar of net asset value held on the record date of the meeting. The results of the Special Meeting of Shareholders are noted below.
Proposal 1 - To approve a new Investment Advisory Agreement for each Fund and ALPS Advisors, Inc.:
| Number of Votes | ||||||||||||||||||||
| Fund | Record Date Votes | Affirmative | Against | Abstain | Uninstructed | |||||||||||||||
ALPS/Red Rocks Listed Private Equity Fund | 17,705,934.019 | 17,425,953.687 | 91,859.305 | 188,121.027 | 0.000 | |||||||||||||||
ALPS/WMC Value Intersection Fund | 4,527,157.632 | 4,013,703.357 | 185,427.911 | 328,026.364 | 0.000 | |||||||||||||||
Clough China Fund | 2,421,552.907 | 2,153,843.854 | 37,130.494 | 24,776.559 | 205,802.000 | |||||||||||||||
Jefferies Asset Management Commodity Strategy Allocation Fund | 5,331,041.213 | 5,148,514.516 | 49,694.209 | 54,836.488 | 77,996.000 | |||||||||||||||
RiverFront Long-Term Growth Fund | 2,583,213.688 | 2,453,390.709 | 4,773.142 | 17,891.837 | 107,158.000 | |||||||||||||||
RiverFront Long-Term Growth & Income Fund | 1,001,193.310 | 752,822.956 | 6,241.666 | 18,323.688 | 233,805.000 | |||||||||||||||
RiverFront Moderate Growth Fund | 875,189.834 | 590,336.811 | 6,547.929 | 49,726.094 | 228,579.000 | |||||||||||||||
RiverFront Moderate Growth & Income Fund | 2,456,382.553 | 1,724,799.625 | 22,334.698 | 60,945.230 | 648,303.000 | |||||||||||||||
ALPS/Kotak India Growth Fund | 224,896.090 | 223,519.090 | 902.000 | 475.000 | 0.000 | |||||||||||||||
| 134 | October 31, 2011 |
Table of Contents
Additional Information | ||||
October 31, 2011 (Unaudited)
| ||||
| Percentage of Total Outstanding | Percentage of Voted | |||||||||||||||
| Fund | Affirmative | Against | Abstain | Uninstructed | Affirmative | Against | Abstain | Uninstructed | ||||||||
ALPS/Red Rocks Listed Private Equity Fund | 54.221% | 0.286% | 0.585% | 0.000% | 98.419% | 0.519% | 1.062% | 0.000% | ||||||||
ALPS/WMC Value Intersection Fund | 45.022% | 2.080% | 3.680% | 0.000% | 88.658% | 4.096% | 7.246% | 0.000% | ||||||||
Clough China Fund | 45.178% | 0.779% | 0.520% | 4.317% | 88.945% | 1.533% | 1.023% | 8.499% | ||||||||
Jefferies Asset Management Commodity Strategy Allocation Fund | 49.064% | 0.474% | 0.523% | 0.743% | 96.576% | 0.932% | 1.029% | 1.463% | ||||||||
RiverFront Long-Term Growth Fund | 48.222% | 0.094% | 0.351% | 2.106% | 94.974% | 0.185% | 0.693% | 4.148% | ||||||||
RiverFront Long-Term Growth & Income Fund | 37.936% | 0.315% | 0.923% | 11.278% | 75.193% | 0.623% | 1.830% | 22.354% | ||||||||
RiverFront Moderate Growth Fund | 34.748% | 0.385% | 2.927% | 13.454% | 67.452% | 0.748% | 5.682% | 26.118% | ||||||||
RiverFront Moderate Growth & Income Fund | 35.662% | 0.462% | 1.260% | 13.404% | 70.217% | 0.909% | 2.481% | 26.393% | ||||||||
ALPS/Kotak India Growth Fund | 63.179% | 0.255% | 0.134% | 0.000% | 99.388% | 0.401% | 0.211% | 0.000% | ||||||||
Proposal 2 - To approve a new Sub-Advisory Agreement for each Fund with ALPS Advisors, Inc. and each of the current Sub-Advisers:
| Number of Votes | ||||||||||||||||||||
| Fund | Record Date Votes | Affirmative | Against | Abstain | Uninstructed | |||||||||||||||
ALPS/Red Rocks Listed Private Equity Fund | 17,705,934.019 | 17,417,236.636 | 98,029.356 | 190,668.027 | 0.000 | |||||||||||||||
ALPS/WMC Value Intersection Fund | 4,527,157.632 | 4,029,961.487 | 159,981.613 | 337,314.532 | 0.000 | |||||||||||||||
Clough China Fund | 2,421,552.907 | 2,134,144.506 | 35,939.842 | 45,666.599 | 205,802.000 | |||||||||||||||
Jefferies Asset Management Commodity Strategy Allocation Fund | 5,331,041.213 | 5,143,587.858 | 50,415.209 | 59,042.146 | 77,996.000 | |||||||||||||||
RiverFront Long-Term Growth Fund | 2,583,213.688 | 2,452,911.709 | 4,776.142 | 18,370.837 | 107,158.000 | |||||||||||||||
RiverFront Long-Term Growth & Income Fund | 1,001,193.310 | 752,822.956 | 6,241.666 | 18,323.688 | 233,805.000 | |||||||||||||||
RiverFront Moderate Growth Fund | 875,189.834 | 588,625.099 | 6,547.929 | 51,437.806 | 228,579.000 | |||||||||||||||
RiverFront Moderate Growth & Income Fund | 2,456,382.553 | 1,713,451.701 | 34,161.979 | 60,465.873 | 648,303.000 | |||||||||||||||
ALPS/Kotak India Growth Fund | 224,896.090 | 233,410.090 | 1,011.000 | 475.000 | 0.000 | |||||||||||||||
| Percentage of Total Outstanding | Percentage of Voted | |||||||||||||||
| Fund | Affirmative | Against | Abstain | Uninstructed | Affirmative | Against | Abstain | Uninstructed | ||||||||
ALPS/Red Rocks Listed Private Equity Fund | 54.193% | 0.305% | 0.594% | 0.000% | 98.369% | 0.554% | 1.077% | 0.000% | ||||||||
ALPS/WMC Value Intersection Fund | 45.203% | 1.795% | 3.784% | 0.000% | 89.015% | 3.534% | 7.451% | 0.000% | ||||||||
Clough China Fund | 44.765% | 0.754% | 0.958% | 4.317% | 88.131% | 1.484% | 1.886% | 8.499% | ||||||||
| 135 | October 31, 2011 |
Table of Contents
Additional Information | ||||
October 31, 2011 (Unaudited)
| ||||
| Percentage of Total Outstanding | Percentage of Voted | |||||||||||||||
| Fund | Affirmative | Against | Abstain | Uninstructed | Affirmative | Against | Abstain | Uninstructed | ||||||||
Jefferies Asset Management Commodity Strategy Allocation Fund | 49.018% | 0.480% | 0.563% | 0.743% | 96.484% | 0.946% | 1.107% | 1.463% | ||||||||
RiverFront Long-Term Growth Fund | 48.212% | 0.094% | 0.361% | 2.106% | 94.956% | 0.185% | 0.711% | 4.148% | ||||||||
RiverFront Long-Term Growth & Income Fund | 37.936% | 0.315% | 0.923% | 11.278% | 75.193% | 0.623% | 1.830% | 22.354% | ||||||||
RiverFront Moderate Growth Fund | 34.647% | 0.385% | 3.028% | 13.454% | 67.257% | 0.748% | 5.877% | 26.118% | ||||||||
RiverFront Moderate Growth & Income Fund | 35.427% | 0.706% | 1.251% | 13.404% | 69.755% | 1.391% | 2.461% | 26.393% | ||||||||
ALPS/Kotak India Growth Fund | 63.148% | 0.286% | 0.134% | 0.000% | 99.339% | 0.450% | 0.211% | 0.000% | ||||||||
| 136 | October 31, 2011 |
Table of Contents
Table of Contents

Table of Contents
October 31, 2011
| CONTENTS | PAGE | |
| 1 | ||
| 6 | ||
| 12 | ||
| 8 | ||
| 14 | ||
| 9 | ||
| 15 | ||
| 18 | ||
| 19 | ||
| 20 | ||
| 22 | ||
| 24 | ||
| 31 | ||
| 1-877-421-5078 | www.vulcanvaluepartners.com |
Table of Contents
October 31, 2011 (Unaudited)
Dear Shareholders:
During the six months ended October 31, 2011, equity markets declined and volatility increased markedly. Vulcan Value Partners’ discipline of limiting our investments to companies with stable values and strong balance sheets served us well.
We are pleased to report that the Vulcan Value Partners Funds preserved capital for the period ended October 31, 2011^. Performance for the Vulcan Value Partners Fund and the Vulcan Value Partners Small Cap Fund was above their respective major market indices and benchmarks both year to date and for the six months ended October 31, 2011. We place no weight on short term results, good or bad, and neither should you. We are focused on seeking to produce superior real rates of return over our five year time horizon. Everything we do is with that goal in mind, even if it hurts our results in the short run. We encourage you to place more weight on our longer term historical results and a great deal of weight on our long-term prospects. Also, as you review our results please remember that all of our investment operations are driven by the same investment philosophy.
Increased market volatility coincided with the release of earning results so we had real time value updates as prices were falling. In contrast to declines in stock prices, our estimate of our portfolio values increased. As price to value ratios(c) improved, we allocated more capital to companies with growing values at larger discounts, resulting in a potentially larger estimated margin of safety and improved prospects for future potential compounding. It is important to note that when we say that the estimates of our values are stable or increasing, we are incorporating a deteriorating global economy in our estimates.
Our companies are not immune to the economy but we believe they hold dominant positions in their respective industries, historically produce consistent high levels of free cash flow(a) and have strong balance sheets. We also think they have demonstrated an ability to compound their values through good times and bad. A company whose stock price has declined but whose value has risen offers the potential for significant rewards to the long term investor.
In addition to allocating capital among existing positions, we took full advantage of stock price volatility and purchased several new companies with what we believe to be exceptional economics that are discounted to our estimate of intrinsic value(d). We follow a number of companies that we do not own but would like to own should they ever become sufficiently discounted. We compare these companies to the companies we already own in the portfolios. When we can materially improve our margin of safety, both in terms of price to value and business quality, we will sell companies that we own and buy those that we do not. The hurdle is high because we already own outstanding businesses at a discount to our estimate of intrinsic value.
We were able to execute and improve our portfolios because our research team was prepared when price declines created opportunities to buy wonderful business with steadily growing values. We had already done the bulk of the work when these businesses became discounted to our estimate of fair value(b), so we were able to move quickly, update our values, and execute on the trading desk. As an example, on August 8th, the S&P 500(e) had an intra-day percentage decline of approximately -7.1% and the Russell 2000®(f) declined approximately -8.3%. On August 9th the intra-day decline for the S&P 500 was approximately -6.5% and the Russell 2000 was approximately -8.8%. Companies that we have waited patiently to buy at a price were available to
Semi-Annual (Unaudited) | October 31, 2011 | 1 |
Table of Contents
Shareholder Letter
October 31, 2011 (Unaudited)
us for only a few hours at a time. We were able to fill all of our orders for four positions, and nearly all of a fifth. To give you a sense of how briefly these companies were available to us at prices we wanted to pay, these positions closed up approximately 10.2%, 9.2%, 7.5%, 6.7%, and 7.5%, respectively on August 9th compared to the prices we paid for them during the day. The short term gains are nice but we are buying them with a five year time horizon. We believe that double digit value growth and an eventual closing of the price to value discount will result in above average long term returns with less risk. I am extremely pleased with our research team’s performance.
I am also pleased with you, our clients. During this period many of you added capital. Your stable capital and long term time horizon allowed us to take full advantage of the opportunities presented to us. Your actions during this period speak volumes. We greatly appreciate the confidence you have placed in us and look forward to delivering results consistent with our investment philosophy – above average compounding with below average risk.
Please note that in the commentary that follows regarding each of our funds we define meaningful as having a 1% impact on portfolio returns or a greater than 10% change in price. We generally limit comments about top contributors and detractors to the top three or to companies that had a meaningful impact on portfolio performance. As we discuss our investment programs below, please keep in mind that we follow a single investment philosophy and simply apply it to different areas of the equity markets.
VULCAN VALUE PARTNERS FUND REVIEW
We purchased Visa, United Technologies, Parker Hannifin, and Bank of New York Mellon. These are companies we have followed for many years, some even for decades, that are rarely discounted to our estimate of fair value(b). They became available to us at what we believe to be compelling discounts as their values have risen steadily for many years and their prices declined meaningfully during the third quarter. We also added to existing positions whose values, we believe, have risen and whose prices have declined.
We paid for these positions by reducing our stakes in less discounted companies, selling companies whose discounts and overall business quality were meaningfully less attractive than those we were buying and from cash inflows from you. We partially paid for Visa by reducing our weight in MasterCard. MasterCard is a wonderful business that was more discounted than Visa during the 2008 financial crisis when we bought it. MasterCard’s value has compounded at a solid double digit rate since we purchased it but its stock price has risen even faster. In fact, it is one of the best performing stocks in the S&P 500 this year with a gain of approximately 55%. As a result, its price to value ratio(c) is less attractive than when we originally purchased it. In the meantime, Visa’s value has compounded at a similar double digit rate but its stock price has underperformed. Consequently, its price to value ratio(c) has become compelling.
United Technologies and Parker Hannifin are U.S. multinationals with significant operations outside the U.S. They are leaders in their respective industries and deliver difficult to duplicate, value added products to their customers. Both companies have strong balance sheets, produce high levels of free cash flow(a) and earn attractive returns on invested capital. They are well managed and have grown their values at double digit rates over many years. Bank of New York Mellon is a leading custody bank, which is very different from a commercial bank. Just like the
2 | www.vulcanvaluepartners.com |
Table of Contents
Shareholder Letter
October 31, 2011 (Unaudited)
manufacturing oriented United Technologies and Parker Hannifin, Bank of New York Mellon has produced high levels of free cash flow(a), has attractive returns on invested capital, a strong balance sheet, and significant operations outside the U.S. Its growth is driven by global growth in financial assets.
We also sold Hewlett Packard, Teva Pharmaceuticals, Time Warner Cable and Whirlpool. Each company is unique and all are discounted to our estimate of fair value(b). We sold them because we had an opportunity to both improve our estimated margin of safety and upgrade the quality of our portfolio.
Top contributors to performance included Apple, MasterCard, and Google. All of these businesses are competitively entrenched, extremely well managed, and are growing their values at or above our expectations, despite less than robust economic conditions.
Detractors to performance included Hewlett Packard, Dover Corp and Disney. Dover Corp and Disney are growing their values steadily and we are pleased with the steps their management teams are taking to strengthen their business franchises and allocate capital intelligently. We sold Hewlett Packard despite its discount because capital allocation missteps were impeding value growth and we had the opportunity to redeploy capital into what we believe are more compelling businesses with even more attractive valuations.
VULCAN VALUE PARTNERS SMALL CAP FUND REVIEW
We purchased four new positions: Nordson, Idex, Eaton Vance and Jarden. These are companies we have followed for many years, some even for decades, that are rarely discounted to our estimate of fair value(b). They became available to us at what we believe to be compelling discounts as their values have risen steadily for many years and their prices declined meaningfully during the third quarter. We also added to existing positions whose values, we believe, have risen and whose prices have declined.
Nordson and Idex are U.S. based manufacturing companies with substantial operations outside the U.S. Both make highly engineered, value added products and hold dominant positions in niche markets. We owned Idex several years ago. We continued to follow it after we sold it because we wanted to be ready to buy it again, should it ever become discounted sufficiently. Idex steadily grew its value after we sold it. Stock price declines during the third quarter gave us an opportunity to own it again with a potentially significant margin of safety. Eaton Vance is an extremely well managed investment company that has steadily grown its value through both bull and bear markets. It is also a company we have been waiting many, many years to buy at a discount to our estimate of fair value(b).
Jarden is very well managed and has an enviable collection of consumer brands including Coleman, K2, Rawlings, Crockpot, Sunbeam, Oster, Mr. Coffee, Rival, Ball, Pine Mountain, and First Alert among others.
We paid for these positions by reducing our stakes in less discounted companies and selling companies whose discounts and overall business quality we think were meaningfully less attractive than those we were buying. We sold Corelogic, Lender Processing Services, Investment Technology Group, Markel Corp and Speedway Motorsports. All of these businesses were
Semi-Annual (Unaudited) | October 31, 2011 | 3 |
Table of Contents
Shareholder Letter
October 31, 2011 (Unaudited)
discounted to our estimate of fair value(b). We sold them because we had an opportunity to both improve our margin of safety and upgrade the already high quality of our portfolio. We also exited Dr. Pepper Snapple, which was a wonderful investment for us but was no longer sufficiently discounted compared to other alternatives available to us. We exited Miller Industries for the same reason. We were not able to purchase a meaningful stake in Miller Industries at prices we wanted to pay, so we exited the small position with a gain.
Top contributors to performance included Pro Assurance, Towers Watson and Heartland Payment Systems. Pro Assurance is a well run medical malpractice insurer that happens to be based in our hometown of Birmingham, Alabama. Despite a soft insurance market, health care reform and a weak economy, Pro Assurance has grown its value consistently since we bought it several years ago. Towers Watson is the product of a merger between publicly traded Watson Wyatt and privately held Towers Perrin. The combination is a consulting powerhouse with a global reach. We are not fans of mergers and acquisitions as prices are often too high and hoped for synergies rarely occur. To their credit, Towers Watson is proving to be an exception to the rule. The company’s stock, which, in our opinion, over-discounted the risks of the merger, has reacted favorably as the company has made material progress bringing the two organizations together. Heartland Payments Systems is a credit card processor. In 2008, it was the victim of a sophisticated data breach whereby encrypted credit card information on their network was stolen. When the breach was discovered we calculated a range of possible legal liabilities related to the data theft. Under the worst of scenarios Heartland Payment Systems was substantially undervalued. As the company has moved forward in settling its claims the market’s assessment of Heartland Payment System’s legal liability has declined and the stock has responded favorably. Our value grew as Heartland settled more of its data breach liabilities for substantially less than our earlier, conservative estimates.
Detractors to performance included Janus Capital, Sonic Corp., and Lender Processing Services. Like Eaton Vance, Janus Capital is in the investment management business. Their stock has reacted negatively to the decline in equities. Janus Capital generates strong free cash flow(a) and should benefit as it delivers investment returns to its clients over time. Sonic Corp. has made solid progress improving same restaurant sales and strengthening its balance sheet since the recession hit in 2008. Continued high unemployment is pressuring its customer base and slowing same restaurant results. The company is generating strong free cash flow(a) and has just announced a share repurchase program, which we believe is an excellent use of capital since its shares are so discounted to our estimate of fair value(b).
CLOSING
Recently, there has been high volatility, steep equity market declines and a weakening global economic environment. Many companies that declined in price deserved to do so. Others, whose values continued to rise, did not. We follow the latter closely and were able to take advantage of improving price to value ratios(c) to materially improve our portfolios across the board. I am extremely proud of our research team whose discipline and hard work allowed us to execute when the opportunity presented itself. We believe we are fully invested in financially strong, high quality companies with steadily rising values selling at steep discounts to our estimate of intrinsic value. We are pleased that we were able to preserve capital in a down market but we are even more pleased with our prospects for future compounding.
4 | www.vulcanvaluepartners.com |
Table of Contents
Shareholder Letter
October 31, 2011 (Unaudited)
We take our fiduciary duty to you very seriously and appreciate the confidence you have placed in us.
Sincerely,
C.T. Fitzpatrick
Chief Investment Officer
| ^ | See pages 6 and 12 for performance returns as of October 31, 2011. |
| (a) | Free cash flow – the cash that a company is able to generate after laying out the money required to maintain or expand its asset base. |
| (b) | Fair value – the estimated value of all assets and liabilities of an acquired company used to consolidate the financial statements of both companies. |
| (c) | Price to value ratio – the ratio of current price to intrinsic value of a company. |
| (d) | The actual value of a company or an asset based on an underlying perception of its true value including all aspects of the business, in terms of both tangible and intangible factors. |
| (e) | The S&P 500 Index is the Standard & Poor’s composite of 500 stocks, a widely recognized, unmanaged index of common stock prices. The index is not actively managed and does not reflect any deduction for fees, expenses or taxes. An investor may not invest directly in an index. |
| (f) | The Russell 2000® Index measures the performance of the small-cap segment of the U.S. equity universe. The Russell 2000® index is subset of the Russell 3000® index representing approximately 10% of the total market capitalization of that index. It includes approximately 2,000 of the smallest securities based on a combination of their market cap and current index membership. The index is not actively managed and does not reflect any deduction for fees, expenses or taxes. An investor may not invest directly in an index. |
Stock markets, especially foreign markets, are volatile and can decline significantly in response to adverse issuer, political, regulatory, market or economic developments. Value stocks can perform differently from the market as a whole. They can remain undervalued by the market for long periods of time. Funds that emphasize investments in smaller companies generally experience greater price volatility.
The Shareholder Letter included in this shareholder report contains certain forward-looking statements about the factors that may affect the performance of the Funds in the future. These statements are based on Fund management’s predictions and expectations concerning certain future events and their expected impact on the Funds, such as performance of the economy as a whole and of specific industry sectors, changes in the levels of interest rates, the impact of developing world events, and other factors that may influence the future performance of the Funds. Management believes these forward-looking statements to be reasonable, although they are inherently uncertain and difficult to predict. Actual events may cause adjustments in portfolio management strategies from those currently expected to be employed.
Semi-Annual (Unaudited) | October 31, 2011 | 5 |
Table of Contents
October 31, 2011 (Unaudited)
Average Annual Total Returns (as of 10/31/2011)
| Annualized | Expense Ratios** | |||||||||||||
1 month | 3 month | YTD | 1 Year | Since Inception* | Gross | Net*** | ||||||||
Vulcan Value Partners Fund | 11.72% | -0.18% | 2.74% | 6.12% | 6.89% | 2.02% | 1.51% | |||||||
Russell 1000® Value Index | 11.45% | -3.40% | -1.08% | 6.16% | 6.98% | |||||||||
S&P 500 Total Return Index | 10.93% | -2.47% | 1.30% | 8.09% | 8.11% | |||||||||
Performance data quoted represents past performance. Past performance does not guarantee future results. Investment return and principal value of an investment will fluctuate so that an investor’s shares, when sold or redeemed, may be worth more or less than the original cost. Current performance data may be higher or lower than actual data quoted. For the most current month-end performance data, please call 1-877-421-5078.
The table does not reflect the deduction of taxes that a shareholder would pay on Fund distributions or the redemption of Fund shares.
Subject to investment risks, including possible loss of the principal amount invested.
| * | Fund Inception date of 12/30/09. |
| ** | The gross and net expense ratios are as stated in the “Fees and Expenses of the Fund” in the Fund’s current prospectus. |
| *** | Vulcan Value Partners, LLC (“Vulcan” or the “Adviser”) has given a contractual agreement to the Fund that to the extent the Total Annual Fund Operating Expenses (as defined in Item 3 of Form N-1A) with respect to the Fund (exclusive of Acquired Fund Fees and Expenses (if any), brokerage expenses, interest expense, taxes and extraordinary expenses) (“Designated Annual Fund Operating Expenses”) exceed 1.50% of the Fund’s average daily net assets for a particular fiscal year of the Fund, the Adviser will reduce the Management Fee and/or Other Expenses otherwise payable to the Adviser with respect to the Fund for the fiscal year by an amount equal to such excess, and/or the Adviser shall reimburse the Fund by the amount of such excess. This agreement is in effect through August 31, 2012. Without this agreement, expenses could be higher. If the Adviser foregoes any fees and/or reimburses the Fund pursuant to this letter agreement with respect to a particular fiscal year, then the Adviser shall be entitled to recover from the Fund the amount foregone or reimbursed to the extent Designated Annual Fund Operating Expenses are less than 1.50% of the Fund’s average daily net assets during any fiscal year following such fiscal year. |
6 | www.vulcanvaluepartners.com |
Table of Contents
Fund Overview
October 31, 2011 (Unaudited)
Performance of $10,000 Initial Investment (as of 10/31/2011)
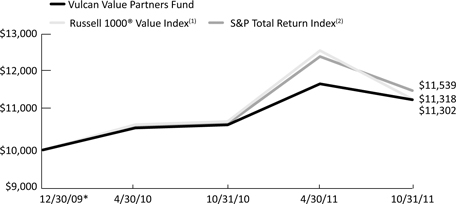
The chart above represents historical performance of a hypothetical investment of $10,000 in the Fund since inception. Past performance does not guarantee future results. This chart does not reflect the deduction of taxes that a shareholder would pay on Fund distributions or the redemption of Fund shares.
| * | Fund Inception date of 12/30/09. |
| (1) | The Russell 1000® Value Index measures the performance of the large-cap value segment of the U.S. equity universe. It includes those Russell 1000® companies with lower price-to-book ratios and lower expected growth values. |
| (2) | The S&P 500 Total Return Index is an unmanaged index of 500 common stocks chosen for market size, liquidity and industry group representation. It is a market-value weighted index. The S&P 500 Index figures do not reflect any fees, expenses or taxes. |
Indices are not actively managed and do not reflect any deduction for fees, expenses or taxes. It is not possible to invest directly in an index.
Investing in the Fund is subject to investment risks, including possible loss of the principal amount invested.
Industry Allocation (as a % of Net Assets)
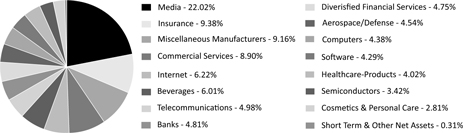
Semi-Annual (Unaudited) | October 31, 2011 | 7 |
Table of Contents
October 31, 2011
As a shareholder of the Vulcan Value Partners Fund (the “Fund”), you will incur two types of costs: (1) transaction costs, including applicable redemption fees; and (2) ongoing costs, including management fees and other Fund expenses. The following examples are intended to help you understand your ongoing costs (in dollars) of investing in the Fund and to compare these costs with the ongoing costs of investing in other mutual funds. The examples are based on an investment of $1,000 invested on May 1, 2011 and held until October 31, 2011.
Actual Expenses. The first line of each table below provides information about actual account values and actual expenses. You may use the information in this line, together with the amount you invested, to estimate the expenses that you paid over the period. Simply divide your account value by $1,000 (for example, an $8,600 account value divided by $1,000 = 8.6), then multiply the result by the number in the first line under the heading “Expenses Paid During Period” to estimate the expenses you paid on your account during this period.
Hypothetical Example for Comparison Purposes. The second line of the table below provides information about hypothetical account values and hypothetical expenses based on the Fund’s actual expense ratio and an assumed rate of return of 5% per year before expenses, which is not the Fund’s actual return. The hypothetical account values and expenses may not be used to estimate the actual ending account balance or expenses you paid for the period. You may use this information to compare the ongoing costs of investing in the Fund and other mutual funds. To do so, compare this 5% hypothetical example with the 5% hypothetical examples that appear in the shareholder reports of the other funds. The expenses shown in the table are meant to highlight ongoing Fund costs only and do not reflect transaction fees, such as redemption fees or exchange fees. Therefore, the second line of each table below is useful in comparing ongoing costs only, and may not help you determine the relative total costs of owning different funds. In addition, if these transactional costs were included, your costs would have been higher.
Beginning Account 5/1/11 | Ending Account Value 10/31/11 | Expense Ratio(a) | Expenses Paid During period 5/1/11 - 10/31/11(b) | |||||
Actual | $ 1,000.00 | $ 964.80 | 1.50% | $ 7.41 | ||||
Hypothetical (5% return before expenses) | $ 1,000.00 | $ 1,017.60 | 1.50% | $ 7.61 | ||||
| (a) | The Fund’s expense ratios have been annualized based on the Fund’s most recent fiscal half-year expenses. |
| (b) | Expenses are equal to the Fund’s annualized expense ratio, multiplied by the average account value over the period, multiplied by the number of days in the most recent fiscal half-year (184)/366. |
8 | www.vulcanvaluepartners.com |
Table of Contents
| Vulcan Value Partners Fund | Statement of Investments | |
| October 31, 2011 (Unaudited) |
| Shares | Value (Note 1) | |||||||
COMMON STOCKS (99.69%) | ||||||||
COMMUNICATIONS (33.22%) | ||||||||
Internet (6.22%) | ||||||||
Google, Inc., Class A(a) | 9,921 | $ | 5,879,581 | |||||
|
| |||||||
Media (22.02%) | ||||||||
Comcast Corp., Class A | 168,932 | 3,885,436 | ||||||
DIRECTV, Class A(a) | 123,172 | 5,599,399 | ||||||
Discovery Communications, Inc., Class C(a) | 102,303 | 4,048,130 | ||||||
Time Warner, Inc. | 86,372 | 3,022,156 | ||||||
The Walt Disney Co. | 122,338 | 4,267,150 | ||||||
|
| |||||||
| 20,822,271 | ||||||||
|
| |||||||
Telecommunications (4.98%) | ||||||||
Cisco Systems, Inc. | 254,284 | 4,711,883 | ||||||
|
| |||||||
TOTAL COMMUNICATIONS | 31,413,735 | |||||||
|
| |||||||
CONSUMER, NON-CYCLICAL (21.74%) | ||||||||
Beverages (6.01%) | ||||||||
The Coca-Cola Co. | 49,744 | 3,398,510 | ||||||
Diageo PLC, Sponsored ADR | 27,509 | 2,279,946 | ||||||
|
| |||||||
| 5,678,456 | ||||||||
|
| |||||||
Commercial Services (8.90%) | ||||||||
Mastercard, Inc., Class A | 8,020 | 2,784,865 | ||||||
Visa, Inc., Class A | 60,338 | 5,627,122 | ||||||
|
| |||||||
| 8,411,987 | ||||||||
|
| |||||||
Cosmetics & Personal Care (2.81%) | ||||||||
The Procter & Gamble Co. | 41,525 | 2,657,185 | ||||||
|
| |||||||
Healthcare-Products (4.02%) | ||||||||
C.R. Bard, Inc. | 18,819 | 1,617,493 | ||||||
Medtronic, Inc. | 62,969 | 2,187,543 | ||||||
|
| |||||||
| 3,805,036 | ||||||||
|
| |||||||
TOTAL CONSUMER, NON-CYCLICAL | 20,552,664 | |||||||
|
| |||||||
FINANCIALS (18.94%) | ||||||||
Banks (4.81%) | ||||||||
The Bank of New York Mellon Corp. | 213,927 | 4,552,366 | ||||||
|
| |||||||
Semi-Annual (Unaudited) | October 31, 2011 | 9 |
Table of Contents
| Statement of Investments | Vulcan Value Partners Fund | |
| October 31, 2011 (Unaudited) |
| Shares | Value (Note 1) | |||||||
FINANCIALS (continued) | ||||||||
Diversified Financial Services (4.75%) | ||||||||
The NASDAQ OMX Group, Inc.(a) | 179,136 | $ | 4,487,357 | |||||
|
| |||||||
Insurance (9.38%) | ||||||||
The Chubb Corp. | 65,489 | 4,391,038 | ||||||
Everest Re Group, Ltd. | 49,820 | 4,479,814 | ||||||
|
| |||||||
| 8,870,852 | ||||||||
|
| |||||||
TOTAL FINANCIALS | 17,910,575 | |||||||
|
| |||||||
INDUSTRIALS (13.70%) | ||||||||
Aerospace/Defense (4.54%) | ||||||||
United Technologies Corp. | 55,113 | 4,297,712 | ||||||
|
| |||||||
Miscellaneous Manufacturers (9.16%) | ||||||||
Dover Corp. | 72,127 | 4,005,212 | ||||||
Parker Hannifin Corp. | 57,080 | 4,654,874 | ||||||
|
| |||||||
| 8,660,086 | ||||||||
|
| |||||||
TOTAL INDUSTRIALS | 12,957,798 | |||||||
|
| |||||||
TECHNOLOGY (12.09%) | ||||||||
Computers (4.38%) | ||||||||
Apple, Inc.(a) | 10,232 | 4,141,709 | ||||||
|
| |||||||
Semiconductors (3.42%) | ||||||||
Texas Instruments, Inc. | 105,215 | 3,233,257 | ||||||
|
| |||||||
Software (4.29%) | ||||||||
Microsoft Corp. | 152,312 | 4,056,068 | ||||||
|
| |||||||
TOTAL TECHNOLOGY | 11,431,034 | |||||||
|
| |||||||
TOTAL COMMON STOCKS (Cost $87,285,350) | 94,265,806 | |||||||
10 | www.vulcanvaluepartners.com |
Table of Contents
| Vulcan Value Partners Fund | Statement of Investments | |
| October 31, 2011 (Unaudited) |
| 7-Day Yield | Shares | Value (Note 1) | ||||||||
SHORT TERM INVESTMENTS (0.35%) | ||||||||||
MONEY MARKET FUND (0.35%) | ||||||||||
Dreyfus Treasury Prime Cash Management | 0.010% | 327,713 | $ | 327,713 | ||||||
|
| |||||||||
TOTAL SHORT TERM INVESTMENTS (Cost $327,713) | 327,713 | |||||||||
TOTAL INVESTMENTS (100.04%) (Cost $87,613,063) | $ | 94,593,519 | ||||||||
Liabilities In Excess Of Other Assets (-0.04%) | (34,249) | |||||||||
NET ASSETS (100.00%) | $ | 94,559,270 | ||||||||
| (a) | Non-Income Producing Security. |
Common Abbreviations:
ADR - American Depositary Receipt.
Ltd. - Limited.
PLC - Public Limited Company.
Holdings are subject to change.
For Fund compliance purposes, the Fund’s industry classifications refer to any one or more of the industry sub-classifications used by one or more widely recognized market indexes or ratings group indexes, and/or as defined by Fund management. This definition may not apply for purposes of this report, which may combine industry subclassifications for reporting ease. Industries are shown as a percent of net assets. These industry classifications are based on third-party definitions. The definitions are industry terms and do not reflect the legal status of any of the investments or the companies in which the Fund has invested.
See Accompanying Notes to Financial Statements.
Semi-Annual (Unaudited) | October 31, 2011 | 11 |
Table of Contents
Fund Overview
October 31, 2011 (Unaudited)
VULCAN VALUE PARTNERS SMALL CAP FUND
Average Annual Total Returns (as of 10/31/2011)
| Annualized | Expense Ratios** | |||||||||||||
1 month | 3 month | YTD | 1 Year | Since Inception* | Gross | Net*** | ||||||||
Vulcan Value Partners Small Cap Fund | 11.48% | -2.27% | -2.82% | 6.84% | 12.40% | 2.51% | 1.51% | |||||||
Russell 2000® Value Index | 14.41% | -7.09% | -6.77% | 3.54% | 7.62% | |||||||||
Russell 2000® Index | 15.14% | -6.67% | -4.46% | 6.71% | 10.28% | |||||||||
Performance data quoted represents past performance. Past performance does not guarantee future results. Investment return and principal value of an investment will fluctuate so that an investor’s shares, when sold or redeemed, may be worth more or less than the original cost. Current performance data may be higher or lower than actual data quoted. For the most current month-end performance data, please call 1-877-421-5078.
The table does not reflect the deduction of taxes that a shareholder would pay on Fund distributions or the redemption of Fund shares.
Subject to investment risks, including possible loss of the principal amount invested.
| * | Fund Inception date of 12/30/09. |
| ** | The gross and net expense ratios are as stated in the “Fees and Expenses of the Fund” in the Fund’s current prospectus. |
| *** | Vulcan Value Partners, LLC (“Vulcan” or the “Adviser”) has given a contractual agreement to the Fund that to the extent the Total Annual Fund Operating Expenses (as defined in Item 3 of Form N-1A) with respect to the Fund (exclusive of Acquired Fund Fees and Expenses (if any), brokerage expenses, interest expense, taxes and extraordinary expenses) (“Designated Annual Fund Operating Expenses”) exceed 1.50% of such Fund’s average daily net assets for a particular fiscal year of the Fund, the Adviser will reduce the Management Fee and/or Other Expenses otherwise payable to the Adviser with respect to the Fund for such fiscal year by an amount equal to such excess, and/or the Adviser shall reimburse the Fund by the amount of such excess. This agreement is in effect through August 31, 2012. Without this agreement, expenses could be higher. If the Adviser foregoes any fees and/or reimburses the Fund pursuant to this letter agreement with respect to a particular fiscal year, then the Adviser shall be entitled to recover from the Fund the amount foregone or reimbursed to the extent Designated Annual Fund Operating Expenses are less than 1.50% of the Fund’s average daily net assets during any fiscal year following such fiscal year. |
12 | www.vulcanvaluepartners.com |
Table of Contents
Fund Overview
October 31, 2011 (Unaudited)
Performance of $10,000 Initial Investment (as of 10/31/2011)
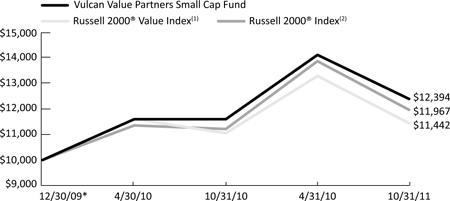
The chart above represents historical performance of a hypothetical investment of $10,000 in the Fund since inception. Past performance does not guarantee future results. This chart does not reflect the deduction of taxes that a shareholder would pay on Fund distributions or the redemption of Fund shares.
| * | Fund Inception date of 12/30/09. |
| (1) | The Russell 2000® Value Index measures the performance of small-cap value segment of the U.S. equity universe. It includes those Russell 2000® companies with lower price-to-book ratios and lower forecasted growth values. |
| (2) | The Russell 2000® Index measures the performance of the small-cap segment of the U.S. equity universe. The Russell 2000® Index is a subset of the Russell 3000® Index representing approximately 8% of the total market capitalization of that index. It includes approximately 2,000 of the smallest securities based on a combination of their market cap and current index membership. |
Indices are not actively managed and do not reflect any deduction for fees, expenses or taxes. It is not possible to invest directly in an index.
Investing in the Fund is subject to investment risks, including possible loss of the principal amount invested.
Industry Allocation (as a % of Net Assets)
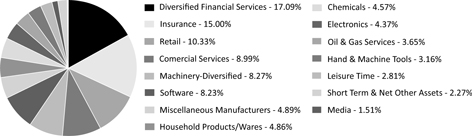
Semi-Annual (Unaudited) | October 31, 2011 | 13 |
Table of Contents
Disclosure of Fund Expenses
October 31, 2011
As a shareholder of the Vulcan Value Partners Small Cap Fund (the “Fund”), you will incur two types of costs: (1) transaction costs, including applicable redemption fees; and (2) ongoing costs, including management fees and other Fund expenses. The following examples are intended to help you understand your ongoing costs (in dollars) of investing in the Fund and to compare these costs with the ongoing costs of investing in other mutual funds. The examples are based on an investment of $1,000 invested on May 1, 2011 and held until October 31, 2011.
Actual Expenses. The first line of each table below provides information about actual account values and actual expenses. You may use the information in this line, together with the amount you invested, to estimate the expenses that you paid over the period. Simply divide your account value by $1,000 (for example, an $8,600 account value divided by $1,000 = 8.6), then multiply the result by the number in the first line under the heading “Expenses Paid During Period” to estimate the expenses you paid on your account during this period.
Hypothetical Example for Comparison Purposes. The second line of the table below provides information about hypothetical account values and hypothetical expenses based on the Fund’s actual expense ratio and an assumed rate of return of 5% per year before expenses, which is not the Fund’s actual return. The hypothetical account values and expenses may not be used to estimate the actual ending account balance or expenses you paid for the period. You may use this information to compare the ongoing costs of investing in the Fund and other mutual funds. To do so, compare this 5% hypothetical example with the 5% hypothetical examples that appear in the shareholder reports of the other funds. The expenses shown in the table are meant to highlight ongoing Fund costs only and do not reflect transaction fees, such as redemption fees or exchange fees. Therefore, the second line of each table below is useful in comparing ongoing costs only, and may not help you determine the relative total costs of owning different funds. In addition, if these transactional costs were included, your costs would have been higher.
Vulcan Value Partners Small Cap Fund
��
Beginning Account 5/1/11 | Ending Account Value 10/31/11 | Expense Ratio(a) | Expenses Paid During period | |||||
Actual | $ 1,000.00 | $ 877.60 | 1.50% | $ 7.08 | ||||
Hypothetical (5% return before expenses) | $ 1,000.00 | $ 1,017.60 | 1.50% | $ 7.61 | ||||
| (a) | The Fund’s expense ratios have been annualized based on the Fund’s most recent fiscal half-year expenses. |
| (b) | Expenses are equal to the Fund’s annualized expense ratio, multiplied by the average account value over the period, multiplied by the number of days in the most recent fiscal half-year (184)/366. |
14 | www.vulcanvaluepartners.com |
Table of Contents
| Vulcan Value Partners Small Cap Fund | Statement of Investments | |
| October 31, 2011 (Unaudited) |
| Shares | Value (Note 1) | |||||||
COMMON STOCKS (97.73%) | ||||||||
BASIC MATERIALS (4.57%) | ||||||||
Chemicals (4.57%) | ||||||||
KMG Chemicals, Inc. | 103,631 | $ | 1,506,795 | |||||
|
| |||||||
TOTAL BASIC MATERIALS | 1,506,795 | |||||||
|
| |||||||
COMMUNICATIONS (1.51%) | ||||||||
Media (1.51%) | ||||||||
Discovery Communications, Inc., Class A(a) | 11,476 | 498,747 | ||||||
|
| |||||||
TOTAL COMMUNICATIONS | 498,747 | |||||||
|
| |||||||
CONSUMER, CYCLICAL (13.14%) | ||||||||
Leisure Time (2.81%) | ||||||||
Interval Leisure Group, Inc.(a) | 67,131 | 927,079 | ||||||
|
| |||||||
Retail (10.33%) | ||||||||
Jos A Bank Clothiers, Inc.(a) | 18,181 | 971,593 | ||||||
Nathan’s Famous, Inc.(a) | 79,981 | 1,509,241 | ||||||
Sonic Corp.(a) | 124,746 | 924,368 | ||||||
|
| |||||||
| 3,405,202 | ||||||||
|
| |||||||
TOTAL CONSUMER, CYCLICAL | 4,332,281 | |||||||
|
| |||||||
CONSUMER, NON-CYCLICAL (13.84%) | ||||||||
Commercial Services (8.99%) | ||||||||
Heartland Payment Systems, Inc. | 69,438 | 1,510,971 | ||||||
Towers Watson & Co., Class A | 22,077 | 1,450,459 | ||||||
|
| |||||||
| 2,961,430 | ||||||||
|
| |||||||
Household Products/Wares (4.85%) | ||||||||
Jarden Corp. | 49,948 | 1,599,834 | ||||||
|
| |||||||
TOTAL CONSUMER, NON-CYCLICAL | 4,561,264 | |||||||
|
| |||||||
ENERGY (3.65%) | ||||||||
Oil & Gas Services (3.65%) | ||||||||
Bolt Technology Corp.(a) | 119,215 | 1,201,687 | ||||||
|
| |||||||
TOTAL ENERGY | 1,201,687 | |||||||
|
| |||||||
Semi-Annual (Unaudited) | October 31, 2011 | 15 |
Table of Contents
| Statement of Investments | Vulcan Value Partners Small Cap Fund | |
| October 31, 2011 (Unaudited) |
| Shares | Value (Note 1) | |||||||
FINANCIALS (32.10%) | ||||||||
Diversified Financial Services (17.09%) | ||||||||
Eaton Vance Corp. | 62,544 | $ | 1,644,282 | |||||
Janus Capital Group, Inc. | 188,353 | 1,235,596 | ||||||
The NASDAQ OMX Group, Inc.(a) | 54,083 | 1,354,779 | ||||||
Netspend Holdings, Inc.(a) | 243,134 | 1,398,020 | ||||||
|
| |||||||
| 5,632,677 | ||||||||
|
| |||||||
Insurance (15.01%) | ||||||||
Endurance Specialty Holdings, Ltd. | 39,118 | 1,455,190 | ||||||
Everest Re Group, Ltd. | 23,332 | 2,098,013 | ||||||
ProAssurance Corp. | 18,184 | 1,391,985 | ||||||
|
| |||||||
| 4,945,188 | ||||||||
|
| |||||||
TOTAL FINANCIALS | 10,577,865 | |||||||
|
| |||||||
INDUSTRIALS (20.69%) | ||||||||
Electronics (4.37%) | ||||||||
Ituran Location and Control, Ltd. | 108,271 | 1,441,087 | ||||||
|
| |||||||
Hand & Machine Tools (3.16%) | ||||||||
Lincoln Electric Holdings, Inc. | 28,607 | 1,041,295 | ||||||
|
| |||||||
Machinery-Diversified (8.27%) | ||||||||
IDEX Corp. | 37,503 | 1,329,481 | ||||||
Nordson Corp. | 30,123 | 1,396,804 | ||||||
|
| |||||||
| 2,726,285 | ||||||||
|
| |||||||
Miscellaneous Manufacturers (4.89%) | ||||||||
Donaldson Co., Inc. | 25,159 | 1,611,434 | ||||||
|
| |||||||
TOTAL INDUSTRIALS | 6,820,101 | |||||||
|
| |||||||
TECHNOLOGY (8.23%) | ||||||||
Software (8.23%) | ||||||||
Dun & Bradstreet Corp. | 19,597 | 1,310,255 | ||||||
16 | www.vulcanvaluepartners.com |
Table of Contents
| Vulcan Value Partners Small Cap Fund | Statement of Investments | |
| October 31, 2011 (Unaudited) |
| Shares | Value (Note 1) | |||||||||
TECHNOLOGY (continued) | ||||||||||
Software (continued) | ||||||||||
Fair Isaac Corp. | 51,279 | $ | 1,402,481 | |||||||
|
| |||||||||
| 2,712,736 | ||||||||||
|
| |||||||||
TOTAL TECHNOLOGY | 2,712,736 | |||||||||
|
| |||||||||
TOTAL COMMON STOCKS (Cost $30,667,243) | 32,211,476 | |||||||||
| 7-Day Yield | Shares | Value (Note 1) | ||||||||
SHORT TERM INVESTMENTS (2.32%) | ||||||||||
MONEY MARKET FUND (2.32%) | ||||||||||
Dreyfus Treasury Prime Cash Management | 0.010% | 763,646 | 763,646 | |||||||
|
| |||||||||
TOTAL SHORT TERM INVESTMENTS (Cost $763,646) | 763,646 | |||||||||
TOTAL INVESTMENTS (100.05%) (Cost $31,430,889) | $ | 32,975,122 | ||||||||
Liabilities In Excess Of Other Assets (-0.05%) | (16,919) | |||||||||
NET ASSETS (100.00%) | $ | 32,958,203 | ||||||||
| (a) | Non-Income Producing Security. |
Common Abbreviations:
Ltd. - Limited.
Holdings are subject to change.
For Fund compliance purposes, the Fund’s industry classifications refer to any one or more of the industry sub-classifications used by one or more widely recognized market indexes or ratings group indexes, and/or as defined by Fund management. This definition may not apply for purposes of this report, which may combine industry subclassifications for reporting ease. Industries are shown as a percent of net assets. These industry classifications are based on third-party definitions. The definitions are industry terms and do not reflect the legal status of any of the investments or the companies in which the Fund has invested.
See Accompanying Notes to Financial Statements.
Semi-Annual (Unaudited) | October 31, 2011 | 17 |
Table of Contents
Statements of Assets and Liabilities
October 31, 2011
Vulcan Value Partners Fund | Vulcan Value Partners Small Cap Fund | |||||||
ASSETS: | ||||||||
Investments, at value | $ | 94,593,519 | $ | 32,975,122 | ||||
Receivable for shares sold | 14,453 | 39,346 | ||||||
Interest and dividends receivable | 72,278 | 21,309 | ||||||
Other assets | 8,243 | 6,528 | ||||||
Total assets | 94,688,493 | 33,042,305 | ||||||
LIABILITIES: | ||||||||
Payable for shares redeemed | – | 28,735 | ||||||
Payable to adviser | 89,642 | 23,187 | ||||||
Payable for administration fees | 13,905 | 4,843 | ||||||
Payable for transfer agency fees | 4,684 | 6,787 | ||||||
Payable to trustees | 1,431 | 991 | ||||||
Accrued expenses and other liabilities | 19,561 | 19,559 | ||||||
Total liabilities | 129,223 | 84,102 | ||||||
NET ASSETS | $ | 94,559,270 | $ | 32,958,203 | ||||
NET ASSETS CONSIST OF: | ||||||||
Paid-in capital | $ | 88,810,094 | $ | 31,564,898 | ||||
Undistributed/(overdistributed) net investment income | 13,164 | (85,993) | ||||||
Accumulated net realized loss on investments | (1,244,444) | (64,935) | ||||||
Net unrealized appreciation in value of investments | 6,980,456 | 1,544,233 | ||||||
NET ASSETS | $ | 94,559,270 | $ | 32,958,203 | ||||
INVESTMENTS, AT COST | $ | 87,613,063 | $ | 31,430,889 | ||||
PRICING OF SHARES: | ||||||||
Net Asset Value, offering and redemption price per share | $ | 11.25 | $ | 12.04 | ||||
Shares of beneficial interest outstanding (unlimited number of shares, no par value common stock authorized) | 8,408,145 | 2,738,329 | ||||||
See Accompanying Notes to Financial Statements.
18 | www.vulcanvaluepartners.com |
Table of Contents
For the Six Months Ended October 31, 2011
Vulcan Value Partners Fund | Vulcan Value Partners Small Cap Fund | |||||||
INVESTMENT INCOME: | ||||||||
Dividends | $ | 504,409 | $ | 161,901 | ||||
Foreign taxes withheld | (7,596) | – | ||||||
Interest | 69 | 43 | ||||||
Total investment income | 496,882 | 161,944 | ||||||
EXPENSES: | ||||||||
Investment advisory fees (Note 5) | 323,128 | 206,608 | ||||||
Administrative fees | 72,877 | 39,740 | ||||||
Transfer agency fees | 25,934 | 32,775 | ||||||
Legal and audit fees | 11,240 | 11,155 | ||||||
Custodian fees | 6,033 | 6,040 | ||||||
Trustees’ fees and expenses | 2,921 | 2,067 | ||||||
Repayment of previously waived fees | 24,377 | – | ||||||
Other | 18,177 | 19,401 | ||||||
Total expenses before waiver | 484,687 | 317,786 | ||||||
Less fees waived/reimbursed by investment advisor | – | (69,849) | ||||||
Total net expenses | 484,687 | 247,937 | ||||||
NET INVESTMENT INCOME/(LOSS) | 12,195 | (85,993) | ||||||
Net realized loss on investments | (2,009,936) | (1,973,831) | ||||||
Net change in unrealized appreciation/(depreciation) of investments | 2,885,725 | (2,535,305) | ||||||
NET REALIZED AND UNREALIZED GAIN/(LOSS) ON | 875,789 | (4,509,136) | ||||||
NET INCREASE/(DECREASE) IN NET ASSETS RESULTING | $ | 887,984 | $ | (4,595,129) | ||||
See Accompanying Notes to Financial Statements.
Semi-Annual (Unaudited) | October 31, 2011 | 19 |
Table of Contents
Statements of Changes in Net Assets
| Vulcan Value Partners Fund | ||||||||
For the Six Months Ended October 31, 2011 (Unaudited) | For the Year Ended April 30, 2011 | |||||||
OPERATIONS: | ||||||||
Net investment income | $ | 12,195 | $ | 18,332 | ||||
Net realized gain/(loss) on investments | (2,009,936) | 879,538 | ||||||
Net change in unrealized appreciation on investments | 2,885,725 | 3,194,574 | ||||||
Net increase in net assets resulting from operations | 887,984 | 4,092,444 | ||||||
DISTRIBUTIONS TO SHAREHOLDERS (Note 1): | ||||||||
From net investment income | – | (44,569) | ||||||
From net realized gains on investments | – | (112,394) | ||||||
Total distributions | – | (156,963) | ||||||
SHARE TRANSACTIONS: (Note 3) | ||||||||
Proceeds from sales of shares | 46,776,752 | 32,541,935 | ||||||
Issued to shareholders in reinvestment of distributions | – | 148,586 | ||||||
Cost of shares redeemed, net of redemption fees | (1,862,688) | (675,867) | ||||||
Net increase from share transactions | 44,914,064 | 32,014,654 | ||||||
Net increase in net assets | 45,802,048 | 35,950,135 | ||||||
NET ASSETS: | ||||||||
Beginning of period | 48,757,222 | 12,807,087 | ||||||
End of period* | $ | 94,559,270 | $ | 48,757,222 | ||||
*Includes undistributed net investment income of: | $ | 13,164 | $ | 969 | ||||
See Accompanying Notes to Financial Statements.
20 | www.vulcanvaluepartners.com |
Table of Contents
Statements of Changes in Net Assets
| Vulcan Value Partners Small Cap Fund | ||||||||
For the Six Months Ended October 31, 2011 (Unaudited) | For the Year Ended April 30, 2011 | |||||||
OPERATIONS: | ||||||||
Net investment loss | $ | (85,993) | $ | (140,682) | ||||
Net realized gain/(loss) on investments | (1,973,831) | 2,221,811 | ||||||
Net change in unrealized appreciation/(depreciation) on investments | (2,535,305) | 3,389,029 | ||||||
Net increase/(decrease) in net assets resulting from operations | (4,595,129) | 5,470,158 | ||||||
DISTRIBUTIONS TO SHAREHOLDERS (Note 1): | ||||||||
From net realized gains on investments | – | (524,784) | ||||||
Total distributions | – | (524,784) | ||||||
SHARE TRANSACTIONS: (Note 3) | ||||||||
Proceeds from sales of shares | 5,309,360 | 25,881,789 | ||||||
Issued to shareholders in reinvestment of distributions | – | 518,379 | ||||||
Cost of shares redeemed, net of redemption fees | (4,118,846) | (2,207,868) | ||||||
Net increase from share transactions | 1,190,514 | 24,192,300 | ||||||
Net increase/(decrease) in net assets | (3,404,615) | 29,137,674 | ||||||
NET ASSETS: | ||||||||
Beginning of period | 36,362,818 | 7,225,144 | ||||||
End of period* | $ | 32,958,203 | $ | 36,362,818 | ||||
*Includes undistributed net investment income/(loss) of: | $ | (85,993) | $ | 0 | ||||
See Accompanying Notes to Financial Statements.
Semi-Annual (Unaudited) | October 31, 2011 | 21 |
Table of Contents
| Vulcan Value Partners Fund | Financial Highlights | |
| For a share outstanding throughout each period presented. |
For the Six 2011 (Unaudited) | For the Year Ended April 30, 2011 | For the Period December 30, 2009 April 30, 2010 | |||||||||||||
NET ASSET VALUE, BEGINNING OF PERIOD | $ | 11.66 | $ | 10.57 | $ | 10.00 | |||||||||
INCOME/(LOSS) FROM OPERATIONS: | |||||||||||||||
Net investment income/(loss) | 0.00 | (a)(b) | 0.01 | (a) | (0.00) | (b) | |||||||||
Net realized and unrealized gain/(loss) on investments | (0.41) | 1.13 | 0.57 | ||||||||||||
Total from investment operations | (0.41) | 1.14 | 0.57 | ||||||||||||
LESS DISTRIBUTIONS TO SHAREHOLDERS: | |||||||||||||||
From net investment income | – | (0.01 | ) | – | |||||||||||
Distributions from net realized gain on investments | – | (0.04 | ) | – | |||||||||||
Total distributions | – | (0.05 | ) | – | |||||||||||
Redemption fees added to paid in capital (Note 3) | 0.00 | (b) | 0.00 | (b) | 0.00 | (b) | |||||||||
Increase/(Decrease) in net asset value | (0.41) | 1.09 | 0.57 | ||||||||||||
NET ASSET VALUE, END OF PERIOD | $ | 11.25 | $ | 11.66 | $ | 10.57 | |||||||||
Total return | (3.52% | )(c) | 10.82% | 5.70% | (c) | ||||||||||
RATIOS AND SUPPLEMENTAL DATA: | |||||||||||||||
Net assets, end of period (000’s) | $ | 94,559 | $ | 48,757 | $ | 12,807 | |||||||||
Ratio of expenses to average net assets including fee waivers/reimbursements/repayment of previously waived fees | 1.50% | (d) | 1.50% | 1.50% | (d) | ||||||||||
Ratio of expenses to average net assets without fee waivers/reimbursements/repayment of previously waived fees | 1.50% | (d) | 2.01% | 4.97% | (d) | ||||||||||
Net investment income/(loss) to average net assets including fee waivers/reimbursements/repayment of previously waived fees | 0.04% | (d) | 0.07% | (0.06%) | (d) | ||||||||||
Portfolio turnover rate | 29% | 44% | 24% | ||||||||||||
| (a) | Per share numbers have been calculated using the average shares method. |
| (b) | Less than $0.005 per share. |
| (c) | Not annualized. |
| (d) | Annualized. |
See Accompanying Notes to Financial Statements.
22 | www.vulcanvaluepartners.com |
Table of Contents
| Vulcan Value Partners Small Cap Fund | Financial Highlights | |
For a share outstanding throughout each period presented. |
| For the Six Months Ended October 31, 2011 (Unaudited) | For the Year Ended April 30, 2011 | For the Period December 30, 2009 (Inception) to April 30, 2010 | |||||||||||||
NET ASSET VALUE, BEGINNING OF PERIOD | $ | 13.72 | $ | 11.60 | $ | 10.00 | |||||||||
INCOME/(LOSS) FROM OPERATIONS: | |||||||||||||||
Net investment loss | (0.03 | )(a) | (0.09 | )(a) | (0.00) | (b) | |||||||||
Net realized and unrealized gain/(loss) on investments | (1.65) | 2.55 | 1.60 | ||||||||||||
Total from investment operations | (1.68) | 2.46 | 1.60 | ||||||||||||
LESS DISTRIBUTIONS TO SHAREHOLDERS: | |||||||||||||||
Distributions from net realized gain on investments | – | (0.34) | – | ||||||||||||
Total distributions | – | (0.34) | – | ||||||||||||
Redemption fees added to paid in capital (Note 3) | 0.00 | (b) | 0.00 | (b) | – | ||||||||||
Increase/(Decrease) in net asset value | (1.68) | 2.12 | 1.60 | ||||||||||||
NET ASSET VALUE, END OF PERIOD | $ | 12.04 | $ | 13.72 | $ | 11.60 | |||||||||
Total return | (12.24% | )(c) | 21.75% | 16.00% | (c) | ||||||||||
RATIOS AND SUPPLEMENTAL DATA: | |||||||||||||||
Net assets, end of period (000’s) | $ | 32,958 | $ | 36,363 | $ | 7,225 | |||||||||
Ratio of expenses to average net assets including fee waivers/reimbursements | 1.50% | (d) | 1.50% | 1.50% | (d) | ||||||||||
Ratio of expenses to average net assets without fee waivers/reimbursements | 1.92% | (d) | 2.50% | 7.31% | (d) | ||||||||||
Net investment loss to average net assets including fee waivers/reimbursements | (0.52%) | (d) | (0.71%) | (0.57%) | (d) | ||||||||||
Portfolio turnover rate | 32% | 60% | 33% | ||||||||||||
| (a) | Per share numbers have been calculated using the average shares method. |
| (b) | Less than $0.005 per share. |
| (c) | Not annualized. |
| (d) | Annualized. |
See Accompanying Notes to Financial Statements.
Semi-Annual (Unaudited) | October 31, 2011 | 23 |
Table of Contents
October 31, 2011 (Unaudited)
1. ORGANIZATION
Financial Investors Trust (the “Trust”) was organized as a Delaware statutory trust on November 30, 1993 and registered as an open-end management investment company under the Investment Company Act of 1940, as amended (“1940 Act”). As of October 31, 2011, the Trust had fifteen registered funds. This semi-annual report describes the Vulcan Value Partners Fund and Vulcan Value Partners Small Cap Fund (collectively, the “Funds”).
2. SIGNIFICANT ACCOUNTING POLICIES
The following is a summary of significant accounting policies consistently followed by the Funds. These policies are in conformity with U.S. generally accepted accounting principles (“GAAP”).
The preparation of Statement of Investments in conformity with GAAP requires management to make certain estimates and assumptions that affect the reported amounts in the Statement of Investments during the reporting period. Management believes the estimates and security valuations are appropriate; however, actual results may differ from those estimates, and the security valuations reflected in the Schedule of Investments may differ from the value the Funds ultimately realize upon sale of the securities. The Portfolio of Investments have been prepared as of the close of the New York Stock Exchange (“NYSE”) on October 31, 2011.
Investment Valuation: The Board of Trustees (“Board” or “Trustees”) has approved procedures to be used to value each Fund’s securities for the purposes of determining each Fund’s net asset value (“NAV”). The valuation of the securities of the Funds is determined in good faith by or under the direction of the Board. The Board has delegated certain valuation functions for the Funds to ALPS Fund Services, Inc., the Administrator.
Each Fund generally values its securities based on market prices determined at the close of regular trading on the NYSE (normally, 4:00 p.m. Eastern time) on each business day (Monday through Friday). Neither Fund values its securities on any day that the NYSE is closed, including the following observed holidays: New Year’s Day, Martin Luther King, Jr. Day, Presidents’ Day, Good Friday, Memorial Day, Independence Day, Labor Day, Thanksgiving Day and Christmas Day, and the preceding Friday or subsequent Monday when one of those holidays falls on a Saturday or Sunday, respectively.
Each Fund’s currency valuations, if any, are done as of the close of regularly scheduled trading on the NYSE (normally at 4:00 p.m. Eastern time). For equity securities that are traded on an exchange, the market price is usually the closing sale or official closing price on that exchange. In the case of securities not traded on an exchange, or if such closing prices are not otherwise available, the market price is typically determined by independent third party pricing vendors approved by the Board using a variety of pricing techniques and methodologies. The market price for debt obligations is generally the price supplied by an independent third-party pricing service approved by the Board, which may use a matrix, formula or other objective method that takes into consideration market indices, yield curves and other specific adjustments. Short term debt obligations that will mature in 60 days or less are valued at amortized cost, unless it is determined that using this method would not reflect an investment’s fair value. If vendors are unable to supply a price, or if the price supplied is deemed to be unreliable, the market price may be determined using quotations received from one or more brokers/dealers that make a market in the security. Investments in other funds are calculated to their respective net asset values as determined by those funds in accordance with the 1940 Act.
24 | www.vulcanvaluepartners.com |
Table of Contents
Notes to Financial Statements
October 31, 2011 (Unaudited)
When such prices or quotations are not available, or when Vulcan Value Partners, LLC (“Vulcan” or “Adviser”) believes that they are unreliable, securities may be priced using fair value procedures approved by the Board. Because the Funds may invest in securities that may be thinly traded or for which market quotations may not be readily available or may be unreliable (such as securities of small capitalization companies), the Funds may use fair valuation procedures more frequently than funds that invest primarily in securities that are more liquid (such as equity securities of large capitalization domestic issuers). The Funds may also use fair value procedures if the Adviser determines that a significant event has occurred between the time at which a market price is determined and the time at which each Fund’s NAV is calculated. In particular, the value of non-U.S. securities may be materially affected by events occurring after the close of the market on which they are traded, but before each Fund prices its shares.
The Funds may determine the fair value of investments based on information provided by pricing services and other third-party vendors, which may recommend fair value prices or adjustments with reference to other securities, indices or assets. In considering whether fair value pricing is required and in determining fair values, the Funds may, among other things, consider significant events (which may be considered to include changes in the value of U.S. securities or securities indices) that occur after the close of the relevant market and before each Fund values its securities. In addition, the Funds may utilize modeling tools provided by third-party vendors to determine fair values of non-U.S. securities. The Funds’ use of fair value pricing may help deter “stale price arbitrage.”
Valuing securities at fair value involves greater reliance on judgment than valuation of securities based on readily available market quotations. A fund that uses fair value to price securities may value those securities higher or lower than another fund using market quotations or its own fair value methodologies to price the same securities. There can be no assurance that the Funds could obtain the fair value assigned to a security if it were to sell the security at approximately the time at which each Fund determines its net asset value, and the difference between fair value and the price of the securities may be material.
Fair Value Measurements: A three-tier hierarchy has been established to classify fair value measurements for disclosure purposes. Inputs refer broadly to the assumptions that market participants would use in pricing the asset or liability, including assumptions about risk. Inputs may be observable or unobservable. Observable inputs are inputs that reflect the assumptions market participants would use in pricing the asset or liability that are developed based on market data obtained from sources independent of the reporting entity. Unobservable inputs are inputs that reflect the reporting entity’s own assumptions about the assumptions market participants would use in pricing the asset or liability that are developed based on the best information available. Various inputs are used in determining the value of each Fund’s investments as of the reporting period end. The designated input levels are not necessarily an indication of the risk or liquidity associated with these investments. These inputs are categorized in the following hierarchy under applicable financial accounting standards:
Level 1 – | Unadjusted quoted prices in active markets for identical investments, unrestricted assets or liabilities that a Fund has the ability to access at the measurement date; |
Semi-Annual (Unaudited) | October 31, 2011 | 25 |
Table of Contents
Notes to Financial Statements
October 31, 2011 (Unaudited)
Level 2 – | Quoted prices which are not active, quoted prices for similar assets or liabilities in active markets or inputs other than quoted prices that are observable (either directly or indirectly) for substantially the full term of the asset or liability; and | |
Level 3 – | Significant unobservable prices or inputs (including the Fund’s own assumptions in determining the fair value of investments) where there is little or no market activity for the asset or liability at the measurement date. |
The following is a summary of the inputs used to value each Fund’s investments as of October 31, 2011.
Vulcan Value Partners Fund:
| Investments in Securities at Value | Level 1 - Unadjusted Quoted Prices | Level 2 - Other Significant Observable Inputs | Level 3 - Significant Unobservable Inputs | Total | ||||||||||||
Common Stocks(a) | $ | 94,265,806 | $ | – | $ | – | $ | 94,265,806 | ||||||||
Short Term Investments | 327,713 | – | – | 327,713 | ||||||||||||
TOTAL | $ | 94,593,519 | $ | – | $ | – | $ | 94,593,519 | ||||||||
| Vulcan Value Partners Small Cap Fund: | ||||||||||||||||
Investments in Securities at Value | | Level 1 - Unadjusted Quoted Prices | | | Level 2 - Other Significant Observable Inputs | | | Level 3 - Significant Unobservable Inputs | | Total | ||||||
Common Stocks(a) | $ | 32,211,476 | $ | – | $ | – | $ | 32,211,476 | ||||||||
Short Term Investments | 763,646 | – | – | 763,646 | ||||||||||||
TOTAL | $ | 32,975,122 | $ | – | $ | – | $ | 32,975,122 | ||||||||
| (a) | For detailed descriptions, see the accompanying Statements of Investments. |
For the six months ended October 31, 2011, the Funds did not have any significant transfers between Level 1 and Level 2 securities. For the period ended October 31, 2011, the Funds did not have any securities that used significant unobservable inputs (Level 3) in determining fair value. Therefore, a reconciliation of assets in which significant unobservable inputs (Level 3) were used in determining fair value is not applicable.
Investment Transactions: Investment and shareholder transactions are accounted for on the date the investments are purchased or sold (trade date). Realized gains and losses from investment transactions are reported on an identified cost basis, which is the same basis the Funds use for federal income tax purposes. Interest income, which includes accretion of discounts, is accrued and recorded as earned. Dividend income is recognized on the ex-dividend date or for certain foreign securities, as soon as information is available to the Funds.
Foreign Securities: The Funds may directly purchase securities of foreign issuers. Investing in securities of foreign issuers involves special risks not typically associated with investing in securities of U.S. issuers. The risks include possible reevaluation of currencies, the inability to
26 | www.vulcanvaluepartners.com |
Table of Contents
| Notes to Financial Statements | ||
| October 31, 2011 (Unaudited) |
repatriate foreign currency, less complete financial information about companies and possible future adverse political and economic developments. Moreover, securities of many foreign issuers and their markets may be less liquid and their prices more volatile than those of securities of comparable U.S. issuers.
Expenses: Some expenses of the Trust can be directly attributed to the Funds. Expenses which cannot be directly attributed are apportioned among all funds in the Trust based on average net assets.
Use of Estimates: Each Fund’s financial statements are prepared in accordance with GAAP. This requires management to make estimates and assumptions that affect (a) the reported amounts of assets and liabilities and disclosure of contingent assets and liabilities at the date of the financial statements, and (b) the reported amounts of increases and decreases in net assets from operations during the reporting period. Actual results could differ from these estimates.
Federal Income Taxes: Each Fund complies with the requirements under Subchapter M of the Internal Revenue Code applicable to regulated investment companies and intends to distribute substantially all of its net taxable income and net capital gains, if any, each year. The Funds are not subject to income taxes to the extent such distributions are made.
During the six months ended October 31, 2011, the Funds did not have liability for any unrecognized tax benefits in the accompanying financial statements. The Funds file income tax returns in the U.S. federal jurisdiction and the State of Colorado.
Distributions to Shareholders: Each Fund normally pays dividends and distributes capital gains, if any, on an annual basis. Income dividend distributions are derived from interest and other income each Fund receives from its investments, including distributions of short-term capital gains. Capital gain distributions are derived from gains realized when each Fund sells a security it has owned for more than a year. Each Fund may make additional distributions and dividends at other times if the portfolio manager believes doing so may be necessary for each Fund to avoid or reduce taxes. Net investment income/(loss) and net realized gain/(loss) may differ for financial statement and tax purposes. The character of distributions made during the year from net investment income or net realized gains may differ from its ultimate characterization for federal income tax purposes.
Also, due to the timing of dividend distributions, the fiscal year in which amounts are distributed may differ from the fiscal year in which the income or realized gain were recorded by each Fund.
The differences between book-basis and tax-basis are primarily due to the deferral of post October losses and wash sale losses.
Semi-Annual (Unaudited) | October 31, 2011 | 27 |
Table of Contents
Notes to Financial Statements
October 31, 2011 (Unaudited)
As of October 31, 2011, the cost of securities on a tax basis and gross unrealized appreciation/ (depreciation) on investments for federal income tax purposes were as follows:
Vulcan Value Partners Fund | Vulcan Value Partners Small Cap Fund | |||||||
Gross appreciation | $ | 7,472,556 | $ | 3,755,217 | ||||
Gross depreciation | (605,341) | (2,285,019) | ||||||
Net unrealized appreciation | 6,867,215 | 1,470,198 | ||||||
Cost of investments for income tax purposes | $ | 87,726,304 | $ | 31,504,924 | ||||
3. SECURITIES TRANSACTIONS
The cost of purchases and proceeds from sales of securities (excluding short-term securities) during the six months ended October 31, 2011, was as follows:
| Fund | Purchase of Securities | Proceeds from Sales of Securities | ||||||
Vulcan Value Partners Fund | $ | 64,393,571 | $18,569,234 | |||||
Vulcan Value Partners Small Cap Fund | 12,957,214 | 10,657,064 | ||||||
4. CAPITAL SHARE TRANSACTIONS
Shares redeemed within 90 days of purchase may incur a 2% short-term redemption fee deducted from the redemption amount. The Vulcan Value Partners Fund and the Vulcan Value Partners Small Cap Fund retained $109 and $883, respectively, for the six months ended October 31, 2011, which is reflected in the “Shares redeemed” in the Statement of Changes in Net Assets.
Transactions in shares of capital stock for the dates listed below were as follows:
Vulcan Value Partners Fund
For the Six Months Ended October 31, 2011 | For the Year Ended April 30, 2011 | |||||||
Shares Sold | 4,392,667 | 3,016,906 | ||||||
Shares Issued in Reinvestment of Dividends | – | 14,011 | ||||||
Less Shares Redeemed | (166,361) | (61,203) | ||||||
Net Increase | 4,226,306 | 2,969,714 | ||||||
28 | www.vulcanvaluepartners.com |
Table of Contents
| Notes to Financial Statements | ||
| October 31, 2011 (Unaudited) |
Vulcan Value Partners Small Cap Fund
| For the Six Months Ended October 31, 2011 | For the Year Ended April 30, 2011 | |||||||
Shares Sold | 430,432 | 2,157,470 | ||||||
Shares Issued in Reinvestment of Dividends | – | 44,382 | ||||||
Less Shares Redeemed | (342,131) | (174,629) | ||||||
Net Increase | 88,301 | 2,027,223 | ||||||
5. MANAGEMENT AND RELATED-PARTY TRANSACTIONS
Vulcan, subject to the authority of the Board, is responsible for the overall management and administration of the Funds’ business affairs. Vulcan manages the investments of the Funds in accordance with each Fund’s investment objective, policies and limitations and investment guidelines established jointly by the Adviser and the Trustees. Pursuant to the Investment Advisory Agreement (the “Advisory Agreement”), the Funds pay Vulcan an annual management fee of 1.00% and 1.25% for Vulcan Value Partners Fund and Vulcan Value Partners Small Cap Fund, respectively, based on each Fund’s average daily net assets. Vulcan has contractually agreed with the Funds to limit the amount of each Fund’s total annual expenses (exclusive of distribution and service (12b-1) fees, acquired fund fees and expenses, brokerage expenses, interest expense, taxes and extraordinary expenses) to 1.50% of each Fund’s average daily net assets. This agreement is in effect through August 31, 2012 and is reevaluated on an annual basis. Without this agreement, expenses could be higher. The Adviser is permitted to recover expenses it has borne through the agreement described above to the extent that each Fund’s expenses in later periods fall below the annual rates set forth in the relevant agreement. If the Adviser foregoes any fees and/or reimburses a Fund pursuant to this agreement with respect to a particular fiscal year, then the Adviser shall be entitled to recover from the Fund the amount forgone or reimbursed to the extent Designated Annual Fund Operating Expenses are less than 1.50% of the Fund’s average daily net assets during any fiscal year following such fiscal year.
Pursuant to these agreements, the Funds will reimburse the Adviser for any fee waivers and expense reimbursements made by the Adviser, provided that any such reimbursements made by the Funds to the Adviser will not cause the Funds’ expense limitation to exceed expense limitations in existence at the time the expense was incurred, or at the time of the reimbursement, whichever is lower, and the reimbursement is made within three years after the expenses were incurred.
For the Six Months ended October 31, 2011, the fee waivers and/ or reimbursements were as follows:
| Fund | Fees Waived/Reim bursed By Advisor | Recoupment of Past Waived Fees By Advisor | Total | |||||||||
Vulcan Value Partners Fund | $ | 0 | $ | 0 | $ | 0 | ||||||
Vulcan Value Partners Small Cap Fund | 69,849 | 0 | 69,849 | |||||||||
As of April 30, 2011, the balances of recoupable expenses for each Fund were as follows: | ||||||||||||
| Fund | 2010 | 2011 | Total | |||||||||
Vulcan Value Partners Fund | $ | 84,786 | $ | 134,059 | $ | 218,845 | ||||||
Vulcan Value Partners Small Cap Fund | 69,849 | 76,119 | 145,968 | |||||||||
Semi-Annual (Unaudited) | October 31, 2011 | 29 |
Table of Contents
Notes to Financial Statements
October 31, 2011 (Unaudited)
Distributor: ALPS Distributors, Inc. (an affiliate of ALPS) (“ADI” or the “Distributor”) acts as the distributor of each Fund’s shares pursuant to a Distribution Agreement with the Trust. Shares are sold on a continuous basis by ADI as agent for the Funds, and ADI has agreed to use its best efforts to solicit orders for the sale of each Fund’s shares, although it is not obliged to sell any particular amount of shares. ADI is not entitled to any compensation for its services as Distributor. ADI is registered as a broker-dealer with the Securities and Exchange Commission.
Beneficial Ownership: The beneficial ownership, either directly or indirectly, of more than 25% of the voting securities of any class a Fund creates a presumption of control of the Fund under Section 2(a)(9) of the 1940 Act. As of October 31, 2011, the following entities owned beneficially 25% or greater of the Fund’s outstanding shares. The shares are held under omnibus accounts (whereby the transactions of two or more shareholders are combined and carried in the name of the originating broker rather than designated separately).
| Fund | Name | Percentage | ||
Vulcan Value Partners Fund | JPMorgan Chase & Co. | 31.98% | ||
Vulcan Value Partners Small Cap Fund | National Financial Services | 55.92% |
6. SUBSEQUENT EVENTS
Management has evaluated whether any events or transactions occurred subsequent to October 31, 2011 through the date of issuance of the Funds’ financial statements and determined that there were no other material events or transactions that would require recognition or disclosure in the Funds’ financial statements.
7. INDEMNIFICATIONS
Under the Trust’s organizational documents, its officers and Trustees are indemnified against certain liability arising out of the performance of their duties to the Trust. Additionally, in the normal course of business, the Trust enters into contracts with service providers that may contain general indemnification clauses. The Trust’s maximum exposure under these arrangements is unknown, as this would involve future claims that may be made against the Trust that have not yet occurred.
30 | www.vulcanvaluepartners.com |
Table of Contents
October 31, 2011 (Unaudited)
1. FUND HOLDINGS
The Funds file their complete schedule of portfolio holdings with the Securities and Exchange Commission (the “SEC”) for the first and third quarters of each fiscal year on Form N-Q within 60 days after the end of the period. Copies of the Funds’ Form N-Q are available without charge on the SEC website at http://www.sec.gov. You may also review and copy the Form N-Q at the SEC’s Public Reference Room in Washington, DC. For more information about the operation of the Public Reference Room, please call the SEC at 1-800-SEC-0330.
2. FUND PROXY VOTING POLICIES, PROCEDURES AND SUMMARIES
Each Fund’s policies and procedures used in determining how to vote proxies and information regarding how the Funds voted proxies relating to portfolio securities during the most recent prior 12-month period ending June 30 will be available without charge, (1) upon request, by calling (866) 759-5679 and (2) on the SEC’s website at http://www.sec.gov.
Semi-Annual (Unaudited) | October 31, 2011 | 31 |
Table of Contents

The Management Commentary included in this shareholder report contains certain forward-looking statements about the factors that may affect the performance of the Funds in the future. These statements are based on Fund management’s predictions and expectations concerning certain future events and their expected impact on the Funds, such as performance of the economy as a whole and of specific industry sectors, changes in the levels of interest rates, the impact of developing world events, and other factors that may influence the future performance of the Funds. Management believes these forward-looking statements to be reasonable, although they are inherently uncertain and difficult to predict. Actual events may cause adjustments in portfolio management strategies from those currently expected to be employed.
This Fund is neither insured nor guaranteed by the U.S. Government, the FDIC, the Federal Reserve Board or any other governmental agency or insurer.
For more information about the Fund, including a prospectus, please visit www.vulcanvaluepartners.com or call 1.877.421.5078.
This material must be accompanied or proceeded by a prospectus.
The Vulcan Value Partners Funds are distributed by ALPS Distributors, Inc.
Table of Contents
Table of Contents
| ||||||||
| 1 | ||||||||
| 4 | ||||||||
| 6 | ||||||||
| 7 | ||||||||
| 16 | ||||||||
| 17 | ||||||||
| 18 | ||||||||
| 19 | ||||||||
| 20 | ||||||||
| 27 | ||||||||
Table of Contents
The Disciplined Growth Investors Fund | Shareholder Letter | |
| October 31, 2011 (Unaudited) |
CURRENT INVESTMENT STRATEGY
By Fred Martin, CFA
The third quarter of 2011 was rough on long-term investors. The market decline during the quarter was caused in large part by irresolute action on the part of governments in the United States and Europe. In the United States the political leadership failed to significantly reduce federal budget deficits. In Europe, the political leadership has not yet faced the Greek debt crisis.
The stock market declined sharply in the face of this lack of leadership. The S&P 500 declined by 13.9% and the Nasdaq by 12.9%. The Russell mid-cap growth index declined by 19.3%. In our view this is not a sustainable market decline because the valuation of our stocks remains highly favorable and the profit/cash flow progress of our holdings has been excellent.
For the last three years we have asserted that the valuations of our stocks were highly favorable. We believed our stocks could perform well in a poor macro-economic environment. Also, our stocks faced little or no competition from the two other major areas for liquid investments, bonds and money market funds. Even though the negative headlines dominated the news during this past quarter, we are beginning to see a glimmer of hope in the macroeconomic environment. This represents a major change in our thinking about the investment landscape.
Before we outline our thoughts we want to caution our readers that we are only seeing a glimmer of hope, not a full burst of sunshine.
After the severe damage to the financial system from the 2008 crisis, we did not then see the basis for a vigorous, normal economic recovery. We estimated that the economy might begin to recover in 2015 or 2016. Among our concerns was the collapse in housing prices and activity.
We now feel more confident that a full recovery should be underway by 2015-16, with a possible slight improvement in the economy beginning in 2012.
What is the basis for our view?
1) The political environment
We did not know how the American people would react to the 2008 financial meltdown. Would they prefer a larger or smaller government? Would they engage in self-pity or would they be willing to roll up their sleeves and tackle the problems? Would they allow their political leaders to maintain the same policies? We believe the answer is clear: The American people want to put their country back on track. They are very dissatisfied with the political leadership, as evidenced by the popularity of the Tea Party and recent emergence of the Occupy Wall Street protesters. They do not accept the status quo and are willing to accept personal sacrifice for the greater benefit of the country. The 2010 mid-term elections were a vote against national economic policies, and we expect the 2012 election will reflect similar sentiments.
Semi-Annual Report (Unaudited) | October 31, 2011 | 1 |
Table of Contents
The Disciplined Growth Investors Fund | Shareholder Letter | |
| October 31, 2011 (Unaudited) |
2) Changes in national economic policy
The prescription to restore our economy is becoming increasingly clear and is achieving a rough consensus. To improve our intermediate-term prospects, the key points are to simplify and flatten the tax code and reduce regulatory impediments to economic activity. The top priority is to encourage domestic hydrocarbon energy production. The second priority is to significantly revise or rework the recent legislated changes in the U.S. health care system. The third priority is to rationalize the regulatory oversight of the financial industry. These changes alone would begin to restore business confidence in the U.S. business climate. It is also becoming clear that federal spending, including entitlements, is not sustainable over the long term.
3) Positive game-changers
The Bakken oil/gas field in North Dakota has emerged as a major find, helped by new exploration technology, horizontal fracking. There is little question that the field is very large. It now appears that oil and gas can be produced from this field with lifting costs only slightly higher than Saudi Arabia. The Bakken field is likely not the only domestic hydrocarbon field with significant reserves and reasonable lifting costs. Increased domestic hydrocarbon energy production could be transformative, adding domestic jobs and also radically changing our balance of trade. And, as though the Mideast did not already have enough unrest, increased U.S. production and reserves could change the balance of economic power in the energy industry. Second, the technology revolution continues to unfold at a rapid pace. The proliferation of the Web and mobile computing and communications is driving prices down and offering potentially major opportunities for productivity gains. We expect this technology revolution to take years to unfold. The process will be Darwinian: Many companies will fail to grasp the extent of the change, while others will embrace it and thrive.
4) Housing and banks
We believe it is only a matter of time before both sectors become contributors to the U.S. economic picture. U.S. banks are improving their balance sheets. The remaining threat to them is the collateral damage from a European default. Net interest spreads are still depressed, and loan growth is problematic. Both conditions should improve with a more robust economy. The affordability of housing is now at a generational high. The extremely attractive value of U.S. homes today will provide the basis for a recovery in housing.
5) European stasis
The pace of European response to the 2008 financial crisis is becoming clear. Europe is in no particular rush to solve its debt crises. Western Europe does not have the same fascination with growth and technological innovation as we in the United States. We expect Europe will make changes slowly and only as necessary under the threat of a collapse in the Euro or its banking system. The slow pace of European progress will continue to cause varying levels of discomfort to U.S. investors. So long as Europe does not collapse, however, the U.S. economy can recover—if we improve our domestic business climate.
| 2 | www.DGIfund.com |
Table of Contents
The Disciplined Growth Investors Fund | Shareholder Letter | |
| October 31, 2011 (Unaudited) |
Conclusion
The above comments are not to imply that the level of macroeconomic uncertainty will recede soon. The more likely progression will involve two steps forward and one step back.
The investment environment will still have the “normal” set of risks. The stock market has always been subject to uncomfortably severe price declines. Individual companies will continue to face competitive threats from other companies. The rate and duration of every economic recovery is always uncertain. China may experience a slowdown. The world will continue to have pockets of political instability. The Arab “spring” may morph into increased existential threats to Israel. The Iranian and North Korean regimes are likely to cause trouble of one sort or another.
Strong corporate earnings, reasonable valuations, and gradual macroeconomic improvements should enable the stock market to continue to make healthy progress over the next several years.
About Disciplined Growth Investors
Disciplined Growth Investors is a Minneapolis-based investment management firm specializing in prudently exploiting investment opportunities in publicly held small cap and mid cap growth companies. Founded in 1997, the firm remains employee owned and completely independent.
About the Authors
Fred Martin is Disciplined Growth Investors’ founder and Chief Investment Officer. Fred has been managing portfolios since 1976 and is the primary architect of the investment philosophy employed by the firm.
Fred Martin is a registered representative of ALPS Distributors, Inc.
Investments in small and mid-size companies will generally lead to greater volatility. Investments in fixed-income securities are subject to increased loss of principal during periods of rising interest rates. The fund is new and had limited operating history.
Definitions
Nasdaq: The National Association of Securities Dealers Automated Quotation System is a nationwide computerized quotation system for over 5,500 over-the-counter stocks. The index is compiled of more than 4,800 stocks that are traded via this system.
Russell Mid-Cap Growth Index: The Russell Midcap Growth Index measures the performance of those Russell Midcap companies with higher price-to-book ratios and higher forecasted growth values. An investor cannot invest directly in an index.
S&P 500 Index: The Standard & Poor’s composite index of 500 stocks, a widely recognized, unmanaged index of common stock prices.
Semi-Annual Report (Unaudited) | October 31, 2011 | 3 |
Table of Contents
| The Disciplined Growth Investors Fund | Performance Update | |
| October 31, 2011 (Unaudited) |
Performance as of October 31, 2011
| 1 month | Since Inception* | |||
The Disciplined Growth Investors Fund | 11.46% | 8.90% |
The returns shown above do not reflect the deductions of taxes a shareholder would pay on Fund distributions or redemptions of Fund shares.
Performance data quoted represents past performance. Past performance does not guarantee future results. Investment return and principal value of an investment will fluctuate so that an investor’s shares, when sold or redeemed, may be worth more or less than the original cost. Current performance data may be higher or lower than actual data quoted. For the most current month-end performance data please call 855-DGI-FUND.
| * | Fund Inception date of August 12, 2011. |
Growth of $10,000 as of October 31, 2011
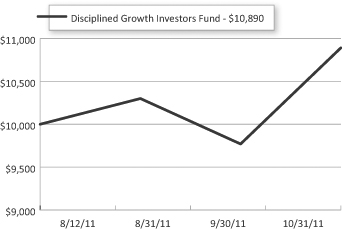 |
The chart represents historical performance of a hypothetical investment of $10,000 in the Fund since inception. Past performance does not guarantee future results. This chart does not reflect the deduction of taxes that a shareholder would pay on Fund distributions or the redemption of Fund shares.
| 4 | www.DGIfund.com |
Table of Contents
| The Disciplined Growth Investors Fund | Performance Update | |
| October 31, 2011 (Unaudited) |
Industry Allocation (as a % of Net Assets)*
Information Technology | 15.53 | % | ||
Electronics | 10.65 | % | ||
Medical Equipment & Services | 6.86 | % | ||
Consumer Products | 6.71 | % | ||
Corporate Bonds | 6.69 | % | ||
Retail | 6.46 | % | ||
Scientific Instruments & Services | 2.91 | % | ||
Manufacturing & Production | 2.83 | % | ||
Insurance | 2.81 | % | ||
Telecommunications | 2.55 | % | ||
Consumer Finance & Credit Services | 2.38 | % | ||
Leisure | 2.17 | % | ||
Commercial Services | 1.93 | % | ||
Machinery | 1.87 | % | ||
Transportation & Freight | 1.84 | % |
| * | Holdings are subject to change. |
| Investment Banking & Brokerage | 1.32 | % | ||
| Auto & Auto Parts | 1.14 | % | ||
| Utilities | 1.14 | % | ||
| Energy Equipment & Services | 0.97 | % | ||
| Media | 0.82 | % | ||
| Consumer Services | 0.35 | % | ||
| Asset/Mortgage Backed Securities | 0.26 | % | ||
| Foreign Government Bonds | 0.18 | % | ||
| Pharmaceuticals & Biotech | 0.17 | % | ||
| Government & Agency Obligations | 0.14 | % | ||
| Non-renewable Energy | 0.07 | % | ||
| Rights | 0.01 | % | ||
| Short Term & Net Other Assets | 19.24 | % | ||
Semi-Annual Report (Unaudited) | October 31, 2011 | 5 |
Table of Contents
| The Disciplined Growth Investors Fund | Disclosure of Fund Expenses | |
| October 31, 2011 (Unaudited) |
As a shareholder of a Fund, you incur two types of costs: direct costs, such as short-term redemption fees and wire fees, balance fees, and indirect costs, including management fees, and other fund operating expenses. This example is intended to help you understand your indirect costs, also referred to as “ongoing costs” (in dollars), of investing in the Fund and to compare these costs with the ongoing costs of investing in other mutual funds.
This example is based on an investment of $1,000 invested at the beginning of the period and held for the entire six-month period of May 1, 2011 through October 31, 2011.
Actual Expenses The first line of the table below provides information about actual account values and actual expenses. You may use the information in this line, together with the amount you invested at the beginning of the period, to estimate the expenses that you paid over the period. Simply divide your account value by $1,000 (for example, an $8,600 account value divided by $1,000 = 8.6), then multiply the result by the number in the first line under the heading “Expenses Paid During Period” to estimate the expenses you paid on your account during this period.
Hypothetical Example for Comparison Purposes The second line of the table provides information about hypothetical account values and hypothetical expenses based on the Fund’s actual expense ratio and an assumed rate of return of 5% per year before expenses, which is not the Fund’s actual return. The hypothetical account values and expenses may not be used to estimate the actual ending account balance or expenses you paid for the period. You may use this information to compare ongoing costs of investing in the Fund and other funds. To do so, compare this 5% hypothetical example with the 5% hypothetical examples that appear in the shareholder reports of other funds.
Please note that the expenses shown in the table are meant to highlight your ongoing costs only and do not reflect any direct costs, such as wire fees or low balance fees. Therefore, the second line of the table is useful in comparing ongoing costs only and will not help you determine the relative total costs of owning different funds. In addition, if these direct costs were included, your costs would be higher.
Beginning Account 5/1/2011 | Ending Account 10/31/11 | Expense Ratio(a) | Expenses Paid During period 5/1/2011 - 10/31/11(b) | |||||
Actual(c) | $1,000.00 | $1,089.00 | 0.78% | $1.74 | ||||
Hypothetical | $1,000.00 | $1,021.22 | 0.78% | $3.96 | ||||
| (a) | The Fund’s expense ratios have been annualized based on the Fund’s most recent fiscal half-year expenses. |
| (b) | Expenses are equal to the Fund’s annualized expense ratio, multiplied by the average account value over the period, multiplied by the number of days in the most recent fiscal half-year 184/366. |
| (c) | The Disciplined Growth Investors Fund commenced operations on August 12, 2011. |
| 6 | www.DGIfund.com |
Table of Contents
The Disciplined Growth Investors Fund | Portfolio of Investments | |
| October 31, 2011 (Unaudited) |
| Shares | Value (Note 2) | |||||||
COMMON STOCKS (73.48%) | ||||||||
CONSUMER DISCRETIONARY (17.65%) | ||||||||
Auto & Auto Parts (1.14%) | ||||||||
Gentex Corp. | 3,325 | $ | 100,149 | |||||
|
| |||||||
Consumer Products (6.71%) | ||||||||
Ethan Allen Interiors, Inc. | 7,094 | 140,461 | ||||||
Garmin Ltd. | 3,738 | 128,550 | ||||||
Ralph Lauren Corp. | 1,256 | 199,440 | ||||||
Select Comfort Corp.(a) | 5,700 | 118,389 | ||||||
|
| |||||||
| 586,840 | ||||||||
|
| |||||||
Consumer Services (0.35%) | ||||||||
Nutrisystem, Inc. | 2,457 | 30,369 | ||||||
|
| |||||||
Leisure (2.17%) | ||||||||
The Cheesecake Factory, Inc.(a) | 2,425 | 67,876 | ||||||
Royal Caribbean Cruises Ltd. | 4,100 | 121,852 | ||||||
|
| |||||||
| 189,728 | ||||||||
|
| |||||||
Media (0.82%) | ||||||||
DreamWorks Animation SKG, Inc. - Class A(a) | 3,862 | 71,640 | ||||||
|
| |||||||
Retail (6.46%) | ||||||||
Cabela’s, Inc.(a) | 5,350 | 133,322 | ||||||
Lincoln National Corp. | 2,822 | 53,759 | ||||||
TJX Cos., Inc. | 6,425 | 378,625 | ||||||
|
| |||||||
| 565,706 | ||||||||
|
| |||||||
TOTAL CONSUMER DISCRETIONARY | 1,544,432 | |||||||
|
| |||||||
ENERGY (1.04%) | ||||||||
Energy Equipment & Services (0.97%) | ||||||||
Baker Hughes, Inc. | 150 | 8,698 | ||||||
Noble Corp.(a) | 2,132 | 76,624 | ||||||
|
| |||||||
| 85,322 | ||||||||
|
| |||||||
Non-renewable Energy (0.07%) | ||||||||
Exxon Mobil Corp. | 75 | 5,857 | ||||||
|
| |||||||
TOTAL ENERGY | 91,179 | |||||||
|
| |||||||
Semi-Annual Report (Unaudited) | October 31, 2011 | 7 |
Table of Contents
The Disciplined Growth Investors Fund | Portfolio of Investments | |
| October 31, 2011 (Unaudited) |
| Shares | Value (Note 2) | |||||||
FINANCIAL SERVICES (6.51%) | ||||||||
Consumer Finance & Credit Services (2.38%) | ||||||||
Factset Research Systems, Inc. | 2,094 | $ | 208,186 | |||||
|
| |||||||
Insurance (2.81%) | ||||||||
Limited Brands, Inc. | 5,755 | 245,796 | ||||||
|
| |||||||
Investment Banking & Brokerage (1.32%) | ||||||||
E*Trade Financial Corp.(a) | 4,834 | 52,449 | ||||||
Janus Capital Group, Inc. | 9,725 | 63,796 | ||||||
|
| |||||||
| 116,245 | ||||||||
|
| |||||||
TOTAL FINANCIAL SERVICES | 570,227 | |||||||
|
| |||||||
HEALTH CARE (7.03%) | ||||||||
Medical Equipment & Services (6.86%) | ||||||||
Edwards Lifesciences Corp.(a) | 5,050 | 380,871 | ||||||
Intuitive Surgical, Inc.(a) | 262 | 113,671 | ||||||
Varian Medical Systems, Inc.(a) | 1,800 | 105,696 | ||||||
|
| |||||||
| 600,238 | ||||||||
|
| |||||||
Pharmaceuticals & Biotech (0.17%) | ||||||||
Incyte Corp. Ltd.(a) | 1,100 | 15,147 | ||||||
|
| |||||||
TOTAL HEALTH CARE | 615,385 | |||||||
|
| |||||||
PRODUCER DURABLES (11.38%) | ||||||||
Commercial Services (1.93%) | ||||||||
The Corporate Executive Board Co. | 2,900 | 106,111 | ||||||
Paychex, Inc. | 2,150 | 62,651 | ||||||
|
| |||||||
| 168,762 | ||||||||
|
| |||||||
Machinery (1.87%) | ||||||||
Middleby Corp.(a) | 1,943 | 163,756 | ||||||
|
| |||||||
Manufacturing & Production (2.83%) | ||||||||
Eaton Corp. | 5,525 | 247,630 | ||||||
|
| |||||||
Scientific Instruments & Services (2.91%) | ||||||||
Brady Corp. - Class A | 1,975 | 60,672 | ||||||
Trimble Navigation Ltd.(a) | 4,800 | 193,968 | ||||||
|
| |||||||
| 254,640 | ||||||||
|
| |||||||
| 8 | www.DGIfund.com |
Table of Contents
The Disciplined Growth Investors Fund | Portfolio of Investments | |
| October 31, 2011 (Unaudited) |
| Shares | Value (Note 2) | |||||||
PRODUCER DURABLES (continued) | ||||||||
Transportation & Freight (1.84%) | ||||||||
JetBlue Airways Corp.(a) | 4,800 | $ | 21,504 | |||||
Landstar System, Inc. | 3,125 | 139,469 | ||||||
|
| |||||||
| 160,973 | ||||||||
|
| |||||||
TOTAL PRODUCER DURABLES | 995,761 | |||||||
|
| |||||||
TECHNOLOGY (28.73%) | ||||||||
Electronics (10.65%) | ||||||||
Advanced Micro Devices, Inc.(a) | 10,781 | 62,853 | ||||||
ARM Holdings PLC ADR | 8,937 | 251,040 | ||||||
Microchip Technology, Inc. | 3,175 | 114,808 | ||||||
Open Text Corp.(a) | 4,631 | 282,584 | ||||||
Plexus Corp.(a) | 8,575 | 220,378 | ||||||
|
| |||||||
| 931,663 | ||||||||
|
| |||||||
Information Technology (15.53%) | ||||||||
Adobe Systems, Inc.(a) | 3,100 | 91,171 | ||||||
Akamai Technologies, Inc.(a) | 5,325 | 143,455 | ||||||
Apple, Inc.(a) | 463 | 187,413 | ||||||
Autodesk, Inc.(a) | 6,175 | 213,655 | ||||||
Dolby Laboratories, Inc. - Class A(a) | 2,350 | 68,714 | ||||||
Intuit, Inc. | 7,325 | 393,133 | ||||||
Seagate Technology PLC | 8,085 | 130,573 | ||||||
Yahoo!, Inc.(a) | 8,400 | 131,376 | ||||||
|
| |||||||
| 1,359,490 | ||||||||
|
| |||||||
Telecommunications (2.55%) | ||||||||
Aviat Networks, Inc.(a) | 7,350 | 15,068 | ||||||
Plantronics, Inc. | 4,125 | 137,816 | ||||||
Viasat, Inc.(a) | 1,644 | 70,018 | ||||||
|
| |||||||
| 222,902 | ||||||||
|
| |||||||
TOTAL TECHNOLOGY | 2,514,055 | |||||||
|
| |||||||
Semi-Annual Report (Unaudited) | October 31, 2011 | 9 |
Table of Contents
The Disciplined Growth Investors Fund | Portfolio of Investments | |
| October 31, 2011 (Unaudited) |
| Shares | Value (Note 2) | |||||||
UTILITIES (1.14%) | ||||||||
Utilities (1.14%) | ||||||||
tw telecom, Inc. - Class A(a) | 5,400 | $ | 99,900 | |||||
|
| |||||||
TOTAL UTILITIES | 99,900 | |||||||
|
| |||||||
TOTAL COMMON STOCKS (Cost $5,823,665) | 6,430,939 | |||||||
|
| |||||||
RIGHTS (0.01%) | ||||||||
Sanofi CVR(a) | 525 | 467 | ||||||
|
| |||||||
TOTAL RIGHTS (Cost $548) | 467 | |||||||
|
| |||||||
| Principal Amount | Value (Note 2) | |||||||
ASSET/MORTGAGE BACKED SECURITIES (0.26%) | ||||||||
Government National Mortgage Association, Series 2005-93 | ||||||||
5.500% 12/20/2034 | $ | 20,000 | 22,680 | |||||
|
| |||||||
TOTAL ASSET/MORTGAGE BACKED SECURITIES (Cost $22,483) | 22,680 | |||||||
|
| |||||||
CORPORATE BONDS (6.69%) | ||||||||
Abbott Laboratories | ||||||||
5.125% 04/01/2019 | 15,000 | 17,495 | ||||||
Affiliated Computer Services, Inc. | ||||||||
5.125% 06/01/2015 | 2,000 | 2,153 | ||||||
American Express Co. | ||||||||
4.875% 07/15/2013 | 5,000 | 5,270 | ||||||
Anheuser-Busch InBev Worldwide, Inc. | ||||||||
5.375% 01/15/2020 | 7,000 | 8,324 | ||||||
Arizona Public Service Co. | ||||||||
8.750% 03/01/2019 | 3,000 | 3,765 | ||||||
AT&T, Inc. | ||||||||
5.500% 02/01/2018 | 5,000 | 5,828 | ||||||
BB&T Corp. | ||||||||
5.700% 04/30/2014 | 3,000 | 3,298 | ||||||
BP Capital Markets PLC | ||||||||
5.250% 11/07/2013 | 3,000 | 3,246 | ||||||
Burlington Northern Santa Fe LLC | ||||||||
4.875% 01/15/2015 | 5,000 | 5,549 | ||||||
| 10 | www.DGIfund.com |
Table of Contents
The Disciplined Growth Investors Fund | Portfolio of Investments | |
| October 31, 2011 (Unaudited) |
| Principal Amount | Value (Note 2) | |||||||
CORPORATE BONDS (continued) | ||||||||
Carolina Power & Light Co. | ||||||||
5.125% 09/15/2013 | $ | 4,000 | $ | 4,314 | ||||
CenterPoint Energy Resources Corp., Series B | ||||||||
7.875% 04/01/2013 | 3,000 | 3,265 | ||||||
Coca-Cola HBC Finance BV | ||||||||
5.125% 09/17/2013 | 9,000 | 9,518 | ||||||
Comcast Cable Communications Holdings, Inc. | ||||||||
9.455% 11/15/2022 | 4,000 | 5,779 | ||||||
Commonwealth Edison Co. | ||||||||
5.800% 03/15/2018 | 8,000 | 9,437 | ||||||
The Connecticut Light & Power Co., Series 09-A | ||||||||
5.500% 02/01/2019 | 5,000 | 5,858 | ||||||
Consumers Energy Co., Series D | ||||||||
5.375% 04/15/2013 | 20,000 | 21,203 | ||||||
Corporacion Andina de Fomento | ||||||||
5.750% 01/12/2017 | 1,000 | 1,102 | ||||||
8.125% 06/04/2019 | 2,000 | 2,449 | ||||||
Covidien International Finance SA | ||||||||
6.000% 10/15/2017 | 10,000 | 12,055 | ||||||
CSX Corp. | ||||||||
5.500% 08/01/2013 | 4,000 | 4,283 | ||||||
7.375% 02/01/2019 | 10,000 | 12,695 | ||||||
Diageo Capital PLC | ||||||||
5.750% 10/23/2017 | 3,000 | 3,486 | ||||||
Emerson Electric Co. | ||||||||
5.000% 04/15/2019 | 4,000 | 4,644 | ||||||
Energy Transfer Partners LP | ||||||||
9.700% 03/15/2019 | 15,000 | 18,608 | ||||||
Florida Power & Light Co. | ||||||||
4.850% 02/01/2013 | 4,000 | 4,201 | ||||||
Fluor Corp. | ||||||||
3.375% 09/15/2021 | 10,000 | 10,038 | ||||||
General Electric Capital Corp. | ||||||||
5.875% 01/14/2038 | 15,000 | 16,275 | ||||||
General Mills, Inc. | ||||||||
6.000% 02/15/2012 | 5,000 | 5,074 | ||||||
GlaxoSmithKline Capital, Inc. | ||||||||
4.850% 05/15/2013 | 2,000 | 2,132 | ||||||
Hewlett-Packard Co. | ||||||||
3.750% 12/01/2020 | 3,000 | 3,056 | ||||||
Historic TW, Inc. | ||||||||
9.125% 01/15/2013 | 3,000 | 3,265 | ||||||
Home Depot, Inc. | ||||||||
5.250% 12/16/2013 | 4,000 | 4,356 | ||||||
Semi-Annual Report (Unaudited) | October 31, 2011 | 11 |
Table of Contents
The Disciplined Growth Investors Fund | Portfolio of Investments | |
| October 31, 2011 (Unaudited) |
| Principal Amount | Value (Note 2) | |||||||
CORPORATE BONDS (continued) | ||||||||
International Bank for Reconstruction & Development Interest Strip | ||||||||
10.429%(b) 07/15/2012 | $ | 6,000 | $ | 5,978 | ||||
International Business Machines Corp. | ||||||||
7.625% 10/15/2018 | 20,000 | 26,821 | ||||||
Johnson & Johnson | ||||||||
5.850% 07/15/2038 | 20,000 | 27,037 | ||||||
JPMorgan Chase & Co. | ||||||||
4.750% 05/01/2013 | 15,000 | 15,780 | ||||||
5.375% 10/01/2012 | 1,000 | 1,043 | ||||||
Kimberly-Clark Corp. | ||||||||
7.500% 11/01/2018 | 8,000 | 10,547 | ||||||
Kraft Foods, Inc. | ||||||||
4.125% 02/09/2016 | 2,000 | 2,173 | ||||||
6.125% 02/01/2018 | 15,000 | 17,755 | ||||||
Lockheed Martin Corp. | ||||||||
7.650% 05/01/2016 | 3,000 | 3,695 | ||||||
Lubrizol Corp. | ||||||||
8.875% 02/01/2019 | 2,000 | 2,727 | ||||||
McDonald’s Corp. | ||||||||
6.300% 03/01/2038 | 20,000 | 27,640 | ||||||
Merck & Co., Inc. | ||||||||
3.875% 01/15/2021 | 10,000 | 10,986 | ||||||
National Rural Utilities Cooperative Finance Corp. | ||||||||
10.375% 11/01/2018 | 7,000 | 10,066 | ||||||
Nevada Power Co. | ||||||||
7.125% 03/15/2019 | 8,000 | 9,981 | ||||||
News America, Inc. | ||||||||
6.900% 03/01/2019 | 9,000 | 10,700 | ||||||
Nisource Finance Corp. | ||||||||
6.800% 01/15/2019 | 8,000 | 9,605 | ||||||
Northeast Utilities | ||||||||
5.650% 06/01/2013 | 5,000 | 5,324 | ||||||
Ohio Power Co., Series M | ||||||||
5.375% 10/01/2021 | 3,000 | 3,449 | ||||||
Oncor Electric Delivery Co. LLC | ||||||||
6.375% 05/01/2012 | 3,000 | 3,077 | ||||||
Plains All American Pipeline LP / Plains All American Finance Corp. | ||||||||
5.625% 12/15/2013 | 3,000 | 3,234 | ||||||
8.750% 05/01/2019 | 5,000 | 6,428 | ||||||
PPL Energy Supply LLC | ||||||||
6.300% 07/15/2013 | 3,000 | 3,202 | ||||||
| 12 | www.DGIfund.com |
Table of Contents
| The Disciplined Growth Investors Fund | Portfolio of Investments | |
| October 31, 2011 (Unaudited) |
| Principal Amount | Value (Note 2) | |||||||
CORPORATE BONDS (continued) | ||||||||
Private Export Funding Corp., Series P | ||||||||
5.685% 05/15/2012 | $ | 2,000 | $ | 2,059 | ||||
Public Service Electric & Gas Co. | ||||||||
5.000% 08/15/2014 | 5,000 | 5,500 | ||||||
Reinsurance Group of America, Inc. | ||||||||
6.750% 12/15/2011 | 6,000 | 6,036 | ||||||
Republic Services, Inc. | ||||||||
5.500% 09/15/2019 | 10,000 | 11,544 | ||||||
Rio Tinto Finance USA Ltd. | ||||||||
9.000% 05/01/2019 | 7,000 | 9,597 | ||||||
Safeway, Inc. | ||||||||
5.625% 08/15/2014 | 2,000 | 2,196 | ||||||
Sempra Energy | ||||||||
8.900% 11/15/2013 | 15,000 | 17,059 | ||||||
Shell International Finance BV | ||||||||
4.950% 03/22/2012 | 5,000 | 5,089 | ||||||
Southern California Edison Co., Series 05-A | ||||||||
5.000% 01/15/2016 | 3,000 | 3,405 | ||||||
Tennessee Valley Authority, Series B | ||||||||
4.700% 07/15/2033 | 13,000 | 14,734 | ||||||
TransCanada PipeLines Ltd. | ||||||||
7.250% 08/15/2038 | 3,000 | 4,192 | ||||||
Tyco International Finance SA | ||||||||
8.500% 01/15/2019 | 4,000 | 5,177 | ||||||
United Parcel Service, Inc. | ||||||||
6.200% 01/15/2038 | 15,000 | 20,171 | ||||||
United Technologies Corp. | ||||||||
5.375% 12/15/2017 | 2,000 | 2,336 | ||||||
US Bank | ||||||||
4.800% 04/15/2015 | 5,000 | 5,474 | ||||||
Wal-Mart Stores, Inc. | ||||||||
6.200% 04/15/2038 | 20,000 | 26,382 | ||||||
Waste Management, Inc. | ||||||||
7.375% 03/11/2019 | 4,000 | 5,030 | ||||||
|
| |||||||
TOTAL CORPORATE BONDS (Cost $579,781) | 585,250 | |||||||
|
| |||||||
FOREIGN GOVERNMENT BONDS (0.18%) | ||||||||
Israel Government AID Bond, Zero Coupon, Series 8-Z | ||||||||
02/15/2020 | 9,000 | 7,460 | ||||||
Province of British Columbia Canada | ||||||||
4.300% 05/30/2013 | 4,000 | 4,241 | ||||||
Semi-Annual Report (Unaudited) | October 31, 2011 | 13 |
Table of Contents
The Disciplined Growth Investors Fund | Portfolio of Investments | |
| October 31, 2011 (Unaudited) |
| Principal Amount | Value (Note 2) | |||||||||||||
FOREIGN GOVERNMENT BONDS (continued) | ||||||||||||||
Province of Quebec Canada, Series NN | ||||||||||||||
7.125% 02/09/2024 | $ | 3,000 | $ | 4,183 | ||||||||||
|
| |||||||||||||
TOTAL FOREIGN GOVERNMENT BONDS (Cost $15,942) | 15,884 | |||||||||||||
|
| |||||||||||||
GOVERNMENT & AGENCY OBLIGATIONS (0.14%) | ||||||||||||||
U.S. Treasury Bonds | ||||||||||||||
6.500% 11/15/2026 | 3,000 | 4,418 | ||||||||||||
U.S. Treasury Notes | ||||||||||||||
4.500% 11/15/2015 | 4,000 | 4,605 | ||||||||||||
4.500% 02/15/2016 | 3,000 | 3,472 | ||||||||||||
|
| |||||||||||||
TOTAL GOVERNMENT & AGENCY OBLIGATIONS (Cost $12,651) | 12,495 | |||||||||||||
|
| |||||||||||||
| 7-Day Yield | Shares | Value (Note 2) | ||||||||||||
SHORT TERM INVESTMENTS (19.87%) | ||||||||||||||
Fidelity Institutional Money Market Government Portfolio - Class I | 0.01 | % | 1,739,072 | 1,739,072 | ||||||||||
|
| |||||||||||||
TOTAL SHORT TERM INVESTMENTS (Cost $1,739,072) | 1,739,072 | |||||||||||||
|
| |||||||||||||
TOTAL INVESTMENTS (100.63%) (Cost $8,194,142) | $ | 8,806,787 | ||||||||||||
Liabilities In Excess Of Other Assets (-0.63%) | (55,167) | |||||||||||||
|
| |||||||||||||
NET ASSETS (100.00%) | $ | 8,751,620 | ||||||||||||
|
| |||||||||||||
| 14 | www.DGIfund.com |
Table of Contents
The Disciplined Growth Investors Fund | Portfolio of Investments | |
| October 31, 2011 (Unaudited) |
| (a) | Non-Income Producing Security. |
| (b) | Rate shown represents the bond equivalent yield to maturity at date of purchase. |
Percentages are stated as a percent of net assets.
Common Abbreviations: |
ADR - American Depository Receipt. |
AID - Agency for International Development. |
BV - Besloten Vennootschap. |
CVR - Contingent Value Rights. |
LLC - Limited Liability Company. |
LP - Limited Partnership. |
Ltd. - Limited. |
PLC - Public Limited Company. |
SA - Generally designates corporations in various countries, mostly those employing the civil law. |
Holdings are subject to change.
For Fund compliance purposes, the Fund’s industry classifications refer to any one or more of the industry sub-classifications used by one or more widely recognized market indexes or ratings group indexes, and/or as defined by Fund management. This definition may not apply for purposes of this report, which may combine industry sub-classifications for reporting ease. Industries are shown as a percent of net assets. These industry classifications are based on third-party definitions. The definitions are industry terms and do not reflect the legal status of any of the investments or the companies in which the Fund has invested.
See Notes to Financial Statements.
Semi-Annual Report (Unaudited) | October 31, 2011 | 15 |
Table of Contents
The Disciplined Growth Investors Fund | Statement of Assets and Liabilities | |
| October 31, 2011 (Unaudited) |
ASSETS | ||||
Investments, at value | $ | 8,806,787 | ||
Receivable for investments sold | 2,427 | |||
Dividends and interest receivable | 9,037 | |||
Total assets | 8,818,251 | |||
LIABILITIES | ||||
Payable for investments purchased | 61,689 | |||
Payable to adviser | 4,831 | |||
Accrued expenses and other liabilities | 111 | |||
Total liabilities | 66,631 | |||
NET ASSETS | $ | 8,751,620 | ||
NET ASSETS CONSIST OF | ||||
Paid-in capital (Note 4) | $ | 8,142,330 | ||
Undistibuted net investment loss | (3,405 | ) | ||
Accumulated net realized gain on investments | 50 | |||
Net unrealized appreciation on investments | 612,645 | |||
NET ASSETS | $ | 8,751,620 | ||
INVESTMENTS, AT COST | $ | 8,194,142 | ||
PRICING OF SHARES | ||||
Net Asset Value, offering and redemption price per share | $ | 10.89 | ||
Shares of beneficial interest outstanding | 803,464 | |||
See Notes to Financial Statements.
| 16 | www.DGIfund.com |
Table of Contents
The Disciplined Growth Investors Fund | Statement of Operations | |
| For the Period August 12, 2011 (Inception) to October 31, 2011 (Unaudited) | ||||
INVESTMENT INCOME | ||||
Dividends | $ | 2,846 | ||
Interest | 1,312 | |||
Total investment income | 4,158 | |||
EXPENSES | ||||
Investment advisory fees (Note 5) | 5,846 | |||
Interest expense | 1,717 | |||
Total net expenses | 7,563 | |||
NET INVESTMENT LOSS | (3,405 | ) | ||
REALIZED AND UNREALIZED GAIN ON INVESTMENTS | ||||
Net realized gain on investments | 50 | |||
Net change in unrealized appreciation on investments | 612,645 | |||
NET REALIZED AND UNREALIZED GAIN ON INVESTMENTS | 612,695 | |||
NET INCREASE IN NET ASSETS RESULTING FROM OPERATIONS | $ | 609,290 | ||
See Notes to Financial Statements.
Semi-Annual Report (Unaudited) | October 31, 2011 | 17 |
Table of Contents
The Disciplined Growth Investors Fund | Statement of Changes in Net Assets | |
| For the Period August 12, 2011 (Inception) to October 31, 2011 (Unaudited) | ||||
OPERATIONS | ||||
Net investment loss | $ | (3,405) | ||
Net realized gain on investments | 50 | |||
Net change in unrealized appreciation on investments | 612,645 | |||
Net increase in net assets resulting from operations | 609,290 | |||
CAPITAL SHARE TRANSACTIONS (Note 4) | ||||
Proceeds from sales of shares | 8,142,330 | |||
Cost of shares redeemed, net of redemption fees | – | |||
Net increase from capital share transactions | 8,142,330 | |||
Net increase in net assets | 8,751,620 | |||
NET ASSETS | ||||
Beginning of period | – | |||
End of period* | $ | 8,751,620 | ||
* Including undistributed net investment loss of: | $ | (3,405) | ||
OTHER INFORMATION | ||||
Share Transactions | ||||
Issued | 803,464 | |||
Redeemed | – | |||
Net increase in share transactions | 803,464 | |||
See Notes to Financial Statements.
| 18 | www.DGIfund.com |
Table of Contents
The Disciplined Growth Investors Fund | Financial Highlights | |
For a share outstanding during the period presented. |
| For the Period August 12, 2011 (Inception) to October 31, 2011 (Unaudited) | |||||
NET ASSET VALUE, BEGINNING OF PERIOD | $ | 10.00 | |||
INCOME/(LOSS) FROM OPERATIONS | |||||
Net investment loss(a) | (0.01) | ||||
Net realized and unrealized gain on investments | 0.90 | ||||
Total from investment operations | 0.89 | ||||
DISTRIBUTIONS | |||||
From net investment income | – | ||||
From net realized gain on investments | – | ||||
Total distributions | – | ||||
REDEMPTION FEES ADDED TO PAID-IN CAPITAL (Note 4) | – | ||||
INCREASE IN NET ASSET VALUE | 0.89 | ||||
NET ASSET VALUE, END OF PERIOD | $ | 10.89 | |||
TOTAL RETURN | 8.90% | (b) | |||
RATIOS AND SUPPLEMENTAL DATA | |||||
Net assets, end of period (000’s) | $ | 8,752 | |||
RATIOS TO AVERAGE NET ASSETS | |||||
Expenses (excluding interest expense) | 0.78% | (c) | |||
Expenses (including interest expense) | 1.01% | (c) | |||
Net investment loss | (0.45%) | (c) | |||
PORTFOLIO TURNOVER RATE | 0%(b) | (d) | |||
| (a) | Per share numbers have been calculated using the average shares method. |
| (b) | Not annualized. |
| (c) | Annualized. |
| (d) | Less than 0.5%. |
See Notes to Financial Statements.
Semi-Annual Report (Unaudited) | October 31, 2011 | 19 |
Table of Contents
The Disciplined Growth Investors Fund | Notes to Financial Statements | |
| October 31, 2011(Unaudited) |
1. ORGANIZATION
Financial Investors Trust (the “Trust”) a Delaware statutory trust, is an open-end management investment company registered under the Investment Company Act of 1940, as amended (“1940 Act”). As of October 31, 2011, the Trust had fifteen registered funds. This semi-annual report describes The Disciplined Growth Investors Fund (the “Fund”). The Fund seeks long-term capital growth and as a secondary objective, modest income with reasonable risk.
From August 12, 2011 through October 31, 2011, the assets of four separate accounts were transferred-in-kind into the Disciplined Growth Investors Fund in the amount of $4,809,378. Only equity holdings and cash were transferred in-kind. No fixed income securities were included in these in-kind transfers. The intent of the transfers was to save on equity transaction costs both for the new shareholders at the institution they transferred from and for the Fund on the addition of assets.
2. SIGNIFICANT ACCOUNTING POLICIES
The following is a summary of significant accounting policies consistently followed by the Fund. These policies are in conformity with U.S. generally accepted accounting principles, (“GAAP”).
The preparation of financial reporting in accordance with GAAP requires management to make certain estimates and assumptions that affect the reported amounts and disclosures in the financial statements during the reporting period. Management believes the estimates and security valuations are appropriate; however, actual results may differ from those estimates, and the security valuations reflected in the financial statements may differ from the value the Fund ultimately realizes upon sale of the securities. The financial statements have been prepared as of the close of the New York Stock Exchange (“NYSE”) on October 31, 2011.
Investment Valuation: The Fund generally values its securities based on market prices determined at the close of regular trading on the New York Stock Exchange (“NYSE”), normally 4:00 p.m. Eastern Time, on each day the NYSE is open for trading. A Fund’s net asset value (“NAV”) is computed by dividing the value of all assets of the Fund (including accrued interest and dividends), less all liabilities (including accrued expenses and dividends declared but unpaid), by the total number of shares outstanding.
For equity securities that are traded on an exchange, the market price is usually the closing sale or official closing price on that exchange. In the case of equity securities not traded on an exchange, or if such closing prices are not otherwise available, the market price is typically determined by independent third party pricing vendors approved by the Board of Trustees (the “Board”) using a variety of pricing techniques and methodologies. The market price for debt obligations is generally the price supplied by an independent third-party pricing service approved by the Board, which may use a matrix, formula or other objective method that takes into consideration market indices, yield curves and other specific adjustments. Short–term debt obligations that will mature in 60 days or less are valued at amortized cost, unless it is determined that using this method would not reflect an investment’s fair value. If vendors are unable to supply a price, or if the price supplied is deemed to be unreliable, the market price may be determined using quotations received from one or more brokers–dealers that make a market in the security.
| 20 | www.DGIfund.com |
Table of Contents
The Disciplined Growth Investors Fund | Notes to Financial Statements | |
| October 31, 2011(Unaudited) |
The Fund will use a fair valuation model provided by an independent pricing service, which is intended to reflect fair value when a security’s value or a meaningful portion of the Fund’s portfolio is believed to have been materially affected by a valuation event that has occurred between the close of the exchange or market on which the security is traded and the close of the regular trading day on the NYSE. The Fund’s valuation procedures set forth certain triggers which instruct when to use the fair valuation model. The value assigned to a security by the fair valuation model is a determination of fair value made under the Fund’s valuation procedures and under the supervision of the Board of Trustees. In such a case, a Fund’s value for a security may be different from the last sales price (or the latest closing price) and there is no guarantee that a fair valued security will be sold at the price at which a Fund is valuing the security.
Forward currency exchange contracts have a market value determined by the prevailing foreign currency exchange daily rates and current foreign currency exchange forward rates. The foreign currency exchange forward rates are calculated using an automated system that estimates rates on the basis of the current day foreign currency exchange rates and forward foreign currency exchange rates supplied by a pricing service. Foreign exchange rates and forward foreign currency exchange rates may generally be obtained at the close of the NYSE, normally 4:00 p.m. Eastern Time.
Redeemable securities issued by open-end registered investment companies are valued at the investment company’s or subsidiary’s applicable net asset value, with the exception of exchange-traded open-end investment companies, which are priced as equity securities.
Investment securities that are primarily traded on foreign securities exchanges are valued at the preceding closing values of such securities on their respective exchanges, except when an occurrence subsequent to the time a value was so established is likely to have changed such value. In such an event, the fair value of those securities are determined in good faith through consideration of other factors in accordance with procedures established by and under the general supervision of the Board of Trustees.
When such prices or quotations are not available, or when the Fair Value Committee appointed by the Board believes that they are unreliable, securities may be priced using fair value procedures approved by the Board. The Fund may also use fair value procedures if the Fair Value Committee determines that a significant event has occurred between the time at which a market price is determined and the time at which a Fund’s NAV is calculated. In particular, the value of non-U.S. securities may be materially affected by events occurring after the close of the foreign exchange on which they are traded, but before a Fund prices its shares.
Investment Transactions: Investment and shareholder transactions are accounted for on the date the investments are purchased or sold (trade date). Realized gains and losses from investment transactions are reported on an identified cost basis. Interest income, which includes accretion of discounts, is accrued and recorded as earned. Dividend income is recognized on the ex-dividend date or for certain foreign securities, as soon as information is available to the Fund.
Foreign Securities: The Fund may directly purchase securities of foreign issuers. Investing in securities of foreign issuers involves special risks not typically associated with investing in securities of U.S. issuers. The risks include possible reevaluation of currencies, the inability to repatriate foreign currency, less complete financial information about companies and possible future adverse political and economic developments. Moreover, securities of many foreign issuers and their markets may be less liquid and their prices more volatile than those of securities of comparable U.S. issuers.
Semi-Annual Report (Unaudited) | October 31, 2011 | 21 |
Table of Contents
The Disciplined Growth Investors Fund | Notes to Financial Statements | |
| October 31, 2011(Unaudited) |
Foreign Currency Translation: The books and records of the Fund are maintained in U.S. dollars. Investment valuations and other assets and liabilities initially expressed in foreign currencies are converted each business day into U.S. dollars based upon current exchange rates. Prevailing foreign exchange rates may generally be obtained at the close of the NYSE (normally, 4:00 p.m. Eastern time). The portion of realized and unrealized gains or losses on investments due to fluctuations in foreign currency exchange rates is not separately disclosed and is included in realized and unrealized gains or losses on investments, when applicable.
Foreign Currency Spot Contracts: The Fund may enter into foreign currency spot contracts to facilitate transactions in foreign securities or to convert foreign currency receipts into U.S. dollars. A foreign currency spot contract is an agreement between two parties to buy and sell currencies at the current market rate, for settlement generally within two business days. The U.S. dollar value of the contracts is determined using current currency exchange rates supplied by a pricing service. The contract is marked-to-market daily for settlements beyond one day and any change in market value is recorded as an unrealized gain or loss. When the contract is closed, the Fund records a realized gain or loss equal to the difference between the value on the open and close date. Losses may arise from changes in the value of the foreign currency, or if the counterparties do not perform under the contract’s terms. The maximum potential loss from such contracts is the aggregate face value in U.S. dollars at the time the contract was opened.
Fair Value Measurements: The Fund discloses the classification of their fair value measurements following a three-tier hierarchy based on the inputs used to measure fair value. Inputs refer broadly to the assumptions that market participants would use in pricing the asset or liability, including assumptions about risk. Inputs may be observable or unobservable. Observable inputs reflect the assumptions market participants would use in pricing the asset or liability that are developed based on market data obtained from sources independent of the reporting entity. Unobservable inputs reflect the reporting entity’s own assumptions about the assumptions market participants would use in pricing the asset or liability that are developed based on the best information available.
Various inputs are used in determining the value of the Fund’s investments as of the end of the reporting period. When inputs used fall into different levels of the fair value hierarchy, the level in the hierarchy within which the fair value measurement falls is determined based on the lowest level input that is significant to the fair value measurement in its entirety. The designated input levels are not necessarily an indication of the risk or liquidity associated with these investments. These inputs are categorized in the following hierarchy under applicable financial accounting standards:
Level 1 – | Unadjusted quoted prices in active markets for identical investments, unrestricted assets or liabilities that a Fund has the ability to access at the measurement date; | |
Level 2 – | Quoted prices which are not active, quoted prices for similar assets or liabilities in active markets or inputs other than quoted prices that are observable (either directly or indirectly) for substantially the full term of the asset or liability; and | |
| 22 | www.DGIfund.com |
Table of Contents
| The Disciplined Growth Investors Fund | Notes to Financial Statements | |
| October 31, 2011(Unaudited) |
Level 3 – | Significant unobservable prices or inputs (including the Fund’s own assumptions in determining the fair value of investments) where there is little or no market activity for the asset or liability at the measurement date. |
The following is a summary of each input used to value the Fund as of October 31, 2011:
Disciplined Growth Investors Fund
| Investments in Securities at Value | Level 1 - Unadjusted Quoted Prices | Level 2 - Other Significant Observable Inputs | Level 3 - Significant Unobservable Inputs | Total | ||||||||||||||||||||
Common Stocks | $ | 6,430,939 | $ | – | $ | – | $ | 6,430,939 | ||||||||||||||||
Rights | 467 | – | – | 467 | ||||||||||||||||||||
Asset/Mortgage Backed Securities | – | 22,680 | – | 22,680 | ||||||||||||||||||||
Corporate Bonds | – | 585,250 | – | 585,250 | ||||||||||||||||||||
Foreign Government Bonds | – | 15,884 | – | 15,884 | ||||||||||||||||||||
Government & Agency Obligations | – | 12,495 | – | 12,495 | ||||||||||||||||||||
Short Term Investments | 1,739,072 | – | – | 1,739,072 | ||||||||||||||||||||
TOTAL | $ | 8,170,478 | $ | 636,309 | $ | – | $ | 8,806,787 | ||||||||||||||||
The above table is presented by levels of disaggregation for each asset class. For detailed descriptions of the underlying industries, see the accompanying Portfolio of Investments.
There were no Level 3 securities held during the period.
For the period ended October 31, 2011, the Fund did not have any significant transfers between Level 1 and Level 2 securities. As such, international securities can transfer between Level 1 and Level 2 based on triggers being met without disclosure detailing the transfers into and out of Level 1 and Level 2.
Forward Foreign Currency Transactions: The Fund may engage in currency transactions with counterparties to hedge the value of portfolio securities denominated in particular currencies against fluctuations in relative value, to gain or reduce exposure to certain currencies, or to generate income or gains. All commitments are marked to market daily at the applicable exchange rates and any resulting unrealized gains or losses are recorded in the Fund’s financial statements. The Fund records realized gains or losses at the time a forward contract is offset by entry into a closing transaction or extinguished by delivery of the currency. The Fund had no open forward foreign currency contracts at October 31, 2011.
Trust Expenses: Some expenses of the Trust can be directly attributed to a Fund. Expenses which cannot be directly attributed to the Fund are apportioned among all Funds in the Trust based on average net assets of each Fund.
Semi-Annual Report (Unaudited) | October 31, 2011 | 23 |
Table of Contents
The Disciplined Growth Investors Fund | Notes to Financial Statements | |
| October 31, 2011(Unaudited) |
Federal Income Taxes: The Fund complies with the requirements under Subchapter M of the Internal Revenue Code applicable to regulated investment companies and intend to distribute substantially all of their net taxable income and net capital gains, if any, each year. The Fund is not subject to income taxes to the extent such distributions are made. As of and during the period ended October 31, 2011, the Fund did not have a liability for any unrecognized tax benefits in the accompanying financial statements. The Fund files income tax returns in the U.S. federal jurisdiction and Colorado.
Distributions to Shareholders: The Fund normally pays dividends, if any, quarterly and distributes capital gains, if any, on an annual basis. Income dividend distributions are derived from interest and other income the Fund receives from its investments, including distributions of short term capital gains. Capital gain distributions are derived from gains realized when each Fund sells a security it has owned for more than a year. The Fund may make additional distributions and dividends at other times if the portfolio manager believes doing so may be necessary for the Fund to avoid or reduce taxes. Net investment income/(loss) and net realized gain/(loss) may differ for financial statement and tax purposes. The character of distributions made during the year from net investment income or net realized gains may differ from its ultimate characterization for federal income tax purposes. Also, due to the timing of dividend distributions, the fiscal year in which amounts are distributed may differ from the fiscal year in which the income or realized gain were recorded by the Fund. During the period ended October 31, 2011, the Fund did not make any distributions.
Unrealized Appreciation and Depreciation on Investments: The differences between book-basis and tax-basis are primarily due to the deferral of post October losses and wash sale losses. As of October 31, 2011, the cost of securities on a tax basis and gross unrealized appreciation/ (depreciation) on investments for federal income tax purposes were as follows:
Gross appreciation (excess of value over tax cost) | $ | 635,554 | ||
Gross depreciation (excess of tax cost over value) | (22,909 | ) | ||
Net unrealized appreciation | $ | 612,645 | ||
Cost of investments for income tax purposes | $ | 8,194,142 |
3. SECURITIES TRANSACTIONS
The cost of purchases and proceeds from sales of securities (excluding short-term securities and U.S. Government Obligations during the period ended October 31, 2011, were as follows:
Purchases | $ | 1,633,064 | ||
Sales | 10,751 |
The cost of purchases and proceeds from sales of securities in U.S. Government Obligations during the period ended October 31, 2011, were as follows:
Purchases | $ | 24,368 | ||
Sales | – |
| 24 | www.DGIfund.com |
Table of Contents
The Disciplined Growth Investors Fund | Notes to Financial Statements | |
| October 31, 2011(Unaudited) |
4. SHARES OF BENEFICIAL INTEREST
The capitalization of the Trust consists of an unlimited number of shares of beneficial interest with no par value per share. Holders of the shares of the Fund of the Trust have one vote for each share held and a proportionate fraction of a vote for each fractional share. All shares issued and outstanding are fully paid and are non-assessable, transferable and redeemable at the option of the shareholder. Shares have no pre-emptive rights.
Shares redeemed within 90 days of purchase may incur a 2% short-term redemption fee deducted from the redemption amount. For the period ended October 31, 2011, the Fund did not receive any redemption fees.
Beneficial Ownership: The beneficial ownership, either directly or indirectly, of more than 25% of the voting securities of any class a Fund creates a presumption of control of the Fund under Section 2(a)(9) of the 1940 Act. As of October 31, 2011, Richard J. Ivance held approximately 25.51% of the Disciplined Growth Investors Fund.
5. MANAGEMENT AND RELATED-PARTY TRANSACTIONS
Disciplined Growth Investors, Inc. (“the Adviser” or “DGI”), subject to the authority of the Board, is responsible for the overall management and administration of the Fund’s business affairs. DGI manages the investments of the Fund in accordance with the Fund’s investment objective, policies and limitations and investment guidelines established jointly by the Adviser and the Trustees. Pursuant to the Advisory Agreement, the Fund pays the Adviser a unitary fee for the services and facilities it provides payable on a monthly basis at the annual rate of 0.78% of the Fund’s average daily net assets. The initial term of the Advisory Agreement is two years. The Board, shareholders of the Fund or the Adviser may terminate the Advisory Agreement upon sixty (60) days notice.
Out of the unitary management fee, the Adviser pays substantially all expenses of the Fund, including the cost of transfer agency, custody, fund administration, legal, audit and other services, except for interest expenses, distribution fees or expenses, brokerage expenses, taxes and extraordinary expenses not incurred in the ordinary course of the Fund’s business.
The Investment Adviser’s unitary management fee is designed to pay substantially all the Fund’s expenses and to compensate the Investment Adviser for providing services for the Fund.
Under the terms of the Advisory Agreement, the Adviser shall not be liable for losses or damages incurred by the Fund, unless such losses or damages are attributable to the willful misfeasance, bad faith or gross negligence on the part of the Adviser or from reckless disregard by it of its obligations and duties under the Advisory Agreement (“disabling conduct”). In addition, the Fund will indemnify the Adviser and its affiliates and hold each of them harmless against any losses or damages not resulting from disabling conduct.
Distributor: ALPS Distributors, Inc. (an affiliate of ALPS) (“ADI” or the “Distributor”) acts as the distributor of the Fund’s shares pursuant to a Distribution Agreement with the Trust. Shares are sold on a continuous basis by ADI as agent for the Fund, and ADI has agreed to use its best efforts to solicit orders for the sale of the Fund’s shares, although it is not obliged to sell any particular amount of shares. ADI is not entitled to any compensation for its services as Distributor. ADI is registered as a broker-dealer with the Securities and Exchange Commission.
Semi-Annual Report (Unaudited) | October 31, 2011 | 25 |
Table of Contents
The Disciplined Growth Investors Fund | Notes to Financial Statements | |
| October 31, 2011(Unaudited) |
6. INDEMNIFICATIONS
Under the Trust’s organizational documents, its officers and Trustees are indemnified against certain liability arising out of the performance of their duties to the Trust. Additionally, in the normal course of business, the Trust enters into contracts with service providers that may contain general indemnification clauses. The Trust’s maximum exposure under these arrangements is unknown, as this would involve future claims that may be made against the Trust that have not yet occurred.
7. SUBSEQUENT EVENTS
Management has evaluated whether any events or transactions occurred subsequent to October 31, 2011 through the date of issuance of the Fund’s financial statements and determined that there were no other material events or transactions that would require recognition or disclosure in the Fund’s financial statements.
| 26 | www.DGIfund.com |
Table of Contents
The Disciplined Growth Investors Fund | Additional Information | |
| October 31, 2011(Unaudited) |
1. FUND HOLDINGS
The Fund files its complete schedule of portfolio holdings with the Securities and Exchange Commission (the “SEC”) for the first and third quarters of each fiscal year on Form N-Q within 60 days after the end of the period. Copies of the Funds’ Form N-Q are available without charge on the SEC website at http://www.sec.gov. You may also review and copy the Form N-Q at the SEC’s Public Reference Room in Washington, DC. For more information about the operation of the Public Reference Room, please call the SEC at 1-800-SEC-0330
2. FUND PROXY VOTING POLICIES, PROCEDURES AND SUMMARIES
The Fund’s policies and procedures used in determining how to vote proxies and information regarding how the Fund voted proxies relating to portfolio securities during the most recent prior 12-month period ending June 30 will be available without charge, (1) upon request, by calling 855-DGI-FUND and (2) on the SEC’s website at http://www.sec.gov.
3. DISCLOSURE REGARDING APPROVAL OF FUND ADVISORY AGREEMENT
On June 28, 2011, the Trustees met in person to discuss, among other things, the approval of the Investment Advisory Agreement between the Trust and DGI (the “DGI Fund Advisory Agreement”) in accordance with Section 15(c) of the 1940 Act. The Independent Trustees met with independent legal counsel during executive session and discussed the DGI Fund Advisory Agreement and other related materials.
In approving the DGI Fund Advisory Agreement, the Trustees, including the Independent Trustees, considered the following factors with respect to the DGI Fund:
Investment Advisory Fee Rate: The Trustees reviewed and considered the contractual annual unitary advisory fee to be paid by the Trust, on behalf of the DGI Fund, to DGI of 0.78% of the DGI Fund’s daily average net assets, in light of the extent and quality of the advisory services to be provided by DGI to the DGI Fund.
The Trustees considered the information they received comparing the DGI Fund’s contractual annual unitary advisory fee and overall expenses with those of funds in both the relevant expense group and universe of funds provided by an independent provider of investment company data.
Based on such information, the Trustees further determined that the contractual annual unitary advisory fee of 0.78% and the total expense ratio of 0.78% for the DGI Fund is comparable to others within the DGI Fund’s anticipated peer universe.
Nature, Extent and Quality of the Services under the DGI Fund Advisory Agreement: The Trustees received and considered information regarding the nature, extent and quality of services provided to the DGI Fund under the DGI Fund Advisory Agreement. The Trustees reviewed certain background materials supplied by DGI in its presentation, including its Form ADV.
The Trustees reviewed and considered DGI’s investment advisory personnel, its history as an asset manager, its performance and the amount of assets currently under management by DGI. The Trustees also reviewed the research and decision-making processes utilized by DGI, including the methods adopted to seek to achieve compliance with the investment objectives, policies and restrictions of the DGI Fund.
Semi-Annual Report (Unaudited) | October 31, 2011 | 27 |
Table of Contents
The Disciplined Growth Investors Fund | Additional Information | |
| October 31, 2011(Unaudited) |
The Trustees considered the background and experience of DGI’s management in connection with the DGI Fund, including reviewing the qualifications, backgrounds and responsibilities of the management team primarily responsible for the day-to-day portfolio management of the DGI Fund and the extent of the resources devoted to research and analysis of actual and potential investments.
The Trustees also reviewed, among other things, DGI’s insider trading policies and procedures and its Code of Ethics.
Performance: The Trustees noted that since the DGI Fund had not yet begun operations, there was no fund performance to be reviewed or analyzed at this time, but they noted the performance of the private accounts advised by DGI. The Trustees considered DGI’s performance and reputation generally and its investment techniques, risk management controls and decision-making processes, taking into account that such performance was not the actual performance of the DGI Fund.
The Adviser’s Profitability: The Trustees received and considered a projected profitability analysis prepared by DGI based on the fees payable under the DGI Fund Advisory Agreement. The Trustees considered the profits, if any, anticipated to be realized by DGI in connection with the operation of the DGI Fund. The Board then reviewed DGI’s financial statements in order to analyze the financial condition and stability and profitability of the adviser.
Economies of Scale: The Trustees considered whether economies of scale in the provision of services to the DGI Fund will be passed along to the shareholders under the proposed agreements.
Other Benefits to the Adviser: The Trustees reviewed and considered any other benefits derived or to be derived by DGI from its relationship with the DGI Fund, including soft dollar arrangements.
In selecting DGI as the DGI Fund’s investment adviser and approving the DGI Fund Advisory Agreement and the fees charged under this agreement, the Trustees concluded that no single factor reviewed by the Trustees was identified by the Trustees to be determinative as the principal factor in whether to approve the DGI Fund Advisory Agreement. Further, the Independent Trustees were advised by separate independent legal counsel throughout the process. The Trustees, including all of the Independent Trustees, concluded that:
| • | the investment advisory fees to be received by DGI with respect to the DGI Fund were comparable to others within the DGI Fund’s peer universe; |
| • | the nature, extent and quality of services to be rendered by DGI under the DGI Fund Advisory Agreement were adequate; |
| • | the profit, if any, anticipated to be realized by DGI in connection with the operation of the DGI Fund is fair to the Trust, especially in light of the unitary fee arrangement; and |
| • | there were no material economies of scale or other incidental benefits accruing to DGI in connection with its relationship with the DGI Fund. |
Based on the Trustees’ deliberations and their evaluation of the information described above, the Trustees, including all of the Independent Trustees, concluded that DGI’s compensation for investment advisory services is consistent with the best interests of the DGI Fund and its shareholders.
| 28 | www.DGIfund.com |
Table of Contents

Must be accompanied by or proceeded by a Prospectus.
The Disciplined Growth Investors Fund is distributed by ALPS Distributors, Inc.
Table of Contents
CLASS A SHARES (MFBPX) CLASS I SHARES (MFBTX) |
Table of Contents

| PAGE | ||||
| 1 | ||||
| 3 | ||||
| 4 | ||||
| 6 | ||||
| 7 | ||||
| 8 | ||||
| 9 | ||||
| 11 | ||||
| 18 | ||||
Table of Contents
Aspen Managed Futures Strategy Fund | Manager Commentary | |
| October 31, 2011 (Unaudited) |
Management Discussion & Analysis
October 31, 2011
Market Conditions
The downgrade of U.S. sovereign debt(a) in August set the stage for a turbulent and volatile three-month period. Stocks lost considerable ground in August and September, as fears of a global debt contagion Europe caused considerable investor angst. The relief rally that followed in October, which saw markets gain nearly 11%, erased most of the losses, leaving stocks down approximately 3% for the three-month period. The commodity markets followed a similar path as stocks, as the correlation between raw materials and equities continued to increase.
Fixed income markets performed admirably in the third quarter, as the increasing volatility in stock indices drove investors to safe harbor investments. The Federal Reserve Bank’s announcement that they would keep longer-term rates low for at least the next few years buoyed the Treasury market. Operation Twist, which involves government buying of longer-term bonds in favor of short-term paper, allowed 20-30 year Treasuries to gain nearly 18%. Municipal bonds rose in the same timeframe. Short-term government notes posted small gains.
Performance Results
For the three-month period ending October 31, 2011, the Class I shares of the Aspen Managed Futures Strategy Fund was -5.80%. The Fund strives to give investors the return of the managed futures industry. Per its mandate, the Fund maintained very tight correlation to the Aspen Managed Futures Beta Index. The Aspen Managed Futures Beta Index uses a combination of trend and counter-trend algorithms to determine exposures to 23 futures markets. In following the Index, the fund can take long or short exposures to each of the eligible markets. A long position in a futures market will profit if the price of the futures contract rises, and a short position will profit if the price of the futures contract falls.
The Newedge CTA Index, a managed futures benchmark, was -4.30% in the same timeframe. Another benchmark, the BTOP 50 Index, was -2.61%. It is important to note that there are important differences between the fund and these indices in terms of construction. There were no significant changes to the fund strategy during this period.
Explanation of Fund Performance
From the inception of the fund on August 3 through the end of September, increasingly bearish market sentiment led the fund to adopt an increasingly strong risk adverse profile, consisting of short equities, long sovereign fixed income, short currencies (vs. the US dollar), and short industrial and agricultural commodities. Moreover, the portion of the portfolio allocated to the counter-trend strategy declined over this period, and was near zero by September month-end. Losses in the counter-trend portfolio, currency trends, and commodity trends (the latter asset class trend models were slower to adjust to the newly prevailing pessimism) were overcome by sizable gains in equity and fixed income trends. By the end of September, the portfolio had adopted strongly risk adverse positioning.
In the first two weeks of October, strong trend reversals in all asset classes caused the trend strategy to accrue sizable losses. The counter-trend strategy recorded gains in this period, but it represented a small portion of the portfolio. Fund NAV reached its nadir on October 14. By mid-month the trend strategy had substantially truncated (and in some cases reversed) exposures and the counter-trend strategy represented a much larger proportion of the overall portfolio. Consequently, the fund held a deleveraged and hedged portfolio over the second half of October, such that fund volatility was greatly reduced in the second half of the month.
For the entire August through October period, seven individual markets contributed positively to performance, fifteen contributed negatively, and one market did not contribute to performance. Cash equivalents in the portfolio contributed an almost negligible positive amount to performance, due to the low interest rate environment. The markets that contributed the largest gains were Canadian 10-Year Government Bonds, Swiss Francs, Corn, US 10-Year Treasury Notes, and Soybeans. The markets that contributed the largest losses were Australian Dollars, Silver, Canadian Dollars, the FTSE 100 Index of UK equities, and New Zealand Dollars.
The fund does not adopt a fixed volatility target, but rather increases exposure as the perception of opportunity for profit improves, or in periods where the fund’s role as a portfolio diversifier is likely to be most relevant (i.e., in periods distinguished by a systematically measurable high degree of exogenous macroeconomic risk). Because the months of August through October were characterized by an unusually high degree of politico-economic risk and financial volatility, the volatility of the fund was considerably higher than it is likely to be over an entire market cycle, with the annualized volatility of daily returns standing at just under 17% for the August 3 through October 31 period. For comparison, the volatility of the S&P 500 Index was around 36% for the same period—also substantially higher than the volatility that index will experience over an entire market cycle. Moreover, whereas the correlation of the fund to most traditional asset classes is expected to approach zero over the long run, the fund’s profile was substantially risk adverse for most of this period; for example, the correlation of daily returns between the fund and the S&P 500 index was -0.63 (where 1.00 represents perfect positive correlation and -1.00 represents perfect negative correlation).
Outlook
The situation in Europe continues to deteriorate. As rates on the continent’s sovereign debt continue to increase, it is increasingly difficult for the effected countries to making interest payments without issuing new debt. Europe remains the biggest threat to U.S. economic growth as well; we believe that if there is a systemic breakdown there, it will very likely propel the world into a global recession.
| Semi-Annual Report | October 31, 2011 | 1 |
Table of Contents
Aspen Managed Futures Strategy Fund | Manager Commentary | |
| October 31, 2011 (Unaudited) |
A portfolio designed to exploit the two most likely Europe scenarios - that the European Central Bank will buy the outstanding European debt (by printing euros) to drive rates lower (i.e., quantitative easing), or the elimination of several of the weaker EU member states - would include such positions as short euro, short euro stocks, long EU fixed income, long gold, long the U.S. dollar, etc. Many of these positions are difficult for retail investors to enter.
One way to get this basket of trades in one investment is to buy a trend-based managed futures mutual fund. Since these funds are able to exploit price trends in the marketplace, many of the positions mentioned above are likely represented in their portfolios.
| (a) | Bonds issued by a national government in a foreign currency, in order to finance the issuing country’s growth. Sovereign debt is generally a riskier investment when it comes from a developing country, and a safer investment when it comes from a developed country. |
| Performance as of October 31, 2011 | Portfolio Composition as of October 31, 2011 As a percentage of Net Assets | |||||||||||
| Aspen Managed Futures Strategy Fund | 1 month | Since Inception* |
| |||||||||
Aspen Managed Futures Strategy Fund - Class A (NAV) 1 | -7.02% | -5.90% | ||||||||||
Aspen Managed Futures Strategy Fund - Class A (MOP)2 | -12.14% | -11.06% | ||||||||||
Aspen Managed Futures Strategy Fund - Class I | -6.92% | -5.80% | ||||||||||
Aspen Managed Futures Beta Index | -6.69% | -5.35% | ||||||||||
1 Net Asset Value (NAV) is the share price without sales charges. |
| |||||||||||
2 Maximum Offering Price (MOP) includes sales charges. Class A returns include effects of the Fund’s maximum sales charge of 5.50%. |
| |||||||||||
Performance data quoted represents past performance. Past performance does not guarantee future results. Investment return and principal value of an investment will fluctuate so that an investor’s shares, when sold or redeemed, may be worth more or less than the original cost. Current performance data may be higher or lower than actual data quoted. For the most current month-end performance data please call 1-855-845-9444. |
| |||||||||||
* Fund Inception date of August 2, 2011. |
| |||||||||||
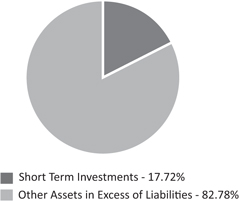
Performance of $10,000 Initial Investment (as of October 31, 2011)
Comparison of change in value of a $10,000 investment (includes applicable sales loads)
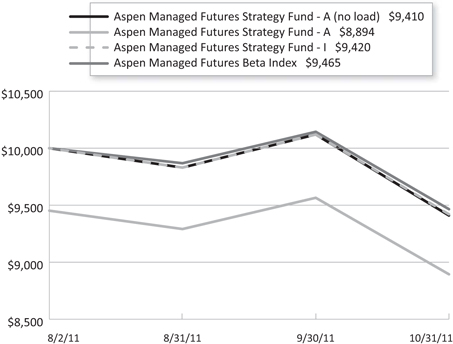
The chart represents historical performance of a hypothetical investment of $10,000 in the Fund since inception. Past performance does not guarantee future results. This chart does not reflect the deduction of taxes that a shareholder would pay on Fund distributions or the redemption of Fund shares.
The Aspen Managed Futures Beta Index is not actively managed and does not reflect any deduction for fees, expenses or taxes. It is not possible to invest directly in an index.
| 2 | www.aspenfuturesfund.com |
Table of Contents
| Aspen Managed Futures Strategy Fund | Consolidated Disclosure of Fund Expenses | |
| October 31, 2011 (Unaudited) |
As a shareholder of a Fund, you incur two types of costs: direct costs, such as wire fees, low balance fees, and redemption fees, and indirect costs, including management fees, and other fund operating expenses. This example is intended to help you understand your indirect costs, also referred to as “ongoing costs” (in dollars), of investing in the Fund and to compare these costs with the ongoing costs of investing in other mutual funds.
This example is based on an investment of $1,000 invested at the beginning of the period and held for the entire six-month period of May 1, 2011 through October 31, 2011.
Actual Expenses The first line of the table below provides information about actual account values and actual expenses. You may use the information in this line, together with the amount you invested at the beginning of the period, to estimate the expenses that you paid over the period. Simply divide your account value by $1,000 (for example, an $8,600 account value divided by $1,000 = 8.6), then multiply the result by the number in the first line under the heading “Expenses Paid During Period” to estimate the expenses you paid on your account during this period.
Hypothetical Example for Comparison Purposes The second line of the table provides information about hypothetical account values and hypothetical expenses based on the Fund’s actual expense ratio and an assumed rate of return of 5% per year before expenses, which is not the Fund’s actual return. The hypothetical account values and expenses may not be used to estimate the actual ending account balance or expenses you paid for the period. You may use this information to compare ongoing costs of investing in the Fund and other funds. To do so, compare this 5% hypothetical example with the 5% hypothetical examples that appear in the shareholder reports of other funds.
Please note that the expenses shown in the table are meant to highlight your ongoing costs only and do not reflect any direct costs, such as wire fees or low balance fees. Therefore, the second line of the table is useful in comparing ongoing costs only and will not help you determine the relative total costs of owning different funds. In addition, if these direct costs were included, your costs would be higher.
| Beginning Account Value 5/1/11 | Ending Account Value 10/31/11 | Expense Ratio(a) | Expenses Paid During period 5/1/11 - 10/31/11(b) | |||||||||||||||||
Class A(c) | ||||||||||||||||||||
Actual | $ | 1,000.00 | $ | 941.00 | 1.80 | % | $ | 4.25 | ||||||||||||
Hypothetical (5% return before expenses) | $ | 1,000.00 | $ | 1,016.09 | 1.80 | % | $ | 9.12 | ||||||||||||
Class I(c) | ||||||||||||||||||||
Actual | $ | 1,000.00 | $ | 942.00 | 1.55 | % | $ | 3.66 | ||||||||||||
Hypothetical (5% return before expenses) | $ | 1,000.00 | $ | 1,017.34 | 1.55 | % | $ | 7.86 | ||||||||||||
| (a) | The Fund’s expense ratios have been annualized based on the period from Fund’s inception date of August 2, 2011 through October 31, 2011. |
| (b) | Expenses are equal to the Fund’s annualized expense ratio, multiplied by the average account value over the period, multiplied by the number of days in the most recent fiscal half-year (184)/366. |
| (c) | The Aspen Managed Futures Strategy Fund began operations on August 2, 2011. |
| Semi-Annual Report | October 31, 2011 | 3 |
Table of Contents
Aspen Managed Futures Strategy Fund | Consolidated Schedule of Investments | |
| October 31, 2011 (Unaudited) |
| 7-Day Yield | Shares | Value (Note 2) | ||||||||||||
SHORT TERM INVESTMENTS (17.22%) | ||||||||||||||
MONEY MARKET FUND (17.22%) | ||||||||||||||
Dreyfus Treasury & Agency Cash Management Fund - Institutional Shares | 0.010% | 4,202,838 | $ | 4,202,838 | ||||||||||
HighMark 100% U.S. Treasury Money Market Fund | 0.000% | 4,202,838 | 4,202,838 | |||||||||||
|
| |||||||||||||
| 8,405,676 | ||||||||||||||
|
| |||||||||||||
TOTAL SHORT TERM INVESTMENTS (Cost $8,405,676) | 8,405,676 | |||||||||||||
|
| |||||||||||||
TOTAL INVESTMENTS (17.22%) (Cost $8,405,676) | $ | 8,405,676 | ||||||||||||
Other Assets In Excess Of Liabilities (82.78%) | 40,402,022 | (a) | ||||||||||||
|
| |||||||||||||
NET ASSETS (100.00%) | $ | 48,807,698 | ||||||||||||
|
| |||||||||||||
| (a) | Includes cash which is being held as collateral for futures contracts. |
Percentages are stated as a percent of net assets.
FUTURES CONTRACTS
At October 31, 2011, the Fund had outstanding futures contracts:
| Description | Position | Contracts | Expiration Date | Value (Note 2) | Unrealized Appreciation | |||||||||
Australian Dollar Future | Long | 98 | 12/20/11 | $10,320,380 | $271,315 | |||||||||
Canadian 10 Year Bond Future | Long | 50 | 12/20/11 | 6,586,907 | 18,775 | |||||||||
E-mini S&P 500® Future | Long | 15 | 12/17/11 | 936,975 | 27,853 | |||||||||
Gold 100 Oz Future | Long | 5 | 12/29/11 | 862,600 | 17,463 | |||||||||
Heating Oil Future | Long | 11 | 12/01/11 | 1,412,935 | 13,486 | |||||||||
Japanese Yen Currency Future | Short | 2 | 12/20/11 | (320,525) | 9,993 | |||||||||
New Zealand Dollar Future | Long | 96 | 12/20/11 | 7,769,280 | 163,352 | |||||||||
Soybean Future | Short | 15 | 01/14/12 | (912,938) | 11,480 | |||||||||
Sugar No. 11 (World) Future | Short | 30 | 03/01/12 | (865,872) | 12,935 | |||||||||
U.S. 10-Year Treasury Notes Future | Long | 50 | 12/21/11 | 6,453,125 | 21,433 | |||||||||
WTI Crude Future | Long | 10 | 11/19/11 | 931,900 | 36,845 | |||||||||
|
| |||||||||||||
| $33,174,767 | $604,930 | |||||||||||||
|
| |||||||||||||
| 4 | www.aspenfuturesfund.com |
Table of Contents
| Aspen Managed Futures Strategy Fund | Consolidated Schedule of Investments | |
| October 31, 2011 (Unaudited) |
| Description | Position | Contracts | Expiration Date | Value (Note 2) | Unrealized Depreciation | |||||||||
Canadian Dollar Future | Short | 25 | 12/21/11 | $(2,512,500) | $(51,411) | |||||||||
Copper Future | Short | 11 | 12/29/11 | (998,800) | (92,151) | |||||||||
Corn Future | Short | 14 | 12/15/11 | (452,900) | (12,541) | |||||||||
Euro FX Currency Future | Short | 14 | 12/20/11 | (2,436,000) | (22,913) | |||||||||
Euro STOXX 50 Index Future | Short | 28 | 12/17/11 | (925,197) | (38,111) | |||||||||
Euro-Bund Future | Long | 34 | 12/09/11 | 6,373,295 | (19,934) | |||||||||
FTSE 100 Index Future | Short | 10 | 12/17/11 | (890,534) | (29,601) | |||||||||
Long Gilt Future | Long | 16 | 12/29/11 | 3,301,722 | (8,064) | |||||||||
Nikkei 225 Index Future | Short | 42 | 12/09/11 | (1,866,900) | (39,971) | |||||||||
Silver Future | Short | 3 | 12/29/11 | (515,310) | (48,560) | |||||||||
Swiss Franc Currency Future | Short | 54 | 12/20/11 | (7,735,500) | (166,020) | |||||||||
|
| |||||||||||||
| $(8,658,624) | $(529,277) | |||||||||||||
|
| |||||||||||||
Common Abbreviations:
FTSE - Financial Times and the London Stock Exchange
FX - Foreign
No. - Number
Oz - Ounce
See Notes to Financial Statements.
| Semi-Annual Report | October 31, 2011 | 5 |
Table of Contents
| Aspen Managed Futures Strategy Fund | Consolidated Statement of Assets & Liabilities | |
| October 31, 2011 (Unaudited) |
ASSETS: | ||||
Investments, at value | $ | 8,405,676 | ||
Deposit with broker for futures contracts | 39,369,810 | |||
Foreign currency, at value (Cost $128,869) | 129,540 | |||
Receivable for shares sold | 798,530 | |||
Variation margin receivable | 75,653 | |||
Dividends and interest receivable | 28 | |||
Prepaid and other assets | 113,290 | |||
Total assets | 48,892,527 | |||
LIABILITIES: | ||||
Payable to advisor | 9,820 | |||
Payable for administration fees | 35,440 | |||
Payable for distribution and service fees Class A | 1,713 | |||
Payable for transfer agency fees | 5,810 | |||
Payable to trustees | 2,980 | |||
Accrued expenses and other liabilities | 29,066 | |||
Total liabilities | 84,829 | |||
NET ASSETS | $ | 48,807,698 | ||
NET ASSETS CONSIST OF: | ||||
Paid-in capital | $ | 50,992,737 | ||
Undistributed net investment loss | (115,798) | |||
Accumulated net realized loss on futures contracts and foreign currency transactions | (2,145,565) | |||
Net unrealized appreciation on futures contracts and translation of assets and liabilities in foreign currencies | 76,324 | |||
NET ASSETS | $ | 48,807,698 | ||
INVESTMENTS, AT COST | $ | 8,405,676 | ||
PRICING OF SHARES: | ||||
Class A: | ||||
Net Asset Value, offering and redemption price per share | $ | 9.41 | ||
Net Assets | $ | 5,024,001 | ||
Shares of beneficial interest outstanding | 533,663 | |||
Maximum offering price per share (NAV/0.9450), based on maximum sales charge of 5.50% of the offering price | $ | 9.96 | ||
Class I: | ||||
Net Asset Value, offering and redemption price per share | $ | 9.42 | ||
Net Assets | $ | 43,783,697 | ||
Shares of beneficial interest outstanding | 4,649,748 | |||
See Notes to Financial Statements.
| 6 | www.aspenfuturesfund.com |
Table of Contents
| Aspen Managed Futures Strategy Fund | Consolidated Statement of Operations | |
| October 31, 2011 (Unaudited) |
INVESTMENT INCOME: | ||||
Interest | $435 | |||
Total Investment Income | 435 | |||
EXPENSES: | ||||
Investment advisory fees | 53,494 | |||
Administrative fees | 50,940 | |||
Distribution and service fees Class A | 5,681 | |||
Transfer agency fees | 8,201 | |||
Legal and audit fees | 18,986 | |||
Offering cost | 24,662 | |||
Custodian fees | 4,252 | |||
Trustees’ fees and expenses | 2,980 | |||
Other | 6,208 | |||
Total expenses before waiver/reimbursement | 175,404 | |||
Less fees waived/reimbursed by investment advisor (Note 5) | ||||
Class A | (20,992) | |||
Class I | (38,179) | |||
Total Net Expenses | 116,233 | |||
NET INVESTMENT LOSS | (115,798) | |||
Net realized loss on futures contracts | (2,139,757) | |||
Net realized loss on foreign currency transactions | (5,808) | |||
Net change in unrealized appreciation on futures contracts | 75,653 | |||
Net change in unrealized appreciation on translation of assets and liabilities denominated in foreign currency transactions | 671 | |||
NET REALIZED AND UNREALIZED LOSS ON INVESTMENTS | (2,069,241) | |||
NET DECREASE IN NET ASSETS RESULTING FROM OPERATIONS | $ (2,185,039) | |||
See Notes to Financial Statements.
| Semi-Annual Report | October 31, 2011 | 7 |
Table of Contents
| Aspen Managed Futures Strategy Fund | Consolidated Statement of Changes in Net Assets | |
For the Period August 2, 2011 (Inception) to October 31, 2011 (Unaudited) | ||||
OPERATIONS: | ||||
Net investment loss | $ | (115,798) | ||
Net realized loss on futures contracts and foreign currency transactions | (2,145,565) | |||
Net change in unrealized appreciation on futures contracts and foreign currency translations | 76,324 | |||
Net decrease in net assets resulting from operations | (2,185,039) | |||
DISTRIBUTIONS TO SHAREHOLDERS (Note 2): | ||||
Class A | ||||
From net investment income | – | |||
From net realized gains on investments | – | |||
Class I | ||||
From net investment income | – | |||
From net realized gains on investments | – | |||
Total distributions | – | |||
SHARE TRANSACTIONS (Note 4): | ||||
Class A | ||||
Proceeds from sales of shares | 10,660,670 | |||
Cost of shares redeemed, net of redemption fees | (5,000,340) | |||
Class I | ||||
Proceeds from sales of shares | 51,056,921 | |||
Cost of shares redeemed, net of redemption fees | (5,724,514) | |||
Net increase from share transactions | 50,992,737 | |||
Net increase in net assets | 48,807,698 | |||
NET ASSETS: | ||||
Beginning of period | – | |||
End of period* | $ | 48,807,698 | ||
*Includes undistributed net investment loss of: | $ | (115,798) | ||
Other Information: | ||||
SHARE TRANSACTIONS: | ||||
Class A | ||||
Sold | 1,066,748 | |||
Redeemed | (533,085) | |||
Net increase in shares outstanding | 533,663 | |||
Class I | ||||
Sold | 5,259,730 | |||
Redeemed | (609,982) | |||
Net increase in shares outstanding | 4,649,748 | |||
See Notes to Financial Statements.
| 8 | www.aspenfuturesfund.com |
Table of Contents
| Aspen Managed Futures Strategy Fund – Class A | Consolidated Financial Highlights | |
| For a share outstanding throughout the period presented. |
For the Period August 2, 2011 (Inception) to October 31, 2011 (Unaudited) | ||||
NET ASSET VALUE, BEGINNING OF PERIOD | $ | 10.00 | ||
INCOME/(LOSS) FROM OPERATIONS: | ||||
Net investment loss(a) | (0.04) | |||
Net realized and unrealized loss on investments | (0.55) | |||
Total from investment operations | (0.59) | |||
LESS DISTRIBUTIONS: | ||||
From net investment income | – | |||
Distributions from net realized gain on investments | – | |||
Total distributions | – | |||
REDEMPTION FEES ADDED TO PAID IN CAPITAL (NOTE 4) | – | |||
DECREASE IN NET ASSET VALUE | (0.59) | |||
NET ASSET VALUE, END OF PERIOD | $ | 9.41 | ||
TOTAL RETURN(b) | (5.90%) | (c) | ||
RATIOS AND SUPPLEMENTAL DATA: | ||||
Net assets, end of period (000’s) | $ | 5,024 | ||
RATIOS TO AVERAGE NET ASSETS: | ||||
Operating expenses including fee waivers/reimbursements | 1.80% | (d) | ||
Operating expenses excluding fee waivers/reimbursements | 2.72% | (d) | ||
Net investment loss including fee waivers/reimbursements | (1.79%) | (d) | ||
PORTFOLIO TURNOVER RATE | 0% | (c) | ||
| (a) | Per share numbers have been calculated using the average shares method. |
| (b) | Total return does not reflect the effect of sales charges. |
| (c) | Not annualized. |
| (d) | Annualized. |
See Notes to Financial Statements.
| Semi-Annual Report | October 31, 2011 | 9 |
Table of Contents
| Aspen Managed Futures Strategy Fund – Class I | Consolidated Financial Highlights | |
| For a share outstanding throughout the period presented. |
For the Period August 2, 2011 (Inception) to October 31, 2011 (Unaudited) | ||||
NET ASSET VALUE, BEGINNING OF PERIOD | $ | 10.00 | ||
INCOME/(LOSS) FROM OPERATIONS: | ||||
Net investment loss(a) | (0.04) | |||
Net realized and unrealized loss on investments | (0.54) | |||
Total from investment operations | (0.58) | |||
LESS DISTRIBUTIONS: | ||||
From net investment income | – | |||
Distributions from net realized gain on investments | – | |||
Total distributions | – | |||
REDEMPTION FEES ADDED TO PAID IN CAPITAL (NOTE 4) | 0.00 | (b) | ||
DECREASE IN NET ASSET VALUE | (0.58) | |||
NET ASSET VALUE, END OF PERIOD | $ | 9.42 | ||
TOTAL RETURN | (5.80%) | (c) | ||
RATIOS AND SUPPLEMENTAL DATA: | ||||
Net assets, end of period (000’s) | $ | 43,784 | ||
RATIOS TO AVERAGE NET ASSETS: | ||||
Operating expenses including fee waivers/reimbursements | 1.55% | (d) | ||
Operating expenses excluding fee waivers/reimbursements | 2.34% | (d) | ||
Net investment loss including fee waivers/reimbursements | (1.54%) | (d) | ||
PORTFOLIO TURNOVER RATE | 0% | (c) | ||
| (a) | Per share numbers have been calculated using the average shares method. |
| (b) | Less than $0.005 per share. |
| (c) | Not annualized. |
| (d) | Annualized. |
See Notes to Financial Statements.
| 10 | www.aspenfuturesfund.com |
Table of Contents
| Aspen Managed Futures Strategy Fund | Notes to Financial Statements | |
| October 31, 2011 (Unaudited) |
1. ORGANIZATION
Financial Investors Trust (the “Trust”) a Delaware statutory trust, is an open-end management investment company registered under the Investment Company Act of 1940, as amended (“1940 Act”). As of October 31, 2011, the Trust had fifteen registered funds. This semi-annual report describes the Aspen Managed Futures Strategy Fund ( the “Fund”). The Fund seeks investment results that replicate as closely as possible, before fees and expenses, the price and yield performance of the Aspen Managed Futures Beta Index (the “MFBI” or “Index”).
Basis of Consolidation for the Aspen Futures Fund, Ltd.
Aspen Futures Fund, Ltd. (the “Subsidiary”) a Cayman Islands exempted company is a wholly owned subsidiary of the Aspen Futures Fund, Ltd. The Subsidiary acts as an investment vehicle for the Fund in order to effect certain commodity-related investments on behalf of the Fund. The Fund is the sole shareholder of the Subsidiary pursuant to a subscription agreement dated as of August 2, 2011, and it is intended that the Fund will remain the sole shareholder and will continue to control the Subsidiary. Under the Articles of Association of the Subsidiary, shares issued by the Subsidiary confer upon a shareholder the right to vote at general meetings of the Subsidiary and certain rights in connection with any winding-up or repayment of capital, as well as the right to participate in the profits or assets of the Subsidiary. The Fund may invest up to 25% of its total assets in shares of the Subsidiary. As a wholly owned subsidiary of the Aspen Managed Futures Strategy Fund, all assets and liabilities, income and expenses of the Subsidiary are consolidated in the financial statements and financial highlights of the Fund. All investments held by the Subsidiary are disclosed in the accounts of the Aspen Managed Futures Strategy Fund.
The Subsidiary prices its portfolio investments pursuant to the same pricing and valuation methodologies and procedures used by the Fund, which require, among other things, that each of the Subsidiary’s portfolio investments be marked-to-market (that is, the value on the Subsidiary’s books changes) each business day to reflect changes in the market value of each investment. The value of shares of the Subsidiary fluctuates with the value of the Subsidiary’s portfolio investments.
2. SIGNIFICANT ACCOUNTING POLICIES
The following is a summary of significant accounting policies consistently followed by the Fund. These policies are in conformity with U.S. generally accepted accounting principles, (“GAAP”).
The preparation of financial reporting in accordance with GAAP requires management to make certain estimates and assumptions that affect the reported amounts and disclosures in the financial statements during the reporting period. Management believes the estimates and security valuations are appropriate; however, actual results may differ from those estimates, and the security valuations reflected in the financial statements may differ from the value the Fund ultimately realizes upon sale of the securities. The financial statements have been prepared as of the close of the New York Stock Exchange (“NYSE”) on October 31, 2011.
Investment Valuation: The Fund generally values its securities based on market prices determined at the close of regular trading on the New York Stock Exchange (“NYSE”), normally 4:00 p.m. Eastern Time, on each day the NYSE is open for trading. A Fund’s net asset value (“NAV”) is computed by dividing the value of all assets of the Fund (including accrued interest and dividends), less all liabilities (including accrued expenses and dividends declared but unpaid), by the total number of shares outstanding.
For equity securities that are traded on an exchange, the market price is usually the closing sale or official closing price on that exchange. In the case of equity securities not traded on an exchange, or if such closing prices are not otherwise available, the market price is typically determined by independent third party pricing vendors approved by the Board of Trustees (the “Board”) using a variety of pricing techniques and methodologies. The market price for debt obligations is generally the price supplied by an independent third-party pricing service approved by the Board, which may use a matrix, formula or other objective method that takes into consideration market indices, yield curves and other specific adjustments. Short-term debt obligations that will mature in 60 days or less are valued at amortized cost, unless it is determined that using this method would not reflect an investment’s fair value. If vendors are unable to supply a price, or if the price supplied is deemed to be unreliable, the market price may be determined using quotations received from one or more brokers-dealers that make a market in the security.
Futures and swap contracts that are listed or traded on a national securities exchange, commodities exchange, contract market or comparable over-the-counter market, and that are freely transferable, are valued at their closing settlement price on the exchange on which they are primarily traded or based upon the current settlement price for a like instrument acquired on the day on which the instrument is being valued. A settlement price may not be used if the market makes a limit move with respect to a particular commodity. Over the-counter futures and swap contracts for which market quotations are readily available are valued based on quotes received from independent pricing services or one or more dealers that make markets in such securities.
The Funds will use a fair valuation model provided by an independent pricing service, which is intended to reflect fair value when a security’s value or a meaningful portion of the Fund’s portfolio is believed to have been materially affected by a valuation event that has occurred between the close of the exchange or market on which the security is traded and the close of the regular trading day on the NYSE. The Funds’ valuation
| Semi-Annual Report | October 31, 2011 | 11 |
Table of Contents
| Aspen Managed Futures Strategy Fund | Notes to Financial Statements | |
| October 31, 2011 (Unaudited) |
procedures set forth certain triggers which instruct when to use the fair valuation model. The value assigned to a security by the fair valuation model is a determination of fair value made under the Funds’ valuation procedures and under the supervision of the Board of Trustees. In such a case, a Fund’s value for a security may be different from the last sales price (or the latest closing price) and there is no guarantee that a fair valued security will be sold at the price at which a Fund is valuing the security.
Forward currency exchange contracts have a market value determined by the prevailing foreign currency exchange daily rates and current foreign currency exchange forward rates. The foreign currency exchange forward rates are calculated using an automated system that estimates rates on the basis of the current day foreign currency exchange rates and forward foreign currency exchange rates supplied by a pricing service. Foreign exchange rates and forward foreign currency exchange rates may generally be obtained at the close of the NYSE, normally 4:00 p.m. Eastern Time.
Redeemable securities issued by open-end registered investment companies are valued at the investment company’s or subsidiary’s applicable net asset value, with the exception of exchange-traded open-end investment companies, which are priced as equity securities.
Investment securities that are primarily traded on foreign securities exchanges are valued at the preceding closing values of such securities on their respective exchanges, except when an occurrence subsequent to the time a value was so established is likely to have changed such value. In such an event, the fair value of those securities are determined in good faith through consideration of other factors in accordance with procedures established by and under the general supervision of the Board of Trustees.
When such prices or quotations are not available, or when the Fair Value Committee appointed by the Board believes that they are unreliable, securities may be priced using fair value procedures approved by the Board. The Fund may also use fair value procedures if the Fair Value Committee determines that a significant event has occurred between the time at which a market price is determined and the time at which a Fund’s NAV is calculated. In particular, the value of non-U.S. securities may be materially affected by events occurring after the close of the foreign exchange on which they are traded, but before a Fund prices its shares.
Investment Transactions: Investment and shareholder transactions are accounted for on the date the investments are purchased or sold (trade date). Realized gains and losses from investment transactions are reported on an identified cost basis. Interest income, which includes accretion of discounts, is accrued and recorded as earned. Dividend income is recognized on the ex-dividend date or for certain foreign securities, as soon as information is available to the Fund.
Foreign Securities: The Fund may directly purchase securities of foreign issuers. Investing in securities of foreign issuers involves special risks not typically associated with investing in securities of U.S. issuers. The risks include possible reevaluation of currencies, the inability to repatriate foreign currency, less complete financial information about companies and possible future adverse political and economic developments. Moreover, securities of many foreign issuers and their markets may be less liquid and their prices more volatile than those of securities of comparable U.S. issuers.
Foreign Currency Translation: The books and records of the Fund is maintained in U.S. dollars. Investment valuations and other assets and liabilities initially expressed in foreign currencies are converted each business day into U.S. dollars based upon current exchange rates. Prevailing foreign exchange rates may generally be obtained at the close of the NYSE (normally, 4:00 p.m. Eastern time). The portion of realized and unrealized gains or losses on investments due to fluctuations in foreign currency exchange rates is not separately disclosed and is included in realized and unrealized gains or losses on investments, when applicable.
Foreign Currency Spot Contracts: The Fund may enter into foreign currency spot contracts to facilitate transactions in foreign securities or to convert foreign currency receipts into U.S. dollars. A foreign currency spot contract is an agreement between two parties to buy and sell currencies at the current market rate, for settlement generally within two business days. The U.S. dollar value of the contracts is determined using current currency exchange rates supplied by a pricing service. The contract is marked-to-market daily for settlements beyond one day and any change in market value is recorded as an unrealized gain or loss. When the contract is closed, the Fund records a realized gain or loss equal to the difference between the value on the open and close date. Losses may arise from changes in the value of the foreign currency, or if the counterparties do not perform under the contract’s terms. The maximum potential loss from such contracts is the aggregate face value in U.S. dollars at the time the contract was opened.
Fair Value Measurements: The Fund discloses the classification of its fair value measurements following a three-tier hierarchy based on the inputs used to measure fair value. Inputs refer broadly to the assumptions that market participants would use in pricing the asset or liability, including assumptions about risk. Inputs may be observable or unobservable. Observable inputs reflect the assumptions market participants would use in pricing the asset or liability that are developed based on market data obtained from sources independent of the reporting entity. Unobservable inputs reflect the reporting entity’s own assumptions about the assumptions market participants would use in pricing the asset or liability that are developed based on the best information available.
| 12 | www.aspenfuturesfund.com |
Table of Contents
| Aspen Managed Futures Strategy Fund | Notes to Financial Statements | |
| October 31, 2011 (Unaudited) |
Various inputs are used in determining the value of the Fund’s investments as of the end of the reporting period. When inputs used fall into different levels of the fair value hierarchy, the level in the hierarchy within which the fair value measurement falls is determined based on the lowest level input that is significant to the fair value measurement in its entirety. The designated input levels are not necessarily an indication of the risk or liquidity associated with these investments. These inputs are categorized in the following hierarchy under applicable financial accounting standards:
Level 1 – | Unadjusted quoted prices in active markets for identical investments, unrestricted assets or liabilities that a Fund has the ability to access at the measurement date; | |
Level 2 – | Quoted prices which are not active, quoted prices for similar assets or liabilities in active markets or inputs other than quoted prices that are observable (either directly or indirectly) for substantially the full term of the asset or liability; and | |
Level 3 – | Significant unobservable prices or inputs (including the Fund’s own assumptions in determining the fair value of investments) where there is little or no market activity for the asset or liability at the measurement date. | |
The following is a summary of each input used to value the Fund as of October 31, 2011:
Aspen Managed Futures Strategy Fund
| Investments in Securities at Value* | Level 1 - Quoted Prices | Level 2 - Other Significant Observable Inputs | Level 3 - Significant Unobservable Inputs | Total | ||||||||||||
Short Term Investments | $ | 8,405,676 | $ | – | $ | – | $ | 8,405,676 | ||||||||
TOTAL | $ | 8,405,676 | $ | – | $ | – | $ | 8,405,676 | ||||||||
Other Financial Instruments | ||||||||||||||||
Assets: | ||||||||||||||||
Futures Contracts(a) | $ | 604,930 | $ | – | $ | – | $ | 604,930 | ||||||||
Liabilities: | ||||||||||||||||
Futures Contracts(a) | (529,277) | – | – | (529,277) | ||||||||||||
TOTAL | $ | 75,653 | $ | – | $ | – | $ | 75,653 | ||||||||
| * | For detailed descriptions of country, sector and industry, see the accompanying Statement of Investments. |
| (a) | Only current day’s variation margin is reported within the Statement of Assets and Liabilities. The variation margin is included in the open futures cummulative appreciation of $75,653. |
For the period ended October 31, 2011, the Fund did not have any significant transfers between Level 1 and Level 2 securities.
Risk Exposure and the Use of Derivative Instruments:
The Fund may use derivatives (including futures and forwards) to pursue its investment objective. The Fund’s use of derivative instruments involves risks different from, or possibly greater than, the risks associated with investing directly in securities and other traditional investments. These risks include (i) the risk that the counterparty to a derivative transaction may not fulfill its contractual obligations, (ii) risk of mispricing or improper valuation, and (iii) the risk that changes in the value of the derivative may not correlate perfectly with the underlying asset, rate or index. These risks could cause the Fund to lose more than the principal amount invested. In addition, investments in derivatives involve leverage, which means a small percentage of assets invested in derivatives can have a disproportionately large impact on the Fund.
Risk of Investing in Derivatives: The Fund’s use of derivatives can result in losses due to unanticipated changes in the market risk factors and the overall market. In instances where the Fund is using derivatives to decrease, or hedge, exposures to market risk factors for securities held by the Fund, there are also risks that those derivatives may not perform as expected resulting in losses for the combined or hedged positions. Derivatives may have little or no initial cash investment relative to their market value exposure and therefore can produce significant gains or losses in excess of their cost. This use of embedded leverage allows the Fund to increase its market value exposure relative to it net assets and can substantially increase the volatility of the Funds’ performance.
In addition, use of derivatives may increase or decrease exposure to the following risk factors:
| • | Equity Risk: Equity risk relates to the change in value of equity securities as they relate to increases or decreases in the general market. |
| • | Fixed Income Risk: When the Fund invests in fixed-income securities or derivatives, the value of your investment in the Fund will fluctuate with changes in interest rates. Typically, a rise in interest rates causes a decline in the value of fixed-income |
| Semi-Annual Report | October 31, 2011 | 13 |
Table of Contents
| Aspen Managed Futures Strategy Fund | Notes to Financial Statements | |
| October 31, 2011 (Unaudited) |
securities or derivatives owned by the Fund. In general, the market price of debt securities with longer maturities will increase or decrease more in response to changes in interest rates than shorter-term securities. Other risk factors include credit risk (the debtor may default) and prepayment risk (the debtor may pay its obligation early, reducing the amount of interest payments). |
| • | Foreign Currency Risk: Currency trading involves significant risks, including market risk, interest rate risk, country risk, counterparty credit risk and short sale risk. Market risk results from the price movement of foreign currency values in response to shifting market supply and demand. Interest rate risk arises whenever a country changes its stated interest rate target associated with its currency. Country risk arises because virtually every country has interfered with international transactions in its currency. |
| • | Commodity Risk: Exposure to the commodities markets may subject the Fund to greater volatility than investments in traditional securities. Commodity prices are influenced by unfavorable weather, animal and plant disease, geologic and environmental factors, as well as changes in government regulation such as tariffs, embargoes or burdensome production rules and restrictions. |
Futures: The Fund invests in futures contracts in accordance with the investment objectives. The Fund does so for a variety of reasons including for cash management, hedging or non-hedging purposes in an attempt to achieve investment returns consistent with the Fund’s investment objective. A futures contract provides for the future sale by one party and purchase by another party of a specified quantity of the security or other financial instrument at a specified price and time. A futures contract on an index is an agreement pursuant to which two parties agree to take or make delivery of an amount of cash equal to the difference between the value of the index at the close of the last trading day of the contract and the price at which the index contract was originally written. Futures transactions may result in losses in excess of the amount invested in the futures contract. There can be no guarantee that there will be a correlation between price movements in the hedging vehicle and in the portfolio securities being hedged. An incorrect correlation could result in a loss on both the hedged securities in a fund and the hedging vehicle so that the portfolio return might have been greater had hedging not been attempted. There can be no assurance that a liquid market will exist at a time when a fund seeks to close out a futures contract or a futures option position. Lack of a liquid market for any reason may prevent a fund from liquidating an unfavorable position, and the fund would remain obligated to meet margin requirements until the position is closed. In addition, a fund could be exposed to risk if the counterparties to the contracts are unable to meet the terms of their contracts. With exchange traded futures, there is minimal counterparty credit risk to the funds since futures are exchange traded and the exchange’s clearinghouse, as counterparty to all exchange traded futures, guarantees the futures against default. When a purchase or sale of a futures contract is made by a fund, the fund is required to deposit with its custodian (or broker, if legally permitted) a specified amount of liquid assets (“initial margin”). The margin required for a futures contract is set by the exchange on which the contract is traded and may be modified during the term of the contract. The initial margin is in the nature of a performance bond or good faith deposit on the futures contract that is returned to a fund upon termination of the contract, assuming all contractual obligations have been satisfied. Each day a fund may pay or receive cash, called “variation margin,” equal to the daily change in value of the futures contract. Such payments or receipts are recorded for financial statement purposes as unrealized gains or losses by a fund. Variation margin does not represent a borrowing or loan by a fund but is instead a settlement between a fund and the broker of the amount one would owe the other if the futures contract expired. When the contract is closed, a fund records a realized gain or loss equal to the difference between the value of the contract at the time it was opened and the value at the time it was closed.
Balance Sheet – Fair Value of Derivative Instruments as of October 31, 2011(a):
Derivatives not Aaccounted for as Hedging Instruments | Asset Derivatives Balance Sheet Location | Fair Value | Liabilities Derivatives Location | Fair Value | ||||||||||
Futures Contracts* | Variation Margin Receivable | $ | 75,653 | Variation Margin Payable | $ | — | ||||||||
|
|
|
| |||||||||||
|
| |||||||||||||
| $ | 75,653 | $ | — | |||||||||||
|
|
|
| |||||||||||
| *Risk Exposure to Fund | ||||||||||||||
Commodity Contracts | $ | (61,043) | ||||||||||||
Equity Contracts | (79,830) | |||||||||||||
Fixed Income Contracts | 12,210 | |||||||||||||
Foreign Currency Contacts | 204,316 | |||||||||||||
|
| |||||||||||||
| $ | 75,653 | |||||||||||||
|
| |||||||||||||
| (a) | For open derivative instruments as of October 31, 2011, see the Schedule of Investments, which is also indicative of the activity for the period ended October 31, 2011. |
| 14 | www.aspenfuturesfund.com |
Table of Contents
| Aspen Managed Futures Strategy Fund | Notes to Financial Statements | |
| October 31, 2011 (Unaudited) |
The Effect of Derivative Instruments on the Statement of Operations for the period ended October 31, 2011:
Derivatives not Accounted for as Hedging Instruments | Location Of Gains/(Loss) on Derivatives Recognized in Income | Realized Gain/(Loss) on Derivatives Recognized in Income | Changed in Unrealized Gain/(Loss) on Derivatives in Income | |||||||
Futures Contracts* | Net realized loss on futures contracts/Net change in unrealized appreciation on futures contracts | $ | (2,139,757) | $ | 75,653 | |||||
|
| |||||||||
| $ | (2,139,757) | $ | 75,653 | |||||||
|
| |||||||||
| *Risk Exposure to Fund | ||||||||||
Commodity Contracts | $ | (666,305) | $ | (61,043) | ||||||
Equity Contracts | (555,153) | (79,830) | ||||||||
Fixed Income Contracts | (9,503) | 12,210 | ||||||||
Foreign Currency Contacts | (908,796) | 204,316 | ||||||||
|
| |||||||||
| $ | (2,139,757) | $ | 75,653 | |||||||
|
| |||||||||
Forward Foreign Currency Transactions: The Fund may engage in currency transactions with counterparties to hedge the value of portfolio securities denominated in particular currencies against fluctuations in relative value, to gain or reduce exposure to certain currencies, or to generate income or gains. All commitments are marked to market daily at the applicable exchange rates and any resulting unrealized gains or losses are recorded in the Fund’s financial statements. The Fund records realized gains or losses at the time a forward contract is offset by entry into a closing transaction or extinguished by delivery of the currency. The Fund had no open forward foreign currency contracts at October 31, 2011.
Trust Expenses: Some expenses of the Trust can be directly attributed to a Fund. Expenses which cannot be directly attributed to the Fund are apportioned among all Funds in the Trust based on average net assets of each Fund.
Fund Expenses: Expenses that are specific to a Fund or class of shares of a Fund are charged directly to that Fund or share class. Expenses that are common to all Funds generally are allocated among the Funds in proportion to their average daily net assets.
For Funds offering multiple share classes, all of the realized and unrealized gains and losses and net investment income, other than class specific expenses, are allocated daily to each class in proportion to its average daily net assets. Fees provided under the distribution (Rule 12b-1) and/or shareholder service plans for a particular class of the Fund are charged to the operations of such class.
Federal Income Taxes: The Fund complies with the requirements under Subchapter M of the Internal Revenue Code applicable to regulated investment companies and intend to distribute substantially all of their net taxable income and net capital gains, if any, each year. The Fund is not subject to income taxes to the extent such distributions are made. As of and during the period ended October 31, 2011, the Fund did not have a liability for any unrecognized tax benefits in the accompanying financial statements. The Fund files income tax returns in the U.S. federal jurisdiction and Colorado.
Distributions to Shareholders: The Fund normally pays dividends and distributes capital gains, if any, on an annual basis. Income dividend distributions are derived from interest and other income the Fund receives from its investments, including distributions of short term capital gains. Capital gain distributions are derived from gains realized when each Fund sells a security it has owned for more than a year. The Fund may make additional distributions and dividends at other times if the portfolio manager believes doing so may be necessary for the Fund to avoid or reduce taxes. Net investment income/(loss) and net realized gain/(loss) may differ for financial statement and tax purposes. The character of distributions made during the year from net investment income or net realized gains may differ from its ultimate characterization for federal income tax purposes. Also, due to the timing of dividend distributions, the fiscal year in which amounts are distributed may differ from the fiscal year in which the income or realized gain were recorded by the Fund. During the period ended October 31, 2011, the Fund did not make any distributions.
| Semi-Annual Report | October 31, 2011 | 15 |
Table of Contents
| Aspen Managed Futures Strategy Fund | Notes to Financial Statements | |
| October 31, 2011 (Unaudited) |
Unrealized Appreciation and Depreciation on Investments: The differences between book-basis and tax-basis are primarily due to the deferral of post October losses and wash sale losses. As of October 31, 2011, the cost of securities on a tax basis and gross unrealized appreciation/(depreciation) on investments for federal income tax purposes were as follows:
Aspen Managed Futures Strategy Fund | ||||
Gross appreciation | ||||
(excess of value over tax cost) | $ | 0 | ||
Gross depreciation | ||||
(excess of tax cost over value) | 0 | |||
Net unrealized appreciation | 0 | |||
Cost of investments for income tax purposes | $ | 8,405,676 | ||
3. SECURITIES TRANSACTIONS
The cost of purchases and proceeds from sales of securities during the period ended October 31, 2011, were as follows:
| Aspen Managed Futures Strategy Fund | ||||
Purchases | $ | 0 | ||
Sales | $ | 0 | ||
4. SHARES OF BENEFICIAL INTEREST
The capitalization of the Trust consists of an unlimited number of shares of beneficial interest with no par value per share. Holders of the shares of the Fund of the Trust have one vote for each share held and a proportionate fraction of a vote for each fractional share. All shares issued and outstanding are fully paid and are non-assessable, transferable and redeemable at the option of the shareholder. Shares have no pre-emptive rights.
Shares redeemed within 30 days of purchase may incur a 2% short-term redemption fee deducted from the redemption amount. The Fund’s Class I shares received $1,079 in redemption fees during the period ended October 31, 2011, there were no redemption fees collected on Class A shares.
Beneficial Ownership: The beneficial ownership, either directly or indirectly, of more than 25% of the voting securities of any class a Fund creates a presumption of control of the Fund under Section 2(a)(9) of the 1940 Act. As of October 31, 2011, the following entities owned beneficially 25% or greater of the Fund’s outstanding shares. The shares are held under omnibus accounts (whereby the transactions of two or more shareholders are combined and carried in the name of the originating broker rather than designated separately).
| Class | Name | Percentage | ||
A | Nomura International, PLC | 87.50% | ||
I | Charles Schwab & Co. | 32.49% | ||
I | National Financial Services Corp. | 35.02% |
5. MANAGEMENT AND RELATED-PARTY TRANSACTIONS
Aspen Partners Ltd. (the “Adviser” or “Aspen”), subject to the authority of the Board, is responsible for the overall management and administration of the Fund’s business affairs. The Adviser manages the investments of the Fund in accordance with the Fund’s investment objective, policies and limitations and investment guidelines established jointly by the Adviser and the Trustees. Pursuant to the Advisory Agreement, (the “Advisory Agreement”), the Fund will pay the Adviser an annual management fee of 0.75%, based on the Fund’s average daily net assets. The management fee is paid on a monthly basis. The initial term of the Advisory Agreement is two years. The Board, shareholders of the Fund or the Adviser may terminate the Advisory Agreement upon sixty (60) days notice.
The Subsidiary has entered into a separate advisory agreement (the “Subsidiary Advisory Agreement”) with Aspen, the Subsidiary’s investment adviser and the Fund’s investment adviser, for the management of the Subsidiary’s portfolio pursuant to which the Subsidiary is obligated to pay the Adviser a management fee at the same rate that the Fund pays the Adviser for investment advisory services provided to the Fund. The Adviser has agreed to waive the advisory fee it receives from the Fund in an amount equal to the management fee pay by the Subsidiary. This waiver may not be terminated or modified without the consent of the Board of the Fund.
The initial term of the Advisory Agreement and the Subsidiary Advisory Agreement is two years and may be reapproved annually thereafter. The Board, shareholders of the Fund or the Adviser may terminate the Advisory Agreement and the Subsidiary Advisory Agreement upon sixty (60) days’ notice.
| 16 | www.aspenfuturesfund.com |
Table of Contents
| Aspen Managed Futures Strategy Fund | Notes to Financial Statements | |
| October 31, 2011 (Unaudited) |
The Adviser has agreed to waive and/or reimburse fees or expenses in order to limit total annual Fund operating expenses after fee waiver/expense reimbursements (excluding distribution and service (12b-1) fees, shareholder services fees, acquired fund fees and expenses, brokerage expenses, interest expenses, taxes and extraordinary expenses) to 1.55% of the Fund’s average daily net assets. This agreement is in effect through August 31, 2012. The Fund may have to repay some of these waivers and reimbursements to the Adviser in the following three years. This agreement may not be terminated or modified prior to this date except with the approval of the Fund’s Board of Trustees.
Pursuant to these agreements, the Fund will reimburse the Adviser for any fee waivers and expense reimbursements made by the Adviser, provided that any such reimbursements made by the Fund to the Adviser will not cause the Fund’s expense limitation to exceed expense limitations in existence at the time the expense was incurred, or at the time of the reimbursement, whichever is lower, and the reimbursement is made within three years after the expenses were incurred.
For the period ended October 31, 2011, the fee waivers and/ or reimbursements were as follows:
| Fund | Fees Waived/Reimbursed By Advisor | Recoupment of Past Waived Fees By Advisor | Total | ||||||
Aspen Managed Futures Strategy Fund - Class A | $20,992 | $0 | $20,992 | ||||||
Aspen Managed Futures Strategy Fund - Class I | 38,179 | 0 | 38,179 | ||||||
As of October 31, 2011, the balances of recoupable expenses for each Fund were as follows:
| Fund | 2011 | |||||
Aspen Managed Futures Strategy Fund - Class A | $ | 20,992 | ||||
Aspen Managed Futures Strategy Fund - Class I | 38,179 | |||||
Distributor: ALPS Distributors, Inc. (an affiliate of ALPS Fund Services, Inc.) (“ADI” or the “Distributor”) acts as the distributor of the Fund’s shares pursuant to a Distribution Agreement with the Trust. Shares are sold on a continuous basis by ADI as agent for the Fund, and ADI has agreed to use its best efforts to solicit orders for the sale of the Fund’s shares, although it is not obliged to sell any particular amount of shares. ADI is not entitled to any compensation for its services as Distributor. ADI is registered as a broker-dealer with the Securities and Exchange Commission.
The Fund has adopted a plan of distribution for Class A shares pursuant to Rule 12b-1 under the 1940 Act (the “Plan”). The Plan allows the Fund to use Class A assets to pay fees in connection with the distribution and marketing of Class A shares and/or the provision of shareholder services to Class A shareholders. The Plan permits payment for services in connection with the administration of plans or programs that use Class A shares as their funding medium and for related expenses. The Plan permits the Fund to use its Class A assets to make total payments at an annual rate of up to 0.25% of the Fund’s average daily net assets attributable to its Class A shares. The expenses of the plan are reflected as distribution and service fees in the Statement of Operations.
6. INDEMNIFICATIONS
Under the Trust’s organizational documents, its officers and Trustees are indemnified against certain liability arising out of the performance of their duties to the Trust. Additionally, in the normal course of business, the Trust enters into contracts with service providers that may contain general indemnification clauses. The Trust’s maximum exposure under these arrangements is unknown, as this would involve future claims that may be made against the Trust that have not yet occurred.
7. SUBSEQUENT EVENTS
Management has evaluated whether any events or transactions occurred subsequent to October 31, 2011 through the date of issuance of the Fund’s financial statements and determined that there were no other material events or transactions that would require recognition or disclosure in the Fund’s financial statements.
| Semi-Annual Report | October 31, 2011 | 17 |
Table of Contents
| Aspen Managed Futures Strategy Fund | Additional Information | |
| October 31, 2011 (Unaudited) |
1. FUND HOLDINGS
The Fund files its complete schedule of portfolio holdings with the Securities and Exchange Commission (the “SEC”) for the first and third quarters of each fiscal year on Form N-Q within 60 days after the end of the period. Copies of the Funds’ Form N-Q are available without charge on the SEC website at http://www.sec.gov. You may also review and copy the Form N-Q at the SEC’s Public Reference Room in Washington, DC. For more information about the operation of the Public Reference Room, please call the SEC at 1-800-SEC-0330.
2. FUND PROXY VOTING POLICIES, PROCEDURES AND SUMMARIES
The Funds policies and procedures used in determining how to vote proxies and information regarding how the Fund voted proxies relating to portfolio securities during the most recent prior 12-month period ending June 30 will be available without charge, (1) upon request, by calling 1-855-845-9444 and (2) on the SEC’s website at http://www.sec.gov.
3. DISCLOSURE REGARDING APPROVAL OF FUND ADVISORY AGREEMENT
On March 8, 2011, the Trustees met in person to discuss, among other things, the approval of the Investment Advisory Agreement between the Trust and Aspen (the “Advisory Agreement”) in accordance with Section 15(c) of the 1940 Act. The Independent Trustees met with independent legal counsel during executive session and discussed the Advisory Agreement and other related materials.
In approving the Advisory Agreement, the Trustees, including the Independent Trustees, considered the following factors with respect to the Aspen Fund:
Investment Advisory Fee Rate: The Trustees reviewed and considered the contractual annual advisory fee to be paid by the Trust, on behalf of the Fund, to Aspen of 0.75% of the Fund’s daily average net assets, in light of the extent and quality of the advisory services provided by Aspen to the Fund.
The Trustees considered the information they received comparing the Fund’s contractual advisory fees and overall expenses with those of funds in both the relevant expense group and universe of funds provided by Lipper, an independent provider of investment company data.
Based on such information, the Trustees further determined that the contractual annual advisory fees set forth above and the total expense ratio of 1.55% for the Fund, taking into account the contractual fee waivers in place, is comparable to others within the Fund’s anticipated peer universe.
Nature, Extent and Quality of the Services under the Aspen Fund Advisory Agreement: The Trustees received and considered information regarding the nature, extent and quality of services provided to the Fund under the Advisory Agreement. The Trustees reviewed certain background materials supplied by Aspen in its presentation, including its Form ADV.
The Trustees reviewed and considered Aspen’s investment advisory personnel, its history as an asset manager, its performance and the amount of assets currently under management by Aspen. The Trustees also reviewed the research and decision-making processes utilized by Aspen, including the methods adopted to seek to achieve compliance with the investment objectives, policies and restrictions of the Fund.
The Trustees considered the background and experience of Aspen’s management in connection with the Fund, including reviewing the qualifications, backgrounds and responsibilities of the management team primarily responsible for the day-to-day portfolio management of the Fund and the extent of the resources devoted to research and analysis of actual and potential investments.
The Trustees also reviewed, among other things, Aspen’s insider trading policies and procedures and its Code of Ethics.
Performance: The Trustees noted that since the Fund had not yet begun operations, there was no fund performance to be reviewed or analyzed at this time, but they noted the performance of the private accounts advised by Aspen. The Trustees considered Aspen’s performance and reputation generally and its investment techniques, risk management controls and decision-making processes, taking into account that such performance was not the actual performance of the Fund.
The Adviser’s Profitability: The Trustees received and considered a projected profitability analysis prepared by Aspen based on the fees payable under the Advisory Agreement. The Trustees considered the profits, if any, anticipated to be realized by Aspen in connection with the operation of the Fund. The Board then reviewed Aspen’s financial statements in order to analyze the financial condition and stability and profitability of the Adviser.
Economies of Scale: The Trustees considered whether economies of scale in the provision of services to the Fund will be passed along to the shareholders under the proposed agreements.
| 18 | www.aspenfuturesfund.com |
Table of Contents
| Aspen Managed Futures Strategy Fund | Additional Information | |
| October 31, 2011 (Unaudited) |
Other Benefits to the Adviser: The Trustees reviewed and considered any other benefits derived or to be derived by Aspen from its relationship with the Fund, including soft dollar arrangements.
In selecting Aspen as the Fund’s investment adviser and approving the Advisory Agreement and the fees charged under this agreement, the Trustees concluded that no single factor reviewed by the Trustees was identified by the Trustees to be determinative as the principal factor in whether to approve the Advisory Agreement. Further, the Independent Trustees were advised by separate independent legal counsel throughout the process. The Trustees, including all of the Independent Trustees, concluded that:
| • | the investment advisory fees to be received by Aspen with respect to the Fund were comparable to others with in the Fund’s peer universe; |
| • | the nature, extent and quality of services rendered by Aspen under the Advisory Agreement were adequate; |
| • | the profit, if any, anticipated to be realized by Aspen in connection with the operation of the Fund is fair to the Trust, especially in light of the fee waiver agreement between the Trust and Aspen; and |
| • | there were no material economies of scale or other incidental benefits accruing to Aspen in connection with its relationship with the Fund. |
Based on the Trustees’ deliberations and their evaluation of the information described above, the Trustees, including all of the Independent Trustees, concluded that Aspen’s compensation for investment advisory services is consistent with the best interests of the Fund and its shareholders.
| Semi-Annual Report | October 31, 2011 | 19 |
Table of Contents
|


This Material must be accompanied or preceded by the prospectus.
WWW.ASPENFUTURESFUND.COM
Table of Contents
Table of Contents
 | Grandeur Peak FundsSM | |||
| TABLE OF CONTENTS |
| 1 | ||||
| 5 | ||||
| 9 | ||||
Portfolio of Investments | ||||
| 11 | ||||
| 20 | ||||
| 27 | ||||
| 28 | ||||
| 29 | ||||
Financial Highlights | ||||
| 30 | ||||
| 32 | ||||
| 34 | ||||
| 43 | ||||
Table of Contents
Grandeur Peak FundsSM | Shareholder Letter | |
| October 31, 2011 (Unaudited) |

Robert Gardiner, CFA
CEO & Portfolio Manager
An Exciting Beginning to a Global Vision
Dear Fellow Shareholders,
It seems odd to be sending a semi-annual report dated just two weeks after the launch of the new Grandeur Peak Funds. It is by coincidence that the fiscal year-end of the Financial Investors Trust, of which our Funds are members, is April 30th, and as such the Semi-Annual report will be dated October 31st each year.
The Funds are off to a solid start and are almost fully invested. This report will give you a good opportunity to see where we made our initial investments, by region, country, industry, and company. We are excited by the prospects of our companies despite the broad global economic challenges. We believe we are finding small and micro cap companies around the world that can continue to grow, even in stagnant economies. Their valuations are reasonable, and in some foreign markets we believe they are quite attractive.
This fall our entire team climbed beautiful Grandeur Peak located above the Salt Lake Valley to celebrate months of hard work, enjoy the spectacular view, and to inaugurate our new firm. We have moved swiftly to form Grandeur Peak Global Advisors after leaving Wasatch Advisors on June 30th. In addition to building a great investment team, we’ve brought on seasoned partners to handle trading and operations and to take care of our valued shareholders. Eric Huefner, president of the firm, has accomplished a great deal in a short period of time. His hard work has allowed me, Blake Walker and the rest of our research team to stay more focused on our companies and portfolios in what has been a very volatile market. Today we are a formidable start-up company with six research professionals and three business professionals, a team with substantial experience in managing portfolios, picking stocks and in building companies.
Grandeur Peak Global Advisors has been a dream in the making since 1981 when Eric Huefner and I were hired in the Wasatch Advisors back office as 16 year old high school students. I fell in love with this business and spent the next thirty years at Wasatch, while talking openly about my desire to one day have my own firm. The rest of our team shares my passion for global investment, my interest in creating a truly special boutique firm, and my energy to tackle the compelling opportunity we see in global small/micro cap investing. We are group of seasoned veterans, owing much to the tutelage we received at Wasatch Advisors. My co-manager, Blake Walker, worked alongside me at Wasatch for the last ten years. Eric’s tenure at Wasatch included six years early on, and then the last five years running the Wasatch mutual funds business. Amy Hone, Amy Sunderland, Randy Pearce, Rob Green, and Spence Stewart have all worked at Wasatch.
Semi-Annual Report (Unaudited) | October 31, 2011 | 1 |
Table of Contents
Grandeur Peak FundsSM | Shareholder Letter | |
| October 31, 2011 (Unaudited) |
We are extremely grateful to Sam Stewart who nurtured and mentored each of us over the last several decades. He is a great friend for whom we have the upmost respect as a wonderful boss, a true small cap pioneer, and a great investor. Wasatch is led today by another good friend and investor, Jeff Cardon, whose friendship and mentoring over many years we are also thankful. Wasatch is a strong firm. We’re proud to have been a part of Wasatch’s long legacy of respected results. It was a very difficult decision for us to leave. We wish our friends at Wasatch the very best.
Grandeur Peak Global has been founded on the same investment philosophy each of us learned and helped develop at Wasatch. We believe it is an enduring investment philosophy. We will invest in what we believe to be best-in-class small undiscovered growth companies with outstanding management, headroom to grow, and a sustainable competitive advantage; and we’ll try to find them before the Street does. We will also invest in “Fallen Angels” – companies that have hit a bump in the road but which we believe can get back on track, and whose stock price temporarily presents exceptional value. To a lesser extent, we will invest in “Stalwarts” – midcap companies that aren’t growing as fast as they did as smaller companies but which have powerful market positions and strong business models and still have growth left; these are companies we know very well and have typically followed for many years. We will adhere religiously to our disciplined investment philosophy. We will do our own independent research, visit companies around the globe, and build our own proprietary financial models to help us evaluate each company’s potential and valuation.
As mentioned, Grandeur Peak is an actual peak overlooking the Salt Lake Valley. But more importantly, Grandeur Peak is a metaphor for us. We believe that the way to succeed in today’s investing environment is to organize ourselves with a global view, a view that allows us to see each company in its global context, and that accords us the opportunity to go anywhere in the world to find what we believe to be the best companies, offering the best risk-adjusted returns for our clients. Our goal as a team and as a firm over the coming decades is to attain that global Grandeur Peak where we can see the whole valley of investing and understand the world with greater perspective than other investors.
We’re one of a very small handful of funds focused on small and microcap companies on a global scale. We’re also one of a very few firms, as far as we are aware, that has set itself up where each PM and each analyst is a global industry specialist. We don’t segment the world as most investment firms do by splitting company and sector research into domestic and international buckets. While it’s challenging to cover a sector on a global basis, it is a challenge that must be accepted to try to find the best-in-class companies.
Despite our significant experience we are still a young and enthusiastic team, a team that has the energy necessary to canvas the world in search of the most compelling investments, and to never fall short due the lack of effort or commitment to our clients. We will be unwavering in our discipline of screening the investable universe worldwide; from the U.S. to Europe to Asia to Emerging and even some Frontier Markets. We will seek to leave no stone unturned. We’re committed to travelling the globe to visit companies and markets, and we will likely take turns living overseas in the coming years to help us continuously understand the world better. As I look around at my peers in the industry I know many who share my vision of global investing, but I know few who are willing to actually do what it takes to implement it well. It’s a more comfortable lifestyle to stay focused domestically, but I think it will be more difficult for these investors to achieve strong returns.
2 | www.GrandeurPeakGlobal.com |
Table of Contents
Grandeur Peak FundsSM | Shareholder Letter | |
| October 31, 2011 (Unaudited) |
Not only is our team highly energized, but we are dedicated to the success of our new firm. I want you to know how grateful I am to our team. Every team member left a good position and promising opportunities at another firm to join Grandeur Peak, and each is now working for far less pay as part of our start-up than they were or could be making elsewhere. We are all highly motivated to make our firm a great success. We are also committed to “eating our own cooking.” Every member of our team will be heavily invested in the Grandeur Peak Funds.
Perhaps our greatest advantage today is our size, which allows us to be a nimble player in the markets. This is key, especially when it comes to small and microcap investing. Too many small cap managers have become a victim of their own success and have allowed themselves to get to a size where they are at a disadvantage in managing money in the small and microcap space. Understandably, it’s a very difficult thing for a firm who has worked so hard to garner assets to then turn them away after they are successful. At Grandeur Peak we are committed to closing our products at far smaller sizes than most firms have done in the past. We believe our clients will be best served by this, and we will maintain a long-term investment advantage.
We are optimistic that our launch timing may have worked out nicely. Small and microcap stocks globally have been hit hard in recent months. While we’re concerned that the U.S. small cap market has more correcting to do relative to their large cap peers, we see the international small and microcap universe as extremely exciting. Unlike U.S. markets where one fallout from the Sarbanes-Oxley legislation in 2002 has been a lackluster decade of Initial Public Offerings (IPOs), the international markets have seen an IPO boom. As bottom up stock pickers this has created a very exciting universe from which to choose. We feel like kids in a candy store today. The international small and microcap universe is less followed by Wall Street and we are finding plenty of undiscovered, special companies. But while we feel the timing for international small and microcaps is excellent, we haven’t abandoned the U.S. markets by any means as there are still interesting lesser known companies domestically at what we regard as reasonable valuations. We are hoping that there is pent up demand for more U.S. IPOs in the coming decade as well. (Note: we tend to buy IPOs not on the offering, but six to eighteen months later after Wall Street has moved onto the next hot IPO and the company valuation makes more sense for long-term investors.)
In conclusion, I would like to foremost express my deep gratitude and appreciation to you, our shareholders; you have made my dream a reality for us. I extend a very personal thank you to each of you early investors. We will never forget any of you. At Grandeur Peak we know that we have a very important responsibility to our shareholders. We launched Grandeur Peak specifically to help individuals and institutions build wealth in what has become a very volatile and confusing world. We have chosen mutual funds as our investment vehicle, rather than a hedge fund for example, to make our services available to anyone interested, and at what we believe is a reasonable fee. It’s the core mission of our firm to endeavor to help you, from our largest to our very smallest valued shareholder, climb to your own Grandeur Peak with your investments. You have my commitment that we will work tirelessly in this regard.
Sincerely,
Robert
Robert Gardiner, CEO
Grandeur Peak Global Advisors
Semi-Annual Report (Unaudited) | October 31, 2011 | 3 |
Table of Contents
Grandeur Peak FundsSM | Shareholder Letter | |
| October 31, 2011 (Unaudited) |
The objective of both the Grandeur Peak Global Opportunities Fund and the Grandeur Peak International Opportunities Fund is long-term growth of capital. These funds are new and have limited operating history.
Mutual fund investing involves risks and loss of principal is possible. Investing in small and micro cap funds will be more volatile and loss of principal could be greater than investing in large cap or more diversified funds. Investing in foreign securities entails special risks, such as currency fluctuations and political uncertainties, which are described in more detail in the prospectus. Investments in emerging markets are subject to the same risks as other foreign securities and may be subject to greater risks than investments in foreign countries with more established economies and securities markets.
An investor should consider investment objectives, risks, charges, and expenses carefully before investing. To obtain a prospectus, containing this and other information, visit www.grandeurpeakglobal.com or call 1-855-377-PEAK (7325). Please read it carefully before investing.
Wasatch Advisors is not affiliated with Grandeur Peak Global Advisors or with ALPS Distributors, Inc.
Grandeur Peak Funds are distributed by ALPS Distributors, Inc (“ADI”).
Eric Huefner and Mark Siddoway are Registered Representatives of ALPS Distributors, Inc.
CFA® is a trademark owned by CFA Institute.
4 | www.GrandeurPeakGlobal.com |
Table of Contents
Grandeur Peak Global Opportunities Fund | Performance Update | |
| October 31, 2011 (Unaudited) |
Performance as of October 31, 2011
| Since Inception* | ||||
Grandeur Peak Global Opportunities Fund – Investor (GPGOX) | 4.00% | |||
Grandeur Peak Global Opportunities Fund – Institutional (GPGIX) | 4.00% | |||
Russell Global Small Cap Index | 4.47% |
The returns shown above do not reflect the deduction of taxes a shareholder would pay on Fund distributions or redemption of Fund shares.
Performance data quoted represents past performance. Past performance does not guarantee future results. Investment return and principal value of an investment will fluctuate so that an investor’s shares, when sold or redeemed, may be worth more or less than the original cost. Current performance data may be higher or lower than actual data quoted. For the most current month-end performance data, please call 1-855-377-PEAK (7325).
* Fund Inception date of October 17, 2011.
Growth of $10,000 as of October 31, 2011
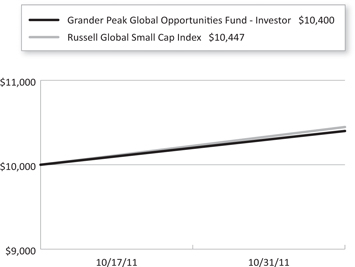
The graphs shown above represent a hypothetical investment of $10,000 in the Fund’s Investor Class Shares for the period from inception to 10/31/11. All returns reflect reinvested dividends, but do not reflect the deduction of taxes that an investor would pay on distributions or redemptions.
The Russell Global Small Cap Index is not actively managed and does not reflect any deduction for fees, expenses or taxes. It is not possible to invest directly in an index.
The Fund also offers Institutional Class shares, performance for which is not reflected in the graphs above. The performance of Institutional Class shares may be higher or lower than the performance of the Investor Class shares shown in the graphs above based upon differences in fees paid by shareholders investing in the Investor Class shares and Institutional Class shares.
Semi-Annual Report (Unaudited) | October 31, 2011 | 5 |
Table of Contents
Grandeur Peak Global Opportunities Fund | Performance Update | |
| October 31, 2011 (Unaudited) |
| Regional Allocation (as a % of Net Assets)* | ||||
North America | 35.2 | % | ||
Europe | 22.3 | % | ||
Asia ex Japan | 20.0 | % | ||
Latin America | 6.3 | % | ||
Australia/New Zealand | 3.9 | % | ||
Japan | 3.8 | % | ||
Africa/Middle East | 2.1 | % | ||
Short Term & Net Other Assets | 6.4 | % | ||
Total | 100.0 | % | ||
Sector Allocation (as a % of Net Assets)* | ||||
Industrials | 20.6 | % | ||
Information Technology | 19.7 | % | ||
Financials | 14.7 | % | ||
Consumer Discretionary | 14.6 | % | ||
Health Care | 10.1 | % | ||
Energy | 4.8 | % | ||
Exchange Traded Funds | 3.4 | % | ||
Materials | 2.9 | % | ||
Consumer Staples | 2.8 | % | ||
Short Term & Other Net Assets | 6.4 | % | ||
Total | 100.0 | % | ||
Top 10 Holdings (as a % of Net Assets)* | ||||
L’Occitane International SA | 2.3 | % | ||
Melexis NV | 1.7 | % | ||
RPS Group PLC | 1.6 | % | ||
Banco ABC Brasil SA | 1.5 | % | ||
Vitasoy International Holdings, Ltd. | 1.5 | % | ||
Home Capital Group, Inc. | 1.4 | % | ||
Banco Daycoval SA | 1.4 | % | ||
Wirecard AG | 1.3 | % | ||
China Medical System Holdings, Ltd. | 1.2 | % | ||
Magellan Financial Group, Ltd. | 1.1 | % | ||
Total | 15.0 | % | ||
* Holdings are subject to change.
6 | www.GrandeurPeakGlobal.com |
Table of Contents
Grandeur Peak International Opportunities Fund | Performance Update | |
| October 31, 2011 (Unaudited) |
Performance as of October 31, 2011
| Since Inception* | ||||
Grandeur Peak International Opportunities Fund – Investor (GPIOX) | 4.00% | |||
Grandeur Peak International Opportunities Fund – Institutional (GPIIX) | 4.00% | |||
Russell Global ex-U.S. Small Cap Index | 2.79% |
The returns shown above do not reflect the deduction of taxes a shareholder would pay on Fund distributions or redemption of Fund shares.
Performance data quoted represents past performance. Past performance does not guarantee future results. Investment return and principal value of an investment will fluctuate so that an investor’s shares, when sold or redeemed, may be worth more or less than the original cost. Current performance data may be higher or lower than actual data quoted. For the most current month-end performance data, please call 1-855-377-PEAK (7325).
* Fund Inception date of October 17, 2011.
Growth of $10,000 as of October 31, 2011
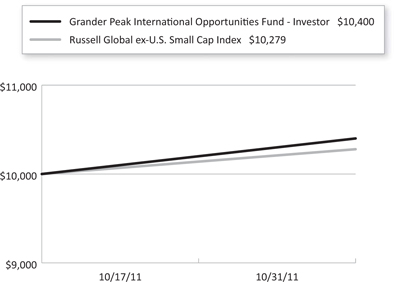
The graphs shown above represent a hypothetical investment of $10,000 in the Fund’s Investor Class Shares for the period from inception to 10/31/11. All returns reflect reinvested dividends, but do not reflect the deduction of taxes that an investor would pay on distributions or redemptions.
The Russell Global ex-U.S. Small Cap Index is not actively managed and does not reflect any deduction for fees, expenses or taxes. It is not possible to invest directly in an index.
The Fund also offers Institutional Class shares, performance for which is not reflected in the graphs above. The performance of Institutional Class shares may be higher or lower than the performance of the Investor Class shares shown in the graphs above based upon differences in fees paid by shareholders investing in the Investor Class shares and Institutional Class shares.
Semi-Annual Report (Unaudited) | October 31, 2011 | 7 |
Table of Contents
Grandeur Peak International Opportunities Fund | Performance Update | |
| October 31, 2011 (Unaudited) |
| Regional Allocation (as a % of Net Assets)* | ||||
Europe | 30.1 | % | ||
Asia ex Japan | 29.7 | % | ||
Latin America | 8.4 | % | ||
North America | 8.4 | % | ||
Australia/New Zealand | 6.6 | % | ||
Japan | 5.6 | % | ||
Africa/Middle East | 3.6 | % | ||
Short Term & Net Other Assets | 7.6 | % | ||
Total | 100.0 | % | ||
Sector Allocation (as a % of Net Assets)* | ||||
Industrials | 17.9 | % | ||
Information Technology | 17.9 | % | ||
Consumer Discretionary | 15.4 | % | ||
Financials | 10.6 | % | ||
Health Care | 10.3 | % | ||
Exchange Traded Funds | 6.3 | % | ||
Energy | 6.1 | % | ||
Consumer Staples | 4.0 | % | ||
Materials | 3.9 | % | ||
Short Term & Net Other Assets | 7.6 | % | ||
Total | 100.0 | % | ||
Top 10 Holdings (as a % of Net Assets)* | ||||
L’Occitane International SA | 2.3 | % | ||
RPS Group PLC | 2.2 | % | ||
Vitasoy International Holdings, Ltd. | 2.0 | % | ||
China Medical System Holdings, Ltd. | 1.9 | % | ||
Banco Daycoval SA | 1.9 | % | ||
Wirecard AG | 1.9 | % | ||
Melexis NV | 1.8 | % | ||
Tegma Gestao Logistica | 1.6 | % | ||
Banco ABC Brasil SA | 1.6 | % | ||
Hy-Lok Corp. | 1.6 | % | ||
Total | 18.8 | % | ||
* Holdings are subject to change.
8 | www.GrandeurPeakGlobal.com |
Table of Contents
Grandeur Peak FundsSM | Disclosure of Fund Expenses | |
| October 31, 2011 (Unaudited) |
As a shareholder of a Fund, you incur two types of costs: direct costs, such as short-term redemption fees and wire fees, and indirect costs, including management fees, and other fund operating expenses. This example is intended to help you understand your indirect costs, also referred to as “ongoing costs” (in dollars), of investing in the Fund and to compare these costs with the ongoing costs of investing in other mutual funds.
This example is based on an investment of $1,000 invested at the beginning of the period and held for the entire six-month period of May 1, 2011 through October 31, 2011.
Actual Expenses The first line of the table below provides information about actual account values and actual expenses. You may use the information in this line, together with the amount you invested at the beginning of the period, to estimate the expenses that you paid over the period. Simply divide your account value by $1,000 (for example, an $8,600 account value divided by $1,000 = 8.6), then multiply the result by the number in the first line under the heading “Expenses Paid During Period” to estimate the expenses you paid on your account during this period.
Hypothetical Example for Comparison Purposes The second line of the table provides information about hypothetical account values and hypothetical expenses based on the Fund’s actual expense ratio and an assumed rate of return of 5% per year before expenses, which is not the Fund’s actual return. The hypothetical account values and expenses may not be used to estimate the actual ending account balance or expenses you paid for the period. You may use this information to compare ongoing costs of investing in the Fund and other funds. To do so, compare this 5% hypothetical example with the 5% hypothetical examples that appear in the shareholder reports of other funds.
Please note that the expenses shown in the table are meant to highlight your ongoing costs only and do not reflect any direct costs, such as wire fees or low balance fees. Therefore, the second line of the table is useful in comparing ongoing costs only and will not help you determine the relative total costs of owning different funds. In addition, if these direct costs were included, your costs would be higher.
Beginning Account 5/1/2011 | Ending Account 10/31/11 | Expense Ratio(a) | Expenses Paid During period 5/1/2011 - 10/31/11(b) | |||||
Grandeur Peak Global Opportunities Fund(c) | ||||||||
Investor | ||||||||
Actual | $ 1,000.00 | $ 1,040.00 | 1.75% | $ 0.68 | ||||
Hypothetical | $ 1,000.00 | $ 1,016.34 | 1.75% | $ 8.87 | ||||
Institutional | ||||||||
Actual | $ 1,000.00 | $ 1,040.00 | 1.50% | $ 0.59 | ||||
Hypothetical | $ 1,000.00 | $ 1,017.60 | 1.50% | $ 7.61 | ||||
| (a) | The Fund’s expense ratios have been annualized based on the Fund’s most recent fiscal half-year expenses. |
| (b) | Expenses are equal to the Fund’s annualized expense ratio, multiplied by the average account value over the period, multiplied by the number of days in the most recent fiscal half-year 184/366. |
| (c) | The Grandeur Peak Global Opportunities Fund commenced operations on October 17, 2011. |
Semi-Annual Report (Unaudited) | October 31, 2011 | 9 |
Table of Contents
Grandeur Peak FundsSM | Disclosure of Fund Expenses | |
| October 31, 2011 (Unaudited) |
Beginning Account 5/1/2011 | Ending Account 10/31/11 | Expense Ratio(a) | Expenses Paid During period 5/1/2011 - 10/31/11(b) | |||||
Grandeur Peak International Opportunities Fund(c) | ||||||||
Investor | ||||||||
Actual | $ 1,000.00 | $ 1,040.00 | 1.75% | $ 0.68 | ||||
Hypothetical | $ 1,000.00 | $ 1,016.34 | 1.75% | $ 8.87 | ||||
Institutional | ||||||||
Actual | $ 1,000.00 | $ 1,040.00 | 1.50% | $ 0.59 | ||||
Hypothetical | $ 1,000.00 | $ 1,017.60 | 1.50% | $ 7.61 | ||||
| (a) | The Fund’s expense ratios have been annualized based on the Fund’s most recent fiscal half-year expenses. |
| (b) | Expenses are equal to the Fund’s annualized expense ratio, multiplied by the average account value over the period, multiplied by the number of days in the most recent fiscal half-year 184/366. |
| (c) | The Grandeur Peak International Opportunities Fund commenced operations on October 17, 2011. |
10 | www.GrandeurPeakGlobal.com |
Table of Contents
| Portfolio of Investments | ||
| October 31, 2011 (Unaudited) |
| Shares | Value (Note 2) | |||||||
COMMON STOCKS (90.17%) | ||||||||
Australia (3.72%) | ||||||||
Ausenco, Ltd.(a) | 22,550 | $ | 63,515 | |||||
Billabong International, Ltd.(a) | 17,400 | 77,732 | ||||||
Campbell Brothers, Ltd.(a) | 1,280 | 61,619 | ||||||
carsales.com, Ltd.(a) | 10,595 | 54,771 | ||||||
CSG, Ltd.(a) | 70,350 | 83,788 | ||||||
Lycopodium, Ltd.(a) | 8,303 | 53,458 | ||||||
Magellan Financial Group, Ltd.(a) | 220,565 | 329,056 | ||||||
Navitas, Ltd.(a) | 25,905 | 112,195 | ||||||
The Reject Shop, Ltd.(a) | 13,315 | 138,377 | ||||||
SMS Management & Technology, Ltd.(a) | 20,210 | 114,626 | ||||||
|
| |||||||
| 1,089,137 | ||||||||
|
| |||||||
Belgium (1.67%) | ||||||||
Melexis NV(a) | 34,855 | 490,160 | ||||||
|
| |||||||
Brazil (5.79%) | ||||||||
Banco ABC Brasil SA | 65,900 | 441,419 | ||||||
Banco Daycoval SA | 74,100 | 408,298 | ||||||
CETIP SA - Balcao Organizado de Ativos e Derivativos | 9,700 | 132,829 | ||||||
Drogasil SA | 18,000 | 113,335 | ||||||
Fleury SA | 8,200 | 104,694 | ||||||
Lojas Renner SA | 3,800 | 115,537 | ||||||
Marcopolo SA | 35,500 | 131,095 | ||||||
Tegma Gestao Logistica | 19,200 | 250,505 | ||||||
|
| |||||||
| 1,697,712 | ||||||||
|
| |||||||
Britain (6.58%) | ||||||||
Abcam PLC(a) | 12,265 | 72,934 | ||||||
Afren PLC(a)(b) | 20,000 | 31,633 | ||||||
Coastal Energy Co.(a)(b) | 15,685 | 188,887 | ||||||
CVS Group PLC(b) | 12,480 | 24,682 | ||||||
Fidessa Group PLC(a) | 4,020 | 104,925 | ||||||
Highland Gold Mining, Ltd.(a) | 47,690 | 146,720 | ||||||
Immunodiagnostic Systems Holdings PLC | 6,690 | 99,608 | ||||||
Intertek Group PLC(a) | 1,765 | 58,193 | ||||||
Michael Page International PLC(a) | 13,575 | 87,389 | ||||||
Premier Oil PLC(a)(b) | 34,455 | 202,836 | ||||||
Rotork PLC(a) | 2,860 | 77,141 | ||||||
Semi-Annual Report (Unaudited) | October 31, 2011 | 11 |
Table of Contents
| Grandeur Peak Global Opportunities Fund | Portfolio of Investments | |
| October 31, 2011 (Unaudited) |
| Shares | Value (Note 2) | |||||||
Britain (continued) | ||||||||
RPS Group PLC(a) | 163,617 | $ | 473,840 | |||||
Sthree PLC(a) | 19,475 | 88,954 | ||||||
Ted Baker PLC(a) | 12,885 | 158,836 | ||||||
Ultra Electronics Holdings PLC(a) | 4,335 | 110,603 | ||||||
|
| |||||||
| 1,927,181 | ||||||||
|
| |||||||
Canada (6.98%) | ||||||||
Atrium Innovations, Inc.(b) | 8,305 | 109,067 | ||||||
Gildan Activewear, Inc. | 3,670 | 94,700 | ||||||
Gran Tierra Energy, lnc.(b) | 33,975 | 206,568 | ||||||
Home Capital Group, Inc. | 9,195 | 415,862 | ||||||
Inmet Mining Corp. | 2,730 | 162,965 | ||||||
Pan American Silver Corp. | 8,325 | 232,607 | ||||||
Pan Orient Energy Corp.(b) | 14,270 | 32,499 | ||||||
Richelieu Hardware, Ltd. | 5,405 | 144,296 | ||||||
ShawCor, Ltd. | 7,545 | 180,535 | ||||||
Stantec, lnc.(b) | 5,560 | 136,720 | ||||||
TransGlobe Energy Corp.(b) | 19,040 | 195,987 | ||||||
Westfire Energy, Ltd.(b) | 29,420 | 135,478 | ||||||
|
| |||||||
| 2,047,284 | ||||||||
|
| |||||||
China (4.97%) | ||||||||
BCD Semiconductor Manufacturing, Ltd.(b) | 17,105 | 78,597 | ||||||
China Automation Group, Ltd.(a) | 91,610 | 31,803 | ||||||
China Lilang, Ltd.(a) | 47,175 | 49,658 | ||||||
China Medical System Holdings, Ltd.(a) | 469,530 | 344,754 | ||||||
China Real Estate Information Corp., ADR(b) | 28,000 | 166,600 | ||||||
Comtec Solar Systems Group, Ltd.(a)(b) | 72,230 | 13,278 | ||||||
Minth Group, Ltd.(a) | 117,860 | 122,287 | ||||||
O2Micro International, Ltd., ADR(b) | 31,415 | 128,487 | ||||||
Pacific Online, Ltd.(a) | 548,222 | 263,662 | ||||||
ShangPharma Corp.(b) | 11,232 | 103,334 | ||||||
WuXi PharmaTech Cayman, Inc., ADR(b) | 12,360 | 153,635 | ||||||
|
| |||||||
| 1,456,095 | ||||||||
|
| |||||||
Colombia (0.44%) | ||||||||
Petrominerales, Ltd. | 4,915 | 129,686 | ||||||
|
| |||||||
Denmark (0.22%) | ||||||||
SimCorp AS(a) | 370 | 63,407 | ||||||
|
| |||||||
12 | www.GrandeurPeakGlobal.com |
Table of Contents
| Grandeur Peak Global Opportunities Fund | Portfolio of Investments | |
| October 31, 2011 (Unaudited) |
| Shares | Value (Note 2) | |||||||
France (2.92%) | ||||||||
1000mercis SA(a) | 3,640 | $ | 200,518 | |||||
Alten, Ltd.(a) | 7,638 | 217,502 | ||||||
Audika Groupe(a) | 4,385 | 96,946 | ||||||
Bureau Veritas SA(a) | 670 | 51,987 | ||||||
Neurones | 5,740 | 60,919 | ||||||
Sartorius Stedim Biotech(a) | 1,935 | 130,834 | ||||||
Thermador Groupe(a) | 515 | 98,428 | ||||||
|
| |||||||
| 857,134 | ||||||||
|
| |||||||
Germany (3.20%) | ||||||||
Amadeus Fire AG(a) | 4,705 | 179,903 | ||||||
Bertrandt AG(a) | 3,280 | 183,930 | ||||||
Gerry Weber International AG(a) | 3,500 | 108,658 | ||||||
Viscom AG(a)(b) | 9,800 | 87,231 | ||||||
Wirecard AG(a) | 23,835 | 379,117 | ||||||
|
| |||||||
| 938,839 | ||||||||
|
| |||||||
Hong Kong (3.17%) | ||||||||
CST Mining Group, Ltd.(a)(b) | 850,110 | 11,786 | ||||||
Ports Design, Ltd.(a) | 182,430 | 325,303 | ||||||
Sino Biopharmaceutical(a) | 90,835 | 27,670 | ||||||
Vitasoy International Holdings, Ltd.(a) | 613,195 | 431,295 | ||||||
Yingde Gases Group Co.(a) | 124,820 | 133,112 | ||||||
|
| |||||||
| 929,166 | ||||||||
|
| |||||||
India (1.39%) | ||||||||
HDFC Bank, Ltd., ADR | 8,575 | 271,485 | ||||||
ICICI Bank, Ltd., ADR | 3,615 | 134,333 | ||||||
|
| |||||||
| 405,818 | ||||||||
|
| |||||||
Ireland (0.82%) | ||||||||
Beazley PLC(a) | 66,020 | 133,179 | ||||||
ICON PLC, ADR(b) | 6,445 | 108,276 | ||||||
|
| |||||||
| 241,455 | ||||||||
|
| |||||||
Israel (0.18%) | ||||||||
Camtek, Ltd.(a)(b) | 6,850 | 53,941 | ||||||
|
| |||||||
Italy (0.07%) | ||||||||
DiaSorin S.p.A.(a) | 670 | 21,688 | ||||||
|
| |||||||
Semi-Annual Report (Unaudited) | October 31, 2011 | 13 |
Table of Contents
Grandeur Peak Global Opportunities Fund | Portfolio of Investments | |
| October 31, 2011 (Unaudited) |
| Shares | Value (Note 2) | |||||||
Japan (3.76%) | ||||||||
Benefit One, lnc.(a) | 35 | $ | 23,540 | |||||
C Uyemura & Co.(a) | 4,110 | 143,556 | ||||||
CMIC Co., Ltd.(a) | 4,620 | 76,628 | ||||||
Daikokutenbussan Co.(a) | 2,810 | 80,646 | ||||||
Disco Corp.(a) | 785 | 41,465 | ||||||
EPS Co., Ltd.(a) | 70 | 146,711 | ||||||
Future Architect, lnc.(a) | 135 | 55,140 | ||||||
GCA Savvian Group Corp.(a) | 55 | 64,376 | ||||||
Japan Pure Chemical Co., Ltd.(a) | 10 | 24,850 | ||||||
Macromill, lnc.(a) | 4,745 | 55,597 | ||||||
MonotaRO Co., Ltd.(a) | 14,445 | 140,608 | ||||||
Prestige International, lnc.(a) | 2,700 | 22,947 | ||||||
Simplex Holdings, lnc.(a) | 444 | 163,762 | ||||||
Trancom Co., Ltd.(a) | 3,070 | 62,415 | ||||||
|
| |||||||
| 1,102,241 | ||||||||
|
| |||||||
Luxembourg (2.27%) | ||||||||
L’Occitane International SA(a) | 301,403 | 664,534 | ||||||
|
| |||||||
Malaysia (0.75%) | ||||||||
KFC Holdings Malaysia Bhd(a) | 100,400 | 113,126 | ||||||
Padini Holdings Bhd(a) | 318,750 | 107,344 | ||||||
|
| |||||||
| 220,470 | ||||||||
|
| |||||||
Mexico (0.07%) | ||||||||
Compartamos SAB de CV | 12,505 | 19,329 | ||||||
|
| |||||||
Netherlands (1.08%) | ||||||||
Brunel International NV(a) | 2,335 | 83,989 | ||||||
LMA International NV(a) | 453,000 | 118,934 | ||||||
VistaPrint NV(b) | 3,270 | 114,188 | ||||||
|
| |||||||
| 317,111 | ||||||||
|
| |||||||
New Zealand (0.19%) | ||||||||
Kathmandu Holdings, Ltd.(a) | 28,290 | 56,330 | ||||||
|
| |||||||
Norway (0.51%) | ||||||||
Oslo Bors VPS Holding ASA(a) | 11,835 | 148,222 | ||||||
|
| |||||||
Singapore (1.08%) | ||||||||
ARA Asset Management, Ltd.(a)(c) | 108,080 | 111,963 | ||||||
14 | www.GrandeurPeakGlobal.com |
Table of Contents
Grandeur Peak Global Opportunities Fund | Portfolio of Investments | |
| October 31, 2011 (Unaudited) |
| Shares | Value (Note 2) | |||||||
Singapore (continued) | ||||||||
Breadtalk Group, Ltd.(a) | 221,625 | $ | 90,406 | |||||
CSE Global, Ltd.(a) | 56,550 | 37,652 | ||||||
Goodpack, Ltd.(a) | 58,000 | 77,301 | ||||||
|
| |||||||
| 317,322 | ||||||||
|
| |||||||
South Africa (1.57%) | ||||||||
Advtech, Ltd. | 39,299 | 29,219 | ||||||
Clicks Group, Ltd.(a) | 26,285 | 137,339 | ||||||
Foschini Group, Ltd.(a) | 7,635 | 95,823 | ||||||
Lewis Group, Ltd.(a) | 10,775 | 101,640 | ||||||
Life Healthcare Group Holdings, Ltd.(a) | 40,180 | 97,399 | ||||||
|
| |||||||
| 461,420 | ||||||||
|
| |||||||
South Korea (3.29%) | ||||||||
Daewoong Pharma Co.(a) | 2,000 | 58,714 | ||||||
Eugene Tech Co., Ltd.(a) | 4,000 | 62,784 | ||||||
Hanmi Semiconductor Co., Ltd.(a) | 13,000 | 69,592 | ||||||
Hy-Lok Corp.(a) | 19,200 | 260,015 | ||||||
iMarketKorea, lnc.(a) | 4,000 | 65,024 | ||||||
Koh Young Technology, lnc.(a) | 3,110 | 79,923 | ||||||
LG Fashion Corp.(a) | 5,300 | 213,367 | ||||||
Shinsegae Food Co., Ltd.(a) | 2,130 | 154,159 | ||||||
|
| |||||||
| 963,578 | ||||||||
|
| |||||||
Sweden (2.68%) | ||||||||
AddTech AB(a) | 9,948 | 224,609 | ||||||
Connecta AB(a) | 6,540 | 69,181 | ||||||
HIQ International AB(a)(b) | 38,389 | 169,490 | ||||||
Indutrade AB(a) | 6,050 | 161,921 | ||||||
Swedol AB(a) | 34,860 | 160,102 | ||||||
|
| |||||||
| 785,303 | ||||||||
|
| |||||||
Switzerland (0.34%) | ||||||||
Burckhardt Compression Holding AG(a) | 445 | 98,361 | ||||||
|
| |||||||
Taiwan (1.87%) | ||||||||
Pacific Hospital Supply Co.(a) | 41,000 | 134,164 | ||||||
Polyronics Tech Corp.(a) | 75,000 | 123,957 | ||||||
Sporton International, lnc.(a) | 35,000 | 75,465 | ||||||
Test Research, lnc.(a) | 89,000 | 111,152 | ||||||
Semi-Annual Report (Unaudited) | October 31, 2011 | 15 |
Table of Contents
Grandeur Peak Global Opportunities Fund | Portfolio of Investments | |
| October 31, 2011 (Unaudited) |
| Shares | Value (Note 2) | |||||||
Taiwan (continued) | ||||||||
TXC Corp.(a) | 88,000 | $ | 103,588 | |||||
|
| |||||||
| 548,326 | ||||||||
|
| |||||||
United Arab Emirates (0.37%) | ||||||||
Exillon Energy PLC(a)(b) | 22,215 | 106,871 | ||||||
|
| |||||||
United States (28.22%) | ||||||||
3D Systems Corp.(b) | 5,600 | 91,112 | ||||||
Abaxis, lnc.(b) | 2,330 | 65,380 | ||||||
Akamai Technologies, lnc.(b) | 1,175 | 31,655 | ||||||
Allegiant Travel Co.(b) | 1,155 | 60,014 | ||||||
Altera Corp. | 1,690 | 64,085 | ||||||
American Software, Inc. | 19,300 | 150,926 | ||||||
Amphenol Corp. | 1,920 | 91,181 | ||||||
Amsurg Corp.(b) | 3,830 | 97,014 | ||||||
Ares Capital Corp. | 13,568 | 209,897 | ||||||
athenahealth, lnc.(b) | 440 | 23,280 | ||||||
AtriCure, lnc.(b) | 3,250 | 36,270 | ||||||
Big 5 Sporting Goods Corp. | 3,450 | 26,669 | ||||||
Bio-Reference Labs, lnc.(b) | 3,515 | 70,441 | ||||||
Cabot Microelectronics Corp.(b) | 885 | 34,090 | ||||||
Capstead Mortgage Corp. | 13,010 | 157,681 | ||||||
Cardica, lnc.(b) | 18,295 | 38,785 | ||||||
Carter’s, lnc.(b) | 1,550 | 59,039 | ||||||
Convio, lnc.(b) | 5,290 | 50,731 | ||||||
Copart, lnc.(b) | 3,070 | 133,698 | ||||||
Corvel Corp.(b) | 2,065 | 106,492 | ||||||
Covance, lnc.(b) | 2,680 | 135,956 | ||||||
CRA International, lnc.(b) | 5,770 | 111,476 | ||||||
DFC Global Corp.(b) | 10,540 | 231,037 | ||||||
Diamond Hill Investment Group, Inc. | 1,280 | 96,358 | ||||||
Dollar Tree, lnc.(b) | 1,720 | 137,531 | ||||||
Entegris, lnc.(b) | 6,125 | 54,880 | ||||||
Exact Sciences Corp.(b) | 4,350 | 34,583 | ||||||
Exponent, lnc.(b) | 1,615 | 77,811 | ||||||
The First of Long Island Corp. | 5,610 | 143,336 | ||||||
Forward Air Corp. | 970 | 31,768 | ||||||
FTI Consulting, lnc.(b) | 2,790 | 109,954 | ||||||
Graco, Inc. | 1,845 | 79,224 | ||||||
HCC Insurance Holdings, Inc. | 4,035 | 107,371 | ||||||
Hibbett Sports, lnc.(b) | 1,755 | 72,288 | ||||||
16 | www.GrandeurPeakGlobal.com |
Table of Contents
Grandeur Peak Global Opportunities Fund | Portfolio of Investments | |
| October 31, 2011 (Unaudited) |
| Shares | Value (Note 2) | |||||||
United States (continued) | ||||||||
Houston Wire & Cable Co. | 12,905 | $ | 164,797 | |||||
Huron Consulting Group, lnc.(b) | 3,895 | 140,259 | ||||||
IDEX Corp. | 2,695 | 95,538 | ||||||
Illinois Tool Works, Inc. | 1,620 | 78,781 | ||||||
InnerWorkings, Inc.(b) | 6,100 | 55,205 | ||||||
Intevac, lnc.(b) | 1,770 | 14,249 | ||||||
IPC The Hospitalist Co., lnc.(b) | 1,390 | 58,283 | ||||||
ISTA Pharmaceuticals, lnc.(b) | 2,365 | 9,791 | ||||||
Knight Transportation, Inc. | 17,495 | 265,924 | ||||||
Linear Technology Corp. | 8,430 | 272,373 | ||||||
LKQ Corp.(b) | 4,735 | 138,167 | ||||||
Maxim Integrated Products, Inc. | 10,475 | 274,026 | ||||||
Mednax, lnc.(b) | 315 | 20,727 | ||||||
Meridian Bioscience, Inc. | 9,800 | 178,556 | ||||||
Mesa Laboratories, Inc. | 2,400 | 89,376 | ||||||
Micrel, Inc. | 14,475 | 159,515 | ||||||
Microchip Technology, Inc. | 3,895 | 140,843 | ||||||
Monro Muffler Brake, Inc. | 3,400 | 126,106 | ||||||
MSC Industrial Direct Co. | 3,970 | 270,000 | ||||||
MSCI, lnc.(b) | 4,600 | 153,594 | ||||||
Myriad Genetics, lnc.(b) | 1,995 | 42,454 | ||||||
Navigant Consulting, lnc.(b) | 17,510 | 198,388 | ||||||
Opnet Technologies, Inc. | 2,150 | 94,041 | ||||||
Pool Corp. | 2,210 | 64,576 | ||||||
Portfolio Recovery Associates, lnc.(b) | 3,195 | 224,097 | ||||||
Power Integrations, Inc. | 2,275 | 81,058 | ||||||
Resources Connection, Inc. | 15,975 | 177,163 | ||||||
Robert Half International, Inc. | 5,105 | 134,925 | ||||||
Ross Stores, Inc. | 1,740 | 152,650 | ||||||
SEI Investments Co. | 5,000 | 80,950 | ||||||
Silicon Laboratories, lnc.(b) | 1,640 | 70,110 | ||||||
SPS Commerce, lnc.(b) | 2,870 | 56,137 | ||||||
State Street Corp. | 3,255 | 131,469 | ||||||
STR Holdings, lnc.(b) | 6,730 | 57,541 | ||||||
Stratasys, lnc.(b) | 3,800 | 106,552 | ||||||
Supertex, lnc.(b) | 2,710 | 50,027 | ||||||
Synovis Life Technologies, lnc.(b) | 2,500 | 44,900 | ||||||
Syntel, Inc. | 1,605 | 78,485 | ||||||
Tetra Tech, lnc.(b) | 2,605 | 56,867 | ||||||
TTM Technologies, lnc.(b) | 6,975 | 77,911 | ||||||
Ultimate Software Group, lnc.(b) | 1,130 | 68,003 | ||||||
Semi-Annual Report (Unaudited) | October 31, 2011 | 17 |
Table of Contents
Grandeur Peak Global Opportunities Fund | Portfolio of Investments | |
| October 31, 2011 (Unaudited) |
| Shares | Value (Note 2) | |||||||
United States (continued) | ||||||||
Universal Truckload Services, Inc. | 7,635 | $ | 118,495 | |||||
Volterra Semiconductor Corp.(b) | 2,835 | 67,190 | ||||||
Waters Corp.(b) | 1,040 | 83,325 | ||||||
WW Grainger, Inc. | 420 | 71,950 | ||||||
Zumiez, lnc.(b) | 6,785 | 154,359 | ||||||
|
| |||||||
| 8,271,746 | ||||||||
|
| |||||||
TOTAL COMMON STOCKS (Cost $26,485,443) | 26,429,867 | |||||||
|
| |||||||
EXCHANGE TRADED FUNDS (3.45%) | ||||||||
Market Vectors India Small-Cap Index ETF(b) | 59,465 | 778,397 | ||||||
IQ South Korea Small-Cap ETF | 8,000 | 232,480 | ||||||
|
| |||||||
TOTAL EXCHANGE TRADED FUNDS (Cost $1,064,617) | 1,010,877 | |||||||
|
| |||||||
SHORT TERM INVESTMENTS (14.72%) | ||||||||
BlackRock Liquidity Funds Treasury Trust Fund Portfolio - Institutional Class | 4,315,149 | 4,315,149 | ||||||
|
| |||||||
TOTAL SHORT TERM INVESTMENTS (Cost $4,315,149) | 4,315,149 | |||||||
|
| |||||||
TOTAL INVESTMENTS (108.34%) (Cost $31,865,209) | $ | 31,755,893 | ||||||
Liabilities In Excess Of Other Assets (-8.34%) | (2,443,864 | ) | ||||||
|
| |||||||
NET ASSETS (100.00%) | $ | 29,312,029 | ||||||
|
| |||||||
18 | www.GrandeurPeakGlobal.com |
Table of Contents
Grandeur Peak Global Opportunities Fund | Portfolio of Investments | |
| October 31, 2011 (Unaudited) |
| (a) | Fair valued security; valued by management in accordance with procedures approved by the Fund’s Board of Trustees. As of October 31, 2011, these securities had a total value of $12,790,747 or 40.28% of total net assets. |
| (b) | Non-Income Producing Security. |
| (c) | Security exempt from registration under Rule 144A of the Securities Act of 1933. These securities may be resold in the ordinary course of business in transactions exempt from registration, normally to qualified institutional buyers. As of October 31, 2011, these securities had a total aggregate market value of $111,963, representing 0.38% of net assets. |
| (d) | Less than 0.0005%. |
Percentages stated as a percent of net assets.
Common Abbreviations:
AB - Aktiebolag is the Swedish equivalent of the term corporation.
ADR - American Depositary Receipt.
AG - Aktiengesellschaft is a German term that refers to a corporation that is limited by shares, i.e., owned by shareholders.
AS - Aktieselskab is the Danish term for a stock-based corporation.
ASA - Allmennaksjeselskap is the Norwegian term for a public limited company.
Bhd - Berhad is the Malaysian term for public limited company.
ETF - Exchange Traded Fund.
Ltd. - Limited.
NV - Naamloze Vennootschap is the Dutch term for a public limited liability corporation.
PLC - Public Limited Company.
SA - Generally designates corporations in various countries, mostly those employing the civil law.
SAB de CV - A variable capital company.
S.p.A. - Societa’ Per Azioni is an Italian shared company.
See Notes to Financial Statements.
Semi-Annual Report (Unaudited) | October 31,2011 | 19 |
Table of Contents
| Portfolio of Investments | ||
| October 31, 2011 (Unaudited) |
| Shares | Value (Note 2) | |||||||
COMMON STOCKS (86.08%) | ||||||||
Australia (6.15%) | ||||||||
Ausenco, Ltd.(a) | 27,075 | $ | 76,260 | |||||
Billabong International, Ltd.(a) | 7,500 | 33,505 | ||||||
Campbell Brothers, Ltd.(a) | 1,485 | 71,488 | ||||||
carsales.com, Ltd.(a) | 8,675 | 44,845 | ||||||
CSG, Ltd.(a) | 53,905 | 64,202 | ||||||
Lycopodium, Ltd.(a) | 7,445 | 47,934 | ||||||
Magellan Financial Group, Ltd.(a) | 117,926 | 175,931 | ||||||
Navitas, Ltd.(a) | 24,480 | 106,023 | ||||||
The Reject Shop, Ltd.(a) | 5,695 | 59,186 | ||||||
SMS Management & Technology, Ltd.(a) | 12,075 | 68,486 | ||||||
|
| |||||||
| 747,860 | ||||||||
|
| |||||||
Belgium (1.76%) | ||||||||
Melexis NV(a) | 15,229 | 214,163 | ||||||
|
| |||||||
Brazil (7.81%) | ||||||||
Banco ABC Brasil SA | 29,100 | 194,921 | ||||||
Banco Daycoval SA | 41,500 | 228,669 | ||||||
CETIP SA - Balcao Organizado de Ativos e Derivativos | 4,300 | 58,883 | ||||||
Drogasil SA | 8,700 | 54,779 | ||||||
Fleury SA | 5,000 | 63,838 | ||||||
Marcopolo SA | 22,700 | 83,827 | ||||||
Technos SA(b) | 7,700 | 65,839 | ||||||
Tegma Gestao Logistica | 15,200 | 198,316 | ||||||
|
| |||||||
| 949,072 | ||||||||
|
| |||||||
Britain (9.20%) | ||||||||
Abcam PLC(a) | 10,810 | 64,282 | ||||||
Afren PLC(a)(b) | 13,000 | 20,561 | ||||||
Coastal Energy Co.(a)(b) | 7,763 | 93,486 | ||||||
CVS Group PLC(b) | 8,320 | 16,455 | ||||||
Fidessa Group PLC(a) | 2,665 | 69,559 | ||||||
Highland Gold Mining, Ltd.(a) | 22,950 | 70,607 | ||||||
Immunodiagnostic Systems Holdings PLC | 4,625 | 68,862 | ||||||
Michael Page International PLC(a) | 8,225 | 52,948 | ||||||
Premier Oil PLC(a)(b) | 18,380 | 108,203 | ||||||
Rotork PLC(a) | 1,375 | 37,087 | ||||||
RPS Group PLC(a) | 93,757 | 271,523 | ||||||
Sthree PLC(a) | 15,429 | 70,473 | ||||||
20 | www.GrandeurPeakGlobal.com |
Table of Contents
Grandeur Peak International Opportunities Fund | Portfolio of Investments | |
| October 31, 2011 (Unaudited) |
| Shares | Value (Note 2) | |||||||
Britain (continued) | ||||||||
Ted Baker PLC(a) | 8,810 | $ | 108,603 | |||||
Ultra Electronics Holdings PLC(a) | 2,540 | 64,805 | ||||||
|
| |||||||
| 1,117,454 | ||||||||
|
| |||||||
Canada (8.38%) | ||||||||
Atrium Innovations, Inc.(b) | 5,605 | 73,609 | ||||||
Gran Tierra Energy, lnc.(b) | 15,850 | 96,368 | ||||||
Home Capital Group, Inc. | 3,990 | 180,456 | ||||||
Inmet Mining Corp. | 1,205 | 71,931 | ||||||
Pan American Silver Corp. | 4,645 | 129,785 | ||||||
Pan Orient Energy Corp.(b) | 9,820 | 22,364 | ||||||
Petroamerica Oil Corp.(b) | 112,695 | 10,741 | ||||||
Richelieu Hardware, Ltd. | 2,300 | 61,403 | ||||||
ShawCor, Ltd. | 3,595 | 86,020 | ||||||
Stantec, lnc.(b) | 2,940 | 72,294 | ||||||
TransGlobe Energy Corp.(b) | 13,580 | 139,785 | ||||||
Westfire Energy, Ltd.(b) | 15,980 | 73,587 | ||||||
|
| |||||||
| 1,018,343 | ||||||||
|
| |||||||
China (7.85%) | ||||||||
BCD Semiconductor Manufacturing, Ltd.(b) | 13,190 | 60,608 | ||||||
China Automation Group, Ltd.(a) | 42,150 | 14,633 | ||||||
China Lilang, Ltd.(a) | 47,045 | 49,521 | ||||||
China Medical System Holdings, Ltd.(a) | 321,915 | 236,367 | ||||||
China Real Estate Information Corp., ADR(b) | 16,780 | 99,841 | ||||||
Comtec Solar Systems Group, Ltd.(a)(b) | 109,305 | 20,093 | ||||||
Minth Group, Ltd.(a) | 88,915 | 92,255 | ||||||
O2Micro International, Ltd., ADR(b) | 20,435 | 83,579 | ||||||
Pacific Online, Ltd.(a) | 321,145 | 154,451 | ||||||
ShangPharma Corp.(b) | 6,236 | 57,371 | ||||||
WuXi PharmaTech Cayman, Inc., ADR(b) | 6,846 | 85,096 | ||||||
|
| |||||||
| 953,815 | ||||||||
|
| |||||||
Colombia (0.44%) | ||||||||
Petrominerales, Ltd. | 2,040 | 53,827 | ||||||
|
| |||||||
Denmark (0.29%) | ||||||||
SimCorp AS(a) | 205 | 35,131 | ||||||
|
| |||||||
France (3.99%) | ||||||||
1000mercis SA(a) | 1,705 | 93,924 | ||||||
Semi-Annual Report (Unaudited) | October 31, 2011 | 21 |
Table of Contents
Grandeur Peak International Opportunities Fund | Portfolio of Investments | |
| October 31, 2011 (Unaudited) |
| Shares | Value (Note 2) | |||||||
France (continued) | ||||||||
Alten, Ltd.(a) | 3,975 | $ | 113,193 | |||||
Audika Groupe(a) | 3,455 | 76,385 | ||||||
Neurones | 4,070 | 43,195 | ||||||
Sartorius Stedim Biotech(a) | 1,395 | 94,323 | ||||||
Thermador Groupe(a) | 334 | 63,835 | ||||||
|
| |||||||
| 484,855 | ||||||||
|
| |||||||
Germany (4.63%) | ||||||||
Amadeus Fire AG(a) | 3,045 | 116,430 | ||||||
Bertrandt AG(a) | 1,670 | 93,647 | ||||||
Gerry Weber International AG(a) | 2,895 | 89,876 | ||||||
Viscom AG(a)(b) | 3,950 | 35,159 | ||||||
Wirecard AG(a) | 14,320 | 227,773 | ||||||
|
| |||||||
| 562,885 | ||||||||
|
| |||||||
Hong Kong (4.29%) | ||||||||
CST Mining Group, Ltd.(a)(b) | 1,133,485 | 15,715 | ||||||
EcoGreen Fine Chemicals Group, Ltd.(a) | 58,375 | 15,547 | ||||||
Ports Design, Ltd.(a) | 80,160 | 142,939 | ||||||
Sino Biopharmaceutical(a) | 82,670 | 25,182 | ||||||
Vitasoy International Holdings, Ltd.(a) | 337,065 | 237,077 | ||||||
Yingde Gases Group Co.(a) | 79,855 | 85,160 | ||||||
|
| |||||||
| 521,620 | ||||||||
|
| |||||||
Ireland (1.43%) | ||||||||
Beazley PLC(a) | 59,760 | 120,551 | ||||||
ICON PLC, ADR(b) | 3,180 | 53,424 | ||||||
|
| |||||||
| 173,975 | ||||||||
|
| |||||||
Israel (0.64%) | ||||||||
Camtek, Ltd.(a)(b) | 9,883 | 77,824 | ||||||
|
| |||||||
Italy (0.20%) | ||||||||
DiaSorin S.p.A.(a) | 765 | 24,763 | ||||||
|
| |||||||
Japan (5.61%) | ||||||||
Benefit One, lnc.(a) | 29 | 19,504 | ||||||
C Uyemura & Co.(a) | 1,875 | 65,491 | ||||||
CMIC Co., Ltd.(a) | 2,155 | 35,743 | ||||||
Daikokutenbussan Co.(a) | 1,845 | 52,951 | ||||||
Disco Corp.(a) | 685 | 36,183 | ||||||
22 | www.GrandeurPeakGlobal.com |
Table of Contents
Grandeur Peak International Opportunities Fund | Portfolio of Investments | |
| October 31, 2011 (Unaudited) |
| Shares | Value (Note 2) | |||||||
Japan (continued) | ||||||||
EPS Co., Ltd.(a) | 41 | $ | 85,931 | |||||
Future Architect, lnc.(a) | 92 | 37,577 | ||||||
GCA Savvian Group Corp.(a) | 25 | 29,262 | ||||||
Japan Pure Chemical Co., Ltd.(a) | 7 | 17,395 | ||||||
Macromill, lnc.(a) | 2,995 | 35,092 | ||||||
MonotaRO Co., Ltd.(a) | 9,845 | 95,831 | ||||||
Prestige International, lnc.(a) | 2,000 | 16,998 | ||||||
Simplex Holdings, lnc.(a) | 259 | 95,528 | ||||||
Trancom Co., Ltd.(a) | 2,890 | 58,756 | ||||||
|
| |||||||
| 682,242 | ||||||||
|
| |||||||
Luxembourg (2.32%) | ||||||||
L’Occitane International SA(a) | 127,575 | 281,278 | ||||||
|
| |||||||
Malaysia (1.11%) | ||||||||
KFC Holdings Malaysia Bhd(a) | 53,300 | 60,056 | ||||||
Padini Holdings Bhd(a) | 220,650 | 74,307 | ||||||
|
| |||||||
| 134,363 | ||||||||
|
| |||||||
Mexico (0.13%) | ||||||||
Compartamos SAB de CV | 9,975 | 15,419 | ||||||
|
| |||||||
Netherlands (1.61%) | ||||||||
Brunel International NV(a) | 1,325 | 47,660 | ||||||
LMA International NV(a) | 336,000 | 88,216 | ||||||
VistaPrint NV(b) | 1,695 | 59,189 | ||||||
|
| |||||||
| 195,065 | ||||||||
|
| |||||||
New Zealand (0.50%) | ||||||||
Kathmandu Holdings, Ltd.(a) | 30,672 | 61,073 | ||||||
|
| |||||||
Norway (0.79%) | ||||||||
Oslo Bors VPS Holding ASA(a) | 7,635 | 95,621 | ||||||
|
| |||||||
Singapore (2.11%) | ||||||||
ARA Asset Management, Ltd.(a)(c) | 88,920 | 92,115 | ||||||
Breadtalk Group, Ltd.(a) | 158,375 | 64,604 | ||||||
CSE Global, Ltd.(a) | 54,055 | 35,991 | ||||||
Goodpack, Ltd.(a) | 48,000 | 63,973 | ||||||
|
| |||||||
| 256,683 | ||||||||
|
| |||||||
Semi-Annual Report (Unaudited) | October 31, 2011 | 23 |
Table of Contents
Grandeur Peak International Opportunities Fund | Portfolio of Investments | |
| October 31, 2011 (Unaudited) |
| Shares | Value (Note 2) | |||||||
South Africa (2.63%) | ||||||||
Advtech, Ltd. | 36,325 | $ | 27,008 | |||||
Clicks Group, Ltd.(a) | 18,285 | 95,539 | ||||||
Foschini Group, Ltd.(a) | 5,370 | 67,396 | ||||||
Lewis Group, Ltd.(a) | 6,955 | 65,606 | ||||||
Life Healthcare Group Holdings, Ltd.(a) | 26,365 | 63,911 | ||||||
|
| |||||||
| 319,460 | ||||||||
|
| |||||||
South Korea (4.95%) | ||||||||
Daewoong Pharma Co.(a) | 1,200 | 35,228 | ||||||
Eugene Tech Co., Ltd.(a) | 2,400 | 37,670 | ||||||
Hanmi Semiconductor Co., Ltd.(a) | 7,500 | 40,149 | ||||||
Hy-Lok Corp.(a) | 14,028 | 189,974 | ||||||
iMarketKorea, lnc.(a) | 2,000 | 32,512 | ||||||
Koh Young Technology, lnc.(a) | 2,300 | 59,107 | ||||||
LG Fashion Corp.(a) | 3,000 | 120,774 | ||||||
Shinsegae Food Co., Ltd.(a) | 1,183 | 85,620 | ||||||
|
| |||||||
| 601,034 | ||||||||
|
| |||||||
Sweden (3.29%) | ||||||||
AddTech AB(a) | 4,427 | 99,954 | ||||||
Connecta AB(a) | 3,370 | 35,648 | ||||||
HIQ International AB(a)(b) | 20,825 | 91,944 | ||||||
Indutrade AB(a) | 3,250 | 86,983 | ||||||
Swedol AB(a) | 18,627 | 85,548 | ||||||
|
| |||||||
| 400,077 | ||||||||
|
| |||||||
Switzerland (0.55%) | ||||||||
Burckhardt Compression Holding AG(a) | 305 | 67,416 | ||||||
|
| |||||||
Taiwan (3.09%) | ||||||||
Pacific Hospital Supply Co.(a) | 25,000 | 81,808 | ||||||
Polyronics Tech Corp.(a) | 50,000 | 82,638 | ||||||
Sporton International, lnc.(a) | 24,000 | 51,748 | ||||||
Test Research, lnc.(a) | 62,000 | 77,431 | ||||||
TXC Corp.(a) | 69,000 | 81,222 | ||||||
|
| |||||||
| 374,847 | ||||||||
|
| |||||||
24 | www.GrandeurPeakGlobal.com |
Table of Contents
Grandeur Peak International Opportunities Fund | Portfolio of Investments | |
| October 31, 2011 (Unaudited) |
| Shares | Value (Note 2) | |||||||
United Arab Emirates (0.33%) | ||||||||
Exillon Energy PLC(a)(b) | 8,240 | $ | 39,641 | |||||
|
| |||||||
TOTAL COMMON STOCKS (Cost $10,687,929) | 10,459,806 | |||||||
|
| |||||||
EXCHANGE TRADED FUNDS (6.33%) | ||||||||
Market Vectors India Small-Cap Index ETF(b) | 47,170 | 617,456 | ||||||
IQ South Korea Small-Cap ETF | 4,000 | 116,240 | ||||||
IQ Taiwan Small-Cap ETF | 1,540 | 35,805 | ||||||
|
| |||||||
TOTAL EXCHANGE TRADED FUNDS (Cost $835,612) | 769,501 | |||||||
|
| |||||||
SHORT TERM INVESTMENTS (6.20%) | ||||||||
BlackRock Liquidity Funds Treasury Trust Fund Portfolio - Institutional Class | 752,965 | 752,965 | ||||||
|
| |||||||
TOTAL SHORT TERM INVESTMENTS (Cost $752,965) | 752,965 | |||||||
|
| |||||||
TOTAL INVESTMENTS (98.61%) (Cost $12,276,506) | $ | 11,982,272 | ||||||
Assets In Excess Of Other Liabilities (1.39%) | 168,598 | |||||||
|
| |||||||
NET ASSETS (100.00%) | $ | 12,150,870 | ||||||
|
| |||||||
Semi-Annual Report (Unaudited) | October 31, 2011 | 25 |
Table of Contents
Grandeur Peak International Opportunities Fund | Portfolio of Investments | |
| October 31, 2011 (Unaudited) |
| (a) | Fair valued security; valued by management in accordance with procedures approved by the Fund’s Board of Trustees. As of October 31, 2011, these securities had a total value of $7,768,517 or 64.83% of total net assets. |
| (b) | Non-Income Producing Security. |
| (c) | Security exempt from registration under Rule 144A of the Securities Act of 1933. These securities may be resold in the ordinary course of business in transactions exempt from registration, normally to qualified institutional buyers. As of October 31, 2011, these securities had a total aggregate market value of $92,115, representing 0.76% of net assets. |
| (d) | Less than 0.0005%. |
Percentages stated as a percent of net assets.
Common Abbreviations:
AB - Aktiebolag is the Swedish equivalent of the term corporation.
ADR - American Depositary Receipt.
AG - Aktiengesellschaft is a German term that refers to a corporation that is limited by shares, i.e., owned by shareholders.
AS - Aktieselskab is the Danish term for a stock-based corporation.
ASA - Allmennaksjeselskap is the Norwegian term for a public limited company.
Bhd - Berhad is the Malaysian term for public limited company.
ETF - Exchange Traded Fund.
Ltd. - Limited.
NV - Naamloze Vennootschap is the Dutch term for a public limited liability corporation.
PLC - Public Limited Company.
SA - Generally designates corporations in various countries, mostly those employing the civil law.
SAB de CV - A variable capital company.
S.p.A. - Societa ` Per Azioni is an Italian shared company.
See Notes to Financial Statements.
26 | www.GrandeurPeakGlobal.com |
Table of Contents
Grandeur Peak FundsSM | Statements of Assets and Liabilities | |
| October 31, 2011 (Unaudited) |
Grandeur Peak Global Opportunities | Grandeur Peak International Opportunities | |||||||
ASSETS | ||||||||
Investments, at value (Cost - see below) | $ | 31,755,893 | $ | 11,982,272 | ||||
Foreign cash, at value | – | 40,191 | ||||||
Dividends and interest receivable | 3,211 | 2,043 | ||||||
Receivable for investments sold | 741,746 | 511,628 | ||||||
Receivable for fund shares subscribed | 728,232 | 138,979 | ||||||
Receivable due from advisor | 1,062 | 2,615 | ||||||
Prepaid and other assets | – | 438 | ||||||
Total assets | 33,230,144 | 12,678,166 | ||||||
LIABILITIES | ||||||||
Foreign cash due to custodian | 1,786 | – | ||||||
Payable for investments purchased | 3,900,922 | 518,072 | ||||||
Advisory fee payable | 2,647 | – | ||||||
Administration fees payable | 4,910 | 2,330 | ||||||
Distribution and service fees payable | 633 | 389 | ||||||
Accrued expenses and other liabilities | 7,217 | 6,505 | ||||||
Total liabilities | 3,918,115 | 527,296 | ||||||
NET ASSETS | $ | 29,312,029 | $ | 12,150,870 | ||||
NET ASSETS CONSISTS OF | ||||||||
Paid-in capital (Note 4) | $ | 29,619,195 | $ | 12,610,427 | ||||
Undistributed net investment income | 6,072 | 5,385 | ||||||
Accumulated net realized loss on investments and foreign currency transactions | (232,642) | (177,091) | ||||||
Net unrealized depreciation on investments and translation of assets and liabilities in foreign currencies | (80,596) | (287,851) | ||||||
NET ASSETS | $ | 29,312,029 | $ | 12,150,870 | ||||
INVESTMENTS, AT COST | $ | 31,865,209 | $ | 12,276,506 | ||||
PRICING OF SHARES | ||||||||
Investor Class | ||||||||
Net Assets | $ | 8,374,906 | $ | 4,668,777 | ||||
Net Asset Value, offering and redemption price per share | $ | 2.08 | $ | 2.08 | ||||
Shares of beneficial interest outstanding | 4,028,688 | 2,243,761 | ||||||
Institutional Class | ||||||||
Net Assets | $ | 20,937,123 | $ | 7,482,093 | ||||
Net Asset Value, offering and redemption price per share | $ | 2.08 | $ | 2.08 | ||||
Shares of beneficial interest outstanding | 10,053,258 | 3,596,027 | ||||||
See Notes to Financial Statements.
Semi-Annual Report (Unaudited) | October 31, 2011 | 27 |
Table of Contents
Grandeur Peak FundsSM | Statements of Operations | |
| For the Period October 17, 2011 (Inception) to October 31, 2011 (Unaudited) | ||
Grandeur Peak Global Opportunities | Grandeur Peak International Opportunities | |||||||
INVESTMENT INCOME | ||||||||
Dividends | $ | 21,711 | $ | 12,269 | ||||
Interest | 1,907 | 1,521 | ||||||
Foreign taxes withheld | (3,201) | (1,796) | ||||||
Total investment income | 20,417 | 11,994 | ||||||
EXPENSES | ||||||||
Investment advisor fees (Note 5) | 11,428 | 5,181 | ||||||
Administrative fees | 4,909 | 2,329 | ||||||
Distribution and service fees - Investor Class | 633 | 389 | ||||||
Transfer agent fees | 1,612 | 1,395 | ||||||
Legal fees | 193 | 1,135 | ||||||
Printing fees | 277 | 243 | ||||||
Registration fees | – | 1,281 | ||||||
Audit and tax preparation fees | 1,676 | 1,676 | ||||||
Custodian fees | 492 | 459 | ||||||
Trustee fees | 206 | 88 | ||||||
Offering costs | 2,527 | – | ||||||
Other expenses | 234 | 228 | ||||||
Total expenses | 24,187 | 14,404 | ||||||
Less fees waived/reimbursed by investment advisor | ||||||||
Investor Class | (2,897) | (3,087) | ||||||
Institutional Class | (6,945) | (4,708) | ||||||
Total net expenses | 14,345 | 6,609 | ||||||
NET INVESTMENT INCOME | 6,072 | 5,385 | ||||||
REALIZED AND UNREALIZED GAIN/(LOSS) ON INVESTMENTS | ||||||||
Net realized loss on investments | (122,205) | (114,606) | ||||||
Net realized loss on foreign currency transactions | (110,437) | (62,485) | ||||||
Net change in unrealized depreciation on investments | (109,316) | (294,234) | ||||||
Net change in unrealized appreciation on translation of assets and liabilities in foreign currencies | 28,720 | 6,383 | ||||||
NET REALIZED AND UNREALIZED LOSS ON INVESTMENTS AND FOREIGN CURRENCY TRANSACTIONS | (313,238) | (464,942) | ||||||
NET DECREASE IN NET ASSETS RESULTING FROM OPERATIONS | $ | (307,166) | $ | (459,557) | ||||
See Notes to Financial Statements.
28 | www.GrandeurPeakGlobal.com |
Table of Contents
Grandeur Peak FundsSM | Statements of Changes in Net Assets | |
| For the Period October 17, 2011 (Inception) to October 31, 2011 (Unaudited) | ||
Grandeur Peak Global Opportunities | Grandeur Peak International Opportunities | |||||||
OPERATIONS | ||||||||
Net investment income | $ | 6,072 | $ | 5,385 | ||||
Net realized loss on investments and foreign currency transactions | (232,642) | (177,091) | ||||||
Net change in unrealized depreciation on investments and foreign currency translations | (80,596) | (287,851) | ||||||
Net decrease in net assets resulting from operations | (307,166) | (459,557) | ||||||
CAPITAL SHARE TRANSACTIONS (NOTE 4) | ||||||||
Investor Class | ||||||||
Proceeds from sales of shares | 8,111,848 | 4,495,883 | ||||||
Net increase from capital shares transactions | 8,111,848 | 4,495,883 | ||||||
Institutional Class | ||||||||
Proceeds from sales of shares | 21,507,347 | 8,114,544 | ||||||
Net increase from capital shares transactions | 21,507,347 | 8,114,544 | ||||||
Net increase in net assets | 29,312,029 | 12,150,870 | ||||||
NET ASSETS | ||||||||
Beginning of period | – | – | ||||||
End of period* | $ | 29,312,029 | $ | 12,150,870 | ||||
*Including undistributed net investment income of: | $ | 6,072 | $ | 5,385 | ||||
OTHER INFORMATION | ||||||||
Shares Transactions | ||||||||
Investor | ||||||||
Issued | 4,028,688 | 2,243,761 | ||||||
Net increase in share transactions | 4,028,688 | 2,243,761 | ||||||
Institutional | ||||||||
Issued | 10,053,258 | 3,596,027 | ||||||
Net increase in share transactions | 10,053,258 | 3,596,027 | ||||||
See Notes to Financial Statements.
Semi-Annual Report (Unaudited) | October 31, 2011 | 29 |
Table of Contents
| Financial Highlights | ||
| For a share outstanding throughout the period presented. |
| Investor Class | For the Period October 17, 2011 (Inception) to October 31, 2011 (Unaudited) | |||
NET ASSET VALUE, BEGINNING OF PERIOD | $ | 2.00 | ||
INCOME FROM INVESTMENT OPERATIONS | ||||
Net investment income(b) | 0.00 | (a) | ||
Net realized and unrealized gain on investments | 0.08 | |||
Total income from investment operations | 0.08 | |||
DISTRIBUTIONS | ||||
From net investment income | – | |||
From net realized gain on investments | – | |||
Total distributions | – | |||
REDEMPTION FEES ADDED TO PAID-IN CAPITAL (Note 4) | – | |||
INCREASE IN NET ASSET VALUE | 0.08 | |||
NET ASSET VALUE, END OF PERIOD | $ | 2.08 | ||
TOTAL RETURN | 4.00% | (c) | ||
RATIOS AND SUPPLEMENTAL DATA | ||||
Net assets, end of period (in 000s) | $ | 8,375 | ||
RATIOS TO AVERAGE NET ASSETS | ||||
Expenses (excluding fees waived/reimbursed by investment advisor) | 2.89% | (d) | ||
Expenses (including fees waived/reimbursed by investment advisor) | 1.75% | (d) | ||
Net investment income | 0.50% | (d) | ||
PORTFOLIO TURNOVER RATE | 4% | (c) | ||
| (a) | Less than $0.005 per share. |
| (b) | Per share numbers have been calculated using the average shares method. |
| (c) | Not Annualized. |
| (d) | Annualized. |
See Notes to Financial Statements.
30 | www.GrandeurPeakGlobal.com |
Table of Contents
Grandeur Peak Global Opportunities Fund | Financial Highlights | |
| For a share outstanding throughout the period presented. |
| Institutional Class | For the Period October 17, 2011 (Inception) to October 31, 2011 (Unaudited) | |||
NET ASSET VALUE, BEGINNING OF PERIOD | $ | 2.00 | ||
INCOME FROM INVESTMENT OPERATIONS | ||||
Net investment income(b) | 0.00 | (a) | ||
Net realized and unrealized gain on investments | 0.08 | |||
Total income from investment operations | 0.08 | |||
DISTRIBUTIONS | ||||
From net investment income | – | |||
From net realized gain on investments | – | |||
Total distributions | – | |||
REDEMPTION FEES ADDED TO PAID-IN CAPITAL (Note 4) | – | |||
INCREASE IN NET ASSET VALUE | 0.08 | |||
NET ASSET VALUE, END OF PERIOD | $ | 2.08 | ||
TOTAL RETURN | 4.00% | (c) | ||
RATIOS AND SUPPLEMENTAL DATA | ||||
Net assets, end of period (in 000s) | $ | 20,937 | ||
RATIOS TO AVERAGE NET ASSETS | ||||
Expenses (excluding fees waived/reimbursed by investment advisor) | 2.55% | (d) | ||
Expenses (including fees waived/reimbursed by investment advisor) | 1.50% | (d) | ||
Net investment income | 0.73% | (d) | ||
PORTFOLIO TURNOVER RATE | 4% | (c) | ||
| (a) | Less than $0.005 per share. |
| (b) | Per share numbers have been calculated using the average shares method. |
| (c) | Not Annualized. |
| (d) | Annualized. |
See Notes to Financial Statements.
Semi-Annual Report (Unaudited) | October 31, 2011 | 31 |
Table of Contents
| Financial Highlights | ||
| For a share outstanding throughout the period presented. |
| Investor Class | For the Period October 17, 2011 (Inception) to October 31, 2011 (Unaudited) | |||
NET ASSET VALUE, BEGINNING OF PERIOD | $ | 2.00 | ||
INCOME FROM INVESTMENT OPERATIONS | ||||
Net investment income(a) | 0.00 | (b) | ||
Net realized and unrealized gain on investments | 0.08 | |||
Total income from investment operations | 0.08 | |||
DISTRIBUTIONS | ||||
From net investment income | – | |||
From net realized gain on investments | – | |||
Total distributions | – | |||
REDEMPTION FEES ADDED TO PAID-IN CAPITAL (Note 4) | ||||
INCREASE IN NET ASSET VALUE | 0.08 | |||
NET ASSET VALUE, END OF PERIOD | $ | 2.08 | ||
TOTAL RETURN | 4.00% | (c) | ||
RATIOS AND SUPPLEMENTAL DATA | ||||
Net assets, end of period (in 000s) | $ | 4,669 | ||
RATIOS TO AVERAGE NET ASSETS | ||||
Expenses (excluding fees waived/reimbursed by investment advisor) | 3.74% | (d) | ||
Expenses (including fees waived/reimbursed by investment advisor) | 1.75% | (d) | ||
Net investment income | 2.96% | (d) | ||
PORTFOLIO TURNOVER RATE | 7% | (c) | ||
| (a) | per share numbers have been calculated using the average shares method. |
| (b) | Less than $0.005 per share. |
| (c) | Not Annualized. |
| (d) | Annualized. |
See Notes to Financial Statements.
32 | www.GrandeurPeakGlobal.com |
Table of Contents
Grandeur Peak International Opportunities Fund | Financial Highlights | |
| For a share outstanding throughout the period presented. |
| Institutional Class | For the Period (Inception) to October 31, 2011 (Unaudited) | |||
NET ASSET VALUE, BEGINNING OF PERIOD | $ | 2.00 | ||
INCOME FROM INVESTMENT OPERATIONS | ||||
Net investment income(b) | 0.00 | (a) | ||
Net realized and unrealized gain on investments | 0.08 | |||
Total income from investment operations | 0.08 | |||
DISTRIBUTIONS | ||||
From net investment income | – | |||
From net realized gain on investments | – | |||
Total distributions | – | |||
REDEMPTION FEES ADDED TO PAID-IN CAPITAL (Note 4) | – | |||
INCREASE IN NET ASSET VALUE | 0.08 | |||
NET ASSET VALUE, END OF PERIOD | $ | 2.08 | ||
TOTAL RETURN | 4.00% | (c) | ||
RATIOS AND SUPPLEMENTAL DATA | ||||
Net assets, end of period (in 000s) | $ | 7,482 | ||
RATIOS TO AVERAGE NET ASSETS | ||||
Expenses (excluding fees waived/reimbursed by investment advisor) | 3.32% | (d) | ||
Expenses (including fees waived/reimbursed by investment advisor) | 1.50% | (d) | ||
Net investment income | 2.85% | (d) | ||
PORTFOLIO TURNOVER RATE | 7% | (c) | ||
| (a) | Less than $0.005 per share. |
| (b) | Per share numbers have been calculated using the average shares method. |
| (c) | Not Annualized. |
| (d) | Annualized. |
See Notes to Financial Statements.
Semi-Annual Report (Unaudited) | October 31, 2011 | 33 |
Table of Contents
Grandeur Peak FundsSM | Notes to Financial Statements | |
| October 31, 2011 (Unaudited) |
1. ORGANIZATION
Financial Investors Trust (the “Trust”) a Delaware statutory trust, is an open-end management investment company registered under the Investment Company Act of 1940, as amended (“1940 Act”). As of October 31, 2011, the Trust had fifteen registered funds. This semi-annual report describes the Grandeur Peak Global Opportunities Fund and Grandeur Peak International Opportunities Fund (collectively, the “Funds”). The Funds seek long-term growth of capital. The Funds offer Investor Class and Institutional Class shares. All classes of shares have identical rights to earnings, assets and voting privileges, except for class specific expenses and exclusive rights to vote on matters affecting only individual classes.
From July 1, 2011 through October 17, 2011, Mr. Gardiner and Mr. Walker managed two separate accounts in the same style as the Grandeur Peak Global Opportunities Fund and the Grandeur Peak International Opportunities Fund are now managed. On October 17, 2011, when these mutual funds were launched, the assets of the two separately managed accounts were transferred-in-kind into the two Grandeur Peak mutual funds in the amounts of $8,695,783 and $5,641,085 respectively. Since these separate accounts had declined in value between July 1st and October 17th, as had the global stock market, these transfers-in-kind resulted in the mutual funds benefiting from a net unrealized loss on the equity positions that were transferred into the mutual funds. The net amount of unrealized losses that the mutual funds obtained through these transfers were $1,228,923 in the Global Opportunities Fund and $986,814 in the International Opportunities Fund.
2. SIGNIFICANT ACCOUNTING POLICIES
The following is a summary of significant accounting policies consistently followed by the Funds. These policies are in conformity with U.S. generally accepted accounting principles, (“GAAP”).
The preparation of financial reporting in accordance with GAAP requires management to make certain estimates and assumptions that affect the reported amounts and disclosures in the financial statements during the reporting period. Management believes the estimates and security valuations are appropriate; however, actual results may differ from those estimates, and the security valuations reflected in the financial statements may differ from the value the Fund ultimately realizes upon sale of the securities. The financial statements have been prepared as of the close of the New York Stock Exchange (“NYSE”) on October 31, 2011.
Investment Valuation: The Funds generally value their securities based on market prices determined at the close of regular trading on the New York Stock Exchange (“NYSE”), normally 4:00 p.m. Eastern Time, on each day the NYSE is open for trading. A Fund’s net asset value (“NAV”) is computed by dividing the value of all assets of the Fund (including accrued interest and dividends), less all liabilities (including accrued expenses and dividends declared but unpaid), by the total number of shares outstanding.
For equity securities that are traded on an exchange, the market price is usually the closing sale or official closing price on that exchange. In the case of equity securities not traded on an exchange, or if such closing prices are not otherwise available, the market price is typically determined by independent third party pricing vendors approved by the Board of Trustees (the “Board”) using a variety of pricing techniques and methodologies. The market price for debt obligations is generally the price supplied by an independent third-party pricing service approved by the Board, which may use a matrix, formula or other objective method that takes into consideration market indices, yield curves and other specific adjustments. Short–term debt obligations that will mature in 60 days or less are valued at amortized cost, unless it is determined that using this method would not reflect an investment’s fair value. If vendors are unable to supply a price, or if the price supplied is deemed to be unreliable, the market price may be determined using quotations received from one or more brokers–dealers that make a market in the security.
34 | www.GrandeurPeakGlobal.com |
Table of Contents
Grandeur Peak FundsSM | Notes to Financial Statements | |
| October 31, 2011 (Unaudited) |
The Funds will use a fair valuation model provided by an independent pricing service, which is intended to reflect fair value when a security’s value or a meaningful portion of the Fund’s portfolio is believed to have been materially affected by a valuation event that has occurred between the close of the exchange or market on which the security is traded and the close of the regular trading day on the NYSE. The Funds’ valuation procedures set forth certain triggers which instruct when to use the fair valuation model. The value assigned to a security by the fair valuation model is a determination of fair value made under the Funds’ valuation procedures and under the supervision of the Board of Trustees. In such a case, a Fund’s value for a security may be different from the last sales price (or the latest closing price) and there is no guarantee that a fair valued security will be sold at the price at which a Fund is valuing the security.
Forward currency exchange contracts have a market value determined by the prevailing foreign currency exchange daily rates and current foreign currency exchange forward rates. The foreign currency exchange forward rates are calculated using an automated system that estimates rates on the basis of the current day foreign currency exchange rates and forward foreign currency exchange rates supplied by a pricing service. Foreign exchange rates and forward foreign currency exchange rates may generally be obtained at the close of the NYSE, normally 4:00 p.m. Eastern Time.
Redeemable securities issued by open-end registered investment companies are valued at the investment company’s or subsidiary’s applicable net asset value, with the exception of exchange-traded open-end investment companies, which are priced as equity securities.
Investment securities that are primarily traded on foreign securities exchanges are valued at the preceding closing values of such securities on their respective exchanges, except when an occurrence subsequent to the time a value was so established is likely to have changed such value. In such an event, the fair value of those securities are determined in good faith through consideration of other factors in accordance with procedures established by and under the general supervision of the Board of Trustees.
When such prices or quotations are not available, or when the Fair Value Committee appointed by the Board believes that they are unreliable, securities may be priced using fair value procedures approved by the Board. The Funds may also use fair value procedures if the Fair Value Committee determines that a significant event has occurred between the time at which a market price is determined and the time at which a Fund’s NAV is calculated. In particular, the value of non-U.S. securities may be materially affected by events occurring after the close of the foreign exchange on which they are traded, but before a Fund prices its shares.
Investment Transactions: Investment and shareholder transactions are accounted for on the date the investments are purchased or sold (trade date). Realized gains and losses from investment transactions are reported on an identified cost basis. Interest income, which includes accretion of discounts, is accrued and recorded as earned. Dividend income is recognized on the ex-dividend date or for certain foreign securities, as soon as information is available to the Fund.
Foreign Securities: The Funds may directly purchase securities of foreign issuers. Investing in securities of foreign issuers involves special risks not typically associated with investing in securities of U.S. issuers. The risks include possible reevaluation of currencies, the inability to repatriate foreign currency, less complete financial information about companies and possible future adverse political and economic developments. Moreover, securities of many foreign issuers and their markets may be less liquid and their prices more volatile than those of securities of comparable U.S. issuers.
Semi-Annual Report (Unaudited) | October 31, 2011 | 35 |
Table of Contents
Grandeur Peak FundsSM | Notes to Financial Statements | |
| October 31, 2011 (Unaudited) |
Foreign Currency Translation: The books and records of the Funds are maintained in U.S. dollars. Investment valuations and other assets and liabilities initially expressed in foreign currencies are converted each business day into U.S. dollars based upon current exchange rates. Prevailing foreign exchange rates may generally be obtained at the close of the NYSE (normally, 4:00 p.m. Eastern time). The portion of realized and unrealized gains or losses on investments due to fluctuations in foreign currency exchange rates is not separately disclosed and is included in realized and unrealized gains or losses on investments, when applicable.
Foreign Currency Spot Contracts: The Funds may enter into foreign currency spot contracts to facilitate transactions in foreign securities or to convert foreign currency receipts into U.S. dollars. A foreign currency spot contract is an agreement between two parties to buy and sell currencies at the current market rate, for settlement generally within two business days. The U.S. dollar value of the contracts is determined using current currency exchange rates supplied by a pricing service. The contract is marked-to-market daily for settlements beyond one day and any change in market value is recorded as an unrealized gain or loss. When the contract is closed, the Fund records a realized gain or loss equal to the difference between the value on the open and close date. Losses may arise from changes in the value of the foreign currency, or if the counterparties do not perform under the contract’s terms. The maximum potential loss from such contracts is the aggregate face value in U.S. dollars at the time the contract was opened.
Fair Value Measurements: The Funds disclose the classification of their fair value measurements following a three-tier hierarchy based on the inputs used to measure fair value. Inputs refer broadly to the assumptions that market participants would use in pricing the asset or liability, including assumptions about risk. Inputs may be observable or unobservable. Observable inputs reflect the assumptions market participants would use in pricing the asset or liability that are developed based on market data obtained from sources independent of the reporting entity. Unobservable inputs reflect the reporting entity’s own assumptions about the assumptions market participants would use in pricing the asset or liability that are developed based on the best information available.
Various inputs are used in determining the value of the Fund’s investments as of the end of the reporting period. When inputs used fall into different levels of the fair value hierarchy, the level in the hierarchy within which the fair value measurement falls is determined based on the lowest level input that is significant to the fair value measurement in its entirety. The designated input levels are not necessarily an indication of the risk or liquidity associated with these investments. These inputs are categorized in the following hierarchy under applicable financial accounting standards:
Level 1 – | Unadjusted quoted prices in active markets for identical investments, unrestricted assets or liabilities that a Fund has the ability to access at the measurement date; | |
Level 2 – | Quoted prices which are not active, quoted prices for similar assets or liabilities in active markets or inputs other than quoted prices that are observable (either directly or indirectly) for substantially the full term of the asset or liability; and | |
Level 3 – | Significant unobservable prices or inputs (including the Fund’s own assumptions in determining the fair value of investments) where there is little or no market activity for the asset or liability at the measurement date. | |
36 | www.GrandeurPeakGlobal.com |
Table of Contents
Grandeur Peak FundsSM | Notes to Financial Statements | |
| October 31, 2011 (Unaudited) |
The following is a summary of each input used to value the Funds as of October 31, 2011:
Investments in Securities at Value | Level 1 - Quoted and Unadjusted Prices | Level 2 - Other Significant Observable Inputs | Level 3 - Significant Unobservable Inputs | Total | ||||||||||||
Grandeur Peak Global Opportunities | ||||||||||||||||
Common Stocks | ||||||||||||||||
Australia | $ | – | $ | 1,089,137 | $ | – | $ | 1,089,137 | ||||||||
Belgium | – | 490,160 | – | 490,160 | ||||||||||||
Brazil | 1,697,712 | – | – | 1,697,712 | ||||||||||||
Britain | 124,290 | 1,802,891 | – | 1,927,181 | ||||||||||||
Canada | 2,047,284 | – | – | 2,047,284 | ||||||||||||
China | 630,653 | 825,442 | – | 1,456,095 | ||||||||||||
Colombia | 129,686 | – | – | 129,686 | ||||||||||||
Denmark | – | 63,407 | – | 63,407 | ||||||||||||
France | 60,919 | 796,215 | – | 857,134 | ||||||||||||
Germany | – | 938,839 | – | 938,839 | ||||||||||||
Hong Kong | – | 929,166 | – | 929,166 | ||||||||||||
India | 405,818 | – | – | 405,818 | ||||||||||||
Ireland | 108,276 | 133,179 | – | 241,455 | ||||||||||||
Israel | – | 53,941 | – | 53,941 | ||||||||||||
Italy | – | 21,688 | – | 21,688 | ||||||||||||
Japan | – | 1,102,241 | – | 1,102,241 | ||||||||||||
Luxembourg | – | 664,534 | – | 664,534 | ||||||||||||
Malaysia | – | 220,470 | – | �� | 220,470 | |||||||||||
Mexico | 19,329 | – | – | 19,329 | ||||||||||||
Netherlands | 114,188 | 202,923 | – | 317,111 | ||||||||||||
New Zealand | – | 56,330 | – | 56,330 | ||||||||||||
Norway | – | 148,222 | – | 148,222 | ||||||||||||
Singapore | – | 317,322 | – | 317,322 | ||||||||||||
South Africa | 29,219 | 432,201 | – | 461,420 | ||||||||||||
South Korea | – | 963,578 | – | 963,578 | ||||||||||||
Sweden | – | 785,303 | – | 785,303 | ||||||||||||
Switzerland | – | 98,361 | – | 98,361 | ||||||||||||
Taiwan | – | 548,326 | – | 548,326 | ||||||||||||
United Arab Emirates | – | 106,871 | – | 106,871 | ||||||||||||
United States | 8,271,746 | – | – | 8,271,746 | ||||||||||||
Exchange Traded Funds | 1,010,877 | – | – | 1,010,877 | ||||||||||||
Short Term Investments | 4,315,149 | – | – | 4,315,149 | ||||||||||||
Total | $ | 18,965,146 | $ | 12,790,747 | $ | – | $ | 31,755,893 | ||||||||
Semi-Annual Report (Unaudited) |October 31, 2011 | 37 |
Table of Contents
Grandeur Peak FundsSM | Notes to Financial Statements | |
| October 31, 2011 (Unaudited) |
Investments in Securities at Value | Level 1 - Quoted and Unadjusted Prices | Level 2 - Other Significant Observable Inputs | Level 3 - Significant Unobservable Inputs | Total | ||||||||||||
Grandeur Peak International Opportunities | ||||||||||||||||
Common Stocks | ||||||||||||||||
Australia | $ | – | $ | 747,860 | $ | – | $ | 747,860 | ||||||||
Belgium | – | 214,163 | – | 214,163 | ||||||||||||
Brazil | 949,072 | – | – | 949,072 | ||||||||||||
Britain | 85,317 | 1,032,137 | – | 1,117,454 | ||||||||||||
Canada | 1,018,343 | – | – | 1,018,343 | ||||||||||||
China | 386,495 | 567,320 | – | 953,815 | ||||||||||||
Colombia | 53,827 | – | – | 53,827 | ||||||||||||
Denmark | – | 35,131 | – | 35,131 | ||||||||||||
France | 43,195 | 441,660 | – | 484,855 | ||||||||||||
Germany | – | 562,885 | – | 562,885 | ||||||||||||
Hong Kong | – | 521,620 | – | 521,620 | ||||||||||||
Ireland | 53,424 | 120,551 | – | 173,975 | ||||||||||||
Israel | – | 77,824 | – | 77,824 | ||||||||||||
Italy | – | 24,763 | – | 24,763 | ||||||||||||
Japan | – | 682,242 | – | 682,242 | ||||||||||||
Luxembourg | – | 281,278 | – | 281,278 | ||||||||||||
Malaysia | – | 134,363 | – | 134,363 | ||||||||||||
Mexico | 15,419 | – | – | 15,419 | ||||||||||||
Netherlands | 59,189 | 135,876 | – | 195,065 | ||||||||||||
New Zealand | – | 61,073 | – | 61,073 | ||||||||||||
Norway | – | 95,621 | – | 95,621 | ||||||||||||
Singapore | – | 256,683 | – | 256,683 | ||||||||||||
South Africa | 27,008 | 292,452 | – | 319,460 | ||||||||||||
South Korea | – | 601,034 | – | 601,034 | ||||||||||||
Sweden | – | 400,077 | – | 400,077 | ||||||||||||
Switzerland | – | 67,416 | – | 67,416 | ||||||||||||
Taiwan | – | 374,847 | – | 374,847 | ||||||||||||
United Arab Emirates | – | 39,641 | – | 39,641 | ||||||||||||
Exchange Traded Funds | 769,501 | – | – | 769,501 | ||||||||||||
Short Term Investments | 752,965 | – | – | 752,965 | ||||||||||||
Total | $ | 4,213,755 | $ | 7,768,517 | $ | – | $ | 11,982,272 | ||||||||
For the period ended October 31, 2011, the Funds did not have any significant transfers between Level 1 and Level 2 securities. As such, international securities can transfer between Level 1 and Level 2 based on triggers being met without disclosure detailing the transfers into and out of Level 1 and Level 2.
Forward Foreign Currency Transactions: The Funds may engage in currency transactions with counterparties to hedge the value of portfolio securities denominated in particular currencies against fluctuations in relative value, to gain or reduce exposure to certain currencies, or to generate income or gains. All commitments are marked to market daily at the applicable exchange rates and any resulting unrealized gains or losses are recorded in the Fund’s financial statements. The Funds record realized gains or losses at the time a forward contract is offset by entry into a closing transaction or extinguished by delivery of the currency. The Funds had no open forward foreign currency contracts at October 31, 2011.
38 | www.GrandeurPeakGlobal.com |
Table of Contents
Grandeur Peak FundsSM | Notes to Financial Statements | |
| October 31, 2011 (Unaudited) |
Trust Expenses: Some expenses of the Trust can be directly attributed to a Fund. Expenses which cannot be directly attributed to the Funds are apportioned among all Funds in the Trust based on average net assets of each Fund.
Fund Expenses: Expenses that are specific to a Fund or class of shares of a Fund are charged directly to that Fund or share class. Expenses that are common to all Funds generally are allocated among the Funds in proportion to their average daily net assets.
For Funds offering multiple share classes, all of the realized and unrealized gains and losses and net investment income, other than class specific expenses, are allocated daily to each class in proportion to its average daily net assets. Fees provided under the distribution (Rule 12b-1) and/or shareholder service plans for a particular class of the Fund are charged to the operations of such class.
Federal Income Taxes: The Funds comply with the requirements under Subchapter M of the Internal Revenue Code applicable to regulated investment companies and intend to distribute substantially all of their net taxable income and net capital gains, if any, each year. The Funds are not subject to income taxes to the extent such distributions are made. As of and during the period ended October 31, 2011, the Funds did not have a liability for any unrecognized tax benefits in the accompanying financial statements. The Funds file income tax returns in the U.S. federal jurisdiction and Colorado.
Distributions to Shareholders: The Funds normally pay dividends and distributes capital gains, if any, on an annual basis. Income dividend distributions are derived from interest and other income the Funds receive from their investments, including distributions of short term capital gains. Capital gain distributions are derived from gains realized when each Fund sells a security it has owned for more than a year. The Funds may make additional distributions and dividends at other times if the portfolio manager believes doing so may be necessary for the Funds to avoid or reduce taxes. Net investment income/(loss) and net realized gain/(loss) may differ for financial statement and tax purposes. The character of distributions made during the year from net investment income or net realized gains may differ from its ultimate characterization for federal income tax purposes. Also, due to the timing of dividend distributions, the fiscal year in which amounts are distributed may differ from the fiscal year in which the income or realized gain were recorded by the Funds. During the period ended October 31, 2011, the Funds did not make any distributions.
Semi-Annual Report (Unaudited) |October 31, 2011 | 39 |
Table of Contents
Grandeur Peak FundsSM | Notes to Financial Statements | |
| October 31, 2011 (Unaudited) |
Unrealized Appreciation and Depreciation on Investments: The differences between book-basis and tax-basis are primarily due to the deferral of post October losses and wash sale losses. As of October 31, 2011, the cost of securities on a tax basis and gross unrealized appreciation/ (depreciation) on investments for federal income tax purposes were as follows:
| Grandeur Peak Global Opportunities | Grandeur Peak International Opportunities | |||||||
Gross unrealized appreciation | $ | 1,026,471 | $ | 455,414 | ||||
Gross unrealized depreciation | (1,143,441) | (757,425) | ||||||
Net unrealized appreciation | (116,970) | (302,011) | ||||||
Cost of investments for income tax purposes | $ | 31,872,863 | $ | 12,284,283 | ||||
3. SECURITIES TRANSACTIONS
The cost of purchases and proceeds from sales of securities during the period ended October 31, 2011, were as follows:
| Grandeur Peak Global Opportunities | Grandeur Peak International Opportunities | |||||||
| Purchases | $ | 20,066,180 | $ | 6,793,173 | ||||
| Sales | 1,092,767 | 798,351 | ||||||
4. SHARES OF BENEFICIAL INTEREST
The capitalization of the Trust consists of an unlimited number of shares of beneficial interest with no par value per share. Holders of the shares of the Funds of the Trust have one vote for each share held and a proportionate fraction of a vote for each fractional share. All shares issued and outstanding are fully paid and are non-assessable, transferable and redeemable at the option of the shareholder. Shares have no pre-emptive rights.
Shares redeemed within 60 days of purchase may incur a 2% short-term redemption fee deducted from the redemption amount. For the period ended October 31, 2011, the Funds did not receive any redemption fees.
Beneficial Ownership: The beneficial ownership, either directly or indirectly, of more than 25% of the voting securities of any class a Fund creates a presumption of control of the Fund under Section 2(a)(9) of the 1940 Act. As of October 31, 2011, the following entities owned beneficially 25% or greater of the Fund’s outstanding shares. The shares are held under omnibus accounts (whereby the transactions of two or more shareholders are combined and carried in the name of the originating broker rather than designated separately).
| Fund | Class | Name | Percentage | |||
Global Opportunities | Institutional | Susanne B. Gardiner Family Trust | 38.17% | |||
Global Opportunities | Institutional | Charles Schwab & Co. | 28.70% | |||
Global Opportunities | Investor | Charles Schwab & Co. | 88.66% | |||
International Opportunities | Institutional | Susanne B. Gardiner Family Trust | 69.82% | |||
International Opportunities | Investor | Charles Schwab & Co. | 94.13% |
40 | www.GrandeurPeakGlobal.com |
Table of Contents
Grandeur Peak FundsSM | Notes to Financial Statements | |
| October 31, 2011 (Unaudited) |
5. MANAGEMENT AND RELATED-PARTY TRANSACTIONS
Grandeur Peak Global Advisors, LLC (the “Adviser” or “Grandeur Peak Global Advisors”), subject to the authority of the Board, is responsible for the overall management and administration of the Fund’s business affairs. The Adviser manages the investments of the Fund in accordance with the Fund’s investment objective, policies and limitations and investment guidelines established jointly by the Adviser and the Trustees. Pursuant to the Advisory Agreement, (the “Advisory Agreement”), each Fund pays the Adviser an annual management fee of 1.25%, based on the Fund’s average daily net assets. The management fee is paid on a monthly basis.
The Adviser has contractually agreed to limit certain of each Fund’s expenses to 1.75% of the Fund’s average daily net assets in the Investor Class shares and 1.50% of the Fund’s average daily net assets in the Institutional Class shares until August 31, 2013. The Fund may have to repay some of these waivers and reimbursements to the Adviser in the following three years. Pursuant to these agreements, each Fund will reimburse the Adviser for any fee waivers and expense reimbursements made by the Adviser, provided that any such reimbursements made by a Fund to the Adviser will not cause the Fund’s expense limitation to exceed expense limitations in existence at the time the expense was incurred, or at the time of the reimbursement, whichever is lower, and the reimbursement is made within three years after the expenses were incurred.
For the period ended October 31, 2011, the fee waivers and/ or reimbursements were as follows:
| Fund | Fees Waived/ Reimbursed By Advisor | Recoupment of Past Waived Fees By Advisor | Total | |||||||||
Grandeur Peak Global Opportunities | ||||||||||||
Investor Class | $ | 2,897 | $ | 0 | $ | 2,897 | ||||||
Institutional Class | 6,945 | 0 | 6,945 | |||||||||
Grandeur Peak Global Opportunities | ||||||||||||
Investor Class | 3,087 | 0 | 3,087 | |||||||||
Institutional Class | 4,708 | 0 | 4,708 | |||||||||
As of October 31, 2011, the balances of recoupable expenses for each Fund were as follows:
| Fund | 2011 | |||||||||
Grandeur Peak Global Opportunities | ||||||||||
Investor Class | $ | 2,897 | ||||||||
Institutional Class | 6,945 | |||||||||
Grandeur Peak Global Opportunities | ||||||||||
Investor Class | 3,087 | |||||||||
Institutional Class | 4,708 | |||||||||
Distributor: ALPS Distributors, Inc. (an affiliate of ALPS) (“ADI” or the “Distributor”) acts as the distributor of the Fund’s shares pursuant to a Distribution Agreement with the Trust. Shares are sold on a continuous basis by ADI as agent for the Fund, and ADI has agreed to use its best efforts to solicit orders for the sale of the Fund’s shares, although it is not obliged to sell any particular amount of shares. ADI is not entitled to any compensation for its services as Distributor. ADI is registered as a broker-dealer with the Securities and Exchange Commission.
Semi-Annual Report (Unaudited) | October 31, 2011 | 41 |
Table of Contents
Grandeur Peak FundsSM | Notes to Financial Statements | |
| October 31, 2011 (Unaudited) |
Each Fund has adopted a Distribution and Services (12b-1) Plan pursuant to Rule 12b- 1 of the 1940 Act (the “Plan”) for its Investor Class shares. The Plan allows a Fund to use Investor Class assets to pay fees in connection with the distribution and marketing of Investor Class shares and/or the provision of shareholder services to Investor Class shareholders. The Plan permits payment for services in connection with the administration of plans or programs that use Investor Class shares of the Fund as their funding medium and for related expenses. The Plan permits a Fund to make total payments at an annual rate of up to 0.25% of the Fund’s average daily net assets attributable to its Investor Class shares. The expenses of the Plan are reflected as distribution and service fees in the Statement of Operations.
6. INDEMNIFICATIONS
Under the Trust’s organizational documents, its officers and Trustees are indemnified against certain liability arising out of the performance of their duties to the Trust. Additionally, in the normal course of business, the Trust enters into contracts with service providers that may contain general indemnification clauses. The Trust’s maximum exposure under these arrangements is unknown, as this would involve future claims that may be made against the Trust that have not yet occurred.
7. SUBSEQUENT EVENTS
Management has evaluated whether any events or transactions occurred subsequent to October 31, 2011 through the date of issuance of the Fund’s financial statements and determined that there were no other material events or transactions that would require recognition or disclosure in the Fund’s financial statements.
42 | www.GrandeurPeakGlobal.com |
Table of Contents
Grandeur Peak FundsSM | Additional Information | |
| October 31, 2011 (Unaudited) |
1. FUND HOLDINGS
The Fund files its complete schedule of portfolio holdings with the Securities and Exchange Commission (the “SEC”) for the first and third quarters of each fiscal year on Form N-Q within 60 days after the end of the period. Copies of the Funds’ Form N-Q are available without charge on the SEC website at http://www.sec.gov. You may also review and copy the Form N-Q at the SEC’s Public Reference Room in Washington, DC. For more information about the operation of the Public Reference Room, please call the SEC at 1-800-SEC-0330.
2. FUND PROXY VOTING POLICIES, PROCEDURES AND SUMMARIES
The Funds policies and procedures used in determining how to vote proxies and information regarding how the Fund voted proxies relating to portfolio securities during the most recent prior 12-month period ending June 30 will be available without charge, (1) upon request, by calling 855-377-PEAK(7325) and (2) on the SEC’s website at http://www.sec.gov.
3. DISCLOSURE REGARDING APPROVAL OF FUND ADVISORY AGREEMENT
On September 13, 2011, the Trustees met in person to discuss, among other things, the approval of the Investment Advisory Agreement between the Trust and Grandeur Peak Global Advisors (the “Grandeur Peak Fund Advisory Agreement”) in accordance with Section 15(c) of the 1940 Act. The Independent Trustees met with independent legal counsel during executive session and discussed the Grandeur Peak Fund Advisory Agreement and other related materials.
In approving the Grandeur Peak Fund Advisory Agreement, the Trustees, including the Independent Trustees, considered the following factors with respect to the Grandeur Peak Fund:
Investment Advisory Fee Rate: The Trustees reviewed and considered the contractual annual advisory fee to be paid by the Trust, on behalf of the Grandeur Peak Funds, to Grandeur Peak Global Advisors of 1.25% of each the Grandeur Peak Funds’ daily average net assets, in light of the extent and quality of the advisory services to be provided by Grandeur Peak Advisors to the Grandeur Peak Funds.
The Trustees considered the information they received comparing the Grandeur Peak Funds’ contractual annual advisory fee and overall expenses with those of funds in both the relevant expense group and universe of funds provided by Morningstar, an independent provider of investment company data.
Based on such information, the Trustees further determined that the contractual annual advisory fee of 1.25% of each of the Grandeur Peak Funds and the total expense ratio of 1.75% and 1.50% for the Investor Class and Institutional Class, respectively, of each of the Grandeur Peak Funds is comparable to others within the Grandeur Peak Funds’ anticipated peer universe.
Nature, Extent and Quality of the Services under the Grandeur Peak Fund Advisory Agreement: The Trustees received and considered information regarding the nature, extent and quality of services provided to the Grandeur Peak Funds under the Grandeur Peak Fund Advisory Agreement. The Trustees reviewed certain background materials supplied by Grandeur Peak Global Advisors in its presentation, including its Form ADV.
Semi-Annual Report (Unaudited) | October 31, 2011 | 43 |
Table of Contents
Grandeur Peak FundsSM | Additional Information | |
| October 31, 2011 (Unaudited) |
The Trustees reviewed and considered Grandeur Peak Global Advisors’ investment advisory personnel, its history as an asset manager, its performance and the amount of assets currently under management by Grandeur Peak Global Advisors. The Trustees also reviewed the research and decision-making processes utilized by Grandeur Peak Global Advisors, including the methods adopted to seek to achieve compliance with the investment objectives, policies and restrictions of the Grandeur Peak Funds.
The Trustees considered the background and experience of Grandeur Peak Global Advisors’ management in connection with the Grandeur Peak Funds, including reviewing the qualifications, backgrounds and responsibilities of the management team primarily responsible for the day-to-day portfolio management of the Grandeur Peak Funds and the extent of the resources devoted to research and analysis of actual and potential investments.
The Trustees also reviewed, among other things, Grandeur Peak Global Advisors’ insider trading policies and procedures and its Code of Ethics.
Performance: The Trustees noted that since the Grandeur Peak Funds had not yet begun operations, there was no fund performance to be reviewed or analyzed at this time. The Trustees considered Grandeur Peak Global Advisors’ reputation generally and its investment techniques, risk management controls and decision-making processes.
The Adviser’s Profitability: The Trustees received and considered a projected profitability analysis prepared by Grandeur Peak Global Advisors based on the fees payable under the Grandeur Peak Fund Advisory Agreement. The Trustees considered the profits, if any, anticipated to be realized by Grandeur Peak Global Advisors in connection with the operation of the Grandeur Peak Funds. The Board then reviewed Grandeur Peak Global Advisors’ pro forma five-year income statement in order to analyze the financial condition and stability and profitability of the adviser.
Economies of Scale: The Trustees considered whether economies of scale in the provision of services to the Grandeur Peak Funds will be passed along to the shareholders under the proposed agreements.
Other Benefits to the Adviser: The Trustees reviewed and considered any other benefits derived or to be derived by Grandeur Peak Global Advisors from its relationship with the Grandeur Peak Funds, including soft dollar arrangements.
In selecting Grandeur Peak Global Advisors as the Grandeur Peak Funds’ investment adviser and approving the Grandeur Peak Fund Advisory Agreement and the fees charged under this agreement, the Trustees concluded that no single factor reviewed by the Trustees was identified by the Trustees to be determinative as the principal factor in whether to approve the Grandeur Peak Fund Advisory Agreement. Further, the Independent Trustees were advised by separate independent legal counsel throughout the process. The Trustees, including all of the Independent Trustees, concluded that:
§ | the investment advisory fees to be received by Grandeur Peak Global Advisors with respect to the Grandeur Peak Funds were comparable to others within each of the Grandeur Peak Funds’ peer universe; |
44 | www.GrandeurPeakGlobal.com |
Table of Contents
Grandeur Peak FundsSM | Additional Information | |
| October 31, 2011 (Unaudited) |
§ | the nature, extent and quality of services to be rendered by Grandeur Peak Global Advisors under the Grandeur Peak Fund Advisory Agreement were adequate; | |
§ | the profit, if any, anticipated to be realized by Grandeur Peak Global Advisors in connection with the operation of the Grandeur Peak Funds is not unreasonable to the Grandeur Peaks Funds; and | |
§ | there were no material economies of scale or other incidental benefits accruing to Grandeur Peak Global Advisors in connection with its relationship with the Grandeur Peak Funds. | |
Based on the Trustees’ deliberations and their evaluation of the information described above, the Trustees, including all of the Independent Trustees, concluded that Grandeur Peak Global Advisors’ compensation for investment advisory services is consistent with the best interests of the Grandeur Peak Funds and their shareholders.
Semi-Annual Report (Unaudited) | October 31, 2011 | 45 |
Table of Contents
Table of Contents
| Item 2. | Code of Ethics. |
Not applicable to this Report.
| Item 3. | Audit Committee Financial Expert. |
Not applicable to this Report.
| Item 4. | Principal Accountant Fees and Services. |
Not applicable to this Report.
| Item 5. | Audit Committee of Listed Registrants. |
Not applicable to Registrant.
| Item 6. | Investments. |
| (a) | Schedule of Investments is included as part of the Reports to Stockholders filed under Item 1 of this Form N-CSR. |
| (b) | Not applicable. |
| Item 7. | Disclosure of Proxy Voting Policies and Procedures for Closed-End Management Investment Companies. |
Not applicable to Registrant.
| Item 8. | Portfolio Managers of Closed-End Management Investment Companies. |
Not applicable to Registrant.
Table of Contents
| Item 9. | Purchases of Equity Securities by Closed-End Management Investment Company and Affiliated Purchasers. |
Not applicable to Registrant.
| Item 10. | Submission of Matters to a Vote of Security Holders. |
There have been no material changes to the procedures by which shareholders may recommend nominees to the Registrant’s Board of Trustees, where those changes were implemented after the Registrant last provided disclosure in response to the requirements of Item 407(c)(2)(iv) of Regulation S-K, or this Item.
| Item 11. | Controls and Procedures. |
| (a) | The Registrant’s principal executive officer and principal financial officer have concluded that the Registrant’s disclosure controls and procedures (as defined in Rule 30a-3(c) under the Investment Company Act of 1940, as amended) are effective based on their evaluation of these controls and procedures as of a date within 90 days of the filing date of this report. |
| (b) | There was no change in the Registrant’s internal control over financial reporting (as defined in Rule 30a-3(d) under the Investment Company Act of 1940, as amended) that occurred during the second fiscal quarter of the period covered by this report that has materially affected, or is reasonably likely to materially affect, the Registrant’s internal control over financial reporting. |
| Item 12. | Exhibits. |
| (a)(1) | Not applicable to this Report. |
| (a)(2) | The certifications required by Rule 30a-2(a) of the Investment Company Act of 1940, as amended, and Section 302 of the Sarbanes-Oxley Act of 2002 are attached hereto as Exhibit 99.Cert. |
| (a)(3) | Not applicable to Registrant. |
| (b) | The certifications by the Registrant’s principal executive officer and principal financial officer, as required by Rule 30a-2(b) of the Investment Company Act of 1940, as amended, and Section 906 of the Sarbanes-Oxley Act of 2002 are attached hereto as Exhibit 99.906Cert. |
Table of Contents
SIGNATURES
Pursuant to the requirements of the Securities Exchange Act of 1934 and the Investment Company Act of 1940, the Registrant has duly caused this report to be signed on its behalf by the undersigned, thereunto duly authorized.
FINANCIAL INVESTORS TRUST
| By: | /s/ Edmund J. Burke | |
| Edmund J. Burke (Principal Executive Officer) | ||
| President | ||
| Date: | January 9, 2012 | |
Pursuant to the requirements of the Securities Exchange Act of 1934 and the Investment Company Act of 1940, this report has been signed below by the following persons on behalf of the Registrant and in the capacities and on the dates indicated.
| FINANCIAL INVESTORS TRUST | ||
| By: | /s/ Edmund J. Burke | |
| Edmund J. Burke (Principal Executive Officer) | ||
| President | ||
| Date: | January 9, 2012 | |
| By: | /s/ Jeremy O. May | |
| Jeremy O. May (Principal Financial Officer) | ||
| Treasurer | ||
| Date: | January 9, 2012 | |