Table of Contents
UNITED STATES
SECURITIES AND EXCHANGE COMMISSION
Washington, D.C. 20549
FORM N-CSR
CERTIFIED SHAREHOLDER REPORT OF REGISTERED
MANAGEMENT INVESTMENT COMPANIES
Investment Company Act file number: 811-8194
FINANCIAL INVESTORS TRUST
(exact name of Registrant as specified in charter)
1290 Broadway, Suite 1100, Denver, Colorado 80203
(Address of principal executive offices) (Zip code)
David T. Buhler, Secretary
Financial Investors Trust
1290 Broadway, Suite 1100
Denver, Colorado 80203
(Name and address of agent for service)
Registrant’s telephone number, including area code: 303-623-2577
Date of fiscal year end: April 30
Date of reporting period: May 1, 2012 - October 31, 2012
Table of Contents
| Item 1. | Reports to Stockholders. |
Table of Contents
Table of Contents
| 1 | ||||
| 5 | ||||
| 7 | ||||
| 8 | ||||
| 9 | ||||
| 10 | ||||
| 13 | ||||
| 17 | ||||
| 19 | ||||
| 20 | ||||
| 21 | ||||
| 22 | ||||
| 26 | ||||
| 29 | ||||
| 32 | ||||
| 33 | ||||
| 34 | ||||
| 35 | ||||
| 38 | ||||
| 42 | ||||
| 45 | ||||
| 46 | ||||
| 47 | ||||
| 48 | ||||
Jefferies Asset Management Commodity Strategy Allocation Fund | ||||
| 54 | ||||
| 57 | ||||
| 61 | ||||
| 62 | ||||
| 63 | ||||
| 64 | ||||
| 67 | ||||
| 79 | ||||
| 91 | ||||
| 93 | ||||
| 94 | ||||
| 99 | ||||
| 116 | ||||
| 138 | ||||
| 142 | ||||
Table of Contents
| October 31, 2012 (Unaudited) |
Performance
The ALPS | Kotak India Growth Fund’s (the “Fund”) Class A Shares, INDAX, during the 6-month period ended 10/31/2012, delivered a net return of 8.39% at Net Asset Value (Class A delivered a net return of 2.41% at MOP, Class C, INFCX, was 6.98% with CDSC, Class I, INDIX, was 8.61%). The Fund’s performance was above that of the S&P® CNX 500 Index (“CNX 500”) -5.53%, over the same period, without taking into account sales charges for Class A and C Shares.
During the period, the Indian equity markets rallied along with the global markets with broader Indian indices like CNX 500 returning 5.53%, S&P® CNX Nifty Index (“Nifty”)7 returning 4.75% and S&P® CNX Midcap Index (“CNX MIDCAP”)8 returning 1.65% (all in United States Dollar (“USD”) terms). The investment environment during this period was impacted by the factors described below, with May and September marking the worst and best monthly change respectively (CNX 500 returned -12.49% in May, 8.23% in June, -1.38% in July, 0.61% in August, 14.35% in September, and -3.07% in October).
| « | Global equity markets rallied in the period with tension in Euro-area countries subsiding as the European Central Bank unveiled the European Stability Mechanism. In the U.S., the Fed’s announcement of the third and open ended Quantitative Easing (QE) focusing on Mortgage Backed Securities and extension of operation twist1 until December 2012 also added to market optimism. In India, the announcement of several key reforms activities and strong FII (Foreign Institutional Investor) flows of around USD 9.4 billion during the period helped the performance of the Indian equity market and counter the weakness seen at the beginning of the period due to uncertainty on the GAAR2 (General Anti-Avoidance Rule) issue. |
| « | During the period, the Reserve Bank of India (RBI) cut the Cash Reserve Ratio (CRR), refraining from cutting interest rates (Repo3 and Reverse repo rate4 is maintained at 8% and 7% respectively). Thus, in the period, RBI cuts CRR by 25 basis points5 (bps), bringing CRR to 4.50% on its 09/17/2012 policy meeting. The CRR cut will inject Indian Rupee (INR) 170 billion to the banking system. RBI clearly has been worried on the inflation front and has refrained from cutting rates on that account. The policy document states a few times that the rate cuts in April were front loaded in nature and were a result of the anticipated changes with respect to containment of the fiscal deficit. We continue to expect the RBI to cut interest rate to the cumulative of 50bps for Financial Year (FY) 2013, with rate cut likely to happen from January onwards. |
| « | For the quarter ending June 2012 (Q1FY13), real GDP growth came in at 5.5%, higher than previous quarter number of 5.3% and Bloomberg consensus expectation of 5.2%. Agriculture (2.9% year-on-year) and Construction (10.9% YoY) growth within the Industry category (3.6% YoY) came in as a positive surprise while Services (6.9% YoY v/s 7.9% in previous quarter) growth fell to the lowest since March 2009. Currently Services sector contribute nearly 60% to India GDP followed by Industry (27%) and Agriculture (13%). Post these numbers, we expect the full year FY13 GDP growth to be at best 5.7% and see a potential downward revision in future to the central bank’s estimate of 6.5%. |
| « | The period also saw the INR appreciating in the month of September with strong FII flow, announcement of major reforms activities, and announcement of open-ended QE3 in U.S. Nevertheless, the INR fell back in the month of October due to worsening global risk sentiment and RBI’s macroeconomic assessment where RBI lowered its GDP estimate for FY13 to 5.8% (v/s 6.5% earlier) while increased its inflation estimate for FY13 to 7.5% (v/s 7% earlier). |
| « | India inflation number (Wholesale price Index - WPI) averaged to 7.6% during the period with the October inflation number standing at 7.45% (v/s September’s 7.8%), better than the Bloomberg consensus expectation of 7.9%. All three broad components - primary articles, fuel and power, and manufactured product inflation - rose at slower pace than September’s. Core inflation also slowed down to a 4-month low at 5.2% (v/s September’s 5.6%) while food inflation also fell substantially. |
| « | The Government also announced several key reforms activities during the period. In May, the Government finally hiked petrol prices by INR 7.5/liter or around 10% (highest ever) with a follow up on diesel price (INR 5 hike or around 12%) in September. Besides that, in September, the Government also announced series of major reforms activities, surprising the market on the upside. The Government announced the opening of Foreign Direct Investment (FDI) in Multi Brand Retailing (up to 51%), Aviation (up to 49%), Broadcasting (49% to 74%), and Power-Trading Exchanges (up to 49%). In addition, the Government also announced divestment plan which will see the Government divest its holding in MMTC, Oil India, Nalco, and Hindustan Copper. The divestments are expected to cover around half of the divestment plan announced in the union budget last March (INR 300 billion). In October, reforms activities continue with the announcement of FDI in insurance companies (up to 49%) and pension funds (up to 26%). |
| « | The period also saw changes in Finance Ministry of the Government of India. Mr. P. Chidambaram came back as Finance Minister after replacing Mr. Pranab Mukherjee who left the post to become the 13th President of India in July. This has raised expectations of the economic reforms process getting stepped up with some of them eventually materialized in September. |
| « | The Indian Corporate earnings during the period were mixed, with Q2FY13 (quarter ending September 2012) result showing some improvement as compared to previous quarter. The results showed that the Profit after tax growth was led by Cement, Technology, Health Care, and Private Sector Banks. In addition, Technology, Capital Goods & Engineering, and Auto results were mixed. Public sector banks continued to surprise negatively on the asset quality side while Oil & Gas and Telecom sector reported a decline in profits. |
Fund Composition
The Fund is constructed to potentially benefit from the strong macro-economic growth in the Indian economy across four broad themes in India – Consumption led by favorable demographics, Financial Services, Infrastructure and Outsourcing. The Fund has
1 | October 31, 2012
Table of Contents
ALPS | Kotak India Growth Fund | ||
Management Commentary | October 31, 2012 (Unaudited) |
the flexibility to invest across market capitalizations – depending on market conditions, valuation differential, earnings growth, liquidity, etc.
For the 6-month period ending October 31, 2012, sectorally the key changes to the portfolio have been in Capital Goods & Engineering (added 170bps), Auto & Auto Ancillary (added 120bps), Fast Moving Consumer Goods (added 90bps), Banking & Finance (reduced 180bps), Utilities (reduced 140bps), and Infrastructure (reduced 160bps). Thematically, Consumption (at about 34%) and Financials (at about 24%) are the largest themes in the Fund while infrastructure exposure is less than 9% due to poor policy initiatives by the Government. Over the last 6 months, exposure to midcap and small-cap companies in the Fund has moved marginally from 26.25% in April 2012 to 25.69% in October 2012.
Sectorally, the Fund is overweight Pharmaceutical, Information Technology, and Durables while underweight Oil & Gas, Banking & Finance, and Fast Moving Consumer Goods as of 10/31/2012.
Outlook
Post the result season, attention will once again be on further reforms initiatives by the Government. Thus, the winter session in parliament beginning 11/22/2012 will have important implications on the ability of the Government to pass through key reforms. Failure to do so may increase the speculation of an early election in India. The progress of the 2G telecom auctions would also be keenly watched by the market. While the recent credit policy indicated a status quo on policy rates, we continue to expect the RBI to cut interest rate by another 50bps in stages for FY13 starting January 2013.
The U.S. presidential election outcome and the subsequent discussion on fiscal cliff6 may also have a bearing on global markets and may determine the global risk-on/risk-off mode in the near future which would have an implication on emerging market inflows. All these factors would contribute to some volatility in the interim.
We believe we are positioned to capture any positive momentum in the market and also the Fund construction with exposures to Defensive sectors will ensure limited downside in case of any global risk-off affecting Indian markets. As of 10/31/2012, the S&P® CNX 500 Index is trading at 13.91x FY13 and 11.93x FY14 Earnings Per Share (EPS) respectively. S&P® CNX Nifty Index is trading at 14.5x FY13 and 12.82x FY14 EPS respectively. S&P® CNX Midcap Index is trading at 12.01x FY13 and 9.76x FY14 EPS, respectively. With valuations still near long term average and with the confidence building measures through pro reforms policy initiated by the Government, we believe India would continue to remain one of the attractive markets for long term investment.
| 1 | Operation Twist is a program conducted by the U.S. Federal Reserve in late 2011 and 2012 to help stimulate the economy. Operation Twist is the nickname for the Fed’s initiative of buying longer-term Treasuries and simultaneously selling some of the shorter-dated issues it already held in order to bring down long-term interest rates. No additional money printing occurred for this. |
| 2 | Tax Avoidance is an area of concern across the world. The rules are framed in different countries to minimize such avoidance of tax. Such rules in simple terms are known as “General Anti Avoidance Rules” or GAAR. Thus GAAR is a set of general rules enacted so as to check the tax avoidance. |
| 3 | The rate at which the RBI lends money to commercial banks is called repo rate. |
| 4 | The rate at which the RBI borrows money from commercial banks.is called the Reverse Repo rate. |
| 5 | Basis Points or bps is a unit that is equal to 1/100th of 1%, and is used to denote the change in a financial instrument. |
| 6 | Fiscal Cliff is a term used to describe the situation that the U.S. government will face at the end of 2012, when the terms of the Budget Control Act of 2011 are scheduled to go into effect. Fiscal cliff is an USD600bn automatic tax increase and spending cuts to reduce U.S. fiscal deficit that will take effect on 1st Jan 2013 should Congress not act. The U.S. Congressional Budget Office estimated that if no changes are made, there is a high probability that U.S. will fall into recession in 2013. |
| 7 | The S&P CNX 500 is India’s first broad based benchmark of the Indian capital market. The S&P CNX 500 companies are disaggregated into 72 industry indices. Industry weightages in the index reflect the industry weightages in the market. An investor may not invest directly in an index. |
| 8 | The CNX Midcap Index is a free float capitalization-weighted index designed to represent the midcap segment of the market in India. The index was developed with a base value of 1000 as of January 1, 2003. This index replaces the old CNX Midcap 200 Index which was discontinued effective July 18, 2005. |
The views and information discussed in this commentary are as of the date of publication, are subject to change, and may not reflect the writer’s current views. The views expressed represent an assessment of market conditions at a specific point in time, are opinions only and should not be relied upon as investment advice regarding a particular investment or markets in general. Such information does not constitute a recommendation to buy or sell specific securities or investment vehicles. It should not be assumed that any investment will be profitable or will equal the performance of the portfolios or any securities or any sectors mentioned herein. The subject matter contained herein has been derived from several sources believed to be reliable and accurate at the time of compilation. Kotak Mahindra (UK) Limited does not accept any liability for losses either direct or consequential caused by the use of this information.
| 2 | October 31, 2012 |
Table of Contents
ALPS | Kotak India Growth Fund | ||
Management Commentary | October 31, 2012 (Unaudited) |
Performance of $10,000 Initial Investment (for the period ended October 31, 2012)
Comparison of change in value of a $10,000 investment (includes applicable sales loads of 5.50%)
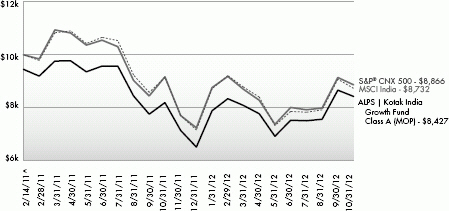
The chart above represents historical performance of a hypothetical investment of $10,000 in the Fund since inception. Past performance does not guarantee future results. This chart does not reflect the deduction of taxes that a shareholder would pay on Fund distributions or the redemption of Fund shares.
3 | October 31, 2012
Table of Contents
ALPS | Kotak India Growth Fund | ||
Management Commentary | October 31, 2012 (Unaudited) |
Average Annual Total Returns (as of October 31, 2012)
| 1 Year | Since Inception ^ | Total Expense Ratio | What you Pay * | |||||
Class A (NAV)1 | 2.84% | -6.49% | 12.50% | 2.00% | ||||
Class A (MOP)2 | -2.76% | -9.52% | ||||||
Class C (NAV)1 | 2.16% | -7.16% | 13.10% | 2.60% | ||||
Class C (CDSC)2 | 1.16% | -7.16% | ||||||
Class I | 3.18% | -6.18% | 12.10% | 1.60% | ||||
S&P® CNX 500 Index3 | -3.06% | -9.03% | ||||||
MSCI India Index Total Return4 | -4.74% | -7.62% |
Performance data quoted represents past performance. Past performance does not guarantee future results. Investment return and principal value of an investment will fluctuate so that an investor’s shares, when sold or redeemed, may be worth more or less than the original cost. Current performance data may be higher or lower than actual data quoted. The Fund imposes a 2.00% redemption fee on shares held for less than 30 days. The Fund imposes a maximum Contingent Deferred Sales Charge (“CDSC”) of 1.00% to shares redeemed within the first 12 months after a purchase, and on Class A shares redeemed within the first 12 months after a purchase in excess of $1 million. Performance shown does not reflect the redemption fee or the CDSC, which if reflected would reduce the performance quoted. For the most current month-end performance data please call 1-866-759-5679.
Investing in the Fund is subject to investment risks, including possible loss of the principal amount invested. Derivatives generally are more sensitive to changes in economic or market conditions than other types of investments; this could result in losses that significantly exceed the funds original investment.
| 1 | Net Asset Value (NAV) is the share price without sales charges. |
| 2 | Maximum Offering Price (MOP) includes sales charges. Class A returns include effects of the Fund’s maximum sales charge of 5.50%; Class C returns include the 1.00% CDSC. |
| 3 | S&P® CNX 500 - India’s first broad based benchmark of the Indian capital market. The S&P® CNX 500 companies are disaggregated into 72 industry indices. Industry weightages in the market. The index is not actively managed and does not reflect any deduction for fees, expenses or taxes. An investor may not invest directly in an index. |
| 4 | MSCI India Index - a free float weighted equity index. It was developed with a base value of 100 as-of December 31,1992. The index is not actively managed and does not reflect any deduction for fees, expenses or taxes. An investor may not invest directly in an index. |
| ^ | Fund inception date of February 14, 2011. |
| * | What You Pay reflects the Advisor’s and Sub-Advisor’s decision to contractually limit expenses through August 31, 2013. Please see the prospectus for additional information. |
The table does not reflect the deduction of taxes that a shareholder would pay on Fund distributions or the redemption of Fund shares.
This Fund is not suitable for all investors and is subject to investment risks, including possible loss of the principal amount invested.
Mutual funds are not insured or guaranteed by the FDIC or by any other government agency or government sponsored agency of the federal government or any state, not deposits, obligations or guaranteed by any bank or its affiliates and are subject to investment risks, including possible loss of the principal amount invested.
Investing in India involves risk and considerations not present when investing in more established securities markets. The Fund may be more susceptible to economic, market, political and local risks of the region than a fund that is more geographically diversified.
Top Ten Long Holdings (as a % of Net Assets)†
|
| |||
ICICI Bank, Ltd. | 5.49 | % | ||
HDFC Bank, Ltd. | 5.24 | % | ||
ITC, Ltd. | 4.71 | % | ||
Infosys, Ltd. | 4.14 | % | ||
Reliance Industries, Ltd. | 3.93 | % | ||
Larsen & Toubro, Ltd. | 3.12 | % | ||
Housing Development Finance Corp. | 2.54 | % | ||
Tata Consultancy Services, Ltd. | 2.33 | % | ||
State Bank of India | 2.30 | % | ||
Tata Motors, Ltd. | 2.03 | % | ||
Top Ten Holdings | 35.83 | % | ||
| † | Holdings are subject to change. Table presents indicative values only. |
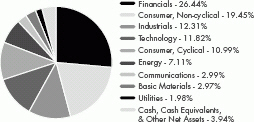
Industry Sector Allocation
(as a % of Net Assets)
4 | October 31, 2012
Table of Contents
ALPS | Kotak India Growth Fund | ||
| Consolidated Statement of Investments | October 31, 2012 (Unaudited) |
| Shares | Value (Note 2) | |||||||
COMMON STOCKS (96.06%) |
| |||||||
Basic Materials (2.97%) |
| |||||||
Mining (2.97%) | ||||||||
Hindalco Industries, Ltd. | 27,497 | $59,204 | ||||||
Hindustan Zinc, Ltd. | 22,610 | 56,075 | ||||||
Sterlite Industries India, Ltd. | 30,357 | 55,925 | ||||||
|
| |||||||
| 171,204 | ||||||||
|
| |||||||
TOTAL BASIC MATERIALS |
| 171,204 | ||||||
|
| |||||||
Communications (2.99%) |
| |||||||
Media (1.64%) | ||||||||
Dish TV India, Ltd.(a) | 40,495 | 56,628 | ||||||
Sun TV Network, Ltd. | 6,200 | 37,854 | ||||||
|
| |||||||
| 94,482 | ||||||||
|
| |||||||
Telecommunications (1.35%) |
| |||||||
Bharti Airtel, Ltd. | 15,647 | 78,215 | ||||||
|
| |||||||
TOTAL COMMUNICATIONS |
| 172,697 | ||||||
|
| |||||||
Consumer, Cyclical (10.99%) |
| |||||||
Apparel (1.18%) | ||||||||
Bata India, Ltd. | 4,315 | 68,360 | ||||||
|
| |||||||
Auto Manufacturers (4.70%) |
| |||||||
Bajaj Auto, Ltd. | 1,780 | 59,971 | ||||||
Mahindra & Mahindra, Ltd. | 5,762 | 94,318 | ||||||
Tata Motors, Ltd. | 24,611 | 117,054 | ||||||
|
| |||||||
| 271,343 | ||||||||
|
| |||||||
Auto Parts & Equipment (1.67%) |
| |||||||
Motherson Sumi Systems, Ltd. | 33,310 | 96,181 | ||||||
|
| |||||||
Home Builders (1.12%) |
| |||||||
Sobha Developers, Ltd. | 9,762 | 64,929 | ||||||
|
| |||||||
Home Furnishings (1.24%) |
| |||||||
TTK Prestige, Ltd. | 1,205 | 71,587 | ||||||
|
| |||||||
Textiles (1.08%) |
| |||||||
Raymond, Ltd. | 8,803 | 62,348 | ||||||
|
| |||||||
TOTAL CONSUMER, CYCLICAL |
| 634,748 | ||||||
|
| |||||||
Consumer, Non-cyclical (19.45%) |
| |||||||
Agriculture (4.71%) |
| |||||||
ITC, Ltd. | 51,865 | 271,866 | ||||||
|
| |||||||
Commercial Services (1.03%) |
| |||||||
Info Edge India, Ltd. | 9,185 | 59,681 | ||||||
|
| |||||||
| Shares | Value (Note 2) | |||||||
Food (2.74%) | ||||||||
Britannia Industries, Ltd. | 7,150 | $64,283 | ||||||
GlaxoSmithKline Consumer Healthcare, Ltd. | 1,663 | 93,724 | ||||||
|
| |||||||
| 158,007 | ||||||||
|
| |||||||
Household Products & Wares (2.64%) |
| |||||||
Hindustan Unilever, Ltd. | 9,246 | 93,753 | ||||||
Marico, Ltd. | 15,044 | 58,450 | ||||||
|
| |||||||
| 152,203 | ||||||||
|
| |||||||
Pharmaceuticals (8.33%) |
| |||||||
Cadila Healthcare, Ltd. | 3,790 | 61,299 | ||||||
Cipla, Ltd. | 9,318 | 62,872 | ||||||
Divi’s Laboratories, Ltd. | 2,807 | 62,627 | ||||||
Dr. Reddy’s Laboratories, Ltd. | 2,748 | 89,514 | ||||||
Glenmark Pharmaceuticals, Ltd. | 8,832 | 70,309 | ||||||
Lupin, Ltd. | 7,378 | 77,564 | ||||||
Sun Pharmaceutical Industries, Ltd. | 4,415 | 56,868 | ||||||
|
| |||||||
| 481,053 | ||||||||
|
| |||||||
TOTAL CONSUMER, NON-CYCLICAL |
| 1,122,810 | ||||||
|
| |||||||
Energy (7.11%) | ||||||||
Oil & Gas (7.11%) | ||||||||
Cairn India, Ltd.(a) | 11,693 | 72,956 | ||||||
Oil & Natural Gas Corp., Ltd. | 22,229 | 110,708 | ||||||
Reliance Industries, Ltd. | 15,199 | 226,787 | ||||||
|
| |||||||
| 410,451 | ||||||||
|
| |||||||
TOTAL ENERGY |
| 410,451 | ||||||
|
| |||||||
Financials (26.44%) |
| |||||||
Banks (19.13%) | ||||||||
Axis Bank, Ltd. | 4,439 | 97,022 | ||||||
HDFC Bank, Ltd. | 25,777 | 302,729 | ||||||
ICICI Bank, Ltd. | 16,289 | 317,004 | ||||||
IndusInd Bank, Ltd. | 15,852 | 106,956 | ||||||
State Bank of India | 3,399 | 132,703 | ||||||
Union Bank of India | 23,672 | 85,760 | ||||||
Yes Bank, Ltd. | 8,201 | 62,608 | ||||||
|
| |||||||
| 1,104,782 | ||||||||
|
| |||||||
Diversified Financial Services (5.15%) |
| |||||||
Bajaj Finance, Ltd. | 3,474 | 83,045 | ||||||
Housing Development Finance Corp. | 10,389 | 146,661 | ||||||
Shriram Transport Finance Co., Ltd. | 5,825 | 67,463 | ||||||
|
| |||||||
| 297,169 | ||||||||
|
| |||||||
Investment Companies (1.17%) |
| |||||||
Bajaj Holdings and Investment, Ltd. | 4,202 | 67,757 | ||||||
|
| |||||||
5 | October 31, 2012
Table of Contents
ALPS | Kotak India Growth Fund | ||
Consolidated Statement of Investments | October 31, 2012 (Unaudited) |
| Shares | Value (Note 2) | |||||||
Real Estate (0.99%) |
| |||||||
DLF, Ltd. | 15,245 | $57,150 | ||||||
|
| |||||||
TOTAL FINANCIALS | 1,526,858 | |||||||
|
| |||||||
Industrials (12.31%) |
| |||||||
Building Materials (4.29%) |
| |||||||
Century Textiles & Industries, Ltd. | 9,806 | 70,278 | ||||||
India Cements, Ltd. | 40,300 | 71,309 | ||||||
Shree Cement, Ltd. | 1,350 | 105,980 | ||||||
|
| |||||||
| 247,567 | ||||||||
|
| |||||||
Engineering & Construction (5.28%) |
| |||||||
Engineers India, Ltd. | 16,243 | 70,489 | ||||||
GMR Infrastructure, Ltd.(a) | 146,340 | 54,317 | ||||||
Larsen & Toubro, Ltd. | 5,978 | 180,022 | ||||||
|
| |||||||
| 304,828 | ||||||||
|
| |||||||
Machinery Diversified (1.55%) |
| |||||||
Thermax, Ltd. | 8,241 | 89,417 | ||||||
|
| |||||||
Metal Fabricate/Hardware (1.19%) |
| |||||||
SKF India, Ltd. | 5,737 | 68,905 | ||||||
|
| |||||||
TOTAL INDUSTRIALS | 710,717 | |||||||
|
| |||||||
Technology (11.82%) | ||||||||
Computers (8.02%) | ||||||||
Infosys, Ltd. | 5,461 | 239,082 | ||||||
Redington India, Ltd. | 59,533 | 89,476 | ||||||
Tata Consultancy Services, Ltd. | 5,507 | 134,431 | ||||||
|
| |||||||
| 462,989 | ||||||||
|
| |||||||
Software (3.80%) | ||||||||
HCL Technologies, Ltd. | 5,325 | 60,011 | ||||||
Oracle Financial Services Software, Ltd.(a) | 1,308 | 70,465 | ||||||
Persistent Systems, Ltd. | 10,013 | 89,034 | ||||||
|
| |||||||
| 219,510 | ||||||||
|
| |||||||
TOTAL TECHNOLOGY | 682,499 | |||||||
|
| |||||||
Utilities (1.98%) | ||||||||
Electric (1.98%) | ||||||||
Power Grid Corp. of India, Ltd. | 26,457 | 55,937 | ||||||
PTC India, Ltd. | 49,600 | 58,606 | ||||||
|
| |||||||
| 114,543 | ||||||||
|
| |||||||
TOTAL UTILITIES | 114,543 | |||||||
|
| |||||||
TOTAL COMMON STOCKS (Cost $5,199,602) | 5,546,527 | |||||||
|
| |||||||
| 7-Day Yield | Shares | Value (Note 2) | ||||||||||
SHORT TERM INVESTMENTS (0.14%) |
| |||||||||||
Money Market Fund (0.14%) |
| |||||||||||
Dreyfus Cash Advantage Fund, Institutional Class | 0.088 | % | 8,207 | $8,207 | ||||||||
|
| |||||||||||
TOTAL SHORT TERM INVESTMENTS (Cost $8,207) |
| 8,207 | ||||||||||
|
| |||||||||||
TOTAL INVESTMENTS (96.20%) (Cost $5,207,809) |
| $5,554,734 | ||||||||||
Other Assets In Excess Of Liabilities (3.80%) |
| 219,572 | ||||||||||
|
| |||||||||||
NET ASSETS (100.00%) |
| $5,774,306 | ||||||||||
|
| |||||||||||
| (a) | Non-Income Producing Security. |
Common Abbreviations:
Ltd. - Limited.
For Fund compliance purposes, the Fund’s industry classifications refer to any one or more of the industry sub-classifications used by one or more widely recognized market indexes or ratings group indexes, and/or as defined by Fund management. This definition may not apply for purposes of this report, which may combine industry sub-classifications for reporting ease. Industries are shown as a percent of net assets. These industry classifications are based on third party definitions and are unaudited. The definitions are industry terms and do not reflect the legal status of any of the investments or the companies in which the Fund has invested.
See Notes to Financial Statements.
6 | October 31, 2012 |
Table of Contents
ALPS | Kotak India Growth Fund | ||
| October 31, 2012 (Unaudited) |
ASSETS | ||||
Investments, at value | $ | 5,554,734 | ||
Cash | 1,173 | |||
Foreign currency, at value (Cost $181,212) | 181,207 | |||
Foreign currency held at broker for futures contracts (Cost $58,056) | 55,211 | |||
Receivable for investments sold | 43,322 | |||
Receivable for shares sold | 23,621 | |||
Dividends receivable | 2,195 | |||
Receivable due from advisor | 27,806 | |||
Prepaid expenses and other assets | 14,352 | |||
Total Assets | 5,903,621 | |||
LIABILITIES | ||||
Payable for investments purchased | 52,250 | |||
Administration and transfer agency fees payable | 25,832 | |||
Distribution and services fees payable | 4,883 | |||
Legal fees payable | 87 | |||
Audit fees payable | 43,640 | |||
Trustees’ fees and expenses payable | 170 | |||
Accrued expenses and other liabilities | 2,453 | |||
Total Liabilities | 129,315 | |||
NET ASSETS | $ | 5,774,306 | ||
NET ASSETS CONSIST OF | ||||
Paid-in capital | $ | 6,081,313 | ||
Accumulated net investment loss | (28,736) | |||
Accumulated net realized loss on investments, future contracts and foreign currency transactions | (622,298) | |||
Net unrealized appreciation on investments and translation of assets and liabilities denominated in foreign currencies | 344,027 | |||
NET ASSETS | $ | 5,774,306 | ||
INVESTMENTS, AT COST | $ | 5,207,809 | ||
PRICING OF SHARES | ||||
Class A: | ||||
Net Asset Value, offering and redemption price per share(a) | $ | 8.91 | ||
Net Assets | $ | 2,915,577 | ||
Shares of beneficial interest outstanding (unlimited number of shares, no par value common stock authorized) | 327,144 | |||
Maximum offering price per share ((NAV/0.9450), based on maximum sales charge of 5.50% of the offering price) | $ | 9.43 | ||
Class C: Net Asset Value, offering and redemption price per share(a) | $ | 8.80 | ||
Net Assets | $ | 650,918 | ||
Shares of beneficial interest outstanding (unlimited number of shares, no par value common stock authorized) | 73,942 | |||
Class I: Net Asset Value, offering and redemption price per share | $ | 8.96 | ||
Net Assets | $ | 2,207,811 | ||
Shares of beneficial interest outstanding (unlimited number of shares, no par value common stock authorized) | 246,324 | |||
| (a) | Redemption price per share may be reduced for any applicable contingent deferred sales charge. For a description of a possible sales charge, please see the Fund’s Prospectus. |
See Notes to Financial Statements.
7 | October 31, 2012
Table of Contents
ALPS | Kotak India Growth Fund | ||
| For the Six Months Ended October 31, 2012 (Unaudited) |
INVESTMENT INCOME | ||||
Dividends | $ | 50,937 | ||
Total Investment Income | 50,937 | |||
EXPENSES | ||||
Investment advisory fees | 29,567 | |||
Administrative and transfer agency fees | 75,817 | |||
Distribution and service fees | ||||
Class A | 4,913 | |||
Class C | 2,380 | |||
Legal fees | 3,309 | |||
Audit fees | 25,987 | |||
Reports to shareholders and printing fees | 505 | |||
State registration fees | 19,975 | |||
Insurance fees | 105 | |||
Custody fees | 36,149 | |||
Trustees’ fees and expenses | 1,026 | |||
Miscellaneous expenses | 11,603 | |||
Total Expense | 211,336 | |||
Less fees waived/reimbursed by investment advisor | ||||
Class A | (86,553) | |||
Class C | (16,556) | |||
Class I | (63,088) | |||
Net Expenses | 45,139 | |||
Net Investment Income | 5,798 | |||
Net realized loss on investments | (328,863) | |||
Net realized gain on futures contracts | 671 | |||
Net realized gain on foreign currency transactions | 249,468 | |||
Net change in unrealized appreciation on investments | 472,183 | |||
Net change in unrealized appreciation on translation of assets and liabilities denominated in foreign currencies | 167 | |||
NET REALIZED AND UNREALIZED GAIN ON INVESTMENTS | 393,626 | |||
NET INCREASE IN NET ASSETS RESULTING FROM OPERATIONS | $ | 399,424 | ||
See Notes to Financial Statements.
8 | October 31, 2012
Table of Contents
ALPS | Kotak India Growth Fund | ||
For the Six Months Ended October 31, 2012 (Unaudited) | For the Year Ended April 30, 2012 | |||||||
OPERATIONS | ||||||||
Net investment income/(loss) | $ | 5,798 | $ | (28,880) | ||||
Net realized loss on investments, futures contracts and foreign currency transactions | (78,724) | (581,197) | ||||||
Net change in unrealized appreciation/(depreciation) on investments, futures contracts and translation of assets and liabilities denominated in foreign currencies | 472,350 | (159,023) | ||||||
Net Increase/(Decrease) in Net Assets Resulting from Operations | 399,424 | (769,100) | ||||||
DISTRIBUTIONS | ||||||||
Dividends to shareholders from net realized gains | ||||||||
Class A | 0 | (1,040) | ||||||
Class C | 0 | (511) | ||||||
Class I | 0 | (1,048) | ||||||
Net Decrease in Net Assets from Distributions | 0 | (2,599) | ||||||
BENEFICIAL INTEREST TRANSACTIONS (NOTE 6) | ||||||||
Shares sold | ||||||||
Class A | 879,021 | 2,225,793 | ||||||
Class C | 202,000 | 604,159 | ||||||
Class I | 470,835 | 1,530,305 | ||||||
Dividends reinvested | ||||||||
Class A | 0 | 923 | ||||||
Class C | 0 | 505 | ||||||
Class I | 0 | 964 | ||||||
Shares redeemed | ||||||||
Class A | (558,078) | (455,302) | ||||||
Class C | (20,247) | (439,459) | ||||||
Class I | (46,990) | (216,102) | ||||||
Net Increase in Net Assets Derived from Beneficial Interest Transactions | 926,541 | 3,251,786 | ||||||
Net increase in net assets | 1,325,965 | 2,480,087 | ||||||
NET ASSETS | ||||||||
Beginning of year | 4,448,341 | 1,968,254 | ||||||
End of period * | $ | 5,774,306 | $ | 4,448,341 | ||||
*Including accumulated net investment loss of: | $ | (28,736) | $ | (34,534) | ||||
See Notes to Financial Statements.
9 | October 31, 2012
Table of Contents
ALPS | Kotak India Growth Fund – Class A | ||
Selected data for a share of beneficial interest outstanding throughout the periods indicated: | ||
For the Six Months Ended October 31, 2012 (Unaudited)(a) | For the Year Ended April 30, 2012(a) | For the Period February 14, 2011 (Inception) to April 30, 2011(a) | ||||
Net asset value, beginning of period | $8.22 | $10.35 | $10.00 | |||
INCOME/(LOSS) FROM INVESTMENT OPERATIONS: | ||||||
Net investment income/(loss)(b) | 0.01 | (0.08) | (0.04) | |||
Net realized and unrealized gain/(loss) | 0.68 | (2.04) | 0.39 | |||
Total from investment operations | 0.69 | (2.12) | 0.35 | |||
DISTRIBUTIONS: | ||||||
From net realized gains | – | (0.01) | – | |||
Total distributions | – | (0.01) | – | |||
REDEMPTION FEES ADDED TO PAID-IN CAPITAL (NOTE 6) | 0.00(c) | 0.00(c) | 0.00(c) | |||
Net increase/(decrease) in net asset value | 0.69 | (2.13) | 0.35 | |||
Net asset value, end of period | $8.91 | $8.22 | $10.35 | |||
TOTAL RETURN(d) | 8.39% | (20.44)% | 3.40% | |||
RATIOS/SUPPLEMENTAL DATA: | ||||||
Net assets, end of period (000s) | $2,916 | $2,404 | $935 | |||
Ratio of expenses to average net assets excluding fee waivers and reimbursements | 9.05%(e) | 12.42% | 69.96%(e) | |||
Ratio of expenses to average net assets including fee waivers and reimbursements | 2.00%(e) | 2.00% | 2.00%(e) | |||
Ratio of net investment income/(loss) to average net assets | 0.15%(e) | (0.89)% | (1.82)%(e) | |||
Portfolio turnover rate(f) | 57% | 114% | 9% | |||
| (a) | Per share amounts and ratios to average net assets include income and expenses of the Kotak Mauritius Portfolio |
(wholly-owned subsidiary).
| (b) | Calculated using the average shares method. |
| (c) | Less than $0.005 per share. |
| (d) | Total returns are for the period indicated and have not been annualized. Total returns would have been lower had certain expenses not been waived during the period. Returns shown do not reflect the deduction of taxes that a shareholder would pay on Fund distributions or the redemption of Fund shares. Returns shown exclude any applicable sales charges. |
| (e) | Annualized. |
| (f) | Portfolio turnover rate for periods less than one full year have not been annualized. |
See Notes to Financial Statements.
10 | October 31, 2012
Table of Contents
ALPS | Kotak India Growth Fund – Class C | ||
Consolidated Financial Highlights | ||
Selected data for a share of beneficial interest outstanding throughout the periods indicated: | ||
For the Six Months Ended October 31, 2012 (Unaudited)(a) | For the Year Ended April 30, 2012(a) | For the Period February 14, 2011 (Inception) to April 30, 2011(a) | ||||
Net asset value, beginning of period | $8.15 | $10.32 | $10.00 | |||
INCOME/(LOSS) FROM INVESTMENT OPERATIONS: | ||||||
Net investment loss(b) | (0.02) | (0.13) | (0.05) | |||
Net realized and unrealized gain/(loss) | 0.67 | (2.03) | 0.37 | |||
Total from investment operations | 0.65 | (2.16) | 0.32 | |||
DISTRIBUTIONS: | ||||||
From net realized gains | – | (0.01) | – | |||
Total distributions | – | (0.01) | – | |||
REDEMPTION FEES ADDED TO PAID-IN CAPITAL (NOTE 6) | – | 0.00(c) | – | |||
Net increase/(decrease) in net asset value | 0.65 | (2.17) | 0.32 | |||
Net asset value, end of period | $8.80 | $8.15 | $10.32 | |||
TOTAL RETURN(d) | 7.98% | (20.97)% | 3.20% | |||
RATIOS/SUPPLEMENTAL DATA: | ||||||
Net assets, end of period (000s) | $651 | $435 | $466 | |||
Ratio of expenses to average net assets excluding fee waivers and reimbursements | 9.56%(e) | 13.39% | 69.64%(e) | |||
Ratio of expenses to average net assets including fee waivers and reimbursements | 2.60%(e) | 2.60% | 2.60%(e) | |||
Ratio of net investment loss to average net assets | (0.45)%(e) | (1.49)% | (2.42)%(e) | |||
Portfolio turnover rate(f) | 57% | 114% | 9% | |||
| (a) | Per share amounts and ratios to average net assets include income and expenses of the Kotak Mauritius Portfolio |
(wholly-owned subsidiary).
| (b) | Calculated using the average shares method. |
| (c) | Less than $0.005 per share. |
| (d) | Total returns are for the period indicated and have not been annualized. Total returns would have been lower had certain expenses not been waived during the period. Returns shown do not reflect the deduction of taxes that a shareholder would pay on Fund distributions or the redemption of Fund shares. Returns shown exclude any applicable sales charges. |
| (e) | Annualized. |
| (f) | Portfolio turnover rate for periods less than one full year have not been annualized. |
See Notes to Financial Statements.
11 | October 31, 2012
Table of Contents
ALPS | Kotak India Growth Fund – Class I | ||
Consolidated Financial Highlights | ||
Selected data for a share of beneficial interest outstanding throughout the periods indicated: | ||
For the Six Months Ended October 31, 2012 (Unaudited)(a) | For the Year Ended April 30, 2012(a) | For the Period February 14, 2011 (Inception) to April 30, 2011(a) | ||||
Net asset value, beginning of period | $8.25 | $10.34 | $10.00 | |||
INCOME/(LOSS) FROM INVESTMENT OPERATIONS: | ||||||
Net investment income/(loss)(b) | 0.02 | (0.04) | (0.03) | |||
Net realized and unrealized gain/(loss) | 0.69 | (2.04) | 0.37 | |||
Total from investment operations | 0.71 | (2.08) | 0.34 | |||
DISTRIBUTIONS: | ||||||
From net realized gains | – | (0.01) | – | |||
Total distributions | – | (0.01) | – | |||
REDEMPTION FEES ADDED TO PAID-IN CAPITAL (NOTE 6) | – | 0.00(c) | – | |||
Net increase/(decrease) in net asset value | 0.71 | (2.09) | 0.34 | |||
Net asset value, end of period | $8.96 | $8.25 | $10.34 | |||
TOTAL RETURN(d) | 8.61% | (20.23)% | 3.50% | |||
RATIOS/SUPPLEMENTAL DATA: | ||||||
Net assets, end of period (000s) | $2,208 | $1,609 | $568 | |||
Ratio of expenses to average net assets excluding fee waivers and reimbursements | 8.62%(e) | 12.05% | 96.67%(e) | |||
Ratio of expenses to average net assets including fee waivers and reimbursements | 1.60%(e) | 1.60% | 1.60%(e) | |||
Ratio of net investment income/(loss) to average net assets | 0.55%(e) | (0.49)% | (1.36)%(e) | |||
Portfolio turnover rate(f) | 57% | 114% | 9% | |||
| (a) | Per share amounts and ratios to average net assets include income and expenses of the Kotak Mauritius Portfolio |
(wholly-owned subsidiary).
| (b) | Calculated using the average shares method. |
| (c) | Less than $0.005 per share. |
| (d) | Total returns are for the period indicated and have not been annualized. Total returns would have been lower had certain expenses not been waived during the period. Returns shown do not reflect the deduction of taxes that a shareholder would pay on Fund distributions or the redemption of Fund shares. |
| (e) | Annualized. |
| (f) | Portfolio turnover rate for periods less than one full year have not been annualized. |
See Notes to Financial Statements.
12 | October 31, 2012
Table of Contents
| October 31, 2012 (Unaudited) |
Overview
With only two months to go in 2012, it’s easy to see why equity values, and Listed Private Equity, have done well overall; there has been a noticeable absence of major drama. No drama these days has appeared to equate to rising values, especially in Listed Private Equity. Sure, there were the all too familiar “issues”: 1) Europe; ongoing political and economic upheaval in Spain, Greece and Italy, Germany’s ongoing support of the Euro/EU, the role of the European Central Bank (ECB), flat to declining GDP and unemployment; 2) the U.S.; the recent Presidential election, continued dysfunction in Washington, D.C., the year-end budget drama, known as the fiscal cliff, growing deficits, a third round of quantitative easing and a lack of business confidence; and 3) the Middle East; Iran, Syria, Israel, Libya, et al. However, investors seem to have taken some degree of comfort that the “issues” are contained, or least not spinning out of control, for the time being. As I’ve said in the past, stay tuned, there’s more to follow.
Macro issues aside, the world of private equity continues to move forward. While the pace of new investments continues to be muted, sales of existing investments, also known as exits or realizations, continue to be robust. Per one of the largest global Private Equity Fund of Fund Managers, Pantheon, trade sales (when a private equity firm sells one of its portfolio companies to a corporate buyer) within their portfolio for the past year represented approximately 62% of exits, compared with Initial Public Offerings (IPOs) representing approximately 1%. That gives one a sense of just how closed the public equity markets are. If a Company wants to issue debt: no problem. On the other hand, if a Company wants to issue equity: not so easy. And therein lies the problem: investors continue to be exceedingly cautious. Growth is elusive. Survival, and hence maintaining what you have, is still the common refrain. Risk assets (equity as a whole) continue to be out of favor. Return of principal, even with puny to negative real returns, is the focus. Until this dynamic changes, we expect private equity to muddle along with pockets of success, but with a cautious approach as well.
Taking it one layer deeper, certain behaviors of Listed Private Equity have been similar to those of illiquid partnership-based private equity: new investments, exits/realizations, and the general mood towards the future is almost exactly the same. The one notable exception, Listed Private Equity discounts continue to be an issue on investors’ minds, although not to the degree that we’ve seen in previous quarters. Progress is being made. Investors are beginning to see more capital coming back to them in the form of dividends/special dividends. Realizations in private equity portfolios continue to be done at uplifts to last valuations, and consolidation within the listed space continues; the $1.3 billion acquisition of Conversus Capital LP by HarbourVest in July 2012 being the most recent example.
While it didn’t necessarily feel this way during the summer, it was a good several months. Sometimes no drama is a good thing.
Portfolio Review
The Fund’s Class A Shares, LPEFX, returned 6.21% net of fees, (Class A delivered a net return of 0.40% at MOP), compared with 2.12% and 8.97% for the MSCI World Index and the S&P® Listed Private Equity Index, respectively for the Semi-Annual period ending October 31, 2012.
During the period we exited three holdings, Brookfield Infrastructure Partners LP, Fosun International and Leucadia National Corporation. In addition, we added three holdings, Carlyle Group, Hosken Consolidated Investments LTD and Investor AB, a previous holding of the Fund.
As any investor that has held or followed the Fund over the past few years knows, diversification continues to be the cornerstone of how we manage exposure and risk. The recent period was no different: with approximately 40 holdings in some of the top performing private equity firms/funds around the globe, the Fund offers investors fully diversified private equity exposure.
Net contributors to performance for the period included:
| • | AP Alternative Assets LP |
| • | Wendel Investissement |
| • | Apollo Global Management LLC, Class A |
Net detractors to performance for the period were:
| • | SVG Capital PLC |
| • | Fosun International |
| • | Ratos AB, B Shares |
Outlook
I’d like to suggest that the outlook for private equity in the coming period and into early 2013 is quite positive. While it certainly could be positive, I’m less than comfortable predicting that. A number of developments point to better times ahead within private equity portfolio holdings; improving individual company level cash flow, solid balance sheets, continued rationalization and consolidation in some cases and strong trade sale valuations and activity. However, the global macro and political backdrop is uncertain at best. Until there is clarity here, investor confidence may be muted.
Despite the uncertainty, we continue to believe that the private equity model is fundamentally alive and well. We continue to believe that the patient investor will be rewarded when we consider the value of portfolio assets and the cash flow that they may generate.
As always, we appreciate your continued support and interest in Red Rocks and the Listed Private Equity strategy.
Adam Goldman
Co-Portfolio Manager
The views and information discussed in this commentary are as of the date of publication, are subject to change, and may not reflect the writer’s current views. The views expressed represent an assessment of market conditions at a specific point in time, are opinions only and should not be relied upon as investment advice regarding a particular investment or markets in general. Such information does not constitute a recommendation to buy or sell specific securities or investment vehicles. It should not be assumed that any investment will be profitable or will equal the performance of the portfolios or any securities or any sectors mentioned herein. The subject matter contained herein has been derived from several sources believed to be reliable and accurate at the time of compilation. Red Rocks Capital LLC does not accept any liability for losses either direct or consequential caused by the use of this information.
| 13 | October 31, 2012 |
Table of Contents
ALPS | Red Rocks Listed Private Equity Fund | ||
Management Commentary | October 31, 2012 (Unaudited) |
Performance of $10,000 Initial Investment (for the period ended October 31, 2012)
Comparison of change in value of a $10,000 investment (includes applicable sales loads of 5.50%)
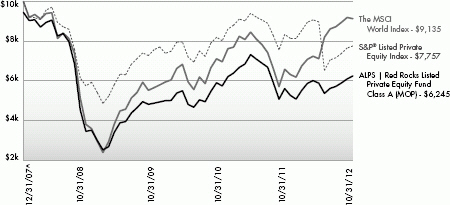
The chart above represents historical performance of a hypothetical investment of $10,000 in the Fund since inception. Past performance does not guarantee future results. This chart does not reflect the deduction of taxes that a shareholder would pay on Fund distributions or the redemption of Fund shares.
14 | October 31, 2012
Table of Contents
ALPS | Red Rocks Listed Private Equity Fund | ||
Management Commentary | October 31, 2012 (Unaudited) | |
Average Annual Total Returns (as of October 31, 2012)
| 1 Year | 3 Year | Since Inception ^ | Total Expense Ratio | What you Pay * | ||||||
Class A (NAV)1 | 11.44% | 9.08% | -8.20% | 3.34% | 3.28% | |||||
Class A (MOP)2 | 5.25% | 7.07% | -9.27% | |||||||
Class C (NAV)1 | 10.51% | 8.05% | -9.00% | 4.00% | 3.88% | |||||
Class C (CDSC)2 | 9.51% | 8.05% | -9.00% | |||||||
Class I | 11.47% | 9.33% | -7.98% | 3.04% | 2.88% | |||||
Class R | 11.19% | 8.69% | -8.62% | 3.52% | 3.38% | |||||
S&P® LPE Total Return Index3 | 17.84% | 12.00% | -5.12% | |||||||
MSCI World Index4 | 9.45% | 7.88% | -1.86% |
Performance data quoted represents past performance. Past performance does not guarantee future results. Investment return and principal value of an investment will fluctuate so that an investor’s shares, when sold or redeemed, may be worth more or less than the original cost. Current performance data may be higher or lower than actual data quoted. The Fund imposes a 2.00% redemption fee on shares held for less than 90 days. The Fund imposes a maximum Contingent Deferred Sales Charge (“CDSC”) of 1.00% on Class C shares redeemed within the first 12 months after a purchase, and on Class A shares redeemed within the first 12 months after a purchase in excess of $1 million. Performance data does not reflect the redemption fee or the CDSC, which if reflected would reduce the performance quoted. For the most current month-end performance data, please call 1-866-759-5679.
Performance shown for Class C shares prior to June 30, 2010 reflects the historical performance of the Fund’s Class A shares, calculated using the fees and expenses of Class C shares.
| 1 | Net Asset Value (NAV) is the share price without sales charges. The performance data shown does not reflect the decution of the sales load or the redemption fee or CDSC, and that, if reflected, the load or fee would reduce the performance quoted. |
| 2 | Maximum Offering Price (MOP) for Class A shares includes the Fund’s maximum sales charge of 5.50%. CDSC performance for Class C shares includes a 1% contingent deferred sales charge (CDSC) on C shares redeemed within 12 months of purchase. Performance shown at NAV does not include these sales charges and would have been lower had it been taken into account. |
| 3 | S&P® Listed Private Equity Index: The S&P® Listed Private Equity Index is comprised of 30 leading listed private equity companies that meet size, liquidity, exposure, and activity requirements. The index is designed to provide tradable exposure to the leading publicly listed companies in the private equity space. The index is not actively managed and does not reflect any deduction for fees, expenses or taxes. An investor may not invest directly in an index. |
| 4 | MSCI World Index: Morgan Stanley Capital International’s market capitalization weighted index is composed of companies representative of the market structure of 22 developed market countries in North America, Europe and the Asia/Pacific Region. The index is not actively managed and does not reflect any deduction for fees, expenses or taxes. An investor may not invest directly in an index. |
| ^ | Fund inception date of December 31, 2007. |
| * | What You Pay reflects the Advisor’s and Sub-Advisor’s decision to contractually limit expenses through August 31, 2013. Please see the prospectus for additional information. |
The table does not reflect the deduction of taxes that a shareholder would pay on Fund distributions or the redemption of Fund shares.
Listed Private Equity Companies are subject to various risks depending on their underlying investments, which could include, but are not limited to, additional liquidity risk, industry risk, non-U.S. security risk, currency risk, credit risk, managed portfolio risk and derivatives risk (derivatives risk is the risk that the value of the Listed Private Equity Companies’ derivative investments will fall because of pricing difficulties or lack of correlation with the underlying investment).
There are inherent risks in investing in private equity companies, which encompass financial institutions or vehicles whose principal business is to invest in and lend capital to privately held companies. Generally, little public information exists for private and thinly traded companies, and there is a risk that investors may not be able to make a fully informed investment decision.
Listed Private Equity Companies may have relatively concentrated investment portfolios, consisting of a relatively small number of holdings. A consequence of this limited number of investments is that the aggregate returns realized may be adversely impacted by the poor performance of a small number of investments, or even a single investment, particularly if a company experiences the need to write down the value of an investment.
Certain of the Fund’s investments may be exposed to liquidity risk due to low trading volume, lack of a market maker or legal restrictions limiting the ability of the Fund to sell particular securities at an advantageous price and/or time. As a result, these securities may be more difficult to value. Foreign investing involves special risks, such as currency fluctuations and political uncertainty. The Fund invests in derivatives and is subject to the risk that the value of those derivative investments will fall because of pricing difficulties or lack of correlation with the underlying investment.
Mutual funds are not insured or guaranteed by the FDIC or by any other government agency or government sponsored agency of the federal government or any state, not deposits, obligations or guaranteed by any bank or its affiliates and are subject to investment risks, including possible loss of the principal amount invested.
15 | October 31, 2012
Table of Contents
ALPS | Red Rocks Listed Private Equity Fund | ||
Management Commentary | October 31, 2012 (Unaudited) |
Top Ten Holdings (as a % of Net Assets) † | ||||
| ||||
Conversus Capital LP | 5.12 | % | ||
Electra Private Equity PLC | 4.72 | % | ||
SVG Capital PLC | 4.56 | % | ||
Blackstone Group LP | 4.50 | % | ||
Wendel Investissement | 4.46 | % | ||
AP Alternative Assets LP | 4.38 | % | ||
KKR & Co. LP | 4.32 | % | ||
Onex Corp. | 4.31 | % | ||
Eurazeo | 3.75 | % | ||
| Apollo Global Management LLC, Class A | 3.65 | % | ||
Top Ten Holdings | 43.77 | % | ||
† Holdings are subject to change. Table presents indicative values only. |
| |||
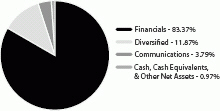
Industry Sector Allocation (as a % of Net Assets)
16 | October 31, 2012
Table of Contents
ALPS | Red Rocks Listed Private Equity Fund | ||
| October 31, 2012 (Unaudited) |
| Shares | Value (Note 2) | |||
COMMON STOCKS (99.03%) | ||||
Communications (3.79%) | ||||
Internet (3.79%) | ||||
ICG Group, Inc.(a) | 340,000 | $3,563,200 | ||
Safeguard Scientifics, Inc.(a) | 192,041 | 3,043,850 | ||
| ||||
| 6,607,050 | ||||
| ||||
TOTAL COMMUNICATIONS | 6,607,050 | |||
| ||||
Diversified (11.87%) | ||||
Holding Companies-Diversified Operations (11.87%) | ||||
Ackermans & van Haaren N.V. | 72,586 | 5,902,693 | ||
Remgro, Ltd. | 140,000 | 2,397,744 | ||
Schouw & Co. | 202,472 | 4,626,142 | ||
Wendel Investissement | 88,300 | 7,781,415 | ||
| ||||
| 20,707,994 | ||||
| ||||
TOTAL DIVERSIFIED | 20,707,994 | |||
| ||||
Financials (83.37%) | ||||
Closed-End Funds (40.06%) | ||||
AP Alternative Assets LP(a) | 518,724 | 7,645,992 | ||
Candover Investments PLC(a) | 192,000 | 1,113,883 | ||
Castle Private Equity, Ltd.(a) | 238,876 | 3,257,517 | ||
Conversus Capital LP | 438,548 | 8,924,460 | ||
Electra Private Equity PLC(a) | 279,501 | 8,231,628 | ||
Graphite Enterprise Trust PLC | 903,000 | 6,098,496 | ||
HarbourVest Global Private Equity, Ltd.(a) | 602,200 | 4,353,906 | ||
HBM Healthcare Investments AG Class A(a) | 72,400 | 3,863,717 | ||
HgCapital Trust PLC | 256,542 | 4,144,118 | ||
Pantheon International Participations PLC, Ordinary Shares(a) | 267,016 | 3,623,872 | ||
Pantheon International Participations PLC, Redeemable Shares(a) | 135,200 | 1,805,445 | ||
Princess Private Equity Holding, Ltd. | 741,225 | 6,350,447 | ||
Standard Life European Private Equity Trust PLC, Ordinary Shares | 980,573 | 2,519,990 | ||
SVG Capital PLC(a) | 1,913,000 | 7,961,701 | ||
| ||||
| 69,895,172 | ||||
| ||||
Diversified Financial Services (16.33%) | ||||
Blackstone Group LP | 511,000 | 7,848,960 | ||
Intermediate Capital Group PLC | 1,130,000 | 5,565,478 | ||
KKR & Co. LP | 501,300 | 7,544,565 | ||
Onex Corp. | 186,900 | 7,522,784 | ||
| ||||
| 28,481,787 | ||||
| ||||
| Shares | Value (Note 2) | |||||
Investment Companies (4.86%) | ||||||
Hosken Consolidated | 239,500 | $2,695,899 | ||||
Investor AB, B Shares | 116,000 | 2,558,579 | ||||
Ratos AB, B Shares | 375,700 | 3,225,756 | ||||
| ||||||
| 8,480,234 | ||||||
| ||||||
Private Equity (19.58%) | ||||||
3i Group PLC | 891,000 | 3,097,155 | ||||
Altamir Amboise | 373,650 | 3,351,382 | ||||
Apollo Global Management | 419,000 | 6,364,610 | ||||
Aurelius AG | 74,818 | 3,818,868 | ||||
Bure Equity AB | 464,881 | 1,604,996 | ||||
The Carlyle Group LP | 51,200 | 1,330,688 | ||||
Deutsche Beteiligungs AG | 108,572 | 2,742,726 | ||||
Eurazeo | 143,000 | 6,545,579 | ||||
GIMV N.V. | 89,351 | 4,318,616 | ||||
IP Group PLC(a) | 513,000 | 978,530 | ||||
| ||||||
| 34,153,150 | ||||||
| ||||||
Real Estate (2.54%) | ||||||
Brookfield Asset | 128,900 | 4,439,316 | ||||
| ||||||
TOTAL FINANCIALS | 145,449,659 | |||||
| ||||||
TOTAL COMMON STOCKS (Cost $152,635,884) | 172,764,703 | |||||
| ||||||
7-Day Yield | Shares | Value (Note 2) | ||||
SHORT TERM INVESTMENTS (1.05%) | ||||||
Money Market Fund (1.05%) | ||||||
Dreyfus Treasury Prime | 0.00003% | 1,829,091 | 1,829,091 | |||
| ||||||
TOTAL SHORT TERM INVESTMENTS (Cost $1,829,091) | 1,829,091 | |||||
| ||||||
TOTAL INVESTMENTS (100.08%) (Cost $154,464,975) | $174,593,794 | |||||
Liabilities In Excess Of Other Assets | (133,842) | |||||
| ||||||
NET ASSETS (100.00%) | $174,459,952 | |||||
| ||||||
17 | October 31, 2012
Table of Contents
ALPS | Red Rocks Listed Private Equity Fund | ||
Statement of Investments | October 31, 2012 (Unaudited) |
| (a) | Non-Income Producing Security. |
Common Abbreviations:
AB - Aktiebolag is the Swedish equivalent of the term corporation.
AG - Aktiengesellschaft is a German term that refers to a corporation that is limited by shares, i.e., owned by shareholders.
LLC - Limited Liability Company.
LP - Limited Partnership.
Ltd. - Limited.
N.V. - Naamloze Vennootschap is the Dutch term for a public limited liability corporation.
PLC - Public Limited Company.
For Fund compliance purposes, the Fund’s industry classifications refer to any one or more of the industry sub-classifications used by one or more widely recognized market indexes or ratings group indexes, and/or as defined by Fund management. This definition may not apply for purposes of this report, which may combine industry subclassifications for reporting ease. Industries are shown as a percent of net assets. These industry classifications are based on third party definitions and are unaudited. The definitions are industry terms and do not reflect the legal status of any of the investments or the companies in which the Fund has invested.
See Notes to Financial Statements.
18 | October 31, 2012
Table of Contents
ALPS | Red Rocks Listed Private Equity Fund | ||
| October 31, 2012 (Unaudited) |
ASSETS | ||||
Investments, at value | $ | 174,593,794 | ||
Cash | 44 | |||
Foreign currency, at value (Cost $87,140) | 87,581 | |||
Receivable for investments sold | 516,560 | |||
Dividends and interest receivable | 159,596 | |||
Prepaid expenses and other assets | 21,538 | |||
Total Assets | 175,379,113 | |||
LIABILITIES | ||||
Payable for investments purchased | 205,885 | |||
Payable for shares redeemed | 305,513 | |||
Investment advisory fees payable | 126,994 | |||
Administration and transfer agency fees payable | 21,329 | |||
Distribution and services fees payable | 112,978 | |||
Legal fees payable | 2,652 | |||
Audit fees payable | 28,718 | |||
Custody fees payable | 72,052 | |||
Trustees’ fees and expenses payable | 5,885 | |||
Accrued expenses and other liabilities | 37,155 | |||
Total Liabilities | 919,161 | |||
NET ASSETS | $ | 174,459,952 | ||
NET ASSETS CONSIST OF | ||||
Paid-in capital | $ | 189,593,089 | ||
Accumulated net investment loss | (9,081,714 | ) | ||
Accumulated net realized loss on investments and foreign currency transactions | (26,176,504 | ) | ||
Net unrealized appreciation on investments and translation of assets and liabilities denominated in foreign currencies | 20,125,081 | |||
NET ASSETS | $ | 174,459,952 | ||
INVESTMENTS, AT COST | $ | 154,464,975 | ||
PRICING OF SHARES | ||||
Class A: Net Asset Value, offering and redemption price per share(a) | $ | 4.96 | ||
Net Assets | $ | 80,246,827 | ||
Shares of beneficial interest outstanding (unlimited number of shares, no par value common stock authorized) | 16,185,066 | |||
Maximum offering price per share ((NAV/0.9450), based on maximum sales charge of 5.50% of the offering price) | $ | 5.25 | ||
Class C: | ||||
Net Asset Value, offering and redemption price per share(a) | $ | 4.85 | ||
Net Assets | $ | 2,953,891 | ||
Shares of beneficial interest outstanding (unlimited number of shares, no par value common stock authorized) | 608,785 | |||
Class I: | ||||
Net Asset Value, offering and redemption price per share | $ | 4.98 | ||
Net Assets | $ | 91,208,979 | ||
Shares of beneficial interest outstanding (unlimited number of shares, no par value common stock authorized) | 18,298,341 | |||
Class R: | ||||
Net Asset Value, offering and redemption price per share | $ | 4.42 | ||
Net Assets | $ | 50,255 | ||
Shares of beneficial interest outstanding (unlimited number of shares, no par value common stock authorized) | 11,377 | |||
| (a) | Redemption price per share may be reduced for any applicable contingent deferred sales charge. For a description of a possible sales charge, please see the Fund’s Prospectus. |
See Notes to Financial Statements.
19 | October 31, 2012
Table of Contents
ALPS | Red Rocks Listed Private Equity Fund | ||
| For the Six Months Ended October 31, 2012 (Unaudited) | ||
INVESTMENT INCOME | ||||
Dividends | $ | 2,815,556 | ||
Foreign taxes withheld on dividends | (201,887) | |||
Interest and other income | 6,407 | |||
Total Investment Income | 2,620,076 | |||
EXPENSES | ||||
Investment advisory fees | 696,148 | |||
Administrative and transfer agency fees | 137,815 | |||
Distribution and service fees | ||||
Class A | 163,295 | |||
Class C | 14,104 | |||
Class R | 127 | |||
Legal fees | 6,276 | |||
Audit fees | 16,248 | |||
Networking fees | ||||
Class A | 14,178 | |||
Class C | 889 | |||
Class I | 38,142 | |||
Class R | 48 | |||
Reports to shareholders and printing fees | 25,819 | |||
State registration fees | 32,591 | |||
Insurance fees | 4,090 | |||
Custody fees | 59,055 | |||
Trustees’ fees and expenses | 9,758 | |||
Miscellaneous expenses | 7,385 | |||
Total Expense | 1,225,968 | |||
Less fees waived/reimbursed by investment advisor | ||||
Class A | (41,771) | |||
Class C | (398) | |||
Class I | (24,174) | |||
Class R | (39) | |||
Net Expenses | 1,159,586 | |||
Net Investment Income | 1,460,490 | |||
Net realized loss on investments | (1,325,946) | |||
Net realized loss on foreign currency transactions | (40,367) | |||
Net change in unrealized appreciation on investments | 9,966,848 | |||
Net change in unrealized appreciation on translation of assets and liabilities denominated in foreign currencies | 994 | |||
NET REALIZED AND UNREALIZED GAIN ON INVESTMENTS | 8,601,529 | |||
NET INCREASE IN NET ASSETS RESULTING FROM OPERATIONS | $ | 10,062,019 | ||
See Notes to Financial Statements.
20 | October 31, 2012
Table of Contents
ALPS | Red Rocks Listed Private Equity Fund | ||
For the Six Months Ended October 31, 2012 | For the Year Ended April 30, 2012 | |||||||
OPERATIONS | ||||||||
Net investment income | $ | 1,460,490 | $ | 2,252,886 | ||||
Net realized loss on investments and foreign currency transactions | (1,366,313) | (1,997,056) | ||||||
Net change in unrealized appreciation/(depreciation) on investments and translation of assets and liabilities denominated in foreign currencies | 9,967,842 | (40,079,612) | ||||||
Net Increase/(Decrease) in Net Assets Resulting from Operations | 10,062,019 | (39,823,782) | ||||||
DISTRIBUTIONS | ||||||||
Dividends to shareholders from net investment income | ||||||||
Class A | 0 | (7,773,831) | ||||||
Class C | 0 | (232,203) | ||||||
Class I | 0 | (5,228,944) | ||||||
Class R | 0 | (9,179) | ||||||
Net Decrease in Net Assets from Distributions | 0 | (13,244,157) | ||||||
BENEFICIAL INTEREST TRANSACTIONS (NOTE 6) | ||||||||
Shares sold | ||||||||
Class A | 11,213,935 | 55,043,701 | ||||||
Class C | 297,182 | 1,787,116 | ||||||
Class I | 20,978,524 | 50,688,416 | ||||||
Class R | 5,823 | 41,342 | ||||||
Dividends reinvested | ||||||||
Class A | 0 | 6,987,024 | ||||||
Class C | 0 | 172,533 | ||||||
Class I | 0 | 1,952,666 | ||||||
Class R | 0 | 8,650 | ||||||
Shares redeemed | ||||||||
Class A | (21,431,278) | (67,995,564) | ||||||
Class C | (338,130) | (718,469) | ||||||
Class I | (12,764,304) | (22,792,481) | ||||||
Class R | (5,253) | (85,079) | ||||||
Net Increase/(Decrease) in Net Assets Derived from Beneficial Interest Transactions | (2,043,501) | 25,089,855 | ||||||
Net increase/(decrease) in net assets | 8,018,518 | (27,978,084) | ||||||
NET ASSETS | ||||||||
Beginning of year | 166,441,434 | 194,419,518 | ||||||
End of period * | $ | 174,459,952 | $ | 166,441,434 | ||||
*Including accumulated net investment loss of: | $ | (9,081,714) | $ | (10,542,204) | ||||
See Notes to Financial Statements.
21 | October 31, 2012
Table of Contents
ALPS | Red Rocks Listed Private Equity Fund – Class A | ||
| Selected data for a share of beneficial interest outstanding throughout the periods indicated: | ||
For the Ended | For the Year Ended 2012 | For the Year Ended 2011 | For the Year Ended 2010 | For the Year Ended 2009 | For the Period 2007 2008 | |||||||
Net asset value, beginning of period | $4.67 | $6.44 | $5.17 | $3.56 | $9.47 | $10.00 | ||||||
INCOME/(LOSS) FROM INVESTMENT OPERATIONS: | ||||||||||||
Net investment income | 0.04(a) | 0.07(a) | 0.04(a) | 0.14 | 0.08(a) | 0.11 | ||||||
Net realized and unrealized gain/(loss) | 0.25 | (1.41) | 1.61 | 1.99 | (5.97) | (0.64) | ||||||
Total from investment operations | 0.29 | (1.34) | 1.65 | 2.13 | (5.89) | (0.53) | ||||||
DISTRIBUTIONS: | ||||||||||||
From net investment income | – | (0.43) | (0.38) | (0.52) | (0.03) | – | ||||||
From net realized gains | – | – | – | – | (0.00)(b) | – | ||||||
Total distributions | – | (0.43) | (0.38) | (0.52) | (0.03) | – | ||||||
REDEMPTION FEES ADDED TO PAID-IN CAPITAL (NOTE 6) | 0.00(b) | 0.00(b) | 0.00(b) | 0.00(b) | 0.01 | – | ||||||
Net increase/(decrease) in net asset value | 0.29 | (1.77) | 1.27 | 1.61 | (5.91) | (0.53) | ||||||
Net asset value, end of period | $4.96 | $4.67 | $6.44 | $5.17 | $3.56 | $9.47 | ||||||
TOTAL RETURN(c) | 6.21% | (19.68)% | 33.22% | 61.68% | (62.01)% | (5.30)% | ||||||
RATIOS/SUPPLEMENTAL DATA: | ||||||||||||
Net assets, end of period (000s) | $80,247 | $85,807 | $124,874 | $67,192 | $27,860 | $832 | ||||||
Ratio of expenses to average net assets excluding fee waiver sand reimbursements(g) | 1.65%(d) | 1.71% | 1.70% | 1.71% | 2.08% | 39.07%(d) | ||||||
Ratio of expenses to average net assets including fee waivers and reimbursements(g) | 1.55%(d) | 1.50% | 1.50% | 1.44%(e) | 1.25% | 1.25%(d) | ||||||
Ratio of net investment income to average net assets(g) | 1.72%(d) | 1.34% | 0.67% | 0.42% | 2.16% | 4.68%(d) | ||||||
Portfolio turnover rate(f) | 18% | 72% | 43% | 54% | 59% | 15% | ||||||
| (a) | Calculated using the average shares method. |
| (b) | Less than $0.005 and ($0.005) per share. |
| (c) | Total returns are for the period indicated and have not been annualized. Total returns would have been lower had certain expenses not been waived during the period. Returns shown do not reflect the deduction of taxes that a shareholder would pay on Fund distributions or the redemption of Fund shares. Returns shown exclude any applicable sales charges. |
| (d) | Annualized. |
| (e) | Effective September 1, 2009, the net expense ratio limitation changed from 1.25% to 1.50% (exclusive of distribution and service (12b-1) fees, acquired fund fees and expenses, brokerage expenses, interest expense, short sale dividend expense, taxes and extraordinary expenses). |
| (f) | Portfolio turnover rate for periods less than one full year have not been annualized. |
| (g) | The ratios exclude the impact of expenses of the underlying funds in which the Fund invests as represented in the Statement of lnvestments. |
See Notes to Financial Statements.
22 | October 31, 2012
Table of Contents
ALPS | Red Rocks Listed Private Equity Fund – Class C | ||
Financial Highlights | Selected data for a share of beneficial interest outstanding throughout the periods indicated: | |
| For the Six Months Ended October 31, 2012 (Unaudited) | For the Year Ended April 30, 2012 | For the Period July 2, 2010 (Inception) to April 30, 2011 | ||||
Net asset value, beginning of period | $4.59 | $6.37 | $4.39 | |||
INCOME/(LOSS) FROM INVESTMENT OPERATIONS: | ||||||
Net investment income/(loss)(a) | 0.02 | 0.03 | (0.01) | |||
Net realized and unrealized gain/(loss) | 0.24 | (1.39) | 2.36 | |||
Total from investment operations | 0.26 | (1.36) | 2.35 | |||
DISTRIBUTIONS: | ||||||
From net investment income | – | (0.42) | (0.37) | |||
Total distributions | – | (0.42) | (0.37) | |||
REDEMPTION FEES ADDED TO PAID-IN CAPITAL (NOTE 6) | 0.00(b) | 0.00(b) | 0.00(b) | |||
Net increase/(decrease) in net asset value | 0.26 | (1.78) | 1.98 | |||
Net asset value, end of period | $4.85 | $4.59 | $6.37 | |||
TOTAL RETURN(c) | 5.66% | (20.33)% | 55.32% | |||
RATIOS/SUPPLEMENTAL DATA: | ||||||
Net assets, end of period (000s) | $2,954 | $2,838 | $2,566 | |||
Ratio of expenses to average net assets excluding fee waivers and reimbursements(g) | 2.28%(d) | 2.37% | 2.31%(d) | |||
Ratio of expenses to average net assets including fee waivers and reimbursements(g) | 2.25%(d) | 2.25% | 2.25%(d) | |||
Ratio of net investment income/(loss) to average net assets(g) | 0.96%(d) | 0.59% | (0.19)%(d) | |||
Portfolio turnover rate(e) | 18% | 72% | 43%(f) | |||
| (a) | Calculated using the average shares method. |
| (b) | Less than $0.005 per share. |
| (c) | Total returns are for the period indicated and have not been annualized. Total returns would have been lower had certain expenses not been waived during the period. Returns shown do not reflect the deduction of taxes that a shareholder would pay on Fund distributions or the redemption of Fund shares. Returns shown exclude any applicable sales charges. |
| (d) | Annualized. |
| (e) | Portfolio turnover rate for periods less than one full year have not been annualized. |
| (f) | Portfolio turnover rate is calculated at the Fund Level and represents the year ended April 30, 2011. |
| (g) | The ratios exclude the impact of expenses of the underlying funds in which the Fund invests as represented in the Statement of lnvestments. |
See Notes to Financial Statements.
23 | October 31, 2012
Table of Contents
ALPS | Red Rocks Listed Private Equity Fund – Class I | ||
Financial Highlights | Selected data for a share of beneficial interest outstanding throughout the periods indicated: | |
For the Six Months | For the Year Ended April 30, 2012 | For the Year Ended April 30, 2011 | For the Year Ended April 30, 2010 | For the Year Ended April 30, 2009 | For the Period Ended April 30, 2008(a) | |||||||
Net asset value, beginning of period | $4.69 | $6.47 | $5.19 | $3.57 | $9.47 | $10.00 | ||||||
INCOME/(LOSS) FROM INVESTMENT OPERATIONS: | ||||||||||||
Net investment income | 0.04(b) | 0.08(b) | 0.05(b) | 0.28 | 0.10(b) | 0.13 | ||||||
Net realized and unrealized gain/(loss) | 0.25 | (1.42) | 1.62 | 1.87 | (5.97) | (0.66) | ||||||
Total from investment operations | 0.29 | (1.34) | 1.67 | 2.15 | (5.87) | (0.53) | ||||||
DISTRIBUTIONS: | ||||||||||||
From net investment income | – | (0.44) | (0.39) | (0.53) | (0.05) | – | ||||||
From net realized gains | – | – | – | – | (0.00)(c) | – | ||||||
Total distributions | – | (0.44) | (0.39) | (0.53) | (0.05) | – | ||||||
REDEMPTION FEES ADDED TO PAID-IN CAPITAL (NOTE 6) | 0.00(c) | 0.00(c) | 0.00(c) | 0.00(c) | 0.02 | – | ||||||
Net increase/(decrease) in net asset value | 0.29 | (1.78) | 1.28 | 1.62 | (5.90) | (0.53) | ||||||
Net asset value, end of period | $4.98 | $4.69 | $6.47 | $5.19 | $3.57 | $9.47 | ||||||
TOTAL RETURN(d) | 6.18% | (19.52)% | 33.47% | 62.09% | (61.79)% | (5.30)% | ||||||
RATIOS/SUPPLEMENTAL DATA: | ||||||||||||
Net assets, end of period (000s) | $91,209 | $77,750 | $66,854 | $45,144 | $12,938 | $21 | ||||||
Ratio of expenses to average net assets excluding fee waivers and reimbursements(h) | 1.31%(e) | 1.41% | 1.36% | 1.47% | 2.05% | 35.33%(e) | ||||||
Ratio of expenses to average net assets including fee waivers and reimbursements(h) | 1.25%(e) | 1.25% | 1.25% | 1.19%(f) | 1.00% | 1.00%(e) | ||||||
Ratio of net investment income to average net assets(h) | 1.88%(e) | 1.60% | 0.91% | 0.78% | 2.56% | 6.11%(e) | ||||||
Portfolio turnover rate(g) | 18% | 72% | 43% | 54% | 59% | 15% | ||||||
| (a) | The Fund commenced operations on December 31, 2007. |
| (b) | Calculated using the average shares method. |
| (c) | Less than $0.005 and ($0.005) per share. |
| (d) | Total returns are for the period indicated and have not been annualized. Total returns would have been lower had certain expenses not been waived during the period. Returns shown do not reflect the deduction of taxes that a shareholder would pay on Fund distributions or the redemption of Fund shares. |
| (e) | Annualized. |
| (f) | Effective September 1, 2009, the net expense ratio limitation changed from 1.00% to 1.25% (exclusive of distribution and service (12b-1) fees, acquired fund fees and expenses, brokerage expenses, interest expense, short sale dividend expense, taxes and extraordinary expenses). |
| (g) | Portfolio turnover rate for periods less than one full year have not been annualized. |
| (h) | The ratios exclude the impact of expenses of the underlying funds in which the Fund invests as represented in the Statement of lnvestments. |
See Notes to Financial Statements.
24 | October 31, 2012
Table of Contents
ALPS | Red Rocks Listed Private Equity Fund – Class R | ||
Financial Highlights | Selected data for a share of beneficial interest outstanding throughout the periods indicated: | |
For the Six Months | For the Year Ended April 30, 2012 | For the Year Ended April 30, 2011 | For the Year Ended April 30, 2010 | For the Year Ended April 30, 2009 | For the Period Ended April 30, 2008(a) | |||||||
Net asset value, beginning of period | $4.17 | $5.82 | $4.73 | $3.31 | $9.46 | $10.00 | ||||||
INCOME/(LOSS) FROM INVESTMENT OPERATIONS: | ||||||||||||
Net investment income/(loss) | 0.03(b) | 0.05(b) | 0.03(b) | (0.09) | 0.15(b) | 0.12 | ||||||
Net realized and unrealized gain/(loss) | 0.22 | (1.27) | 1.43 | 2.02 | (6.05) | (0.66) | ||||||
Total from investment operations | 0.25 | (1.22) | 1.46 | 1.93 | (5.90) | (0.54) | ||||||
DISTRIBUTIONS: | ||||||||||||
From net investment income | – | (0.43) | (0.37) | (0.51) | (0.26) | – | ||||||
From net realized gains | – | – | – | – | (0.00)(c) | – | ||||||
Total distributions | – | (0.43) | (0.37) | (0.51) | (0.26) | – | ||||||
REDEMPTION FEES ADDED TO PAID-IN CAPITAL (NOTE 6) | – | – | – | – | 0.01 | – | ||||||
Net increase/(decrease) in net asset value | 0.25 | (1.65) | 1.09 | 1.42 | (6.15) | (0.54) | ||||||
Net asset value, end of period | $4.42 | $4.17 | $5.82 | $4.73 | $3.31 | $9.46 | ||||||
TOTAL RETURN(d) | 6.00% | (19.93)% | 32.47% | 60.92% | (62.10)% | (5.40)% | ||||||
RATIOS/SUPPLEMENTAL DATA: | ||||||||||||
Net assets, end of period (000s) | $50 | $46 | $125 | $18 | $ – (e) | $1 | ||||||
Ratio of expenses to average net assets excluding fee waivers and reimbursements(i) | 1.90%(f) | 1.89% | 1.87% | 2.27% | 6.08% | 43.39%(f) | ||||||
Ratio of expenses to average net assets including fee waivers and reimbursements(i) | 1.75%(f) | 1.75% | 1.75% | 1.75%(g) | 1.50% | 1.50%(f) | ||||||
Ratio of net investment income/(loss) to average net assets(i) | 1.42%(f) | 1.10% | 0.66% | (0.24)% | 2.72% | 3.90%(f) | ||||||
Portfolio turnover rate(h) | 18% | 72% | 43% | 54% | 59% | 15% | ||||||
| (a) | The Fund commenced operations on December 31, 2007. |
| (b) | Calculated using the average shares method. |
| (c) | Less than ($0.005) per share. |
| (d) | Total returns are for the period indicated and have not been annualized. Total returns would have been lower had certain expenses not been waived during the period. Returns shown do not reflect the deduction of taxes that a shareholder would pay on Fund distributions or the redemption of Fund shares. |
| (e) | Less than $500. |
| (f) | Annualized. |
| (g) | Effective September 1, 2009, the net expense ratio limitation changed from 1.50% to 1.75% (exclusive of distribution and service (12b-1) fees, acquired fund fees and expenses, brokerage expenses, interest expense, short sale dividend expense, taxes and extraordinary expenses). |
| (h) | Portfolio turnover rate for periods less than one full year have not been annualized. |
| (i) | The ratios exclude the impact of expenses of the underlying funds in which the Fund invests as represented in the Statement of lnvestments. |
See Notes to Financial Statements.
25 | October 31, 2012
Table of Contents
| October 31, 2012 (Unaudited) | ||
Market Comment
U.S. equities moved higher in the period, in part due to a strengthening housing market and central bank interventions around the globe. Although Europe continued to grapple with economic and structural challenges, investors’ risk appetites surged after European Central Bank President Mario Draghi revealed a comprehensive plan to support struggling sovereigns, including direct purchases of government bonds in the open market. Additionally, the U.S. Federal Reserve’s announcement of a third round of quantitative easing was well received by the market, boosting stock prices. Equities retreated from their mid-September highs after a re-escalation of euro area concerns and renewed macro data weakness cast a cloud over the earlier liquidity-driven rally. In October, disappointing corporate revenue results and concerns about the looming U.S. “fiscal cliff” contributed to a slight rise in risk aversion toward the end of the period.
Within the Russell 1000® Value Index1, nine of ten sectors posted positive returns, with the Telecommunications Services, Consumer Discretionary, and Health Care sectors gaining the most. Information Technology was the only sector to post a negative return during the period, while Materials and Energy also lagged.
Fund Review
The Portfolio underperformed its benchmark for the period, posting positive relative results in four out of ten broad market sectors. Overall, stock selection was negative relative to the Russell 1000® Value Index, as decisions in Industrials, Consumer Staples, and Consumer Discretionary more than offset positive relative performance in Information Technology and Health Care.
Detractors from relative performance for the period included Abercrombie & Fitch (Consumer Discretionary), Lorillard (Consumer Staples), and Towers Watson (Industrials). Abercrombie & Fitch, a casual apparel specialty retailer, underperformed after the Company posted disappointing quarterly earnings, in part due to weakness in Europe. Shares of Lorillard, a U.S.-based tobacco company, declined after the firm reported lackluster results and investors voiced concerns about potential new regulation of menthol cigarettes. Shares of Towers Watson, a U.S.-based global provider of professional services, including employee benefits, talent management, and risk and capital management, fell after the Company issued quarterly earnings guidance that fell below analysts’ estimates.
Top contributors to relative performance included Phillips-Van Heusen (PVH) (Consumer Discretionary), Gilead Sciences (Health Care), and Phillips 66 (Energy). PVH, a clothing company with a large portfolio of brands including Calvin Klein and Tommy Hilfiger, saw its shares rise after the company announced solid quarterly profits based on strong sales in the U.S. and Europe and lower raw materials costs. Shares of Gilead Sciences, a U.S.-based biopharmaceutical company, outperformed after the firm’s results exceeded expectations on strong antiviral product sales. Investors also reacted positively to the company’s plans for developing its hepatitis C franchise. Shares of Phillips 66, a U.S.-based refining and
marketing company, rose due to a strong operating environment and a share repurchase program announced during the period. Not holding benchmark constituent Hewlett-Packard during the period also contributed positively to results.
Outlook
Overall, we expect global economic growth to continue, but at a slow rate and with varying degrees of recovery by region. The U.S. has been better positioned than many other economies, partly because its deleveraging process is more advanced and partly in response to a more aggressive policy environment. The U.S. household balance sheet has also received a welcome windfall gain from recovering housing and equity prices this year. Housing has been a bright spot in the U.S. with the recent Case-Shiller data showing year-over-year price appreciation for the first time in years. However, many risks still remain including the well publicized “fiscal cliff”. The fiscal contraction could amount to 4% of GDP, enough to tip the economy back into recession. We believe there will ultimately be some compromise reached, which will be closer to a 1-2% headwind vs. the 3-4% that many fear. We believe that the U.S. will remain in a slow growth environment. Continued aggressive Fed policy (QE3) and an improving housing market should help us to avoid a recession.
The Fund attempts to add value by combining Wellington Management’s proprietary fundamental and quantitative research in a disciplined framework to build a portfolio of the most attractive stocks. Within this framework, the Fund ended the period most overweight the Health Care and Information Technology sectors and most underweight the Materials and Telecommunication Services sectors.
The views and information discussed in this commentary are as of the date of publication, are subject to change, and may not reflect the writer’s current views. The views expressed represent an assessment of market conditions at a specific point in time, are opinions only and should not be relied upon as investment advice regarding a particular investment or markets in general. Such information does not constitute a recommendation to buy or sell specific securities or investment vehicles. It should not be assumed that any investment will be profitable or will equal the performance of the portfolios or any securities or any sectors mentioned herein. The subject matter contained herein has been derived from several sources believed to be reliable and accurate at the time of compilation. Wellington Management Company, LLP does not accept any liability for losses either direct or consequential caused by the use of this information.
| 1 | The Russell 1000® Value Index measures the performance of those Russell 1000® companies with lower price-to-book ratios and lower forecasted growth values. The index is not actively managed and does not reflect any deduction for fees, expenses or taxes. An investor may not invest directly in an index. |
26 | October 31, 2012
Table of Contents
ALPS | WMC Disciplined Value Fund | ||
Management Commentary | October 31, 2012 (Unaudited) | |
Performance of $10,000 Initial Investment (for the period ended October 31, 2012)
Comparison of change in value of a $10,000 investment (includes applicable sales loads of 5.50%)
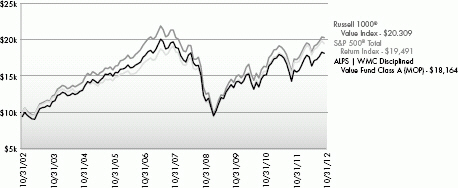
The chart above represents historical performance of a hypothetical investment of $10,000 in the Fund for the last ten years. Past performance does not guarantee future results. This chart does not reflect the deduction of taxes that a shareholder would pay on Fund distributions or the redemption of Fund shares.
Average Annual Total Returns (as of October 31, 2012)
| 1 Year | 5 Year | 10 Year | Total Expense Ratio | What you Pay * | ||||||
Class A (NAV)1 | 14.51% | -1.65% | 6.75% | 1.58% | 1.40% | |||||
Class A (MOP)2 | 8.26% | -2.76% | 6.15% | |||||||
Class C (NAV)1 | 13.86% | -2.35% | 5.97% | 2.33% | 2.15% | |||||
Class C (CDSC)2 | 12.86% | -2.35% | 5.97% | |||||||
Class I | 14.84% | -1.40% | 6.92% | 1.33% | 1.15% | |||||
Russell 1000® Value Index3 | 16.89% | -1.00% | 7.34% | |||||||
S&P 500® Total Return Index4 | 15.21% | 0.36% | 6.91% |
Performance data quoted represents past performance. Past performance does not guarantee future results. Investment return and principal value of an investment will fluctuate so that an investor’s shares, when sold or redeemed, may be worth more or less than the original cost. Current performance data may be higher or lower than actual data quoted. The Fund imposes a maximum Contingent Deferred Sales Charge (“CDSC”) of 1.00% on Class C shares redeemed within the first 12 months after a purchase, and on Class A shares redeemed within the first 12 months after a purchase in excess of $1 million. Performance data does not reflect the CDSC, which if reflected would reduce the performance quoted. For the most current month-end performance data, please call 1-866-759-5679.
Performance shown for Class C shares prior to June 30, 2010 reflects the historical performance of the Fund’s Class A shares, calculated using the fees and expenses of Class C shares.
The performance shown for the ALPS | WMC Disciplined Value Fund (the “Fund”) for periods prior to August 29, 2009, reflects the performance of the Activa Mutual Funds Trust – Activa Value Fund (as result of a prior reorganization of Activa Mutual Funds Trust – Activa Value Fund into the Fund).
| 1 | Net Asset Value (NAV) is the share price without sales charges. |
| 2 | Maximum Offering Price (MOP) for Class A shares includes the Fund’s maximum sales charge of 5.50%. CDSC performance for Class C shares includes a 1% CDSC on C shares redeemed within 12 months of purchase. Performance shown at NAV does not include these sales charges and would have been lower had it been taken into account. |
27 | October 31, 2012
Table of Contents
ALPS | WMC Disciplined Value Fund | ||
Management Commentary | October 31, 2012 (Unaudited) | |
| 3 | The Russell 1000® Value Index measures the performance of those Russell 1000® companies with lower price-to-book ratios and lower forecasted growth values. The index is not actively managed and does not reflect any deduction for fees, expenses or taxes. An investor may not invest directly in an index. |
| 4 | The S&P 500® Index is the Standard & Poor’s composite index of 500 stocks, a widely recognized, unmanaged index of common stock prices. The index is not actively managed and does not reflect any deduction for fees, expenses or taxes. An investor may not invest directly in an index. |
| * | What You Pay reflects the Advisor’s decision to contractually limit expenses through August 31, 2013. Please see the prospectus for additional information. |
The table does not reflect the deduction of taxes that a shareholder would pay on Fund distributions or the redemption of Fund shares.
Mutual funds are not insured or guaranteed by the FDIC or by any other government agency or government sponsored agency of the federal government or any state, not deposits, obligations or guaranteed by any bank or its affiliates and are subject to investment risks, including possible loss of the principal amount invested.
There is no guarantee that the Fund will continue to hold any one particular security or stay invested in any one particular company. The composition of the Fund’s top holdings is subject to change. Performance figures are historical and reflect the change in share price, reinvested distributions, changes in net asset value, sales charges and capital gains distributions, if any.
Investing in the Fund is subject to investment risks, including possible loss of the principal amount invested. Derivatives generally are more sensitive to changes in economic or market conditions than other types of investments; this could result in losses that significantly exceed the Fund’s original investment.
Top Ten Holdings (as a % of Net Assets)†
| ||
Wells Fargo & Co. | 3.47% | |
General Electric Co. | 3.43% | |
Exxon Mobil Corp. | 3.36% | |
Merck & Co., Inc. | 3.08% | |
JPMorgan Chase & Co. | 3.07% | |
Chevron Corp. | 3.07% | |
AT&T, Inc. | 2.22% | |
ACE, Ltd. | 2.13% | |
Bank of America Corp. | 2.00% | |
Citigroup, Inc. | 1.99% | |
Top Ten Holdings | 27.82% |
| † | Holdings are subject to change. Table presents indicative values only. |
Industry Sector Allocation (as a % of Net Assets)
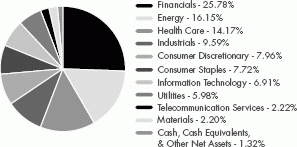
28 | October 31, 2012
Table of Contents
ALPS | WMC Disciplined Value Fund | ||
| October 31, 2012 (Unaudited) | ||
| Shares | Value (Note 2) | |||
COMMON STOCKS (98.68%) | ||||
Consumer Discretionary (7.96%) | ||||
Automobiles & Components (1.02%) | ||||
TRW Automotive Holdings | 16,730 | $778,112 | ||
| ||||
Consumer Durables & Apparel (1.60%) | ||||
Hasbro, Inc. | 10,150 | 365,299 | ||
PVH Corp. | 7,760 | 853,522 | ||
| ||||
| 1,218,821 | ||||
| ||||
Media (2.21%) | ||||
News Corp., Class A | 39,475 | 944,242 | ||
Viacom, Inc., Class B | 14,420 | 739,314 | ||
| ||||
| 1,683,556 | ||||
| ||||
Retailing (3.13%) | ||||
Abercrombie & Fitch Co., Class A | 14,312 | 437,661 | ||
Lowe’s Cos., Inc. | 37,125 | 1,202,107 | ||
TJX Cos., Inc. | 17,930 | 746,426 | ||
| ||||
| 2,386,194 | ||||
| ||||
TOTAL CONSUMER DISCRETIONARY | 6,066,683 | |||
| ||||
Consumer Staples (7.72%) | ||||
Food & Staples Retailing (1.62%) | ||||
CVS Caremark Corp. | 26,655 | 1,236,792 | ||
| ||||
Food Beverage & Tobacco (5.23%) | ||||
Altria Group, Inc. | 32,300 | 1,027,140 | ||
The JM Smucker Co. | 11,260 | 964,306 | ||
Lorillard, Inc. | 9,450 | 1,096,295 | ||
Philip Morris International, Inc. | 10,155 | 899,327 | ||
| ||||
| 3,987,068 | ||||
| ||||
Household & Personal Products (0.87%) | ||||
Energizer Holdings, Inc. | 9,025 | 658,554 | ||
| ||||
TOTAL CONSUMER STAPLES | 5,882,414 | |||
| ||||
Energy (16.15%) | ||||
Energy (16.15%) | ||||
Anadarko Petroleum Corp. | 11,350 | 780,993 | ||
Chevron Corp. | 21,219 | 2,338,546 | ||
ConocoPhillips | 20,890 | 1,208,487 | ||
Exxon Mobil Corp. | 28,134 | 2,564,977 | ||
Halliburton Co. | 13,405 | 432,847 | ||
Marathon Oil Corp. | 25,800 | 775,548 | ||
Marathon Petroleum Corp. | 12,900 | 708,597 | ||
National Oilwell Varco, Inc. | 9,685 | 713,785 | ||
Newfield Exploration Co.(a) | 16,000 | 433,920 | ||
Occidental Petroleum Corp. | 13,970 | 1,103,071 | ||
Patterson-UTI Energy, Inc. | 26,500 | 428,770 | ||
| Shares | Value (Note 2) | |||
Energy (continued) | ||||
Phillips 66 | 17,420 | $821,527 | ||
| ||||
TOTAL ENERGY | 12,311,068 | |||
| ||||
Financials (25.78%) | ||||
Banks (6.43%) | ||||
PNC Financial Services Group, Inc. | 14,000 | 814,660 | ||
US Bancorp | 43,480 | 1,443,971 | ||
Wells Fargo & Co. | 78,570 | 2,647,024 | ||
| ||||
| 4,905,655 | ||||
| ||||
Diversified Financials (10.98%) | ||||
Ameriprise Financial, Inc. | 20,930 | 1,221,684 | ||
Bank of America Corp. | 163,632 | 1,525,050 | ||
BlackRock, Inc. | 4,400 | 834,592 | ||
Citigroup, Inc. | 40,515 | 1,514,856 | ||
Invesco, Ltd. | 38,360 | 932,915 | ||
JPMorgan Chase & Co. | 56,170 | 2,341,166 | ||
| ||||
| 8,370,263 | ||||
| ||||
Insurance (6.27%) | ||||
ACE, Ltd. | 20,690 | 1,627,269 | ||
Aon PLC | 16,040 | 865,358 | ||
Hartford Financial Services Group, Inc. | 36,420 | 790,678 | ||
MetLife, Inc. | 20,780 | 737,482 | ||
Prudential Financial, Inc. | 13,290 | 758,195 | ||
| ||||
| 4,778,982 | ||||
| ||||
Real Estate (2.10%) | ||||
Camden Property Trust | 4,715 | 309,445 | ||
Equity Lifestyle Properties, Inc. | 6,900 | 464,577 | ||
Forest City Enterprises, Inc., Class A(a) | 51,300 | 823,365 | ||
| ||||
| 1,597,387 | ||||
| ||||
TOTAL FINANCIALS | 19,652,287 | |||
| ||||
Health Care (14.17%) | ||||
Health Care Equipment & Services (3.73%) | ||||
Aetna, Inc. | 10,660 | 465,842 | ||
Covidien PLC | 12,570 | 690,721 | ||
McKesson Corp. | 5,970 | 557,061 | ||
UnitedHealth Group, Inc. | 20,140 | 1,127,840 | ||
| ||||
| 2,841,464 | ||||
| ||||
Pharmaceuticals, Biotechnology & Life | ||||
Amgen, Inc. | 10,690 | 925,166 | ||
Eli Lilly & Co. | 19,455 | 946,097 | ||
Forest Laboratories, Inc.(a) | 26,673 | 899,147 | ||
Gilead Sciences, Inc.(a) | 12,065 | 810,285 | ||
29 | October 31, 2012
Table of Contents
ALPS | WMC Disciplined Value Fund | ||
Statement of Investments | October 31, 2012 (Unaudited) | |
| Shares | Value (Note 2) | |||
Pharmaceuticals, Biotechnology & Life Sciences (continued) | ||||
Merck & Co., Inc. | 51,440 | $2,347,207 | ||
Pfizer, Inc. | 20,680 | 514,312 | ||
Thermo Fisher Scientific, Inc. | 8,470 | 517,178 | ||
Watson Pharmaceuticals, Inc.(a) | 11,680 | 1,003,896 | ||
| ||||
| 7,963,288 | ||||
| ||||
TOTAL HEALTH CARE | 10,804,752 | |||
| ||||
Industrials (9.59%) | ||||
Capital Goods (6.62%) | ||||
The Boeing Co. | 7,660 | 539,570 | ||
Dover Corp. | 10,600 | 617,132 | ||
General Electric Co. | 124,315 | 2,618,074 | ||
Parker Hannifin Corp. | 6,550 | 515,223 | ||
United Technologies Corp. | 9,680 | 756,589 | ||
| ||||
| 5,046,588 | ||||
| ||||
Commercial & Professional Services (1.80%) | ||||
Equifax, Inc. | 14,500 | 725,580 | ||
Towers Watson & Co., Class A | 12,030 | 646,132 | ||
| ||||
| 1,371,712 | ||||
| ||||
Transportation (1.17%) | ||||
Hertz Global Holdings, | 36,845 | 488,933 | ||
United Continental Holdings, Inc.(a) | 21,200 | 407,252 | ||
| ||||
| 896,185 | ||||
| ||||
TOTAL INDUSTRIALS | 7,314,485 | |||
| ||||
Information Technology (6.91%) | ||||
Semiconductors & Semiconductor | ||||
Xilinx, Inc. | 11,260 | 368,878 | ||
| ||||
Sofware & Services (5.76%) | ||||
Accenture PLC, Class A | 11,495 | 774,878 | ||
eBay, Inc.(a) | 13,220 | 638,394 | ||
Genpact, Ltd. | 31,955 | 562,727 | ||
Oracle Corp. | 26,240 | 814,752 | ||
Teradata Corp.(a) | 4,920 | 336,085 | ||
VeriSign, Inc.(a) | 9,770 | 362,174 | ||
Visa, Inc., A Shares | 6,510 | 903,328 | ||
| ||||
| 4,392,338 | ||||
| ||||
Technology Hardware & Equipment (0.67%) | ||||
Apple, Inc. | 855 | 508,810 | ||
| ||||
TOTAL INFORMATION TECHNOLOGY | 5,270,026 | |||
| ||||
Materials (2.20%) | ||||
Materials (2.20%) | ||||
The Dow Chemical Co. | 37,968 | 1,112,462 | ||
| Shares | Value (Note 2) | |||
Materials (continued) | ||||
Newmont Mining Corp. | 10,311 | $562,465 | ||
| ||||
TOTAL MATERIALS | 1,674,927 | |||
| ||||
Telecommunication Services (2.22%) | ||||
Telecommunication Services (2.22%) | ||||
AT&T, Inc. | 48,915 | 1,691,970 | ||
| ||||
TOTAL TELECOMMUNICATION SERVICES | 1,691,970 | |||
| ||||
Utilities (5.98%) | ||||
Utilities (5.98%) | ||||
American Electric Power Co., Inc | 22,170 | 985,235 | ||
NextEra Energy, Inc. | 19,130 | 1,340,248 | ||
PG&E Corp. | 25,360 | 1,078,307 | ||
Xcel Energy, Inc. | 40,870 | 1,154,577 | ||
| ||||
TOTAL UTILITIES | 4,558,367 | |||
| ||||
TOTAL COMMON STOCKS (Cost $62,617,221) | 75,226,979 | |||
| ||||
7-Day Yield | Shares | Value (Note 2) | ||||
SHORT TERM INVESTMENTS (1.62%) | ||||||
Money Market Fund (1.62%) | ||||||
Fidelity Institutional Money Market - Money Market Portfolio, Class I | 0.152% | 1,233,998 | 1,233,998 | |||
| ||||||
TOTAL SHORT TERM INVESTMENTS (Cost $1,233,998) | 1,233,998 | |||||
| ||||||
TOTAL INVESTMENTS (100.30%) (Cost $63,851,219) | $76,460,977 | |||||
Liabilities In Excess Of Other | (228,928) | |||||
| ||||||
NET ASSETS (100.00%) | $76,232,049 | |||||
| ||||||
| (a) | Non-Income Producing Security. |
Common Abbreviations:
Ltd. - Limited.
PLC - Public Limited Company.
30 | October 31, 2012
Table of Contents
ALPS | WMC Disciplined Value Fund | ||
Statement of Investments | October 31, 2012 (Unaudited) | |
For Fund compliance purposes, the Fund’s industry classifications refer to any one or more of the industry sub-classifications used by one or more widely recognized market indexes or ratings group indexes, and/or as defined by Fund management. This definition may not apply for purposes of this report, which may combine industry sub-classifications for reporting ease. Industries are shown as a percent of net assets. These industry classifications are based on third party definitions and are unaudited. The definitions are industry terms and do not reflect the legal status of any of the investments or the companies in which the Fund has invested.
See Notes to Financial Statements.
31 | October 31, 2012
Table of Contents
ALPS | WMC Disciplined Value Fund | ||
| October 31, 2012 (Unaudited) | ||
ASSETS | ||||
Investments, at value | $ | 76,460,977 | ||
Receivable for investments sold | 494,335 | |||
Receivable for shares sold | 60 | |||
Dividends receivable | 83,673 | |||
Prepaid expenses and other assets | 19,692 | |||
Total Assets | 77,058,737 | |||
LIABILITIES | ||||
Payable for investments purchased | 305,751 | |||
Payable for shares redeemed | 395,424 | |||
Investment advisory fees payable | 52,326 | |||
Administration and transfer agency fees payable | 41,526 | |||
Distribution and services fees payable | 9,630 | |||
Legal fees payable | 472 | |||
Audit fees payable | 12,747 | |||
Trustees’ fees and expenses payable | 1,539 | |||
Overdraft payable | 4,106 | |||
Accrued expenses and other liabilities | 3,167 | |||
Total Liabilities | 826,688 | |||
NET ASSETS | $ | 76,232,049 | ||
NET ASSETS CONSIST OF | ||||
Paid-in capital | $ | 71,650,977 | ||
Accumulated net investment income | 745,315 | |||
Accumulated net realized loss on investments | (8,774,001 | ) | ||
Net unrealized appreciation on investments | 12,609,758 | |||
NET ASSETS | $ | 76,232,049 | ||
INVESTMENTS, AT COST | $ | 63,851,219 | ||
PRICING OF SHARES | ||||
Class A: | ||||
Net Asset Value, offering and redemption price per share(a) | $ | 8.66 | ||
Net Assets | $ | 44,057,319 | ||
Shares of beneficial interest outstanding (unlimited number of shares, no par value common stock authorized) | 5,084,609 | |||
Maximum offering price per share ((NAV/0.9450), based on maximum sales charge of | $ | 9.16 | ||
Class C: | ||||
Net Asset Value, offering and redemption price per share(a) | $ | 8.60 | ||
Net Assets | $ | 80,606 | ||
Shares of beneficial interest outstanding (unlimited number of shares, no par value common stock authorized) | 9,378 | |||
Class I: | ||||
Net Asset Value, offering and redemption price per share | $ | 8.75 | ||
Net Assets | $ | 32,094,124 | ||
Shares of beneficial interest outstanding (unlimited number of shares, no par value common stock authorized) | 3,668,710 | |||
| (a) | Redemption price per share may be reduced for any applicable contingent deferred sales charge. For a description of a possible sales charge, please see the Fund’s Prospectus. |
See Notes to Financial Statements.
32 | October 31, 2012
Table of Contents
ALPS | WMC Disciplined Value Fund | ||
| For the Six Months Ended October 31, 2012 (Unaudited) | ||
INVESTMENT INCOME | ||||
Dividends | $ | 945,477 | ||
Total Investment Income | 945,477 | |||
EXPENSES | ||||
Investment advisory fees | 363,143 | |||
Administrative and transfer agency fees | 88,366 | |||
Distribution and service fees | ||||
Class A | 55,020 | |||
Class C | 392 | |||
Legal fees | 1,701 | |||
Audit fees | 8,987 | |||
Reports to shareholders and printing fees | 10,828 | |||
State registration fees | 14,876 | |||
Insurance fees | 1,865 | |||
Custody fees | 5,062 | |||
Trustees’ fees and expenses | 3,350 | |||
Miscellaneous expenses | 3,872 | |||
Total Expense | 557,462 | |||
Less fees waived/reimbursed by investment advisor | ||||
Class A | (36,016 | ) | ||
Class C | (64 | ) | ||
Class I | (26,376 | ) | ||
Net Expenses | 495,006 | |||
Net Investment Income | 450,471 | |||
Net realized gain on investments | 1,532,042 | |||
Net change in unrealized appreciation on investments | 103,006 | |||
NET REALIZED AND UNREALIZED GAIN ON INVESTMENTS | 1,635,048 | |||
NET INCREASE IN NET ASSETS RESULTING FROM OPERATIONS | $ | 2,085,519 | ||
See Notes to Financial Statements.
33 | October 31, 2012
Table of Contents
ALPS | WMC Disciplined Value Fund | ||
For the Six Months Ended October 31, 2012 (Unaudited) | For the Year Ended April 30, 2012 | |||||||
OPERATIONS | ||||||||
Net investment income | $ | 450,471 | $ | 662,413 | ||||
Net realized gain on investments | 1,532,042 | 2,407,417 | ||||||
Net change in unrealized appreciation/(depreciation) on investments | 103,006 | (4,114,283 | ) | |||||
Net Increase/(Decrease) in Net Assets Resulting from Operations | 2,085,519 | (1,044,453 | ) | |||||
DISTRIBUTIONS | ||||||||
Dividends to shareholders from net investment income | ||||||||
Class A | 0 | (293,376 | ) | |||||
Class C | 0 | (25 | ) | |||||
Class I | 0 | (241,602 | ) | |||||
Net Decrease in Net Assets from Distributions | 0 | (535,003 | ) | |||||
BENEFICIAL INTEREST TRANSACTIONS (NOTE 6) | ||||||||
Shares sold | ||||||||
Class A | 188,899 | 2,056,325 | ||||||
Class C | 0 | 65,000 | ||||||
Class I | 1,442,198 | 8,493,521 | ||||||
Dividends reinvested | ||||||||
Class A | 0 | 281,298 | ||||||
Class C | 0 | 25 | ||||||
Class I | 0 | 241,601 | ||||||
Shares redeemed | ||||||||
Class A | (2,373,510 | ) | (4,947,805 | ) | ||||
Class I | (4,814,443 | ) | (3,071,135 | ) | ||||
Net Increase/(Decrease) in Net Assets Derived from Beneficial Interest Transactions | (5,556,856 | ) | 3,118,830 | |||||
Net increase/(decrease) in net assets | (3,471,337 | ) | 1,539,374 | |||||
NET ASSETS | ||||||||
Beginning of year | 79,703,386 | 78,164,012 | ||||||
End of period * | $ | 76,232,049 | $ | 79,703,386 | ||||
*Including accumulated net investment income of: | $ | 745,315 | $ | 294,844 | ||||
See Notes to Financial Statements.
34 | October 31, 2012
Table of Contents
ALPS | WMC Disciplined Value Fund – Class A | ||
| Selected data for a share of beneficial interest outstanding throughout the periods indicated: | ||
For the Six Months Ended October 31, 2012 (Unaudited)(a) | For the Year Ended April 30, 2012 | For the Year Ended April 30, 2011(b) | For the Period January 1, 2010 to April 30, 2010(c) | For the Year Ended December 31, 2009 | For the Year Ended December 31, 2008 | For the Year Ended December 31, 2007 | ||||||||
Net asset value, beginning of period | $8.42 | $8.64 | $7.43 | $6.92 | $5.86 | $9.35 | $9.81 | |||||||
INCOME/(LOSS) FROM INVESTMENT OPERATIONS: | ||||||||||||||
Net investment income | 0.05(d) | 0.06(d) | 0.06(d) | 0.03 | 0.07 | 0.08 | 0.14 | |||||||
Net realized and unrealized gain/(loss) | 0.19 | (0.23) | 1.22 | 0.48 | 1.06 | (3.49) | 0.09 | |||||||
Total from investment operations | 0.24 | (0.17) | 1.28 | 0.51 | 1.13 | (3.41) | 0.23 | |||||||
DISTRIBUTIONS: | ||||||||||||||
From net investment income | – | (0.05) | (0.07) | – | (0.07) | (0.08) | (0.14) | |||||||
From net realized gains | – | – | – | – | – | – | (0.55) | |||||||
Total distributions | – | (0.05) | (0.07) | – | (0.07) | (0.08) | (0.69) | |||||||
Net increase/(decrease) in net asset value | 0.24 | (0.22) | 1.21 | 0.51 | 1.06 | (3.49) | (0.46) | |||||||
Net asset value, end of period | $8.66 | $8.42 | $8.64 | $7.43 | $6.92 | $5.86 | $9.35 | |||||||
TOTAL RETURN(e) | 2.85% | (1.81)% | 17.34% | 7.22% | 19.24% | (36.45)% | 2.43% | |||||||
RATIOS/SUPPLEMENTAL DATA: | ||||||||||||||
Net assets, end of period (000s) | $44,057 | $44,989 | $48,899 | $45,300 | $62,264 | $53,841 | $88,679 | |||||||
Ratio of expenses | 1.56%(f) | 1.58% | 1.71% | 1.70%(f) | N/A | N/A | N/A | |||||||
Ratio of expenses | 1.40%(f) | 1.40% | 1.40% | 1.40%(f) | 1.62% | 1.50% | 1.20% | |||||||
Ratio of net investment income to average net assets | 1.07%(f) | 0.83% | 0.77% | 0.60%(f) | 1.12% | 1.10% | 1.40% | |||||||
Portfolio turnover rate(g) | 13% | 46% | 44% | 11% | 56% | 83% | 52% | |||||||
| (a) | Prior to August 31, 2012, the ALPS | WMC Disciplined Value Fund was known as the ALPS | WMC Value Intersection Fund. |
| (b) | Prior to August 31, 2010, the ALPS | WMC Value Intersection Fund was known as the Activa Value Fund. |
| (c) | Effective March 9, 2010, the Board approved changing the fiscal year-end of the Fund from December 31 to April 30. |
| (d) | Calculated using the average shares method. |
| (e) | Total returns are for the period indicated and have not been annualized. Total returns would have been lower had certain expenses not been waived during the period. Returns shown do not reflect the deduction of taxes that a shareholder would pay on Fund distributions or the redemption of Fund shares. Returns shown exclude any applicable sales charges. |
| (f) | Annualized. |
| (g) | Portfolio turnover rate for periods less than one full year have not been annualized. |
See Notes to Financial Statements.
35 | October 31, 2012
Table of Contents
ALPS | WMC Disciplined Value Fund – Class C | ||
Financial Highlights | Selected data for a share of beneficial interest outstanding throughout the periods indicated: | |
For the Six Months Ended October 31, 2012 (Unaudited)(a) | For the Year Ended April 30, 2012 | For the Period July 2, 2010 (Inception) to April 30, 2011(b) | ||||
Net asset value, beginning of period | $8.39 | $8.62 | $6.40 | |||
INCOME/(LOSS) FROM INVESTMENT OPERATIONS: | ||||||
Net investment income/(loss)(c) | 0.01 | (0.01) | (0.01) | |||
Net realized and unrealized gain/(loss) | 0.20 | (0.20) | 2.27 | |||
Total from investment operations | 0.21 | (0.21) | 2.26 | |||
DISTRIBUTIONS: | ||||||
From net investment income | – | (0.02) | (0.04) | |||
Total distributions | – | (0.02) | (0.04) | |||
Net increase/(decrease) in net asset value | 0.21 | (0.23) | 2.22 | |||
Net asset value, end of period | $8.60 | $8.39 | $8.62 | |||
TOTAL RETURN(d) | 2.50% | (2.45)% | 35.44% | |||
RATIOS/SUPPLEMENTAL DATA: | ||||||
Net assets, end of period (000s) | $81 | $79 | $14 | |||
Ratio of expenses to average net assets excluding fee waivers and reimbursements | 2.31%(e) | 2.38% | 2.49%(e) | |||
Ratio of expenses to average net assets including fee waivers and reimbursements | 2.15%(e) | 2.15% | 2.15%(e) | |||
Ratio of net investment income/(loss) to average net assets | 0.32%(e) | (0.16)% | (0.09)%(e) | |||
Portfolio turnover rate(f) | 13% | 46% | 44%(g) | |||
| (a) | Prior to August 31, 2012, the ALPS | WMC Disciplined Value Fund was known as the ALPS | WMC Value Intersection Fund. |
| (b) | Prior to August 31, 2010, the ALPS | WMC Value Intersection Fund was known as the Activa Value Fund. |
| (c) | Calculated using the average shares method. |
| (d) | Total returns are for the period indicated and have not been annualized. Total returns would have been lower had certain expenses not been waived during the period. Returns shown do not reflect the deduction of taxes that a shareholder would pay on Fund distributions or the redemption of Fund shares. Returns shown exclude any applicable sales charges. |
| (e) | Annualized. |
| (f) | Portfolio turnover rate for periods less than one full year have not been annualized. |
| (g) | Portfolio turnover rate is calculated at the Fund Level and represents the year ended April 30, 2011. |
See Notes to Financial Statements.
36 | October 31, 2012
Table of Contents
ALPS | WMC Disciplined Value Fund – Class I | ||
Financial Highlights | Selected data for a share of beneficial interest outstanding throughout the periods indicated: | |
For the Six Months Ended October 31, 2012 (Unaudited)(a) | For the Year Ended April 30, 2012 | For the Year Ended April 30, 2011(b) | For the Period January 1, 2010 April 30, 2010(c) | For the Year Ended December 31, 2009 | For the Year Ended December 31, 2008 | For the Year Ended 2007 | ||||||||
Net asset value, beginning of period | $8.49 | $8.71 | $7.48 | $6.96 | $5.89 | $9.41 | $9.86 | |||||||
INCOME/(LOSS) FROM INVESTMENT OPERATIONS: | ||||||||||||||
Net investment income | 0.06(d) | 0.09(d) | 0.07(d) | 0.02 | 0.07 | 0.09 | 0.15 | |||||||
Net realized and unrealized gain/(loss) | 0.20 | (0.24) | 1.24 | 0.50 | 1.08 | (3.52) | 0.10 | |||||||
Total from investment operations | 0.26 | (0.15) | 1.31 | 0.52 | 1.15 | (3.43) | 0.25 | |||||||
DISTRIBUTIONS: | ||||||||||||||
From net investment income | – | (0.07) | (0.08) | – | (0.08) | (0.09) | (0.15) | |||||||
From net realized gains | – | – | – | – | – | – | (0.55) | |||||||
Total distributions | – | (0.07) | (0.08) | – | (0.08) | (0.09) | (0.70) | |||||||
Net increase/(decrease) in net asset value | 0.26 | (0.22) | 1.23 | 0.52 | 1.07 | (3.52) | (0.45) | |||||||
Net asset value, end of period | $8.75 | $8.49 | $8.71 | $7.48 | $6.96 | $5.89 | $9.41 | |||||||
TOTAL RETURN(e) | 3.06% | (1.62)% | 17.67% | 7.47% | 19.59% | (36.38)% | 2.59% | |||||||
RATIOS/SUPPLEMENTAL DATA: | ||||||||||||||
Net assets, end of period | $32,094 | $34,636 | $29,251 | $16,814 | $16,465 | $3,658 | $5,422 | |||||||
Ratio of expenses | 1.31%(f) | 1.33% | 1.46% | 1.49%(f) | N/A | N/A | N/A | |||||||
Ratio of expenses | 1.15%(f) | 1.15% | 1.15% | 1.15%(f) | 1.46% | 1.40% | 1.10% | |||||||
Ratio of net investment income to average net assets | 1.32%(f) | 1.08% | 0.95% | 0.77%(f) | 1.17% | 1.30% | 1.40% | |||||||
Portfolio turnover rate(g) | 13% | 46% | 44% | 11% | 56% | 83% | 52% | |||||||
| (a) | Prior to August 31, 2012, the ALPS | WMC Disciplined Value Fund was known as the ALPS | WMC Value Intersection Fund. |
| (b) | Prior to August 31, 2010, the ALPS | WMC Value Intersection Fund was known as the Activa Value Fund. |
| (c) | Effective March 9, 2010, the Board approved changing the fiscal year-end of the Fund from December 31 to April 30. |
| (d) | Calculated using the average shares method. |
| (e) | Total returns are for the period indicated and have not been annualized. Total returns would have been lower had certain expenses not been waived during the period. Returns shown do not reflect the deduction of taxes that a shareholder would pay on Fund distributions or the redemption of Fund shares. |
| (f) | Annualized. |
| (g) | Portfolio turnover rate for periods less than one full year have not been annualized. |
See Notes to Financial Statements.
37 | October 31, 2012
Table of Contents
| October 31, 2012 (Unaudited) |
During the six month period ending October 31, 2012, the Clough China Fund gained 1.39%, slightly outperforming the MSCI China Index which rose 1.21%.
Investment Environment
While the Fund and benchmark index generated modest gains, it was a volatile period for Chinese equities. Indeed, the market began the period under considerable pressure, falling more than 15% at one point in May as China’s macro data released for the month of April were weaker than expected and investors realized that Beijing would not undertake any large fiscal or monetary stimulus package such as the one implemented in the 2009 financial crisis. Even though the People’s Bank of China (PBOC) cut the required reserve ratio (RRR) for commercial banks in June and then lowered interest rates in early July, markets remained depressed until September when the announcement of QE3 (third round of quantitative easing) by the U.S. Federal Reserve brought some liquidity back to the region. In September and October, the benchmark rallied and gained about 15% from its lows.
Recent macro statistics have shown a notable improvement in China’s economic data. We see the turnaround as having begun in September, and being confirmed in October on several fronts. Industrial production rose 9.6% year-over-year in October, up from 9.2% in September and 8.9% in August. Retail sales also accelerated, growing 14.5% in October as compared to 14.2% and 13.2% from the prior two months. Power generation was still very slow in September, growing just 1.5% year-over-year, before accelerating to 6.4% in October signaling an increase in manufacturing activity.1 Even exports are rebounding, despite weakness in Europe. Exports increased 11.6% in October after gaining 9.9% in September and a sluggish 2.7% in August.2 November manufacturing and services PMI8 (Purchasing Managers’ Index), both from HSBC9 Holdings plc and official government sources are now all back above the 50 expansionary mark6.
More important for investors, the Corporate sector is showing signs of an earnings recovery. China’s industrial companies’ profits rose 7.8% in September. This was the first gain in six months. They then surged 20.5% in October from a year earlier, pushing the full year growth back into positive territory.3 After an extended slowdown, the data suggest that China’s economic growth likely bottomed in the third quarter of 2012, with a 7.4% GDP growth.2 We expect an acceleration in growth from the fourth quarter onwards. The ongoing debate regarding China’s slowdown seems to have been resolved with a “soft landing” scenario.
Portfolio Composition
The Fund’s massive overweight in the Consumer Discretionary (22% vs. 5.4% in our benchmark) and Technology (11.8% vs. 6.3%) sectors were a positive contributor to the Fund’s performance whereas Utilities, Telecom Services and Materials disappointed. In terms of individual stocks, the best performing holding was Great Wall Motors – an auto manufacturer whose strategy to emphasize SUV models has been very successful and resulted in spectacular financial results with revenues increasing 37% and earnings growing 51% over the first nine months of 2012.4 China State Construction International,
a construction and civil engineering group that is leveraged to the development of social housing projects across China and VTech Holdings, a leading provider of children’s electronic education products worldwide, were also noteworthy positive contributors. VTech has been an attractive cash generator offering a sustainable dividend yield above 6%.
On the other hand, the worst performing stocks during the period were two Financials – Ping An Insurance and the broker Haitong Securities. Integrated oil giant Petrochina was also a drag on Fund performance.
The Fund’s exposure to small-to-mid capitalization equities (about 40% of assets) is and will likely remain much higher than the benchmark (13%). As China’s economy rebalances, we believe smaller, faster growing companies should provide better investment opportunities than the bigger, more mature companies. We can describe many of these companies as “new leaders” driven by private sector, entrepreneurial management teams. This is very different from many of the very large Chinese companies, which usually have some level of state ownership. These new leaders often have surprisingly strong balance sheets and cash flow and offer a high visibility in their growth. Our presence on the ground and frequent traveling in Mainland China allow consistent due diligence on a stock universe larger than our reference index.
Outlook
As mentioned, we see the early signals of a cyclical recovery in China. We expect GDP to grow around 7.8% for the full year 2012 and a similar performance next year. Capital expenditure and consumer spending will remain the two growth engines of the economy. A major new stimulus package is both unlikely and unnecessary, though we do expect some loosening of fiscal policy. The Government has already taken several steps to restart infrastructure spending in select areas such as railway and subway construction where contracts approvals had been frozen for more than a year.
On the consumption side, we believe household income growth should continue to drive retail sales. Urbanization trends continue to support the rise in the middle class that is forecast to reach 300 million people or 23% of the population by 2017, up from 200 million this year.5 This is nearly equivalent to the size of the entire U.S. population. Importantly, the balance sheet of China’s household sector is pristine, characterized by a very low level of debts. For instance, credit card debts currently represent less than 2% of GDP, well below the levels found in Korea and the United States. In our view, high income growth and low credit penetration should drive rapid growth in private consumption for years to come.
Coming back to next year, we expect two factors to play an important role to support economic growth and financial markets. First, we expect some relaxation of the tightening policy on the Property sector, now that property prices have stabilized. This could happen in the summer months. Second, we believe a set of reforms supporting the next wave of urbanization are likely to be adopted. The new political leadership has started to signal a withdrawal or a
| 38 | October 31, 2012 |
Table of Contents
Clough China Fund | ||
Management Commentary | October 31, 2012 (Unaudited) |
gradual loosening of the residency permit, known as “Hukou”, that would allow migrant workers to more easily settle in large cities with their families, while being entitled to normal education and health care services.
Indeed the political transition, delayed by one month, finally took place on November 6th and was in line with expectations. Xi Jinping will succeed Hu Jintao as Party General Secretary and China’s next President. The next Premier, Li Kejiang, is a firm believer in urbanization as a key to continued growth and stability. These reforms will add visibility to the medium-term growth potential of China and support the much needed economic rebalancing. In our view, they should be well received by the equity markets.
As the economy and the profit cycle have now turned around, we believe investors should take advantage of still low valuation levels and increase exposure to China. The MSCI China Index trades at just 9.4x expected earnings for 2013, well below historical levels.7 The current low valuations and an economic acceleration should drive a strong performance for Chinese equities over the next twelve months. This would provide a nice tailwind to the Fund’s performance.
Sources:
| 1 | National Bureau of Statistics |
| 2 | Bloomberg |
| 3 | UBS |
| 4 | Great Wall Motors |
| 5 | Jones Lang LaSalle “Uncovering retail opportunities in China”, December 2012. |
| 6 | HSBC “China’s Party Congress: what the leadership changes for Chinese equities”, November 2012. |
| 7 | Credit Suisse |
| 8 | Purchasing Managers’ Indices (PMIs) are long-established monthly data-driven snapshots of individual countries’ economies. They are compiled using proprietary and highly effective market research techniques (based on interviews with senior purchasing executives) which accurately measure economic activity and report well before other comparative official and government statistics. Source: http://www.hsbc.com |
| 9 | HSBC - The Hongkong and Shanghai Banking Corporation Limited. Source: http://www.hsbc.com |
| 10 | The Morgan Stanley Capital International (“MSCI”) China Index is constructed according to the MSCI Global Investable Market Index (GIMI) family. The MSCI China Index is part of the MSCI Emerging Markets Index. The index is not actively managed and does not reflect any deduction for fees, expenses or taxes. An investor may not invest directly in an index. |
The views and information discussed in this commentary are as of the date of publication, are subject to change, and may not reflect the writer’s current views. The views expressed represent an assessment of market conditions at a specific point in time, are opinions only and should not be relied upon as investment advice regarding a particular investment or markets in general. Such information does not constitute a recommendation to buy or sell specific securities or investment vehicles. It should not be assumed that any investment will be profitable or will equal the performance of the portfolios or any securities or any sectors mentioned herein. The subject matter contained herein has been derived
from several sources believed to be reliable and accurate at the time of compilation. Clough Capital Partners, LP does not accept any liability for losses either direct or consequential caused by the use of this information.
| 39 | October 31, 2012 |
Table of Contents
Clough China Fund | ||
Management Commentary | October 31, 2012 (Unaudited) |
Performance of $10,000 Initial Investment (for the period ended October 31, 2012)
Comparison of change in value of a $10,000 investment (includes applicable sales loads of 5.50%)

The chart above represents historical performance of a hypothetical investment of $10,000 in the Fund since inception. Past performance does not guarantee future results. This chart does not reflect the deduction of taxes that a shareholder would pay on Fund distributions or the redemption of Fund shares.
Average Annual Total Returns (as of October 31, 2012)
| 1 Year | 3 Year | 5 Year | Since Inception ^ | Total Expense Ratio | What You Pay * | |||||||
Class A (NAV)1 | 8.61% | 3.68% | -5.30% | 13.65% | 2.09% | 1.96% | ||||||
Class A (MOP)2 | 2.64% | 1.75% | -6.37% | 12.71% | ||||||||
Class C (NAV)1 | 7.75% | 2.88% | -6.02% | 12.81% | 2.89% | 2.71% | ||||||
Class C (CDSC)2 | 6.75% | 2.88% | -6.02% | 12.81% | ||||||||
Class I3 | 8.83% | 4.01% | -4.92% | 14.16% | 1.86% | 1.71% | ||||||
MSCI China Index4 | 7.92% | 0.34% | -8.33% | 13.53% |
Performance data quoted represents past performance. Past performance does not guarantee future results. Investment return and principal value of an investment will fluctuate so that an investor’s shares, when sold or redeemed, may be worth more or less than the original cost. Current performance data may be higher or lower than actual data quoted. The Fund imposes a 2.00% redemption fee on shares held for less than 30 days. The Fund imposes a maximum Contingent Deferred Sales Charge (“CDSC”) of 1.00% on Class C shares redeemed within the first 12 months after a purchase, and on Class A shares redeemed within the first 12 months after a purchase in excess of $l million. Performance data does not reflect the redemption fee or the CDSC, which if reflected would reduce the performance quoted. For the most current month-end performance data, please call 1-877-256-8445.
The performance shown for the Clough China Fund for periods prior to January 15, 2010, reflects the performance of the Old Mutual China Fund, a series of Old Mutual Funds I (as a result of a prior reorganization of the Old Mutual China Fund into the Clough China Fund).
| 1 | Net Asset Value (NAV) is the share price without sales charges. |
| 2 | Maximum Offering Price (MOP) includes sales charges. Class A returns include effects of the Fund’s maximum sales charge of 5.50%; Class C returns include the 1.00% CDSC. |
40 | October 31, 2012
Table of Contents
Clough China Fund | ||
Management Commentary | October 31, 2012 (Unaudited) |
| 3 | Prior to close of business on January 15, 2010, Class I was known as Institutional Class of the Old Mutual China Fund. |
| 4 | The Morgan Stanley Capital International (“MSCI”) China Index is constructed according to the MSCI Global Investable Market Index (GIMI) family. The MSCI China Index is part of the MSCI Emerging Markets Index. The index is not actively managed and does not reflect any deduction for fees, expenses or taxes. An investor may not invest directly in an index. |
| ^ | Fund Inception date of December 30, 2005. |
| * | What You Pay reflects the Advisor’s decision to contractually limit expenses through August 31, 2013. Please see the prospectus for additional information. |
The table does not reflect the deduction of taxes that a shareholder would pay on Fund distributions or the redemption of Fund shares.
Mutual funds are not insured or guaranteed by the FDIC or by any other government agency or government sponsored agency of the federal government or any state, not deposits, obligations or guaranteed by any bank or its affiliates and are subject to investment risks, including possible loss of the principal amount invested.
Investing in the Fund is subject to investment risks, including possible loss of the principal amount invested.
Investing in China, Hong Kong and Taiwan involves risk and considerations not present when investing in more established securities markets. The Fund may be more susceptible to the economic, market, political and local risks of these regions than a fund that is more geographically diversified.
This Fund is not suitable for all investors.
Top Ten Holdings (as a % of Net Assets) † | ||||
| ||||
China Construction Bank Corp., Class H | 5.90 | % | ||
Tencent Holdings, Ltd. | 5.88 | % | ||
Industrial & Commercial Bank of China, | 5.77 | % | ||
L’Occitane International SA | 4.02 | % | ||
Bank of China, Ltd., Class H | 3.96 | % | ||
China State Construction International Holdings, Ltd. | 3.49 | % | ||
Great Wall Motor Co., Ltd., Class H | 3.18 | % | ||
Shenzhou International Group Holdings, Ltd. | 3.06 | % | ||
PetroChina Co., Ltd., Class H | 3.00 | % | ||
VTech Holdings, Ltd. | 2.94 | % | ||
Top Ten Holdings | 41.20 | % | ||
† Holdings are subject to change. Table presents indicative values only. |
| |||
Industry Sector Allocation (as a % of Net Assets)
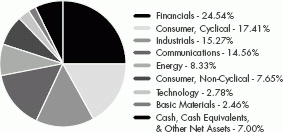
41 | October 31, 2012
Table of Contents
Clough China Fund | ||
| October 31, 2012 (Unaudited) | ||
| Shares | Value (Note 2) | |||
COMMON STOCKS (93.00%) | ||||
Basic Materials (2.46%) | ||||
Iron & Steel (1.59%) | ||||
Angang Steel Co., Ltd., | 570,000 | $339,587 | ||
Maanshan Iron & Steel Co., Ltd., Class H(a) | 2,112,000 | 541,178 | ||
| ||||
| 880,765 | ||||
| ||||
Mining (0.87%) | ||||
Zhaojin Mining Industry Co., Ltd., Class H | 288,000 | 484,203 | ||
| ||||
TOTAL BASIC MATERIALS | 1,364,968 | |||
| ||||
Communications (14.56%) | ||||
Internet (5.89%) | ||||
Tencent Holdings, Ltd. | 92,800 | 3,264,191 | ||
| ||||
Telecommunications (8.67%) | ||||
China Mobile, Ltd. | 129,500 | 1,436,381 | ||
China Telecom Corp., Ltd., | 2,096,000 | 1,240,097 | ||
SmarTone Telecommunications Holdings, Ltd. | 249,455 | 502,640 | ||
VTech Holdings, Ltd. | 137,800 | 1,632,363 | ||
| ||||
| 4,811,481 | ||||
| ||||
TOTAL COMMUNICATIONS | 8,075,672 | |||
| ||||
Consumer, Cyclical (17.41%) | ||||
Airlines (0.52%) | ||||
Air China, Ltd., Class H | 412,000 | 291,103 | ||
| ||||
Apparel (4.15%) | ||||
Shenzhou International Group Holdings, Ltd. | 872,000 | 1,695,293 | ||
Sitoy Group Holdings, Ltd.(a) | 1,048,000 | 605,761 | ||
| ||||
| 2,301,054 | ||||
| ||||
Auto Manufacturers (3.19%) | ||||
Great Wall Motor Co., Ltd., | 647,500 | 1,766,705 | ||
| ||||
Auto Parts & Equipment (0.51%) | ||||
Xinyi Glass Holdings, Ltd. | 506,000 | 282,511 | ||
| ||||
Distribution & Wholesale (1.02%) | ||||
Li & Fung, Ltd. | 340,000 | 567,176 | ||
| ||||
Home Furnishings (1.16%) | ||||
Haier Electronics Group Co., | 370,000 | 471,171 | ||
Skyworth Digital Holdings, Ltd. | 324,000 | 174,146 | ||
| ||||
| 645,317 | ||||
| ||||
Retail (6.86%) | ||||
Baoxin Auto Group, Ltd.(a| | 571,000 | 407,757 | ||
| Shares | Value (Note 2) | |||
Retail (continued) | ||||
Bosideng International Holdings, Ltd. | 904,000 | $285,755 | ||
China Resources Enterprise, Ltd. | 92,000 | 298,074 | ||
Giordano International, Ltd. | 462,000 | 382,960 | ||
Man Wah Holdings, Ltd. | 581,600 | 356,677 | ||
SA SA International Holdings, Ltd. | 1,776,000 | 1,216,053 | ||
Stelux Holdings International, Ltd. | 3,823,600 | 855,380 | ||
| ||||
| 3,802,656 | ||||
| ||||
TOTAL CONSUMER, CYCLICAL | 9,656,522 | |||
| ||||
Consumer, Non-Cyclical (7.65%) | ||||
Cosmetics/Personal Care (4.02%) | ||||
L’Occitane International SA | 717,250 | 2,229,660 | ||
| ||||
Food (1.22%) | ||||
Want Want China Holdings, Ltd. | 498,000 | 677,987 | ||
| ||||
Healthcare-Products (0.43%) | ||||
Hengan International Group Co., Ltd. | 26,500 | 240,619 | ||
| ||||
Household Products/Wares (1.98%) | ||||
Biostime International Holdings, Ltd. | 48,000 | 122,783 | ||
Samsonite International SA | 470,100 | 973,138 | ||
| ||||
| 1,095,921 | ||||
| ||||
TOTAL CONSUMER, NON-CYCLICAL | 4,244,187 | |||
| ||||
Energy (8.33%) | ||||
Coal (2.21%) | ||||
China Shenhua Energy Co., Ltd., Class H | 289,500 | 1,226,669 | ||
| ||||
Oil & Gas (5.01%) | ||||
China Petroleum & Chemical Corp., Class H | 1,053,000 | 1,109,732 | ||
PetroChina Co., Ltd., Class H | 1,228,000 | 1,666,296 | ||
| ||||
| 2,776,028 | ||||
| ||||
Oil & Gas Services (1.11%) | ||||
Anton Oilfield Services Group | 2,048,000 | 616,489 | ||
| ||||
TOTAL ENERGY | 4,619,186 | |||
| ||||
Financials (24.54%) | ||||
Banks (15.62%) | ||||
Bank of China, Ltd., Class H | 5,356,300 | 2,194,381 | ||
China Construction Bank Corp., Class H | 4,367,080 | 3,273,852 | ||
42 | October 31, 2012
Table of Contents
Clough China Fund | ||
Statement of Investments | October 31, 2012 (Unaudited) |
| Shares | Value (Note 2) | |||
Banks (continued) | ||||
Industrial & Commercial Bank of China, Class H | 4,856,967 | $3,198,309 | ||
| ||||
| 8,666,542 | ||||
| ||||
Diversified Financial Services (0.50%) | ||||
Haitong Securities Co., Ltd., Class H(a) | 216,800 | 276,776 | ||
| ||||
Insurance (3.16%) | ||||
China Life Insurance Co., Ltd., Class H | 287,000 | 843,927 | ||
Ping An Insurance Group Co. of China, Ltd., | 116,000 | 912,866 | ||
| ||||
| 1,756,793 | ||||
| ||||
Real Estate (5.26%) | ||||
Cheung Kong Holdings, Ltd. | 24,000 | 353,749 | ||
China Overseas Grand Oceans Group, Ltd. | 1,039,500 | 1,081,763 | ||
China Overseas Land & Investment, Ltd. | 261,293 | 680,367 | ||
Hang Lung Properties, Ltd. | 77,000 | 266,620 | ||
Hysan Development Co., Ltd. | 121,000 | 533,768 | ||
| ||||
| 2,916,267 | ||||
| ||||
TOTAL FINANCIALS | 13,616,378 | |||
| ||||
Industrials (15.27%) | ||||
Building Materials (3.54%) | ||||
Anhui Conch Cement Co., Ltd., Class H | 222,000 | 762,518 | ||
China Resources Cement Holdings, Ltd. | 1,068,000 | 721,970 | ||
Far East Global Group, | 2,546,000 | 482,063 | ||
| ||||
| 1,966,551 | ||||
| ||||
Electrical Components & Equipment (1.08%) | ||||
Zhuzhou CSR Times Electric Co., Ltd., Class H | 204,000 | 596,483 | ||
| ||||
Engineering & Construction (5.23%) | ||||
Cheung Kong Infrastructure Holdings, Ltd. | 52,000 | 304,660 | ||
China Railway Construction Corp. Ltd., Class H | 672,000 | 663,893 | ||
China State Construction International Holdings, Ltd. | 1,632,000 | 1,934,464 | ||
| ||||
| 2,903,017 | ||||
| ||||
Environmental Control (0.50%) | ||||
China Everbright International, Ltd. | 542,000 | 278,007 | ||
| ||||
Shares | Value (Note 2) | |||||
Hand/Machine Tools (1.88%) | ||||||
Techtronic Industries Co. | 551,500 | $1,045,376 | ||||
| ||||||
Machinery-Diversified (1.03%) | ||||||
CSR Corp., Ltd., Class H | 737,000 | 569,034 | ||||
| ||||||
Packaging & Containers (0.83%) | ||||||
CPMC Holdings, Ltd. | 653,000 | 459,921 | ||||
| ||||||
Transportation (1.18%) | ||||||
Orient Overseas International, Ltd. | 104,000 | 654,794 | ||||
| ||||||
TOTAL INDUSTRIALS | 8,473,183 | |||||
| ||||||
Technology (2.78%) | ||||||
Computers (2.78%) | ||||||
Lenovo Group, Ltd. | 1,924,000 | 1,540,504 | ||||
| ||||||
TOTAL TECHNOLOGY | 1,540,504 | |||||
| ||||||
TOTAL COMMON STOCKS (Cost $43,182,629) | 51,590,600 | |||||
| ||||||
| 7-Day Yield | Shares | Value (Note 2) | ||||
SHORT TERM INVESTMENTS (2.25%) | ||||||
Money Market Fund (2.25%) | ||||||
Dreyfus Cash Management Fund, Institutional Class | 0.051% | 1,249,972 | 1,249,972 | |||
| ||||||
TOTAL SHORT TERM INVESTMENTS (Cost $1,249,972) | 1,249,972 | |||||
| ||||||
TOTAL INVESTMENTS (95.25%) (Cost $44,432,601) | $52,840,572 | |||||
Other Assets In Excess Of | 2,632,257 | |||||
| ||||||
NET ASSETS (100.00%) | $55,472,829 | |||||
| ||||||
43 | October 31, 2012
Table of Contents
Clough China Fund | ||
Statement of Investments | October 31, 2012 (Unaudited) |
| (a) | Non-Income Producing Security. |
Common Abbreviations:
Ltd. - Limited.
SA - Generally designated corporations in various countries, mostly those employing civil law.
For Fund compliance purposes, the Fund’s industry classifications refer to any one or more of the industry sub-classifications used by one or more widely recognized market indexes or ratings group indexes, and/or as defined by Fund management. This definition may not apply for purposes of this report, which may combine industry sub-classifications for reporting ease. Industries are shown as a percent of net assets. These industry classifications are based on third party definitions and are unaudited. The definitions are industry terms and do not reflect the legal status of any of the investments or the companies in which the Fund has invested.
See Notes to Financial Statements.
44 | October 31, 2012
Table of Contents
Clough China Fund | ||
| October 31, 2012 (Unaudited) |
ASSETS | ||||
Investments, at value | $ | 52,840,572 | ||
Cash | 240 | |||
Foreign currency, at value (Cost $2,838,438) | 2,841,080 | |||
Receivable for investments sold | 863,807 | |||
Receivable for shares sold | 316 | |||
Dividends receivable | 50 | |||
Prepaid expenses and other assets | 14,797 | |||
Total Assets | 56,560,862 | |||
LIABILITIES | ||||
Payable for investments purchased | 935,286 | |||
Payable for shares redeemed | 15,710 | |||
Investment advisory fees payable | 51,810 | |||
Administration and transfer agency fees payable | 16,082 | |||
Distribution and services fees payable | 13,660 | |||
Legal fees payable | 375 | |||
Audit fees payable | 21,830 | |||
Trustees’ fees and expenses payable | 3,092 | |||
Accrued expenses and other liabilities | 30,188 | |||
Total Liabilities | 1,088,033 | |||
NET ASSETS | $ | 55,472,829 | ||
NET ASSETS CONSIST OF | ||||
Paid-in capital | $ | 52,937,939 | ||
Accumulated net investment income | 848,187 | |||
Accumulated net realized loss on investments and foreign currency transactions | (6,723,910 | ) | ||
Net unrealized appreciation on investments and translation of assets and liabilities denominated in foreign currencies | 8,410,613 | |||
NET ASSETS | $ | 55,472,829 | ||
INVESTMENTS, AT COST | $ | 44,432,601 | ||
PRICING OF SHARES | ||||
Class A: | ||||
Net Asset Value, offering and redemption price per share(a) | $ | 18.67 | ||
Net Assets | $ | 26,714,411 | ||
Shares of beneficial interest outstanding (unlimited number of shares, no par value common stock authorized) | 1,431,154 | |||
Maximum offering price per share ((NAV/0.9450), based on maximum sales charge of 5.50% of the offering price) | $ | 19.76 | ||
Class C: | ||||
Net Asset Value, offering and redemption price per share(a) | $ | 18.07 | ||
Net Assets | $ | 9,630,860 | ||
Shares of beneficial interest outstanding (unlimited number of shares, no par value common stock authorized) | 532,998 | |||
Class I: | ||||
Net Asset Value, offering and redemption price per share | $ | 18.98 | ||
Net Assets | $ | 19,127,558 | ||
Shares of beneficial interest outstanding (unlimited number of shares, no par value common stock authorized) | 1,007,560 | |||
| (a) | Redemption price per share may be reduced for any applicable contingent deferred sales charge. For a description of a possible sales charge, please see the Fund’s Prospectus. |
See Notes to Financial Statements.
45 | October 31, 2012
Table of Contents
Clough China Fund | ||
| For the Six Months Ended October 31, 2012 (Unaudited) |
INVESTMENT INCOME | ||||
Dividends | $ | 1,538,921 | ||
Foreign taxes withheld on dividends | (79,762) | |||
Total Investment Income | 1,459,159 | |||
EXPENSES | ||||
Investment advisory fees | 385,972 | |||
Administrative and transfer agency fees | 52,191 | |||
Distribution and service fees | ||||
Class A | 34,199 | |||
Class C | 50,181 | |||
Legal fees | 1,085 | |||
Audit fees | 12,829 | |||
Networking fees | ||||
Class A | 6,436 | |||
Class C | 5,293 | |||
Class I | 7,102 | |||
Reports to shareholders and printing fees | 9,329 | |||
State registration fees | 20,066 | |||
Insurance fees | 2,512 | |||
Custody fees | 40,456 | |||
Trustees’ fees and expenses | 4,341 | |||
Miscellaneous expenses | 7,726 | |||
Total Expense | 639,718 | |||
Less fees waived/reimbursed by investment advisor | ||||
Class A | (30,872) | |||
Class C | (14,208) | |||
Class I | (24,220) | |||
Net Expenses | 570,418 | |||
Net Investment Income | 888,741 | |||
Net realized loss on investments | (1,541,088) | |||
Net realized gain on foreign currency transactions | 7,610 | |||
Net change in unrealized appreciation on investments | 83,840 | |||
Net change in unrealized appreciation on translation of assets and liabilities denominated in foreign currencies | 633 | |||
NET REALIZED AND UNREALIZED LOSS ON INVESTMENTS | (1,449,005) | |||
NET DECREASE IN NET ASSETS RESULTING FROM OPERATIONS | $ | (560,264) | ||
See Notes to Financial Statements.
46 | October 31, 2012
Table of Contents
Clough China Fund | ||
For the Six Months Ended October 31, 2012 (Unaudited) | For the Year Ended | |||||||
OPERATIONS | ||||||||
Net investment income | $ | 888,741 | $ | 71,792 | ||||
Net realized loss on investments and foreign currency transactions | (1,533,478) | (4,673,323) | ||||||
Net change in unrealized appreciation/(depreciation) on investments and translation of assets and liabilities denominated in foreign currencies | 84,473 | (8,731,689) | ||||||
Net Decrease in Net Assets Resulting from Operations | (560,264) | (13,333,220) | ||||||
BENEFICIAL INTEREST TRANSACTIONS (NOTE 6) | ||||||||
Shares sold | ||||||||
Class A | 956,482 | 3,954,505 | ||||||
Class C | 223,112 | 2,225,325 | ||||||
Class I | 1,613,342 | 3,554,515 | ||||||
Shares redeemed | ||||||||
Class A | (4,897,967) | (12,417,845) | ||||||
Class C | (2,222,369) | (5,066,931) | ||||||
Class I | (10,723,555) | (10,349,896) | ||||||
Net Decrease in Net Assets Derived from Beneficial Interest Transactions | (15,050,955) | (18,100,327) | ||||||
Net decrease in net assets | (15,611,219) | (31,433,547) | ||||||
NET ASSETS | ||||||||
Beginning of year | 71,084,048 | 102,517,595 | ||||||
End of period * | $ | 55,472,829 | $ | 71,084,048 | ||||
*Including accumulated net investment income/(loss) of: | $ | 848,187 | $ | (40,554) | ||||
See Notes to Financial Statements.
47 | October 31, 2012
Table of Contents
Clough China Fund – Class A | ||
| Selected data for a share of beneficial interest outstanding throughout the periods indicated: | ||
For the Six Months Ended October 31, 2012 (Unaudited) | For the Year Ended April 30, 2012 | For the Year Ended April 30, 2011 | For the Period August 1, 2009 to April 30, 2010(a)(b) | For the Year Ended July 31, 2009 | For the Year Ended July 31, 2008 | For the Year Ended July 31, 2007 | ||||||||
Net asset value, beginning of period | $18.43 | $21.02 | $18.21 | $16.32 | $15.81 | $22.46 | $13.23 | |||||||
INCOME/(LOSS) FROM INVESTMENTS OPERATIONS: | ||||||||||||||
Net investment income/(loss) | 0.28(c) | 0.02(c) | (0.04)(c) | 0.10 | 0.09(c) | (0.01)(c) | 0.06(c) | |||||||
Net realized and unrealized gain/(loss) | (0.04) | (2.61) | 2.94 | 1.85 | 0.62(d) | (1.73) | 9.59 | |||||||
Total from investment operations | 0.24 | (2.59) | 2.90 | 1.95 | 0.71 | (1.74) | 9.65 | |||||||
DISTRIBUTIONS: | ||||||||||||||
From net investment income | – | – | (0.09) | (0.07) | (0.20) | (0.03) | (0.05) | |||||||
From net realized gains | – | – | – | – | – | (4.88) | (0.37) | |||||||
Total distributions | – | – | (0.09) | (0.07) | (0.20) | (4.91) | (0.42) | |||||||
REDEMPTION FEES ADDED TO PAID-IN CAPITAL (NOTE 6) | 0.00(e) | 0.00(e) | 0.00(c)(e) | 0.01 | 0.00(c)(e) | – | – | |||||||
Net increase/(decrease) in net asset value | 0.24 | (2.59) | 2.81 | 1.89 | 0.51 | (6.65) | 9.23 | |||||||
Net asset value, end of period | $18.67 | $18.43 | $21.02 | $18.21 | $16.32 | $15.81 | $22.46 | |||||||
TOTAL RETURN(f) | 1.30% | (12.32)% | 16.00% | 12.07% | 5.00%(d) | (13.91)% | 73.81% | |||||||
RATIOS/SUPPLEMENTAL DATA: | ||||||||||||||
Net assets, end of period (000s) | $26,714 | $30,542 | $44,616 | $28,695 | $15,069 | $17,927 | $25,976 | |||||||
Ratio of expenses to average net assets excluding fee waivers and reimbursements | 2.18%(g) | 2.08% | 2.07% | 2.24%(g) | 2.62% | 2.34% | 2.42% | |||||||
Ratio of expenses to average net assets including fee waivers and reimbursements | 1.95%(g) | 1.95% | 1.89%(h) | 1.87%(g)(i) | 1.95% | 2.02% | 2.10% | |||||||
Ratio of net investment income/(loss) to average net assets | 3.13%(g) | 0.13% | (0.22)% | (0.53)%(g) | 0.70% | (0.06)% | 0.31% | |||||||
Portfolio turnover rate(j) | 96% | 174% | 170% | 110% | 120% | 178% | 193% | |||||||
See Notes to Financial Statements.
48 | October 31, 2012
Table of Contents
Clough China Fund – Class A | ||
Financial Highlights | October 31, 2012 (Unaudited) |
| (a) | Effective March 9, 2010, the Board approved changing the fiscal year-end of the Fund from July 31 to April 30. |
| (b) | Old Mutual China Fund was reorganized into the Clough China Fund on January 15, 2010. |
| (c) | Calculated using the average shares method. |
| (d) | Impact of payment by affiliate was less than $0.01 per share and 0.01%, respectively. |
| (e) | Less than $0.005 per share. |
| (f) | Total returns are for the period indicated and have not been annualized. Total returns would have been lower had certain expenses not been waived during the period. Returns shown do not reflect the deduction of taxes that a shareholder would pay on Fund distributions or the redemption of Fund shares. Returns shown exclude any applicable sales charges. |
| (g) | Annualized. |
| (h) | Effective January 1, 2011, the net expense ratio limitation changed from 1.85% to 1.95% (exclusive of shareholder service fees (except Class C), acquired fund fees and expenses, brokerage expenses, interest expense, short sale dividend expense, taxes and extraordinary expenses). |
| (i) | Effective January 1, 2010, the net expense ratio limitation changed from 1.95% to 1.85% (exclusive of shareholder service fees (except Class C), acquired fund fees and expenses, brokerage expenses, interest expense, short sale dividend expense, taxes and extraordinary expenses). |
| (j) | Portfolio turnover rate for periods less than one full year have not been annualized. |
See Notes to Financial Statements.
49 | October 31, 2012
Table of Contents
Clough China Fund – Class C | ||
Financial Highlights | Selected data for a share of beneficial interest outstanding throughout the periods indicated: |
For the Six Months Ended (Unaudited) | For the Year Ended April 30, 2012 | For the Year Ended April 30, 2011 | For the Period August 1, 2009 to April 30, 2010(a)(b) | For the Year Ended | For the Year Ended July 31, 2008 | For the Year Ended July 31, 2007 | ||||||||
Net asset value, beginning of period | $17.90 | $20.58 | $17.89 | $16.08 | $15.48 | $22.26 | $13.18 | |||||||
INCOME/(LOSS) FROM INVESTMENT OPERATIONS: | ||||||||||||||
Net investment income/(loss) | 0.21(c) | (0.11)(c) | (0.21)(c) | (0.17) | (0.01)(c) | (0.17)(c) | (0.06)(c) | |||||||
Net realized and unrealized gain/(loss) | (0.04) | (2.57) | 2.90 | 1.98 | 0.65(d) | (1.64) | 9.52 | |||||||
| ||||||||||||||
Total from investment operations | 0.17 | (2.68) | 2.69 | 1.81 | 0.64 | (1.81) | 9.46 | |||||||
| ||||||||||||||
DISTRIBUTIONS: | ||||||||||||||
From net investment income | – | – | (0.00)(e) | – | (0.04) | (0.09) | (0.02) | |||||||
From net realized gains | – | – | – | – | – | (4.88) | (0.37) | |||||||
| ||||||||||||||
Total distributions | – | – | – | – | (0.04) | (4.97) | (0.39) | |||||||
| ||||||||||||||
REDEMPTION FEES ADDED TO PAID-IN CAPITAL (NOTE 6) | 0.00(e) | 0.00(e) | 0.00(e) | – | – | – | 0.01 | |||||||
| ||||||||||||||
Net increase/(decrease) in net asset value | 0.17 | (2.68) | 2.69 | 1.81 | 0.60 | (6.78) | 9.08 | |||||||
| ||||||||||||||
Net asset value, end of period | $18.07 | $17.90 | $20.58 | $17.89 | $16.08 | $15.48 | $22.26 | |||||||
| ||||||||||||||
TOTAL RETURN(f) | 0.95% | (13.02)% | 15.13% | 11.26% | 4.21%(d) | (14.49)% | 76.27% | |||||||
RATIOS/SUPPLEMENTAL DATA: | ||||||||||||||
Net assets, end of period (000s) | $9,631 | $11,674 | $16,848 | $7,594 | $8,267 | $9,991 | $15,497 | |||||||
Ratio of expenses to average net assets excluding fee waivers and reimbursements | 2.98%(g) | 2.88% | 2.86% | 3.18%(g) | 3.43% | 3.15% | 3.33% | |||||||
Ratio of expenses to average net assets including fee waivers and reimbursements | 2.70%(g) | 2.70% | 2.70% | 2.70%(g) | 2.70% | 2.77% | 2.85% | |||||||
Ratio of net investment income/(loss) to average net assets | 2.44%(g) | (0.62)% | (1.10)% | (1.26)%(g) | (0.05)% | (0.85)% | (0.33)% | |||||||
Portfolio turnover | 96% | 174% | 170% | 110% | 120% | 178% | 193% | |||||||
| ||||||||||||||
See Notes to Financial Statements.
50 | October 31, 2012
Table of Contents
Clough China Fund – Class C | ||
Financial Highlights | October 31, 2012 (Unaudited)
|
| (a) | Effective March 9, 2010, the Board approved changing the fiscal year-end of the Fund from July 31 to April 30. |
| (b) | Prior to the close of business on January 15, 2010, the Clough China Fund was known as the Old Mutual China Fund. |
| (c) | Calculated using the average shares method. |
| (d) | Impact of payment by affiliate was less than $0.01 per share and 0.01%, respectively. |
| (e) | Less than $0.005 and ($0.005) per share. |
| (f) | Total returns are for the period indicated and have not been annualized. Total returns would have been lower had certain expenses not been waived during the period. Returns shown do not reflect the deduction of taxes that a shareholder would pay on Fund distributions or the redemption of Fund shares. Returns shown exclude any applicable sales charges. |
| (g) | Annualized. |
| (h) | Portfolio turnover rate for periods less than one full year have not been annualized. |
See Notes to Financial Statements.
51 | October 31, 2012
Table of Contents
Clough China Fund – Class I | ||
Financial Highlights | Selected data for a share of beneficial interest outstanding throughout the periods indicated: |
For the Six Months Ended | For the Year Ended April 30, 2012 | For the Year Ended April 30, 2011 | For the Period August 1, 2009 to April 30, 2010(a)(b) | For the Year Ended July 31, 2009 | For the Year Ended July 31, 2008 | For the Year Ended July 31, 2007 | ||||||||
Net asset value, beginning of period | $18.71 | $21.30 | $18.41 | $16.52 | $16.10 | $22.65 | $13.27 | |||||||
INCOME/(LOSS) FROM INVESTMENT OPERATIONS: | ||||||||||||||
Net investment income/(loss) | 0.31(c) | 0.06(c) | (0.01)(c) | 0.01 | 0.15(c) | 0.13(c) | 0.19(c) | |||||||
Net realized and unrealized gain/(loss) | (0.04) | (2.65) | 3.03 | 2.03 | 0.60(d) | (1.80) | 9.63 | |||||||
| ||||||||||||||
Total from investment operations | 0.27 | (2.59) | 3.02 | 2.04 | 0.75 | (1.67) | 9.82 | |||||||
| ||||||||||||||
DISTRIBUTIONS: | ||||||||||||||
From net investment income | – | – | (0.13) | (0.15) | (0.33) | – | (0.07) | |||||||
From net realized gains | – | – | – | – | – | (4.88) | (0.37) | |||||||
| ||||||||||||||
Total distributions | – | – | (0.13) | (0.15) | (0.33) | (4.88) | (0.44) | |||||||
| ||||||||||||||
REDEMPTION FEES ADDED TO PAID-IN CAPITAL (NOTE 6) | 0.00(e) | 0.00(e) | 0.00(e) | – | – | – | – | |||||||
| ||||||||||||||
Net increase/(decrease) in net asset value | 0.27 | (2.59) | 2.89 | 1.89 | 0.42 | (6.55) | 9.38 | |||||||
| ||||||||||||||
Net asset value, end of period | $18.98 | $18.71 | $21.30 | $18.41 | $16.52 | $16.10 | $22.65 | |||||||
| ||||||||||||||
TOTAL RETURN(f) | 1.44% | (12.16)% | 16.45% | 12.36% | 5.51%(d) | (13.41)% | 74.91% | |||||||
RATIOS/SUPPLEMENTAL DATA: | ||||||||||||||
Net assets, end of period (000s) | $19,128 | $28,868 | $41,054 | $15,071 | $9,744 | $9,231 | $22,303 | |||||||
Ratio of expenses to average net assets excluding fee waivers and reimbursements | 1.94%(g) | 1.85% | 1.85% | 1.86%(g) | 1.97% | 1.76% | 1.75% | |||||||
Ratio of expenses to average net assets including fee waivers and reimbursements | 1.70%(g) | 1.70% | 1.53%(h) | 1.40%(g) | 1.40% | 1.47% | 1.55% | |||||||
Ratio of net investment income/(loss) to average net assets | 3.41%(g) | 0.33% | (0.03)% | 0.08%(g) | 1.20% | 0.62% | 1.06% | |||||||
Portfolio turnover | 96% | 174% | 170% | 110% | 120% | 178% | 193% | |||||||
| ||||||||||||||
See Notes to Financial Statements.
52 | October 31, 2012
Table of Contents
Clough China Fund – Class I | ||
Financial Highlights | October 31, 2012 (Unaudited) |
| (a) | Effective March 9, 2010, the Board approved changing the fiscal year-end of the Fund from July 31 to April 30. |
| (b) | Prior to the close of business on January 15, 2010, the Clough China Fund was known as the Old Mutual China Fund and Class I was known as the Institutional Class. |
| (c) | Calculated using the average shares method. |
| (d) | Impact of payment by affiliate was less than $0.01 per share and 0.01%, respectively. |
| (e) | Less than $0.005 per share. |
| (f) | Total returns are for the period indicated and have not been annualized. Total returns would have been lower had certain expenses not been waived during the period. Returns shown do not reflect the deduction of taxes that a shareholder would pay on Fund distributions or the redemption of Fund shares. |
| (g) | Annualized. |
| (h) | Effective January 1, 2011, the net expense ratio limitation changed from 1.40% to 1.70% (exclusive of shareholder service fees (except Class C), acquired fund fees and expenses, brokerage expenses, interest expense, short sale dividend expense, taxes and extraordinary expenses). |
| (i) | Portfolio turnover rate for periods less than one full year have not been annualized. |
See Notes to Financial Statements.
53 | October 31, 2012
Table of Contents
Jefferies Asset Management Commodity Strategy Allocation Fund | ||
| October 31, 2012 (Unaudited) | ||
The six month period ending on October 31, 2012 was broadly negative for commodities. Commodity prices, as measured by the diversified Thomson Reuters/Jefferies CRB Total Return Index, were down 3.25%. Commodity equities also appreciated during the quarter, up 8.06% as measured by the Thomson Reuters/Jefferies CRB Global In The Ground Total Return Index. Commodities actually outpaced the Standard & Poors 500 Total Return Index for the period. The Jefferies Asset Management Commodity Strategy Allocation Fund (JCRIX) delivered a net negative return of -3.62% (JCRAX was -3.73% at MOP and JCRCX was down 4.03% with CDSC).
The Fund slightly underperformed its benchmark, the Thomson Reuters/Jefferies CRB Index, by approximately 37 basis points1 during this period (measured against the performance of the “I”shares). The Fund employs a strategy that combines an actively managed portfolio of commodity futures related exposure (collateralized by Treasury Inflation Protected Securities — TIPS), commodity equities, and physical commodity ETF’s. Throughout most of the quarter, the Fund allocated approximately 65% of its assets toward commodity futures related investments and approximately 35% of its assets in commodity equities. The Fund was almost 98% invested by the end of October.
Commodity prices were declining in late April and especially into May as global financial concerns swirled around the European debt situation. Attention began to swing toward the Federal Reserve and how they were going to address the scheduled conclusion of some of its own stimulus measures. Commodity prices began to bottom with a surge in global grain prices as a direct result of severe drought conditions in much of the US Mid-West. Corn and soybean prices hit record high levels late in the summer. Some moderation of the harsh weather situation in September prompted prices to decline from the record levels, but grain prices were significantly higher for the entire period of time.
Corn was the best performing commodity within the Thomson Reuters/Jefferies CRB Index from the end of April 2012 to the end of October 2012, up 39.12%. Soybeans advanced by 36.58% while wheat prices rose 25.65%. Natural gas prices bounced by 16.03% after recording lows below $2.00/million Metric British Thermal Units (mmBtu) early in the year. Certain commodity prices benefited from the institution of the third round of quantitative easing (QE3) by the US Federal Reserve Open Market Committee (FOMC) in early September. Concerns and uncertainty in the weeks immediately prior to the US presidential election added some price pressure as October came to a close. On the negative side, frozen concentrated orange juice prices fell 24.95%, the most within the T R/J CRB Index. Cotton prices and coffee prices declined 19.42% and 16.56%, respectively.
{The Fund’s top equity holdings at the end of October 2012 included Exxon/Mobil (XOM) 8.69% YTD, Monsanto (MON) +24.74% YTD, Syngenta AG (SYNN) +35.61% YTD, Potash (POT) -1.74% YTD , Deere & Company (DE) +12.34% YTD, Chevron Corporation (CVX) +6.18% YTD, The Mosaic Company (MOS) +5.1% YTD, Agrium Inc. (AGU) +58.15% YTD, and Royal Dutch Shell NA (RDSA)-3.17% YTD}
U.S. Treasury Inflation Protected Bonds or TIPS are held by the fund to invest excess cash and as collateral for commodity futures related investments held in our Cayman Island subsidiary. Nominal yields on the benchmark 10 year note began the quarter at 1.935% and ended the six month period significantly lower, 1.690%. Despite the efforts by the Federal Reserve and other central banks to maintain historically low interest rates, we believe we may be nearing the end of what has been a significant multi-year rally in US treasury prices. As a result, we continue to invest in TIPS with limited duration2 exposure. At the end of October, our weighted average maturity was approximately 2.50 years in our TIPS portfolio.
We strongly believe that the long term fundamental drivers of commodity demand and ultimately higher prices are still in place. Population growth is likely to remain unabated regardless of the economic environment in the US and Europe. A billion more people will be added to the world population over the next decade. The trend of wealth distribution to the developing world as those economies grow at rapid rates relative to the slow or negative growth occurring in the developed countries is contributing to ever increasing demand for raw materials and food. Incremental gains in disposable income in the developing nations have led to competition for the commodities needed for more complex and costly lifestyles. In a world with limited supplies of food, fuel, building materials, and other necessities of life, price may become the ultimate allocator. Additionally, the aggressively accommodative central bank monetary policies recently announced coupled with measures already in place globally are likely to make commodities and other real assets more attractive over time as currencies, including the US Dollar, may decline in value.
| 1 | Basis Point (bp) - is a unit equal to one hundredth of a percentage point, or one part per ten thousand. Source: http://www.investopedia.com |
| 2 | Duration - A measure of the sensitivity of the price (the value of principal) of a fixed-income investment to a change in interest rates. Duration is expressed as a number of years. Source: http://www.investopedia.com |
The views and information discussed in this commentary are as of the date of publication, are subject to change, and may not reflect the writer’s current views. The views expressed represent an assessment of market conditions at a specific point in time, are opinions only and should not be relied upon as investment advice regarding a particular investment or markets in general. Such information does not constitute a recommendation to buy or sell specific securities or investment vehicles. It should not be assumed that any investment will be profitable or will equal the performance of the portfolios or any securities or any sectors mentioned herein. The subject matter contained herein has been derived from several sources believed to be reliable and accurate at the time of compilation. CoreCommodity Management, LLC does not accept any liability for losses either direct or consequential caused by the use of this information.
54 | October 31, 2012 |
Table of Contents
Jefferies Asset Management Commodity Strategy Allocation Fund | ||
Management Commentary | October 31, 2012 (Unaudited) | |
Performance of $10,000 Initial Investment (for the period ended October 31, 2012)
Comparison of change in value of a $10,000 investment (includes applicable sales loads of 5.50%)
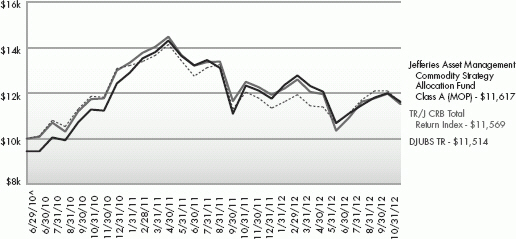
The chart above represents historical performance of a hypothetical investment of $10,000 in the Fund since inception. Past performance does not guarantee future results. This chart does not reflect the deduction of taxes that a shareholder would pay on Fund distributions or the redemption of Fund shares.
Average Annual Total Returns (as of October 31, 2012)
1 Year | Since Inception ^ | Total Expense Ratio | What you Pay* | |||||
Class A (NAV)1 | -5.84% | 9.21% | 1.66% | 1.47% | ||||
Class A (MOP)2 | -11.05% | 6.61% | ||||||
ClassC(NAV)1 | -6.48% | 8.63% | 2.26% | 2.07% | ||||
Class C (CDSC)2 | -7.39% | 8.63% | ||||||
Class I | -5.60% | 9.53% | 1.36% | 1.17% | ||||
TR/J CRB Total Return Index3 | -7.43% | 6.42% | ||||||
DJUBS Commodity TR3 | -4.44% | 6.21% |
Performance data quoted represents past performance. Past performance does not guarantee future results. Investment return and principal value of an investment will fluctuate so that an investor’s shares, when sold or redeemed, may be worth more or less than the original cost. Current performance data may be higher or lower than actual data quoted. The Fund imposes a 2.00% redemption fee on shares held for less than 30 days. The Fund imposes a maximum Contingent Deferred Sales Charge (“CDSC”) of 1.00% to shares redeemed within the first 12 months after a purchase, and on Class A shares redeemed within the first 12 months after a purchase in excess of $1 million. Performance data does not reflect the redemption fee or the CDSC, which if reflected would reduce the performance quoted. For the most current month-end performance data, please call 1-866-759-5679.
| 1 | Net Asset Value (NAV) is the share price without sales charges. |
| 2 | Maximum Offering Price (MOP) includes sales charges. Class A returns include effects of the Fund’s maximum sales charge of 5.50%; Class C returns include the 1.00% CDSC. |
55 | October 31, 2012
Table of Contents
Jefferies Asset Management Commodity Strategy Allocation Fund | ||
Management Commentary | October 31, 2012 (Unaudited) | |
| 3 | Thomson Reuters / Jefferies CRB Index and the Dow Jones-UBS Commodity Index are unmanaged indices used as a measurement of change in commodity market conditions based on the performance of a basket of different commodities. The indices are not actively managed and do not reflect any deduction for fees, expenses or taxes. An investor may not invest directly in an index. |
| ^ | Fund inception date of June 29, 2010. |
| * | What You Pay reflects the Sub-Advisor’s decision to contractually limit expenses through August 31, 2013. Please see the prospectus for additional information. |
The table does not reflect the deduction of taxes that a shareholder would pay on Fund distributions or the redemption of Fund shares.
Mutual funds are not insured or guaranteed by the FDIC or by any other government agency or government sponsored agency of the federal government or any state, not deposits, obligations or guaranteed by any bank or its affiliates and are subject to investment risks, including possible loss of the principal amount invested.
This Fund is not suitable for all investors. Subject to investment risks, including possible loss of the principal amount invested.
Investing in commodity-related securities involves risk and considerations not present when investing in more conventional securities. The Fund may be more susceptible to high volatility of commodity markets.
Derivatives generally are more sensitive to changes in economic or market conditions than other types of investments; this could result in losses that significantly exceed the Fund’s original investment.
Commodity Futures Related Investments: 65.43% (as a % of Net Assets)* | ||
WTI Crude Oil | 14.29 | % | ||
Gold** | 4.58 | % | ||
Natural Gas | 4.26 | % | ||
Aluminum | 3.99 | % | ||
Copper | 3.86 | % | ||
Live Cattle | 3.84 | % | ||
Corn | 3.66 | % | ||
Soybeans | 3.65 | % | ||
Sugar | 3.33 | % | ||
Coffee | 3.24 | % |
Commodity-Equities: 34.57% (as a % of Net Assets) | ||
Monsanto Co. (MON) | 2.71 | % | ||
Exxon Mobil Corp. (XOM) | 2.64 | % | ||
Potash Corp. of Saskatchewan Inc (POT) | 2.21 | % | ||
Syngenta AG (SYNN) | 1.93 | % | ||
Deere & Co. (DE) | 1.51 | % | ||
Chevron Corp. (CVX) | 1.47 | % | ||
The Mosaic Co. (MOS) | 1.10 | % | ||
CF Industries Holdings, Inc. (CF) | 1.00 | % | ||
Royal Dutch Shell PLC, ADR (RDSA) | 0.98 | % | ||
Agrium, Inc. (AGU) | 0.93 | % |
| * | Participation in commodities is generally achieved through investments in over-the-counter commodity swap contracts. |
| ** | Participation in Gold can be achieved through investments in ETFs that hold physical gold, and/or futures or other derivative contracts that are directly tied to the price performance of Gold. |
As of October 31, 2012 the portfolio composition data presented above is an estimate and may not include, among other things, investment expenses, dividends or interest payments, advisory fees or other expenses incurred by the Fund.
56 | October 31, 2012
Table of Contents
Jefferies Asset Management Commodity Strategy Allocation Fund | ||
| October 31, 2012 (Unaudited) | ||
| Shares | Value (Note 2) | |||||||
| ||||||||
COMMON STOCKS (37.94%) | ||||||||
Australia (0.57%) | ||||||||
Fortescue Metals Group, Ltd. | 31,313 | $ | 132,619 | |||||
Incitec Pivot, Ltd. | 234,922 | 770,604 | ||||||
Newcrest Mining, Ltd. | 11,616 | 318,694 | ||||||
Woodside Petroleum, Ltd. | 8,962 | 320,025 | ||||||
|
| |||||||
| 1,541,942 | ||||||||
|
| |||||||
Brazil (0.47%) | ||||||||
Cia Siderurgica Nacional SA, ADR | 1,580 | 8,595 | ||||||
Gerdau SA, ADR | 10,527 | 92,532 | ||||||
Petroleo Brasileiro SA, ADR | 19,741 | 418,707 | ||||||
Vale SA, ADR | 40,800 | 747,456 | ||||||
|
| |||||||
| 1,267,290 | ||||||||
|
| |||||||
Canada (6.08%) | ||||||||
Agnico-Eagle Mines, Ltd. | 7,499 | 423,618 | ||||||
Agrium, Inc. | 23,863 | 2,518,501 | ||||||
Barrick Gold Corp. | 9,018 | 365,229 | ||||||
Cameco Corp. | 5,892 | 114,010 | ||||||
Canadian Natural Resources, Ltd. | 4,755 | 143,601 | ||||||
Eldorado Gold Corp. | 12,377 | 183,427 | ||||||
Encana Corp. | 18,598 | 419,385 | ||||||
First Quantum Minerals, Ltd. | 2,013 | 45,248 | ||||||
Goldcorp, Inc. | 23,974 | 1,084,344 | ||||||
IAMGOLD Corp. | 14,163 | 220,801 | ||||||
Inmet Mining Corp. | 10,325 | 532,403 | ||||||
Kinross Gold Corp. | 49,744 | 496,943 | ||||||
New Gold, Inc.(a) | 17,252 | 202,366 | ||||||
Pan American Silver Corp. | 28,599 | 629,178 | ||||||
Potash Corp. of Saskatchewan, Inc. | 134,886 | 5,445,348 | ||||||
Silver Wheaton Corp. | 18,183 | 736,411 | ||||||
Suncor Energy, Inc. | 26,717 | 898,226 | ||||||
Teck Resources, Ltd., Class B | 14,026 | 447,149 | ||||||
TransCanada Corp. | 12,212 | 549,861 | ||||||
Turquoise Hill Resources, Ltd.(a) | 20,919 | 165,051 | ||||||
Viterra, Inc. | 28,720 | 452,619 | ||||||
Yamana Gold, Inc. | 23,109 | 467,033 | ||||||
|
| |||||||
| 16,540,752 | ||||||||
|
| |||||||
Chile (0.20%) | ||||||||
Sociedad Quimica y Minera de Chile SA, ADR | 9,298 | 537,889 | ||||||
China (0.60%) | ||||||||
China Petroleum & Chemical Corp., Class H | 245,224 | 260,410 | ||||||
China Shenhua Energy Co., Ltd., Class H | 58,216 | 247,886 | ||||||
CNOOC, Ltd. | 250,001 | 519,353 | ||||||
Jiangxi Copper Co., Ltd., Class H | 27,185 | 70,330 | ||||||
PetroChina Co., Ltd., Class H | 330,045 | 450,562 | ||||||
| Shares | Value (Note 2) | |||||||
| ||||||||
China (continued) | ||||||||
Zijin Mining Group Co., Ltd., | 214,020 | $ | 86,160 | |||||
|
| |||||||
| 1,634,701 | ||||||||
|
| |||||||
France (0.66%) | ||||||||
Total SA | 35,634 | 1,792,969 | ||||||
Germany (0.58%) | ||||||||
K+S AG | 32,181 | 1,522,458 | ||||||
ThyssenKrupp AG | 2,845 | 64,734 | ||||||
|
| |||||||
| 1,587,192 | ||||||||
|
| |||||||
India (0.15%) | ||||||||
Reliance Industries, Ltd., GDR(b) | 13,626 | 404,011 | ||||||
Sterlite Industries India, Ltd., ADR | 2,057 | 15,407 | ||||||
|
| |||||||
| 419,418 | ||||||||
|
| |||||||
Israel (0.40%) | ||||||||
Israel Chemicals, Ltd. | 55,718 | 697,255 | ||||||
The Israel Corp., Ltd. | 574 | 390,190 | ||||||
|
| |||||||
| 1,087,445 | ||||||||
|
| |||||||
Italy (0.66%) | ||||||||
Eni SpA, ADR | 39,236 | 1,800,540 | ||||||
Japan (0.14%) | ||||||||
Inpex Corp. | 59 | 336,277 | ||||||
Nippon Steel & Sumitomo Metal Corp. | 20,342 | 44,848 | ||||||
|
| |||||||
| 381,125 | ||||||||
|
| |||||||
Jersey (0.12%) | ||||||||
Randgold Resources, Ltd., ADR | 2,698 | 322,654 | ||||||
Luxembourg (0.15%) | ||||||||
ArcelorMittal | 17,506 | 258,564 | ||||||
Tenaris SA, ADR | 4,150 | 156,123 | ||||||
|
| |||||||
| 414,687 | ||||||||
|
| |||||||
Mexico (0.29%) | ||||||||
Grupo Mexico SAB de CV, Series B | 18,337 | 58,817 | ||||||
Industrias Penoles SAB de CV | 14,794 | 740,039 | ||||||
|
| |||||||
| 798,856 | ||||||||
|
| |||||||
Netherlands (1.23%) | ||||||||
CNH Global N.V.(a) | 12,464 | 558,387 | ||||||
Nutreco Holding N.V. | 4,220 | 315,877 | ||||||
Royal Dutch Shell PLC, ADR | 36,221 | 2,480,414 | ||||||
|
| |||||||
| 3,354,678 | ||||||||
|
| |||||||
Norway (0.59%) | 15,744 | 70,887 | ||||||
Norsk Hydro ASA | ||||||||
57 | October 31, 2012
Table of Contents
Jefferies Asset Management Commodity Strategy Allocation Fund | ||
Consolidated Statement of Investments | October 31, 2012 (Unaudited) | |
| Shares | Value (Note 2) | |||||||
| ||||||||
Norway (continued) | ||||||||
Yara International ASA | 32,236 | $ | 1,518,704 | |||||
|
| |||||||
| 1,589,591 | ||||||||
|
| |||||||
Peru (0.13%) | ||||||||
Cia de Minas Buenaventura SA, ADR | 9,676 | 346,014 | ||||||
Russia (2.15%) | ||||||||
Gazprom OAO, ADR | 131,010 | 1,196,776 | ||||||
LUKOIL OAO, ADR | 15,521 | 938,245 | ||||||
Mechel Steel Group, ADR | 16,800 | 106,680 | ||||||
MMC Norilsk Nickel OJSC, ADR | 87,247 | 1,338,369 | ||||||
NovaTek OAO, GDR(c) | 825 | 94,050 | ||||||
Rosneft Oil Co. OAO, GDR(a)(c) | 41,721 | 308,735 | ||||||
Uralkali OJSC, GDR(c) | 47,500 | 1,861,050 | ||||||
|
| |||||||
| 5,843,905 | ||||||||
|
| |||||||
Singapore (0.61%) | ||||||||
Golden Agri-Resources, Ltd. | 780,586 | 399,956 | ||||||
Olam International, Ltd. | 258,948 | 418,206 | ||||||
Wilmar International, Ltd. | 330,439 | 837,069 | ||||||
|
| |||||||
| 1,655,231 | ||||||||
|
| |||||||
South Africa (0.71%) | ||||||||
Anglo Platinum, Ltd. | 435 | 20,218 | ||||||
AngloGold Ashanti, Ltd., ADR | 14,802 | 502,972 | ||||||
Gold Fields, Ltd., ADR | 33,120 | 414,331 | ||||||
Harmony Gold Mining Co., Ltd., ADR | 32,096 | 266,397 | ||||||
Impala Platinum Holdings, Ltd. | 17,765 | 319,623 | ||||||
Kumba Iron Ore, Ltd. | 1,186 | 74,137 | ||||||
Sasol, Ltd. | 7,880 | 336,261 | ||||||
|
| |||||||
| 1,933,939 | ||||||||
|
| |||||||
South Korea (0.16%) | ||||||||
POSCO, ADR | 5,654 | 443,160 | ||||||
Switzerland (2.58%) | ||||||||
Glencore International PLC | 53,696 | 297,262 | ||||||
Syngenta AG | 14,518 | 5,671,264 | ||||||
Transocean, Ltd. | 5,189 | 237,086 | ||||||
Weatherford International, Ltd.(a) | 20,498 | 231,627 | ||||||
Xstrata PLC | 36,382 | 574,848 | ||||||
|
| |||||||
| 7,012,087 | ||||||||
|
| |||||||
United Kingdom (2.40%) | ||||||||
Anglo American PLC | 27,213 | 835,708 | ||||||
Antofagasta PLC | 7,696 | 156,113 | ||||||
BG Group PLC | 55,192 | 1,022,041 | ||||||
BHP Billiton PLC, ADR | 17,630 | 1,127,968 | ||||||
BP PLC, ADR | 50,326 | 2,158,482 | ||||||
Kazakhmys PLC | 4,437 | 50,766 | ||||||
Lonmin PLC | 5,780 | 47,850 | ||||||
Petropavlovsk PLC | 10,162 | 66,138 | ||||||
| Shares | Value (Note 2) | |||||||
| ||||||||
United Kingdom (continued) | ||||||||
Rio Tinto PLC, ADR | 20,957 | $ | 1,047,431 | |||||
|
| |||||||
| 6,512,497 | ||||||||
|
| |||||||
United States (16.31%) | ||||||||
AGCO Corp.(a) | 19,842 | 903,009 | ||||||
Alcoa, Inc. | 15,849 | 135,826 | ||||||
Allegheny Technologies, Inc. | 357 | 9,407 | ||||||
Allied Nevada Gold Corp.(a) | 2,043 | 75,428 | ||||||
Anadarko Petroleum Corp. | 8,297 | 570,917 | ||||||
Apache Corp. | 4,738 | 392,070 | ||||||
Archer-Daniels-Midland Co. | 88,781 | 2,382,882 | ||||||
Baker Hughes, Inc. | 9,162 | 384,529 | ||||||
Bunge, Ltd. | 11,789 | 837,373 | ||||||
Cameron International Corp.(a) | 2,123 | 107,509 | ||||||
CF Industries Holdings, Inc. | 11,216 | 2,301,411 | ||||||
Chevron Corp. | 33,987 | 3,745,707 | ||||||
Cliffs Natural Resources, Inc. | 7,741 | 280,766 | ||||||
Coeur d’Alene Mines Corp.(a) | 6,120 | 189,169 | ||||||
ConocoPhillips | 12,054 | 697,324 | ||||||
Deere & Co. | 50,890 | 4,348,042 | ||||||
Devon Energy Corp. | 6,099 | 355,023 | ||||||
EOG Resources, Inc. | 3,055 | 355,877 | ||||||
Exxon Mobil Corp. | 82,238 | 7,497,638 | ||||||
Freeport-McMoRan Copper & Gold, Inc. | 9,872 | 383,823 | ||||||
Halliburton Co. | 14,394 | 464,782 | ||||||
Hecla Mining Co. | 31,685 | 208,487 | ||||||
Hess Corp. | 3,720 | 194,407 | ||||||
Ingredion, Inc. | 15,924 | 978,689 | ||||||
Intrepid Potash, Inc.(a) | 13,143 | 285,597 | ||||||
Kinder Morgan, Inc. | 7,351 | 255,153 | ||||||
Marathon Oil Corp. | 20,522 | 616,891 | ||||||
Monsanto Co. | 81,665 | 7,028,907 | ||||||
The Mosaic Co. | 48,656 | 2,546,655 | ||||||
National Oilwell Varco, Inc. | 4,769 | 351,475 | ||||||
Newmont Mining Corp. | 14,676 | 800,576 | ||||||
Noble Energy, Inc. | 4,487 | 426,310 | ||||||
Nucor Corp. | 4,500 | 180,585 | ||||||
Occidental Petroleum Corp. | 15,760 | 1,244,410 | ||||||
Peabody Energy Corp. | 4,768 | 133,027 | ||||||
Pioneer Natural Resources Co. | 2,243 | 236,973 | ||||||
Royal Gold, Inc. | 1,936 | 170,523 | ||||||
Schlumberger, Ltd. | 20,561 | 1,429,606 | ||||||
Southern Copper Corp. | 97 | 3,696 | ||||||
Southwestern Energy Co.(a) | 6,607 | 229,263 | ||||||
Valero Energy Corp. | 8,213 | 238,998 | ||||||
The Williams Co., Inc. | 10,898 | 381,321 | ||||||
|
| |||||||
| 44,360,061 | ||||||||
|
| |||||||
TOTAL COMMON STOCKS | 103,178,623 | |||||||
| ||||||||
.
58 | October 31, 2012
Table of Contents
Jefferies Asset Management Commodity Strategy Allocation Fund | ||
Consolidated Statement of Investments | October 31, 2012 (Unaudited) | |
| Shares | Value (Note 2) | |||||||||||
| ||||||||||||
EXCHANGE TRADED FUNDS (2.19%) |
| |||||||||||
iShares® Gold Trust(a) |
| 218,898 | $ | 3,668,730 | ||||||||
SPDR® Gold Trust(a) |
| 13,688 | 2,283,980 | |||||||||
|
| |||||||||||
TOTAL EXCHANGE TRADED FUNDS |
| 5,952,710 | ||||||||||
| ||||||||||||
WARRANTS (0.00%)(d) |
| |||||||||||
Canada (0.00%)(d) |
| |||||||||||
Kinross Gold Corp., Strike Price $21.30, Expires 9/17/14(a) |
| 19 | 9 | |||||||||
|
| |||||||||||
United States (0.00%) |
| |||||||||||
Magnum Hunter Resources Corp.(a) |
| 629 | 0 | |||||||||
|
| |||||||||||
TOTAL WARRANTS |
| 9 | ||||||||||
| ||||||||||||
| Principal Amount | Value (Note 2) | |||||||||||
| ||||||||||||
GOVERNMENT BONDS (53.14%) |
| |||||||||||
U.S. Treasury Bonds (53.14%) |
| |||||||||||
United States Treasury Inflation Indexed Bonds |
| |||||||||||
1.875%, | 7/15/13 | (e)(f) | $ | 10,522,067 | 10,767,852 | |||||||
2.000%, | | 1/15/14 | (f) | 13,369,678 | 13,872,084 | |||||||
1.250%, | | 4/15/14 | (e) | 8,652,621 | 8,950,055 | |||||||
2.000%, | 7/15/14 | 11,303,223 | 11,978,771 | |||||||||
1.625%, | | 1/15/15 | (e)(f) | 13,540,718 | 14,421,920 | |||||||
0.500%, | | 4/15/15 | (f) | 11,611,855 | 12,133,482 | |||||||
1.875%, | 7/15/15 | 8,585,450 | 9,384,970 | |||||||||
2.000%, | 1/15/16 | 8,994,030 | 10,005,157 | |||||||||
0.125%, | 4/15/16 | 21,392,365 | 22,555,575 | |||||||||
2.500%, | 7/15/16 | 11,120,460 | 12,828,496 | |||||||||
2.375%, | 1/15/17 | (f) | 9,994,075 | 11,657,149 | ||||||||
0.125%, | 4/15/17 | 5,577,660 | 5,982,040 | |||||||||
|
| |||||||||||
| 144,537,551 | ||||||||||||
|
| |||||||||||
TOTAL GOVERNMENT BONDS |
| 144,537,551 | ||||||||||
| ||||||||||||
7-Day Yield | Shares | Value (Note 2) | ||||||||||
| ||||||||||||
SHORT TERM INVESTMENTS (3.20%) |
| |||||||||||
Money Market Fund (3.20%) |
| |||||||||||
Dreyfus Treasury Prime Cash Management Fund, Investor Shares | 0.00003 | % | 8,692,182 | 8,692,182 | ||||||||
|
| |||||||||||
TOTAL SHORT TERM INVESTMENTS |
| 8,692,182 | ||||||||||
| ||||||||||||
TOTAL INVESTMENTS (96.47%) |
| $ | 262,361,075 | |||||||||
Other Assets In Excess Of Liabilities - (3.53%) |
| 9,607,581 | ||||||||||
| ||||||||||||
NET ASSETS - 100.00% |
| $ | 271,968,656 | |||||||||
| ||||||||||||
| (a) | Non-Income Producing Security. |
| (b) | Security exempt from registration under rule 144A of the securities act of 1933. This security may be resold in transactions exempt from registration, normally to qualified institutional buyers. At period end, the market value of those securities was $404,011, representing 0.15% of the Fund’s net assets. |
| (c) | These securities initially sold to other parties pursuant to Regulation S under the 1933 Act and subsequently resold to the Fund. At period end, the aggregate market value of those securities was $2,263,835, representing 0.83% of the Fund’s net assets. |
| (d) | Less than 0.005%. |
| (e) | Security, or portion of security, is being held as collateral for futures contracts. |
| (f) | Security, or portion of security, is being held as collateral for total return swap contracts. |
Common Abbreviations:
| ADR | - American Depositary Receipt. |
| AG | - Aktiengesellschaft is a German term that refers to a corporation that is limited by shares, i.e., owned by shareholders. |
| ASA | - Allmennaksjeselskap is the Norwegian term for public limited company. |
| GDR | - Global Depositary Receipt. |
| Ltd. | - Limited. |
| N.V. | - Naamloze vennootschap. |
| OAO | - Russian open joint stock company |
| OJSC | - Open joint stock company |
| PLC | - Public Limited Co. |
| SA | - Generally designated corporations in various countries, mostly those employing the civil law. |
| SAB | de CV - A variable capital company. |
| SpA | - Societa per Azioni. |
| SPDR | - Standard & Poor’s Depository Receipt. |
For Fund compliance purposes, the Fund’s industry and geographical classifications refer to any one or more of the subclassifications used by one or more widely recognized market indexes or ratings group indexes, and/or as defined by Fund management. This definition may not apply for purposes of this report, which may combine sub-classifications for reporting ease. Industries and regions are shown as a percent of net assets. These classifications are based on third party definitions and are unaudited. The definitions are industry terms and do not reflect the legal status of any of the investments or the companies in which the Fund has invested.
See Notes to Financial Statements.
.
59 | October 31, 2012
Table of Contents
Jefferies Asset Management Commodity Strategy Allocation Fund | ||
Consolidated Statement of Investments | October 31, 2012 (Unaudited) | |
FUTURES CONTRACTS
At October 31, 2012, the Fund had outstanding futures contracts:
| Description | Position | Contracts | Expiration Date | Value (Note 2) | Unrealized Apreciation | |||||||||
Gold 100 Oz. Future | Long | 12 | 12/28/12 | $2,062,920 | $110,575 | |||||||||
S&P 500® E-Mini Future | Short | (155) | 12/24/12 | (10,902,700) | 356,008 | |||||||||
Silver Future | Short | (1) | 12/30/13 | (162,595) | 10,903 | |||||||||
|
| |||||||||||||
| $(9,002,375) | $477,486 | |||||||||||||
|
| |||||||||||||
| Description | Position | Contracts | Expiration Date | Value (Note 2) | Unrealized Depreciation | |||||||||
Brent Crude Oil Future | Long | 12 | 11/16/12 | $1,304,400 | $(40,698) | |||||||||
Silver Future | Long | 1 | 12/30/14 | 162,295 | (10,282) | |||||||||
|
| |||||||||||||
| $1,466,695 | $(50,980) | |||||||||||||
|
| |||||||||||||
TOTAL RETURN SWAP CONTRACTS(a)
| ||||||||||||||
| Swap Counterparty | Reference Obligation | Notional Amount | Rate Paid by the Fund | Termination Date | Unrealized Appreciation | |||||||||
Bank of America - Merrill Lynch | LME Aluminum 3 Month | $ | 96,849,182 | 0.00% | 12/12/12 | $ | 62,472 | |||||||
Bank of America - Merrill Lynch | LME Zinc 3 Month | (548,500) | 0.00% | 11/16/12 | 74,200 | |||||||||
Bank of America - Merrill Lynch | MLCS Coffee J-F3 | 5,053,453 | 0.10% | 6/28/13 | 517,413 | |||||||||
Bank of America - Merrill Lynch | MLCS Copper J-F3 | 6,554,498 | 0.10% | 6/28/13 | 401,806 | |||||||||
Bank of America - Merrill Lynch | MLCS Silver J-F3 | 906,445 | 0.10% | 6/28/13 | 73,874 | |||||||||
Bank of America - Merrill Lynch | MLCX Aluminum J-F3 | (5,958,985) | 0.10% | 6/28/13 | 583,368 | |||||||||
Bank of America - Merrill Lynch | MLCX Gold T-F3 | 5,396,404 | 0.10% | 6/28/13 | 213,931 | |||||||||
|
| |||||||||||||
| $ | 1,927,064 | |||||||||||||
|
| |||||||||||||
| Swap Counterparty | Reference Obligation | Notional Amount | Rate Paid by the Fund | Termination Date | Unrealized Depreciation | |||||||||
Bank of America - Merrill Lynch | CRB 3 Month Forward Total Return Index | $ | 104,637,031 | 0.48% | 6/28/13 | $ | (4,335,037) | |||||||
Bank of America - Merrill Lynch | LME Aluminum 3 Month | (287,438) | 0.00% | 12/12/12 | (42,485) | |||||||||
Bank of America - Merrill Lynch | LME Zinc 3 Month | 524,219 | 0.00% | 11/16/12 | (49,919) | |||||||||
Bank of America - Merrill Lynch | ML Aluminum GA6 | 5,840,692 | 0.10% | 6/28/13 | (569,211) | |||||||||
Bank of America - Merrill Lynch | ML eXtra Coffee GA6 | 5,067,412 | 0.10% | 6/28/13 | (494,949) | |||||||||
Bank of America - Merrill Lynch | ML eXtra Copper GA6 | 6,381,701 | 0.10% | 6/28/13 | (393,325) | |||||||||
Bank of America - Merrill Lynch | ML eXtra Silver GA6 | 1,133,210 | 0.10% | 6/28/13 | (73,726) | |||||||||
UBS | CRB 3 Month Forward Total Return Index | 73,209,749 | 0.40% | 6/28/13 | (3,003,810) | |||||||||
|
| |||||||||||||
| $ | (8,962,462) | |||||||||||||
|
| |||||||||||||
| (a) | The Fund receives monthly payments based on any positive monthly return of the Reference Obligation. The Fund makes payments on any negative monthly return of such Reference Obligation. |
See Notes to Financial Statements.
60 | October 31, 2012
Table of Contents
Jefferies Asset Management Commodity Strategy Allocation Fund | ||
| October 31, 2012 (Unaudited) | ||
ASSETS | ||||
Investments, at value | $ | 262,361,075 | ||
Cash | 15,774,821 | |||
Foreign currency, at value (Cost $4,573) | 4,573 | |||
Unrealized appreciation on total return swap contracts | 1,927,064 | |||
Receivable for shares sold | 563,566 | |||
Variation margin receivable | 477,486 | |||
Receivable due from broker for futures contracts | 535,965 | |||
Dividends and interest receivable | 654,751 | |||
Prepaid expenses and other assets | 31,946 | |||
Total Assets | 282,331,247 | |||
LIABILITIES | ||||
Payable for investments purchased | 13 | |||
Payable for variation margin | 50,980 | |||
Payable for shares redeemed | 741,793 | |||
Unrealized depreciation on total return swap contracts | 8,962,462 | |||
Investment advisory fees payable | 175,775 | |||
Administration and transfer agency fees payable | 28,478 | |||
Distribution and services fees payable | 160,581 | |||
Legal fees payable | 6,121 | |||
Audit fees payable | 36,668 | |||
Trustees’ fees and expenses payable | 5,622 | |||
Total return swap payable | 88,029 | |||
Accrued expenses and other liabilities | 106,069 | |||
Total Liabilities | 10,362,591 | |||
NET ASSETS | $ | 271,968,656 | ||
NET ASSETS CONSIST OF | ||||
Paid-in capital | $ | 286,780,377 | ||
Accumulated net investment loss | (1,036,646) | |||
Accumulated net realized loss on investments, futures contracts, total return swap contracts and foreign currency transactions | (15,637,565) | |||
Net unrealized appreciation on investments, futures contracts, total return swap contracts and translation of assets and liabilities denominated in foreign currencies | 1,862,490 | |||
NET ASSETS | $ | 271,968,656 | ||
INVESTMENTS, AT COST | $ | 253,889,236 | ||
PRICING OF SHARES | ||||
Class A: | ||||
Net Asset Value, offering and redemption price per share(a) | $ | 10.74 | ||
Net Assets | $ | 111,743,608 | ||
Shares of beneficial interest outstanding (unlimited number of shares, no par value common stock authorized) | 10,407,009 | |||
Maximum offering price per share ((NAV/0.9450), based on maximum sales charge of 5.50% of the offering price) | $ | 11.37 | ||
Class C: | ||||
Net Asset Value, offering and redemption price per share(a) | $ | 10.68 | ||
Net Assets | $ | 19,726,793 | ||
Shares of beneficial interest outstanding (unlimited number of shares, no par value common stock authorized) | 1,847,095 | |||
Class I: | ||||
Net Asset Value, offering and redemption price per share | $ | 10.69 | ||
Net Assets | $ | 140,498,255 | ||
Shares of beneficial interest outstanding (unlimited number of shares, no par value common stock authorized) | 13,142,201 | |||
| (a) | Redemption price per share may be reduced for any applicable contingent deferred sales charge. For a description of a possible sales charge, please see the Fund’s Prospectus. |
See Notes to Financial Statements.
61 | October 31, 2012
Table of Contents
Jefferies Asset Management Commodity Strategy Allocation Fund | ||
| For the Six Months Ended October 31, 2012 (Unaudited) | ||
INVESTMENT INCOME | ||||
Dividends | $ | 997,731 | ||
Foreign taxes withheld on dividends | (66,591) | |||
Interest and other income | 353,232 | |||
Total Investment Income | 1,284,372 | |||
EXPENSES | ||||
Investment advisory fees | 989,516 | |||
Administrative and transfer agency fees | 185,065 | |||
Distribution and service fees | ||||
Class A | 201,781 | |||
Class C | 94,117 | |||
Legal fees | 7,924 | |||
Audit fees | 24,003 | |||
Networking fees | ||||
Class I | 56,557 | |||
Reports to shareholders and printing fees | 19,596 | |||
State registration fees | 26,676 | |||
Insurance fees | 4,185 | |||
Custody fees | 34,818 | |||
Trustees’ fees and expenses | 12,558 | |||
Miscellaneous expenses | 11,065 | |||
Total Expense | 1,667,861 | |||
Less fees waived/reimbursed by investment advisor | ||||
Class A | (39,900) | |||
Class C | (7,420) | |||
Class I | (45,744) | |||
Net Expenses | 1,574,797 | |||
Net Investment Loss | (290,425) | |||
Net realized loss on investments | (7,634,158) | |||
Net realized loss on futures contracts | (429,157) | |||
Net realized loss on total return swap contracts | (899,521) | |||
Net realized loss on foreign currency transactions | (23,294) | |||
Net change in unrealized appreciation on investments | 9,650,334 | |||
Net change in unrealized appreciation on futures contracts | 428,043 | |||
Net change in unrealized depreciation on total return swap contracts | (5,573,072) | |||
Net change in unrealized appreciation on securities sold short | 6,647 | |||
Net change in unrealized appreciation on translation of assets and liabilities denominated in foreign currencies | 9,104 | |||
NET REALIZED AND UNREALIZED LOSS ON INVESTMENTS | (4,465,074) | |||
NET DECREASE IN NET ASSETS RESULTING FROM OPERATIONS | $ | (4,755,499) | ||
See Notes to Financial Statements.
62 | October 31, 2012
Table of Contents
Jefferies Asset Management Commodity Strategy Allocation Fund | ||
For the Six Months Ended October 31, 2012 (Unaudited) | For the Year Ended April 30, 2012 | |||||||
OPERATIONS | ||||||||
Net investment income/(loss) | $ | (290,425) | $ | 723,730 | ||||
Net realized loss on investments, futures contracts, total return swap contracts and foreign currency transactions | (8,986,130) | (16,419,885) | ||||||
Net change in unrealized appreciation/(depreciation) on investments, futures contracts, total return swap contracts and translation of assets and liabilities denominated in foreign currencies | 4,521,056 | (7,830,792) | ||||||
Net Decrease in Net Assets Resulting from Operations | (4,755,499) | (23,526,947) | ||||||
DISTRIBUTIONS | ||||||||
Dividends to shareholders from net investment income | ||||||||
Class A | (261,576) | (3,099,336) | ||||||
Class C | (33,219) | (650,148) | ||||||
Class I | (320,794) | (5,302,231) | ||||||
Dividends to shareholders from net realized gains | ||||||||
Class A | 0 | (76,847) | ||||||
Class C | 0 | (22,661) | ||||||
Class I | 0 | (98,964) | ||||||
Net Decrease in Net Assets from Distributions | (615,589) | (9,250,187) | ||||||
BENEFICIAL INTEREST TRANSACTIONS (NOTE 6) | ||||||||
Shares sold | ||||||||
Class A | 53,024,505 | 82,119,588 | ||||||
Class C | 4,270,165 | 14,395,546 | ||||||
Class I | 73,260,290 | 66,432,636 | ||||||
Dividends reinvested | ||||||||
Class A | 202,802 | 2,497,583 | ||||||
Class C | 18,377 | 450,106 | ||||||
Class I | 238,161 | 3,994,738 | ||||||
Shares redeemed | ||||||||
Class A | (25,059,658) | (24,121,608) | ||||||
Class C | (1,920,695) | (1,620,551) | ||||||
Class I | (14,092,248) | (42,014,869) | ||||||
Net Increase in Net Assets Derived from Beneficial Interest Transactions | 89,941,699 | 102,133,169 | ||||||
Net increase in net assets | 84,570,611 | 69,356,035 | ||||||
NET ASSETS | ||||||||
Beginning of year | 187,398,045 | 118,042,010 | ||||||
End of period * | $ | 271,968,656 | $ | 187,398,045 | ||||
*Including accumulated net investment loss of: | $ | (1,036,646) | $ | (130,632) | ||||
See Notes to Financial Statements.
63 | October 31, 2012
Table of Contents
Jefferies Asset Management Commodity Strategy Allocation Fund – Class A | ||
Selected data for a share of beneficial interest outstanding throughout the periods indicated: | ||
For the Six Months Ended October 31, 2012 (Unaudited)(a) | For the Year Ended April 30, 2012(a) | For the Period June 29, 2010 (Inception) to April 30, 2011(a) | ||||
Net asset value, beginning of period | $11.18 | $14.28 | $10.00 | |||
INCOME/(LOSS) FROM INVESTMENT OPERATIONS: | ||||||
Net investment income/(loss)(b) | (0.02) | 0.04 | 0.12 | |||
Net realized and unrealized gain/(loss) | (0.39) | (2.29) | 4.87 | |||
Total from investment operations | (0.41) | (2.25) | 4.99 | |||
DISTRIBUTIONS: | ||||||
From net investment income | (0.03) | (0.83) | (0.71) | |||
From net realized gains | – | (0.02) | – | |||
Total distributions | (0.03) | (0.85) | (0.71) | |||
REDEMPTION FEES ADDED TO PAID-IN CAPITAL (NOTE 6) | 0.00(c) | 0.00(c) | 0.00(c) | |||
Net increase/(decrease) in net asset value | (0.44) | (3.10) | 4.28 | |||
Net asset value, end of period | $10.74 | $11.18 | $14.28 | |||
TOTAL RETURN(d) | (3.65)% | (15.77)% | 51.41% | |||
RATIOS/SUPPLEMENTAL DATA: | ||||||
Net assets, end of period (000s) | $111,744 | $85,805 | $37,060 | |||
Ratio of expenses to average net assets excluding fee waivers and reimbursements | 1.53%(e) | 1.64% | 2.59%(e) | |||
Ratio of expenses to average net assets including fee waivers and reimbursements | 1.45%(e) | 1.45% | 1.45%(e) | |||
Ratio of net investment income/(loss) to average net assets | (0.38)%(e) | 0.36% | 1.08%(e) | |||
Portfolio turnover rate(f) | 88% | 264% | 59% | |||
| (a) | Per share amounts and ratios to average net assets include income and expenses of the Jefferies Asset Management Cayman Trust (wholly-owned subsidiary), exclusive of the subsidiary’s management fee. |
| (b) | Calculated using the average shares method. |
| (c) | Less than $0.005 per share. |
| (d) | Total returns are for the period indicated and have not been annualized. Total returns would have been lower had certain expenses not been waived during the period. Returns shown do not reflect the deduction of taxes that a shareholder would pay on Fund distributions or the redemption of Fund shares. Returns shown exclude any applicable sales charges. |
| (e) | Annualized. |
| (f) | Portfolio turnover rate for periods less than one full year have not been annualized. |
See Notes to Financial Statements.
64 | October 31, 2012
Table of Contents
Jefferies Asset Management Commodity Strategy Allocation Fund – Class C | ||
Consolidated Financial Highlights | ||
| Selected data for a share of beneficial interest outstanding throughout the periods indicated: | ||
For the Six Months Ended October 31, 2012 (Unaudited)(a) | For the Year Ended April 30, 2012(a) | For the Period June 29, 2010 (Inception) to April 30, 2011(a) | ||||
Net asset value, beginning of period | $11.15 | $14.19 | $10.00 | |||
INCOME/(LOSS) FROM INVESTMENT OPERATIONS: | ||||||
Net investment income/(loss)(b) | (0.05) | (0.05) | 0.08 | |||
Net realized and unrealized gain/(loss) | (0.40) | (2.26) | 4.87 | |||
Total from investment operations | (0.45) | (2.31) | 4.95 | |||
DISTRIBUTIONS: | ||||||
From net investment income | (0.02) | (0.71) | (0.76) | |||
From net realized gains | – | (0.02) | – | |||
Total distributions | (0.02) | (0.73) | (0.76) | |||
REDEMPTION FEES ADDED TO PAID-IN CAPITAL (NOTE 6) | 0.00(c) | 0.00(c) | 0.00(c) | |||
Net increase/(decrease) in net asset value | (0.47) | (3.04) | 4.19 | |||
Net asset value, end of period | $10.68 | $11.15 | $14.19 | |||
TOTAL RETURN(d) | (4.03)% | (16.26)% | 50.90% | |||
RATIOS/SUPPLEMENTAL DATA: | ||||||
Net assets, end of period (000s) | $19,727 | $18,095 | $7,352 | |||
Ratio of expenses to average net assets excluding fee waivers and reimbursements | 2.13%(e) | 2.24% | 4.00%(e) | |||
Ratio of expenses to average net assets including fee waivers and reimbursements | 2.05%(e) | 2.05% | 2.05%(e) | |||
Ratio of net investment income/(loss) to average net assets | (0.85)%(e) | (0.42)% | 0.72%(e) | |||
Portfolio turnover rate(f) | 88% | 264% | 59% | |||
| (a) | Per share amounts and ratios to average net assets include income and expenses of the Jefferies Asset Management Cayman Trust (wholly-owned subsidiary), exclusive of the subsidiary’s management fee. |
| (b) | Calculated using the average shares method. |
| (c) | Less than $0.005 per share. |
| (d) | Total returns are for the period indicated and have not been annualized. Total returns would have been lower had certain expenses not been waived during the period. Returns shown do not reflect the deduction of taxes that a shareholder would pay on Fund distributions or the redemption of Fund shares. Returns shown exclude any applicable sales charges. |
| (e) | Annualized. |
| (f) | Portfolio turnover rate for periods less than one full year have not been annualized. |
See Notes to Financial Statements.
65 | October 31, 2012
Table of Contents
Jefferies Asset Management Commodity Strategy Allocation Fund – Class I | ||
Consolidated Financial Highlights | ||
Selected data for a share of beneficial interest outstanding throughout the periods indicated: | ||
For the Six Months Ended October 31, 2012 (Unaudited)(a) | For the Year Ended April 30, 2012(a) | For the Period June 29, 2010 (Inception) to April 30, 2011(a) | ||||
Net asset value, beginning of period | $11.12 | $14.25 | $10.00 | |||
INCOME/(LOSS) FROM INVESTMENT OPERATIONS: | ||||||
Net investment income(b) | (0.00)(c) | 0.10 | 0.13 | |||
Net realized and unrealized gain/(loss) | (0.40) | (2.32) | 4.89 | |||
Total from investment operations | (0.40) | (2.22) | 5.02 | |||
DISTRIBUTIONS: | ||||||
From net investment income | (0.03) | (0.89) | (0.77) | |||
From net realized gains | – | (0.02) | – | |||
Total distributions | (0.03) | (0.91) | (0.77) | |||
REDEMPTION FEES ADDED TO PAID-IN CAPITAL (NOTE 6) | 0.00(c) | 0.00(c) | 0.00(c) | |||
Net increase/(decrease) in net asset value | (0.43) | (3.13) | 4.25 | |||
Net asset value, end of period | $10.69 | $11.12 | $14.25 | |||
TOTAL RETURN(d) | (3.53)% | (15.53)% | 51.74% | |||
RATIOS/SUPPLEMENTAL DATA: | ||||||
Net assets, end of period (000s) | $140,498 | $83,497 | $73,630 | |||
Ratio of expenses to average net assets excluding fee waivers and reimbursements | 1.23%(e) | 1.33% | 2.04%(e) | |||
Ratio of expenses to average net assets including fee waivers and reimbursements | 1.15%(e) | 1.15% | 1.15%(e) | |||
Ratio of net investment income/(loss) to average net assets | (0.04)%(e) | 0.82% | 1.19%(e) | |||
Portfolio turnover rate(f) | 88% | 264% | 59% | |||
| (a) | Per share amounts and ratios to average net assets include income and expenses of the Jefferies Asset Management Cayman Trust (wholly-owned subsidiary), exclusive of the subsidiary’s management fee. |
| (b) | Calculated using the average shares method. |
| (c) | Less than $0.005 and ($0.005) per share. |
| (d) | Total returns are for the period indicated and have not been annualized. Total returns would have been lower had certain expenses not been waived during the period. Returns shown do not reflect the deduction of taxes that a shareholder would pay on Fund distributions or the redemption of Fund shares. |
| (e) | Annualized. |
| (f) | Portfolio turnover rate for periods less than one full year have not been annualized. |
See Notes to Financial Statements.
66 | October 31, 2012
Table of Contents
| October 31, 2012 (Unaudited) | ||
Earnings Disappoint But Economic Growth On Track
Third calendar quarter earnings were slightly below lowered expectations on average. Revenue growth also disappointed, with about 36% of reporting companies failing to meet sales expectations. We think weak sales and earnings were related to slower business investment spending evidenced in third-quarter gross domestic product “GDP”. We think businesses are holding back investment due to uncertainty over the US fiscal cliff and the European financial crisis. If these issues are resolved favorably over the next few months, as we expect, earnings could reaccelerate in 2013.
Despite this fading earnings momentum and the likelihood that its cause (political uncertainty) continues into the fourth quarter, analyst consensus estimates are forecasting low-teens growth for the fourth quarter and into 2013. These figures seem overly optimistic to us; we are expecting only single-digit earnings growth at best. Although this would require analysts to lower their estimates, stocks’ best performance has historically come when earnings growth is slightly negative to mid-single digits. Thus, we do not expect decelerating earnings growth to end the cyclical bull market, we expect the S&P 500® Index’s1 quantitative easing-fueled 38% annualized trend from June through September to fall to a more moderate and sustainable pace.
With investor focus shifting from central bank monetary stimulus to earnings and economic fundamentals, the S&P 500® has been bumping around in a trading range since mid-October but, in our view, remains at technical and valuation support levels consistent with a ‘normal’ pullback in a cyclical bull market.
The US’ third-quarter GDP growth accelerated to 2% annualized from 1.3% in the second quarter, slightly exceeding consensus expectations, led by consumer and government spending. Notably, government spending has contributed positively to economic growth for the first time in two years, mainly because of increased defense spending and a pause, if not the end, of state and local government cutbacks. We do not expect government spending to positively contribute to GDP growth next year. In RiverFront’s base case scenario, to which we assign a 50% probability, government spending would subtract about one percentage point of growth (as most of the fiscal cliff is averted or postponed but the first steps toward deficit reduction are taken) leading to around 1% ‘new normal’ growth in 2013. In our optimistic scenario — prompted by effective policy response from all three major economic blocs (US, Europe, and China) — trade and investment would rebound, producing 2% US economic growth. We currently attach a 30% probability to this scenario. In our pessimistic scenario, a 20% probability, domestic and global policy inaction would lead to a global recession and a 2% decline in US GDP.
Given our weighted-average view of the odds, we think the S&P 500® is likely to track single-digit earnings growth next year, with possible multiple expansion if our optimistic scenario’s growth rate occurs. Hence, we think 10% upside for the S&P 500® towards 1540
is achievable in the first half next year (18 times 2014 second quarter trend earnings of $85.69) with further upside to new all time highs if our optimistic scenario unfolds. On the downside, a global recession could bring the S&P 500® below 1200 (based on 14 times 12-month forward trend earnings). If our probability estimates on the three economic scenarios are correct, equity markets offer a compelling risk-reward, particularly in contrast to record low yielding investment grade bonds. We believe that high quality bonds have limited upside in any non-deflationary scenario, and that such a scenario is unlikely with virtually every central bank lowering rates and/or expanding their balance sheets. Meanwhile, in our more likely baseline to optimistic scenario, rising Treasury yields mathematically guarantee significant investor losses. For example, a one percentage point increase in 10-year Treasury yields would incur a -6.6% total return from current levels. Thus, we continue to prefer relatively ‘riskier’ assets like stocks.
Performance Discussion
RiverFront’s investment process combines dynamic strategic asset allocation with tactical adjustment tools. We believe that over longer time frames, valuation, or the price you pay for an asset, is the single most important determinant of your odds of being successful. However, in our view, investors rarely give themselves or their investment manager sufficient time to be proven right. Thus Riverfront incorporates tactical adjustments to our dynamic strategic allocations in an attempt to manage risk and lower short term volatility for our shorter time horizon portfolios (3-7 years) and to enhance returns in our longer term portfolios (7-10 yrs).
Tactical moves in our more conservative offerings tend to be more oriented to “risk management” than opportunistic adjustments. In our two most conservative strategies (Conservative Income Builder and Moderate Growth & Income), we seek to navigate short-term cycles with less volatility, and provide our clients the reassurance that portfolio risks will be actively managed; thereby giving them the confidence to remain invested across a market cycle. Conversely, tactical tilts in our longer time frame funds tend to be more opportunistic. Given the longer time horizon (7-10) years for these funds, investors in these strategies should be able to withstand higher levels of volatility in times of market uncertainly in order to achieve their longer term goals.
With this process as the backdrop, the RiverFront Investment Team typically constructs a core portfolio of securities and then makes variations in position sizes to conform to the risk profile of each individual model. For example, our most aggressive offering, the Global Growth Fund is comprised of all equities. Those same equities are utilized in Global Allocation, but a measure of fixed income is added to provide a potential offset to downside volatility. To that end, the drivers of performance for the two funds will be the same, generally, just in different degrees. The same holds true for the balanced funds (those that contain a higher proportion of fixed income) Dynamic Equity Income, Moderate Growth & Income and Conservative Income Builder.
See Notes to Financial Statements.
67 | October 31, 2012
Table of Contents
RiverFront Global Allocation Series | ||
Management Commentary | October 31, 2012 (Unaudited) | |
During the six months ended October 31st, U.S. equities continued to outperform developed international and emerging markets. As a result, the Riverfront funds with heavier weights to those non-U.S. asset classes had lower relative performance. The RiverFront Price Matters® framework continues to highlight the relative attractiveness of both developed international and emerging markets compared to the long term historical trends for both asset classes. As a result, we have continued to add to our weights in those asset classes but this did impact performance slightly negatively. With potential resolutions to the economic issues overhanging Europe as well as continued stimulative policies on the parts of central bankers around the world, these undervalued asset classes have begun to outperform the US on a relative basis as we have moved further into the fourth calendar quarter. There were some positive selection contributions during the period as our focus on Germany as well as Asia ex-Japan both contributed positively to performance.
Other negative factors during the six-month period included cash as well as individual security selection in domestic equity. Specifically, RiverFront had raised some cash across all funds during the summer as volatility crept back into the markets. During the time necessary to reinvest that cash, fund performance was impacted negatively. At this time, the funds are fully invested.
Individual security selection within financials was a negative to performance. Additionally, allocation and selection in energy and telecommunications impacted fund performance negatively. Earlier in the period, our equity selection tended to lean more towards high quality, dividend oriented stocks. These types of names underperformed the broader S&P. During the summer, the investment team began adding cyclicality back to the funds by investing in industrials and materials. This shift was a positive contributor to performance.
In the balanced funds, RiverFront continues to be underweight traditional fixed income. We have preferred high yield for much of 2012 which has been a positive driver for performance. We continue to prefer dividend paying equities for those investors who can tolerate the higher relative volatility inherent in investing in equities relative to fixed income.
RiverFront Conservative Income Builder Fund
Given that this fund was just launched on August 31, 2012, we believe there is insufficient performance history to discuss at this time.
RiverFront Dynamic Equity Income Fund
For the six-month period ended October 31, 2012, the RiverFront Dynamic Equity Income Fund underperformed the MSCI All Country World Index2 by approximately 0.50%.
RiverFront Global Allocation Fund
For the six-month period ended October 31, 2012, the RiverFront Global Growth Fund underperformed the MSCI All Country World Index by approximately 0.55%.
RiverFront Global Growth Fund
For the six-month period ended October 31, 2012, the RiverFront Global Growth Fund underperformed the MSCI All Country World Index by approximately 0.63%.
RiverFront Moderate Growth & Income Fund
For the six-month period ended October 31, 2012, the RiverFront Moderate Growth & Income Fund underperformed the S&P 500® Total Return Index by approximately 1.56%.
Past performance is no guarantee of future results. Dividends are not guaranteed and are subject to change or elimination. Investments in international and emerging markets securities include exposure to risks such as currency fluctuations, foreign taxes and regulations, and the potential for illiquid markets and political instability.
The views and information discussed in this commentary are as of the date of publication, are subject to change, and may not reflect the writer’s current views. The views expressed represent an assessment of market conditions at a specific point in time, are opinions only and should not be relied upon as investment advice regarding a particular investment or markets in general. Such information does not constitute a recommendation to buy or sell specific securities or investment vehicles. It should not be assumed that any investment will be profitable or will equal the performance of the portfolios or any securities or any sectors mentioned herein. The subject matter contained herein has been derived from several sources believed to be reliable and accurate at the time of compilation. RiverFront Investment Group, LLC does not accept any liability for losses either direct or consequential caused by the use of this information.
| 1 | Standard & Poor’s (S&P) 500® Index – measures the performance of 500 large cap stocks, which together represent about 75% of the total US equities market. |
| 2 | The MSCI ACWI is a free float-adjusted market capitalization weighted index that is designed to measure the equity market performance of developed and emerging markets. The MSCI ACWI consists of 45 country indices comprising 24 developed and 21 emerging market country indices. The index includes reinvestment of dividends, net of foreign withholding taxes. |
| 68 | October 31, 2012 |
Table of Contents
RiverFront Conservative Income Builder Fund | ||
Performance Update | October 31, 2012 (Unaudited) | |
Performance of $10,000 Initial Investment (for the period ended October 31, 2012)
Comparison of change in value of a $10,000 investment (includes applicable sales loads of 5.50%)
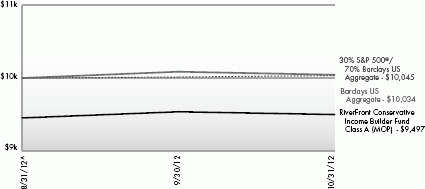
The chart above represents historical performance of a hypothetical investment of $10,000 in the Fund since inception. Past performance does not guarantee future results. This chart does not reflect the deduction of taxes that a shareholder would pay on Fund distributions or the redemption of Fund shares.
Average Annual Total Returns (as of October 31, 2012)
| 1 Year | Since Inception ^ | Total Expense Ratio | What you Pay * | |||||
Class A (NAV)1 | -0.40% | 0.50% | 1.89% | 1.38% | ||||
Class A (LOAD or MOP)2 | -5.90% | -5.01% | ||||||
Class C (NAV)1 | -0.40% | 0.40% | 2.64% | 2.13% | ||||
Class C (LOAD or MOP)2 | -1.39% | -0.60% | ||||||
Class I (NAV)1 | -0.30% | 0.60% | 1.64% | 1.13% | ||||
Barclays Capital US Aggregate Bond Index3 | 0.20% | 0.33% | ||||||
30% S&P 500® and 70% Barclays US Aggregate4 | -0.42% | 0.45% |
Performance data quoted represents past performance. Past performance does not guarantee future results. Investment return and principal value of an investment will fluctuate so that an investor’s shares, when sold or redeemed, may be worth more or less than the original cost. Current performance data may be higher or lower than actual data quoted. The Fund imposes a maximum Contingent Deferred Sales Charge (“CDSC”) of 1.00% on Class C shares redeemed within the first 12 months after a purchase, and on Class A shares redeemed within the first 12 months after a purchase in excess of $1 million. Performance data does not reflect the CDSC, which if reflected would reduce the performance quoted. For the most current month-end performance data, please call 1-866-759-5679.
The table does not reflect the deduction of taxes that a shareholder would pay on Fund distributions or the redemption of Fund shares.
This Fund is not suitable for all investors. Subject to investment risks, including possible loss of the principal amount invested.
Mutual funds are not insured or guaranteed by the FDIC or by any other government agency or government sponsored agency of the federal government or any state, not deposits, obligations or guaranteed by any bank or its affiliates and are subject to investment risks, including possible loss of the principal amount invested.
69 | October 31, 2012
Table of Contents
RiverFront Conservative Income Builder Fund | ||
Performance Update | October 31, 2012 (Unaudited) | |
| 1 | Net Asset Value (NAV) is the share price without sales charges. |
| 2 | Maximum Offering Price (MOP) includes sales charges. Class A returns include effects of the Fund’s maximum sales charge of 5.50%; Class C returns include the 1.00% CDSC. |
| 3 | The Barclay’s U.S. Aggregate Bond Index is a broad-based benchmark that measures the investment grade, U.S. dollar-denominated, fixed-rate taxable bond market, including Treasuries, government-related and corporate securities, MBS (agency fixed-rate and hybrid ARM passthroughs), ABS, and CMBS. |
| 4 | S&P 500® Index - S&P 500® Index is the Standard & Poor’s composite index of 500 stocks, a widely recognized, unmanaged index of common stock prices. |
Barclays Capital U.S. Aggregate Bond Index - An unmanaged index composed of securities from the Barclays Capital Government/Corporate Bond Index, Mortgage-Backed Securities Index and the Asset-Backed Securities Index. Total return comprises price appreciation/depreciation and income as a percentage of the original investment. Indices are rebalanced monthly by market capitalization.
| ^ | Fund inception date of August 31, 2012. |
| * | What You Pay reflects the Advisor’s and Sub-Advisor’s decision to contractually limit expenses through August 31, 2013. Please see the prospectus for additional information. |
Top Ten Holdings (as a % of Net Assets) †
Vanguard Short-Term Corporate Bond ETF | 18.26 | % | ||
iShares® Barclays 1-3 Year Credit Bond Fund | 11.58 | % | ||
SPDR® Barclays Capital High Yield Bond ETF | 7.28 | % | ||
iShares® iBoxx $ High Yield Corporate Bond Fund | 6.72 | % | ||
Vanguard MSCI European ETF | 6.47 | % | ||
iShares® JPMorgan USD Emerging Markets Bond Fund | 6.34 | % | ||
iShares® Barclays MBS Bond Fund | 5.01 | % | ||
PowerShares Senior Loan Portfolio | 3.99 | % | ||
PowerShares Fundamental High Yield Corporate Bond Portfolio | 2.12 | % | ||
Vanguard MSCI Emerging Markets ETF | 1.95 | % | ||
Top Ten Holdings | 69.72 | % | ||
† Holdings are subject to change. Table presents indicative values only. | ||||
Portfolio Composition (as a % of Net Assets)
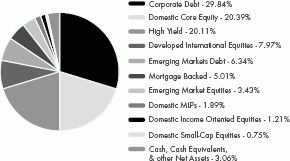
70 | October 31, 2012
Table of Contents
RiverFront Dynamic Equity Income Fund | ||
Performance Update | October 31, 2012 (Unaudited) | |
Performance of $10,000 Initial Investment (for the period ended October 31, 2012)
Comparison of change in value of a $10,000 investment (includes applicable sales loads of 5.50%)
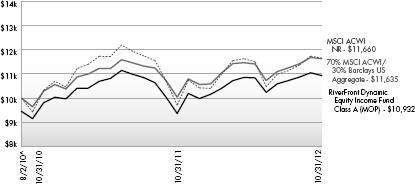
The chart above represents historical performance of a hypothetical investment of $10,000 in the Fund since inception. Past performance does not guarantee future results. This chart does not reflect the deduction of taxes that a shareholder would pay on Fund distributions or the redemption of Fund shares.
The MSCI ACWI replaced the S&P 500® Index as the Fund’s primary index because it better reflects the Fund’s portfolio. The MSCI ACWI is a free float-adjusted market capitalization weighted index that is designed to measure the equity market performance of developed and emerging markets.
The MSCI ACWI consists of 45 country indices comprising 24 developed and 21 emerging market country indices. The index includes reinvestment of dividends, net of foreign withholding taxes.
Average Annual Total Returns (as of October 31, 2012)
| 1 Year | Since Inception ^ | Total Expense Ratio | What you Pay * | |||||
Class A (NAV)1 | 7.27% | 6.70% | 1.94% | 1.40% | ||||
Class A (MOP)2 | 1.39% | 4.06% | ||||||
Class C (NAV)1 | 6.55% | 5.91% | 2.69% | 2.15% | ||||
Class C (CDSC)2 | 5.55% | 5.91% | ||||||
Class I (NAV)1 | 7.55% | 6.95% | 1.69% | 1.15% | ||||
MSCI All Country World Index3 | 8.55% | 7.09% | ||||||
70% ACWI and 30% Barclays US Aggregate3,4 | 7.78% | 6.97% |
Performance data quoted represents past performance. Past performance does not guarantee future results. Investment return and principal value of an investment will fluctuate so that an investor’s shares, when sold or redeemed, may be worth more or less than the original cost. Current performance data may be higher or lower than actual data quoted. The Fund imposes a maximum Contingent Deferred Sales Charge (“CDSC”) of 1.00% on Class C shares redeemed within the first 12 months after a purchase, and on Class A shares redeemed within the first 12 months after a purchase in excess of $1 million. Performance data does not reflect the CDSC, which if reflected would reduce the performance quoted. For the most current month-end performance data, please call 1-866-759-5679.
71| October 31, 2012
Table of Contents
RiverFront Dynamic Equity Income Fund | ||
Performance Update | October 31, 2012 (Unaudited) | |
| 1 | Net Asset Value (NAV) is the share price without sales charges. |
| 2 | Maximum Offering Price (MOP) includes sales charges. Class A returns include effects of the Fund’s maximum sales charge of 5.50%; Class C returns include the 1.00% CDSC. |
| 3 | The MSCI ACWI is a free float-adjusted market capitalization weighted index that is designed to measure the equity market performance of developed and emerging markets. The MSCI ACWI consists of 45 country indices comprising 24 developed and 21 emerging market country indices. The index includes reinvestment of dividends, net of foreign withholding taxes. |
| 4 | An unmanaged index composed of securities from the Barclays Capital Government/Corporate Bond Index, Mortgage-Backed Securities Index and the Asset-Backed Securities Index. Total return comprises price appreciation/depreciation and income as a percentage of the original investment. Indices are rebalanced monthly by market capitalization. |
| ^ | Fund inception date of August 2, 2010. |
| * | What You Pay reflects the Advisor’s and Sub-Advisor’s decision to contractually limit expenses through August 31, 2013. Please see the prospectus for additional information. |
The table does not reflect the deduction of taxes that a shareholder would pay on Fund distributions or the redemption of Fund shares.
This Fund is not suitable for all investors. Subject to investment risks, including possible loss of the principal amount invested.
Mutual funds are not insured or guaranteed by the FDIC or by any other government agency or government sponsored agency of the federal government or any state, not deposits, obligations or guaranteed by any bank or its affiliates and are subject to investment risks, including possible loss of the principal amount invested.
Top Ten Holdings (as a % of Net Assets)†
| ||
SPDR® Barclays Capital High Yield Bond ETF | 9.84% | |
Vanguard MSCI European ETF | 8.44% | |
Vanguard MSCI Emerging Markets ETF | 5.75% | |
iShares® iBoxx $ High Yield Corporate Bond Fund | 4.93% | |
iShares® S&P SmallCap 600® Index Fund | 4.91% | |
Vanguard Large-Cap ETF | 3.82% | |
PowerShares Senior Loan Portfolio | 3.69% | |
SPDR® Dow Jones REIT ETF | 3.12% | |
iShares® S&P Mid-Cap 400® Index Fund | 2.48% | |
Utilities Select Sector SPDR® Fund | 2.35% | |
Top Ten Holdings | 49.33% |
† Holdings are subject to change. Table presents indicative values only.
Portfolio Composition (as a % of Net Assets)
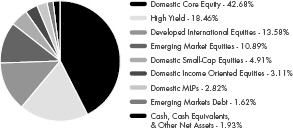
72 | October 31, 2012
Table of Contents
RiverFront Global Allocation Fund | ||
Performance Update | October 31, 2012 (Unaudited) | |
Performance of $10,000 Initial Investment (for the period ended October 31, 2012)
Comparison of change in value of a $10,000 investment (includes applicable sales loads of 5.50%)
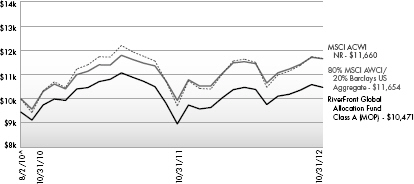
The chart above represents historical performance of a hypothetical investment of $10,000 in the Fund since inception. Past performance does not guarantee future results. This chart does not reflect the deduction of taxes that a shareholder would pay on Fund distributions or the redemption of Fund shares.
The MSCI ACWI replaced the S&P 500® Index as the Fund’s primary index because it better reflects the Fund’s portfolio. The MSCI ACWI is a free float-adjusted market capitalization weighted index that is designed to measure the equity market performance of developed and emerging markets.
The MSCI ACWI consists of 45 country indices comprising 24 developed and 21 emerging market country indices. The index includes reinvestment of dividends, net of foreign withholding taxes.
Average Annual Total Returns (as of October 31, 2012)
| 1 Year | Since Inception ^ | Total Expense Ratio | What you Pay * | |||||
Class A (NAV)1 | 7.50% | 4.67% | 2.02% | 1.40% | ||||
Class A (MOP)2 | 1.56% | 2.07% | ||||||
Class C (NAV)1 | 6.69% | 3.88% | 2.77% | 2.15% | ||||
Class C (CDSC)2 | 5.69% | 3.88% | ||||||
Class I (NAV)1 | 7.66% | 4.87% | 1.77% | 1.15% | ||||
MSCI All Country World Index3 | 8.55% | 7.09% | ||||||
80% ACWI and 20% Barclays US Aggregate3,4 | 8.06% | 7.05% |
Performance data quoted represents past performance. Past performance does not guarantee future results. Investment return and principal value of an investment will fluctuate so that an investor’s shares, when sold or redeemed, may be worth more or less than the original cost. Current performance data may be higher or lower than actual data quoted. The Fund imposes a maximum Contingent Deferred Sales Charge (“CDSC”) of 1.00% on Class C shares redeemed within the first 12 months after a purchase, and on Class A shares redeemed within the first 12 months after a purchase in excess of $1 million. Performance data does not reflect the CDSC, which if reflected would reduce the performance quoted. For the most current month-end performance data, please call 1-866-759-5679.
| 1 | Net Asset Value (NAV) is the share price without sales charges. |
| 2 | Maximum Offering Price (MOP) includes sales charges. Class A returns include effects of the Fund’s maximum sales charge of 5.50%; Class C returns include the 1.00% CDSC. |
73 | October 31, 2012
Table of Contents
RiverFront Global Allocation Fund | ||
Performance Update | October 31, 2012 (Unaudited) | |
| 3 | The MSCI ACWI is a free float-adjusted market capitalization weighted index that is designed to measure the equity market performance of developed and emerging markets. The MSCI ACWI consists of 45 country indices comprising 24 developed and 21 emerging market country indices. The index includes reinvestment of dividends, net of foreign withholding taxes. |
| 4 | An unmanaged index composed of securities from the Barclays Capital Government/Corporate Bond Index, Mortgage-Backed Securities Index and the Asset-Backed Securities Index. Total return comprises price appreciation/depreciation and income as a percentage of the original investment. Indices are rebalanced monthly by market capitalization. |
| ^ | Fund inception date of August 2, 2010. |
| * | What You Pay reflects the Advisor’s and Sub-Advisor’s decision to contractually limit expenses through August 31, 2013. Please see the prospectus for additional information. |
The table does not reflect the deduction of taxes that a shareholder would pay on Fund distributions or the redemption of Fund shares.
This Fund is not suitable for all investors. Subject to investment risks, including possible loss of the principal amount invested.
Mutual funds are not insured or guaranteed by the FDIC or by any other government agency or government sponsored agency of the federal government or any state, not deposits, obligations or guaranteed by any bank or its affiliates and are subject to investment risks, including possible loss of the principal amount invested.
Top Ten Holdings (as a % of Net Assets)†
| ||
Vanguard Large-Cap ETF | 12.31% | |
Vanguard MSCI Emerging Markets ETF | 7.56% | |
iShares® S&P SmallCap 600® Index Fund | 5.92% | |
SPDR® Barclays Capital High Yield Bond ETF | 4.42% | |
Vanguard MSCI EAFE ETF | 4.01% | |
PowerShares Senior Loan Portfolio | 3.98% | |
Vanguard MSCI European ETF | 3.51% | |
iShares® MSCI United Kingdom Index Fund | 2.91% | |
Vanguard Short-Term Corporate Bond ETF | 2.39% | |
iShares® MSCI Emerging Markets Index Fund | 2.17% | |
Top Ten Holdings | 49.18% |
† Holdings are subject to change. Table presents indicative values only.
Portfolio Composition (as a % of Net Assets)
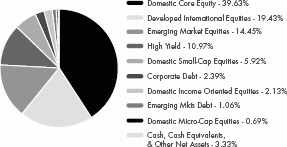
74 | October 31, 2012
Table of Contents
RiverFront Global Growth Fund | ||
Performance Update | October 31, 2012 (Unaudited) | |
Performance of $10,000 Initial Investment (for the period ended October 31, 2012)
Comparison of change in value of a $10,000 investment (includes applicable sales loads of 5.50%)
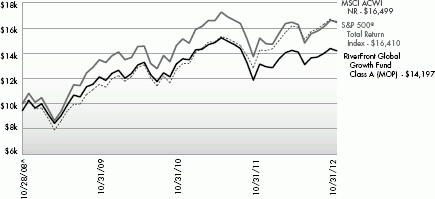
The chart above represents historical performance of a hypothetical investment of $10,000 in the Fund since inception. Past performance does not guarantee future results. This chart does not reflect the deduction of taxes that a shareholder would pay on Fund distributions or the redemption of Fund shares.
The MSCI ACWI replaced the S&P 500® Index as the Fund’s primary index because it better reflects the Fund’s portfolio. The MSCI ACWI is a free float-adjusted market capitalization weighted index that is designed to measure the equity market performance of developed and emerging markets.
The MSCI ACWI consists of 45 country indices comprising 24 developed and 21 emerging market country indices. The index includes reinvestment of dividends, net of foreign withholding taxes.
Average Annual Total Returns (as of October 31, 2012)
| 1 Year | 3 Year | Since Inception ^ | Total Expense Ratio | What you Pay * | ||||||
Class A (NAV)1 | 8.02% | 6.21% | 10.68% | 1.69% | 1.36% | |||||
Class A (MOP)2 | 2.05% | 4.21% | 9.13% | |||||||
Class C (NAV)1 | 7.34% | 5.45% | 9.88% | 2.44% | 2.11% | |||||
Class C (CDSC)2 | 6.34% | 5.45% | 9.88% | |||||||
Class I (NAV)1 | 8.32% | 6.48% | 10.96% | 1.44% | 1.11% | |||||
Class L (NAV)1,3 | 8.34% | 6.44% | 10.93% | 1.69% | 1.36% | |||||
Investor (NAV)2 | 8.06% | 6.20% | 10.65% | 1.44% | 1.11% | |||||
S&P 500® Total Return Index4 | 15.21% | 13.21% | 13.16% | |||||||
MSCI All Country World Index5 | 8.55% | 7.54% | 13.32% |
Performance data quoted represents past performance. Past performance does not guarantee future results. Investment return and principal value of an investment will fluctuate so that an investor’s shares, when sold or redeemed, may be worth more or less than the original cost. Current performance data may be higher or lower than actual data quoted. The Fund imposes a maximum Contingent Deferred Sales Charge (“CDSC”) of 1.00% on Class C shares redeemed within the first 12 months after a purchase, and on Class A shares redeemed within the first 12 months after a purchase in excess of $1 million. Performance data does not reflect the CDSC, which if reflected would reduce the performance quoted. For the most current month-end performance data, please call 1-866-759-5679.
The Class A, C, I and L shares performance shown for periods prior to September 27, 2010 reflects the performance of the Baird Funds, Inc. – RiverFront Long-Term Growth Fund’s Institutional Class shares (as result of the reorganization of the Baird Funds, Inc. – RiverFront Long-Term Growth Fund into the Fund).
75 | October 31, 2012
Table of Contents
RiverFront Global Growth Fund | ||
Performance Update | October 31, 2012 (Unaudited) | |
The Investor Class performance shown for periods prior to September 27, 2010 reflects the performance of the Baird Funds, Inc. – RiverFront Long-Term Growth Fund’s Investor Class shares (as result of the reorganization of the Baird Funds, Inc.– RiverFront Long-Term Growth Fund into the Fund).
The table does not reflect the deduction of taxes that a shareholder would pay on Fund distributions or the redemption of Fund shares.
This Fund is not suitable for all investors. Subject to investment risks, including possible loss of the principal amount invested.
| 1 | Net Asset Value (NAV) is the share price without sales charges. |
| 2 | Maximum Offering Price (MOP) includes sales charges. Class A returns include effects of the Fund’s maximum sales charge of 5.50%; Class C returns include the 1.00% CDSC. |
| 3 | Prior to close of business on September 24, 2010, Class L was known as Institutional Class of the Baird Funds, Inc. - RiverFront Long-Term Growth Fund. |
| 4 | S&P 500® Total Return Index is the Standard & Poor’s composite index of 500 stocks, a widely recognized, unmanaged index of common stock prices. The index is not actively managed and does not reflect any deduction for fees, expenses or taxes. An investor may not invest directly in an index. |
| 5 | The MSCI ACWI is a free float-adjusted market capitalization weighted index that is designed to measure the equity market performance of developed and emerging markets. The MSCI ACWI consists of 45 country indices comprising 24 developed and 21 emerging market country indices. The index includes reinvestment of dividends, net of foreign withholding taxes. |
| ^ | Fund inception date of October 28, 2008. |
| * | What You Pay reflects the Advisor’s and Sub-Advisor’s decision to contractually limit expenses through August 31, 2013. Please see the prospectus for additional information. |
Mutual funds are not insured or guaranteed by the FDIC or by any other government agency or government sponsored agency of the federal government or any state, not deposits, obligations or guaranteed by any bank or its affiliates and are subject to investment risks, including possible loss of the principal amount invested.
Top Ten Holdings (as a % of Net Assets)†
| ||
Vanguard MSCI Emerging Markets ETF | 9.74% | |
iShares® S&P SmallCap 600® Index Fund | 8.71% | |
Vanguard MSCI European ETF | 5.90% | |
Vanguard Large-Cap ETF | 5.74% | |
Vanguard MSCI EAFE ETF | 4.38% | |
SPDR® Dow Jones REIT ETF | 3.52% | |
iShares® MSCI All Country Asia ex Japan Index Fund | 3.19% | |
iShares® MSCI Emerging Markets Index Fund | 3.05% | |
iShares® MSCI United Kingdom Index Fund | 2.89% | |
iShares® MSCI EMU Index Fund | 2.69% | |
Top Ten Holdings | 49.81% |
| † | Holdings are subject to change. Table presents indicative values only. |
Portfolio Composition (as a % of Net Assets)
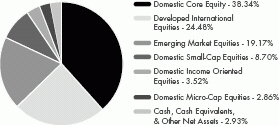
76 | October 31, 2012
Table of Contents
RiverFront Moderate Growth & Income Fund | ||
Performance Update | October 31, 2012 (Unaudited) | |
Performance of $10,000 Initial Investment (for the period ended October 31, 2012)
Comparison of change in value of a $10,000 investment (includes applicable sales loads of 5.50%)
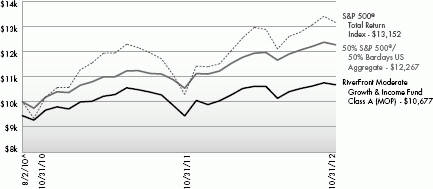
The chart above represents historical performance of a hypothetical investment of $10,000 in the Fund since inception. Past performance does not guarantee future results. This chart does not reflect the deduction of taxes that a shareholder would pay on Fund distributions or the redemption of Fund shares.
Average Annual Total Returns (as of October 31, 2012)
| 1 Year | Since Inception ^ | Total Expense Ratio | What you Pay * | |||||
Class A (NAV)1 | 6.23% | 5.59% | 1.71% | 1.41% | ||||
Class A (MOP)2 | 0.39% | 2.97% | ||||||
Class C (NAV)1 | 5.38% | 4.83% | 2.46% | 2.16% | ||||
Class C (CDSC)2 | 4.38% | 4.83% | ||||||
Class I (NAV)1 | 6.56% | 5.89% | 1.46% | 1.16% | ||||
S&P 500® Total Return Index3 | 15.21% | 12.98% | ||||||
50% S&P 500® and 50% Barclays US Aggregate3,4 | 10.30% | 9.51% |
Performance data quoted represents past performance. Past performance does not guarantee future results. Investment return and principal value of an investment will fluctuate so that an investor’s shares, when sold or redeemed, may be worth more or less than the original cost. Current performance data may be higher or lower than actual data quoted. The Fund imposes a maximum Contingent Deferred Sales Charge (“CDSC”) of 1.00% on Class C shares redeemed within the first 12 months after a purchase, and on Class A shares redeemed within the first 12 months after a purchase in excess of $1 million. Performance data does not reflect the CDSC, which if reflected would reduce the performance quoted. For the most current month-end performance data, please call 1-866-759-5679.
| 1 | Net Asset Value (NAV) is the share price without sales charges. |
| 2 | Maximum Offering Price (MOP) includes sales charges. Class A returns include effects of the Fund's maximum sales charge of 5.50%; Class C returns include the 1.00% CDSC. |
| 3 | S&P 500® Total Return Index is the Standard & Poor's composite index of 500 stocks, a widely recognized, unmanaged index of common stock prices. The index is not actively managed and does not reflect any deduction for fees, expenses or taxes. An investor may not invest directly in an index. |
| 4 | An unmanaged index composed of securities from the Barclays Capital Government/Corporate Bond Index, Mortgage-Backed Securities Index and the Asset-Backed Securities Index. Total return comprises price appreciation/depreciation and income as a percentage of the original investment. Indices are rebalanced monthly by market capitalization. |
77 | October 31, 2012
Table of Contents
RiverFront Moderate Growth & Income Fund | ||
Performance Update | October 31, 2012 (Unaudited) | |
| ^ | Fund inception date of August 2, 2010. |
| * | What You Pay reflects the Advisor's and Sub-Advisor’s decision to contractually limit expenses through August 31, 2013. Please see the prospectus for additional information. |
The table does not reflect the deduction of taxes that a shareholder would pay on Fund distributions or the redemption of Fund shares.
This Fund is not suitable for all investors. Subject to investment risks, including possible loss of the principal amount invested.
Mutual funds are not insured or guaranteed by the FDIC or by any other government agency or government sponsored agency of the federal government or any state, not deposits, obligations or guaranteed by any bank or its affiliates and are subject to investment risks, including possible loss of the principal amount invested.
Top Ten Holdings (as a % of Net Assets)†
| ||
Vanguard Short-Term Corporate Bond ETF | 11.68% | |
SPDR® Barclays Capital High Yield Bond ETF | 9.25% | |
Vanguard MSCI Emerging Markets ETF | 8.41% | |
Vanguard MSCI European ETF | 8.08% | |
iShares® iBoxx $ High Yield Corporate Bond Fund | 5.10% | |
Vanguard Dividend Appreciation ETF | 4.49% | |
iShares® JPMorgan USD Emerging Markets Bond Fund | 4.20% | |
PowerShares Senior Loan Portfolio | 4.01% | |
iShares® S&P SmallCap 600® Index Fund | 2.54% | |
SPDR® Dow Jones REIT ETF | 2.21% | |
Top Ten Holdings | 59.97% |
† Holdings are subject to change. Table presents indicative values only.
Portfolio Composition (as a % of Net Assets)
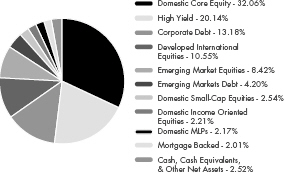
78 | October 31, 2012
Table of Contents
RiverFront Conservative Income Builder Fund | ||
| Statement of Investments | October 31, 2012 (Unaudited) | |
| Shares | Value (Note 2) | |||
COMMON STOCKS (14.15%) | ||||
Basic Materials (0.69%) | ||||
Forest Products & Paper (0.69%) | ||||
MeadWestvaco Corp. | 161 | $4,780 | ||
| ||||
TOTAL BASIC MATERIALS | 4,780 | |||
| ||||
Communications (2.90%) | ||||
Media (0.66%) | ||||
Time Warner, Inc. | 105 | 4,562 | ||
| ||||
Telecommunications (2.24%) | ||||
BCE, Inc. | 174 | 7,597 | ||
QUALCOMM, Inc. | 133 | 7,791 | ||
| ||||
| 15,388 | ||||
| ||||
TOTAL COMMUNICATIONS | 19,950 | |||
| ||||
Consumer Staples (0.82%) | ||||
Retail (0.82%) | ||||
Wal-Mart Stores, Inc. | 75 | 5,626 | ||
| ||||
TOTAL CONSUMER STAPLES | 5,626 | |||
| ||||
Consumer, Cyclical (2.05%) | ||||
Retail (1.46%) | ||||
McDonald’s Corp. | 45 | 3,906 | ||
Nordstrom, Inc. | 73 | 4,144 | ||
Tiffany & Co. | 32 | 2,023 | ||
| ||||
| 10,073 | ||||
| ||||
Toys, Games & Hobbies (0.59%) | ||||
Hasbro, Inc. | 113 | 4,067 | ||
| ||||
TOTAL CONSUMER, CYCLICAL | 14,140 | |||
| ||||
Consumer, Non-cyclical (2.86%) | ||||
Healthcare Products (0.62%) | ||||
Johnson & Johnson | 60 | 4,249 | ||
| ||||
Healthcare-Services (0.60%) | ||||
UnitedHealth Group, Inc. | 74 | 4,144 | ||
| ||||
Pharmaceuticals (1.64%) | ||||
Merck & Co., Inc. | 136 | 6,206 | ||
Pfizer, Inc. | 206 | 5,123 | ||
| ||||
| 11,329 | ||||
| ||||
TOTAL CONSUMER, NON-CYCLICAL | 19,722 | |||
| ||||
| Shares | Value (Note 2) | |||
Energy (0.66%) | ||||
Oil & Gas (0.66%) | ||||
Chevron Corp. | 41 | $4,519 | ||
| ||||
TOTAL ENERGY | 4,519 | |||
| ||||
Financials (1.25%) | ||||
Insurance (1.25%) | ||||
The Chubb Corp. | 56 | 4,311 | ||
MetLife, Inc. | 120 | 4,259 | ||
| ||||
| 8,570 | ||||
| ||||
TOTAL FINANCIALS | 8,570 | |||
| ||||
Industrials (1.55%) | ||||
Aerospace & Defense (0.59%) | ||||
L-3 Communications Holdings, Inc. | 55 | 4,059 | ||
| ||||
Miscellaneous Manufacturing (0.96%) | ||||
General Electric Co. | 315 | 6,634 | ||
| ||||
TOTAL INDUSTRIALS | 10,693 | |||
| ||||
Technology (1.37%) | ||||
Computers (0.86%) | ||||
Apple, Inc. | 10 | 5,951 | ||
| ||||
Software (0.51%) | ||||
CA, Inc. | 156 | 3,513 | ||
| ||||
TOTAL TECHNOLOGY | 9,464 | |||
| ||||
TOTAL COMMON STOCKS (Cost $98,590) | 97,464 | |||
| ||||
EXCHANGE TRADED FUNDS (81.94%) | ||||
Aggressive Growth (0.80%) | ||||
Vanguard Dividend Appreciation ETF | 93 | 5,480 | ||
| ||||
Debt (61.30%) | ||||
iShares® Barclays 1-3 Year Credit Bond Fund | 754 | 79,773 | ||
iShares® Barclays MBS Bond Fund | 317 | 34,483 | ||
iShares® iBoxx $ High Yield Corporate Bond Fund | 500 | 46,315 | ||
iShares® JPMorgan USD Emerging Markets Bond Fund | 359 | 43,658 | ||
PowerShares Fundamental High Yield Corporate Bond Portfolio | 761 | 14,589 | ||
PowerShares Senior Loan Portfolio | 1,107 | 27,498 | ||
79 | October 31, 2012
Table of Contents
RiverFront Conservative Income Builder Fund | ||
Statement of Investments | October 31, 2012 (Unaudited) | |
| Shares | Value (Note 2) | |||
Debt (continued) | ||||
SPDR® Barclays Capital High Yield Bond ETF | 1,243 | $50,130 | ||
Vanguard Short-Term Corporate Bond ETF | 1,558 | 125,731 | ||
| ||||
| 422,177 | ||||
| ||||
Equity (18.00%) | ||||
Credit Suisse Cushing 30 MLP Index ETN | 284 | 7,137 | ||
iShares® Dow Jones US Financial Services Index Fund | 73 | 4,146 | ||
iShares® MSCI Emerging Markets Index Fund | 248 | 10,195 | ||
iShares® MSCI Pacific ex-Japan Index Fund | 77 | 3,519 | ||
iShares® S&P Mid-Cap 400® Index Fund | 43 | 4,211 | ||
iShares® S&P SmallCap 600® Index Fund | 69 | 5,197 | ||
PowerShares International Dividend Achievers Portfolio | 448 | 6,850 | ||
PowerShares S&P 500® High Beta Port ETF | 436 | 8,903 | ||
SPDR® Dow Jones REIT ETF | 117 | 8,344 | ||
Utilities Select Sector SPDR® Fund(a) | 110 | 4,056 | ||
Vanguard Consumer Staples ETF | 38 | 3,443 | ||
Vanguard MSCI Emerging Markets ETF | 324 | 13,443 | ||
Vanguard MSCI European ETF | 967 | 44,541 | ||
| ||||
| 123,985 | ||||
| ||||
Growth (1.84%) | ||||
PowerShares S&P 500® Low Volatility Portfolio | 452 | 12,706 | ||
| ||||
TOTAL EXCHANGE TRADED FUNDS (Cost $563,070) | 564,348 | |||
| ||||
EXCHANGE TRADED NOTES (0.85%) | ||||
Master Limited Partnerships (0.85%) | ||||
UBS E-TRACS Alerian MLP Infrastructure ETN | 174 | 5,846 | ||
| ||||
TOTAL EXCHANGE TRADED NOTES (Cost $5,826) | 5,846 | |||
| ||||
TOTAL INVESTMENTS (96.94%) (Cost $667,486) | $667,658 | |||
Other Assets In Excess Of | 21,059 | |||
| ||||
NET ASSETS (100.00%) | $688,716 | |||
| ||||
| (a) | Non-Income Producing Security. |
| (b) | Affiliated Company. See Note 8 to Financial Statements. |
Common Abbreviations:
ACWI - All Country World Index.
ASEAN - Association of Southeast Asian Nations.
DWA - Dorsey Wright & Associates.
EAFE - Europe, Australia, and Far East.
ETF - Exchange Traded Fund.
EMU - European Monetary Union.
FTSE - Financial Times and the London Stock Exchange.
MSCI - Morgan Stanley Capital International.
REIT - Real Estate Investment Trust.
S&P - Standard and Poor’s.
SPDR - Standard and Poor’s Depositary Receipt.
For Fund compliance purposes, the Fund’s industry classifications refer to any one or more of the industry sub-classifications used by one or more widely recognized market indexes or ratings group indexes, and/or as defined by Fund management. This definition may not apply for purposes of this report, which may combine industry sub-classifications for reporting ease. Industries are shown as a percent of net assets. These industry classifications are based on third party definitions and are unaudited. The definitions are industry terms and do not reflect the legal status of any of the investments or the companies in which the Fund has invested.
See Notes to Financial Statements.
| 80 | October 31, 2012 |
Table of Contents
RiverFront Dynamic Equity Income Fund | ||
Statement of Investments | October 31, 2012 (Unaudited) | |
| Shares | Value (Note 2) | |||||||
COMMON STOCKS (27.70%) |
| |||||||
Basic Materials (1.09%) |
| |||||||
Forest Products & Paper (1.09%) |
| |||||||
MeadWestvaco Corp. | 10,041 | $298,117 | ||||||
|
| |||||||
TOTAL BASIC MATERIALS |
| 298,117 | ||||||
|
| |||||||
Communications (4.62%) |
| |||||||
Media (1.46%) | ||||||||
Time Warner, Inc. | 9,136 | 396,959 | ||||||
|
| |||||||
Telecommunications (3.16%) |
| |||||||
BCE, Inc. | 8,883 | 387,832 | ||||||
QUALCOMM, Inc. | 8,095 | 474,165 | ||||||
|
| |||||||
| 861,997 | ||||||||
|
| |||||||
TOTAL COMMUNICATIONS |
| 1,258,956 | ||||||
|
| |||||||
Consumer Staples (1.56%) |
| |||||||
Retail (1.56%) | ||||||||
Wal-Mart Stores, Inc. | 5,653 | 424,088 | ||||||
|
| |||||||
TOTAL CONSUMER STAPLES |
| 424,088 | ||||||
|
| |||||||
Consumer, Cyclical (4.48%) |
| |||||||
Retail (3.16%) | ||||||||
McDonald's Corp. | 3,901 | 338,607 | ||||||
Nordstrom, Inc. | 6,290 | 357,083 | ||||||
Tiffany & Co. | 2,610 | 165,004 | ||||||
|
| |||||||
| 860,694 | ||||||||
|
| |||||||
Toys, Games & Hobbies (1.32%) |
| |||||||
Hasbro, Inc. | 10,014 | 360,404 | ||||||
|
| |||||||
TOTAL CONSUMER, CYCLICAL |
| 1,221,098 | ||||||
|
| |||||||
Consumer, Non-cyclical (5.73%) |
| |||||||
Healthcare Products (1.33%) |
| |||||||
Johnson & Johnson | 5,113 | 362,103 | ||||||
|
| |||||||
Healthcare-Services (1.30%) |
| |||||||
UnitedHealth Group, Inc. | 6,331 | 354,536 | ||||||
|
| |||||||
Pharmaceuticals (3.10%) |
| |||||||
Merck & Co., Inc. | 10,192 | 465,061 | ||||||
Pfizer, Inc. | 15,212 | 378,322 | ||||||
|
| |||||||
| 843,383 | ||||||||
|
| |||||||
TOTAL CONSUMER, |
| 1,560,022 | ||||||
|
| |||||||
| Shares | Value (Note 2) | |||||||
Energy (1.40%) | ||||||||
Oil & Gas (1.40%) |
| |||||||
Chevron Corp. | 3,460 | $381,327 | ||||||
|
| |||||||
TOTAL ENERGY | 381,327 | |||||||
|
| |||||||
Financials (2.70%) |
| |||||||
Insurance (2.70%) | ||||||||
The Chubb Corp. | 4,826 | 371,505 | ||||||
MetLife, Inc. | 10,251 | 363,808 | ||||||
|
| |||||||
| 735,313 | ||||||||
|
| |||||||
TOTAL FINANCIALS | 735,313 | |||||||
|
| |||||||
Industrials (3.41%) | ||||||||
Aerospace & Defense (1.29%) |
| |||||||
L-3 Communications Holdings, Inc. | 4,755 | 350,919 | ||||||
|
| |||||||
Miscellaneous Manufacturing (2.12%) |
| |||||||
General Electric Co. | 27,379 | 576,602 | ||||||
|
| |||||||
TOTAL INDUSTRIALS |
| 927,521 | ||||||
|
| |||||||
Technology (2.71%) | ||||||||
Computers (1.61%) | ||||||||
Apple, Inc. | 735 | 437,398 | ||||||
|
| |||||||
Software (1.10%) | ||||||||
CA, Inc. | 13,351 | 300,665 | ||||||
|
| |||||||
TOTAL TECHNOLOGY |
| 738,063 | ||||||
|
| |||||||
TOTAL COMMON STOCKS (Cost $6,674,941) |
| 7,544,505 | ||||||
|
| |||||||
EXCHANGE TRADED FUNDS (69.13%) |
| |||||||
Aggressive Growth (2.02%) |
| |||||||
Vanguard Dividend Appreciation ETF | 9,334 | 550,053 | ||||||
|
| |||||||
Consumer Staples (0.86%) |
| |||||||
Vanguard Consumer Staples ETF | 2,573 | 233,139 | ||||||
|
| |||||||
Debt (10.24%) | ||||||||
iShares® iBoxx $ High Yield Corporate Bond Fund | 14,501 | 1,343,228 | ||||||
iShares® JPMorgan USD Emerging Markets Bond Fund | 3,636 | 442,174 | ||||||
PowerShares Senior Loan Portfolio | 40,418 | 1,003,983 | ||||||
|
| |||||||
| 2,789,385 | ||||||||
|
| |||||||
81 | October 31, 2012 |
Table of Contents
RiverFront Dynamic Equity Income Fund | ||
Statement of Investments | October 31, 2012 (Unaudited) | |
| Shares | Value (Note 2) | |||||||||
Emerging Market Equity (8.37%) | 4,913 | $276,602 | ||||||||
iShares® MSCI All Country Asia ex Japan Index Fund | ||||||||||
Vanguard MSCI Emerging Markets ETF | 37,769 | 1,567,036 | ||||||||
WisdomTree Emerging Markets Small-Cap Dividend Fund | 9,572 | 435,621 | ||||||||
|
| |||||||||
| 2,279,259 | ||||||||||
|
| |||||||||
Equity (35.32%) |
| |||||||||
Credit Suisse Cushing 30 MLP Index ETN | 17,036 | 428,115 | ||||||||
Global X FTSE ASEAN 40 ETF | 16,358 | 274,649 | ||||||||
iShares® Dow Jones US Financial Services Index Fund | 6,317 | 358,743 | ||||||||
iShares® MSCI Emerging Markets Index Fund | 10,018 | 411,840 | ||||||||
iShares® MSCI EMU Index Fund | 13,776 | 424,576 | ||||||||
iShares® MSCI Pacific ex-Japan Index Fund | 8,362 | 382,143 | ||||||||
iShares® S&P SmallCap 600® Index Fund | 17,741 | 1,336,252 | ||||||||
PowerShares International Dividend Achievers Portfolio | 38,845 | 593,940 | ||||||||
PowerShares S&P 500® High Beta Port ETF | 28,506 | 582,093 | ||||||||
SPDR® Dow Jones REIT ETF | 11,899 | 848,637 | ||||||||
Utilities Select Sector SPDR® Fund(a) | 17,331 | 638,994 | ||||||||
Vanguard Large-Cap ETF | 16,135 | 1,041,030 | ||||||||
Vanguard MSCI European ETF | 49,923 | 2,299,453 | ||||||||
|
| |||||||||
| 9,620,465 | ||||||||||
|
| |||||||||
Fixed Income / High Yield (9.84%) |
| |||||||||
SPDR® Barclays Capital High Yield Bond ETF | 66,453 | 2,680,049 | ||||||||
|
| |||||||||
Mid-Cap (2.48%) |
| |||||||||
iShares® S&P Mid-Cap 400® Index Fund | 6,902 | 675,982 | ||||||||
|
| |||||||||
TOTAL EXCHANGE (Cost $18,232,268) |
| 18,828,332 | ||||||||
|
| |||||||||
EXCHANGE TRADED NOTES (1.24%) |
| |||||||||
Master Limited Partnerships (1.24%) |
| |||||||||
UBS E-TRACS Alerian MLP Infrastructure ETN | 10,076 | 338,554 | ||||||||
|
| |||||||||
TOTAL EXCHANGE (Cost $317,717) |
| 338,554 | ||||||||
|
| |||||||||
| Shares | Value (Note 2) | |||||||||||
SHORT TERM INVESTMENTS (2.26%) |
| |||||||||||
Money Market Fund (2.26%) |
| |||||||||||
Dreyfus Cash Management Fund, Institutional Class | 0.061 | % | 616,026 | $616,026 | ||||||||
|
| |||||||||||
TOTAL SHORT TERM INVESTMENTS |
| |||||||||||
(Cost $616,026) | 616,026 | |||||||||||
|
| |||||||||||
TOTAL INVESTMENTS (100.33%) (Cost $25,840,952) |
| $27,327,417 | ||||||||||
Liabilities In Excess Of Other Assets (-0.33%) |
| (89,115 | ) | |||||||||
|
| |||||||||||
NET ASSETS (100.00%) |
| $27,238,302 | ||||||||||
|
| |||||||||||
| (a) | Affiliated Company. See Note 8 to Financial Statements. |
Common Abbreviations:
ASEAN - Association of Southeast Asian Nations.
EMU - European Monetary Union.
ETF - Exchange Traded Fund.
ETN - Exchange Traded Note.
FTSE - Financial Times and the London Stock Exchange.
MLP - Master Limited Partnership.
MSCI - Morgan Stanley Capital International.
REIT - Real Estate Investment Trust.
S&P - Standard and Poor's.
SPDR - Standard and Poor's Depositary Receipt.
For Fund compliance purposes, the Fund's industry classifications refer to any one or more of the industry sub-classifications used by one or more widely recognized market indexes or ratings group indexes, and/or as defined by Fund management. This definition may not apply for purposes of this report, which may combine industry sub-classifications for reporting ease. Industries are shown as a percent of net assets. These industry classifications are based on third party definitions and are unaudited. The definitions are industry terms and do not reflect the legal status of any of the investments or the companies in which the Fund has invested.
See Notes to Financial Statements.
82 | October 31, 2012
Table of Contents
RiverFront Global Allocation Fund | ||
Statement of Investments | October 31, 2012 (Unaudited) | |
| Shares | Value (Note 2) | |||||||
COMMON STOCKS (19.63%) |
| |||||||
Basic Materials (0.60%) |
| |||||||
Forest Products & Paper (0.60%) |
| |||||||
MeadWestvaco Corp. | 3,893 | $ | 115,583 | |||||
|
| |||||||
TOTAL BASIC MATERIALS |
| 115,583 | ||||||
|
| |||||||
Communications (3.10%) |
| |||||||
Internet (0.30%) | ||||||||
VeriSign, Inc.(a) | 1,544 | 57,236 | ||||||
|
| |||||||
Media (1.39%) | ||||||||
Scripps Networks Interactive, Inc., Class A | 2,313 | 140,445 | ||||||
Time Warner, Inc. | 2,919 | 126,831 | ||||||
|
| |||||||
| 267,276 | ||||||||
|
| |||||||
Telecommunications (1.41%) |
| |||||||
BCE, Inc. | 2,632 | 114,913 | ||||||
QUALCOMM, Inc. | 2,681 | 157,040 | ||||||
|
| |||||||
| 271,953 | ||||||||
|
| |||||||
TOTAL COMMUNICATIONS |
| 596,465 | ||||||
|
| |||||||
Consumer Staples (0.77%) |
| |||||||
Retail (0.77%) | ||||||||
Wal-Mart Stores, Inc. | 1,979 | 148,465 | ||||||
|
| |||||||
TOTAL CONSUMER STAPLES |
| 148,465 | ||||||
|
| |||||||
Consumer, Cyclical (2.27%) |
| |||||||
Retail (1.75%) | ||||||||
Cracker Barrel Old Country Store, Inc. | 1,456 | 92,675 | ||||||
McDonald’s Corp. | 1,348 | 117,006 | ||||||
Nordstrom, Inc. | 2,238 | 127,051 | ||||||
|
| |||||||
| 336,732 | ||||||||
|
| |||||||
Toys, Games & Hobbies (0.52%) |
| |||||||
Hasbro, Inc. | 2,809 | 101,096 | ||||||
|
| |||||||
TOTAL CONSUMER, |
| 437,828 | ||||||
|
| |||||||
Consumer, Non-cyclical (3.48%) |
| |||||||
Healthcare Products (0.59%) |
| |||||||
Johnson & Johnson | 1,609 | 113,949 | ||||||
|
| |||||||
Healthcare-Services (0.61%) |
| |||||||
UnitedHealth Group, Inc. | 2,072 | 116,032 | ||||||
|
| |||||||
Pharmaceuticals (2.28%) |
| |||||||
Merck & Co., Inc. | 4,656 | 212,454 | ||||||
| Shares | Value (Note 2) | |||||||
Pharmaceuticals (continued) |
| |||||||
Pfizer, Inc. | 9,121 | $ | 226,839 | |||||
|
| |||||||
| 439,293 | ||||||||
|
| |||||||
TOTAL CONSUMER, |
| 669,274 | ||||||
|
| |||||||
Energy (2.13%) | ||||||||
Oil & Gas (2.13%) | ||||||||
Chevron Corp. | 2,411 | 265,716 | ||||||
ExxonMobil Corp. | 1,588 | 144,778 | ||||||
|
| |||||||
| 410,494 | ||||||||
|
| |||||||
TOTAL ENERGY |
| 410,494 | ||||||
|
| |||||||
Financials (1.66%) | ||||||||
Insurance (1.14%) | ||||||||
HCC Insurance Holdings, Inc. | 3,394 | 120,962 | ||||||
MetLife, Inc. | 2,768 | 98,236 | ||||||
|
| |||||||
| 219,198 | ||||||||
|
| |||||||
Real Estate (0.52%) |
| |||||||
CBRE Group, Inc., Class A(a) | 5,543 | 99,885 | ||||||
|
| |||||||
TOTAL FINANCIALS |
| 319,083 | ||||||
|
| |||||||
Industrials (2.32%) |
| |||||||
Aerospace & Defense (0.73%) |
| |||||||
L-3 Communications Holdings, Inc. | 1,908 | 140,810 | ||||||
|
| |||||||
Hand & Machine Tools (0.58%) |
| |||||||
Snap-on, Inc. | 1,450 | 112,129 | ||||||
|
| |||||||
Miscellaneous Manufacturing (1.01%) |
| |||||||
General Electric Co. | 9,186 | 193,457 | ||||||
|
| |||||||
TOTAL INDUSTRIALS |
| 446,396 | ||||||
|
| |||||||
Technology (3.30%) |
| |||||||
Computers (1.63%) | ||||||||
Apple, Inc. | 527 | 313,618 | ||||||
|
| |||||||
Computers & Peripherals (0.96%) |
| |||||||
EMC Corp.(a) | 3,554 | 86,788 | ||||||
Synopsys, Inc.(a) | 3,029 | 97,534 | ||||||
|
| |||||||
| 184,322 | ||||||||
|
| |||||||
Software (0.71%) |
| |||||||
CA, Inc. | 2,656 | 59,813 | ||||||
83 | October 31, 2012 |
Table of Contents
RiverFront Global Allocation Fund | ||
Statement of Investments | October 31, 2012 (Unaudited) | |
| Shares | Value (Note 2) | |||||||||
Software (continued) |
| |||||||||
Oracle Corp. | 2,496 | $77,501 | ||||||||
|
| |||||||||
| 137,314 | ||||||||||
|
| |||||||||
TOTAL TECHNOLOGY |
| 635,254 | ||||||||
|
| |||||||||
TOTAL COMMON STOCKS (Cost $3,236,029) |
| 3,778,842 | ||||||||
|
| |||||||||
EXCHANGE TRADED FUNDS (77.04%) |
| |||||||||
Debt (6.01%) | ||||||||||
iShares® iBoxx $ High Yield Corporate Bond Fund | 2,006 | 185,816 | ||||||||
iShares® JPMorgan USD Emerging Markets Bond Fund | 1,678 | 204,062 | ||||||||
PowerShares Senior Loan Portfolio | 30,885 | 767,183 | ||||||||
|
| |||||||||
| 1,157,061 | ||||||||||
|
| |||||||||
Emerging Market Equity (11.27%) |
| |||||||||
iShares® MSCI All Country Asia ex Japan Index Fund | 5,262 | 296,251 | ||||||||
iShares® MSCI Emerging Markets Index Fund | 10,174 | 418,253 | ||||||||
Vanguard MSCI Emerging Markets ETF | 35,097 | 1,456,174 | ||||||||
|
| |||||||||
| 2,170,678 | ||||||||||
|
| |||||||||
Equity (43.38%) |
| |||||||||
First Trust Dow Jones Internet Index Fund(a) | 2,613 | 94,878 | ||||||||
Global X FTSE ASEAN 40 ETF | 11,609 | 194,914 | ||||||||
Health Care Select Sector SPDR® Fund(b) | 5,479 | 219,160 | ||||||||
iShares® Dow Jones US Financial Services Index Fund | 5,283 | 300,022 | ||||||||
iShares® MSCI ACWI ex US Index Fund | 8,741 | 346,493 | ||||||||
iShares® MSCI EMU Index Fund | 12,709 | 391,691 | ||||||||
iShares® MSCI Germany Index Fund | 16,202 | 371,674 | ||||||||
iShares® MSCI Pacific ex-Japan Index Fund | 5,548 | 253,544 | ||||||||
iShares® Russell Microcap Index Fund | 2,606 | 132,750 | ||||||||
iShares® S&P SmallCap 600® Index Fund | 15,135 | 1,139,968 | ||||||||
Powershares DWA Technical Leaders Portfolio | 10,290 | 282,049 | ||||||||
PowerShares International Dividend Achievers Portfolio | 18,402 | 281,367 | ||||||||
PowerShares S&P 500® High Beta Port ETF | 13,120 | 267,910 | ||||||||
| Shares | Value (Note 2) | |||||||||
Equity (continued) |
| |||||||||
PowerShares S&P® SmallCap Health Care Portfolio | 3,141 | $107,391 | ||||||||
SPDR® Dow Jones REIT ETF | 5,738 | 409,234 | ||||||||
SPDR® S&P® Metals & Mining ETF | 2,213 | 98,478 | ||||||||
Vanguard Large-Cap ETF | 36,733 | 2,370,013 | ||||||||
Vanguard MSCI European ETF | 14,652 | 674,871 | ||||||||
WisdomTree Emerging Markets Small-Cap Dividend Fund | 9,137 | 415,825 | ||||||||
|
| |||||||||
| 8,352,232 | ||||||||||
|
| |||||||||
Fixed Income / Corporate Bonds (2.39%) |
| |||||||||
Vanguard Short-Term Corporate Bond ETF | 5,704 | 460,313 | ||||||||
|
| |||||||||
Fixed Income / High Yield (6.02%) |
| |||||||||
PowerShares Fundamental High Yield Corporate Bond Portfolio | 16,092 | 308,484 | ||||||||
SPDR® Barclays Capital High Yield Bond ETF | 21,095 | 850,761 | ||||||||
|
| |||||||||
| 1,159,245 | ||||||||||
|
| |||||||||
International Equity (7.39%) |
| |||||||||
iShares® MSCI Canada Index Fund | 3,165 | 90,139 | ||||||||
iShares® MSCI United Kingdom Index Fund | 32,014 | 559,604 | ||||||||
Vanguard MSCI EAFE ETF | 23,238 | 772,199 | ||||||||
|
| |||||||||
| 1,421,942 | ||||||||||
|
| |||||||||
Utilities (0.58%) |
| |||||||||
Utilities Select Sector SPDR® Fund(b) | 3,005 | 110,794 | ||||||||
|
| |||||||||
TOTAL EXCHANGE TRADED FUNDS (Cost $14,300,389) |
| 14,832,265 | ||||||||
|
| |||||||||
| 7-Day Yield | Shares | Value (Note 2) | ||||||||||
SHORT TERM INVESTMENTS (2.56%) |
| |||||||||||
Money Market Fund (2.56%) |
| |||||||||||
Dreyfus Cash Management Fund, Institutional Class | 0.061% | 494,053 | 494,053 | |||||||||
|
| |||||||||||
TOTAL SHORT TERM INVESTMENTS (Cost $494,053) |
| 494,053 | ||||||||||
|
| |||||||||||
84 | October 31, 2012 |
Table of Contents
RiverFront Global Allocation Fund | ||
Statement of Investments | October 31, 2012 (Unaudited) |
Value (Note 2) | ||||
| ||||
TOTAL INVESTMENTS (99.23%) (Cost $18,030,471) | $ | 19,105,160 | ||
Other Assets In Excess Of Liabilities (0.77%) | 148,126 | |||
|
| |||
NET ASSETS (100.00%) | $ | 19,253,286 | ||
|
| |||
| (a) | Non-Income Producing Security. |
| (b) | Affiliated Company. See Note 8 to Financial Statements. |
Common Abbreviations:
ASEAN - Association of Southeast Asian Nations.
ACWI - All Country World Index.
DWA - Dorsey Wright & Associates.
EAFE - Europe, Australia, and Far East.
EMU - European Monetary Union.
ETF - Exchange Traded Fund.
FTSE - Financial Times and the London Stock Exchange.
MSCI - Morgan Stanley Capital International.
REIT - Real Estate Investment Trust.
S&P - Standard and Poor’s.
SPDR - Standard and Poor’s Depositary Receipt.
For Fund compliance purposes, the Fund's industry classifications refer to any one or more of the industry sub-classifications used by one or more widely recognized market indexes or ratings group indexes, and/or as defined by Fund management. This definition may not apply for purposes of this report, which may combine industry sub-classifications for reporting ease. Industries are shown as a percent of net assets. These industry classifications are based on third party definitions and are unaudited. The definitions are industry terms and do not reflect the legal status of any of the investments or the companies in which the Fund has invested.
See Notes to Financial Statements.
85 | October 31, 2012
Table of Contents
RiverFront Global Growth Fund | ||
Statement of Investments | October 31, 2012 (Unaudited) |
| Shares | Value (Note 2) | |||||||
| ||||||||
COMMON STOCKS (23.26%) |
| |||||||
Basic Materials (0.57%) | ||||||||
Forest Products & Paper (0.57%) |
| |||||||
MeadWestvaco Corp. | 9,409 | $279,353 | ||||||
|
| |||||||
TOTAL BASIC MATERIALS | 279,353 | |||||||
|
| |||||||
Communications (3.62%) |
| |||||||
Internet (0.40%) | ||||||||
VeriSign, Inc.(a) | 5,306 | 196,694 | ||||||
|
| |||||||
Media (1.77%) | ||||||||
Scripps Networks Interactive, Inc., Class A | 7,254 | 440,463 | ||||||
Time Warner, Inc. | 9,667 | 420,031 | ||||||
|
| |||||||
| 860,494 | ||||||||
|
| |||||||
Telecommunications (1.45%) |
| |||||||
BCE, Inc. | 7,510 | 327,887 | ||||||
QUALCOMM, Inc. | 6,446 | 377,574 | ||||||
|
| |||||||
| 705,461 | ||||||||
|
| |||||||
TOTAL COMMUNICATIONS |
| 1,762,649 | ||||||
|
| |||||||
Consumer Staples (0.85%) | ||||||||
Food & Staples Retailing (0.85%) |
| |||||||
Wal-Mart Stores, Inc. | 5,493 | 412,085 | ||||||
|
| |||||||
TOTAL CONSUMER STAPLES |
| 412,085 | ||||||
|
| |||||||
Consumer, Cyclical (2.68%) |
| |||||||
Leisure Equipment & Products (0.68%) |
| |||||||
Hasbro, Inc. | 9,122 | 328,301 | ||||||
|
| |||||||
Retail (2.00%) | ||||||||
Cracker Barrel Old Country Store, Inc. | 4,905 | 312,203 | ||||||
McDonald’s Corp. | 4,021 | 349,023 | ||||||
Nordstrom, Inc. | 5,515 | 313,086 | ||||||
|
| |||||||
| 974,312 | ||||||||
|
| |||||||
TOTAL CONSUMER, CYCLICAL |
| 1,302,613 | ||||||
|
| |||||||
Consumer, Non-cyclical (4.11%) |
| |||||||
Health Care Providers & Services (0.81%) |
| |||||||
Johnson & Johnson | 5,538 | 392,201 | ||||||
|
| |||||||
Healthcare-Services (0.76%) |
| |||||||
UnitedHealth Group, Inc. | 6,634 | 371,504 | ||||||
|
| |||||||
Pharmaceuticals (2.54%) |
| |||||||
Merck & Co., Inc. | 14,720 | 671,674 | ||||||
| Shares | Value (Note 2) | |||||||
| ||||||||
Pharmaceuticals (continued) |
| |||||||
Pfizer, Inc. | 22,577 | $561,490 | ||||||
|
| |||||||
| 1,233,164 | ||||||||
|
| |||||||
TOTAL CONSUMER, NON-CYCLICAL |
| 1,996,869 | ||||||
|
| |||||||
Energy (2.04%) | ||||||||
Oil & Gas (2.04%) | ||||||||
Chevron Corp. | 5,719 | 630,291 | ||||||
Exxon Mobil Corp. | 3,949 | 360,030 | ||||||
|
| |||||||
| 990,321 | ||||||||
|
| |||||||
TOTAL ENERGY | 990,321 | |||||||
|
| |||||||
Financials (2.37%) | ||||||||
Insurance (1.69%) | ||||||||
HCC Insurance Holdings, Inc. | 13,131 | 467,989 | ||||||
MetLife, Inc. | 10,052 | 356,745 | ||||||
|
| |||||||
| 824,734 | ||||||||
|
| |||||||
Real Estate (0.68%) | ||||||||
CBRE Group, Inc., Class A(a) | 18,303 | 329,820 | ||||||
|
| |||||||
TOTAL FINANCIALS | 1,154,554 | |||||||
|
| |||||||
Industrials (3.15%) | ||||||||
Aerospace & Defense (0.98%) |
| |||||||
L-3 Communications Holdings, Inc. | 6,434 | 474,829 | ||||||
|
| |||||||
Hand & Machine Tools (0.81%) |
| |||||||
Snap-on, Inc. | 5,096 | 394,074 | ||||||
|
| |||||||
Miscellaneous Manufacturing (1.36%) |
| |||||||
General Electric Co. | 31,504 | 663,474 | ||||||
|
| |||||||
TOTAL INDUSTRIALS | 1,532,377 | |||||||
|
| |||||||
Technology (3.87%) | ||||||||
Computers & Peripherals (2.94%) |
| |||||||
Apple, Inc. | 1,384 | 823,619 | ||||||
EMC Corp.(a) | 11,770 | 287,423 | ||||||
Synopsys, Inc.(a) | 9,895 | 318,619 | ||||||
|
| |||||||
| 1,429,661 | ||||||||
|
| |||||||
Software (0.93%) | ||||||||
CA, Inc. | 8,765 | 197,388 | ||||||
86 | October 31, 2012
Table of Contents
| RiverFront Global Growth Fund | ||
Statement of Investments | October 31, 2012 (Unaudited) |
| Shares | Value (Note 2) | |||
| ||||
Software (continued) | ||||
Oracle Corp. | 8,247 | $256,069 | ||
| ||||
| 453,457 | ||||
| ||||
TOTAL TECHNOLOGY | 1,883,118 | |||
| ||||
TOTAL COMMON STOCKS (Cost $9,262,756) | 11,313,939 | |||
| ||||
EXCHANGE TRADED FUNDS (73.81%) | ||||
Emerging Markets (15.97%) | ||||
iShares® MSCI All Country Asia ex Japan Index Fund | 27,545 | 1,550,784 | ||
iShares® MSCI Emerging Markets Index Fund | 36,100 | 1,484,071 | ||
Vanguard MSCI Emerging Markets ETF | 114,058 | 4,732,266 | ||
| ||||
| 7,767,121 | ||||
| ||||
Equity (50.13%) | ||||
First Trust Dow Jones Internet Index Fund(a) | 9,224 | 334,923 | ||
Global X FTSE ASEAN 40 ETF | 30,009 | 503,848 | ||
Health Care Select Sector SPDR® Fund(b) | 13,589 | 543,560 | ||
iShares® Dow Jones US Financial Services Index Fund | 17,502 | 993,939 | ||
iShares® MSCI ACWI Index Fund | 22,327 | 885,042 | ||
iShares® MSCI EMU Index Fund | 42,464 | 1,308,740 | ||
iShares® MSCI Germany Index Fund | 53,944 | 1,237,475 | ||
iShares® MSCI Pacific ex-Japan Index Fund | 18,890 | 863,273 | ||
iShares® MSCI United Kingdom Index Fund | 80,268 | 1,403,085 | ||
iShares® S&P SmallCap 600® Index Fund | 56,218 | 4,234,340 | ||
Powershares DWA Technical Leaders Portfolio | 25,750 | 705,807 | ||
PowerShares International Dividend Achievers Portfolio | 64,292 | 983,025 | ||
PowerShares S&P® 500 High Beta Port ETF | 41,412 | 845,633 | ||
PowerShares S&P® SmallCap Health Care Portfolio | 10,661 | 364,500 | ||
SPDR® Dow Jones REIT ETF | 23,993 | 1,711,181 | ||
SPDR® S&P® Metals & Mining ETF | 8,533 | 379,719 | ||
Utilities Select Sector SPDR® Fund(b) | 10,072 | 371,355 | ||
Vanguard Large-Cap ETF | 43,270 | 2,791,780 | ||
Vanguard MSCI European ETF | 62,291 | 2,869,123 | ||
| Shares | Value (Note 2) | |||||
| ||||||
Equity (continued) | ||||||
WisdomTree Emerging Markets Small-Cap Dividend Fund | 23,055 | $1,049,233 | ||||
| ||||||
| 24,379,581 | ||||||
| ||||||
Growth (1.89%) | ||||||
Wilshire Micro-Cap ETF | 49,884 | 920,360 | ||||
| ||||||
International Equity (4.85%) | ||||||
iShares® MSCI Canada Index Fund | 8,065 | 229,691 | ||||
Vanguard MSCI EAFE ETF | 64,015 | 2,127,219 | ||||
| ||||||
| 2,356,910 | ||||||
| ||||||
Micro-Cap (0.97%) | ||||||
First Trust Dow Jones Select Micro-Cap Index Fund | 21,512 | 470,037 | ||||
| ||||||
TOTAL EXCHANGE TRADED FUNDS (Cost $32,667,099) | 35,894,009 | |||||
| ||||||
7-Day Yield | Shares | Value (Note 2) | ||||
| ||||||
SHORT TERM INVESTMENTS (2.91%) | ||||||
Money Market Fund (2.91%) | ||||||
Dreyfus Cash Management Fund, Institutional Class | 0.061% | 1,414,560 | 1,414,560 | |||
| ||||||
TOTAL SHORT TERM INVESTMENTS (Cost $1,414,560) | 1,414,560 | |||||
| ||||||
TOTAL INVESTMENTS (99.98%) (Cost $43,344,415) | $48,622,508 | |||||
Other Assets In Excess Of | 10,641 | |||||
| ||||||
NET ASSETS (100.00%) | $48,633,149 | |||||
| ||||||
87 | October 31, 2012
Table of Contents
| RiverFront Global Growth Fund | ||
Statement of Investments | October 31, 2012 (Unaudited) |
| (a) | Non-Income Producing Security. |
| (b) | Affiliated Company. See Note 8 to Financial Statements. |
Common Abbreviations:
| ACWI | - All Country World Index. |
| ASEAN | - Association of Southeast Asian Nations. |
| DWA | - Dorsey Wright & Associates. |
| EAFE | - Europe, Australia, and Far East. |
| ETF | - Exchange Traded Fund. |
| EMU | - European Monetary Union. |
| FTSE | - Financial Times and the London Stock Exchange. |
| MSCI | - Morgan Stanley Capital International. |
| REIT | - Real Estate Investment Trust. |
| S&P | - Standard and Poor’s. |
| SPDR | - Standard and Poor’s Depositary Receipt. |
For Fund compliance purposes, the Fund’s industry classifications refer to any one or more of the industry sub-classifications used by one or more widely recognized market indexes or ratings group indexes, and/or as defined by Fund management. This definition may not apply for purposes of this report, which may combine industry sub-classifications for reporting ease. Industries are shown as a percent of net assets. These industry classifications are based on third party definitions and are unaudited. The definitions are industry terms and do not reflect the legal status of any of the investments or the companies in which the Fund has invested.
See Notes to Financial Statements.
88 | October 31, 2012
Table of Contents
| RiverFront Moderate Growth & Income Fund | ||
Statement of Investments | October 31, 2012 (Unaudited) | |
| Shares | Value (Note 2) | |||
| ||||
COMMON STOCKS (22.30%) | ||||
Basic Materials (0.90%) | ||||
Forest Products & Paper (0.90%) | ||||
MeadWestvaco Corp. | 25,862 | $767,843 | ||
| ||||
TOTAL BASIC MATERIALS | 767,843 | |||
| ||||
Communications (3.91%) | ||||
Media (1.11%) | ||||
Time Warner, Inc. | 21,763 | 945,602 | ||
| ||||
Telecommunications (2.80%) | ||||
BCE, Inc. | 26,200 | 1,143,892 | ||
QUALCOMM, Inc. | 21,126 | 1,237,456 | ||
| ||||
| 2,381,348 | ||||
| ||||
TOTAL COMMUNICATIONS | 3,326,950 | |||
| ||||
Consumer Staples (1.31%) | ||||
Retail (1.31%) | ||||
Wal-Mart Stores, Inc. | 14,812 | 1,111,196 | ||
| ||||
TOTAL CONSUMER STAPLES | 1,111,196 | |||
| ||||
Consumer, Cyclical (3.45%) | ||||
Retail (2.43%) | ||||
McDonald's Corp. | 9,324 | 809,323 | ||
Nordstrom, Inc. | 15,156 | 860,406 | ||
Tiffany & Co. | 6,259 | 395,694 | ||
| ||||
| 2,065,423 | ||||
| ||||
Toys, Games & Hobbies (1.02%) | ||||
Hasbro, Inc. | 24,034 | 864,984 | ||
| ||||
TOTAL CONSUMER, CYCLICAL | 2,930,407 | |||
| ||||
Consumer, Non-cyclical (4.77%) | ||||
Healthcare Products (1.02%) | ||||
Johnson & Johnson | 12,192 | 863,438 | ||
| ||||
Healthcare-Services (1.00%) | ||||
UnitedHealth Group, Inc. | 15,242 | 853,552 | ||
| ||||
Pharmaceuticals (2.75%) | ||||
Merck & Co., Inc. | 28,117 | 1,282,979 | ||
Pfizer, Inc. | 42,357 | 1,053,418 | ||
| ||||
| 2,336,397 | ||||
| ||||
TOTAL CONSUMER, | 4,053,387 | |||
| ||||
| Shares | Value (Note 2) | |||
| ||||
Energy (1.07%) | ||||
Oil & Gas (1.07%) | ||||
Chevron Corp. | 8,294 | $914,082 | ||
| ||||
TOTAL ENERGY | 914,082 | |||
| ||||
Financials (2.07%) | ||||
Insurance (2.07%) | ||||
The Chubb Corp. | 11,476 | 883,423 | ||
MetLife, Inc. | 24,615 | 873,586 | ||
| ||||
| 1,757,009 | ||||
| ||||
TOTAL FINANCIALS | 1,757,009 | |||
| ||||
Industrials (2.57%) | ||||
Aerospace & Defense (0.98%) | ||||
L-3 Communications Holdings, Inc. | 11,266 | 831,431 | ||
| ||||
Engineering & Construction (0.00%)(a) | ||||
Engility Holdings, Inc.(b) | 1 | 19 | ||
| ||||
Miscellaneous Manufacturing (1.59%) | ||||
General Electric Co. | 64,208 | 1,352,220 | ||
| ||||
TOTAL INDUSTRIALS | 2,183,670 | |||
| ||||
Technology (2.25%) | ||||
Computers (1.41%) | ||||
Apple, Inc. | 2,012 | 1,197,341 | ||
| ||||
Software (0.84%) | ||||
CA, Inc. | 31,796 | 716,046 | ||
| ||||
TOTAL TECHNOLOGY | 1,913,387 | |||
| ||||
TOTAL COMMON STOCKS (Cost $16,914,078) | 18,957,931 | |||
| ||||
EXCHANGE TRADED FUNDS (74.05%) | ||||
Aggressive Growth (4.49%) | ||||
Vanguard Dividend Appreciation ETF | 64,715 | 3,813,655 | ||
| ||||
Consumer Staples (0.79%) | ||||
Vanguard Consumer Staples ETF | 7,391 | 669,698 | ||
| ||||
Debt (16.82%) | ||||
iShares® Barclays 1-3 Year Credit Bond Fund | 12,060 | 1,275,948 | ||
iShares® Barclays MBS Bond Fund | 15,694 | 1,707,193 | ||
.
89 | October 31, 2012
Table of Contents
| RiverFront Moderate Growth & Income Fund | ||
Statement of Investments | October 31, 2012 (Unaudited) | |
| Shares | Value (Note 2) | |||
| ||||
Debt (continued) | ||||
iShares® iBoxx $ High Yield Corporate Bond Fund | 46,780 | $4,333,232 | ||
iShares® JPMorgan USD Emerging Markets Bond Fund | 29,366 | 3,571,199 | ||
PowerShares Senior Loan Portfolio | 137,365 | 3,412,147 | ||
| ||||
| 14,299,719 | ||||
| ||||
Emerging Market Equity (8.41%) | ||||
Vanguard MSCI Emerging Markets ETF | 172,406 | 7,153,125 | ||
| ||||
Equity (20.83%) | ||||
Credit Suisse Cushing 30 MLP Index ETN | 34,953 | 878,369 | ||
iShares® Dow Jones US Financial Services Index Fund | 14,870 | 844,467 | ||
iShares® MSCI Pacific ex-Japan Index Fund | 18,825 | 860,303 | ||
iShares® S&P SmallCap 600® Index Fund | 28,712 | 2,162,588 | ||
PowerShares International Dividend Achievers Portfolio | 81,412 | 1,244,789 | ||
PowerShares S&P 500® High Beta Port ETF | 68,437 | 1,397,484 | ||
SPDR® Dow Jones REIT ETF | 26,328 | 1,877,713 | ||
Utilities Select Sector SPDR® Fund(c) | 42,789 | 1,577,630 | ||
Vanguard MSCI European ETF | 149,073 | 6,866,302 | ||
| ||||
| 17,709,645 | ||||
| ||||
Fixed Income/Corporate Bonds (11.68%) | ||||
Vanguard Short-Term Corporate Bond ETF | 122,989 | 9,925,212 | ||
| ||||
Fixed Income/ High Yield (11.03%) | ||||
PowerShares Fundamental High Yield Corporate Bond Portfolio | 79,089 | 1,516,136 | ||
SPDR® Barclays Capital High Yield Bond ETF | 194,947 | 7,862,213 | ||
| ||||
| 9,378,349 | ||||
| ||||
TOTAL EXCHANGE TRADED FUNDS (Cost $61,047,267) | 62,949,403 | |||
| ||||
| Shares | Value (Note 2) | |||||
| ||||||
EXCHANGE TRADED NOTES (1.13%) | ||||||
Master Limited Partnerships (1.13%) | ||||||
UBS E-TRACS Alerian MLP Infrastructure ETN | 28,652 | $962,707 | ||||
| ||||||
TOTAL EXCHANGE TRADED NOTES (Cost $912,575) | 962,707 | |||||
| ||||||
7-Day Yield | Shares | Value (Note 2) | ||||
| ||||||
SHORT TERM INVESTMENTS (2.70%) | ||||||
Money Market Fund (2.70%) | ||||||
Dreyfus Cash | 0.061% | 2,292,192 | 2,292,192 | |||
| ||||||
TOTAL SHORT TERM INVESTMENTS (Cost $2,292,192) | 2,292,192 | |||||
| ||||||
TOTAL INVESTMENTS (100.18%) (Cost $81,166,112) | $85,162,233 | |||||
Liabilities In Excess Of Other | (152,736) | |||||
| ||||||
NET ASSETS (100.00%) | $85,009,497 | |||||
| ||||||
| (a) | Less than 0.005%. |
| (b) | Non-Income Producing Security. |
| (c) | Affiliated Company. See Note 8 to Financial Statements. |
Common Abbreviations:
ETF - Exchange Traded Fund.
ETN - Exchange Traded Note.
MBS - Mortgage-Backed Securities.
MLP - Master Limited Partnership.
MSCI - Morgan Stanley Capital International.
REIT - Real Estate Investment Trust.
S&P - Standard and Poor's.
SPDR - Standard and Poor's Depositary Receipt.
For Fund compliance purposes, the Fund's industry classifications refer to any one or more of the industry sub-classifications used by one or more widely recognized market indexes or ratings group indexes, and/or as defined by Fund management. This definition may not apply for purposes of this report, which may combine industry sub-classifications for reporting ease. Industries are shown as a percent of net assets. These industry classifications are based on third party definitions and are unaudited. The definitions are industry terms and do not reflect the legal status of any of the investments or the companies in which the Fund has invested.
See Notes to Financial Statements.
90 | October 31, 2012
Table of Contents
RiverFront Global Allocation Series | ||
| October 31, 2012 (Unaudited) | ||
| RiverFront Conservative Income Builder Fund | RiverFront Fund | RiverFront Global Allocation Fund | RiverFront Global Growth Fund | RiverFront Fund | ||||||||||||||||
ASSETS | ||||||||||||||||||||
Investments, at value | $ | 663,602 | $ | 26,688,423 | $ | 18,775,206 | $ | 47,707,594 | $ | 83,584,603 | ||||||||||
Investments in affiliates, at value | 4,056 | 638,994 | 329,954 | 914,914 | 1,577,630 | |||||||||||||||
Cash | 0 | 64 | 0 | 594 | 147 | |||||||||||||||
Receivable for shares sold | 0 | 4,561 | 162,874 | 10,848 | 141,286 | |||||||||||||||
Dividends and interest receivable | 77 | 6,613 | 3,177 | 10,123 | 15,721 | |||||||||||||||
Receivable due from advisor | 57 | 0 | 0 | 13,921 | 0 | |||||||||||||||
Prepaid offering costs | 41,778 | 0 | 0 | 0 | 0 | |||||||||||||||
Prepaid expenses and other assets | 9,166 | 26,425 | 25,396 | 48,566 | 46,831 | |||||||||||||||
Total Assets | 718,736 | 27,365,080 | 19,296,607 | 48,706,560 | 85,366,218 | |||||||||||||||
LIABILITIES | ||||||||||||||||||||
Payable for shares redeemed | 0 | 82,530 | 9,172 | 27,119 | 237,213 | |||||||||||||||
Investment advisory fees payable | 0 | 5,125 | 323 | 0 | 40,250 | |||||||||||||||
Administration and transfer agency fees payable | 448 | 2,852 | 2,299 | 4,022 | 8,124 | |||||||||||||||
Distribution and services fees payable | 232 | 13,438 | 8,810 | 8,857 | 43,220 | |||||||||||||||
Trustees’ fees and expenses payable | 20 | 1,162 | 786 | 1,918 | 2,315 | |||||||||||||||
Audit fee payable | 4,149 | 13,984 | 13,984 | 14,146 | 13,984 | |||||||||||||||
Printing fee payable | 13 | 3,059 | 3,361 | 8,773 | 5,857 | |||||||||||||||
Custody fee payable | 1,875 | 3,390 | 3,176 | 4,415 | 3,665 | |||||||||||||||
Overdraft payable | 21,106 | 0 | 0 | 0 | 0 | |||||||||||||||
Accrued expenses and other liabilities | 2,177 | 1,238 | 1,410 | 4,161 | 2,093 | |||||||||||||||
Total Liabilities | 30,020 | 126,778 | 43,321 | 73,411 | 356,721 | |||||||||||||||
NET ASSETS | $ | 688,716 | $ | 27,238,302 | $ | 19,253,286 | $ | 48,633,149 | $ | 85,009,497 | ||||||||||
NET ASSETS CONSIST OF | ||||||||||||||||||||
Paid-in capital | $ | 688,252 | $ | 26,558,593 | $ | 19,026,895 | $ | 43,352,773 | $ | 82,204,139 | ||||||||||
Accumulated net investment income | 1,315 | 74,949 | 139,608 | 494,408 | 187,279 | |||||||||||||||
Accumulated net realized loss on investments | (1,023) | (881,705) | (987,906) | (492,125) | (1,378,042) | |||||||||||||||
Net unrealized appreciation in value on investments | 172 | 1,486,465 | 1,074,689 | 5,278,093 | 3,996,121 | |||||||||||||||
NET ASSETS | $ | 688,716 | $ | 27,238,302 | $ | 19,253,286 | $ | 48,633,149 | $ | 85,009,497 | ||||||||||
INVESTMENTS, AT COST | $ | 663,473 | $ | 25,233,543 | $ | 17,732,807 | $ | 42,501,801 | $ | 79,655,206 | ||||||||||
INVESTMENTS IN AFFILIATES, AT COST | $ | 4,013 | $ | 607,409 | $ | 297,664 | $ | 842,614 | $ | 1,510,906 | ||||||||||
See Notes to Financial Statements.
91 | October 31, 2012
Table of Contents
RiverFront Global Allocation Series | ||
Statements of Assets and Liabilities (continued) | October 31, 2012 (Unaudited) | |
| RiverFront Conservative Income Builder Fund | RiverFront Fund | RiverFront Global Allocation Fund | RiverFront Global Growth Fund | RiverFront & Income Fund | ||||||||||||||||
PRICING OF SHARES | ||||||||||||||||||||
ClassA: | ||||||||||||||||||||
Net Asset Value, offering and redemption price per share(a) | $ | 10.05 | $ | 11.24 | $ | 10.95 | $ | 13.48 | $ | 10.93 | ||||||||||
Net Assets | $ | 73,188 | $ | 6,124,263 | $ | 6,628,225 | $ | 6,819,605 | $ | 23,601,922 | ||||||||||
Shares of beneficial interest out standing (unlimited number of shares, no par value common stock authorized) | 7,280 | 544,815 | 605,509 | 505,872 | 2,158,498 | |||||||||||||||
Maximum offering price per share ((NAV/0.9450), based on maximum sales charge of 5.50% of the offering price) | $ | 10.63 | $ | 11.89 | $ | 11.59 | $ | 14.26 | $ | 11.57 | ||||||||||
Class C: | ||||||||||||||||||||
Net Asset Value, offering and redemption price per share(a) | $ | 10.04 | $ | 11.14 | $ | 10.85 | $ | 13.36 | $ | 10.89 | ||||||||||
Net Assets | $ | 253,442 | $ | 14,131,302 | $ | 8,547,777 | $ | 6,451,207 | $ | 45,082,904 | ||||||||||
Shares of beneficial interest outstanding (unlimited number of shares, no par value common stock authorized) | 25,237 | 1,269,010 | 787,714 | 482,987 | 4,139,180 | |||||||||||||||
Class I: | ||||||||||||||||||||
Net Asset Value, offering and redemption price per share | $ | 10.06 | $ | 11.17 | $ | 10.75 | $ | 13.53 | $ | 10.93 | ||||||||||
Net Assets | $ | 362,086 | $ | 6,982,737 | $ | 4,077,284 | $ | 4,517,044 | $ | 16,324,671 | ||||||||||
Shares of beneficial interest outstanding (unlimited number of shares, no par value common stock authorized) | 36,001 | 625,058 | 379,137 | 333,877 | 1,494,027 | |||||||||||||||
Class L: | ||||||||||||||||||||
Net Asset Value, offering and redemption price per share | N/A | N/A | N/A | $ | 13.50 | N/A | ||||||||||||||
Net Assets | N/A | N/A | N/A | $ | 21,845,434 | N/A | ||||||||||||||
Shares of beneficial interest outstanding (unlimited number of shares, no par value common stock authorized) | N/A | N/A | N/A | 1,617,703 | N/A | |||||||||||||||
Investor Class: | ||||||||||||||||||||
Net Asset Value, offering and redemption price per share | N/A | N/A | N/A | $ | 13.43 | N/A | ||||||||||||||
Net Assets | N/A | N/A | N/A | $ | 8,999,859 | N/A | ||||||||||||||
Shares of beneficial interest outstanding (unlimited number of shares, no par value common stock authorized) | N/A | N/A | N/A | 670,203 | N/A | |||||||||||||||
| (a) | Redemption price per share may be reduced for any applicable contingent deferred sales charge. For a description of a possible sales charge, please see the Fund’s Prospectus. |
See Notes to Financial Statements.
92 | October 31, 2012
Table of Contents
RiverFront Global Allocation Series | ||
| For the Six Months Ended October 31, 2012 (Unaudited) | ||
| RiverFront Conservative Income Builder Fund(a) | RiverFront Fund | RiverFront Global Allocation Fund | RiverFront Global Growth Fund | RiverFront Moderate Growth Fund | ||||||||||||||||
INVESTMENT INCOME | ||||||||||||||||||||
Dividends | $ | 2,498 | $ | 462,649 | $ | 260,176 | $ | 602,720 | $ | 1,323,870 | ||||||||||
Dividends from affiliated securities | 36 | 23,443 | 8,970 | 26,331 | 52,489 | |||||||||||||||
Foreign taxes withheld on dividends | (11) | (1,479) | (427) | (1,261) | (3,943) | |||||||||||||||
Interest and other income | 0 | 160 | 46 | 132 | 339 | |||||||||||||||
Total Investment Income | 2,523 | 484,773 | 268,765 | 627,922 | 1,372,755 | |||||||||||||||
EXPENSES | ||||||||||||||||||||
Investment advisory fees | 818 | 119,533 | 82,699 | 216,660 | 341,782 | |||||||||||||||
Administrative and transfer agency fees | 494 | 16,731 | 12,526 | 30,979 | 45,075 | |||||||||||||||
Distribution and service fees | ||||||||||||||||||||
Class A | 21 | 7,681 | 7,509 | 6,822 | 26,969 | |||||||||||||||
Class C | 320 | 69,479 | 46,209 | 32,717 | 210,374 | |||||||||||||||
Investor Class | N/A | N/A | N/A | 11,658 | N/A | |||||||||||||||
Legal fees | 490 | 1,865 | 1,559 | 4,554 | 4,986 | |||||||||||||||
Audit fees | 4,149 | 8,374 | 8,374 | 8,536 | 8,374 | |||||||||||||||
Reports to shareholders and printing fees | 15 | 5,093 | 4,526 | 11,245 | 9,754 | |||||||||||||||
State registration fees | 0 | 21,032 | 20,768 | 30,709 | 23,168 | |||||||||||||||
Insurance fees | 0 | 676 | 579 | 1,751 | 1,617 | |||||||||||||||
Custody fees | 1,875 | 7,239 | 6,976 | 8,644 | 6,653 | |||||||||||||||
Trustees’ fees and expenses | 20 | 1,788 | 1,187 | 3,031 | 4,177 | |||||||||||||||
Offering costs | 8,535 | 0 | 0 | 0 | 0 | |||||||||||||||
Miscellaneous expenses | 2,180 | 4,516 | 3,904 | 6,510 | 8,909 | |||||||||||||||
Total Expense | 18,917 | 264,007 | 196,816 | 373,816 | 691,838 | |||||||||||||||
Less fees waived/reimbursed by investment advisor | ||||||||||||||||||||
Class A | (1,456) | (11,684) | (15,967) | (18,308) | (19,012) | |||||||||||||||
Class C | (5,740) | (26,513) | (24,181) | (21,914) | (36,935) | |||||||||||||||
Class I | (10,417) | (13,381) | (9,357) | (17,180) | (12,373) | |||||||||||||||
Class L | N/A | N/A | N/A | (75,685) | N/A | |||||||||||||||
Investor Class | N/A | N/A | N/A | (31,209) | N/A | |||||||||||||||
Less fees waived/reimbursed by administrator | ||||||||||||||||||||
Class A | (8) | 0 | 0 | 0 | 0 | |||||||||||||||
Class C | (33) | 0 | 0 | 0 | 0 | |||||||||||||||
Class I | (55) | 0 | 0 | 0 | 0 | |||||||||||||||
Investor Class | N/A | N/A | N/A | 0 | N/A | |||||||||||||||
Net Expenses | 1,208 | 212,429 | 147,311 | 209,520 | 623,518 | |||||||||||||||
Net Investment Income | 1,315 | 272,344 | 121,454 | 418,402 | 749,237 | |||||||||||||||
Net realized gain/(loss) on investments | (1,095) | 275,605 | 97,759 | 935,094 | 348,904 | |||||||||||||||
Net realized gain on investments - affiliated securities | 72 | 63,545 | 42,947 | 128,508 | 136,860 | |||||||||||||||
Net change in unrealized appreciation/(depreciation) on investments | 172 | (451,870) | (183,598) | (1,210,223) | (769,786) | |||||||||||||||
NET REALIZED AND UNREALIZED LOSS ON INVESTMENTS | (851) | (112,720) | (42,892) | (146,621) | (284,022) | |||||||||||||||
NET INCREASE IN NET ASSETS RESULTING FROM OPERATIONS | $ | 464 | $ | 159,624 | $ | 78,562 | $ | 271,781 | $ | 465,215 | ||||||||||
| (a) | For the period August 31, 2012 (Inception) to October 31, 2012. |
See Notes to Financial Statements.
93 | October 31, 2012
Table of Contents
RiverFront Conservative Income Builder Fund | ||
| For the Period August 31, 2012 (Inception) to October 31, 2012 | ||||
OPERATIONS | ||||
Net investment income | $ | 1,315 | ||
Net realized loss on investments | (1,095) | |||
Net realized gain on investments - affiliated securities | 72 | |||
Net change in unrealized appreciation on investments | 172 | |||
Net Increase in Net Assets Resulting from Operations | 464 | |||
BENEFICIAL INTEREST TRANSACTIONS (NOTE 6) | ||||
Shares sold | ||||
Class A | 73,316 | |||
Class C | 254,953 | |||
Class I | 360,009 | |||
Shares redeemed | ||||
Class C | (26) | |||
Net Increase in Net Assets Derived from Beneficial Interest Transactions | 688,252 | |||
Net increase in net assets | 688,716 | |||
NET ASSETS | ||||
Beginning of period | 0 | |||
End of period * | $ | 688,716 | ||
* Including accumulated net investment income of: | $ | 1,315 | ||
See Notes to Financial Statements.
94 | October 31, 2012
Table of Contents
RiverFront Dynamic Equity Income Fund | ||
Statements of Changes in Net Assets | ||
For the Six Months Ended | For the Year Ended April 30, 2012 | |||||||
OPERATIONS | ||||||||
Net investment income | $ | 272,344 | $ | 288,918 | ||||
Net realized gain/(loss) on investments | 275,605 | (1,200,717) | ||||||
Net realized gain/(loss) on investments - affiliated securities | 63,545 | (1,724) | ||||||
Net change in unrealized appreciation/(depreciation) on investments | (451,870) | 646,260 | ||||||
Net Increase/(Decrease) in Net Assets Resulting from Operations | 159,624 | (267,263) | ||||||
DISTRIBUTIONS | ||||||||
Dividends to shareholders from net investment income | ||||||||
Class A | (51,663) | (87,846) | ||||||
Class C | (79,642) | (114,982) | ||||||
Class I | (66,090) | (86,665) | ||||||
Dividends to shareholders from tax return of capital | ||||||||
Class A | 0 | (4,982) | ||||||
Class C | 0 | (6,644) | ||||||
Class I | 0 | (5,785) | ||||||
Net Decrease in Net Assets from Distributions | (197,395) | (306,904) | ||||||
BENEFICIAL INTEREST TRANSACTIONS (NOTE 6) | ||||||||
Shares sold | ||||||||
Class A | 1,040,382 | 5,884,180 | ||||||
Class C | 2,162,637 | 6,381,158 | ||||||
Class I | 1,600,905 | 5,159,764 | ||||||
Dividends reinvested | ||||||||
Class A | 48,290 | 89,572 | ||||||
Class C | 74,910 | 114,439 | ||||||
Class I | 61,972 | 88,904 | ||||||
Shares redeemed | ||||||||
Class A | (2,018,716) | (4,149,403) | ||||||
Class C | (1,840,021) | (1,768,723) | ||||||
Class I | (1,594,791) | (1,732,169) | ||||||
Net Increase/(Decrease) in Net Assets Derived from Beneficial Interest Transactions | (464,432) | 10,067,722 | ||||||
Net increase/(decrease) in net assets | (502,203) | 9,493,555 | ||||||
NET ASSETS | ||||||||
Beginning of period | 27,740,505 | 18,246,950 | ||||||
End of period * | $ | 27,238,302 | $ | 27,740,505 | ||||
*Including accumulated net investment income of: | $ | 74,949 | $ | 0 | ||||
See Notes to Financial Statements.
95 | October 31, 2012
Table of Contents
RiverFront Global Allocation Fund | ||
| Statements of Changes in Net Assets |
For the Six Months Ended | For the Year Ended April 30, 2012 | |||||||
OPERATIONS | ||||||||
Net investment income | $ | 121,454 | $ | 134,141 | ||||
Net realized gain/(loss) on investments | 97,759 | (1,083,285) | ||||||
Net realized gain/(loss) on investments - affiliated securities | 42,947 | (41,025) | ||||||
Net change in unrealized appreciation/(depreciation) on investments | (183,598) | 342,565 | ||||||
Net Increase/(Decrease) in Net Assets Resulting from Operations | 78,562 | (647,604) | ||||||
DISTRIBUTIONS | ||||||||
Dividends to shareholders from net investment income | ||||||||
Class A | 0 | (60,313) | ||||||
Class C | 0 | (22,209) | ||||||
Class I | 0 | (32,904) | ||||||
Dividends to shareholders from net realized gains | ||||||||
Class A | 0 | (5,804) | ||||||
Class C | 0 | (6,150) | ||||||
Class I | 0 | (2,718) | ||||||
Net Decrease in Net Assets from Distributions | 0 | (130,098) | ||||||
BENEFICIAL INTEREST TRANSACTIONS (NOTE 6) | ||||||||
Shares sold | ||||||||
Class A | 1,431,543 | 6,877,768 | ||||||
Class C | 872,601 | 4,698,847 | ||||||
Class I | 1,600,444 | 4,167,358 | ||||||
Dividends reinvested | ||||||||
Class A | 0 | 62,009 | ||||||
Class C | 0 | 26,544 | ||||||
Class I | 0 | 35,623 | ||||||
Shares redeemed | ||||||||
Class A | (650,863) | (5,737,887) | ||||||
Class C | (2,242,641) | (3,041,562) | ||||||
Class I | (1,014,480) | (2,650,489) | ||||||
Net Increase/(Decrease) in Net Assets Derived from Beneficial Interest Transactions | (3,396) | 4,438,211 | ||||||
Net increase in net assets | 75,166 | 3,660,509 | ||||||
NET ASSETS | ||||||||
Beginning of period | 19,178,120 | 15,517,611 | ||||||
End of period * | $ | 19,253,286 | $ | 19,178,120 | ||||
*Including accumulated net investment income of: | $ | 139,608 | $ | 18,154 | ||||
See Notes to Financial Statements.
96 | October 31, 2012
Table of Contents
RiverFront Global Growth Fund | ||
Statements of Changes in Net Assets |
For the Six Months Ended October 31, 2012 (Unaudited) | For the Year Ended April 30, 2012 | |||||||
OPERATIONS | ||||||||
Net investment income | $ | 418,402 | $ | 657,945 | ||||
Net realized gain/(loss) on investments | 935,094 | (1,277,446) | ||||||
Net realized gain/(loss) on investments - affiliated securities | 128,508 | (186,041) | ||||||
Net change in unrealized depreciation on investments | (1,210,223) | (6,929,668) | ||||||
Net Increase/(Decrease) in Net Assets Resulting from Operations | 271,781 | (7,735,210) | ||||||
DISTRIBUTIONS | ||||||||
Dividends to shareholders from net investment income | ||||||||
Class A | 0 | (68,584) | ||||||
Class C | 0 | (36,657) | ||||||
Class I | 0 | (67,523) | ||||||
Class L | 0 | (306,995) | ||||||
Investor Class | 0 | (115,639) | ||||||
Dividends to shareholders from net realized gains | ||||||||
Class A | 0 | (420,162) | ||||||
Class C | 0 | (428,017) | ||||||
Class I | 0 | (367,485) | ||||||
Class L | 0 | (1,570,587) | ||||||
Investor Class | 0 | (705,783) | ||||||
Net Decrease in Net Assets from Distributions | 0 | (4,087,432) | ||||||
BENEFICIAL INTEREST TRANSACTIONS (NOTE 6) | ||||||||
Shares sold | ||||||||
Class A | 2,339,185 | 2,906,251 | ||||||
Class C | 913,773 | 3,379,153 | ||||||
Class I | 353,345 | 3,272,520 | ||||||
Class L | 723,990 | 7,116,023 | ||||||
Investor Class | 100,650 | 335,689 | ||||||
Dividends reinvested | ||||||||
Class A | 0 | 475,706 | ||||||
Class C | 0 | 455,331 | ||||||
Class I | 0 | 426,249 | ||||||
Class L | 0 | 1,789,306 | ||||||
Investor Class | 0 | 755,405 | ||||||
Shares redeemed | ||||||||
Class A | (780,664) | (8,714,023) | ||||||
Class C | (1,295,133) | (2,177,829) | ||||||
Class I | (1,877,525) | (1,484,244) | ||||||
Class L | (3,799,638) | (21,589,251) | ||||||
Investor Class | (1,285,989) | (9,371,913) | ||||||
Net Decrease in Net Assets Derived from Beneficial Interest Transactions | (4,608,006) | (22,425,627) | ||||||
Net decrease in net assets | (4,336,225) | (34,248,269) | ||||||
NET ASSETS | ||||||||
Beginning of period | 52,969,374 | 87,217,643 | ||||||
End of period * | $ | 48,633,149 | $ | 52,969,374 | ||||
*Including accumulated net investment income of: | $ | 494,408 | $ | 76,006 | ||||
See Notes to Financial Statements.
97 | October 31, 2012
Table of Contents
RiverFront Moderate Growth & Income Fund | ||
Statements of Changes in Net Assets | ||
For the Six Months Ended October 31, 2012 (Unaudited) | For the Year Ended April 30, 2012 | |||||||
OPERATIONS | ||||||||
Net investment income | $ | 749,237 | $ | 733,268 | ||||
Net realized loss on investments | (1,081,096) | (1,821,063) | ||||||
Net realized gain on investments - affiliated securities | 1,566,860 | 0 | ||||||
Net change in unrealized appreciation/(depreciation) on investments | (769,786) | 2,293,075 | ||||||
Net Increase in Net Assets Resulting from Operations | 465,215 | 1,205,280 | ||||||
DISTRIBUTIONS | ||||||||
Dividends to shareholders from net investment income | ||||||||
Class A | (186,095) | (264,650) | ||||||
Class C | (243,577) | (296,849) | ||||||
Class I | (132,286) | (197,488) | ||||||
Dividends to shareholders from tax return of capital | ||||||||
Class A | 0 | (8,956) | ||||||
Class C | 0 | (11,913) | ||||||
Class I | 0 | (6,512) | ||||||
Net Decrease in Net Assets from Distributions | (561,958) | (786,368) | ||||||
BENEFICIAL INTEREST TRANSACTIONS (NOTE 6) | ||||||||
Shares sold | ||||||||
Class A | 5,121,293 | 14,528,189 | ||||||
Class C | 9,726,527 | 21,335,610 | ||||||
Class I | 6,245,803 | 11,507,426 | ||||||
Dividends reinvested | ||||||||
Class A | 167,665 | 247,545 | ||||||
Class C | 198,275 | 249,701 | ||||||
Class I | 118,652 | 183,575 | ||||||
Shares redeemed | ||||||||
Class A | (2,410,930) | (6,318,830) | ||||||
Class C | (3,809,914) | (6,776,170) | ||||||
Class I | (2,900,890) | (6,470,194) | ||||||
Net Increase in Net Assets Derived from Beneficial Interest Transactions | 12,456,481 | 28,486,852 | ||||||
Net increase in net assets | 12,359,738 | 28,905,764 | ||||||
NET ASSETS | ||||||||
Beginning of period | 72,649,759 | 43,743,995 | ||||||
End of period * | $ | 85,009,497 | $ | 72,649,759 | ||||
*Including accumulated net investment income of: | $ | 187,279 | $ | 0 | ||||
See Notes to Financial Statements.
98 | October 31, 2012
Table of Contents
RiverFront Conservative Income Builder Fund – Class A | ||
| Selected data for a share of beneficial interest outstanding throughout the periods indicated: | ||
For the Period August 31, 2012 (Inception) to October 31, 2012 (Unaudited) | ||
Net asset value, beginning of period | $10.00 | |
INCOME/(LOSS) FROM INVESTMENT OPERATIONS: | ||
Net investment income(a) | 0.02 | |
Net realized and unrealized gain | 0.03 | |
Total from investment operations | 0.05 | |
Net increase in net asset value | 0.05 | |
Net asset value, end of period | $10.05 | |
TOTAL RETURN(b) | 0.50% | |
RATIOS/SUPPLEMENTAL DATA: | ||
Net assets, end of period (000s) | $73 | |
Ratio of expenses to average net assets excluding fee waivers and reimbursements | 18.73%(c) | |
Ratio of expenses to average net assets including fee waivers and reimbursements | 1.15%(c) | |
Ratio of net investment income to average net assets | 1.19%(c) | |
Portfolio turnover rate(d) | 12% | |
| (a) | Calculated using the average shares method. |
| (b) | Total returns are for the period indicated and have not been annualized. Total returns would have been lower had certain expenses not been waived during the period. Returns shown do not reflect the deduction of taxes that a shareholder would pay on Fund distributions or the redemption of Fund shares. Returns shown exclude any applicable sales charges. |
| (c) | Annualized. |
| (d) | Portfolio turnover rate for periods less than one full year have not been annualized. |
See Notes to Financial Statements.
99 | October 31, 2012
Table of Contents
RiverFront Conservative Income Builder Fund – Class C | ||
Financial Highlights | Selected data for a share of beneficial interest outstanding throughout the periods indicated: | |
For the Period August 31, 2012 (Inception) to October 31, 2012 (Unaudited) | ||
Net asset value, beginning of period | $10.00 | |
INCOME/(LOSS) FROM INVESTMENT OPERATIONS: | ||
Net investment income(a) | 0.01 | |
Net realized and unrealized gain | 0.03 | |
Total from investment operations | 0.04 | |
Net increase in net asset value | 0.04 | |
Net asset value, end of period | $10.04 | |
TOTAL RETURN(b) | 0.40% | |
RATIOS/SUPPLEMENTAL DATA: | ||
Net assets, end of period (000s) | $253 | |
Ratio of expenses to average net assets excluding fee waivers and reimbursements | 19.92%(c) | |
Ratio of expenses to average net assets including fee waivers and reimbursements | 1.90%(c) | |
Ratio of net investment income to average net assets | 0.80%(c) | |
Portfolio turnover rate(d) | 12% | |
| (a) | Calculated using the average shares method. |
| (b) | Total returns are for the period indicated and have not been annualized. Total returns would have been lower had certain expenses not been waived during the period. Returns shown do not reflect the deduction of taxes that a shareholder would pay on Fund distributions or the redemption of Fund shares. Returns shown exclude any applicable sales charges. |
| (c) | Annualized. |
| (d) | Portfolio turnover rate for periods less than one full year have not been annualized. |
See Notes to Financial Statements.
100 | October 31, 2012
Table of Contents
RiverFront Conservative Income Builder Fund – Class I | ||
Financial Highlights | Selected data for a share of beneficial interest outstanding throughout the periods indicated: | |
For the Period August 31, 2012 (Inception) to October 31, 2012 (Unaudited) | ||
Net asset value, beginning of period | $10.00 | |
INCOME/(LOSS) FROM INVESTMENT OPERATIONS: | ||
Net investment income(a) | 0.03 | |
Net realized and unrealized gain | 0.03 | |
Total from investment operations | 0.06 | |
Net increase in net asset value | 0.06 | |
Net asset value, end of period | $10.06 | |
TOTAL RETURN(b) | 0.60% | |
RATIOS/SUPPLEMENTAL DATA: | ||
Net assets, end of period (000s) | $362 | |
Ratio of expenses to average net assets excluding fee waivers and reimbursements | 19.64%(c) | |
Ratio of expenses to average net assets including fee waivers and reimbursements | 0.90%(c) | |
Ratio of net investment income to average net assets | 1.72%(c) | |
Portfolio turnover rate(d) | 12% | |
| (a) | Calculated using the average shares method. |
| (b) | Total returns are for the period indicated and have not been annualized. Total returns would have been lower had certain expenses not been waived during the period. Returns shown do not reflect the deduction of taxes that a shareholder would pay on Fund distributions or the redemption of Fund shares. |
| (c) | Annualized. |
| (d) | Portfolio turnover rate for periods less than one full year have not been annualized. |
See Notes to Financial Statements.
101 | October 31, 2012
Table of Contents
RiverFront Dynamic Equity Income Fund – Class A | ||
Financial Highlights | Selected data for a share of beneficial interest outstanding throughout the periods indicated: | |
For the Six Months Ended | For the Year Ended April 30, 2012 (a) | For the Period (Inception) to | ||||
Net asset value, beginning of period | $11.24 | $11.73 | $10.00 | |||
INCOME/(LOSS) FROM INVESTMENT OPERATIONS: | ||||||
Net investment income(b) | 0.13 | 0.16 | 0.12 | |||
Net realized and unrealized gain/(loss) | (0.03) | (0.49) | 1.67 | |||
Total from investment operations | 0.10 | (0.33) | 1.79 | |||
DISTRIBUTIONS: | ||||||
From net investment income | (0.10) | (0.15) | (0.06) | |||
From net realized gains | – | – | (0.00)(c) | |||
Tax return of capital | – | (0.01) | (0.00)(c) | |||
Total distributions | (0.10) | (0.16) | (0.06) | |||
Net increase/(decrease) in net asset value | – | (0.49) | 1.73 | |||
Net asset value, end of period | $11.24 | $11.24 | $11.73 | |||
TOTAL RETURN(d) | 0.88% | (2.80)% | 17.99% | |||
RATIOS/SUPPLEMENTAL DATA: | ||||||
Net assets, end of period (000s) | $6,124 | $7,114 | $5,723 | |||
Ratio of expenses to average net assets excluding fee waivers and reimbursements | 1.63%(e) | 1.73% | 2.17%(e) | |||
Ratio of expenses to average net assets including fee waivers and reimbursements | 1.25%(e)(g) | 1.30% | 1.30%(e) | |||
Ratio of net investment income to average net assets | 2.34%(e) | 1.50% | 1.48%(e) | |||
Portfolio turnover rate(f) | 57% | 133% | 66% | |||
| (a) | Prior to January 1, 2012, the RiverFront Dynamic Equity Income Fund was known as the RiverFront Long-Term Growth & Income Fund. |
| (b) | Calculated using the average shares method. |
| (c) | Less than ($0.005) per share. |
| (d) | Total returns are for the period indicated and have not been annualized. Total returns would have been lower had certain expenses not been waived during the period. Returns shown do not reflect the deduction of taxes that a shareholder would pay on Fund distributions or the redemption of Fund shares. Returns shown exclude any applicable sales charges. |
| (e) | Annualized. |
| (f) | Portfolio turnover rate for periods less than one full year have not been annualized. |
| (g) | Effective September 1, 2012, the net expense ratio changed from 1.30% to 1.15% (exclusive of distribution and service (12b-1) fees, shareholder service fees, acquired fund fees and expenses, brokerage expenses, interest expense, short sale dividend expense, taxes and extraordinary expenses). |
See Notes to Financial Statements.
102 | October 31, 2012
Table of Contents
RiverFront Dynamic Equity Income Fund – Class C | ||
Financial Highlights | Selected data for a share of beneficial interest outstanding throughout the periods indicated: | |
For the Six Months Ended (Unaudited) | For the Year Ended April 30, 2012(a) | For the Period (Inception) to | ||||
Net asset value, beginning of period | $11.14 | $11.67 | $10.00 | |||
INCOME/(LOSS) FROM INVESTMENT OPERATIONS: | ||||||
Net investment income(b) | 0.09 | 0.09 | 0.05 | |||
Net realized and unrealized gain/(loss) | (0.03) | (0.51) | 1.67 | |||
Total from investment operations | 0.06 | (0.42) | 1.72 | |||
DISTRIBUTIONS: | ||||||
From net investment income | (0.06) | (0.10) | (0.05) | |||
From net realized gains | – | – | (0.00)(c) | |||
Tax return of capital | – | (0.01) | (0.00)(c) | |||
Total distributions | (0.06) | (0.11) | (0.05) | |||
Net increase/(decrease) in net asset value | – | (0.53) | 1.67 | |||
Net asset value, end of period | $11.14 | $11.14 | $11.67 | |||
TOTAL RETURN(d) | 0.59% | (3.60)% | 17.32% | |||
RATIOS/SUPPLEMENTAL DATA: | ||||||
Net assets, end of period (000s) | $14,131 | $13,729 | $9,223 | |||
Ratio of expenses to average net assets excluding fee waivers and reimbursements | 2.38%(e) | 2.49% | 3.10%(e) | |||
Ratio of expenses to average net assets including fee waivers and reimbursements | 2.00%(e)(g) | 2.05% | 2.05%(e) | |||
Ratio of net investment income to average net assets | 1.59%(e) | 0.84% | 0.65%(e) | |||
Portfolio turnover rate(f) | 57% | 133% | 66% | |||
| (a) | Prior to January 1, 2012, the RiverFront Dynamic Equity Income Fund was known as the RiverFront Long-Term Growth & Income Fund. |
| (b) | Calculated using the average shares method. |
| (c) | Less than ($0.005) per share. |
| (d) | Total returns are for the period indicated and have not been annualized. Total returns would have been lower had certain expenses not been waived during the period. Returns shown do not reflect the deduction of taxes that a shareholder would pay on Fund distributions or the redemption of Fund shares. Returns shown exclude any applicable sales charges. |
| (e) | Annualized. |
| (f) | Portfolio turnover rate for periods less than one full year have not been annualized. |
| (g) | Effective September 1, 2012, the net expense ratio changed from 2.05% to 1.90% (exclusive of distribution and service (12b-1) fees, shareholder service fees, acquired fund fees and expenses, brokerage expenses, interest expense, short sale dividend expense, taxes and extraordinary expenses). |
See Notes to Financial Statements.
103 | October 31, 2012
Table of Contents
RiverFront Dynamic Equity Income Fund – Class I | ||
Financial Highlights | Selected data for a share of beneficial interest outstanding throughout the periods indicated: | |
For the Six Months Ended (Unaudited) | For the Year Ended April 30, 2012(a) | For the Period (Inception) to | ||||
Net asset value, beginning of period | $11.17 | $11.64 | $10.00 | |||
INCOME/(LOSS) FROM INVESTMENT OPERATIONS: | ||||||
Net investment income(b) | 0.14 | 0.20 | 0.12 | |||
Net realized and unrealized gain/(loss) | (0.03) | (0.50) | 1.68 | |||
Total from investment operations | 0.11 | (0.30) | 1.80 | |||
DISTRIBUTIONS: | ||||||
From net investment income | (0.11) | (0.16) | (0.15) | |||
From net realized gains | – | – | (0.00)(c) | |||
Tax return of capital | – | (0.01) | (0.01) | |||
Total distributions | (0.11) | (0.17) | (0.16) | |||
Net increase/(decrease) in net asset value | – | (0.47) | 1.64 | |||
Net asset value, end of period | $11.17 | $11.17 | $11.64 | |||
TOTAL RETURN(d) | 0.98% | (2.58)% | 18.21% | |||
RATIOS/SUPPLEMENTAL DATA: | ||||||
Net assets, end of period (000s) | $6,983 | $6,897 | $3,301 | |||
Ratio of expenses to average net assets excluding fee waivers and reimbursements | 1.38%(e) | 1.49% | 2.44%(e) | |||
Ratio of expenses to average net assets including fee waivers and reimbursements | 1.00%(e)(g) | 1.05% | 1.05%(e) | |||
Ratio of net investment income to average net assets | 2.56%(e) | 1.88% | 1.49%(e) | |||
Portfolio turnover rate(f) | 57% | 133% | 66% | |||
| (a) | Prior to January 1, 2012, the RiverFront Dynamic Equity Income Fund was known as the RiverFront Long-Term Growth & Income Fund. |
| (b) | Calculated using the average shares method. |
| (c) | Less than ($0.005) per share. |
| (d) | Total returns are for the period indicated and have not been annualized. Total returns would have been lower had certain expenses not been waived during the period. Returns shown do not reflect the deduction of taxes that a shareholder would pay on Fund distributions or the redemption of Fund shares. |
| (e) | Annualized. |
| (f) | Portfolio turnover rate for periods less than one full year have not been annualized. |
| (g) | Effective September 1, 2012, the net expense ratio changed from 1.05% to 0.90% (exclusive of distribution and service (12b-1) fees, shareholder service fees, acquired fund fees and expenses, brokerage expenses, interest expense, short sale dividend expense, taxes and extraordinary expenses). |
See Notes to Financial Statements.
104 | October 31, 2012
Table of Contents
RiverFront Global Allocation Fund – Class A | ||
Financial Highlights | Selected data for a share of beneficial interest outstanding throughout the periods indicated: | |
For the (Unaudited) | For the Year Ended April 30, 2012(a) | For the Period (Inception) to | ||||
Net asset value, beginning of period | $10.86 | $11.66 | $10.00 | |||
INCOME/(LOSS) FROM INVESTMENT OPERATIONS: | ||||||
Net investment income(b) | 0.09 | 0.12 | 0.10 | |||
Net realized and unrealized gain/(loss) | (0.00)(c) | (0.84) | 1.61 | |||
Total from investment operations | 0.09 | (0.72) | 1.71 | |||
DISTRIBUTIONS: | ||||||
From net investment income | – | (0.07) | (0.05) | |||
From net realized gains | – | (0.01) | – | |||
Total distributions | – | (0.08) | (0.05) | |||
Net increase/(decrease) in net asset value | 0.09 | (0.80) | 1.66 | |||
Net asset value, end of period | $10.95 | $10.86 | $11.66 | |||
TOTAL RETURN(d) | 0.83% | (6.18)% | 17.12% | |||
RATIOS/SUPPLEMENTAL DATA: | ||||||
Net assets, end of period (000s) | $6,628 | $5,791 | $4,686 | |||
Ratio of expenses to average net assets excluding fee waivers and reimbursements | 1.78%(e) | 1.80% | 3.00%(e) | |||
Ratio of expenses to average net assets including fee waivers and reimbursements | 1.25%(e)(g) | 1.30% | 1.30%(e) | |||
Ratio of net investment income to average net assets | 1.61%(e) | 1.10% | 1.16%(e) | |||
Portfolio turnover rate(f) | 50% | 163% | 77% | |||
| (a) | Prior to January 1, 2012, the RiverFront Global Allocation Fund was known as the RiverFront Moderate Growth Fund. |
| (b) | Calculated using the average shares method. |
| (c) | Less than ($0.005) per share. |
| (d) | Total returns are for the period indicated and have not been annualized. Total returns would have been lower had certain expenses not been waived during the period. Returns shown do not reflect the deduction of taxes that a shareholder would pay on Fund distributions or the redemption of Fund shares. Returns shown exclude any applicable sales charges. |
| (e) | Annualized. |
| (f) | Portfolio turnover rate for periods less than one full year have not been annualized. |
| (g) | Effective September 1, 2012, the net expense ratio limitation changed from 1.30% to 1.15% (exclusive of distribution and service (12b-1) fees, shareholder service fees, acquired fund fees and expenses, brokerage expenses, interest expense, short sale dividend expense, taxes and extraordinary expenses). |
See Notes to Financial Statements.
105 | October 31, 2012
Table of Contents
RiverFront Global Allocation Fund – Class C | ||
Financial Highlights | Selected data for a share of beneficial interest outstanding throughout the periods indicated: | |
For the Six Months Ended (Unaudited) | For the Year Ended April 30, 2012(a) | For the Period (Inception) to | ||||
Net asset value, beginning of period | $10.81 | $11.64 | $10.00 | |||
INCOME/(LOSS) FROM INVESTMENT OPERATIONS: | ||||||
Net investment income(b) | 0.05 | 0.02 | 0.00(c) | |||
Net realized and unrealized gain/(loss) | (0.01) | (0.82) | 1.65 | |||
Total from investment operations | 0.04 | (0.80) | 1.65 | |||
DISTRIBUTIONS: | ||||||
From net investment income | – | (0.02) | (0.01) | |||
From net realized gains | – | (0.01) | – | |||
Total distributions | – | (0.03) | (0.01) | |||
Net increase/(decrease) in net asset value | 0.04 | (0.83) | 1.64 | |||
Net asset value, end of period | $10.85 | $10.81 | $11.64 | |||
TOTAL RETURN(d) | 0.37% | (6.86)% | 16.52% | |||
RATIOS/SUPPLEMENTAL DATA: | ||||||
Net assets, end of period (000s) | $8,548 | $9,891 | $8,926 | |||
Ratio of expenses to average net assets excluding fee waivers and reimbursements | 2.53%(e) | 2.58% | 3.21%(e) | |||
Ratio of expenses to average net assets including fee waivers and reimbursements | 2.00%(e)(g) | 2.05% | 2.05%(e) | |||
Ratio of net investment income to average net assets | 0.87%(e) | 0.17% | 0.04%(e) | |||
Portfolio turnover rate(f) | 50% | 163% | 77% | |||
| (a) | Prior to January 1, 2012, the RiverFront Global Allocation Fund was known as the RiverFront Moderate Growth Fund. |
| (b) | Calculated using the average shares method. |
| (c) | Less than $0.005per share. |
| (d) | Total returns are for the period indicated and have not been annualized. Total returns would have been lower had certain expenses not been waived during the period. Returns shown do not reflect the deduction of taxes that a shareholder would pay on Fund distributions or the redemption of Fund shares. Returns shown exclude any applicable sales charges. |
| (e) | Annualized. |
| (f) | Portfolio turnover rate for periods less than one full year have not been annualized. |
| (g) | Effective September 1, 2012, the net expense ratio limitation changed from 2.05% to 1.90% (exclusive of distribution and service (12b-1) fees, shareholder service fees, acquired fund fees and expenses, brokerage expenses, interest expense, short sale dividend expense, taxes and extraordinary expenses). |
See Notes to Financial Statements.
106 | October 31, 2012
Table of Contents
RiverFront Global Allocation Fund – Class I | ||
Financial Highlights | Selected data for a share of beneficial interest outstanding throughout the periods indicated: | |
For the (Unaudited) | For the Year Ended April 30, 2012(a) | For the Period (Inception) to | ||||
Net asset value, beginning of period | $10.66 | $11.42 | $10.00 | |||
INCOME/(LOSS) FROM INVESTMENT OPERATIONS: | ||||||
Net investment income(b) | 0.10 | 0.13 | 0.08 | |||
Net realized and unrealized gain/(loss) | (0.01) | (0.80) | 1.62 | |||
Total from investment operations | 0.09 | (0.67) | 1.70 | |||
DISTRIBUTIONS: | ||||||
From net investment income | – | (0.08) | (0.28) | |||
From net realized gains | – | (0.01) | – | |||
Total distributions | – | (0.09) | (0.28) | |||
Net increase/(decrease) in net asset value | 0.09 | (0.76) | 1.42 | |||
Net asset value, end of period | $10.75 | $10.66 | $11.42 | |||
TOTAL RETURN(c) | 0.84% | (5.86)% | 17.20% | |||
RATIOS/SUPPLEMENTAL DATA: | ||||||
Net assets, end of period (000s) | $4,077 | $3,496 | $1,905 | |||
Ratio of expenses to average net assets excluding fee waivers and reimbursements | 1.53%(d) | 1.55% | 4.68%(d) | |||
Ratio of expenses to average net assets including fee waivers and reimbursements | 1.00%(d)(f) | 1.05% | 1.05%(d) | |||
Ratio of net investment income to average net assets | 1.90%(d) | 1.28% | 0.98%(d) | |||
Portfolio turnover rate(e) | 50% | 163% | 77% | |||
| (a) | Prior to January 1, 2012, the RiverFront Global Allocation Fund was known as the RiverFront Moderate Growth Fund. |
| (b) | Calculated using the average shares method. |
| (c) | Total returns are for the period indicated and have not been annualized. Total returns would have been lower had certain expenses not been waived during the period. Returns shown do not reflect the deduction of taxes that a shareholder would pay on Fund distributions or the redemption of Fund shares. |
| (d) | Annualized. |
| (e) | Portfolio turnover rate for periods less than one full year have not been annualized. |
| (f) | Effective September 1, 2012, the net expense ratio limitation changed from 1.05% to 0.90% (exclusive of distribution and service (12b-1) fees, shareholder service fees, acquired fund fees and expenses, brokerage expenses, interest expense, short sale dividend expense, taxes and extraordinary expenses). |
See Notes to Financial Statements.
107 | October 31, 2012
Table of Contents
RiverFront Global Growth Fund – Class A | ||
Financial Highlights | Selected data for a share of beneficial interest outstanding throughout the periods indicated: | |
| For the Six Months Ended October 31, 2012 (Unaudited) | For the Year Ended April 30, 2012(a) | For the Period January 1, 2011 to April 30, 2011(b) | For the Period September 27, 2010 (Inception) to December 31, 2010 | |||||
Net asset value, beginning of period | $13.37 | $15.65 | $14.66 | $13.68 | ||||
INCOME/(LOSS) FROM INVESTMENT OPERATIONS: | ||||||||
Net investment income after reimbursements(c) | 0.11 | 0.14 | 0.00(d) | 0.23 | ||||
Net realized and unrealized | – | (1.41) | 0.99 | 1.03 | ||||
Total from investment operations | 0.11 | (1.27) | 0.99 | 1.26 | ||||
DISTRIBUTIONS: | ||||||||
From net investment income | – | (0.14) | – | (0.14) | ||||
From net realized gains | – | (0.87) | – | (0.14) | ||||
Total distributions | – | (1.01) | – | (0.28) | ||||
Net increase/(decrease) in net asset value | 0.11 | (2.28) | 0.99 | 0.98 | ||||
Net asset value, end of period | $13.48 | $13.37 | $15.65 | $14.66 | ||||
TOTAL RETURN(e) | 0.82% | (7.51)% | 6.75% | 9.22% | ||||
RATIOS/SUPPLEMENTAL DATA: | ||||||||
Net assets, end of period (000s) | $6,820 | $5,241 | $12,307 | $1,934 | ||||
Ratio of expenses to average net assets excluding fee waivers and reimbursements | 1.57%(f) | 1.52% | 1.58%(f) | 2.15%(f) | ||||
Ratio of expenses to average net assets including fee waivers and reimbursements (includes acquired fund fee reimbursements) | 0.90%(f) | 0.92% | 0.81%(f) | 0.91%(f) | ||||
Ratio of expenses to average net assets including fee waivers and reimbursements (excludes acquired fund fee reimbursements) | 1.15%(f) | 1.15% | 1.15%(f) | 1.15%(f) | ||||
Ratio of net investment income to average net assets | 1.63%(f) | 0.99% | 0.06%(f) | 6.20%(f) | ||||
Portfolio turnover | 43% | 119% | 34% | 99% | ||||
| (a) | Prior to January 1, 2012, the RiverFront Global Growth Fund was known as the RiverFront Long-Term Growth Fund. |
| (b) | Effective March 8, 2011, the Board approved changing the fiscal year-end of the Fund from December 31 to April 30. |
| (c) | Calculated using the average shares method. |
| (d) | Less than $0.005per share. |
| (e) | Total returns are for the period indicated and have not been annualized. Total returns would have been lower had certain expenses not been waived during the period. Returns shown do not reflect the deduction of taxes that a shareholder would pay on Fund distributions or the redemption of Fund shares. Returns shown exclude any applicable sales charges. |
| (f) | Annualized. |
| (g) | Portfolio turnover rate for periods less than one full year have not been annualized. |
See Notes to Financial Statements.
108 | October 31, 2012
Table of Contents
RiverFront Global Growth Fund – Class C | ||
Financial Highlights | Selected data for a share of beneficial interest outstanding throughout the periods indicated: | |
| For the Six Months Ended October 31, 2012 (Unaudited) | For the Year Ended April 30, 2012(a) | For the Period January 1, 2011 to April 30, 2011(b) | For the Period September 27, 2010 (Inception) to December 31, 2010 | |||||
Net asset value, beginning of period | $13.29 | $15.60 | $14.63 | $13.68 | ||||
INCOME/(LOSS) FROM INVESTMENT OPERATIONS: | ||||||||
Net investment | 0.06 | 0.05 | (0.04) | 0.20 | ||||
Net realized and unrealized | 0.01 | (1.42) | 1.01 | 1.02 | ||||
Total from investment operations | 0.07 | (1.37) | 0.97 | 1.22 | ||||
DISTRIBUTIONS: | ||||||||
From net investment income | – | (0.07) | – | (0.13) | ||||
From net realized gains | – | (0.87) | – | (0.14) | ||||
Total distributions | – | (0.94) | – | (0.27) | ||||
Net increase/(decrease) in net asset value | 0.07 | (2.31) | 0.97 | 0.95 | ||||
Net asset value, end of period | $13.36 | $13.29 | $15.60 | $14.63 | ||||
TOTAL RETURN(d) | 0.53% | (8.22)% | 6.63% | 8.91% | ||||
RATIOS/SUPPLEMENTAL DATA: | ||||||||
Net assets, end of period (000s) | $6,451 | $6,808 | $6,156 | $2,050 | ||||
Ratio of expenses to average net assets excluding fee waivers and reimbursements | 2.31%(e) | 2.29% | 2.33%(e) | 2.89%(e) | ||||
Ratio of expenses to average net assets including fee waivers and reimbursements (includes acquired fund fee reimbursements) | 1.65%(e) | 1.67% | 1.55%(e) | 1.66%(e) | ||||
Ratio of expenses to average net assets including fee waivers and reimbursements (excludes acquired fund fee reimbursements) | 1.90%(e) | 1.90% | 1.90%(e) | 1.90%(e) | ||||
Ratio of net investment income/(loss) to average net assets | 0.91%(e) | 0.34% | (0.72)%(e) | 5.36%(e) | ||||
Portfolio turnover | 43% | 119% | 34% | 99% | ||||
| (a) | Prior to January 1, 2012, the RiverFront Global Growth Fund was known as the RiverFront Long-Term Growth Fund. |
| (b) | Effective March 8, 2011, the Board approved changing the fiscal year-end of the Fund from December 31 to April 30. |
| (c) | Calculated using the average shares method. |
| (d) | Total returns are for the period indicated and have not been annualized. Total returns would have been lower had certain expenses not been waived during the period. Returns shown do not reflect the deduction of taxes that a shareholder would pay on Fund distributions or the redemption of Fund shares. Returns shown exclude any applicable sales charges. |
| (e) | Annualized. |
| (f) | Portfolio turnover rate for periods less than one full year have not been annualized. |
See Notes to Financial Statements.
109 | October 31, 2012
Table of Contents
RiverFront Global Growth Fund – Class I | ||
Financial Highlights | Selected data for a share of beneficial interest outstanding throughout the periods indicated: | |
| For the Six Months Ended October 31, 2012 (Unaudited) | For the Year Ended April 30, 2012(a) | For the Period January 1, 2011 to April 30, 2011(b) | For the Period September 27, 2010 (Inception) to December 31, 2010 | |||||
Net asset value, beginning of period | $13.40 | $15.67 | $14.65 | $13.68 | ||||
INCOME/(LOSS) FROM INVESTMENT OPERATIONS: | ||||||||
Net investment | 0.13 | 0.19 | 0.01 | 0.17 | ||||
Net realized and unrealized | – | (1.43) | 1.01 | 1.09 | ||||
Total from investment operations | 0.13 | (1.24) | 1.02 | 1.26 | ||||
DISTRIBUTIONS: | ||||||||
From net investment income | – | (0.16) | – | (0.15) | ||||
From net realized gains | – | (0.87) | – | (0.14) | ||||
Total distributions | – | (1.03) | – | (0.29) | ||||
Net increase/(decrease) in net asset value | 0.13 | (2.27) | 1.02 | 0.97 | ||||
Net asset value, end of period | $13.53 | $13.40 | $15.67 | $14.65 | ||||
TOTAL RETURN(d) | 0.97% | (7.31)% | 7.04% | 9.12% | ||||
RATIOS/SUPPLEMENTAL DATA: | ||||||||
Net assets, end of period (000s) | $4,517 | $6,022 | $4,508 | $2,280 | ||||
Ratio of expenses to average net assets excluding fee waivers and reimbursements | 1.32%(e) | 1.30% | 1.30%(e) | 1.74%(e) | ||||
Ratio of expenses to average net assets including fee waivers and reimbursements (includes acquired fund fee reimbursements) | 0.65%(e) | 0.67% | 0.61%(e) | 0.66%(e) | ||||
Ratio of expenses to average net assets including fee waivers and reimbursements (excludes acquired fund fee reimbursements) | 0.90%(e) | 0.90% | 0.90%(e) | 0.90%(e) | ||||
Ratio of net investment income to average net assets | 1.95%(e) | 1.40% | 0.23%(e) | 4.70%(e) | ||||
Portfolio turnover | 43% | 119% | 34% | 99% | ||||
| (a) | Prior to January 1, 2012, the RiverFront Global Growth Fund was known as the RiverFront Long-Term Growth Fund. |
| (b) | Effective March 8, 2011, the Board approved changing the fiscal year-end of the Fund from December 31 to April 30. |
| (c) | Calculated using the average shares method. |
| (d) | Total returns are for the period indicated and have not been annualized. Total returns would have been lower had certain expenses not been waived during the period. Returns shown do not reflect the deduction of taxes that a shareholder would pay on Fund distributions or the redemption of Fund shares. |
| (e) | Annualized. |
| (f) | Portfolio turnover rate for periods less than one full year have not been annualized. |
See Notes to Financial Statements.
110 | October 31, 2012
Table of Contents
RiverFront Global Growth Fund – Class L | ||
Financial Highlights | Selected data for a share of beneficial interest outstanding throughout the periods indicated: | |
For the Six Months | For the Year Ended April 30, 2012(a) | For the Period January 1, 2011 to April 30, 2011(b) | For the Year Ended 2010(c) | For the Year Ended 2009 | For the Period October 28, 2008 (Inception) to 2008 | |||||||
| ||||||||||||
Net asset value, beginning of period | $13.37 | $15.65 | $14.63 | $13.22 | $10.49 | $10.00 | ||||||
INCOME/(LOSS) FROM INVESTMENT OPERATIONS: | ||||||||||||
Net investment income after reimbursements (d) | 0.13 | 0.17 | 0.01 | 0.18 | 0.16 | 0.12 | ||||||
Net realized and unrealized gain/(loss) | – | (1.49) | 1.01 | 1.52 | 2.66 | 0.46 | ||||||
| ||||||||||||
Total from investment operations | 0.13 | (1.32) | 1.02 | 1.70 | 2.82 | 0.58 | ||||||
| ||||||||||||
DISTRIBUTIONS: | ||||||||||||
From net investment income | – | (0.17) | – | (0.15) | (0.09) | (0.09) | ||||||
From net realized gains | – | (0.79) | – | (0.14) | – | – | ||||||
| ||||||||||||
Total distributions | – | (0.96) | – | (0.29) | (0.09) | (0.09) | ||||||
| ||||||||||||
Net increase/(decrease) in net asset value | 0.13 | (2.28) | 1.02 | 1.41 | 2.73 | 0.49 | ||||||
| ||||||||||||
Net asset value, end of period | $13.50 | $13.37 | $15.65 | $14.63 | $13.22 | $10.49 | ||||||
| ||||||||||||
TOTAL RETURN(e) | 0.97% | (7.31)% | 6.97% | 12.87% | 26.86% | 5.81% | ||||||
RATIOS/SUPPLEMENTAL DATA: | ||||||||||||
Net assets, end of period (000s) | $21,845 | $24,765 | $42,977 | $43,240 | $27,763 | $7,439 | ||||||
Ratio of expenses to average net assets excluding fee waivers and reimbursements | 1.31%(f) | 1.08% | 1.28%(f) | 1.22% | 1.53% | 4.97%(f) | ||||||
Ratio of expenses to average net assets including fee waivers and reimbursements (includes acquired fund fee reimbursements) | 0.65%(f) | 0.67% | 0.64%(f) | 0.66% | N/A | N/A | ||||||
Ratio of expenses to average net assets including fee waivers and reimbursements (excludes acquired fund fee reimbursements) | 0.90%(f) | 0.90% | 0.90%(f) | 0.90% | 0.90% | 0.90%(f) | ||||||
Ratio of net investment income to average net assets | 1.91%(f) | 1.26% | 0.19%(f) | 1.33% | 1.34% | 7.55%(f) | ||||||
Portfolio turnover rate(g) | 43% | 119% | 34% | 99% | 67% | 13% | ||||||
| ||||||||||||
| (a) | Prior to January 1, 2012, the RiverFront Global Growth Fund was known as the RiverFront Long-Term Growth Fund. |
| (b) | Effective March 8, 2011, the Board approved changing the fiscal year-end of the Fund from December 31 to April 30. |
| (c) | Prior to close of business on September 24, 2010, Class L was known as Institutional Class of the Predescessor Fund. |
| (d) | Calculated using the average shares method. |
| (e) | Total returns are for the period indicated and have not been annualized. Total returns would have been lower had certain expenses not been waived during the period. Returns shown do not reflect the deduction of taxes that a shareholder would pay on Fund distributions or the redemption of Fund shares. |
| (f) | Annualized. |
| (g) | Portfolio turnover rate for periods less than one full year have not been annualized. |
See Notes to Financial Statements.
111 | October 31, 2012
Table of Contents
RiverFront Global Growth Fund – Investor Class | ||
Financial Highlights | Selected data for a share of beneficial interest outstanding throughout the periods indicated: | |
| For the | For the Period | |||||||||||
| Six Months | For the Period | For the | For the | October 28, 2008 | ||||||||
| Ended | For the | January 1, 2011 | Year Ended | Year Ended | (Inception) to | |||||||
| October 31, 2012 | Year Ended | to | December 31, | December 31, | December 31, | |||||||
| (Unaudited) | April 30, 2012(a) | April 30, 2011(b) | 2010 | 2009 | 2008 | |||||||
| ||||||||||||
Net asset value, beginning of period | $13.32 | $15.59 | $14.59 | $13.19 | $10.49 | $10.00 | ||||||
INCOME/(LOSS) FROM INVESTMENT OPERATIONS: | ||||||||||||
Net investment income after reimbursements(c) | 0.11 | 0.13 | 0.00(d) | 0.12 | 0.13 | 0.12 | ||||||
Net realized and unrealized gain/(loss) | – | (1.47) | 1.00 | 1.54 | 2.65 | 0.46 | ||||||
| ||||||||||||
Total from investment operations | 0.11 | (1.34) | 1.00 | 1.66 | 2.78 | 0.58 | ||||||
| ||||||||||||
DISTRIBUTIONS: | ||||||||||||
From net investment income | – | (0.14) | – | (0.12) | (0.08) | (0.09) | ||||||
From net realized gains | – | (0.79) | – | (0.14) | – | – | ||||||
| ||||||||||||
Total distributions | – | (0.93) | – | (0.26) | (0.08) | (0.09) | ||||||
| ||||||||||||
Net increase/(decrease) in net asset value | 0.11 | (2.27) | 1.00 | 1.40 | 2.70 | 0.49 | ||||||
| ||||||||||||
Net asset value, end of period | $13.43 | $13.32 | $15.59 | $14.59 | $13.19 | $10.49 | ||||||
| ||||||||||||
TOTAL RETURN(e) | 0.83% | (7.48)% | 6.79% | 12.58% | 26.58% | 5.68% | ||||||
RATIOS/SUPPLEMENTAL DATA: | ||||||||||||
Net assets, end of period (000s) | $9,000 | $10,133 | $21,270 | $23,556 | $13,882 | $426 | ||||||
Ratio of expenses to average net assets excluding fee waivers and reimbursements | 1.56%(f) | 1.93% | 1.53%(f) | 1.47% | 1.78% | 5.22%(f) | ||||||
Ratio of expenses to average net assets including fee waivers and reimbursements (includes acquired fund fee reimbursements) | 0.90%(f) | 0.92% | 0.89%(f) | 0.91% | N/A | N/A | ||||||
Ratio of expenses to average net assets including fee waivers and reimbursements (excludes acquired fund fee reimbursements) | 1.15%(f) | 1.15% | 1.15%(f) | 1.15% | 1.15% | 1.15%(f) | ||||||
Ratio of net investment income/(loss) to average net assets | 1.67%(f) | 0.97% | (0.08)%(f) | 0.93% | 1.09% | 7.30%(f) | ||||||
Portfolio turnover rate(g) | 43% | 119% | 34% | 99% | 67% | 13% | ||||||
| ||||||||||||
| (a) | Prior to January 1, 2012, the RiverFront Global Growth Fund was known as the RiverFront Long-Term Growth Fund. |
| (b) | Effective March 8, 2011, the Board approved changing the fiscal year-end of the Fund from December 31 to April 30. |
| (c) | Calculated using the average shares method. |
| (d) | Less than $0.005 per share. |
| (e) | Total returns are for the period indicated and have not been annualized. Total returns would have been lower had certain expenses not been waived during the period. Returns shown do not reflect the deduction of taxes that a shareholder would pay on Fund distributions or the redemption of Fund shares. |
| (f) | Annualized. |
| (g) | Portfolio turnover rate for periods less than one full year have not been annualized. |
See Notes to Financial Statements.
112 | October 31, 2012
Table of Contents
RiverFront Moderate Growth & Income Fund – Class A | ||
Financial Highlights | Selected data for a share of beneficial interest outstanding throughout the periods indicated: | |
For the Six Months Ended October 31, 2012 (Unaudited) | For the Year Ended April 30, 2012 | For the Period August 2, 2010 (Inception) to April 30, 2011 | ||||
| ||||||
Net asset value, beginning of period | $10.96 | $11.08 | $10.00 | |||
INCOME/(LOSS) FROM INVESTMENT OPERATIONS: | ||||||
Net investment income(a) | 0.13 | 0.17 | 0.15 | |||
Net realized and unrealized gain/(loss) | (0.07) | (0.12) | 1.01 | |||
| ||||||
Total from investment operations | 0.06 | 0.05 | 1.16 | |||
| ||||||
DISTRIBUTIONS: | ||||||
From net investment income | (0.09) | (0.17) | (0.08) | |||
From net realized gains | – | – | (0.00)(b) | |||
| ||||||
Total distributions | (0.09) | (0.17) | (0.08) | |||
| ||||||
Net increase/(decrease) in net asset value | (0.03) | (0.12) | 1.08 | |||
| ||||||
Net asset value, end of period | $10.93 | $10.96 | $11.08 | |||
| ||||||
TOTAL RETURN(c) | 0.60% | 0.55% | 11.70% | |||
RATIOS/SUPPLEMENTAL DATA: | ||||||
Net assets, end of period (000s) | $23,602 | $20,754 | $12,148 | |||
Ratio of expenses to average net assets excluding fee waivers and reimbursements | 1.42%(d) | 1.50% | 1.64%(d) | |||
Ratio of expenses to average net assets including fee waivers and reimbursements | 1.25%(d)(f) | 1.30% | 1.30%(d) | |||
Ratio of net investment income to average net assets | 2.30%(d) | 1.65% | 1.89%(d) | |||
Portfolio turnover rate(e) | 47% | 128% | 69% | |||
| ||||||
| (a) | Calculated using the average shares method. |
| (b) | Less than ($0.005) per share. |
| (c) | Total returns are for the period indicated and have not been annualized. Total returns would have been lower had certain expenses not been waived during the period. Returns shown do not reflect the deduction of taxes that a shareholder would pay on Fund distributions or the redemption of Fund shares. Returns shown exclude any applicable sales charges. |
| (d) | Annualized. |
| (e) | Portfolio turnover rate for periods less than one full year have not been annualized. |
| (f) | Effective September 1, 2012, the net expense ratio changed from 1.30% to 1.15% (exclusive of distribution and service (12b-1) fees, shareholder service fees, acquired fund fees and expenses, brokerage expenses, interest expense, short sale dividend expense, taxes and extraordinary expenses). |
See Notes to Financial Statements.
113 | October 31, 2012
Table of Contents
RiverFront Moderate Growth & Income Fund – Class C | ||
Financial Highlights | Selected data for a share of beneficial interest outstanding throughout the periods indicated: | |
For the Six Months Ended October 31, 2012 (Unaudited) | For the Year Ended April 30, 2012 | For the Period August 2, 2010 (Inception) to April 30, 2011 | ||||
| ||||||
Net asset value, beginning of period | $10.92 | $11.06 | $10.00 | |||
INCOME/(LOSS) FROM INVESTMENT OPERATIONS: | ||||||
Net investment income(a) | 0.08 | 0.09 | 0.10 | |||
Net realized and unrealized gain/(loss) | (0.05) | (0.13) | 1.02 | |||
| ||||||
Total from investment operations | 0.03 | (0.04) | 1.12 | |||
| ||||||
DISTRIBUTIONS: | ||||||
From net investment income | (0.06) | (0.10) | (0.06) | |||
From net realized gains | – | – | (0.00)(b) | |||
| ||||||
Total distributions | (0.06) | (0.10) | (0.06) | |||
| ||||||
Net increase/(decrease) in net asset value | (0.03) | (0.14) | 1.06 | |||
| ||||||
Net asset value, end of period | $10.89 | $10.92 | $11.06 | |||
| ||||||
TOTAL RETURN(c) | 0.31% | (0.37)% | 11.24% | |||
RATIOS/SUPPLEMENTAL DATA: | ||||||
Net assets, end of period (000s) | $45,083 | $39,015 | $24,061 | |||
Ratio of expenses to average net assets excluding fee waivers and reimbursements | 2.17%(d) | 2.25% | 2.54%(d) | |||
Ratio of expenses to average net assets including fee waivers and reimbursements | 2.00%(d)(f) | 2.05% | 2.05%(d) | |||
Ratio of net investment income to average net assets | 1.55%(d) | 0.88% | 1.22%(d) | |||
Portfolio turnover rate(e) | 47% | 128% | 69% | |||
| ||||||
| (a) | Calculated using the average shares method. |
| (b) | Less than ($0.005) per share. |
| (c) | Total returns are for the period indicated and have not been annualized. Total returns would have been lower had certain expenses not been waived during the period. Returns shown do not reflect the deduction of taxes that a shareholder would pay on Fund distributions or the redemption of Fund shares. Returns shown exclude any applicable sales charges. |
| (d) | Annualized. |
| (e) | Portfolio turnover rate for periods less than one full year have not been annualized. |
| (f) | Effective September 1, 2012, the net expense ratio changed from 2.05% to 1.90% (exclusive of distribution and service (12b-1) fees, shareholder service fees, acquired fund fees and expenses, brokerage expenses, interest expense, short sale dividend expense, taxes and extraordinary expenses). |
See Notes to Financial Statements.
114 | October 31, 2012
Table of Contents
RiverFront Moderate Growth & Income Fund – Class I | ||
Financial Highlights | Selected data for a share of beneficial interest outstanding throughout the periods indicated: | |
For the Six Months Ended October 31, 2012 (Unaudited) | For the Year Ended April 30, 2012 | For the Period August 2, 2010 (Inception) to April 30, 2011 | ||||
| ||||||
Net asset value, beginning of period | $10.94 | $11.07 | $10.00 | |||
INCOME/(LOSS) FROM INVESTMENT OPERATIONS: | ||||||
Net investment income(a) | 0.14 | 0.20 | 0.17 | |||
Net realized and unrealized gain/(loss) | (0.05) | (0.13) | 1.01 | |||
| ||||||
Total from investment operations | 0.09 | 0.07 | 1.18 | |||
| ||||||
DISTRIBUTIONS: | ||||||
From net investment income | (0.10) | (0.20) | (0.11) | |||
From net realized gains | – | – | (0.00)(b) | |||
| ||||||
Total distributions | (0.10) | (0.20) | (0.11) | |||
| ||||||
Net increase/(decrease) in net asset value | (0.01) | (0.13) | 1.07 | |||
| ||||||
Net asset value, end of period | $10.93 | $10.94 | $11.07 | |||
| ||||||
TOTAL RETURN(c) | 0.87% | 0.71% | 11.92% | |||
RATIOS/SUPPLEMENTAL DATA: | ||||||
Net assets, end of period (000s) | $16,325 | $12,880 | $7,535 | |||
Ratio of expenses to average net assets excluding fee waivers and reimbursements | 1.17%(d) | 1.26% | 1.55%(d) | |||
Ratio of expenses to average net assets including fee waivers and reimbursements | 0.99%(d)(f) | 1.05% | 1.05%(d) | |||
Ratio of net investment income to average net assets | 2.54%(d) | 1.91% | 2.16%(d) | |||
Portfolio turnover rate(e) | 47% | 128% | 69% | |||
| ||||||
| (a) | Calculated using the average shares method. |
| (b) | Less than ($0.005) per share. |
| (c) | Total returns are for the period indicated and have not been annualized. Total returns would have been lower had certain expenses not been waived during the period. Returns shown do not reflect the deduction of taxes that a shareholder would pay on Fund distributions or the redemption of Fund shares. |
| (d) | Annualized. |
| (e) | Portfolio turnover rate for periods less than one full year have not been annualized. |
| (f) | Effective September 1, 2012, the net expense ratio changed from 1.05% to 0.90% (exclusive of distribution and service (12b-1) fees, shareholder service fees, acquired fund fees and expenses, brokerage expenses, interest expense, short sale dividend expense, taxes and extraordinary expenses). |
See Notes to Financial Statements.
115 | October 31, 2012
Table of Contents
| October 31, 2012 (Unaudited) |
1. ORGANIZATION
Financial Investors Trust (the “Trust”), a Delaware statutory trust, is an open-end management investment company under the Investment Company Act of 1940, as amended (“1940 Act”). As of October 31, 2012, the Trust had 24 registered funds. This semi-annual report describes the following funds; ALPS | Kotak India Growth Fund, ALPS | Red Rocks Listed Private Equity Fund, ALPS | WMC Disciplined Value Fund (prior to August 1, 2012, known as the ALPS | WMC Value Intersection Fund), Clough China Fund, Jefferies Asset Management Commodity Strategy Allocation Fund, RiverFront Conservative Income Builder Fund, RiverFront Dynamic Equity Income Fund, RiverFront Global Allocation Fund, RiverFront Global Growth Fund and RiverFront Moderate Growth & Income Fund (each, a “Fund” and collectively, the “Funds”).
ALPS | Kotak India Growth Fund seeks to achieve long-term capital appreciation. ALPS | Red Rocks Listed Private Equity Fund seeks to maximize total return, which consists of appreciation on its investments and a variable income stream. ALPS | WMC Disciplined Value Fund seeks long-term capital appreciation. Dividend income may be a factor in portfolio selection but is secondary to the Fund’s principal objective. The Clough China Fund seeks to provide investors with long-term capital appreciation. The Jefferies Asset Management Commodity Strategy Allocation Fund seeks to maximize real returns, consistent with prudent investment management. The RiverFront Conservative Income Builder Fund seeks to provide current income and potential for that income to grow over time, primarily through investments in fixed-income securities, including high-and low- grade corporate debt, with the balance of the Fund (typically 20%-50%) invested in a diversified basket of dividend-paying stocks, including small- and mid-cap domestic and foreign securities. The RiverFront Dynamic Equity Income Fund seeks to achieve long-term growth and income through a combination of capital appreciation and rising dividend payments that exceeds the average yield on global stocks generally. The RiverFront Global Allocation Fund seeks to provide high total investment return through a fully managed investment policy utilizing United States and foreign equity securities, debt and money market securities, the combination of which will be varied from time to time both with respect to types of securities and markets in response to changing market and economic trends. Total investment return means the combination of capital appreciation and investment income. The RiverFront Global Growth Fund seeks to achieve long-term capital appreciation through a fully managed investment policy utilizing United States and foreign equity securities, debt and money market securities, the combination of which will be varied from time to time both with respect to types of securities and markets in response to changing market and economic trends. The RiverFront Moderate Growth & Income Fund has two primary investment objectives. It seeks (1) to provide a level of current income that exceeds the average yield on U.S. stocks in general and (2) to provide a growing stream of income over the years. The Fund’s secondary objective is to provide growth of capital.
The classes differ principally in the applicable distribution and shareholder service fees. Shareholders of each class also bear certain expenses that pertain to that particular class. All shareholders bear the common expenses of the Fund and earn income and realized gains/losses from the Fund pro rata based on the average daily net assets of each class, without distinction between share classes. Dividends to shareholders are determined separately for each class based on income and expenses allocable to each class. Realized gain distributions to shareholders are allocated to each class pro rata based on the shares outstanding of each class on the date of distribution. Differences in per share dividend rates generally result from differences in separate class expenses, including distribution and shareholder service fees, if applicable.
Basis of Consolidation for the ALPS | Kotak India Growth Fund
ALPS | Kotak India Growth Fund, (the “Kotak Fund”) invests in the equity securities of Indian companies through its wholly owned, collective investment vehicle, the Kotak Mauritius Portfolio (the “Portfolio”). The Portfolio is registered with and regulated by the Mauritius Financial Services Commission. The Portfolio was formed for the purpose of facilitating the Kotak Fund’s purchase of securities of a wide selection of Indian companies, consistent with the Kotak Fund’s investment strategies. The Portfolio is a private company limited by shares incorporated under the Mauritius Companies Act 2001. As a wholly owned subsidiary of the Kotak Fund, financial statements of the Portfolio are included in the consolidated financial statements and financial highlights of the Kotak Fund. All investments held by the Portfolio are disclosed in the accounts of the Kotak Fund.
The Portfolio established residency in Mauritius allowing the Fund to receive the beneficial tax treatment under the Treaty between India and Mauritius. If the benefits of the Treaty are denied or if the Portfolio is held to have a permanent establishment in India, gains derived by the Portfolio due to the sale of securities, may be subject to taxation in India. Currently, India has introduced legislation on General Anti-Avoidance Rules (“GAAR”) which contain treaty override provisions. The GAAR may be used by the Indian tax authorities to declare any arrangement whose main purpose or one of the main purposes is to obtain a tax benefit, as an “impermissible avoidance arrangement”. Originally, GAAR was to be effective from April 1, 2012; however GAAR has been deferred until April 1, 2013.
Basis of Consolidation for the Jefferies Asset Management Commodity Strategy Allocation Fund
Jefferies Asset Management Cayman Commodity Fund Ltd. (the “Subsidiary”), a Cayman Islands exempted company, was incorporated on April 23, 2010 and is a wholly owned subsidiary of the Jefferies Asset Management Commodity Strategy Fund (“the Jefferies Fund”). The Subsidiary acts as an investment vehicle for the Jefferies Fund in order to effect certain commodity-related investments on behalf of the Jefferies Fund. Jefferies Fund is the sole shareholder of the Subsidiary pursuant to a subscription agreement dated as of June 14, 2010, and it is intended that the Jefferies Fund will remain the sole shareholder and will continue to wholly own and control the Subsidiary. Under the Articles of Association of the Subsidiary, shares issued by the Subsidiary confer upon a shareholder the right to vote at general meetings of the Subsidiary and certain rights in connection
116 | October 31, 2012 | ||
Table of Contents
Notes to Financial Statements | ||
| October 31, 2012 (Unaudited) |
with any winding-up or repayment of capital, as well as the right to participate in the profits or assets of the Subsidiary. The Jefferies Fund may invest up to 25% of its total assets in shares of the Subsidiary. As a wholly owned subsidiary of the Jefferies Fund, the financial statements of the Subsidiary are included in the consolidated financial statements and financial highlights of the Jefferies Fund. All investments held by the Subsidiary are disclosed in the accounts of the Jefferies Fund. As of October 31, 2012, net assets of the Jefferies Fund were $271,968,656, of which $48,998,789, or 18.02%, represented the Jefferies Fund’s ownership of all issued shares and voting rights of the Subsidiary.
2. SIGNIFICANT ACCOUNTING POLICIES
The accompanying financial statements were prepared in accordance with accounting principles generally accepted in the United States of America (“U.S. GAAP”). The preparation of financial statements in conformity with U.S. GAAP requires management to make certain estimates and assumptions that affect the reported amounts of assets and liabilities and disclosures of contingent assets and liabilities at the date of the financial statements and the reported amounts of revenue and expenses during the period. Actual results could differ from those estimates. The following is a summary of significant accounting policies consistently followed by the Funds and subsidiaries, as applicable, in preparation of their financial statements.
Investment Valuation: The Funds generally value their securities based on market prices determined at the close of regular trading on the New York Stock Exchange (“NYSE”), normally 4:00 p.m. Eastern Time, on each day the NYSE is open for trading.
For equity securities and mutual funds that are traded on an exchange, the market price is usually the closing sale or official closing price on that exchange. In the case of equity securities not traded on an exchange, or if such closing prices are not otherwise available, the securities are valued at the mean of the most recent bid and ask prices on such day.
The market price for debt obligations is generally the price supplied by an independent third-party pricing service approved by the Board of Trustees (the “Board”), which may use a matrix, formula or other objective method that takes into consideration quotations from dealers, market transactions in comparable investments, market indices and yield curves. If vendors are unable to supply a price, or if the price supplied is deemed to be unreliable, the market price may be determined using quotations received from one or more brokers-dealers that make a market in the security. Short-term debt obligations that will mature in 60 days or less are valued at amortized cost; unless it is determined that using this method would not reflect an investment’s fair value. Investments in non-exchange traded funds are fair valued at their respective net asset values.
Futures contracts that are listed or traded on a national securities exchange, commodities exchange, contract market or comparable over the counter market, and that are freely transferable, are valued at their closing settlement price on the exchange on which they are primarily traded or based upon the current settlement price for a like instrument acquired on the day on which the instrument is being valued. A settlement price may not be used if the market makes a limit move with respect to a particular commodity. Over-the-counter swap contracts for which market quotations are readily available are valued based on quotes received from independent pricing services or one or more dealers that make markets in such securities.
Equity securities that are primarily traded on foreign securities exchanges are valued at the closing values of such securities on their respective foreign exchanges, except when an event occurs subsequent to the close of the foreign exchange and the close of the NYSE that was likely to have changed such value. In such an event, the fair value of those securities are determined in good faith through consideration of other factors in accordance with procedures established by and under the general supervision of the Board. The Funds will use a fair valuation model provided by an independent pricing service, which is intended to reflect fair value when a security’s value or a meaningful portion of the Fund’s portfolio is believed to have been materially affected by an valuation event that has occurred between the close of the exchange or market on which the security is traded and the close of the regular trading day on the NYSE. The Funds’ valuation procedures set forth certain triggers which instruct when to use the fair valuation model.
Forward currency exchange contracts have a market value determined by the prevailing foreign currency exchange daily rates and current foreign currency exchange forward rates. The foreign currency exchange forward rates are calculated using an automated system that estimates rates on the basis of the current day foreign currency exchange rates and forward foreign currency exchange rates supplied by a pricing service. Foreign exchange rates and forward foreign currency exchange rates may generally be obtained at the close of the NYSE, normally 4:00 p.m. Eastern Time.
When such prices or quotations are not available, or when the Fair Value Committee appointed by the Board believes that they are unreliable, securities may be priced using fair value procedures approved by the Board.
Fair Value Measurements: The Funds disclose the classification of their fair value measurements following a three-tier hierarchy based on the inputs used to measure fair value. Inputs refer broadly to the assumptions that market participants would use in pricing the asset or liability, including assumptions about risk. Inputs may be observable or unobservable. Observable inputs reflect the assumptions market participants would use in pricing the asset or liability that are developed based on market data obtained from sources independent of the reporting entity.
117 | October 31, 2012
Table of Contents
Notes to Financial Statements | ||
| October 31, 2012 (Unaudited) |
Unobservable inputs reflect the reporting entity’s own assumptions about the assumptions market participants would use in pricing the asset or liability that are developed based on the best information available.
Various inputs are used in determining the value of each Fund’s investments as of the end of the reporting period. When inputs used fall into different levels of the fair value hierarchy, the level in the hierarchy within which the fair value measurement falls is determined based on the lowest level input that is significant to the fair value measurement in its entirety. The designated input levels are not necessarily an indication of the risk or liquidity associated with these investments. These inputs are categorized in the following hierarchy under applicable financial accounting standards:
| Level 1 – | Unadjusted quoted prices in active markets for identical investments, unrestricted assets or liabilities that a Fund has the ability to access at the measurement date; |
| Level 2 – | Quoted prices which are not active, quoted prices for similar assets or liabilities in active markets or inputs other than quoted prices that are observable (either directly or indirectly) for substantially the full term of the asset or liability; and |
| Level 3 – | Significant unobservable prices or inputs (including the Fund’s own assumptions in determining the fair value of investments) where there is little or no market activity for the asset or liability at the measurement date. |
The following is a summary of each Fund’s investments/financial instruments in the fair value hierarchy as of October 31, 2012:
| Investments in Securities at Value | Level 1 - Unadjusted Quoted Prices | Level 2 - Other Significant Observable Inputs | Level 3 - Significant Unobservable Inputs | Total | ||||||||||||
| ||||||||||||||||
ALPS | Kotak India Growth Fund | ||||||||||||||||
Common Stocks | ||||||||||||||||
Basic Materials | $ | – | $ | 171,204 | $ | – | $ | 171,204 | ||||||||
Communications | – | 172,697 | – | 172,697 | ||||||||||||
Consumer, Cyclical | – | 634,748 | – | 634,748 | ||||||||||||
Consumer, Non-cyclical | 64,283 | 1,058,527 | – | 1,122,810 | ||||||||||||
Energy | – | 410,451 | – | 410,451 | ||||||||||||
Financials | – | 1,526,858 | – | 1,526,858 | ||||||||||||
Industrials | 105,980 | 604,737 | – | 710,717 | ||||||||||||
Technology | – | 682,499 | – | 682,499 | ||||||||||||
Utilities | – | 114,543 | – | 114,543 | ||||||||||||
Short Term Investments | 8,207 | – | – | 8,207 | ||||||||||||
| ||||||||||||||||
TOTAL | $ | 178,470 | $ | 5,376,264 | $ | – | $ | 5,554,734 | ||||||||
| ||||||||||||||||
| Investments in Securities at Value | Level 1 - Unadjusted Quoted Prices | Level 2 - Other Significant Observable Inputs | Level 3 - Significant Unobservable Inputs | Total | ||||||||||||
| ||||||||||||||||
ALPS | Red Rocks Listed Private Equity Fund | ||||||||||||||||
Common Stocks(a) | $ | 172,764,703 | $ | – | $ | – | $ | 172,764,703 | ||||||||
Short Term Investments | 1,829,091 | – | – | 1,829,091 | ||||||||||||
| ||||||||||||||||
Total | $ | 174,593,794 | $ | – | $ | – | $ | 174,593,794 | ||||||||
| ||||||||||||||||
| Investments in Securities at Value | Level 1 - Unadjusted Quoted Prices | Level 2 - Other Significant Observable Inputs | Level 3 - Significant Unobservable Inputs | Total | ||||||||||||
| ||||||||||||||||
ALPS/WMC Disciplined Value Fund | ||||||||||||||||
Common Stocks(a) | $ | 75,226,979 | $ | – | $ | – | $ | 75,226,979 | ||||||||
Short Term Investments | 1,233,998 | – | – | 1,233,998 | ||||||||||||
| ||||||||||||||||
Total | $ | 76,460,977 | $ | – | $ | – | $ | 76,460,977 | ||||||||
| ||||||||||||||||
118 | October 31, 2012
Table of Contents
Notes to Financial Statements | ||
| October 31,2012(Unaudited) |
| Investments in Securities at Value | Level 1 - Unadjusted Quoted Prices | Level 2 - Other Significant Observable Inputs | Level 3 - Significant Unobservable Inputs | Total | ||||||||||||
Clough China Fund | ||||||||||||||||
Common Stocks | ||||||||||||||||
Basic Materials | $ | – | $ | 1,364,968 | $ | – | $ | 1,364,968 | ||||||||
Communications | – | 8,075,672 | – | 8,075,672 | ||||||||||||
Consumer, Cyclical | – | 9,656,522 | – | 9,656,522 | ||||||||||||
Consumer, Non-Cyclical | – | 4,244,187 | – | 4,244,187 | ||||||||||||
Energy | – | 4,619,186 | – | 4,619,186 | ||||||||||||
Financials | – | 13,616,378 | – | 13,616,378 | ||||||||||||
Industrials | – | 8,473,183 | – | 8,473,183 | ||||||||||||
Technology | – | 1,540,504 | – | 1,540,504 | ||||||||||||
Short Term Investments | 1,249,972 | – | – | 1,249,972 | ||||||||||||
| ||||||||||||||||
TOTAL | $ | 1,249,972 | $ | 51,590,600 | $ | – | $ | 52,840,572 | ||||||||
| ||||||||||||||||
| Investments in Securities at Value | Level 1 - Unadjusted Quoted Prices | Level 2 - Other Significant Observable Inputs | Level 3 - Significant Unobservable Inputs | Total | ||||||||||||
Jefferies Asset Management Commodity Strategy Allocation Fund |
| |||||||||||||||
Common Stocks(a) | $ | 103,178,623 | $ | – | $ | – | $ | 103,178,623 | ||||||||
Exchange Traded Funds | 5,952,710 | – | – | 5,952,710 | ||||||||||||
Warrants | 9 | – | – | 9 | ||||||||||||
Government Bonds | – | 144,537,551 | – | 144,537,551 | ||||||||||||
Short Term Investments | 8,692,182 | – | – | 8,692,182 | ||||||||||||
| ||||||||||||||||
Total | $ | 117,823,524 | $ | 144,537,551 | $ | – | $ | 262,361,075 | ||||||||
| ||||||||||||||||
Other Financial Instruments | ||||||||||||||||
Assets | ||||||||||||||||
Futures Contracts | $ | 477,486 | $ | – | $ | – | $ | 477,486 | ||||||||
Total Return Swap Contracts | – | 1,927,064 | – | 1,927,064 | ||||||||||||
Liabilities | ||||||||||||||||
Futures Contracts | (50,980) | – | – | (50,980) | ||||||||||||
Total Return Swap Contracts | – | (8,962,462) | – | (8,962,462) | ||||||||||||
| ||||||||||||||||
Total | $ | 426,506 | $ | (7,035,398) | $ | – | $ | (6,608,892) | ||||||||
| ||||||||||||||||
| Investments in Securities at Value | Level 1 - Unadjusted Quoted Prices | Level 2 - Other Significant Observable Inputs | Level 3 - Significant Unobservable Inputs | Total | ||||||||||||
RiverFront Conservative Income Builder Fund |
| |||||||||||||||
Common Stocks(a) | $ | 97,464 | $ | – | $ | – | $ | 97,464 | ||||||||
Exchange Traded Funds | 564,347 | – | – | 564,347 | ||||||||||||
Exchange Traded Notes | 5,846 | – | – | 5,846 | ||||||||||||
| ||||||||||||||||
Total | $ | 667,657 | $ | – | $ | – | $ | 667,657 | ||||||||
| ||||||||||||||||
| Investments in Securities at Value | Leve 1 - Unadjusted Quoted Prices | Level 2 - Other Significant Observable Inputs | Level 3 - Significant Unobservable Inputs | Total | ||||||||||||
RiverFront Dynamic Equity Income Fund |
| |||||||||||||||
Common Stocks(a) | $ | 7,544,505 | $ | – | $ | – | $ | 7,544,505 | ||||||||
Exchange Traded Funds | 18,828,332 | – | – | 18,828,332 | ||||||||||||
Exchange Traded Notes | 338,554 | – | – | 338,554 | ||||||||||||
Short Term Investments | 616,026 | – | – | 616,026 | ||||||||||||
| ||||||||||||||||
Total | $ | 27,327,417 | $ | – | $ | – | $ | 27,327,417 | ||||||||
| ||||||||||||||||
| Investments in Securities at Value | Level 1 - Unadjusted Quoted Prices | Level 2 - Other Significant Observable Inputs | Level 3 - Significant Unobservable Inputs | Total | ||||||||||||
RiverFront Global Allocation Fund |
| |||||||||||||||
Common Stocks(a) | $ | 3,778,842 | $ | – | $ | – | $ | 3,778,842 | ||||||||
Exchange Traded Funds | 14,832,265 | – | – | 14,832,265 | ||||||||||||
Short Term Investments | 494,053 | – | – | 494,053 | ||||||||||||
| ||||||||||||||||
Total | $ | 19,105,160 | $ | – | $ | – | $ | 19,105,160 | ||||||||
| ||||||||||||||||
119 | October 31, 2012
Table of Contents
Notes to Financial Statements | ||
| October 31,2012 (Unaudited) |
| Investments in Securities at Value | Level 1 - Unadjusted Quoted Prices | Level 2 - Other Significant Observable Inputs | Level 3 - Significant Unobservable Inputs | Total | ||||||||||||
RiverFront Global Growth Fund | ||||||||||||||||
Common Stocks(a) | $ | 11,313,939 | $ | – | $ | – | $ | 11,313,939 | ||||||||
Exchange Traded Funds | 35,894,009 | – | – | 35,894,009 | ||||||||||||
Short Term Investments | 1,414,560 | – | – | 1,414,560 | ||||||||||||
| ||||||||||||||||
Total | $ | 48,622,508 | $ | – | $ | – | $ | 48,622,508 | ||||||||
| ||||||||||||||||
| Investments in Securities at Value | Level 1 - Unadjusted Quoted Prices | Level 2 - Other Significant Observable Inputs | Level 3 - Significant Unobservable Inputs | Total | ||||||||||||
RiverFront Moderate Growth & Income Fund |
| |||||||||||||||
Common Stocks(a) | $ | 18,957,931 | $ | – | $ | – | $ | 18,957,931 | ||||||||
Exchange Traded Funds | 62,949,403 | – | – | 62,949,403 | ||||||||||||
Exchange Traded Notes | 962,707 | – | – | 962,707 | ||||||||||||
Short Term Investments | 2,292,192 | – | – | 2,292,192 | ||||||||||||
| ||||||||||||||||
Total | $ | 85,162,233 | $ | – | $ | – | $ | 85,162,233 | ||||||||
| ||||||||||||||||
| (a) | For detailed descriptions of country, sector and/or industry, see the accompanying Statement of Investments. |
The Funds recognize transfers between levels as of the end of the fiscal year. For the six months ended October 31, 2012, the Funds did not have any transfers between Level 1 and Level 2 securities, except ALPS | Kotak India Growth Fund and the Clough China Fund utilizes a fair value evaluation service with respect to international securities with an earlier market closing than the Fund’s net asset value computation cutoff.
Fund and Class Expenses: Some expenses of the Trust can be directly attributed to a Fund or a specific share class of a Fund. Expenses which cannot be directly attributed are apportioned among all Funds in the Trust based on average net assets of each share class within a Fund.
Federal Income Taxes: The Funds comply with the requirements under Subchapter M of the Internal Revenue Code of 1986 applicable to regulated investment companies and intend to distribute substantially all of their net taxable income and net capital gains, if any, each year. The Funds are not subject to income taxes to the extent such distributions are made.
As of and during the six months ended October 31, 2012, the Funds did not have a liability for any unrecognized tax benefits in the accompanying financial statements. The Funds file income tax returns in the U.S. federal jurisdiction and Colorado. For the ALPS | Kotak India Growth Fund, Jefferies Asset Management Commodity Strategy Allocation Fund, RiverFront Dynamic Equity Income Fund, RiverFront Global Allocation Fund and RiverFront Moderate Growth & Income Fund; years ended April 30, 2011 through April 30, 2012 are open to examination for the U.S. federal jurisdiction and Colorado. For ALPS | Red Rocks Listed Private Equity Fund; years ended April 30, 2009 through April 30, 2012 are open to examination for the U.S. federal jurisdiction and years ended April 30, 2008 through April 30, 2012 are open for Colorado. For the RiverFront Global Growth Fund; years ended December 31, 2008 through December 31, 2010, April 30, 2011 and April 30, 2012 are open to examination for the U.S. federal jurisdiction and Colorado. For the Clough China Fund; years ended July 31, 2009, April 30, 2010, April 30, 2011 and April 30, 2012 are open to examination for the U.S. federal jurisdiction and years ended July 31, 2008, July 31, 2009 and April 30, 2010 through April 30, 2012 are open for Colorado. For the ALPS | WMC Disciplined Value Fund; years ended December 31, 2008, December 31, 2009, and April 30, 2010 through April 30, 2012 are open to examination for the U.S. federal jurisdiction and Colorado. The Activa Value Fund was reorganized into the ALPS | WMC Disciplined Value Fund for which years ended December 31, 2006 through December 31, 2008 remain open to examination for Michigan.
Distributions to Shareholders: Each Fund, except the Jefferies Asset Management Commodity Strategy Allocation Fund, the RiverFront Conservative Income Builder Fund, the RiverFront Dynamic Equity Income Fund, and the RiverFront Moderate Growth & Income Fund normally pays dividends and distributes capital gains, if any, on an annual basis. The Jefferies Asset Management Commodity Strategy Allocation Fund pays dividends, if any, on a quarterly basis and distributes capital gains annually. The RiverFront Conservative Income Builder Fund, the RiverFront Dynamic Equity Income Fund, and RiverFront Moderate Growth & Income Fund pay dividends, if any, on a quarterly basis and distributes capital gains, if any on an annual basis. Income dividend distributions are derived from interest and other income the Fund receives from its investments, including distributions of short-term capital gains. Capital gain distributions are derived from gains realized when the Fund sells a security it has owned for more than a year. Each Fund may make additional distributions and dividends at other times if its portfolio manager or managers believe doing so may be necessary for the Fund to avoid or reduce taxes. Net investment income/(loss) and net realized gain/(loss) may differ for financial statement and tax purposes.
Investment Transactions and Investment Income: Investment transactions are accounted for on the date the investments are purchased or sold (trade date basis). Net realized gains and losses from investment transactions are reported on an identified cost basis. Interest income, which
120 | October 31, 2012
Table of Contents
Notes to Financial Statements | ||
| October 31,2012 (Unaudited) |
includes accretion of discounts and amortization of premiums, is accrued and recorded as earned. Dividend income is recognized on the exdividend date or for certain foreign securities, as soon as information is available to each Fund.
Foreign Securities: Each Fund may directly purchase securities of foreign issuers. Investing in securities of foreign issuers involves special risks not typically associated with investing in securities of U.S. issuers. The risks include possible reevaluation of currencies, the inability to repatriate foreign currency, less complete financial information about companies and possible future adverse political and economic developments. Moreover, securities of many foreign issuers and their markets may be less liquid and their prices more volatile than those of securities of comparable U.S. issuers.
Foreign Currency Translation: The books and records of the Funds are maintained in U.S. dollars. Investment valuations and other assets and liabilities initially expressed in foreign currencies are converted each business day into U.S. dollars based upon current exchange rates. The portion of realized and unrealized gains or losses on investments due to fluctuations in foreign currency exchange rates is not separately disclosed and is included in realized and unrealized gains or losses on investments, when applicable.
Foreign Currency Spot Contracts: The Funds may enter into foreign currency spot contracts to facilitate transactions in foreign securities or to convert foreign currency receipts into U.S. dollars. A foreign currency spot contract is an agreement between two parties to buy and sell currencies at the current market rate, for settlement generally within two business days. The U.S. dollar value of the contracts is determined using current currency exchange rates supplied by a pricing service. The contract is marked-to-market daily for settlements beyond one day and any change in market value is recorded as an unrealized gain or loss. When the contract is closed, the Fund records a realized gain or loss equal to the difference between the value on the open and close date. Losses may arise from changes in the value of the foreign currency, or if the counterparties do not perform under the contract’s terms. The maximum potential loss from such contracts is the aggregate face value in U.S. dollars at the time the contract was opened.
Real Estate Investment Trusts (“REITs”): The Funds may invest a portion of their assets in REITs and are subject to certain risks associated with direct investment in REITs. REITs may be affected by changes in the value of their underlying properties and by defaults by borrowers or tenants. REITs depend generally on their ability to generate cash flow to make distributions to shareowners, and certain REITs have self-liquidation provisions by which mortgages held may be paid in full and distributions of capital returns may be made at any time. In addition, the performance of a REIT may be affected by its failure to qualify for tax-free pass-through of income under the Internal Revenue Code of 1986, as amended (the “Code”), or its failure to maintain exemption from registration under the 1940 Act.
Treasury Inflation Protected-Securities: The Funds may invest in treasury inflation protected securities (“TIPS”), including structured bonds in which the principal amount is adjusted daily to keep pace with inflation, as measured by the U.S. Consumer Pricing Index for Urban Consumers. The adjustments to principal due to inflation/ deflation are reflected as increases/decreases to interest income with a corresponding adjustment to cost. Such adjustments may have a significant impact on a Fund’s distributions and may result in a return of capital to shareholders. The repayment of the original bond principal upon maturity is guaranteed by the full faith and credit of the U.S. Government.
3. DERIVATIVE INSTRUMENTS
ALPS | Kotak India Growth Fund and Jefferies Asset Management Commodity Strategy Allocation Fund investment objectives not only permit the Funds to purchase investment securities, they also allow the Funds to enter in various types of derivatives contracts. In doing so, the Funds will employ strategies in differing combinations to permit them to increase, decrease, or change the level or types of exposure to market factors. Central to those strategies are features inherent in derivatives that make them more attractive for this purpose than equity or debt securities; they require little or no initial cash investment, they can focus exposure on only certain selected risk factors, and they may not require the ultimate receipt or delivery of the underlying security (or securities) to the contract. This may allow the Funds to pursue their objectives more quickly and efficiently than if they were to make direct purchases or sales of securities capable of affecting a similar response to market factors.
Risk of Investing in Derivatives: The Funds’ use of derivatives can result in losses due to unanticipated changes in the market risk factors and the overall market. In instances where the Funds are using derivatives to decrease, or hedge, exposures to market risk factors for securities held by the Funds, there are also risks that those derivatives may not perform as expected resulting in losses for the combined or hedged positions.
Derivatives may have little or no initial cash investment relative to their market value exposure and therefore can produce significant gains or losses in excess of their cost. This use of embedded leverage allows the Fund to increase its market value exposure relative to it net assets and can substantially increase the volatility of the Funds’ performance.
121 | October 31, 2012
Table of Contents
Notes to Financial Statements | ||
| October 31,2012 (Unaudited) |
Additional associated risks from investing in derivatives also exist and potentially could have significant effects on the valuation of the derivative and the Funds. Typically, the associated risks are not the risks that the Funds are attempting to increase or decrease exposure to, per their investment objectives, but are the additional risks from investing in derivatives.
Examples of these associated risks are liquidity risk, which is the risk that the Funds will not be able to sell or close out the derivative in a timely manner, and counterparty credit risk, which is the risk that the counterparty will not fulfill its obligation to the Funds. In addition, use of derivatives may increase or decrease exposure to the following risk factors:
Equity Risk: Equity risk relates to the change in value of equity securities as they relate to increases or decreases in the general market. Associated risks can be different for each type of derivative and are discussed by each derivative type in the notes that follow.
Commodity Risk: Exposure to the commodities markets may subject the Fund to greater volatility than investments in traditional securities. Prices of various commodities may also be affected by factors, such as drought, floods, weather, livestock disease, embargoes, tariffs and other regulatory developments, which are unpredictable. The prices of commodities can also fluctuate widely due to supply and demand disruptions in major producing or consuming regions.
Foreign Currency Risk: Currency trading involves significant risks, including market risk, interest rate risk, country risk, counterparty credit risk and short sale risk. Market risk results from the price movement of foreign currency values in response to shifting market supply and demand. Interest rate risk arises whenever a country changes its stated interest rate target associated with its currency. Country risk arises because virtually every country has interfered with international transactions in its currency.
Interest Rate Risk: Interest rate risk is the risk that fixed income securities will decline in value because of changes in interest rates. As nominal interest rates rise, the value of fixed income securities held by the Fund are likely to decrease. Securities with longer durations tend to be more sensitive to changes in interest rates, and are usually more volatile than securities.
Swap Contracts: The Jefferies Asset Management Commodity Strategy Allocation Fund may enter into swap transactions for hedging purposes or to seek to increase total return. At the present time, the Jefferies Asset Management Commodity Strategy Allocation Fund primarily enters into swap transactions for the purpose of increasing total return. Risks may arise as a result of the failure of the counterparty to the swap contract to comply with the terms of the swap contract. The loss incurred by the failure of a counterparty is generally limited to the net payment to be received by the Jefferies Asset Management Commodity Strategy Allocation Fund and/or the termination value at the end of the contract.
Therefore, the Jefferies Asset Management Commodity Strategy Allocation Fund considers the creditworthiness of each counterparty to a contract in evaluating potential credit risk. Additionally, risks may arise from unanticipated movements in interest rates or in the value of the underlying reference asset or index. Entering into these agreements involves, to varying degrees, market risk, liquidity risk and elements of credit, legal and documentation risk that are not directly reflected in the amounts recognized in the Statements of Assets and Liabilities.
The Jefferies Asset Management Commodity Strategy Allocation Fund may pay or receive cash as collateral on these contracts which may be recorded as an asset and/or liability. The Jefferies Asset Management Commodity Strategy Allocation Fund must set aside liquid assets, or engage in other appropriate measures, to cover its obligations under these contracts. Swaps are marked to market daily using either pricing vendor quotations, counterparty prices or model prices and the change in value, if any, is recorded as an unrealized gain or loss. Upfront payments made and/or received by the Jefferies Asset Management Commodity Strategy Allocation Fund are recorded as an asset and/or liability and realized gains or losses are recognized ratably over the contract’s term/event, with the exception of forward starting interest rate swaps, whose realized gains or losses are recognized ratably from the effective start date. Periodic payments received or made on swap contracts are recorded as realized gains or losses. Gains or losses are realized upon termination of a swap contract and are recorded on the Statements of Operations.
The Jefferies Asset Management Commodity Strategy Allocation Fund invests in total return swaps to obtain exposure to a security or market without owning such security or investing directly in that market or to transfer the risk/return of one market (e.g., fixed income) to another market (e.g., equity) (equity risk and/or interest rate risk). Total return swaps are agreements in which there is an exchange of cash flows whereby one party commits to make payments based on the total return (coupons plus capital gains/losses) of an underlying instrument in exchange for fixed or floating rate interest payments. To the extent the total return of the instrument or index underlying the transaction exceeds or falls short of the offsetting interest rate obligation, the Fund will receive a payment from or make a payment to the counterparty. Swap agreements held at October 31, 2012 are disclosed in the Statement of Operations.
The number of swap contracts held at October 31, 2012 is representative of swap contract activity for the six months ending October 31, 2012.
122 | October 31, 2012
Table of Contents
Notes to Financial Statements | ||
| October 31,2012 (Unaudited) |
Futures: Certain Funds may invest in futures contracts in accordance with their investment objectives. Each Fund does so for a variety of reasons including for cash management, hedging or non-hedging purposes in an attempt to achieve investment returns consistent with the Fund’s investment objective. A futures contract provides for the future sale by one party and purchase by another party of a specified quantity of the security or other financial instrument at a specified price and time. A futures contract on an index is an agreement pursuant to which two parties agree to take or make delivery of an amount of cash equal to the difference between the value of the index at the close of the last trading day of the contract and the price at which the index contract was originally written. Futures transactions may result in losses in excess of the amount invested in the futures contract. There can be no guarantee that there will be a correlation between price movements in the hedging vehicle and in the portfolio securities being hedged. An incorrect correlation could result in a loss on both the hedged securities in a Fund and the hedging vehicle so that the portfolio return might have been greater had hedging not been attempted. There can be no assurance that a liquid market will exist at a time when a Fund seeks to close out a futures contract or a futures option position. Lack of a liquid market for any reason may prevent a Fund from liquidating an unfavorable position, and the Fund would remain obligated to meet margin requirements until the position is closed. In addition, a Fund could be exposed to risk if the counterparties to the contracts are unable to meet the terms of their contracts. With exchange traded futures, there is minimal counterparty credit risk to the Funds since futures are exchange traded and the exchange’s clearinghouse, as counterparty to all exchange traded futures, guarantees the futures against default.
When a purchase or sale of a futures contract is made by a Fund, the Fund is required to deposit with its custodian (or broker, if legally permitted) a specified amount of liquid assets (“initial margin”). The margin required for a futures contract is set by the exchange on which the contract is traded and may be modified during the term of the contract. The initial margin is in the nature of a performance bond or good faith deposit on the futures contract that is returned to a Fund upon termination of the contract, assuming all contractual obligations have been satisfied. Each day a Fund may pay or receive cash, called “variation margin,” equal to the daily change in value of the futures contract. Such payments or receipts are recorded for financial statement purposes as unrealized gains or losses by a Fund. Variation margin does not represent a borrowing or loan by a Fund but is instead a settlement between a Fund and the broker of the amount one would owe the other if the futures contract expired. When the contract is closed, a Fund records a realized gain or loss equal to the difference between the value of the contract at the time it was opened and the value at the time it was closed. As of October 31, 2012, Jefferies Asset Management Commodity Strategy Allocation Fund had futures contracts outstanding with a net unrealized appreciation/(depreciation) of $426,506. The other Funds held no futures contracts at October 31, 2012. The number of futures contracts held at October 31, 2012 is representative of futures contracts activity during the six months ended October 31, 2012 .
Derivatives Instruments: The following tables disclose the amounts related to each Fund’s use of derivative instruments.
The effect of derivatives instruments on the Balance Sheet as of October 31, 2012:
| Asset Derivatives | Liability Derivatives | |||||||||||
| Derivative Instruments | Balance Sheet Location | Fair Value | Balance Sheet Location | Fair Value | ||||||||
Jefferies Asset Management Commodity Strategy Allocation Fund | ||||||||||||
Commodity Contracts (futures) | Variation margin receivable | $ | 477,486 | Payable for variation margin | $ | 50,980 | ||||||
Commodity Contracts (swaps) | Unrealized appreciation on total return swap contracts | 1,927,064 | Unrealized depreciation on total return swap contracts | 8,962,462 | ||||||||
| ||||||||||||
Total | $ | 2,404,550 | $ | 9,013,442 | ||||||||
| ||||||||||||
The effect of derivatives instruments on the Statement of Operations for the six months ended October 31, 2012:
| Derivatives Instruments | Location of Gain/(Loss) On Derivatives Recognized in Income | Realized Gain/(Loss) On Derivatives Recognized in Income | Change in Unrealized (Depreciation) Recognized in Income | |||||||
ALPS | Kotak India Growth Fund |
| |||||||||
Equity Contracts (futures) | Net realized gain on futures contracts/Net change in unrealized appreciation on futures contracts | $ | 671 | $ | 0 | |||||
| ||||||||||
Total | $ | 671 | 0 | |||||||
| ||||||||||
123 | October 31, 2012
Table of Contents
Notes to Financial Statements | ||
| October 31, 2012 (Unaudited) |
| Derivatives Instruments | Location of Gain/(Loss) On Derivatives Recognized in Income | Realized Gain/(Loss) On Income | Change in Unrealized Income | |||
Jefferies Asset Management Commodity Strategy Allocation Fund | ||||||
Futures Contracts* | Net realized loss on futures contracts/Net change in unrealized appreciation on futures contracts | $ (429,157) | $ 428,043 | |||
Commodity Contracts (swaps) | Net realized loss on total return swap contracts/Net change in unrealized depreciation on total return swap contracts | (899,521) | (5,573,072) | |||
| ||||||
Total | $ (1,328,678) | (5,145,029) | ||||
| ||||||
| *Risk Exposure to Fund | ||||||||
| Commodity Contracts | $ | 432,838 | $ 428,043 | |||||
| Equity Contracts | (862,236 | ) | 0 | |||||
| Foreign Currency Contracts | 241 | 0 | ||||||
|
| |||||||
| $ | (429,157 | ) | $ 428,043 | |||||
|
| |||||||
4. TAX BASIS INFORMATION
Tax Basis of Distributions to Shareholders: The character of distributions made during the year from net investment income or net realized gains may differ from its ultimate characterization for federal income tax purposes. Also, due to the timing of dividend distributions, the fiscal year in which amounts are distributed may differ from the fiscal year in which the income or realized gain were recorded by a Fund. The amounts and characteristics of tax basis distributions and composition of distributable earnings/(accumulated losses) are finalized.
The tax character of distributions paid by the Funds for the fiscal year or period ended April 30, 2012 is as follows:
| Fund | Ordinary Income | Distributions paid from: 2012 Long-Term Capital Gain | Return of Capital | |||||||||
ALPS | Kotak India Growth Fund | $ | 2,599 | $ | 0 | $ | 0 | ||||||
ALPS | Red Rocks Listed Private Equity Fund | 13,244,157 | 0 | 0 | |||||||||
ALPS | WMC Disciplined Value Fund | 535,003 | 0 | 0 | |||||||||
Clough China Fund | 0 | 0 | 0 | |||||||||
Jefferies Asset Management Commodity Strategy Allocation Fund | 8,501,893 | 639,478 | 0 | |||||||||
RiverFront Conservative Income Builder Fund | N/A | N/A | N/A | |||||||||
RiverFront Dynamic Equity Income Fund | 289,493 | 0 | 17,411 | |||||||||
RiverFront Global Allocation Fund | 123,429 | 6,669 | 0 | |||||||||
RiverFront Global Growth Fund | 2,586,518 | 1,500,914 | 0 | |||||||||
RiverFront Moderate Growth & Income Fund | 758,987 | 0 | 27,381 | |||||||||
Capital Losses: As of April 30, 2012 the following Funds had capital loss carryforwards which may reduce the Funds’ taxable income arising from future net realized gains on investments, if any, to the extent permitted by the Code and thus may reduce the amount of the distributions to shareholders which would otherwise be necessary to relieve the Funds of any liability for federal tax. Pursuant to the Code, such capital loss carryforwards will expire as follows:
Pre-Enactment Capital Losses:
| Fund | Expiring 4/30/2016 | Expiring 4/30/2017 | Expiring 4/30/2018 | |||||||||
ALPS | Kotak India Growth Fund | $ | 0 | $ | 0 | $ | 0 | ||||||
ALPS | Red Rocks Listed Private Equity Fund | 0 | 0 | 8,281,739 | |||||||||
ALPS | WMC Disciplined Value Fund | 7,146,132 | 2,780,282 | 0 | |||||||||
Clough China Fund | 0 | 0 | 0 | |||||||||
Jefferies Asset Management Commodity Strategy Allocation Fund | 0 | 0 | 0 | |||||||||
124 | October 31, 2012
Table of Contents
Notes to Financial Statements | ||
| October 31, 2012 (Unaudited) |
| Fund | Expiring 4/30/2016 | Expiring 4/30/2017 | Expiring 4/30/2018 | |||||||||
RiverFront Conservative Income Builder Fund | N/A | N/A | N/A | |||||||||
RiverFront Dynamic Equity Income Fund | 0 | 0 | 0 | |||||||||
RiverFront Global Allocation Fund | 0 | 0 | 0 | |||||||||
RiverFront Global Growth Fund | 0 | 0 | 0 | |||||||||
RiverFront Moderate Growth & Income Fund | 0 | 0 | 0 | |||||||||
Under the recently enacted Regulated Investment Company Modernization Act of 2010, capital losses incurred by each Fund after January 1, 2011 will not be subject to expiration. In addition, such losses must be utilized prior to the losses incurred in the years preceding enactment.
Post-Enactment Capital Losses*
Capital losses deferred to next tax year were as follows:
| Fund | Short-Term | Long-Term | ||||||
ALPS | Kotak India Growth Fund | $ | 131,301 | $ | 0 | ||||
ALPS | Red Rocks Listed Private Equity Fund | 0 | 4,048,305 | ||||||
ALPS | WMC Disciplined Value Fund | 0 | 0 | ||||||
Clough China Fund | 554,925 | 0 | ||||||
Jefferies Asset Management Commodity Strategy Allocation Fund | 0 | 0 | ||||||
RiverFront Conservative Income Builder Fund | N/A | N/A | ||||||
RiverFront Dynamic Equity Income Fund | 703,320 | 0 | ||||||
RiverFront Global Allocation Fund | 763,613 | 2,317 | ||||||
RiverFront Global Growth Fund | 326,114 | 0 | ||||||
RiverFront Moderate Growth & Income Fund | 1,279,511 | 0 | ||||||
The Fund elects to defer to the year ending April 30, 2013, capital losses recognized during the period November 1, 2011–April 30, 2012 in the amount of:
| Fund | Amount | |||
ALPS | Kotak India Growth Fund | $ | 141,010 | ||
ALPS | Red Rocks Listed Private Equity Fund | 4,219,436 | |||
ALPS | WMC Disciplined Value Fund | 52,958 | |||
Clough China Fund | 2,990,969 | |||
Jefferies Asset Management Commodity Strategy Allocation Fund | 0 | |||
RiverFront Conservative Income Builder Fund | N/A | |||
RiverFront Dynamic Equity Income Fund | 456,157 | |||
RiverFront Global Allocation Fund | 210,083 | |||
RiverFront Global Growth Fund | 1,147,115 | |||
RiverFront Moderate Growth & Income Fund | 530,349 | |||
The Fund elects to defer to the year ending April 30, 2013, late year ordinary losses in the amount of: |
| |||
| Fund | Amount | |||
ALPS | Kotak India Growth Fund | $ | 23,621 | ||
ALPS | Red Rocks Listed Private Equity Fund | 0 | |||
ALPS | WMC Disciplined Value Fund | 0 | |||
Clough China Fund | 0 | |||
Jefferies Asset Management Commodity Strategy Allocation Fund | 130,655 | |||
RiverFront Conservative Income Builder Fund | N/A | |||
RiverFront Dynamic Equity Income Fund | 0 | |||
RiverFront Global Allocation Fund | 0 | |||
RiverFront Global Growth Fund | 0 | |||
RiverFront Moderate Growth & Income Fund | 0 | |||
| * | Post-Enactment Capital Losses arise in fiscal years beginning after December 22, 2010, and exclude any elective late-year capital losses (during the period November 1st to December 31st) deferred for the current fiscal year. As a result of the enactment of the Regulated Investment Company Act of 2010, pre-enactment capital loss carryforwards may be more likely to expire unused. Additionally, post-enactment capital losses that are carried forward will retain their character as either short-term or long-term losses rather than being considered all short-term as under previous law. |
125 | October 31, 2012
Table of Contents
Notes to Financial Statements | ||
| October 31, 2012 (Unaudited) |
Unrealized Appreciation and Depreciation on Investments: As of October 31, 2012, the costs of investments for federal income tax purposes and accumulated net unrealized appreciation/(depreciation) on investments were as follows:
| Fund | Gross Appreciation (excess of value over tax cost) | Gross Depreciation (excess of value over tax cost) | Net Unrealized Appreciation/ (Depreciation) | Cost of Investments for Income Tax Purposes | ||||||||||||
ALPS | Kotak India Growth Fund | $ | 546,572 | $ | (519,265 | ) | $ | 27,307 | $ | 5,527,427 | |||||||
ALPS | Red Rocks Listed Private Equity Fund | 19,095,462 | (5,101,845 | ) | 13,993,617 | 160,600,177 | |||||||||||
ALPS | WMC Disciplined Value Fund | 14,626,413 | (2,305,152 | ) | 12,321,261 | 64,139,715 | |||||||||||
Clough China Fund | 6,836,841 | (168,607 | ) | 6,668,234 | 46,172,338 | |||||||||||
Jefferies Asset Management Commodity Strategy Allocation Fund | 9,494,955 | (8,301,688 | ) | 1,193,267 | 261,167,808 | |||||||||||
RiverFront Conservative Income Builder Fund | 4,475 | (4,810 | ) | (335 | ) | 667,992 | ||||||||||
RiverFront Dynamic Equity Income Fund | 1,655,750 | (232,274 | ) | 1,423,476 | 25,903,941 | |||||||||||
RiverFront Global Allocation Fund | 1,110,486 | (164,327 | ) | 946,159 | 18,159,001 | |||||||||||
RiverFront Global Growth Fund | 5,520,054 | (264,012 | ) | 5,256,042 | 43,366,466 | |||||||||||
RiverFront Moderate Growth & Income Fund | 4,284,090 | (402,755 | ) | 3,881,335 | 81,280,898 | |||||||||||
| 5. SECURITIES TRANSACTIONS | ||||||||||||||||
Purchases and sales of securities, excluding short-term securities during the period ended October 31, 2012 were as follows:
| Fund | Purchases of Securities | Proceeds From Sales of Securities | ||||||
ALPS | Kotak India Growth Fund | $ | 3,507,931 | $ | 2,594,219 | ||||
ALPS | Red Rocks Listed Private Equity Fund | 28,671,363 | 28,571,241 | ||||||
ALPS/WMC Disciplined Value Fund | 9,867,013 | 15,349,538 | ||||||
Clough China Fund | 50,788,542 | 63,562,367 | ||||||
Jefferies Asset Management Commodity Strategy Allocation Fund | 160,216,557 | 121,985,243 | ||||||
RiverFront Conservative Income Builder Fund | 745,947 | 77,438 | ||||||
RiverFront Dynamic Equity Income Fund | 14,580,816 | 14,398,585 | ||||||
RiverFront Global Allocation Fund | 8,960,127 | 8,667,914 | ||||||
RiverFront Global Growth Fund | 20,192,778 | 24,104,536 | ||||||
RiverFront Moderate Growth & Income Fund | 48,061,955 | 32,891,878 | ||||||
Investment Transactions in U.S. Government Obligations for the period ended October 31, 2012 were as follows:
| Fund | Purchases of Securities | Proceeds from Sales of Securities | ||||||
Jefferies Asset Management Commodity Strategy Allocation Fund | $ | 103,729,361 | $ | 71,003,967 | ||||
126 | October 31, 2012
Table of Contents
Notes to Financial Statements | ||
| October 31, 2012 (Unaudited) |
6. BENEFICIAL INTEREST TRANSACTIONS
Shares redeemed within 90 days of purchase may incur a 2% short-term redemption fee deducted from the redemption amount, with the exception of ALPS | WMC Disciplined Value Fund, RiverFront Conservative Income Builder Fund, RiverFront Dynamic Equity Income Fund, RiverFront Global Allocation Fund, RiverFront Global Growth Fund, and RiverFront Moderate Growth & Income Fund shares. For the six months ended October 31, 2012, the amounts listed below were retained by the Funds. These amounts are reflected in “Shares redeemed” in the Statement of Changes in Net Assets.
| Fund | Redemption Fee Retained | |||
ALPS | Kotak India Growth Fund - Class A | $ | 94 | ||
ALPS | Red Rocks Listed Private Equity Fund - Class A | 7,647 | |||
ALPS | Red Rocks Listed Private Equity Fund - Class C | 50 | |||
ALPS | Red Rocks Listed Private Equity Fund - Class I | 3,579 | |||
Clough China Fund - Class A | 5 | |||
Clough China Fund - Class C | 2 | |||
Clough China Fund - Class I | 6 | |||
Jefferies Asset Management Commodity Strategy Allocation Fund - Class A | 12,929 | |||
Jefferies Asset Management Commodity Strategy Allocation Fund - Class C | 5 | |||
Jefferies Asset Management Commodity Strategy Allocation Fund - Class I | 5,405 | |||
Transactions in shares of capital stock were as follows:
| ALPS | Kotak India Growth Fund | ||||||||
For the Six Months Ended | For the Year Ended April 30, 2012 | |||||||
Class A | ||||||||
Shares sold | 106,995 | 260,500 | ||||||
Dividends reinvested | – | 131 | ||||||
Shares redeemed | (72,241 | ) | (58,587 | ) | ||||
Net increase in shares outstanding | 34,754 | 202,044 | ||||||
Class C | ||||||||
Shares sold | 22,994 | 70,152 | ||||||
Dividends reinvested | – | 72 | ||||||
Shares redeemed | (2,450 | ) | (61,930 | ) | ||||
Net increase in shares outstanding | 20,544 | 8,295 | ||||||
Class I | ||||||||
Shares sold | 57,369 | 166,157 | ||||||
Dividends reinvested | – | 137 | ||||||
Shares redeemed | (5,946 | ) | (26,308 | ) | ||||
Net increase in shares outstanding | 51,423 | 139,986 | ||||||
127 | October 31, 2012
Table of Contents
Notes to Financial Statements | ||
| October 31, 2012 (Unaudited) |
| ALPS | Red Rocks Listed Private Equity Fund | ||||||||
For the Six Months Ended | For the Year Ended | |||||||
Class A | ||||||||
Shares sold | 2,433,993 | 11,295,795 | ||||||
Dividends reinvested | – | 1,751,134 | ||||||
Shares redeemed | (4,617,299) | (14,073,795) | ||||||
Net decrease in shares outstanding | (2,183,306) | (1,026,866) | ||||||
Class C | ||||||||
Shares sold | 67,462 | 326,458 | ||||||
Dividends reinvested | – | 43,901 | ||||||
Shares redeemed | (77,342) | (154,304) | ||||||
Net increase/(decrease) in shares outstanding | (9,880) | 216,055 | ||||||
Class I | ||||||||
Shares sold | 4,498,833 | 10,460,936 | ||||||
Dividends reinvested | – | 488,167 | ||||||
Shares redeemed | (2,780,540) | (4,705,661) | ||||||
Net increase in shares outstanding | 1,718,293 | 6,243,442 | ||||||
Class R | ||||||||
Shares sold | 1,493 | 8,748 | ||||||
Dividends reinvested | – | 2,430 | ||||||
Shares redeemed | (1,205) | (21,597) | ||||||
Net increase/(decrease) in shares outstanding | 288 | (10,419) | ||||||
| ALPS/WMC Disciplined Value Fund | ||||||||
For the Six Months Ended | For the Year Ended | |||||||
Class A | ||||||||
Shares sold | 22,974 | 264,467 | ||||||
Dividends reinvested | – | 39,233 | ||||||
Shares redeemed | (279,917) | (620,273) | ||||||
Net decrease in shares outstanding | (256,943) | (316,573) | ||||||
Class C | ||||||||
Shares sold | – | 7,803 | ||||||
Dividends reinvested | – | 4 | ||||||
Shares redeemed | – | – | ||||||
Net increase in shares outstanding | – | 7,807 | ||||||
Class I | ||||||||
Shares sold | 171,660 | 1,067,103 | ||||||
Dividends reinvested | – | 33,463 | ||||||
Shares redeemed | (581,254) | (381,661) | ||||||
Net increase/(decrease) in shares outstanding | (409,594) | 718,905 | ||||||
128 | October 31, 2012
Table of Contents
Notes to Financial Statements | ||
| October 31, 2012 (Unaudited) |
| Clough China Fund | ||||||||
For the Six Months Ended October 31, 2012 (Unaudited) | For the Year Ended April 30, 2012 | |||||||
Class A | ||||||||
Shares sold | 54,974 | 209,926 | ||||||
Dividends reinvested | – | – | ||||||
Shares redeemed | (281,391) | (674,790) | ||||||
Net decrease in shares outstanding | (226,417) | (464,864) | ||||||
Class C | ||||||||
Shares sold | 13,174 | 122,497 | ||||||
Dividends reinvested | – | – | ||||||
Shares redeemed | (132,241) | (289,141) | ||||||
Net decrease in shares outstanding | (119,067) | (166,644) | ||||||
Class I | ||||||||
Shares sold | 87,176 | 188,409 | ||||||
Dividends reinvested | – | – | ||||||
Shares redeemed | (622,143) | (573,633) | ||||||
Net decrease in shares outstanding | (534,967) | (385,224) | ||||||
Jefferies Asset Management Commodity Strategy Allocation Fund | ||||
For the Six Months Ended (Unaudited) | For the Year Ended April 30, 2012 | |||||||
Class A | ||||||||
Shares sold | 5,083,333 | 6,933,626 | ||||||
Dividends reinvested | 20,382 | 218,828 | ||||||
Shares redeemed | (2,369,438) | (2,074,763) | ||||||
Net increase in shares outstanding | 2,734,277 | 5,077,691 | ||||||
Class C | ||||||||
Shares sold | 403,058 | 1,202,707 | ||||||
Dividends reinvested | 1,852 | 39,730 | ||||||
Shares redeemed | (181,068) | (137,380) | ||||||
Net increase in shares outstanding | 223,842 | 1,105,057 | ||||||
Class I | ||||||||
Shares sold | 6,946,039 | 5,629,924 | ||||||
Dividends reinvested | 24,057 | 353,517 | ||||||
Shares redeemed | (1,333,907) | (3,645,315) | ||||||
Net increase in shares outstanding | 5,636,189 | 2,338,126 | ||||||
129 | October 31, 2012
Table of Contents
Notes to Financial Statements | ||
| October 31, 2012 (Unaudited) |
RiverFront Conservative Income Builder Fund | ||||
For the Period August 31, 2012 (Inception) to October 31, 2012 | ||||
Class A | ||||
Shares sold | 7,280 | |||
Dividends reinvested | – | |||
Shares redeemed | – | |||
Net increase in shares outstanding | 7,280 | |||
Class C | ||||
Shares sold | 25,240 | |||
Dividends reinvested | – | |||
Shares redeemed | (3) | |||
Net increase in shares outstanding | 25,237 | |||
Class I | ||||
Shares sold | 36,001 | |||
Dividends reinvested | – | |||
Shares redeemed | – | |||
Net increase in shares outstanding | 36,001 | |||
| RiverFront Dynamic Equity Income Fund | ||||||||
For the Six Months Ended October 31, 2012 (Unaudited) | For the Year Ended | |||||||
Class A | ||||||||
Shares sold | 93,933 | 530,316 | ||||||
Dividends reinvested | 4,398 | 8,166 | ||||||
Shares redeemed | (186,556 | ) | (393,279 | ) | ||||
Net increase/(decrease) in shares outstanding | (88,225 | ) | 145,203 | |||||
Class C | ||||||||
Shares sold | 196,354 | 593,935 | ||||||
Dividends reinvested | 6,930 | 10,526 | ||||||
Shares redeemed | (166,531 | ) | (162,608 | ) | ||||
Net increase in shares outstanding | 36,753 | 441,853 | ||||||
Class I | ||||||||
Shares sold | 145,432 | 484,688 | ||||||
Dividends reinvested | 5,672 | 8,154 | ||||||
Shares redeemed | (143,721 | ) | (158,669 | ) | ||||
Net increase in shares outstanding | 7,383 | 334,173 | ||||||
130 | October 31, 2012
Table of Contents
Notes to Financial Statements | ||
| October 31, 2012 (Unaudited) |
| RiverFront Global Allocation Fund | ||||||||
For the Six Months Ended | For the Year Ended | |||||||
Class A | ||||||||
Shares sold | 132,737 | 663,389 | ||||||
Dividends reinvested | – | 6,128 | ||||||
Shares redeemed | (60,274) | (538,507) | ||||||
Net increase in shares outstanding | 72,463 | 131,010 | ||||||
Class C | ||||||||
Shares sold | 81,909 | 437,383 | ||||||
Dividends reinvested | – | 2,628 | ||||||
Shares redeemed | (209,230) | (291,982) | ||||||
Net increase/(decrease) in shares outstanding | (127,321) | 148,029 | ||||||
Class I | ||||||||
Shares sold | 147,347 | 411,287 | ||||||
Dividends reinvested | – | 3,591 | ||||||
Shares redeemed | (96,252) | (253,648) | ||||||
Net increase in shares outstanding | 51,095 | 161,230 | ||||||
| RiverFront Global Growth Fund | ||||||||
For the Six Months Ended | For the Year Ended April 30, 2012 | |||||||
Class A | ||||||||
Shares sold | 173,219 | 209,866 | ||||||
Dividends reinvested | – | 38,770 | ||||||
Shares redeemed | (59,321) | (642,942) | ||||||
Net increase/(decrease) in shares outstanding | 113,898 | (394,306) | ||||||
Class C | ||||||||
Shares sold | 68,947 | 246,379 | ||||||
Dividends reinvested | – | 37,231 | ||||||
Shares redeemed | (97,998) | (166,212) | ||||||
Net increase/(decrease) in shares outstanding | (29,051) | 117,398 | ||||||
Class I | ||||||||
Shares sold | 26,765 | 239,739 | ||||||
Dividends reinvested | – | 34,683 | ||||||
Shares redeemed | (142,329) | (112,688) | ||||||
Net increase/(decrease) in shares outstanding | (115,564) | 161,734 | ||||||
Class L | ||||||||
Shares sold | 55,964 | 525,916 | ||||||
Dividends reinvested | – | 145,946 | ||||||
Shares redeemed | (290,016) | (1,566,052) | ||||||
Net decrease in shares outstanding | (234,052) | (894,190) | ||||||
Investor Class | ||||||||
Shares sold | 7,632 | 24,645 | ||||||
Dividends reinvested | – | 61,817 | ||||||
Shares redeemed | (98,390) | (689,522) | ||||||
Net decrease in shares outstanding | (90,758) | (603,060) | ||||||
131 | October 31, 2012
Table of Contents
Notes to Financial Statements | ||
| October 31, 2012 (Unaudited) |
| RiverFront Moderate Growth & Income Fund | ||||||||
For the Six Months Ended (Unaudited) | For the April 30, 2012 | |||||||
Class A | ||||||||
Shares sold | 471,113 | 1,379,834 | ||||||
Dividends reinvested | 15,566 | 23,351 | ||||||
Shares redeemed | (222,671) | (604,739) | ||||||
Net increase in shares outstanding | 264,008 | 798,446 | ||||||
Class C | ||||||||
Shares sold | 900,558 | 2,019,096 | ||||||
Dividends reinvested | 18,551 | 23,356 | ||||||
Shares redeemed | (351,682) | (646,996) | ||||||
Net increase in shares outstanding | 567,427 | 1,395,456 | ||||||
Class I | ||||||||
Shares sold | 571,422 | 1,088,980 | ||||||
Dividends reinvested | 11,006 | 17,351 | ||||||
Shares redeemed | (265,330) | (609,818) | ||||||
Net increase in shares outstanding | 317,098 | 496,513 | ||||||
Beneficial Ownership: The beneficial ownership, either directly or indirectly, of more than 25% of the voting securities of any class of the Fund creates a presumption of control of the Fund under Section 2(a)(9) of the 1940 Act. As of October 31, 2012, the following entities owned beneficially 25% or greater of the Fund’s outstanding shares. The shares are held under omnibus accounts (whereby the transactions of two or more shareholders are combined and carried in the name of the originating broker rather than designated separately).
| Class | ALPS | Kotak India Growth Fund | Percentage | ||
I | Kotak Mahindra, Inc. | 35.54% | ||
| Class | ALPS | Red Rocks Listed Private Equity Fund | Percentage | ||
R | National Financial Services Corp. | 31.71% | ||
| Class | ALPS | WMC Disciplined Value Fund | Percentage | ||
C | Raymond James & Associates, Inc. | 83.21% | ||
I | Fidelity Investments Institutional | 100.00% | ||
| Class | Clough China Fund | Percentage | ||
A | Merrill Lynch | 30.15% | ||
C | Merrill Lynch | 45.53% | ||
I | Merrill Lynch | 69.16% | ||
| Class | Jefferies Asset Management Commodity Strategy Allocation Fund | Percentage | ||
I | Charles Schwab & Co., Inc. | 47.42% | ||
| Class | RiverFront Conservative Income Builder Fund | Percentage | ||
A | National Financial Services Corp. | 64.98% | ||
A | ALPS Fund Services, Inc. | 27.47% | ||
C | Robert W. Baird & Co., Inc. | 27.44% | ||
I | RiverFront Investment Group LLC | 55.55% | ||
I | ALPS Fund Services, Inc. | 44.44% | ||
| Class | RiverFront Dynamic Equity Fund | Percentage | ||
I | DCGT as TTEE and/or Custody | 29.67% | ||
| Class | RiverFront Global Allocation Fund | Percentage | ||
I | Charles Schwab & Co. | 42.01% | ||
132 | October 31, 2012
Table of Contents
Notes to Financial Statements | ||
| October 31, 2012 (Unaudited) |
| Class | RiverFront Global Growth Fund | Percentage | ||
I | Robert W. Baird & Co., Inc. | 33.89% | ||
L | DCGT as TTEE and/or Custody | 60.92% |
7. MANAGEMENT AND RELATED-PARTY TRANSACTIONS
ALPS Advisors, Inc. (“AAI” or “Advisor”), subject to the authority of the Board, is responsible for the overall management and administration of each Fund’s business affairs. AAI has delegated daily management of the Funds listed below to the corresponding Sub-Advisor listed in the table below. Each Sub-Advisor manages the investments of the Fund in accordance with its investment objective, policies and limitations and investment guidelines established jointly by the Advisor and the Board.
| Fund | Sub-Advisor | |
ALPS | Kotak India Growth Fund | Kotak Mahindra (UK) Limited | |
ALPS | Red Rocks Listed Private Equity Fund | Red Rocks Capital LLC | |
ALPS | WMC Disciplined Value Fund | Wellington Management Company, LLP | |
Clough China Fund | Clough Capital Partners, LP | |
Jefferies Asset Management Commodity Strategy Allocation Fund | CoreCommodity Management, LLC (formerly Jefferies Asset Management, LLC) | |
RiverFront Conservative Income Builder Fund | RiverFront Investment Group, LLC | |
RiverFront Dynamic Equity Income Fund | RiverFront Investment Group, LLC | |
RiverFront Global Allocation Fund | RiverFront Investment Group, LLC | |
RiverFront Global Growth Fund | RiverFront Investment Group, LLC | |
RiverFront Moderate Growth & Income Fund | RiverFront Investment Group, LLC |
Pursuant to the Investment Advisory Agreement (the “Advisory Agreement”), each Fund pays the Advisor an annual management fee which is based on the Fund’s average daily net assets. The management fee is paid on a monthly basis. The following table reflects the Funds’ contractual management fee rates (expressed as an annual rate).
| Fund | Contractual Management Fee | |||||
ALPS | Kotak India Growth Fund | 1.25 | % | ||||
ALPS | Red Rocks Listed Private Equity Fund | 0.85 | % | ||||
ALPS | WMC Disciplined Value Fund | 0.95 | %(a) | ||||
Clough China Fund | 1.35 | % | ||||
Jefferies Asset Management Commodity Strategy Allocation Fund | 0.85 | % | ||||
RiverFront Conservative Income Builder Fund | 0.85 | % | ||||
RiverFront Dynamic Equity Income Fund | 0.85 | %(b) | ||||
RiverFront Global Allocation Fund | 0.85 | %(b) | ||||
RiverFront Global Growth Fund | 0.85 | %(b) | ||||
RiverFront Moderate Growth & Income Fund | 0.85 | %(b) | ||||
| (a) | The contractual management fee is 0.95% for the first $250 million of net assets, 0.85% for the next $250 million of net assets, and 0.75% for net assets in excess of $500 million. |
| (b) | Prior to August 31, 2012, the contractual management fee was 0.90%. |
133 | October 31, 2012
Table of Contents
Notes to Financial Statements | ||
| October 31, 2012 (Unaudited) |
Pursuant to an Investment Sub-advisory Agreement, the Advisor pays each sub-advisor an annual sub-advisory management fee which is based on each Fund’s average daily assets. The Advisor is required to pay all fees due to each sub-advisor out of the management fee the Advisor receives from each Fund. The following table reflects the Funds’ contractual sub-advisory fee rates.
| Fund | Average Daily Net Assets of the Fund | Contractual Sub-Advisory Fee | ||
ALPS | Kotak India Growth Fund | First $50 Million | 1.15% | ||
| Over $50 Million | 1.05% | |||
ALPS | Red Rocks Listed Private Equity Fund | All Asset Levels | 0.57% | ||
ALPS | WMC Disciplined Value Fund | First $250 Million | 0.50% | ||
| $250 Million -$500 Million | 0.40% | |||
| Over $500 Million | 0.30% | |||
Clough China Fund | All Asset Levels | 0.90% | ||
Jefferies Asset Management Commodity Strategy Allocation Fund | All Asset Levels | 0.75% | ||
RiverFront Conservative Income Builder Fund | All Asset Levels | 0.60% | ||
RiverFront Dynamic Equity Income Fund | All Asset Levels | 0.60% | ||
RiverFront Global Allocation Fund | All Asset Levels | 0.60% | ||
RiverFront Global Growth Fund | All Asset Levels | 0.60% | ||
RiverFront Moderate Growth & Income Fund | All Asset Levels | 0.60% |
The Advisor and the Sub-Advisor have contractually agreed to limit the amount of each Fund’s total annual expenses, exclusive of distribution and service (12b-1) fees (except Clough China Class A, Class C and Class I shares), shareholder service fees (except ALPS | Red Rocks Listed Private Equity Class A shares, ALPS | WMC Disciplined Value Class A shares, and Clough China Class C shares), acquired fund fees and expenses, brokerage expenses, interest expense, short sale dividend expense, taxes and extraordinary expenses, that exceed the following annual rates below. These agreements are reevaluated on an annual basis based on the terms disclosed below.
| Fund | Class A | Class C | Class I | Class Inv | Class L | Class R | Term of Expense Limit Agreement | |||||||||||||||
ALPS | Kotak India Growth Fund | 1.60 | % | 1.60 | % | 1.60 | % | N/A | N/A | N/A | 9/1/12 - 8/31/13 | ||||||||||||
ALPS | Red Rocks Listed Private Equity Fund | 1.25 | % | 1.25 | % | 1.25 | % | N/A | N/A | 1.25% | 9/1/12 - 8/31/13 | ||||||||||||
ALPS | WMC Disciplined Value Fund | 1.15 | % | 1.15 | % | 1.15 | % | N/A | N/A | N/A | 9/1/12 - 8/31/13 | ||||||||||||
Clough China Fund | 1.95 | % | 2.70 | % | 1.70 | % | N/A | N/A | N/A | 9/1/12 - 8/31/13 | ||||||||||||
Jefferies Asset Management Commodity Strategy Allocation Fund | 1.05 | % | 1.05 | % | 1.15 | % | N/A | N/A | N/A | 9/1/12 - 8/31/13 | ||||||||||||
RiverFront Conservative Income Builder Fund | 0.90 | % | 0.90 | % | 0.90 | % | N/A | N/A | N/A | 9/1/12 - 8/31/13 | ||||||||||||
RiverFront Dynamic Equity Income Fund | 0.90 | %(a) | 0.90 | %(a) | 0.90 | %(a) | N/A | N/A | N/A | 9/1/12 - 8/31/13 | ||||||||||||
RiverFront Global Allocation Fund | 0.90 | %(a) | 0.90 | %(a) | 0.90 | %(a) | N/A | N/A | N/A | 9/1/12 - 8/31/13 | ||||||||||||
RiverFront Global Growth Fund | 0.90 | % | 0.90 | % | 0.90 | % | 0.90% | 0.90% | N/A | 9/1/12 - 8/31/13 | ||||||||||||
RiverFront Moderate Growth & Income Fund | 0.90 | %(a) | 0.90 | %(a) | 0.90 | %(a) | N/A | N/A | N/A | 9/1/12 - 8/31/13 | ||||||||||||
| (a) | Prior to September 1, 2012, the Advisor and the Sub-Advisor had contractually agreed to limit the amount of each Fund’s total annual expenses, to 1.05% for Class A, Class C and Class I, respectively. |
The Advisor and Sub-Advisor have contractually agreed to reimburse Acquired Fund Fees and Expenses of the RiverFront Global Growth Fund through December 31, 2012.
The Advisor and each Sub-Advisor are permitted to recover expenses they have waived or reimbursed, on a class-by-class basis, through the agreements described above to the extent that expenses in later periods fall below the annual limits set forth in these agreements. Clough China Fund is not obligated to pay any such waived or reimbursed fees and expenses more than one year after the end of the fiscal year in which the fees or expenses were waived or reimbursed. The Jefferies Asset Management Commodity Strategy Allocation Fund is not obligated to pay any such waived or reimbursed fees and expenses more than two years after the end of the fiscal year in which the fees or expenses were waived or reimbursed. The ALPS | Kotak India Growth Fund, ALPS | Red Rocks Listed Private Equity Fund, ALPS | WMC Disciplined Value Fund, RiverFront Global Growth Fund, RiverFront Dynamic Equity Income Fund, RiverFront Global Allocation Fund and RiverFront Moderate Growth & Income Fund are not obligated to pay any such waived or reimbursed fees and expenses more than three years after the end of the fiscal year in which the fees or expenses were waived or reimbursed. At April 30, 2012, the Advisor and Sub-Advisor may seek reimbursement of previously waived and reimbursed fees as follows:
134 | October 31, 2012
Table of Contents
Notes to Financial Statements | ||
| October 31,2012 (Unaudited) |
| Expires 2013 | Expires 2014 | Expires 2015 | Total | |||||||||||||||||
ALPS | Kotak India Growth Fund | $ | N/A | $ | 110,597 | $ | 375,232 | $ | 485,829 | ||||||||||||
ALPS | Red Rocks Listed Private Equity Fund | 210,797 | 210,869 | 296,865 | 718,531 | ||||||||||||||||
ALPS | WMC Disciplined Value Fund | N/A | N/A | 117,336 | 117,336 | ||||||||||||||||
Clough China Fund | N/A | N/A | 118,784 | 118,784 | ||||||||||||||||
Jefferies Asset Management Commodity Strategy Allocation Fund | N/A | 298,504 | 248,308 | 546,812 | ||||||||||||||||
RiverFront Conservative Income Builder Fund | N/A | N/A | N/A | N/A | ||||||||||||||||
RiverFront Dynamic Equity Income Fund | N/A | 54,560 | 100,877 | 155,437 | ||||||||||||||||
RiverFront Global Allocation Fund | N/A | 69,932 | 103,414 | 173,346 | ||||||||||||||||
RiverFront Global Growth Fund | 105,476 | 100,360 | 230,267 | 436,103 | ||||||||||||||||
RiverFront Moderate Growth & Income Fund | N/A | 69,535 | 117,687 | 187,222 | ||||||||||||||||
ALPS Distributors, Inc. (the “Distributor”) acts as the distributor of the Funds’ shares pursuant to a Distribution Agreement with the Trust. Shares are sold on a continuous basis by ADI as agent for the Funds, and ADI has agreed to use its best efforts to solicit orders for the sale of Funds’ shares, although it is not obliged to sell any particular amount of shares. ADI is not entitled to any compensation for its services as Distributor. ADI is registered as a broker-dealer with the Securities and Exchange Commission.
Each Fund has adopted a Distribution and Services Plan (the “Plan”) pursuant to Rule 12b-1 of the 1940 Act for the Class A, Class C, Class R (ALPS |Red Rocks Listed Private Equity Fund only), and Investor Class (RiverFront Long-Term Growth Fund only) shares. The Plan allows a Fund to use Class A, Class C, Class R and Investor Class assets to pay fees in connection with the distribution and marketing of Class A, Class C, Class R and Investor Class shares and/or the provision of shareholder services to Class A, Class C, Class R and Investor Class shareholders. The Plan permits payment for services in connection with the administration of plans or programs that use Class A, Class C, Class R and Investor Class shares of a Fund, if any, as their funding medium and for related expenses. The Plan permits a Fund to make total payments at an annual rate of up to 0.25% of a Fund’s average daily net assets attributable to its Class A and Investor Class shares, 0.75% of a Fund’s average daily net assets attributable to its Class C shares and 0.50% of the ALPS | Red Rocks Listed Private Equity Fund’s average daily net assets attributable to its Class R shares. Because these fees are paid out of a Fund’s Class A, Class C, Class R and Investor Class assets, if any, on an ongoing basis, over time they will increase the cost of an investment in Class A, Class C, Class R and Investor Class shares, if any, and Plan fees may cost an investor more than other types of sales charges.
The ALPS | Kotak India Growth Fund Class A and Class C shares, ALPS | Red Rocks Listed Private Equity Fund Class A and Class C shares, ALPS | WMC Disciplined Value Fund Class C shares, Clough China Fund Class C shares, Jefferies Commodity Strategy Allocation Fund Class A and Class C shares, RiverFront Conservative Income Builder Fund Class C shares, RiverFront Dynamic Equity Income Fund Class C shares, RiverFront Global Allocation Fund Class C shares, RiverFront Global Growth Fund Class C Shares, and the RiverFront Moderate Growth & Income Fund Class C shares have adopted a shareholder services plan (“Shareholder Services Plan”). Under the Shareholder Services Plan for each Fund, the Funds are authorized to pay banks and their affiliates and other institutions, including broker-dealers and Fund affiliates (“Participating Organizations”), an aggregate fee in an amount not to exceed on an annual basis 0.15% for ALPS | Kotak India Growth Fund Class A shares, ALPS | Red Rocks Listed Private Equity Fund Class A shares, and Jefferies Commodity Strategy Allocation Fund Class A shares, and not to exceed 0.25% for the ALPS | Kotak India Growth Fund Class C shares, ALPS | Red Rocks Listed Private Equity Fund Class C shares, ALPS | WMC Disciplined Value Fund Class C shares, Clough China Fund Class C shares, Jefferies Commodity Strategy Allocation Fund Class C shares, RiverFront Conservative Income Builder Fund Class C shares, RiverFront Dynamic Equity Income Fund Class C shares, RiverFront Global Allocation Fund Class C shares, RiverFront Global Growth Fund Class C Shares, and the RiverFront Moderate Growth & Income Fund Class C shares of the average daily net asset value of the Class A shares and Class C shares, respectively, attributable to or held in the name of a Participating Organization for its clients as compensation for providing shareholder service activities, which do not include distribution services, pursuant to an agreement with a Participating Organization. Shareholder Services plan fees are included with distribution and service fees on the Statement of Operations.
Networking fees, certain intermediaries may charge networking, omnibus account or other administrative fees with respect to transactions in shares of each Fund. Transactions may be processed through the National Securities Clearing Corporation or similar systems or processed on a manual basis. These fees are paid by the Fund to the Distributor, which uses such fees to reimburse intermediaries. In the event an intermediary receiving payments from the Distributor on behalf of the Fund converts from a networking structure to an omnibus account structure or otherwise experiences increased costs, fees borne by the Fund may increase. Networking fees are shown in the Statement of Operations, if applicable to the Fund.
ALPS Fund Services, Inc. (“ALPS”) serves as administrator to the Funds and the Funds have agreed to pay expenses incurred in connection with their administrative activities. Pursuant to an Administrative Agreement, ALPS provides operational services to the Funds including, but not limited to fund accounting and fund administration and generally assists in the Funds’ operations.
135 | October 31, 2012
Table of Contents
Notes to Financial Statements | ||
| October 31, 2012 (Unaudited) |
The Annual Administrative Fee is based on each Fund’s average daily net assets and will be billed monthly, at the following:
| Fund | Average Daily Net Assets of the Fund | Annual Administrative Fee | ||
ALPS | Kotak India Growth Fund | All Asset Levels | 0.15% | ||
ALPS | Red Rocks Listed Private Equity Fund | First $500 Million | 0.08% | ||
| $500 Million-$1 Billion | 0.06% | |||
| Over $1 Billion | 0.04% | |||
ALPS | WMC Disciplined Value Fund | All Asset Levels | 0.15% | ||
Clough China Fund | All Asset Levels | 0.15% | ||
Jefferies Asset Management Commodity Strategy Allocation Fund | All Asset Levels | 0.10%* | ||
RiverFront Conservative Income Builder Fund | All Asset Levels | 0.10% | ||
RiverFront Dynamic Equity Income Fund | All Asset Levels | 0.10% | ||
RiverFront Global Allocation Fund | All Asset Levels | 0.10% | ||
RiverFront Global Growth Fund | All Asset Levels | 0.10% | ||
RiverFront Moderate Growth & Income Fund | All Asset Levels | 0.10% |
* Subject to a minimum annual fee of $57,140.
8. TRANSACTIONS WITH AFFILIATES
For the six months ended October 31, 2012, the following Funds recorded distributions from affiliated investment companies as affiliated dividend income, and had the following affiliated purchases and sales:
RiverFront Conservative Income Builder Fund
| Security Name | Share Balance April 30, 2012 | Purchases | Sales | Share Balance October 31, 2012 | Dividend Income | Realized Gain | Market Value October 31, 2012 | |||||||||||||||||||||
| ||||||||||||||||||||||||||||
Health Care Select Sector SPDR® Fund | – | 91 | 91 | – | $ | – | $ | 72 | $ | – | ||||||||||||||||||
| ||||||||||||||||||||||||||||
Utilities Select Sector SPDR® Fund | – | 110 | – | 110 | 36 | – | 4,056 | |||||||||||||||||||||
| ||||||||||||||||||||||||||||
| $ | 36 | $ | 72 | $ | 4,056 | |||||||||||||||||||||||
| ||||||||||||||||||||||||||||
| RiverFront Dynamic Equity Income Fund | ||||||||||||||||||||||||||||
| Security Name | Share Balance 2012 | Purchases | Sales | Share Balance October 31, 2012 | Dividend Income | Realized Gain/ | Market Value October 31, 2012 | |||||||||||||||||||||
| ||||||||||||||||||||||||||||
Consumer Discretionary Select Sector SPDR® Fund | – | 7,432 | 7,432 | – | $ | 1,095 | $ | (3,850 | ) | $ | – | |||||||||||||||||
| ||||||||||||||||||||||||||||
Health Care Select Sector SPDR® Fund | 15,042 | 214 | 15,256 | – | 2,935 | 67,399 | – | |||||||||||||||||||||
| ||||||||||||||||||||||||||||
Utilities Select Sector | 17,503 | 233 | 405 | 17,331 | 12,510 | (4 | ) | 638,994 | ||||||||||||||||||||
| ||||||||||||||||||||||||||||
| $ | 16,540 | $ | 67,545 | $ | 638,994 | |||||||||||||||||||||||
| ||||||||||||||||||||||||||||
| RiverFront Global Allocation Fund | ||||||||||||||||||||||||||||
| Security Name | Share Balance | Purchases | Sales | Share Balance October 31, 2012 | Dividend Income | Realized Gain | Market October 31, 2012 | |||||||||||||||||||||
| ||||||||||||||||||||||||||||
Consumer Discretionary Select Sector SPDR® Fund | 5,993 | – | 5,993 | – | $ | 910 | $ | 39,069 | $ | – | ||||||||||||||||||
| ||||||||||||||||||||||||||||
Health Care Select Sector SPDR® Fund | 5,588 | 154 | 263 | 5,479 | 2,814 | 779 | 219,160 | |||||||||||||||||||||
| ||||||||||||||||||||||||||||
Utilities Select Sector SPDR® Fund | – | 6,298 | 3,293 | 3,005 | 3,245 | 3,099 | 110,794 | |||||||||||||||||||||
| ||||||||||||||||||||||||||||
| $ | 6,969 | $ | 42,947 | $ | 329,954 | |||||||||||||||||||||||
| ||||||||||||||||||||||||||||
136 | October 31, 2012
Table of Contents
Notes to Financial Statements | ||
| October 31, 2012 (Unaudited) |
RiverFront Global Growth Fund
| Security Name | Share Balance | Purchases | Sales | Share Balance October 31, 2012 | Dividend Income | Realized Gain | Market Value October 31, 2012 | |||||||||||||||||
| ||||||||||||||||||||||||
Consumer Discretionary Select Sector SPDR® Fund | 17,524 | – | 17,524 | – | $ | – | $ | 114,259 | $ | – | ||||||||||||||
Health Care Select Sector SPDR® Fund | 14,866 | 201 | 1,478 | 13,589 | 5,529 | 3,997 | 534,560 | |||||||||||||||||
Utilities Select Sector SPDR® Fund | – | 22,320 | 12,248 | 10,072 | 11,148 | 10,252 | 371,355 | |||||||||||||||||
| ||||||||||||||||||||||||
| $ | 16,677 | $ | 128,508 | $ | 905,915 | |||||||||||||||||||
| ||||||||||||||||||||||||
| RiverFront Moderate Growth & Income Fund | ||||||||||||||||||||||||
| Security Name | Share April 30, | Purchases | Sales | Share Balance October 31, 2012 | Dividend Income | Realized Gain/ | Market Value October 31, 2012 | |||||||||||||||||
| ||||||||||||||||||||||||
Consumer Discretionary Select Sector SPDR® Fund | – | 16,595 | 16,595 | – | $ | 2,492 | $ | (18,487 | ) | $ | – | |||||||||||||
| ||||||||||||||||||||||||
Health Care Select Sector SPDR® Fund | 33,164 | 3,116 | 36,280 | – | 6,605 | 155,347 | – | |||||||||||||||||
| ||||||||||||||||||||||||
Utilities Select Sector SPDR® Fund | 36,892 | 5,897 | – | 42,789 | 28,327 | – | 1,577,630 | |||||||||||||||||
| ||||||||||||||||||||||||
| $ | 37,424 | $ | 136,860 | $ | 2,821,612 | |||||||||||||||||||
| ||||||||||||||||||||||||
The above securities are deemed affiliated investment companies because the Fund’s Distributor is also the distributor of the Select Sector SPDR exchange traded funds (the “Underlying Sector ETFs”). As required by exemptive relief obtained by the Underlying Sector ETFs, the Advisor will reimburse the Fund an amount equal to the distribution fee received by ADI from the Underlying Sector ETFs attributable to the Fund’s investment in the Underlying Sector ETFs, for so long as ADI acts as the distributor to the Fund and the Underlying Sector ETFs.
9. INDEMNIFICATIONS
Under the Trust’s organizational documents, its officers and Trustees are indemnified against certain liability arising out of the performance of their duties to the Trust. Additionally, in the normal course of business, the Trust enters into contracts with service providers that may contain general indemnification clauses which may permit indemnification to the extent permissible under applicable law. The Trust’s maximum exposure under these arrangements is unknown, as this would involve future claims that may be made against the Trust that have not yet occurred.
137 | October 31, 2012
Table of Contents
| October 31, 2012 (Unaudited) |
As a shareholder of the Funds, you will incur two types of costs: (1) transaction costs, including applicable sales charges (loads) and redemption fees; and (2) ongoing costs, including management fees, distribution and service (12b-1) fees, shareholder service fees and other Fund expenses. The following examples are intended to help you understand your ongoing costs (in dollars) of investing in the Fund and to compare these costs with the ongoing costs of investing in other mutual funds. The examples are based on an investment of $1,000 invested on May 1, 2012 and held until October 31, 2012.
Actual Expenses. The first line of the table on the next page provides information about actual account values and actual expenses. You may use the information in this line, together with the amount you invested, to estimate the expenses that you paid over the period. Simply divide your account value by $1,000 (for example, an $8,600 account value divided by $1,000 = 8.6), then multiply the result by the number in the first line under the heading “Expense Paid During Period” to estimate the expenses you paid on your account during this period.
Hypothetical Example for Comparison Purposes. The second line of the table on the next page provides information about hypothetical account values and hypothetical expenses based on the Fund’s actual expense ratio and an assumed rate of return of 5% per year before expenses, which is not the Fund’s actual return. The hypothetical account values and expenses may not be used to estimate the actual ending account balance or expenses you paid for the period. You may use this information to compare the ongoing costs of investing in the Fund and other mutual funds. To do so, compare this 5% hypothetical example with the 5% hypothetical examples that appear in the shareholder reports of the other funds.
The expenses shown in the table are meant to highlight ongoing Fund costs only and do not reflect transaction fees, such as sales charges, redemption fees, or exchange fees. Therefore, the second line of the table on the next page is useful in comparing ongoing costs only, and may not help you determine the relative total costs of owning different funds. In addition, if these transactional costs were included, your costs would have been higher.
| Beginning Account Value 5/1/12 | Ending Account Value 10/31/12 | Expense Ratio(a) | Expense Paid During Period | |||||||||||||||||
ALPS | Kotak India Growth Fund (c) | ||||||||||||||||||||
Class A | ||||||||||||||||||||
Actual | $ | 1,000.00 | $ | 1,083.90 | 2.00 | % | $ | 10.51 | ||||||||||||
Hypothetical (5% return before expenses) | $ | 1,000.00 | $ | 1,015.12 | 2.00 | % | $ | 10.16 | ||||||||||||
Class C | ||||||||||||||||||||
Actual | $ | 1,000.00 | $ | 1,079.80 | 2.60 | % | $ | 13.63 | ||||||||||||
Hypothetical (5% return before expenses) | $ | 1,000.00 | $ | 1,012.10 | 2.60 | % | $ | 13.19 | ||||||||||||
Class I | ||||||||||||||||||||
Actual | $ | 1,000.00 | $ | 1,086.10 | 1.60 | % | $ | 8.41 | ||||||||||||
Hypothetical (5% return before expenses) | $ | 1,000.00 | $ | 1,017.14 | 1.60 | % | $ | 8.13 | ||||||||||||
ALPS | Red Rocks Listed Private Equity Fund | ||||||||||||||||||||
Class A | ||||||||||||||||||||
Actual | $ | 1,000.00 | $ | 1,062.10 | 1.55 | % | $ | 8.06 | ||||||||||||
Hypothetical (5% return before expenses) | $ | 1,000.00 | $ | 1,017.39 | 1.55 | % | $ | 7.88 | ||||||||||||
Class C | ||||||||||||||||||||
Actual | $ | 1,000.00 | $ | 1,056.60 | 2.25 | % | $ | 11.66 | ||||||||||||
Hypothetical (5% return before expenses) | $ | 1,000.00 | $ | 1,013.86 | 2.25 | % | $ | 11.42 | ||||||||||||
Class I | ||||||||||||||||||||
Actual | $ | 1,000.00 | $ | 1,061.80 | 1.25 | % | $ | 6.50 | ||||||||||||
Hypothetical (5% return before expenses) | $ | 1,000.00 | $ | 1,018.90 | 1.25 | % | $ | 6.36 | ||||||||||||
Class R | ||||||||||||||||||||
Actual | $ | 1,000.00 | $ | 1,060.00 | 1.75 | % | $ | 9.09 | ||||||||||||
Hypothetical (5% return before expenses) | $ | 1,000.00 | $ | 1,016.38 | 1.75 | % | $ | 8.89 | ||||||||||||
138 | October 31, 2012
Table of Contents
Disclosure of Fund Expenses | ||
| October 31, 2012 (Unaudited) |
Beginning Account Value 5/1/12 | Ending Account Value 10/31/12 | Expense Ratio(a) | Expense Paid During Period 5/1/12 - 10/31/12(b) | ||||||||||||||
ALPS/WMC Disciplined Value Fund | |||||||||||||||||
Class A | |||||||||||||||||
Actual | $ | 1,000.00 | $ | 1,028.50 | 1.40% | $ | 7.16 | ||||||||||
Hypothetical (5% return before expenses) | $ | 1,000.00 | $ | 1,018.15 | 1.40% | $ | 7.12 | ||||||||||
Class C | |||||||||||||||||
Actual | $ | 1,000.00 | $ | 1,025.00 | 2.15% | $ | 10.97 | ||||||||||
Hypothetical (5% return before expenses) | $ | 1,000.00 | $ | 1,014.37 | 2.15% | $ | 10.92 | ||||||||||
Class I | |||||||||||||||||
Actual | $ | 1,000.00 | $ | 1,030.60 | 1.15% | $ | 5.89 | ||||||||||
Hypothetical (5% return before expenses) | $ | 1,000.00 | $ | 1,019.41 | 1.15% | $ | 5.85 | ||||||||||
Clough China Fund | |||||||||||||||||
Class A | |||||||||||||||||
Actual | $ | 1,000.00 | $ | 1,013.00 | 1.95% | $ | 9.89 | ||||||||||
Hypothetical (5% return before expenses) | $ | 1,000.00 | $ | 1,015.38 | 1.95% | $ | 9.91 | ||||||||||
Class C | |||||||||||||||||
Actual | $ | 1,000.00 | $ | 1,009.50 | 2.70% | $ | 13.68 | ||||||||||
Hypothetical (5% return before expenses) | $ | 1,000.00 | $ | 1,011.59 | 2.70% | $ | 13.69 | ||||||||||
Class I | |||||||||||||||||
Actual | $ | 1,000.00 | $ | 1,014.40 | 1.70% | $ | 8.63 | ||||||||||
Hypothetical (5% return before expenses) | $ | 1,000.00 | $ | 1,016.64 | 1.70% | $ | 8.64 | ||||||||||
Jefferies Asset Management Commodity Strategy Allocation Fund (d) | |||||||||||||||||
Class A | |||||||||||||||||
Actual | $ | 1,000.00 | $ | 963.50 | 1.45% | $ | 7.18 | ||||||||||
Hypothetical (5% return before expenses) | $ | 1,000.00 | $ | 1,017.90 | 1.45% | $ | 7.38 | ||||||||||
Class C | |||||||||||||||||
Actual | $ | 1,000.00 | $ | 959.70 | 2.05% | $ | 10.13 | ||||||||||
Hypothetical (5% return before expenses) | $ | 1,000.00 | $ | 1,014.87 | 2.05% | $ | 10.41 | ||||||||||
Class I | |||||||||||||||||
Actual | $ | 1,000.00 | $ | 964.70 | 1.15% | $ | 5.69 | ||||||||||
Hypothetical (5% return before expenses) | $ | 1,000.00 | $ | 1,019.41 | 1.15% | $ | 5.85 | ||||||||||
RiverFront Conservative Income Builder Fund |
| ||||||||||||||||
Class A | |||||||||||||||||
Actual | $ | 1,000.00 | $ | 1,005.00 | 1.15% | $ | 1.93 | ||||||||||
Hypothetical (5% return before expenses) | $ | 1,000.00 | $ | 1,019.30 | 1.15% | $ | 5.82 | ||||||||||
Class C | |||||||||||||||||
Actual | $ | 1,000.00 | $ | 1,004.00 | 1.90% | $ | 3.18 | ||||||||||
Hypothetical (5% return before expenses) | $ | 1,000.00 | $ | 1,015.54 | 1.90% | $ | 9.60 | ||||||||||
Class I | |||||||||||||||||
Actual | $ | 1,000.00 | $ | 1,006.00 | 0.90% | $ | 1.51 | ||||||||||
Hypothetical (5% return before expenses) | $ | 1,000.00 | $ | 1,020.56 | 0.90% | $ | 4.56 | ||||||||||
139 | October 31, 2012
Table of Contents
Disclosure of Fund Expenses | ||
| October 31, 2012 (Unaudited) |
| Beginning Account Value 5/1/12 | Ending Account Value 10/31/12 | Expense Ratio(a) | Expense Paid During Period 5/1/12 - 10/31/12(b) | |||||||||||||||||
RiverFront Dynamic Equity Income Fund | ||||||||||||||||||||
Class A | ||||||||||||||||||||
Actual | $ | 1,000.00 | $ | 1,008.80 | 1.25 | % | $ | 6.33 | ||||||||||||
Hypothetical (5% return before expenses) | $ | 1,000.00 | $ | 1,018.90 | 1.25 | % | $ | 6.36 | ||||||||||||
Class C | ||||||||||||||||||||
Actual | $ | 1,000.00 | $ | 1,005.90 | 2.00 | % | $ | 10.11 | ||||||||||||
Hypothetical (5% return before expenses) | $ | 1,000.00 | $ | 1,015.12 | 2.00 | % | $ | 10.16 | ||||||||||||
Class I | ||||||||||||||||||||
Actual | $ | 1,000.00 | $ | 1,009.80 | 1.00 | % | $ | 5.07 | ||||||||||||
Hypothetical (5% return before expenses) | $ | 1,000.00 | $ | 1,020.16 | 1.00 | % | $ | 5.09 | ||||||||||||
RiverFront Global Allocation Fund | ||||||||||||||||||||
Class A | ||||||||||||||||||||
Actual | $ | 1,000.00 | $ | 1,008.30 | 1.25 | % | $ | 6.33 | ||||||||||||
Hypothetical (5% return before expenses) | $ | 1,000.00 | $ | 1,018.90 | 1.25 | % | $ | 6.36 | ||||||||||||
Class C | ||||||||||||||||||||
Actual | $ | 1,000.00 | $ | 1,003.70 | 2.00 | % | $ | 10.10 | ||||||||||||
Hypothetical (5% return before expenses) | $ | 1,000.00 | $ | 1,015.12 | 2.00 | % | $ | 10.16 | ||||||||||||
Class I | ||||||||||||||||||||
Actual | $ | 1,000.00 | $ | 1,008.40 | 1.00 | % | $ | 5.06 | ||||||||||||
Hypothetical (5% return before expenses) | $ | 1,000.00 | $ | 1,020.16 | 1.00 | % | $ | 5.09 | ||||||||||||
RiverFront Global Growth Fund | ||||||||||||||||||||
Class A | ||||||||||||||||||||
Actual | $ | 1,000.00 | $ | 1,008.20 | 0.90 | % | $ | 4.56 | ||||||||||||
Hypothetical (5% return before expenses) | $ | 1,000.00 | $ | 1,020.67 | 0.90 | % | $ | 4.58 | ||||||||||||
Class C | ||||||||||||||||||||
Actual | $ | 1,000.00 | $ | 1,005.30 | 1.65 | % | $ | 8.34 | ||||||||||||
Hypothetical (5% return before expenses) | $ | 1,000.00 | $ | 1,016.89 | 1.65 | % | $ | 8.39 | ||||||||||||
Class I | ||||||||||||||||||||
Actual | $ | 1,000.00 | $ | 1,009.70 | 0.65 | % | $ | 3.29 | ||||||||||||
Hypothetical (5% return before expenses) | $ | 1,000.00 | $ | 1,021.93 | 0.65 | % | $ | 3.31 | ||||||||||||
Class L | ||||||||||||||||||||
Actual | $ | 1,000.00 | $ | 1,009.70 | 0.65 | % | $ | 3.29 | ||||||||||||
Hypothetical (5% return before expenses) | $ | 1,000.00 | $ | 1,021.93 | 0.65 | % | $ | 3.31 | ||||||||||||
Investor Class | ||||||||||||||||||||
Actual | $ | 1,000.00 | $ | 1,008.30 | 0.90 | % | $ | 4.56 | ||||||||||||
Hypothetical (5% return before expenses) | $ | 1,000.00 | $ | 1,020.67 | 0.90 | % | $ | 4.58 | ||||||||||||
RiverFront Moderate Growth & Income Fund | ||||||||||||||||||||
Class A | ||||||||||||||||||||
Actual | $ | 1,000.00 | $ | 1,006.00 | 1.25 | % | $ | 6.32 | ||||||||||||
Hypothetical (5% return before expenses) | $ | 1,000.00 | $ | 1,018.90 | 1.25 | % | $ | 6.36 | ||||||||||||
140 | October 31, 2012
Table of Contents
Disclosure of Fund Expenses | ||
| October 31, 2012 (Unaudited) |
Beginning Account Value 5/1/12 | Ending Account Value 10/31/12 | Expense Ratio(a) | Expense Paid 5/1/12 - 10/31/12(b) | ||||||||||||||
Class C | |||||||||||||||||
Actual | $ | 1,000.00 | $ | 1,003.10 | 2.00% | $ | 10.10 | ||||||||||
Hypothetical (5% return before expenses) | $ | 1,000.00 | $ | 1,015.12 | 2.00% | $ | 10.16 | ||||||||||
Class I | |||||||||||||||||
Actual | $ | 1,000.00 | $ | 1,008.70 | 0.99% | $ | 5.01 | ||||||||||
Hypothetical (5% return before expenses) | $ | 1,000.00 | $ | 1,020.21 | 0.99% | $ | 5.04 | ||||||||||
| (a) | Annualized, based on the Fund’s most recent fiscal half year expenses. |
| (b) | Expenses are equal to the Fund’s annualized expense ratio multiplied by the average account value over the period, multiplied by the number of days in the most recent fiscal half year (184), divided by 365. |
| (c) | Includes expenses of the Kotak Mauritius Portfolio (wholly-owned subsidiary), exclusive of subsidiary’s management fee. |
| (d) | Includes expenses of the Jefferies Asset Management Cayman Trust (wholly-owned subsidiary), exclusive of the subsidiary’s management fee. |
141 | October 31, 2012
Table of Contents
| October 31, 2012 (Unaudited) |
1. FUND HOLDINGS
The Funds file their complete schedule of portfolio holdings with the Securities and Exchange Commission (the “SEC”) for the first and third quarters of each fiscal year on Form N-Q within 60 days after the end of the period. Copies of the Funds’ Form N-Q are available without charge on the SEC website at http:// www.sec.gov. You may also review and copy the Form N-Q at the SEC’s Public Reference Room in Washington, D.C. For more information about the operation of the Public Reference Room, please call the SEC at 1-800-SEC-0330.
2. FUND PROXY VOTING POLICIES, PROCEDURES AND SUMMARIES
Fund policies and procedures used in determining how to vote proxies and information regarding how each of the Funds voted proxies relating to portfolio securities during the most recent prior 12-month period ending June 30 are available without charge, (1) upon request, by calling (toll-free) (866) 759-5679 and (2) on the SEC’s website at http://www.sec.gov.
3. DISCLOSURE REGARDING APPROVAL OF FUND ADVISORY AGREEMENTS
RiverFront Conservative Income Builder Fund (“RiverFront Fund”)
On June 12, 2012, the Trustees met in person to discuss, among other things, the approval of the Investment Advisory Agreement between the Trust and ALPS Advisors, Inc. (the “ALPS Advisory Agreement”), and the Investment Sub-Advisory Agreement among the Trust, ALPS Advisors and RiverFront Investment Group, LLC (the “RiverFront Sub-Advisory Agreement”), each in accordance with Section 15(c) of the 1940 Act. The Independent Trustees met with independent legal counsel during executive session and discussed the ALPS Advisory Agreement and RiverFront Sub-Advisory Agreement and other related materials.
In approving the ALPS Advisory Agreement and the RiverFront Sub-Advisory Agreement, the Trustees, including the Independent Trustees, considered the following factors with respect to the RiverFront Fund:
Investment Advisory Fee Rate: The Trustees reviewed and considered the contractual annual advisory fee to be paid by (a) the Trust, on behalf of the RiverFront Fund, to ALPS Advisors of 0.85% of the RiverFront Fund’s daily average net assets and (b) by ALPS Advisors to RiverFront of 0.60% of the RiverFront Fund’s daily average net assets, in light of the extent and quality of the advisory services provided by the ALPS Advisors and RiverFront to the RiverFront Fund.
The Board received and considered information comparing the RiverFront Fund’s contractual advisory fees and overall expenses with those of funds in both the relevant expense group and universe of funds provided by an independent provider of investment company data.
Based on such information, the Trustees further determined that the contractual annual advisory fees set forth above and the total expense ratios of 1.15%, 1.90% and 0.90% for Class A, Class C and Class I shares of the RiverFront Fund, taking into account the contractual fee waivers in place, is comparable to others within such Fund’s anticipated peer universe.
Nature, Extent and Quality of the Services under the Investment Advisory Agreement and the Sub-Advisory Agreement: The Trustees received and considered information regarding the nature, extent and quality of services provided to the RiverFront Fund under the ALPS Advisory Agreement and the RiverFront Sub-Advisory Agreement. The Trustees reviewed certain background materials supplied by ALPS Advisors and RiverFront in each of their presentations, including their Forms ADV.
The Trustees reviewed and considered ALPS Advisors’ and RiverFront’s investment advisory personnel, their history as asset managers, their performance and the amount of assets currently under management by ALPS Advisors and RiverFront. The Trustees also reviewed the research and decision-making processes utilized by ALPS Advisors and RiverFront, including the methods adopted to seek to achieve compliance with the investment objectives, policies and restrictions of the RiverFront Fund.
The Trustees considered the background and experience of ALPS Advisors’ and RiverFront’s management in connection with the RiverFront Fund, including reviewing the qualifications, backgrounds and responsibilities of the management team primarily responsible for the day-to-day portfolio management of the RiverFront Fund and the extent of the resources devoted to research and analysis of actual and potential investments.
The Trustees also reviewed, among other things, ALPS Advisors’ and RiverFront’s insider trading policies and procedures and a description of their Codes of Ethics.
142 | October 31, 2012
Table of Contents
Additional Information | ||
| October 31, 2012 (Unaudited) |
Performance: The Trustees noted that since the RiverFront Fund had not begun operations, there was no performance for the RiverFront Fund to be reviewed or analyzed at this time. The Trustees considered, however, MTD, QTD, YTD and 1-year performance information as of March 30, 2012, for certain related separate accounts managed by RiverFront. The Trustees also noted the limitations on the comparability of related separate account performance information.
The Advisors’ Profitability: The Trustees received and considered a profitability analysis prepared by ALPS Advisors based on the fees payable under the Investment Advisory Agreement. The Trustees considered the profits, if any, anticipated to be realized by ALPS Advisors and RiverFront in connection with the operation of the RiverFront Fund. The Board then reviewed ALPS Advisors’ and RiverFront’s financial statements in order to analyze the financial condition and stability and profitability of each advisor.
Economies of Scale: The Trustees considered whether economies of scale in the provision of services to the RiverFront Fund were being passed along to the shareholders.
Other Benefits to the Advisor: The Trustees reviewed and considered any other incidental benefits derived or to be derived by ALPS Advisors and RiverFront from their relationship with the RiverFront Fund, including soft-dollar arrangements.
In selecting ALPS Advisors as the RiverFront Fund’s investment advisor and RiverFront as the RiverFront Fund’s sub-advisor and approving the ALPS Advisory Agreement and RiverFront Sub-Advisory Agreement and the fees charged under each agreement, the Trustees concluded that no single factor reviewed by the Trustees was identified by the Trustees to be determinative as the principal factor in whether to approve the ALPS Advisory Agreement and RiverFront Sub-Advisory Agreement. Further, the Independent Trustees were advised by separate independent legal counsel throughout the process. The Trustees, including all of the Independent Trustees, concluded that:
| » | the investment advisory fee to be received by ALPS Advisors with respect to the RiverFront Fund was comparable to others with in such Fund’s anticipated peer universe; |
| » | the nature, extent and quality of services rendered by ALPS Advisors under the ALPS Advisory Agreement and by RiverFront under the RiverFront Sub-Advisory Agreement were adequate; |
| » | there was no performance history for the RiverFront Fund for the Board to consider; |
| » | the terms of the proposed fee waiver and expense limitation agreement among the Trust, on behalf of the RiverFront Fund, ALPS Advisors and RiverFront, were not unreasonable; |
| » | the profit, if any, anticipated to be realized by ALPS Advisors in connection with the operation of the RiverFront Fund is fair to the Trust, especially in light of the fee waiver agreement among the Trust, ALPS Advisors and RiverFront; and |
| » | there were no material other incidental benefits accruing to ALPS Advisors or RiverFront in connection with its relationship with the RiverFront Fund. |
Based on the Trustees’ deliberations and their evaluation of the information described above, the Trustees, including all of the Independent Trustees, concluded that ALPS Advisors’ and RiverFront’s compensation for investment advisory services is consistent with the best interests of the RiverFront Fund and its shareholders.
143 | October 31, 2012
Table of Contents
Intentionally Left Blank
Table of Contents

Table of Contents

Table of Contents
| PAGE | ||||
| 1 | ||||
| 4 | ||||
| 5 | ||||
| 7 | ||||
| 8 | ||||
| 9 | ||||
| 10 | ||||
| 12 | ||||
| 20 | ||||
Table of Contents
Aspen Managed Futures Strategy Fund | Manager Commentary | |
| October 31, 2012 (Unaudited) |
Market Conditions
The environment of the last six months was the beneficiary of several positive economic gleanings. First off, leading economic indicators suggested a bounce in technology and industrial company earnings growth, most likely from the predilection of purchasing managers to update computers and other equipment. Domestic stocks continued their global outperformance with a 2.16% gain, while Europe was flat and the Nikkei Index1 lost 6.22%.
The U.S. seems to be stuck in a low but positive growth scenario. With extremely low interest rates promised by the U.S. Federal Reserve until at least mid-2015, companies are enjoying a cash-rich environment that makes it easier to plan longer-term expansion projects. Domestic banks are also benefitting from virtually cost-free customer deposits. Even housing seems to be on the mend. Led by demographics (the current crop of 55+ Americans is the largest on record) and pent-up demand due to smaller than normal family formations, the market for housing is finally starting to improve in a number of key markets. The Fed is also helping by purchasing approximately $85 billion in mortgage-backed securities per month. The improvement in the housing sector is likely to add 0.50% per year to gross national product.
The improvement in liquidity is not isolated to the U.S. Recent announcements by the European Central Bank indicating that it can now buy unlimited amounts of sovereign bonds caused a fixed income rally throughout the region. Spanish and Greek debt both rallied on the news. The good karma spread to the U.S., where both government and corporate bonds enjoyed a profitable six-month period.
This cheery scenario can’t last forever. We believe allocating to a cogent diversifier like managed futures makes tremendous sense in these uncertain times. Markets face multiple risks after the election and in 2013 with the President having to make tough choices early in his second term.
Performance Results
For the six-month period ending October 31, 2012, the Class I shares of the Aspen Managed Futures Strategy Fund posted a loss of 0.67%. Per its mandate, the Fund maintained very tight correlation to the Aspen Managed Futures Beta Index2. The index uses a combination of trend and counter-trend algorithms to determine exposures to 23 futures markets. In following the index, the Fund can take long or short exposures to each of the eligible markets. A long position in a futures market will profit if the price of the futures contract rises, and a short position will profit if the price of the futures contract falls.
The Newedge CTA Index3, a managed futures benchmark, returned -2.57% in the same timeframe. Another benchmark, the Barclay BTOP50 Index4, returned -2.36%. It is important to note that there are substantive differences between the Fund and these indices in terms of construction. There were no significant changes to the Fund strategy during this period.
Explanation of Fund Performance
A downturn in risk assets (e.g., stocks and commodities) and the accompanying “flight to quality” in May proved beneficial to positions in the Fund’s trend model (particularly long positions in sovereign fixed income futures), propelling the Fund to a 3.45% gain for the month.
The bulk of those gains were given back with the advent of a risk rally in the first two weeks of June. Thereafter, the summer months were characterized by low volatility, with little opportunity for the formation of trends. The trend model’s positions in most currencies, equity indices, and commodities changed positions multiple times over the summer, while fixed income positions remained long throughout the period. The Fund’s counter-trend positions posted positive attribution throughout the summer months, almost precisely canceling the small losses from the trend model (which always constitutes the bulk of the Fund’s overall positions), such that the Fund’s NAVs on June 20 and September 27 were the same. Following the Fund’s returns in June (-2.67%), July (+2.43%), August (-0.97%), and September (-1.74%), the Fund was up just 0.33% for the five months ending September 30.
With fierce whipsaws in the prices of all major asset classes, the month of October proved to be one of the worst months in years for many stalwarts of the managed futures industry. Trend-following models performed particularly badly. The Newedge CTA Index return was -3.07%, and the Newedge CTA Trend Sub-Index return was -4.87% for the month. Although the Aspen Managed Futures Strategy Fund posted losses for the month as well, the model’s dynamic risk indicator proved its mettle in October, reducing exposures across the portfolio early in the month, and increasing allocations to the counter-trend model in a timely fashion later in the month. As a result, the Fund was down only 1.00% in October, significantly outperforming most of its peers.
By the end of October, the lack of sustained trends had resulted in mixed portfolios (i.e., some long and some short positions) in the currency, equity, and commodity asset classes. Although all fixed income markets remained long, the trends in those markets were substantially weakened, such that the portfolio could not be said to be meaningfully “risk on” or “risk off”5 heading into November.
Over the entire May-to-October period, ten markets contributed positively to Fund performance, and twelve markets contributed negatively. Cash equivalents in the portfolio contributed an almost negligible positive amount to performance, due to the low interest rate environment. The markets with the largest gains were Corn (which sustained a very large uptrend in prices due to drought conditions in the Midwest), UK Gilt (bonds issued by British government), Australian Dollar, Soybeans, and US 10-Year Treasuries. The markets with the largest losses were Euro Stoxx 50 Index6, Nikkei (USD), Copper, FTSE 1007, and Crude Oil.
Annualized volatility of daily returns for the Fund was about 6.76% for the May 1 through October 31 period. By comparison, the volatility of the S&P 500® Total Index8 was approximately 13.49% for the same period. The correlation of daily returns between the Fund and the S&P 500® Total Index was -0.43 (where 1.00 represents perfect positive correlation and -1.00 represents perfect negative correlation), indicating that the Fund remained strongly diversified relative to traditional risk assets.
| Semi-Annual Report | October 31, 2012 | 1 |
Table of Contents
Aspen Managed Futures Strategy Fund | Manager Commentary | |
| October 31, 2012 (Unaudited) |
Outlook
Although the Fund lost some ground in the last six months, most industry benchmarks experienced larger pullbacks. This illustrates one of our basic tenets-that over the course of a market cycle, it is very difficult to outperform an index. While one reason is the reduced fees associated with most indices (relative to higher fees for active management), our systematic approach removes many behavioral-based tendencies that can adversely affect performance.
One of the most often-asked questions is the potential impact of higher interest rates on portfolio returns. Investors seem aware that rates are extremely low—and artificially so, given the Fed’s easy money policy—but that rates may return to historic norms.
The catalyst for higher rates could have economic or market-based origins. Stronger economic growth might cause the Federal Reserve to rethink its dovish mindset and put the brakes on asset purchases, which could potentially cause higher short-term rates. Or market participants might start selling Treasury debt for the potential for higher returns in equities. Either scenario could lead to higher rates, which may require registered investment advisors to re-think their asset allocation strategies.
Fixed income investments typically suffer as rates rise. Their slightly increased correlation with equities during these periods makes them less attractive as diversifiers. Surprisingly, investments in gold also tend to lose value as rates rise. This is most likely due to the increased cost of storage (which is directly tied to short rates).
Conversely, we believe managed futures tend to benefit from rising rates. This is not only due to the strategy’s ability to capture up-trends in commodities during inflationary periods, but also to its tendency to benefit from rising volatility. When combined with equities, managed futures can be an especially beneficial portfolio diversifier during rising rate scenarios.
Sincerely,
Bryan R. Fisher
Kenneth E. Banwart
William Ware Bush
Adam Langley
The views and information discussed in this commentary are as of the date of publication, are subject to change, and may not reflect the writer’s current views. The views expressed represent an assessment of market conditions at a specific point in time, are opinions only and should not be relied upon as investment advice regarding a particular investment or markets in general. Such information does not constitute a recommendation to buy or sell specific securities or investment vehicles. It should not be assumed that any investment will be profitable or will equal the performance of the portfolios or any securities or any sectors mentioned herein. The subject matter contained herein has been derived from several sources believed to be reliable and accurate at the time of compilation. The Fund does not accept any liability for losses either direct or consequential caused by the use of this information.
| 1 | The Nikkei 225 Stock Average is a price-weighted index comprised of Japan’s top 225 blue-chip companies traded on the Tokyo Stock Exchange. The Nikkei (USD) is a futures contract traded on the Chicago Mercantile Exchange which tracks the Nikkei 225 Stock Average and is priced in US Dollars. The index is not actively managed and does not reflect any deduction for fees, expenses or taxes. |
| 2 | Aspen Managed Futures Beta Index - The Managed Futures Beta Index is constructed using a quantitative, rules-based model designed to replicate the trend-following and counter-trend exposure of futures markets by allocating assets to liquid futures contracts of certain financial and commodities futures markets. The Index therefore seeks to reflect the performance of strategies and exposures common to a broad universe of futures markets, i.e., managed futures beta. The index is not actively managed and does not reflect any deduction for fees, expenses or taxes. |
| 3 | The Newedge CTA Index provides the market with a reliable daily performance benchmark of major commodity trading advisors (CTAs). The Newedge CTA Index calculates the daily rate of return for a pool of CTAs selected from the larger managers that are open to new investment. Selection of the pool of qualified CTAs used in construction of the Index will be conducted annually, with re-balancing on January 1st of each year. A committee of industry professionals has been established to monitor the methodology of the index on a regular basis. The index is not actively managed and does not reflect any deduction for fees, expenses or taxes. You cannot invest directly in the index. |
| 4 | Barclay BTOP50 Index is an index of the largest investable CTA programs as measured by assets under management. The index is not actively managed and does not reflect any deduction for fees, expenses or taxes. |
| 5 | During a market sentiment of ‘Risk on,’ the market is optimistic and more willing to take risk in exchange for possibly better returns. At this time there will be a greater interest in shares or stocks and commodities. When the market sentiment is ‘Risk off, ‘ there is pessimism in the market and it will favor perceived lower risk investments such as U.S. Treasuries or U.S. dollars. http://en.wikipedia.org. |
| 6 | The Euro Stoxx 50 Index is a market-capitalization weighted stock index of 50 large blue-chip European companies operating within Eurozone nations. The index is not actively managed and does not reflect any deduction for fees, expenses or taxes. |
| 7 | The FTSE 100 is an index of the largest 100 blue-chip stocks traded on the London Stock Exchange. The index is not actively managed and does not reflect any deduction for fees, expenses or taxes. |
| 8 | The S&P 500® Total Return Index is an unmanaged index of 500 common stocks chosen for marketsize, liquidity and industry group representation. It is a market-value weighted index. The index is not actively managed and does not reflect any deduction for fees, expenses or taxes. |
| 2 | www.aspenfuturesfund.com |
Table of Contents
Aspen Managed Futures Strategy Fund | Manager Commentary | |
| October 31, 2012 (Unaudited) |
Cumulative Total Return Performance for the period ended October 31, 2012
Aspen Managed Futures Strategy Fund | Year-to-Date | 1 Year | Since Inception* | |||||
Aspen Managed | -4.82% | -5.63% | -9.09% | |||||
Aspen Managed | -10.03% | -10.84% | -13.11% | |||||
Aspen Managed | -4.60% | -5.31% | -8.76% | |||||
Newedge CTA | -2.93% | -2.15% | -5.30% | |||||
Aspen Managed | -4.91% | -5.66% | -8.69% | |||||
Performance data quoted represents past performance. Past performance does not guarantee future results. Investment return and principal value of an investment will fluctuate so that an investor’s shares, when sold or redeemed, may be worth more or less than the original cost. Current performance data may be higher or lower than actual data quoted. For the most current month-end performance data please call 1-855-845-9444.
The table does not reflect the deduction of taxes that a shareholder would pay on Fund distributions or the redemption of Fund shares.
| * | Fund Inception date of August 2, 2011. |
| 1 | Net Asset Value (NAV) is the share price without sales charges. |
| 2 | Maximum Offering Price (MOP) includes sales charges. Class A returns include effects of the Fund’s maximum sales charge of 5.50%. |
| 3 | The Newedge CTA Index provides the market with a reliable daily performance benchmark of major commodity trading advisors (CTAs). The Newedge CTA Index calculates the daily rate of return for a pool of CTAs selected from the larger managers that are open to new investment. Selection of the pool of qualified CTAs used in construction of the Index will be conducted annually, with re-balancing on January 1st of each year. A committee of industry professionals has been established to monitor the methodology of the index on a regular basis. You cannot invest directly in the index. |
| 4 | Aspen Managed Futures Beta Index - The Managed Futures Beta Index is constructed using a quantitative, rules-based model designed to replicate the trend-following and counter-trend exposure of futures markets by allocating assets to liquid futures contracts of certain financial and commodities futures markets. The Index therefore seeks to reflect the performance of strategies and exposures common to a broad universe of futures markets, i.e., managed futures beta. |
Portfolio Composition as of October 31, 2012
As a percentage of Net Assets
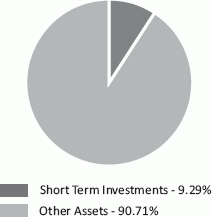
Performance of $10,000 Initial Investment (for the period ended October 31, 2012)
Comparison of change in value of a $10,000 investment (includes applicable sales loads)
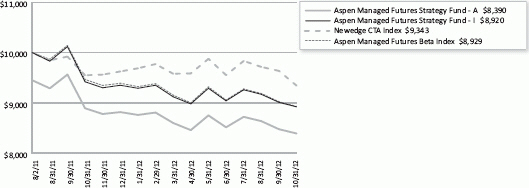
The chart represents historical performance of a hypothetical investment of $10,000 in the Fund since inception. Past performance does not guarantee future results. This chart does not reflect the deduction of taxes that a shareholder would pay on Fund distributions or the redemption of Fund shares.
The Aspen Managed Futures Beta Index and the Newedge CTA Index are not actively managed and do not reflect any deduction for fees, expenses or taxes. It is not possible to invest directly in an index.
| Semi-Annual Report | October 31, 2012 | 3 |
Table of Contents
| Aspen Managed Futures Strategy Fund | Fund Expenses | |
| October 31, 2012 (Unaudited) |
As a shareholder of a Fund, you incur two types of costs: (1) transaction costs, including applicable sales charges (loads), redemption fees, wire fees and low balance fees; and (2) ongoing costs, including management fees, distribution and service (12b-1) fees, shareholder services fees and other Fund expenses. This example is intended to help you understand your indirect costs, also referred to as “ongoing costs” (in dollars), of investing in the Fund and to compare these costs with the ongoing costs of investing in other mutual funds.
This example is based on an investment of $1,000 invested at the beginning of the period and held for the entire six-month period of May 1, 2012 through October 31, 2012.
Actual Expenses The first line of the table below provides information about actual account values and actual expenses. You may use the information in this line, together with the amount you invested at the beginning of the period, to estimate the expenses that you paid over the period. Simply divide your account value by $1,000 (for example, an $8,600 account value divided by $1,000 = 8.6), then multiply the result by the number in the first line under the heading “Expenses Paid During Period” to estimate the expenses you paid on your account during this period.
Hypothetical Example for Comparison Purposes The second line of the table provides information about hypothetical account values and hypothetical expenses based on the Fund’s actual expense ratio and an assumed rate of return of 5% per year before expenses, which is not the Fund’s actual return. The hypothetical account values and expenses may not be used to estimate the actual ending account balance or expenses you paid for the period. You may use this information to compare ongoing costs of investing in the Fund and other funds. To do so, compare this 5% hypothetical example with the 5% hypothetical examples that appear in the shareholder reports of other funds.
Please note that the expenses shown in the table are meant to highlight your ongoing costs only and do not reflect any transactional costs, such as applicable sales charges (loads), redemption fees, wire fees and low balance fees. Therefore, the second line of the table is useful in comparing ongoing costs only and will not help you determine the relative total costs of owning different funds. In addition, if these transaction costs were included, your costs would be higher.
Beginning 5/1/12 | Ending 10/31/12 | Expense Ratio(a) | Expenses Paid 5/1/12 - 10/31/12(b) | |||||||||
Class A | ||||||||||||
Actual | $ 1,000.00 | $ 992.20 | 1.80% | $ 9.04 | ||||||||
Hypothetical (5% return before expenses) | $ 1,000.00 | $ 1,016.13 | 1.80% | $ 9.15 | ||||||||
Class I | ||||||||||||
Actual | $ 1,000.00 | $ 993.30 | 1.40% | $ 7.03 | ||||||||
Hypothetical (5% return before expenses) | $ 1,000.00 | $ 1,018.15 | 1.40% | $ 7.12 | ||||||||
| (a) | The Fund’s expense ratios have been based on the Fund’s most recent fiscal half-year expenses. |
| (b) | Expenses are equal to the Fund’s annualized expense ratio, multiplied by the average account value over the period, multiplied by the number of days in the most recent fiscal half-year (184)/365. |
| 4 | www.aspenfuturesfund.com |
Table of Contents
Aspen Managed Futures Strategy Fund | Consolidated Schedule of Investments | |
| October 31, 2012 (Unaudited) |
| 7-Day Yield | Shares | Value (Note 2) | ||||||||
SHORT TERM INVESTMENTS (9.29%) | ||||||||||
MONEY MARKET FUND (9.29%) | ||||||||||
Dreyfus Treasury & Agency Cash Management Fund - Institutional Shares | 0.010% | 10,297,720 | $ | 10,297,720 |
| |||||
|
| |||||||||
| 10,297,720 | ||||||||||
|
| |||||||||
TOTAL SHORT TERM INVESTMENTS (Cost $10,297,720) | 10,297,720 | |||||||||
|
| |||||||||
TOTAL INVESTMENTS (9.29%) (Cost $10,297,720) | $ | 10,297,720 | ||||||||
|
| |||||||||
Other Assets In Excess Of Liabilities (90.71%) | 100,586,827(a) | |||||||||
|
| |||||||||
NET ASSETS (100.00%) | $ | 110,884,547 | ||||||||
|
| |||||||||
| (a) | Includes cash which is being held as collateral for futures contracts. |
Percentages are stated as a percent of net assets.
FUTURES CONTRACTS
At October 31, 2012, the Fund had outstanding futures contracts:
| Description | Position | Contracts | Expiration Date | Underlying Face Amount at Value | Unrealized Appreciation | |||||||||||
Commodity Contracts | ||||||||||||||||
Corn Future | Long | 33 | 12/15/12 | $1,246,987 | $4,536 | |||||||||||
Crude Oil Future | Short | 30 | 12/22/12 | (2,587,200) | 74,773 | |||||||||||
Sugar No. 11 (World) Future | Short | 170 | 03/28/13 | (3,705,184) | 142,088 | |||||||||||
Foreign Currency Contracts | ||||||||||||||||
Australian Dollar Currency Future | Long | 416 | 12/18/12 | 43,014,400 | 193,402 | |||||||||||
Euro FX Currency Future | Short | 116 | 12/18/12 | (18,802,150) | 109,318 | |||||||||||
New Zealand Dollar Future | Long | 302 | 12/18/12 | 24,754,940 | 170,956 | |||||||||||
|
| |||||||||||||||
| $43,921,793 | $695,073 | |||||||||||||||
|
| |||||||||||||||
| Description | Position | Contracts | Expiration Date | Underlying Face Amount at Value | Unrealized Depreciation | |||||||||||
Commodity Contracts | ||||||||||||||||
Copper Future | Short | 15 | 12/28/12 | $(1,319,063) | $(63) | |||||||||||
Gold 100 Oz Future | Long | 7 | 12/28/12 | 1,203,370 | (35,489) | |||||||||||
Heating Oil Future | Short | 10 | 12/01/12 | (1,286,166) | (15,120) | |||||||||||
Silver Future | Short | 8 | 12/27/12 | (1,292,640) | (34) | |||||||||||
Soybean Future | Long | 17 | 01/15/13 | 1,316,438 | (5,115) | |||||||||||
Equity Contracts | ||||||||||||||||
Euro STOXX 50 Index Future | Long | 200 | 12/22/12 | 6,491,083 | (11,890) | |||||||||||
FTSE 100 IDX Future | Long | 69 | 12/22/12 | 6,418,190 | (17,533) | |||||||||||
Nikkei 225 Index Future | Short | 97 | 12/14/12 | (4,333,475) | (15,868) | |||||||||||
S&P 500® Emini Future | Long | 61 | 12/22/12 | 4,290,740 | (89,302) | |||||||||||
Fixed Income Contracts | ||||||||||||||||
Canadian 10 Year Bond Future | Short | 58 | 12/20/12 | (7,960,010) | (40,998) | |||||||||||
Euro-Bund Future | Short | 43 | 12/07/12 | (7,896,412) | (66,968) | |||||||||||
Long Gilt Future | Short | 41 | 12/27/12 | (7,882,809) | (5,313) | |||||||||||
US 10-Year Treasury Notes Future | Short | 59 | 12/20/12 | (7,848,847) | (37,995) | |||||||||||
| Semi-Annual Report | October 31, 2012 | 5 |
Table of Contents
Aspen Managed Futures Strategy Fund | Consolidated Schedule of Investments | |
| October 31, 2012 (Unaudited) |
| Description | Position | Contracts | Expiration Date | Underlying Face Amount at Value | Unrealized Depreciation | |||||||||||
Foreign Currency Contracts | ||||||||||||||||
Canadian Dollar Currency Future | Short | 61 | 12/19/12 | $(6,092,680) | $(1,486) | |||||||||||
Japanese Yen Currency Future | Short | 78 | 12/18/12 | (12,227,475) | (5,866) | |||||||||||
Swiss Franc Currency Future | Short | 185 | 12/18/12 | (24,847,812) | (178,519) | |||||||||||
|
| |||||||||||||||
| $(63,267,568) | $(527,559) | |||||||||||||||
|
| |||||||||||||||
Common Abbreviations:
FTSE - Financial Times and the London Stock Exchange
FX - Foreign
No. - Number
Oz - Ounce
S&P - Standard and Poor’s
See Notes to Consolidated Financial Statements.
| 6 | www.aspenfuturesfund.com |
Table of Contents
| Aspen Managed Futures Strategy Fund | Assets & Liabilities | |
| October 31, 2012 (Unaudited) |
ASSETS: | ||||
Investments, at value | $ | 10,297,720 | ||
Deposit with broker for futures contracts | 99,488,025 | |||
Foreign currency, at value (Cost $186,307) | 185,715 | |||
Receivable for shares sold | 909,084 | |||
Variation margin receivable | 167,514 | |||
Interest receivable | 83 | |||
Prepaid and other assets | 19,125 | |||
Total assets | 111,067,266 | |||
LIABILITIES: | ||||
Payable to advisor | 69,890 | |||
Payable for shares redeemed | 31,951 | |||
Payable for administration fees | 18,367 | |||
Payable for distribution and service fees | ||||
Class A | 358 | |||
Payable for transfer agency fees | 5,917 | |||
Payable for trustee fees | 9,156 | |||
Payable for audit fees | 35,098 | |||
Payable for legal fees | 2,047 | |||
Payable for chief compliance officer fees | 2,623 | |||
Payable for principal financial officer fees | 437 | |||
Accrued expenses and other liabilities | 6,875 | |||
Total liabilities | 182,719 | |||
NET ASSETS | $ | 110,884,547 | ||
NET ASSETS CONSIST OF: | ||||
Paid-in capital | $ | 116,393,781 | ||
Accumulated net investment loss | (1,372,495) | |||
Accumulated net realized loss on futures contracts and foreign currency transactions | (4,303,661) | |||
Net unrealized appreciation on futures contracts and translation of assets and liabilities in foreign currencies | 166,922 | |||
NET ASSETS | $ | 110,884,547 | ||
INVESTMENTS, AT COST | $ | 10,297,720 | ||
PRICING OF SHARES: | ||||
Class A: | ||||
Net Asset Value, offering and redemption price per share | $ | 8.88 | ||
Net Assets | $ | 1,651,815 | ||
Shares of beneficial interest outstanding | 186,110 | |||
Maximum offering price per share (NAV/0.9450), based on maximum sales charge of 5.50% of the offering price | $ | 9.39 | ||
Class I: | ||||
Net Asset Value, offering and redemption price per share | $ | 8.92 | ||
Net Assets | $ | 109,232,732 | ||
Shares of beneficial interest outstanding | 12,252,338 | |||
See Notes to Consolidated Financial Statements.
| Semi-Annual Report | October 31, 2012 | 7 |
Table of Contents
| Aspen Managed Futures Strategy Fund | of Operations | |
| For the Six Months Ended October 31, 2012 (Unaudited) | ||
INVESTMENT INCOME: | ||||
Interest | $24,350 | |||
Total Investment Income | 24,350 | |||
EXPENSES: | ||||
Investment advisory fees | 384,851 | |||
Repayment of previously waived fees | ||||
Class A | 2,400 | |||
Class I | 74,999 | |||
Administrative fees | 105,773 | |||
Distribution and service fees | ||||
Class A | 1,933 | |||
Transfer agency fees | 23,711 | |||
Legal and audit fees | 26,877 | |||
Offering costs | 38,212 | |||
Custodian fees | 5,194 | |||
Trustees’ fees and expenses | 11,367 | |||
Principal financial officer fees | 2,521 | |||
Chief compliance officer fees | 15,123 | |||
Other | 26,709 | |||
Total Net Expenses | 719,670 | |||
NET INVESTMENT LOSS | (695,320) | |||
Net realized loss on futures contracts | (740,035) | |||
Net realized gain on foreign currency transactions | 55,589 | |||
Net change in unrealized appreciation on futures contracts | 437,039 | |||
Net change in unrealized depreciation on translation of assets and liabilities denominated in foreign currency transactions | (798) | |||
NET REALIZED AND UNREALIZED LOSS ON INVESTMENTS | (248,205) | |||
NET DECREASE IN NET ASSETS RESULTING FROM OPERATIONS | $ (943,525) | |||
See Notes to Consolidated Financial Statements.
8 | www.aspenfuturesfund.com |
Table of Contents
| Aspen Managed Futures Strategy Fund | Consolidated Statement of Changes in Net Assets | |
| For the Six Months Ended October 31, 2012 (Unaudited) | For the Period August 2, 2011 (Inception) to April 30, 2012 | |||||||
OPERATIONS: | ||||||||
Net investment loss | $ | (695,320) | $ | (637,508) | ||||
Net realized loss on futures contracts and foreign currency transactions | (684,446) | (5,063,338) | ||||||
Net change in unrealized appreciation/(depreciation) on futures contracts and foreign currency translations | 436,241 | (269,319) | ||||||
Net decrease in net assets resulting from operations | (943,525) | (5,970,165) | ||||||
SHARE TRANSACTIONS (Note 4): | ||||||||
Class A | ||||||||
Proceeds from sales of shares | 811,328 | 11,355,891 | ||||||
Cost of shares redeemed | (384,706) | (9,450,244) | ||||||
Class I | ||||||||
Proceeds from sales of shares | 40,011,564 | 120,133,964 | ||||||
Cost of shares redeemed | (20,315,132) | (24,374,693) | ||||||
Redemption fees | 1,002 | 9,263 | ||||||
Net increase from share transactions | 20,124,056 | 97,674,181 | ||||||
Net increase in net assets | 19,180,531 | 91,704,016 | ||||||
NET ASSETS: | ||||||||
Beginning of period | 91,704,016 | – | ||||||
End of period* | $ | 110,884,547 | $ | 91,704,016 | ||||
* Includes accumulated net investment loss of: | $ | (1,372,495) | $ | (677,175) | ||||
Other Information: | ||||||||
SHARE TRANSACTIONS: | ||||||||
Class A | ||||||||
Sold | 88,636 | 1,141,658 | ||||||
Redeemed | (42,657) | (1,001,527) | ||||||
Net increase in shares outstanding | 45,979 | 140,131 | ||||||
Class I | ||||||||
Sold | 4,390,214 | 12,696,132 | ||||||
Redeemed | (2,215,345) | (2,618,663) | ||||||
Net increase in shares outstanding | 2,174,869 | 10,077,469 | ||||||
See Notes to Consolidated Financial Statements.
| Semi-Annual Report | October 31, 2012 | 9 |
Table of Contents
| Aspen Managed Futures Strategy Fund – Class A | Consolidated Financial Highlights | |
| For a share outstanding throughout the periods presented. |
For the Six (Unaudited)(a) | For the Period April 30, 2012(a) | |||||||||
NET ASSET VALUE, BEGINNING OF PERIOD INCOME/(LOSS) FROM OPERATIONS: | $ | 8.95 | $ | 10.00 | ||||||
Net investment loss(b) | (0.08) | (0.13) | ||||||||
Net realized and unrealized gain/(loss) on investments | 0.01 | (0.92) | ||||||||
Total from investment operations | (0.07) | (1.05) | ||||||||
DECREASE IN NET ASSET VALUE | (0.07) | (1.05) | ||||||||
NET ASSET VALUE, END OF PERIOD | $ | 8.88 | $ | 8.95 | ||||||
TOTAL RETURN(c) | (0.78%)(d) | (10.50%)(d) | ||||||||
RATIOS AND SUPPLEMENTAL DATA: | ||||||||||
Net assets, end of period (000’s) | $ | 1,652 | $ | 1,254 | ||||||
RATIOS TO AVERAGE NET ASSETS: | ||||||||||
Operating expenses excluding fee waivers/reimbursements | 1.80%(e) | 2.53%(e) | ||||||||
Operating expenses including fee waivers/reimbursements | N/A | 1.80%(e) | ||||||||
Net investment loss including fee waivers/reimbursements | (1.75%)(e) | (1.79%)(e) | ||||||||
PORTFOLIO TURNOVER RATE | 0%(d) | 0%(d) | ||||||||
| (a) | Per share amounts and ratios to average net assets include income and expenses of the Aspen Futures Fund Ltd. (subsidiary), exclusive of the subsidiary’s management fee. |
| (b) | Per share numbers have been calculated using the average shares method. |
| (c) | Total return does not reflect the effect of sales charges. |
| (d) | Not annualized. |
| (e) | Annualized. |
See Notes to Consolidated Financial Statements.
| 10 | www.aspenfuturesfund.com |
Table of Contents
Aspen Managed Futures Strategy Fund – Class I | Consolidated Financial Highlights | |
| For a share outstanding throughout the periods presented. |
For the Six Months Ended October 31, 2012 (Unaudited)(a) | For the Period August 2, 2011 (Inception)to April 30, 2012(a) | |||||||||
NET ASSET VALUE, BEGINNING OF PERIOD | $ | 8.98 | $ | 10.00 | ||||||
INCOME/(LOSS) FROM OPERATIONS: | ||||||||||
Net investment loss(b) | (0.06) | (0.11) | ||||||||
Net realized and unrealized loss on investments | – | (0.91) | ||||||||
Total from investment operations | (0.06) | (1.02) | ||||||||
REDEMPTION FEES ADDED TO PAID IN CAPITAL (NOTE 4) | 0.00 | (c) | 0.00 | (c) | ||||||
DECREASE IN NET ASSET VALUE | (0.06) | (1.02) | ||||||||
NET ASSET VALUE, END OF PERIOD | $ | 8.92 | $ | 8.98 | ||||||
TOTAL RETURN | (0.67%) | (d) | (10.20%) | (d) | ||||||
RATIOS AND SUPPLEMENTAL DATA: | ||||||||||
Net assets, end of period (000’s) | $ | 109,233 | $ | 90,450 | ||||||
RATIOS TO AVERAGE NET ASSETS: | ||||||||||
Operating expenses excluding fee waivers/reimbursements | 1.40% | (e) | 1.75% | (e) | ||||||
Operating expenses including fee waivers/reimbursements | N/A | 1.55% | (e) | |||||||
Net investment loss including fee waivers/reimbursements | (1.35%) | (e) | (1.54%) | (e) | ||||||
PORTFOLIO TURNOVER RATE | 0%(d) | 0% | (d) | |||||||
| (a) | Per share amounts and ratios to average net assets include income and expenses of the Aspen Futures Fund Ltd. (subsidiary), exclusive of the subsidiary’s management fee. |
| (b) | Per share numbers have been calculated using the average shares method. |
| (c) | Less than $0.005 per share. |
| (d) | Not annualized. |
| (e) | Annualized. |
See Notes to Consolidated Financial Statements.
| Semi-Annual Report | October 31, 2012 | 11 |
Table of Contents
Aspen Managed Futures Strategy Fund | Financial Statements | |
| October 31, 2012 (Unaudited) |
1. ORGANIZATION
Financial Investors Trust (the “Trust”), a Delaware statutory trust, is an open-end management investment company registered under the Investment Company Act of 1940, as amended (“1940 Act”). As of October 31, 2012, the Trust had 24 registered funds. This semi-annual report describes the Aspen Managed Futures Strategy Fund (the “Fund”). The Fund seeks investment results that replicate as closely as possible, before fees and expenses, the price and yield performance of the Aspen Managed Futures Beta Index (the “MFBI” or “Index”). The Aspen Managed Futures Strategy Fund offers Class A and Class I shares. All classes of shares have identical rights to earnings, assets and voting privileges, except for class specific expenses and exclusive rights to vote on matters affecting only individual classes.
Basis of Consolidation for the Aspen Futures Fund, Ltd.
Aspen Futures Fund, Ltd. (the “Subsidiary”), a Cayman Islands exempted company, is a wholly owned subsidiary of the Fund. The Subsidiary acts as an investment vehicle for the Fund in order to effect certain commodity-related investments on behalf of the Fund. Investments in the Subsidiary are expected to provide the Fund with exposure to the commodity markets within the limitations of Subchapter M of the Internal Revenue Code of 1986, as amended (the “Code”), and recent IRS revenue rulings, as discussed below under “Distributions to Shareholders” and “Tax Basis Information.” The Fund is the sole shareholder of the Subsidiary pursuant to a subscription agreement dated as of August 2, 2011, and it is intended that the Fund will remain the sole shareholder and will continue to control the Subsidiary. Under the Articles of Association of the Subsidiary, shares issued by the Subsidiary confer upon a shareholder the right to wholly own and vote at general meetings of the Subsidiary and certain rights in connection with any winding-up or repayment of capital, as well as the right to participate in the profits or assets of the Subsidiary. The Fund may invest up to 25% of its total assets in shares of the Subsidiary. As a wholly owned subsidiary of Aspen Managed Futures Strategy Fund, all assets and liabilities, income and expenses of the Subsidiary are consolidated in the financial statements and financial highlights of the Fund. All investments held by the Subsidiary are disclosed in the accounts of the Fund. As of October 31, 2012, net assets of the Fund were $110,884,547, of which $22,000,196, or 19.84%, represented the Fund’s ownership of all issued shares and voting rights of the Subsidiary.
2. SIGNIFICANT ACCOUNTING POLICIES
The following is a summary of significant accounting policies consistently followed by the Fund and Subsidiary. These policies are in conformity with U.S. generally accepted accounting principles (“GAAP”).
The preparation of financial statements in accordance with GAAP requires management to make certain estimates and assumptions that affect the reported amounts and disclosures in the financial statements during the reporting period. Management believes the estimates and security valuations are appropriate; however, actual results may differ from those estimates, and the security valuations reflected in the financial statements may differ from the value the Fund ultimately realizes upon sale of the securities.
Investment Valuation: The Fund generally values its securities based on market prices determined at the close of regular trading on the New York Stock Exchange (“NYSE”), normally 4:00 p.m. Eastern Time, on each day the NYSE is open for trading.
For equity securities and mutual funds that are traded on an exchange, the market price is usually the closing sale or official closing price on that exchange. In the case of equity securities not traded on an exchange, or if such closing prices are not otherwise available, the securities are valued at the mean of the most recent bid and ask prices on such day.
The market price for debt obligations is generally the price supplied by an independent third-party pricing service approved by the Board of Trustees (the “Board”), which may use a matrix, formula or other objective method that takes into consideration quotations from dealers, market transactions in comparable investments, market indices and yield curves. If vendors are unable to supply a price, or if the price supplied is deemed to be unreliable, the market price may be determined using quotations received from one or more brokers–dealers that make a market in the security. Short–term debt obligations that will mature in 60 days or less are valued at amortized cost, unless it is determined that using this method would not reflect an investment’s fair value. Investments in non-exchange traded funds are fair valued at their respective net asset values.
Futures contracts that are listed or traded on a national securities exchange, commodities exchange, contract market or comparable over-the- counter market, and that are freely transferable, are valued at their closing settlement price on the exchange on which they are primarily traded or based upon the current settlement price for a like instrument acquired on the day on which the instrument is being valued. A settlement price may not be used if the market makes a limit move with respect to a particular commodity.
Forward currency exchange contracts have a market value determined by the prevailing foreign currency exchange daily rates and current foreign currency exchange forward rates. The foreign currency exchange forward rates are calculated using an automated system that estimates rates on the basis of the current day foreign currency exchange rates and forward foreign currency exchange rates supplied by a pricing service.
| 12 | www.aspenfuturesfund.com |
Table of Contents
| Aspen Managed Futures Strategy Fund | Notes to Consolidated Financial Statements | |
| October 31, 2012 (Unaudited) |
Redeemable securities issued by open-end registered investment companies are valued at the investment company’s applicable net asset value.
Investment securities that are primarily traded on foreign securities exchanges are valued at the preceding closing values of such securities on their respective exchanges, except when an occurrence subsequent to the time a value was so established is likely to have changed such value. In such an event, the fair value of those securities are determined in good faith through consideration of other factors in accordance with procedures established by and under the general supervision of the Board.
When such prices or quotations are not available, or when the Fair Value Committee appointed by the Board believes that they are unreliable, securities may be priced using fair value procedures approved by the Board. The Fund may also use fair value procedures if the Fair Value Committee determines that a significant event has occurred between the time at which a market price is determined and the time at which a Fund’s NAV is calculated. In particular, the value of non-U.S. securities may be materially affected by events occurring after the close of the foreign exchange on which they are traded, but before the Fund prices its shares.
Valuing securities at fair value involves greater reliance on judgment than valuation of securities based on readily available market quotations. A fund that uses fair value to price securities may value those securities higher or lower than another fund using market quotations or its own fair value methodologies to price the same securities. There can be no assurance that the Fund could obtain the fair value assigned to a security if it were to sell the security at approximately the time at which the Fund determines its net asset value, and the difference between fair value and the price of the securities may be material.
Fair Value Measurements: The Fund discloses the classification of its fair value measurements following a three-tier hierarchy based on the inputs used to measure fair value. Inputs refer broadly to the assumptions that market participants would use in pricing the asset or liability, including assumptions about risk. Inputs may be observable or unobservable. Observable inputs reflect the assumptions market participants would use in pricing the asset or liability that are developed based on market data obtained from sources independent of the reporting entity. Unobservable inputs reflect the reporting entity’s own assumptions about the assumptions market participants would use in pricing the asset or liability that are developed based on the best information available.
Various inputs are used in determining the value of the Fund’s investments as of the end of the reporting period. When inputs used fall into different levels of the fair value hierarchy, the level in the hierarchy within which the fair value measurement falls is determined based on the lowest level input that is significant to the fair value measurement in its entirety. The designated input levels are not necessarily an indication of the risk or liquidity associated with these investments. These inputs are categorized in the following hierarchy under applicable financial accounting standards:
Level 1 | – | Unadjusted quoted prices in active markets for identical investments, unrestricted assets or liabilities that the Fund has the ability to access at the measurement date; | ||
Level 2 | – | Quoted prices which are not active, quoted prices for similar assets or liabilities in active markets or inputs other than quoted prices that are observable (either directly or indirectly) for substantially the full term of the asset or liability; and | ||
Level 3 | – | Significant unobservable prices or inputs (including the Fund’s own assumptions in determining the fair value of investments) where there is little or no market activity for the asset or liability at the measurement date. | ||
| Semi-Annual Report | October 31, 2012 | 13 |
Table of Contents
Aspen Managed Futures Strategy Fund | Notes to Consolidated Financial Statements | |
| October 31, 2012 (Unaudited) |
The following is a summary of each input used to value the Fund as of October 31, 2012:
| Investments in Securities at Value | Level 1 - Quoted Prices | Level 2 - Other Significant | Level 3 - Unobservable | Total | ||||||||||||
Short Term Investments | $ | 10,297,720 | $ | – | $ | – | $ | 10,297,720 | ||||||||
TOTAL | $ | 10,297,720 | $ | – | $ | – | $ | 10,297,720 | ||||||||
Other Financial Instruments | ||||||||||||||||
Assets: | ||||||||||||||||
Futures Contracts | ||||||||||||||||
Commodity Contracts | $ | 221,397 | $ | – | $ | – | $ | 221,397 | ||||||||
Foreign Currency Contracts | 473,676 | – | – | 473,676 | ||||||||||||
Liabilities: | ||||||||||||||||
Futures Contracts | ||||||||||||||||
Commodity Contracts | $ | (55,821) | $ | – | $ | – | $ | (55,821) | ||||||||
Equity Contracts | (134,593) | – | – | (134,593) | ||||||||||||
Fixed Income Contracts | (151,274) | – | – | (151,274) | ||||||||||||
Foreign Currency Contracts | (185,871) | – | – | (185,871) | ||||||||||||
TOTAL | $ | 167,514 | $ | – | $ | – | $ | 167,514 | ||||||||
The Fund recognizes transfers between levels as of the beginning of the annual period in which the transfer occurred. For the six months ended October 31, 2012, the Fund did not have any transfers between Level 1 and Level 2 securities. For the six months ended October 31, 2012, the Fund did not have any securities that used significant unobservable inputs (Level 3) in determining fair value. Therefore, a reconciliation of assets in which significant unobservable inputs (Level 3) were used in determining fair value is not applicable.
Investment Transactions: Investment transactions are accounted for on the date the investments are purchased or sold (trade date). Realized gains and losses from investment transactions are reported on an identified cost basis. Interest income, which includes accretion of discounts, is accrued and recorded as earned. Dividend income is recognized on the ex-dividend date or for certain foreign securities, as soon as information is available to the Fund.
Foreign Securities: The Fund may directly purchase securities of foreign issuers. Investing in securities of foreign issuers involves special risks not typically associated with investing in securities of U.S. issuers. The risks include possible reevaluation of currencies, the inability to repatriate foreign currency, less complete financial information about companies and possible future adverse political and economic developments. Moreover, securities of many foreign issuers and their markets may be less liquid and their prices more volatile than those of securities of comparable U.S. issuers.
Foreign Currency Translation: The books and records of the Fund are maintained in U.S. dollars. Investment valuations and other assets and liabilities initially expressed in foreign currencies are converted each business day into U.S. dollars based upon current exchange rates. Prevailing foreign exchange rates may generally be obtained at the close of the NYSE (normally, 4:00 p.m. Eastern Time). The portion of realized and unrealized gains or losses on investments due to fluctuations in foreign currency exchange rates is not separately disclosed and is included in realized and unrealized gains or losses on investments, when applicable.
Foreign Currency Spot Contracts: The Fund may enter into foreign currency spot contracts to facilitate transactions in foreign securities or to convert foreign currency receipts into U.S. dollars. A foreign currency spot contract is an agreement between two parties to buy and sell currencies at the current market rate, for settlement generally within two business days. The U.S. dollar value of the contracts is determined using current currency exchange rates supplied by a pricing service. The contract is marked-to-market daily for settlements beyond one day and any change in market value is recorded as an unrealized gain or loss. When the contract is closed, the Fund records a realized gain or loss equal to the difference between the value on the open and close date. Losses may arise from changes in the value of the foreign currency, or if the counterparties do not perform under the contract’s terms. The maximum potential loss from such contracts is the aggregate face value in U.S. dollars at the time the contract was opened.
Trust Expenses: Some expenses of the Trust can be directly attributed to the Fund. Expenses which cannot be directly attributed to the Fund are apportioned among all funds in the Trust based on average net assets of each fund.
Fund and Class Expenses: Expenses that are specific to a class of shares of the Fund are charged directly to that share class. Fees provided under the distribution (Rule 12b-1) for a particular class of the Fund are charged to the operations of such class.
| 14 | www.aspenfuturesfund.com |
Table of Contents
| Aspen Managed Futures Strategy Fund | Notes to Consolidated Financial Statements | |
| October 31, 2012 (Unaudited) |
Offering Costs: Offering costs, including costs of printing initial prospectuses, legal and registration fees, are being amortized over twelve months from the inception date of the Fund. As of October 31, 2012, no offering costs remain to be amortized for the Fund.
Federal Income Taxes: The Fund complies with the requirements under Subchapter M of the Internal Revenue Code of 1986, as amended, applicable to regulated investment companies and intends to distribute substantially all of their net taxable income and net capital gains, if any, each year. The Fund is not subject to income taxes to the extent such distributions are made.
During the six months ended October 31, 2012, the Fund did not have a liability for any unrecognized tax benefits in the accompanying financial statements. The Fund files income tax returns in the U.S. Federal jurisdiction and Colorado.
Distributions to Shareholders: The Fund normally pays dividends and distributes capital gains, if any, on an annual basis. Income dividend distributions are derived from interest and other income the Fund receives from its investments, including distributions of short term capital gains. Capital gains distributions are derived from gains realized when the Fund sells a security it has owned for more than a year. The Fund may make additional distributions and dividends at other times if the portfolio manager believes doing so may be necessary for the Fund to avoid or reduce taxes. Net investment income/(loss) and net realized gain/(loss) may differ for financial statement and tax purposes.
3. DERIVATIVE INSTRUMENTS
The Fund uses derivatives (including futures) to pursue its investment objective. The Fund’s use of derivative instruments involves risks different from, or possibly greater than, the risks associated with investing directly in securities and other traditional investments. These risks may include (i) the risk that the counterparty to a derivative transaction may not fulfill its contractual obligations, (ii) risk of mispricing or improper valuation, and (iii) the risk that changes in the value of the derivative may not correlate perfectly with the underlying asset, rate or index. These risks could cause the Fund to lose more than the principal amount invested. In addition, investments in derivatives involve leverage, which means a small percentage of assets invested in derivatives can have a disproportionately large impact on the Fund.
The Fund’s use of derivatives can result in losses due to unanticipated changes in the market risk factors and the overall market. In instances where the Fund is using derivatives to decrease, or hedge, exposures to market risk factors for securities held by the Fund, there are also risks that those derivatives may not perform as expected resulting in losses for the combined or hedged positions. Derivatives may have little or no initial cash investment relative to their market value exposure and therefore can produce significant gains or losses in excess of their cost. This use of embedded leverage allows the Fund to increase its market value exposure relative to its net assets and can substantially increase the volatility of the Fund’s performance.
In addition, use of derivatives may increase or decrease exposure to the following risk factors:
| • | Equity Risk: Equity risk relates to the change in value of equity securities as they relate to increases or decreases in the general market. |
| • | Fixed Income Risk: When the Fund invests in fixed-income securities or derivatives, the value of an investment in the Fund will fluctuate with changes in interest rates. Typically, a rise in interest rates causes a decline in the value of fixed-income securities or derivatives owned by the Fund. In general, the market price of debt securities with longer maturities will increase or decrease more in response to changes in interest rates than shorter-term securities. Other risk factors include credit risk (the debtor may default) and prepayment risk (the debtor may pay its obligation early, reducing the amount of interest payments). |
| • | Foreign Currency Risk: Currency trading involves significant risks, including market risk, interest rate risk, country risk, counterparty credit risk and short sale risk. Market risk results from the price movement of foreign currency values in response to shifting market supply and demand. Interest rate risk arises whenever a country changes its stated interest rate target associated with its currency. Country risk arises because virtually every country has interfered with international transactions in its currency. Counterparty credit risk arises when the counterparty will not fulfill its obligations to the Fund. Short sale risk arises from the sale of a security that is not owned, or any sale that is completed by the delivery of a security borrowed. |
| • | Commodity Risk: Exposure to the commodities markets may subject the Fund to greater volatility than investments in traditional securities. Commodity prices are influenced by unfavorable weather, animal and plant disease, geologic and environmental factors, as well as changes in government regulation such as tariffs, embargoes or burdensome production rules and restrictions. |
Futures: The Fund and the Subsidiary may enter into futures contracts. Futures contracts are agreements between two parties to buy and sell a particular commodity, instrument or index for a specified price on a specified future date. When the Fund or the Subsidiary enters into a futures contract, it is required to deposit with (or for the benefit of) its broker an amount of cash or short-term high-quality securities as “initial margin”. The margin requirements are set by the exchange on which the contract is traded and may be modified during the term of the contract. The initial margin is in the nature of a performance bond or good faith deposit on the futures contract that is returned to the Fund upon termination of the
| Semi-Annual Report | October 31, 2012 | 15 |
Table of Contents
Aspen Managed Futures Strategy Fund | Notes to Consolidated Financial Statements | |
| October 31, 2012 (Unaudited) |
contract, assuming all contractual obligations have been satisfied. As the value of the contract changes, the value of the futures contract position increases or declines. Subsequent payments, known as “variation margin”, are made or received by the Fund or the Subsidiary, depending on the price fluctuations in the fair value of the contract and the value of cash or securities on deposit with the broker. The aggregate principal amounts of the contracts are not recorded in the financial statements. Fluctuations in the value of the contracts are recorded in the Consolidated Statements of Assets and Liabilities as an asset (liability) and in the Consolidated Statements of Operations as unrealized appreciation (depreciation) until the contracts are closed, when they are recorded as realized gains (losses). Realized gain or loss on a futures position is equal to the difference between the value of the contract at the time it was opened and the value at the time it was closed, minus brokerage commissions. When the Fund or the Subsidiary enters into a futures contract certain risks may arise, such as illiquidity in the futures market, which may limit the Fund’s or the Subsidiary’s ability to close out a futures contract prior to settlement date, and unanticipated movements in the value of securities, commodities or interest rates. Futures contracts are exchange-traded. Exchange-traded futures are standardized contracts and are settled through a clearing house with fulfillment supported by the credit of the exchange. Therefore, counterparty credit risk to the Fund and the Subsidiary is reduced. In addition, the Fund could be exposed to risk if the counterparties to the contracts are unable to meet the terms of their contracts. With exchange traded futures, there is minimal counterparty credit risk to the Funds since futures are exchange traded and the exchange’s clearinghouse, as a counterparty to all exchange traded futures, guarantees the futures against default.
Balance Sheet – Fair Value of Derivative Instruments as of October 31, 2012:
| Derivatives Instruments | Asset Derivatives Balance Sheet Location | Fair Value | Liabilities Derivatives Balance Sheet Location | Fair Value | ||||||||||
Futures Contracts* | Variation Margin Receivable | $ | 167,514 | Variation Margin Payable | $ | – | ||||||||
|
|
|
| |||||||||||
| $ | 167,514 | $ | – | |||||||||||
|
|
|
| |||||||||||
| *Risk Exposure to Fund | ||||||||||||||
Commodity Contracts | $ | 165,576 | ||||||||||||
Equity Contracts | (134,593 | ) | ||||||||||||
Fixed Income Contracts | (151,274 | ) | ||||||||||||
Foreign Currency Contracts | 287,805 | |||||||||||||
|
| |||||||||||||
| $ | 167,514 | |||||||||||||
|
| |||||||||||||
| * | For open derivative instruments as of October 31, 2012, see the Consolidated Schedule of Investments, which is also indicative of the activity for the six months ended October 31, 2012. |
Consolidated Statement of Operations – The effect of Derivative Instruments for the six months ended October 31, 2012:
| Derivatives Instruments | Location of Gain/(Loss) on Derivatives Recognized in Income | Realized Gain/(Loss) on Derivatives Recognized in Income | Change in Unrealized Gain/(Loss) on Derivatives Recognized in Income | |||||||
Futures Contracts* | Net realized loss on futures contracts/Net change in unrealized appreciation on futures contracts | $ | (740,035) | $ | 437,039 | |||||
|
| |||||||||
| $ | (740,035) | $ | 437,039 | |||||||
|
| |||||||||
| *Risk Exposure to Fund | ||||||||||
Commodity Contracts | $ | 260,661 | $ | 195,051 | ||||||
Equity Contracts | (1,295,017) | ( 150,249) | ||||||||
Fixed Income Contracts | 1,261,315 | (389,183) | ||||||||
Foreign Currency Contracts | (966,994) | 781,420 | ||||||||
|
| |||||||||
| $ | (740,035) | $ | 437,039 | |||||||
|
| |||||||||
| * | For open derivative instruments as of October 31, 2012, see the Consolidated Schedule of Investments, which is also indicative of the activity for the six months ended October 31, 2012. |
| 16 | www.aspenfuturesfund.com |
Table of Contents
Aspen Managed Futures Strategy Fund | Notes to Consolidated Financial Statements | |
| October 31, 2012 (Unaudited) |
4. TAX BASIS INFORMATION
Tax Basis of Distributions to Shareholders: Distributions are determined in accordance with Federal income tax regulations, which differ from GAAP, and, therefore, may differ significantly in amount or character from net investment income and realized gains for financial reporting purposes. Financial reporting records are adjusted for permanent book/tax differences to reflect tax character but are not adjusted for temporary differences. During the six months ended October 31, 2012, the Fund did not make any distributions.
As of October 31, 2012, the aggregate cost of investments, gross unrealized appreciation/(depreciation) and net unrealized appreciation for Federal tax purposes was as follows:
| Fund | Cost of Investments | Gross Unrealized Appreciation | Gross Unrealized (Depreciation) | Net Unrealized Appreciation of Foreign Currency and Derivatives | ||||
Aspen Managed Futures Strategy | ||||||||
Fund | $ 10,297,720 | $ 406,598 | ($ 406,598) | $ 0 |
Under the Regulated Investment Company Modernization Act of 2010 (the “Modernization Act”), net capital losses recognized in tax years beginning after December 22, 2010 may be carried forward indefinitely, and the character of the losses is retained as short-term and/or long-term.
Post Modernization Act enactment, short-term capital losses in the amount of $627,443 and long-term capital losses in the amount of $704,192 are deferred to the next fiscal year.
5. SHARES OF BENEFICIAL INTEREST
The capitalization of the Trust consists of an unlimited number of shares of beneficial interest with no par value per share. Holders of the shares of the Fund of the Trust have one vote for each share held and a proportionate fraction of a vote for each fractional share. All shares issued and outstanding are fully paid and are non-assessable, transferable and redeemable at the option of the shareholder. Shares have no pre-emptive rights.
Fund shares redeemed within 30 days of purchase may incur a 2% short-term redemption fee deducted from the redemption amount. The Fund’s Class I shares received $1,002 in redemption fees during the six months ended October 31, 2012. There were no redemption fees collected on Class A shares.
Beneficial Ownership: The beneficial ownership, either directly or indirectly, of more than 25% of the voting securities of any class of the Fund creates a presumption of control of the Fund under Section 2(a)(9) of the 1940 Act. As of October 31, 2012, the following entities owned beneficially 25% or greater of the Fund’s outstanding shares. The shares are held under omnibus accounts (whereby the transactions of two or more shareholders are combined and carried in the name of the originating broker rather than designated separately).
| Class | Aspen Managed Futures Strategy Fund | Percentage | ||||
I | Charles Schwab & Co. | 33.69% | ||||
I | National Financial Services Corp. | 52.93% |
6. MANAGEMENT AND RELATED-PARTY TRANSACTIONS
Aspen Partners Ltd. (the “Adviser” or “Aspen”), subject to the authority of the Board, is responsible for the overall management and administration of the Fund’s business affairs. The Adviser manages the investments of the Fund in accordance with the Fund’s investment objective, policies and limitations and investment guidelines established jointly by the Adviser and the Trustees. Pursuant to the Investment Advisory Agreement, (the “Advisory Agreement”), the Fund will pay the Adviser an annual management fee of 0.75%, based on the Fund’s average daily net assets. The management fee is paid on a monthly basis.
The Subsidiary has entered into a separate advisory agreement (the “Subsidiary Advisory Agreement”) with Aspen, the Subsidiary’s investment adviser and the Fund’s investment adviser, for the management of the Subsidiary’s portfolio pursuant to which the Subsidiary is obligated to pay the Adviser a management fee at the same rate that the Fund pays the Adviser for investment advisory services provided to the Fund. The Adviser has agreed to waive the advisory fee it receives from the Fund in an amount equal to the management fee paid by the Subsidiary. This waiver may not be terminated or modified without the consent of the Board.
| Semi-Annual Report | October 31, 2012 | 17 |
Table of Contents
Aspen Managed Futures Strategy Fund | Notes to Consolidated Financial Statements | |
| October 31, 2012 (Unaudited) |
The Adviser has agreed to waive and/or reimburse fees or expenses in order to limit total annual Fund operating expenses after fee waiver/expense reimbursements (excluding distribution and service (12b-1) fees, shareholder services fees, acquired fund fees and expenses, brokerage expenses, interest expenses, taxes and extraordinary expenses) to 1.55% of the Fund’s average daily net assets. This agreement is in effect through August 31, 2013. This agreement may not be terminated or modified prior to this date except with the approval of the Board.
Pursuant to this agreement, the Fund will reimburse the Adviser for any fee waivers and expense reimbursements made by the Adviser, provided that any such reimbursements made by the Fund to the Adviser will not cause the Fund’s expense limitation to exceed expense limitations in existence at the time the expense was incurred, or at the time of the reimbursement, whichever is lower, and the reimbursement is made within three years after the expenses were incurred.
For the six months ended October 31, 2012, the fee waivers and/or reimbursements were as follows:
| Fund | Fees Waived/Reimbursed By Advisor | Recoupment of Past Waived Fees By Advisor | Total | |||||
Aspen Managed Futures Strategy | $ 0 | $ (2,400) | $ (2,400) | |||||
Aspen Managed Futures Strategy | $ 0 | $ (74,999) | $ (74,999) |
As of October 31, 2012, the balances of recoupable expenses for the Fund were as follows:
Fund | 2015 | 2016 | TOTAL | |||||||
Aspen Managed Futures Strategy Fund - Class A | $ 19,373 | $ 0 | $ 19,373 | |||||||
Aspen Managed Futures Strategy Fund - Class I | 0 | 0 | 0 |
Fund Accounting Fees and Expenses
ALPS Fund Services, Inc. (“ALPS” and the “Administrator”) (an affiliate of ALPS Distributors, Inc.) serves as administrator to the Fund and Subsidiary. The Fund has agreed to pay expenses incurred in connection with its administrative activities. Pursuant to the Administration, Bookkeeping and Pricing Services Agreement (the “Agreement”), ALPS will provide operational services to the Fund including, but not limited to fund accounting and fund administration and generally assist in the Fund’s operations. The table below describes the administrative fee paid by the Fund to ALPS pursuant to the Agreement during the six months ended October 31, 2012.
The Fund’s administration fee is accrued on a daily basis, and paid on a monthly basis following the end of the month, based on the greater of (a) an annual total fee of $165,000 from the first to the last, or projected last, day of the then current year of service under the Administration Agreement; or (b) the following basis point fee schedule:
| Average Total Net Assets | Contractual Fee | |||||
Between $0-$500M | 0.05 | % | ||||
$500M-$1B | 0.03 | % | ||||
Above $1B | 0.02 | % | ||||
The Subsidiary’s administration fee is based on an annual rate of $37,500 through July 2012 and $15,000 thereafter.
The Administrator is also reimbursed by the Fund for certain out-of-pocket expenses.
Transfer Agent
ALPS serves as transfer, dividend paying and shareholder servicing agent for the Fund. ALPS is compensated based upon a $20,000 annual base fee for the Fund, and annually $9 per direct open account and $7 per open account through the National Securities Clearing Corporation. ALPS is also reimbursed by the Fund for certain out-of-pocket expenses.
Compliance Services
ALPS provides services as the Fund’s Chief Compliance Officer to assist the Trust’s Chief Compliance Officer in monitoring and testing the policies and procedures of the Trust in conjunction with requirements under Rule 38a-1 under the 1940 Act and receives an annual base fee of $30,000.
Principal Financial Officer
ALPS receives an annual fee of $5,000 for providing Principal Financial Officer services to the Fund.
Distributor
ALPS Distributors, Inc. (“ADI” or the “Distributor”) (an affiliate of ALPS) acts as the distributor of the Fund’s shares pursuant to a Distribution Agreement with the Trust. Shares are sold on a continuous basis by ADI as agent for the Fund, and ADI has agreed to use its best efforts to solicit
| 18 | www.aspenfuturesfund.com |
Table of Contents
Aspen Managed Futures Strategy Fund | Notes to Consolidated Financial Statements | |
| October 31, 2012 (Unaudited) |
orders for the sale of the Fund’s shares, although it is not obliged to sell any particular amount of shares. ADI is not entitled to any compensation for its services as Distributor. ADI is registered as a broker-dealer with the Securities and Exchange Commission.
The Fund has adopted a plan of distribution for Class A shares pursuant to Rule 12b-1 under the 1940 Act (the “Plan”). The Plan allows the Fund to use Class A assets to pay fees in connection with the distribution and marketing of Class A shares and/or the provision of shareholder services to Class A shareholders. The Plan permits payment for services in connection with the administration of plans or programs that use Class A shares as their funding medium and for related expenses. The Plan permits the Fund to use its Class A assets to make total payments at an annual rate of up to 0.25% of the Fund’s average daily net assets attributable to its Class A shares. The expenses of the plan are reflected as distribution and service fees in the Consolidated Statement of Operations.
7. INDEMNIFICATIONS
Under the Trust’s organizational documents, its officers and Trustees are indemnified against certain liability arising out of the performance of their duties to the Trust. Additionally, in the normal course of business, the Trust enters into contracts with service providers that may contain general indemnification clauses, which may permit indemnification to the extent permissible under applicable law. The Trust’s maximum exposure under these arrangements is unknown, as this would involve future claims that may be made against the Trust that have not yet occurred.
| Semi-Annual Report | October 31, 2012 | 19 |
Table of Contents
Aspen Managed Futures Strategy Fund | Additional Information | |
| October 31, 2012 (Unaudited) |
1. FUND HOLDINGS
The Fund files its complete schedule of portfolio holdings with the Securities and Exchange Commission (the “SEC”) for the first and third quarters of each fiscal year on Form N-Q within 60 days after the end of the period. Copies of the Fund’s Form N-Q are available without charge on the SEC website at http://www.sec.gov. You may also review and copy the Form N-Q at the SEC’s Public Reference Room in Washington, DC. For more information about the operation of the Public Reference Room, please call the SEC at 1-800-SEC-0330.
2. FUND PROXY VOTING POLICIES, PROCEDURES AND SUMMARIES
The Fund’s policies and procedures used in determining how to vote proxies and information regarding how the Fund voted proxies relating to portfolio securities during the most recent prior 12-month period ending June 30 are available without charge, (1) upon request, by calling (toll- free) 1-855-845-9444 and (2) on the SEC’s website at http://www.sec.gov.
| 20 | www.aspenfuturesfund.com |
Table of Contents

Table of Contents

Table of Contents
| ||
| ||
|
| 1 | ||||||
| 5 | ||||||
| 7 | ||||||
| 8 | ||||||
| 17 | ||||||
| 18 | ||||||
| 19 | ||||||
| 20 | ||||||
| 21 | ||||||
| 27 | ||||||
Table of Contents
| The Disciplined Growth Investors Fund | Shareholder Letter | |
| October 31, 2012 (Unaudited) |
DGIFX Shareholder Letter:
The Disciplined Growth Investors mutual fund is a balanced fund, invested with a significant exposure to both stocks and bonds. Because the expected return from our portfolio of stocks is considerably higher than our portfolio of bonds we increased the stock allocation to about 70%. The remainder of the portfolio is invested in bonds and cash. We are maintaining tight maturity and credit control over the bonds in the mutual fund.
The economic framework for our decisions envisions some continued progress towards recovery from the 2008 financial crisis. We expect continued economic and market turbulence. There are too many open issues. In the U.S. there has been little or no progress towards resolution of the chronic U.S federal budget deficits. In Europe, there have been some efforts made to retain the Eurodollar as the primary currency. The Mideast is in turmoil. China’s ability to maintain high growth rates is questionable. As these issues move towards resolution we expect market turbulence.
Our investment approach seeks to minimize the chances of long-term loss of capital and purchasing power. We expect the stock market will be periodically buffeted by macroeconomic issues but will not suffer permanent erosion. The bond market is far more exposed to long-term loss of capital.
Bonds appear vulnerable for four reasons:
1. Bond yields are low.
2. There is not sufficient transparency offered by bond issuers.
3. The world’s largest borrower (U.S. Treasury) cannot manage its financial affairs properly.
4. Bonds, especially, longer-term maturities, are uniquely vulnerable to inflation.
Low Bond Yields
A buyer of 10-year Treasury Bonds today would earn a 1.75% yield-to-maturity. This means the investor would earn 1.75% per year before inflation if the bonds were held until maturity. This return similar to what most equity investors earned from 2000 until 2010.
A 1.75% return seems low by almost any measure.
Investment grade corporate bonds and high-yield bonds offer higher yields than Treasuries. According to Bank of America - Merrill Lynch, AA-rated industrials offer a 2.5% yield-to-maturity on ten-year maturities.1 AA-rated utilities offer 2.9%. High yield bonds offer 6.48%.2
In our view, investment grade and high-yield corporate bonds do not offer competitive ten-year returns when compared to stocks. Today, the stocks of many companies offer potential ten-year returns in excess of 10% under very reasonable assumptions.3 Many of these companies’ balance sheets are in significantly better shape than to the debt-laden balance sheets of high-yield borrowers.
Insufficient Transparency
During the last 20 years bond issuers have evolved into a dizzying array of offerings. The securitization of bonds allowed Wall Street to create bundled products and CMO’s (collateralized mortgage obligations), CDO’s (collateralized debt obligations), ABS (asset-backed securities), CDS (credit default swaps) have emerged most popular pools of bonds.
| 1 | Source: Factset. Ratings referenced are from Standard & Poors. Data as of 9/30/2012. |
| 2 | Source: Factset. Ratings referenced are from Standard & Poors. Data as of 9/30/2012. |
| 3 | Based on internal research from Disciplined Growth Investors as of 9/30/2012. |
| Semi-Annual Report | October 31, 2012 | 1 |
Table of Contents
| The Disciplined Growth Investors Fund | Shareholder Letter | |
| October 31, 2012 (Unaudited) |
These pools allowed for high efficiency in channeling funds to borrowers. The problem is, these pools are not transparent enough to allow the prudent investor to know what he or she is buying. This has created a dangerous environment, which manifested itself in a near-collapse of the financial system in 2008.
The opacity of the bond market violates the most basic tenet of risk management: know what you own.
The U.S. Government is a Fiscal Mess
Late last year, we published a paper entitled “A Tale of Two Cities” detailing the future liabilities of the U.S. government. The fiscal picture of the U.S. government is dismal, both in the present and in the future. Today the U.S. government spends 60% more than it receives in revenues. And the long-term picture is worse, because of unfunded liabilities.
Inevitably, the U.S, government will restrain itself, either voluntarily or by force. In the meantime, why would any prudent investor loan money to the U.S. government? Especially since the yield on 10-year U.S. government bonds is 1.75%.
Bonds are Vulnerable to Inflation
With the exception of Treasury Inflation Protected Securities (TIPS), nearly all bond contracts are written in current dollars.4 If the value of the dollar falls before the lender is repaid, the lender loses purchasing power.
When inflation increases, interest must rise to offer the lender protection against the loss of purchasing power. The devastating effects on real net worth can be illustrated by a real-life story.
In the early 1980’s interest rates reached extremely high levels because of the inflation of the 1960’s and 1970’s. In the early 1980’s I directed the purchase of the New Jersey Bell 3 and 3/8% bonds due in 1995. New Jersey Bell had a AAA credit rating. We bought the bonds for about 35 cents on the dollar. This meant that the bonds had a current yield of nearly 9% and the bondholders would receive 100 cents on the dollar in about 12 years, for a gain in principal of nearly 3 times the investment.
I remember this story vividly because I wrote a letter to our clients explaining the purchase of the bonds; my purpose was to reassure them that purchase of bonds at those prices was a sound investment decision.
We purchased those bonds from somebody. I have gone back and researched the history of the bonds. Unfortunately I have not yet been able to determine when and at what price the bonds were issued. It is reasonable to assume the bonds were issued in 1955 or 1965. Since the bonds were to be redeemed at par in 1995, they were probably issued at a price of 100, or par, in either 1955 or 1965.
From 1955 through 1983, gold prices rose from a fixed $35 per ounce to an average price of $420, a rise of twelve times.5 Simultaneously, the dollar, adjusted for inflation, fell to about a quarter of its original
| 4 | A Treasury Inflation Protected Security, or “TIPS”, is a US Government-backed Treasury Security indexed to inflation to protect investors from the affects of inflation. The interest rate remains fixed and the par – or issue – value of the security rises with inflation. |
| 5 | Source: World Gold Council data via National Mining Association. |
| 2 | 1-855-DGI-FUND (344-3863) | www.DGIfund.com |
Table of Contents
| The Disciplined Growth Investors Fund | Shareholder Letter | |
| October 31, 2012 (Unaudited) |
real value.6 The consequence of this inflation was reflected in bond prices: a New Jersey Bell (the predecessor to Verizon) 3 3/8 40-year bond fell from a face value at par of $1,000 to approximately $350. The total coupons collected during that period, almost $1,000, were cold comfort: the original face value of $1,000 would have purchased almost 29 ounces of gold at issue, while by 1983 the $350 price tag wouldn’t have even covered a full ounce. This was a massive loss of purchasing power.
The Point of My Comments
We are not forecasting a return of inflation, but we do view bonds as a lousy place to invest today. Eventually, transparency will increase, the U.S. government will get its fiscal house in order, and interest rates will offer enough yield to justify the risk of owning that type of liquid asset. We do not know when these events will occur.
Are the majority of investors heeding our warning? The net inflows into stock and bond mutual funds say no. Since 2007, mutual fund investors reversed a prior of pattern of favoring equity mutual funds over bond mutual funds. Bond mutual funds garnered nearly $1 trillion of new funds and equity mutual funds suffered outflows of $450 billion.
According to mutual fund data, investors poured money into equity mutual funds in the 1990’s. Today investors are pouring funds into bond funds. We believe they will be wrong again.
Mutual Fund Flows ($ billions)
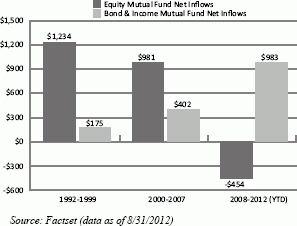
Fred Martin,
Chief Investment Officer
The Disciplined Growth Investors Fund is distributed by ALPS Distributors, Inc.
Fred Martin is a registered representative of ALPS Distributors, Inc.
Must be accompanied by or preceded by a prospectus.
| 6 | Source: U.S. Bureau of Labor Statistics CPI data. |
| Semi-Annual Report | October 31, 2012 | 3 |
Table of Contents
| The Disciplined Growth Investors Fund | Shareholder Letter | |
| October 31, 2012 (Unaudited) |
Disclosures:
The views and information discussed in this commentary are as of the date of publication, are subject to change, and may not reflect the writer’s current views. The views expressed represent an assessment of market conditions at a specific point in time, are opinions only and should not be relied upon as investment advice regarding a particular investment or markets in general. Such information does not constitute a recommendation to buy or sell specific securities or investment vehicles. It should not be assumed that any investment will be profitable or will equal the performance of the portfolios or any securities or any sectors mentioned herein. The subject matter contained herein has been derived from several sources believed to be reliable and accurate at the time of compilation. The Fund does not accept any liability for losses either direct or consequential caused by the use of this information.
S&P ratings assist investors by evaluating the credit worthiness of many bond issues. AAA to BBB ratings are typically issued to those securities considered investment grade. The rating is not a recommendation to buy or sell a particular bond. For information on the rating agency’s methodology go to: http://www.standardandpoors.com/home/en/us.
All holdings are subject to change, including those mentioned in this shareholder letter.
The Top 10 Holdings as of 9/30/2012 are: Edwards Lifesciences Corp., TJX Companies Inc., Intuit Inc., Cabela’s Inc., Limited Brands Inc., Plexus Corp., Eaton Corp., Select Comfort Corp., Trimble Navigation Ltd., Seagate Technology PLC. Holdings are subject to change.
An investment in the Fund involves risk, including possible loss of principal. Investments in small and mid-size companies will generally lead to greater volatility. Investments in fixed-income securities are subject to increased loss of principal during periods of rising interest rates.
| 4 | 1-855-DGI-FUND (344-3863) | www.DGIfund.com |
Table of Contents
| The Disciplined Growth Investors Fund | Performance Update | |
| October 31, 2012 (Unaudited) |
Total Return (for the period ended October 31, 2012)
| 1 month | 3 month | 1 Year | YTD | Since Inception* | ||||||
Disciplined Growth Investors Fund | -1.93% | 2.91% | 12.99% | 13.09% | 18.54% | |||||
S&P 500® Total Return Index(1) | -1.85% | 2.96% | 15.21% | 14.29% | 18.53% |
| * | Fund Inception date of August 12, 2011 |
| (1) | The S&P 500® Total Return Index is an unmanaged index of 500 common stocks chosen for market size, liquidity and industry group representation. It is a market-value weighted index. The S&P 500® Total Return Index is not actively managed and do not reflect any deduction for fees, expenses or taxes. It is not possible to invest directly in an index. |
The returns shown above do not reflect the deductions of taxes a shareholder would pay on Fund distributions or redemptions of Fund shares.
Returns less than one year are cumulative.
Performance data quoted represents past performance. Past performance does not guarantee future results. Investment return and principal value of an investment will fluctuate so that an investor’s shares, when sold or redeemed, may be worth more or less than the original cost. Current performance data may be higher or lower than actual data quoted. For the most current month-end performance data please call 855-DGI-FUND.
Growth of $10,000 Investment in the Fund (for the period ended October 31, 2012)
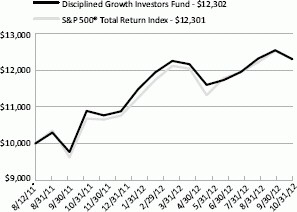
The chart represents historical performance of a hypothetical investment of $10,000 in the Fund since inception. Past performance does not guarantee future results. This chart does not reflect the deduction of taxes that a shareholder would pay on Fund distributions or the redemption of Fund shares.
Investing in the Fund is subject to investment risks, including possible loss of the principal amount invested.
| Semi-Annual Report | October 31, 2012 | 5 |
Table of Contents
| The Disciplined Growth Investors Fund | Performance Update | |
| October 31, 2012 (Unaudited) |
Industry Sector Allocation (as a % of Net Assets)*
Technology | 22.58 | % | ||
Consumer Discretionary | 21.66 | % | ||
Corporate Bonds | 21.57 | % | ||
Producer Durables | 10.48 | % | ||
Health Care | 7.31 | % | ||
Financial Services | 3.67 | % | ||
Energy | 2.20 | % | ||
Foreign Government Bonds | 1.52 | % | ||
Utilities | 1.22 | % | ||
Industrials | 0.68 | % | ||
Asset/Mortgage Backed Securities | 0.20 | % | ||
Government & Agency Obligations | 0.12 | % | ||
Municipal Bonds | 0.01 | % | ||
Short Tem & Other Net Assets | 6.78 | % |
Top Ten Holdings (as a % of Net Assets)*
TJX Cos., Inc. | 3.99 | % | ||
Edwards Lifesciences Corp. | 3.76 | % | ||
Intuit, Inc. | 3.68 | % | ||
Eaton Corp. | 2.60 | % | ||
Limited Brands, Inc. | 2.57 | % | ||
Plexus Corp. | 2.34 | % | ||
Trimble Navigation Ltd. | 2.26 | % | ||
Cabela’s, Inc. | 2.26 | % | ||
Open Text Corp. | 2.18 | % | ||
Middleby Corp. | 2.17 | % | ||
Top Ten Holdings | 27.81 | % |
| * | Holdings are subject to change. Tables present indicative values only. |
| 6 | 1-855-DGI-FUND (344-3863) | www.DGIfund.com |
Table of Contents
The Disciplined Growth Investors Fund | Disclosure of Fund Expenses | |
| October 31, 2012 (Unaudited) |
As a shareholder of a Fund, you incur two types of costs: direct costs, such as short-term redemption fees and wire fees, balance fees, and indirect costs, including management fees, and other fund operating expenses. This example is intended to help you understand your indirect costs, also referred to as “ongoing costs” (in dollars), of investing in the Fund and to compare these costs with the ongoing costs of investing in other mutual funds.
This example is based on an investment of $1,000 invested at the beginning of the period and held for the entire six-month period of May 1, 2012 through October 31, 2012.
Actual Expenses The first line of the table below provides information about actual account values and actual expenses. You may use the information in this line, together with the amount you invested at the beginning of the period, to estimate the expenses that you paid over the period. Simply divide your account value by $1,000 (for example, an $8,600 account value divided by $1,000 = 8.6), then multiply the result by the number in the first line under the heading “Expenses Paid During Period” to estimate the expenses you paid on your account during this period.
Hypothetical Example for Comparison Purposes The second line of the table provides information about hypothetical account values and hypothetical expenses based on the Fund’s actual expense ratio and an assumed rate of return of 5% per year before expenses, which is not the Fund’s actual return. The hypothetical account values and expenses may not be used to estimate the actual ending account balance or expenses you paid for the period. You may use this information to compare ongoing costs of investing in the Fund and other funds. To do so, compare this 5% hypothetical example with the 5% hypothetical examples that appear in the shareholder reports of other funds.
Please note that the expenses shown in the table are meant to highlight your ongoing costs only and do not reflect any direct costs, such as wire fees or low balance fees. Therefore, the second line of the table is useful in comparing ongoing costs only and will not help you determine the relative total costs of owning different funds. In addition, if these direct costs were included, your costs would be higher.
Beginning Account 5/1/2012 | Ending Account 10/31/12 | Expense Ratio(a) | Expenses Paid During period | |||||||||||||||||
Actual | $ | 1,000.00 | $ | 1,011.50 | 0.78% | $ | 3.95 | |||||||||||||
Hypothetical | $ | 1,000.00 | $ | 1,021.27 | 0.78% | $ | 3.97 | |||||||||||||
| (a) | The Fund’s expense ratios have been annualized based on the Fund’s most recent fiscal half-year expenses. |
| (b) | Expenses are equal to the Fund’s annualized expense ratio, multiplied by the average account value over the period, multiplied by the number of days in the most recent fiscal half-year 184/365. |
| Semi-Annual Report | October 31, 2012 | 7 |
Table of Contents
| The Disciplined Growth Investors Fund | Portfolio of Investments | |
| October 31, 2012 (Unaudited) |
| Shares | Value (Note 2) | |||||||
COMMON STOCKS (69.80%) | ||||||||
CONSUMER DISCRETIONARY (21.66%) | ||||||||
Auto & Auto Parts (1.20%) | ||||||||
Gentex Corp. | 31,475 | $ | 542,000 | |||||
|
| |||||||
Commercial Services (1.15%) | ||||||||
The Corporate Executive Board Co. | 11,575 | 520,412 | ||||||
|
| |||||||
Consumer Products (7.35%) | ||||||||
Ethan Allen Interiors, Inc. | 30,369 | 893,152 | ||||||
Garmin Ltd. | 16,463 | 625,430 | ||||||
Ralph Lauren Corp. | 5,581 | 857,744 | ||||||
Select Comfort Corp.(a) | 34,399 | 957,324 | ||||||
|
| |||||||
| 3,333,650 | ||||||||
|
| |||||||
Consumer Services (0.22%) | ||||||||
Nutrisystem, Inc. | 10,232 | 98,534 | ||||||
|
| |||||||
Leisure (2.05%) | ||||||||
The Cheesecake Factory, Inc. | 8,450 | 279,357 | ||||||
Royal Caribbean Cruises Ltd. | 19,275 | 648,989 | ||||||
|
| |||||||
| 928,346 | ||||||||
|
| |||||||
Media (0.87%) | ||||||||
DreamWorks Animation SKG, Inc. - Class A(a) | 19,412 | 395,422 | ||||||
|
| |||||||
Retail (8.82%) | ||||||||
Cabela’s, Inc.(a) | 22,900 | 1,026,149 | ||||||
Limited Brands, Inc. | 24,355 | 1,166,361 | ||||||
TJX Cos., Inc. | 43,400 | 1,806,742 | ||||||
|
| |||||||
| 3,999,252 | ||||||||
|
| |||||||
TOTAL CONSUMER DISCRETIONARY | 9,817,616 | |||||||
|
| |||||||
ENERGY (2.20%) | ||||||||
Energy Equipment & Services (1.40%) | ||||||||
Noble Corp. | 16,782 | 633,353 | ||||||
|
| |||||||
| 8 | 1-855-DGI-FUND (344-3863) | www.DGIfund.com |
Table of Contents
| The Disciplined Growth Investors Fund | Portfolio of Investments | |
| October 31, 2012 (Unaudited) |
| Shares | Value (Note 2) | |||||||
ENERGY (continued) | ||||||||
Oil & Gas (0.80%) | ||||||||
Ultra Petroleum Corp.(a) | 16,000 | $ | 364,960 | |||||
|
| |||||||
TOTAL ENERGY | 998,313 | |||||||
|
| |||||||
FINANCIAL SERVICES (3.67%) | ||||||||
Banks (0.68%) | ||||||||
TCF Financial Corp. | 26,800 | 306,592 | ||||||
|
| |||||||
Consumer Finance & Credit Services (1.91%) | ||||||||
FactSet Research Systems, Inc. | 9,569 | 866,473 | ||||||
|
| |||||||
Investment Banking & Brokerage (1.08%) | ||||||||
E*Trade Financial Corp.(a) | 20,381 | 170,385 | ||||||
Janus Capital Group, Inc. | 37,775 | 321,088 | ||||||
|
| |||||||
| 491,473 | ||||||||
|
| |||||||
TOTAL FINANCIAL SERVICES | 1,664,538 | |||||||
|
| |||||||
HEALTH CARE (7.31%) | ||||||||
Medical Equipment & Services (7.04%) | ||||||||
Edwards Lifesciences Corp.(a) | 19,650 | 1,706,210 | ||||||
Intuitive Surgical, Inc.(a) | 1,387 | 752,059 | ||||||
Varian Medical Systems, Inc.(a) | 10,975 | 732,691 | ||||||
|
| |||||||
| 3,190,960 | ||||||||
|
| |||||||
Medical Specialties (0.22%) | ||||||||
Align Technology, Inc.(a) | 3,775 | 100,339 | ||||||
|
| |||||||
Pharmaceuticals & Biotech (0.05%) | ||||||||
Incyte Corp. Ltd.(a) | 1,400 | 22,344 | ||||||
|
| |||||||
TOTAL HEALTH CARE | 3,313,643 | |||||||
|
| |||||||
INDUSTRIALS (0.68%) | ||||||||
Machinery-Diversified (0.68%) | ||||||||
Graco, Inc. | 6,450 | 309,987 | ||||||
|
| |||||||
TOTAL INDUSTRIALS | 309,987 | |||||||
|
| |||||||
| Semi-Annual Report | October 31, 2012 | 9 |
Table of Contents
| The Disciplined Growth Investors Fund | Portfolio of Investments | |
| October 31, 2012 (Unaudited) |
| Shares | Value (Note 2) | |||||||
PRODUCER DURABLES (10.48%) | ||||||||
Commercial Services (0.63%) | ||||||||
Paychex, Inc. | 8,800 | $ | 285,384 | |||||
|
| |||||||
Machinery (2.17%) | ||||||||
Middleby Corp.(a) | 7,868 | 983,107 | ||||||
|
| |||||||
Manufacturing & Production (2.60%) | ||||||||
Eaton Corp. | 24,975 | 1,179,319 | ||||||
|
| |||||||
Scientific Instruments & Services (2.87%) | ||||||||
Brady Corp. - Class A | 8,900 | 273,764 | ||||||
Trimble Navigation Ltd.(a) | 21,750 | 1,026,165 | ||||||
|
| |||||||
| 1,299,929 | ||||||||
|
| |||||||
Transportation & Freight (2.21%) | ||||||||
JetBlue Airways Corp.(a) | 52,475 | 277,593 | ||||||
Landstar System, Inc. | 14,350 | 726,827 | ||||||
|
| |||||||
| 1,004,420 | ||||||||
|
| |||||||
TOTAL PRODUCER DURABLES | 4,752,159 | |||||||
|
| |||||||
TECHNOLOGY (22.58%) | ||||||||
Computers (0.01%) | ||||||||
Imation Corp.(a) | 800 | 3,656 | ||||||
|
| |||||||
Electronics (7.77%) | ||||||||
Advanced Micro Devices, Inc.(a) | 37,375 | 76,619 | ||||||
ARM Holdings PLC ADR | 29,137 | 942,582 | ||||||
Microchip Technology, Inc. | 14,400 | 451,440 | ||||||
Open Text Corp.(a) | 18,381 | 990,552 | ||||||
Plexus Corp.(a) | 39,500 | 1,062,945 | ||||||
|
| |||||||
| 3,524,138 | ||||||||
|
| |||||||
Information Technology (12.95%) | ||||||||
Akamai Technologies, Inc.(a) | 21,250 | 807,287 | ||||||
Apple, Inc. | 1,008 | 599,861 | ||||||
Autodesk, Inc.(a) | 27,750 | 883,560 | ||||||
Dolby Laboratories, Inc. - Class A(a) | 10,375 | 327,746 | ||||||
Intuit, Inc. | 28,075 | 1,668,216 | ||||||
Seagate Technology PLC | 34,180 | 933,798 | ||||||
Yahoo!, Inc.(a) | 38,650 | 649,707 | ||||||
|
| |||||||
| 5,870,175 | ||||||||
|
| |||||||
10 | 1-855-DGI-FUND (344-3863) | www.DGIfund.com |
Table of Contents
| The Disciplined Growth Investors Fund | Portfolio of Investments | |
| October 31, 2012 (Unaudited) |
| Shares | Value (Note 2) | |||||||
TECHNOLOGY (continued) | ||||||||
Telecommunications (1.85%) | ||||||||
Aviat Networks, Inc.(a) | 34,225 | $ | 78,033 | |||||
Plantronics, Inc. | 17,750 | 575,810 | ||||||
ViaSat, Inc.(a) | 4,719 | 183,286 | ||||||
|
| |||||||
| 837,129 | ||||||||
|
| |||||||
TOTAL TECHNOLOGY | 10,235,098 | |||||||
|
| |||||||
UTILITIES (1.22%) | ||||||||
Utilities (1.22%) | ||||||||
tw telecom, Inc.(a) | 21,650 | 551,425 | ||||||
|
| |||||||
TOTAL UTILITIES | 551,425 | |||||||
|
| |||||||
TOTAL COMMON STOCKS (Cost $28,680,643) | 31,642,779 | |||||||
|
| |||||||
| Principal Amount | Value (Note 2) | |||||||
ASSET/MORTGAGE BACKED SECURITIES (0.20%) | ||||||||
Government National Mortgage Association, Series | ||||||||
2005-93 | ||||||||
5.500% 12/20/2034 | $ | 83,000 | 92,122 | |||||
|
| |||||||
TOTAL ASSET/MORTGAGE BACKED SECURITIES (Cost $92,808) | 92,122 | |||||||
|
| |||||||
CORPORATE BONDS (21.57%) | ||||||||
Abbott Laboratories | ||||||||
5.125% 04/01/2019 | 106,000 | 127,994 | ||||||
Affiliated Computer Services, Inc. | ||||||||
5.125% 06/01/2015 | 103,000 | 111,201 | ||||||
Alliant Energy Corp. | ||||||||
4.000% 10/15/2014 | 205,000 | 214,341 | ||||||
Ameren Illinois Co. | ||||||||
9.750% 11/15/2018 | 54,000 | 75,050 | ||||||
American Express Co. | ||||||||
7.250% 05/20/2014 | 186,000 | 204,563 | ||||||
Anheuser-Busch InBev Worldwide, Inc. | ||||||||
5.375% 01/15/2020 | 194,000 | 241,296 | ||||||
Arizona Public Service Co. | ||||||||
8.750% 03/01/2019 | 169,000 | 225,458 | ||||||
Semi-Annual Report | October 31, 2012 | 11 |
Table of Contents
| The Disciplined Growth Investors Fund | Portfolio of Investments | |
| October 31, 2012 (Unaudited) |
| Principal Amount | Value (Note 2) | |||||||
CORPORATE BONDS (continued) | ||||||||
AT&T, Inc. | ||||||||
5.500% 02/01/2018 | $ | 192,000 | $ | 233,480 | ||||
BB&T Corp. | ||||||||
5.700% 04/30/2014 | 12,000 | 12,899 | ||||||
BP Capital Markets PLC | ||||||||
5.250% 11/07/2013 | 197,000 | 206,575 | ||||||
Burlington Northern Santa Fe LLC | ||||||||
4.875% 01/15/2015 | 199,000 | 215,884 | ||||||
Carolina Power & Light Co. | ||||||||
5.125% 09/15/2013 | 99,000 | 103,106 | ||||||
CenterPoint Energy Resources Corp. | ||||||||
4.500% 01/15/2021 | 103,000 | 117,986 | ||||||
Coca-Cola HBC Finance BV | ||||||||
5.500% 09/17/2015 | 199,000 | 218,259 | ||||||
Comcast Cable Communications Holdings, Inc. | ||||||||
9.455% 11/15/2022 | 145,000 | 219,661 | ||||||
Commonwealth Edison Co. | ||||||||
5.800% 03/15/2018 | 92,000 | 113,645 | ||||||
The Connecticut Light & Power Co., Series 09-A | ||||||||
5.500% 02/01/2019 | 97,000 | 116,043 | ||||||
Consolidated Edison Co. of New York, Inc. | ||||||||
7.125% 12/01/2018 | 192,000 | 251,215 | ||||||
Corporacion Andina de Fomento | ||||||||
5.750% 01/12/2017 | 1,000 | 1,144 | ||||||
8.125% 06/04/2019 | 163,000 | 211,688 | ||||||
CSX Corp. | ||||||||
7.375% 02/01/2019 | 89,000 | 113,897 | ||||||
The Dayton Power & Light Co. | ||||||||
5.125% 10/01/2013 | 106,000 | 110,357 | ||||||
Diageo Capital PLC | ||||||||
5.750% 10/23/2017 | 93,000 | 113,348 | ||||||
Emerson Electric Co. | ||||||||
5.000% 04/15/2019 | 109,000 | 129,236 | ||||||
Energy Transfer Partners LP | ||||||||
9.700% 03/15/2019 | 84,000 | 113,161 | ||||||
Florida Power & Light Co. | ||||||||
4.850% 02/01/2013 | 107,000 | 108,154 | ||||||
Fluor Corp. | ||||||||
3.375% 09/15/2021 | 110,000 | 118,213 | ||||||
General Electric Capital Corp. | ||||||||
5.875% 01/14/2038 | 207,000 | 255,119 | ||||||
Hewlett-Packard Co. | ||||||||
3.750% 12/01/2020 | 127,000 | 123,602 | ||||||
| 12 | 1-855-DGI-FUND (344-3863) | www.DGIfund.com |
Table of Contents
| The Disciplined Growth Investors Fund | Portfolio of Investments | |
| October 31, 2012 (Unaudited) |
| Principal Amount | Value (Note 2) | |||||||
CORPORATE BONDS (continued) | ||||||||
Historic TW, Inc. | ||||||||
9.125% 01/15/2013 | $ | 195,000 | $ | 198,159 | ||||
The Home Depot, Inc. | ||||||||
5.250% 12/16/2013 | 52,000 | 54,836 | ||||||
International Business Machines Corp. | ||||||||
7.625% 10/15/2018 | 154,000 | 209,030 | ||||||
Johnson & Johnson | ||||||||
5.850% 07/15/2038 | 170,000 | 241,826 | ||||||
JPMorgan Chase & Co. | ||||||||
3.700% 01/20/2015 | 196,000 | 207,625 | ||||||
Lockheed Martin Corp. | ||||||||
4.250% 11/15/2019 | 196,000 | 223,358 | ||||||
Lubrizol Corp. | ||||||||
8.875% 02/01/2019 | 88,000 | 124,181 | ||||||
McDonald’s Corp. | ||||||||
6.300% 03/01/2038 | 157,000 | 226,130 | ||||||
Merck & Co., Inc | ||||||||
5.950% 12/01/2028 | 89,000 | 117,877 | ||||||
Mondelez International, Inc. | ||||||||
5.375% 02/10/2020 | 199,000 | 244,448 | ||||||
National Rural Utilities Cooperative Finance Corp. | ||||||||
10.375% 11/01/2018 | 78,000 | 116,098 | ||||||
Nevada Power Co. | ||||||||
7.125% 03/15/2019 | 150,000 | 196,505 | ||||||
News America, Inc. | ||||||||
6.900% 03/01/2019 | 95,000 | 119,407 | ||||||
Nisource Finance Corp. | ||||||||
6.800% 01/15/2019 | 95,000 | 116,389 | ||||||
Noble Energy, Inc. | ||||||||
8.250% 03/01/2019 | 166,000 | 220,424 | ||||||
Northeast Utilities | ||||||||
5.650% 06/01/2013 | 5,000 | 5,145 | ||||||
Ohio Power Co., Series M | ||||||||
5.375% 10/01/2021 | 178,000 | 220,664 | ||||||
Oncor Electric Delivery Co. LLC | ||||||||
7.000% 09/01/2022 | 165,000 | 209,911 | ||||||
The Pepsi Bottling Group, Inc., Series B | ||||||||
7.000% 03/01/2029 | 140,000 | 205,476 | ||||||
Plains All American Pipeline LP / Plains All American Finance Corp. | ||||||||
5.625% 12/15/2013 | 11,000 | 11,597 | ||||||
8.750% 05/01/2019 | 155,000 | 210,331 | ||||||
PPL Energy Supply LLC | ||||||||
6.300% 07/15/2013 | 102,000 | 105,987 | ||||||
| Semi-Annual Report | October 31, 2012 | 13 |
Table of Contents
| The Disciplined Growth Investors Fund | Portfolio of Investments | |
| October 31, 2012 (Unaudited) |
| Principal Amount | Value (Note 2) | |||||||
CORPORATE BONDS (continued) | ||||||||
PSEG Power LLC | ||||||||
5.000% 04/01/2014 | $ | 107,000 | $ | 113,020 | ||||
Republic Services, Inc. | ||||||||
5.500% 09/15/2019 | 102,000 | 121,017 | ||||||
Rio Tinto Finance USA Ltd. | ||||||||
9.000% 05/01/2019 | 150,000 | 206,086 | ||||||
Royal Bank of Scotland Group PLC, Series 1 | ||||||||
9.118% 03/31/2049 | 3,000 | 2,970 | ||||||
Safeway, Inc. | ||||||||
5.625% 08/15/2014 | 13,000 | 13,911 | ||||||
Sempra Energy | ||||||||
8.900% 11/15/2013 | 96,000 | 103,945 | ||||||
Tennessee Valley Authority, Series B | ||||||||
4.700% 07/15/2033 | 40,000 | 49,117 | ||||||
TransCanada PipeLines Ltd. | ||||||||
7.250% 08/15/2038 | 163,000 | 249,231 | ||||||
Unilever Capital Corp. | ||||||||
4.800% 02/15/2019 | 99,000 | 117,179 | ||||||
United Parcel Service, Inc. | ||||||||
6.200% 01/15/2038 | 159,000 | 225,516 | ||||||
United Technologies Corp. | ||||||||
5.375% 12/15/2017 | 10,000 | 12,081 | ||||||
US Bank | ||||||||
3.778%(b) 04/29/2020 | 203,000 | 215,016 | ||||||
4.800% 04/15/2015 | 17,000 | 18,626 | ||||||
Wal-Mart Stores, Inc. | ||||||||
6.200% 04/15/2038 | 162,000 | 225,812 | ||||||
Waste Management, Inc. | ||||||||
7.375% 03/11/2019 | 89,000 | 113,586 | ||||||
|
| |||||||
TOTAL CORPORATE BONDS (Cost $9,377,387) | 9,779,092 | |||||||
|
| |||||||
FOREIGN GOVERNMENT BONDS (1.52%) | ||||||||
Israel Government AID Bonds | ||||||||
5.500% 12/04/2023 | 166,000 | 219,738 | ||||||
Israel Government AID Bonds, Zero Coupon, Series 8-Z | ||||||||
02/15/2020 | 29,000 | 25,762 | ||||||
Province of British Columbia | ||||||||
4.300% 05/30/2013 | 12,000 | 12,278 | ||||||
Province of Ontario Canada | ||||||||
0.950% 05/26/2015 | 206,000 | 208,156 | ||||||
| 14 | 1-855-DGI-FUND (344-3863) | www.DGIfund.com |
Table of Contents
| The Disciplined Growth Investors Fund | Portfolio of Investments | |
| October 31, 2012 (Unaudited) |
| Principal Amount | Value (Note 2) | |||||||||||
FOREIGN GOVERNMENT BONDS (continued) | ||||||||||||
Province of Quebec Canada, Series NN | ||||||||||||
7.125% 02/09/2024 | $ | 161,000 | $ | 225,515 | ||||||||
|
| |||||||||||
TOTAL FOREIGN GOVERNMENT BONDS (Cost $672,733) | 691,449 | |||||||||||
|
| |||||||||||
GOVERNMENT & AGENCY OBLIGATIONS (0.12%) | ||||||||||||
U.S. Treasury Bonds | ||||||||||||
4.000% 11/15/2012 | 40,000 | 40,064 | ||||||||||
6.500% 11/15/2026 | 3,000 | 4,587 | ||||||||||
U.S. Treasury Notes | ||||||||||||
4.500% 11/15/2015 | 4,000 | 4,493 | ||||||||||
4.500% 02/15/2016 | 3,000 | 3,398 | ||||||||||
|
| |||||||||||
TOTAL GOVERNMENT & AGENCY OBLIGATIONS (Cost $52,361) | 52,542 | |||||||||||
|
| |||||||||||
MUNICIPAL BONDS (0.01%) | ||||||||||||
Minnesota | ||||||||||||
County of Stearns | ||||||||||||
2.000% 12/01/2012 | 5,000 | 5,007 | ||||||||||
|
| |||||||||||
TOTAL MUNICIPAL BONDS (Cost $5,016) | 5,007 | |||||||||||
|
| |||||||||||
7-Day Yield | Shares | Value (Note 2) | ||||||||||
SHORT TERM INVESTMENTS (6.67%) | ||||||||||||
Fidelity Institutional Money Market Government Portfolio - Class I | 0.01 | % | 3,022,123 | 3,022,123 | ||||||||
|
| |||||||||||
TOTAL SHORT TERM INVESTMENTS (Cost $3,022,123) | 3,022,123 | |||||||||||
|
| |||||||||||
TOTAL INVESTMENTS (99.89%) (Cost $41,903,071) | $ | 45,285,114 | ||||||||||
Other Assets In Excess Of Liabilities (0.11%) | 49,265 | |||||||||||
|
| |||||||||||
NET ASSETS (100.00%) | $ | 45,334,379 | ||||||||||
|
| |||||||||||
| Semi-Annual Report | October 31, 2012 | 15 |
Table of Contents
| The Disciplined Growth Investors Fund | Portfolio of Investments | |
| October 31, 2012 (Unaudited) |
| (a) | Non-Income Producing Security. |
| (b) | The coupon rate shown on floating or adjustable rate securities represents the rate at period end. |
Percentages are stated as a percent of net assets.
Common Abbreviations:
ADR - American Depository Receipt.
AID - Agency for International Development.
BV - Besloten Vennootschap.
LLC - Limited Liability Company.
LP - Limited Partnership.
Ltd. - Limited.
PLC - Public Limited Company.
Holdings are subject to change.
For Fund compliance purposes, the Fund’s industry classifications refer to any one or more of the industry sub-classifications used by one or more widely recognized market indexes or ratings group indexes, and/or as defined by Fund management. This definition may not apply for purposes of this report, which may combine industry sub-classifications for reporting ease. Industries are shown as a percent of net assets. These industry classifications are based on third-party definitions. The definitions are industry terms and do not reflect the legal status of any of the investments or the companies in which the Fund has invested.
See Notes to Financial Statements.
| 16 | 1-855-DGI-FUND (344-3863) | www.DGIfund.com |
Table of Contents
| The Disciplined Growth Investors Fund | Statement of Assets and Liabilities | |
| October 31, 2012 (Unaudited) |
ASSETS | ||||
Investments, at value | $ | 45,285,114 | ||
Receivable for investments sold | 21,761 | |||
Receivable for shares sold | 10,472 | |||
Dividends and interest receivable | 142,835 | |||
Other assets | 2,935 | |||
Total assets | 45,463,117 | |||
LIABILITIES | ||||
Payable for investments purchased | 100,089 | |||
Payable to adviser | 28,649 | |||
Total liabilities | 128,738 | |||
NET ASSETS | $ | 45,334,379 | ||
NET ASSETS CONSIST OF | ||||
Paid-in capital | $ | 41,780,863 | ||
Accumulated net investment income | 19,787 | |||
Accumulated net realized gain on investments | 151,686 | |||
Net unrealized appreciation on investments | 3,382,043 | |||
NET ASSETS | $ | 45,334,379 | ||
INVESTMENTS, AT COST | $ | 41,903,071 | ||
PRICING OF SHARES | ||||
Net Asset Value, offering and redemption price per share | $ | 12.22 | ||
Shares of beneficial interest outstanding | 3,709,830 | |||
See Notes to Financial Statements.
| Semi-Annual Report | October 31, 2012 | 17 |
Table of Contents
| The Disciplined Growth Investors Fund | Statement of Operations | |
For the Six Months Ended October 31, 2012 (Unaudited) | ||||
INVESTMENT INCOME | ||||
Dividends | $ | 162,378 | ||
Foreign taxes withheld | (203) | |||
Interest | 141,179 | |||
Total investment income | 303,354 | |||
EXPENSES | ||||
Investment advisory fees (Note 6) | 146,413 | |||
Total expenses | 146,413 | |||
NET INVESTMENT INCOME | 156,941 | |||
REALIZED AND UNREALIZED GAIN ON INVESTMENTS | ||||
Net realized gain on investments | 60,667 | |||
Net change in unrealized appreciation on investments | 104,626 | |||
NET REALIZED AND UNREALIZED GAIN ON INVESTMENTS | 165,293 | |||
NET INCREASE IN NET ASSETS RESULTING FROM OPERATIONS | $ | 322,234 | ||
See Notes to Financial Statements.
| 18 | 1-855-DGI-FUND (344-3863) | www.DGIfund.com |
Table of Contents
| The Disciplined Growth Investors Fund | Statement of Changes in Net Assets | |
For the Six Months Ended (Unaudited) | For the Period August 12, (Inception) to April 30, 2012 | |||||||
OPERATIONS | ||||||||
Net investment income | $ | 156,941 | $ | 74,458 | ||||
Net realized gain on investments | 60,667 | 91,019 | ||||||
Net change in unrealized appreciation on investments | 104,626 | 3,277,417 | ||||||
Net increase in net assets resulting from operations | 322,234 | 3,442,894 | ||||||
DISTRIBUTIONS | ||||||||
From net investment income | (153,273) | (58,339) | ||||||
Total distributions | (153,273) | (58,339) | ||||||
CAPITAL SHARE TRANSACTIONS (Note 5) | ||||||||
Proceeds from sales of shares | 10,616,431 | 32,628,566 | ||||||
Issued to shareholders in reinvestment of distributions | 153,228 | 58,309 | ||||||
Cost of shares redeemed, net of redemption fees | (1,282,307) | (393,364) | ||||||
Net increase from capital share transactions | 9,487,352 | 32,293,511 | ||||||
Net increase in net assets | 9,656,313 | 35,678,066 | ||||||
NET ASSETS | ||||||||
Beginning of period | 35,678,066 | – | ||||||
End of period* | $ | 45,334,379 | $ | 35,678,066 | ||||
*Including accumulated net investment income of: | $ | 19,787 | $ | 16,119 | ||||
OTHER INFORMATION | ||||||||
Share Transactions | ||||||||
Issued | 863,093 | 2,969,119 | ||||||
Issued in lieu of cash distributions | 12,696 | 5,081 | ||||||
Redeemed | (106,067) | (34,092) | ||||||
Net increase in share transactions | 769,722 | 2,940,108 | ||||||
See Notes to Financial Statements.
| Semi-Annual Report | October 31, 2012 | 19 |
Table of Contents
| The Disciplined Growth Investors Fund | Financial Highlights | |
| For a share outstanding during the periods presented |
For the Six Ended October 31, 2012 | For the Period April 30, 2012 | |||||||
NET ASSET VALUE, BEGINNING OF PERIOD | $ | 12.13 | $ | 10.00 | ||||
INCOME FROM OPERATIONS | ||||||||
Net investment income(a) | 0.05 | 0.05 | ||||||
Net realized and unrealized gain on investments | 0.09 | 2.11 | ||||||
Total from investment operations | 0.14 | 2.16 | ||||||
DISTRIBUTIONS | ||||||||
From net investment income | (0.05 | ) | (0.03 | ) | ||||
From net realized gain on investments | – | – | ||||||
Total distributions | (0.05 | ) | (0.03 | ) | ||||
REDEMPTION FEES ADDED TO PAID-IN CAPITAL (Note 5) | 0.00 | (b) | 0.00 | (b) | ||||
INCREASE IN NET ASSET VALUE | 0.09 | 2.13 | ||||||
NET ASSET VALUE, END OF PERIOD | $ | 12.22 | $ | 12.13 | ||||
TOTAL RETURN | 1.15% | (c) | 21.65% | (c) | ||||
RATIOS AND SUPPLEMENTAL DATA | ||||||||
Net assets, end of period (000’s) | $ | 45,334 | $ | 35,678 | ||||
RATIOS TO AVERAGE NET ASSETS | ||||||||
Expenses | 0.78% | (d) | 0.77% | (d) | ||||
Net investment income | 0.84% | (d) | 0.60% | (d) | ||||
PORTFOLIO TURNOVER RATE | 4% | (c) | 6% | (c) | ||||
| (a) | Per share numbers have been calculated using the average shares method. |
| (b) | Less than $0.005 per share. |
| (c) | Not annualized. |
| (d) | Annualized. |
See Notes to Financial Statements.
| 20 | 1-855-DGI-FUND (344-3863) | www.DGIfund.com |
Table of Contents
| The Disciplined Growth Investors Fund | Notes to Financial Statements | |
| October 31, 2012 (Unaudited) |
1. ORGANIZATION
Financial Investors Trust (the “Trust”), a Delaware statutory trust, is an open-end management investment company registered under the Investment Company Act of 1940, as amended (“1940 Act”). As of October 31, 2012, the Trust had 24 registered funds. This semi-annual report describes The Disciplined Growth Investors Fund (the “Fund”). The Fund seeks long-term capital growth and as a secondary objective, modest income with reasonable risk. The Fund pursues its investment objective by normally investing approximately 60% of its assets in equity securities and approximately 40% in fixed-income securities and cash equivalent.
2. SIGNIFICANT ACCOUNTING POLICIES
The following is a summary of significant accounting policies consistently followed by the Fund. These policies are in conformity with U.S. generally accepted accounting principles (“GAAP”).
The preparation of financial statements in accordance with GAAP requires management to make certain estimates and assumptions that affect the reported amounts and disclosures in the financial statements during the reporting period. Management believes the estimates and security valuations are appropriate; however, actual results may differ from those estimates, and the security valuations reflected in the financial statements may differ from the value the Fund ultimately realizes upon sale of the securities.
Investment Valuation: The Fund generally values its securities based on market prices determined at the close of regular trading on the New York Stock Exchange (“NYSE”), normally 4:00 p.m. Eastern Time, on each day the NYSE is open for trading.
For equity securities and mutual funds that are traded on an exchange, the market price is usually the closing sale or official closing price on that exchange. In the case of equity securities not traded on an exchange, or if such closing prices are not otherwise available, the securities are valued at the mean of the most recent bid and ask prices on such day.
The market price for debt obligations is generally the price supplied by an independent third-party pricing service approved by the Board of Trustees (the “Board”), which may use a matrix, formula or other objective method that takes into consideration quotations from dealers, market transactions in comparable investments, market indices and yield curves. If vendors are unable to supply a price, or if the price supplied is deemed to be unreliable, the market price may be determined using quotations received from one or more brokers–dealers that make a market in the security. Short–term debt obligations that will mature in 60 days or less are valued at amortized cost, unless it is determined that using this method would not reflect an investment’s fair value. Investments in non-exchange traded funds are fair valued at their respective net asset values.
Redeemable securities issued by open-end registered investment companies are valued at the investment company’s applicable net asset value, with the exception of exchange-traded open-end investment companies, which are priced as equity securities.
When such prices or quotations are not available, or when the Fair Value Committee appointed by the Board believes that they are unreliable, securities may be priced using fair value procedures approved by the Board. The Fund may also use fair value procedures if the Fair Value Committee determines that a significant event has occurred between the time at which a market price is determined and the time at which the Fund’s NAV is calculated. In particular, the value of non-U.S.
| Semi-Annual Report | October 31, 2012 | 21 |
Table of Contents
| The Disciplined Growth Investors Fund | Notes to Financial Statements | |
| October 31, 2012 (Unaudited) |
securities may be materially affected by events occurring after the close of the foreign exchange on which they are traded, but before the Fund prices its shares.
Fair Value Measurements: The Fund discloses the classification of their fair value measurements following a three-tier hierarchy based on the inputs used to measure fair value. Inputs refer broadly to the assumptions that market participants would use in pricing the asset or liability, including assumptions about risk. Inputs may be observable or unobservable. Observable inputs reflect the assumptions market participants would use in pricing the asset or liability that are developed based on market data obtained from sources independent of the reporting entity. Unobservable inputs reflect the reporting entity’s own assumptions about the assumptions market participants would use in pricing the asset or liability that are developed based on the best information available.
Various inputs are used in determining the value of the Fund’s investments as of the end of the reporting period. When inputs used fall into different levels of the fair value hierarchy, the level in the hierarchy within which the fair value measurement falls is determined based on the lowest level input that is significant to the fair value measurement in its entirety. The designated input levels are not necessarily an indication of the risk or liquidity associated with these investments. These inputs are categorized in the following hierarchy under applicable financial accounting standards:
Level 1 – | Unadjusted quoted prices in active markets for identical investments, unrestricted assets or liabilities that the Fund has the ability to access at the measurement date; | |
Level 2 – | Quoted prices which are not active, quoted prices for similar assets or liabilities in active markets or inputs other than quoted prices that are observable (either directly or indirectly) for substantially the full term of the asset or liability; and | |
Level 3 – | Significant unobservable prices or inputs (including the Fund’s own assumptions in determining the fair value of investments) where there is little or no market activity for the asset or liability at the measurement date. | |
The following is a summary of each input used to value the Fund as of October 31, 2012:
Investments in Securities at Value(a) | Level 1 - Unadjusted Quoted Prices | Level 2 - Other Significant Observable Inputs | Level 3 - Significant Unobservable Inputs | Total | ||||||||||||
Common Stocks | $ | 31,642,779 | $ | – | $ | – | $ | 31,642,779 | ||||||||
Asset/Mortgage Backed Securities | – | 92,122 | – | 92,122 | ||||||||||||
Corporate Bonds | – | 9,779,092 | – | 9,779,092 | ||||||||||||
Foreign Government Bonds | – | 691,449 | – | 691,449 | ||||||||||||
Government & Agency Obligations | – | 52,542 | – | 52,542 | ||||||||||||
Municipal Bonds | – | 5,007 | – | 5,007 | ||||||||||||
Short Term Investments | 3,022,123 | – | – | 3,022,123 | ||||||||||||
TOTAL | $ | 34,664,902 | $ | 10,620,212 | $ | – | $ | 45,285,114 | ||||||||
| (a) | For detailed descriptions of the underlying industries, see the accompanying Portfolio of Investments. |
| 22 | 1-855-DGI-FUND (344-3863) | www.DGIfund.com |
Table of Contents
| The Disciplined Growth Investors Fund | Notes to Financial Statements | |
| October 31, 2012 (Unaudited) |
The Fund recognizes transfers between levels as of the beginning of the annual period in which the transfer occurred. For the six months ended October 31, 2012, the Fund did not have any transfers between Level 1 and Level 2 securities. For the six months ended October 31, 2012, the Fund did not have any securities that used significant unobservable inputs (Level 3) in determining fair value. Therefore, a reconciliation of assets in which significant unobservable inputs (Level 3) were used in determining fair value is not applicable.
Investment Transactions: Investment transactions are accounted for on the date the investments are purchased or sold (trade date). Realized gains and losses from investment transactions are reported on an identified cost basis. Interest income, which includes accretion of discounts, is accrued and recorded as earned. Dividend income is recognized on the ex-dividend date or for certain foreign securities, as soon as information is available to the Fund.
Trust Expenses: Some expenses of the Trust can be directly attributed to the Fund. Expenses which cannot be directly attributed to the Fund are apportioned among all funds in the Trust based on average net assets of each fund.
Fund Expenses: Expenses that are specific to the Fund are charged directly to the Fund.
Federal Income Taxes: The Fund complies with the requirements under Subchapter M of the Internal Revenue Code of 1986, as amended, applicable to regulated investment companies and intends to distribute substantially all of their net taxable income and net capital gains, if any, each year. The Fund is not subject to income taxes to the extent such distributions are made.
As of and during the six months ended October 31, 2012, the Fund did not have a liability for any unrecognized tax benefits in the accompanying financial statements. The Fund files income tax returns in the U.S. federal jurisdiction, Colorado and Minnesota.
Distributions to Shareholders: The Fund normally pays dividends, if any, quarterly and distributes capital gains, if any, on an annual basis. Income dividend distributions are derived from interest and other income the Fund receives from its investments, including distributions of short term capital gains. Capital gain distributions are derived from gains realized when the Fund sells a security it has owned for more than a year. The Fund may make additional distributions and dividends at other times if the portfolio manager believes doing so may be necessary for the Fund to avoid or reduce taxes. Net investment income/(loss) and net realized gain/(loss) may differ for financial statement and tax purposes.
3. TAX BASIS INFORMATION
Federal Tax Information
The timing and character of income and capital gain distributions are determined in accordance with income tax regulations, which may differ from GAAP. Reclassifications are made to the Fund’s capital accounts for permanent tax differences to reflect income and gains available for distribution (or available capital loss carryforwards) under income tax regulations. If, for any calendar year, the total distributions made under the distribution policy exceed the Fund’s net investment income and net realized capital gains, the excess will generally be treated as a non-taxable return of capital, reducing the shareholder’s adjusted basis in his or her shares. For the six months ended October 31, 2012, there were no permanent book and tax basis differences.
| Semi-Annual Report | October 31, 2012 | 23 |
Table of Contents
| The Disciplined Growth Investors Fund | Notes to Financial Statements | |
| October 31, 2012 (Unaudited) |
Classification of Distributions to Shareholders
Net investment income and net realized gain/(loss) may differ for financial statement and tax purposes. The character of distributions made during the year from net investment income or net realized gains may differ from its ultimate characterization for federal income tax purposes. Also, due to the timing of dividend distributions, the fiscal year in which amounts are distributed may differ from the fiscal year in which the income or realized gain was recorded by the Fund, accordingly, tax basis balances have not been determined as of October 31, 2012.
The tax character of distributions paid during the period ended October 31, 2012, is as follows:
Distributions paid from: | ||||
Ordinary income | $ | 153,273 | ||
Total | $ | 153,273 | ||
Under the Regulated Investment Company Modernization Act of 2010 (the “Modernization Act”), net capital losses recognized in tax years beginning after December 22, 2010 may be carried forward indefinitely, and the character of the losses is retained as short-term and/or long-term.
At October 31, 2012, the Fund did not generate capital losses to carryforward.
As of October 31, 2012, the aggregate cost of investments, gross unrealized appreciation/(depreciation) and net unrealized appreciation for Federal tax purposes was as follows:
| Fund | Cost of Investments | Gross Unrealized Appreciation | Gross Unrealized (Depreciation) | Net Unrealized Appreciation | ||||||||||||
The Disciplined Growth Investors Fund | $ | 41,927,862 | $ | 4,283,517 | ($ | 926,265 | ) | $ | 3,357,252 | |||||||
4. SECURITIES TRANSACTIONS
From May 1, 2012 through October 31, 2012, the assets of four separate accounts were transferred in-kind into the Fund in the amount of $4,133,648. Equity holdings, asset/mortgage backed securities, fixed income and rights were transferred in-kind. The intent of the transfers was to save on equity transaction costs both for the new shareholders at the institution they transferred from and for the Fund on the addition of assets.
The cost of purchases and proceeds from sales of securities (excluding short-term securities, transfers-in-kind, and U.S. Government Obligations) during the six months ended October 31, 2012, were as follows:
| Fund | Purchases of Securities | Proceeds From Sales of Securities | ||||||
The Disciplined Growth Investors Fund | $ | 6,168,838 | $ | 1,524,076 | ||||
| 24 | 1-855-DGI-FUND (344-3863) | www.DGIfund.com |
Table of Contents
| The Disciplined Growth Investors Fund | Notes to Financial Statements | |
| October 31, 2012 (Unaudited) |
Investment transactions in U.S. government and agency securities (excluding transfers-in-kind) for the six months ended October 31,2012, were as follows:
| Fund | Purchases of Securities | Proceeds from Sales of Securities | ||||||
The Disciplined Growth Investors Fund | $ | 269,175 | $ | — | ||||
5. SHARES OF BENEFICIAL INTEREST
The capitalization of the Trust consists of an unlimited number of shares of beneficial interest with no par value per share. Holders of the shares of the Fund of the Trust have one vote for each share held and a proportionate fraction of a vote for each fractional share. All shares issued and outstanding are fully paid and are non-assessable, transferable and redeemable at the option of the shareholder. Shares have no pre-emptive rights.
Shares redeemed within 90 days of purchase may incur a 2% short-term redemption fee deducted from the redemption amount. For the six months ended October 31, 2012, the Fund retained $1,055, which is reflected in the “Cost of shares redeemed, net of redemption fees” in the Statement of Changes in Net Assets.
6. MANAGEMENT AND RELATED-PARTY TRANSACTIONS
Disciplined Growth Investors, Inc. (“the Adviser” or “DGI”), subject to the authority of the Board, is responsible for the overall management and administration of the Fund’s business affairs. DGI manages the investments of the Fund in accordance with the Fund’s investment objective, policies and limitations and investment guidelines established jointly by the Adviser and the Trustees. Pursuant to the Advisory Agreement, the Fund pays the Adviser a unitary fee for the services and facilities it provides payable on a monthly basis at the annual rate of 0.78% of the Fund’s average daily net assets.
Out of the unitary management fee, the Adviser pays substantially all expenses of the Fund, including the cost of transfer agency, custody, fund administration, legal, audit and other services, except for interest expenses, distribution fees, brokerage expenses, taxes and extraordinary expenses not incurred in the ordinary course of the Fund’s business. Also included are Trustee fees which were $1,872 for the six months ended October 31, 2012.
Fund Accounting Fees and Expenses
ALPS Fund Services, Inc. (“ALPS” and the “Administrator”) (an affiliate of ALPS Distributors, Inc.) serves as administrator to the Fund, and has agreed to pay expenses incurred in connection with its administrative activities. Pursuant to the Administration, Bookkeeping and Pricing Services Agreement (the “Agreement”), ALPS will provide operational services to the Fund including, but not limited to fund accounting and fund administration and generally assist in the Fund’s operations. The table below describes the administrative fee paid by the Fund to ALPS pursuant to the Agreement during the six months ended October 31, 2012:
Annual Administrative Fee, billed monthly, in the amount of the greater of $150,000 annual minimum or:
| Average Total Net Assets | Contractual Fee | |||
Between $0-$500M | 0.05 | % | ||
$500M-$1B | 0.03 | % | ||
Above $1B | 0.02 | % | ||
| Semi-Annual Report | October 31, 2012 | 25 |
Table of Contents
| The Disciplined Growth Investors Fund | Notes to Financial Statements | |
| October 31, 2012 (Unaudited) |
The Administrator is also reimbursed by the Fund for certain out-of-pocket expenses. The fee is included in the unitary fee paid to the Adviser.
Transfer Agent
ALPS serves as transfer, dividend paying and shareholder servicing agent for the Fund under a Transfer Agency and Services Agreement with the Trust. Under this Agreement, ALPS is paid an annual base fee of $25,000 plus fees for open accounts and is reimbursed for certain out-of- pocket expenses. The fee is included in the unitary fee paid to the Adviser.
Compliance Services
ALPS provides services that assist the Fund’s Chief Compliance Officer in monitoring and testing the policies and procedures of the Trust in conjunction with requirements under Rule 38a-1 under the 1940 Act under the Chief Compliance Officer Services Agreement with the Trust. Under this Agreement, ALPS is paid an annual base fee of $30,000 and is reimbursed for certain out-of- pocket expenses. The fee is included in the unitary fee paid to the Adviser.
Principal Financial Officer
ALPS receives an annual fee of $10,000 for providing Principal Financial Officer (“PFO”) services to the Fund. The fee is included in the unitary fee paid to the Adviser.
Distributor: ALPS Distributors, Inc. (“ADI” or the “Distributor”) (an affiliate of ALPS) acts as the distributor of the Fund’s shares pursuant to a Distribution Agreement with the Trust. Shares are sold on a continuous basis by ADI as agent for the Fund, and ADI has agreed to use its best efforts to solicit orders for the sale of the Fund’s shares, although it is not obliged to sell any particular amount of shares. ADI is not entitled to any compensation for its services as Distributor. ADI is registered as a broker-dealer with the Securities and Exchange Commission.
7. INDEMNIFICATIONS
Under the Trust’s organizational documents, its officers and Trustees are indemnified against certain liability arising out of the performance of their duties to the Trust. Additionally, in the normal course of business, the Trust enters into contracts with service providers that may contain general indemnification clauses, which may permit indemnification to the extent permissible under applicable law. The Trust’s maximum exposure under these arrangements is unknown, as this would involve future claims that may be made against the Trust that have not yet occurred.
| 26 | 1-855-DGI-FUND (344-3863) | www.DGIfund.com |
Table of Contents
| The Disciplined Growth Investors Fund | Additional Information | |
| October 31, 2012 (Unaudited) |
1. FUND HOLDINGS
The Fund files its complete schedule of portfolio holdings with the Securities and Exchange Commission (the “SEC”) for the first and third quarters of each fiscal year on Form N-Q within 60 days after the end of the period. Copies of the Fund’s Form N-Q are available without charge on the SEC website at http://www.sec.gov. You may also review and copy the Form N-Q at the SEC’s Public Reference Room in Washington, DC. For more information about the operation of the Public Reference Room, please call the SEC at 1-800-SEC-0330.
2. FUND PROXY VOTING POLICIES, PROCEDURES AND SUMMARIES
The Fund’s policies and procedures used in determining how to vote proxies and information regarding how the Fund voted proxies relating to portfolio securities during the most recent prior 12-month period ending June 30 are available without charge, (1) upon request, by calling (toll free) 855-DGI-FUND and (2) on the SEC’s website at http://www.sec.gov.
| Semi-Annual Report | October 31, 2012 | 27 |
Table of Contents

Table of Contents
Table of Contents

Manager Commentary | ||||
| 1 | ||||
| 4 | ||||
| 8 | ||||
Schedule of Investments | ||||
| 10 | ||||
| 12 | ||||
| 14 | ||||
| 15 | ||||
Statements of Changes in Net Assets | ||||
| 16 | ||||
| 17 | ||||
Financial Highlights | ||||
| 18 | ||||
| 22 | ||||
| 26 | ||||
| 32 | ||||
Table of Contents
| Manager Commentary | ||
October 31, 2012 (Unaudited) |
Dear Shareholder:
Bank stocks have outperformed the broader market this year as improving loan growth, solid mortgage banking income, ongoing credit leverage, and greater evidence of stability in housing coupled with depressed valuations have outweighed net interest margin (NIM) pressure and heightened macro concerns. More specifically, the Emerald Banking and Finance Fund has posted a positive return for the first nine months of 2012, up 19.26% at the end of the third quarter (without sales load). For additional performance details, please see the chart on the next page.
While the ride has not been without economic and regulatory headwinds in 2012, few surprises have emerged in the third quarter as growth outlooks have held relatively steady despite increasing customer cautiousness. Emerald believes we are seeing a housing bounce off the bottom that should continue to increase lending activity and keep mortgage origination income robust thus helping to sustain relative valuations. In this type of economic atmosphere, not all bank stocks are created equal and Emerald’s goal is to be able to continue to differentiate itself through our ten step research process and our ability to identify those bank management teams with the ability to navigate the headwinds in the sector, such as a slowdown in global growth and looming political and regulatory landmines, by growing loans organically or through acquisitions while reducing their cost of funds and implementing efficiency initiatives that should sustain earnings momentum well into 2013. We believe that banks with earnings diversity, scale and growth will command a premium over the next twelve to eighteen months.
During the third calendar quarter of 2012, the Federal Open Market Committee (or “FOMC”) announced on that it would purchase mortgage-backed securities at a $40 billion per month pace, as well as continuing its policy of purchasing longer duration securities, bringing the Central Bank’s monthly asset purchases to $85 billion. In addition, the Federal Funds target rate of 0-0.25% has been extended through mid 2015, or a year beyond the Fed’s July 31 FOMC statement. As the interest rate environment has remained persistently low the last four years, some banks still have funding and excess liquidity levers left, but that benefit is waning and we expect to see NIM (net interest margin) pressure at some institutions for the rest of the year and into 2013 but not for all institutions.
We have witnessed banks such as Cardinal Financial (CFNL) and Eagle Bancorp (EGBN) that are still able to expand their net interest margins as these banks continue to benefit from market share takeaway opportunities or economic catalysts in their markets to generate strong loan growth. As banks with loan growth change the asset mix from securities into loans they should receive some relief from possible NIM compression.
We also continue to expect a mergers & acquisitions wave for banks with less than $1 billion in assets that we believe is being driven by Basel III requirements and regulatory expenses (Basel III is a global regulatory standard on bank capital adequacy, stress testing and market liquidity risk agreed upon by the members of the Basel Committee on Banking Supervision in 2010–11, and scheduled to be introduced from 2013 until 2018.).
We look forward to the continued opportunity to provide experienced portfolio management to our shareholders via our ten step research process and believe that this type of bifurcated market is exactly the type of environment where our stock picking capabilities differentiate the Fund from its peers.
Top Five Contributors to Return Included: | Top Five Detractors from Return Included: | |||
Texas Capital Bancshares (TCBI) | East West Bancorp, Inc. (EWBC) | |||
Bank of the Ozarks (OZRK) | Bankrate (RATE) | |||
Viewpoint Financial Group (VPFG) | Ares Commercial Real Estate (ACRE) | |||
Signature Bank (SBNY) | First Horizon National Corp. (FHN) | |||
Cardinal Financial (CFNL) | Carolina Trust Bank (CART) |
 |  | |||
Kenneth G. Mertz II, CFA | Steven E. Russell, Esq. | |||
Chief Investment Officer | Portfolio Manager | |||
Portfolio Manager |
Emerald Mutual Fund Advisers Trust
Semi-Annual Report | October 31, 2012 |
1 |
Table of Contents
Emerald Banking and Finance Fund | Manager Commentary | |
October 31, 2012 (Unaudited) |
TOP TEN HOLDINGS (as a % of Net Assets)*
| ||||||
Texas Capital Bancshares, Inc. | 4.17% | |||||
Bank of the Ozarks, Inc. | 4.04% | |||||
Signature Bank | 3.12% | |||||
Horizon Bancorp | 2.72% | |||||
Eagle Bancorp, Inc. | 2.64% | |||||
Cardinal Financial Corp. | 2.39% | |||||
CU Bancorp | 2.36% | |||||
Whitestone REIT | 2.23% | |||||
CoBiz Financial, Inc. | 2.15% | |||||
First of Long Island Corp. | 2.14% | |||||
Top Ten Holdings | 27.96% | |||||
INDUSTRY SECTOR ALLOCATION (as a % of Net Assets) |
| |||||
Banks: Diversified | 72.37% | |||||
Real Estate Investment Trusts (REITs) | 13.27% | |||||
Banks: Savings, Thrift & Mortgage | 7.04% | |||||
Financial Data & Systems | 2.08% | |||||
Commercial Finance & Mortgage | 1.63% | |||||
Insurance: Property- Casualty | 1.36% | |||||
Asset Management & Custodian | 0.93% | |||||
Cash, Cash Equivalents, & Other Net Assets | 1.32% | |||||
* Holdings are subject to change. |
| |||||
| Tables present indicative values only. | ||||||
GROWTH OF $10,000 INVESTMENT IN THE FUND (for the period ended October 31, 2012)
Comparison of change in value of a $10,000 investment (includes applicable sales loads)
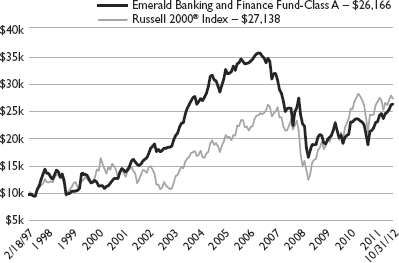
The chart represents historical performance of a hypothetical investment of $10,000 in the Fund since inception. Past performance does not guarantee future results. This chart does not reflect the deduction of taxes that a shareholder would pay on Fund distributions or the redemption of Fund shares.
AVERAGE ANNUAL TOTAL RETURN (for the period ended October 31, 2012)
1 Year | 3 Year | 5 Year | 10 Year | Since Inception1 | Expense Ratio | |||||||||||
| Gross2 | Net2 | |||||||||||||||
Class A (NAV) | 23.77% | 11.13% | -3.08% | 4.01% | 6.64% | 2.07% | 1.84% | |||||||||
Class A (MOP) | 17.91% | 9.35% | -4.02% | 3.50% | 6.31% | 2.07% | 1.84% | |||||||||
Russell 2000® Index† | 12.08% | 14.82% | 1.19% | 9.58% | 6.57% | |||||||||||
Class C (NAV) | 23.05% | 10.48% | -3.71% | 3.36% | 6.49% | 2.72% | 2.49% | |||||||||
Class C (CDSC) | 22.05% | 10.48% | -3.71% | 3.36% | 6.49% | 2.72% | 2.49% | |||||||||
Russell 2000® Index | 12.08% | 14.82% | 1.19% | 9.58% | 5.17% | |||||||||||
Investor Class | 24.09% | – | – | – | 6.24% | 2.12% | 1.89% | |||||||||
Russell 2000® Index | 12.08% | – | – | – | 8.77% | |||||||||||
Institutional Class | – | – | – | – | 8.01%** | N/A | N/A | |||||||||
Russell 2000® Index | – | – | – | – | -1.41%** | |||||||||||
The performance quoted represents past performance, does not guarantee future results and current performance may be lower or higher than the data quoted. The investment return and principal value of an investment will fluctuate so that shares, when redeemed, may be worth more or less than their original cost. Performance data current to the most recent month end may be obtained at www.emeraldmutualfunds.com.
Performance shown for periods prior to March 16, 2012, reflects the performance of the Forward Banking & Finance Fund, a series of Forward Funds (as a result of a reorganization of the Forward Banking & Finance Fund into the Emerald Banking & Finance Fund.
Maximum Offering Price (MOP) for Class A shares includes the Fund’s maximum sales charge of 4.75%. Performance shown at NAV does not include these sales charges and would have been lower had it been taken into account.
A Contingent Deferred Sales Charge (CDSC) of 1.00% may apply to Class C shares redeemed within the first 12 months after a purchase.
| 1 | Inception Dates - Class A: 02/18/1997, Class C: 07/01/2000, Class Institutional: 03/19/2012, Class Investor: 03/16/2010 |
| 2 | www.emeraldmutualfunds.com |
Table of Contents
Emerald Banking and Finance Fund | Manager Commentary | |
October 31, 2012 (Unaudited) |
| ||
| ||
| ||
|
| 2 | Emerald Mutual Fund Advisers Trust (“Emerald” or the “Adviser”) has agreed contractually to waive a portion of its fees and reimburse other expenses until August 31, 2014 in amounts necessary to limit the Fund’s operating expenses (exclusive of Acquired Fund Fees and Expenses, brokerage expenses, interest expenses, taxes and extraordinary expense) for Class A, Class C, Institutional Class, and Investor Class shares to an annual rate (as percentage of the Fund’s average daily net assets) of 1.84%, 2.49%, 1.54% and 1.89% respectively. The Adviser will be permitted to recover, on a class-by-class basis, expenses it has borne through the agreement described above to the extent that the Fund’s expenses in later periods fall below the annual rates set forth in the relevant agreement. The Fund will not be obligated to pay any such deferred fees and expenses more than three years after the year(s) in which the fees and expense were incurred. The Adviser may not discontinue this waiver, prior to August 31, 2014, without the approval by the Fund’s Board of Trustees. |
| ** | Cumulative |
† The Russell 2000® Index measures the performance of the small-cap segment of the U.S. equity universe. The Russell 2000® is a subset of the Russell 3000® Index representing approximately 10% of the total market capitalization of that index. It includes approximately 2000 of the smallest securities based on a combination of their market cap and current index membership.
Each index is not actively managed and does not reflect any deduction for fees, expenses or taxes. An investor cannot invest directly into an index.
Important Risks
The views and information discussed in this commentary are as of the date of publication, are subject to change, and may not reflect the writer’s current views. The views expressed represent an assessment of market conditions at a specific point in time, are opinions only and should not be relied upon as investment advice regarding a particular investment or markets in general. Such information does not constitute a recommendation to buy or sell specific securities or investment vehicles. It should not be assumed that any investment will be profitable or will equal the performance of the portfolios or any securities or any sectors mentioned herein. The subject matter contained herein has been derived from several sources believed to be reliable and accurate at the time of compilation. The Fund does not accept any liability for losses either direct or consequential caused by the use of this information.
A fund that concentrates in a particular industry will involve a greater degree of risk than a fund with a more diversified portfolio. Investing in smaller companies generally will present greater investment risks, including: greater price volatility, greater sensitivity to changing economic conditions and less liquidity than the securities of larger, more mature companies.
Semi-Annual Report | October 31, 2012 |
3 |
Table of Contents
| Manager Commentary | ||
October 31, 2012 (Unaudited) |
Dear Shareholder:
The performance of the Emerald Growth Fund’s Class A shares (without sales load), for the semi-annual period ended October 31, 2012 reflected a decline of 5.87%. Although disappointed by the relative and nominal performance during the trailing six month period ended October 31, 2012, on a year-to-date basis the Emerald Growth Fund’s Class A shares (without sales load) gained 14.08%, outperforming the Russell 2000 Growth Index(1), which increased 10.53%. For additional performance details, please see the chart on the next page.
While returns on a year-to-date basis are commendable, the path was anything but linear, as evidenced by the six month trailing performance detailed above. Challenged earlier in the period by slowing global economic data, trading losses at JP Morgan and a disappointing Facebook initial public offering, the market subsequently recovered. With the clearance by the German Constitutional Court, Europe has the go ahead to proceed with its plan for unlimited Quantitative Easing. Not to be out done, the US Federal Reserve quickly followed suit with its announcement on September 13th that it planned to keep short-term rates at record lows until mid-2015 and pledged to purchase $40 billion a month in mortgage backed securities for as long as it takes for employment to improve. The statement went one step-further, in a pro-active move to refute claims that the Federal Reserve’s tool box was empty, by indicating that more asset purchases and other tools would be used if the economy failed to generate more jobs in the context of price stability.
While the recent actions from the central banks have provided a lift to the market, we believe that the market melt-up is being supported by more than just the anticipation and realization of additional quantitative easing. Domestic economic activity has stabilized and in some areas we are seeing surprising strength. After a more subdued second quarter, Emerald believes the consumer component of the economy appears to be undergoing resurgence. At the same time, Emerald believes the housing market appears to be solidly on the road to recovery. The NAHB (National Association of Home Builders/ Wells Fargo Housing Market Index) housing index rose for a 5th straight month to 40, the highest reading since June 2006. (This Index is based on a monthly survey of NAHB members designed to take the pulse of the single-family housing market. The survey asks respondents to rate market conditions for the sale of new homes at the present time and in the next 6 months as well as the traffic of prospective buyers of new homes.) Additionally, and not insignificantly, auto sales in September surged to a 14.9 million annual rate, a level which hasn’t been witnessed in the U.S. market since 2007.
The risk-on, risk-off machinations in the market and the rapid rate at which they adjust continue to provide a challenging back-drop for investing. Earnings season proved particularly challenging during the month of October as positive surprises received little attention and those companies that surprised negatively were punished disproportionately, providing a headwind to stock pickers like Emerald. As a consequence the portfolio underperformed the Russell 2000 Growth benchmark for the trailing size month period as positive contribution from the financial services, energy and healthcare exposure was unable to offset disappointing relative performance from the producer durables, technology and consumer discretionary sectors.
The financial services sector led returns for the period driven by both stock selection and the portfolio’s relative overweight position in the banking industry. Bank stocks have flourished this year as improving loan growth, solid mortgage banking income, ongoing credit leverage, and greater evidence of stability in housing have outweighed net interest margin (NIM) pressure and heightened macro concerns. Within the Emerald portfolio, shares of Texas Capital Bancshares led performance as momentum in the bank’s commercial and industrial loan pipeline, particularly in the health care and services sectors, has been accelerating. Emerald believes that Texas Capital’s loan growth will continue to deliver upside to current earnings projections. In particular we are optimistic regarding the potential contribution from the addition of the 12 new commercial and industrial lenders that have joined the lending team over the last year.
Looking forward, while performance to date within the industry has been strong, Emerald believes that the banking industry is poised to continue its outperformance as the quality of bank assets continues to improve, capital is abundant and lending remains expansionary. Emerald has added aggressively to its position within financial services during the last six months transitioning the portfolio from an underweight position to an overweight position as of quarter-end.
The energy sector also contributed positively to performance driven by stock selection within the oil crude producer industry. The most notable contributor to return was Gulfport Energy. The company released results from a few Utica Shale wells In Ohio that were far above investor expectations. With 65,000 net acres in the heart of the Utica, investors aggressively bid up shares on the Utica news, favorable earnings results and substantial upside from Gulfport’s Canadian Oil Sands and Permian acreage positions.
Offsetting the aforementioned, however, was disappointing stock selection within the consumer discretionary sector. Body Central Corp. was the top detractor to performance during the period. After posting strong sales performance over the better part of the last year, Body Central, a retailer of women’s apparel, guided to weaker than expected second quarter earnings as a result of several merchandising missteps. While extremely disappointed by the execution issues at the company, we view the market’s reaction as overly severe given the company’s strong balance sheet, solid cash flow generation and strong new store economics. Emerald has maintained its position in Body Central. Although
4 | www.emeraldmutualfunds.com |
Table of Contents
Emerald Growth Fund | Manager Commentary | |
October 31, 2012 (Unaudited) |
disappointed with the recent relative performance, Emerald remains encouraged by the opportunity set within the consumer discretionary sector. The portfolio held a relative overweight position to the consumer discretionary sector at period end.
Performance of the holdings within the producer durable and technology sectors all detracted from return driven primarily by disappointing stock selection within scientific instrument and software industries. While disappointed with the short-term performance within the technology sector Emerald continues to believe that there are many attractive investment opportunities within the sector for those companies that are defining the niche in which they operate such as email marketing, security, industrial lasers and human capital management to name a few. Emerald was overweight the technology sector as of period end.
Emerald has maintained a level of cautious optimism for the better part of the last three years, confident in our fundamental bottom-up understanding of the companies in which we invest and their opportunities, but cautious on the macro-economic unknowns. Entering the fourth calendar quarter and second half of the fiscal year for the mutual fund, we find ourselves in a similar situation. At the stock level, Emerald remains optimistic and enthusiastic about the level of innovation and growth opportunities reflected in our portfolio holdings, but at the same time we remain grounded in recognition of the challenges and uncertainties that lie ahead. In that regard, while issues surrounding Europe and global growth will continue to directionally influence the market from day-to-day, the domestic issues, including the upcoming presidential election and the pending fiscal cliff, are likely to be the most influential to market direction through the balance of the year. Beyond these near-term uncertainties there is plenty to be encouraged about. Housing is recovering, liquidity is abundant, interest rates low, earnings are expanding, multiples are attractive relative to historical levels, cash on corporate balance sheets is high as a percentage of market capitalization, correlations have fallen and the volatility index remains subdued.
Looking to the balance of 2012 the portfolio remains positioned in what we believe are the best growth opportunities which are reflected at the sector level in overweight positions in the consumer discretionary, healthcare, financial services and technology sectors and the most significant underweight positions in the materials, producer durables and consumer staples sectors. Emerald, as has been the case since the inception of the firm, remains focused on utilizing its fundamental bottom-up research process to seek to identify the best growth companies within the small capitalization universe.
Top Contributors to Performance Included: | Top Detractors from Performance Included: | |
Hovnanian Enterprises Inc. (HOV) | Body Central Corp. (BODY) | |
Ultimate Software Group (ULTI) | FARO Technologies (FARO) | |
Sarepta Therapeutics (SRPT) | Magnum Hunter Resources (MHR) | |
Kenexa Corp. (KNXA) | Crocs Inc. (CROX) | |
Medivation Inc. (MDVN) | Aeropostale Inc. (ARO) |
|
|
| ||
Kenneth G. Mertz II, CFA | Stacey L. Sears | Joseph W. Garner | ||
Chief Investment Officer | Portfolio Manager | Portfolio Manager | ||
Portfolio Manager
| ||||
Emerald Mutual Fund Advisers Trust |


| (1) | The Russell 2000® Growth Index measures the performance of the small-cap growth segment of the U.S. equity universe. It includes those Russell 2000® Index companies with higher price-to-value ratios and higher forecasted growth values. |
The index is not actively managed and do not reflect any deduction for fees, expenses or taxes. An investor cannot invest directly into an index.
Semi-Annual Report | October 31, 2012 |
5 |
Table of Contents
Emerald Growth Fund | Manager Commentary | |
October 31, 2012 (Unaudited) |
TOP TEN HOLDINGS (as a % of Net Assets)*
| ||||||
MWI Veterinary Supply, Inc. | 3.39% | |||||
FARO Technologies, Inc. | 2.19% | |||||
Akorn, Inc. | 2.04% | |||||
Middleby Corp. | 1.96% | |||||
Bank of the Ozarks, Inc. | 1.93% | |||||
IPG Photonics Corp. | 1.90% | |||||
Jazz Pharmaceuticals PLC | 1.87% | |||||
WESCO International, Inc. | 1.80% | |||||
Triumph Group, Inc. | 1.74% | |||||
Medivation, Inc. | 1.73% | |||||
Top Ten Holdings | 20.55% | |||||
INDUSTRY SECTOR ALLOCATION (as a % of Net Assets)
| ||||||
Health Care | 22.72% | |||||
Consumer Discretionary | 22.40% | |||||
Technology | 18.73% | |||||
Producer Durables | 11.65% | |||||
Financial Services | 11.54% | |||||
Energy | 5.28% | |||||
Materials & Processing | 4.92% | |||||
Consumer Staples | 2.44% | |||||
Rights and Warrants | 0.00% | |||||
Cash, Cash Equivalents, & Other Net Assets | 0.32% | |||||
* Holdings are subject to change. Tables present indicative values only. |
| |||||
GROWTH OF $10,000 INVESTMENT IN THE FUND (for the period ended October 31, 2012)
Comparison of change in value of a $10,000 investment (includes applicable sales loads)
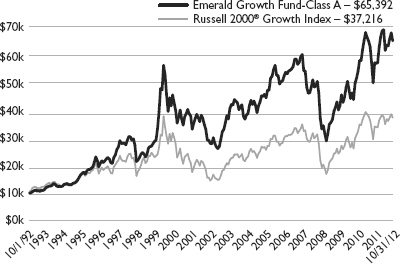
The chart represents historical performance of a hypothetical investment of $10,000 in the Fund since inception. Past performance does not guarantee future results. This chart does not reflect the deduction of taxes that a shareholder would pay on Fund distributions or the redemption of Fund shares.
AVERAGE ANNUAL TOTAL RETURN (for the period ended
October 31, 2012)
| 1 Year | 3 Year | 5 Year | 10 Year | Since Inception1 | Expense Ratio Gross2 Net2 | |||||||||||||||||||||||
Class A (NAV) | 14.06% | 17.75% | 1.61% | 8.99% | 10.06% | 1.43% | 1.29% | |||||||||||||||||||||
Class A (MOP) | 8.62% | 15.84% | 0.62% | 8.46% | 9.80% | 1.43% | 1.29% | |||||||||||||||||||||
Russell 2000® Growth Index† | 9.70% | 15.74% | 1.41% | 9.66% | 6.76% | |||||||||||||||||||||||
Class C (NAV) | 13.39% | 16.97% | 0.96% | 8.35% | 2.55% | 2.08% | 1.94% | |||||||||||||||||||||
Class C (CDSC) | 12.39% | 16.97% | 0.96% | 8.35% | 2.55% | 2.08% | 1.94% | |||||||||||||||||||||
Russell 2000® Growth Index | 9.70% | 15.74% | 1.41% | 9.66% | 1.43% | |||||||||||||||||||||||
Institutional Class | 14.44% | 18.10% | – | – | 14.40% | 1.13% | 0.99% | |||||||||||||||||||||
Russell 2000® Growth Index | 9.70% | 15.74% | – | – | 14.54% | |||||||||||||||||||||||
Investor Class | 14.08% | – | – | – | -2.17% | ** | 1.48% | 1.34% | ||||||||||||||||||||
Russell 2000® Growth Index | 9.70% | – | – | – | -2.61% | ** | ||||||||||||||||||||||
The performance quoted represents past performance, does not guarantee future results and current performance may be lower or higher than the data quoted. The investment return and principal value of an investment will fluctuate so that shares, when redeemed, may be worth more or less than their original cost. Performance data current to the most recent month end may be obtained at www.emeraldmutualfunds.com.
Performance shown for periods prior to March 16, 2012, reflects the performance of the Forward Growth Fund, a series of Forward Funds (as a result of a reorganization of the Forward Growth Fund into the Emerald Growth Fund.
Maximum Offering Price (MOP) for Class A shares includes the Fund’s maximum sales charge of 4.75%. Performance shown at NAV does not include these sales charges and would have been lower had it been taken into account.
6 | www.emeraldmutualfunds.com |
Table of Contents
Emerald Growth Fund | Manager Commentary | |
October 31, 2012 (Unaudited) |
| ||
A Contingent Deferred Sales Charge (CDSC) of 1.00% may apply to Class C shares redeemed within the first 12 months after a purchase.
| 1 | Inception Dates - Class A: 10/01/1992, Class C: 07/01/2000, Class Institutional: 10/21/2008, Class Investor: 05/01/2011 |
| 2 | Emerald Mutual Fund Advisers Trust (“Emerald” or the “Adviser”) has agreed contractually to waive a portion of its fees and reimburse other expenses until August 31, 2013 in amounts necessary to limit the Fund’s operating expenses (exclusive of Acquired Fund Fees and Expenses, brokerage expenses, interest expenses, taxes and extraordinary expense) for Class A, Class C, Institutional Class, and Investor Class shares to an annual rate (as percentage of the Fund’s average daily net assets) of 1.29%, 1.94%, 0.99% and 1.34% respectively. The Adviser will be permitted to recover, on a class-by-class basis, expenses it has borne through the agreement described above to the extent that the Fund’s expenses in later periods fall below the annual rates set forth in the relevant agreement. The Fund will not be obligated to pay any such deferred fees and expenses more than three years after the year(s) in which the fees and expense were incurred. The Adviser may not discontinue this waiver, prior to August 31, 2013, without the approval by the Fund’s Board of Trustees. |
| ** | Cumulative |
† The Russell 2000® Growth Index measures the performance of the small-cap growth segment of the U.S. equity universe. It includes those Russell 2000® Index companies with higher price-to-value ratios and higher forecasted growth values.
The index is not actively managed and does not reflect any deduction for fees, expenses or taxes. An Investor cannot invest directly into an index.
Important Risks
The views and information discussed in this commentary are as of the date of publication, are subject to change, and may not reflect the writer’s current views. The views expressed represent an assessment of market conditions at a specific point in time, are opinions only and should not be relied upon as investment advice regarding a particular investment or markets in general. Such information does not constitute a recommendation to buy or sell specific securities or investment vehicles. It should not be assumed that any investment will be profitable or will equal the performance of the portfolios or any securities or any sectors mentioned herein. The subject matter contained herein has been derived from several sources believed to be reliable and accurate at the time of compilation. The Fund does not accept any liability for losses either direct or consequential caused by the use of this information.
Investing in smaller companies generally will present greater investment risks, including: greater price volatility, greater sensitivity to changing economic conditions and less liquidity than the securities of larger, more mature companies.
Semi-Annual Report | October 31, 2012 |
7 |
Table of Contents
Emerald Funds | Disclosure of Fund Expenses | |
October 31, 2012 (Unaudited) |
As a shareholder of the Funds, you incur two types of costs: (1) transaction costs, including applicable sales charges (loads); and (2) ongoing costs, including management fees, distribution and service (12b-1) fees, shareholder services fees and other Fund expenses. This example is intended to help you understand your ongoing costs (in dollars) of investing in the Funds and to compare these costs with the ongoing costs of investing in other mutual funds. The example is based on an investment of $1,000 invested at the beginning of the (six-month) period and held for the entire period May 1, 2012 through October 31, 2012.
Actual Expenses
The first line for each share class of each Fund in the table provides information about actual account values and actual expenses. You may use this information, together with the amount you invested, to estimate the expenses that you paid over the period. Simply divide your account value by $1,000 (for example, an $8,600 account value divided by $1,000 = 8.6), then multiply the result by the number in the applicable line under the heading entitled “Expenses Paid During Period” to estimate the expenses you paid on your account during this period.
Hypothetical Example For Comparison Purposes
The second line for each share class of each Fund in the table below provides information about hypothetical account values and hypothetical expenses based on the Fund’s actual expense ratio and an assumed rate of return of 5% per year before expenses, which is not the Fund’s actual return. The hypothetical account values and expenses may not be used to estimate the actual ending account balance or expenses you paid for the period. You may use this information to compare the ongoing costs of investing in the Funds and other funds. To do so, compare this 5% hypothetical example with the 5% hypothetical examples that appear in the shareholder reports of other funds.
Please note that the expenses shown in the table below are meant to highlight your ongoing costs only and do not reflect any transactional costs, such as sales charges (loads), redemption fees or exchange fees. Therefore, the second line for each share class of each Fund within the table is useful in comparing ongoing costs only, and will not help you determine the relative total costs of owning different funds. If these transactional costs were included, your costs would have been higher.
| EMERALD BANKING AND FINANCE FUND | BEGINNING ACCOUNT VALUE | ENDING ACCOUNT VALUE 10/31/12 | EXPENSE RATIO(a) | EXPENSES PAID DURING PERIOD 05/01/12- 10/31/12(b) | ||||||||||||||||
Class A | ||||||||||||||||||||
Actual | $ | 1,000.00 | $ | 1,071.30 | 1.84 | % | $ | 9.61 | ||||||||||||
Hypothetical (5% return before expenses) | $ | 1,000.00 | $ | 1,015.93 | 1.84 | % | $ | 9.35 | ||||||||||||
| ||||||||||||||||||||
Class C | ||||||||||||||||||||
Actual | $ | 1,000.00 | $ | 1,067.50 | 2.49 | % | $ | 12.98 | ||||||||||||
Hypothetical (5% return before expenses) | $ | 1,000.00 | $ | 1,012.65 | 2.49 | % | $ | 12.63 | ||||||||||||
| ||||||||||||||||||||
Institutional Class | ||||||||||||||||||||
Actual | $ | 1,000.00 | $ | 1,073.10 | 1.54 | % | $ | 8.05 | ||||||||||||
Hypothetical (5% return before expenses) | $ | 1,000.00 | $ | 1,017.44 | 1.54 | % | $ | 7.83 | ||||||||||||
| ||||||||||||||||||||
Investor Class | ||||||||||||||||||||
Actual | $ | 1,000.00 | $ | 1,071.40 | 1.89 | % | $ | 9.87 | ||||||||||||
Hypothetical (5% return before expenses) | $ | 1,000.00 | $ | 1,015.68 | 1.89 | % | $ | 9.60 | ||||||||||||
| (a) | The Fund’s expense ratios have been based on the Fund’s most recent fiscal half-year expenses. |
| (b) | Expenses are equal to the Fund’s annualized expense ratio multiplied by the average account value over the period, multiplied by the number of days in the most recent fiscal half year (184), then divided by 365. |
8 |
www.emeraldmutualfunds.com |
Table of Contents
Emerald Funds | Disclosure of Fund Expenses | |
October 31, 2012 (Unaudited) |
| EMERALD GROWTH FUND | BEGINNING ACCOUNT VALUE 05/01/12 | ENDING ACCOUNT VALUE 10/31/12 | EXPENSE RATIO(a) | EXPENSES PAID DURING PERIOD 05/01/12- 10/31/12(b) | ||||||||||||||||
Class A | ||||||||||||||||||||
Actual | $ | 1,000.00 | $ | 941.40 | 1.29 | % | $ | 6.31 | ||||||||||||
Hypothetical (5% return before expenses) | $ | 1,000.00 | $ | 1,018.70 | 1.29 | % | $ | 6.56 | ||||||||||||
| ||||||||||||||||||||
Class C | ||||||||||||||||||||
Actual | $ | 1,000.00 | $ | 938.20 | 1.94 | % | $ | 9.48 | ||||||||||||
Hypothetical (5% return before expenses) | $ | 1,000.00 | $ | 1,015.43 | 1.94 | % | $ | 9.86 | ||||||||||||
| ||||||||||||||||||||
Institutional Class | ||||||||||||||||||||
Actual | $ | 1,000.00 | $ | 942.70 | 0.99 | % | $ | 4.85 | ||||||||||||
Hypothetical (5% return before expenses) | $ | 1,000.00 | $ | 1,020.21 | 0.99 | % | $ | 5.04 | ||||||||||||
| ||||||||||||||||||||
Investor Class | ||||||||||||||||||||
Actual | $ | 1,000.00 | $ | 941.30 | 1.34 | % | $ | 6.56 | ||||||||||||
Hypothetical (5% return before expenses) | $ | 1,000.00 | $ | 1,018.45 | 1.34 | % | $ | 6.82 | ||||||||||||
| (a) | The Fund’s expense ratios have been based on the Fund’s most recent fiscal half-year expenses. |
| (b) | Expenses are equal to the Fund’s annualized expense ratio multiplied by the average account value over the period, multiplied by the number of days in the most recent fiscal half year (184), then divided by 365. |
Semi-Annual Report | October 31, 2012 |
9 |
Table of Contents
Emerald Banking and Finance Fund | Schedule of Investments | |
| October 31, 2012 (Unaudited) |
| Shares | Value (Note 2) | |||||||
| COMMON STOCKS: 98.68% |
| ||||||
| Financial Services: 98.68% |
| ||||||
| Asset Management & Custodian: 0.93% |
| ||||||
| 3,100 | Affiliated Managers Group, Inc.(a)
| $
| 392,150
|
| ||||
| Banks: Diversified: 72.37% |
| ||||||
| 36,670 | Access National Corp. | 483,677 | ||||||
| 23,120 | American Business Bank(a) | 601,120 | ||||||
| 11,354 | Bank of Marin Bancorp | 423,845 | ||||||
| 52,098 | Bank of the Ozarks, Inc. | 1,705,689 | ||||||
| 21,560 | BofI Holding, Inc.(a) | 606,267 | ||||||
| 3,500 | Bridge Bancorp, Inc. | 70,000 | ||||||
| 18,290 | Bryn Mawr Bank Corp. | 414,086 | ||||||
| 63,140 | Cardinal Financial Corp. | 1,008,346 | ||||||
| 40,000 | Carolina Trust Bank(a) | 98,000 | ||||||
| 17,704 | Center Bancorp, Inc. | 201,649 | ||||||
| 34,580 | Central Valley Community Bancorp(a) | 307,416 | ||||||
| 7,211 | Citizens Financial Services, Inc. | 331,706 | ||||||
| 127,613 | CoBiz Financial, Inc. | 909,881 | ||||||
| 1,600 | Community Bank System, Inc. | 44,144 | ||||||
| 9,926 | Cortland Bancorp | 95,786 | ||||||
| 77,229 | CU Bancorp(a) | 996,254 | ||||||
| 53,546 | Eagle Bancorp, Inc.(a) | 1,116,970 | ||||||
| 19,760 | East West Bancorp, Inc. | 420,690 | ||||||
| 11,356 | Enterprise Financial Services Corp. | 158,984 | ||||||
| 14,050 | Evans Bancorp, Inc. | 226,907 | ||||||
| 42,950 | EverBank Financial Corp. | 654,558 | ||||||
| 89,859 | Farmers National Banc Corp. | 556,227 | ||||||
| 18,400 | Financial Institutions, Inc. | 350,336 | ||||||
| 23,792 | First California Financial Group, Inc.(a) | 160,596 | ||||||
| 6,140 | First Community Bancshares, Inc. | 91,977 | ||||||
| 28,866 | First Financial Bancorp | 453,196 | ||||||
| 21,150 | First Financial Bankshares, Inc. | 766,265 | ||||||
| 48,710 | First Horizon National Corp. | 453,490 | ||||||
| 30,190 | First of Long Island Corp. | 905,398 | ||||||
| 112,530 | Guaranty Bancorp(a) | 205,930 | ||||||
| 11,416 | Hancock Holding Co. | 360,631 | ||||||
| 71,360 | Heritage Oaks Bancorp(a) | 388,198 | ||||||
| 21,510 | Home BancShares, Inc. | 745,106 | ||||||
| 16,003 | HopFed Bancorp, Inc. | 125,624 | ||||||
| 39,589 | Horizon Bancorp | 1,148,081 | ||||||
| 58,461 | Howard Bancorp, Inc.(a) | 379,997 | ||||||
| 15,250 | Independent Bank Corp. | 450,028 | ||||||
| 28,473 | Investors Bancorp, Inc. | 512,229 | ||||||
| 29,063 | Lakeland Financial Corp. | 775,691 | ||||||
| 9,697 | Meridian Interstate Bancorp, Inc.(a) | 163,782 | ||||||
| 15,169 | MidSouth Bancorp, Inc. | 235,120 | ||||||
| 6,320 | NBT Bancorp, Inc. | 134,426 | ||||||
| 30,000 | Northeast Bancorp | 285,900 | ||||||
| 6,224 | Oak Valley Bancorp(a) | 47,676 | ||||||
| 19,640 | Old Line Bancshares, Inc. | 216,236 | ||||||
| 19,950 | Old National Bancorp | 244,787 | ||||||
| 10,392 | Orrstown Financial Services, Inc.(a) | 91,865 | ||||||
| Shares | Value (Note2) | |||||||
| Banks: Diversified (continued) |
| ||||||
| 52,790 | Pacific Premier Bancorp, Inc.(a) | $ | 592,304 | |||||
| 15,000 | Peoples Bancorp, Inc. | 319,500 | ||||||
| 14,460 | Pinnacle Financial Partners, | 282,693 | ||||||
| 15,070 | Prosperity Bancshares, Inc. | 630,830 | ||||||
| 18,500 | Signature Bank(a) | 1,317,940 | ||||||
| 31,188 | Southern National Bancorp of Virginia, Inc. | 253,870 | ||||||
| 8,750 | State Bank Financial Corp. | 132,738 | ||||||
| 84,776 | Susquehanna Bancshares, Inc. | 879,127 | ||||||
| 11,858 | SVB Financial Group(a) | 671,044 | ||||||
| 4,260 | SY Bancorp, Inc. | 100,451 | ||||||
| 37,113 | Texas Capital Bancshares, | 1,761,754 | ||||||
| 8,520 | Tompkins Financial Corp. | 344,890 | ||||||
| 4,760 | UMB Financial Corp. | 211,963 | ||||||
| 36,593 | ViewPoint Financial Group, Inc. | 761,134 | ||||||
| 21,740 | Virginia Commerce Bancorp, | 199,138 | ||||||
| 28,463 | Washington Banking Co. | 389,089 | ||||||
| 58,387 | Western Alliance | 599,051 | ||||||
| 30,572,283 | ||||||||
| Banks: Savings, Thrift & Mortgage: 7.04% |
| ||||||
| 3,510 | Berkshire Hills Bancorp, Inc. | 82,415 | ||||||
| 50,225 | Capitol Federal Financial, Inc. | 598,180 | ||||||
| 7,500 | Elmira Savings Bank | 164,175 | ||||||
| 9,400 | First Pactrust Bancorp, Inc. | 110,544 | ||||||
| 12,500 | Flushing Financial Corp. | 194,375 | ||||||
| 25,050 | Heritage Financial Corp. | 346,441 | ||||||
| 3,300 | Hingham Institution for Savings | 224,235 | ||||||
| 11,680 | Home Bancorp, Inc.(a) | 220,869 | ||||||
| 16,830 | Provident New York Bancorp | 153,658 | ||||||
| 16,999 | Teche Holding Co. | 681,320 | ||||||
| 8,830 | Territorial Bancorp, Inc. | 199,558 | ||||||
| 2,975,770 | ||||||||
| Commercial Finance & Mortgage: 1.63% |
| ||||||
| 41,410 | Walker & Dunlop, Inc.(a) | 687,820 | ||||||
| Financial Data & Systems: 2.08% |
| ||||||
| 20,931 | Cass Information Systems, Inc. | 878,474 | ||||||
| Insurance: Property-Casualty: 1.36% |
| ||||||
| 13,508 | Amtrust Financial Services, Inc. | 326,894 | ||||||
| 6,840 | Axis Capital Holdings, Ltd. | 247,745 | ||||||
| 574,639 | ||||||||
| Real Estate Investment Trusts |
| ||||||
| (REITs): 13.27% |
| ||||||
| 4,730 | American Campus Communities, Inc. | 214,316 | ||||||
| 51,963 | Campus Crest Communities, Inc. | 576,270 | ||||||
| 21,230 | CubeSmart | 278,538 | ||||||
| 63,190 | Glimcher Realty Trust | 674,237 | ||||||
| 4,030 | Mid-America Apartment Communities, Inc. | 260,781 | ||||||
| 10 | www.emeraldmutualfunds.com |
Table of Contents
Emerald Banking and Finance Fund | Schedule of Investments | |
October 31, 2012 (Unaudited) |
| Shares | Value (Note 2) | |||||||
| Real Estate Investment Trusts (REITs) |
| ||||||
| (continued) |
| ||||||
| 10,670 | National Retail Properties, Inc. | $338,026 | ||||||
| 14,060 | Saul Centers, Inc. | 608,376 | ||||||
| 3,700 | Sovran Self Storage, Inc. | 213,860 | ||||||
| 86,310 | Summit Hotel Properties, Inc. | 712,921 | ||||||
| 11,690 | Tanger Factory Outlet Centers,Inc. | 367,884 | ||||||
| 22,180 | Urstadt Biddle Properties, Inc., Class A | 420,089 | ||||||
| 70,000 | Whitestone | 942,900 | ||||||
| 5,608,198 | ||||||||
Total Common Stocks (Cost $30,642,689)
|
| 41,689,334
|
| |||||
| SHORT TERM INVESTMENTS: 1.36% |
| ||||||
| $574,938 | Dreyfus Government Cash Management Fund - Institutional Class 0.010% (7 Day Yield) | 574,938 | ||||||
Total Short Term Investments (Cost $574,938) | 574,938 | |||||||
Total Investments: 100.04% (Cost $31,217,627) | 42,264,272 | |||||||
Liabilities In Excess Of Other Assets: (0.04)% | (18,926 | ) | ||||||
| Net Assets: 100.00% | $42,245,346 | |||||||
| (a) | Non-income producing security. |
For Fund compliance purposes, the Fund’s industry classifications refer to any one or more of the industry sub-classifications used by one or more widely recognized market indexes or ratings group indexes, and/or as defined by Fund management. This definition may not apply for purposes of this report, which may combine industry sub- classifications for reporting ease. Industries are shown as a percent of net assets. These industry classifications are based on third party definitions and are unaudited. The definitions are industry terms and do not reflect the legal status of any of the investments or the companies in which the Fund has invested.
See Notes to Financial Statements.
Semi-Annual Report | October 31, 2012 |
11 |
Table of Contents
| Schedule of Investments | ||
October 31, 2012 (Unaudited) |
| Shares | Value (Note 2) | |||||
COMMON STOCKS: 99.68% | ||||||
Consumer Discretionary: 22.40% | ||||||
| 33,909 | BJ’s Restaurants, Inc.(a) | $ | 1,120,692 | |||
| 85,256 | Black Diamond, Inc.(a) | 809,932 | ||||
| 68,347 | Body Central Corp.(a) | 682,787 | ||||
| 40,038 | Carmike Cinemas, Inc.(a) | 545,318 | ||||
| 13,358 | Chuy’s Holdings, Inc.(a) | 326,336 | ||||
| 87,891 | Crocs, Inc.(a) | 1,107,427 | ||||
| 93,300 | Fifth & Pacific Cos., Inc.(a) | 1,024,434 | ||||
| 57,971 | Francesca’s Holdings | 1,711,884 | ||||
| 30,006 | Hibbett Sports, Inc.(a) | 1,620,024 | ||||
| 28,285 | HomeAway, Inc.(a) | 727,207 | ||||
| 340,407 | Hovnanian Enterprises, Inc., Class A(a) | 1,463,750 | ||||
| 85,902 | Martha Stewart Living Omnimedia, Class A | 248,257 | ||||
| 50,435 | Mattress Firm Holding | 1,614,424 | ||||
| 34,169 | Meritage Homes Corp.(a) | 1,263,570 | ||||
| 26,440 | Multimedia Games Holding Co., Inc(a) | 420,396 | ||||
| 77,359 | Pandora Media, Inc.(a) | 649,042 | ||||
| 50,318 | Red Robin Gourmet Burgers, Inc.(a) | 1,680,621 | ||||
| 32,580 | Select Comfort Corp.(a) | 906,701 | ||||
| 97,851 | SHFL Entertainment, Inc.(a) | 1,382,635 | ||||
| 1,859 | Shutterstock, Inc.(a) | 44,151 | ||||
| 79,729 | Sinclair Broadcast Group, Inc., Class A | 1,004,585 | ||||
| 136,276 | Standard Pacific Corp.(a) | 940,304 | ||||
| 46,856 | Teavana Holdings, Inc.(a) | 494,331 | ||||
| 65,011 | Tilly’s, Inc., Class A(a) | 1,049,278 | ||||
| 15,691 | Ulta Salon Cosmetics & Fragrance, Inc. | 1,447,024 | ||||
| 27,585 | Vitamin Shoppe, Inc.(a) | 1,578,965 | ||||
| 69,844 | Zagg, Inc.(a) | 501,480 | ||||
| 26,365,555 | ||||||
| Consumer Staples: 2.44% | ||||||
| 39,945 | GNC Holdings, Inc., Class A | 1,544,673 | ||||
| 41,079 | PhotoMedex, Inc.(a) | 546,761 | ||||
| 65,045 | Smart Balance, Inc.(a) | 774,036 | ||||
| 2,865,470 | ||||||
| Energy: 5.28% | ||||||
| 33,638 | Cheniere Energy, Inc.(a) | 541,235 | ||||
| 25,575 | Diamondback Energy, Inc.(a) | 435,542 | ||||
| 19,121 | Forum Energy Technologies, Inc.(a) | 426,590 | ||||
| 52,295 | Gulfport Energy Corp.(a) | 1,735,148 | ||||
| 84,640 | Kodiak Oil & Gas Corp.(a) | 782,074 | ||||
| 365,414 | Magnum Hunter Resources Corp.(a) | 1,395,881 | ||||
| 68,082 | Rex Energy Corp.(a) | 901,406 | ||||
| 6,217,876 | ||||||
| Financial Services: 11.54% | ||||||
| 69,562 | Bank of the Ozarks, Inc. | 2,277,460 | ||||
| 63,648 | CoBiz Financial, Inc. | 453,810 | ||||
| 18,032 | Financial Engines, Inc.(a) | 432,948 | ||||
| 63,420 | First Horizon National Corp. | 590,440 | ||||
| Shares | Value (Note 2) | |||||
| Financial Services (continued) | ||||||
| 105,064 | Glimcher Realty Trust, REIT | $ | 1,121,033 | |||
| 118,203 | Howard Bancorp, Inc.(a) | 768,320 | ||||
| 18,234 | Signature Bank(a) | 1,298,990 | ||||
| 124,571 | Susquehanna Bancshares, Inc. | 1,291,801 | ||||
| 30,001 | SVB Financial Group(a) | 1,697,757 | ||||
| 13,330 | Tanger Factory Outlet Centers, Inc. | 419,495 | ||||
| 42,346 | Texas Capital Bancshares, Inc.(a) | 2,010,165 | ||||
| 73,740 | Walker & Dunlop, Inc.(a) | 1,224,821 | ||||
| 13,587,040 | ||||||
| Health Care: 22.72% | ||||||
| 14,783 | Abaxis, Inc.(a) | 543,719 | ||||
| 94,725 | Acadia Healthcare Co., | 1,948,493 | ||||
| 84,447 | Achillion Pharmaceuticals,Inc.(a) | 797,180 | ||||
| 199,931 | Akorn, Inc.(a) | 2,401,171 | ||||
| 26,986 | Align Technology, Inc.(a) | 717,288 | ||||
| 59,790 | Alnylam Pharmaceuticals,Inc.(a) | 966,804 | ||||
| 45,846 | Anacor Pharmaceuticals,Inc.(a) | 263,615 | ||||
| 82,683 | BioScrip, Inc.(a) | 761,510 | ||||
| 21,508 | Cepheid, Inc.(a) | 651,908 | ||||
| 113,480 | Dusa Pharmaceuticals, | 778,473 | ||||
| 40,020 | Exact Sciences Corp.(a) | 378,589 | ||||
| 40,450 | Greatbatch, Inc.(a) | 889,091 | ||||
| 68,490 | Incyte Corp., Ltd.(a) | 1,093,100 | ||||
| 32,915 | IPC The Hospitalist Co., | 1,135,238 | ||||
| 40,920 | Jazz Pharmaceuticals | 2,198,632 | ||||
| 39,876 | Medivation, Inc.(a) | 2,038,461 | ||||
| 37,987 | MWI Veterinary Supply, | 3,989,395 | ||||
| 182,886 | NPS Pharmaceuticals,Inc.(a) | 1,689,867 | ||||
| 33,116 | Omnicell, Inc.(a) | 482,831 | ||||
| 103,680 | Regulus Therapeutics, | 495,590 | ||||
| 44,816 | Sarepta Therapeutics, Inc.(a) | 955,029 | ||||
| 17,976 | Synageva BioPharma | 760,025 | ||||
| 37,482 | Verastem, Inc.(a) | 297,607 | ||||
| 33,830 | Vivus, Inc.(a) | 504,067 | ||||
| 26,737,683 | ||||||
| Materials & Processing: 4.92% | ||||||
| 33,488 | Allied Nevada Gold Corp.(a) | 1,236,377 | ||||
| 31,686 | Apogee Enterprises, Inc. | 645,444 | ||||
| 17,480 | Carpenter Technology Corp. | 849,703 | ||||
| 40,628 | Trex Co., Inc(a) | 1,419,542 | ||||
| 61,345 | USG Corp.(a) | 1,638,525 | ||||
| 5,789,591 | ||||||
| Producer Durables: 11.65% | ||||||
| 20,195 | Chart Industries,Inc.(a) | 1,429,604 | ||||
| 64,043 | FARO Technologies, Inc.(a) | 2,574,529 | ||||
| 18,472 | Middleby Corp.(a) | 2,308,076 | ||||
| 12,765 | Raven Industries, Inc. | 348,357 | ||||
| 62,157 | Roadrunner Transportation Systems, Inc.(a) | 1,083,396 | ||||
12 |
www.emeraldmutualfunds.com |
Table of Contents
Emerald Growth Fund | Schedule of Investments | |
October 31, 2012 (Unaudited) |
| Shares | Value (Note 2) | |||||||
| Producer Durables (continued) | |||||||
| 30,157 | Spirit Airlines, Inc.(a) | $529,255 | ||||||
| 31,316 | Triumph Group, Inc. | 2,048,693 | ||||||
| 31,354 | United Rentals, Inc.(a) | 1,274,854 | ||||||
| 32,610 | WESCO International, Inc.(a) | 2,115,737 | ||||||
| 13,712,501 | ||||||||
| Technology: 18.73% | |||||||
| 21,387 | 3D Systems Corp.(a) | 930,335 | ||||||
| 99,307 | Aruba Networks, Inc.(a) | 1,804,408 | ||||||
| 34,300 | Bazaarvoice, Inc.(a) | 437,668 | ||||||
| 94,806 | Brightcove, Inc.(a) | 1,196,452 | ||||||
| 37,106 | Cavium, Inc.(a) | 1,231,177 | ||||||
| 71,513 | ExactTarget, Inc.(a) | 1,667,683 | ||||||
| 13,210 | Finisar Corp.(a) | 152,179 | ||||||
| 54,910 | Fortinet, Inc.(a) | 1,063,607 | ||||||
| 22,980 | Guidewire Software, | 704,107 | ||||||
| 30,638 | Infoblox, Inc.(a) | 508,897 | ||||||
| 51,146 | Inphi Corp.(a) | 428,092 | ||||||
| 118,688 | Integrated Device Technology, Inc.(a) | 645,663 | ||||||
| 42,219 | IPG Photonics Corp.(a) | 2,240,985 | ||||||
| 65,747 | Ixia, Inc.(a) | 921,115 | ||||||
| 74,203 | Jive Software, Inc.(a) | 831,074 | ||||||
| 32,145 | Microsemi Corp.(a) | 617,184 | ||||||
| 27,410 | Millennial Media, Inc.(a) | 439,382 | ||||||
| 40,896 | Peregrine Semiconductor | 724,268 | ||||||
| 28,957 | QLIK Technologies, | 533,098 | ||||||
| 125,261 | Saba Software, Inc.(a) | 1,262,631 | ||||||
| 32,263 | Sourcefire, Inc.(a) | 1,380,534 | ||||||
| 31,340 | Synchronoss Technologies, Inc.(a) | 642,157 | ||||||
| 16,640 | Ultimate Software Group, Inc.(a) | 1,686,630 | ||||||
| 22,049,326 | ||||||||
Total Common Stocks (Cost $92,395,500) | 117,325,042 | |||||||
| RIGHTS AND WARRANTS: 0.00% | |||||||
| 22,283 | Magnum Hunter Resources Corp., Warrants, Strike Price $10.50 (expiring 10/14/13)(a)(b) | 0 | ||||||
Total Rights and Warrants (Cost $0) | 0 | |||||||
| SHORT TERM INVESTMENTS: 0.40% |
| ||||||
| 473,863 | Dreyfus Government Cash Management | 473,863 | ||||||
Total Short Term Investments (Cost $473,863) | 473,863 | |||||||
| Shares | Value (Note 2) | |||||||
Total Investments: 100.08% (excluding investments purchased with cash collateral from securities loaned) | ||||||||
| (Cost $92,869,363) | $117,798,905 | |||||||
| INVESTMENTS PURCHASED WITH | | ||||||
| 22,051 | Short-Term Investment Trust, Liquid Assets Portfolio Institutional Class, 0.180% | $22,051 | ||||||
Total Investments Purchased with Cash Collateral From Securities Loaned (Cost $22,051) | 22,051 | |||||||
Total Investments: 100.10% (Cost $92,891,414) | 117,820,956 | |||||||
Liabilities In Excess Of Other Assets: (0.10)% | (113,886 | ) | ||||||
Net Assets: 100.00% | $117,707,070 | |||||||
| (a) | Non-income producing security. |
| (b) | Security, or portion of security, is currently on loan. |
| (c) | The security has been segregated to satisfy the commitment to return the cash collateral received in securities lending transactions upon the borrower’s return of the securities loaned. (Note 2). |
For Fund compliance purposes, the Fund’s industry classifications refer to any one or more of the industry sub-classifications used by one or more widely recognized market indexes or ratings group indexes, and/or as defined by Fund management. This definition may not apply for purposes of this report, which may combine industry sub-classifications for reporting ease. Industries are shown as a percent of net assets. These industry classifications are based on third party definitions and are unaudited. The definitions are industry terms and do not reflect the legal status of any of the investments or the companies in which the Fund has invested.
See Notes to Financial Statements.
Semi-Annual Report | October 31, 2012 |
13 |
Table of Contents
Emerald Funds | Statements of Assets and Liabilities | |
October 31, 2012 (Unaudited) |
EMERALD BANKING FUND | EMERALD GROWTH FUND | |||||||
ASSETS: | ||||||||
Investments, at value(a) | $ | 42,264,272 | $ | 117,820,956 | ||||
Cash | 0 | 55 | ||||||
Receivable for investments sold | 67,325 | 0 | ||||||
Receivable for shares sold | 7,983 | 52,017 | ||||||
Interest and dividends receivable | 35,289 | 18,806 | ||||||
Other assets | 19,707 | 18,100 | ||||||
|
|
|
| |||||
Total Assets | 42,394,576 | 117,909,934 | ||||||
|
|
|
| |||||
LIABILITIES: | ||||||||
Payable for shares redeemed | 56,998 | 29,486 | ||||||
Payable for collateral upon return of securities loaned | 0 | 22,051 | ||||||
Payable to advisor | 35,333 | 70,352 | ||||||
Payable to fund accounting and administration | 4,412 | 12,190 | ||||||
Payable for distribution and service fees | 23,406 | 22,784 | ||||||
Payable to trustees | 1,227 | 4,394 | ||||||
Payable to transfer agents | 6,560 | 6,573 | ||||||
Payable for chief compliance officer fee | 598 | 2,896 | ||||||
Payable for principal financial officer fee | 149 | 725 | ||||||
Payable for audit fee | 14,235 | 15,851 | ||||||
Payable for printing fee | 5,951 | 12,377 | ||||||
Accrued expenses and other liabilities | 361 | 3,185 | ||||||
|
|
|
| |||||
Total Liabilities | 149,230 | 202,864 | ||||||
|
|
|
| |||||
NET ASSETS | $ | 42,245,346 | $ | 117,707,070 | ||||
|
|
|
| |||||
NET ASSETS CONSIST OF: | ||||||||
Paid-in capital | $ | 45,628,088 | $ | 79,920,394 | ||||
Accumulated net investment loss | (38,889) | (553,312) | ||||||
Accumulated net realized gain/(loss) on investments | (14,390,498) | 13,410,446 | ||||||
Net unrealized appreciation on investments | 11,046,645 | 24,929,542 | ||||||
|
|
|
| |||||
NET ASSETS | $ | 42,245,346 | $ | 117,707,070 | ||||
|
|
|
| |||||
INVESTMENTS, AT COST | $ | 31,217,627 | $ | 92,891,414 | ||||
PRICING OF SHARES | ||||||||
Class A: (b) | ||||||||
Net Asset Value, offering and redemption price per share | $ | 18.17 | $ | 15.25 | ||||
Net Assets | $ | 23,312,751 | $ | 39,108,404 | ||||
Shares of beneficial interest outstanding | 1,283,110 | 2,564,217 | ||||||
Maximum offering price per share (NAV/.9525, based on maximum sales charge of 4.75% of the offering price) | $ | 19.08 | $ | 16.01 | ||||
Class C: (b) | ||||||||
Net Asset Value, offering and redemption price per share | $ | 16.76 | $ | 13.97 | ||||
Net Assets | $ | 15,243,880 | $ | 3,162,532 | ||||
Shares of beneficial interest outstanding | 909,361 | 226,388 | ||||||
Institutional Class: | ||||||||
Net Asset Value, offering and redemption price per share | $ | 18.20 | $ | 15.45 | ||||
Net Assets | $ | 121,361 | $ | 74,148,002 | ||||
Shares of beneficial interest outstanding | 6,669 | 4,798,240 | ||||||
Investor Class: | ||||||||
Net Asset Value, offering and redemption price per share | $ | 17.41 | $ | 15.23 | ||||
Net Assets | $ | 3,567,354 | $ | 1,288,132 | ||||
Shares of beneficial interest outstanding | 204,961 | 84,588 | ||||||
| (a) | At October 31, 2012, securities with a market value of $- and $0, respectively, were on loan to brokers. |
| (b) | Redemption price per share may be reduced for any applicable contingent deferred sales charge. For a description of a possible sales charge, please see the Funds’ Prospectus. |
See Notes to Financial Statements.
14 |
www.emeraldmutualfunds.com |
Table of Contents
Emerald Funds | Statements of Operations | |
For the Six Months Ended October 31, 2012 (Unaudited) |
| EMERALD BANKING AND FINANCE FUND | EMERALD GROWTH FUND | |||||||
INVESTMENT INCOME: | ||||||||
Interest | $ | 32 | $ | 79 | ||||
Dividends | 360,605 | 116,479 | ||||||
Foreign taxes withheld | (27) | 0 | ||||||
Securities lending income | 0 | 42 | ||||||
|
|
|
| |||||
Total Investment Income | 360,610 | 116,600 | ||||||
|
|
|
| |||||
EXPENSES: | ||||||||
Investment advisory fee | 190,816 | 449,615 | ||||||
Administration fee | 19,735 | 57,353 | ||||||
Custodian fee | 2,818 | 7,606 | ||||||
Legal and audit fee | 13,007 | 19,005 | ||||||
Transfer agent fee | 32,876 | 28,938 | ||||||
Trustees’ fees and expenses | 2,098 | 7,239 | ||||||
Registration/filing fees | 22,999 | 26,433 | ||||||
Reports to shareholder and printing fees | 3,065 | 7,352 | ||||||
Distribution and service fees | ||||||||
Class A | 36,988 | 70,071 | ||||||
Class C | 73,688 | 14,979 | ||||||
Institutional Class | 10 | 18,911 | ||||||
Investor Class | 4,498 | 2,435 | ||||||
Chief compliance officer fee | 4,571 | 15,590 | ||||||
Principal financial officer fee | 1,142 | 3,899 | ||||||
Other | 3,758 | 8,167 | ||||||
|
|
|
| |||||
Total expenses before waiver | 412,069 | 737,593 | ||||||
Less fees waived/reimbursed by investment advisor (Note 3) | (12,570) | (67,681) | ||||||
|
|
|
| |||||
Total Net Expenses | 399,499 | 669,912 | ||||||
|
|
|
| |||||
NET INVESTMENT LOSS: | (38,889) | (553,312) | ||||||
|
|
|
| |||||
Net realized gain on investments | 1,888,102 | 6,022,565 | ||||||
Net change in unrealized appreciation/(depreciation) on investments | 678,850 | (13,102,842) | ||||||
|
|
|
| |||||
NET REALIZED AND UNREALIZED GAIN/(LOSS) ON INVESTMENTS | 2,566,952 | (7,080,277) | ||||||
|
|
|
| |||||
NET INCREASE/(DECREASE) IN NET ASSETS RESULTING FROM OPERATIONS | $ | 2,528,063 | $ | (7,633,589) | ||||
|
|
|
| |||||
See Notes to Financial Statements.
Semi-Annual Report | October 31, 2012 |
15 |
Table of Contents
| Statements of Changes in Net Assets | ||
| For the Six Months Ended October 31, 2012 (unaudited) | For the Period January 1, 2012 to April 30, 2012 (a)(b) | Year Ended December 31, 2011 | ||||||||||
OPERATIONS: | ||||||||||||
Net investment loss | $ | (38,889) | $ | (55,289) | $ | (171,307) | ||||||
Net realized gain on investments | 1,888,102 | 377,708 | 1,403,730 | |||||||||
Net change in unrealized appreciation/(depreciation) on investments | 678,850 | 3,624,786 | (3,408,071) | |||||||||
|
|
|
|
|
| |||||||
Net increase/(decrease) in net assets resulting from operations | 2,528,063 | 3,947,205 | (2,175,648) | |||||||||
|
|
|
|
|
| |||||||
SHARE TRANSACTIONS: | ||||||||||||
Class A | ||||||||||||
Proceeds from sale of shares | 5,692,624 | 558,884 | 7,104,262 | |||||||||
Cost of shares redeemed | (5,087,098) | (1,955,508) | (12,134,100) | |||||||||
|
|
|
|
|
| |||||||
Net increase/(decrease) from share transactions | 605,526 | (1,396,624) | (5,029,838) | |||||||||
|
|
|
|
|
| |||||||
Class C | ||||||||||||
Proceeds from sale of shares | 913,004 | 289,945 | 925,478 | |||||||||
Cost of shares redeemed | (1,315,941) | (833,416) | (4,259,179) | |||||||||
|
|
|
|
|
| |||||||
Net decrease from share transactions | (402,937) | (543,471) | (3,333,701) | |||||||||
|
|
|
|
|
| |||||||
Institutional Class | ||||||||||||
Proceeds from sale of shares | 110,000 | 7,500 | – | |||||||||
|
|
|
|
|
| |||||||
Net increase from share transactions | 110,000 | 7,500 | – | |||||||||
|
|
|
|
|
| |||||||
Investor Class | ||||||||||||
Proceeds from sale of shares | 2,698,795 | 553,960 | 192,346 | |||||||||
Cost of shares redeemed | (47,296) | (38,595) | (62,335) | |||||||||
|
|
|
|
|
| |||||||
Net increase from share transactions | 2,651,499 | 515,365 | 130,011 | |||||||||
|
|
|
|
|
| |||||||
Net increase/(decrease) in net assets | $ | 5,492,151 | $ | 2,529,975 | $ | (10,409,176) | ||||||
|
|
|
|
|
| |||||||
NET ASSETS: | ||||||||||||
Beginning of period | 36,753,195 | 34,223,220 | 44,632,396 | |||||||||
|
|
|
|
|
| |||||||
End of period (including accumulated net investment loss of $(38,889), $0 and $0, respectively) | $ | 42,245,346 | $ | 36,753,195 | $ | 34,223,220 | ||||||
|
|
|
|
|
| |||||||
Other Information: | ||||||||||||
SHARE TRANSACTIONS: | ||||||||||||
Class A | ||||||||||||
Sold | 318,983 | 34,567 | 459,338 | |||||||||
Redeemed | (295,538) | (121,170) | (796,670) | |||||||||
|
|
|
|
|
| |||||||
Net increase/(decrease) in shares outstanding | 23,445 | (86,603) | (337,332) | |||||||||
|
|
|
|
|
| |||||||
Class C | ||||||||||||
Sold | 56,505 | 19,157 | 64,376 | |||||||||
Redeemed | (82,810) | (55,919) | (297,678) | |||||||||
|
|
|
|
|
| |||||||
Net decrease in shares outstanding | (26,305) | (36,762) | (233,302) | |||||||||
|
|
|
|
|
| |||||||
Institutional Class | ||||||||||||
Sold | 6,224 | 445 | – | |||||||||
|
|
|
|
|
| |||||||
Net increase in shares outstanding | 6,224 | 445 | – | |||||||||
|
|
|
|
|
| |||||||
Investor Class | ||||||||||||
Sold | 165,294 | 35,715 | 13,276 | |||||||||
Redeemed | (2,972) | (2,485) | (4,161) | |||||||||
|
|
|
|
|
| |||||||
Net increase in shares outstanding | 162,322 | 33,230 | 9,115 | |||||||||
|
|
|
|
|
| |||||||
| (a) | The Fund began offering Institutional Class shares on March 16, 2012. |
| (b) | Effective March 13, 2012, the Board approved changing the fiscal year-end of the Fund from December 31 to April 30. |
See Notes to Financial Statements.
16 |
www.emeraldmutualfunds.com |
Table of Contents
| Statements of Changes in Net Assets | ||
| For the Six Months Ended October 31, 2012 (unaudited) | For the Period January 1, 2012 to April 30, 2012 (a) | Year Ended December 31, 2011 (b) | ||||||||||
OPERATIONS: | ||||||||||||
Net investment loss | $ | (553,312) | $ | (343,635) | $ | (998,270) | ||||||
Net realized gain on investments | 6,022,565 | 4,975,489 | 17,632,425 | |||||||||
Net change in unrealized appreciation/(depreciation) on investments | (13,102,842) | 17,806,862 | (18,505,164) | |||||||||
|
|
|
|
|
| |||||||
Net increase/(decrease) in net assets resulting from operations | (7,633,589) | 22,438,716 | (1,871,009) | |||||||||
|
|
|
|
|
| |||||||
SHARE TRANSACTIONS: | ||||||||||||
Class A | ||||||||||||
Proceeds from sale of shares | 3,078,694 | 1,322,264 | 6,495,536 | |||||||||
Cost of shares redeemed | (3,611,843) | (4,049,586) | (15,702,192) | |||||||||
|
|
|
|
|
| |||||||
Net decrease from share transactions | (533,149) | (2,727,322) | (9,206,656) | |||||||||
|
|
|
|
|
| |||||||
Class C | ||||||||||||
Proceeds from sale of shares | 589,883 | 160,186 | 598,742 | |||||||||
Cost of shares redeemed | (262,215) | (440,586) | (652,998) | |||||||||
|
|
|
|
|
| |||||||
Net increase/(decrease) from share transactions | 327,668 | (280,400) | (54,256) | |||||||||
|
|
|
|
|
| |||||||
Institutional Class | ||||||||||||
Proceeds from sale of shares | 5,928,892 | 6,741,602 | 14,532,788 | |||||||||
Cost of shares redeemed | (9,894,270) | (2,499,170) | (13,251,443) | |||||||||
|
|
|
|
|
| |||||||
Net increase/(decrease) from share transactions | (3,965,378) | 4,242,432 | 1,281,345 | |||||||||
|
|
|
|
|
| |||||||
Investor Class | ||||||||||||
Proceeds from sale of shares | 289,900 | 24,856 | 942,919 | |||||||||
Cost of shares redeemed | (30,000) | (6,289) | (8,611) | |||||||||
|
|
|
|
|
| |||||||
Net increase from share transactions | 259,900 | 18,567 | 934,308 | |||||||||
|
|
|
|
|
| |||||||
Net increase/(decrease) in net assets | $ | (11,544,548) | $ | 23,691,993 | $ | (8,916,268) | ||||||
|
|
|
|
|
| |||||||
NET ASSETS: | ||||||||||||
Beginning of period | 129,251,618 | 105,559,625 | 114,475,893 | |||||||||
|
|
|
|
|
| |||||||
End of period (including accumulated net investment loss of $(553,312), $0 and $0, respectively) | $ | 117,707,070 | $ | 129,251,618 | $ | 105,559,625 | ||||||
|
|
|
|
|
| |||||||
Other Information: | ||||||||||||
SHARE TRANSACTIONS: | ||||||||||||
Class A | ||||||||||||
Sold | 209,373 | 86,928 | 459,368 | |||||||||
Redeemed | (237,462) | (263,330) | (1,139,141) | |||||||||
|
|
|
|
|
| |||||||
Net decrease in shares outstanding | (28,089) | (176,402) | (679,773) | |||||||||
|
|
|
|
|
| |||||||
Class C | ||||||||||||
Sold | 41,999 | 10,962 | 48,633 | |||||||||
Redeemed | (18,900) | (30,490) | (49,356) | |||||||||
|
|
|
|
|
| |||||||
Net increase/(decrease) in shares outstanding | 23,099 | (19,528) | (723) | |||||||||
|
|
|
|
|
| |||||||
Institutional Class | ||||||||||||
Sold | 380,946 | 428,209 | 1,000,591 | |||||||||
Redeemed | (656,791) | (160,803) | (938,781) | |||||||||
|
|
|
|
|
| |||||||
Net increase/(decrease) in shares outstanding | (275,845) | 267,406 | 61,810 | |||||||||
|
|
|
|
|
| |||||||
Investor Class | ||||||||||||
Sold | 19,522 | 1,619 | 66,493 | |||||||||
Redeemed | (2,010) | (400) | (636) | |||||||||
|
|
|
|
|
| |||||||
Net increase in shares outstanding | 17,512 | 1,219 | 65,857 | |||||||||
|
|
|
|
|
| |||||||
| (a) | Effective March 13, 2012, the Board approved changing the fiscal year-end of the Fund from December 31 to April 30. |
| (b) | The Fund began offering Investor Class shares on May 2, 2011. |
See Notes to Financial Statements.
Semi-Annual Report | October 31, 2012 |
17 |
Table of Contents
| Financial Highlights | ||
For a share outstanding throughout the periods presented. | ||
| CLASS A | ||||||||||||||||||||||||||||
For the Six Months October 31, (unaudited) | For the Period 2012 to April 30, 2012 (a)(b) | Year Ended December 31, 2011 | Year Ended December 31, 2010 | Year Ended December 31, 2009 | Year Ended December 31, 2008 (c) | Year Ended December 31, 2007 | ||||||||||||||||||||||
NET ASSET VALUE, BEGINNING OF PERIOD | $ | 16.96 | $ | 15.16 | $ | 15.89 | $ | 13.62 | $ | 15.39 | $ | 19.61 | $ | 28.81 | ||||||||||||||
INCOME/(LOSS) FROM OPERATIONS:(d) | ||||||||||||||||||||||||||||
Net investment income/(loss) | 0.00 | (e)(f) | (0.01) | (e) | (0.03) | (e) | (0.04) | 0.02 | (e) | 0.08 | (0.05) | |||||||||||||||||
Net realized and unrealized gain/(loss) on investments | 1.21 | 1.81 | (0.70) | 2.31 | (1.76) | (4.28) | (5.86) | |||||||||||||||||||||
|
|
|
|
|
|
|
|
|
|
|
|
|
| |||||||||||||||
Total from Investment Operations | 1.21 | 1.80 | (0.73) | 2.27 | (1.74) | (4.20) | (5.91) | |||||||||||||||||||||
|
|
|
|
|
|
|
|
|
|
|
|
|
| |||||||||||||||
LESS DISTRIBUTIONS: | ||||||||||||||||||||||||||||
From investment income | – | – | – | – | (0.03) | (0.02) | – | |||||||||||||||||||||
From capital gains | – | – | – | – | – | – | (3.30) | |||||||||||||||||||||
|
|
|
|
|
|
|
|
|
|
|
|
|
| |||||||||||||||
Total Distributions | – | – | – | – | (0.03) | (0.02) | (3.30) | |||||||||||||||||||||
|
|
|
|
|
|
|
|
|
|
|
|
|
| |||||||||||||||
REDEMPTION FEES ADDED TO PAID-IN CAPITAL | – | – | – | – | – | – | 0.01 | |||||||||||||||||||||
|
|
|
|
|
|
|
|
|
|
|
|
|
| |||||||||||||||
NET INCREASE/(DECREASE) IN NET ASSET VALUE | 1.21 | 1.80 | (0.73) | 2.27 | (1.77) | (4.22) | (9.20) | |||||||||||||||||||||
|
|
|
|
|
|
|
|
|
|
|
|
|
| |||||||||||||||
NET ASSET VALUE, END OF PERIOD | $ | 18.17 | $ | 16.96 | $ | 15.16 | $ | 15.89 | $ | 13.62 | $ | 15.39 | $ | 19.61 | ||||||||||||||
|
|
|
|
|
|
|
|
|
|
|
|
|
| |||||||||||||||
TOTAL RETURN(g) | 7.13 | %(h) | 11.87 | %(h) | (4.59) | % | 16.67 | % | (11.29) | % | (21.41) | % | (20.92) | % | ||||||||||||||
RATIOS/SUPPLEMENTAL DATA: | ||||||||||||||||||||||||||||
Net Assets, End of Period (000s) | $ | 23,313 | $ | 21,363 | $ | 20,412 | $ | 26,756 | $ | 22,675 | $ | 48,460 | $ | 64,560 | ||||||||||||||
RATIOS TO AVERAGE NET ASSETS: | ||||||||||||||||||||||||||||
Net Investment income/(loss) | 0.05 | %(i) | (0.24) | %(i) | (0.22) | % | (0.22) | % | 0 .15 | % | 0 .36 | % | (0.14) | % | ||||||||||||||
Operating expenses excluding reimbursement/waiver | 1.91 | %(i) | 1.96 | %(i) | 1.90 | % | 1.95 | % | 1.88 | % | 1.65 | % | 1.69 | % | ||||||||||||||
Operating expenses including reimbursement/waiver | 1.84 | %(i) | 1.85 | %(i) | n/a | n/a | n/a | n/a | n/a | |||||||||||||||||||
PORTFOLIO TURNOVER RATE | 21 | %(h) | 9 | %(h) | 27 | % | 48 | % | 43 | % | 61 | % | 29 | % | ||||||||||||||
| (a) | Prior to March 16, 2012, the Emerald Banking and Finance Fund was known as the Forward Banking and Finance Fund. |
| (b) | Effective March 13, 2012 the Board approved changing the fiscal year-end of the Fund from December 31 to April 30. |
| (c) | Prior to May 1, 2008, the Forward Banking and Finance Fund was known as the Forward Emerald Banking and Finance Fund. |
| (d) | The amount shown for a share outstanding throughout the period may not correlate with the Statement of Operations for the period due to the timing of sales and redemptions of Fund shares in relation to income earned and/or fluctuating market value of the investments of the Fund. |
| (e) | Per share amounts are based upon average shares outstanding. |
| (f) | Less than $0.005 per share. |
| (g) | Total return does not reflect the effect of sales charges. |
| (h) | Not Annualized. |
| (i) | Annualized. |
See Notes to Financial Statements.
18 |
www.emeraldmutualfunds.com |
Table of Contents
| Emerald Banking and Finance Fund | Financial Highlights | |
For a share outstanding throughout the periods presented. |
| CLASS C | ||||||||||||||||||||||||||||
| For the Six Months Ended October 31, 2012 (unaudited) | For the Period | Year Ended 31, 2011 | Year Ended 31, 2010 | Year Ended 31, 2009 | Year Ended 31, 2008 (c) | Year Ended 31, 2007 | ||||||||||||||||||||||
NET ASSET VALUE, BEGINNING OF PERIOD | $ | 15.70 | $ | 14.06 | $ | 14.82 | $ | 12.77 | $ | 14.52 | $ | 18.60 | $ | 27.71 | ||||||||||||||
INCOME/(LOSS) FROM OPERATIONS:(d) | ||||||||||||||||||||||||||||
Net investment loss | (0.05) | (e) | (0.04) | (e) | (0.11) | (e) | (0.18) | (0.19) | (0.19) | (0.29) | ||||||||||||||||||
Net realized and unrealized gain/(loss) on investments | 1.11 | 1.68 | (0.65) | 2.23 | (1.56) | (3.89) | (5.53) | |||||||||||||||||||||
|
|
|
|
|
|
|
|
|
|
|
|
|
| |||||||||||||||
Total from Investment Operations | 1.06 | 1.64 | (0.76) | 2.05 | (1.75) | (4.08) | (5.82) | |||||||||||||||||||||
|
|
|
|
|
|
|
|
|
|
|
|
|
| |||||||||||||||
LESS DISTRIBUTIONS: | ||||||||||||||||||||||||||||
From capital gains | – | – | – | – | – | – | (3.30) | |||||||||||||||||||||
|
|
|
|
|
|
|
|
|
|
|
|
|
| |||||||||||||||
Total Distributions | – | – | – | – | – | – | (3.30) | |||||||||||||||||||||
|
|
|
|
|
|
|
|
|
|
|
|
|
| |||||||||||||||
REDEMPTION FEES ADDED TO PAID-IN CAPITAL | – | – | – | – | – | – | 0.01 | |||||||||||||||||||||
|
|
|
|
|
|
|
|
|
|
|
|
|
| |||||||||||||||
NET INCREASE/(DECREASE) IN NET ASSET VALUE | 1.06 | 1.64 | (0.76) | 2.05 | (1.75) | (4.08) | (9.11) | |||||||||||||||||||||
|
|
|
|
|
|
|
|
|
|
|
|
|
| |||||||||||||||
NET ASSET VALUE, END OF PERIOD | $ | 16.76 | $ | 15.70 | $ | 14.06 | $ | 14.82 | $ | 12.77 | $ | 14.52 | $ | 18.60 | ||||||||||||||
|
|
|
|
|
|
|
|
|
|
|
|
|
| |||||||||||||||
TOTAL RETURN(f) | 6.75% | (g) | 11.66% | (g) | (5.13)% | 16 .05% | (12.05)% | (21.94)% | (21.43)% | |||||||||||||||||||
RATIOS/SUPPLEMENTAL DATA: | ||||||||||||||||||||||||||||
Net Assets, End of Period (000s) | $ | 15,244 | $ | 14,690 | $ | 13,675 | $ | 17,872 | $ | 16,907 | $ | 23,486 | $ | 41,441 | ||||||||||||||
RATIOS TO AVERAGE NET ASSETS: | ||||||||||||||||||||||||||||
Net Investment loss | (0.60)% | (h) | (0.82)% | (h) | (0.77)% | (0.77)% | (0.47)% | (0.30)% | (0.79)% | |||||||||||||||||||
Operating expenses excluding reimbursement/waiver | 2.56% | (h) | 2.55% | (h) | 2.45% | 2.50% | 2.49% | 2.30% | 2.34% | |||||||||||||||||||
Operating expenses including reimbursement/waiver | 2.49% | (h) | 2.44% | (h) | n/a | n/a | n/a | n/a | n/a | |||||||||||||||||||
PORTFOLIO TURNOVER RATE | 21 % | (g) | 9% | (g) | 27% | 48% | 43 % | 61% | 29% | |||||||||||||||||||
| (a) | Prior to March 16, 2012, the Emerald Banking and Finance Fund was known as the Forward Banking and Finance Fund. |
| (b) | Effective March 13, 2012 the Board approved changing the fiscal year-end of the Fund from December 31 to April 30. |
| (c) | Prior to May 1, 2008, the Forward Banking and Finance Fund was known as the Forward Emerald Banking and Finance Fund. |
| (d) | The amount shown for a share outstanding throughout the period may not correlate with the Statement of Operations for the period due to the timing of sales and redemptions of Fund shares in relation to income earned and/or fluctuating market value of the investments of the Fund. |
| (e) | Per share amounts are based upon average shares outstanding. |
| (f) | Total return does not reflect the effect of sales charges. |
| (g) | Not Annualized. |
| (h) | Annualized. |
See Notes to Financial Statements.
Semi-Annual Report | October 31, 2012 |
19 |
Table of Contents
Emerald Banking and Finance Fund | Financial Highlights | |
For a share outstanding throughout the periods presented. | ||
| INSTITUTIONAL CLASS | ||||||||
| For the Six Months Ended October 31, 2012 (unaudited) | For the Period March 16, 2012 to April 30, 2012 (a) | |||||||
NET ASSET VALUE, BEGINNING OF PERIOD | $ | 16.96 | $ | 16.85 | ||||
INCOME/(LOSS) FROM OPERATIONS: | ||||||||
Net investment income/(loss)(b) | 0.03 | (0.01) | ||||||
Net realized and unrealized gain on investments | 1.21 | 0.12 | ||||||
|
|
|
| |||||
Total from Investment Operations | 1.24 | 0.11 | ||||||
|
|
|
| |||||
NET INCREASE IN NET ASSET VALUE | 1.24 | 0.11 | ||||||
|
|
|
| |||||
NET ASSET VALUE, END OF PERIOD | $ | 18.20 | $ | 16.96 | ||||
|
|
|
| |||||
TOTAL RETURN | 7.31% | (c) | 0.65% | (c) | ||||
RATIOS/SUPPLEMENTAL DATA: | ||||||||
Net Assets, End of Period (000s) | $ | 121 | $ | 8 | ||||
RATIOS TO AVERAGE NET ASSETS: | ||||||||
Net Investment income/(loss) | 0.35% | (d) | (0.27)% | (d) | ||||
Operating expenses excluding reimbursement/waiver | 1.61% | (d) | 1.83% | (d) | ||||
Operating expenses including reimbursement/waiver | 1.54% | (d) | 1.53% | (d) | ||||
PORTFOLIO TURNOVER RATE | 21% | (c) | 9% | (c)(e) | ||||
| (a) | The Fund began offering Institutional Class shares on March 16, 2012. |
| (b) | Per share amounts are based upon average shares outstanding. |
| (c) | Not Annualized. |
| (d) | Annualized. |
| (e) | Portfolio turnover rate is calculated at the Fund level and represents the period ended April 30, 2012. |
See Notes to Financial Statements.
20 |
www.emeraldmutualfunds.com |
Table of Contents
| Emerald Banking and Finance Fund | Financial Highlights | |
For a share outstanding throughout the periods presented. |
| INVESTOR CLASS | ||||||||||||||||
| For the Six Months Ended October 31, 2012 (unaudited) | For the Period January 1, 2012 to April 30, 2012 (a)(b) | Year Ended December 31, 2011 | Period Ended 2010 (c) | |||||||||||||
NET ASSET VALUE, BEGINNING OF PERIOD | $ | 16.25 | $ | 14.50 | $ | 15.14 | $ | 14.85 | ||||||||
INCOME/(LOSS) FROM OPERATIONS:(d) | ||||||||||||||||
Net investment income/(loss)(e) | 0.00 | (f) | (0.00) | (f) | 0.07 | (0.02) | ||||||||||
Net realized and unrealized gain/(loss) on investments | 1.16 | 1.75 | (0.71) | 0.31 | ||||||||||||
|
|
|
|
|
|
|
| |||||||||
Total from Investment Operations | 1.16 | 1.75 | (0.64) | 0.29 | ||||||||||||
|
|
|
|
|
|
|
| |||||||||
NET INCREASE/(DECREASE) IN NET ASSET VALUE | 1.16 | 1.75 | (0.64) | 0.29 | ||||||||||||
|
|
|
|
|
|
|
| |||||||||
NET ASSET VALUE, END OF PERIOD | $ | 17.41 | $ | 16.25 | $ | 14.50 | $ | 15.14 | ||||||||
|
|
|
|
|
|
|
| |||||||||
TOTAL RETURN | 7.14% | (g) | 12.07% | (g) | (4.23)% | 1.95% | (g) | |||||||||
RATIOS/SUPPLEMENTAL DATA: | ||||||||||||||||
Net Assets, End of Period (000s) | $ | 3,567 | $ | 693 | $ | 136 | $ | 4 | ||||||||
RATIOS TO AVERAGE NET ASSETS: | ||||||||||||||||
Net Investment income/(loss) | 0.04% | (h) | (0.07)% | (h) | 0.47% | (0.20)% | (h) | |||||||||
Operating expenses excluding reimbursement/waiver | 1.96% | (h) | 1.88% | (h) | 1.48% | 1.83% | ||||||||||
Operating expenses including reimbursement/waiver | 1.89% | (h) | 1.72% | (h) | n/a | n/a | (h) | |||||||||
PORTFOLIO TURNOVER RATE | 21% | (g) | 9% | (g) | 27% | 48% | (i) | |||||||||
| (a) | Prior to March 16, 2012, the Emerald Banking and Finance Fund was known as the Forward Banking and Finance Fund. |
| (b) | Effective March 13, 2012 the Board approved changing the fiscal year-end of the Fund from December 31 to April 30. |
| (c) | The Fund began offering Investor Class shares on March 16, 2010. |
| (d) | The amount shown for a share outstanding throughout the period may not correlate with the Statement of Operations for the period due to the timing of sales and redemptions of Fund shares in relation to income earned and/or fluctuating market value of the investments of the Fund. |
| (e) | Per share amounts are based upon average shares outstanding. |
| (f) | Less than $0.005 per share and $(0.005) per share. |
| (g) | Not Annualized. |
| (h) | Annualized. |
| (i) | Portfolio turnover rate is calculated at the Fund level and represents the year ended December 31, 2010. |
See Notes to Financial Statements.
Semi-Annual Report | October 31, 2012 |
21 |
Table of Contents
| Financial Highlights | ||
For a share outstanding throughout the periods presented. | ||
| CLASS A | ||||||||||||||||||||||||||||
| For the Six Months Ended October 31, 2012 (unaudited) | For the Period April 30, 2012 (a)(b) | Year Ended 31, 2011 | Year Ended 31, 2010 | Year Ended 31, 2009 | Year Ended 31, 2008 (c) | Year Ended 31, 2007 | ||||||||||||||||||||||
NET ASSET VALUE, BEGINNING OF PERIOD | $ | 16.20 | $ | 13.37 | $ | 13.57 | $ | 10.63 | $ | 7.99 | $ | 12.73 | $ | 13.90 | ||||||||||||||
INCOME/(LOSS) FROM OPERATIONS: | ||||||||||||||||||||||||||||
Net investment loss | (0.08 | )(d) | (0.05 | )(d) | (0.14 | )(d) | (0.12 | ) | (0.11 | ) | (0.11 | ) | (0.13 | ) | ||||||||||||||
Net realized and unrealized gain/(loss) on investments | (0.87 | ) | 2.88 | (0.06 | ) | 3.06 | 2.75 | (4.59 | ) | 0.44 | ||||||||||||||||||
|
|
|
|
|
|
|
|
|
|
|
|
|
| |||||||||||||||
Total from Investment Operations | (0.95 | ) | 2.83 | (0.20 | ) | 2.94 | 2.64 | (4.70 | ) | 0.31 | ||||||||||||||||||
|
|
|
|
|
|
|
|
|
|
|
|
|
| |||||||||||||||
LESS DISTRIBUTIONS: | ||||||||||||||||||||||||||||
From capital gains | – | – | – | – | – | (0.04 | ) | (1.48 | ) | |||||||||||||||||||
|
|
|
|
|
|
|
|
|
|
|
|
|
| |||||||||||||||
Total Distributions | – | – | – | – | – | (0.04 | ) | (1.48 | ) | |||||||||||||||||||
|
|
|
|
|
|
|
|
|
|
|
|
|
| |||||||||||||||
REDEMPTION FEES ADDED TO PAID-IN CAPITAL | – | – | – | – | – | – | 0.00 | (e) | ||||||||||||||||||||
|
|
|
|
|
|
|
|
|
|
|
|
|
| |||||||||||||||
NET INCREASE/(DECREASE) IN NET ASSET VALUE | (0.95 | ) | 2.83 | (0.20 | ) | 2.94 | 2.64 | (4.74 | ) | (1.17 | ) | |||||||||||||||||
|
|
|
|
|
|
|
|
|
|
|
|
|
| |||||||||||||||
NET ASSET VALUE, END OF PERIOD | $ | 15.25 | $ | 16.20 | $ | 13.37 | $ | 13.57 | $ | 10.63 | $ | 7.99 | $ | 12.73 | ||||||||||||||
|
|
|
|
|
|
|
|
|
|
|
|
|
| |||||||||||||||
TOTAL RETURN(f) | (5.86 | )%(g) | 21.17 | %(g) | (1.47 | )% | 27.66 | % | 33.04 | % | (36.91 | )% | 1 .97 | % | ||||||||||||||
RATIOS/SUPPLEMENTAL DATA: | ||||||||||||||||||||||||||||
Net Assets, End of Period (000s) | $ | 39,108 | $ | 41,991 | $ | 37,008 | $ | 46,785 | $ | 51,177 | $ | 92,675 | $ | 174,019 | ||||||||||||||
RATIOS TO AVERAGE NET ASSETS: | ||||||||||||||||||||||||||||
Net Investment loss | (1.10 | )%(h) | (1.02 | )%(h) | (1.03 | )% | (0.85 | )% | (1.03 | )% | (0.95 | )% | (0 .96 | )% | ||||||||||||||
Operating expenses excluding reimbursement/waiver | 1.40 | %(h) | 1.36 | %(h) | 1.36 | % | 1.41 | % | 1.38 | % | 1.35 | % | 1.36 | % | ||||||||||||||
Operating expenses including reimbursement/waiver | 1.29 | %(h) | 1.29 | %(h) | 1.29 | % | 1.29 | % | 1.29 | %(i) | n/a | n/a | ||||||||||||||||
PORTFOLIO TURNOVER RATE | 43 | %(g) | 28 | %(g) | 75 | % | 78 | % | 113 | % | 108 | % | 76 | % | ||||||||||||||
| (a) | Prior to March 16, 2012, the Emerald Growth Fund was known as the Forward Growth Fund. |
| (b) | Effective March 13, 2012 the Board approved changing the fiscal year-end of the Fund from December 31 to April 30. |
| (c) | Prior to May 1, 2008, the Forward Growth Fund was known as the Forward Emerald Growth Fund. |
| (d) | Per share amounts are based upon average shares outstanding. |
| (e) | Less than $0.005 per share. |
| (f) | Total return does not reflect the effect of sales charges. |
| (g) | Not Annualized. |
| (h) | Annualized. |
| (i) | Effective January 1, 2009, the Advisor agreed to limit expenses at 1.29%. |
| 22 | www.emeraldmutualfunds.com |
Table of Contents
Emerald Growth Fund | Financial Highlights | |
For a share outstanding throughout the periods presented. |
| CLASS C | ||||||||||||||||||||||||||||
| For the Six Months Ended October 31, 2012 (unaudited) | For the Period January 1, 2012 to April 30, 2012 (a)(b) | Year Ended 31, 2011 | Year Ended 31, 2010 | Year Ended 31, 2009 | Year Ended 31, 2008 (c) | Year Ended 31, 2007 | ||||||||||||||||||||||
NET ASSET VALUE, BEGINNING OF PERIOD | $ | 14.89 | $ | 12.31 | $ | 12.58 | $ | 9.92 | $ | 7.49 | $ | 12.03 | $ | 13.30 | ||||||||||||||
INCOME/(LOSS) FROM OPERATIONS: | ||||||||||||||||||||||||||||
Net investment loss | (0.12 | )(d) | (0.08 | )(d) | (0.22 | )(d) | (0.03 | ) | (0.36 | ) | (0.48 | ) | (0.23 | ) | ||||||||||||||
Net realized and unrealized gain/(loss) on investments | (0.80 | ) | 2.66 | (0.05 | ) | 2.69 | 2.79 | (4.02 | ) | 0.44 | ||||||||||||||||||
|
|
|
|
|
|
|
|
|
|
|
|
|
| |||||||||||||||
Total from Investment Operations | (0.92 | ) | 2.58 | (0.27 | ) | 2.66 | 2.43 | (4.50 | ) | 0.21 | ||||||||||||||||||
|
|
|
|
|
|
|
|
|
|
|
|
|
| |||||||||||||||
LESS DISTRIBUTIONS: | ||||||||||||||||||||||||||||
From capital gains | – | – | – | – | – | (0.04 | ) | (1.48 | ) | |||||||||||||||||||
|
|
|
|
|
|
|
|
|
|
|
|
|
| |||||||||||||||
Total Distributions | – | – | – | – | – | (0.04 | ) | (1.48 | ) | |||||||||||||||||||
|
|
|
|
|
|
|
|
|
|
|
|
|
| |||||||||||||||
REDEMPTION FEES ADDED TO PAID-IN CAPITAL | – | – | – | – | – | – | 0.00 | (e) | ||||||||||||||||||||
|
|
|
|
|
|
|
|
|
|
|
|
|
| |||||||||||||||
NET INCREASE/(DECREASE) IN NET ASSET VALUE | (0.92 | ) | 2.58 | (0.27 | ) | 2.66 | 2.43 | (4.54 | ) | (1.27 | ) | |||||||||||||||||
|
|
|
|
|
|
|
|
|
|
|
|
|
| |||||||||||||||
NET ASSET VALUE, END OF PERIOD | $ | 13.97 | $ | 14.89 | $ | 12.31 | $ | 12.58 | $ | 9.92 | $ | 7.49 | $ | 12.03 | ||||||||||||||
|
|
|
|
|
|
|
|
|
|
|
|
|
| |||||||||||||||
TOTAL RETURN(f) | (6.18 | )%(g) | 20.96 | %(g) | (2.15 | )% | 26.81 | % | 32.44 | % | (37.40 | )% | 1.31 | % | ||||||||||||||
RATIOS/SUPPLEMENTAL DATA: | ||||||||||||||||||||||||||||
Net Assets, End of Period (000s) | $ | 3,163 | $ | 3,026 | $ | 2,743 | $ | 2,812 | $ | 2,555 | $ | 2,623 | $ | 8,593 | ||||||||||||||
RATIOS TO AVERAGE NET ASSETS: | ||||||||||||||||||||||||||||
Net Investment loss | (1.74 | )%(h) | (1.67 | )%(h) | (1.68 | )% | (1.48 | )% | (1.68 | )% | (1.65 | )% | (1.61 | )% | ||||||||||||||
Operating expenses excluding reimbursement/waiver | 2.05 | %(h) | 2.01 | %(h) | 2.01 | % | 2.06 | % | 2.04 | % | 2.04 | % | 2.01 | % | ||||||||||||||
Operating expenses including reimbursement/waiver | 1.94 | %(h) | 1.94 | %(h) | 1.94 | % | 1.94 | % | 1.94 | %(i) | n/a | n/a | ||||||||||||||||
PORTFOLIO TURNOVER RATE | 43 | %(g) | 28 | %(g) | 75 | % | 78 | % | 113 | % | 108 | % | 76 | % | ||||||||||||||
| (a) | Prior to March 16, 2012, the Emerald Growth Fund was known as the Forward Growth Fund. |
| (b) | Effective March 13, 2012 the Board approved changing the fiscal year-end of the Fund from December 31 to April 30. |
| (c) | Prior to May 1, 2008, the Forward Growth Fund was known as the Forward Emerald Growth Fund. |
| (d) | Per share amounts are based upon average shares outstanding. |
| (e) | Less than $0.005 per share. |
| (f) | Total return does not reflect the effect of sales charges. |
| (g) | Not Annualized. |
| (h) | Annualized. |
| (i) | Effective January 1, 2009, the Advisor agreed to limit expenses at 1.94%. |
See Notes to Financial Statements.
Semi-Annual Report | October 31, 2012 |
23 |
Table of Contents
Emerald Growth Fund | Financial Highlights | |
For a share outstanding throughout the periods presented | ||
| INSTITUTIONAL CLASS | ||||||||||||||||||||||||
| For the Six Months Ended October 31, 2012 (unaudited) | For the Period January 1, 2012 to April 30, 2012 (a)(b) | Year Ended December 31, 2011 | Year Ended December 31, 2010 | Year Ended December 31, 2009 | Period Ended December 31, 2008 (c)(d) | |||||||||||||||||||
NET ASSET VALUE, BEGINNING OF PERIOD | $ | 16.39 | $ | 13.51 | $ | 13.67 | $ | 10.68 | $ | 8.00 | $ | 9.03 | ||||||||||||
INCOME/(LOSS) FROM OPERATIONS: | ||||||||||||||||||||||||
Net investment loss | (0.06 | )(e) | (0.04 | )(e) | (0.10 | )(e) | (0.06 | ) | (0.17 | ) | (0.01 | ) | ||||||||||||
Net realized and unrealized gain/(loss) on investments | (0.88 | ) | 2.92 | (0.06 | ) | 3.05 | 2.85 | (0.98 | ) | |||||||||||||||
|
|
|
|
|
|
|
|
|
|
|
| |||||||||||||
Total from Investment Operations | (0.94 | ) | 2.88 | (0.16 | ) | 2.99 | 2.68 | (0.99 | ) | |||||||||||||||
|
|
|
|
|
|
|
|
|
|
|
| |||||||||||||
LESS DISTRIBUTIONS: | ||||||||||||||||||||||||
From capital gains | – | – | – | – | – | (0.04 | ) | |||||||||||||||||
|
|
|
|
|
|
|
|
|
|
|
| |||||||||||||
Total Distributions | – | – | – | – | – | (0.04 | ) | |||||||||||||||||
|
|
|
|
|
|
|
|
|
|
|
| |||||||||||||
NET INCREASE/(DECREASE) IN NET ASSET VALUE | (0.94 | ) | 2.88 | (0.16 | ) | 2.99 | 2.68 | (1.03 | ) | |||||||||||||||
|
|
|
|
|
|
|
|
|
|
|
| |||||||||||||
NET ASSET VALUE, END OF PERIOD | $ | 15.45 | $ | 16.39 | $ | 13.51 | $ | 13.67 | $ | 10.68 | $ | 8.00 | ||||||||||||
|
|
|
|
|
|
|
|
|
|
|
| |||||||||||||
TOTAL RETURN | (5.73 | )%(f) | 21.32 | %(f) | (1.17 | )% | 28.00 | % | 33.50 | % | (10.95 | )%(f) | ||||||||||||
RATIOS/SUPPLEMENTAL DATA: | ||||||||||||||||||||||||
Net Assets, End of Period (000s) | $ | 74,148 | $ | 83,149 | $ | 64,930 | $ | 64,880 | $ | 47,091 | $ | 908 | ||||||||||||
RATIOS TO AVERAGE NET ASSETS: | ||||||||||||||||||||||||
Net Investment loss | (0.80 | )%(g) | (0.72 | )%(g) | (0.72 | )% | (0.52 | )% | (0.73 | )% | (0.45 | )%(g) | ||||||||||||
Operating expenses excluding reimbursement/waiver | 1.10 | %(g) | 1.06 | %(g) | 1.06 | % | 1.11 | % | 1.08 | % | 1.08 | %(g) | ||||||||||||
Operating expenses including reimbursement/waiver | 0.99 | %(g) | 0.99 | %(g) | 0.99 | % | 0.99 | % | 0.99 | %(h) | n/a | |||||||||||||
PORTFOLIO TURNOVER RATE | 43 | %(f) | 28 | %(f) | 75 | % | 78 | % | 113 | % | 108 | %(i) | ||||||||||||
| (a) | Prior to March 16, 2012, the Emerald Growth Fund was known as the Forward Growth Fund. |
| (b) | Effective March 13, 2012 the Board approved changing the fiscal year-end of the Fund from December 31 to April 30. |
| (c) | The Fund began offering Institutional Class shares on October 21, 2008. |
| (d) | Prior to May 1, 2008, the Forward Growth Fund was known as the Forward Emerald Growth Fund. |
| (e) | Per share amounts are based upon average shares outstanding. |
| (f) | Not Annualized. |
| (g) | Annualized. |
| (h) | Effective January 1, 2009, the Advisor agreed to limit expenses at 0.99%. |
| (i) | Portfolio turnover rate is calculated at the Fund level and represents the year ended December 31, 2008. |
See Notes to Financial Statements.
24 |
www.emeraldmutualfunds.com |
Table of Contents
Emerald Growth Fund | Financial Highlights | |
For a share outstanding throughout the periods presented. | ||
| INVESTOR CLASS | ||||||||||||
| For the Six Months Ended October 31, 2012 (unaudited) | For the Period January 1, 2012 to April 30, 2012 (a)(b) | Period Ended December 31, 2011 (c) | ||||||||||
NET ASSET VALUE, BEGINNING OF PERIOD | $ | 16.18 | $ | 13.35 | $ | 15.74 | ||||||
INCOME/(LOSS) FROM OPERATIONS: | ||||||||||||
Net investment loss(d) | (0.09) | (0.05) | (0.09) | |||||||||
Net realized and unrealized gain/(loss) on investments | (0.86) | 2.88 | (2.30) | |||||||||
|
|
|
|
|
| |||||||
Total from Investment Operations | (0.95) | 2.83 | (2.39) | |||||||||
|
|
|
|
|
| |||||||
NET INCREASE/(DECREASE) IN NET ASSET VALUE | (0.95) | 2.83 | (2.39) | |||||||||
|
|
|
|
|
| |||||||
NET ASSET VALUE, END OF PERIOD | $ | 15.23 | $ | 16.18 | $ | 13.35 | ||||||
|
|
|
|
|
| |||||||
TOTAL RETURN | (5.87)% | (e) | 21.20% | (e) | (15.18)% | (e) | ||||||
RATIOS/SUPPLEMENTAL DATA: | ||||||||||||
Net Assets, End of Period (000s) | $ | 1,288 | $ | 1,085 | $ | 879 | ||||||
RATIOS TO AVERAGE NET ASSETS: | ||||||||||||
Net Investment loss | (1.14)% | (f) | (1.07)% | (f) | (1.00)% | (f) | ||||||
Operating expenses excluding reimbursement/waiver | 1.45% | (f) | 1.41% | (f) | 1.43% | (f) | ||||||
Operating expenses including reimbursement/waiver | 1.34% | (f) | 1.34% | (f) | 1.34% | (f) | ||||||
PORTFOLIO TURNOVER RATE | 43% | (e) | 28% | (e) | 75% | (g) | ||||||
| (a) | Prior to March 16, 2012, the Emerald Growth Fund was known as the Forward Growth Fund. |
| (b) | Effective March 13, 2012 the Board approved changing the fiscal year-end of the Fund from December 31 to April 30. |
| (c) | The Fund began offering Investor Class shares on May 2, 2011. |
| (d) | Per share amounts are based upon average shares outstanding. |
| (e) | Not Annualized. |
| (f) | Annualized. |
| (g) | Portfolio turnover is calculated at the Fund level and represents the year ended December 31, 2011. |
See Notes to Financial Statements.
Semi-Annual Report | October 31, 2012 |
25 |
Table of Contents
Emerald Funds | Notes to Financial Statements | |
October 31, 2012 (Unaudited) |
1. ORGANIZATION
Financial Investors Trust (the “Trust”), Delaware statutory trust, is an open-end management investment company registered under the Investment Company Act of 1940, as amended (the “1940 Act”). As of October 31, 2012, the Trust had 24 registered funds. This semi-annual report describes the Emerald Banking and Finance Fund and Emerald Growth Fund (each a “Fund” and collectively, the “Funds”).
The Emerald Banking and Finance Fund seeks to achieve long term growth through capital appreciation with income as a secondary objective and invest primarily in equity securities of companies principally engaged in the banking or financial services industries.
The Emerald Growth Fund seeks to achieve long-term growth through capital appreciation and invests in equity securities, including common stocks, preferred stocks, and securities convertible into common or preferred stocks.
2. SIGNIFICANT ACCOUNTING POLICIES
The following is a summary of significant accounting policies consistently followed by the Funds. These policies are in conformity with U.S. generally accepted accounting principles (“GAAP”).
The preparation of financial statements in accordance with GAAP requires management to make certain estimates and assumptions that affect the reported amounts in the financial statements during the reporting period. Management believes these the estimates and security valuations are appropriate; however, actual results may differ from those estimates, and the security valuations reflected in the financial statements may differ from the value the Funds ultimately realize upon sale of the securities.
Investment Valuation: The Funds generally value their securities based on market prices determined at the close of regular trading on the New York Stock Exchange (“NYSE”), normally, 4:00 p.m. Eastern time, on each business day the NYSE is open for trading.
For equity securities and mutual funds that are traded on an exchange, the market price is usually the closing sale or official closing price on that exchange. In the case of equity securities not traded on an exchange, or if such closing prices are not otherwise available, the securities are valued at the mean of the most recent bid and ask prices on such day.
The market price for debt obligations is generally the price supplied by an independent third-party pricing service approved by the Board of Trustees (the “Board”), which may use a matrix, formula or other objective method that takes into consideration quotations from dealers, market transactions in comparable investments, market indices and yield curves. If vendors are unable to supply a price, or if the price supplied is deemed to be unreliable, the market price may be determined using quotations received from one or more brokers–dealers that make a market in the security. Short–term debt obligations that will mature in 60 days or less are valued at amortized cost, unless it is determined that using this method would not reflect an investment’s fair value. Investments in non-exchange traded funds are fair valued at their respective net asset values.
Investment securities that are primarily traded on foreign securities exchanges are valued at the preceding closing values of such securities on their respective exchanges, except when an occurrence subsequent to the time a value was so established is likely to have changed such value. In such an event, the fair value of those securities are determined in good faith through consideration of other factors in accordance with procedures established by and under the general supervision of the Board.
The Funds may determine the fair value of investments based on information provided by pricing services and other third-party vendors, which may recommend fair value prices or adjustments with reference to other securities, indices or assets. In considering whether fair value pricing is required and in determining fair values, the Funds may, among other things, consider significant events (which may be considered to include changes in the value of U.S. securities or securities indices) that occur after the close of the relevant market and before each Fund values its securities. The Funds’ use of fair value pricing may help deter “stale price arbitrage.”
Fair Value Measurements: A three-tier hierarchy has been established to classify fair value measurements for disclosure purposes. Inputs refer broadly to the assumptions that market participants would use in pricing the asset or liability, including assumptions about risk. Inputs may be observable or unobservable. Observable inputs are inputs that reflect the assumptions market participants would use in pricing the asset or liability that are developed based on market data obtained from sources independent of the reporting entity. Unobservable inputs are inputs that reflect the reporting entity’s own assumptions about the assumptions market participants would use in pricing the asset or liability that are developed based on the best information available. Various inputs are used in determining the value of each Fund’s investments as of the reporting period end. The designated input levels are not necessarily an indication of the risk or liquidity associated with these investments. These inputs are categorized in the following hierarchy under applicable financial accounting standards:
26 |
www.emeraldmutualfunds.com |
Table of Contents
Emerald Funds | Notes to Financial Statements | |
October 31, 2012 (Unaudited) |
Level 1 – | Unadjusted quoted prices in active markets for identical investments, unrestricted assets or liabilities that the Funds have the ability to access at the measurement date; | |||
Level 2 – | Quoted prices which are not active, quoted prices for similar assets or liabilities in active markets or inputs other than quoted prices that are observable (either directly or indirectly) for substantially the full term of the asset or liability; and | |||
Level 3 – | Significant unobservable prices or inputs (including the Fund’s own assumptions in determining the fair value of investments) where there is little or no market activity for the asset or liability at the measurement date. |
The following is a summary of each input used to value the Funds as of October 31, 2012.
| Investments in Securities at Value | Level 1 - Quoted Prices | Level 2 - Other Significant Observable Inputs | Level 3 - Significant Unobservable Inputs | Total | ||||||||||||
Emerald Banking and Finance Fund | ||||||||||||||||
Common Stocks(a) | ||||||||||||||||
Asset Management & Custodian | $ | 392,150 | $ | – | $ | – | $ | 392,150 | ||||||||
Banks: Diversified | 30,144,791 | 427,492 | – | 30,572,283 | ||||||||||||
Banks: Savings, Thrift & Mortgage | 2,975,770 | – | – | 2,975,770 | ||||||||||||
Commercial Finance & Mortgage | 687,820 | – | – | 687,820 | ||||||||||||
Financial Data & Systems | 878,474 | – | – | 878,474 | ||||||||||||
Insurance: Property-Casualty | 574,639 | – | – | 574,639 | ||||||||||||
Real Estate Investment Trusts (REITs) | 5,608,198 | – | – | 5,608,198 | ||||||||||||
Short Term Investments | 574,938 | �� | – | – | 574,938 | |||||||||||
TOTAL | $ | 41,836,780 | $ | 427,492 | $ | – | $ | 42,264,272 | ||||||||
| Investments in Securities at Value | Level 1 - Quoted Prices | Level 2 - Other Significant Observable Inputs | Level 3 - Significant Unobservable Inputs | Total | ||||||||||||
Emerald Growth Fund | ||||||||||||||||
Common Stocks(a) | $ | 117,325,042 | $ | – | $ | – | $ | 117,325,042 | ||||||||
Warrants | – | 0 | – | 0 | ||||||||||||
Short Term Investments | 473,863 | – | – | 473,863 | ||||||||||||
Investments Purchased with Cash Collateral From Securities Loaned | 22,051 | – | – | 22,051 | ||||||||||||
TOTAL | $ | 117,820,956 | $ | 0 | $ | – | $ | 117,820,956 | ||||||||
(a) For detailed descriptions of sector and industry, see the accompanying Schedule of Investments.
The Funds recognize transfers between levels as of the beginning of the annual period in which the transfer occurred. During the six months ended October 31, 2012, the Banking and Finance Fund transferred a Common Stock with a market value of $601,120 from a Level 2 to Level 1 security due to the availability of a quoted price in an active market. During the six months ended October 31, 2012 the Banking and Finance Fund transferred a Common Stock with a market value of $331,706 between Level 1 and Level 2 due to the availability of a quoted price in an active market.
For the six months ended October 31, 2012, the Funds did not have transfers between significant unobservable inputs (Level 3) used in determining fair value. Therefore, a reconciliation of assets in which unobservable inputs (Level 3) were used in determining fair value is not applicable.
Investment Transactions: Investment transactions are accounted for on the date the investments are purchased or sold (trade date). Realized gains and losses from investment transactions are reported on an identified cost basis, which is the same basis the Funds use for federal income tax purposes. Interest income, which includes accretion of discounts, is accrued and recorded as earned. Dividend income is recognized on the ex-dividend date or for certain foreign securities, as soon as information is available to the Funds.
Real Estate Investment Trusts (“REITs”): The Funds may invest a portion of their assets in REITs and are subject to certain risks associated with direct investment in REITs. REITs may be affected by changes in the value of their underlying properties and by defaults by borrowers or tenants. REITs depend generally on their ability to generate cash flow to make distributions to shareowners, and certain REITs have self-liquidation provisions by which mortgages held may be paid in full and distributions of capital returns may be made at any time. In addition, the performance
Semi-Annual Report | October 31, 2012 |
27 |
Table of Contents
Emerald Funds | Notes to Financial Statements | |
October 31, 2012 (Unaudited) |
of a REIT may be affected by its failure to qualify for tax-free pass-through of income under the Internal Revenue Code of 1986, as amended (the “Code”), or its failure to maintain exemption from registration under the Investment Company Act of 1940, as amended (the “1940 Act”).
Lending of Portfolio Securities: Prior to March 16, 2012, each Fund from time to time had lent portfolio securities to broker-dealers, banks or institutional borrowers of securities. The loans were secured by collateral in the form of cash that was equal to at least 102% of the fair value of the securities loaned plus accrued interest, if any. Upon lending its securities to third parties, a Fund receives compensation in the form of income on the investment of the cash collateral. Gain or loss in the fair value of the securities loaned that may occur during the term of the loan will be for the account of the Fund. The Fund has the right under the lending agreement to recover the securities from the borrower on demand, and loans are subject to termination by the lending Fund or the borrower at any time. While the lending Fund does not have the right to vote securities on loan, it intends, to the extent practicable, to terminate the loan and regain the right to vote if the matter to be voted upon is considered significant with respect to the investment. Additionally, the Fund does not have the right to sell or repledge collateral received in the form of securities unless the borrower goes into default. Each Fund receives cash collateral which is invested in the Short-Term Investment Trust Liquid Assets Portfolio Institutional Class. The risks to a Fund of securities lending are that the borrower may not provide additional collateral when required or return the securities when due. This collateral must be valued daily and should the market value of the loaned securities increase, the borrower must furnish additional collateral to the lending Fund. The Fund bears the risk of any income or gains and losses from investing and reinvesting cash pledged as collateral. During the time portfolio securities are on loan, the borrower pays the lending Fund the economic equivalent of any dividends or interest paid on such securities. In the event the borrower defaults on its obligation to the lending Fund, the lending Fund could experience delays in recovering its securities and possible capital losses. As of October 31, 2012, the Emerald Growth Fund had securities on loan valued at $0 and received cash collateral with a value of $22,051. The current security on loan (Magnum Hunter Resources Corp. Warrants) is held at the custodian Brown Brothers Harriman & Co. (“BBH”), and the warrants are due to expire on October 14, 2013. Once the warrant expires, BBH can recall and transfer the current quantity to Union Bank of California, the current custodian to the Funds.
Trust Expenses: Some expenses of the Trust can be directly attributed to the Funds. Expenses which cannot be directly attributed to the Funds are apportioned among all funds in the Trust based on average net assets of each fund.
Fund and Class Expenses: Expenses that are specific to a Fund or class of shares of a Fund are charged directly to that Fund or share class. Expenses that are common to all Funds generally are allocated among the Funds in proportion to their average daily net assets. Fees provided under the distribution (Rule 12b-1) and/or shareholder service plans for a particular class of the Funds are charged to the operations of such class.
Federal Income Taxes: Each Fund complies with the requirements under Subchapter M of the Internal Revenue Code of 1986, as amended, applicable to regulated investment companies and intends to distribute substantially all of its net taxable income and net capital gains, if any, each year. The Funds are not subject to income taxes to the extent such distributions are made.
As of and during the six months ended October 31, 2012, the Funds did not have a liability for any unrecognized tax benefits in the accompanying financial statements. Each Fund files income tax returns in the U.S. federal jurisdiction and Colorado. The statute of limitations on each Fund’s federal and state tax filings remains open for the fiscal years ended April 30, 2012, December 31, 2011, December 31, 2010, December 31, 2009, and December 31, 2008.
Distributions to Shareholders: Each Fund normally pays dividends and distributes capital gains, if any, on an annual basis. Income dividend distributions are derived from interest and other income each Fund receives from its investments, including distributions of short-term capital gains. Capital gain distributions are derived from gains realized when each Fund sells a security it has owned for more than a year. Each Fund may make additional distributions and dividends at other times if the portfolio manager believes doing so may be necessary for each Fund to avoid or reduce taxes. Net investment income/(loss) and net realized gain/(loss) may differ for financial statement and tax purposes.
3. TAX BASIS INFORMATION
Tax Basis of Distributions to Shareholders: The character of distributions made during the year from net investment income or net realized gains may differ from its ultimate characterization for federal income tax purposes. Also, due to the timing of dividend distributions, the fiscal year in which amounts are distributed may differ from the fiscal year in which the income or realized gain were recorded by each Fund. During the period ended April 30, 2012 and the six months ended October 31, 2012, the Funds did not make any distributions.
28 |
www.emeraldmutualfunds.com |
Table of Contents
Emerald Funds | Notes to Financial Statements | |
October 31, 2012 (Unaudited) |
As of October 31, 2012, the aggregate cost of investments, gross unrealized appreciation/ (depreciation) and net unrealized appreciation/ depreciation for Federal tax purposes was as follows:
| Fund | Cost of Investments | Gross Unrealized Appreciation | Gross Unrealized (Depreciation) | Net Unrealized Appreciation | ||||||||||||
Emerald Banking and Finance Fund | $ | 31,240,067 | $ | 11,575,143 | $ | (550,938 | ) | $ | 11,024,205 | |||||||
Emerald Growth Fund | 93,250,803 | 30,305,104 | (5,734,951 | ) | 24,570,153 | |||||||||||
Under the Regulated Investment Company Modernization Act of 2010 (the “Modernization Act”), net capital losses recognized in tax years beginning after December 22, 2010 may be carried forward indefinitely, and the character of the losses is retained as short-term and/or long-term. Under the law in effect prior to the Modernization Act, net capital losses were carried forward for eight years and treated as short-term. As a transition rule, the Modernization Act requires that post-enactment net capital losses be used before pre-enactment net capital losses. Additionally, post-enactment capital losses that are carried forward will retain their character as either short-term or long-term losses rather than being considered all short-term as under previous law.
4. MANAGEMENT AND RELATED-PARTY TRANSACTIONS
Emerald Mutual Fund Advisers Trust, (“the Adviser”), subject to the authority of the Board, is responsible for the overall management and administration of the Funds’ business affairs. The Adviser manages the investments of the Funds in accordance with the Funds’ investment objective, policies and limitations and investment guidelines established jointly by the Adviser and the Trustees. Pursuant to the Advisory Agreement, the Funds pay the Adviser fees for the services and facilities it provides payable on a monthly basis at the annual rate set forth below of the Funds’ average daily net assets.
Emerald Banking and Finance Fund
| Average Total Net Assets | Contractual Fee | |||||||||
Between $0-$100M | 1.00 | % | ||||||||
Above $100M | 0.90 | % | ||||||||
Emerald Growth Fund
| Average Total Net Assets | Contractual Fee | |||||||||
Between $0-$250M | 0.75 | % | ||||||||
$250M-$500M | 0.65 | % | ||||||||
$500M-$750M | 0.55 | % | ||||||||
Above $750M | 0.45 | % | ||||||||
The Adviser has contractually agreed to limit the total amount of “Management Fees” and “Other Expenses” that it is entitled to receive from the Emerald Banking and Finance Fund through August 31, 2014 and the Emerald Growth Fund through August 31, 2013, respectively, with respect to the Funds’ different classes, to the extent the Total Annual Fund Operating Expenses of a Fund (exclusive of acquired fund fees and expenses, brokerage expenses, interest expense, taxes and extraordinary expenses) exceed the annual rates (as a percentage of each Fund’s average daily net assets) set forth on the tables below. The Adviser will reduce the fee payable with respect to such Fund to the extent of such excess, and/or shall reimburse the Fund (or class) by the amount of such excess. The waiver or reimbursement shall be allocated to each class of the Fund in the same manner as the underlying expenses or fees were allocated.
Emerald Banking and Finance Fund
| Class A | Class C | Institutional Class | Investor Class | |||||
1.84% | 2.49% | 1.54% | 1.89% |
Emerald Growth Fund
| Class A | Class C | Institutional Class | Investor Class | |||||
1.29% | 1.94% | 0.99% | 1.34% |
Semi-Annual Report | October 31, 2012 |
29 |
Table of Contents
Emerald Funds | Notes to Financial Statements | |
October 31, 2012 (Unaudited) |
For the six months ended October 31, 2012, the fee waivers and/or reimbursements were as follows:
| Fund | Fees Waived/Reimbursed by Advisor | Recoupment of Past Waived Fees by Advisor | Total | |||||||
Emerald Banking and Finance Fund | ||||||||||
Class A | $ | 6,970 | $ 0 | $ | 6,970 | |||||
Class C | 4,900 | 0 | 4,900 | |||||||
Institutional Class | 14 | 0 | 14 | |||||||
Investor Class | 686 | 0 | 686 | |||||||
Emerald Growth Fund | ||||||||||
Class A | $ | 22,580 | $ 0 | $ | 22,580 | |||||
Class C | 1,691 | 0 | 1,691 | |||||||
Institutional Class | 42,708 | 0 | 42,708 | |||||||
Investor Class | 702 | 0 | 702 | |||||||
As of October 31, 2012, the balances of recoupable expenses for each Fund were as follows:
| Fund | Expires 2015 | Expires 2016 | Total | |||||||||
Emerald Banking and Finance Fund | ||||||||||||
Class A | $ | 7,504 | $ | 6,970 | $ | 14,474 | ||||||
Class C | 5,168 | 4,900 | 10,068 | |||||||||
Institutional Class | 2 | 14 | 16 | |||||||||
Investor Class | 228 | 686 | 914 | |||||||||
Emerald Growth Fund | ||||||||||||
Class A | $ | 6,877 | $ | 22,580 | $ | 29,457 | ||||||
Class C | 518 | 1,691 | 2,209 | |||||||||
Institutional Class | 13,614 | 42,708 | 56,322 | |||||||||
Investor Class | 177 | 702 | 879 | |||||||||
The Emerald Banking and Finance and Emerald Growth Funds will not be obligated to pay any such deferred fees and expenses more than three years after the year(s) in which the fees and expense were incurred.
Distributor: ALPS Distributors, Inc. (“ADI” or the “Distributor”) (an affiliate of ALPS) acts as the distributor of the Funds’ shares pursuant to a Distribution Agreement with the Trust. Shares are sold on a continuous basis by ADI as agent for the Funds, and ADI has agreed to use its best efforts to solicit orders for the sale of Funds’ shares, although it is not obliged to sell any particular amount of shares. ADI is not entitled to any compensation for its services as Distributor. ADI is registered as a broker-dealer with the Securities and Exchange Commission.
Each Fund has adopted a separate Distribution and Services Plan (each a “Plan” and collectively, the “Plans”) pursuant to Rule 12b-1 of the 1940 Act. The Plans allow each Fund, as applicable, to use each Fund’s assets to pay fees in connection with the distribution and marketing of the Funds’ shares and/or the provision of shareholder services to the Funds’ shareholders. The Plan permits payment for services in connection with the administration of plans or programs that use shares of each Fund as their funding medium and for related expenses. The Plans permit each Fund to make total payments at an annual rate of up to 0.35%, 0.75% and 0.25% of the average daily net asset value of Class A, Class C and Investor Class, respectively. Because these fees are paid out of the Funds’ assets on an ongoing basis, over time they will increase the cost of an investment in the Funds, and Plan fees may cost an investor more than other types of sales charges.
Each Fund has adopted a Shareholder Services Plan (a “Shareholder Services Plan”) with respect to its shares. Under the Shareholder Services Plan, each Fund is authorized to pay banks and their affiliates and other institutions, including broker-dealers and Fund affiliates (“Participating Organizations”), an aggregate fee in an amount not to exceed on an annual basis 0.25%, 0.05% and 0.15% of the average daily net asset value of Class C, Institutional Class and Investor Class, respectively, of the Funds attributable to or held in the name of a Participating Organization for its clients as compensation for providing services pursuant to an agreement with a Participating Organization. Any amount of such payment not paid during the Funds’ fiscal year for such service activities shall be reimbursed to the Funds as soon as practicable after the end of the fiscal year. Shareholder Services Plan fees are included with distribution and service fees on the Statement of Operations.
30 | www.emeraldmutualfunds.com
|
Table of Contents
Emerald Funds | Notes to Financial Statements | |
October 31, 2012 (Unaudited) |
Administrator: ALPS Fund Services, Inc. (“ALPS” and the “Administrator”) (an affiliate of ADI) serves as administrator to the Funds, and each Fund has agreed to pay expenses incurred in connection with its administrative activities. Pursuant to the Administration, Bookkeeping and Pricing Services Agreement (the “Agreement”), ALPS will provide operational services to the Funds including, but not limited to, fund accounting and fund administration and generally assist in each Fund’s operations. The table below describes the administrative fees paid by the Funds to ALPS pursuant to the Agreement during the six months ended October 31, 2012:
The Annual Administrative Fee, billed monthly, is subject to a minimum of $140,000 in Year 1 and $200,000 in subsequent years is equal to:
| Average Total Net Assets | Contractual Fee | |||||
Between $0-$500M | 0.06 | % | ||||
$500M-$1B | 0.04 | % | ||||
Above $1B | 0.025 | % | ||||
Transfer Agent: ALPS serves as transfer, dividend paying and shareholder servicing agent for the Funds (“Transfer Agent”). ALPS is compensated based upon a $25,000 annual base fee per Fund, and annually $9 per direct open account and $7 per open account through NSCC. The Transfer Agent is also reimbursed by the Funds for certain out-of-pocket expenses.
Compliance Services: ALPS provides services as Fund Chief Compliance Officer Assurance Representations and Review. ALPS provides services which assist the Funds’ Chief Compliance Officer in monitoring and testing the policies and procedures of the Trust in conjunction with requirements under Rule 38a-1 under the 1940 Act and receives an annual base fee of $40,000.
Principal Financial Officer: ALPS receives an annual fee of $10,000 for providing Principal Financial Officer (“PFO”) services to the Funds.
Beneficial Ownership: The beneficial ownership, either directly or indirectly, of more than 25% of the voting securities of any class of the Funds creates a presumption of control of the Fund under Section 2(a)(9) of the 1940 Act. As of October 31, 2012, the following entities owned beneficially 25% or greater of the Funds’ outstanding shares.
| Fund | Class | Name | Percentage | |||||||
Emerald Growth Fund | Investor | Joseph W. Garner | 63.35 | % | ||||||
Emerald Growth Fund | Institutional | JPMorgan Chase* | 90.41 | % | ||||||
| * | The shares are held under omnibus accounts (whereby the transactions of two or more shareholders are combined and carried in the name of the originating broker rather than designated separately). |
5. SECURITIES TRANSACTIONS
The cost of purchases and proceeds from sales of securities (excluding short-term securities) during the six months ended October 31, 2012, was as follows:
| Fund | Cost of Investments Purchased | Proceeds from Investments Sold | ||||||
Emerald Banking and Finance Fund | $ | 10,572,017 | $ | 7,880,188 | ||||
Emerald Growth Fund | 50,664,741 | 53,566,401 | ||||||
6. INDEMNIFICATIONS
Under the Trust’s organizational documents, its officers and Trustees are indemnified against certain liability arising out of the performance of their duties to the Trust. Additionally, in the normal course of business, the Trust enters into contracts with service providers that may contain general indemnification clauses, which may permit indemnification to the extent permissible under applicable law. The Trust’s maximum exposure under these arrangements is unknown, as this would involve future claims that may be made against the Trust that have not yet occurred.
Semi-Annual Report | October 31, 2012 |
31 |
Table of Contents
Emerald Funds | Additional Information | |
October 31, 2012 (Unaudited) |
1. FUND HOLDINGS
The Funds file their complete schedule of portfolio holdings with the Securities and Exchange Commission (the “SEC”) for the first and third quarters of each fiscal year on Form N-Q within 60 days after the end of the period. Copies of the Funds’ Form N-Q are available without charge on the SEC website at http://www.sec.gov. You may also review and copy the Form N-Q at the SEC’s Public Reference Room in Washington, DC. For more information about the operation of the Public Reference Room, please call the SEC at 1-800-SEC-0330.
2. FUND PROXY VOTING POLICIES, PROCEDURES AND SUMMARIES
Each Fund’s policies and procedures used in determining how to vote proxies and information regarding how the Funds voted proxies relating to portfolio securities during the most recent prior 12-month period ending June 30 are available without charge, (1) upon request, by calling (toll-free) (855) 828-9909 and (2) on the SEC’s website at http://www.sec.gov.
32 | www.emeraldmutualfunds.com
|
Table of Contents

Table of Contents

Table of Contents
| Grandeur Peak FundsSM |

| TABLE OF CONTENTS | ||||||
| 1 | ||||||
| 6 | ||||||
| 10 | ||||||
Portfolio of Investments | ||||||
| 12 | ||||||
| 21 | ||||||
| 28 | ||||||
| 30 | ||||||
Statements of Changes in Net Assets | ||||||
| 31 | ||||||
| 33 | ||||||
Financial Highlights | ||||||
| 35 | ||||||
| 37 | ||||||
| 39 | ||||||
| 49 | ||||||
Table of Contents
Grandeur Peak FundsSM | Shareholder Letter | |
October 31, 2012 (Unaudited) |
 | ||||
| Robert Gardiner, CFA | Blake Walker | |||
| CEO & Portfolio Manager | CIO & Portfolio Manager | |||
Dear Fellow Shareholders,
Over fifteen years ago my wife Susie instituted “Best & Worst” at our family dinner table. Since then, each night we ask the members of our family to tell the best and worst thing that happened to them that day. My kids happily talk about goals scored or being asked to a dance as today’s “best,” while homework or a bad test score frequently make the “worst” list. As you might imagine, I spend a lot of time sharing joys and pains of individual stocks that were up or down on a given day. It’s been a wonderful way to help us love and understand each other better.
In early October our growing firm made our annual climb up Grandeur Peak.1 At the top of the peak each of us shared our own best and worst from the firm’s first year. It’s truly amazing what the Grandeur Peak team has accomplished this past year.
While Susie and I hope for a happy day for our kids every day, life is not easy and our kids inevitably have bad days. Similarly, while this first year was a great start for our firm in both absolute and relative performance, we’ve been around long enough to know that there will be tough years for us as well. We will be candid and transparent with you about our strengths and weaknesses each year. Our hope is that we can produce more good years than bad and thereby help you achieve your financial goals over the long run.
The best days as a parent are when one of our kids reports “no worsts today.” We are similarly very grateful and pleased to report a great year to you. Having beaten our benchmarks handily and being near the top of our peer group, it would be tempting to simply say “no worsts” this year (see pages 6 and 8 for full performance details2). But as we reflect on the year there are areas where we fell short. So we’ll report on both the good and bad of this past year.
1 Grandeur Peak is part of the Wasatch Mountain Range just east of Salt Lake City, Utah. The peak provides a great view of the entire Salt Lake Valley and beyond. Our annual hike up Grandeur Peak is about six miles round trip through the beautiful fall foliage.
2 Past performance does not guarantee future results.
Semi-Annual Report | October 31, 2012 | 1 |
Table of Contents
Grandeur Peak FundsSM | Shareholder Letter | |
October 31, 2012 (Unaudited) |
By far the best part of our year was you, our clients, who put your trust in Grandeur Peak. Our mission is to help each of you achieve your financial goals (to climb to that financial peak you are working towards). With just under $350M now under management, we are very grateful to each of you for your commitment to us, and we will not forget you as our initial investors. We have now reached profitability and are able to invest further in strengthening the firm.
Another best this year has been the team we’ve assembled. We were very fortunate as a startup to get out of the chute with these nine seasoned and skilled professionals. Each individual left a very good position or opportunity at another firm to join Grandeur Peak, and each has brought something unique and important to our firm. The chess pieces have come together nicely and I believe our team is well positioned for the match ahead.
I’m especially grateful to our team for the tremendous effort they have put forth over the past year. Since last October, we have visited 16 foreign countries and 16 different states in the U.S., resulting in a total of 477 on-site company visits. We have also directly interacted with another 569 companies via company visits to our Salt Lake office, individual conference calls, or other one-on-one meetings. This number of company touches is remarkable and surpasses anything I’ve experienced in the past.
As a result, our biggest challenge this year has been digesting all of these companies. Over our careers we’ve put in place a robust research process. We believe that the key to good performance for our clients is to be highly disciplined in this process. It has worked well historically, and we are confident that it can continue to work going forward as long as we are absolutely disciplined in our execution. While the front end of our process (screening and visits) has been hitting on most cylinders, we’ve fallen somewhat short on the back end of our process. The detailed follow-up on our companies, timely model building, and watch list monitoring has not received the full time I would like for it to get. I can see opportunities that we’ve missed. There were great companies that might have been weighted higher if we had crossed our t’s and dotted our i’s faster, watch list names where we missed good buying opportunities, and companies struggling where we didn’t recognize the issues quickly enough. We can do better here.
To improve the back-end of our process we have been aggressively building a research “support team.” We began a research internship program the day we launched Grandeur Peak in July of 2011. We had one intern in the summer of 2011 and we have since had 10 students pass through our doors as part of summer, fall, or winter internships. Two of these interns have “graduated” from the internship program to become junior research analysts on the team (we love the model of grooming research talent from within). This fall we have four research interns, as well as two research assistants. Our junior team is really starting to increase our productivity, so we’re feeling better about the back end of our process. There is more work to do, but we’re well on our way.
While I’m talking about our team, I want to highlight the near flawless execution of our business operations team this year. Being on the business operations team is like playing goalie… where no one notices you until the other team scores. Well, our business operations team kept the ball out of the goal, built impressive back-office capabilities, and allowed the research team to stay focused on research. Both our internal team and our outsourced partners have done an excellent job. This pays great, although often hidden, dividends to you as clients.
2 | 1.855.377.7325 | www.GrandeurPeakGlobal.com |
Table of Contents
Grandeur Peak FundsSM | Shareholder Letter | |
October 31, 2012 (Unaudited) |
Geographically, the investment highs for the year were in developed foreign markets. Western Europe, Japan, Australia, and Canada have been significant outperforming markets for us. We found great small and microcap companies that have been able to outrun the macroeconomic headwinds in those markets.
To a lesser degree we were able to outperform in emerging markets. Malaysia, South Africa, South Korea and Brazil were good markets this year. China is going through a tough period, but fortunately we were able to see some of the issues coming and we lowered our weights somewhat in China. India has been a great frustration for us – definitely a member of the “worst” list for 2012. This is the one country in which our funds are still not registered for local investments. Meanwhile, India has been one of the best performing markets in 2012. Since we were unable to purchase stocks traded in India, we took a minor position in a small-cap Indian ETF (Exchange Traded Fund). We’ve made three trips to India in the last two years and we are prepared to invest once the local market becomes available to us. We, and our outsourced partners, have been working tirelessly with the Indian regulatory body to acquire this registration. We believe we are very close, and this will remain a top priority for the firm until the registration is obtained.
In the U.S., our performance has been in line with the market. I feel good about keeping up in a bull market, as we generally don’t expect our investment style to lead in bull markets (but of course we always hope to outperform). We are finding greater market inefficiency outside of the U.S. in the small cap space. There are a plethora of undiscovered small and microcap companies abroad, but fewer domestically. This is a consequence of a decade of Sarbanes Oxley regulation which has lowered the quality and quantity of U.S. IPOs (Initial Public Offerings); meanwhile, there has been an extremely healthy foreign IPO market over the same period. There are also many more asset managers focused on small caps in the U.S. than there were a decade ago, yet few managers have begun tackling the bigger opportunity among foreign small caps.
We are by no means walking away from U.S. investments. We simply have to work harder to find great little companies that are inefficiently priced in the U.S. Fortunately, the U.S. IPO market has begun to perk up, and recent legislation (the Jobs Act) should help smaller companies come public with less cost burden. I’ve personally given significant focus to the U.S. market this year with a number of domestic trips. We’re confident that we can remain a premier investor in the U.S. market as well.
On the industry front, I’m particularly pleased with the results of our global analysts. By assigning accountability for each industry to a member of our research team we have more effectively found some of the hidden gems. We didn’t weight the industries particularly well this year: Industrials and Technology have underperformed where we’ve been overweight, and Financials have outperformed where we’ve been underweight. But, within each industry, our stock picking has been excellent. In every major industry grouping we have outperformed measurably, with the exception of Materials. We outperformed in Consumer, Energy, Financials, Health Care, Industrials and Technology. This is our story. We do not consider ourselves masters of sector rotation. Rather we’re bottom-up stock pickers identifying what we believe to be the best companies in each area, and then weighting them in the portfolio based upon which opportunities we think are the most interesting. Our approach has born good fruit this year.
Over the last twelve months we’re pleased to report that we’ve had 8 stock doubles and 1 triple in our portfolios. We’ve created a Grandeur Peak Hall of Fame for stock picks that have made a
Semi-Annual Report | October 31, 2012 | 3 |
Table of Contents
Grandeur Peak FundsSM | Shareholder Letter | |
October 31, 2012 (Unaudited) |
significant individual contribution to the portfolio. Magellan Financial has been a top five holding that has nearly tripled in the last year. It was our first new stock pick after launching Grandeur Peak. It was an undiscovered Australian asset manager that has done extremely well for its clients and has been growing its assets nicely. Investors have begun recognizing Magellan’s success and have responded accordingly. Monotaro is a Japanese industrial company which was another top five holding that nearly tripled this year. It’s a great illustration of how small and micro cap growth companies can be found in slower growth developed countries like Japan.
While we love winners, we believe investing is a “loser’s game” where it’s more important to limit the number of mistakes you make than the number of winners you have. Our largest negative contributors were O2 Micro International and MK Trend, but I am very pleased that no stock hurt us over a half a point in performance and that the overall number of losers has been reasonably low. We’ve had years in our career where we’ve done better on the mistake front than this year though. I believe as we continue to improve the back-end of our process we can find improvements here as well.
As we approach the end of 2012, we are all a bit cautious. We’ve seen the global economy unquestionably weaken the last several months despite positive signs earlier in the year. Indeed, the third quarter earnings season was weaker in the U.S; China and Japan are clearly slowing; Europe’s issues are not resolved; and with the fiscal cliff looming, there is a lot of uncertainty right now.
Our strategy remains very clear, however. We’re going to continue looking for the highest quality micro, small and occasionally midcap companies on the planet; companies with a strong competitive advantage and good business models; companies with headroom to grow even in a slow growth global environment; companies with good corporate governance and strong management teams. We’re going to try to find these companies at reasonable prices before they are discovered broadly. We’ll also look for them as “fallen angels,” when the market has unduly punished the stock price because the company hit a bump in the road—a bump from which we believe the company will recover relatively quickly.
We’ve had many highs over the past year for which we are grateful. However, we’re a firm that strives foremost to get better every day, and we won’t rest on a good year. We’re working hard to correct the lows and to repeat the highs as we head into 2013. We’re particularly focused on fine tuning and executing our robust research process.
In closing I want to again recognize our dedicated employees and their supportive families for their tremendous passion and hard work over the last 16 months. We’ve found great joy in building this firm together. We would also like to thank you, as valued clients, for your trust and confidence in us. We will do everything in our power to earn and deserve your trust each day.
Sincerely,
Robert
Robert Gardiner, CEO & Portfolio Manager
Grandeur Peak Global Advisors
4 | 1.855.377.7325 | www.GrandeurPeakGlobal.com |
Table of Contents
Grandeur Peak FundsSM | Shareholder Letter | |
October 31, 2012 (Unaudited) |
Mutual fund investing involves risks and loss of principal is possible. Investing in small and micro cap funds will be more volatile and loss of principal could be greater than investing in large cap or more diversified funds. Investing in foreign securities entails special risks, such as currency fluctuations and political uncertainties, which are described in more detail in the prospectus. Investments in emerging markets are subject to the same risks as other foreign securities and may be subject to greater risks than investments in foreign countries with more established economies and securities markets.
An investor should consider investment objectives, risks, charges, and expenses carefully before investing. To obtain a Grandeur Peak Funds prospectus, containing this and other information, visit www.grandeurpeakglobal.com or call 1-855-377-PEAK (7325). Please read it carefully before investing.
The views and information discussed in this commentary are as of the date of publication, are subject to change, and may not reflect the writer’s current views. The views expressed represent an assessment of market conditions at a specific point in time, are opinions only and should not be relied upon as investment advice regarding a particular investment or markets in general. Such information does not constitute a recommendation to buy or sell specific securities or investment vehicles. It should not be assumed that any investment will be profitable or will equal the performance of the portfolios or any securities or any sectors mentioned herein. The subject matter contained herein has been derived from several sources believed to be reliable and accurate at the time of compilation. The Funds do not accept any liability for losses either direct or consequential caused by the use of this information.
CFA® is a trademark owned by CFA Institute.
Semi-Annual Report | October 31, 2012 | 5 |
Table of Contents
Grandeur Peak Global Opportunities Fund | Performance Update | |
October 31, 2012 (Unaudited) |
Performance for the periods ended October 31, 2012
| 6 months | 1 Year | Since Inception* | ||||
Grandeur Peak Global Opportunities Fund – Investor (GPGOX) | 4.33% | 15.87% | 19.67% | |||
Grandeur Peak Global Opportunities Fund – Institutional (GPGIX) | 4.31% | 16.35% | 20.15% | |||
Russell Global Small Cap Index | 0.49% | 7.75% | 12.08% | |||
Russell Global Index | 1.54% | 9.07% | 13.24% |
| * | Fund Inception date of October 17, 2011. |
Returns for periods greater than 1 year are annualized.
The returns shown above do not reflect the deduction of taxes a shareholder would pay on Fund distributions or redemption of Fund shares.
Performance data quoted represents past performance. Past performance does not guarantee future results. Investment return and principal value of an investment will fluctuate so that an investor’s shares, when sold or redeemed, may be worth more or less than the original cost. Current performance data may be higher or lower than actual data quoted. For the most current month-end performance data, please call 1-855-377-PEAK (7325).
Growth of $10,000 for the period ended October 31, 2012
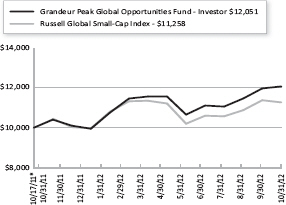
The graphs shown above represent a hypothetical investment of $10,000 in the Fund’s Investor Class shares for the period from inception to 10/31/2012. All returns reflect reinvested dividends, but do not reflect the deduction of taxes that an investor would pay on distributions or redemptions.
The Russell Global Small Cap Index and Russell Global Index are not actively managed and do not reflect any deduction for fees, expenses or taxes. It is not possible to invest directly in an index.
The Fund also offers Institutional Class shares, performance for which is not reflected in the graphs above. The performance of Institutional Class shares may be higher or lower than the
Semi-Annual Report | October 31, 2012 | 6 |
Table of Contents
Grandeur Peak Global Opportunities Fund | Performance Update | |
October 31, 2012 (Unaudited) |
performance of the Investor Class shares shown in the graphs above based upon differences in fees paid by shareholders investing in the Investor Class shares and Institutional Class shares.
Regional Allocation (as a % of Net Assets)* | ||||
North America | 38.8 | % | ||
Europe | 23.1 | % | ||
Asia ex Japan | 15.8 | % | ||
Australia/New Zealand | 7.1 | % | ||
Japan | 3.9 | % | ||
Latin America | 3.0 | % | ||
Africa/Middle East | 2.4 | % | ||
Cash, Cash Equivalents, & Other Net Assets | 5.9 | % | ||
Total | 100.0 | % | ||
Industry Sector Allocation (as a % of Net Assets)* | ||||
Technology | 22.3 | % | ||
Industrials | 20.9 | % | ||
Consumer | 19.0 | % | ||
Financials | 15.4 | % | ||
Health Care | 9.9 | % | ||
Energy & Materials | 6.4 | % | ||
Exchange Traded Funds | 0.2 | % | ||
Cash, Cash Equivalents, & Other Net Assets | 5.9 | % | ||
Total | 100.0 | % | ||
Top 10 Holdings (as a % of Net Assets)* | ||||
Magellan Financial Group, Ltd. | 2.6 | % | ||
Melexis NV | 2.4 | % | ||
Clinigen Group Plc | 2.2 | % | ||
RPS Group PLC | 2.1 | % | ||
Tilly’s, Inc., Class A | 1.5 | % | ||
L’Occitane International SA | 1.5 | % | ||
Wirecard AG | 1.4 | % | ||
Nu Skin Enterprises, Inc. | 1.4 | % | ||
Bertrandt AG | 1.3 | % | ||
Super Retail Group, Ltd. | 1.3 | % | ||
Total | 17.7 | % | ||
| * | Holdings are subject to change. Tables present indicative values only. |
Semi-Annual Report | October 31, 2012 | 7 |
Table of Contents
Grandeur Peak International Opportunities Fund | Performance Update | |
October 31, 2012 (Unaudited) |
Performance for the periods ended October 31, 2012
| 6 months | 1 Year | Since Inception* | ||||
Grandeur Peak International Opportunities Fund – Investor (GPIOX) | 5.24% | 15.87% | 19.67% | |||
Grandeur Peak International Opportunities Fund – Institutional (GPIIX) | 5.68% | 16.35% | 20.15% | |||
Russell Global ex-U.S. Small Cap Index | 0.22% | 5.41% | 8.07% |
| * | Fund Inception date of October 17, 2011. |
Returns for periods greater than 1 year are annualized.
The returns shown above do not reflect the deduction of taxes a shareholder would pay on Fund distributions or redemption of Fund shares.
Performance data quoted represents past performance. Past performance does not guarantee future results. Investment return and principal value of an investment will fluctuate so that an investor’s shares, when sold or redeemed, may be worth more or less than the original cost. Current performance data may be higher or lower than actual data quoted. For the most current month-end performance data, please call 1-855-377-PEAK (7325).
Growth of $10,000 for the period ended October 31, 2012
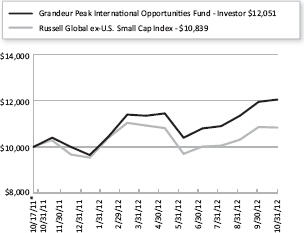
The graphs shown above represent a hypothetical investment of $10,000 in the Fund’s Investor Class shares for the period from inception to 10/31/2012. All returns reflect reinvested dividends, but do not reflect the deduction of taxes that an investor would pay on distributions or redemptions.
The Russell Global ex-U.S. Small Cap Index is not actively managed and does not reflect any deduction for fees, expenses or taxes. It is not possible to invest directly in an index.
The Fund also offers Institutional Class shares, performance for which is not reflected in the graphs above. The performance of Institutional Class shares may be higher or lower than the performance of the Investor Class shares shown in the graphs above based upon differences in fees paid by shareholders investing in the Investor Class shares and Institutional Class shares.
Semi-Annual Report | October 31, 2012 | 8 |
Table of Contents
Grandeur Peak International Opportunities Fund | Performance Update | |
October 31, 2012 (Unaudited) |
Regional Allocation (as a % of Net Assets)* | ||||
Europe | 29.4 | % | ||
Asia ex Japan | 24.3 | % | ||
North America | 7.6 | % | ||
Australia/New Zealand | 9.1 | % | ||
Japan | 5.7 | % | ||
Latin America | 4.7 | % | ||
Africa/Middle East | 4.3 | % | ||
Cash, Cash Equivalents, & Other Net Assets | 14.9 | % | ||
Total | 100.0 | % | ||
Industry Sector Allocation (as a % of Net Assets)* | ||||
Consumer | 20.0 | % | ||
Industrials | 20.0 | % | ||
Technology | 18.5 | % | ||
Financials | 10.5 | % | ||
Health Care | 8.6 | % | ||
Energy & Materials | 7.1 | % | ||
Exchange Traded Funds | 0.4 | % | ||
Cash, Cash Equivalents, & Other Net Assets | 14.9 | % | ||
Total | 100.0 | % | ||
Top 10 Holdings (as a % of Net Assets)* | ||||
Magellan Financial Group, Ltd. | 2.9 | % | ||
Melexis NV | 2.6 | % | ||
Clinigen Group PLC | 2.2 | % | ||
RPS Group PLC | 2.2 | % | ||
L’Occitane International SA | 1.9 | % | ||
Wirecard AG | 1.8 | % | ||
Bertrandt AG | 1.6 | % | ||
Banco Daycoval SA | 1.5 | % | ||
Trancom Co., Ltd. | 1.5 | % | ||
Nu Skin Enterprises, Inc., Class A | 1.4 | % | ||
Total | 19.6 | % | ||
| * | Holdings are subject to change. Tables present indicative values only. |
Semi-Annual Report | October 31, 2012 | 9 |
Table of Contents
Grandeur Peak FundsSM | Disclosure of Fund Expenses | |
October 31, 2012 (Unaudited) |
As a shareholder of a Fund, you incur two types of costs: direct costs, such as short-term redemption fees and wire fees, and indirect costs, including management fees, and other fund operating expenses. This example is intended to help you understand your indirect costs, also referred to as “ongoing costs” (in dollars), of investing in the Fund and to compare these costs with the ongoing costs of investing in other mutual funds.
This example is based on an investment of $1,000 invested at the beginning of the period and held for the entire six-month period of May 1, 2012 through October 31, 2012.
Actual Expenses The first line of the table below provides information about actual account values and actual expenses. You may use the information in this line, together with the amount you invested at the beginning of the period, to estimate the expenses that you paid over the period. Simply divide your account value by $1,000 (for example, an $8,600 account value divided by $1,000 = 8.6), then multiply the result by the number in the first line under the heading “Expenses Paid During Period” to estimate the expenses you paid on your account during this period.
Hypothetical Example for Comparison Purposes The second line of the table provides information about hypothetical account values and hypothetical expenses based on the Fund’s actual expense ratio and an assumed rate of return of 5% per year before expenses, which is not the Fund’s actual return. The hypothetical account values and expenses may not be used to estimate the actual ending account balance or expenses you paid for the period. You may use this information to compare ongoing costs of investing in the Fund and other funds. To do so, compare this 5% hypothetical example with the 5% hypothetical examples that appear in the shareholder reports of other funds.
Please note that the expenses shown in the table are meant to highlight your ongoing costs only and do not reflect any direct costs, such as wire fees or low balance fees. Therefore, the second line of the table is useful in comparing ongoing costs only and will not help you determine the relative total costs of owning different funds. In addition, if these direct costs were included, your costs would be higher.
Beginning Account 5/1/2012 | Ending Account 10/31/12 | Expense Ratio(a) | Expenses Paid During period 5/1/2012 -10/31/12(b) | |||||||||||||||||
Grandeur Peak Global Opportunities | ||||||||||||||||||||
Investor Class | ||||||||||||||||||||
Actual | $ | 1,000.00 | $ | 1,043.30 | 1.75 | % | $ | 9.01 | ||||||||||||
Hypothetical (5% return before expenses) | $ | 1,000.00 | $ | 1,016.38 | 1.75 | % | $ | 8.89 | ||||||||||||
Institutional Class | ||||||||||||||||||||
Actual | $ | 1,000.00 | $ | 1,043.10 | 1.50 | % | $ | 7.72 | ||||||||||||
Hypothetical (5% return before expenses) | $ | 1,000.00 | $ | 1,017.64 | 1.50 | % | $ | 7.63 | ||||||||||||
| (a) | The Fund’s expense ratios have been annualized based on the Fund’s most recent fiscal half-year expenses. |
| (b) | Expenses are equal to the Fund’s annualized expense ratio, multiplied by the average account value over the period, multiplied by the number of days in the most recent fiscal half-year 184/365. |
10 | 1.855.377.7325 | www.GrandeurPeakGlobal.com |
Table of Contents
Grandeur Peak FundsSM | Disclosure of Fund Expenses | |
October 31, 2012 (Unaudited) |
Beginning Account 5/1/2012 | Ending Account 10/31/12 | Expense Ratio(a) | Expenses Paid During period 5/1/2012 - 10/31/12(b) | |||||||||||||||||
Grandeur Peak International Opportunities |
| |||||||||||||||||||
Investor Class | ||||||||||||||||||||
Actual | $ | 1,000.00 | $ | 1,052.40 | 1.75 | % | $ | 9.05 | ||||||||||||
Hypothetical (5% return before expenses) | $ | 1,000.00 | $ | 1,016.38 | 1.75 | % | $ | 8.89 | ||||||||||||
Institutional Class | ||||||||||||||||||||
Actual | $ | 1,000.00 | $ | 1,056.80 | 1.50 | % | $ | 7.78 | ||||||||||||
Hypothetical (5% return before expenses) | $ | 1,000.00 | $ | 1,017.64 | 1.50 | % | $ | 7.63 | ||||||||||||
| (a) | The Fund’s expense ratios have been annualized based on the Fund’s most recent fiscal half-year expenses. |
| (b) | Expenses are equal to the Fund’s annualized expense ratio, multiplied by the average account value over the period, multiplied by the number of days in the most recent fiscal half-year 184/365. |
Semi-Annual Report | October 31, 2012 | 11 |
Table of Contents
| Grandeur Peak Global Opportunities Fund | Portfolio of Investments | |
October 31, 2012 (Unaudited) |
| Shares | Value (Note 2) | |||||||
COMMON STOCKS (93.81%) | ||||||||
Australia (7.08%) | ||||||||
ALS, Ltd. | 75,400 | $ | 725,557 | |||||
Ausenco, Ltd. | 107,515 | 352,677 | ||||||
Billabong International, Ltd. | 414,542 | 380,831 | ||||||
Countplus, Ltd. | 230,836 | 347,450 | ||||||
DWS, Ltd. | 241,873 | 380,382 | ||||||
Lycopodium, Ltd. | 90,815 | 577,881 | ||||||
Magellan Financial Group, Ltd. | 1,238,845 | 4,951,059 | ||||||
Navitas, Ltd. | 65,505 | 280,151 | ||||||
The Reject Shop, Ltd. | 71,790 | 1,058,957 | ||||||
Sirtex Medical, Ltd. | 71,900 | 820,998 | ||||||
SMS Management & Technology, Ltd. | 22,910 | 118,434 | ||||||
Super Retail Group, Ltd. | 261,257 | 2,443,504 | ||||||
Webjet, Ltd. | 279,300 | 1,159,715 | ||||||
|
| |||||||
| 13,597,596 | ||||||||
|
| |||||||
Belgium (2.40%) | ||||||||
Melexis NV | 291,934 | 4,612,551 | ||||||
|
| |||||||
Brazil (2.97%) | ||||||||
Banco ABC Brasil SA | 230,152 | 1,307,675 | ||||||
Banco Daycoval SA | 451,900 | 2,356,230 | ||||||
CETIP SA - Mercados Organizados | 71,000 | 818,000 | ||||||
Marcopolo SA | 78,600 | 393,958 | ||||||
Tegma Gestao Logistica | 48,500 | 835,775 | ||||||
|
| |||||||
| 5,711,638 | ||||||||
|
| |||||||
Britain (8.27%) | ||||||||
Abcam PLC | 107,565 | 668,300 | ||||||
Clinigen Group PLC(a) | 1,375,000 | 4,293,616 | ||||||
CVS Group PLC | 43,680 | 112,606 | ||||||
Fidessa Group PLC | 9,620 | 206,474 | ||||||
Halma PLC | 58,800 | 391,323 | ||||||
Highland Gold Mining, Ltd. | 74,690 | 125,956 | ||||||
Michael Page International PLC | 37,375 | 217,373 | ||||||
N Brown Group PLC | 301,580 | 1,635,726 | ||||||
Premier Oil PLC(a) | 336,255 | 1,903,023 | ||||||
Robert Walters PLC | 203,500 | 651,875 | ||||||
RPS Group PLC | 1,045,584 | 3,946,651 | ||||||
Sthree PLC | 176,747 | 856,396 | ||||||
Ted Baker PLC | 29,470 | 450,846 | ||||||
Semi-Annual Report | October 31, 2012 | 12 |
Table of Contents
| Grandeur Peak Global Opportunities Fund | Portfolio of Investments | |
October 31, 2012 (Unaudited) |
| Shares | Value (Note 2) | |||||||
Britain (continued) | ||||||||
Ultra Electronics Holdings PLC | 16,235 | $ | 443,556 | |||||
|
| |||||||
| 15,903,721 | ||||||||
|
| |||||||
Canada (5.59%) | ||||||||
Atrium Innovations, Inc.(a) | 28,705 | 295,744 | ||||||
Gildan Activewear, Inc. | 19,770 | 673,219 | ||||||
Gran Tierra Energy, Inc.(a) | 337,275 | 1,713,357 | ||||||
Home Capital Group, Inc. | 41,664 | 2,121,266 | ||||||
Inmet Mining Corp. | 17,130 | 883,299 | ||||||
Pan American Silver Corp. | 10,725 | 235,279 | ||||||
Richelieu Hardware, Ltd. | 26,555 | 923,409 | ||||||
SEMAFO, Inc. | 141,725 | 567,610 | ||||||
ShawCor, Ltd., Class A | 50,645 | 2,256,523 | ||||||
Stantec, Inc. | 14,364 | 494,740 | ||||||
TransGlobe Energy Corp.(a) | 54,540 | 587,585 | ||||||
|
| |||||||
| 10,752,031 | ||||||||
|
| |||||||
China (3.35%) | ||||||||
Airtac International Group | 100,000 | 468,977 | ||||||
China Lilang, Ltd. | 469,175 | 266,974 | ||||||
China Medical System Holdings, Ltd. | 2,309,427 | 1,332,009 | ||||||
Golden Eagle Retail Group, Ltd. | 223,000 | 489,158 | ||||||
Minth Group, Ltd. | 607,460 | 613,727 | ||||||
O2Micro International, Ltd., ADR(a) | 510,163 | 1,617,217 | ||||||
Pacific Online, Ltd. | 3,248,853 | 1,022,858 | ||||||
Parkson Retail Group, Ltd. | 750,000 | 634,835 | ||||||
|
| |||||||
| 6,445,755 | ||||||||
|
| |||||||
France (1.48%) | ||||||||
1000mercis SA | 16,730 | 910,748 | ||||||
Audika Groupe | 20,667 | 245,640 | ||||||
Neurones | 43,508 | 462,419 | ||||||
Sartorius Stedim Biotech | 5,013 | 453,010 | ||||||
Thermador Groupe | 10,192 | 770,820 | ||||||
|
| |||||||
| 2,842,637 | ||||||||
|
| |||||||
Germany (5.03%) | ||||||||
Adler Modemaerkte AG(a) | 62,882 | 340,687 | ||||||
Amadeus Fire AG | 15,205 | 705,541 | ||||||
Bertrandt AG | 29,585 | 2,475,259 | ||||||
CompuGroup Medical AG | 74,765 | 1,356,685 | ||||||
Semi-Annual Report | October 31, 2012 | 13 |
Table of Contents
| Grandeur Peak Global Opportunities Fund | Portfolio of Investments | |
October 31, 2012 (Unaudited) |
| Shares | Value (Note 2) | |||||||
Germany (continued) | ||||||||
Gerry Weber International AG | 9,800 | $ | 444,831 | |||||
Nexus AG | 55,000 | 670,106 | ||||||
Softing AG(a) | 27,820 | 261,426 | ||||||
Wirecard AG(a) | 119,085 | 2,721,211 | ||||||
zooplus AG(a) | 16,120 | 698,898 | ||||||
|
| |||||||
| 9,674,644 | ||||||||
|
| |||||||
Hong Kong (0.63%) | ||||||||
Trinity, Ltd. | 465,000 | 325,798 | ||||||
Vitasoy International Holdings, Ltd. | 553,483 | 525,627 | ||||||
Yingde Gases Group Co. | 381,320 | 361,636 | ||||||
|
| |||||||
| 1,213,061 | ||||||||
|
| |||||||
India (0.55%) | ||||||||
MakeMyTrip, Ltd.(a) | 68,300 | 1,062,065 | ||||||
|
| |||||||
Indonesia (0.29%) | ||||||||
Arwana Citramulia Tbk PT | 4,000,000 | 549,714 | ||||||
|
| |||||||
Ireland (0.74%) | ||||||||
Beazley PLC | 504,400 | 1,425,282 | ||||||
|
| |||||||
Israel (0.85%) | ||||||||
Caesar Stone Sdot Yam, Ltd.(a) | 31,700 | 508,468 | ||||||
Camtek, Ltd.(a) | 114,351 | 194,397 | ||||||
SodaStream International, Ltd.(a) | 26,000 | 929,500 | ||||||
|
| |||||||
| 1,632,365 | ||||||||
|
| |||||||
Japan (3.87%) | ||||||||
CMIC Co., Ltd. | 27,220 | 416,330 | ||||||
CyberAgent, Inc. | 398 | 795,701 | ||||||
Daiken Medical Co., Ltd. | 17,500 | 281,254 | ||||||
EPS Co., Ltd. | 304 | 906,707 | ||||||
Kakaku.com, Inc. | 20,000 | 685,206 | ||||||
MonotaRO Co., Ltd. | 71,245 | 1,871,487 | ||||||
Nihon M&A Center, Inc. | 13,900 | 417,017 | ||||||
Simplex Holdings, Inc. | 786 | 239,256 | ||||||
Trancom Co., Ltd. | 96,170 | 1,819,074 | ||||||
|
| |||||||
| 7,432,032 | ||||||||
|
| |||||||
14 | 1.855.377.7325 | www.GrandeurPeakGlobal.com |
Table of Contents
| Grandeur Peak Global Opportunities Fund | Portfolio of Investments | |
October 31, 2012 (Unaudited) |
| Shares | Value (Note 2) | |||||||
Luxembourg (1.46%) | ||||||||
L’Occitane International SA | 900,153 | $ | 2,804,975 | |||||
|
| |||||||
Malaysia (1.65%) | ||||||||
Aeon Credit Service M Bhd | 250,080 | 981,929 | ||||||
JobStreet Corp. Bhd | 228,300 | 160,395 | ||||||
My EG Services Bhd | 1,775,500 | 454,659 | ||||||
Padini Holdings Bhd | 2,037,650 | 1,371,366 | ||||||
Uzma Bhd(a) | 437,500 | 201,083 | ||||||
|
| |||||||
| 3,169,432 | ||||||||
|
| |||||||
Netherlands (1.52%) | ||||||||
Brunel International NV | 25,745 | 1,239,666 | ||||||
VistaPrint NV(a) | 55,020 | 1,676,459 | ||||||
|
| |||||||
| 2,916,125 | ||||||||
|
| |||||||
Russia (0.09%) | ||||||||
Exillon Energy PLC(a) | 68,749 | 172,796 | ||||||
|
| |||||||
Singapore (2.17%) | ||||||||
ARA Asset Management, Ltd. | 698,080 | 907,081 | ||||||
Breadtalk Group, Ltd. | 948,625 | 466,613 | ||||||
CSE Global, Ltd. | 1,185,550 | 840,712 | ||||||
Goodpack, Ltd. | 312,000 | 496,212 | ||||||
Parkson Retail Asia, Ltd.(a) | 390,000 | 462,002 | ||||||
Petra Foods, Ltd. | 460,000 | 988,031 | ||||||
|
| |||||||
| 4,160,651 | ||||||||
|
| |||||||
South Africa (0.70%) | ||||||||
Clicks Group, Ltd. | 78,785 | 543,185 | ||||||
EOH Holdings, Ltd. | 118,300 | 504,545 | ||||||
Foschini Group, Ltd. | 21,035 | 305,409 | ||||||
|
| |||||||
| 1,353,139 | ||||||||
|
| |||||||
South Korea (2.73%) | ||||||||
Hy-Lok Corp. | 66,500 | 1,341,463 | ||||||
iMarketKorea, Inc. | 41,000 | 973,684 | ||||||
Koh Young Technology, Inc. | 38,410 | 889,284 | ||||||
Korean Reinsurance Co. | 17,200 | 168,751 | ||||||
LG Fashion Corp. | 40,350 | 1,124,739 | ||||||
MKTrend Co., Ltd. | 39,340 | 300,118 | ||||||
Semi-Annual Report | October 31, 2012 | 15 |
Table of Contents
| Grandeur Peak Global Opportunities Fund | Portfolio of Investments | |
October 31, 2012 (Unaudited) |
| Shares | Value (Note 2) | |||||||
South Korea (continued) | ||||||||
Shinsegae Food Co., Ltd. | 4,430 | $ | 442,756 | |||||
|
| |||||||
| 5,240,795 | ||||||||
|
| |||||||
Sweden (1.64%) | ||||||||
AddTech AB, B Shares | 45,537 | 1,136,211 | ||||||
Connecta AB | 14,140 | 104,884 | ||||||
DIBS Payment Services AB | 52,699 | 413,145 | ||||||
HIQ International AB(a) | 148,304 | 675,237 | ||||||
Indutrade AB | 25,564 | 716,866 | ||||||
Swedol AB, B Shares | 33,657 | 114,171 | ||||||
|
| |||||||
| 3,160,514 | ||||||||
|
| |||||||
Taiwan (3.91%) | ||||||||
Cub Elecparts, Inc. | 155,000 | 310,398 | ||||||
Global Mixed Mode Technology, Inc. | 143,000 | 461,125 | ||||||
Leadtrend Technology Corp. | 93,000 | 145,171 | ||||||
Pacific Hospital Supply Co. | 392,150 | 1,142,387 | ||||||
Polyronics Tech Corp. | 437,200 | 763,276 | ||||||
Power Mate Technology Co., Ltd. | 100,000 | 114,677 | ||||||
Richtek Technology Corp. | 34,200 | 186,146 | ||||||
Sporton International, Inc. | 346,086 | 785,469 | ||||||
Taiwan Hon Chuan Enterprise Co., Ltd. | 871,000 | 1,854,555 | ||||||
Test Research, Inc. | 547,234 | 895,431 | ||||||
TXC Corp. | 491,600 | 854,883 | ||||||
|
| |||||||
| 7,513,518 | ||||||||
|
| |||||||
Thailand (0.11%) | ||||||||
Coastal Energy Co. (London Exchange)(a) | 11,888 | 219,470 | ||||||
|
| |||||||
Turkey (0.82%) | ||||||||
Albaraka Turk Katilim Bankasi AS(a) | 621,000 | 491,950 | ||||||
Emlak Konut Gayrimenkul Yatirim Ortakligi AS | 328,000 | 488,569 | ||||||
Katmerciler Arac Ustu Ekipman Sanayi ve Ticaret AS(a) | 274,740 | 591,630 | ||||||
|
| |||||||
| 1,572,149 | ||||||||
|
| |||||||
United Arab Emirates (0.21%) | ||||||||
Aramex PJSC | 755,100 | 398,828 | ||||||
|
| |||||||
United States (33.70%) | ||||||||
Abaxis, Inc.(a) | 19,630 | 721,991 | ||||||
16 | 1.855.377.7325 | www.GrandeurPeakGlobal.com |
Table of Contents
Grandeur Peak Global Opportunities Fund | Portfolio of Investments | |
October 31, 2012 (Unaudited) |
| Shares | Value (Note 2) | |||||||
United States (continued) | ||||||||
Allegiant Travel Co.(a) | 6,755 | $ | 491,359 | |||||
American Software, Inc., Class A | 142,548 | 1,167,468 | ||||||
Amphenol Corp., Class A | 20,920 | 1,257,920 | ||||||
Amsurg Corp.(a) | 50,030 | 1,426,856 | ||||||
Ares Capital Corp. | 134,742 | 2,352,595 | ||||||
AtriCure, Inc.(a) | 44,550 | 286,011 | ||||||
Big 5 Sporting Goods Corp. | 36,250 | 323,712 | ||||||
Capstead Mortgage Corp. | 75,410 | 929,051 | ||||||
Cardtronics, Inc.(a) | 38,450 | 1,092,364 | ||||||
Cempra, Inc.(a) | 124,100 | 832,711 | ||||||
Colony Financial, Inc. | 43,800 | 876,438 | ||||||
Covance, Inc.(a) | 18,132 | 883,210 | ||||||
CRA International, Inc.(a) | 30,573 | 511,792 | ||||||
DFC Global Corp.(a) | 58,740 | 989,769 | ||||||
E2open, Inc.(a) | 27,400 | 479,500 | ||||||
Echo Global Logistics, Inc.(a) | 31,800 | 534,558 | ||||||
Ellie Mae, Inc.(a) | 65,700 | 1,642,500 | ||||||
Encore Capital Group, Inc.(a) | 13,800 | 400,200 | ||||||
Endeavour International Corp.(a) | 46,700 | 339,042 | ||||||
EPAM Systems, Inc.(a) | 50,500 | 907,990 | ||||||
ExamWorks Group, Inc.(a) | 61,550 | 862,931 | ||||||
ExlService Holdings, Inc.(a) | 31,000 | 918,840 | ||||||
First Cash Financial Services, Inc.(a) | 18,900 | 844,074 | ||||||
The First of Long Island Corp. | 13,610 | 408,164 | ||||||
First Republic Bank | 28,805 | 989,452 | ||||||
Forward Air Corp. | 6,170 | 205,893 | ||||||
FTI Consulting, Inc.(a) | 8,190 | 212,612 | ||||||
Gordmans Stores, Inc.(a) | 62,000 | 933,720 | ||||||
Herbalife, Ltd. | 13,800 | 708,630 | ||||||
ICU Medical, Inc.(a) | 7,100 | 421,243 | ||||||
IDEX Corp. | 22,995 | 977,977 | ||||||
Intevac, Inc.(a) | 100,000 | 500,000 | ||||||
KBW, Inc. | 44,126 | 717,048 | ||||||
Keynote Systems, Inc. | 25,000 | 357,250 | ||||||
Knight Transportation, Inc. | 77,095 | 1,165,676 | ||||||
Linear Technology Corp. | 27,370 | 855,586 | ||||||
Littelfuse, Inc. | 12,100 | 648,560 | ||||||
LKQ Corp.(a) | 17,470 | 364,948 | ||||||
Manning & Napier, Inc. | 152,700 | 1,986,627 | ||||||
Market Leader, Inc.(a) | 128,000 | 870,400 | ||||||
MarketAxess Holdings, Inc. | 42,400 | 1,324,576 | ||||||
Semi-Annual Report | October 31, 2012 | 17 |
Table of Contents
Grandeur Peak Global Opportunities Fund | Portfolio of Investments | |
October 31, 2012 (Unaudited) |
| Shares | Value (Note 2) | |||||||
United States (continued) | ||||||||
Maxim Integrated Products, Inc. | 33,175 | $ | 913,142 | |||||
Meridian Bioscience, Inc. | 59,900 | 1,183,025 | ||||||
Mesa Laboratories, Inc. | 9,300 | 453,561 | ||||||
Micrel, Inc. | 39,675 | 384,451 | ||||||
Microchip Technology, Inc. | 38,945 | 1,220,926 | ||||||
MSC Industrial Direct Co., Inc., Class A | 15,970 | 1,191,362 | ||||||
Myriad Genetics, Inc.(a) | 20,595 | 538,971 | ||||||
Navigant Consulting, Inc.(a) | 54,910 | 570,515 | ||||||
Newpark Resources, Inc.(a) | 57,000 | 387,030 | ||||||
Nu Skin Enterprises, Inc., Class A | 57,200 | 2,707,276 | ||||||
Pegasystems, Inc. | 41,300 | 969,311 | ||||||
Perficient, Inc.(a) | 91,896 | 1,044,858 | ||||||
Pericom Semiconductor Corp.(a) | 104,614 | 808,666 | ||||||
Polypore International, Inc.(a) | 15,200 | 536,256 | ||||||
Portfolio Recovery Associates, Inc.(a) | 8,755 | 916,211 | ||||||
Power Integrations, Inc. | 26,675 | 789,047 | ||||||
Quality Systems, Inc. | 26,100 | 455,445 | ||||||
ReachLocal, Inc.(a) | 25,650 | 316,521 | ||||||
Resources Connection, Inc. | 60,675 | 748,730 | ||||||
RG Barry Corp. | 40,000 | 609,600 | ||||||
Rimage Corp. | 17,077 | 102,120 | ||||||
Roadrunner Transportation Systems, Inc.(a) | 61,200 | 1,066,716 | ||||||
Robert Half International, Inc. | 19,105 | 513,733 | ||||||
rue21, Inc.(a) | 29,700 | 894,267 | ||||||
SEI Investments Co. | 39,700 | 868,636 | ||||||
Silicon Laboratories, Inc.(a) | 9,440 | 381,565 | ||||||
Tetra Tech, Inc.(a) | 15,305 | 397,012 | ||||||
Tilly’s, Inc., Class A(a) | 179,646 | 2,899,486 | ||||||
Trimas Corp.(a) | 40,000 | 1,003,200 | ||||||
TTM Technologies, Inc.(a) | 22,475 | 202,275 | ||||||
Universal Truckload Services, Inc. | 116,435 | 1,844,330 | ||||||
Vera Bradley, Inc.(a) | 20,500 | 611,105 | ||||||
Volterra Semiconductor Corp.(a) | 77,435 | 1,406,994 | ||||||
WageWorks, Inc.(a) | 58,000 | 1,124,620 | ||||||
|
| |||||||
| 64,782,207 | ||||||||
|
| |||||||
TOTAL COMMON STOCKS (Cost $166,450,065) | 180,319,691 | |||||||
|
| |||||||
18 | 1.855.377.7325 | www.GrandeurPeakGlobal.com |
Table of Contents
Grandeur Peak Global Opportunities Fund | �� | Portfolio of Investments |
October 31, 2012 (Unaudited) |
| Shares | Value (Note 2) | |||||||
EXCHANGE TRADED FUNDS (0.24%) | ||||||||
Market Vectors® India Small-Cap Index ETF | 43,465 | $ | 452,036 | |||||
TOTAL EXCHANGE TRADED FUNDS (Cost $549,820) | 452,036 | |||||||
|
| |||||||
SHORT TERM INVESTMENTS (2.93%) | ||||||||
BlackRock Liquidity Funds Treasury Trust Fund Portfolio - Institutional Class (7 Day Yield 0.127%) | 5,639,493 | 5,639,493 | ||||||
|
| |||||||
TOTAL SHORT TERM INVESTMENTS (Cost $ 5,639,493) | 5,639,493 | |||||||
|
| |||||||
TOTAL INVESTMENTS (96.98%) (Cost $ 172,639,378) | $ | 186,411,220 | ||||||
Assets In Excess Of Other Liabilities (3.02%) | 5,798,184 | |||||||
|
| |||||||
NET ASSETS (100.00%) | $ | 192,209,404 | ||||||
|
| |||||||
| (a) | Non-Income Producing Security. |
Percentages stated as a percent of net assets.
Common Abbreviations:
AB - Aktiebolag is the Swedish equivalent of the term corporation.
ADR - American Depositary Receipt.
AG - Aktiengesellschaft is a German term that refers to a corporation that is limited by shares, i.e., owned by shareholders.
AS - Aktieselskab is the Danish term for a stock-based corporation.
Bhd - Berhad is the Malaysian term for public limited company.
ETF - Exchange Traded Fund.
Ltd. - Limited.
NV - Naamloze Vennootschap is the Dutch term for a public limited liability corporation.
PLC - Public Limited Company.
PJSC - Public Joint Stock Company.
SA - Generally designates corporations in various countries, mostly those employing the civil law.
Semi-Annual Report | October 31, 2012 | 19 |
Table of Contents
Grandeur Peak Global Opportunities Fund | Portfolio of Investments | |
October 31, 2012 (Unaudited) |
For Fund compliance purposes, the Fund’s geographical and sector classifications refer to any one or more of the sub-classifications used by one or more widely recognized market indexes or ratings group indexes, and/or as defined by Fund management. These definitions may not apply for purposes of this report, which may combine sub-classifications for reporting ease. Geographical regions and sectors are shown as a percent of net assets. These classifications are based on third party definitions. The definitions are industry terms and do not reflect the legal status of any of the investments or the companies in which the Fund has invested.
See Notes to Financial Statements.
20 | 1.855.377.7325 | www.GrandeurPeakGlobal.com |
Table of Contents
| Portfolio of Investments | ||
October 31, 2012 (Unaudited) |
| Shares | Value (Note 2) | |||||||
COMMON STOCKS (84.77%) | ||||||||
Australia (9.06%) | ||||||||
ALS, Ltd. | 56,925 | $ | 547,776 | |||||
Ausenco, Ltd. | 88,775 | 291,205 | ||||||
Billabong International, Ltd. | 220,642 | 202,699 | ||||||
Countplus, Ltd. | 145,925 | 219,643 | ||||||
DWS, Ltd. | 140,151 | 220,409 | ||||||
Lycopodium, Ltd. | 69,102 | 439,715 | ||||||
Magellan Financial Group, Ltd. | 673,555 | 2,691,871 | ||||||
Navitas, Ltd. | 42,280 | 180,823 | ||||||
The Reject Shop, Ltd. | 51,295 | 756,640 | ||||||
Sirtex Medical, Ltd. | 68,000 | 776,465 | ||||||
SMS Management & Technology, Ltd. | 25,875 | 133,761 | ||||||
Super Retail Group, Ltd. | 131,348 | 1,228,482 | ||||||
Webjet, Ltd. | 175,318 | 727,959 | ||||||
|
| |||||||
| 8,417,448 | ||||||||
|
| |||||||
Belgium (2.59%) | ||||||||
Melexis NV | 152,565 | 2,410,524 | ||||||
|
| |||||||
Bermuda (0.26%) | ||||||||
Techcomp Holdings, Ltd. | 713,000 | 238,278 | ||||||
|
| |||||||
Brazil (4.21%) | ||||||||
Banco ABC Brasil SA | 155,003 | 880,695 | ||||||
Banco Daycoval SA | 273,700 | 1,427,086 | ||||||
CETIP SA - Mercados Organizados | 52,500 | 604,860 | ||||||
Marcopolo SA | 67,000 | 335,816 | ||||||
Tegma Gestao Logistica | 38,700 | 666,896 | ||||||
|
| |||||||
| 3,915,353 | ||||||||
|
| |||||||
Britain (9.25%) | ||||||||
Abcam PLC | 74,010 | 459,823 | ||||||
Clinigen Group PLC(a) | 664,000 | 2,073,426 | ||||||
CVS Group PLC | 44,320 | 114,256 | ||||||
Fidessa Group PLC | 6,415 | 137,685 | ||||||
Halma PLC | 65,900 | 438,575 | ||||||
Highland Gold Mining, Ltd. | 52,450 | 88,451 | ||||||
Michael Page International PLC | 32,425 | 188,584 | ||||||
N Brown Group PLC | 138,495 | 751,177 | ||||||
Premier Oil PLC(a) | 162,280 | 918,418 | ||||||
Robert Walters PLC | 90,900 | 291,181 | ||||||
Semi-Annual Report | October 31, 2012 | 21 |
Table of Contents
Grandeur Peak International Opportunities Fund | Portfolio of Investments | |
October 31, 2012 (Unaudited) |
| Shares | Value (Note 2) | |||||||
Britain (continued) | ||||||||
RPS Group PLC | 541,790 | $ | 2,045,035 | |||||
Sthree PLC | 77,116 | 373,652 | ||||||
Ted Baker PLC | 19,878 | 304,103 | ||||||
Tracsis PLC | 53,100 | 124,251 | ||||||
Ultra Electronics Holdings PLC | 10,240 | 279,767 | ||||||
|
| |||||||
| 8,588,384 | ||||||||
|
| |||||||
Canada (6.25%) | ||||||||
Atrium Innovations, Inc.(a) | 19,105 | 196,837 | ||||||
Gildan Activewear, Inc. | 8,000 | 272,421 | ||||||
Gran Tierra Energy, Inc.(a) | 169,950 | 863,346 | ||||||
Home Capital Group, Inc. | 19,230 | 979,069 | ||||||
Inmet Mining Corp. | 8,635 | 445,259 | ||||||
Pan American Silver Corp. | 12,345 | 270,817 | ||||||
Petroamerica Oil Corp.(a) | 112,695 | 28,209 | ||||||
Richelieu Hardware, Ltd. | 20,950 | 728,504 | ||||||
SEMAFO, Inc. | 64,575 | 258,623 | ||||||
ShawCor, Ltd., Class A | 22,545 | 1,004,508 | ||||||
Stantec, Inc. | 11,476 | 395,269 | ||||||
TransGlobe Energy Corp.(a) | 33,480 | 360,696 | ||||||
|
| |||||||
| 5,803,558 | ||||||||
|
| |||||||
China (4.24%) | ||||||||
Airtac International Group | 47,000 | 220,419 | ||||||
China Lilang, Ltd. | 253,045 | 143,990 | ||||||
China Medical System Holdings, Ltd. | 1,620,923 | 934,901 | ||||||
Golden Eagle Retail Group, Ltd. | 266,000 | 583,480 | ||||||
Minth Group, Ltd. | 245,815 | 248,351 | ||||||
O2Micro International, Ltd., ADR(a) | 251,714 | 797,933 | ||||||
Pacific Online, Ltd. | 1,863,152 | 586,589 | ||||||
Parkson Retail Group, Ltd. | 500,000 | 423,223 | ||||||
|
| |||||||
| 3,938,886 | ||||||||
|
| |||||||
Finland (0.34%) | ||||||||
BasWare OYJ | 11,400 | 317,685 | ||||||
|
| |||||||
France (2.46%) | ||||||||
1000mercis SA | 12,894 | 701,924 | ||||||
Audika Groupe | 20,255 | 240,743 | ||||||
Neurones | 40,220 | 427,473 | ||||||
Sartorius Stedim Biotech | 5,812 | 525,213 | ||||||
22 | 1.855.377.7325 | www.GrandeurPeakGlobal.com |
Table of Contents
| Grandeur Peak International Opportunities Fund | Portfolio of Investments | |
October 31, 2012 (Unaudited) |
| Shares | Value (Note 2) | |||||||
France (continued) | ||||||||
Thermador Groupe | 5,165 | $ | 390,629 | |||||
|
| |||||||
| 2,285,982 | ||||||||
|
| |||||||
Germany (7.02%) | ||||||||
2G energy AG | 5,900 | 233,279 | ||||||
Adler Modemaerkte AG(a) | 39,200 | 212,381 | ||||||
Amadeus Fire AG | 10,845 | 503,229 | ||||||
Bertrandt AG | 17,222 | 1,440,896 | ||||||
CompuGroup Medical AG | 35,200 | 638,739 | ||||||
Gerry Weber International AG | 8,295 | 376,518 | ||||||
Nexus AG | 38,121 | 464,456 | ||||||
Softing AG(a) | 33,086 | 310,910 | ||||||
Viscom AG | 15,850 | 147,916 | ||||||
Wirecard AG | 74,170 | 1,694,858 | ||||||
zooplus AG(a) | 11,400 | 494,258 | ||||||
|
| |||||||
| 6,517,440 | ||||||||
|
| |||||||
Hong Kong (0.94%) | ||||||||
EcoGreen Fine Chemicals Group, Ltd. | 118,375 | 21,689 | ||||||
Trinity, Ltd. | 271,000 | 189,874 | ||||||
Vitasoy International Holdings, Ltd. | 462,338 | 439,069 | ||||||
Yingde Gases Group Co. | 232,855 | 220,835 | ||||||
|
| |||||||
| 871,467 | ||||||||
|
| |||||||
India (0.86%) | ||||||||
MakeMyTrip, Ltd.(a) | 51,700 | 803,935 | ||||||
|
| |||||||
Indonesia (0.53%) | ||||||||
Arwana Citramulia Tbk PT | 3,611,000 | 496,254 | ||||||
|
| |||||||
Ireland (0.87%) | ||||||||
Beazley PLC | 286,600 | 809,845 | ||||||
|
| |||||||
Israel (1.01%) | ||||||||
Caesar Stone Sdot Yam, Ltd.(a) | 21,500 | 344,860 | ||||||
Camtek, Ltd.(a) | 56,296 | 95,703 | ||||||
SodaStream International, Ltd.(a) | 14,000 | 500,500 | ||||||
|
| |||||||
| 941,063 | ||||||||
|
| |||||||
Japan (5.65%) | ||||||||
Benefit One, Inc. | 54 | 55,468 | ||||||
Semi-Annual Report | October 31, 2012 | 23 |
Table of Contents
| Grandeur Peak International Opportunities Fund | Portfolio of Investments | |
October 31, 2012 (Unaudited) |
| Shares | Value (Note 2) | |||||||
Japan (continued) | ||||||||
CMIC Co., Ltd. | 20,955 | $ | 320,507 | |||||
CyberAgent, Inc. | 196 | 391,853 | ||||||
Daiken Medical Co., Ltd. | 20,700 | 332,683 | ||||||
EPS Co., Ltd. | 188 | 560,726 | ||||||
Kakaku.com, Inc. | 12,000 | 411,124 | ||||||
MonotaRO Co., Ltd. | 42,945 | 1,128,093 | ||||||
Nihon M&A Center, Inc. | 12,600 | 378,016 | ||||||
Simplex Holdings, Inc. | 948 | 288,568 | ||||||
Trancom Co., Ltd. | 72,990 | 1,380,620 | ||||||
|
| |||||||
| 5,247,658 | ||||||||
|
| |||||||
Luxembourg (1.89%) | ||||||||
L’Occitane International SA | 562,362 | 1,752,381 | ||||||
|
| |||||||
Malaysia (2.56%) | ||||||||
Aeon Credit Service M Bhd | 163,440 | 641,741 | ||||||
JobStreet Corp. Bhd | 108,000 | 75,876 | ||||||
My EG Services Bhd | 1,220,800 | 312,614 | ||||||
Padini Holdings Bhd | 1,497,850 | 1,008,074 | ||||||
Uzma Bhd(a) | 744,200 | 342,049 | ||||||
|
| |||||||
| 2,380,354 | ||||||||
|
| |||||||
Netherlands (1.76%) | ||||||||
Brunel International NV | 18,175 | 875,157 | ||||||
VistaPrint NV(a) | 25,070 | 763,883 | ||||||
|
| |||||||
| 1,639,040 | ||||||||
|
| |||||||
Norway (0.07%) | ||||||||
Oslo Bors VPS Holding ASA | 7,635 | 64,950 | ||||||
|
| |||||||
Russia (0.18%) | ||||||||
Exillon Energy PLC(a) | 66,740 | 167,747 | ||||||
|
| |||||||
Singapore (3.06%) | ||||||||
ARA Asset Management, Ltd. | 470,920 | 611,910 | ||||||
Breadtalk Group, Ltd. | 785,375 | 386,314 | ||||||
CSE Global, Ltd. | 958,055 | 679,388 | ||||||
Goodpack, Ltd. | 262,000 | 416,691 | ||||||
Parkson Retail Asia, Ltd.(a) | 260,000 | 308,001 | ||||||
24 | 1.855.377.7325 | www.GrandeurPeakGlobal.com |
Table of Contents
Grandeur Peak International Opportunities Fund | Portfolio of Investments | |
October 31, 2012 (Unaudited) |
| Shares | Value (Note 2) | |||||||
Singapore (continued) | ||||||||
Petra Foods, Ltd. | 204,000 | $ | 438,170 | |||||
|
| |||||||
| 2,840,474 | ||||||||
|
| |||||||
South Africa (1.92%) | ||||||||
Clicks Group, Ltd. | 48,485 | 334,281 | ||||||
Ellies Holdings, Ltd. | 528,940 | 416,654 | ||||||
EOH Holdings, Ltd. | 68,156 | 290,683 | ||||||
Foschini Group, Ltd. | 23,770 | 345,119 | ||||||
Pinnacle Technology Holdings, Ltd. | 129,500 | 256,143 | ||||||
Value Group, Ltd. | 227,990 | 136,731 | ||||||
|
| |||||||
| 1,779,611 | ||||||||
|
| |||||||
South Korea (5.18%) | ||||||||
Daewoong Pharma Co. | 2,969 | 130,945 | ||||||
Daum Communications Corp. | 5,500 | 472,538 | ||||||
Hy-Lok Corp. | 38,528 | 777,202 | ||||||
iMarketKorea, Inc. | 19,960 | 474,018 | ||||||
Koh Young Technology, Inc. | 29,400 | 680,680 | ||||||
Korean Reinsurance Co. | 21,600 | 211,920 | ||||||
LEENO Industrial, Inc. | 10,800 | 324,317 | ||||||
LG Fashion Corp. | 34,470 | 960,836 | ||||||
MKTrend Co., Ltd. | 40,660 | 310,188 | ||||||
Shinsegae Food Co., Ltd. | 4,674 | 467,143 | ||||||
|
| |||||||
| 4,809,787 | ||||||||
|
| |||||||
Sweden (3.00%) | ||||||||
AddTech AB, B Shares | 29,011 | 723,864 | ||||||
Connecta AB | 9,670 | 71,728 | ||||||
DIBS Payment Services AB | 83,100 | 651,480 | ||||||
HIQ International AB(a) | 123,400 | 561,848 | ||||||
Indutrade AB | 21,950 | 615,523 | ||||||
Swedol AB, B Shares | 47,310 | 160,484 | ||||||
|
| |||||||
| 2,784,927 | ||||||||
|
| |||||||
Taiwan (6.00%) | ||||||||
Cub Elecparts, Inc. | 170,000 | 340,436 | ||||||
Global Mixed Mode Technology, Inc. | 134,500 | 433,715 | ||||||
Leadtrend Technology Corp. | 167,000 | 260,683 | ||||||
Pacific Hospital Supply Co. | 288,700 | 841,023 | ||||||
Polyronics Tech Corp. | 498,300 | 869,946 | ||||||
Power Mate Technology Co., Ltd. | 176,000 | 201,831 | ||||||
Semi-Annual Report | October 31, 2012 | 25 |
Table of Contents
| Grandeur Peak International Opportunities Fund | Portfolio of Investments | |
October 31, 2012 (Unaudited) |
| Shares | Value (Note 2) | |||||||
Taiwan (continued) | ||||||||
Richtek Technology Corp. | 50,000 | $ | 272,144 | |||||
Sporton International, Inc. | 194,208 | 440,770 | ||||||
Taiwan Hon Chuan Enterprise Co., Ltd. | 441,800 | 940,692 | ||||||
Test Research, Inc. | 254,880 | 417,057 | ||||||
TXC Corp. | 316,900 | 551,083 | ||||||
|
| |||||||
| 5,569,380 | ||||||||
|
| |||||||
Thailand (0.37%) | ||||||||
Coastal Energy Co. (London Exchange)(a) | 5,218 | 96,332 | ||||||
Coastal Energy Co. (Toronto Exchange)(a) | 13,000 | 244,315 | ||||||
|
| |||||||
| 340,647 | ||||||||
|
| |||||||
Turkey (1.48%) | ||||||||
Albaraka Turk Katilim Bankasi AS(a) | 412,000 | 326,382 | ||||||
Emlak Konut Gayrimenkul Yatirim Ortakligi AS | 217,000 | 323,230 | ||||||
Katmerciler Arac Ustu Ekipman Sanayi ve Ticaret AS(a) | 230,310 | 495,954 | ||||||
TAV Havalimanlari Holding AS | 47,000 | 233,361 | ||||||
|
| |||||||
| 1,378,927 | ||||||||
|
| |||||||
United Arab Emirates (0.36%) | ||||||||
Aramex PJSC | 626,900 | 331,115 | ||||||
|
| |||||||
United States (1.40%) | ||||||||
Nu Skin Enterprises, Inc., Class A | 27,400 | 1,296,842 | ||||||
|
| |||||||
TOTAL COMMON STOCKS (Cost $72,017,844) | 78,739,942 | |||||||
|
| |||||||
EXCHANGE TRADED FUNDS (0.35%) | ||||||||
Market Vectors® India Small-Cap Index ETF | 30,770 | 320,008 | ||||||
TOTAL EXCHANGE TRADED FUNDS (Cost $384,150) | 320,008 | |||||||
|
| |||||||
26 | 1.855.377.7325 | www.GrandeurPeakGlobal.com |
Table of Contents
Grandeur Peak International Opportunities Fund | Portfolio of Investments | |
October 31, 2012 (Unaudited) |
| Shares | Value (Note 2) | |||||||
SHORT TERM INVESTMENTS (11.89%) | ||||||||
BlackRock Liquidity Funds Treasury Trust Fund Portfolio - Institutional Class (7 Day Yield 0.127%) | 11,044,037 | $ | 11,044,037 | |||||
|
| |||||||
TOTAL SHORT TERM INVESTMENTS (Cost $ 11,044,037) | 11,044,037 | |||||||
|
| |||||||
TOTAL INVESTMENTS (97.01%) (Cost $ 83,446,031) | $ | 90,103,987 | ||||||
Assets In Excess Of Other Liabilities (2.99%) | 2,779,231 | |||||||
|
| |||||||
NET ASSETS (100.00%) | $ | 92,883,218 | ||||||
|
| |||||||
| (a) | Non-Income Producing Security. |
Percentages stated as a percent of net assets.
Common Abbreviations:
AB - Aktiebolag is the Swedish equivalent of the term corporation.
ADR - American Depositary Receipt.
AG - Aktiengesellschaft is a German term that refers to a corporation that is limited by shares,
i.e., owned by shareholders.
AS - Aktieselskab is the Danish term for a stock-based corporation.
ASA - Allmennaksjeselskap is the Norwegian term for a public limited company.
Bhd - Berhad is the Malaysian term for public limited company.
ETF - Exchange Traded Fund.
Ltd. - Limited.
NV - Naamloze Vennootschap is the Dutch term for a public limited liability corporation.
OYJ - Julkinen Osakeyhtiö is the Finnish term for a public limited company.
PLC - Public Limited Company.
PJSC - Public Joint Stock Company.
SA - Generally designates corporations in various countries, mostly those employing the civil law.
Tbk PT - Terbuka Perseroan Terbatas is an Indonesian term for a limited liability company.
For Fund compliance purposes, the Fund’s country classifications refer to any one or more of the country sub-classifications used by one or more widely recognized market indexes or ratings group indexes, and/or as defined by Fund management. This definition may not apply for purposes of this report, which may combine country sub-classifications for reporting ease. Countries are shown as a percent of net assets. These country classifications are based on third party definitions. The definitions are industry terms and do not reflect the legal status of any of the investments or the companies in which the Fund has invested.
See Notes to Financial Statements.
Semi-Annual Report | October 31, 2012 | 27 |
Table of Contents
Grandeur Peak FundsSM | Statement of Assets and Liabilities | |
October 31, 2012 (Unaudited) |
| Grandeur Peak Global Opportunities | Grandeur Peak International Opportunities | |||||||
ASSETS | ||||||||
Investments, at value (Cost - see below) | $ | 186,411,220 | $ | 90,103,987 | ||||
Foreign cash, at value | 3,770,982 | 2,643,856 | ||||||
Dividends and interest receivable | 107,153 | 55,493 | ||||||
Receivable for investments sold | 2,430,590 | 612,198 | ||||||
Receivable for fund shares subscribed | 315,289 | 388,838 | ||||||
Prepaid and other assets | 25,806 | 19,877 | ||||||
Total assets | 193,061,040 | 93,824,249 | ||||||
LIABILITIES | ||||||||
Payable to custodian | 169 | – | ||||||
Payable for investments purchased | 481,858 | 805,829 | ||||||
Payable for fund shares redeemed | 83,537 | 4,050 | ||||||
Advisory fees payable | 194,009 | 83,922 | ||||||
Administration fees payable | 14,515 | 7,232 | ||||||
Custodian fees payable | 22,245 | 12,295 | ||||||
Payable for trustee fees | 2,215 | – | ||||||
Payable for chief compliance officer fee | 1,641 | 1,641 | ||||||
Payable for principal financial officer fees | 547 | 547 | ||||||
Distribution and service fees payable | 17,839 | 2,822 | ||||||
Accrued expenses and other liabilities | 33,061 | 22,693 | ||||||
Total liabilities | 851,636 | 941,031 | ||||||
NET ASSETS | $ | 192,209,404 | $ | 92,883,218 | ||||
| ||||||||
NET ASSETS CONSISTS OF | ||||||||
Paid-in capital (Note 5) | $ | 175,183,691 | $ | 85,423,551 | ||||
Accumulated net investment income | 546,969 | 384,578 | ||||||
Accumulated net realized gain on investments and foreign currency transactions | 2,792,229 | 358,794 | ||||||
Net unrealized appreciation on investments and translation of assets and liabilities in foreign currencies | 13,686,515 | 6,716,295 | ||||||
NET ASSETS | $ | 192,209,404 | $ | 92,883,218 | ||||
| ||||||||
INVESTMENTS, AT COST | $ | 172,639,378 | $ | 83,446,031 | ||||
28 | 1.855.377.7325 | www.GrandeurPeakGlobal.com |
Table of Contents
Grandeur Peak FundsSM | Statement of Assets and Liabilities (continued) | |
October 31, 2012 (Unaudited) |
| Grandeur Peak Global Opportunities | Grandeur Peak International Opportunities | |||||||
PRICING OF SHARES | ||||||||
Investor Class | ||||||||
Net Assets | $ | 85,085,949 | $ | 14,373,281 | ||||
Net Asset Value, offering and redemption price per share | $ | 2.41 | $ | 2.41 | ||||
Shares of beneficial interest outstanding | 35,346,567 | 5,955,014 | ||||||
Institutional Class | ||||||||
Net Assets | $ | 107,123,455 | $ | 78,509,937 | ||||
Net Asset Value, offering and redemption price per share | $ | 2.42 | $ | 2.42 | ||||
Shares of beneficial interest outstanding | 44,261,463 | 32,450,572 | ||||||
See Notes to Financial Statements.
Semi-Annual Report | October 31, 2012 | 29 |
Table of Contents
Grandeur Peak FundsSM | Statements of Operations | |
For the Six Months Ended October 31, 2012 (Unaudited) |
| Grandeur Peak Global | Grandeur Peak Opportunities | ||||||
INVESTMENT INCOME | ||||||||
Dividends | $ | 2,356,660 | $ | 1,217,672 | ||||
Interest | 55 | 256 | ||||||
Foreign taxes withheld | (160,954 | ) | (107,757 | ) | ||||
Total investment income | 2,195,761 | 1,110,171 | ||||||
EXPENSES | ||||||||
Investment advisor fees (Note 6) | 1,019,943 | 440,191 | ||||||
Administrative fees | 75,363 | 35,379 | ||||||
Distribution and service fees - Investor Class | 95,703 | 13,008 | ||||||
Transfer agent fees | 33,634 | 17,106 | ||||||
Legal fees | 4,029 | 1,627 | ||||||
Printing fees | 6,928 | 1,851 | ||||||
Registration fees | 13,748 | 13,244 | ||||||
Audit and tax preparation fees | 9,996 | 9,794 | ||||||
Custodian fees | 46,015 | 29,386 | ||||||
Insurance | 179 | 77 | ||||||
Trustee fees | 6,662 | 2,460 | ||||||
Chief compliance officer fees | 7,891 | 7,891 | ||||||
Principal financial officer fees | 2,630 | 2,631 | ||||||
Offering costs | 34,146 | 31,823 | ||||||
Other expenses | 11,525 | 9,292 | ||||||
Total expenses | 1,368,392 | 615,760 | ||||||
Less fees waived/reimbursed by investment advisor | ||||||||
Investor Class | (23,053 | ) | (10,978 | ) | ||||
Institutional Class | (26,171 | ) | (63,544 | ) | ||||
Total net expenses | 1,319,168 | 541,238 | ||||||
NET INVESTMENT INCOME | 876,593 | 568,933 | ||||||
REALIZED AND UNREALIZED GAIN/(LOSS) ON INVESTMENTS | ||||||||
Net realized gain on investments | 2,375,745 | 685,547 | ||||||
Net realized loss on foreign currency transactions | (153,489 | ) | (60,589 | ) | ||||
Net change in unrealized appreciation on investments | 5,289,319 | 3,304,355 | ||||||
Net change in unrealized appreciation/(depreciation) on translation of assets and liabilities in foreign currencies | (86,503 | ) | 50,031 | |||||
NET REALIZED AND UNREALIZED GAIN ON INVESTMENTS AND FOREIGN CURRENCY TRANSACTIONS | 7,425,072 | 3,979,344 | ||||||
NET INCREASE IN NET ASSETS RESULTING FROM OPERATIONS | $ | 8,301,665 | $ | 4,548,277 | ||||
See Notes to Financial Statements.
30 | 1.855.377.7325 | www.GrandeurPeakGlobal.com |
Table of Contents
| Grandeur Peak Global Opportunities Fund | Statements of Changes in Net Assets |
| For the Six Months Ended (Unaudited) | For the Period April 30, 2012 | ||||||
OPERATIONS | ||||||||
Net investment income | $ | 876,593 | $ | 95,503 | ||||
Net realized gain on investments and foreign currency transactions | 2,222,256 | 101,624 | ||||||
Net change in unrealized appreciation on investments and foreign currency translations | 5,202,816 | 9,712,622 | ||||||
Net increase in net assets resulting from operations | 8,301,665 | 9,909,749 | ||||||
CAPITAL SHARE TRANSACTIONS (NOTE 5) | ||||||||
Investor Class | ||||||||
Proceeds from sales of shares | 12,297,547 | 70,935,320 | ||||||
Cost of shares redeemed | (3,943,983) | (479,829) | ||||||
Redemption fees | 4,404 | 1,255 | ||||||
Net increase from capital shares transactions | 8,357,968 | 70,456,746 | ||||||
Institutional Class | ||||||||
Proceeds from sales of shares | 28,918,594 | 70,797,423 | ||||||
Cost of shares redeemed | (4,260,527) | (272,865) | ||||||
Redemption fees | 489 | 162 | ||||||
Net increase from capital shares transactions | 24,658,556 | 70,524,720 | ||||||
Net increase in net assets | 41,318,189 | 150,891,215 | ||||||
NET ASSETS | ||||||||
Beginning of period | 150,891,215 | – | ||||||
End of period* | $ | 192,209,404 | $ | 150,891,215 | ||||
*Including accumulated net investment income/(loss) of: | $ | 546,969 | $ | (329,624) | ||||
Semi-Annual Report | October 31, 2012 | 31 |
Table of Contents
| Grandeur Peak Global Opportunities Fund | Statements of Changes in Net Assets (continued) |
For the Six Months Ended (Unaudited) | For the Period April 30, 2012 | |||||||
OTHER INFORMATION | ||||||||
Shares Transactions | ||||||||
Investor Class | ||||||||
Issued | 5,412,692 | 31,896,998 | ||||||
Redeemed | (1,742,180) | (220,943) | ||||||
Net increase in share transactions | 3,670,512 | 31,676,055 | ||||||
Institutional Class | ||||||||
Issued | 12,634,094 | 33,638,446 | ||||||
Redeemed | (1,891,311) | (119,766) | ||||||
Net increase in share transactions | 10,742,783 | 33,518,680 | ||||||
See Notes to Financial Statements.
32 | 1.855.377.7325 | www.GrandeurPeakGlobal.com |
Table of Contents
| Grandeur Peak International Opportunities Fund | Statements of Changes in Net Assets |
| For the Six Months Ended (Unaudited) | For the Period October 17, 2011 April 30, 2012 | ||||||
OPERATIONS | ||||||||
Net investment income | $ | 568,933 | $ | 68,526 | ||||
Net realized gain/(loss) on investments and foreign currency transactions | 624,958 | (555,062) | ||||||
Net change in unrealized appreciation on investments and foreign currency translations | 3,354,386 | 4,261,024 | ||||||
Net increase in net assets resulting from operations | 4,548,277 | 3,774,488 | ||||||
CAPITAL SHARE TRANSACTIONS (NOTE 5) | ||||||||
Investor Class | ||||||||
Proceeds from sales of shares | 5,384,500 | 8,652,042 | ||||||
Cost of shares redeemed | (983,199) | (306,774) | ||||||
Redemption fees | 451 | 196 | ||||||
Net increase from capital shares transactions | 4,401,752 | 8,345,464 | ||||||
Institutional Class | ||||||||
Proceeds from sales of shares | 20,523,855 | 52,679,495 | ||||||
Cost of shares redeemed | (1,322,326) | (69,011) | ||||||
Redemption fees | 40 | 1,184 | ||||||
Net increase from capital shares transactions | 19,201,569 | 52,611,668 | ||||||
Net increase in net assets | 28,151,598 | 64,731,620 | ||||||
NET ASSETS | ||||||||
Beginning of period | 64,731,620 | – | ||||||
End of period* | $ | 92,883,218 | $ | 64,731,620 | ||||
*Including accumulated net investment income/(loss) of: | $ | 384,578 | $ | (184,355) | ||||
Semi-Annual Report | October 31, 2012 | 33 |
Table of Contents
| Grandeur Peak International Opportunities Fund | Statements of Changes in Net Assets (continued) |
For the Six Months Ended (Unaudited) | For the Period April 30, 2012 | |||||||
OTHER INFORMATION | ||||||||
Shares Transactions | ||||||||
Investor Class | ||||||||
Issued | 2,338,450 | 4,205,017 | ||||||
Redeemed | (441,569) | (146,884) | ||||||
Net increase in share transactions | 1,896,881 | 4,058,133 | ||||||
Institutional Class | ||||||||
Issued | 8,814,370 | 24,273,224 | ||||||
Redeemed | (606,306) | (30,716) | ||||||
Net increase in share transactions | 8,208,064 | 24,242,508 | ||||||
See Notes to Financial Statements
34 | 1.855.377.7325 | www.GrandeurPeakGlobal.com |
Table of Contents
| Financial Highlights | ||
For a share outstanding throughout the periods presented. |
| Investor Class | For the Six Months Ended | For the Period October 17, 2011 (Inception) to April 30, 2012 | ||||||
NET ASSET VALUE, BEGINNING OF PERIOD | $ 2.31 | $ 2.00 | ||||||
INCOME FROM INVESTMENT OPERATIONS | ||||||||
Net investment income/(loss)(a) | 0.01 | (0.00) | (b) | |||||
Net realized and unrealized gain on investments | 0.09 | 0.31 | ||||||
Total income from investment operations | 0.10 | 0.31 | ||||||
REDEMPTION FEES ADDED TO PAID-IN CAPITAL (Note 5) | 0.00 | (b) | 0.00 | (b) | ||||
INCREASE IN NET ASSET VALUE | 0.10 | 0.31 | ||||||
NET ASSET VALUE, END OF PERIOD | $ 2.41 | $ 2.31 | ||||||
TOTAL RETURN | 4.33% | (c) | 15.50% | (c) | ||||
RATIOS AND SUPPLEMENTAL DATA | ||||||||
Net assets, end of period (in 000s) | $ 85,086 | $ 73,154 | ||||||
RATIOS TO AVERAGE NET ASSETS | ||||||||
Expenses (excluding fees waived/reimbursed by investment advisor) | 1.81% | (d) | 2.30% | (d) | ||||
Expenses (including fees waived/reimbursed by investment advisor) | 1.75% | (d) | 1.75% | (d) | ||||
Net investment income/(loss) | 0.95% | (d) | (0.04)% | (d) | ||||
PORTFOLIO TURNOVER RATE | 17% | (c) | 42% | (c) | ||||
| (a) | Per share numbers have been calculated using the average shares method. |
| (b) | Less than $0.005 per share. |
| (c) | Not Annualized. |
| (d) | Annualized. |
See Notes to Financial Statements.
Semi-Annual Report | October 31, 2012 | 35 |
Table of Contents
Grandeur Peak Global Opportunities Fund | Financial Highlights | |
For a share outstanding throughout the periods presented. |
| Institutional Class | For the Six Months Ended | For the Period October 17, 2011 (Inception) to April 30, 2012 | ||||||
NET ASSET VALUE, BEGINNING OF PERIOD | $ 2.32 | $ 2.00 | ||||||
INCOME FROM INVESTMENT OPERATIONS | ||||||||
Net investment income(a) | 0.01 | 0.00 | (b) | |||||
Net realized and unrealized gain on investments | 0.09 | 0.32 | ||||||
Total income from investment operations | 0.10 | 0.32 | ||||||
REDEMPTION FEES ADDED TO PAID-IN CAPITAL (Note 5) | 0.00 | (b) | 0.00 | (b) | ||||
INCREASE IN NET ASSET VALUE | 0.10 | 0.32 | ||||||
NET ASSET VALUE, END OF PERIOD | $ 2.42 | $ 2.32 | ||||||
TOTAL RETURN | 4.31% | (c) | 16.00% | (c) | ||||
RATIOS AND SUPPLEMENTAL DATA | ||||||||
Net assets, end of period (in 000s) | $ 107,123 | $ 77,737 | ||||||
RATIOS TO AVERAGE NET ASSETS | ||||||||
Expenses (excluding fees waived/reimbursed by investment advisor) | 1.56% | (d) | 2.03% | (d) | ||||
Expenses (including fees waived/reimbursed by investment advisor) | 1.50% | (d) | 1.50% | (d) | ||||
Net investment income | 1.19% | (d) | 0.40% | (d) | ||||
PORTFOLIO TURNOVER RATE | 17% | (c) | 42% | (c) | ||||
| (a) | Per share numbers have been calculated using the average shares method. |
| (b) | Less than $0.005 per share. |
| (c) | Not Annualized. |
| (d) | Annualized. |
See Notes to Financial Statements.
36 | 1.855.377.7325 | www.GrandeurPeakGlobal.com |
Table of Contents
| Financial Highlights | ||
For a share outstanding throughout the periods presented. | ||
| Investor Class | For the Six Months Ended October 31, 2012 | For the Period October 17, 2011 (Inception) to April 30, 2012 | ||||||
NET ASSET VALUE, BEGINNING OF PERIOD | $ 2.29 | $ 2.00 | ||||||
INCOME FROM INVESTMENT OPERATIONS | ||||||||
Net investment income(a) | 0.02 | 0.00 | (b) | |||||
Net realized and unrealized gain on investments | 0.10 | 0.29 | ||||||
Total income from investment operations | 0.12 | 0.29 | ||||||
REDEMPTION FEES ADDED TO PAID-IN CAPITAL (Note 5) | 0.00 | (b) | 0.00 | (b) | ||||
INCREASE IN NET ASSET VALUE | 0.12 | 0.29 | ||||||
NET ASSET VALUE, END OF PERIOD | $ 2.41 | $ 2.29 | ||||||
TOTAL RETURN | 5.24% | (c) | 14.50% | (c) | ||||
RATIOS AND SUPPLEMENTAL DATA | ||||||||
Net assets, end of period (in 000s) | $ 14,373 | $ 9,274 | ||||||
RATIOS TO AVERAGE NET ASSETS | ||||||||
Expenses (excluding fees waived/reimbursed by investment advisor) | 1.96% | (d) | 2.94% | (d) | ||||
Expenses (including fees waived/reimbursed by investment advisor) | 1.75% | (d) | 1.75% | (d) | ||||
Net investment income | 1.40% | (d) | 0.33% | (d) | ||||
PORTFOLIO TURNOVER RATE | 14% | (c) | 24% | (c) | ||||
| (a) | Per share numbers have been calculated using the average shares method. |
| (b) | Less than $0.005 per share. |
| (c) | Not Annualized. |
| (d) | Annualized. |
See Notes to Financial Statements.
Semi-Annual Report | October 31, 2012 | 37 |
Table of Contents
Grandeur Peak International Opportunities Fund | Financial Highlights | |
For a share outstanding throughout the periods presented. | ||
| Institutional Class | For the Six Months Ended | For the Period (Inception) to April 30, 2012 | ||||||
NET ASSET VALUE, BEGINNING OF PERIOD | $ 2.29 | $ 2.00 | ||||||
INCOME FROM INVESTMENT OPERATIONS | ||||||||
Net investment income(a) | 0.02 | 0.01 | ||||||
Net realized and unrealized gain on investments | 0.11 | 0.28 | ||||||
Total income from investment operations | 0.13 | 0.29 | ||||||
REDEMPTION FEES ADDED TO PAID-IN CAPITAL (Note 5) | 0.00 | (b) | 0.00 | (b) | ||||
INCREASE IN NET ASSET VALUE | 0.13 | 0.29 | ||||||
NET ASSET VALUE, END OF PERIOD | $ 2.42 | $ 2.29 | ||||||
TOTAL RETURN | 5.68% | (c) | 14.50% | (c) | ||||
RATIOS AND SUPPLEMENTAL DATA | ||||||||
Net assets, end of period (in 000s) | $ 78,510 | $ 55,458 | ||||||
RATIOS TO AVERAGE NET ASSETS | ||||||||
Expenses (excluding fees waived/reimbursed by investment advisor) | 1.71% | (d) | 2.50% | (d) | ||||
Expenses (including fees waived/reimbursed by investment advisor) | 1.50% | (d) | 1.50% | (d) | ||||
Net investment income | 1.65% | (d) | 0.56% | (d) | ||||
PORTFOLIO TURNOVER RATE | 14% | (c) | 24% | (c) | ||||
| (a) | Per share numbers have been calculated using the average shares method. |
| (b) | Less than $0.005 per share. |
| (c) | Not Annualized. |
| (d) | Annualized. |
See Notes to Financial Statements.
38 | 1.855.377.7325 | www.GrandeurPeakGlobal.com |
Table of Contents
Grandeur Peak FundsSM | Notes to Financial Statements | |
October 31, 2012 (Unaudited) |
1. ORGANIZATION
Financial Investors Trust (the “Trust”), a Delaware statutory trust, is an open-end management investment company registered under the Investment Company Act of 1940, as amended (“1940 Act”). As of October 31, 2012, the Trust had 24 registered funds. This semi-annual report describes the Grandeur Peak Global Opportunities Fund and Grandeur Peak International Opportunities Fund (each a “Fund” and collectively, the “Funds”). The Grandeur Peak Global Opportunities Fund seeks long-term growth of capital and invests primarily in foreign and domestic small and micro cap companies. The Grandeur Peak International Opportunities Fund seeks long-term growth of capital and invests primarily in foreign small and micro cap companies. The Funds offer Investor Class and Institutional Class shares. All classes of shares have identical rights to earnings, assets and voting privileges, except for class specific expenses and exclusive rights to vote on matters affecting only individual classes.
2. SIGNIFICANT ACCOUNTING POLICIES
The following is a summary of significant accounting policies consistently followed by the Funds. These policies are in conformity with U.S. generally accepted accounting principles (“GAAP”).
The preparation of financial statements in accordance with GAAP requires management to make certain estimates and assumptions that affect the reported amounts and disclosures in the financial statements during the reporting period. Management believes the estimates and security valuations are appropriate; however, actual results may differ from those estimates, and the security valuations reflected in the financial statements may differ from the value the Funds ultimately realize upon sale of the securities.
Investment Valuation: The Funds generally value their securities based on market prices determined at the close of regular trading on the New York Stock Exchange (“NYSE”), normally 4:00 p.m. Eastern Time, on each day the NYSE is open for trading.
For equity securities and mutual funds that are traded on an exchange, the market price is usually the closing sale or official closing price on that exchange. In the case of equity securities not traded on an exchange, or if such closing prices are not otherwise available, the securities are valued at the mean of the most recent bid and ask prices on such day.
Equity securities that are primarily traded on foreign securities exchanges are valued at the closing values of such securities on their respective foreign exchanges, except when an event occurs subsequent to the close of the foreign exchange and the close of the NYSE that was likely to have changed such value. In such an event, the fair value of those securities are determined in good faith through consideration of other factors in accordance with procedures established by and under the general supervision of the Board of Trustees (the “Board”). The Funds will use a fair valuation model provided by an independent pricing service, which is intended to reflect fair value when a security’s value or a meaningful portion of the Fund’s portfolio is believed to have been materially affected by an valuation event that has occurred between the close of the exchange or market on which the security is traded and the close of the regular trading day on the NYSE. The Funds’ valuation procedures set forth certain triggers which instruct when to use the fair valuation model.
Forward currency exchange contracts have a market value determined by the prevailing foreign currency exchange daily rates and current foreign currency exchange forward rates. The foreign
Semi-Annual Report | October 31, 2012 | 39 |
Table of Contents
Grandeur Peak FundsSM | Notes to Financial Statements | |
October 31, 2012 (Unaudited) |
currency exchange forward rates are calculated using an automated system that estimates rates on the basis of the current day foreign currency exchange rates and forward foreign currency exchange rates supplied by a pricing service.
Redeemable securities issued by open-end registered investment companies are valued at the investment company’s applicable net asset value.
When such prices or quotations are not available, or when the Fair Value Committee appointed by the Board believes that they are unreliable, securities may be priced using fair value procedures approved by the Board. The Funds may also use fair value procedures if the Fair Value Committee determines that a significant event has occurred between the time at which a market price is determined and the time at which the Funds’ NAV is calculated. In particular, the value of non-U.S. securities may be materially affected by events occurring after the close of the foreign exchange on which they are traded, but before the Funds price their shares.
Fair Value Measurements: The Funds disclose the classification of their fair value measurements following a three-tier hierarchy based on the inputs used to measure fair value. Inputs refer broadly to the assumptions that market participants would use in pricing the asset or liability, including assumptions about risk. Inputs may be observable or unobservable. Observable inputs reflect the assumptions market participants would use in pricing the asset or liability that are developed based on market data obtained from sources independent of the reporting entity. Unobservable inputs reflect the reporting entity’s own assumptions about the assumptions market participants would use in pricing the asset or liability that are developed based on the best information available.
Various inputs are used in determining the value of the Funds’ investments as of the end of the reporting period. When inputs used fall into different levels of the fair value hierarchy, the level in the hierarchy within which the fair value measurement falls is determined based on the lowest level input that is significant to the fair value measurement in its entirety. The designated input levels are not necessarily an indication of the risk or liquidity associated with these investments. These inputs are categorized in the following hierarchy under applicable financial accounting standards:
Level 1 – | Unadjusted quoted prices in active markets for identical investments, unrestricted assets or liabilities that the Funds have the ability to access at the measurement date; | |
Level 2 – | Quoted prices which are not active, quoted prices for similar assets or liabilities in active markets or inputs other than quoted prices that are observable (either directly or indirectly) for substantially the full term of the asset or liability; and | |
Level 3 – | Significant unobservable prices or inputs (including the Funds’ own assumptions in determining the fair value of investments) where there is little or no market activity for the asset or liability at the measurement date. | |
40 | 1.855.377.7325 | www.GrandeurPeakGlobal.com |
Table of Contents
Grandeur Peak FundsSM | Notes to Financial Statements | |
October 31, 2012 (Unaudited) |
The following is a summary of each input used to value the Funds as of October 31, 2012:
Investments in Securities at Value(a) | Level 1 - Quoted and Unadjusted Prices | Level 2 - Other Significant Observable Inputs | Level 3 - Significant | Total | ||||||||||||
Grandeur Peak Global Opportunities |
| |||||||||||||||
Common Stocks | ||||||||||||||||
Australia | $ | 13,597,596 | $ | – | $ | – | $ | 13,597,596 | ||||||||
Belgium | 4,612,551 | – | – | 4,612,551 | ||||||||||||
Brazil | 5,711,638 | – | – | 5,711,638 | ||||||||||||
Britain | 15,903,721 | – | – | 15,903,721 | ||||||||||||
Canada | 10,752,031 | – | – | 10,752,031 | ||||||||||||
China | 6,445,755 | – | – | 6,445,755 | ||||||||||||
France | 2,842,637 | – | – | 2,842,637 | ||||||||||||
Germany | 9,674,644 | – | – | 9,674,644 | ||||||||||||
Hong Kong | 1,213,061 | – | – | 1,213,061 | ||||||||||||
Indonesia | 549,714 | – | – | 549,714 | ||||||||||||
Ireland | 1,425,282 | – | – | 1,425,282 | ||||||||||||
Israel | 1,632,365 | – | – | 1,632,365 | ||||||||||||
Japan | 7,432,032 | – | – | 7,432,032 | ||||||||||||
Luxembourg | 2,804,975 | – | – | 2,804,975 | ||||||||||||
Malaysia | 3,169,432 | – | – | 3,169,432 | ||||||||||||
Mauritius | 1,062,065 | – | – | 1,062,065 | ||||||||||||
Netherlands | 2,916,125 | – | – | 2,916,125 | ||||||||||||
Russia | 172,796 | – | – | 172,796 | ||||||||||||
Singapore | 4,160,651 | – | – | 4,160,651 | ||||||||||||
South Africa | 1,353,139 | – | – | 1,353,139 | ||||||||||||
South Korea | 5,240,795 | – | – | 5,240,795 | ||||||||||||
Sweden | 3,160,514 | – | – | 3,160,514 | ||||||||||||
Taiwan | 7,513,518 | – | – | 7,513,518 | ||||||||||||
Thailand | 219,470 | – | – | 219,470 | ||||||||||||
Turkey | 1,572,149 | – | – | 1,572,149 | ||||||||||||
United Arab Emirates | 398,828 | – | – | 398,828 | ||||||||||||
United States | 64,782,207 | – | – | 64,782,207 | ||||||||||||
Exchange Traded Funds | 452,036 | – | – | 452,036 | ||||||||||||
Short Term Investments | 5,639,493 | – | – | 5,639,493 | ||||||||||||
Total | $ | 186,411,220 | $ | – | $ | – | $ | 186,411,220 | ||||||||
| (a) | For detailed descriptions of countries, see the accompanying Portfolio of Investments. |
Semi-Annual Report | October 31, 2012 | 41 |
Table of Contents
Grandeur Peak FundsSM | Notes to Financial Statements | |
October 31, 2012 (Unaudited) |
Investments in Securities at Value(a) | Level 1 - Quoted and Unadjusted Prices | Level 2 - Other Significant Observable Inputs | Level 3 - Significant Unobservable Inputs | Total | ||||||||||||
Grandeur Peak International Opportunities |
| |||||||||||||||
Common Stocks | ||||||||||||||||
Australia | $ | 8,417,448 | $ | – | $ | – | $ | 8,417,448 | ||||||||
Belgium | 2,410,524 | – | – | 2,410,524 | ||||||||||||
Bermuda | 238,278 | – | – | 238,278 | ||||||||||||
Brazil | 3,915,353 | – | – | 3,915,353 | ||||||||||||
Britain | 8,588,384 | – | – | 8,588,384 | ||||||||||||
Canada | 5,803,558 | – | – | 5,803,558 | ||||||||||||
Cayman Islands | 244,315 | – | – | 244,315 | ||||||||||||
China | 3,938,886 | – | – | 3,938,886 | ||||||||||||
Finland | 317,685 | – | – | 317,685 | ||||||||||||
France | 2,285,982 | – | – | 2,285,982 | ||||||||||||
Germany | 6,517,440 | – | – | 6,517,440 | ||||||||||||
Hong Kong | 871,467 | – | – | 871,467 | ||||||||||||
Indonesia | 496,254 | – | – | 496,254 | ||||||||||||
Ireland | 809,845 | – | – | 809,845 | ||||||||||||
Israel | 941,063 | – | – | 941,063 | ||||||||||||
Japan | 5,247,658 | – | – | 5,247,658 | ||||||||||||
Luxembourg | 1,752,381 | – | – | 1,752,381 | ||||||||||||
Malaysia | 2,380,354 | – | – | 2,380,354 | ||||||||||||
Mauritius | 803,935 | – | – | 803,935 | ||||||||||||
Netherlands | 1,639,040 | – | – | 1,639,040 | ||||||||||||
Norway | 64,950 | – | – | 64,950 | ||||||||||||
Russia | 167,747 | – | – | 167,747 | ||||||||||||
Singapore | 2,840,474 | – | – | 2,840,474 | ||||||||||||
South Africa | 1,779,611 | – | – | 1,779,611 | ||||||||||||
South Korea | 4,809,787 | – | – | 4,809,787 | ||||||||||||
Sweden | 2,784,927 | – | – | 2,784,927 | ||||||||||||
Taiwan | 5,569,380 | – | – | 5,569,380 | ||||||||||||
Thailand | 96,332 | – | – | 96,332 | ||||||||||||
Turkey | 1,378,927 | – | – | 1,378,927 | ||||||||||||
United Arab Emirates | 331,115 | – | – | 331,115 | ||||||||||||
United States | 1,296,842 | – | – | 1,296,842 | ||||||||||||
Exchange Traded Funds | 320,008 | – | – | 320,008 | ||||||||||||
Short Term Investments | 11,044,037 | – | – | 11,044,037 | ||||||||||||
Total | $ | 90,103,987 | $ | – | $ | – | $ | 90,103,987 | ||||||||
| (a) | For detailed descriptions of countries, see the accompanying Portfolio of Investments. |
42 | 1.855.377.7325 | www.GrandeurPeakGlobal.com |
Table of Contents
Grandeur Peak FundsSM | Notes to Financial Statements | |
October 31, 2012 (Unaudited) |
The Funds recognize transfers between levels as of the beginning of the annual period in which the transfer occurred. For the period ended October 31, 2012, the Funds did not have any transfers between Level 1 and Level 2 securities. The following is a reconciliation of assets in which significant unobservable inputs (Level 3) were used in determining fair value:
Grandeur Peak Global Opportunities Fund
Investments in Securities at Value | Balance as of April 30, 2012 | Realized gain/(loss) | Change in unrealized appreciation/ (depreciation) | Net purchases/ (sales) | Transfer in and /or (out) of Level 3 | Balance as of October 31, 2012 | Net change in still held at | |||||||||||||||||||||
Common Stocks | $ | 190,464 | $ | (127,800 | ) | $ | 52,117 | $ | (114,781 | ) | $ | – | $ | – | $ – | |||||||||||||
Total | $ | 190,464 | $ | (127,800 | ) | $ | 52,117 | $ | (114,781 | ) | $ | – | $ | – | $ – | |||||||||||||
Grandeur Peak International Opportunities Fund
Investments in Securities at Value | Balance as of April 30, 2012 | Realized gain/(loss) | Change in unrealized appreciation/ (depreciation) | Net purchases/ (sales) | Transfer in and /or (out) of Level 3 | Balance as of October 31, 2012 | Net change in unrealized appreciation/ (depreciation) included in the statement of operations attributable to level 3 investments still held at October 31, 2012 | |||||||||||||||||||||
Common Stocks | $ | 110,632 | $ | (78,585 | ) | $ | 34,624 | $ | (66,671 | ) | $ | – | $ | – | $ – | |||||||||||||
Total | $ | 110,632 | $ | (78,585 | ) | $ | 34,624 | $ | (66,671 | ) | $ | – | $ | – | $ – | |||||||||||||
Trust Expenses: Some expenses of the Trust can be directly attributed to the Funds. Expenses which cannot be directly attributed to the Funds are apportioned among all funds in the Trust based on average net assets of each fund.
Fund and Class Expenses: Expenses that are specific to a Fund or class of shares of a Fund are charged directly to that Fund or share class. Expenses that are common to all Funds generally are allocated among the Funds in proportion to their average daily net assets.
Fees provided under the distribution (Rule 12b-1) and/or shareholder service plans for a particular class of the Funds are charged to the operations of such class.
Offering Costs: Offering costs, including costs of printing initial prospectuses, legal and registration fees, are being amortized over twelve months from the inception date of the Funds.
Federal Income Taxes: The Funds comply with the requirements under Subchapter M of the Internal Revenue Code of 1986, as amended, applicable to regulated investment companies and intend to distribute substantially all of their net taxable income and net capital gains, if any, each year. The Funds are not subject to income taxes to the extent such distributions are made.
Semi-Annual Report | October 31, 2012 | 43 |
Table of Contents
Grandeur Peak FundsSM | Notes to Financial Statements | |
October 31, 2012 (Unaudited) |
As of and during the six months ended October 31, 2012, the Funds did not have a liability for any unrecognized tax benefits in the accompanying financial statements. The Funds file income tax returns in the U.S. federal jurisdiction and Colorado.
Investment Transactions: Investment transactions are accounted for on the date the investments are purchased or sold (trade date). Realized gains and losses from investment transactions are reported on an identified cost basis. Interest income, which includes accretion of discounts, is accrued and recorded as earned. Dividend income is recognized on the ex-dividend date or for certain foreign securities, as soon as information is available to the Funds.
Foreign Securities: The Funds may directly purchase securities of foreign issuers. Investing in securities of foreign issuers involves special risks not typically associated with investing in securities of U.S. issuers. The risks include possible reevaluation of currencies, the inability to repatriate foreign currency, less complete financial information about companies and possible future adverse political and economic developments. Moreover, securities of many foreign issuers and their markets may be less liquid and their prices more volatile than those of securities of comparable U.S. issuers.
Foreign Currency Translation: The books and records of the Funds are maintained in U.S. dollars. Investment valuations and other assets and liabilities initially expressed in foreign currencies are converted each business day into U.S. dollars based upon current exchange rates. Prevailing foreign exchange rates may generally be obtained at the close of the NYSE (normally, 4:00 p.m. Eastern Time). The portion of realized and unrealized gains or losses on investments due to fluctuations in foreign currency exchange rates is not separately disclosed and is included in realized and unrealized gains or losses on investments, when applicable.
Foreign Currency Spot Contracts: The Funds may enter into foreign currency spot contracts to facilitate transactions in foreign securities or to convert foreign currency receipts into U.S. dollars. A foreign currency spot contract is an agreement between two parties to buy and sell currencies at the current market rate, for settlement generally within two business days. The U.S. dollar value of the contracts is determined using current currency exchange rates supplied by a pricing service. The contract is marked-to-market daily for settlements beyond one day and any change in market value is recorded as an unrealized gain or loss. When the contract is closed, a realized gain or loss is recorded equal to the difference between the value on the open and close date. Losses may arise from changes in the value of the foreign currency, or if the counterparties do not perform under the contract’s terms. The maximum potential loss from such contracts is the aggregate face value in U.S. dollars at the time the contract was opened.
Distributions to Shareholders: Each Fund normally pays dividends and distributes capital gains, if any, on an annual basis. Income dividend distributions are derived from interest and other income each Fund receives from their investments, including distributions of short term capital gains. Capital gain distributions are derived from gains realized when each Fund sells a security it has owned for more than a year. Each Fund may make additional distributions and dividends at other times if the portfolio manager believes doing so may be necessary for each Fund to avoid or reduce taxes. Net investment income/(loss) and net realized gain/(loss) may differ for financial statement and tax purposes.
44 | 1.855.377.7325 | www.GrandeurPeakGlobal.com |
Table of Contents
Grandeur Peak FundsSM | Notes to Financial Statements | |
October 31, 2012 (Unaudited) |
3. TAX BASIS INFORMATION
Tax Basis of Distributions to Shareholders: The character of distributions made during the year from net investment income or net realized gains may differ from its ultimate characterization for federal income tax purposes. Also, due to the timing of dividend distributions, the fiscal year in which amounts are distributed may differ from the fiscal year in which the income or realized gain were recorded by the Funds. During the period ended April 30, 2012 and the six months ended October 31, 2012, the Funds did not make any distributions.
Under the Regulated Investment Company Modernization Act of 2010 (the “Modernization Act”), net capital losses recognized in tax years beginning after December 22, 2010 may be carried forward indefinitely, and the character of the losses is retained as short-term and/or long-term.
As of October 31, 2012, the aggregate cost of investments, gross unrealized appreciation/(depreciation) and net unrealized appreciation for Federal tax purposes was as follows:
| Fund | Cost of Investments | Gross Unrealized Appreciation | Gross Unrealized (Depreciation) | Net appreciation of foreign currency and derivatives | Net Unrealized Appreciation | |||||||||||||||
Grandeur Peak Global Opportunities Fund | $172,694,592 | $23,189,253 | ($9,472,625 | ) | $0 | $13,716,628 | ||||||||||||||
Grandeur Peak International Opportunities | $83,471,279 | $10,830,063 | ($4,197,355 | ) | $0 | $6,632,708 | ||||||||||||||
4. SECURITIES TRANSACTIONS
The cost of purchases and proceeds from sales of securities (excluding short term securities and transfers-in-kind) during the six months ended October 31, 2012 were as follows:
| Fund | Purchases of Securities | Proceeds From Sales of Securities | ||||||
Grandeur Peak Global Opportunities | $ | 62,429,662 | $ 26,413,051 | |||||
Grandeur Peak International Opportunities | 23,377,846 | 9,217,048 | ||||||
4. SHARES OF BENEFICIAL INTEREST
The capitalization of the Trust consists of an unlimited number of shares of beneficial interest with no par value per share. Holders of the shares of the Funds of the Trust have one vote for each share held and a proportionate fraction of a vote for each fractional share. All shares issued and outstanding are fully paid and are non-assessable, transferable and redeemable at the option of the shareholder. Shares have no pre-emptive rights.
Shares redeemed within 60 days of purchase may incur a 2% short-term redemption fee deducted from the redemption amount. For the six months ended October 31, 2012, the redemption fees
Semi-Annual Report | October 31, 2012 | 45 |
Table of Contents
Grandeur Peak FundsSM | Notes to Financial Statements | |
October 31, 2012 (Unaudited) |
charged were $4,893 and $491 for the Global Opportunities Fund and International Opportunities Fund, respectively.
Beneficial Ownership: The beneficial ownership, either directly or indirectly, of more than 25% of the voting securities of any class of a Fund creates a presumption of control of the Fund under Section 2(a)(9) of the 1940 Act. As of October 31, 2012, the following entities owned beneficially 25% or greater of each Fund’s outstanding shares. The shares are held under omnibus accounts (whereby the transactions of two or more shareholders are combined and carried in the name of the originating broker rather than designated separately).
| Fund | Class | Name | Percentage | |||||
Grandeur Peak Global Opportunities | Investor | Charles Schwab & Co. | 71.58 | % | ||||
Grandeur Peak International Opportunities | Investor | Charles Schwab & Co. | 25.13 | % | ||||
Grandeur Peak International Opportunities | Institutional | Deseret Mutual Benefit Administration | 39.51 | % | ||||
6. MANAGEMENT AND RELATED-PARTY TRANSACTIONS
Grandeur Peak Global Advisors, LLC (the “Adviser” or “Grandeur Peak Global Advisors”), subject to the authority of the Board, is responsible for the overall management and administration of the Funds’ business affairs. The Adviser manages the investments of the Funds in accordance with the Funds’ investment objective, policies and limitations and investment guidelines established jointly by the Adviser and the Trustees. Pursuant to the Advisory Agreement, (the “Advisory Agreement”), each Fund pays the Adviser an annual management fee of 1.25%, based on each Fund’s average daily net assets. The management fee is paid on a monthly basis.
The Adviser has contractually agreed to limit certain of each Fund’s expenses to 1.75% of the Fund’s average daily net assets in the Investor Class shares and 1.50% of the Fund’s average daily net assets in the Institutional Class shares until August 31, 2013. Pursuant to this agreement, each Fund will reimburse the Adviser for any fee waivers and expense reimbursements made by the Adviser, provided that any such reimbursements made by the Funds to the Adviser will not cause the Funds’ expense limitation to exceed expense limitations in existence at the time the expense was incurred, or at the time of the reimbursement, whichever is lower, and the reimbursement is made within three years after the expenses were incurred.
For the six months ended October 31, 2012, the fee waivers and/or reimbursements were as follows:
| Fund | Fees Waived/ Advisor | Recoupment of Past Advisor | Total | |||||||||
Grandeur Peak Global Opportunities Fund | ||||||||||||
Investor Class | $ 23,053 | $ 0 | $ 23,053 | |||||||||
Institutional Class | 26,171 | 0 | 26,171 | |||||||||
Grandeur Peak Global International Opportunities Fund | ||||||||||||
Investor Class | $ 10,978 | $ 0 | $ 10,978 | |||||||||
Institutional Class | 63,544 | 0 | 63,544 | |||||||||
46 | 1.855.377.7325 | www.GrandeurPeakGlobal.com |
Table of Contents
Grandeur Peak FundsSM | Notes to Financial Statements | |
October 31, 2012 (Unaudited) |
As of October 31, 2012, the balances of recoupable expenses for each Fund were as follows:
| Fund | Expires 2015 | Expires 2016 | Total | |||||||||
Grandeur Peak Global Opportunities Fund | ||||||||||||
Investor Class | $ | 57,387 | $ | 23,053 | $ | 80,440 | ||||||
Institutional Class | 130,976 | 26,171 | 157,147 | |||||||||
Grandeur Peak Global International Opportunities Fund | ||||||||||||
Investor Class | $ | 42,227 | $ | 10,978 | $ | 53,205 | ||||||
Institutional Class | 102,671 | 63,544 | 166,215 | |||||||||
Fund Fund Accounting Fees and Expenses
ALPS Fund Services, Inc. (“ALPS” and the “Administrator”) (an affiliate of ALPS Distributors, Inc.) serves as administrator to the Funds, and each Fund has agreed to pay expenses incurred in connection with its administrative activities. Pursuant to the Administration, Bookkeeping and Pricing Services Agreement (the “Agreement”), ALPS will provide operational services to the Funds including, but not limited to fund accounting and fund administration and generally assist in each Fund’s operations. The table below describes the administrative fee paid by the Funds to ALPS pursuant to the Agreement during the six months ended October 31, 2012:
Annual Administrative Fee, billed monthly, in the amount of the greater of the annual minimum of $185,000 in year one and $205,000 in year 2 and forward or:
Average Total Net Assets | Contractual Fee | |
Between $0-$500M | 0.05% | |
$500M-$1B | 0.03% | |
Above $1B | 0.02% |
The Administrator is also reimbursed by the Funds for certain out-of-pocket expenses.
Transfer Agent
ALPS serves as transfer, dividend paying and shareholder servicing agent for the Funds (“Transfer Agent”). ALPS is compensated based upon a $25,000 annual base fee per Fund, and annually $9 per direct open account and $7 per open account through NSCC. The Transfer Agent is also reimbursed by the Funds for certain out-of-pocket expenses.
Compliance Services
ALPS provides services which assist the Trust’s Chief Compliance Officer in monitoring and testing the policies and procedures of the Trust in conjunction with requirements under Rule 38a-1 under the 1940 Act for an annual fee of $30,000.
Principal Financial Officer
ALPS receives an annual fee of $10,000 for providing Principal Financial Officer (“PFO”) services to the Trust.
Distributor: ALPS Distributors, Inc. (“ADI” or the “Distributor”) (an affiliate of ALPS) acts as the distributor of the Funds’ shares pursuant to a Distribution Agreement with the Trust. Shares are sold on a continuous basis by ADI as agent for the Funds, and ADI has agreed to use its best efforts to solicit orders for the sale of each Fund’s shares, although it is not obliged to sell any particular
Semi-Annual Report | October 31, 2012 | 47 |
Table of Contents
Grandeur Peak FundsSM | Notes to Financial Statements | |
October 31, 2012 (Unaudited) |
amount of shares. ADI is not entitled to any compensation for its services as Distributor. ADI is registered as a broker-dealer with the Securities and Exchange Commission.
Each Fund has adopted a Distribution and Services (12b-1) Plan pursuant to Rule 12b- 1 of the 1940 Act (the “Plan”) for its Investor Class shares. The Plan allows the Funds to use Investor Class assets to pay fees in connection with the distribution and marketing of Investor Class shares and/or the provision of shareholder services to Investor Class shareholders. The Plan permits payment for services in connection with the administration of plans or programs that use Investor Class shares of each Fund as their funding medium and for related expenses. The Plan permits the Funds to make total payments at an annual rate of up to 0.25% of each Fund’s average daily net assets attributable to its Investor Class shares. The expenses of the Plan are reflected as distribution and service fees in the Statement of Operations.
7. INDEMNIFICATIONS
Under the Trust’s organizational documents, its officers and Trustees are indemnified against certain liability arising out of the performance of their duties to the Trust. Additionally, in the normal course of business, the Trust enters into contracts with service providers that may contain general indemnification clauses, which may permit indemnification to the extent permissible under applicable law. The Trust’s maximum exposure under these arrangements is unknown, as this would involve future claims that may be made against the Trust that have not yet occurred.
48 | 1.855.377.7325 | www.GrandeurPeakGlobal.com |
Table of Contents
Grandeur Peak FundsSM | Additional Information | |
October 31, 2012 (Unaudited) |
1. FUND HOLDINGS
The Funds file their complete schedule of portfolio holdings with the Securities and Exchange Commission (the “SEC”) for the first and third quarters of each fiscal year on Form N-Q within 60 days after the end of the period. Copies of the Funds’ Form N-Q are available without charge on the SEC website at http://www.sec.gov. You may also review and copy the Form N-Q at the SEC’s Public Reference Room in Washington, DC. For more information about the operation of the Public Reference Room, please call the SEC at 1-800-SEC-0330.
2. FUND PROXY VOTING POLICIES, PROCEDURES AND SUMMARIES
The Funds’ policies and procedures used in determining how to vote proxies and information regarding how the Funds voted proxies relating to portfolio securities during the most recent prior 12-month period ending June 30 are available without charge, (1) upon request, by calling (toll-free) 855-377-PEAK(7325) and (2) on the SEC’s website at http://www.sec.gov.
Semi-Annual Report | October 31, 2012 | 49 |
Table of Contents

Table of Contents

Table of Contents
| TABLE OF CONTENTS |
| 1 | ||||||||
Performance Update | ||||||||
| 4 | ||||||||
| 7 | ||||||||
| 10 | ||||||||
| 13 | ||||||||
Portfolio of Investments | ||||||||
| 15 | ||||||||
| 16 | ||||||||
| 17 | ||||||||
| 18 | ||||||||
| 19 | ||||||||
| 20 | ||||||||
Financial Highlights | ||||||||
| 21 | ||||||||
| 22 | ||||||||
| 23 | ||||||||
| 24 | ||||||||
| 32 | ||||||||
| 34 | ||||||||
Table of Contents
Pathway Advisors Funds | Shareholder Letter | |
October 31, 2012 (Unaudited) |
November 1, 2012
Dear Shareholder:
Since our initial offering in late July of this year, we’ve been diligently working to promote the funds and expand awareness of our presence in the marketplace. The table below summarizes the first full quarter’s results for each of our funds.
| Period Ended 9/30/12* | ||
Pathway Advisors Conservative | 1.70% | |
Pathway Advisors Growth & Income | 2.80% | |
Pathway Advisors Aggressive Growth | 4.10% |
| * | Since inception. The Funds’ inception date is July 30, 2012. |
The performance data quoted represents past performance. Past performance does not guarantee future results. The investment return and principal value of an investment will fluctuate so that an Investor’s shares, when redeemed, may not be worth more or less than their original cost and current performance may be lower or higher than the performance quoted.
Hanson McClain Strategic Advisors, Inc. (the “Adviser”) has agreed contractually to limit the amount of the Fund’s total annual expenses, exclusive of Acquired Fund Fees and Expenses, brokerage expenses, interest expenses, taxes and extraordinary expenses, to 1.98% of the Fund’s average daily net assets. This agreement is in effect through August 31, 2014. The Adviser will be permitted to recover expenses it has borne through the agreement described above to the extent that the Fund’s expenses in later periods fall below the annual rates set forth in the relevant agreement. The Fund will not be obligated to pay any such deferred fees and expenses more than three years after the end of the fiscal year in which the fees and expense were deferred. The Adviser may not discontinue this waiver without the approval by the Fund’s Board of Trustees.
Overtly positive economic news remains limited as the economy continues to struggle toward recovery. Meanwhile, all eyes gaze towards the approach of the fiscal cliff1. Briefly, as part of the debt ceiling negotiations back in the summer of 2011 (the last time the debt ceiling2 was increased), part preventative action, part counterbalance against the possibility of an increase in the debt burden, members of Congress created spending cuts that would automatically be implemented the next time the debt ceiling was reached without a budget agreement in place. In response, Congress created a bi-partisan super-committee charged with proactively addressing the budget dilemma, as well as heading off any perceived overreaching cuts to spending. The plan went awry when the committee’s recommendations were not heeded and no action was taken. This means that not only are massive, automatic spending cuts still in place, but they are scheduled to occur at almost the exact same time that, first, unemployment benefits expire for some 5 million people (the end of the year), second, the debt ceiling is again reached (early 2013), and third, large existing tax cuts expire. Simply, hundreds of billions of dollars in spending programs are set to expire at approximately the same time the largest tax increase in some 70 years becomes law. This unique convergence of economic circumstances has become known as the fiscal cliff. Some financial experts believe that unless decisive, preventative action is undertaken, our economy could experience a significant rise in unemployment due to a potential 1-to-1.5% decrease in GDP. While we believe that the worst potentialities associated with the fiscal cliff will ultimately be rectified, probably in the 11th hour, it is difficult to determine what either the short or long-term ramifications might be. Based on recent history, however, we feel that
Semi-Annual Report | October 31, 2012 | 1 |
Table of Contents
Pathway Advisors Funds | Shareholder Letter | |
October 31, 2012 (Unaudited) |
temporary solutions will again be enacted, while the most difficult decisions and actions on taxes and spending will, once again, be kicked down the road to be dealt with at a later date.
Despite the uncertainty surrounding the fiscal cliff, the ongoing concerns from the Eurozone, and our presidential election, the equity markets were up by varying degrees for the funds’ first three months. As evidenced by the large value of inflows into bonds, investors may still be wary of equities, but, conversely, many advisors and financial professionals are concerned about the rich valuations in certain bond sectors, particularly US treasury bonds. With these and other concerns in mind, we continue to keep our holdings diversified and consistent with our investors’ objectives for growth and capital appreciation, as well as income and capital preservation, depending on the fund.
In the end, we believe that our emphasis on risk management and our focus on long-term risk-adjusted returns (in conjunction with our tactical overlay) will allow our funds to perform well relative to their respective benchmarks. We appreciate the confidence that you have placed in our management, and we take seriously our fiduciary responsibility to deliver competitive performance that can help you reach your investment objectives and financial goals.
Sincerely,
David Schauer
| 1 | Fiscal Cliff is a term used to refer to the economic effects that could result from tax increases, spending cuts and corresponding reduction in the U.S. budget deficit beginning in 2013 if the existing laws are not changed by the end of 2013. |
| 2 | Debt ceiling is the maximum amount of monies the United States can borrow. The debt ceiling was created under the Second Liberty Bond Act of 1917, putting a “ceiling” on the amount of bonds the United States can issue. |
This manager commentary represents an assessment of the market environment at a specific point in time and is not intended to be a forecast of future events or a guarantee of future results. This information should not be relied upon by the reader as research or investment advice. Investors should consider carefully the investment objectives, risks, and charges and expenses of the Funds before investing. Portfolio composition is subject to change at any time and references to specific securities, industries and sectors referenced in this letter are not recommendations to purchase or sell a particular security. Current and future portfolio holdings are subject to risk. See the Schedule of Portfolio holdings for the percent of assets of each Fund invested in particular securities.
The Pathway Advisors Aggressive Growth Fund invests in underlying funds that use investment techniques and financial instruments that may be considered aggressive, including the use of futures contracts, options on futures contracts, securities and indices, forward contracts, swap agreements and similar instruments, exposes an underlying fund to potentially dramatic changes (losses) in the value of certain of its portfolio holdings.
The Pathway Advisors Growth and Income Fund’s share price can move down in response to stock market conditions, changes in the economy or changes in a particular underlying fund’s share price. An underlying fund may decline in value even when the values of stocks or bonds in general are rising. An underlying fund’s investments in fixed-income securities may decline in value because of changes in
2 | www.pathwayadvisorsfunds.com |
Table of Contents
Pathway Advisors Funds | Shareholder Letter | |
October 31, 2012 (Unaudited) |
interest rates. As nominal interest rates rise, the value of fixed income securities held by an underlying fund (and indirectly, by the Fund) are likely to decrease.
The Pathway Advisors Conservative Fund invests in underlying funds that invest long or short in fixed-income securities subjects the Fund to additional risks that include credit risk, interest risk, maturity risk, investment-grade securities risk, municipal securities risk and prepayment risk. These risks could affect the value of a particular investment by the Fund, possibly causing the Fund’s share price and total return to be reduced and fluctuate more than other types of investments.
The Pathway Advisors Funds are distributed by ALPS Distributors, Inc.
Semi-Annual Report | October 31, 2012 | 3 |
Table of Contents
| Performance Update | ||
October 31, 2012 (Unaudited) |
Performance for the period ended October 31, 2012
| One Month | Latest Quarter | Since Inception* | ||||||||||||||||||
Pathway Advisors Conservative Fund | 0.10 | % | 1.80 | % | 1.80 | % | ||||||||||||||
S&P 500 Total Return Index1 | -1.85 | % | 2.96 | % | 2.51 | % | ||||||||||||||
Barclays Capital U.S. Aggregate Bond Index2 | 0.20 | % | 0.40 | % | 0.47 | % | ||||||||||||||
Russell 2000® Index3 | -2.17 | % | 4.41 | % | 3.80 | % | ||||||||||||||
| * | Fund Inception date of July 30, 2012. |
Indexes are not actively managed and do not reflect any deduction for fees or expenses. You cannot invest directly in an index.
The returns shown above do not reflect the deduction of taxes a shareholder would pay on Fund distributions or redemption of Fund shares.
The Fund is new and has a limited operating history.
Performance data quoted represents past performance. Past performance does not guarantee future results. Investment return and principal value of an investment will fluctuate so that an investor’s shares, when sold or redeemed, may be worth more or less than the original cost. Current performance data may be higher or lower than actual data quoted. For the most current month-end performance data, please call 1-888-288-1121.
| 1 | The S&P 500® Total Return Index is an unmanaged index of 500 common stocks chosen for the market size, liquidity and industry group representation. It is a market-value weighted index. The index is not actively managed and does not reflect any deduction for fees, expenses or taxes. An investor cannot invest directly into the index. |
| 2 | The Barclays Capital Aggregate Bond Index is a market capitalization-weighted index, meaning the securities in the index are weighted according to the market size of each bond type. Most U.S. traded investment grade bonds are represented. Municipal bonds, and Treasury Inflation-Protected Securities are excluded, due to tax treatment issues. The index includes Treasury securities, Government agency bonds, Mortgage-backed bonds, Corporate bonds, and a small amount of foreign bonds traded in U.S. The index is not actively managed and does not reflect any deduction for fees, expenses or taxes. An investor cannot invest directly into the index. |
| 3 | The Russell 2000® Index measures the performance of the small-cap segment of the U.S. equity universe. The Russell 2000® is a subset of the Russell 3000® Index representing approximately 10% of the total market capitalization of that index. It includes approximately 2000 of the smallest securities based on a combination of their market cap and current index membership. The index is not actively managed and does not reflect any deduction for fees, expenses or taxes. An investor cannot invest directly into the index. |
4 | www.pathwayadvisorsfunds.com |
Table of Contents
Pathway Advisors Conservative Fund | Performance Update | |
October 31, 2012 (Unaudited) |
Growth of $10,000 for the period ended October 31, 2012
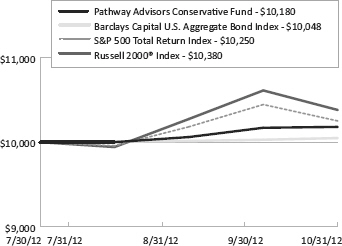
The graphs shown above represent a hypothetical investment of $10,000 in the Fund’s Investor Class shares for the period from inception to 10/31/12. All returns reflect reinvested dividends, but do not reflect the deduction of taxes that an investor would pay on distributions or redemptions.
Semi-Annual Report | October 31, 2012 | 5 |
Table of Contents
Pathway Advisors Conservative Fund | Performance Update | |
October 31, 2012 (Unaudited) |
| Top Ten Long Holdings | (as a % of Net Assets)* | ||||||
DoubleLine Total Return Bond Fund - Class I | 16.68 | % | |||||
Vanguard Wellesley Income Fund - Class Admiral | 14.99 | % | |||||
PIMCO Total Return Fund - Institutional Class | 12.97 | % | |||||
Metropolitan West Total Return Bond Fund - Class I | 9.95 | % | |||||
Vanguard Total Stock Market ETF | 6.93 | % | |||||
PIMCO Real Return Fund - Institutional Class | 5.62 | % | |||||
Templeton Global Bond Fund - Class A | 5.11 | % | |||||
Loomis Sayles Bond Fund - Institutional Class | 5.08 | % | |||||
Vanguard Wellington Fund - Class Admiral | 4.65 | % | |||||
iShares® Dow Jones International Select Dividend Index Fund | 3.10 | % | |||||
Top Ten Holdings | 85.08 | % | |||||
Portfolio Allocation (as a % of Net Assets)*
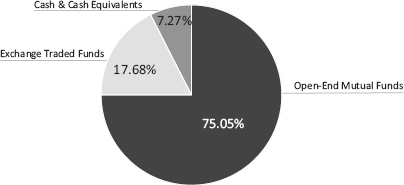
| * | Holdings are subject to change. Table and chart presents indicative values only. |
6 | www.pathwayadvisorsfunds.com |
Table of Contents
| Performance Update | ||
October 31, 2012 (Unaudited) |
Performance for the period ended October 31, 2012
| One Month | Latest Quarter | Since Inception* | ||||
Pathway Advisors Growth and Income Fund - NAV | -0.29% | 2.71% | 2.50% | |||
S&P 500 Total Return Index1 | -1.85% | 2.96% | 2.51% | |||
Barclays Capital U.S. Aggregate Bond Index2 | 0.20% | 0.40% | 0.47% | |||
Russell 2000® Index3 | -2.17% | 4.41% | 3.80% |
| * | Fund Inception date of July 30, 2012. |
Indexes are not actively managed and do not reflect any deduction for fees or expenses. You cannot invest directly in an index.
The returns shown above do not reflect the deduction of taxes a shareholder would pay on Fund distributions or redemption of Fund shares.
The Fund is new and has a limited operating history.
Performance data quoted represents past performance. Past performance does not guarantee future results. Investment return and principal value of an investment will fluctuate so that an investor’s shares, when sold or redeemed, may be worth more or less than the original cost. Current performance data may be higher or lower than actual data quoted. For the most current month-end performance data, please call 1-888-288-1121.
| 1 | The S&P 500® Total Return Index is an unmanaged index of 500 common stocks chosen for the market size, liquidity and industry group representation. It is a market-value weighted index. The index is not actively managed and does not reflect any deduction for fees, expenses or taxes. An investor cannot invest directly into the index. |
| 2 | The Barclays Capital Aggregate Bond Index is a market capitalization-weighted index, meaning the securities in the index are weighted according to the market size of each bond type. Most U.S. traded investment grade bonds are represented. Municipal bonds, and Treasury Inflation-Protected Securities are excluded, due to tax treatment issues. The index includes Treasury securities, Government agency bonds, Mortgage-backed bonds, Corporate bonds, and a small amount of foreign bonds traded in U.S. The index is not actively managed and does not reflect any deduction for fees, expenses or taxes. An investor cannot invest directly into the index. |
| 3 | The Russell 2000® Index measures the performance of the small-cap segment of the U.S. equity universe. The Russell 2000® is a subset of the Russell 3000® Index representing approximately 10% of the total market capitalization of that index. It includes approximately 2000 of the smallest securities based on a combination of their market cap and current index membership. The index is not actively managed and does not reflect any deduction for fees, expenses or taxes. An investor cannot invest directly into the index. |
Semi-Annual Report | October 31, 2012 | 7 |
Table of Contents
Pathway Advisors Growth and Income Fund | Performance Update | |
October 31, 2012 (Unaudited) |
Growth of $10,000 for the period ended October 31, 2012
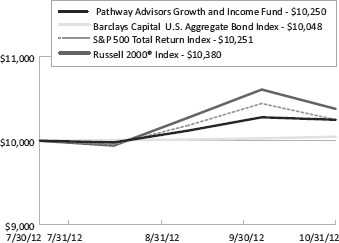
The graphs shown above represent a hypothetical investment of $10,000 in the Fund’s Investor Class shares for the period from inception to 10/31/12. All returns reflect reinvested dividends, but do not reflect the deduction of taxes that an investor would pay on distributions or redemptions.
8 | www.pathwayadvisorsfunds.com |
Table of Contents
Pathway Advisors Growth and Income Fund | Performance Update | |
October 31, 2012 (Unaudited) |
| Top Ten Long Holdings | (as a % of Net Assets)* | |||||||||
DoubleLine Total Return Bond Fund - Class I | 14.92 | % | ||||||||
Vanguard Large-Cap ETF | 14.86 | % | ||||||||
PIMCO Total Return Fund - Institutional Class | 9.91 | % | ||||||||
SPDR® S&P 500 ETF Trust | 8.87 | % | ||||||||
T. Rowe Price Capital Appreciation Fund | 8.07 | % | ||||||||
iShares® Dow Jones International Select Dividend Index Fund | 7.15 | % | ||||||||
Vanguard Wellington Fund - Class Admiral | 7.06 | % | ||||||||
PIMCO Real Return Fund - Institutional Class | 6.92 | % | ||||||||
iShares® Dow Jones Select Dividend Index Fund | 4.74 | % | ||||||||
Metropolitan West Total Return Bond Fund - Class I | 4.67 | % | ||||||||
Top Ten Holdings | 87.17 | % | ||||||||
Portfolio Allocation (as a % of Net Assets)*
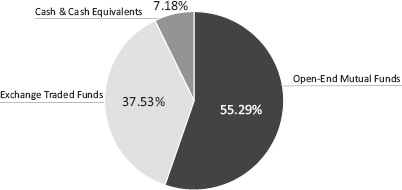
| * | Holdings are subject to change. Table and chart presents indicative values only. |
Semi-Annual Report | October 31, 2012 | 9 |
Table of Contents
| Performance Update | ||
October 31, 2012 (Unaudited) |
Performance for the period ended October 31, 2012
| One Month | Latest Quarter | Since Inception* | ||||
Pathway Advisors Aggressive Growth Fund | -0.48% | 4.02% | 3.60% | |||
MSCI EAFE NR1 | 0.83% | 6.60% | 6.65% | |||
S&P 500 Total Return Index2 | -1.85% | 2.96% | 2.51% | |||
Russell 2000® Index3 | -2.17% | 4.41% | 3.80% |
| * | Fund Inception date of July 30, 2012. |
Indexes are not actively managed and do not reflect any deduction for fees or expenses. You cannot invest directly in an index.
The returns shown above do not reflect the deduction of taxes a shareholder would pay on Fund distributions or redemption of Fund shares.
The Fund is new and has a limited operating history.
Performance data quoted represents past performance. Past performance does not guarantee future results. Investment return and principal value of an investment will fluctuate so that an investor’s shares, when sold or redeemed, may be worth more or less than the original cost. Current performance data may be higher or lower than actual data quoted. For the most current month-end performance data, please call 1-888-288-1121.
| 1 | MSCI EAFE® (Europe, Australasia, Far East) Index is a free float-adjusted market capitalization weighted index designed to measure developed market equity performance. The MSCI EAFE® Index is composed of companies representative of the market structure of Developed Market countries. The index includes reinvestment of dividends, net of foreign withholding taxes. The index is not actively managed and does not reflect any deduction for fees, expenses or taxes. An investor cannot invest directly into the index. |
| 2 | The S&P 500® Total Return Index is an unmanaged index of 500 common stocks chosen for the market size, liquidity and industry group representation. It is a market-value weighted index. The index is not actively managed and does not reflect any deduction for fees, expenses or taxes. An investor cannot invest directly into the index. |
| 3 | The Russell 2000® Index measures the performance of the small-cap segment of the U.S. equity universe. The Russell 2000® is a subset of the Russell 3000® Index representing approximately 10% of the total market capitalization of that index. It includes approximately 2000 of the smallest securities based on a combination of their market cap and current index membership. The index is not actively managed and does not reflect any deduction for fees, expenses or taxes. An investor cannot invest directly into the index. |
Source: MSCI. MSCI makes no express or implied warranties or representations and shall have no liability whatsoever with respect to any MSCI data contained herein. The MSCI data may not be further redistributed or used to create indices or financial products. This report is not approved or produced by MSCI.
10 | www.pathwayadvisorsfunds.com |
Table of Contents
Pathway Advisors Aggressive Growth Fund | Performance Update | |
October 31, 2012 (Unaudited) |
Growth of $10,000 for the period ended October 31, 2012
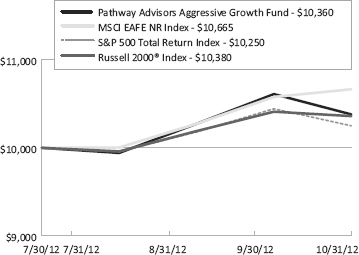
The graphs shown above represent a hypothetical investment of $10,000 in the Fund’s Investor Class shares for the period from inception to 10/31/12. All returns reflect reinvested dividends, but do not reflect the deduction of taxes that an investor would pay on distributions or redemptions.
Semi-Annual Report | October 31, 2012 | 11 |
Table of Contents
Pathway Advisors Aggressive Growth Fund | Performance Update | |
October 31, 2012 (Unaudited) |
| Top Ten Long Holdings | (as a % of Net Assets)* | ||||
Vanguard Total Stock Market ETF | 13.65 | % | |||
iShares® Dow Jones International Select Dividend Index Fund | 12.33 | % | |||
SPDR® S&P 500 ETF Trust | 9.34 | % | |||
T. Rowe Price Capital Appreciation Fund | 8.61 | % | |||
DoubleLine Total Return Bond Fund - Class I | 8.35 | % | |||
Akre Focus Fund - Institutional Class | 7.82 | % | |||
Mairs & Power Growth Fund - Investor Class | 7.63 | % | |||
Fidelity Convertible Securities Fund | 6.86 | % | |||
Vanguard MSCI Emerging Markets ETF | 3.47 | % | |||
WisdomTree Emerging Markets SmallCap Dividend Fund | 3.15 | % | |||
Top Ten Holdings | 81.21 | % | |||
Portfolio Allocation (as a % of Net Assets)*
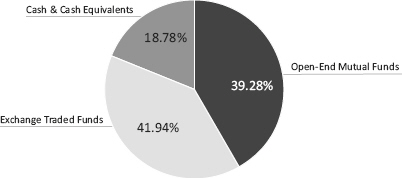
| * | Holdings are subject to change. Table and chart presents indicative values only. |
12 | www.pathwayadvisorsfunds.com |
Table of Contents
Pathway Advisors Funds | Disclosure of Fund Expenses | |
October 31, 2012 (Unaudited) |
As a shareholder of a Fund, you incur two types of costs: direct costs, such as short-term redemption fees and wire fees, and indirect costs, including management fees, and other fund operating expenses. This example is intended to help you understand your indirect costs, also referred to as “ongoing costs” (in dollars), of investing in the Fund and to compare these costs with the ongoing costs of investing in other mutual funds.
This example is based on an investment of $1,000 invested at the beginning of the period and held for the entire six-month period of May 1, 2012 through October 31, 2012.
Actual Expenses The first line of the table below provides information about actual account values and actual expenses. You may use the information in this line, together with the amount you invested at the beginning of the period, to estimate the expenses that you paid over the period. Simply divide your account value by $1,000 (for example, an $8,600 account value divided by $1,000 = 8.6), then multiply the result by the number in the first line under the heading “Expenses Paid During Period” to estimate the expenses you paid on your account during this period.
Hypothetical Example for Comparison Purposes The second line of the table provides information about hypothetical account values and hypothetical expenses based on the Fund’s actual expense ratio and an assumed rate of return of 5% per year before expenses, which is not the Fund’s actual return. The hypothetical account values and expenses may not be used to estimate the actual ending account balance or expenses you paid for the period. You may use this information to compare ongoing costs of investing in the Fund and other funds. To do so, compare this 5% hypothetical example with the 5% hypothetical examples that appear in the shareholder reports of other funds.
Please note that the expenses shown in the table are meant to highlight your ongoing costs only and do not reflect any direct costs, such as wire fees or low balance fees. Therefore, the second line of the table is useful in comparing ongoing costs only and will not help you determine the relative total costs of owning different funds. In addition, if these direct costs were included, your costs would be higher.
Semi-Annual Report | October 31, 2012 | 13 |
Table of Contents
Pathway Advisors Funds | Disclosure of Fund Expenses | |
October 31, 2012 (Unaudited) |
BEGINNING ACCOUNT VALUE 05/01/12 | ENDING ACCOUNT VALUE 10/31/12 | EXPENSE RATIO(a) | EXPENSES PAID DURING PERIOD 05/01/2012- 10/31/12(b) | |||||||||||||||||
Pathway Advisors Conservative Fund | ||||||||||||||||||||
Actual(c) | $ | 1,000.00 | $ | 1,018.00 | 1.98 | % | $ | 5.09 | ||||||||||||
Hypothetical (5% return before expenses) | $ | 1,000.00 | $ | 1,015.22 | 1.98 | % | $ | 10.06 | ||||||||||||
Pathway Advisors Growth and Income Fund | ||||||||||||||||||||
Actual(c) | $ | 1,000.00 | $ | 1,025.00 | 1.98 | % | $ | 5.11 | ||||||||||||
Hypothetical (5% return before expenses) | $ | 1,000.00 | $ | 1,015.22 | 1.98 | % | $ | 10.06 | ||||||||||||
Pathway Advisors Aggressive Growth Fund | ||||||||||||||||||||
Actual(c) | $ | 1,000.00 | $ | 1,036.00 | 1.98 | % | $ | 5.14 | ||||||||||||
Hypothetical (5% return before expenses) | $ | 1,000.00 | $ | 1,015.22 | 1.98 | % | $ | 10.06 | ||||||||||||
| (a) | The Funds’ expense ratio has been annualized based on the period from the Funds’ commencement date of July 30, 2012 to October 31, 2012. |
| (b) | Expenses are equal to the Funds’ annualized expense ratio multiplied by the number of days in the most recent fiscal half year (184), then divided by 365. |
| (c) | The Fund commenced operations on July 30, 2012. |
14 | www.pathwayadvisorsfunds.com |
Table of Contents
| Portfolio of Investments | ||
October 31, 2012 (Unaudited) |
| Description | Shares | Value (Note 2) | ||||||||||
EXCHANGE TRADED FUNDS (17.68%) | ||||||||||||
iShares® Dow Jones International Select Dividend Index Fund | 243 | $ | 7,880 | |||||||||
SPDR® Barclays Capital High Yield Bond ETF | 184 | 7,421 | ||||||||||
Vanguard MSCI Emerging Markets ETF | 120 | 4,979 | ||||||||||
Vanguard REIT ETF | 110 | 7,082 | ||||||||||
Vanguard Total Stock Market ETF | 244 | 17,646 | ||||||||||
|
| |||||||||||
TOTAL EXCHANGE TRADED FUNDS (Cost $44,304) | 45,008 | |||||||||||
OPEN-END MUTUAL FUNDS (75.05%) | ||||||||||||
DoubleLine Total Return Bond Fund - Class I | 3,734 | 42,456 | ||||||||||
Loomis Sayles Bond Fund - Institutional Class | 860 | 12,932 | ||||||||||
Metropolitan West Total Return Bond Fund - Class I | 2,287 | 25,319 | ||||||||||
PIMCO Real Return Fund - Institutional Class | 1,131 | 14,306 | ||||||||||
PIMCO Total Return Fund - Institutional Class | 2,848 | 33,008 | ||||||||||
Templeton Global Bond Fund - Class A | 964 | 12,998 | ||||||||||
Vanguard Wellesley Income Fund - Class Admiral | 642 | 38,156 | ||||||||||
Vanguard Wellington Fund - Class Admiral | 200 | 11,840 | ||||||||||
|
| �� | ||||||||||
TOTAL OPEN-END MUTUAL FUNDS (Cost $188,680) | 191,015 | |||||||||||
7-Day Yield | Shares | Value (Note 2) | ||||||||||
SHORT TERM INVESTMENTS (3.53%) | ||||||||||||
Dreyfus Cash Management, Institutional Shares | 0.061 | % | 8,980 | 8,980 | ||||||||
|
| |||||||||||
TOTAL SHORT TERM INVESTMENTS (Cost $8,980) | 8,980 | |||||||||||
TOTAL INVESTMENTS (96.26%) (Cost $241,964) | $ | 245,003 | ||||||||||
Other Assets In Excess Of Liabilities (3.74%) | 9,510 | |||||||||||
NET ASSETS (100.00%) | $ | 254,513 | ||||||||||
Common Abbreviations:
ETF - Exchange Traded Fund.
MSCI - Morgan Stanley Capital International.
PIMCO - Pacific Investment Management Company, LLC.
REIT - Real Estate Investment Trust.
SPDR - Standard & Poor’s Depository Receipts.
See Notes to Financial Statements.
Semi-Annual Report | October 31, 2012 | 15 |
Table of Contents
| Portfolio of Investments | ||
October 31, 2012 (Unaudited) |
| Description | Shares | Value (Note 2) | ||||||||||
EXCHANGE TRADED FUNDS (37.53%) | ||||||||||||
iShares® Dow Jones International Select Dividend Index Fund | 565 | $ | 18,323 | |||||||||
iShares® Dow Jones Select Dividend Index Fund | 210 | 12,144 | ||||||||||
SPDR® S&P 500 ETF Trust | 161 | 22,730 | ||||||||||
Vanguard Large-Cap ETF | 590 | 38,067 | ||||||||||
WisdomTree Emerging Markets SmallCap Dividend Fund | 107 | 4,870 | ||||||||||
|
| |||||||||||
TOTAL EXCHANGE TRADED FUNDS (Cost $93,879) | 96,134 | |||||||||||
OPEN-END MUTUAL FUNDS (55.29%) | ||||||||||||
DoubleLine Total Return Bond Fund - Class I | 3,362 | 38,223 | ||||||||||
Fidelity Convertible Securities Fund | 388 | 9,579 | ||||||||||
Metropolitan West Total Return Bond Fund - Class I | 1,080 | 11,956 | ||||||||||
PIMCO Real Return Fund - Institutional Class | 1,401 | 17,729 | ||||||||||
PIMCO Total Return Fund - Institutional Class | 2,191 | 25,391 | ||||||||||
T. Rowe Price Capital Appreciation Fund | 893 | 20,670 | ||||||||||
Vanguard Wellington Fund - Class Admiral | 306 | 18,083 | ||||||||||
|
| |||||||||||
TOTAL OPEN-END MUTUAL FUNDS (Cost $139,198) | 141,631 | |||||||||||
7-Day Yield | Shares | Value (Note 2) | ||||||||||
SHORT TERM INVESTMENTS (3.53%) | ||||||||||||
Dreyfus Cash Management, Institutional Shares | 0.061 | % | 9,048 | 9,048 | ||||||||
|
| |||||||||||
TOTAL SHORT TERM INVESTMENTS (Cost $9,048) | 9,048 | |||||||||||
TOTAL INVESTMENTS (96.35%) (Cost $242,125) | $ | 246,813 | ||||||||||
Other Assets In Excess Of Liabilities (3.65%) | 9,359 | |||||||||||
NET ASSETS (100.00%) | $ | 256,172 | ||||||||||
Common Abbreviations:
ETF - Exchange Traded Fund.
PIMCO - Pacific Investment Management Company, LLC.
SPDR - Standard & Poor’s Depository Receipts.
See Notes to Financial Statements.
16 | www.pathwayadvisorsfunds.com |
Table of Contents
| Portfolio of Investments | ||
October 31, 2012 (Unaudited) |
| Description | Shares | Value (Note 2) | ||||||
EXCHANGE TRADED FUNDS (41.94%) | ||||||||
iShares® Dow Jones International Select Dividend Index Fund | 1,362 | $ | 44,170 | |||||
SPDR® S&P 500 ETF Trust | 237 | 33,460 | ||||||
Vanguard MSCI Emerging Markets ETF | 300 | 12,447 | ||||||
Vanguard Total Stock Market ETF | 676 | 48,888 | ||||||
WisdomTree Emerging Markets SmallCap Dividend Fund | 248 | 11,286 | ||||||
|
| |||||||
TOTAL EXCHANGE TRADED FUNDS (Cost $147,044) | 150,251 | |||||||
OPEN-END MUTUAL FUNDS (39.28%) | ||||||||
Akre Focus Fund - Institutional Class | 1,800 | 28,013 | ||||||
DoubleLine Total Return Bond Fund - Class I | 2,632 | 29,921 | ||||||
Fidelity Convertible Securities Fund | 995 | 24,571 | ||||||
Mairs & Power Growth Fund - Investor Class | 333 | 27,340 | ||||||
T. Rowe Price Capital Appreciation Fund | 1,333 | 30,853 | ||||||
|
| |||||||
TOTAL OPEN-END MUTUAL FUNDS (Cost $137,086) | 140,698 | |||||||
| 7-Day Yield | Shares | Value (Note 2) | ||||||||||
SHORT TERM INVESTMENTS (17.05%) | ||||||||||||
Dreyfus Cash Management, Institutional Shares | 0.061 | % | 61,082 | 61,082 | ||||||||
|
| |||||||||||
TOTAL SHORT TERM INVESTMENTS (Cost $61,082) | 61,082 | |||||||||||
TOTAL INVESTMENTS (98.27% ) (Cost $345,212) | $ | 352,031 | ||||||||||
Other Assets In Excess Of Liabilities (1.73%) | 6,201 | |||||||||||
NET ASSETS (100.00%) | $ | 358,232 | ||||||||||
Common Abbreviations:
ETF - Exchange Traded Fund.
MSCI - Morgan Stanley Capital International.
SPDR - Standard & Poor’s Depository Receipts.
See Notes to Financial Statements.
Semi-Annual Report | October 31, 2012 | 17 |
Table of Contents
Pathway Advisors Funds | Statement of Assets and Liabilities | |
October 31, 2012 (Unaudited) |
| PATHWAY ADVISORS CONSERVATIVE FUND | PATHWAY ADVISORS GROWTH AND INCOME FUND | PATHWAY ADVISORS AGGRESSIVE GROWTH FUND | ||||||||||
ASSETS | ||||||||||||
Investments, at value | $ | 245,003 | $ | 246,813 | $ | 352,031 | ||||||
Receivable for investments sold | 2,341 | 2,270 | 0 | |||||||||
Receivable due from advisor | 19,893 | 19,966 | 21,782 | |||||||||
Dividends | 173 | 127 | 1 | |||||||||
Deferred offering cost | 22,409 | 22,409 | 22,409 | |||||||||
Other assets | 57 | 57 | 57 | |||||||||
Total assets | 289,876 | 291,642 | 396,280 | |||||||||
LIABILITIES | ||||||||||||
Distributions and service fees payable | 324 | 325 | 362 | |||||||||
Payable for trustees’ fees and expenses | 6 | 6 | 8 | |||||||||
Payable for chief compliance officer fees | 2,129 | 2,140 | 2,481 | |||||||||
Payable for principal financial officer fees | 532 | 535 | 620 | |||||||||
Payable for administration fees | 13,379 | 13,466 | 15,558 | |||||||||
Payable for transfer agency fees | 9,535 | 9,529 | 9,531 | |||||||||
Payable for legal and audit fees | 6,714 | 6,714 | 6,714 | |||||||||
Payable for custody fees | 1,234 | 1,245 | 1,261 | |||||||||
Payable for reports to shareholders | 1,085 | 1,085 | 1,085 | |||||||||
Accrued expenses and other liabilities | 425 | 425 | 428 | |||||||||
Total liabilities | 35,363 | 35,470 | 38,048 | |||||||||
NET ASSETS | $ | 254,513 | $ | 256,172 | $ | 358,232 | ||||||
NET ASSETS CONSIST OF | ||||||||||||
Paid-in capital | $ | 250,023 | $ | 250,017 | $ | 350,030 | ||||||
Accumulated net investment income | 925 | 607 | 344 | |||||||||
Accumulated net realized gain on investments | 526 | 860 | 1,039 | |||||||||
Net unrealized appreciation on investments | 3,039 | 4,688 | 6,819 | |||||||||
NET ASSETS | $ | 254,513 | $ | 256,172 | $ | 358,232 | ||||||
INVESTMENTS, AT COST | $ | 241,964 | $ | 242,125 | $ | 345,212 | ||||||
PRICING OF SHARES | ||||||||||||
Net Asset Value, offering and redemption price per share | $ | 10.18 | $ | 10.25 | $ | 10.36 | ||||||
Net Assets | $ | 254,513 | $ | 256,172 | $ | 358,232 | ||||||
Shares of beneficial interest outstanding (unlimited number of shares, no par value common stock authorized) | 25,002 | 25,002 | 34,583 | |||||||||
See Notes to Financial Statements.
18 | www.pathwayadvisorsfunds.com |
Table of Contents
Pathway Advisors Funds | Statements of Operations | |
For the Period July 30, 2012 (Inception) to October 31, 2012 (Unaudited) | ||
| PATHWAY ADVISORS CONSERVATIVE FUND | PATHWAY ADVISORS GROWTH AND INCOME FUND | PATHWAY ADVISORS AGGRESSIVE GROWTH FUND | ||||||||||
INVESTMENT INCOME | ||||||||||||
Dividends | $ | 2,208 | $ | 1,896 | $ | 1,777 | ||||||
Total investment income | 2,208 | 1,896 | 1,777 | |||||||||
EXPENSES | ||||||||||||
Investment advisory fees | 648 | 651 | 724 | |||||||||
Administration fees | 20,506 | 20,609 | 22,768 | |||||||||
Transfer agency fees | 11,690 | 11,684 | 11,685 | |||||||||
Distribution and service fees | 324 | 326 | 362 | |||||||||
Legal fees | 673 | 673 | 673 | |||||||||
Audit fees | 6,040 | 6,041 | 6,040 | |||||||||
Custody fees | 1,274 | 1,274 | 1,274 | |||||||||
Reports to shareholders | 1,085 | 1,085 | 1,086 | |||||||||
Trustees’ fees and expenses | 6 | 6 | 8 | |||||||||
Registration/filing fees | 12 | 12 | 14 | |||||||||
Chief compliance officer fees | 3,271 | 3,284 | 3,637 | |||||||||
Principal financial officer fees | 818 | 821 | 909 | |||||||||
Offering costs | 15,910 | 15,910 | 15,910 | |||||||||
Other | 715 | 715 | 716 | |||||||||
Total expenses before waivers | 62,972 | 63,091 | 65,806 | |||||||||
Less fees waived/reimbursed by investment advisor | (61,689 | ) | (61,802 | ) | (64,373 | ) | ||||||
Total net expenses | 1,283 | 1,289 | 1,433 | |||||||||
NET INVESTMENT INCOME | 925 | 607 | 344 | |||||||||
Net realized gain on investments | 526 | 860 | 1,039 | |||||||||
Net change in unrealized appreciation on investments | 3,039 | 4,688 | 6,819 | |||||||||
NET REALIZED AND UNREALIZED GAIN ON INVESTMENTS | 3,565 | 5,548 | 7,858 | |||||||||
NET INCREASE IN NET ASSETS RESULTING FROM OPERATIONS | $ | 4,490 | $ | 6,155 | $ | 8,202 | ||||||
See Notes to Financial Statements.
Semi-Annual Report | October 31, 2012 | 19 |
Table of Contents
Pathway Advisors Funds | Statements of Changes in Net Assets | |
For the Period July 30, 2012 (Inception) to October 31, 2012 (Unaudited) | ||
| PATHWAY ADVISORS CONSERVATIVE FUND | PATHWAY ADVISORS GROWTH AND INCOME FUND | PATHWAY ADVISORS AGGRESSIVE GROWTH FUND | ||||||||||
OPERATIONS | ||||||||||||
Net investment income | $ | 925 | $ | 607 | $ | 344 | ||||||
Net realized gain on investments | 526 | 860 | 1,039 | |||||||||
Net change in unrealized appreciation on investments | 3,039 | 4,688 | 6,819 | |||||||||
Net increase in net assets resulting from operations | 4,490 | 6,155 | 8,202 | |||||||||
BENEFICIAL INTEREST TRANSACTIONS (NOTE 5) | ||||||||||||
Shares sold | 250,023 | 250,017 | 350,058 | |||||||||
Shares redeemed | – | – | (28 | ) | ||||||||
Net increase in Net Assets Derived from Beneficial Interest Transactions | 250,023 | 250,017 | 350,030 | |||||||||
Net increase in Net Assets | 254,513 | 256,172 | 358,232 | |||||||||
NET ASSETS: | ||||||||||||
Beginning of period | – | – | – | |||||||||
End of period* | $ | 254,513 | $ | 256,172 | $ | 358,232 | ||||||
* Includes accumulated net investment income of: | $ | 925 | $ | 607 | $ | 344 | ||||||
See Notes to Financial Statements.
20 | www.pathwayadvisorsfunds.com |
Table of Contents
| Financial Highlights | ||
For a share outstanding throughout the period presented. |
For the Period Ended October 31, 2012 (unaudited) (a) | |||||
NET ASSET VALUE, BEGINNING OF PERIOD | $ | 10.00 | |||
INCOME/(LOSS) FROM OPERATIONS | |||||
Net investment income(b) | 0.04 | ||||
Net realized and unrealized gain on investments | 0.14 | ||||
|
| ||||
Total from Investment Operations | 0.18 | ||||
|
| ||||
NET INCREASE IN NET ASSET VALUE | 0.18 | ||||
|
| ||||
NET ASSET VALUE, END OF PERIOD | $ | 10.18 | |||
|
| ||||
TOTAL RETURN(c) | 1.80 | % | |||
RATIOS/SUPPLEMENTAL DATA | |||||
Net assets, End of Period (000s) | $ | 255 | |||
RATIOS TO AVERAGE NET ASSETS: | |||||
Operating expenses excluding reimbursement/waiver(d) | 97.15 | %(e) | |||
Operating expenses including reimbursement/waiver(d) | 1.98 | %(e) | |||
Net investment income including reimbursement/waiver(d) | 1.43 | %(e) | |||
PORTFOLIO TURNOVER RATE | 18 | %(f) | |||
| (a) | The Fund commenced operations on July 30, 2012. |
| (b) | Calculated using the average shares method. |
| (c) | Total investment return is calculated assuming a purchase of a common share at the opening of the first day and a sale at closing on the last day of each period reported. Dividends and distributions, if any, are assumed for purposes of this calculation to be reinvested at prices obtained under the Fund’s dividend reinvestment plan. Total returns would have been lower had certain expenses not been waived during the period. Total investment returns do not reflect brokerage commissions, if any, and are not annualized. |
| (d) | The ratios exclude the impact of expenses of the underlying funds in which the Fund invests as represented in the Portfolio of Investments. |
| (e) | Annualized. |
| (f) | Not Annualized. |
See Notes to Financial Statements.
Semi-Annual Report | October 31, 2012 | 21 |
Table of Contents
| Financial Highlights | ||
For a share outstanding throughout the period presented. |
For the Period Ended October 31, 2012 (unaudited) (a) | |||||
NET ASSET VALUE, BEGINNING OF PERIOD | $ | 10.00 | |||
INCOME/(LOSS) FROM OPERATIONS | |||||
Net investment income(b) | 0.02 | ||||
Net realized and unrealized gain on investments | 0.23 | ||||
|
| ||||
Total from Investment Operations | 0.25 | ||||
|
| ||||
NET INCREASE IN NET ASSET VALUE | 0.25 | ||||
|
| ||||
NET ASSET VALUE, END OF PERIOD | $ | 10.25 | |||
|
| ||||
TOTAL RETURN(c) | 2.50 | % | |||
RATIOS/SUPPLEMENTAL DATA | |||||
Net assets, End of Period (000s) | $ | 256 | |||
RATIOS TO AVERAGE NET ASSETS: | |||||
Operating expenses excluding reimbursement/waiver(d) | 96.93 | %(e) | |||
Operating expenses including reimbursement/waiver(d) | 1.98 | %(e) | |||
Net investment income including reimbursement/waiver(d) | 0.93 | %(e) | |||
PORTFOLIO TURNOVER RATE | 13 | %(f) | |||
| (a) | The Fund commenced operations on July 30, 2012. |
| (b) | Calculated using the average shares method. |
| (c) | Total investment return is calculated assuming a purchase of a common share at the opening of the first day and a sale at closing on the last day of each period reported. Dividends and distributions, if any, are assumed for purposes of this calculation to be reinvested at prices obtained under the Fund’s dividend reinvestment plan. Total returns would have been lower had certain expenses not been waived during the period. Total investment returns do not reflect brokerage commissions, if any, and are not annualized. |
| (d) | The ratios exclude the impact of expenses of the underlying funds in which the Fund invests as represented in the Portfolio of Investments. |
| (e) | Annualized. |
| (f) | Not Annualized. |
See Notes to Financial Statements.
22 | www.pathwayadvisorsfunds.com |
Table of Contents
| Pathway Advisors Aggressive Growth Fund | Financial Highlights | |
For a share outstanding throughout the period presented. |
For the Period Ended October 31, 2012 (unaudited) (a) | |||||
NET ASSET VALUE, BEGINNING OF PERIOD | $ | 10.00 | |||
INCOME/(LOSS) FROM OPERATIONS | |||||
Net investment income(b) | 0.01 | ||||
Net realized and unrealized gain on investments | 0.35 | ||||
|
| ||||
Total from Investment Operations | 0.36 | ||||
|
| ||||
NET INCREASE IN NET ASSET VALUE | 0.36 | ||||
|
| ||||
NET ASSET VALUE, END OF PERIOD | $ | 10.36 | |||
|
| ||||
TOTAL RETURN(c) | 3.60% | ||||
RATIOS/SUPPLEMENTAL DATA | |||||
Net assets, End of Period (000s) | $ | 358 | |||
RATIOS TO AVERAGE NET ASSETS: | |||||
Operating expenses excluding reimbursement/waiver(d) | 90.87 | % (e) | |||
Operating expenses including reimbursement/waiver(d) | 1.98 | % (e) | |||
Net investment income including reimbursement/waiver(d) | 0.48 | % (e) | |||
PORTFOLIO TURNOVER RATE | 19 | % (f) | |||
| (a) | The Fund commenced operations on July 30, 2012. |
| (b) | Calculated using the average shares method. |
| (c) | Total investment return is calculated assuming a purchase of a common share at the opening of the first day and a sale at closing on the last day of each period reported. Dividends and distributions, if any, are assumed for purposes of this calculation to be reinvested at prices obtained under the Fund’s dividend reinvestment plan. Total returns would have been lower had certain expenses not been waived during the period. Total investment returns do not reflect brokerage commissions, if any, and are not annualized. |
| (d) | The ratios exclude the impact of expenses of the underlying funds in which the Fund invests as represented in the Portfolio of Investments. |
| (e) | Annualized. |
| (f) | Not Annualized. |
See Notes to Financial Statements.
Semi-Annual Report | October 31, 2012 | 23 |
Table of Contents
Pathway Advisors Funds | Notes to Financial Statements | |
October 31, 2012 (Unaudited) |
1. ORGANIZATION
Financial Investors Trust (the “Trust”), a Delaware statutory trust, is an open-end management investment company registered under the Investment Company Act of 1940, as amended (“1940 Act”). As of October 31, 2012, the Trust has 24 registered funds. This semi-annual report describes Pathway Advisors Conservative Fund, Pathway Advisors Growth and Income Fund and Pathway Advisors Aggressive Growth Fund (individually a “Fund” and collectively, the “Funds”). The Pathway Advisors Conservative Fund seeks total return through a primary emphasis on income with a secondary emphasis on growth of capital. The Pathway Advisors Growth and Income Fund seeks total return through growth of capital and income. The Pathway Advisors Aggressive Growth Fund seeks total return through a primary emphasis on growth with a secondary emphasis on income.
2. SIGNIFICANT ACCOUNTING POLICIES
The following is a summary of significant accounting policies consistently followed by the Funds. These policies are in conformity with U.S. generally accepted accounting principles (“GAAP”).
The preparation of financial statements in accordance with GAAP requires management to make certain estimates and assumptions that affect the reported amounts and disclosures in the financial statements during the reporting period. Management believes the estimates and security valuations are appropriate; however, actual results may differ from those estimates, and the security valuations reflected in the financial statements may differ from the value the Funds ultimately realize upon sale of the securities.
Investment Valuation: The Funds generally value their securities based on market prices determined at the close of regular trading on the New York Stock Exchange (“NYSE”), normally 4:00 p.m. Eastern Time, on each day the NYSE is open for trading.
For equity securities and mutual funds that are traded on an exchange, the market price is usually the closing sale or official closing price on that exchange. In the case of equity securities not traded on an exchange, or if such closing prices are not otherwise available, the securities are valued at the mean of the most recent bid and ask prices on such day.
The market price for debt obligations is generally the price supplied by an independent third-party pricing service approved by the Board of Trustees (the “Board”), which may use a matrix, formula or other objective method that takes into consideration quotations from dealers, market transactions in comparable investments, market indices and yield curves. If vendors are unable to supply a price, or if the price supplied is deemed to be unreliable, the market price may be determined using quotations received from one or more brokers–dealers that make a market in the security. Short–term debt obligations that will mature in 60 days or less are valued at amortized cost, unless it is determined that using this method would not reflect an investment’s fair value. Investments in non-exchange traded funds are fair valued at their respective net asset values.
Redeemable securities issued by open-end registered investment companies are valued at the investment company’s applicable net asset value.
24 | www.pathwayadvisorsfunds.com |
Table of Contents
Pathway Advisors Funds | Notes to Financial Statements | |
October 31, 2012 (Unaudited) |
When such prices or quotations are not available, or when the Fair Value Committee appointed by the Board believes that they are unreliable, securities may be priced using fair value procedures approved by the Board. The Funds may also use fair value procedures if the Fair Value Committee determines that a significant event has occurred between the time at which a market price is determined and the time at which thes Funds’ NAV is calculated. In particular, the value of non-U.S. securities may be materially affected by events occurring after the close of the foreign exchange on which they are traded, but before the Fund prices its shares.
Valuing securities at fair value involves greater reliance on judgment than valuation of securities based on readily available market quotations. The Funds that use fair value to price securities may value those securities higher or lower than another fund using market quotations or its own fair value methodologies to price the same securities. There can be no assurance that the Funds could obtain the fair value assigned to a security if it were to sell the security at approximately the time at which the Funds determine its net asset value, and the difference between fair value and the price of the securities may be material.
Fair Value Measurements: The Funds disclose the classification of their fair value measurements following a three-tier hierarchy based on the inputs used to measure fair value. Inputs refer broadly to the assumptions that market participants would use in pricing the asset or liability, including assumptions about risk. Inputs may be observable or unobservable. Observable inputs reflect the assumptions market participants would use in pricing the asset or liability that are developed based on market data obtained from sources independent of the reporting entity. Unobservable inputs reflect the reporting entity’s own assumptions about the assumptions market participants would use in pricing the asset or liability that are developed based on the best information available.
Various inputs are used in determining the value of the Funds’ investments as of the end of the reporting period. When inputs used fall into different levels of the fair value hierarchy, the level in the hierarchy within which the fair value measurement falls is determined based on the lowest level input that is significant to the fair value measurement in its entirety. The designated input levels are not necessarily an indication of the risk or liquidity associated with these investments. These inputs are categorized in the following hierarchy under applicable financial accounting standards:
Level 1 – | Unadjusted quoted prices in active markets for identical investments, unrestricted assets or liabilities that the Funds have the ability to access at the measurement date | |
Level 2 – | Quoted prices which are not active, quoted prices for similar assets or liabilities in active markets or inputs other than quoted prices that are observable (either directly or indirectly) for substantially the full term of the asset or liability; and | |
Level 3 – | Significant unobservable prices or inputs (including the Fund’s own assumptions in determining the fair value of investments) where there is little or no market activity for the asset or liability at the measurement date. | |
Semi-Annual Report | October 31, 2012 | 25 |
Table of Contents
Pathway Advisors Funds | Notes to Financial Statements | |
October 31, 2012 (Unaudited) |
The following is a summary of the inputs used to value the Funds’ investments as of October 31, 2012:
Pathway Advisors Conservative Fund
| Investments in Securities at Value | Level 1 - Quoted Prices | Level 2 - Other Significant Inputs | Level 3 - Significant | Total | ||||||||||||
Exchange Traded Funds | $ | 45,008 | $ | – | $ | – | $ | 45,008 | ||||||||
Open-End Mutual Funds | 191,015 | – | – | 191,015 | ||||||||||||
Short Term Investments | 8,980 | – | – | 8,980 | ||||||||||||
Total | $ | 245,003 | $ | – | $ | – | $ | 245,003 | ||||||||
Pathway Advisors Growth and Income Fund
| Investments in Securities at Value | Level 1 - Quoted Prices | Level 2 - Other Significant Inputs | Level 3 - Significant | Total | ||||||||||||
Exchange Traded Funds | $ | 96,134 | $ | – | $ | – | $ | 96,134 | ||||||||
Open-End Mutual Funds | 141,631 | – | – | 141,631 | ||||||||||||
Short Term Investments | 9,048 | – | – | 9,048 | ||||||||||||
Total | $ | 246,813 | $ | – | $ | – | $ | 246,813 | ||||||||
Pathway Advisors Aggressive Growth Fund
| Investments in Securities at Value | Level 1 - Quoted Prices | Level 2 - Other Significant Observable Inputs | Level 3 - Significant Unobservable Inputs | Total | ||||||||||||
Exchange Traded Funds | $ | 150,251 | $ | – | $ | – | $ | 150,251 | ||||||||
Open-End Mutual Funds | 140,698 | – | – | 140,698 | ||||||||||||
Short Term Investments | 61,082 | – | – | 61,082 | ||||||||||||
Total | $ | 352,031 | $ | – | $ | – | $ | 352,031 | ||||||||
The Funds recognize transfers between levels as of the beginning of the annual period in which the transfer occurred. For the period ended October 31, 2012, the Funds did not have any transfers between Level 1 and Level 2 securities. For the period ended October 31, 2012, the Funds did not have any securities that used significant unobservable inputs (Level 3) in determining fair value. Therefore, a reconciliation of assets in which significant unobservable inputs (Level 3) were used in determining fair value is not applicable.
26 | www.pathwayadvisorsfunds.com |
Table of Contents
Pathway Advisors Funds | Notes to Financial Statements | |
October 31, 2012 (Unaudited) |
Trust Expenses: Some expenses of the Trust can be directly attributed to the Funds. Expenses which cannot be directly attributed to the Funds are apportioned among all funds in the Trust based on average net assets of each fund.
Fund Expenses: Expenses that are specific to a Fund are charged directly to that Fund. Expenses which cannot be directly attributed are apportioned among all Funds in the Trust based on average net assets of Fund.
Offering Costs: Offering costs, including costs of printing initial prospectuses, legal and registration fees, are being amortized over twelve months from the inception date of the Funds. As of October 31, 2012, $22,409, $22,409 and $22,409, respectively of offering costs remain to be amortized for Pathway Advisors Conservative Fund, Pathway Advisors Growth and Income Fund and Pathway Advisors Aggressive Growth Fund, respectively.
Federal Income Taxes: The Funds comply with the requirements under Subchapter M of the Internal Revenue Code of 1986, as amended, applicable to regulated investment companies and intend to distribute substantially all of their net taxable income and net capital gains, if any, each year. The Funds are not subject to income taxes to the extent such distributions are made.
As of and during the period ended October 31, 2012, the Funds did not have a liability for any unrecognized tax benefits in the accompanying financial statements. The Funds file income tax returns in the U.S. federal jurisdiction and Colorado.
Investment Transactions and Investment Income: Investment and shareholder transactions are accounted for on the date the investments are purchased or sold (trade date basis). Net realized gains and losses from investment transactions are reported on an identified cost basis. Interest income, which includes accretion of discounts and amortization of premiums, is accrued and recorded as earned. Dividend income is recognized on the ex-dividend date or for certain foreign securities, as soon as information is available to the Funds.
Principal Investment Strategies of each Fund: Each Fund is structured as a fund-of-funds and under normal circumstances, the Funds pursue their objectives by investing primarily in managed portfolios of other open-end investment companies registered under the Investment Company of 1940, as amended (the “1940 Act”), that represent a variety of asset classes and investment styles. The Funds may also invest in closed-end funds and exchange-traded funds.
Distributions to Shareholders: Each Fund normally pays dividends and distributes capital gains, if any, on an annual basis. Income dividend distributions are derived from interest and other income each Fund receives from its investments, including distributions of short-term capital gains. Capital gain distributions are derived from gains realized when each Fund sells a security it has owned for more than a year. Each Fund may make additional distributions and dividends at other times if the portfolio manager believes doing so may be necessary for each Fund to avoid or reduce taxes. Net investment income/(loss) and net realized gain/(loss) may differ for financial statement and tax purposes.
Semi-Annual Report | October 31, 2012 | 27 |
Table of Contents
Pathway Advisors Funds | Notes to Financial Statements | |
October 31, 2012 (Unaudited) |
3. TAX BASIS INFORMATION
Tax Basis of Distributions to Shareholders: The character of distributions made during the year from net investment income or net realized gains may differ from its ultimate characterization for federal income tax purposes. Also, due to the timing of dividend distributions, the fiscal year in which amounts are distributed may differ from the fiscal year in which the income or realized gain were recorded by the Funds. There were no distributions paid by the Funds for the period ended October 31, 2012.
Unrealized Appreciation and Depreciation on Investments: As of October 31, 2012, the costs of investments for federal income tax purposes and accumulated net unrealized appreciation/(depreciation) on investments were as follows:
| Fund | Gross Appreciation (excess of value over tax cost) | Gross Depreciation (excess of tax cost over value) | Net Unrealized Appreciation | Cost of Investments for Income Tax Purposes | ||||||||||||
Pathway Advisors Conservative Fund | $ | 3,039 | – | $ | 3,039 | $ | 241,964 | |||||||||
Pathway Advisors Growth and Income Fund | 4,688 | – | 4,688 | 242,125 | ||||||||||||
Pathway Advisors Aggressive Growth Fund | 6,819 | – | 6,819 | 345,212 | ||||||||||||
4. SECURITIES TRANSACTIONS
Purchases and sales of securities, excluding short-term securities during the period ended October 31, 2012 were as follows:
| Fund | Purchases of Securities | Proceeds From Sales of Securities | ||||||
Pathway Advisors Conservative Fund | $ | 275,727 | $ | 43,269 | ||||
Pathway Advisors Growth and Income Fund | 262,814 | 30,597 | ||||||
Pathway Advisors Aggressive Growth Fund | 332,499 | 49,408 | ||||||
5. BENEFICIAL SHARE TRANSACTIONS
Transactions in shares of capital stock:
Pathway Advisors Conservative Fund
For the period July 30, 2012 (Inception) to October 31, 2012 | ||
Common Shares Outstanding - Beginning of Period | – | |
Common Shares Sold | 25,002 | |
Common Shares Outstanding - End of Period | 25,002 | |
28 | www.pathwayadvisorsfunds.com |
Table of Contents
Pathway Advisors Funds | Notes to Financial Statements | |
October 31, 2012 (Unaudited) |
Pathway Advisors Growth and Income Fund
For the period July 30, 2012 (Inception) to October 31, 2012 | ||||
Common Shares Outstanding - Beginning of Period | – | |||
Common Shares Sold | 25,002 | |||
Common Shares Outstanding - End of Period | 25,002 | |||
Pathway Advisors Aggressive Growth Fund
For the period July 30, 2012 (Inception) to October 31, 2012 | ||||
Common Shares Outstanding - Beginning of Period | – | |||
Common Shares Sold | 34,585 | |||
Common Shares Redeemed | (2) | |||
Common Shares Outstanding - End of Period | 34,583 | |||
Beneficial Ownership: The beneficial ownership, either directly or indirectly, of more than 25% of the voting securities of any of the Funds creates a presumption of control of the Funds under Section 2(a)(9) of the 1940 Act. As of October 31, 2012, the following entities owned beneficially 25% or greater of the Funds’ outstanding shares.
| Fund | Name | Percentage | |||||
Pathway Advisors Conservative Fund | Scott and Valerie Hanson Trust | 50.00 | % | ||||
Pathway Advisors Conservative Fund | The McClain Family Trust | 50.00 | % | ||||
Pathway Advisors Growth and Income Fund | Scott and Valerie Hanson Trust | 50.00 | % | ||||
Pathway Advisors Growth and Income Fund | The McClain Family Trust | 50.00 | % | ||||
Pathway Advisors Aggressive Growth Fund | Scott and Valerie Hanson Trust | 36.15 | % | ||||
Pathway Advisors Aggressive Growth Fund | The McClain Family Trust | 36.15 | % | ||||
6. MANAGEMENT AND RELATED PARTY TRANSACTIONS
Investment Advisory
Hanson McClain Strategic Advisors, Inc. (the “Adviser”), subject to the authority of the Board, is responsible for the overall management and administration of the Funds’ business affairs. The Adviser manages the investments of the Funds in accordance with the Funds’ investment objective, policies and limitations and investment guidelines established jointly by the Adviser and the Board. Pursuant to the Investment Advisory Agreement (“Advisory Agreement”), the Adviser is entitled to an investment advisory fee, computed daily and payable monthly of 1.00% of the average daily net assets for each Fund.
The Adviser has agreed contractually to limit the amount of each Fund’s total annual expenses, exclusive of Acquired Fund Fees and Expenses, brokerage expenses, interest expenses, taxes and extraordinary expenses, to 1.98% of the Funds’ average daily net assets. This agreement is in effect through August 31, 2014. The Adviser will be permitted to recover expenses it has borne through the agreement described above to the extent that the Funds’ expenses in later periods fall below
Semi-Annual Report | October 31, 2012 | 29 |
Table of Contents
Pathway Advisors Funds | Notes to Financial Statements | |
October 31, 2012 (Unaudited) |
the annual rates set forth in the relevant agreement. The Funds will not be obligated to pay any such deferred fees and expenses more than three years after the end of the fiscal year in which the fees and expense were deferred. The Adviser may not discontinue this waiver without the approval by the Funds’ Board of Trustees.
For the period ended October 31, 2012, the fee waivers and/ or reimbursements were as follows:
| Fund | Fees Waived/ Reimbursed By Advisor | Recoupment of Past Waived Fees By Advisor | Total | |||||||||
Pathway Advisors Conservative Fund | $ | 61,689 | $ | 0 | $ | 61,689 | ||||||
Pathway Advisors Growth and Income Fund | 61,802 | 0 | 61,802 | |||||||||
Pathway Advisors Aggressive Growth Fund | 64,373 | 0 | 64,373 | |||||||||
As of October 31, 2012, the balances of recoupable expenses for each Fund were as follows:
| Fund | 2012 | |
Pathway Advisors Conservative Fund | $ 61,689 | |
Pathway Advisors Growth and Income Fund | 61,802 | |
Pathway Advisors Aggressive Growth Fund | 64,373 |
Fund Accounting Fees and Expenses
ALPS Fund Services, Inc. (“ALPS” or the “Administrator”) (an affiliate of ALPS Distributors, Inc.) provides administrative, fund accounting and other services to the Funds under the Administration, Bookkeeping and Pricing Services Agreement with the Trust. Under the Agreement, ALPS is paid fees, accrued on a daily basis and paid on a monthly basis following the end of the month, based on the greater of (a) and annual total fee of $245,000 annual minimum in year 1 and $260,000 annual minimum in year 2 and forward; from the first to the last, or projected last, day of the then current year of service under the Agreement; or (b) following basis point fee schedule:
| Average Total Net Assets | Contractual Fee | ||||
Between $0-$500 Million | 0.05 | % | |||
$500M-$1 Billion | 0.03 | % | |||
Above $1 Billion | 0.02 | % | |||
The Administrator is also reimbursed by the Funds for certain out of pocket expenses.
Transfer Agent
ALPS serves as transfer, dividend paying and shareholder servicing agent for the Funds under a Transfer Agency and Services Agreement with the Trust. Under this Agreement, ALPS is paid an annual base fee of $25,000 per Fund plus fees for open accounts and is reimbursed for certain out-of-pocket expenses.
Compliance Services
ALPS provides services that assist the Funds’ Chief Compliance Officer in monitoring and testing the policies and procedures of the Trust in conjunction with requirements under Rule 38a-1 under
30 | www.pathwayadvisorsfunds.com |
Table of Contents
Pathway Advisors Funds | Notes to Financial Statements | |
October 31, 2012 (Unaudited) |
the 1940 Act under the Chief Compliance officer Services Agreement. Under this Agreement, ALPS is paid an annual base fee of $40,000 and is reimbursed for certain out-of-pocket expenses.
Principal Financial Officer
ALPS receives an annual fee of $10,000 for providing Principal Financial Officer (“PFO”) services to the Trust and is reimbursed for certain out-of-pocket expenses.
Distributor
ALPS Distributors, Inc. (“ADI” or the “Distributor”) (an affiliate of ALPS) acts as the distributor of the Funds’ shares pursuant to a Distribution Agreement with the Trust. Shares are sold on a continuous basis by ADI as agent for the Funds, and ADI has agreed to use its best efforts to solicit orders for the sale of Funds’ shares, although it is not obliged to sell any particular amount of shares. ADI is not entitled to any compensation for its services as Distributor. ADI is registered as a broker-dealer with the Securities and Exchange Commission.
Each Fund has adopted a separate Distribution and Services Plan (each a “Plan” and collectively, the “Plans”) pursuant to Rule 12b-1 of the 1940 Act. The Plans allow each Fund, as applicable, to use each Fund’s assets to pay fees in connection with the distribution and marketing of the Funds’ shares and/or the provision of shareholder services to the Funds’ shareholders. The Plan permits payment for services in connection with the administration of plans or programs that use shares of each Fund as their funding medium and for related expenses. The Plans permit each Fund to make total payments at an annual rate of up to 0.35% of a Fund’s average daily net assets. Because these fees are paid out of the Funds’ assets on an ongoing basis, over time they will increase the cost of an investment in the Funds, and Plan fees may cost an investor more than other types of sales charges.
Each Fund has adopted a Shareholder Services Plan (a “Shareholder Services Plan”) with respect to its shares. Under the Shareholder Services Plan, each Fund is authorized to pay banks and their affiliates and other institutions, including broker-dealers and Fund affiliates (“Participating Organizations”), an aggregate fee in an amount not to exceed on an annual basis 0.15% of the average daily net asset value of shares of the Funds attributable to or held in the name of a Participating Organization for its clients as compensation for providing services pursuant to an agreement with a Participating Organization. Any amount of such payment not paid during the Funds’ fiscal year for such service activities shall be reimbursed to the Funds as soon as practicable after the end of the fiscal year. Shareholder Services Plan fees are included with distribution and service fees on the Statement of Operations.
7. INDEMNIFICATIONS
Under the Trust’s organizational documents, its officers and Trustees are indemnified against certain liability arising out of the performance of their duties to the Trust. Additionally, in the normal course of business, the Trust enters into contracts with service providers that may contain general indemnification clauses, which may permit indemnification to the extent permissible under applicable laws. The Trust’s maximum exposure under these arrangements is unknown, as this would involve future claims that may be made against the Trust that have not yet occurred.
Semi-Annual Report | October 31, 2012 | 31 |
Table of Contents
Pathway Advisors Funds | Disclosure Regarding Approval of Fund Advisory Agreements | |
October 31, 2012 (Unaudited) |
Pathway Advisors Conservative Fund, Pathway Advisors Growth and Income Fund and Pathway Advisors Aggressive Growth Fund (the “Pathway Advisors Funds”)
On June 12, 2012, the Trustees met in person to discuss, among other things, the approval of the Investment Advisory Agreement between the Trust and Hanson McClain Strategic Advisors, Inc. (the “Pathway Funds Advisory Agreement”) in accordance with Section 15(c) of the 1940 Act. The Independent Trustees met with independent legal counsel during executive session and discussed the Pathway Funds Advisory Agreement and other related materials.
In approving the Pathway Funds Advisory Agreement, the Trustees, including the Independent Trustees, considered the following factors with respect to the Pathway Advisors Funds:
Investment Advisory Fee Rate: The Trustees reviewed and considered the contractual annual advisory fee to be paid by the Trust, on behalf of the Pathway Advisors Funds, to Hanson McClain of 1.00% of each of the Pathway Advisors Funds’ daily average net assets, in light of the extent and quality of the advisory services to be provided by Hanson McClain to the Pathway Advisors Funds.
The Trustees considered the information they received comparing the Pathway Advisors Funds’ contractual annual advisory fee and overall expenses with those of funds in both the relevant expense group and universe of funds provided by an independent provider of investment company data.
Based on such information, the Trustees further determined that the contractual annual advisory fee of 1.00% of each of the Pathway Advisors Funds and the total expense ratio of 1.98% for each of the Pathway Advisors Funds, taking into account the contractual fee waiver in place, is comparable to others within each of the Pathway Advisors Funds’ anticipated peer universe.
Nature, Extent and Quality of the Services under the Investment Advisory Agreement: The Trustees received and considered information regarding the nature, extent and quality of services to be provided to the Pathway Advisors Funds under the Investment Advisory Agreement. The Trustees reviewed certain background materials supplied by Hanson McClain in its presentation, including its Form ADV.
The Trustees reviewed and considered Hanson McClain’s investment advisory personnel, its history as an asset manager and its performance and the amount of assets currently under management by Hanson McClain and its affiliated entities. The Trustees also reviewed the research and decision-making processes utilized by Hanson McClain, including the methods adopted to seek to achieve compliance with the investment objectives, policies and restrictions of the Pathway Advisors Funds.
The Trustees considered the background and experience of Hanson McClain’s management in connection with the Pathway Advisors Funds, including reviewing the qualifications, backgrounds and responsibilities of the management team primarily responsible for the day-to-day portfolio management of the Pathway Advisors Funds and the extent of the resources devoted to research and analysis of actual and potential investments.
The Trustees also reviewed, among other things, Hanson McClain’s insider trading policies and procedures and its Code of Ethics.
32 | www.pathwayadvisorsfunds.com |
Table of Contents
Pathway Advisors Funds | Disclosure Regarding Approval of Fund Advisory Agreements | |
October 31, 2012 (Unaudited) |
Performance: The Trustees noted that since the Pathway Advisors Funds had not yet begun operations, there was no fund performance to be reviewed or analyzed at this time. The Trustees also considered the limitations on the comparability of performance information for certain related separately managed accounts. The Trustees considered Hanson McClain’s reputation generally and its investment techniques, risk management controls and decision-making processes.
The Adviser’s Profitability: The Trustees received and considered a projected profitability analysis prepared by Hanson McClain based on the fees payable under the Investment Advisory Agreement. The Trustees considered the profits, if any, anticipated to be realized by Hanson McClain in connection with the operation of the Pathway Advisors Funds. The Trustees noted that there were no audited financials for Hanson McClain as 2011 was its first year of operation and there were no revenues.
Economies of Scale: The Trustees considered whether economies of scale in the provision of services to the Pathway Advisors Funds will be passed along to the shareholders under the proposed agreements.
Other Benefits to the Adviser: The Trustees reviewed and considered any other incidental benefits derived or to be derived by Hanson McClain from its relationship with the Pathway Advisors Funds, including soft dollar arrangements.
In selecting Hanson McClain as the Pathway Advisors Funds’ investment adviser and approving the Pathway Funds Advisory Agreement and the fees charged under the Pathway Funds Advisory Agreement, the Trustees concluded that no single factor reviewed by the Trustees was identified by the Trustees to be determinative as the principal factor in whether to approve the Pathway Funds Advisory Agreement. Further, the Independent Trustees were advised by separate independent legal counsel throughout the process. The Trustees, including all of the Independent Trustees, concluded that:
| — | the investment advisory fees to be received by Hanson McClain with respect to the Pathway Advisors Funds were comparable to others within each of the Pathway Advisors Funds’ peer universe; |
| — | the nature, extent and quality of services to be rendered by Hanson McClain under the Pathway Funds Advisory Agreement were adequate; |
| — | there was no performance history for the Pathway Advisors Funds for the Board to consider; |
| — | the terms of the proposed fee waiver and expense limitation agreement between the Trust, on behalf of each Fund, and Hanson McClain, were not unreasonable; |
| — | the profit, if any, anticipated to be realized by Hanson McClain in connection with the operation of the Pathway Advisors Funds is not unreasonable to the Pathway Advisors Funds; and |
| — | there were no material economies of scale or other incidental benefits accruing to Hanson McClain in connection with its relationship with the Pathway Advisors Funds. |
Based on the Trustees’ deliberations and their evaluation of the information described above, the Trustees, including all of the Independent Trustees, concluded that Hanson McClain’s compensation for investment advisory services is consistent with the best interests of the Pathway Advisors Funds and their shareholders.
Semi-Annual Report | October 31, 2012 | 33 |
Table of Contents
Pathway Advisors Funds | Additional Information | |
October 31, 2012 (Unaudited) |
1. FUND HOLDINGS
The Funds file their complete schedule of portfolio holdings with the Securities and Exchange Commission (the “SEC”) for the first and third quarters of each fiscal year on Form N-Q within 60 days after the end of the period. Copies of the Funds’ Form N-Q are available without charge on the SEC website at http://www.sec.gov. You may also review and copy the Form N-Q at the SEC’s Public Reference Room in Washington, DC. For more information about the operation of the Public Reference Room, please call the SEC at 1-800-SEC-0330.
2. FUND PROXY VOTING POLICIES, PROCEDURES AND SUMMARIES
The Funds’ policies and procedures used in determining how to vote proxies and information regarding how the Fund voted proxies relating to portfolio securities during the most recent prior 12-month period ending June 30 are available without charge, (1) upon request, by calling (toll-free) 888-288-1121 and (2) on the SEC’s website at http://www.sec.gov.
34 | www.pathwayadvisorsfunds.com |
Table of Contents
Page Intentionally Left Blank
Table of Contents
Page Intentionally Left Blank
Table of Contents
 | Must be preceded or accompanied by a Prospectus. Funds distributed by ALPS Distributors, Inc. |
Table of Contents
Table of Contents
| TABLEOF CONTENTS | |

| PAGE | ||||
| 1 | ||||
| 7 | ||||
| 8 | ||||
| 9 | ||||
| 10 | ||||
| 11 | ||||
| 12 | ||||
| 13 | ||||
| 14 | ||||
| 15 | ||||
| 17 | ||||
| 18 | ||||
| 23 | ||||
| 24 | ||||
Table of Contents
Redmont Funds | Shareholder Letter | |
| October 31, 2012 (Unaudited) |
Introduction:
Renewed concerns over the stability of the European Union in particular and the resulting impacts on the broader globe economy in general weighed on investor sentiment during the second quarter. As the year unfolded, the global equity markets stabilized during the third quarter and were positive each month. Domestic and global equity markets have produced double digit gains from January through October 2012 as policy makers across the world have continued aggressive actions to keep economic growth moving in a positive direction. The presidential election in the United States was a large source of pressure on investor sentiment. The constant drumbeat of negative campaigning reinforced the failings of each major political party instead of working towards a solution for the legitimate challenges that face the US and the global economy as whole. 2012 is a significant year for elections across the global so this challenge was not unique to the domestic markets.
With this type of environment, the world is experiencing a great deal of uncertainty which causes the investment markets to lurch back and forth – as the markets have from 2010 – 3Q12. We believe this type of return environment makes it extremely difficult for investors to achieve their long-term objectives, as increased volatility combined with increased correlation(1) across asset classes decreases an investor’s patience and increases the desire to make changes to their investment program. This desire to change is purely reactionary and is defined by Warren Buffet as emotional corrosion. We believe that overcoming this emotional corrosion is one of the most difficult things for investors to accomplish. Using investment strategies – like hedged equity exposure – that seek to control volatility while still providing the potential for long-term returns sufficient to meet the objectives of the investor can help to control the need to make changes at inopportune times.
With that background in mind, we have made some adjustments to the allocation of the portfolio since the annual report was published as of April 30th. The subsequent sections will describe the changes and the reasoning behind them in more detail.
Performance Discussion:
REDMONT RESOLUTE FUND I
Table 1 notes the performance for Fund I as of quarter end under standardized reporting (since inception) as well as since initial funding on January 17, 2012 through October 31, 2012.
Performance† (amounts greater than one year are annualized)
Redmont Resolute Fund I Cumulative Total Return(b) | Total Cumulative Return As of September 30, 2012 | Total Cumulative Return From January 17, 2012 to October 31, 2012(a) | ||||||||||||
| YTD | 1-Year | Since Inception* | 3 Months | Year-to-Date | 1-Year | Since 1/17/2012^ | ||||||||
Class A (NAV) | 1.20% | N/A | 1.20% | 0.80% | 0.40% | N/A | 0.30% | |||||||
Class A (MOP) | -4.35% | N/A | -4.35% | -4.74% | -5.10% | N/A | -5.19% | |||||||
Class I (NAV) | 1.40% | N/A | 1.40% | 0.90% | 0.70% | N/A | 0.70% | |||||||
HFRX Global Hedge Fund Index(c) | 2.69% | N/A | 2.69% | 0.37% | 2.15% | N/A | 1.07% | |||||||
S&P 500® Total Return(d) | 16.44% | N/A | 16.44% | 2.96% | 14.29% | N/A | 11.02% | |||||||
Morningstar Multi-Alternative Universe (e) | 3.41% | N/A | 3.41% | 0.56% | 2.85% | N/A | 1.84% | |||||||
| † | Source: FactSet |
| * | Fund Inception Date 12/30/2011. |
| ^ | The date at which cashflows were sufficient to commence standard trading operations. |
| Fees and Expenses of the Fund | ||||||
| Total Annual Fund Operating Expenses | Fee Waiver and Expense Reimbursement(f) | Total Annual Expenses After Waiver | ||||
Resolute Fund I – Class A | 7.36% | -5.06% | 2.30% | |||
Resolute Fund I – Class I | 7.29% | -5.39% | 1.90% | |||
| Semi-Annual Report | October 31, 2012 | 1 |
Table of Contents
Redmont Funds | Shareholder Letter | |
| October 31, 2012 (Unaudited) |
| (a) | January 17, 2012 was when the Fund received its first cash inflow sufficient to invest the Fund in the underlying investments. Performance is also shown as of the actual inception/launch of the Fund at December 30, 2011 through January 17, 2012 until the initial cash flows were received. However, the Fund was invested in money markets from December 30, 2011 through January 17, 2012 until the initial cash flows were received. |
| (b) | Cumulative performance is the aggregate amount that an investment has gained or lost over time, indicative of performance of time involved, including the reinvestment of interest and dividends. Performance since funding is calculated at the Fund’s net asset value (NAV) and is from the date in which the fund received outside funding. |
| (c) | The HFRX Global Index is designed to be representative of the overall composition of the hedge fund universe and includes convertible arbitrage, distressed securities, equity hedge, equity market neutral, event driven, macro, merger arbitrage and relative value strategies. The index is not actively managed and does not reflect any deduction of fees, expenses or taxes. An investor may not invest directly in an index. |
| (d) | The S&P 500® Total Return Index is the Standard & Poor’s composite index of 500 stocks, a widely recognized, unmanaged index of common stock prices. The index is not actively managed and does not reflect any deduction of fees, expenses or taxes. An investor may not invest directly in an index. |
| (e) | The Morningstar Multi-alternative Universe is designed to represent the exposure to alternative investment tactics. Funds in this category have majority of their assets exposed to alternative strategies. An investor’s exposure to different tactics may change slightly over time in response to market movements. Funds in this category include both funds with static allocations to alternative strategies and funds tactically allocating among alternative strategies and asset classes. The gross short exposure is greater than 20%. |
| (f) | During the period covered by this report, Highland Associates, Inc. contractually agreed to limit the amount of the Fund’s total annual expenses, exclusive of 12b-1 fees, Acquired Fund Fees and Expenses, brokerage expenses, interest expenses, taxes, and extraordinary expenses, to 1.90% of the Fund’s average daily net assets. Highland will be permitted to recover, on a class-by-class basis, expenses it has borne through the agreement described above to the extent the Fund’s expenses in later periods fall below the annual rates set forth in the relevant agreement. The Fund will not be obligated to pay any such deferred fees and expenses more than three years after the end of the fiscal year in which the fees and expenses were deferred. |
This performance analysis section shows the Fund’s historical performance. Past performance is not indicative of future results. Investment return and value of shares will fluctuate. Upon redemption, shares may be worth more or less than their original cost. The current performance may be higher or lower than the quoted performance. Call 1-855-268-2242 or visit www.redmontfunds.com for the most recent month end performance results. The Fund has a redemption fee of 2.00% for shares redeemed within the first 90 days of purchase. Maximum Offering Price (MOP) for Class A shares includes the Fund’s maximum sales charge of 5.50%. Performance shown at NAV does not include these sales charges and would have been lower had it been taken into account.
The Redmont Resolute Fund I is a new fund with limited operating history. The table does not reflect the deduction of taxes that a shareholder would pay on Fund distributions or redemption of Fund shares.
Performance vs. HFRX Global(2):
Fund I had a very strong period of performance and is now roughly in-line with the HFRX Global Index on a year-to-date basis when looking at the non-standardized inception of January 17th. Fund I outperformed the HFRX Global Index during June, July, August, and September as the equity markets performed very strongly during the summer. The Resolute Fund has maintained a higher level of net equity exposure than the HFRX Global Index and this was the main factor in the outperformance. The Fund seeks to perform in line with the equity markets over time with less volatility. In order to accomplish this objective, the Fund must maintain a minimum level of net equity exposure or it will not be able to keep up enough in strong markets. Net equity exposure in the hedge fund market has been fairly low throughout 2012. Though hedge fund exposure can vary greatly over time, we expect to outperform the Index in up markets and underperform in down markets and to outperform the Index over a full market cycle.
In looking at the standardized performance (12/31/2011 – 9/30/2012), the two largest factors in the Fund’s underperformance versus the Index were the funding delay in January and the large market draw-down in May. January was a strong month for performance (1.72% return for the Index) and since the Fund was only invested for half the month, the Fund did not participate in the strong performance to the same degree as the Index. In May, the Fund underperformed due to its higher net equity exposure relative to the Index. Both of these issues have been discussed in previous quarterly letters.
Performance vs. S&P 500®(3) :
The Fund has performed as expected for the year-to-date period – it has participated but trailed in strong up markets (January, February, March, June, July, August, and September) but protected capital and outperformed in negative markets (April, May, and October).
Performance vs. Universe:
When compared to the peer group (Morningstar Multi-Alternative Universe)(4), the Fund outperformed the Universe more recently but has trailed on a year-to-date basis. The Fund has outperformed the Universe during six (February, April, June, July, August, September) of the nine months of 2012. The Fund only underperformed the Universe by 7 basis points in March and 20 basis points in October while the underperformance during January and May is discussed below. As with the HFRX Global Index, the Universe is very diverse and contains a number of market-neutral and other low net equity strategies that cause the average net equity exposure for the Universe to be considerably less than our Fund. So we seek to outperform the Universe in up markets and underperform in down markets – 2012 has been consistent with our expectations.
| 2 | www.redmontfunds.com |
Table of Contents
Redmont Funds | Shareholder Letter | |
| October 31, 2012 (Unaudited) |
The factors in the underperformance during January and May are similar to the issues discussed above regarding the HRFX relative performance – the funding delay in January and the large market draw-down in May. January was a strong month for performance for the Universe (1.77% return for the Universe) and since the Fund was only invested for half the month, the Fund did not participate in the strong performance to the same degree as the Universe. In May, the Fund underperformed due to its higher net equity exposure relative to the Universe.
REDMONT RESOLUTE FUND II
Table 2 notes the performance for Fund II as of quarter end under standard reporting (since inception) as well as since initial funding on January 6, 2012 through October 31, 2012.
Performance† (amounts greater than one year are annualized)
Redmont Resolute Fund II Cumulative Total Return(b) | Total Cumulative Return As of September 30, 2012 | Total Cumulative Return From January 6, 2012 to October 31, 2012( a) | ||||||||||||
| YTD | 1-Year | Since Inception* | 3 Months | Year-to-Date | 1-Year | Since 1/6/12^ | ||||||||
Class I (NAV) | 4.40% | N/A | 4.40% | 1.27% | 3.50% | N/A | 3.50% | |||||||
HFRX Global Hedge Fund Index(c) | 2.69% | N/A | 2.69% | 0.37% | 2.15% | N/A | 1.51% | |||||||
S&P 500® Total Return(d) | 16.44% | N/A | 16.44% | 2.96% | 14.29% | N/A | 12.42% | |||||||
Morningstar Multi-Alternative Universe(e) | 3.41% | N/A | 3.41% | 0.56% | 2.85% | N/A | 2.12% | |||||||
| † | Source: FactSet |
| * | Fund Inception Date 12/30/2011. |
| ^ | The date at which cashflows were sufficient to commence standard trading operations. |
| Fees and Expenses of the Fund | ||||||
| Total Annual Fund Operating Expenses | Fee Waiver and Expense Reimbursement(f) | Total Annual Expenses After Waiver | ||||
Resolute Fund II – Class A | 0.81% | -0.50% | 0.31% | |||
| (a) | January 6, 2012 was when the Fund received its first cash inflow sufficient to invest the Fund in the underlying investments. Performance is also shown as of the actual inception/launch of the Fund at December 30, 2011. However, the Fund was invested in money markets from December 30, 2011 through January 6, 2012 until the initial cash flows were received. |
| (b) | Cumulative performance is the aggregate amount that an investment has gained or lost over time, indicative of performance of time involved, including the reinvestment of interest and dividends. Performance since funding is calculated at the Fund’s net asset value (NAV) and is from the date in which the fund received outside funding. |
| (c) | The HFRX Global Index is designed to be representative of the overall composition of the hedge fund universe, and includes convertible arbitrage, distressed securities, equity hedge, equity market neutral, event driven, macro, merger arbitrage, and relative value strategies. The index is not actively managed and does not reflect any deduction of fees, expenses or taxes. An investor may not invest directly in an index. |
| (d) | The S&P 500® Total Return Index is the Standard & Poor’s composite index of 500 stocks, a widely recognized, unmanaged index of common stock prices. The index is not actively managed and does not reflect any deduction of fees, expenses or taxes. An investor may not invest directly in an index. |
| (e) | The Morningstar Multi-alternative Universe is designed to represent the exposure to alternative investment tactics. Funds in this category have majority of their assets exposed to alternative strategies. An investor’s exposure to different tactics may change slightly over time in response to market movements. Funds in this category include both funds with static allocations to alternative strategies and funds tactically allocating |
| (f) | During the period covered by this report, Highland Associates, Inc. contractually agreed to waive the total amount of the Fund’s 0.50% management fees. |
This performance analysis section shows the fund’s historical performance. Past performance is not indicative of future results. Investment return and value of shares will fluctuate. Upon redemption, shares may be worth more or less than their original cost. The current performance may be higher or lower than the quoted performance. Call 1-855-268-2242 or visit www.redmontfunds.com for the most recent month end performance results. The Fund has a redemption fee of 2.00% for shares redeemed within the first 90 days of purchase.
The Redmont Resolute Fund II is a new fund with limited operating history. The table does not reflect the deduction of taxes that a shareholder would pay on Fund distributions or redemption of Fund shares.
Performance vs. HFRX Global:
Fund II had a very strong period of performance and has outperformed the HFRX Global Index on a year-to-date basis. The Fund outperformed the HFRX Global Index during every month this calendar year except for March, May, and October as the Fund has maintained a higher level of net equity exposure than the HFRX Global Index and this was the main factor in the outperformance. As we have discussed in previous letters, the Fund seeks to perform in line with the equity markets over time with less volatility. In order to accomplish this objective, the Fund must maintain a minimum level of net equity exposure or it will not be able to keep up enough in strong markets. Net equity exposure in the hedge fund market has
| Semi-Annual Report | October 31, 2012 | 3 |
Table of Contents
Redmont Funds | Shareholder Letter | |
| October 31, 2012 (Unaudited) |
been fairly low throughout 2012. Though hedge fund exposure can vary greatly over time, we expect to outperform the Index in up markets and underperform in down markets and to outperform the Index over a full market cycle.
Performance vs. S&P 500®:
The Fund has performed as expected for the year-to-date period – it has participated but trailed in strong up markets (January, February, March, June, July, August, and September) but protected capital and outperformed in negative markets (April, May, and October).
Performance vs. Universe:
When compared to the peer group (Morningstar Multi-Alternative Universe), the Fund outperformed the Universe by a wide margin more recently and is now ahead on a year-to-date basis as well. The Fund has outperformed the Universe during seven (January, February, April, June, July, August, September) of the ten months of 2012. The Fund only underperformed the Universe by 13 basis points in March and 30 basis points in October and the underperformance during May was due to the higher net equity exposure of the Fund relative to the Universe. As with the HFRX Global Index, the Universe is very diverse and contains a number of market-neutral and other low net equity strategies that cause the average net equity exposure for the Universe to be considerably less than our Fund. So we expect to outperform the Universe in up markets and underperform in down markets – 2012 has been consistent with our expectations.
Underlying Allocation Weights & Performance:
The Funds are composed of three main asset classes:
| • | Tactical Asset Allocation; |
| • | Long/Short Equity; and |
| • | Opportunistic/Other(5) |
The Fund ended April with a target weight of 40% in Tactical with three underlying funds (investment companies), 40% in Long/Short with four underlying funds (investment companies), and 20% in Opportunistic with two managers that each have two underlying funds (investment companies) for a total of four holdings. During the middle of May, we changed the allocation by reducing the Tactical exposure and increasing the Opportunistic/Other exposure. In general, the Tactical allocation will have the highest level of net equity exposure while the Opportunistic/Other allocation will have the lowest level of net equity exposure. These changes were intended to lower the overall net equity exposure of the Fund and were based on the following reasons:
| • | Valuations(6): equity market returns had been very strong for the preceding six months and, using our internal valuation models, valuations were roughly at their long-term average; |
| • | Economic uncertainty: we believe the increasing uncertainty and economic challenges noted in the introduction will pressure investor sentiment and the equity markets for the foreseeable future; and |
| • | Elections: we believe the elections in the United States and abroad will only serve to emphasize the very real problems globally and will further serve to pressure investor sentiment. |
The combination of valuations close to their long-term averages and the likely poor investor sentiment caused us to reposition the portfolio more conservatively. To the extent that equity market valuations become more attractive, we will consider increasing the net equity exposure of the portfolio. As a result of the reallocation, the target allocations were changed to 30% in Tactical with three underlying funds (investment companies), 35% in Long/Short with four underlying funds (investment companies), and 35% in Opportunistic with four underlying funds (investment companies), and those targets remain in place currently.
Performance by underlying fund (investment company) varied but the Tactical Asset Allocators have contributed the most to returns during 2012 after a very strong period of performance. Long/Short was a close second and has been the most consistent contributor to returns in each quarter this year. The Opportunistic exposure has been the weakest allocation year-to-date which is expected given the strong equity markets and the allocation’s generally low net equity exposure.
Portfolio Exposure(7):
Net equity exposure rose steadily after June 30th as the trend following managers within the Opportunistic allocation increased their net exposure after the end of the second quarter. While the net equity exposure increased, the volatility on the Fund remained constant (declining slightly) and remains less than half of the volatility experienced by the S&P 500. As we have noted before, while the year-to-date period is too short to draw any long-term conclusions about the Fund, our current long-term target for net equity exposure is 10-60% and our long-term target for volatility is roughly 1/2 that of the S&P 500 – both targets have been achieved during the year.
| 4 | www.redmontfunds.com |
Table of Contents
Redmont Funds | Shareholder Letter | |
| October 31, 2012 (Unaudited) |
Closing:
We appreciate your investment in the Redmont Resolute Fund. Please feel free to contact us with any questions.
Sincerely,

R. Scott Graham, CFA & Michael T. Lytle, CFA
Portfolio Managers(8)
Important Notes and Disclosures
The views and information discussed in this commentary are as of the date of publication, are subject to change, and may not reflect the writer’s current views. The views expressed represent an assessment of market conditions at a specific point in time, are opinions only and should not be relied upon as investment advice regarding a particular investment or markets in general. Such information does not constitute a recommendation to buy or sell specific securities or investment vehicles. It should not be assumed that any investment will be profitable or will equal the performance of the portfolios or any securities or any sectors mentioned herein. The subject matter contained herein has been derived from several sources believed to be reliable and accurate at the time of compilation. The Funds do not accept any liability for losses either direct or consequential caused by the use of this information.
The Fund’s investment objectives, risks, charges and expenses must be considered before investing. The prospectus contains this and other important information about the investment company, and may be obtained by calling 1-855-268-2242 or by visiting www.redmontfunds.com. Read it carefully before investing.
Information in this report regarding market or economic trends or the factors influencing historical or future performance reflects the opinions of management as of the date of this report. These statements should not be relied upon for any other purpose.
RISKS:
The Fund may utilize a fund-of-fund structure. There are certain risks associated with the use of a fund-of-funds structure. These risks include, but are not limited to higher expenses, allocation risk, underlying fund risk, and transparency risk. Investments such as mutual funds which focus on alternative strategies are subject to increased risk and loss of principal and are not suitable for all investors.
The Fund’s investments may subject the Fund to significantly greater volatility than investments in traditional securities and involve substantial risks, including risk of a significant portion on their principal value. The commodities markets and the prices of various commodities may fluctuate widely based on a variety of factors. Because the Fund’s performance is linked to the performance of highly volatile commodities, investors should consider purchasing shares of the Fund only as part of an overall diversified portfolio and should be willing to assume the risks of potentially significant fluctuations in the value of the Fund. Additional risks of Commodity Futures-Linked Investments include liquidity risk and counterparty credit risk.
Another principal risk of investing in the Fund is equity risk, which is the risk that the value of the securities held by the Fund will fall due to general market and economic conditions, perceptions regarding the industries in which the issuers of securities held by the Fund participate or factors relating to specific companies in which the Fund invest.
The Fund’s investments in non-U.S. issuers may be even more volatile and may present more risks than investments in U.S. issuers. Equity investments in commodity-related companies may not move in the same direction and to the same extent as the underlying commodities.
This Fund is not suitable for all investors. Subject to investment risks, including possible loss of the principal amount invested.
| Semi-Annual Report | October 31, 2012 | 5 |
Table of Contents
Redmont Funds | Shareholder Letter | |
| October 31, 2012 (Unaudited) |
| (1) | Correlation is a statistical measure of how two securities move in relation to each other. |
| (2) | The HFRX Global Index is designed to be representative of the overall composition of the hedge fund universe and includes convertible arbitrage, distressed securities, equity hedge, equity market neutral, event driven, macro, merger arbitrage, and relative value strategies. The index is not actively managed and does not reflect any deduction of fees, expenses or taxes. Investors cannot invest directly in an index. |
| (3) | The S&P 500® Index consists of 500 widely held common stocks covering industrial, utility, financial, and transportation sectors. The index is not actively managed and does not reflect any deduction of fees, expenses or taxes. Investors cannot invest directly in an index. |
| (4) | The Morningstar Multi-alternative Universe is designed to represent the exposure to alternative investment tactics. Funds in this category have majority of their assets exposed to alternative strategies. An investor’s exposure to different tactics may change slightly over time in response to market movements. Funds in this category include both funds with static allocations to alternative strategies and funds tactically allocating among alternative strategies and asset classes. The gross short exposure is greater than 20%. |
| (5) | The “other” classification consists of but is not limited to trading strategies, managed futures, arbitrage, distressed securities, etc. |
| (6) | Valuation is the process for determining the current worth of a security or a company. |
| (7) | The statistics are computed on a daily periodicity. All comparative calculations are versus the S&P 500® Index. Net equity represents the Fund’s exposure to equity securities. Volatility is measured by calculating the standard deviation. |
| (8) | R. Scott Graham and Michael T. Lytle are registered representatives of ALPS Distributors, Inc. CFA Institute Marks are trademarks owned by the CFA Institute. |
| 6 | www.redmontfunds.com |
Table of Contents
| Performance Update | ||
| October 31, 2012 (Unaudited) |
Performance (for the period ended October 31, 2012)
Redmont Resolute Fund I
| Cumulative Total Return (for the period ended October 31, 2012) | Year-to-Date | Since Inception* | ||||||||
Class A (NAV)(a) | 0.40% | 0.40% | ||||||||
Class A (MOP)(b) | -5.10% | -5.10% | ||||||||
Class I (NAV) | 0.70% | 0.70% | ||||||||
S&P 500® Total Return Index(c) | 14.29% | 14.29% | ||||||||
HFRX Global Hedge Fund Index(d) | 2.15% | 2.15% | ||||||||
| (a) | Net Asset Value (NAV) is the share price without sales charges. |
| (b) | Maximum Offering Price (MOP) for Class A shares includes the Fund's maximum sales charge of 5.50%. Performance shown at NAV does not include these sales charges and would have been lower had it been taken into account. |
| (c) | The S&P 500® Total Return Index is the Standard & Poor's composite index of 500 stocks, a widely recognized, unmanaged index of common stock prices. The index is not actively managed and does not reflect any deduction of fees, expenses or taxes. An investor may not invest directly in an index. |
| (d) | The HFRX Global Index is designed to be representative of the overall composition of the hedge fund universe, and includes convertible arbitrage, distressed securities, equity hedge, equity market neutral, event driven, macro, merger arbitrage, and relative value strategies. The index is not actively managed and does not reflect any deduction of fees, expenses or taxes. Investors cannot invest directly in an index. |
Performance data quoted represents past performance. Past performance does not guarantee future results. Investment return and principal value of an investment will fluctuate so that an investor’s shares, when sold or redeemed, may be worth more or less than the original cost. Current performance data may be higher or lower than actual data quoted. For the most current month-end performance data please call 1-855-268-2242.
The table does not reflect the deduction of taxes that a shareholder would pay on Fund distributions or the redemption of Fund shares.
* Fund Inception date of 12/30/11.
| Top Ten Holdings (for the period ended October 31, 2012*) | ||||
As a percentage of Net Assets | ||||
AQR Multi Strategy Alternative Fund, Class I | 12.45% | |||
AQR Risk Parity Fund, Class I | 12.35% | |||
PIMCO Global Multi-Asset Fund, Institutional Class | 11.80% | |||
FPA Crescent Fund | 8.86% | |||
BlackRock Global Allocation Fund, Inc., Class I | 8.84% | |||
Turner Spectrum Fund, Institutional Class | 8.71% | |||
Robeco Boston Partners Long/Short Research Fund, Institutional Class | 8.65% | |||
Marketfield Fund | 8.65% | |||
Diamond Hill Long-Short Fund, Class Y | 8.57% | |||
ASG Managed Futures Strategy Fund, Class A | 4.95% | |||
Top Ten Holdings | 93.83% | |||
* Holdings are subject to change. Table presents indicative values only. | ||||
Performance of $10,000 Initial Investment (for the period ended October 31, 2012)
Comparison of change in value of a $10,000 investment (includes applicable sales loads)
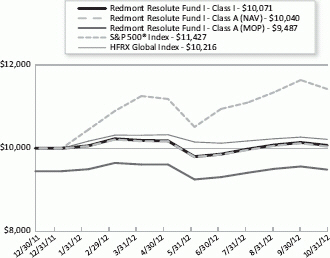
The chart represents historical performance of a hypothetical investment of $10,000 in the Fund since inception. Past performance does not guarantee future results. This chart does not reflect the deduction of taxes that a shareholder would pay on Fund distributions or the redemption of Fund shares.
| Semi-Annual Report | October 31, 2012 | 7 |
Table of Contents
| Performance Update | ||
| October 31, 2012 (Unaudited) |
Performance (for the period ended October 31, 2012)
Redmont Resolute Fund II
| Cumulative Total Return (for the period ended October 31, 2012) | Year-to-Date | Since Inception* | ||||||||
Class I (NAV) | 3.50 | % | 3.50 | % | ||||||
S&P 500® Total Return Index(a) | 14.29 | % | 14.29 | % | ||||||
HFRX Global Hedge Fund Index(b) | 2.15 | % | 2.15 | % | ||||||
| (a) | The S&P 500® Total Return Index is the Standard & Poor’s composite index of 500 stocks, a widely recognized, unmanaged index of common stock prices. The index is not actively managed and does not reflect any deduction of fees, expenses or taxes. An investor may not invest directly in an index. |
| (b) | The HFRX Global Index is designed to be representative of the overall composition of the hedge fund universe and includes convertible arbitrage, distressed securities, equity hedge, equity market neutral, event driven, macro, merger arbitrage and relative value strategies. The index is not actively managed and does not reflect any deduction of fees, expenses or taxes. Investors cannot invest directly in an index. |
Performance data quoted represents past performance. Past performance does not guarantee future results. Investment return and principal value of an investment will fluctuate so that an investor’s shares, when sold or redeemed, may be worth more or less than the original cost. Current performance data may be higher or lower than actual data quoted. For the most current month-end performance data please call 1-855-268-2242.
The table does not reflect the deduction of taxes that a shareholder would pay on Fund distributions or the redemption of Fund shares.
* Fund Inception date of 12/30/11.
| Top Ten Holdings (for the period ended October 31, 2012*) | ||||
As a percentage of Net Assets | ||||
Marketfield Fund | 16.82% | |||
Diamond Hill Long-Short Fund, Class Y | 14.85% | |||
PIMCO Global Multi-Asset Fund, Institutional Class | 14.09% | |||
BlackRock Global Allocation Fund, Inc., Class I | 10.62% | |||
FPA Crescent Fund | 10.56% | |||
AQR Risk Parity Fund, Class I | 7.52% | |||
ASG Managed Futures Strategy Fund, Class Y | 7.16% | |||
AQR Multi Strategy Alternative Fund, Class I | 6.93% | |||
Turner Spectrum Fund, Institutional Class | 6.49% | |||
ASG Diversifying Strategies Fund, Class Y | 2.43% | |||
Top Ten Holdings | 97.47% | |||
* Holdings are subject to change. Table presents indicative values only. | ||||
Performance of $10,000 Initial Investment (for the period ended October 31, 2012)
Comparison of change in value of a $10,000 investment
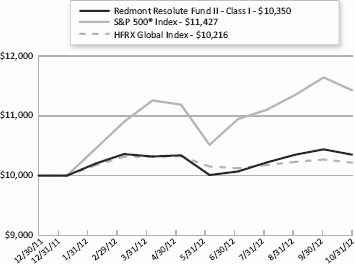
The chart represents historical performance of a hypothetical investment of $10,000 in the Fund since inception. Past performance does not guarantee future results. This chart does not reflect the deduction of taxes that a shareholder would pay on Fund distributions or the redemption of Fund shares.
| 8 | www.redmontfunds.com |
Table of Contents
Redmont Funds | Disclosure of Fund Expenses | |
| October 31, 2012 (Unaudited) |
As a shareholder of the Funds, you incur two types of costs: (1) transaction costs, including applicable sales charges (loads), redemption fees, wire fees and low balance fees; and (2) ongoing costs, including management fees, distribution and service (12b-1) fees, shareholder services fees and other Fund expenses. This example is intended to help you understand your indirect costs, also referred to as “ongoing costs” (in dollars), of investing in the Fund and to compare these costs with the ongoing costs of investing in other mutual funds.
This example is based on an investment of $1,000 invested at the beginning of the period and held for the six-month period of May 31, 2012 through October 31, 2012.
Actual Expenses The first line of the table below provides information about actual account values and actual expenses. You may use the information in this line, together with the amount you invested at the beginning of the period, to estimate the expenses that you paid over the period. Simply divide your account value by $1,000 (for example, an $8,600 account value divided by $1,000 = 8.6), then multiply the result by the number in the first line under the heading “Expenses Paid During Period” to estimate the expenses you paid on your account during this period.
Hypothetical Example for Comparison Purposes The second line of the table provides information about hypothetical account values and hypothetical expenses based on the Fund’s actual expense ratio and an assumed rate of return of 5% per year before expenses, which is not the Fund’s actual return. The hypothetical account values and expenses may not be used to estimate the actual ending account balance or expenses you paid for the period. You may use this information to compare ongoing costs of investing in the Fund and other funds. To do so, compare this 5% hypothetical example with the 5% hypothetical examples that appear in the shareholder reports of other funds.
Please note that the expenses shown in the table are meant to highlight your ongoing costs only and do not reflect any transactional costs, such as applicable sales charges (loads), redemption fees, wire fees and low balance fees. Therefore, the second line of the table is useful in comparing ongoing costs only and will not help you determine the relative total costs of owning different funds. In addition, if these transaction costs were included, your costs would be higher.
BEGINNING ACCOUNT VALUE 05/01/12 | ENDING ACCOUNT VALUE 10/31/12 | EXPENSE RATIO(a) | EXPENSES PAID DURING PERIOD 05/01/12-10/31/12(b) | |||||||||||||||||||||||||||||||||||
Redmont Resolute Fund I | ||||||||||||||||||||||||||||||||||||||
Class A | ||||||||||||||||||||||||||||||||||||||
Actual | $ | 1,000.00 | $ | 987.20 | 2.30 | % | $ | 11.52 | ||||||||||||||||||||||||||||||
Hypothetical (5% return before expenses) | $ | 1,000.00 | $ | 1,013.61 | 2.30 | % | $ | 11.67 | ||||||||||||||||||||||||||||||
| ||||||||||||||||||||||||||||||||||||||
Class I | ||||||||||||||||||||||||||||||||||||||
Actual | $ | 1,000.00 | $ | 989.20 | 1.90 | % | $ | 9.53 | ||||||||||||||||||||||||||||||
Hypothetical (5% return before expenses) | $ | 1,000.00 | $ | 1,015.63 | 1.90 | % | $ | 9.65 | ||||||||||||||||||||||||||||||
Redmont Resolute Fund II | ||||||||||||||||||||||||||||||||||||||
Class I | ||||||||||||||||||||||||||||||||||||||
Actual | $ | 1,000.00 | $ | 1,001.00 | 0.31 | % | $ | 1.56 | ||||||||||||||||||||||||||||||
Hypothetical (5% return before expenses) | $ | 1,000.00 | $ | 1,023.64 | 0.31 | % | $ | 1.58 | ||||||||||||||||||||||||||||||
| (a) | Annualized, based on the Fund’s most recent fiscal half year expenses. |
| (b) | Expenses are equal to the Fund’s annualized expense ratio multiplied by the number of days in the most recent fiscal half year (184), then divided by 365. |
| Semi-Annual Report | October 31, 2012 | 9 |
Table of Contents
| Schedule of Investments | ||
| October 31, 2012 (Unaudited) |
| Description | Shares | Value (Note 2) | ||||||
OPEN-END MUTUAL FUNDS (98.75%) | ||||||||
AQR Multi Strategy Alternative Fund, Class I | 20,044 | $ | 196,430 | |||||
AQR Risk Parity Fund, Class I | 16,554 | 194,841 | ||||||
ASG Diversifying Strategies Fund, Class A | 8,703 | 77,804 | ||||||
ASG Managed Futures Strategy Fund, Class A | 8,563 | 78,091 | ||||||
BlackRock Global Allocation Fund, Inc., Class I | 7,144 | 139,524 | ||||||
Diamond Hill Long-Short Fund, Class Y(a) | 7,412 | 135,187 | ||||||
FPA Crescent Fund | 4,908 | 139,773 | ||||||
MainStay Marketfield Fund, Class I(a) | 8,788 | 136,483 | ||||||
PIMCO Global Multi-Asset Fund, Institutional Class | 16,258 | 186,152 | ||||||
Robeco Boston Partners Long/Short Research Fund, Institutional Class | 11,224 | 136,485 | ||||||
Turner Spectrum Fund, Institutional Class | 12,592 | 137,381 | ||||||
|
| |||||||
| 1,558,151 | ||||||||
|
| |||||||
TOTAL OPEN-END MUTUAL FUNDS (Cost $1,534,222) | 1,558,151 | |||||||
| 7-Day Yield | Shares | Value (Note 2) | ||||||||
SHORT TERM INVESTMENTS (0.35%) | ||||||||||
Dreyfus Treasury Cash Management Fund, Institutional Class | 0.007% | 5,527 | 5,527 | |||||||
|
| |||||||||
TOTAL SHORT TERM INVESTMENTS (Cost $5,527) | 5,527 | |||||||||
TOTAL INVESTMENTS (99.10%) (Cost $1,539,749) | $ | 1,563,678 | ||||||||
Other Assets In Excess Of Liabilities (0.90%) | 14,229 | |||||||||
NET ASSETS (100.00%) | $ | 1,577,907 | ||||||||
| (a) | Non-income producing security. |
Common Abbreviations:
AQR - AQR Capital Management LLC.
ASG - AlphaSimplex Group LLC.
FPA - First Pacific Advisors LLC.
PIMCO - Pacific Investment Management Company.
See Notes to Financial Statements.
| 10 | www.redmontfunds.com |
Table of Contents
| Schedule of Investments | ||
| October 31, 2012 (Unaudited) |
| Description | Shares | Value (Note 2) | ||||||
OPEN-END MUTUAL FUNDS (99.73%) | ||||||||
AQR Multi Strategy Alternative Fund, Class I | 2,195,887 | $ | 21,519,694 | |||||
AQR Risk Parity Fund, Class I | 1,983,406 | 23,344,687 | ||||||
ASG Diversifying Strategies Fund, Class Y | 839,376 | 7,537,599 | ||||||
ASG Managed Futures Strategy Fund, Class Y | 2,435,538 | 22,236,459 | ||||||
BlackRock Global Allocation Fund, Inc., Class I | 1,687,852 | 32,963,750 | ||||||
Diamond Hill Long-Short Fund, Class Y(a) | 2,527,592 | 46,103,280 | ||||||
FPA Crescent Fund | 1,150,987 | 32,780,113 | ||||||
MainStay Marketfield Fund, Class I | 3,361,740 | 52,207,815 | ||||||
PIMCO Global Multi-Asset Fund, Institutional Class | 3,818,550 | 43,722,394 | ||||||
Robeco Boston Partners Long/Short Research Fund, Institutional Class | 574,891 | 6,990,669 | ||||||
Turner Spectrum Fund, Institutional Class | 1,846,329 | 20,143,451 | ||||||
|
| |||||||
| 309,549,911 | ||||||||
|
| |||||||
TOTAL OPEN-END MUTUAL FUNDS (Cost $308,263,576) | 309,549,911 | |||||||
| 7-Day Yield | Shares | Value (Note 2) | ||||||||
SHORT TERM INVESTMENTS (0.28%) | ||||||||||
Dreyfus Treasury Cash Management Fund, Institutional Class | 0.007% | 869,948 | 869,948 | |||||||
|
| |||||||||
TOTAL SHORT TERM INVESTMENTS (Cost $869,948) | 869,948 | |||||||||
TOTAL INVESTMENTS (100.01%) (Cost $309,133,524) | $ | 310,419,859 | ||||||||
Liabilities in Excess of Other Assets (-0.01%) | (15,653) | |||||||||
NET ASSETS (100.00%) | $ | 310,404,206 | ||||||||
| (a) | Non-income producing security. |
Common Abbreviations:
AQR - AQR Capital Management LLC.
ASG - AlphaSimplex Group LLC.
FPA - First Pacific Advisors LLC.
PIMCO - Pacific Investment Management Company.
See Notes to Financial Statements.
| Semi-Annual Report | October 31, 2012 | 11 |
Table of Contents
Redmont Funds | Statements of Assets and Liabilities | |
| October 31, 2012 (Unaudited) |
| REDMONT RESOLUTE FUND I | REDMONT RESOLUTE FUND II | |||||||
ASSETS | ||||||||
Investments, at value | $ | 1,563,678 | $ | 310,419,859 | ||||
Receivable for shares sold | 18,900 | 0 | ||||||
Receivable due from advisor | 5,738 | – | ||||||
Receivable for dividends | 0 | 12 | ||||||
Prepaid offering costs | 627 | 21,297 | ||||||
Other assets | 7,945 | 6,458 | ||||||
Total Assets | 1,596,888 | 310,447,626 | ||||||
LIABILITIES | ||||||||
Distributions and service fees payable | 54 | N/A | ||||||
Trustees' fees and expenses payable | 26 | 1,190 | ||||||
Chief compliance officer fee payable | 143 | 3,790 | ||||||
Principal financial officer fees payable | 31 | 842 | ||||||
Administration fees payable | 90 | 16,915 | ||||||
Transfer agent fees payable | 3,859 | 1,900 | ||||||
Audit fees payable | 13,922 | 14,426 | ||||||
Custody fees payable | 834 | 2,224 | ||||||
Accrued expenses and other liabilities | 22 | 2,133 | ||||||
Total Liabilities | 18,981 | 43,420 | ||||||
NET ASSETS | $ | 1,577,907 | $ | 310,404,206 | ||||
NET ASSETS CONSIST OF | ||||||||
Paid-in capital | $ | 1,575,865 | $ | 310,449,379 | ||||
Accumulated net investment loss | (12,181) | (109,090) | ||||||
Accumulated net realized loss on investments | (9,706) | (1,222,418) | ||||||
Net unrealized appreciation on investments | 23,929 | 1,286,335 | ||||||
NET ASSETS | $ | 1,577,907 | $ | 310,404,206 | ||||
INVESTMENTS, AT COST | $ | 1,539,749 | $ | 309,133,524 | ||||
PRICING OF SHARES | ||||||||
Class A: | ||||||||
Net Asset Value, offering and redemption price per share(a) | $ | 10.04 | N/A | |||||
Net Assets | $ | 101,410 | N/A | |||||
Shares of beneficial interest outstanding (unlimited number of shares, no par value common stock authorized) | 10,100 | N/A | ||||||
Maximum offering price per share ((NAV/0.9450), based on maximum sales charge of 5.50% of the offering price) | $ | 10.62 | N/A | |||||
Class I: | ||||||||
Net Asset Value, offering and redemption price per share | $ | 10.07 | $ | 10.35 | ||||
Net Assets | $ | 1,476,497 | $ | 310,404,206 | ||||
Shares of beneficial interest outstanding (unlimited number of shares, no par value common stock authorized) | 146,657 | 29,994,157 | ||||||
| (a) | Redemption price per share may be reduced for any applicable contingent deferred sales charge. For a description of a possible sales charge, please see the Fund’s Prospectus. |
See Notes to Financial Statements.
| 12 | www.redmontfunds.com |
Table of Contents
Redmont Funds | Statements of Operations | |
| For the Six Months Ended October 31, 2012 (Unaudited) |
REDMONT RESOLUTE FUND I | REDMONT RESOLUTE FUND II | |||||||
INVESTMENT INCOME | ||||||||
Dividends | $ | 2,029 | $ | 236,861 | ||||
Total Investment Income | 2,029 | 236,861 | ||||||
EXPENSES | ||||||||
Investment advisory fees | 2,940 | 392,677 | ||||||
Administration fees | 1,382 | 100,338 | ||||||
Transfer agency fees | 19,459 | 16,507 | ||||||
Distribution and service fees | ||||||||
Class A | 99 | N/A | ||||||
Legal fees | 111 | 6,307 | ||||||
Audit fees | 9,087 | 9,591 | ||||||
Custody fees | 2,527 | 6,568 | ||||||
Reports to shareholders and printing fees | 25 | 2,650 | ||||||
Trustees’ fees and expenses | 52 | 4,536 | ||||||
Registration/filing fees | 4,206 | 3,556 | ||||||
Chief compliance officer fees | 297 | 22,385 | ||||||
Principal financial officer fees | 66 | 4,974 | ||||||
Offering costs | 1,191 | 61,495 | ||||||
Other | 1,427 | 3,602 | ||||||
Total expenses before waivers | 42,869 | 635,186 | ||||||
Less fees waived/reimbursed by investment advisor | ||||||||
Class A | (1,259) | N/A | ||||||
Class I | (30,339) | (392,677) | ||||||
Total Net Expenses | 11,271 | 242,509 | ||||||
NET INVESTMENT LOSS | (9,242) | (5,648) | ||||||
Net realized loss on investments | (9,224) | (1,079,619) | ||||||
Net change in unrealized appreciation/(depreciation) on investments | 12,690 | (293,120) | ||||||
NET REALIZED AND UNREALIZED GAIN/(LOSS) ON INVESTMENTS | 3,466 | (1,372,739) | ||||||
NET DECREASE IN NET ASSETS RESULTING FROM OPERATIONS | $ | (5,776) | $ | (1,378,387) | ||||
See Notes to Financial Statements.
| Semi-Annual Report | October 31, 2012 | 13 |
Table of Contents
Redmont Funds | Statements of Changes in Net Assets | |
| REDMONT RESOLUTE FUND I | ||||||||
Six Months Ended October 31, 2012 (Unaudited) | For the Period Ended April 30, 2012 (a) | |||||||
OPERATIONS | ||||||||
Net investment loss | $ | (9,242) | $ | (3,080) | ||||
Net realized loss on investments | (9,224) | (482) | ||||||
Net change in unrealized appreciation on investments | 12,6900 | 11,239 | ||||||
Net increase/(decrease) in net assets resulting from operations | (5,776) | 7,677 | ||||||
BENEFICIAL INTEREST TRANSACTIONS (NOTE 5) | ||||||||
Shares sold | ||||||||
Class A | 120,000 | 1,051 | ||||||
Class I | 670,038 | 943,710 | ||||||
Shares redeemed | ||||||||
Class A | (19,945) | (44) | ||||||
Class I | (138,765) | (39) | ||||||
Net increase in Net Assets Derived from Beneficial Interest Transactions | 631,328 | 944,678 | ||||||
Net increase in Net Assets | 625,552 | 952,355 | ||||||
NET ASSETS: | ||||||||
Beginning of period | 952,355 | 0 | ||||||
End of period* | $ | 1,577,907 | $ | 952,355 | ||||
* Includes accumulated net investment loss of: | $ | (12,181) | $ | (2,939) | ||||
| REDMONT RESOLUTE FUND II | ||||||||
Six Months Ended October 31, 2012 (Unaudited) | For the Period Ended April 30, 2012 (a) | |||||||
OPERATIONS | ||||||||
Net investment loss | $ | (5,648) | $ | (140,063) | ||||
Net realized loss on investments | (1,079,619) | (142,799) | ||||||
Net change in unrealized appreciation/(depreciation) on investments | (293,120) | 1,579,455 | ||||||
Net increase/(decrease) in net assets resulting from operations | (1,378,387) | 1,296,593 | ||||||
BENEFICIAL INTEREST TRANSACTIONS (NOTE 5) | ||||||||
Shares sold | ||||||||
Class I | 233,285,000 | 77,201,010 | ||||||
Shares redeemed | ||||||||
Class I | – | (10) | ||||||
Net increase in Net Assets Derived from Beneficial Interest Transactions | 233,285,000 | 77,201,000 | ||||||
Net increase in Net Assets | 231,906,613 | 78,497,593 | ||||||
NET ASSETS: | ||||||||
Beginning of period | 78,497,593 | 0 | ||||||
End of period* | $ | 310,404,206 | $ | 78,497,593 | ||||
* Includes accumulated net investment loss of: | $ | (109,090) | $ | (103,442) | ||||
| (a) | The Fund's inception was December 30, 2011. |
See Notes to Financial Statements.
| 14 | www.redmontfunds.com |
Table of Contents
| Financial Highlights | ||
| For a share outstanding throughout the periods presented | ||
| CLASS A | ||||||||
For the Six Months Ended (Unaudited) | For the Period Ended April 30, 2012 (a) | |||||||
NET ASSET VALUE, BEGINNING OF PERIOD | $ | 10.17 | $ | 10.00 | ||||
INCOME/(LOSS) FROM OPERATIONS | ||||||||
Net investment loss(b) | (0.11) | (0.07) | ||||||
Net realized and unrealized gain/(loss) on investments | (0.02) | 0.24 | ||||||
|
|
|
| |||||
Total from Investment Operations | (0.13) | 0.17 | ||||||
|
|
|
| |||||
NET INCREASE/(DECREASE) IN NET ASSET VALUE | (0.13) | 0.17 | ||||||
|
|
|
| |||||
NET ASSET VALUE, END OF PERIOD | $ | 10 .04 | $ | 10 .17 | ||||
|
|
|
| |||||
TOTAL RETURN(c) | (1.28) | % | 1.70 | % | ||||
RATIOS/SUPPLEMENTAL DATA | ||||||||
Net assets, End of Period (000s) | $ | 101 | $ | 1 | ||||
RATIOS TO AVERAGE NET ASSETS: | ||||||||
Operating expenses excluding reimbursement/waiver(d) | 7.36 | %(e) | 689.76 | %(e) | ||||
Operating expenses including reimbursement/waiver(d) | 2.30 | %(e) | 2.30 | %(e) | ||||
Net investment loss including reimbursement/waiver(d) | (2.15) | %(e) | (2.21) | %(e) | ||||
PORTFOLIO TURNOVER RATE | 25 | %(f) | 13 | %(f) | ||||
| (a) | The Fund’s inception was December 30, 2011. |
| (b) | Calculated using the average shares method. |
| (c) | Total investment return is calculated assuming a purchase of a common share at the opening of the first day and a sale at closing on the last day of each period reported. Dividends and distributions, if any, are assumed for purposes of this calculation to be reinvested at prices obtained under the Fund's dividend reinvestment plan. Total returns would have been lower had certain expenses not been waived during the period. Total investment returns do not reflect brokerage commissions, if any, and are not annualized. |
| (d) | The ratios exclude the impact of expenses of the underlying funds in which the Fund invests as represented in the Schedule of Investments. |
| (e) | Annualized. |
| (f) | Not Annualized. |
See Notes to Financial Statements.
| Semi-Annual Report | October 31, 2012 | 15 |
Table of Contents
| Redmont Resolute Fund I | Financial Highlights | |
| For a share outstanding throughout the periods presented | ||
| CLASS I | ||||||||
For the Six Months Ended (Unaudited) | For the Period Ended April 30, 2012 (a) | |||||||
NET ASSET VALUE, BEGINNING OF PERIOD | $ | 10.18 | $ | 10.00 | ||||
INCOME/(LOSS) FROM OPERATIONS | ||||||||
Net investment loss(b) | (0.08) | (0.06) | ||||||
Net realized and unrealized gain/(loss) on investments | (0.03) | 0.24 | ||||||
|
|
|
| |||||
Total from Investment Operations | (0.11) | 0.18 | ||||||
|
|
|
| |||||
NET INCREASE/(DECREASE) IN NET ASSET VALUE | (0.11) | 0.18 | ||||||
|
|
|
| |||||
NET ASSET VALUE, END OF PERIOD | $ | 10 .07 | $ | 10.18 | ||||
|
|
|
| |||||
TOTAL RETURN(c) | (1.08) | % | 1.80 | % | ||||
RATIOS/SUPPLEMENTAL DATA | ||||||||
Net assets, End of Period (000s) | $ | 1,476 | $ | 951 | ||||
RATIOS TO AVERAGE NET ASSETS: | ||||||||
Operating expenses excluding reimbursement/waiver(d) | 7.29 | %(e) | 19.86 | %(e) | ||||
Operating expenses including reimbursement/waiver(d) | 1.90 | %(e) | 1.90 | %(e) | ||||
Net investment loss including reimbursement/waiver(d) | (1.55) | %(e) | (1.78) | %(e) | ||||
PORTFOLIO TURNOVER RATE | 25 | %(f) | 13 | %(f) | ||||
| (a) | The Fund’s inception was December 30, 2011. |
| (b) | Calculated using the average shares method. |
| (c) | Total investment return is calculated assuming a purchase of a common share at the opening of the first day and a sale at closing on the last day of each period reported. Dividends and distributions, if any, are assumed for purposes of this calculation to be reinvested at prices obtained under the Fund’s dividend reinvestment plan. Total returns would have been lower had certain expenses not been waived during the period. Total investment returns do not reflect brokerage commissions, if any, and are not annualized. |
| (d) | The ratios exclude the impact of expenses of the underlying funds in which the Fund invests as represented in the Schedule of Investments. |
| (e) | Annualized. |
| (f) | Not Annualized. |
See Notes to Financial Statements.
| 16 | www.redmontfunds.com |
Table of Contents
| Financial Highlights | ||
| For a share outstanding throughout the periods presented | ||
CLASS I | ||||||||
For the (Unaudited) | For the April 30, 2012 (a) | |||||||
NET ASSET VALUE, BEGINNING OF PERIOD | $ | 10.34 | $ | 10.00 | ||||
INCOME/(LOSS) FROM OPERATIONS | ||||||||
Net investment loss(b) | (0.00) | (c) | (0.03) | |||||
Net realized and unrealized gain on investments | 0.01 | 0.37 | ||||||
|
|
|
| |||||
Total from Investment Operations | 0.01 | 0.34 | ||||||
|
|
|
| |||||
NET INCREASE IN NET ASSET VALUE | 0.01 | 0.34 | ||||||
|
|
|
| |||||
NET ASSET VALUE, END OF PERIOD | $ | 10.35 | $ | 10.34 | ||||
|
|
|
| |||||
TOTAL RETURN(d) | 0.10 | % | 3.40 | % | ||||
RATIOS/SUPPLEMENTAL DATA | ||||||||
Net assets, End of Period (000s) | $ | 310,404 | $ | 78,498 | ||||
RATIOS TO AVERAGE NET ASSETS: | ||||||||
Operating expenses excluding reimbursement/waiver(e) | 0.81 | %(f) | 1.63 | %(f) | ||||
Operating expenses including reimbursement/waiver(e) | 0.31 | %(f) | 1.13 | %(f) | ||||
Net investment loss including reimbursement/waiver(e) | (0.01) | %(f) | (0.97) | %(f) | ||||
PORTFOLIO TURNOVER RATE | 40 | %(g) | 18 | %(g) | ||||
| (a) | The Fund’s inception was December 30, 2011. |
| (b) | Calculated using the average shares method. |
| (c) | Less than $0.005 per share. |
| (d) | Total investment return is calculated assuming a purchase of a common share at the opening of the first day and a sale at closing on the last day of each period reported. Dividends and distributions, if any, are assumed for purposes of this calculation to be reinvested at prices obtained under the Fund’s dividend reinvestment plan. Total returns would have been lower had certain expenses not been waived during the period. Total investment returns do not reflect brokerage commissions, if any, and are not annualized. |
| (e) | The ratios exclude the impact of expenses of the underlying funds in which the Fund invests as represented in the Schedule of Investments. |
| (f) | Annualized. |
| (g) | Not Annualized. |
See Notes to Financial Statements.
| Semi-Annual Report | October 31, 2012 | 17 |
Table of Contents
Redmont Funds | Notes to Financial Statements | |
| October 31, 2012 (Unaudited) |
1. ORGANIZATION
Financial Investors Trust (the “Trust”), a Delaware statutory trust, is an open-end management investment company registered under the Investment Company Act of 1940, as amended (“1940 Act”). As of October 31, 2012, the Trust has 24 registered funds. This semi-annual report describes the Redmont Resolute Fund I and Redmont Resolute Fund II (each a “Fund” and collectively, the “Funds”). The Funds seek to provide long-term total return with reduced volatility and reduced correlation to the conventional stock and bond markets. The Funds are structured as fund-of-funds and under normal circumstances, the Funds pursue their objectives by investing primarily in managed portfolios of other open-end investment companies registered under the Investment Company of 1940, as amended (the “1940 Act”), that use alternative or hedging strategies. The Redmont Resolute Fund I offers Class A and Class I shares and the Redmont Resolute Fund II offers Class I shares. All classes of shares of a particular Fund have identical rights to earnings, assets and voting privileges, except for class specific expenses and exclusive rights to vote on matters affecting only individual classes.
2. SIGNIFICANT ACCOUNTING POLICIES
The following is a summary of significant accounting policies consistently followed by the Fund and Subsidiary. These policies are in conformity with U.S. generally accepted accounting principles (“GAAP”).
The preparation of financial statements in accordance with GAAP requires management to make certain estimates and assumptions that affect the reported amounts and disclosures in the financial statements during the reporting period. Management believes the estimates and security valuations are appropriate; however, actual results may differ from those estimates, and the security valuations reflected in the financial statements may differ from the value the Fund ultimately realizes upon sale of the securities.
Investment Valuation: The Funds generally value their securities based on market prices determined at the close of regular trading on the New York Stock Exchange (“NYSE”), normally 4:00 p.m. Eastern Time, on each day the NYSE is open for trading.
For equity securities and mutual funds that are traded on an exchange, the market price is usually the closing sale or official closing price on that exchange. In the case of equity securities not traded on an exchange, or if such closing prices are not otherwise available, the securities are valued at the mean of the most recent bid and ask prices on such day.
The market price for debt obligations is generally the price supplied by an independent third-party pricing service approved by the Board of Trustees (the “Board”), which may use a matrix, formula or other objective method that takes into consideration quotations from dealers, market transactions in comparable investments, market indices and yield curves. If vendors are unable to supply a price, or if the price supplied is deemed to be unreliable, the market price may be determined using quotations received from one or more brokers–dealers that make a market in the security. Short–term debt obligations that will mature in 60 days or less are valued at amortized cost, unless it is determined that using this method would not reflect an investment’s fair value. Investments in non-exchange traded funds are fair valued at their respective net asset values.
Redeemable securities issued by open-end registered investment companies are valued at the investment company’s applicable net asset value.
When such prices or quotations are not available, or when the Fair Value Committee appointed by the Board believes that they are unreliable, securities may be priced using fair value procedures approved by the Board.
Fair Value Measurements: The Funds disclose the classification of their fair value measurements following a three-tier hierarchy based on the inputs used to measure fair value. Inputs refer broadly to the assumptions that market participants would use in pricing the asset or liability, including assumptions about risk. Inputs may be observable or unobservable. Observable inputs reflect the assumptions market participants would use in pricing the asset or liability that are developed based on market data obtained from sources independent of the reporting entity. Unobservable inputs reflect the reporting entity’s own assumptions about the assumptions market participants would use in pricing the asset or liability that are developed based on the best information available.
Various inputs are used in determining the value of the Funds’ investments as of the end of the reporting period. When inputs used fall into different levels of the fair value hierarchy, the level in the hierarchy within which the fair value measurement falls is determined based on the lowest level input that is significant to the fair value measurement in its entirety. The designated input levels are not necessarily an indication of the risk or liquidity associated with these investments. These inputs are categorized in the following hierarchy under applicable financial accounting standards:
| Level 1 – | Unadjusted quoted prices in active markets for identical investments, unrestricted assets or liabilities that the Funds have the ability to access at the measurement date |
| 18 | www.redmontfunds.com |
Table of Contents
Redmont Funds | Notes to Financial Statements | |
| October 31, 2012 (Unaudited) |
| Level 2 – | Quoted prices which are not active, quoted prices for similar assets or liabilities in active markets or inputs other than quoted prices that are observable (either directly or indirectly) for substantially the full term of the asset or liability; and |
| Level 3 – | Significant unobservable prices or inputs (including the Funds’ own assumptions in determining the fair value of investments) where there is little or no market activity for the asset or liability at the measurement date. |
The following is a summary of the inputs used to value the Funds’ investments as of October 31, 2012:
Redmont Resolute Fund I
| Investments in Securities at Value | Level 1 - Quoted Prices | Level 2 - Other Significant Observable Inputs | Level 3 - Significant | Total | ||||||||||||
Open-End Mutual Funds | $ | 1,558,151 | $ | – | $ | – | $ | 1,558,151 | ||||||||
Short Term Investments | 5,527 | – | – | 5,527 | ||||||||||||
Total | $ | 1,563,678 | $ | – | $ | – | $ | 1,563,678 | ||||||||
Redmont Resolute Fund II
| Investments in Securities at Value | Level 1 - Quoted Prices | Level 2 - Other Significant Observable Inputs | Level 3 - Significant | Total | ||||||||||||
Open-End Mutual Funds | $ | 309,549,911 | $ | – | $ | – | $ | 309,549,911 | ||||||||
Short Term Investments | 869,948 | – | – | 869,948 | ||||||||||||
Total | $ | 310,419,859 | $ | – | $ | – | $ | 310,419,859 | ||||||||
The Funds recognize transfers between levels as of the end of the fiscal year. For the six months ended October 31, 2012, the Funds did not have any transfers between Level 1 and Level 2 securities. There were no level 3 securities held during the period.
Trust Expenses: Some expenses of the Trust can be directly attributed to the Fund. Expenses which cannot be directly attributed to the Fund are apportioned among all funds in the Trust based on average net assets of each fund.
Fund and Class Expenses: Expenses that are specific to a Fund or class of shares of a Fund are charged directly to that Fund or share class. Expenses that are common to all Funds generally are allocated among the Funds in proportion to their average daily net assets. Fees provided under the distribution (Rule 12b-1) and/or shareholder service plans for a particular class of the Fund are charged to the operations of such class.
Offering Costs: Offering costs, including costs of printing initial prospectuses, legal and registration fees, are being amortized over twelve months from the inception date of the Funds. As of October 31, 2012, $627 and $21,297 of offering costs remain to be amortized for the Redmont Resolute Fund I and Redmont Resolute Fund II, respectively.
Federal Income Taxes: The Funds comply with the requirements under Subchapter M of the Internal Revenue Code of 1986, as amended, applicable to regulated investment companies and intend to distribute substantially all of their net taxable income and net capital gains, if any, each year. The Funds are not subject to income taxes to the extent such distributions are made.
As of and during the six months ended October 31, 2012, the Funds did not have a liability for any unrecognized tax benefits in the accompanying financial statements. The Funds file income tax returns in the U.S. federal jurisdiction and Colorado.
Investment Transactions and Investment Income: Investment and shareholder transactions are accounted for on the date the investments are purchased or sold (trade date basis). Net realized gains and losses from investment transactions are reported on an identified cost basis. Interest income, which includes accretion of discounts and amortization of premiums, is accrued and recorded as earned. Dividend income is recognized on the ex-dividend date or for certain foreign securities, as soon as information is available to the Funds.
Principal Investment Strategies of each Fund: Each Fund is structured as a fund-of-funds. Under normal circumstances the Fund pursues its objective by investing primarily in a managed portfolio of other open-end investment companies registered under the 1940 Act, that use alternative or hedging strategies. Each Fund may also invest in closed-end funds, exchange-traded funds and exchange-traded notes, which provide exposure to hedging or alternative strategies. Collectively, the investment companies in which the Funds may invest are referred to as “underlying funds.”
| Semi-Annual Report | October 31, 2012 | 19 |
Table of Contents
Redmont Funds | Notes to Financial Statements | |
| October 31, 2012 (Unaudited) |
Hedging strategies used by underlying funds include the use of short selling, options, futures, derivatives or similar instruments. Alternative investment strategies include long/short, market neutral and arbitrage strategies; commodities or commodity-linked investments; leverage; derivatives; distressed securities; and other investment techniques that are expected to achieve the Funds’ investment objective.
Distributions to Shareholders: Each Fund normally pays dividends and distributes capital gains, if any, on an annual basis. Income dividend distributions are derived from interest and other income each Fund receives from their investments, including distributions of short term capital gains. Capital gain distributions are derived from gains realized when each Fund sells a security it has owned for more than a year. Each Fund may make additional distributions and dividends at other times if its portfolio manager or managers believe doing so may be necessary for each Fund to avoid or reduce taxes. Net investment income/(loss) and net realized gain/(loss) may differ for financial statement and tax purposes.
3. TAX BASIS INFORMATION
Tax Basis of Distributions to Shareholders: The character of distributions made during the year from net investment income or net realized gains may differ from its ultimate characterization for federal income tax purposes. Also, due to the timing of dividend distributions, the fiscal year in which amounts are distributed may differ from the fiscal year in which the income or realized gain were recorded by the Funds. There were no distributions paid by the Funds for the six months ended October 31, 2012.
Unrealized Appreciation and Depreciation on Investments: As of October 31, 2012, the costs of investments for federal income tax purposes and accumulated net unrealized appreciation/(depreciation) on investments were as follows:
| Fund | Gross Appreciation tax cost) | Gross Depreciation over value) | Net Unrealized Appreciation | Cost of Investments for Income Tax Purposes | ||||||||||||||||
Redmont Resolute Fund I | $ | 34,503 | $ | (13,035 | ) | $ | 21,468 | $ | 1,542,210 | |||||||||||
Redmont Resolute Fund II | 4,238,744 | (3,475,289 | ) | 763,455 | 309,656,404 | |||||||||||||||
4. SECURITIES TRANSACTIONS
Purchases and sales of securities, excluding short-term securities during the six months ended October 31, 2012 were as follows:
| Fund | Purchases of Securities | Proceeds From Sales of Securities | ||||||
Redmont Resolute Fund I | $ | 1,092,280 | $ | 286,500 | ||||
Redmont Resolute Fund II | 297,684,316 | 62,367,000 | ||||||
5. BENEFICIAL SHARE TRANSACTIONS
The beneficial ownership, either directly or indirectly, of more than 25% of the voting securities of any class of the Funds creates a presumption of control of the Funds under Section 2(a)(9) of the 1940 Act. As of October 31, 2012, the following entities owned beneficially 25% or greater of the Funds’ outstanding shares. The shares are held under omnibus accounts (whereby the transactions of two or more shareholders are combined and carried in the name of the originating broker rather than designated separately).
| Fund | Class | Name | Percentage | |||
Redmont Resolute Fund I | I | Charles Schwab & Co. | 99.01% | |||
Redmont Resolute Fund I | A | National Financial Services Corp. | 36.49% | |||
Redmont Resolute Fund II | I | Wells Fargo Bank | 81.03% |
| 20 | www.redmontfunds.com |
Table of Contents
Redmont Funds | Notes to Financial Statements | |
| October 31, 2012 (Unaudited) |
Transactions in common shares were as follows:
| Redmont Resolute Fund I | ||||||||
| Class A: | For the Six Months Ended October 31, 2012 | For the Period Ended April 30, 2012(a) | ||||||
Common Shares Outstanding - Beginning of Period | 101 | 0 | ||||||
Common Shares Sold | 11,988 | 105 | ||||||
Common Shares Redeemed | (1,989) | (4) | ||||||
Common Shares Outstanding - End of Period | 10,100 | 101 | ||||||
| Class I: | For the Six Months Ended | For the Period Ended April 30, 2012(a) | ||||||
Common Shares Outstanding - Beginning of Period | 93,449 | 0 | ||||||
Common Shares Sold | 66,872 | 93,453 | ||||||
Common Shares Redeemed | (13,664) | (4) | ||||||
Common Shares Outstanding - End of Period | 146,657 | 93,449 | ||||||
| Redmont Resolute Fund II | ||||||||
| Class I: | For the Six Months Ended | For the Period Ended April 30, 2012(a) | ||||||
Common Shares Outstanding - Beginning of Period | 7,591,661 | 0 | ||||||
Common Shares Sold | 22,402,496 | 7,591,662 | ||||||
Common Shares Redeemed | 0 | (1) | ||||||
Common Shares Outstanding - End of Period | 29,994,157 | 7,591,661 | ||||||
| (a) | The Fund’s inception was December 30, 2011. |
6. MANAGEMENT AND RELATED PARTY TRANSACTIONS
Investment Advisory
Highland Associates, Inc. (“Highland” or the “Adviser”), subject to the authority of the Board, is responsible for the overall management and administration of the Funds’ business affairs. The Adviser manages the investments of the Funds in accordance with the Funds’ investment objective, policies and limitations and investment guidelines established jointly by the Adviser and the Board.
Pursuant to the Investment Advisory Agreement (“Advisory Agreement”), the Adviser is entitled to an investment advisory fee, computed daily and payable monthly of 0.50% of the average daily net assets for each Fund.
The Adviser has contractually agreed to waive fees with respect to each class of the Redmont Resolute Fund I so that the Total Annual Operating Expenses (excluding interest, taxes, brokerage commissions, other expenditures that are capitalized in accordance with GAAP, other extraordinary expenses not incurred in the ordinary course of the Funds’ business, and amounts, if any, payable pursuant to a plan adopted in accordance with Rule 12b-1 under the 1940 Act) will not exceed 1.90% of average daily net assets. The Adviser has also agreed contractually to waive the total amount of Redmont Resolute Fund II’s 0.50% management fees, which is in effect through August 31, 2016.
Fund Accounting Fees and Expenses
ALPS Fund Services, Inc. (“ALPS” and the “Administrator”) (an affiliate of ALPS Distributors, Inc.) provides administrative, fund accounting and other services to the Funds under the Administration, Bookkeeping and Pricing Services Agreement with the Trust. Under the Agreement, ALPS is paid fees, accrued on a daily basis and paid on a monthly basis following the end of the month, based on the greater of (a) and annual total fee of $200,000 from the first to the last, or projected last, day of the then current year of service under the Agreement; or (b) following basis point fee schedule:
| Average Total Net Assets | Contractual Fee | |
Between $0-$500M | 0.05% | |
$500M-$1B | 0.03% | |
Above $1B | 0.02% |
| Semi-Annual Report | October 31, 2012 | 21 |
Table of Contents
Redmont Funds | Notes to Financial Statements | |
| October 31, 2012 (Unaudited) |
The Administrator is also reimbursed by the Funds for certain out of pocket expenses.
Transfer Agent
ALPS serves as transfer, dividend paying and shareholder servicing agent for the Funds under a Transfer Agency and Services Agreement with the Trust. Under this Agreement, ALPS is paid an annual base fee of $25,000 per Fund plus fees for open accounts and is reimbursed for certain out-of-pocket expenses.
Compliance Services
ALPS provides services that assist the Funds’ Chief Compliance Officer in monitoring and testing the policies and procedures of the Trust in conjunction with requirements under Rule 38a-1 under the 1940 Act under the Chief Compliance officer Services Agreement. Under this Agreement, ALPS is paid an annual base fee of $45,000 and is reimbursed for certain out-of-pocket expenses.
Principal Financial Officer
ALPS receives an annual fee of $10,000 for providing Principal Financial Officer (“PFO”) services to the Trust.
Distributor
ALPS Distributors, Inc. (“ADI” or the “Distributor”) (an affiliate of ALPS) acts as the distributor of the Funds’ shares pursuant to a Distribution Agreement with the Trust. Shares are sold on a continuous basis by ADI as agent for the Funds, and ADI has agreed to use its best efforts to solicit orders for the sale of Funds’ shares, although it is not obliged to sell any particular amount of shares. ADI is not entitled to any compensation for its services as Distributor. ADI is registered as a broker-dealer with the Securities and Exchange Commission.
The Redmont Resolute Fund I has adopted a Distribution and Services Plan (the “Plan”) pursuant to Rule 12b-1 of the 1940 Act for Class A shares. The Plan allows the Fund to use Class A assets to pay fees in connection with the distribution and marketing of Class A shares and/or the provision of shareholder services to Class A shareholders. The Plan permits payment for services in connection with the administration of plans or programs that use Class A shares of the Fund, if any, as their funding medium and for related expenses. The Plan permits the Fund to make total payments at an annual rate of up to 0.25% of a Fund’s average daily net assets attributable to its Class A shares. Because these fees are paid out of the Fund’s Class A assets, if any, on an ongoing basis, over time they will increase the cost of an investment in Class A shares, if any, and Plan fees may cost an investor more than other types of sales charges.
The Redmont Resolute Fund I has adopted a shareholder services plan (“Shareholder Services Plan”) for Class A shares. Under the Shareholder Services Plan the Fund is authorized to pay banks and their affiliates and other institutions, including broker-dealers and Fund affiliates (“Participating Organizations”), an aggregate fee in an amount not to exceed on an annual basis 0.15% for Class A shares of the average daily net asset value of the Class A shares, respectively, attributable to or held in the name of a Participating Organization for its clients as compensation for providing shareholder service activities, which do not include distribution services, pursuant to an agreement with a Participating Organization. Shareholder Services plan fees are included with distribution and service fees on the Statement of Operations.
7. INDEMNIFICATIONS
Under the Trust’s organizational documents, its officers and Trustees are indemnified against certain liability arising out of the performance of their duties to the Trust. Additionally, in the normal course of business, the Trust enters into contracts with service providers that may contain general indemnification clauses which may permit indemnification to the extent permissible under applicable law. The Trust’s maximum exposure under these arrangements is unknown, as this would involve future claims that may be made against the Trust that have not yet occurred.
| 22 | www.redmontfunds.com |
Table of Contents
Redmont Funds | Shareholder Meeting | |
| October 31, 2012 (Unaudited) |
A Special Meeting of Shareholders of the Redmont Resolute Fund I and Redmont Resolute Fund II (each, a “Fund” and together, the “Funds”) was held on November 2, 2012 (the “Meeting”). At the meeting, the following matter was voted on and approved by the Shareholders of each Fund. Each vote reported represents one dollar of net asset value held on the record date of the meeting. The results of the Special Meeting of Shareholders are noted below.
Proposal 1 - To approve an amendment to the Investment Advisory Agreement between the Trust, on behalf of the Funds, and Highland Associates, Inc., the Funds’ investment adviser, to increase the advisory fee rate paid to Highland Associates, Inc. by each of the Redmont Resolute Fund I and Redmont Resolute Fund II:
| Number of Votes | ||||||||||||||||||||
| Fund | Record Date Votes | Affirmative | Against | Abstain | Uninstructed | |||||||||||||||
Redmont Resolute Fund I | 72,297.084 | 72,297.084 | 0 | 0 | 0 | |||||||||||||||
Redmont Resolute Fund II | 10,534,241.578 | 10,534,241.578 | 0 | 0 | 0 | |||||||||||||||
| Percentage of Total Outstanding | ||||||||
| Fund | Affirmative | Against | Abstain | Uninstructed | ||||
Redmont Resolute Fund I | 52.213% | 0% | 0% | 0% | ||||
Redmont Resolute Fund II | 63.238% | 0% | 0% | 0% | ||||
| Percentage of Voted | ||||||||
| Fund | Affirmative | Against | Abstain | Uninstructed | ||||
Redmont Resolute Fund I | 100% | 0% | 0% | 0% | ||||
Redmont Resolute Fund II | 100% | 0% | 0% | 0% | ||||
| Semi-Annual Report | October 31, 2012 | 23 |
Table of Contents
Redmont Funds | Additional Information | |
| October 31, 2012 (Unaudited) |
1. FUND HOLDINGS
The Funds file their complete schedule of portfolio holdings with the Securities and Exchange Commission (the “SEC”) for the first and third quarters of each fiscal year on Form N-Q within 60 days after the end of the period. Copies of the Funds’ Form N-Q are available without charge on the SEC website at http:// www.sec.gov. You may also review and copy the Form N-Q at the SEC’s Public Reference Room in Washington, D.C. For more information about the operation of the Public Reference Room, please call the SEC at 1-800-SEC-0330.
2. FUND PROXY VOTING POLICIES, PROCEDURES AND SUMMARIES
Fund policies and procedures used in determining how to vote proxies and information regarding how each of the Funds voted proxies relating to portfolio securities during the most recent prior 12-month period ending June 30 are available without charge, (1) upon request, by calling (toll-free) (866) 759-5679 and (2) on the SEC’s website at http://www.sec.gov.
| 24 | www.redmontfunds.com |
Table of Contents
Redmont Funds | Notes | |
|
Table of Contents

Table of Contents
Table of Contents
| 1 | ||||
| 5 | ||||
| 14 | ||||
| 15 | ||||
| 20 | ||||
| 21 | ||||
| 22 | ||||
| 24 | ||||
| 26 | ||||
| 34 | ||||
Table of Contents
Seafarer Overseas Growth and Income Fund | Letter to Shareholders | |
October 31, 2012 (Unaudited) |
LETTER TO SHAREHOLDERS
Dear Fellow Shareholders,
I am pleased to address you again on behalf of the Seafarer Overseas Growth and Income Fund.
During the first six months of the Fund’s 2012-13 fiscal year (May 1 – October 31), the Investor and Institutional share classes of the Fund gained 7.13% and 7.16%, respectively. By comparison, the Fund’s benchmark, the MSCI Emerging Markets Total Return Index,1 declined -1.01%. The team at Seafarer is pleased with the Fund’s performance to date; however, we are cognizant the Fund is very new, and that our work has only just begun.
Valuations
A brief note on current market conditions: in the preceding letter to shareholders, I stated, “valuations on emerging equities are very appealing.” I draw your attention to that remark because conditions today are somewhat different. Valuations on many emerging market equities have risen, even if the index has not. In the meantime, the growth of profits, while still positive, has decelerated. In my own opinion, stock valuations are now broadly fair.
To be sure, valuations are not excessive when judged relative to history or the potential for future growth. Yet they are no longer especially attractive, in light of both well-known risks (e.g., slow growth in Europe and the possible dis-integration of the Euro; China’s slowing growth; and fiscal problems in the U.S.) and less-appreciated threats (e.g. the potential for conflict in Syria, Iran or the South China seas). More subtly, it is my opinion that the consensus forecast for profit growth in the emerging world has crept beyond reality. Disappointment will likely ensue, and if I am correct, stocks will gyrate. Investors who wish to safeguard a reasonable expectation of profits should be prepared to hold over a long horizon – at least three years – and through what may be considerable volatility.
China’s Future
In the preceding letter to shareholders, I discussed the changing nature of China’s economy. I made two points: first, the rate of growth in China is declining, and because the deceleration stems from structural causes (as opposed to cyclical ones), it will most likely be permanent. Second, the nature of China’s growth model is also changing, moving away from external and infrastructure sectors, and moving toward sectors that favor domestic demand, human capital, and especially services. I am going to revisit China’s evolution here, not only because it warrants your attention, but also because – to state the obvious! – it is highly complex, and challenging to navigate within the context of a long-term investment portfolio.
The pace of China’s growth is slowing amid transition, but its economy still has plenty of untapped capacity to grow, and perhaps in a more sustainable fashion. This latent potential is most visible in the country’s stunted and underdeveloped services sector, which in my view is leading the current transition. By “services,” I mean a broad spectrum of industries, comprising the consumer (e.g. health care, tourism and leisure); commercial (e.g. media, advertising, publishing, distribution, data processing, software and personnel management); and industrial (e.g. transport, logistics, pollution abatement, systems management).
Bright Prospects
China’s modern economy is decidedly pluralistic. However, over the past six decades, the country’s leadership has mostly favored a command-style system, and it has used its control over the economy to steer resources towards tangible, scalable manufacturing industries. The leadership’s intent was to induce growth and employment; yet it has resulted in an economic model that, in my view, is unbalanced, as it is overly reliant on exports, construction, and investments in physical infrastructure. By contrast, China’s leadership has mostly overlooked (and perhaps even fears) the small-scale, intangible, information-intensive industries that comprise the services sector.
| Semi-Annual Report | October 31, 2012 | 1 |
Table of Contents
Seafarer Overseas Growth and Income Fund | Letter to Shareholders | |
October 31, 2012 (Unaudited) |
The consequence of this is that China’s modern service sector is puny by any reasonable measure. I estimate the private service sector comprises roughly one third of total output, whereas the equivalent ratio is 68% in the U.S.2 The low proportion of services within the economy means that if China can encourage growth in the sector – or at least not hinder it – it has plenty of room to expand.
In this respect, I believe present-day China is possibly analogous to the U.S. in 1947. Sixty-five years ago, private sector services accounted for only 48% of U.S. GDP.3 For the next six and a half decades, the service sector led our country’s growth, such that it now accounts for over two-thirds of output.4 I believe China’s evolution will follow a similar path, and indeed the evidence already suggests as much: data from China’s National Bureau of Statistics indicates that China’s tertiary sector (comprised mainly of service industries) has recently outpaced the country’s vaunted industrial sector. Since at least 2003, the former expanded at a compounded rate of 15.5% (measured in nominal terms), whereas the latter grew at a 15.1% rate. Meanwhile, China’s leadership also seems to acknowledge that the services sector will make an important contribution to future growth. The Central Committee’s current five-year plan (2011- 2015) prescribes long-term targets whereby the services sector would account for 70% of the country’s output.5 In addition, the plan elevates seven key industries – three of which are service-based – and “nurtures” them until they become “pillars” of the economy.6
Dark Clouds
Clearly, I remain enthusiastic about China’s economic prospects, especially its service sector; I only wish investing in the country was so simple! Obviously it is not. China faces myriad challenges, encompassing social, political, economic and environmental ills. Most are well known. There are, however, two threats to China’s future that I believe receive insufficient attention: the growing potential for military conflict; and the weakening grasp of the ruling party.
First, regarding the potential for conflict: I think it is unlikely China will go to war; but I cannot dismiss the possibility altogether. If China does engage in a major conflict, clearly it will pose a grave threat to the country’s future (to say nothing of stock markets around the world).
A casual survey of Chinese history suggests that most analysts perceive China as a peaceful power, at least with respect to cross-border conflict. History bears this out: China has occasionally fought lesser wars with its neighbors, but most of its conflicts and intrigues have been confined to its interior. China has always perceived itself as Asia’s central power – it is known as the Middle Kingdom – and historically it has held sway over a network of neighboring states that paid tribute to the center.
Many analysts appear comfortable with the assumption that China will remain a peaceful power amid its rise. I am not so sure: I don’t think the country’s past necessarily prescribes its future. Admittedly, my experience in China is limited, and is that of an outsider. Yet I worry about many things: I worry that the country’s hunger for resources will drive it to become overly assertive; I worry that a substantial portion of the country’s newfound wealth has been channeled into military spending; I worry that claims to seas and lands around greater China have complex and disputed origins; I worry that a large populace within China is restless, frustrated by a deep socio-economic divide and cut off from their roots, courtesy of the Cultural Revolution. Most of all I worry that China’s civilian leadership is struggling to retain its mandate amid economic challenges and scandalous corruption. I am concerned that the leadership will find it convenient to deflect criticism by cultivating chauvinist and bellicose politics.
I do not know whether the Diaoyu Islands will become the flashpoint for conflict. However, events there and elsewhere reveal a new actor: a powerful, modern state eager to assert its interests. Consequently, I assess the probability of conflict there or elsewhere as low, but well above zero. What surprises me is the seemingly relaxed stance of the global investment community. When I began my investment career fourteen years ago, the leading question I received from investors – ahead of every economic and financial issue – was whether war would break out between Beijing and Taipei. I rarely hear concerns about conflict today. Back then, I responded confidently that China’s growth meant it had too much to lose. Perhaps my old argument still holds; but I worry that the balance of power has grown far more complex. I do not advise retreat from China’s markets, but I urge investors to observe events carefully, and to proceed with caution.
| 2 | (855) 732-9220 | seafarefunds.com | |||
Table of Contents
Seafarer Overseas Growth and Income Fund | Letter to Shareholders | |
October 31, 2012 (Unaudited) |
Another matter plagues China today, and constitutes a more present threat to the country’s stability: the slipping grasp of the country’s leadership. As of the date of this report, China had nearly completed its once-per-decade transition in government. It did so under an astonishing cloud of scandal and venality. In my view, the country needs to cut a clear path toward reform and a greater degree of openness. However, the Communist Party of China (CPC) appears to be “circling the wagons” to protect its interests. Certain CPC members appear to have been shielded from scrutiny via patronage; meanwhile, the state-backed segment of the economy has literally been given a bigger seat at the table, as more captains of state-owned companies were “elected” to the 205-member Central Committee than ever before.
I find this shift in China’s direction worrisome, and the country’s top leadership is seemingly concerned, too. In one of his outgoing speeches, President Hu Jintao warned that if the party did not address its deficiencies head on, it could instigate “the fall of the state and the party.”7 Hu then used his influence to have his personal doctrine of the “scientific concept of development” enshrined in his party’s constitution, in a bid to ensure his legacy. There is a certain irony in the notion of the term “scientific development.” By it, President Hu means to favor the adoption of pragmatic policies that are unburdened by ideology. This is laudable. Yet what China’s leadership needs, now more than ever, is a truly scientific disposition: an abiding sense of curiosity; an openness to experimentation; a commitment to transparency; and a constant ability to adjust to reality, as informed by evidence.
I am told that President Hu and the leadership mean quite the opposite. They equate “scientific” with “systematic,” and they intend to curtail experimentation, not promote it. Several analysts have commented that Hu’s speeches during the handover effectively put his successors in the equivalent of a political straightjacket.8 Hu prescribed narrow limits for acceptable reform; much was left off the table, including the state-backed economy, along with the CPC itself. Unfortunately, it appears the leadership now associates political experimentation with the rogue dealings and cowboy-like leadership of the now disgraced Bo Xilai. The consequence is that rather than embrace change, the party appears set to pursue a closed approach that bears little resemblance to “science.”
For all my concerns, though, there is ample room for hope. I remain impressed that reform-minded factions within China continue to quietly win small but cumulatively meaningful battles, freeing up markets and relaxing central control over the economy. On balance, I still see more promise than pitfall – but the path forward is narrowing, and the footing treacherous. Investors must watch carefully where the country steps next.
Seafarer’s Present
Leaving aside China’s complex future, and moving to Seafarer’s simple present: we are happy to have gotten our business off the ground, and to have achieved a measure of progress. In launching our firm, we harbored no illusions: we knew it would be a challenging, long-term endeavor. I can report that the firm’s growth has surpassed our expectation, and we are pleased to have many new shareholders subscribe to the Fund. We are enthusiastic for the future, and we are honored by the trust each shareholder has placed in us. We will work to earn that trust.
The notion of progress is central to our investment philosophy at Seafarer. We invest in the developing world because it is steeped in growth and change. Individuals and families are striving to improve the conditions of their lives. That act – striving to meaningfully better one’s circumstances, and one’s society – is what begets progress. Some portion of that progress spills over to corporate profits, and to the value of companies. This is ultimately what we attempt to capture in our portfolios: the value that arises from the progress and growth of the developing world.
Thank you for entrusting us with your capital. We are honored to act as your investment adviser.
Andrew Foster
Chief Investment Officer
Seafarer Capital Partners, LLC
November 12, 2012
See notes on following page.
| Semi-Annual Report | October 31, 2012 | 3 |
Table of Contents
Seafarer Overseas Growth and Income Fund | Letter to Shareholders | |
October 31, 2012 (Unaudited) |
The views and information discussed in this commentary are as of the date of publication, are subject to change, and may not reflect the writer’s current views. The views expressed represent an assessment of market conditions at a specific point in time, are opinions only and should not be relied upon as investment advice regarding a particular investment or markets in general. Such information does not constitute a recommendation to buy or sell specific securities or investment vehicles. It should not be assumed that any investment will be profitable or will equal the performance of the portfolios or any securities or any sectors mentioned herein. The subject matter contained herein has been derived from several sources believed to be reliable and accurate at the time of compilation. Seafarer does not accept any liability for losses either direct or consequential caused by the use of this information.
| 1 | The MSCI Emerging Markets Total Return Index, Standard (Large+Mid Cap) Core, Gross (dividends reinvested), USD is a free float-adjusted market capitalization index designed to measure equity market performance of emerging markets. The MSCI Emerging Markets Total Return Index consists of the following 21 emerging market country indices: Brazil, Chile, China, Colombia, Czech Republic, Egypt, Hungary, India, Indonesia, Korea, Malaysia, Mexico, Morocco, Peru, Philippines, Poland, Russia, South Africa, Taiwan, Thailand, and Turkey. Index code: GDUEEGF. It is not possible to invest directly in this or any index. |
| 2 | National Bureau of Statistics of China, U.S. Bureau of Economic Analysis (U.S. BEA) and Seafarer. Please note: statistics for both the U.S. and China intentionally exclude services provided by the government and / or the public sector. According to the U.S. BEA, U.S. total service sector activity comprises nearly 80% of U.S. GDP, about 13% of which is attributable to the public sector. China’s most accessible statistics on the tertiary sector do not distinguish between public and private sector services, but together they account for 43% of GDP. My intent here was to focus on private sector services only, and thus I have deducted an estimate for government-related services, which I believe comprise 12% to 13% of China’s GDP. Thus I estimate private sector services to constitute a bit less than one third of China’s output. |
| 3 | U.S. BEA, Seafarer. |
| 4 | U.S. BEA, Seafarer. |
| 5 | Dan Harris, “China’s 12th Five Year Plan: A Preliminary Look,” China Law Blog, 3 March 2011, http://www.chinalawblog.com/2011/03/chinas_12th_five_year_plan_a_preliminary_look.html. |
| 6 | Xinhua, “China to nurture 7 new strategic industries in 2011-15,” 27 October 2010, http://news.xinhuanet.com/english2010/china/2010-10/27/c_13578293.htm. |
| 7 | Zhuang Pinghui, South China Morning Post, 10 November 2012. |
| 8 | Verna Yu, South China Morning Post, 10 November 2012. |
| 4 | (855) 732-9220 | seafarerfunds.com |
Table of Contents
Seafarer Overseas Growth and Income Fund | Portfolio Review | |
October 31, 2012 (Unaudited) |
PORTFOLIO REVIEW
During the first six months of the Fund’s 2012-13 fiscal year (May 1 – October 31), the Seafarer Overseas Growth and Income Fund gained 7.13% and 7.16% for the Investor and Institutional classes, respectively. The Fund’s benchmark, the MSCI Emerging Markets Total Return Index, fell -1.01% during the same period. By way of broader comparison, the S&P 500 Index gained 2.16%.
The Fund’s policy for distributions, as stated in the Prospectus, is that it will normally pay dividends and net investment income, if any, on a semi-annual basis. The Adviser is pleased to report that the Fund paid its first semi-annual distribution to shareholders in June. The Fund distributed $0.04995 and $0.03484 per share for the Investor and Institutional classes, respectively.
Performance
During the past six months, stock markets in the developing world experienced substantial swings. They declined sharply between May and June, and then rose swiftly between July and September, before declining slightly once more in October. The net effect of all those gyrations is that markets finished the last six months just shy of where they began (as measured by the benchmark index).
A number of factors drove the volatility in emerging equities. Markets stumbled in May due to renewed concerns over Greece’s ability to remain a member of the Eurozone, fears over Spain’s solvency, and worries that China’s economic growth would falter. However, by July stocks began to march upwards again; in my view, these gains occurred primarily because of three interrelated events. First, markets recognized that, as grave as the situation in Western Europe was (and is), the substantial decline priced into stocks was overdone. Second, markets anticipated extended stimulus on the part of the world’s major central banks. Indeed, both the U.S. Federal Reserve and the European Central Bank maintained relaxed monetary policies through the summer. Third, equities gained because valuations were quite depressed in June, and yet second quarter corporate profits generally exceeded the (low) expectations of investors.
As markets fell through June, the Fund also declined, but less so than the benchmark index; and as markets recovered lost ground between July and October, the Fund managed to slightly outpace the benchmark. During the six month period, about two-thirds of the Fund’s positions contributed positively to the Fund’s performance. The Fund’s gains were relatively concentrated, though. The ten positions with the greatest contribution to performance were collectively responsible for over 80% of the Fund’s return.
The top contributor to the Fund over the past six months was its holding in a mid-capitalization company called Aselsan Elektronik. Aselsan is a Turkish firm that produces electronic systems and communication equipment for military and civilian markets. The company has existed for several decades, yet it has only recently undertaken efforts to operate on a truly commercial basis. In the past, the company operated essentially as a captive supplier to (and subsidiary of) the Turkish Army; consequently, Aselsan’s financial performance took a back seat. However, the company has recently begun to improve upon its commercial potential, expanding into new markets and accelerating its growth. Aselsan’s shares rose ostensibly in reflection of the company’s improved performance.
The Fund’s holdings in a small-capitalization company called Kingdee International also contributed to gains. Kingdee provides “enterprise management” software to small and mid-sized companies based in China. This software helps companies manage their accounts, track inventory and sales, and engage in online commerce. Kingdee has historically been a leader within its chosen niche. However, the company embarked upon an ill-fated expansion approximately two years ago, one which left the company’s finances stretched thin in light of slowing growth within the Chinese market. As a consequence, Kingdee’s shares dropped over four-fifths between their recent peak in April 2011 and their recent nadir in July 2012.1 Seafarer’s research confirmed that the company’s fundamental
| Semi-Annual Report | October 31, 2012 | 5 |
Table of Contents
Seafarer Overseas Growth and Income Fund | Portfolio Review | |
October 31, 2012 (Unaudited) |
position has deteriorated, and that its near-term profitability is materially compromised. However, Seafarer also judged the extent of the correction overdone, and as such, the Fund began to acquire shares in the company in June. The shares have since recovered a portion of their former value, to the Fund’s benefit.
Another notable positive contribution to the Fund came from its holding in Cerebos Pacific, a Singapore-based purveyor of food and beverage products across Southeast Asia and Australia. The company is a closely-held subsidiary of the Japanese beverage company Suntory. In August, Suntory announced its intent to purchase the roughly 15% of Cerebos that it did not already own; Suntory agreed to pay a premium price in order to take the company private, and the transaction is now on the cusp of consummation. We are pleased to report that this is already the second time a portfolio holding has received such an offer in the relatively short life of the Fund (the first being a Hong Kong company called SinoCom).
The Fund’s two holdings in Mexico, Grupo Herdez and Kimberly-Clark de Mexico, also made prominent contributions to the Fund’s semi-annual gains. Both stocks performed very well, presumably in recognition of their strong financial results. However, I believe their gains also reflect the market’s belated recognition that the Mexican economy is much healthier than headlines convey.
The Fund’s holding in the Market Vectors Vietnam ETF was responsible for the largest drag on performance, by far. Vietnam saw its stock market lurch lower during the period as a series of scandals and reforms impacted its banking sector. To date, Vietnam’s banks have borne the brunt of the pressure arising from the country’s bloated state-owned enterprise sector. Like China, its large neighbor to the north, Vietnam’s government has propagated a substantial number of uncompetitive, state-backed enterprises; and as in China, those entities have borrowed excessively from compliant local banks. Some of the debts have come due, and the state-backed debtors have been either unwilling or unable to repay. This outcome has led to criticism and scandal within the country’s banking sector and throughout its various political circles. Vietnam appears to be redoubling its efforts to reform the sector, yet the market stumbled amid the political and economic strife. Nevertheless, we remain heartily enthusiastic. Much of the country’s private (non-state-backed) sector remains in good health, and valuations on selected stocks appear quite attractive. Seafarer will conduct “on the ground” research in Vietnam during the coming months, with the eventual intent to add individual Vietnamese equities to the Fund, as and when the Fund’s registration status allows.
Allocation
At the end of October, the Fund’s composition had shifted discernibly from that of April, particularly with respect to its regional allocation (more outside Asia), and also relative to company size (a marginal shift toward larger companies).
The Fund’s allocation to the Asia region declined about 16% (from 80% to 64% of net assets) during the semi-annual period, with offsetting increases in other regions, especially Eastern Europe (+12%) and Latin America (+5%). This shift toward Eastern Europe was driven in large part by attractive valuations in Poland; the portfolio’s holdings there appear to exhibit growth and valuation characteristics that are favored by the Fund’s strategy.
The Fund increased its exposure to Latin America during the period, notably by way of introduction of two new issuers in Chile and another in Brazil.2 In the months leading up to the Fund’s launch, we were quite cautious about Brazil: we were concerned the currency was too expensive; the valuations too dear; and the growth slowing too much. However, our research in the country has made us moderately more positive. Valuations on many stocks are still steep, and the immediate outlook for the economy is challenging, but we see signs that the country is gradually turning the corner for the better, and that stronger growth lies ahead. I personally believe that the Rousseff administration has exhibited a great deal of courage, undertaking a number of politically difficult measures that will most likely
| 6 | (855) 732-9220 | seafarerfunds.com |
Table of Contents
Seafarer Overseas Growth and Income Fund | Portfolio Review | |
October 31, 2012 (Unaudited) |
improve the country’s long-term prospects. However, for the moment, the market clearly thinks otherwise: the administration has attempted to inject competition into several inefficient sectors, and the shares of companies that have been singled out have slumped.
Regarding the Fund’s marginal shift toward larger companies (from 20% to 35% of net assets): since inception, the Fund has allocated the bulk of its weight toward mid-sized companies. This is because Seafarer typically finds more mid-sized companies that satisfy the Fund’s growth and valuation criteria. However, during the past three months, the Fund made a deliberate shift toward larger companies, due to concerns about rising valuations across markets. At the recent nadir in markets (June 4th), we felt that valuations were quite attractive, as we indicated in our July Shareholder Conference Call. However, from the lows of June, to the end of the semi-annual period, the emerging market benchmark index rose 14.4%.3 This pronounced, short-term gain has led us to be just a bit more cautious overall, which in turn has prompted us to favor larger companies, where we find valuations – and safety – to be marginally better. To be clear, we believe valuations on emerging market stocks are not excessive at present, even if they are no longer especially attractive.
Andrew Foster
Chief Investment Officer
Seafarer Capital Partners, LLC
November 12, 2012
| 1 | Kingdee International shares closed at HKD 5.07 on April 27, 2011; and closed at HKD 0.85 on July 30, 2012. Source: Factset. |
| 2 | One of the Chilean. issuers referenced in this sentence (Corpbanca SA/Chile) consolidates two separate holdings, a common stock and an ADR. |
| 3 | Performance based on the MSCI Emerging Markets Total Return Index, Standard (Large + Mid Cap) Core, Gross (dividends reinvested), USD. June 4 to October 31, 2012. Source: Bloomberg. |
Seafarer Overseas Growth and Income Fund Performance
Cumulative Total Return (for the period ended October 31, 2012) | Since Inception* | Net Expense Ratio** | ||||||||
Investor Class (SFGIX) | 9.06 | % | 1.60 | % | ||||||
Institutional Class (SIGIX) | 9.09 | % | 1.45 | % | ||||||
MSCI Emerging Markets Total Return Index^ | -3.50 | % | �� | |||||||
Gross expense ratio: 4.48% for Investor Class; 4.59% for Institutional Class**
Assumes reinvestment of all dividends and/or distributions before taxes. The performance data quoted represents past performance and does not guarantee future results. Future returns may be lower or higher. The investment return and principal value will fluctuate so that an investor’s shares, when redeemed, may be worth more or less than the original cost. Shares of the Fund redeemed or exchanged within 90 days of purchase are subject to a 2% redemption fee. Performance does not reflect this fee, which if deducted would reduce an individual’s return. To obtain the Fund’s most recent month-end performance, visit seafarerfunds.com or call (855) 732-9220.
| * | Inception Date: February 15, 2012. |
| ** | Seafarer Capital Partners, LLC has agreed contractually to waive and/or reimburse fees or expenses in order to limit Total Annual Fund Operating Expenses After Fee Waiver / Expense Reimbursements (excluding acquired fund fees and expenses, brokerage expenses, interest expenses, taxes and extraordinary expenses) to 1.60% and 1.45% of the Fund’s average daily net assets for the Investor and Institutional share classes respectively. This agreement is in effect through August 31, 2013. |
| ^ | The MSCI Emerging Markets Total Return Index, Standard (Large+Mid Cap) Core, Gross (dividends reinvested), USD is a free float-adjusted market capitalization index designed to measure equity market performance of emerging markets. The MSCI Emerging Markets Total Return Index consists of the following 21 emerging market country indices: Brazil, Chile, China, Colombia, Czech Republic, Egypt, |
| Semi-Annual Report | October 31, 2012 | 7 |
Table of Contents
Seafarer Overseas Growth and Income Fund | Portfolio Review | |
October 31, 2012 (Unaudited) |
Hungary, India, Indonesia, Korea, Malaysia, Mexico, Morocco, Peru, Philippines, Poland, Russia, South Africa, Taiwan, Thailand, and Turkey. Index code: GDUEEGF. It is not possible to invest directly in this or any index. |
The views and information discussed in this commentary are as of the date of publication, are subject to change, and may not reflect the writer’s current views. The views expressed represent an assessment of market conditions at a specific point in time, are opinions only and should not be relied upon as investment advice regarding a particular investment or markets in general. Such information does not constitute a recommendation to buy or sell specific securities or investment vehicles. It should not be assumed that any investment will be profitable or will equal the performance of the portfolios or any securities or any sectors mentioned herein. The subject matter contained herein has been derived from several sources believed to be reliable and accurate at the time of compilation. Seafarer does not accept any liability for losses either direct or consequential caused by the use of this information.
As of 10/31/2012, Aselsan Elektronik Sanayi Ve Ticaret AS comprised 4.1% of the Seafarer Overseas Growth and Income Fund; Kingdee International Software Group Co. Ltd. comprised 2.1% of the Fund; Cerebos Pacific, Ltd. comprised 1.0% of the Fund; Grupo Herdez SAB de CV comprised 1.9% of the Fund, Kimberly-Clark de Mexico SAB de CV comprised 2.3% of the Fund, Market Vectors Vietnam ETF comprised 3.4% of the Fund, Corpbanca SA/Chile comprised 0.7% of the Fund, and Corpbanca SA/Chile ADR comprised 1.4% of the Fund. Holdings are subject to change.
Performance of a $10,000 Investment (Since Inception)
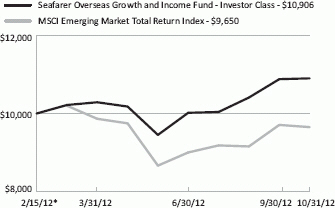
| * | Inception Date: February 15, 2012. |
The chart shown above represents historical performance of a hypothetical investment of $10,000 in the Fund’s Investor Class shares for the period from inception to 10/31/2012. All returns reflect reinvested dividends, but do not reflect the deduction of taxes that an investor would pay on distributions or redemptions.
The Fund also offers Institutional Class shares, performance for which is not reflected in the chart above. The performance of Institutional Class shares may be higher or lower than the performance of the Investor Class shares shown above based upon differences in fees paid by shareholders investing in the Investor Class shares and Institutional Class shares.
| 8 | (855) 732-9220 | seafarerfunds.com |
Table of Contents
Seafarer Overseas Growth and Income Fund | Portfolio Review | |
October 31, 2012 (Unaudited) |
Investment Objective
The Fund seeks to provide long-term capital appreciation along with some current income. The Fund seeks to mitigate adverse volatility in returns as a secondary objective.
Strategy
The Fund invests a significant amount of its net assets in the securities of companies located in developing countries. The Fund can invest in dividend-paying common stocks, preferred stocks, convertible bonds, and fixed-income securities.
The Fund seeks to offer investors a relatively stable means of participating in a portion of developing countries’ growth prospects, while providing some downside protection (in comparison to a portfolio that invests only in the common stocks of developing countries).
Portfolio Management
Andrew Foster, Lead Manager
William Maeck, Associate Manager
Fund Characteristics
| Inception Date | 2/15/2012 | |||||
Net Assets | $17.1M | |||||
Portfolio Turnover1 | 5% | |||||
| Investor Class | Institutional Class | |||||||||
Ticker | SFGIX | SIGIX | ||||||||
NAV (10/31/12) | $10.85 | $10.87 | ||||||||
30-Day SEC Yield (10/31/12) | 1.64% | 1.74% | ||||||||
Net Expense Ratio | 1.60% | 1.45% | ||||||||
Redemption Fee (within 90 calendar days) | 2.00% | 2.00% | ||||||||
Minimum Initial Investment | $2,500 | $100,000 | ||||||||
Minimum Initial Investment (Retirement Account) | $1,000 | $100,000 | ||||||||
Underlying Portfolio Holdings
Number of Holdings | 44 | ||||||
% of Net Assets in Top 10 Holdings | 38% | ||||||
Weighted Average Market Cap | $9.2B | ||||||
Market Cap of Portfolio Median | $3.9B | ||||||
Gross Portfolio Yield2,3 | 3.6% | ||||||
Price / Book Value2 | 1.8 | ||||||
Price / Earnings2 | 12.4 | ||||||
Forecast EPS Growth2 | 9.5% |
Sources: ALPS Fund Services, Inc., FactSet Research Systems, Seafarer.
The “Underlying Portfolio Holdings” table presents indicative values only; Seafarer does not warrant the data’s accuracy, and disclaims any responsibility for its use for investment purposes.
Past performance does not guarantee future results.
See notes on following page.
| Semi-Annual Report | October 31, 2012 | 9 |
Table of Contents
Seafarer Overseas Growth and Income Fund | Portfolio Review | |
October 31, 2012 (Unaudited) |
| 1 | For the period 5/1/2012 – 10/31/2012. Portfolio Turnover is for a period less than one full year and is not annualized. |
| 2 | Calculated as a harmonic average of the underlying portfolio holdings. A harmonic average is the reciprocal of the arithmetic mean of the reciprocals. Harmonic averages are generally preferable to weighted averages or other techniques when measuring the fundamental characteristics (e.g., earnings per share, book value per share) of a portfolio of securities. For more information, see the presentation “Index Calculation Primer,” by Roger J. Bos, CFA, Senior Index Analyst at Standard & Poor’s, 17 July 2000. |
| 3 | Gross Portfolio Yield = gross yield for the underlying portfolio, estimated based on the dividend yield for common and preferred stocks and yield to maturity for bonds. This measure of yield does not account for offsetting Fund expenses and other costs, and consequently it should not be construed as the yield that an investor in the Fund would receive. |
Price / Book Value: the value of a company’s common shares, divided by the company’s book value.
Price / Earnings: the market price of a company’s common shares divided by the earnings per common share as forecast for this year.
Forecast EPS Growth: forecast growth rate of earnings per common share this year, expressed as a percentage.
| 10 | (855) 732-9220 | seafarerfunds.com |
Table of Contents
Seafarer Overseas Growth and Income Fund | Portfolio Review | |
October 31, 2012 (Unaudited) |
Top 10 Holdings
| Holding | Sector | Country | % Net Assets | Issuer Mkt Cap ($B) | Yield1 | Price / Book | Price / Earnings | Forecast EPS Growth | ||||||||
| PGE Polska Grupa Energetyczna SA | Utilities | Poland | 4.7% | $10.1 | 10.6% | 0.8 | 8 | -18% | ||||||||
| SIA Engineering Co., Ltd. | Industrials | Singapore | 4.4% | $3.8 | 5.2% | 3.5 | 17 | 5% | ||||||||
Aselsan Elektronik Sanayi Ve Ticaret AS | Industrials | Turkey | 4.1% | $1.9 | 1.4% | 2.9 | 13 | 54% | ||||||||
| Digital China Holdings, Ltd. | Information Technology | China / Hong Kong | 4.1% | $1.8 | 3.0% | 2.0 | 10 | 18% | ||||||||
| Citic Telecom Intl Holdings, Ltd. | Telecom Services | China / Hong Kong | 4.1% | $0.6 | 5.4% | 1.3 | 9 | 9% | ||||||||
| Infosys, Ltd. ADR | Information Technology | India | 3.7% | $25.2 | 2.0% | 3.6 | 14 | 7% | ||||||||
| Market Vectors Vietnam ETF | Other | Vietnam | 3.4% | – | 1.0% | – | – | – | ||||||||
| Bank Pekao SA | Financials | Poland | 3.3% | $12.6 | 3.5% | 1.9 | 14 | 4% | ||||||||
| Olam Intl 6.0% Cnv Bds 10/15/16 USD | Consumer Staples | Singapore | 3.2% | $3.9 | 3.8% | – | – | – | ||||||||
| Odontoprev SA | Health Care | Brazil | 3.1% | $2.7 | 3.0% | 7.9 | 32 | 23% |
Cumulative Weight of Top 10 Holdings: | 38 | % | ||
Total Number of Holdings: | 44 |
Portfolio holdings are subject to change. Table presents indicative values only. Sources: ALPS Fund Services, Inc., FactSet Research Systems, Inc., Seafarer.
| 1 | Yield = dividend yield for common and preferred stocks and yield to maturity for bonds. |
The table above presents indicative values only; Seafarer does not warrant the data’s accuracy and disclaims any responsibility for its use for investment purposes.
| Semi-Annual Report | October 31, 2012 | 11 |
Table of Contents
Seafarer Overseas Growth and Income Fund | Portfolio Review | |
October 31, 2012 (Unaudited) |
Portfolio Composition
| Region/Country | % Net Assets | ||||
East & South Asia | 64 | ||||
China / Hong Kong | 18 | ||||
India | 4 | ||||
Indonesia | 2 | ||||
Japan | 3 | ||||
Malaysia | 4 | ||||
Singapore | 12 | ||||
South Korea | 6 | ||||
Taiwan | 5 | ||||
Thailand | 7 | ||||
Vietnam | 3 | ||||
Eastern Europe | 15 | ||||
Poland | 10 | ||||
Turkey | 5 | ||||
Latin America | 14 | ||||
Brazil | 5 | ||||
Chile | 5 | ||||
Mexico | 4 | ||||
Middle East & Africa | 3 | ||||
South Africa | 3 | ||||
Cash and Other Assets, Less Liabilities | 5 | ||||
Total | 100 | ||||
| Asset Class | % Net Assets | ||||
Common Stock | 73 | ||||
ADR | 8 | ||||
Preferred Stock | 6 | ||||
USD Convertible Bond | 4 | ||||
ETF | 3 | ||||
Foreign Currency Convertible Bond | 2 | ||||
Cash and Other Assets, Less Liabilities | 5 | ||||
Total | 100 | ||||
| Market Capitalization of Issuer | % Net Assets | ||||
Large Cap (over $10 billion) | 35 | ||||
Mid Cap ($1 - $10 billion) | 44 | ||||
Small Cap (under $1 billion) | 14 | ||||
N/A | 3 | ||||
Cash and Other Assets, Less Liabilities | 5 | ||||
Total | 100 | ||||
Percentage values may not sum to 100% due to rounding.
| Sector | % Net Assets | ||||
Consumer Discretionary | 3 | ||||
Consumer Staples | 9 | ||||
Energy | 6 | ||||
Financials* | 22 | ||||
Health Care | 9 | ||||
Industrials | 11 | ||||
Information Technology | 16 | ||||
Materials | 4 | ||||
Telecommunication Services | 4 | ||||
Utilities | 9 | ||||
Other | 3 | ||||
Cash and Other Assets, Less Liabilities | 5 | ||||
Total | 100 | ||||
| * | The Fund’s concentration in the Financials sector includes holdings in property-related stocks, which are classified within the “Financials Sector” according to the Global Industry Classification Standard (GICS) methodology utilized herein. Property-related holdings comprise 5% of the Fund’s net assets as of 10/31/2012. |
| 12 | (855) 732-9220 | seafarerfunds.com |
Table of Contents
Seafarer Overseas Growth and Income Fund | Portfolio Review | |
October 31, 2012 (Unaudited) |
Greatest Performance Contributors and Detractors
For the period 5/1/2012 – 10/31/2012
Contributors | % Net Assets | * | |||||
Aselsan Elektronik Sanayi Ve Ticaret AS | 4.1 | ||||||
Kingdee International Software Group Co. Ltd. | 2.1 | ||||||
Citic Telecom International Holdings, Ltd. | 4.1 | ||||||
Samsung Fire & Marine Insurance Co., Ltd., Pfd. | 2.6 | ||||||
Perusahaan Gas Negara Persero Tbk PT | 2.5 | ||||||
Detractors | % Net Assets | * | |||||
Market Vectors Vietnam ETF | 3.4 | ||||||
Digital China Holdings, Ltd. | 4.1 | ||||||
Asseco Poland SA | 2.0 | ||||||
Sociedad Quimica y Minera de Chile SA ADR | 2.4 | ||||||
Tata Power Co. Ltd. 1.75% Cnv Bds 11/21/14 USD | 0.6 | ||||||
| * | As of end of period |
Source: Bloomberg
The table above presents estimated values only; Seafarer does not warrant the data’s accuracy and disclaims any responsibility for its use for investment purposes.
| Semi-Annual Report | October 31, 2012 | 13 |
Table of Contents
Seafarer Overseas Growth and Income Fund | Disclosure of Fund Expenses | |
October 31, 2012 (Unaudited) |
As a shareholder of the Fund you will incur two types of costs: (1) transaction costs, including applicable redemption fees; and (2) ongoing costs, including management fees and other Fund expenses. The following examples are intended to help you understand your ongoing costs (in dollars) of investing in the Fund and to compare these costs with the ongoing costs of investing in other mutual funds. The examples are based on an investment of $1,000 invested on May 1, 2012 and held until October 31, 2012.
Actual Expenses. The first line of each table below provides information about actual account values and actual expenses. You may use the information in this line, together with the amount you invested, to estimate the expenses that you paid over the period. Simply divide your account value by $1,000 (for example, an $8,600 account value divided by $1,000 = 8.6), then multiply the result by the number in the first line under the heading “Expenses Paid During Period” to estimate the expenses you paid on your account during this period.
Hypothetical Example for Comparison Purposes. The second line of the table below provides information about hypothetical account values and hypothetical expenses based on the Fund’s actual expense ratio and an assumed rate of return of 5% per year before expenses, which is not the Fund’s actual return. The hypothetical account values and expenses may not be used to estimate the actual ending account balance or expenses you paid for the period. You may use this information to compare the ongoing costs of investing in the Fund and other mutual funds. To do so, compare this 5% hypothetical example with the 5% hypothetical examples that appear in the shareholder reports of the other funds. The expenses shown in the table are meant to highlight ongoing Fund costs only and do not reflect transaction fees, such as redemption fees or exchange fees. Therefore, the second line of each table below is useful in comparing ongoing costs only, and may not help you determine the relative total costs of owning different funds. In addition, if these transactional costs were included, your costs would have been higher.
Beginning Account Value 05/01/12 | Ending Account Value 10/31/12 | Expense Ratio(a) | Expenses Paid During Period 05/01/12 - 10/31/12(b) | |||||
Investor Class | ||||||||
Actual | $ 1,000.00 | $ 1,071.30 | 1.60% | $ 8.35 | ||||
Hypothetical (5% return before expenses) | $ 1,000.00 | $ 1,017.14 | 1.60% | $ 8.13 | ||||
| ||||||||
Institutional Class | ||||||||
Actual | $ 1,000.00 | $ 1,071.60 | 1.45% | $ 7.57 | ||||
Hypothetical (5% return before expenses) | $ 1,000.00 | $ 1,017.90 | 1.45% | $ 7.38 |
| (a) | Annualized, based on the Fund’s most recent fiscal half year expenses. |
| (b) | Expenses are equal to the Fund’s annualized expense ratio multiplied by the average account value over the period, multiplied by the number of days in the most recent fiscal half year (184), then divided by 365. |
| 14 | (855) 732-9220 | seafarerfunds.com |
Table of Contents
Seafarer Overseas Growth and Income Fund | Portfolio of Investments | |
October 31, 2012 (Unaudited) |
| Currency | Shares | Value | ||||||||
COMMON STOCKS* (81.0%) | ||||||||||
Brazil (5.0%) | ||||||||||
Odontoprev SA | BRL | 101,700 | $ | 525,763 | ||||||
Aliansce Shopping Centers SA | BRL | 29,000 | 329,829 | |||||||
|
| |||||||||
Total Brazil | 855,592 | |||||||||
|
| |||||||||
Chile (4.5%) | ||||||||||
Sociedad Quimica y Minera de Chile SA ADR | USD | 7,100 | 410,735 | |||||||
Corpbanca SA/Chile ADR | USD | 11,376 | 233,208 | |||||||
Corpbanca SA/Chile | CLP | 9,750,000 | 127,622 | |||||||
|
| |||||||||
Total Chile | 771,565 | |||||||||
|
| |||||||||
China / Hong Kong (17.6%) | ||||||||||
Digital China Holdings, Ltd. | HKD | 418,000 | 700,695 | |||||||
Citic Telecom International Holdings, Ltd. | HKD | 3,024,000 | 696,895 | |||||||
Hang Lung Properties, Ltd. | HKD | 150,000 | 519,389 | |||||||
Kingdee International Software Group Co., Ltd.(a) | HKD | 1,746,000 | 360,701 | |||||||
Television Broadcasts, Ltd. | HKD | 32,000 | 238,054 | |||||||
Shandong Weigao Group Medical Polymer Co., Ltd., Class H | HKD | 140,000 | 188,806 | |||||||
Vitasoy International Holdings, Ltd. | HKD | 182,000 | 172,608 | |||||||
CLP Holdings, Ltd. | HKD | 15,500 | 132,066 | |||||||
|
| |||||||||
Total China / Hong Kong | 3,009,214 | |||||||||
|
| |||||||||
India (3.7%) | ||||||||||
Infosys, Ltd. ADR | USD | 14,800 | 642,616 | |||||||
|
| |||||||||
Total India | 642,616 | |||||||||
|
| |||||||||
Indonesia (2.5%) | ||||||||||
Perusahaan Gas Negara Persero Tbk PT | IDR | 875,000 | 422,018 | |||||||
|
| |||||||||
Total Indonesia | 422,018 | |||||||||
|
| |||||||||
Japan (2.6%) | ||||||||||
Hisamitsu Pharmaceutical Co., Inc. | JPY | 5,000 | 258,528 | |||||||
OBIC Business Consultants, Ltd. | JPY | 3,600 | 190,205 | |||||||
|
| |||||||||
Total Japan | 448,733 | |||||||||
|
| |||||||||
Malaysia (4.4%) | ||||||||||
AMMB Holdings Bhd | MYR | 185,500 | 387,862 | |||||||
| Semi-Annual Report | October 31, 2012 | 15 |
Table of Contents
Seafarer Overseas Growth and Income Fund | Portfolio of Investments | |
October 31, 2012 (Unaudited) |
| Currency | Shares | Value | ||||||||
Malaysia (continued) | ||||||||||
Hartalega Holdings Bhd | MYR | 243,600 | $ | 372,677 | ||||||
|
| |||||||||
Total Malaysia | 760,539 | |||||||||
|
| |||||||||
Mexico (4.2%) | ||||||||||
Kimberly-Clark de Mexico SAB de CV, Class A | MXN | 161,400 | 391,235 | |||||||
Grupo Herdez SAB de CV | MXN | 120,847 | 327,544 | |||||||
|
| |||||||||
Total Mexico | 718,779 | |||||||||
|
| |||||||||
Poland (10.0%) | ||||||||||
PGE SA | PLN | 148,500 | 805,758 | |||||||
Bank Pekao SA | PLN | 11,900 | 571,628 | |||||||
Asseco Poland SA | PLN | 26,908 | 337,157 | |||||||
|
| |||||||||
Total Poland | 1,714,543 | |||||||||
|
| |||||||||
Singapore (9.1%) | ||||||||||
SIA Engineering Co., Ltd. | SGD | 219,000 | 753,427 | |||||||
Singapore Technologies Engineering, Ltd. | SGD | 124,000 | 356,881 | |||||||
Hong Leong Finance, Ltd. | SGD | 135,000 | 276,077 | |||||||
Cerebos Pacific, Ltd. | SGD | 32,000 | 172,901 | |||||||
|
| |||||||||
Total Singapore | 1,559,286 | |||||||||
|
| |||||||||
South Africa (1.2%) | ||||||||||
Life Healthcare Group Holdings, Ltd. | ZAR | 53,402 | 201,976 | |||||||
|
| |||||||||
Total South Africa | 201,976 | |||||||||
|
| |||||||||
Taiwan (4.5%) | ||||||||||
Taiwan Semiconductor Manufacturing Co., Ltd. | TWD | 143,000 | 435,730 | |||||||
Taiwan Hon Chuan Enterprise Co., Ltd. | TWD | 134,000 | 285,068 | |||||||
Taiwan Semiconductor Manufacturing Co., Ltd. ADR | USD | 3,400 | 54,060 | |||||||
|
| |||||||||
Total Taiwan | 774,858 | |||||||||
|
| |||||||||
Thailand (6.9%) | ||||||||||
Bangkok Bank PCL NVDR | THB | 86,000 | 494,492 | |||||||
PTT PCL | THB | 46,500 | 480,762 | |||||||
Thai Reinsurance PCL(a) | THB | 1,620,000 | 208,729 | |||||||
|
| |||||||||
Total Thailand | 1,183,983 | |||||||||
|
| |||||||||
| 16 | (855) 732-9220 | seafarerfunds.com |
Table of Contents
Seafarer Overseas Growth and Income Fund | Portfolio of Investments | |
October 31, 2012 (Unaudited) |
| Currency | Shares | Value | ||||||||||||||
Turkey (4.8%) | ||||||||||||||||
Aselsan Elektronik Sanayi Ve Ticaret AS | TRY | 185,773 | $ | 702,987 | ||||||||||||
Asya Katilim Bankasi AS(a) | TRY | 100,000 | 112,236 | |||||||||||||
|
| |||||||||||||||
Total Turkey | 815,223 | |||||||||||||||
|
| |||||||||||||||
TOTAL COMMON STOCKS (Cost $13,112,091) | 13,878,925 | |||||||||||||||
EXCHANGE TRADED FUNDS (3.4%) | ||||||||||||||||
Vietnam (3.4%) | ||||||||||||||||
Market Vectors Vietnam ETF | USD | 36,993 | 583,010 | |||||||||||||
|
| |||||||||||||||
Total Vietnam | 583,010 | |||||||||||||||
|
| |||||||||||||||
TOTAL EXCHANGE TRADED FUNDS (Cost $644,366) | 583,010 | |||||||||||||||
PREFERRED STOCKS* (5.5%) | ||||||||||||||||
South Korea (5.5%) | ||||||||||||||||
S-Oil Corp. | KRW | 9,180 | 508,198 | |||||||||||||
Samsung Fire & Marine Insurance Co., Ltd. | KRW | 5,831 | 443,513 | |||||||||||||
|
| |||||||||||||||
Total South Korea | 951,711 | |||||||||||||||
|
| |||||||||||||||
TOTAL PREFERRED STOCKS (Cost $861,250) | 951,711 | |||||||||||||||
| Currency | Rate | Maturity Date | Principal Amount | Value | ||||||||||||
CONVERTIBLE CORPORATE BOND (5.6%) | ||||||||||||||||
India (0.6%) | ||||||||||||||||
Tata Power Co., Ltd., Series TPWR | USD | 1.75% | 11/21/14 | $ | 100,000 | 103,600 | ||||||||||
|
| |||||||||||||||
Total India | 103,600 | |||||||||||||||
|
| |||||||||||||||
Singapore (3.2%) | ||||||||||||||||
Olam International, Ltd. | USD | 6.00% | 10/15/16 | 500,000 | 543,250 | |||||||||||
|
| |||||||||||||||
Total Singapore | 543,250 | |||||||||||||||
|
| |||||||||||||||
| Semi-Annual Report | October 31, 2012 | 17 |
Table of Contents
Seafarer Overseas Growth and Income Fund | Portfolio of Investments | |
October 31, 2012 (Unaudited) |
| Currency | Rate | Maturity Date | Principal Amount | Value | ||||||||||
South Africa (1.8%) | ||||||||||||||
Steinhoff International Holdings, Ltd., Series SHF | ZAR | 9.63% | 07/20/15 | 2,000,000 | $ | 309,781 | ||||||||
|
| |||||||||||||
Total South Africa | 309,781 | |||||||||||||
|
| |||||||||||||
TOTAL CONVERTIBLE CORPORATE BOND (Cost $945,061) | 956,631 | |||||||||||||
| Currency | Shares | Value | ||||||||||||
WARRANTS (0.0%)(b) | ||||||||||||||
Hartalega Holdings, Strike Price 4.14 (expiration 05/29/15) | MYR | 6,860 | 2,545 | |||||||||||
|
| |||||||||||||
| 2,545 | ||||||||||||||
|
| |||||||||||||
TOTAL WARRANTS (Cost $–) | 2,545 | |||||||||||||
TOTAL INVESTMENTS (Cost $15,562,768) (95.5%) | $ | 16,372,822 | ||||||||||||
Cash and Other Assets, Less Liabilities (4.5%) | 769,563 | |||||||||||||
NET ASSETS (100.0%) | $ | 17,142,385 | ||||||||||||
| * | Certain securities were fair valued in good faith through consideration of other factors in accordance with procedures established by and under the general supervision of the Board of Trustees (Note 2). |
| (a) | Non-income producing security. |
| (b) | Less than 0.05%. |
| 18 | (855) 732-9220 | seafarerfunds.com |
Table of Contents
Seafarer Overseas Growth and Income Fund | Portfolio of Investments | |
October 31, 2012 (Unaudited) |
Currency Abbreviations | ||||||||
BRL | - | Brazil Real | ||||||
CLP | - | Chile Peso | ||||||
HKD | - | Hong Kong Dollar | ||||||
IDR | - | Indonesia Rupiah | ||||||
JPY | - | Japan Yen | ||||||
KRW | - | South Korea Won | ||||||
MXN | - | Mexico Peso | ||||||
MYR | - | Malaysia Ringgit | ||||||
PLN | - | Poland Zloty | ||||||
SGD | - | Singapore Dollar | ||||||
THB | - | Thailand Baht | ||||||
TRY | - | Turkey Lira | ||||||
TWD | - | Taiwan New Dollar | ||||||
USD | - | United States Dollar | ||||||
ZAR | - | South Africa Rand | ||||||
Common Abbreviations: | ||||||
ADR | - | American Depositary Receipt. | ||||
AS | - | Andonim Sirketi, Joint Stock Company in Turkey. | ||||
Bhd | - | Berhad, Public Limited Company in Malaysia. | ||||
ETF | - | Exchange Traded Fund. | ||||
Ltd. | - | Limited. | ||||
NVDR | - | Non-Voting Depository Receipt. | ||||
PCL | - | Public Company Limited. | ||||
PT | - | Perseroan Terbata, Limited Liability Company in Indonesia. | ||||
SA | - | Generally designates corporations in various countries, mostly those employing the civil law. This translates literally in all languages mentioned as anonymous company. | ||||
SAB de CV | - | A variable capital company. | ||||
For Fund compliance purposes, the Fund’s geographical classifications refer to any one or more of the sub-classifications used by one or more widely recognized market indexes or ratings group indexes, and/or as defined by Fund management. These definitions may not apply for purposes of this report, which may combine sub-classifications for reporting ease. Geographical regions are shown as a percentage of net assets. These classifications are based on third party definitions. The definitions are industry terms and do not reflect the legal status of any of the investments or the companies in which the Fund has invested.
See Accompanying Notes to Financial Statements.
| Semi-Annual Report | October 31, 2012 | 19 |
Table of Contents
Seafarer Overseas Growth and Income Fund | Statement of Assets and Liabilities | |
October 31, 2012 (Unaudited) |
ASSETS: | ||||
Investments, at value | $ | 16,372,822 | ||
Cash | 510,509 | |||
Foreign currency, at value (Cost $251,543, respectively) | 251,543 | |||
Receivable for shares sold | 157,387 | |||
Interest and dividends receivable | 16,796 | |||
Deferred offering costs | 18,817 | |||
Prepaid expenses and other assets | 17,487 | |||
Total Assets | 17,345,361 | |||
LIABILITIES: | ||||
Payable for investments purchased | 164,824 | |||
Administrative fees payable | 11,547 | |||
Co-administrative & shareholder servicing fees payable | 1,112 | |||
Shareholder service plan fees payable | 2,352 | |||
Director’s fees and expenses payable | 134 | |||
Audit fees payable | 15,861 | |||
Accrued expenses and other liabilities | 7,146 | |||
Total Liabilities | 202,976 | |||
NET ASSETS | $ | 17,142,385 | ||
NET ASSETS CONSIST OF: | ||||
Paid-in capital (Note 5) | $ | 16,287,449 | ||
Accumulated net investment income | 64,905 | |||
Accumulated net realized loss on investments and foreign currency transactions | (19,135) | |||
Net unrealized appreciation on investments and translation of assets and liabilities in foreign currencies | 809,166 | |||
NET ASSETS | $ | 17,142,385 | ||
INVESTMENTS, AT COST | $ | 15,562,768 | ||
PRICING OF SHARES | ||||
Investor Class: | ||||
Net Asset Value, offering and redemption price per share | $ | 10.85 | ||
Net Assets | $ | 12,801,783 | ||
Shares of beneficial interest outstanding | 1,180,171 | |||
Institutional Class: | ||||
Net Asset Value, offering and redemption price per share | $ | 10.87 | ||
Net Assets | $ | 4,340,602 | ||
Shares of beneficial interest outstanding | 399,213 | |||
See Accompanying Notes to Financial Statements.
| 20 | (855) 732-9220 | seafarerfunds.com |
Table of Contents
Seafarer Overseas Growth and Income Fund | Statement of Operations | |
For the Six Months Ended October 31, 2012 (Unaudited) |
INVESTMENT INCOME: | ||||
Dividends | $ | 156,843 | ||
Foreign taxes withheld on dividends | (11,371) | |||
Interest and other income | 4,970 | |||
Total investment income | 150,442 | |||
EXPENSES: | ||||
Investment advisory fees | 36,327 | |||
Administrative and transfer agency fees | 86,125 | |||
Co-administrative & shareholder servicing fees | ||||
Investor Class | 2,846 | |||
Institutional Class | 714 | |||
Trustees’ fees and expenses | 321 | |||
Registration/filing fees | 5,490 | |||
Shareholder service plan fees | ||||
Investor Class | 4,268 | |||
Institutional Class | 714 | |||
Legal fees | 1,674 | |||
Audit fees | 10,566 | |||
Reports to shareholders and printing fees | 4,321 | |||
Custody fees | 2,619 | |||
Offering fees | 34,023 | |||
Miscellaneous | 3,089 | |||
Total expenses | 193,097 | |||
Less fees waived/reimbursed by investment advisor | ||||
Investor Class | (82,030) | |||
Institutional Class | (44,829) | |||
Total net expenses | 66,238 | |||
NET INVESTMENT INCOME: | 84,204 | |||
Net realized loss on investments | (1,158) | |||
Net realized loss on foreign currency transactions | (19,098) | |||
Net change in unrealized appreciation on investments | 799,342 | |||
Net change in unrealized depreciation on translation of assets and liabilities in foreign currency transactions | (375) | |||
NET REALIZED AND UNREALIZED GAIN ON INVESTMENTS AND FOREIGN CURRENCY TRANSLATIONS | 778,711 | |||
NET INCREASE IN NET ASSETS RESULTING FROM OPERATIONS | $ | 862,915 | ||
See Accompanying Notes to Financial Statements.
| Semi-Annual Report | October 31, 2012 | 21 |
Table of Contents
Seafarer Overseas Growth and Income Fund | Statement of Changes in Net Assets | |
For the Six Months Ended October 31, 2012 | For the Period February 15, 2012 (Inception) to April 30, 2012 | |||||||
OPERATIONS: | ||||||||
Net investment income | $ | 84,204 | $ | 8,459 | ||||
Net realized gain/(loss) on investments and foreign currency transactions | (20,256) | 4,356 | ||||||
Net change in unrealized appreciation on investments and foreign currency translations | 798,967 | 10,199 | ||||||
Net increase in net assets resulting from operations | 862,915 | 13,663 | ||||||
DISTRIBUTIONS TO SHAREHOLDERS: | ||||||||
From net investment income | ||||||||
Investor Class | (14,364) | – | ||||||
Institutional Class | (8,402) | – | ||||||
Net decrease in net assets from distributions | (22,766) | – | ||||||
BENEFICIAL INTEREST TRANSACTIONS: | ||||||||
Shares sold | ||||||||
Investor | 11,312,484 | 1,449,187 | ||||||
Institutional | 2,806,193 | 1,327,000 | ||||||
Dividends reinvested | ||||||||
Investor | 14,364 | – | ||||||
Institutional | 8,402 | – | ||||||
Shares Redeemed, net of redemption fees | ||||||||
Investor | (505,095) | – | ||||||
Institutional | (123,962) | – | ||||||
Net increase in net assets derived from beneficial interest transactions | 13,512,386 | 2,776,187 | ||||||
Net increase in net assets | $ | 14,352,535 | $ | 2,789,850 | ||||
NET ASSETS: | ||||||||
Beginning of period | 2,789,850 | – | ||||||
End of period (including accumulated net investment income of $64,905 and $3,467, respectively) | $ | 17,142,385 | $ | 2,789,850 | ||||
| 22 | (855) 732-9220 | seafarerfunds.com |
Table of Contents
Seafarer Overseas Growth and Income Fund | Statement of Changes in Net Assets | |
For the Six Months Ended October 31, 2012 (Unaudited) | For the Period February 15, 2012 (Inception) to April 30, 2012 | |||||||
Other Information: | ||||||||
SHARE TRANSACTIONS: | ||||||||
Investor Class | ||||||||
Sold | 1,086,033 | 141,869 | ||||||
Distributions reinvested | 1,479 | – | ||||||
Redeemed | (49,210) | – | ||||||
Net increase in shares outstanding | 1,038,302 | 141,869 | ||||||
Institutional Class | ||||||||
Sold | 277,521 | 132,281 | ||||||
Distributions reinvested | 863 | – | ||||||
Redeemed | (11,452) | – | ||||||
Net increase in shares outstanding | 266,932 | 132,281 | ||||||
See Accompanying Notes to Financial Statements.
| Semi-Annual Report | October 31, 2012 | 23 |
Table of Contents
Seafarer Overseas Growth and Income Fund | Financial Highlights | |
For a share outstanding through the periods presented |
Investor Class | For the Six Months Ended | For the Period February 15, 2012 (Inception) to April 30, 2012 | ||||||
NET ASSET VALUE, BEGINNING OF PERIOD | $ | 10.18 | $ | 10.00 | ||||
INCOME FROM OPERATIONS: | ||||||||
Net investment income(a) | 0.10 | 0.05 | ||||||
Net realized and unrealized gain on investments | 0.62 | 0.13 | ||||||
Total from investment operations | 0.72 | 0.18 | ||||||
LESS DISTRIBUTIONS: | ||||||||
From investment income | (0.05) | – | ||||||
Total distributions | (0.05) | – | ||||||
REDEMPTION FEES ADDED TO PAID IN CAPITAL | 0.00 | (b) | – | |||||
NET INCREASE IN NET ASSET VALUE | 0.67 | 0.18 | ||||||
NET ASSET VALUE, END OF PERIOD | $ | 10.85 | $ | 10.18 | ||||
TOTAL RETURN(c) | 7.13% | 1.80% | ||||||
RATIOS/SUPPLEMENTAL DATA: | ||||||||
Net assets, end of period (in 000s) | $ | 12,802 | $ | 1,443 | ||||
Operating expenses excluding reimbursement/waiver | 4.48% | (d) | 18.96% | (d) | ||||
Operating expenses including reimbursement/waiver | 1.60% | (d) | 1.60% | (d) | ||||
Net investment income including reimbursement/waiver | 1.89% | (d) | 2.61% | (d) | ||||
PORTFOLIO TURNOVER RATE(e) | 5% | 5% | ||||||
| (a) | Calculated using the average shares method. |
| (b) | Less than $0.005 per share. |
| (c) | Total returns are for the period indicated and have not been annualized. Total returns would have been lower had certain expenses not been waived during the period. Returns shown do not reflect the deduction of taxes that a shareholder would pay on Fund distributions or the redemption of Fund shares. |
| (d) | Annualized. |
| (e) | Portfolio turnover rate for periods less than one full year have not been annualized. |
See Accompanying Notes to Financial Statements.
| 24 | (855) 732-9220 | seafarerfunds.com |
Table of Contents
Seafarer Overseas Growth and Income Fund | Financial Highlights | |
For a share outstanding through the periods presented |
| Institutional Class | For the Six Months Ended | For the Period February 15, 2012 (Inception) to April 30, 2012 | ||||||
NET ASSET VALUE, BEGINNING OF PERIOD | $ | 10.18 | $ | 10.00 | ||||
INCOME FROM OPERATIONS: | ||||||||
Net investment income(a) | 0.11 | 0.04 | ||||||
Net realized and unrealized gain on investments | 0.61 | 0.14 | ||||||
Total from investment operations | 0.72 | 0.18 | ||||||
LESS DISTRIBUTIONS: | ||||||||
From investment income | (0.03) | – | ||||||
Total distributions | (0.03) | – | ||||||
REDEMPTION FEES ADDED TO PAID IN CAPITAL | 0.00 | (b) | – | |||||
NET INCREASE IN NET ASSET VALUE | 0.69 | 0.18 | ||||||
NET ASSET VALUE, END OF PERIOD | $ | 10.87 | $ | 10.18 | ||||
TOTAL RETURN(c) | 7.16% | 1.80% | ||||||
RATIOS/SUPPLEMENTAL DATA: | ||||||||
Net assets, end of period (in 000s) | $ | 4,341 | $ | 1,346 | ||||
Operating expenses excluding reimbursement/waiver | 4.59% | (d) | 21.65% | (d) | ||||
Operating expenses including reimbursement/waiver | 1.45% | (d) | 1.45% | (d) | ||||
Net investment income including reimbursement/waiver | 2.13% | (d) | 2.00% | (d) | ||||
PORTFOLIO TURNOVER RATE(e) | 5% | 5% | ||||||
| (a) | Calculated using the average shares method. |
| (b) | Less than $0.005 per share. |
| (c) | Total returns are for the period indicated and have not been annualized. Total returns would have been lower had certain expenses not been waived during the period. Returns shown do not reflect the deduction of taxes that a shareholder would pay on Fund distributions or the redemption of Fund shares. |
| (d) | Annualized. |
| (e) | Portfolio turnover rate for periods less than one full year have not been annualized. |
See Accompanying Notes to Financial Statements.
| Semi-Annual Report | October 31, 2012 | 25 |
Table of Contents
Seafarer Overseas Growth and Income Fund | Notes to Financial Statements | |
October 31, 2012 (Unaudited) |
1. ORGANIZATION
Financial Investors Trust (the “Trust”), a Delaware statutory trust, is an open-end management investment company registered under the Investment Company Act of 1940, as amended (“1940 Act”). As of October 31, 2012, the Trust had 24 registered funds. This semi-annual report describes the Seafarer Overseas Growth and Income Fund (the “Fund”). The Fund seeks to provide long-term capital appreciation along with some current income; it also seeks to mitigate adverse volatility in returns. The Fund offers Investor Class and Institutional Class shares. All classes of shares have identical rights to earnings, assets and voting privileges, except for class specific expenses and exclusive rights to vote on matters affecting only individual classes.
2. SIGNIFICANT ACCOUNTING POLICIES
The following is a summary of significant accounting policies consistently followed by the Fund. These policies are in conformity with U.S. generally accepted accounting principles (“GAAP”).
The preparation of financial statements in accordance with GAAP requires management to make certain estimates and assumptions that affect the reported amounts and disclosures in the financial statements during the reporting period. Management believes the estimates and security valuations are appropriate; however, actual results may differ from those estimates, and the security valuations reflected in the financial statements may differ from the value the Fund ultimately realizes upon sale of the securities.
Investment Valuation: The Fund generally values its securities based on market prices determined at the close of regular trading on the New York Stock Exchange (“NYSE”), normally 4:00 p.m. Eastern Time, on each day the NYSE is open for trading.
For equity securities and mutual funds that are traded on an exchange, the market price is usually the closing sale or official closing price on that exchange. In the case of equity securities not traded on an exchange, or if such closing prices are not otherwise available, the securities are valued at the mean of the most recent bid and ask prices on such day.
Equity securities that are primarily traded on foreign securities exchanges are valued at the closing values of such securities on their respective foreign exchanges, except when an event occurs subsequent to the close of the foreign exchange and the close of the NYSE that was likely to have changed such value. In such an event, the fair values of those securities are determined in good faith through consideration of other factors in accordance with procedures established by and under the general supervision of the Board of Trustees (the “Board”). The Fund will use a fair valuation model provided by an independent pricing service, which is intended to reflect fair value when a security’s value or a meaningful portion of the Fund’s portfolio is believed to have been materially affected by an valuation event that has occurred between the close of the exchange or market on which the security is traded and the close of the regular trading day on the NYSE. The Fund’s valuation procedures set forth certain triggers which instruct when to use the fair valuation model.
The market price for debt obligations is generally the price supplied by an independent third-party pricing service approved by the Board which may use a matrix, formula or other objective method that takes into consideration quotations from dealers, market transactions in comparable investments, market indices and yield curves. If vendors are unable to supply a price, or if the price supplied is deemed to be unreliable, the market price may be determined using quotations received from one or more broker–
| 26 | (855) 732-9220 | seafarerfunds.com |
Table of Contents
Seafarer Overseas Growth and Income Fund | Notes to Financial Statements | |
October 31, 2012 (Unaudited) |
dealers that make a market in the security. Short–term debt obligations that will mature in 60 days or less are valued at amortized cost, unless it is determined that using this method would not reflect an investment’s fair value. Investments in non-exchange traded funds are fair valued at their respective net asset values.
Forward currency exchange contracts have a market value determined by the prevailing foreign currency exchange daily rates and current foreign currency exchange forward rates. The foreign currency exchange forward rates are calculated using an automated system that estimates rates on the basis of the current day foreign currency exchange rates and forward foreign currency exchange rates supplied by a pricing service.
When such prices or quotations are not available, or when the Fair Value Committee appointed by the Board believes that they are unreliable, securities may be priced using fair value procedures approved by the Board. The Fund may also use fair value procedures if the Fair Value Committee determines that a significant event has occurred between the time at which a market price is determined and the time at which a Fund’s NAV is calculated. In particular, the value of non-U.S. securities may be materially affected by events occurring after the close of the foreign exchange on which they are traded, but before the Fund prices its shares.
Fair Value Measurements: The Fund discloses the classification of its fair value measurements following a three-tier hierarchy based on the inputs used to measure fair value. Inputs refer broadly to the assumptions that market participants would use in pricing the asset or liability, including assumptions about risk. Inputs may be observable or unobservable. Observable inputs reflect the assumptions market participants would use in pricing the asset or liability that are developed based on market data obtained from sources independent of the reporting entity. Unobservable inputs reflect the reporting entity’s own assumptions about the assumptions market participants would use in pricing the asset or liability that are developed based on the best information available.
Various inputs are used in determining the value of the Fund’s investments as of the end of the reporting period. When inputs used fall into different levels of the fair value hierarchy, the level in the hierarchy within which the fair value measurement falls is determined based on the lowest level input that is significant to the fair value measurement in its entirety. The designated input levels are not necessarily an indication of the risk or liquidity associated with these investments. These inputs are categorized in the following hierarchy under applicable financial accounting standards:
Level 1 – | Unadjusted quoted prices in active markets for identical investments, unrestricted assets or liabilities that a Fund has the ability to access at the measurement date; | |
Level 2 – | Quoted prices which are not active, quoted prices for similar assets or liabilities in active markets or inputs other than quoted prices that are observable (either directly or indirectly) for substantially the full term of the asset or liability; and | |
Level 3 – | Significant unobservable prices or inputs (including the Fund’s own assumptions in determining the fair value of investments) where there is little or no market activity for the asset or liability at the measurement date. | |
| Semi-Annual Report | October 31, 2012 | 27 |
Table of Contents
Seafarer Overseas Growth and Income Fund | Notes to Financial Statements | |
October 31, 2012 (Unaudited) |
The following is a summary of each input used to value the Fund as of October 31, 2012:
| Investments in Securities at Value(a) | Level 1 - Quoted Prices | Level 2 - Other Significant Observable Inputs | Level 3 - Significant Unobservable Inputs | Total | ||||||||||||
Common Stocks | ||||||||||||||||
Brazil | $ | 855,592 | $ | – | $ | – | $ | 855,592 | ||||||||
Chile | 771,565 | – | – | 771,565 | ||||||||||||
China / Hong Kong | – | 3,009,214 | – | 3,009,214 | ||||||||||||
India | 642,616 | – | – | 642,616 | ||||||||||||
Indonesia | – | 422,018 | – | 422,018 | ||||||||||||
Japan | – | 448,733 | – | 448,733 | ||||||||||||
Malaysia | 372,677 | 387,862 | – | 760,539 | ||||||||||||
Mexico | 718,779 | – | – | 718,779 | ||||||||||||
Poland | – | 1,714,543 | – | 1,714,543 | ||||||||||||
Singapore | – | 1,559,286 | – | 1,559,286 | ||||||||||||
South Africa | – | 201,976 | – | 201,976 | ||||||||||||
Taiwan | 54,060 | 720,798 | – | 774,858 | ||||||||||||
Thailand | – | 1,183,983 | – | 1,183,983 | ||||||||||||
Turkey | – | 815,223 | – | 815,223 | ||||||||||||
Exchange Traded Funds | 583,010 | – | – | 583,010 | ||||||||||||
Preferred Stocks | ||||||||||||||||
South Korea | – | 951,711 | – | 951,711 | ||||||||||||
Convertible Corporate | ||||||||||||||||
Bond | – | 956,631 | – | 956,631 | ||||||||||||
Warrants | 2,545 | – | – | 2,545 | ||||||||||||
Total | $ | 4,000,844 | $ | 12,371,978 | $ | – | $ | 16,372,822 | ||||||||
| (a) | For detailed descriptions of countries, see the accompanying Portfolio of Investments. |
The Fund recognizes transfers between levels as of the beginning of the annual period in which the transfer occurred. For the six months ended October 31, 2012, the Fund did not have any securities that used significant unobservable inputs (Level 3) in determining fair value. Therefore, a reconciliation of assets in which significant unobservable inputs (Level 3) were used in determining fair value is not applicable.
Security amounts the Fund transferred between Levels 1 and 2 at October 31, 2012 were as follows:
Level 1 - Quoted Prices | Level 2 - Other Significant Observable Inputs | |||||||||||||||
| Transfers In | Transfers (Out) | Transfers In | Transfers (Out) | |||||||||||||
Common Stocks | $ | 372,678 | $ | – | $ | – | $ | (372,678) | ||||||||
Preferred Stocks | – | (443,513.00) | 443,513.00 | – | ||||||||||||
Total | $ | 372,678 | $ | (443,513) | $ | 443,513 | $ | (372,678) | ||||||||
The Fund utilizes a fair value evaluation service with respect to international securities with an earlier market closing than the Fund’s net asset value computation cutoff.
| 28 | (855) 732-9220 | seafarerfunds.com |
Table of Contents
Seafarer Overseas Growth and Income Fund | Notes to Financial Statements | |
October 31, 2012 (Unaudited) |
Investment Transactions: Investment transactions are accounted for on the date the investments are purchased or sold (trade date). Realized gains and losses from investment transactions are reported on an identified cost basis. Interest income, which includes accretion of discounts, is accrued and recorded as earned. Dividend income is recognized on the ex-dividend date or for certain foreign securities, as soon as information is available to the Fund.
Foreign Securities: The Fund may directly purchase securities of foreign issuers. Investing in securities of foreign issuers involves special risks not typically associated with investing in securities of U.S. issuers. The risks include possible reevaluation of currencies, the inability to repatriate foreign currency, less complete financial information about companies and possible future adverse political and economic developments. Moreover, securities of many foreign issuers and their markets may be less liquid and their prices more volatile than those of securities of comparable U.S. issuers.
Foreign Currency Translation: The books and records of the Fund are maintained in U.S. dollars. Investment valuations and other assets and liabilities initially expressed in foreign currencies are converted each business day into U.S. dollars based upon current exchange rates. Prevailing foreign exchange rates may generally be obtained at the close of the NYSE (normally, 4:00 p.m. Eastern time). The portion of realized and unrealized gains or losses on investments due to fluctuations in foreign currency exchange rates is not separately disclosed and is included in realized and unrealized gains or losses on investments, when applicable.
Foreign Currency Spot Contracts: The Fund may enter into foreign currency spot contracts to facilitate transactions in foreign securities or to convert foreign currency receipts into U.S. dollars. A foreign currency spot contract is an agreement between two parties to buy and sell currencies at the current market rate, for settlement generally within two business days. The U.S. dollar value of the contracts is determined using current currency exchange rates supplied by a pricing service. The contract is marked-to-market daily for settlements beyond one day and any change in market value is recorded as an unrealized gain or loss. When the contract is closed, the Fund records a realized gain or loss equal to the difference between the value on the open and close date. Losses may arise from changes in the value of the foreign currency, or if the counterparties do not perform under the contract’s terms. The maximum potential loss from such contracts is the aggregate face value in U.S. dollars at the time the contract was opened.
Trust Expenses: Some expenses of the Trust can be directly attributed to the Fund. Expenses which cannot be directly attributed to the Fund are apportioned among all funds in the Trust based on average net assets of each fund.
Fund and Class Expenses: Expenses that are specific to the Fund or class of shares of the Fund are charged directly to the Fund or share class. Fees provided under the shareholder service plans for a particular class of the Fund are charged to the operations of such class.
Offering Costs: Offering costs, including costs of printing initial prospectuses, legal and registration fees, are being amortized over twelve months from the inception date of the Fund. As of October 31, 2012, $18,817 of offering costs remain to be amortized for the Fund.
Federal Income Taxes: The Fund complies with the requirements under Subchapter M of the Internal Revenue Code of 1986, as amended, applicable to regulated investment companies and
| Semi-Annual Report | October 31, 2012 | 29 |
Table of Contents
Seafarer Overseas Growth and Income Fund | Notes to Financial Statements | |
October 31, 2012 (Unaudited) |
intends to distribute substantially all of its net taxable income and net capital gains, if any, each year. The Fund is not subject to income taxes to the extent such distributions are made.
As of and during the six months ended October 31, 2012, the Fund did not have a liability for any unrecognized tax benefits in the accompanying financial statements. The Fund files income tax returns in the U.S. federal jurisdiction and Colorado.
Distributions to Shareholders: The Fund normally pays dividends and net investment income, if any, on a semi-annual basis. The Fund normally distributes capital gains, if any, on an annual basis. Income dividend distributions are derived from interest and other income the Fund receives from its investments, including distributions of short term capital gains. Capital gain distributions are derived from gains realized when the Fund sells a security it has owned for more than one year. The Fund may make additional distributions and dividends at other times if the Adviser believes doing so may be necessary for the Fund to avoid or reduce taxes. Net investment income/(loss) and net realized gain/(loss) may differ for financial statement and tax purposes.
3. TAX BASIS INFORMATION
Tax Basis of Distributions to Shareholders: The character of distributions made during the year from net investment income or net realized gains may differ from its ultimate characterization for federal income tax purposes. Also, due to the timing of dividend distributions, the fiscal year in which amounts are distributed may differ from the fiscal year in which the income or realized gain is recorded by the Fund. During the six months ended October 31, 2012 and the period ended April 30, 2012, respectively, the Fund did not make any distributions.
As of October 31, 2012, the aggregate cost of investments, gross unrealized appreciation/ (depreciation) and net unrealized appreciation for Federal tax purposes were as follows:
| Fund | Cost of Investments | Gross Unrealized Appreciation | Gross Unrealized (Depreciation) | Net Unrealized on Foreign | Net Unrealized Appreciation | |||||||||||||||
Seafarer Overseas | $ | 15,562,768 | $ | 1,121,723 | $ | (311,669 | ) | $ | 0 | $ | 810,054 | |||||||||
4. SECURITIES TRANSACTIONS
The cost of purchases and proceeds from sales of securities excluding short term securities during the six months ended October 31, 2012, were as follows:
| Purchases of Securities | Proceeds From Sales of Securities | |
| $ 13,340,060 | $388,293 |
5. SHARES OF BENEFICIAL INTEREST
The capitalization of the Trust consists of an unlimited number of shares of beneficial interest with no par value per share. Holders of the shares of the Fund of the Trust have one vote for each share held
| 30 | (855) 732-9220 | seafarerfunds.com |
Table of Contents
Seafarer Overseas Growth and Income Fund | Notes to Financial Statements | |
October 31, 2012 (Unaudited) |
and a proportionate fraction of a vote for each fractional share. All shares issued and outstanding are fully paid and are non-assessable, transferable and redeemable at the option of the shareholder. Shares have no pre-emptive rights.
Shares redeemed within 90 days of purchase may incur a 2% short-term redemption fee deducted from the redemption amount. The redemption fee is reflected in the “Cost of shares redeemed, net of redemption fees” in the Statement of Changes in Net Assets. During the six months ended October 31, 2012, the Fund retained the following redemption fees.
| Fund | Class | Redemption Fees | ||
Seafarer Overseas Growth and Income Fund | Investor | $ 709 | ||
Seafarer Overseas Growth and Income Fund | Institutional | $ 240 |
Beneficial Ownership: The beneficial ownership, either directly or indirectly, of more than 25% of the voting securities of any class of a Fund creates a presumption of control of the Fund under Section 2(a)(9) of the 1940 Act. As of October 31, 2012, the following entities owned beneficially 25% or greater of the voting securities of a class of the Fund.
| Fund | Class | Name | Percentage | |||
Seafarer Overseas Growth and Income Fund | Investor | Charles Schwab & Co.* | 63.08% | |||
Seafarer Overseas Growth and Income Fund | Institutional | National Financial Services Corp.* | 39.73% | |||
Seafarer Overseas Growth and Income Fund | Institutional | Andrew & Michelle Foster | 25.73% |
| * | The shares are held under omnibus accounts (whereby the transactions of two or more shareholders are combined and carried in the name of the originating broker rather than designated separately). |
6. MANAGEMENT AND RELATED-PARTY TRANSACTIONS
Seafarer Capital Partners, LLC (“Seafarer” or the “Adviser”), subject to the authority of the Board, is responsible for the overall management and administration of the Fund’s business affairs. The Adviser manages the investments of the Fund in accordance with the Fund’s investment objective, policies and limitations and investment guidelines established jointly by the Adviser and the Trustees. Pursuant to the Advisory Agreement, (the “Advisory Agreement”), the Fund pays the Adviser an annual management fee of 0.85%, based on the Fund’s average daily net assets. The management fee is paid on a monthly basis.
The Adviser has contractually agreed to limit certain Fund expenses to 1.60% of the Fund’s average daily net assets in the Investor Class shares and 1.45% of the Fund’s average daily net assets in the Institutional Class shares until August 31, 2013. The Fund may have to repay some of these waivers and reimbursements to the Adviser in the following three years. Pursuant to this agreement, the Fund will reimburse the Adviser for any fee waivers and expense reimbursements made by the Adviser, provided that any such reimbursements made by the Fund to the Adviser will not cause the Fund’s expense limitation to exceed expense limitations in existence at the time the expense was incurred, or at the time of the reimbursement, whichever is lower, and the reimbursement is made within three years after the end of the fiscal year in which fees or expenses were incurred.
| Semi-Annual Report | October 31, 2012 | 31 |
Table of Contents
Seafarer Overseas Growth and Income Fund | Notes to Financial Statements | |
October 31, 2012 (Unaudited) |
For the six months ended October 31, 2012, the fee waivers and/or reimbursements were as follows:
| Fund | Fees Waived/ Reimbursed By Advisor | Recoupment of Past Waived Fees By Advisor | Total | |||||||||
Seafarer Overseas Growth and Income Fund | ||||||||||||
Investor Class | $ | 82,030 | $ | – | $ | 82,030 | ||||||
Institutional Class | 44,829 | $ | – | 44,829 | ||||||||
As of October 31, 2012, the balances of recoupable expenses for each class were as follows:
| Fund | Expires 2015 | Expires 2016 | Total | |||||||||
Seafarer Overseas Growth and Income Fund | ||||||||||||
Investor Class | $ | 22,136 | $ | 82,030 | $ | 104,166 | ||||||
Institutional Class | 51,869 | 44,829 | 96,698 | |||||||||
Fund Accounting Fees and Expenses
ALPS Fund Services, Inc. (“ALPS” and the “Administrator”) (an affiliate of ALPS Distributors, Inc.) provides administrative, fund accounting and other services to the Fund under the Administration, Bookkeeping and Pricing Services Agreement with the Trust. Under this Agreement, ALPS is paid fees, accrued on a daily basis and paid on a monthly basis following the end of the month, based on the greater of (a) an annual total fee of $123,000 in year one and $143,000 in year two and forward from the first to the last, or projected last, day of the then-current year of services; or (b) the following fee schedule:
| Average Total Net Assets | Contractual Fee | |
Between $0-$500M | 0.05% | |
$500M-$1B | 0.03% | |
Above $1B | 0.02% |
The Administrator is also reimbursed by the Fund for certain out-of-pocket expenses.
The Adviser provides shareholder and administrative services to the Fund under the Co-Administration and Shareholder Services Agreement with the Trust. Under this Agreement, the Adviser is paid fees, accrued on a daily basis and paid on a monthly basis following the end of the month, of 0.10% of the average daily net assets of the Investor Class and of 0.05% of the average daily net assets of the Institutional Class and is reimbursed for certain out-of-pocket expenses.
Transfer Agent
ALPS serves as transfer, dividend paying and shareholder servicing agent for the Fund (“Transfer Agent”). ALPS is compensated based upon a $25,000 annual base fee per Fund, and annually $9 per direct open account and $7 per open account through NSCC. The Transfer Agent is also reimbursed by the Fund for certain out-of-pocket expenses.
Compliance Services
ALPS provides services that assist the Fund’s Chief Compliance Officer in monitoring and testing the policies and procedures of the Trust on a daily basis in conjunction with requirements under Rule 38a-1 under the 1940 Act under the Chief Compliance Officer Services Agreement with the Trust.
| 32 | (855) 732-9220 | seafarerfunds.com |
Table of Contents
Seafarer Overseas Growth and Income Fund | Notes to Financial Statements | |
October 31, 2012 (Unaudited) |
Under this Agreement, the Adviser pays ALPS an annual base fee of $30,000 and reimburses ALPS for certain out-of-pocket expenses.
Principal Financial Officer
ALPS provides principal financial officer services to the Fund under the Principal Financial Officer Services Agreement with the Trust. Under this Agreement, the Adviser pays ALPS an annual base fee of $10,000 and the Adviser reimburses ALPS for certain out-of-pocket expenses.
Distributor
ALPS Distributors, Inc. (“ADI” or the “Distributor”) (an affiliate of ALPS) acts as the distributor of the Fund’s shares pursuant to the Distribution Agreement with the Trust. Shares are sold on a continuous basis by ADI as agent for the Fund, and ADI has agreed to use its best efforts to solicit orders for the sale of the Fund’s shares, although it is not obliged to sell any particular amount of shares. ADI is registered as a broker-dealer with the Securities and Exchange Commission.
Shareholder Services Plan for Investor Class and Institutional Class Shares
The Fund has adopted a shareholder service plan (a “Service Plan”) for each of its share classes. Under the Service Plan, the Fund is authorized to enter into shareholder service agreements with investment advisors, financial institutions and other service providers (“Participation Organizations”) to maintain and provide certain administrative and servicing functions in relation to the accounts of shareholders. The Service Plan will cause the Fund to pay an aggregate fee, not to exceed on an annual basis of 0.15% and 0.05% of the average daily net asset value of the Investor and Institutional classes, respectively. Such payment will be made on assets attributable to or held in the name of a Participating Organization, on behalf of its clients as compensation for providing service activities pursuant to an agreement with a Participating Organization. Any amount of such payment not paid during the Fund’s fiscal year for such service activities shall be reimbursed to the Fund as soon as practicable after the end of the fiscal year.
7. INDEMNIFICATIONS
Under the Trust’s organizational documents, its officers and Trustees are indemnified against certain liability arising out of the performance of their duties to the Trust. Additionally, in the normal course of business, the Trust enters into contracts with service providers that may contain general indemnification clauses, which may permit indemnification to the extent permissible under the applicable law. The Trust’s maximum exposure under these arrangements is unknown, as this would involve future claims that may be made against the Trust that have not yet occurred.
| Semi-Annual Report | October 31, 2012 | 33 |
Table of Contents
Seafarer Overseas Growth and Income Fund | Additional Information | |
October 31, 2012 (Unaudited) |
1. FUND HOLDINGS
The Fund files its complete schedule of portfolio holdings with the Securities and Exchange Commission (the “SEC”) for the first and third quarters of each fiscal year on Form N-Q within 60 days after the end of the period. Copies of the Fund’s Form N-Q are available without charge on the SEC website at http://www.sec.gov. You may also review and copy the Form N-Q at the SEC’s Public Reference Room in Washington, D.C. For more information about the operation of the Public Reference Room, please call the SEC at 1-800-SEC-0330.
2. FUND PROXY VOTING POLICIES, PROCEDURES AND SUMMARIES
The Fund’s policies and procedures used in determining how to vote proxies and information regarding how the Fund voted proxies relating to portfolio securities during the most recent prior 12-month period ending June 30 are available without charge, (1) upon request, by calling toll-free at (855) 732-9220 and (2) on the SEC’s website at http://www.sec.gov.
| 34 | (855) 732-9220 | seafarerfunds.com |
Table of Contents
Page Intentionally Left Blank.
Table of Contents
Page Intentionally Left Blank.
Table of Contents

Seafarer Funds distributed by ALPS Distributors, Inc.
Must be accompanied or preceded by a prospectus.
Table of Contents

Table of Contents
CONTENTS | PAGE | |||
| 1 | ||||
| 7 | ||||
| 10 | ||||
| 9 | ||||
| 12 | ||||
| 13 | ||||
| 16 | ||||
| 19 | ||||
| 20 | ||||
| 21 | ||||
| 22 | ||||
| 23 | ||||
| 24 | ||||
| 25 | ||||
| 33 | ||||
| www.vulcanvaluepartners.com |
Table of Contents
| Shareholder Letter | ||
| October 31, 2012 (Unaudited) |
Dear Shareholders:
We are pleased to report that the Vulcan Value Partners Funds preserved capital for the period ended October 31, 2012; since inception Vulcan Value Partners Fund has returned 11.63% and Vulcan Value Partners Small Cap Fund returned 16.66% (all returns are net of fees; see pages 7 and 10 for standardized performance information). Our performance was above both benchmarks for the Vulcan Value Partners Fund and the Vulcan Value Partners Small Cap Fund year to date. For the six months ending October 31, 2012, the Vulcan Value Partners Small Cap Fund was above both benchmarks and Vulcan Value Partners Fund outperformed one out of two benchmarks. We place no weight on short-term results, good or bad, and neither should you. We are focused on producing superior real rates of return over our five-year time horizon. Everything we do is with that goal in mind, even if it hurts our results in the short run. We encourage you to place more weight on our longer term historical results and a great deal of weight on our long-term prospects. Also, as you review our results please remember that all of our investment operations are driven by the same investment philosophy.
The stock market has exceeded most peoples’ expectations so far in 2012 and Vulcan Value Partners Funds have done materially better than “the market.” We note that we were extremely bullish about our long-term prospects in our communications to you at the end of 2011. How do we feel right now? In the near term we are neither bullish nor bearish. In the long term (our minimum investment time-horizon is five years) we are very bullish.
The near term:
There are a number of positives and negatives but no extremes that would cause us to be bullish or bearish. The positives include continued flows out of stocks and into bonds. In our opinion, bonds are the next bubble that will pop – more on this topic below. Other positives include an improving housing market for the first time in a very long time, low inflation, thawing credit conditions, and a tremendous amount of liquidity being provided by the Federal Reserve. Negatives include sub-par economic growth in the U.S., a recession in Europe, and a slowdown in China, and in the developing world. Uncertainties include the looming fiscal cliff(1). Many things could go badly but no more so than is the norm. We have no crystal ball but we pay attention to extremes. Other than a bubble in bonds (which ultimately could be good for stocks) we do not see any extremes, which is why we are neutral near term.
The long term:
The relationship between bonds and stocks does not make mathematical sense to us. Moreover, bonds do not make mathematical sense to us. The yield on 10-year treasuries was 1.64% as of September 30, 2012. The most recent Consumer Price Index(2) release showed year over year increases in both actual and core CPI of 2%. The consensus forecast of inflation exceeds 2%. Our own opinion is that over the next ten years (admittedly back loaded) inflation will significantly exceed 2%. If we are correct, stated simply, investors in 10-year treasuries are accepting a negative real return in exchange for “safety.” There are many kinds of risks, and preserving purchasing power is among the most important. Also and very importantly, valuation can either increase or decrease risk. When we buy ownership in a publicly traded company at a discount we reduce risk, though not necessarily volatility. If we pay a premium (and we never knowingly do) we increase risk. Bonds are the same. Investors in long-term treasuries are taking on very high levels of risk because of high valuations. An
Semi-Annual Report | October 31, 2012 | 1 |
Table of Contents
Shareholder Letter | ||
October 31, 2012 (Unaudited) |
investor in a 10-year treasury will suffer a 9% capital loss if interest rates rise a mere 1%. When your going in yield is less than 2% nominally and negative in real terms, a 9% capital loss is a calamity. An investor in 30-year treasuries would suffer a 20% loss with only 1% rise interest rates. Valuation matters. Long-term treasuries have no margin of safety in our opinion.
Equities, on the other hand, look attractive to us. Our equities look very attractive. Both of our strategies are managed by the same investment philosophy and they have similar long-term returns. At certain points in time one strategy will be more attractive than another. Right now, everything is remarkably uniform. So, we can use our Vulcan Value Partners Fund as a proxy for both funds in this example. The dividend yield on our Vulcan Value Partners Fund is 1.8%. This yield is the same as the yield on 10-year treasuries. The yield on 10-year treasuries is fixed. The dividend yield on our fund is not fixed and we think it is likely to grow at rates well above inflation. Why? Our companies’ earnings and, much more important, our companies’ free cash flow are both growing well above inflation. Moreover, we believe our companies have strong balance sheets (a lot stronger than the Federal Government). This combination of strong balance sheets, ample free cash flow, and strong earnings growth has, and we think should, continue to result in dividend growth well ahead of inflation.
Why would anyone prefer a fixed rate of return below the rate of inflation with meaningful risk of capital loss to an equivalent yield that should grow well in excess of the rate of inflation? We can’t think of a rational answer. Yet, hundreds of billions of dollars continue to flow out of equities and into bonds. Like all bubbles, we are confident that this bubble too will burst eventually. When it does, equities and bonds will be re-priced. Those who understand the true risks they are taking will be rewarded and those who do not will suffer. In the meantime, our values are continuing to grow and we estimate that our portfolios, despite above average price appreciation, remain attractively discounted in the mid to upper 60’s. This price to value discount(3) is our margin of safety.(4) Said another way, valuation is reducing risk for us and it is increasing risk for bond investors. We much prefer to be equity investors.
There are two other reasons we are bullish long term. The second is related to the first. Because of attractive valuation, our free cash flow(5) yield is much higher than our dividend yield. Free cash flow is an ultimate determinant of the value of the companies we own. Free cash flow, by definition, belongs to us as owners, whether or not it is used to pay a dividend, repurchase stock, pay down debt, make acquisitions, our to just accrue to the balance sheet. So, our free cash flow yield is much more relevant to our investment outcome than the dividend yield. We expect our companies to grow their free cash at rates well above inflation. In our view, the equities we own (again taking the Vulcan Value Partners Fund as a proxy) with an estimated forward 12 month free cash flow yield of 8.2%, that is growing well ahead of inflation are compelling, especially compared to a fixed rate of return of less than 2% on 10-year treasuries.
The third reason we are bullish long term is that we continue to produce a robust list of companies that we would like to own if businesses we already own become more fully valued. This inventory of potential investments means that we can maintain our margin of safety by replacing higher price to value ratio stocks with lower price to value ratio stocks.
Does all of the above suggest that we expect continued smooth sailing? Of course not. While we cannot predict when it will happen, market volatility is inevitable. We look forward to it. Because we limit ourselves to companies that have demonstrated themselves to have had inherently stable
2 | www.vulcanvaluepartners.com |
Table of Contents
| Shareholder Letter | ||
| October 31, 2012 (Unaudited) |
values we can take advantage of market volatility to improve our margin of safety. Said simply, our companies’ values are more stable than their stock prices. Therefore, declines in stock prices caused by market volatility or security specific volatility create opportunities for us to lower risk by improving our margin of safety. What if there is continued upward volatility? In that case, we intend to follow our discipline and sell companies that are more fully valued by our estimate and buy companies that are more discounted by our estimate from our inventory of potential investments. Our challenge is to execute our investment philosophy regardless of the market environment that confronts us. I am pleased to be able to say that our research team is doing an excellent job in this regard.
As we have often said we place no weight on short-term results, good or bad, and neither should you. In fact, we will willingly make decisions that negatively impact short-term performance when we think we can improve our long-term returns and lower risk. We encourage you to place more weight on our longer-term historical results and a great deal of weight on our long-term prospects. We are virtually fully invested across both funds and have a deep inventory of potential investments.
Please note that in the commentary that follows regarding both of our funds, we generally define material contributors and detractors as companies having a greater than 1% impact on the portfolio. We generally limit comments about top contributors and detractors to the top three.
Vulcan Value Partners Fund
There were no material contributors or detractors during the six months ending October 31, 2012.
However, several companies deserve comment.
As we have noted the macro-economic environment in which our companies operate is sub-par at best. One of the wonderful things about owning well financed, competitively entrenched businesses is that they can take advantage of tough times to improve their competitive position and enhance returns to shareholders. United Technologies took advantage of record low interest rates and sold $9.8 billion of bonds, the largest corporate offering in three years. The offering was oversubscribed with $35 billion of orders, another record. $8.3 billion of the bonds were fixed rate with maturities extending to 30 years. The 10 year and 30 year maturities were sold with yields of 3.109% and 4.576% respectively. We generally use corporate borrowing costs as a reference point in determining our discount rates. The discount rates we use to value United Technologies’ free cash flow are much higher than the cost of this capital they have actually locked in for the next 30 years. Consequently, our value is conservative and United Technologies’ stock price is substantially less than our estimate of fair value, thereby creating a corresponding large margin of safety. United Technologies converts more than 100% of its earnings into free cash flow. Its free cash flow yield is approximately 8.5% as this letter is being written. We estimate that United Technologies will be able to grow its free cash flow and earnings at close to 10% on average over our long-term time horizon. Locking in low-cost, fixed-rate debt will help. Consider our position as equity holders. We receive nearly a 20% rate of return if there is no change in United Technologies’ valuation. Holders of the ten-year bonds will receive just over a 3% return if there is no change in the bonds’ valuation. If inflation rises, we will benefit as equity holders as United Technologies has pricing power but bond holders will almost surely suffer losses as bond yields rise with inflation. Equities are generally more risky than bonds but over and under valuation can change that relationship. “Generally” is not the same thing as “always”. We much prefer being equity investors in United Technologies as opposed to bond holders.
Semi-Annual Report | October 31, 2012 | 3 |
Table of Contents
Shareholder Letter | ||
October 31, 2012 (Unaudited) |
We sold three wonderful businesses during the six months ending October 31, 2012. It was painful. All of the companies were producing high levels of free cash flow, delivering solid bottom line results and were allocating capital intelligently. The companies we exited were Diageo (DEO), Fiserv (FISV), and Medtronic (MDT). There was nothing wrong with the businesses we sold. Their stock prices have compounded more rapidly than their values so that our margin of safety was less attractive compared to the new positions we purchased with their proceeds. We are grateful to the management teams of these businesses for growing their values steadily while we owned them.
We purchased two new positions during the six months ending October 31, 2012. CME Group operates the Chicago Mercantile Exchange, the Chicago Board of Trade, NYMEX, and the COMEX futures exchange. It is the largest derivatives marketplace in the world. It is by far and away the market leader for its most important products, which include futures and options based on interest rates, equity indexes, foreign exchange, energy, and agricultural commodities. It is self clearing. Because its market share is so high, it provides the most liquidity for market participants who trade its products. This deep liquidity creates a barrier to entry to would be competitors. CME Group enjoys very stable margins and generates high levels of free cash flow. We believe it is discounted today primarily because its short-term earnings growth is being held back by record low interest rates, which reduces demand for its interest rate products. We expect higher trading volumes, new products, and recurring free cash flow to lead to double-digit value growth over our five-year time horizon. We purchased CME Group at a large discount to our estimate of intrinsic worth, which is supported by numerous comparable transactions. As much as we liked the businesses we sold to pay for it, we believe that CME Group has even higher business quality and was purchased at a steeper discount than the businesses we sold.
Oracle is one of the most competitively entrenched technology companies we have ever analyzed. Oracle sells and services enterprise and cloud based software. It is used by most of the largest companies in the world. Its primary competitor, SAP, is also a wonderful company. The two rivals fight each other fiercely for new business but once a decision has been made to use one or the other’s products it is extremely difficult to switch. Without Oracle’s software, planes would not fly and Fed Ex and UPS would be delivering packages to each other’s customers. Oracle has an excellent reputation of supporting its customers and their software is critical to managing complex business systems. Customer retention rates exceed 90%. The majority of Oracle’s revenue is recurring. Oracle enjoys strong pricing power and very high, very stable software margins. If Oracle never landed a new customer we estimate that it could grow at a mid-single rate just from its existing customer base. It generates very high levels of free cash flow and has allocated capital intelligently over a number of years. As with CME Group, we believe that Oracle has even higher business quality and was purchased at a steeper discount than the businesses we sold to pay for it.
Vulcan Value Partners Small Cap Fund
There was one material contributor, NetSpend Holdings (NTSP) and no material detractors to performance during the six months ending October 31, 2012.
NetSpend is yet another financial services company that is not a commercial bank but operates around the edges of the banking industry. The company has a superior business model that produces strong free cash flow without financial leverage. NetSpend is a leader in providing prepaid debit cards that can substitute for checking accounts. Their customer base primarily consists of lower income workers who are un-banked or are under-banked because banks do not want to serve them. This
4 | www.vulcanvaluepartners.com |
Table of Contents
| Shareholder Letter | ||
| October 31, 2012 (Unaudited) |
market has expanded because these customers are not profitable for commercial banks in the wake of the Dodd-Frank(6) financial reform bill. NetSpend provides a superior product at a lower cost than commercial banks and is capturing market share in a large, underserved market.
We did buy six new positions; Altra Holdings (AIMC), Gardner Denver (GDI), Iconix Brand Group (ICON), Tupperware Brands Corp (TUP), Neustar (NSR) and Lincoln Electric (LECO).
We exited several successful investments; Bolt Technologies (BOLT), Nordson (NDSN) and Lincoln Electric (LECO). Similar to our comments about Vulcan Value Partners Fund, it was painful. There was nothing wrong with the businesses we sold. Their stock prices have compounded more rapidly than their values so that our margin of safety was less attractive compared to the new positions we purchased with their proceeds. We are grateful to the management teams of these businesses for growing their values steadily while we owned them. Bolt Technology was a very small cap when we bought it in the summer of 2010 during the Deepwater Horizon oil spill and it remains a small cap today.
We sold Nordson and Lincoln Electric to buy Neustar and to add to more discounted portfolio companies. Nordson and Lincoln Electric are both exceptional businesses and are well managed. Both were good investments for us. However, we had an opportunity to reduce risk in the portfolio by reallocating capital to new companies such as Neustar and existing positions within the portfolio at larger discounts, which resulted in a larger margin of safety for the overall portfolio. We purchased Neustar and added to our position. Neustar is the repository for all of the phone numbers in the United States. Every time a call is connected they are involved. As you think about your own experiences using the phone, they do a pretty good job. In fact, we think they do an excellent job. They can be replaced but the switching costs and risk of doing so make it highly unlikely that any of the 4,500 carriers using them would want to do so. They also own internet registries, provide internet infrastructure services and analytics to telecom providers. As you would expect with one of our investments, Neustar has a strong balance sheet, ample free cash flow and attractive returns on capital.
We had an opportunity to buy Lincoln Electric again later in the third quarter. Our value had increased and the stock price declined after we sold it. In the meantime, we made a nice gain on Neustar. We are not traders. We are long-term investors. Even after we sold Lincoln Electric we followed it closely. We hope to own it for a very long time but we will always reallocate capital to reduce risk by improving our margin of safety.
The remaining new purchases during the six months ending October 31, 2012 were Tupperware, Iconix Brand Group, Gardner-Denver, and Altra Holdings. Each of these companies generates high levels of free cash flow, has attractive returns on invested capital, and possesses strong balance sheets. Tupperware derives over 70% of its sales outside the U.S. and approximately 60% of its sales are from emerging markets. Iconix Brand Group owns brands and licenses them to retailers who pay royalties to Iconix. Iconix manages the brands but does no manufacturing. Retailers like working with Iconix because they can earn brand name margins on “private label” items. The company has stable margins, high returns on capital, and produces consistently high levels of free cash flow. Iconix owns many venerable brands but our favorite is Peanuts. Gardner-Denver makes industrial products, mostly pumps, compressors, and blowers. Approximately 31% of sales are in the after-market. Approximately 65% of their sales are outside the U.S. Altra Holdings makes motion control products.
Semi-Annual Report | October 31, 2012 | 5 |
Table of Contents
Shareholder Letter | ||
October 31, 2012 (Unaudited) |
Altra believes that they have #1 or #2 market shares in key products across their core platforms. Their industry is highly fragmented. Approximately 42% of their sales are in the after-market.
We are pleased with our research productivity and have a number of qualified companies competing for purchase should one or more of our current holdings reach fair value.
Closing
We are pleased to be able to share so much good news with you. We work for an exceptional group of long-term investors who all know that compounding in equities is not a straight line. Our goal is to be ready to take advantage of stock price volatility when it occurs by limiting our investments to businesses with inherently stable values. We look forward to such opportunities and appreciate your contribution of stable capital, which allows us to execute our investment philosophy.
As the weather is getting cooler we wish you and your families the best during the approaching holiday season. We will be hard at work preparing for opportunities that may present themselves in the new year.
Sincerely,
C.T. Fitzpatrick
Chief Investment Officer
| (1) | Fiscal Cliff is a term used to refer to the economic effects that could result from tax increases, spending cuts and corresponding reduction in the U.S. budget deficit beginning in 2013 if the existing laws are not changed by the end of 2013. |
| (2) | The Consumer Price Index is a measure of the average change over time in the prices paid by consumers for a market basket of consumer goods and services. |
| (3) | The price to value ratio is a calculation that compares the price of a company’s stock to our appraisal of the company’s intrinsic Value. |
| (4) | Free cash flow is the amount of cash that a company has left over after it has paid all of its expenses, including investments. |
| (5) | Margin of Safety is a favorable difference between the price of a company’s shares and the estimated fair value of those shares. |
| (6) | The Dodd Frank financial reform bill was signed into Federal Law in 2010 and brought about significant changes to financial regulation. |
Stock markets, especially foreign markets, are volatile and can decline significantly in response to adverse issuer, political, regulatory, market or economic developments. Value stocks can perform differently from the market as a whole. They can remain undervalued by the market for long periods of time. Funds that emphasize investments in smaller companies generally experience greater price volatility.
The views and information discussed in this commentary are as of the date of publication, are subject to change, and may not reflect the writer’s current views. The views expressed represent an assessment of market conditions at a specific point in time, are opinions only and should not be relied upon as investment advice regarding a particular investment or markets in general. Such information does not constitute a recommendation to buy or sell specific securities or investment vehicles. It should not be assumed that any investment will be profitable or will equal the performance of the portfolios or any securities or any sectors mentioned herein. The subject matter contained herein has been derived from several sources believed to be reliable and accurate at the time of compilation. The Fund does not accept any liability for losses either direct or consequential caused by the use of this information.
6 | www.vulcanvaluepartners.com |
Table of Contents
| Fund Overview | ||
| October 31, 2012 (Unaudited) |
Average Annual Total Returns (as of 10/31/2012)
| Since | Expense Ratios | |||||||||||||||
| 1 Year | Inception* | Gross | Net** | |||||||||||||
Vulcan Value Partners Fund | 20.87% | 11.63% | 1.24% | 1.24% | ||||||||||||
S&P 500® Total Return Index*** | 15.21% | 10.56% | ||||||||||||||
Russell 1000® Value Index*** | 16.89% | 10.37% | ||||||||||||||
Performance data quoted represents past performance. Past performance does not guarantee future results. Investment return and principal value of an investment will fluctuate so that an investor’s shares, when sold or redeemed, may be worth more or less than the original cost. The Fund imposes a 2.00% redemption fee on shares held for less that 90 days. Current performance data may be higher or lower than actual data quoted. For the most current month-end performance data, please call 1-877-421-5078.
The table does not reflect the deduction of taxes that a shareholder would pay on Fund distributions or the redemption of Fund shares.
Subject to investment risks, including possible loss of the principal amount invested.
| * | Fund Inception date of 12/30/09. |
| ** | Vulcan Value Partners, LLC (“Vulcan” or the “Adviser”) has given a contractual agreement to the Fund that to the extent the Total Annual Fund Operating Expenses (as defined in Item 3 of Form N-1A) with respect to the Fund (exclusive of Acquired Fund Fees and Expenses (if any), brokerage expenses, interest expense, taxes and extraordinary expenses) (“Designated Annual Fund Operating Expenses”) exceed 1.25% of the Fund’s average daily net assets for a particular fiscal year of the Fund, the Adviser will reduce the Management Fee and/or Other Expenses otherwise payable to the Adviser with respect to the Fund for the fiscal year by an amount equal to such excess, and/or the Adviser shall reimburse the Fund by the amount of such excess. This agreement is in effect through August 31, 2013. Without this agreement, expenses could be higher. If the Adviser foregoes any fees and/or reimburses the Fund pursuant to this letter agreement with respect to a particular fiscal year, then the Adviser shall be entitled to recover from the Fund the amount foregone or reimbursed to the extent Designated Annual Fund Operating Expenses are less than 1.25% of the Fund’s average daily net assets during any fiscal year following such fiscal year. |
| *** | Indices are not actively managed and do not reflect any deduction for fees, expenses or taxes. It is not possible to invest directly in an index. |
Semi-Annual Report | October 31, 2012 | 7 |
Table of Contents
Fund Overview | ||
October 31, 2012 (Unaudited) |
Performance of $10,000 Initial Investment (for the period ended October 31, 2012)
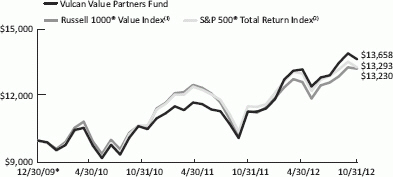
The chart above represents historical performance of a hypothetical investment of $10,000 in the Fund since inception. Past performance does not guarantee future results. This chart does not reflect the deduction of taxes that a shareholder would pay on Fund distributions or the redemption of Fund shares.
| * | Fund Inception date of 12/30/09. |
| (1) | The Russell 1000® Value Index measures the performance of the large-cap value segment of the U.S. equity universe. It includes those Russell 1000® companies with lower price-to-book ratios and lower expected growth values. |
| (2) | The S&P 500® Total Return Index is an unmanaged index of 500 common stocks chosen for market size, liquidity and industry group representation. It is a market-value weighted index. |
Indices are not actively managed and do not reflect any deduction for fees, expenses or taxes. It is not possible to invest directly in an index.
Investing in the Fund is subject to investment risks, including possible loss of the principal amount invested.
Industry Allocation (as a % of Net Assets)†
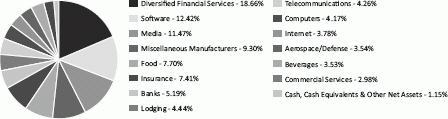
| † | Chart presents indicative values only. |
8 | www.vulcanvaluepartners.com |
Table of Contents
| Disclosure of Fund Expenses | ||
| October 31, 2012 (Unaudited) |
As a shareholder of the Vulcan Value Partners Fund (the “Fund”), you will incur two types of costs: (1) transaction costs, including applicable redemption fees; and (2) ongoing costs, including management fees and other Fund expenses. The following examples are intended to help you understand your ongoing costs (in dollars) of investing in the Fund and to compare these costs with the ongoing costs of investing in other mutual funds. The examples are based on an investment of $1,000 invested on May 1, 2012 and held until October 31, 2012.
Actual Expenses. The first line of each table below provides information about actual account values and actual expenses. You may use the information in this line, together with the amount you invested, to estimate the expenses that you paid over the period. Simply divide your account value by $1,000 (for example, an $8,600 account value divided by $1,000 = 8.6), then multiply the result by the number in the first line under the heading “Expenses Paid During Period” to estimate the expenses you paid on your account during this period.
Hypothetical Example for Comparison Purposes. The second line of the table below provides information about hypothetical account values and hypothetical expenses based on the Fund’s actual expense ratio and an assumed rate of return of 5% per year before expenses, which is not the Fund’s actual return. The hypothetical account values and expenses may not be used to estimate the actual ending account balance or expenses you paid for the period. You may use this information to compare the ongoing costs of investing in the Fund and other mutual funds. To do so, compare this 5% hypothetical example with the 5% hypothetical examples that appear in the shareholder reports of the other funds. The expenses shown in the table are meant to highlight ongoing Fund costs only and do not reflect transaction fees, such as redemption fees or exchange fees. Therefore, the second line of each table below is useful in comparing ongoing costs only, and may not help you determine the relative total costs of owning different funds. In addition, if these transactional costs were included, your costs would have been higher.
Beginning Account 5/1/12 | Ending Account 10/31/12 | Expense Ratio(a) | Expenses Paid During period 5/1/12 - 10/31/12(b) | |||||||
Actual | $ 1,000.00 | $ 1,034.50 | 1.24% | $ 6.36 | ||||||
Hypothetical | $ 1,000.00 | $ 1,018.95 | 1.24% | $ 6.31 | ||||||
| (a) | The Fund’s expense ratios have been annualized based on the Fund’s most recent fiscal half-year expenses. |
| (b) | Expenses are equal to the Fund’s annualized expense ratio, multiplied by the average account value over the period, multiplied by the number of days in the most recent fiscal half-year (184)/365. |
Semi-Annual Report | October 31, 2012 | 9 |
Table of Contents
Fund Overview | ||
October 31, 2012 (Unaudited) |
VULCAN VALUE PARTNERS SMALL CAP FUND
Average Annual Total Returns (as of 10/31/2012)
1 Year | Since Inception* | Expense Ratios | ||||||||||
| Gross | Net** | |||||||||||
Vulcan Value Partners Small Cap Fund | 24.91% | 16.66% | 1.52% | 1.37% | ||||||||
Russell 2000® Value Index*** | 14.47% | 9.99% | ||||||||||
Russell 2000® Index*** | 12.08% | 10.91% | ||||||||||
Performance data quoted represents past performance. Past performance does not guarantee future results. Investment return and principal value of an investment will fluctuate so that an investor’s shares, when sold or redeemed, may be worth more or less than the original cost. The Fund imposes a 2.00% redemption fee on shares held for less than 90 days. Current performance data may be higher or lower than actual data quoted. For the most current month-end performance data, please call 1-877-421-5078.
The table does not reflect the deduction of taxes that a shareholder would pay on Fund distributions or the redemption of Fund shares.
Subject to investment risks, including possible loss of the principal amount invested.
| * | Fund Inception date of 12/30/09. |
| ** | Vulcan Value Partners, LLC (“Vulcan” or the “Adviser”) has given a contractual agreement to the Fund that to the extent the Total Annual Fund Operating Expenses (as defined in Item 3 of Form N-1A) with respect to the Fund (exclusive of Acquired Fund Fees and Expenses (if any), brokerage expenses, interest expense, taxes and extraordinary expenses) (“Designated Annual Fund Operating Expenses”) exceed 1.25% of such Fund’s average daily net assets for a particular fiscal year of the Fund, the Adviser will reduce the Management Fee and/or Other Expenses otherwise payable to the Adviser with respect to the Fund for such fiscal year by an amount equal to such excess, and/or the Adviser shall reimburse the Fund by the amount of such excess. This agreement is in effect through August 31, 2013. Without this agreement, expenses could be higher. If the Adviser foregoes any fees and/or reimburses the Fund pursuant to this letter agreement with respect to a particular fiscal year, then the Adviser shall be entitled to recover from the Fund the amount foregone or reimbursed to the extent Designated Annual Fund Operating Expenses are less than 1.25% of the Fund’s average daily net assets during any fiscal year following such fiscal year. |
| *** | Indices are not actively managed and do not reflect any deduction for fees, expenses or taxes. It is not possible to invest directly in an index. |
10 | www.vulcanvaluepartners.com |
Table of Contents
| Fund Overview | ||
| October 31, 2012 (Unaudited) |
Performance of $10,000 Initial Investment (for the period ended October 31, 2012)
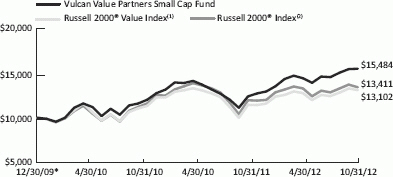
The chart above represents historical performance of a hypothetical investment of $10,000 in the Fund since inception. Past performance does not guarantee future results. This chart does not reflect the deduction of taxes that a shareholder would pay on Fund distributions or the redemption of Fund shares.
| * | Fund Inception date of 12/30/09. |
| (1) | The Russell 2000® Value Index measures the performance of small-cap value segment of the U.S. equity universe. It includes those Russell 2000® companies with lower price-to-book ratios and lower forecasted growth values. |
| (2) | The Russell 2000® Index measures the performance of the small-cap segment of the U.S. equity universe. The Russell 2000® Index is a subset of the Russell 3000® Index representing approximately 8% of the total market capitalization of that index. It includes approximately 2,000 of the smallest securities based on a combination of their market cap and current index membership. |
Indices are not actively managed and do not reflect any deduction for fees, expenses or taxes. It is not possible to invest directly in an index.
Investing in the Fund is subject to investment risks, including possible loss of the principal amount invested.
Industry Allocation (as a % of Net Assets)†
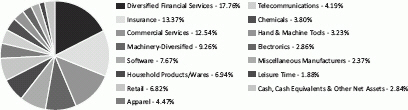
| † | Chart presents indicative values only. |
Semi-Annual Report | October 31, 2012 | 11 |
Table of Contents
Disclosure of Fund Expenses | ||
October 31, 2012 (Unaudited) |
As a shareholder of the Vulcan Value Partners Small Cap Fund (the “Fund”), you will incur two types of costs: (1) transaction costs, including applicable redemption fees; and (2) ongoing costs, including management fees and other Fund expenses. The following examples are intended to help you understand your ongoing costs (in dollars) of investing in the Fund and to compare these costs with the ongoing costs of investing in other mutual funds. The examples are based on an investment of $1,000 invested on May 1, 2012 and held until October 31, 2012.
Actual Expenses. The first line of each table below provides information about actual account values and actual expenses. You may use the information in this line, together with the amount you invested, to estimate the expenses that you paid over the period. Simply divide your account value by $1,000 (for example, an $8,600 account value divided by $1,000 = 8.6), then multiply the result by the number in the first line under the heading “Expenses Paid During Period” to estimate the expenses you paid on your account during this period.
Hypothetical Example for Comparison Purposes. The second line of the table below provides information about hypothetical account values and hypothetical expenses based on the Fund’s actual expense ratio and an assumed rate of return of 5% per year before expenses, which is not the Fund’s actual return. The hypothetical account values and expenses may not be used to estimate the actual ending account balance or expenses you paid for the period. You may use this information to compare the ongoing costs of investing in the Fund and other mutual funds. To do so, compare this 5% hypothetical example with the 5% hypothetical examples that appear in the shareholder reports of the other funds. The expenses shown in the table are meant to highlight ongoing Fund costs only and do not reflect transaction fees, such as redemption fees or exchange fees. Therefore, the second line of each table below is useful in comparing ongoing costs only, and may not help you determine the relative total costs of owning different funds. In addition, if these transactional costs were included, your costs would have been higher.
Vulcan Value Partners Small Cap Fund
Beginning Account 5/1/12 | Ending Account 10/31/12 | Expense Ratio(a) | Expenses Paid During period 5/1/12 - 10/31/12(b) | |||||||
Actual | $ 1,000.00 | $ 1,073.60 | 1.37% | $ 7.16 | ||||||
Hypothetical | $ 1,000.00 | $ 1,018.30 | 1.37% | $ 6.97 | ||||||
| (a) | The Fund’s expense ratios have been annualized based on the Fund’s most recent fiscal half-year expenses. |
| (b) | Expenses are equal to the Fund’s annualized expense ratio, multiplied by the average account value over the period, multiplied by the number of days in the most recent fiscal half-year (184)/365. |
12 | www.vulcanvaluepartners.com |
Table of Contents
| Statement of Investments | ||
| October 31, 2012 (Unaudited) |
| Shares | Value (Note 2) | |||||||
COMMON STOCKS (98.85%) | ||||||||
Communications (19.51%) | ||||||||
Internet (3.78%) | ||||||||
Google, Inc., Class A(a) | 17,414 | $ | 11,837,515 | |||||
|
| |||||||
Media (11.47%) | ||||||||
Discovery Communications, Inc., Class C(a) | 242,335 | 13,275,111 | ||||||
Time Warner, Inc. | 211,835 | 9,204,231 | ||||||
The Walt Disney Co. | 273,038 | 13,397,975 | ||||||
|
| |||||||
| 35,877,317 | ||||||||
|
| |||||||
Telecommunications (4.26%) | ||||||||
Cisco Systems, Inc. | 777,631 | 13,328,595 | ||||||
|
| |||||||
TOTAL COMMUNICATIONS | 61,043,427 | |||||||
|
| |||||||
Consumer, Cyclical (4.44%) | ||||||||
Lodging (4.44%) | ||||||||
Intercontinental Hotels Group PLC, ADR | 564,402 | 13,895,587 | ||||||
|
| |||||||
TOTAL CONSUMER, CYCLICAL | 13,895,587 | |||||||
|
| |||||||
Consumer, Non-cyclical (14.21%) | ||||||||
Beverages (3.53%) | ||||||||
The Coca-Cola Co. | 297,420 | 11,058,075 | ||||||
|
| |||||||
Commercial Services (2.98%) | ||||||||
Mastercard, Inc., Class A | 20,220 | 9,320,005 | ||||||
|
| |||||||
Food (7.70%) | ||||||||
TESCO PLC | 2,783,546 | 14,669,287 | ||||||
Unilever NV, New York Registry Shares | 256,721 | 9,419,094 | ||||||
|
| |||||||
| 24,088,381 | ||||||||
|
| |||||||
TOTAL CONSUMER, NON-CYCLICAL | 44,466,461 | |||||||
|
| |||||||
Financials (31.26%) | ||||||||
Banks (5.19%) | ||||||||
The Bank of New York Mellon Corp. | 657,647 | 16,250,458 | ||||||
|
| |||||||
Diversified Financial Services (18.66%) | ||||||||
CME Group, Inc. | 267,695 | 14,972,182 | ||||||
Franklin Resources, Inc. | 119,289 | 15,245,134 | ||||||
The NASDAQ OMX Group, Inc. | 595,036 | 14,167,807 | ||||||
Semi-Annual Report | October 31, 2012 | 13 |
Table of Contents
| Statement of Investments | Vulcan Value Partners Fund | |
October 31, 2012 (Unaudited) |
| Shares | Value (Note 2) | ||||||
Diversified Financial Services (continued) | ||||||||
Visa, Inc., Class A | 100,949 | $ | 14,007,683 | |||||
|
| |||||||
| 58,392,806 | ||||||||
|
| |||||||
Insurance (7.41%) | ||||||||
The Chubb Corp. | 116,792 | 8,990,648 | ||||||
Everest Re Group, Ltd. | 127,720 | 14,183,306 | ||||||
|
| |||||||
| 23,173,954 | ||||||||
|
| |||||||
TOTAL FINANCIALS | 97,817,218 | |||||||
|
| |||||||
Industrials (12.84%) | ||||||||
Aerospace/Defense (3.54%) | ||||||||
United Technologies Corp. | 141,814 | 11,084,182 | ||||||
|
| |||||||
Miscellaneous Manufacturers (9.30%) | ||||||||
Dover Corp. | 252,251 | 14,686,053 | ||||||
Parker Hannifin Corp. | 183,380 | 14,424,671 | ||||||
|
| |||||||
| 29,110,724 | ||||||||
|
| |||||||
TOTAL INDUSTRIALS | 40,194,906 | |||||||
|
| |||||||
Technology (16.59%) | ||||||||
Computers (4.17%) | ||||||||
Apple, Inc. | 21,935 | 13,053,519 | ||||||
|
| |||||||
Software (12.42%) | ||||||||
Check Point Software Technologies, Ltd.(a) | 246,094 | 10,958,566 | ||||||
Microsoft Corp. | 479,931 | 13,694,831 | ||||||
Oracle Corp. | 457,091 | 14,192,675 | ||||||
|
| |||||||
| 38,846,072 | ||||||||
|
| |||||||
TOTAL TECHNOLOGY | 51,899,591 | |||||||
|
| |||||||
TOTAL COMMON STOCKS (Cost $280,115,441) | 309,317,190 | |||||||
| ||||||||
14 | www.vulcanvaluepartners.com |
Table of Contents
Vulcan Value Partners Fund | Statement of Investments | |
| October 31, 2012 (Unaudited) |
| 7-Day Yield | Shares | Value (Note 2) | |||||||
SHORT TERM INVESTMENTS (0.91%) | ||||||||||
Money Market Fund (0.91%) | ||||||||||
Dreyfus Treasury Prime Cash Management Fund, Institutional Shares | 0.007% | 2,831,603 | $ | 2,831,603 | ||||||
|
| |||||||||
TOTAL SHORT TERM INVESTMENTS (Cost $2,831,603) | 2,831,603 | |||||||||
| ||||||||||
TOTAL INVESTMENTS (99.76%) (Cost $282,947,044) | $ | 312,148,793 | ||||||||
Other Assets In Excess Of Liabilities (0.24%) | 752,077 | |||||||||
| ||||||||||
NET ASSETS (100.00%) | $ | 312,900,870 | ||||||||
| ||||||||||
| (a) | Non-Income Producing Security. |
Common Abbreviations:
ADR - American Depositary Receipt.
Ltd. - Limited.
NV - Naamloze Vennootschap is the Dutch term for a public limited liability corporation.
PLC - Public Limited Company.
Holdings are subject to change.
For Fund compliance purposes, the Fund’s industry classifications refer to any one or more of the industry sub-classifications used by one or more widely recognized market indexes or ratings group indexes, and/or as defined by Fund management. This definition may not apply for purposes of this report, which may combine industry sub-classifications for reporting ease. Industries are shown as a percent of net assets. These industry classifications are based on third party definitions. The definitions are industry terms and do not reflect the legal status of any of the investments or the companies in which the Fund has invested.
See Accompanying Notes to Financial Statements.
| ||
Semi-Annual Report | October 31, 2012 | 15 |
Table of Contents
| Statement of Investments | Vulcan Value Partners Small Cap Fund | |
| October 31, 2012 (Unaudited) |
| Shares | Value (Note 2) | |||||||
COMMON STOCKS (97.16%) | ||||||||
Basic Materials (3.80%) | ||||||||
Chemicals (3.80%) | ||||||||
KMG Chemicals, Inc. | 323,298 | $ | 5,521,930 | |||||
|
| |||||||
TOTAL BASIC MATERIALS | 5,521,930 | |||||||
|
| |||||||
Communications (4.19%) | ||||||||
Telecommunications (4.19%) | ||||||||
NeuStar, Inc., Class A(a) | 166,476 | 6,091,357 | ||||||
|
| |||||||
TOTAL COMMUNICATIONS | 6,091,357 | |||||||
|
| |||||||
Consumer, Cyclical (13.17%) | ||||||||
Apparel (4.47%) | ||||||||
Iconix Brand Group, Inc.(a) | 351,030 | 6,497,565 | ||||||
|
| |||||||
Leisure Time (1.88%) | ||||||||
Interval Leisure Group, Inc. | 143,456 | 2,734,272 | ||||||
|
| |||||||
Retail (6.82%) | ||||||||
Jos A Bank Clothiers, Inc.(a) | 116,978 | 5,473,401 | ||||||
Nathan’s Famous, Inc.(a) | 54,943 | 1,522,470 | ||||||
Sonic Corp.(a) | 294,163 | 2,932,805 | ||||||
|
| |||||||
| 9,928,676 | ||||||||
|
| |||||||
TOTAL CONSUMER, CYCLICAL | 19,160,513 | |||||||
|
| |||||||
Consumer, Non-cyclical (19.47%) | ||||||||
Commercial Services (12.53%) | ||||||||
Heartland Payment Systems, Inc. | 239,735 | 6,252,289 | ||||||
Towers Watson & Co., Class A | 106,731 | 5,732,522 | ||||||
Universal Technical Institute, Inc. | 487,561 | 6,250,532 | ||||||
|
| |||||||
| 18,235,343 | ||||||||
|
| |||||||
Household Products/Wares (6.94%) | ||||||||
Jarden Corp. | 79,475 | 3,957,855 | ||||||
Tupperware Brands Corp. | 103,773 | 6,132,984 | ||||||
|
| |||||||
| 10,090,839 | ||||||||
|
| |||||||
TOTAL CONSUMER, NON-CYCLICAL | 28,326,182 | |||||||
|
| |||||||
16 | www.vulcanvaluepartners.com |
Table of Contents
| Vulcan Value Partners Small Cap Fund | Statement of Investments | |
| October 31, 2012 (Unaudited) |
| Shares | Value (Note 2) | |||||||
Financials (31.14%) | ||||||||
Diversified Financial Services (17.76%) | ||||||||
Eaton Vance Corp. | 244,959 | $ | 6,893,146 | |||||
Janus Capital Group, Inc. | 677,087 | 5,755,240 | ||||||
The NASDAQ OMX Group, Inc. | 268,903 | 6,402,580 | ||||||
Netspend Holdings, Inc.(a) | 633,309 | 6,782,739 | ||||||
|
| |||||||
| 25,833,705 | ||||||||
|
| |||||||
Insurance (13.38%) | ||||||||
Endurance Specialty Holdings, Ltd. | 153,848 | 6,238,537 | ||||||
Everest Re Group, Ltd. | 51,410 | 5,709,081 | ||||||
The Navigators Group, Inc.(a) | 124,105 | 6,587,493 | ||||||
ProAssurance Corp. | 10,306 | 921,356 | ||||||
|
| |||||||
| 19,456,467 | ||||||||
|
| |||||||
TOTAL FINANCIALS | 45,290,172 | |||||||
|
| |||||||
Industrials (17.72%) | ||||||||
Electronics (2.86%) | ||||||||
Ituran Location and Control, Ltd. | 337,142 | 4,167,075 | ||||||
|
| |||||||
Hand & Machine Tools (3.23%) | ||||||||
Lincoln Electric Holdings, Inc. | 108,402 | 4,701,395 | ||||||
|
| |||||||
Machinery-Diversified (9.26%) | ||||||||
Altra Holdings, Inc. | 297,312 | 5,357,562 | ||||||
Gardner Denver, Inc. | 62,780 | 4,352,537 | ||||||
IDEX Corp. | 88,264 | 3,753,868 | ||||||
|
| |||||||
| 13,463,967 | ||||||||
|
| |||||||
Miscellaneous Manufacturers (2.37%) | ||||||||
Donaldson Co., Inc. | 106,928 | 3,450,567 | ||||||
|
| |||||||
TOTAL INDUSTRIALS | 25,783,004 | |||||||
|
| |||||||
Technology (7.67%) | ||||||||
Software (7.67%) | ||||||||
Dun & Bradstreet Corp. | 71,418 | 5,787,715 | ||||||
Semi-Annual Report | October 31, 2012 | 17 |
Table of Contents
| Statement of Investments | Vulcan Value Partners Small Cap Fund | |
| October 31, 2012 (Unaudited) |
| Shares | Value (Note 2) | |||||||||||
Software (continued) | ||||||||||||
Fair Isaac Corp. | 115,124 | $ | 5,364,778 | |||||||||
|
| |||||||||||
| 11,152,493 | ||||||||||||
|
| |||||||||||
TOTAL TECHNOLOGY | 11,152,493 | |||||||||||
|
| |||||||||||
TOTAL COMMON STOCKS (Cost $132,665,942) | 141,325,651 | |||||||||||
| 7-Day Yield | Shares | Value (Note 2) | ||||||||||
SHORT TERM INVESTMENTS (2.80%) | ||||||||||||
Money Market Fund (2.80%) | ||||||||||||
Dreyfus Treasury Prime Cash Management | 0.007 | % | 4,080,979 | 4,080,979 | ||||||||
|
| |||||||||||
TOTAL SHORT TERM INVESTMENTS (Cost $4,080,979) | 4,080,979 | |||||||||||
TOTAL INVESTMENTS (99.96%) (Cost $136,746,921) | $ | 145,406,630 | ||||||||||
Other Assets In Excess Of Liabilities (0.04%) | 56,175 | |||||||||||
NET ASSETS (100.00%) | $ | 145,462,805 | ||||||||||
| (a) | Non-Income Producing Security. |
Common Abbreviations:
Ltd. - Limited.
Holdings are subject to change.
For Fund compliance purposes, the Fund’s industry classifications refer to any one or more of the industry sub-classifications used by one or more widely recognized market indexes or ratings group indexes, and/or as defined by Fund management. This definition may not apply for purposes of this report, which may combine industry sub-classifications for reporting ease. Industries are shown as a percent of net assets. These industry classifications are based on third party definitions. The definitions are industry terms and do not reflect the legal status of any of the investments or the companies in which the Fund has invested.
See Accompanying Notes to Financial Statements.
| ||
18 | www.vulcanvaluepartners.com |
Table of Contents
| Statements of Assets and Liabilities | ||
| October 31, 2012 (Unaudited) |
Vulcan Value Partners Fund | Vulcan Value Partners Small Cap Fund | |||||||
ASSETS: | ||||||||
Investments, at value | $ | 312,148,793 | $ | 145,406,630 | ||||
Receivable for shares sold | 942,380 | 717,549 | ||||||
Dividends receivable | 117,346 | 49,050 | ||||||
Other assets | 9,121 | 8,163 | ||||||
Total assets | 313,217,640 | 146,181,392 | ||||||
LIABILITIES: | ||||||||
Payable to custodian | – | 514,384 | ||||||
Payable for shares redeemed | 290 | 46,231 | ||||||
Payable to adviser | 264,676 | 115,313 | ||||||
Payable for administration fees | 14,262 | 5,859 | ||||||
Payable for transfer agency fees | 8,559 | 11,132 | ||||||
Payable for audit fees | 14,354 | 14,800 | ||||||
Payable to trustees | 2,333 | 1,384 | ||||||
Accrued expenses and other liabilities | 12,296 | 9,484 | ||||||
Total liabilities | 316,770 | 718,587 | ||||||
NET ASSETS | $ | 312,900,870 | $ | 145,462,805 | ||||
NET ASSETS CONSIST OF: | ||||||||
Paid-in capital | $ | 279,643,747 | $ | 135,675,705 | ||||
Undistributed net investment income | 1,288,951 | 53,390 | ||||||
Accumulated net realized gain on investments | 2,766,423 | 1,074,001 | ||||||
Net unrealized appreciation in value of investments | 29,201,749 | 8,659,709 | ||||||
NET ASSETS | $ | 312,900,870 | $ | 145,462,805 | ||||
INVESTMENTS, AT COST | $ | 282,947,044 | $ | 136,746,921 | ||||
PRICING OF SHARES: | ||||||||
Net Asset Value, offering and redemption price per share | $ | 13.48 | $ | 14.15 | ||||
Shares of beneficial interest outstanding (unlimited number of shares, no par value common stock authorized) | 23,205,600 | 10,279,135 | ||||||
See Accompanying Notes to Financial Statements.
| ||
Semi-Annual Report | October 31, 2012 | 19 |
Table of Contents
For the Six Months Ended October 31, 2012 (Unaudited) |
Vulcan Value Partners Fund | Vulcan Value Partners Small Cap Fund | |||||||
INVESTMENT INCOME: | ||||||||
Dividends | $ | 2,595,119 | $ | 515,554 | ||||
Foreign taxes withheld | (13,995) | (16,489) | ||||||
Total investment income | 2,581,124 | 499,065 | ||||||
EXPENSES: | ||||||||
Investment advisory fees (Note 6) | 1,116,265 | 455,200 | ||||||
Administrative fees | 88,529 | 28,882 | ||||||
Transfer agency fees | 26,788 | 29,322 | ||||||
Legal and audit fees | 14,386 | 11,342 | ||||||
Custodian fees | 6,370 | 6,315 | ||||||
Trustees’ fees and expenses | 7,909 | 2,612 | ||||||
Repayment of previously waived fees | 101,609 | – | ||||||
Other | 25,712 | 19,436 | ||||||
Total expenses before waiver | 1,387,568 | 553,109 | ||||||
Less fees waived/reimbursed by investment advisor | – | (54,705) | ||||||
Total net expenses | 1,387,568 | 498,404 | ||||||
NET INVESTMENT INCOME | 1,193,556 | 661 | ||||||
Net realized gain on investments | 2,766,505 | 1,248,024 | ||||||
Net change in unrealized appreciation of investments | 7,472,956 | 4,031,601 | ||||||
NET REALIZED AND UNREALIZED GAIN ON INVESTMENTS | 10,239,461 | 5,279,625 | ||||||
NET INCREASE IN NET ASSETS RESULTING FROM OPERATIONS | $ | 11,433,017 | $ | 5,280,286 | ||||
See Accompanying Notes to Financial Statements.
| ||
20 | www.vulcanvaluepartners.com |
Table of Contents
| Statements of Changes in Net Assets | ||
See Accompanying Notes to Financial Statements.
| ||
Semi-Annual Report | October 31, 2012 | 21 |
Table of Contents
Statements of Changes in Net Assets | ||
See Accompanying Notes to Financial Statements.
| ||
22 | www.vulcanvaluepartners.com |
Table of Contents
| Financial Highlights | ||
| For a share outstanding throughout each period presented. |
For the Six Months Ended October 31, 2012 (Unaudited) | For the Year Ended April 30, 2012 | For the Year Ended April 30, 2011 | For the Period December 30, 2009 (Inception) to April 30, 2010 | |||||
NET ASSET VALUE, BEGINNING OF PERIOD | $ 13.03 | $ 11.66 | $ 10.57 | $ 10.00 | ||||
INCOME/(LOSS) FROM OPERATIONS: | ||||||||
Net investment income/(loss) | 0.07(a) | 0.02(a) | 0.01(a) | (0.00)(b) | ||||
Net realized and unrealized gain on investments | 0.38 | 1.45 | 1.13 | 0.57 | ||||
Total from investment operations | 0.45 | 1.47 | 1.14 | 0.57 | ||||
LESS DISTRIBUTIONS TO SHAREHOLDERS: | ||||||||
From net investment income | – | (0.01) | (0.01) | – | ||||
Distributions from net realized gain on investments | – | (0.09) | (0.04) | – | ||||
Total distributions | – | (0.10) | (0.05) | – | ||||
Redemption fees added to paid-in capital (Note 5) | 0.00(c) | 0.00(c) | 0.00(c) | 0.00(c) | ||||
Increase in net asset value | 0.45 | 1.37 | 1.09 | 0.57 | ||||
NET ASSET VALUE, END OF PERIOD | $ 13.48 | $ 13.03 | $ 11.66 | $ 10.57 | ||||
Total return | 3.45%(d) | 12.73% | 10.82% | 5.70%(d) | ||||
RATIOS AND SUPPLEMENTAL DATA: | ||||||||
Net assets, end of period (000’s) | $ 312,901 | $ 125,087 | $ 48,757 | $ 12,807 | ||||
Ratio of expenses to average net assets without fee waivers/reimbursements | 1.24%(e) | 1.51% | 2.01% | 4.97%(e) | ||||
Ratio of expenses to average net assets including fee waivers/reimbursements | 1.24%(e)(f) | 1.50% | 1.50% | 1.50%(e) | ||||
Net investment income/(loss) to average net assets including fee waivers/reimbursements | 1.07%(e) | 0.16% | 0.07% | (0.06%)(e) | ||||
Portfolio turnover rate | 12%(d) | 49% | 44% | 24%(d) | ||||
| (a) | Per share numbers have been calculated using the average shares method. |
| (b) | Less than $(0.005) per share. |
| (c) | Less than $0.005 per share. |
| (d) | Not annualized. |
| (e) | Annualized. |
| (f) | Effective September 1, 2012, the net expense ratio limitation changed from 1.50% to 1.25%. |
See Accompanying Notes to Financial Statements.
| ||
Semi-Annual Report | October 31, 2012 | 23 |
Table of Contents
Financial Highlights | Vulcan Value Partners Small Cap Fund | |
For a share outstanding throughout the periods presented. |
For the Six Months Ended October 31, 2012 (Unaudited) | For the Year Ended April 30, 2012 | For the Year Ended April 30, 2011 | For the Period December 30, 2009 (Inception) to April 30, 2010 | |||||||||||||||||||||
NET ASSET VALUE, BEGINNING OF PERIOD | $ 13.18 | $ 13.72 | $ 11.60 | $ 10.00 | ||||||||||||||||||||
INCOME/(LOSS) FROM OPERATIONS: | ||||||||||||||||||||||||
Net investment income/(loss) | 0.00(a)(c) | 0.02(a) | (0.09)(a) | (0.00)(b) | ||||||||||||||||||||
Net realized and unrealized gain on investments | 0.97 | 0.17 | 2.55 | 1.60 | ||||||||||||||||||||
Total from investment operations | 0.97 | 0.19 | 2.46 | 1.60 | ||||||||||||||||||||
LESS DISTRIBUTIONS TO SHAREHOLDERS: | ||||||||||||||||||||||||
Distributions from net realized gain on investments | – | (0.73) | (0.34) | – | ||||||||||||||||||||
Total distributions | – | (0.73) | (0.34) | – | ||||||||||||||||||||
Redemption fees added to paid-in capital (Note 5) | 0.00 (c) | 0.00(c) | 0.00(c) | – | ||||||||||||||||||||
Increase/(decrease) in net asset value | 0.97 | (0.54) | 2.12 | 1.60 | ||||||||||||||||||||
NET ASSET VALUE, END OF PERIOD | $ 14.15 | $ 13.18 | $ 13.72 | $ 11.60 | ||||||||||||||||||||
Total return | 7.36%(d) | 2.10% | 21.75% | 16.00%(d) | ||||||||||||||||||||
RATIOS AND SUPPLEMENTAL DATA: | ||||||||||||||||||||||||
Net assets, end of period (000’s) | $ 145,463 | $ 40,103 | $ 36,363 | $ 7,225 | ||||||||||||||||||||
Ratio of expenses to average net assets without fee waivers/reimbursements | 1.52%(e) | 1.86% | 2.50% | 7.31%(e) | ||||||||||||||||||||
Ratio of expenses to average net assets including fee waivers/reimbursements | 1.37%(e)(f) | 1.50% | 1.50% | 1.50%(e) | ||||||||||||||||||||
Net investment income/(loss) to average net assets including fee waivers/reimbursements | 0.00%(e) | 0.15% | (0.71%) | (0.57%)(e) | ||||||||||||||||||||
Portfolio turnover rate | 12%(d) | 57% | 60% | 33%(d) | ||||||||||||||||||||
| (a) | Per share numbers have been calculated using the average shares method. |
| (b) | Less than $(0.005) per share. |
| (c) | Less than $0.005 per share. |
| (d) | Not annualized. |
| (e) | Annualized. |
| (f) | Effective September 1, 2012, the net expense ratio limitation changed from 1.50% to 1.25%. |
See Accompanying Notes to Financial Statements.
| ||
24 | www.vulcanvaluepartners.com |
Table of Contents
| Notes to Financial Statements | ||
| October 31, 2012 (Unaudited) |
1. ORGANIZATION
Financial Investors Trust (the “Trust”) is organized as a Delaware statutory trust and is registered as an open-end management investment company under the Investment Company Act of 1940, as amended (“1940 Act”). As of October 31, 2012, the Trust had 24 registered funds. This semi-annual report describes the Vulcan Value Partners Fund and Vulcan Value Partners Small Cap Fund (each a “Fund” and collectively, the “Funds”). The Vulcan Value Partners Fund seeks to achieve long-term capital appreciation by investing primarily in publicly traded mid- and large-capitalization U.S. companies believed to be both undervalued and possessing a sustainable competitive advantage. The Vulcan Value Partners Small Cap Fund seeks to achieve long-term capital appreciation by investing primarily in publicly traded small-capitalization U.S. companies believed to be both undervalued and possessing a sustainable competitive advantage.
2. SIGNIFICANT ACCOUNTING POLICIES
The following is a summary of significant accounting policies consistently followed by the Funds. These policies are in conformity with U.S. generally accepted accounting principles (“GAAP”).
The preparation of financial statements in conformity with GAAP requires management to make certain estimates and assumptions that affect the reported amounts in the financial statements during the reporting period. Management believes the estimates and security valuations are appropriate; however, actual results may differ from those estimates, and the security valuations reflected in the financial statements may differ from the value the Funds ultimately realize upon sale of the securities.
Investment Valuation: The Funds generally value their securities based on market prices determined at the close of regular trading on the New York Stock Exchange (“NYSE”), normally 4:00 p.m. Eastern Time, on each day the NYSE is open for trading.
For equity securities and mutual funds that are traded on an exchange, the market price is usually the closing sale or official closing price on that exchange. In the case of equity securities not traded on an exchange, or if such closing prices are not otherwise available, the securities are valued at the mean of the most recent bid and ask prices on such day.
The market price for debt obligations is generally the price supplied by an independent third-party pricing service approved by the Board of Trustees (the “Board”), which may use a matrix, formula or other objective method that takes into consideration quotations from dealers, market transactions in comparable investments, market indices and yield curves. If vendors are unable to supply a price, or if the price supplied is deemed to be unreliable, the market price may be determined using quotations received from one or more brokers–dealers that make a market in the security. Short-term debt obligations that will mature in 60 days or less are valued at amortized cost, unless it is determined that using this method would not reflect an investment’s fair value. Investments in non-exchange traded funds are fair valued at their respective net asset values.
Redeemable securities issued by open-end registered investment companies are valued at the investment company’s applicable net asset value.
Semi-Annual Report | October 31, 2012 | 25 |
Table of Contents
Notes to Financial Statements | ||
October 31, 2012 (Unaudited) |
When such prices or quotations are not available, or when the Fair Value Committee appointed by the Board believes that they are unreliable, securities may be priced using fair value procedures approved by the Board. The Funds may also use fair value procedures if the Fair Value Committee determines that a significant event has occurred between the time at which a market price is determined and the time at which the Funds’ NAV is calculated. In particular, the value of non-U.S. securities may be materially affected by events occurring after the close of the foreign exchange on which they are traded, but before the Funds prices its shares.
Valuing securities at fair value involves greater reliance on judgment than valuation of securities based on readily available market quotations. A fund that uses fair value to price securities may value those securities higher or lower than another fund using market quotations or its own fair value methodologies to price the same securities. There can be no assurance that the Funds could obtain the fair value assigned to a security if it were to sell the security at approximately the time at which each Fund determines its net asset value, and the difference between fair value and the price of the securities may be material.
Fair Value Measurements: A three-tier hierarchy has been established to classify fair value measurements for disclosure purposes. Inputs refer broadly to the assumptions that market participants would use in pricing the asset or liability, including assumptions about risk. Inputs may be observable or unobservable. Observable inputs are inputs that reflect the assumptions market participants would use in pricing the asset or liability that are developed based on market data obtained from sources independent of the reporting entity. Unobservable inputs are inputs that reflect the reporting entity’s own assumptions about the assumptions market participants would use in pricing the asset or liability that are developed based on the best information available. Various inputs are used in determining the value of each Fund’s investments as of the reporting period end. The designated input levels are not necessarily an indication of the risk or liquidity associated with these investments. These inputs are categorized in the following hierarchy under applicable financial accounting standards:
Level 1 – | Unadjusted quoted prices in active markets for identical investments, unrestricted assets or liabilities that the Funds have the ability to access at the measurement date; | |
Level 2 – | Quoted prices which are not active, quoted prices for similar assets or liabilities in active markets or inputs other than quoted prices that are observable (either directly or indirectly) for substantially the full term of the asset or liability; and | |
Level 3 – | Significant unobservable prices or inputs (including the Funds’ own assumptions in determining the fair value of investments) where there is little or no market activity for the asset or liability at the measurement date. | |
26 | www.vulcanvaluepartners.com |
Table of Contents
| Notes to Financial Statements | ||
| October 31, 2012 (Unaudited) |
The following is a summary of each input used to value each Fund’s investments as of October 31, 2012.
Vulcan Value Partners Fund:
| Investments in Securities at Value | Level 1 - Unadjusted Quoted Prices | Level 2 - Other Significant Observable Inputs | Level 3 - Significant Unobservable Inputs | Total | ||||||||||||
Common Stocks(a) | $ | 309,317,190 | $ | – | $ | – | $ | 309,317,190 | ||||||||
Short Term Investments | 2,831,603 | – | – | 2,831,603 | ||||||||||||
TOTAL | $ | 312,148,793 | $ | – | $ | – | $ | 312,148,793 | ||||||||
Vulcan Value Partners Small Cap Fund:
| Investments in Securities at Value | Level 1 - Unadjusted Quoted Prices | Level 2 - Other Significant Observable Inputs | Level 3 - Significant Unobservable Inputs | Total | ||||||||||||
Common Stocks(a) | $ | 141,325,651 | $ | – | $ | – | $ | 141,325,651 | ||||||||
Short Term Investments | 4,080,979 | – | – | 4,080,979 | ||||||||||||
TOTAL | $ | 145,406,630 | $ | – | $ | – | $ | 145,406,630 | ||||||||
| (a) | For detailed descriptions, see the accompanying Statements of Investments. |
The Funds recognize transfers between levels as of the beginning of the annual period in which the transfer occurred. For the six months ended October 31, 2012, the Funds did not have any transfers between Level 1 and Level 2 securities. For the six months ended October 31, 2012, the Funds did not have any securities that used significant unobservable inputs (Level 3) in determining fair value. Therefore, a reconciliation of assets in which significant unobservable inputs (Level 3) were used in determining fair value is not applicable.
Investment Transactions: Investment transactions are accounted for on the date the investments are purchased or sold (trade date). Realized gains and losses from investment transactions are reported on an identified cost basis, which is the same basis the Funds use for federal income tax purposes. Interest income, which includes accretion of discounts, is accrued and recorded as earned. Dividend income is recognized on the ex-dividend date or for certain foreign securities, as soon as information is available to the Funds.
Foreign Securities: The Funds may directly purchase securities of foreign issuers. Investing in securities of foreign issuers involves special risks not typically associated with investing in securities of U.S. issuers. The risks include possible reevaluation of currencies, the inability to repatriate foreign currency, less complete financial information about companies and possible future adverse political and economic developments. Moreover, securities of many foreign issuers and their markets may be less liquid and their prices more volatile than those of securities of comparable U.S. issuers.
Semi-Annual Report | October 31, 2012 | 27 |
Table of Contents
Notes to Financial Statements | ||
October 31, 2012 (Unaudited) |
Trust Expenses: Some expenses of the Trust can be directly attributed to the Funds. Expenses which cannot be directly attributed are apportioned among all funds in the Trust based on average net assets of each fund.
Fund and Class Expenses: Expenses that are specific to a Fund or class of shares of a Fund are charged directly to that Fund or share class. Expenses that are common to all Funds generally are allocated among the Funds in proportion to their average daily net assets.
Federal Income Taxes: Each Fund complies with the requirements under Subchapter M of the Internal Revenue Code of 1986, as amended, applicable to regulated investment companies and intends to distribute substantially all of its net taxable income and net capital gains, if any, each year. The Funds are not subject to income taxes to the extent such distributions are made.
During the six months ended October 31, 2012, the Funds did not have liability for any unrecognized tax benefits in the accompanying financial statements. The Funds file income tax returns in the U.S. federal jurisdiction and the State of Colorado.
Distributions to Shareholders: Each Fund normally pays dividends and distributes capital gains, if any, on an annual basis. Income dividend distributions are derived from interest and other income each Fund receives from its investments, including distributions of short-term capital gains. Capital gain distributions are derived from gains realized when each Fund sells a security it has owned for more than a year. Each Fund may make additional distributions and dividends at other times if the portfolio manager believes doing so may be necessary for each Fund to avoid or reduce taxes. Net investment income/(loss) and net realized gain/(loss) may differ for financial statement and tax purposes.
3. TAX BASIS INFORMATION:
Tax Basis of Distributions to Shareholders: The character of distributions made during the year from net investment income or net realized gains may differ from its ultimate characterization for federal income tax purposes. Also, due to the timing of dividend distributions, the fiscal year in which amounts are distributed may differ from the fiscal year in which the income or realized gain were recorded by each Fund. There we no distributions paid by the Funds during the six months ended October 31, 2012.
As of October 31, 2012, the aggregate cost of investments, gross unrealized appreciation/ (depreciation) and net unrealized appreciation for Federal tax purposes was as follows:
| Fund | Cost of Investments | Gross Unrealized Appreciation | Gross Unrealized (Depreciation) | Net Unrealized Appreciation | ||||||||||||
Vulcan Value Partners Fund | $ | 283,153,296 | $ | 31,669,590 | $ | (2,674,093) | $ | 28,995,497 | ||||||||
Vulcan Value Partners Small Cap Fund | $ | 136,854,704 | $ | 11,351,127 | $ | (2,799,201) | $ | 8,551,926 | ||||||||
Capital Loss Carryforwards: Post enactment of the RIC Modernization Act short-term capital losses for Vulcan Value Partners Small Cap Fund in the amount of $105,658 are carried forward to the next fiscal year.
28 | www.vulcanvaluepartners.com |
Table of Contents
| Notes to Financial Statements | ||
| October 31, 2012 (Unaudited) |
Post-Enactment Capital Losses arise in fiscal years beginning after December 22, 2010, and exclude any elective late-year capital losses (during the period November 1st to December 31st) deferred for the current fiscal year. As a result of the enactment of the Regulated Investment Company Act of 2010, pre-enactment capital loss carryforwards may be more likely to expire unused. Additionally, post-enactment capital losses that are carried forward will not expire and retain their character as either short-term or long-term losses rather than being considered all short-term as under previous law.
4. SECURITIES TRANSACTIONS
The cost of purchases and proceeds from sales of securities (excluding short-term securities) during the six months ended October 31, 2012 was as follows:
| Fund | Purchase of Securities | Proceeds From Sales of Securities | ||||||
Vulcan Value Partners Fund | $ | 208,171,189 | $ | 25,961,984 | ||||
Vulcan Value Partners Small Cap Fund | 106,695,152 | 8,813,435 | ||||||
5. CAPITAL SHARE TRANSACTIONS
Shares redeemed within 90 days of purchase may incur a 2% short-term redemption fee deducted from the redemption amount. The Vulcan Value Partners Fund and the Vulcan Value Partners Small Cap Fund retained $721 and $1,076, respectively, for the six months ended October 31, 2012, which is reflected in the “Cost of shares redeemed, net of redemption fees” in the Statement of Changes in Net Assets.
Transactions in shares of capital stock for the dates listed below were as follows:
Vulcan Value Partners Fund
| For the Six Months Ended October 31, 2012 (Unaudited) | For the Year Ended April 30, 2012 | |||||||
Shares Sold | 14,436,652 | 5,573,082 | ||||||
Shares Issued in Reinvestment of Dividends | – | 75,929 | ||||||
Less Shares Redeemed | (834,041) | (227,861) | ||||||
Net Increase | 13,602,611 | 5,421,151 | ||||||
Semi-Annual Report | October 31, 2012 | 29 |
Table of Contents
Notes to Financial Statements | ||
October 31, 2012 (Unaudited) |
Vulcan Value Partners Small Cap Fund
| For the Six Months Ended October 31, 2012 (Unaudited) | For the Year Ended April 30, 2012 | |||||||
Shares Sold | 7,548,942 | 1,389,727 | ||||||
Shares Issued in Reinvestment of Dividends | – | 160,884 | ||||||
Less Shares Redeemed | (312,187 | ) | (1,158,259 | ) | ||||
Net Increase | 7,236,755 | 392,352 | ||||||
6. MANAGEMENT AND RELATED-PARTY TRANSACTIONS
Vulcan Value Partners, LLC (“Vulcan” or the “Adviser”), subject to the authority of the Board, is responsible for the overall management and administration of the Funds’ business affairs. Vulcan manages the investments of the Funds in accordance with each Fund’s investment objective, policies and limitations and investment guidelines established jointly by the Adviser and the Board. Pursuant to the Investment Advisory Agreement (the “Advisory Agreement”), the Funds pay Vulcan an annual management fee of 1.00% and 1.25% for Vulcan Value Partners Fund and Vulcan Value Partners Small Cap Fund, respectively, based on each Fund’s average daily net assets.
Vulcan has contractually agreed with the Funds to limit the amount of each Fund’s total annual expenses (exclusive of distribution and service (12b-1) fees, acquired fund fees and expenses, brokerage expenses, interest expense, taxes and extraordinary expenses) to 1.25% of each Fund’s average daily net assets. Prior to September 1, 2012, Vulcan contractually agreed with the Fund to limit the amount of each Fund’s total annual expenses to 1.50% of each Fund’s average daily net assets. This agreement is in effect through August 31, 2013 and is reevaluated on an annual basis. Without this agreement, expenses could be higher. The Adviser is permitted to recover expenses it has borne through the agreement described above to the extent that each Fund’s expenses in later periods fall below the annual rates set forth in the relevant agreement. If the Adviser foregoes any fees and/or reimburses the Funds pursuant to this agreement with respect to a particular fiscal year, then the Adviser shall be entitled to recover from the Fund the amount forgone or reimbursed to the extent Designated Annual Fund Operating Expenses are less than 1.25% and, prior to September 1, 2012, 1.50% of the Fund’s average daily net assets during any fiscal year following such fiscal year.
Pursuant to these agreements, the Funds will reimburse the Adviser for any fee waivers and expense reimbursements made by the Adviser, provided that any such reimbursements made by the Funds to the Adviser will not cause the Funds’ expense limitation to exceed expense limitations in existence at the time the expense was incurred, or at the time of the reimbursement, whichever is lower, during any fiscal year following such fiscal year.
30 | www.vulcanvaluepartners.com |
Table of Contents
| Notes to Financial Statements | ||
| October 31, 2012 (Unaudited) |
For the six months ended October 31, 2012, the fee waivers and/or reimbursements were as follows:
| Fund | Fees Waived/ Reimbursed By Advisor | Recoupment of Past Waived Fees By Advisor | Total | |||||||||
Vulcan Value Partners Fund | $ | – | $ | (101,609) | $ | (101,609) | ||||||
Vulcan Value Partners Small Cap Fund | 54,705 | – | 54,705 | |||||||||
As of October 31, 2012, the balances of recoupable expenses for each Fund were as follows:
| Fund | 2012 | 2011 | 2010 | Total | ||||||||||||
Vulcan Value Partners Fund | $ | 0 | $ | 0 | $ | 0 | $ | 0 | ||||||||
Vulcan Value Partners Small Cap Fund | 124,024 | 199,532 | 76,119 | 399,675 | ||||||||||||
Distributor: ALPS Distributors, Inc. (“ADI” or the “Distributor”) (an affiliate of ALPS Fund Services, Inc.) acts as the distributor of each Fund’s shares pursuant to a Distribution Agreement with the Trust. Shares are sold on a continuous basis by ADI as agent for the Funds, and ADI has agreed to use its best efforts to solicit orders for the sale of each Fund’s shares, although it is not obliged to sell any particular amount of shares. ADI is not entitled to any compensation for its services as Distributor. ADI is registered as a broker-dealer with the Securities and Exchange Commission.
Principal Financial Officer: ALPS receives an annual fee of $10,000 for providing Principal Financial Officer services to the Funds. Vulcan pays this fee on behalf of the Funds.
Compliance Services: ALPS provides services that assist the Funds’ Chief Compliance Officer in monitoring and testing the policies and procedures of the Trust in conjunction with requirements under Rule 38a-1 under the 1940 Act under the Chief Compliance Officer Services Agreement with the Trust. Under this Agreement, ALPS is paid an annual base fee of $60,000 and is reimbursed for certain out-of-pocket expenses. Vulcan pays this fee on behalf of the Funds.
Transfer Agent: ALPS serves as transfer, dividend paying and shareholder servicing agent for the Fund (“Transfer Agent”). ALPS is compensated based upon a $25,000 annual base fee per Fund, and annually $9 per direct open account and $7 per open account through NSCC. The Transfer Agent is also reimbursed by the Fund for certain out-of-pocket expenses.
Administrator: ALPS Fund Services, Inc. (“ALPS” and the “Administrator”) (an affiliate of ADI) serves as administrator to the Funds, and each Fund has agreed to pay expenses incurred in connection with its administrative activities. Pursuant to the Administration, Bookkeeping and Pricing Services Agreement (the “Agreement”), ALPS will provide operational services to the Funds including, but not limited to fund accounting and fund administration and generally assist in each Fund’s operations. The table below describes the administrative fee paid by the Funds to ALPS pursuant to the Agreement during the six months ended October 31, 2012:
Semi-Annual Report | October 31, 2012 | 31 |
Table of Contents
Notes to Financial Statements | ||
October 31, 2012 (Unaudited) |
Annual Administrative Fee, billed monthly, in the amount of the greater of $210,000 annual minimum through May 2012, and $231,525 minimum thereafter or:
| Average Total Net Assets | Contractual Fee | |
Between $0-$500M | 0.05% | |
$500M-$1B | 0.03% | |
Above $1B | 0.02% |
Beneficial Ownership: The beneficial ownership, either directly or indirectly, of more than 25% of the voting securities of any class a Fund creates a presumption of control of the Fund under Section 2(a)(9) of the 1940 Act. As of October 31, 2012, the following entities owned beneficially 25% or greater of the Fund’s outstanding shares. The shares are held under omnibus accounts (whereby the transactions of two or more shareholders are combined and carried in the name of the originating broker rather than designated separately).
| Fund | Name | Percentage | ||
Vulcan Value Partners Fund | JP Morgan Chase & Co. | 75.76% | ||
Vulcan Value Partners Small Cap Fund | Charles Schwab & Co. | 49.77% | ||
Vulcan Value Partners Small Cap Fund | National Financial Services Corp. | 30.93% |
7. INDEMNIFICATIONS
Under the Trust’s organizational documents, its Officers and Trustees are indemnified against certain liability arising out of the performance of their duties to the Trust. Additionally, in the normal course of business, the Trust enters into contracts with service providers that may contain general indemnification clauses which may permit indemnification to the extent permissible under applicable law. The Trust’s maximum exposure under these arrangements is unknown, as this would involve future claims that may be made against the Trust that have not yet occurred.
8. SUBSEQUENT EVENT
Effective January 1, 2013, the Adviser has agreed to reduce the management fee for Vulcan Value Partners Small Cap Fund to 1.15% annually, based on the Fund’s average daily net assets.
32 | www.vulcanvaluepartners.com |
Table of Contents
| Additional Information | ||
| October 31, 2012 (Unaudited) |
1. FUND HOLDINGS
The Funds file their complete schedule of portfolio holdings with the Securities and Exchange Commission (the “SEC”) for the first and third quarters of each fiscal year on Form N-Q within 60 days after the end of the period. Copies of the Funds’ Form N-Q are available without charge on the SEC website at http://www.sec.gov. You may also review and copy the Form N-Q at the SEC’s Public Reference Room in Washington, DC. For more information about the operation of the Public Reference Room, please call the SEC at 1-800-SEC-0330.
2. FUND PROXY VOTING POLICIES, PROCEDURES AND SUMMARIES
Each Fund’s policies and procedures used in determining how to vote proxies and information regarding how the Funds voted proxies relating to portfolio securities during the most recent prior 12-month period ending June 30 are available without charge, (1) upon request, by calling (toll-free) (866) 759-5679 and (2) on the SEC’s website at http://www.sec.gov.
Semi-Annual Report | October 31, 2012 | 33 |
Table of Contents
The Funds are neither insured nor guaranteed by the U.S. Government, the FDIC, the Federal Reserve Board or any other governmental agency or insurer.
For more information about the Funds, including a prospectus, please visit www.vulcanvaluepartners. com or call 1.877.421.5078.
This material must be accompanied or preceded by a prospectus.
Managed Accounts are available only for institutional and private clients of Vulcan Value Partners, LLC, a federally registered investment advisor. Vulcan Value Partners Funds are distributed by ALPS Distributors, Inc. Separately Managed Accounts and related investment advisory services are provided by Vulcan Value Partners, LLC, a federally regulated investment advisor. ALPS Distributors, Inc. is not affiliated with Vulcan Value Partners, LLC.
Table of Contents
| Item 2. | Code of Ethics. |
Not applicable to this Report.
| Item 3. | Audit Committee Financial Expert. |
Not applicable to this Report.
| Item 4. | Principal Accountant Fees and Services. |
Not applicable to this Report.
| Item 5. | Audit Committee of Listed Registrants. |
Not applicable to Registrant.
| Item 6. | Investments. |
| (a) | Schedule of Investments is included as part of the Reports to Stockholders filed under Item 1 of this Form N-CSR. |
| (b) | Not applicable. |
| Item 7. | Disclosure of Proxy Voting Policies and Procedures for Closed-End Management Investment Companies. |
Not applicable to Registrant.
| Item 8. | Portfolio Managers of Closed-End Management Investment Companies. |
Not applicable to Registrant.
Table of Contents
| Item 9. | Purchases of Equity Securities by Closed-End Management Investment Company and Affiliated Purchasers. |
Not applicable to Registrant.
| Item 10. | Submission of Matters to a Vote of Security Holders. |
There have been no material changes to the procedures by which shareholders may recommend nominees to the Registrant’s Board of Trustees, where those changes were implemented after the Registrant last provided disclosure in response to the requirements of Item 407(c)(2)(iv) of Regulation
S-K, or this Item.
| Item 11. | Controls and Procedures. |
| (a) | The Registrant’s principal executive officer and principal financial officer have concluded that the Registrant’s disclosure controls and procedures (as defined in Rule 30a-3(c) under the Investment Company Act of 1940, as amended) are effective based on their evaluation of these controls and procedures as of a date within 90 days of the filing date of this report. | |||
(b) | There was no change in the Registrant’s internal control over financial reporting (as defined in Rule 30a-3(d) under the Investment Company Act of 1940, as amended) that occurred during the second fiscal quarter of the period covered by this report that has materially affected, or is reasonably likely to materially affect, the Registrant’s internal control over financial reporting. | |||
| Item 12. | Exhibits. |
| (a)(1) | Not applicable to this Report. | |||||
| (a)(2) | The certifications required by Rule 30a-2(a) of the Investment Company Act of 1940, as amended, and Section 302 of the Sarbanes-Oxley Act of 2002 are attached hereto as Exhibit 99.Cert. | |||||
| (a)(3) | Not applicable to Registrant. | |||||
| (b) | The certifications by the Registrant’s principal executive officer and principal financial officer, as required by Rule 30a-2(b) of the Investment Company Act of 1940, as amended, and Section 906 of the Sarbanes-Oxley Act of 2002 are attached hereto as Exhibit 99.906Cert. | |||||
Table of Contents
SIGNATURES
Pursuant to the requirements of the Securities Exchange Act of 1934 and the Investment Company Act of 1940, the Registrant has duly caused this report to be signed on its behalf by the undersigned, thereunto duly authorized.
FINANCIAL INVESTORS TRUST
By: | /s/ Edmund J. Burke | |||
| Edmund J. Burke (Principal Executive Officer) | ||||
| President | ||||
Date: | January 4, 2013 | |||
Pursuant to the requirements of the Securities Exchange Act of 1934 and the Investment Company Act of 1940, this report has been signed below by the following persons on behalf of the Registrant and in the capacities and on the dates indicated.
FINANCIAL INVESTORS TRUST
| By: | /s/ Edmund J. Burke | |||
| Edmund J. Burke (Principal Executive Officer) | ||||
| President | ||||
Date: | January 4, 2013 | |||
By: | /s/ Jeremy O. May | |||
| Jeremy O. May (Principal Financial Officer) | ||||
| Treasurer | ||||
Date: | January 4, 2013 | |||