Table of Contents
UNITED STATES
SECURITIES AND EXCHANGE COMMISSION
Washington, D.C. 20549
FORM N-CSR
CERTIFIED SHAREHOLDER REPORT OF REGISTERED
MANAGEMENT INVESTMENT COMPANIES
Investment Company Act file number: 811-8194
FINANCIAL INVESTORS TRUST
(exact name of Registrant as specified in charter)
1290 Broadway, Suite 1100, Denver, Colorado 80203
(Address of principal executive offices) (Zip code)
David T. Buhler, Secretary
Financial Investors Trust
1290 Broadway, Suite 1100
Denver, Colorado 80203
(Name and address of agent for service)
Registrant’s telephone number, including area code: 303-623-2577
Date of fiscal year end: April 30
Date of reporting period: May 1, 2014 – October 31, 2014
Table of Contents
Item 1. Reports to Stockholders.
Table of Contents
Table of Contents
|
| PAGE | ||||
| 1 | ||||
| 4 | ||||
| 5 | ||||
| 7 | ||||
| 8 | ||||
| 9 | ||||
| 10 | ||||
| 12 | ||||
| 19 | ||||
Table of Contents
| Aspen Managed Futures Strategy Fund | Manager Commentary | |
October 31, 2014 (Unaudited)
|
November 11, 2014
Performance Results
For the six-month period ending October 31, 2014, the Class I shares of the Aspen Managed Futures Strategy Fund (the “Fund”) posted a gain of 5.51%. Per its mandate, the Fund maintained very tight correlation1 to the Aspen Managed Futures Beta Index (“AMFBI” or the “Index”)2. The Index uses a combination of trend and counter-trend algorithms to determine exposures to 23 futures markets. In following the Index, the Fund can take long or short exposures to each of the eligible markets. A long position in a futures market will profit if the price of the futures contract rises, and a short position will profit if the price of the futures contract falls.
The Newedge CTA Index3, a managed futures benchmark, returned 8.99% in the same timeframe. It is important to note that there are substantive differences between the Fund and these indices in terms of construction. There were no significant changes to the Fund strategy during this period.
Explanation of Fund Performance
The Fund was flat in May (0.0%) and slightly down in June (-0.1%). These months perpetuated an extremely low volatility market backdrop that had been evident since early spring. Because the Index that is tracked by the Fund does not have a volatility target, Fund returns joined underlying asset returns in their low volatility state. In fact, the Fund’s daily returns represented a one-penny or zero-penny change in Fund NAV (approximately +/-0.1%) on about 55% of all days over this two-month period.
July (+0.4%), August (+1.4%), and September (+5.5%) represented the strongest quarter for the Fund since it launched, with September in particular being the best month in the Fund’s history. The primary driver of Fund returns was growing strength in the US dollar. This manifested itself as strongly positive returns for short trends in the currency and commodity asset classes. (The markets in both asset classes were almost exclusively short for most of the quarter, representing a rising dollar bet.) Interestingly, the Fund outperformed most managed futures benchmarks in July and September—down months for equities—and underperformed the benchmarks in August—an up month for equities. This reinforces a pattern, now noticeable for at least the past two years, of Fund returns being less beholden to equities than are the returns of many competing managed futures products.
The early days of October witnessed a continued downtrend in equity returns, leading the Fund to adopt a portfolio that was positioned as a strong hedge against further risk asset losses. However, equities rallied mid-month, and US equities in particular managed to rise back to near-record highs, after hitting a nearly 10% drawdown prior to the rally. This caused a whipsaw reversal in the Fund through much of the month. After attenuating negative-risk positions, the Fund benefitted the last two days of the month from the end of the Fed’s Quantitative Easing4 policies, which caused currencies and commodities to resume their strong decline against the US dollar. Gains on those days reduced Fund losses to -1.6% for the entire month.
Outlook
The U.S. capital markets successfully weathered a number of geopolitical risk shocks through the six month period ending in October. These included the evolution of ISIS and its activities in Syria; a spreading Ebola epidemic; and political unrest in Hong Kong. U.S. stocks ended the period with a small gain of approximately 7%. Foreign equities lagged, booking profits of 3-4%. Bonds were up modestly during the period.
In our view, the end of bond buying by the Federal Reserve (which was announced at end of October) should support a number of macroeconomic themes. One example is the strengthening dollar, which is reinforced by the potential for higher rates in the U.S. As our domestic economy continues to outpace the rest of the world, capital may continue being drawn to investment opportunities here, which should result in more demand for the greenback.
Lower energy prices are another macro theme that we expect to continue. The economic slowdown in Europe and Asia, combined with increased production in the U.S., is likely to create a supply/demand imbalance that favors cheaper crude oil. And since crude is denominated in dollars, a rise in the currency makes the commodity less attractive to foreign buyers, forcing prices even lower.
Finally, we expect the U.S. economy to continue its impressive growth. One reason is cheaper energy prices. The other is robust earnings from domestic companies and increased investment from overseas investors seeking more opportunity.
Although these three themes might be difficult to express in a traditional portfolio, they can potentially be captured in one that includes the AMFBI. Current positions in the Index include (but are not limited to) a long dollar holding versus the Japanese yen, Euro, and Canadian currencies. The Index is also short crude and heating oil, and long U.S. equities while short European stocks. The AMFBI is rebalanced weekly to ensure that relevant changes in the macroeconomic landscape are reflected in our holdings.
We realize that amidst the opportunities afforded by the U.S. capital markets, clients may be hesitant to commit at such lofty stock market valuations. In our opinion, one way to counter such resistance is to increase diversification via a managed futures component. Such an allocation gives investors the possibility of exposure to investment themes such as the ones mentioned above, but with the added benefit of non-correlation during volatile market conditions. We believe a managed futures investment can serve as a logical addendum to an intelligently designed stock-bond portfolio.
Sincerely,
Bryan R. Fisher (Managing Director)
William Ware Bush (Director)
Semi-Annual Report | October 31, 2014 |
1 |
Table of Contents
| Aspen Managed Futures Strategy Fund | Manager Commentary | |
October 31, 2014 (Unaudited)
|
Performance data quoted represents past performance. Past performance does not guarantee future results. Investment return and principal value of an investment will fluctuate so that an investor’s shares, when sold or redeemed, may be worth more or less than the original cost. Current performance data may be higher or lower than actual data quoted. For the most current month-end performance data please call 1-855-845-9444.
The views and information discussed in this commentary are as of the date of publication, are subject to change, and may not reflect the writers’ current views. The views expressed represent an assessment of market conditions at a specific point in time, are opinions only and should not be relied upon as investment advice regarding a particular investment or markets in general. Such information does not constitute a recommendation to buy or sell specific securities or investment vehicles. It should not be assumed that any investment will be profitable or will equal the performance of the portfolios or any securities or any sectors mentioned in this letter. The subject matter contained in this letter has been derived from several sources believed to be reliable and accurate at the time of compilation. Neither Aspen Partners Ltd. nor the Fund accepts any liability for losses either direct or consequential caused by the use of this information.
| 1 | Correlation - a statistical measure of how two securities move in relation to each other. |
| 2 | Aspen Managed Futures Beta Index - The Managed Futures Beta Index is constructed using a quantitative, rules-based model designed to replicate the trend-following and counter-trend exposure of futures markets by allocating assets to liquid futures contracts of certain financial and commodities futures markets. The Index therefore seeks to reflect the performance of strategies and exposures common to a broad universe of futures markets, i.e., managed futures beta. The Index is not actively managed and does not reflect any deduction for fees, expenses or taxes. You cannot invest directly in the Index. |
| 3 | The Newedge CTA Index provides the market with a reliable daily performance benchmark of major commodity trading advisors (CTAs). The Newedge CTA Index calculates the daily rate of return for a pool of CTAs selected from the larger managers that are open to new investment. Selection of the pool of qualified CTAs used in construction of the Index will be conducted annually, with re-balancing on January 1st of each year. A committee of industry professionals has been established to monitor the methodology of the index on a regular basis. The Index is not actively managed and does not reflect any deduction for fees, expenses or taxes. You cannot invest directly in the Index. |
| 4 | Quantitative Easing - An unconventional monetary policy in which a central bank purchases government securities or other securities from the market in order to lower interest rates and increase the money supply. |
2 |
www.aspenfuturesfund.com |
Table of Contents
| Aspen Managed Futures Strategy Fund | Manager Commentary | |
October 31, 2014 (Unaudited)
|
Cumulative Total Return Performance as of October 31, 2014
| Aspen Managed Futures Strategy Fund | Calendar Year-to-Date | 1 Year | 3 Year | Since Inception* | ||||||||||||||||
Aspen Managed Futures Strategy Fund - Class A (NAV)(1) | 0.96 | % | 4.55 | % | 0.59 | % | -1.32 | % | ||||||||||||
Aspen Managed Futures Strategy Fund - Class A (MOP)(2) | -4.55 | % | -1.17 | % | -1.30 | % | -3.02 | % | ||||||||||||
Aspen Managed Futures Strategy Fund - Class I | 1.16 | % | 5.06 | % | 0.97 | % | -0.94 | % | ||||||||||||
Newedge CTA Index(3) | 7.15 | % | 9.58 | % | 1.53 | % | -0.02 | % | ||||||||||||
Aspen Managed Futures Beta Index(4) | 1.28 | % | 4.57 | % | 1.90 | % | -3.56 | % | ||||||||||||
Performance data quoted represents past performance. Past performance does not guarantee future results. Investment return and principal value of an investment will fluctuate so that an investor’s shares, when sold or redeemed, may be worth more or less than the original cost. Current performance data may be higher or lower than actual data quoted. For the most current month-end performance data please call 1-855-845-9444.
The table does not reflect the deduction of taxes that a shareholder would pay on Fund distributions or the redemption of Fund shares.
| * | Fund Inception date of August 2, 2011. |
| (1) | Net Asset Value (NAV) is the share price without sales charges. |
| (2) | Maximum Offering Price (MOP) includes sales charges. Class A returns include effects of the Fund’s maximum sales charge of 5.50%. |
| (3) | The Newedge CTA Index provides the market with a reliable daily performance benchmark of major commodity trading advisors (CTAs). The Newedge CTA Index calculates the daily rate of return for a pool of CTAs selected from the larger managers that are open to new investment. Selection of the pool of qualified CTAs used in construction of the Index will be conducted annually, with re-balancing on January 1st of each year. A committee of industry professionals has been established to monitor the methodology of the index on a regular basis. The index is not actively managed and does not reflect any deductions for fees, expense or taxes. An investor may not invest directly in an index. |
| (4) | Aspen Managed Futures Beta Index – The Managed Futures Beta Index is constructed using a quantitative, rules-based model designed to replicate the trend-following and counter-trend exposure of futures markets by allocating assets to liquid futures contracts of certain financial and commodities futures markets. The Index therefore seeks to reflect the performance of strategies and exposures common to a broad universe of futures markets, i.e., managed futures beta. The index is not actively managed and does not reflect any deductions for fees, expense or taxes. An investor may not invest directly in an index. |
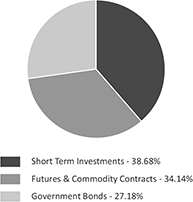
Portfolio Composition as of October 31, 2014 As a percentage of Net Assets
|
Performance of $10,000 Initial Investment (as of October 31, 2014)
Comparison of change in value of a $10,000 investment (includes applicable sales loads)
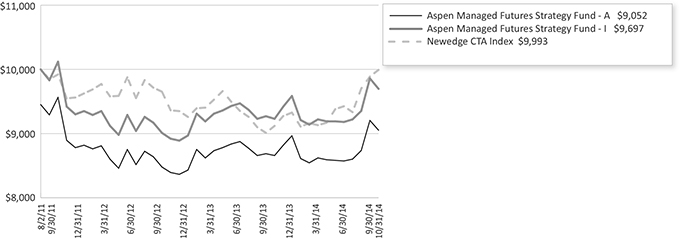
The chart represents historical performance of a hypothetical investment of $10,000 in the Fund since inception. Past performance does not guarantee future results. This chart does not reflect the deduction of taxes that a shareholder would pay on Fund distributions or the redemption of Fund shares.
Semi-Annual Report | October 31, 2014 |
3 |
Table of Contents
| Aspen Managed Futures Strategy Fund | Consolidated Disclosure of Fund Expenses | |
October 31, 2014 (Unaudited) |
As a shareholder of a Fund, you incur two types of costs: (1) transaction costs, including applicable sales charges (loads), redemption fees, wire fees and low balance fees; and (2) ongoing costs, including management fees, distribution and service (12b-1) fees, shareholder services fees and other Fund expenses. This example is intended to help you understand your indirect costs, also referred to as “ongoing costs” (in dollars), of investing in the Fund and to compare these costs with the ongoing costs of investing in other mutual funds.
This example is based on an investment of $1,000 invested at the beginning of the period and held for the entire six-month period of May 1, 2014 through October 31, 2014.
Actual Expenses The first line of the table below provides information about actual account values and actual expenses. You may use the information in this line, together with the amount you invested at the beginning of the period, to estimate the expenses that you paid over the period. Simply divide your account value by $1,000 (for example, an $8,600 account value divided by $1,000 = 8.6), then multiply the result by the number in the first line under the heading “Expenses Paid During Period” to estimate the expenses you paid on your account during this period.
Hypothetical Example for Comparison Purposes The second line of the table provides information about hypothetical account values and hypothetical expenses based on the Fund’s actual expense ratio and an assumed rate of return of 5% per year before expenses, which is not the Fund’s actual return. The hypothetical account values and expenses may not be used to estimate the actual ending account balance or expenses you paid for the period. You may use this information to compare ongoing costs of investing in the Fund and other funds. To do so, compare this 5% hypothetical example with the 5% hypothetical examples that appear in the shareholder reports of other funds.
Please note that the expenses shown in the table are meant to highlight your ongoing costs only and do not reflect any transactional costs, such as applicable sales charges (loads), redemption fees, wire fees and low balance fees. Therefore, the second line of the table is useful in comparing ongoing costs only and will not help you determine the relative total costs of owning different funds. In addition, if these transaction costs were included, your costs would be higher.
| Beginning Account Value 5/1/14 | Ending Account Value 10/31/14 | Expense Ratio(a) | Expenses Paid During period 5/1/14 - 10/31/14(b) | |||||||||||||||||
Class A | ||||||||||||||||||||
Actual | $ | 1,000.00 | $ | 1,053.50 | 1.64 | % | $ | 8.49 | ||||||||||||
Hypothetical (5% return before expenses) | $ | 1,000.00 | $ | 1,016.94 | 1.64 | % | $ | 8.34 | ||||||||||||
Class I | ||||||||||||||||||||
Actual | $ | 1,000.00 | $ | 1,055.10 | 1.28 | % | $ | 6.63 | ||||||||||||
Hypothetical (5% return before expenses) | $ | 1,000.00 | $ | 1,018.75 | 1.28 | % | $ | 6.51 | ||||||||||||
| (a) | The Fund’s expense ratios have been based on the Fund’s most recent fiscal half-year expenses. |
| (b) | Expenses are equal to the Fund’s annualized expense ratio multiplied by the average account value over the period, multiplied by the number of days in the most recent fiscal half-year (184)/365 (to reflect the half-year period). |
4 |
www.aspenfuturesfund.com |
Table of Contents
| Aspen Managed Futures Strategy Fund | Consolidated Schedule of Investments | |
October 31, 2014 (Unaudited)
|
| Principal Amount/ Shares | Value (Note 2) | |||||||
GOVERNMENT BONDS (27.18%) |
| |||||||
U.S. TREASURY NOTES (27.18%) | ||||||||
0.250%, 10/31/2015 | $ | 5,000,000 | $ | 5,005,470 | ||||
0.250%, 11/30/2015 | 7,013,000 | 7,019,578 | ||||||
0.250%, 12/31/2015 | 9,029,000 | 9,036,756 | ||||||
0.375%, 01/31/2016 | 6,006,000 | 6,019,141 | ||||||
0.250%, 02/29/2016 | 6,019,000 | 6,020,409 | ||||||
0.375%, 03/31/2016 | 5,042,000 | 5,048,696 | ||||||
0.375%, 04/30/2016 | 5,019,000 | 5,024,099 | ||||||
0.375%, 05/31/2016 | 7,029,000 | 7,033,941 | ||||||
0.500%, 08/31/2016 | 5,042,000 | 5,049,089 | ||||||
TOTAL GOVERNMENT BONDS | ||||||||
|
| |||||||
(Cost $55,157,662) |
| 55,257,179 | ||||||
|
| |||||||
SHORT TERM INVESTMENTS (38.68%) | ||||||||
MONEY MARKET FUND (4.23%) | ||||||||
Dreyfus Treasury & Agency Cash Management Fund - Institutional Shares, 7-day yield, 0.021% | 8,588,030 | 8,588,030 | ||||||
U.S. TREASURY BILLS (34.45%) | ||||||||
0.020%, 11/13/2014(a) | 7,500,000 | 7,499,792 | ||||||
0.096%, 12/11/2014(a) | 5,000,000 | 4,999,466 | ||||||
0.087%, 01/08/2015(a) | 4,250,000 | 4,249,979 | ||||||
0.099%, 02/05/2015(a) | 10,000,000 | 9,999,550 | ||||||
0.062%, 03/05/2015(a) | 5,000,000 | 4,999,365 | ||||||
0.073%, 04/02/2015(a) | 6,500,000 | 6,498,986 | ||||||
0.074%, 04/30/2015(a) | 4,300,000 | 4,298,989 | ||||||
0.069%, 05/28/2015(a) | 5,500,000 | 5,498,663 | ||||||
0.045%, 06/25/2015(a) | 5,500,000 | 5,497,586 | ||||||
0.066%, 07/23/2015(a) | 6,750,000 | 6,746,436 | ||||||
0.090%, 08/20/2015(a) | 5,750,000 | 5,746,527 | ||||||
0.063%, 09/17/2015(a) | 4,000,000 | 3,997,260 | ||||||
|
| |||||||
| 70,032,599 | ||||||||
|
| |||||||
TOTAL SHORT TERM INVESTMENTS (Cost $78,615,777) |
| 78,620,629 | ||||||
|
| |||||||
TOTAL INVESTMENTS (65.86%) (Cost $133,773,439) |
| $ | 133,877,808 | |||||
|
| |||||||
Other Assets In Excess Of Liabilities (34.14%) |
| 69,412,589 (b) | ||||||
|
| |||||||
NET ASSETS (100.00%) |
| $ | 203,290,397 | |||||
|
| |||||||
| (a) | Rate shown represents the bond equivalent yield to maturity at date of purchase. |
| (b) | Includes cash which is being held as collateral for futures contracts. |
See Notes to Consolidated Financial Statements.
Semi-Annual Report | October 31, 2014 |
5 |
Table of Contents
| Aspen Managed Futures Strategy Fund | Consolidated Schedule of Investments | |
October 31, 2014 (Unaudited) |
FUTURES CONTRACTS
At October 31, 2014, the Fund had outstanding futures contracts:
| Description | Position | Contracts | Expiration Date | Underlying Face Amount at Value | Unrealized Appreciation | |||||||||||
Commodity Contracts | ||||||||||||||||
Gold 100 Oz Future | Short | 66 | 12/30/2014 | $ | (7,732,560) | $ | 493,061 | |||||||||
New York Harbor ULSD Future | Short | 114 | 12/01/2014 | (12,022,189) | 59,934 | |||||||||||
Silver Future | Short | 138 | 12/30/2014 | (11,113,140) | 1,678,872 | |||||||||||
Sugar No. 11 (World) Future | Short | 442 | 03/02/2015 | (7,940,442) | 64,776 | |||||||||||
WTI Crude Oil Future | Short | 147 | 11/21/2014 | (11,839,380) | 58,292 | |||||||||||
Equity Contracts | ||||||||||||||||
Nikkei 225 Index Future | Long | 81 | 12/12/2014 | 6,913,350 | 554,692 | |||||||||||
S&P 500® E-mini Future | Long | 126 | 12/22/2014 | 12,671,820 | 238,897 | |||||||||||
Fixed Income Contracts | ||||||||||||||||
Euro-Bund Future | Long | 210 | 12/09/2014 | 39,713,656 | 241,798 | |||||||||||
Long Gilt Future | Long | 216 | 12/30/2014 | 39,770,924 | 107,741 | |||||||||||
Foreign Currency Contracts | ||||||||||||||||
Canadian Dollar Currency Future | Short | 535 | 12/17/2014 | (47,401,000) | 763,095 | |||||||||||
Euro FX Currency Future | Short | 207 | 12/16/2014 | (32,421,375) | 966,484 | |||||||||||
Japanese Yen Currency Future | Short | 274 | 12/16/2014 | (30,509,900) | 1,433,971 | |||||||||||
Swiss Franc Currency Future | Short | 12 | 12/16/2014 | (1,558,800) | 14,657 | |||||||||||
|
| |||||||||||||||
| $ | (63,469,036) | $ | 6,676,270 | |||||||||||||
|
| |||||||||||||||
| Description | Position | Contracts | Expiration Date | Underlying Face Amount at Value | Unrealized Depreciation | |||||||||||
Commodity Contracts | ||||||||||||||||
Copper Future | Short | 51 | 12/30/2014 | $ | (3,884,925) | $ | (37,789) | |||||||||
Corn Future | Short | 439 | 12/15/2014 | (8,269,663) | (786,654) | |||||||||||
Soybean Future | Short | 156 | 01/15/2015 | (8,184,150) | (277,518) | |||||||||||
Equity Contracts | ||||||||||||||||
Euro STOXX 50® Index Future | Short | 484 | 12/22/2014 | (18,808,306) | (1,150,105) | |||||||||||
FTSE® 100 Index Future | Short | 180 | 12/22/2014 | (18,732,243) | (294,388) | |||||||||||
Fixed Income Contracts | ||||||||||||||||
Canadian 10 Year Bond Future | Long | 219 | 12/19/2014 | 26,626,654 | (124,923) | |||||||||||
U.S. 10 Year Treasury Note Future | Long | 319 | 12/22/2014 | 40,308,641 | (31,125) | |||||||||||
Foreign Currency Contracts | ||||||||||||||||
Australian Dollar Currency Future | Short | 343 | 12/16/2014 | (30,077,667) | (42,466) | |||||||||||
New Zealand Dollar Currency Future | Long | 21 | 12/16/2014 | 1,627,920 | (14,356) | |||||||||||
|
| |||||||||||||||
| $ | (19,393,739) | $ | (2,759,324) | |||||||||||||
|
| |||||||||||||||
Common Abbreviations:
FTSE - Financial Times and the London Stock Exchange
FX - Foreign
No. - Number
Oz - Ounce
S&P - Standard and Poor’s
ULSD - Ultra Low Sulfur Diesel
Holdings are subject to change.
For Fund compliance purposes, the Fund’s industry classifications refer to any one or more of the industry sub-classifications used by one or more widely recognized market indexes or ratings group indexes, and/or as defined by Fund management. This definition may not apply for purposes of this report, which may combine industry sub-classifications for reporting ease. Industries are shown as a percentage of net assets.
See Notes to Consolidated Financial Statements.
6 |
www.aspenfuturesfund.com |
Table of Contents
| Aspen Managed Futures Strategy Fund | Consolidated Statement of Assets & Liabilities | |
October 31, 2014 (Unaudited)
|
ASSETS: | ||||
Investments, at value | $ | 133,877,808 | ||
Foreign currency, at value (Cost $3,529,900) | 3,530,503 | |||
Deposit with broker for futures contracts (Note 3) | 62,071,145 | |||
Receivable for shares sold | 151,244 | |||
Variation margin receivable | 6,676,270 | |||
Interest receivable | 41,027 | |||
Prepaid and other assets | 22,195 | |||
| ||||
Total assets | 206,370,192 | |||
| ||||
LIABILITIES: | ||||
Payable to advisor | 130,236 | |||
Variation margin payable | 2,759,324 | |||
Payable for shares redeemed | 56,587 | |||
Payable for administration fees | 20,137 | |||
Payable for distribution and service fees | 7,164 | |||
Payable for transfer agency fees | 11,537 | |||
Payable for trustee fees and expenses | 7,694 | |||
Payable for professional fees | 25,935 | |||
Payable for chief compliance officer fees | 2,893 | |||
Payable for principal financial officer fees | 437 | |||
Payable for licensing fees | 43,412 | |||
Accrued expenses and other liabilities | 14,439 | |||
| ||||
Total liabilities | 3,079,795 | |||
| ||||
NET ASSETS | $ | 203,290,397 | ||
| ||||
NET ASSETS CONSIST OF: | ||||
Paid-in capital (Note 5) | $ | 192,829,139 | ||
Accumulated net investment loss | (1,824,738) | |||
Accumulated net realized gain on investments, futures contracts and foreign currency transactions | 8,264,078 | |||
Net unrealized appreciation on investments, futures contracts and foreign currency translations | 4,021,918 | |||
| ||||
NET ASSETS | $ | 203,290,397 | ||
| ||||
INVESTMENTS, AT COST | $ | 133,773,439 | ||
PRICING OF SHARES: | ||||
Class A: | ||||
Net Asset Value, offering and redemption price per share | $ | 9.45 | ||
Net Assets | $ | 12,882,465 | ||
Shares of beneficial interest outstanding | 1,363,789 | |||
Maximum offering price per share (NAV/0.9450), based on maximum sales charge of 5.50% of the offering price | $ | 10.00 | ||
Class I: | ||||
Net Asset Value, offering and redemption price per share | $ | 9.57 | ||
Net Assets | $ | 190,407,932 | ||
Shares of beneficial interest outstanding | 19,892,491 | |||
See Notes to Consolidated Financial Statements.
Semi-Annual Report | October 31, 2014 |
7 |
Table of Contents
| Aspen Managed Futures Strategy Fund | Consolidated Statement of Operations | |
For the Six Months Ended October 31, 2014 (Unaudited)
|
| ||||
INVESTMENT INCOME: | ||||
Interest | $ | 133,651 | ||
Dividends | 596 | |||
| ||||
Total Investment Income | 134,247 | |||
| ||||
EXPENSES: | ||||
Investment advisory fees (Note 6) | 719,913 | |||
Administrative fees | 117,132 | |||
Distribution and service fees | 22,081 | |||
Transfer agency fees | 61,125 | |||
Professional fees | 22,419 | |||
Custodian fees | 5,762 | |||
Trustee fees and expenses | 9,151 | |||
Principal financial officer fees | 2,521 | |||
Chief compliance officer fees | 16,674 | |||
Licensing fees | 239,971 | |||
Other | 31,541 | |||
| ||||
Total Net Expenses | 1,248,290 | |||
| ||||
NET INVESTMENT LOSS | (1,114,043) | |||
| ||||
Net realized gain on investments | 22,808 | |||
Net realized gain on futures contracts | 10,036,394 | |||
Net realized loss on foreign currency transactions | (172,153) | |||
Net change in unrealized appreciation of investments | 25,095 | |||
Net change in unrealized appreciation on futures contracts | 1,698,905 | |||
Net change in unrealized appreciation on translation of assets and liabilities denominated in foreign currency transactions | 1,508 | |||
| ||||
NET REALIZED AND UNREALIZED GAIN ON INVESTMENTS | 11,612,557 | |||
| ||||
NET INCREASE IN NET ASSETS RESULTING FROM OPERATIONS | $ | 10,498,514 | ||
| ||||
See Notes to Consolidated Financial Statements.
8 |
www.aspenfuturesfund.com |
Table of Contents
| Aspen Managed Futures Strategy Fund | Consolidated Statements of Changes in Net Assets | |
| For the Six Months Ended October 31, 2014 (Unaudited) | For the Year Ended April 30, 2014 | |||||||
| ||||||||
OPERATIONS: | ||||||||
Net investment loss | $ | (1,114,043) | $ | (1,929,841) | ||||
Net realized gain/(loss) on investments, futures contracts and foreign currency transactions | 9,887,049 | (2,925,094) | ||||||
Net change in unrealized appreciation on investments, futures contracts and foreign currency translations | 1,725,508 | 1,557,404 | ||||||
| ||||||||
Net increase/(decrease) in net assets resulting from operations | 10,498,514 | (3,297,531) | ||||||
| ||||||||
DISTRIBUTIONS TO SHAREHOLDERS (Note 4): | ||||||||
From net realized gains on investments | ||||||||
Class A | – | (162,261) | ||||||
Class I | – | (2,158,924) | ||||||
| ||||||||
Net decrease in net assets from distributions | – | (2,321,185) | ||||||
| ||||||||
SHARE TRANSACTIONS (Note 5): | ||||||||
Class A | ||||||||
Proceeds from sales of shares | 1,457,519 | 13,615,924 | ||||||
Distributions reinvested | – | 160,468 | ||||||
Cost of shares redeemed | (2,145,104) | (3,784,081) | ||||||
Redemption fees | 277 | 7,725 | ||||||
Class I | ||||||||
Proceeds from sales of shares | 24,787,284 | 67,455,247 | ||||||
Distributions reinvested | – | 2,022,776 | ||||||
Cost of shares redeemed | (11,479,430) | (17,814,123) | ||||||
Redemption fees | 470 | 5,843 | ||||||
| ||||||||
Net increase from share transactions | 12,621,016 | 61,669,778 | ||||||
| ||||||||
Net increase in net assets | 23,119,530 | 56,051,063 | ||||||
| ||||||||
NET ASSETS: | ||||||||
Beginning of period | 180,170,867 | 124,119,804 | ||||||
| ||||||||
End of period* | $ | 203,290,397 | $ | 180,170,867 | ||||
| ||||||||
*Includes accumulated net investment loss of: | $ | (1,824,738) | $ | (710,695) | ||||
Other Information: | ||||||||
SHARE TRANSACTIONS: | ||||||||
Class A | ||||||||
Sold | 159,339 | 1,473,235 | ||||||
Distributions reinvested | – | 17,310 | ||||||
Redeemed | (235,236) | (411,560) | ||||||
| ||||||||
Net increase/(decrease) in shares outstanding | (75,897) | 1,078,985 | ||||||
| ||||||||
Class I | ||||||||
Sold | 2,686,534 | 7,251,376 | ||||||
Distributions reinvested | – | 216,109 | ||||||
Redeemed | (1,228,981) | (1,932,582) | ||||||
| ||||||||
Net increase in shares outstanding | 1,457,553 | 5,534,903 | ||||||
| ||||||||
See Notes to Consolidated Financial Statements.
Semi-Annual Report | October 31, 2014 |
9 |
Table of Contents
| Aspen Managed Futures Strategy Fund – Class A | Consolidated Financial Highlights | |
For a share outstanding throughout the periods presented.
|
For the Six Months October 31, 2014 | For the Year Ended | For the Year Ended | For the Period August 2, 2011 (Inception) to April 30, 2012 (a) | |||||||||||||
| ||||||||||||||||
NET ASSET VALUE, BEGINNING OF PERIOD | $ | 8.97 | $ | 9.29 | $ | 8.95 | $ | 10.00 | ||||||||
INCOME/(LOSS) FROM OPERATIONS: | ||||||||||||||||
Net investment loss(b) | (0.07) | (0.16) | (0.16) | (0.13) | ||||||||||||
Net realized and unrealized gain/(loss) on investments | 0.55 | (0.05) | 0.50 | (0.92) | ||||||||||||
| ||||||||||||||||
Total from investment operations | 0.48 | (0.21) | 0.34 | (1.05) | ||||||||||||
| ||||||||||||||||
LESS DISTRIBUTIONS: | ||||||||||||||||
Distributions from net realized gain on investments | – | (0.12) | – | – | ||||||||||||
| ||||||||||||||||
Total distributions | – | (0.12) | – | – | ||||||||||||
| ||||||||||||||||
REDEMPTION FEES ADDED TO PAID IN CAPITAL | 0.00 (c) | 0.01 | 0.00 (c) | – | ||||||||||||
| ||||||||||||||||
INCREASE/(DECREASE) IN NET ASSET VALUE | 0.48 | (0.32) | 0.34 | (1.05) | ||||||||||||
| ||||||||||||||||
NET ASSET VALUE, END OF PERIOD | $ | 9.45 | $ | 8.97 | $ | 9.29 | $ | 8.95 | ||||||||
| ||||||||||||||||
TOTAL RETURN(d) | 5.35% (e) | (2.15%) | 3.80% | (10.50%) (e) | ||||||||||||
RATIOS AND SUPPLEMENTAL DATA: | ||||||||||||||||
Net assets, end of period (000’s) | $ | 12,882 | $ | 12,914 | $ | 3,350 | $ | 1,254 | ||||||||
RATIOS TO AVERAGE NET ASSETS: | ||||||||||||||||
Operating expenses excluding fee waivers/reimbursements | 1.64% (f) | 1.83% | 1.80% | 2.53% (f) | ||||||||||||
Operating expenses including fee waivers/reimbursements | 1.64% (f) | 1.83% | 1.80% | 1.80% (f) | ||||||||||||
Net investment loss including fee waivers/reimbursements | (1.50%) (f) | (1.72%) | (1.75%) | (1.79%) (f) | ||||||||||||
PORTFOLIO TURNOVER RATE | 28% (e) | 90% | 0% | 0% (e) | ||||||||||||
| (a) | Per share amounts and ratios to average net assets include income and expenses of the Aspen Futures Fund Ltd. (subsidiary), exclusive of the subsidiary’s management fee. |
| (b) | Per share numbers have been calculated using the average shares method. |
| (c) | Less than $0.005 per share. |
| (d) | Total return does not reflect the effect of sales charges. |
| (e) | Not annualized. |
| (f) | Annualized. |
See Notes to Consolidated Financial Statements.
10 |
www.aspenfuturesfund.com |
Table of Contents
| Aspen Managed Futures Strategy Fund – Class I | Consolidated Financial Highlights | |
For a share outstanding throughout the periods presented.
|
| For the Six Months Ended October 31, 2014 (Unaudited) (a) | For the Year Ended | For the Year Ended | For the Period August 2, 2011 (Inception) to April 30, 2012 (a) | |||||||||||||
| ||||||||||||||||
NET ASSET VALUE, BEGINNING OF PERIOD | $ | 9.07 | $ | 9.36 | $ | 8.98 | $ | 10.00 | ||||||||
INCOME/(LOSS) FROM OPERATIONS: | ||||||||||||||||
Net investment loss(b) | (0.05) | (0.11) | (0.11) | (0.11) | ||||||||||||
Net realized and unrealized gain/(loss) on investments | 0.55 | (0.06) | 0.49 | (0.91) | ||||||||||||
| ||||||||||||||||
Total from investment operations | 0.50 | (0.17) | 0.38 | (1.02) | ||||||||||||
| ||||||||||||||||
LESS DISTRIBUTIONS: | ||||||||||||||||
Distributions from net realized gain on investments | – | (0.12) | – | – | ||||||||||||
| ||||||||||||||||
Total distributions | – | (0.12) | – | – | ||||||||||||
| ||||||||||||||||
REDEMPTION FEES ADDED TO PAID IN CAPITAL | 0.00 (c) | 0.00 (c) | 0.00 (c) | 0.00 (c) | ||||||||||||
| ||||||||||||||||
INCREASE/(DECREASE) IN NET ASSET VALUE | 0.50 | (0.29) | 0.38 | (1.02) | ||||||||||||
| ||||||||||||||||
NET ASSET VALUE, END OF PERIOD | $ | 9.57 | $ | 9.07 | $ | 9.36 | $ | 8.98 | ||||||||
| ||||||||||||||||
TOTAL RETURN | 5.51% (d) | (1.81%) | 4.23% | (10.20%) (d) | ||||||||||||
RATIOS AND SUPPLEMENTAL DATA: | ||||||||||||||||
Net assets, end of period (000’s) | $ | 190,408 | $ | 167,258 | $ | 120,769 | $ | 90,450 | ||||||||
RATIOS TO AVERAGE NET ASSETS: | ||||||||||||||||
Operating expenses excluding fee waivers/reimbursements | 1.28% (e) | 1.30% | 1.25% | 1.75% (e) | ||||||||||||
Operating expenses including fee waivers/reimbursements | 1.28% (e) | 1.30% | 1.25% | 1.55% (e) | ||||||||||||
Net investment loss including fee waivers/reimbursements | (1.14%) (e) | (1.20%) | (1.20%) | (1.54%) (e) | ||||||||||||
PORTFOLIO TURNOVER RATE | 28% (d) | 90% | 0% | 0% (d) | ||||||||||||
| (a) | Per share amounts and ratios to average net assets include income and expenses of the Aspen Futures Fund Ltd. (subsidiary), exclusive of the subsidiary’s management fee. |
| (b) | Per share numbers have been calculated using the average shares method. |
| (c) | Less than $0.005 per share. |
| (d) | Not annualized. |
| (e) | Annualized. |
See Notes to Consolidated Financial Statements.
Semi-Annual Report | October 31, 2014 |
11 |
Table of Contents
| Aspen Managed Futures Strategy Fund | Financial Statements | |
October 31, 2014 (Unaudited)
|
1. ORGANIZATION
Financial Investors Trust (the “Trust”), a Delaware statutory trust, is an open-end management investment company registered under the Investment Company Act of 1940, as amended (“1940 Act”). As of October 31, 2014, the Trust had 32 registered funds. This semi-annual report describes the Aspen Managed Futures Strategy Fund (the “Fund”). The Fund seeks investment results that replicate as closely as possible, before fees and expenses, the price and yield performance of the Aspen Managed Futures Beta Index (the “MFBI” or “Index”). The Aspen Managed Futures Strategy Fund offers Class A and Class I shares. All classes of shares have identical rights to earnings, assets and voting privileges, except for class specific expenses and exclusive rights to vote on matters affecting only individual classes.
Basis of Consolidation for the Aspen Futures Fund, Ltd.
Aspen Futures Fund, Ltd. (the “Subsidiary”), a Cayman Islands exempted company, is a wholly owned subsidiary of the Fund. The Subsidiary’s investment objective is designed to enhance the ability of the Fund to obtain exposure to equities, financial, currency and commodities markets consistent with the limits of the U.S. federal tax law requirements applicable to registered investment companies. The Subsidiary is subject to substantially the same investment policies and investment restrictions as the Fund. The Subsidiary acts as an investment vehicle for the Fund in order to effect certain commodity-related investments on behalf of the Fund. Investments in the Subsidiary are expected to provide the Fund with exposure to the commodity markets within the limitations of Subchapter M of the Internal Revenue Code of 1986, as amended (the “Code”), and recent IRS revenue rulings, as discussed below under “Federal Income Taxes”. The Fund is the sole shareholder of the Subsidiary pursuant to a subscription agreement dated as of August 2, 2011, and it is intended that the Fund will remain the sole shareholder and will continue to control the Subsidiary. Under the Articles of Association of the Subsidiary, shares issued by the Subsidiary confer upon a shareholder the right to wholly own and vote at general meetings of the Subsidiary and certain rights in connection with any winding-up or repayment of capital, as well as the right to participate in the profits or assets of the Subsidiary. The Fund may invest up to 25% of its total assets in shares of the Subsidiary. As a wholly owned subsidiary of the Fund, all assets and liabilities, income and expenses of the Subsidiary are consolidated in the financial statements and financial highlights of the Fund. All investments held by the Subsidiary are disclosed in the accounts of the Fund. As of October 31, 2014, net assets of the Fund were $203,290,397, of which $33,499,035 or 16.48%, represented the Fund’s ownership of all issued shares and voting rights of the Subsidiary.
2. SIGNIFICANT ACCOUNTING POLICIES
The accompanying financial statements were prepared in accordance with accounting principles generally accepted in the United States of America (“U.S. GAAP”). The preparation of financial statements in conformity with U.S. GAAP requires management to make certain estimates and assumptions that affect the reported amounts of assets and liabilities and disclosures of contingent assets and liabilities at the date of the financial statements and the reported amounts of revenue and expenses during the period. Actual results could differ from those estimates. The Fund is considered an investment company for financial reporting purposes under GAAP. The following is a summary of significant accounting policies consistently followed by the Fund and subsidiary in preparation of the financial statements.
Investment Valuation: The Fund generally values its securities based on market prices determined at the close of regular trading on the New York Stock Exchange (“NYSE”), normally 4:00 p.m. Eastern Time, on each day the NYSE is open for trading.
For equity securities and mutual funds that are traded on an exchange, the market price is usually the closing sale or official closing price on that exchange. In the case of equity securities not traded on an exchange, or if such closing prices are not otherwise available, the securities are valued at the mean of the most recent bid and ask prices on such day. Redeemable securities issued by open-end registered investment companies are valued at the investment company’s applicable net asset value, with the exception of exchange-traded open-end investment companies, which are priced as equity securities.
The market price for debt obligations is generally the price supplied by an independent third-party pricing service approved by the Board of Trustees (the “Board”), which may use a matrix, formula or other objective method that takes into consideration quotations from dealers, market transactions in comparable investments, market indices and yield curves. If vendors are unable to supply a price, or if the price supplied is deemed to be unreliable, the market price may be determined using quotations received from one or more brokers–dealers that make a market in the security. Short–term debt obligations that will mature in 60 days or less are valued at amortized cost, unless it is determined that using this method would not reflect an investment’s fair value.
Futures contracts that are listed or traded on a national securities exchange, commodities exchange, contract market or comparable over-the-counter market, and that are freely transferable, are valued at their closing settlement price on the exchange on which they are primarily traded or based upon the current settlement price for a like instrument acquired on the day on which the instrument is being valued. A settlement price may not be used if the market makes a limit move with respect to a particular commodity.
12 |
www.aspenfuturesfund.com |
Table of Contents
| Aspen Managed Futures Strategy Fund | Notes to Consolidated Financial Statements | |
October 31, 2014 (Unaudited) |
Forward currency exchange contracts have a market value determined by the prevailing foreign currency exchange daily rates and current foreign currency exchange forward rates. The foreign currency exchange forward rates are calculated using an automated system that estimates rates on the basis of the current day foreign currency exchange rates and forward foreign currency exchange rates supplied by a pricing service.
Investment securities that are primarily traded on foreign securities exchanges are valued at the preceding closing values of such securities on their respective exchanges, except when an occurrence subsequent to the time a value was so established is likely to have changed such value. In such an event, the fair value of those securities are determined in good faith through consideration of other factors in accordance with procedures established by and under the general supervision of the Board.
When such prices or quotations are not available, or when the Fair Value Committee appointed by the Board believes that they are unreliable, securities may be priced using fair value procedures approved by the Board.
Fair Value Measurements: The Fund discloses the classification of its fair value measurements following a three-tier hierarchy based on the inputs used to measure fair value. Inputs refer broadly to the assumptions that market participants would use in pricing the asset or liability, including assumptions about risk. Inputs may be observable or unobservable. Observable inputs reflect the assumptions market participants would use in pricing the asset or liability that are developed based on market data obtained from sources independent of the reporting entity. Unobservable inputs reflect the reporting entity’s own assumptions about the assumptions market participants would use in pricing the asset or liability that are developed based on the best information available.
Various inputs are used in determining the value of the Fund’s investments as of the end of the reporting period. When inputs used fall into different levels of the fair value hierarchy, the level in the hierarchy within which the fair value measurement falls is determined based on the lowest level input that is significant to the fair value measurement in its entirety. The designated input levels are not necessarily an indication of the risk or liquidity associated with these investments. These inputs are categorized in the following hierarchy under applicable financial accounting standards:
Level 1 – | Unadjusted quoted prices in active markets for identical investments, unrestricted assets or liabilities that the Fund has the ability to access at the measurement date; | |
Level 2 – | Quoted prices which are not active, quoted prices for similar assets or liabilities in active markets or inputs other than quoted prices that are observable (either directly or indirectly) for substantially the full term of the asset or liability; and | |
Level 3 – | Significant unobservable prices or inputs (including the Fund’s own assumptions in determining the fair value of investments) where there is little or no market activity for the asset or liability at the measurement date. | |
The following is a summary of each input used to value the Fund as of October 31, 2014:
| Investments in Securities at Value | Level 1 - Quoted Prices | Level 2 - Other Significant | Level 3 - Significant Unobservable Inputs | Total | ||||||||||||
| ||||||||||||||||
Government Bonds | $ | – | $ | 55,257,179 | $ | – | $ | 55,257,179 | ||||||||
Short Term Investments | 8,588,030 | 70,032,599 | – | 78,620,629 | ||||||||||||
| ||||||||||||||||
TOTAL | $ | 8,588,030 | $ | 125,289,778 | $ | – | $ | 133,877,808 | ||||||||
| ||||||||||||||||
Other Financial Instruments | ||||||||||||||||
Assets: | ||||||||||||||||
Futures Contracts | ||||||||||||||||
Commodity Contracts | $ | 2,354,935 | $ | – | $ | – | $ | 2,354,935 | ||||||||
Equity Contracts | 793,589 | – | – | 793,589 | ||||||||||||
Fixed Income Contracts | 349,539 | – | – | 349,539 | ||||||||||||
Foreign Currency Contracts | 3,178,207 | – | – | 3,178,207 | ||||||||||||
Liabilities: | ||||||||||||||||
Futures Contracts | ||||||||||||||||
Commodity Contracts | (1,101,961) | – | – | (1,101,961) | ||||||||||||
Equity Contracts | (1,444,493) | – | – | (1,444,493) | ||||||||||||
Fixed Income Contracts | (156,048) | – | – | (156,048) | ||||||||||||
Foreign Currency Contracts | (56,822) | – | – | (56,822) | ||||||||||||
| ||||||||||||||||
TOTAL | $ | 3,916,946 | $ | – | $ | – | $ | 3,916,946 | ||||||||
| ||||||||||||||||
Semi-Annual Report | October 31, 2014 |
13 |
Table of Contents
| Aspen Managed Futures Strategy Fund | Notes to Consolidated Financial Statements | |
October 31, 2014 (Unaudited) |
The Fund recognizes transfers between levels as of the end of the period. For the six months ended October 31, 2014, the Fund did not have any transfers between Level 1 and Level 2 securities. For the six months ended October 31, 2014, the Fund did not have any securities that used significant unobservable inputs (Level 3) in determining fair value.
Investment Transactions and Investment Income: Investment transactions are accounted for on the date the investments are purchased or sold (trade date). Realized gains and losses from investment transactions are reported on an identified cost basis. Interest income, which includes accretion of discounts, is accrued and recorded as earned. Dividend income is recognized on the ex-dividend date or for certain foreign securities, as soon as information is available to the Fund. All of the realized and unrealized gains and losses and net investment income, are allocated daily to each class in proportion to its average daily net assets.
Foreign Securities: The Fund may directly purchase securities of foreign issuers. Investing in securities of foreign issuers involves special risks not typically associated with investing in securities of U.S. issuers. The risks include possible reevaluation of currencies, the inability to repatriate foreign currency, less complete financial information about companies and possible future adverse political and economic developments. Moreover, securities of many foreign issuers and their markets may be less liquid and their prices more volatile than those of securities of comparable U.S. issuers.
Foreign Currency Translation: The books and records of the Fund are maintained in U.S. dollars. Investment valuations and other assets and liabilities initially expressed in foreign currencies are converted each business day into U.S. dollars based upon current exchange rates. Prevailing foreign exchange rates may generally be obtained at the close of the NYSE (normally, 4:00 p.m. Eastern Time). The portion of realized and unrealized gains or losses on investments due to fluctuations in foreign currency exchange rates is not separately disclosed and is included in realized and unrealized gains or losses on investments, when applicable.
Foreign Currency Spot Contracts: The Fund may enter into foreign currency spot contracts to facilitate transactions in foreign securities or to convert foreign currency receipts into U.S. dollars. A foreign currency spot contract is an agreement between two parties to buy and sell currencies at the current market rate, for settlement generally within two business days. The U.S. dollar value of the contracts is determined using current currency exchange rates supplied by a pricing service. The contract is marked-to-market daily for settlements beyond one day and any change in market value is recorded as an unrealized gain or loss. When the contract is closed, the Fund records a realized gain or loss equal to the difference between the value on the open and close date. Losses may arise from changes in the value of the foreign currency, or if the counterparties do not perform under the contract’s terms. The maximum potential loss from such contracts is the aggregate face value in U.S. dollars at the time the contract was opened.
Trust Expenses: Some expenses of the Trust can be directly attributed to the Fund. Expenses which cannot be directly attributed to the Fund are apportioned among all funds in the Trust based on average net assets of each fund.
Fund and Class Expenses: Expenses that are specific to a class of shares of the Fund are charged directly to that share class. All expenses of the Fund, other than class specific expenses, are allocated daily to each class in proportion to its average daily net assets. Fees provided under the distribution (Rule 12b-1) for a particular class of the Fund are charged to the operations of such class.
Federal Income Taxes: The Fund complies with the requirements under Subchapter M of the Internal Revenue Code of 1986, as amended, applicable to regulated investment companies and intends to distribute substantially all of their net taxable income and net capital gains, if any, each year so that it will not be subject to excise tax on distributed income and gains. The Fund is not subject to income taxes to the extent such distributions are made.
As of and during the six months ended October 31, 2014, the Fund did not have a liability for any unrecognized tax benefits. The Fund files U.S. federal, state, and local tax returns as required. The Fund’s tax returns are subject to examination by the relevant tax authorities until expiration of the applicable statute of limitations, which is generally three years after the filing of the tax return for federal purposes and four years for most state returns. Tax returns for open years have incorporated no uncertain tax positions that require a provision for income taxes.
Distributions to Shareholders: The Fund normally pays dividends and distributes capital gains, if any, on an annual basis. Income dividend distributions are derived from interest and other income the Fund receives from its investments, including short term capital gains. Long term capital gains distributions are derived from gains realized when the Fund sells a security it has owned for more than a year. The Fund may make additional distributions and dividends at other times if the portfolio manager believes doing so may be necessary for the Fund to avoid or reduce taxes.
14 |
www.aspenfuturesfund.com |
Table of Contents
| Aspen Managed Futures Strategy Fund | Notes to Consolidated Financial Statements | |
October 31, 2014 (Unaudited)
|
3. DERIVATIVE INSTRUMENTS
The Fund uses derivatives (including futures) to pursue its investment objective. The Fund’s use of derivative instruments involves risks different from, or possibly greater than, the risks associated with investing directly in securities and other traditional investments. These risks may include (i) the risk that the counterparty to a derivative transaction may not fulfill its contractual obligations, (ii) risk of mispricing or improper valuation, and (iii) the risk that changes in the value of the derivative may not correlate perfectly with the underlying asset, rate or index. These risks could cause the Fund to lose more than the principal amount invested. In addition, investments in derivatives involve leverage, which means a small percentage of assets invested in derivatives can have a disproportionately large impact on the Fund.
The Fund’s use of derivatives can result in losses due to unanticipated changes in the market risk factors and the overall market. In instances where the Fund is using derivatives to decrease, or hedge, exposures to market risk factors for securities held by the Fund, there are also risks that those derivatives may not perform as expected resulting in losses for the combined or hedged positions. Derivatives may have little or no initial cash investment relative to their market value exposure and therefore can produce significant gains or losses in excess of their cost. This use of embedded leverage allows the Fund to increase its market value exposure relative to its net assets and can substantially increase the volatility of the Fund’s performance.
In addition, use of derivatives may increase or decrease exposure to the following risk factors:
| — | Equity Risk: Equity risk relates to the change in value of equity securities as they relate to increases or decreases in the general market. |
| — | Fixed Income Risk: When the Fund invests in fixed-income securities or derivatives, the value of an investment in the Fund will fluctuate with changes in interest rates. Typically, a rise in interest rates causes a decline in the value of fixed-income securities or derivatives owned by the Fund. In general, the market price of debt securities with longer maturities will increase or decrease more in response to changes in interest rates than shorter-term securities. Other risk factors include credit risk (the debtor may default) and prepayment risk (the debtor may pay its obligation early, reducing the amount of interest payments). |
| — | Foreign Currency Risk: Currency trading involves significant risks, including market risk, interest rate risk, country risk, counterparty credit risk and short sale risk. Market risk results from the price movement of foreign currency values in response to shifting market supply and demand. Interest rate risk arises whenever a country changes its stated interest rate target associated with its currency. Country risk arises because virtually every country has interfered with international transactions in its currency. Counterparty credit risk arises when the counterparty will not fulfill its obligations to the Fund. Short sale risk arises from the sale of a security that is not owned, or any sale that is completed by the delivery of a security borrowed. |
| — | Commodity Risk: Exposure to the commodities markets may subject the Fund to greater volatility than investments in traditional securities. Commodity prices are influenced by unfavorable weather, animal and plant disease, geologic and environmental factors, as well as changes in government regulation such as tariffs, embargoes or burdensome production rules and restrictions. |
Futures: The Fund and the Subsidiary may enter into futures contracts. Futures contracts are agreements between two parties to buy and sell a particular commodity, instrument or index for a specified price on a specified future date. When the Fund or the Subsidiary enters into a futures contract, it is required to deposit with (or for the benefit of) its broker an amount of cash or short-term high-quality securities as “initial margin”. The margin requirements are set by the exchange on which the contract is traded and may be modified during the term of the contract. The initial margin is in the nature of a performance bond or good faith deposit on the futures contract that is returned to the Fund upon termination of the contract, assuming all contractual obligations have been satisfied. As the value of the contract changes, the value of the futures contract position increases or declines. Subsequent payments, known as “variation margin”, are made or received by the Fund or the Subsidiary, depending on the price fluctuations in the fair value of the contract and the value of cash or securities on deposit with the broker. The aggregate principal amounts of the contracts are not recorded in the financial statements. Fluctuations in the value of the contracts are recorded in the Consolidated Statements of Assets and Liabilities as an asset (liability) and in the Consolidated Statements of Operations as unrealized appreciation (depreciation) until the contracts are closed, when they are recorded as realized gains (losses). Realized gain or loss on a futures position is equal to the difference between the value of the contract at the time it was opened and the value at the time it was closed, minus brokerage commissions. When the Fund or the Subsidiary enters into a futures contract certain risks may arise, such as illiquidity in the futures market, which may limit the Fund’s or the Subsidiary’s ability to close out a futures contract prior to settlement date, and unanticipated movements in the value of securities, commodities or interest rates. Futures contracts are exchange-traded. Exchange-traded futures are standardized contracts and are settled through a clearing house with fulfillment supported by the credit of the exchange. Therefore, counterparty credit risk to the Fund and the Subsidiary is reduced. In addition, the Fund could be exposed to risk if the counterparties to the contracts are unable to meet the terms of their contracts. With exchange traded futures, there is minimal counterparty credit risk to the Funds since futures are exchange traded and the exchange’s clearinghouse, as a counterparty to all exchange traded futures, guarantees the futures against default.
Semi-Annual Report | October 31, 2014 |
15 |
Table of Contents
| Aspen Managed Futures Strategy Fund | Notes to Consolidated Financial Statements | |
October 31, 2014 (Unaudited) |
Consolidated Balance Sheet – Fair Value of Derivative Instruments as of October 31, 2014(a):
| Risk Exposure | Asset Derivatives Balance Sheet Location | Fair Value | Liabilities Derivatives Balance Sheet Location | Fair Value | ||||||||
| ||||||||||||
Futures Contracts* | Variation margin receivable | $ | 6,676,270 | Variation margin payable | $ | 2,759,324 | ||||||
| ||||||||||||
| $ | 6,676,270 | $ | 2,759,324 | |||||||||
| ||||||||||||
| *Risk Exposure to Fund | ||||||||||||
Commodity Contracts | $ | 2,354,935 | $ | 1,101,961 | ||||||||
Equity Contracts | 793,589 | 1,444,493 | ||||||||||
Fixed Income Contracts | 349,539 | 156,048 | ||||||||||
Foreign Currency Contracts | 3,178,207 | 56,822 | ||||||||||
|
| |||||||||||
| $ | 6,676,270 | $ | 2,759,324 | |||||||||
|
| |||||||||||
| (a) | For open derivative instruments as of October 31, 2014, see the Consolidated Schedule of Investments, which is also indicative of the activity for the six months ended October 31, 2014. |
Consolidated Statement of Operations – The effect of Derivative Instruments for the six months ended October 31, 2014:
| Derivatives Instruments | Location of Gain/(Loss) on Derivatives Recognized in Income | Realized Gain/(Loss) on Derivatives Recognized in Income | Change in Unrealized Gain/(Loss) on Derivatives Recognized in Income | |||||||
| ||||||||||
Futures Contracts* | Net realized loss on futures contracts/Net change in unrealized depreciation on futures contracts | $ | 10,036,394 | $ | 1,698,905 | |||||
|
| |||||||||
| $ | 10,036,394 | $ | 1,698,905 | |||||||
|
| |||||||||
| *Risk Exposure to Fund | ||||||||||
Commodity Contracts | $ | 4,236,502 | $ | 622,277 | ||||||
Equity Contracts | (1,947,663) | (1,171,482) | ||||||||
Fixed Income Contracts | 2,842,504 | 523 | ||||||||
Foreign Currency Contracts | 4,905,051 | 2,247,587 | ||||||||
|
| |||||||||
| $ | 10,036,394 | $ | 1,698,905 | |||||||
|
| |||||||||
4. TAX BASIS INFORMATION
Tax Basis of Investments: As of October 31, 2014, the aggregate cost of investments, gross unrealized appreciation/(depreciation) and net unrealized appreciation for Federal tax purposes was as follows:
| Cost of Investments | Gross Appreciation (excess of value over tax cost) | Gross Depreciation (excess of tax cost over value) | Net Appreciation on Futures Contracts and Foreign Currencies | Net Appreciation on Investments | |||||||||||||||||||||
Aspen Managed Futures Strategy Fund | $ | 133,773,439 | $ | 3,114,905 | $ | (3,010,536) | $ | – | $ | 104,369 | |||||||||||||||
Tax Basis of Distributions to Shareholders: Distributions are determined in accordance with federal income tax regulations, which differ from GAAP, and, therefore, may differ significantly in amount or character from net investment income and realized gains for financial reporting purposes. Financial reporting records are adjusted for permanent book/tax differences to reflect tax character but are not adjusted for temporary differences.
The tax character of distributions paid during the year ending April 30, 2014 were as follows:
| Ordinary Income | Long-Term Capital Gain | |||||||||
Aspen Managed Futures Strategy Fund | $ | – | $ | 2,321,185 | ||||||
During the six months October 31, 2014, the Fund did not make any distributions.
16 |
www.aspenfuturesfund.com |
Table of Contents
| Aspen Managed Futures Strategy Fund | Notes to Consolidated Financial Statements | |
October 31, 2014 (Unaudited)
|
5. SHARES OF BENEFICIAL INTEREST
The capitalization of the Trust consists of an unlimited number of shares of beneficial interest with no par value per share. Holders of the shares of the Fund of the Trust have one vote for each share held and a proportionate fraction of a vote for each fractional share. All shares issued and outstanding are fully paid and are non-assessable, transferable and redeemable at the option of the shareholder. Shares have no pre-emptive rights.
Fund shares redeemed within 30 days of purchase may incur a 2% short-term redemption fee deducted from the redemption amount. The amount of redemption fees received during the period are presented in the Consolidated Statement of Changes in Net Assets.
6. MANAGEMENT AND RELATED-PARTY TRANSACTIONS
Aspen Partners Ltd. (the “Adviser” or “Aspen”), subject to the authority of the Board, is responsible for the overall management and administration of the Fund’s business affairs. The Adviser manages the investments of the Fund in accordance with the Fund’s investment objective, policies and limitations and investment guidelines established jointly by the Adviser and the Board. Pursuant to the Investment Advisory Agreement, (the “Advisory Agreement”), the Fund will pay the Adviser an annual management fee of 0.75%, based on the Fund’s average daily net assets. The management fee is paid on a monthly basis.
The Subsidiary has entered into a separate advisory agreement (the “Subsidiary Advisory Agreement”) with Aspen, the Subsidiary’s investment adviser and the Fund’s investment adviser, for the management of the Subsidiary’s portfolio pursuant to which the Subsidiary is obligated to pay the Adviser a management fee at the same rate that the Fund pays the Adviser for investment advisory services provided to the Fund. The Adviser has agreed to waive the advisory fee it receives from the Fund in an amount equal to the management fee paid by the Subsidiary. This waiver may not be terminated or modified without the consent of the Board.
The Adviser has contractually agreed to waive and/or reimburse fees or expenses in order to limit total annual fund operating expenses after fee waiver/expense reimbursements (excluding distribution and service (12b-1) fees, shareholder services fees, acquired fund fees and expenses, brokerage expenses, interest expenses, taxes and extraordinary expenses) to 1.55% of the Fund’s average daily net assets. This agreement is in effect through August 31, 2016. This agreement may not be terminated or modified prior to this date except with the approval of the Board.
Pursuant to this agreement, the Fund will reimburse the Adviser for any fee waivers and expense reimbursements made by the Adviser, provided that any such reimbursements made by the Fund to the Adviser will not cause the Fund’s expense limitation to exceed expense limitations in existence at the time the expense was incurred, or at the time of the reimbursement, whichever is lower, and the reimbursement is made within three years after the expenses were incurred.
Fund Accounting Fees and Expenses
ALPS Fund Services, Inc. (“ALPS” and the “Administrator”) (an affiliate of ALPS Distributors, Inc.) serves as administrator to the Fund and Subsidiary. The Fund has agreed to pay expenses incurred in connection with its administrative activities. Pursuant to the Administration, Bookkeeping and Pricing Services Agreement, ALPS will provide operational services to the Fund including, but not limited to fund accounting and fund administration and generally assist in the Fund’s operations.
The Fund’s administration fee is accrued on a daily basis, and paid on a monthly basis following the end of the month, based on the greater of (a) an annual total fee of $165,000, subject to a 5% increase per annum or (b) the following basis point fee schedule:
| Average Total Net Assets | Contractual Fee | |
Between $0-$500M | 0.05% | |
$500M-$1B | 0.03% | |
Above $1B | 0.02% |
The Subsidiary’s administration fee is based on an annual rate of $45,000.
The Administrator is also reimbursed by the Fund for certain out-of-pocket expenses.
Transfer Agent
ALPS serves as transfer, dividend paying and shareholder servicing agent for the Fund. ALPS receives an annual minimum fee, a fee based upon the number of shareholder accounts, and is also reimbursed by the Fund for certain out-of-pocket expenses.
Semi-Annual Report | October 31, 2014 |
17 |
Table of Contents
| Aspen Managed Futures Strategy Fund | Notes to Consolidated Financial Statements | |
October 31, 2014 (Unaudited) |
Compliance Services
ALPS provides services that assist the Trust’s chief compliance officer in monitoring and testing the policies and procedures of the Trust in conjunction with requirements under Rule 38a-1 under the 1940 Act and receives an annual base fee. ALPS is reimbursed for certain out-of-pocket expenses by the Fund.
Principal Financial Officer
ALPS receives an annual fee for providing principal financial officer services to the Fund.
Distributor
ALPS Distributors, Inc. (“ADI” or the “Distributor”) (an affiliate of ALPS) acts as the distributor of the Fund’s shares pursuant to a Distribution Agreement with the Trust. Shares are sold on a continuous basis by ADI as agent for the Fund, and ADI has agreed to use its best efforts to solicit orders for the sale of the Fund’s shares, although it is not obliged to sell any particular amount of shares. ADI is not entitled to any compensation for its services as Distributor. ADI is registered as a broker-dealer with the Securities and Exchange Commission.
The Fund has adopted a plan of distribution for Class A shares pursuant to Rule 12b-1 under the 1940 Act (the “Plan”). The Plan allows the Fund to use Class A assets to pay fees in connection with the distribution and marketing of Class A shares and/or the provision of shareholder services to Class A shareholders. The Plan permits payment for services in connection with the administration of plans or programs that use Class A shares as their funding medium and for related expenses. The Plan permits the Fund to use its Class A assets to make total payments at an annual rate of up to 0.25% of the Fund’s average daily net assets attributable to its Class A shares. The expenses of the plan are reflected as distribution and service fees in the Consolidated Statement of Operations.
The Fund has adopted a shareholder service plan (a “Shareholder Services Plan”) for Class A shares. Under the Shareholder Services Plan the Fund is authorized to pay banks and their affiliates and other institutions, including broker-dealers and Fund affiliates (“Participating Organizations”), an aggregate fee in an amount not to exceed on an annual basis 0.15% for Class A shares of the average daily net asset value of the Class A shares, respectively, attributable to or held in the name of a Participating Organization for its clients as compensation for providing shareholder service activities, which do not include distribution services, pursuant to an agreement with a Participating Organization. Any amount of such payment not paid during the Fund’s fiscal year for such service activities shall be reimbursed to the Fund. Shareholder Services Plan fees are included with distribution and service fees on the Consolidated Statement of Operations.
Index Licensing Services
The Fund has adopted an Index Licensing Agreement with Quantitative Equity Strategies, LLC (“QES”) and the Adviser, joint owners of the Index, pursuant to which the Fund pays QES a monthly annualized licensing fee of 0.25%, based on the Fund’s average daily net assets for the right to use the Index in connection with the Fund.
7. SECURITIES TRANSACTIONS
The cost of purchases and proceeds from sales of U.S. Government securities (excluding short-term securities) during the six months ended October 31, 2014 were as follows:
| Aspen Managed Futures Strategy Fund | ||||
Cost of Investments Purchased | $ | 17,073,737 | ||
Proceeds from Investments Sold | $ | 23,760,410 | ||
8. INDEMNIFICATIONS
Under the Trust’s organizational documents, its officers and Trustees are indemnified against certain liability arising out of the performance of their duties to the Trust. Additionally, in the normal course of business, the Trust enters into contracts with service providers that may contain general indemnification clauses, which may permit indemnification to the extent permissible under applicable law. The Trust’s maximum exposure under these arrangements is unknown, as this would involve future claims that may be made against the Trust that have not yet occurred.
18 |
www.aspenfuturesfund.com |
Table of Contents
| Aspen Managed Futures Strategy Fund | Additional Information | |
October 31, 2014 (Unaudited) |
1. FUND HOLDINGS
The Fund files its complete schedule of portfolio holdings with the Securities and Exchange Commission (the “SEC”) for the first and third quarters of each fiscal year on Form N-Q within 60 days after the end of the period. Copies of the Fund’s Form N-Q are available without charge on the SEC website at http://www.sec.gov. You may also review and copy the Form N-Q at the SEC’s Public Reference Room in Washington, DC. For more information about the operation of the Public Reference Room, please call the SEC at 1-800-SEC-0330.
2. FUND PROXY VOTING POLICIES, PROCEDURES AND SUMMARIES
The Fund’s policies and procedures used in determining how to vote proxies and information regarding how the Fund voted proxies relating to portfolio securities during the most recent prior 12-month period ending June 30 are available without charge, (1) upon request, by calling (toll-free) 855-845-9444 and (2) on the SEC’s website at http://www.sec.gov.
Semi-Annual Report | October 31, 2014 |
19 |
Table of Contents
Page Intentionally Left Blank
Table of Contents
Table of Contents
Table of Contents
| ||||
| ||||
| 1 | ||||||||
| 3 | ||||||||
| 5 | ||||||||
| 6 | ||||||||
| 15 | ||||||||
| 16 | ||||||||
| 17 | ||||||||
| 18 | ||||||||
| 19 | ||||||||
| 25 | ||||||||
| 28 | ||||||||
Table of Contents
The Disciplined Growth Investors Fund | Shareholder Letter | |
October 31, 2014 (Unaudited) |
October 31, 2014
Dear Shareholders,
As of October 31, 2014, Disciplined Growth Investors, Inc. manages $101.6 million in The Disciplined Growth Investors Fund (the “DGI Fund” or “Fund”), with an allocation of approximately 75% equities and 25% bonds and cash. The DGI Fund posted a total return of 7.83% after fees during the first six months of the Fund’s fiscal year. The equity portion of the portfolio achieved a total return of 10.70% and the fixed income portion provided a return of 1.48%. The equity portion of the fund exceeded the return available from the S&P 500® Total Return Index(1) which was up 8.22% over the same period. The bond portion of the Fund trailed the Barclay’s U.S. Government/Credit Bond Index(2), which returned 2.19% over the same period.
The DGI Fund turned three years old in August of 2014. Since inception (August 12, 2011), the DGI Fund has earned a compound annual total return of 17.02% per year. Stocks in the Fund have returned 24.03% and fixed income has added 3.86%. Stocks in The DGI Fund have substantially outperformed major stock indexes and bonds in the Fund have outperformed the most comparable bond index. Since the Fund’s inception the S&P 500® Total Return Index has earned a compound annual total return of 20.75% and the Barclay’s U.S. Government/Credit Bond Index returned 2.94% per year.
During the last six months, the macroeconomic environment has been problematic; US GDP actually declined in the first calendar quarter of 2014 and has only slightly improved since then. The rest of the world is not exhibiting strong growth. China appears to be having problems of its own. There are many conflicts around the world, with the new insurgency in Iraq and Syria just the latest. The domestic political environment is unsettled. Investor confidence is hardly helped by the continuing litigation over the Affordable Care Act or the unprecedented leveraging of the Federal Reserve Bank or the humanitarian crisis on the southern border.
We consider the macroeconomic picture to be a negative factor for markets and we note these negative developments command most of the attention from the financial press. The positive forces are less obvious but equally powerful. The most positive force has been the sustained earnings and cash flow progress by the companies in the U.S. and importantly those in the mutual fund. The managements of these companies deserve great credit for ignoring the macroeconomic/political conditions and focusing on managing their businesses. The quarterly earnings reports of your mutual fund holdings in June and September reinforced the effectiveness of your company managers. The fundamental progress of your holdings has kept the stocks within reasonable valuations. Which brings up the second major positive; the expected returns from your stocks under reasonable assumptions far exceeds the returns available from the two other liquid asset categories, bonds and money market funds. The net effect of these opposing forces has been stocks significantly outperforming bonds during the last six months. Because the Fund is heavily weighted towards stocks, the performance of the Fund during the six months was strongly positive.
Even though we expect the favorable progress of our companies and our stocks’ significant relative attractiveness to bonds to yield excellent long-term returns, we think it is imprudent to expect quick resolution of the many macroeconomic issues facing the country. The political system in the U.S. was designed to move slowly and we expect this time will be no different. This will present
Semi-Annual Report | October 31, 2014 |
1 |
Table of Contents
The Disciplined Growth Investors Fund | Shareholder Letter | |
October 31, 2014 (Unaudited) |
investors with a difficult challenge- does one wait for macroeconomic and political progress before buying stocks or does one invest in stocks today and trust that the macro environment will improve? To us, the answer is clear; invest in stocks based on their long-term appeal. For those who wait for a more favorable environment we believe the progress may be so slow that identifying an inflection point may be nigh impossible.
Fixed income holdings will continue to be an integral part of The DGI Fund. The Fund will continue to invest a not significant portion of its assets in fixed income securities. While current interest rates do not suggest investors in bonds will earn high returns, we think it is prudent to maintain a balance of stocks and bonds in the fund. Obviously we are maintaining tight control over maturities in the likelihood that interest rates will rise. Eventually the expected returns between stocks and bonds will narrow and we expect to move to a slightly more balanced mix of stocks and bonds.
Thank you for your patience.
Frederick K. Martin, CFA
Chief Investment Officer
Disciplined Growth Investors, Inc.
The views and information discussed in this commentary are as of the date of publication, are subject to change, and may not reflect the writer’s current views. The views expressed represent an assessment of market conditions at a specific point in time, are opinions only and should not be relied upon as investment advice regarding a particular investment or markets in general. Such information does not constitute a recommendation to buy or sell specific securities or investment vehicles. It should not be assumed that any investment will be profitable or will equal the performance of the Fund or any securities or any sectors mentioned in this letter. The subject matter contained in this letter has been derived from several sources believed to be reliable and accurate at the time of compilation. Neither Disciplined Growth Investors, Inc. nor the DGI Fund accepts any liability for losses either direct or consequential caused by the use of this information.
Fred Martin is a registered representative of ALPS Distributors, Inc.
ALPS Distributors, Inc. is the Distributor for The Disciplined Growth Investors Fund.
| (1) | The S&P 500® Total Return Index is an unmanaged index of 500 common stocks chosen for market size, liquidity and industry group representation. It is a market-value weighted index. The Index is not actively managed and does not reflect any deductions for fees, expenses or taxes. An investor may not invest directly in the Index. |
| (2) | Barclays U.S. Government/Credit Bond Index is composed of all bonds that are of investment grade with at least one year until maturity. The Index is not actively managed and does not reflect any deductions for fees, expenses or taxes. An investor may not invest directly in the Index. |
2 |
1-855-DGI-FUND (344-3863) | www.DGIfund.com |
Table of Contents
The Disciplined Growth Investors Fund | Performance Update | |
October 31, 2014 (Unaudited) |
Cumulative Total Return Performance (for the period ended October 31, 2014)
| Since | ||||||||||||||
| 1 month | Quarter | 6 month | YTD | 1 Year | 3 Year | Inception* | ||||||||
Disciplined Growth Investors Fund | 3.66% | 6.30% | 7.83% | 6.95% | 13.51% | 15.06% | 17.02% | |||||||
S&P 500® Total Return Index(1) | 2.44% | 5.05% | 8.22% | 10.99% | 17.27% | 19.77% | 20.75% |
| * | Fund Inception date of August 12, 2011 |
| (1) | The S&P 500® Total Return Index is an unmanaged index of 500 common stocks chosen for market size, liquidity and industry group representation. It is a market-value weighted index. The Index is not actively managed and does not reflect any deductions for fees, expenses or taxes. An investor may not invest directly in the Index. |
The returns shown above do not reflect the deductions of taxes a shareholder would pay on Fund distributions or redemptions of Fund shares.
Returns less than one year are cumulative.
Performance data quoted represents past performance. Past performance does not guarantee future results. Investment return and principal value of an investment will fluctuate so that an investor’s shares, when sold or redeemed, may be worth more or less than the original cost. Current performance data may be higher or lower than actual data quoted. For the most current month-end performance data please call 1.855.DGI.FUND.
Semi-Annual Report | October 31, 2014 |
3 |
Table of Contents
The Disciplined Growth Investors Fund | Performance Update | |
October 31, 2014 (Unaudited) |
Growth of $10,000 Investment in the Fund (for the period ended October 31, 2014)
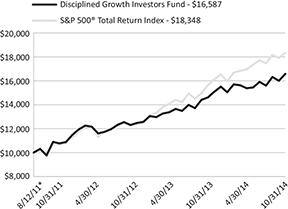
The chart represents historical performance of a hypothetical investment of $10,000 in the Fund since inception. Past performance does not guarantee future results. This chart does not reflect the deduction of taxes that a shareholder would pay on Fund distributions or the redemption of Fund shares.
Investing in the Fund is subject to investment risks, including possible loss of the principal amount invested.
Industry Sector Allocation (as a % of Net Assets)* | ||||||
Technology | 27.69 | % | ||||
Consumer Discretionary | 20.29 | % | ||||
Producer Durables | 12.55 | % | ||||
Health Care | 8.25 | % | ||||
Utilities | 1.02 | % | ||||
Energy | 1.43 | % | ||||
Financial Services | 3.87 | % | ||||
Asset/Mortgage Backed Securities | 0.18 | % | ||||
Corporate Bond | 22.44 | % | ||||
Foreign Government Bonds | 0.49 | % | ||||
Government & Agency Obligations | 0.12 | % | ||||
Other Assets in Excess of Liabilities | 1.67 | % |
* Holdings are subject to change.
Top Ten Holdings (as a % of Net Assets)* | ||||||
TJX Cos., Inc. | 4.53 | % | ||||
Intuit, Inc. | 3.78 | % | ||||
Edwards Lifesciences Corp. | 3.53 | % | ||||
Seagate Technology PLC | 3.31 | % | ||||
Middleby Corp. | 3.02 | % | ||||
Open Text Corp. | 2.98 | % | ||||
L Brands, Inc. | 2.67 | % | ||||
Yahoo!, Inc. | 2.52 | % | ||||
Plexus Corp. | 2.47 | % | ||||
Autodesk, Inc. | 2.31 | % | ||||
Top Ten Holdings | 31.12 | % |
4 |
1-855-DGI-FUND (344-3863) | www.DGIfund.com |
Table of Contents
The Disciplined Growth Investors Fund | Disclosure of Fund Expenses | |
October 31, 2014 (Unaudited) |
As a shareholder of a Fund, you incur two types of costs: direct costs, such as short-term redemption fees and wire fees, balance fees, and indirect costs, including management fees, and other fund operating expenses. This example is intended to help you understand your indirect costs, also referred to as “ongoing costs” (in dollars), of investing in the Fund and to compare these costs with the ongoing costs of investing in other mutual funds.
This example is based on an investment of $1,000 invested at the beginning of the period and held for the entire six-month period of May 1, 2014 through October 31, 2014.
Actual Expenses The first line of the table below provides information about actual account values and actual expenses. You may use the information in this line, together with the amount you invested at the beginning of the period, to estimate the expenses that you paid over the period. Simply divide your account value by $1,000 (for example, an $8,600 account value divided by $1,000 = 8.6), then multiply the result by the number in the first line under the heading “Expenses Paid During Period” to estimate the expenses you paid on your account during this period.
Hypothetical Example for Comparison Purposes The second line of the table provides information about hypothetical account values and hypothetical expenses based on the Fund’s actual expense ratio and an assumed rate of return of 5% per year before expenses, which is not the Fund’s actual return. The hypothetical account values and expenses may not be used to estimate the actual ending account balance or expenses you paid for the period. You may use this information to compare ongoing costs of investing in the Fund and other funds. To do so, compare this 5% hypothetical example with the 5% hypothetical examples that appear in the shareholder reports of other funds.
Please note that the expenses shown in the table are meant to highlight your ongoing costs only and do not reflect any direct costs, such as wire fees or low balance fees. Therefore, the second line of the table is useful in comparing ongoing costs only and will not help you determine the relative total costs of owning different funds. In addition, if these direct costs were included, your costs would be higher.
Beginning Account 5/1/2014 | Ending Account 10/31/2014 | Expense Ratio(a) | Expenses Paid During period 5/1/2014 - 10/31/2014(b) | |||||||||||||||||
Actual | $ | 1,000.00 | $ | 1,078.30 | 0.78 | % | $ | 4.09 | ||||||||||||
Hypothetical (5% return before expenses) | $ | 1,000.00 | $ | 1,021.27 | 0.78 | % | $ | 3.97 | ||||||||||||
| (a) | The Fund’s expense ratios have been annualized based on the Fund’s most recent fiscal half-year expenses. |
| (b) | Expenses are equal to the Fund’s annualized expense ratio, multiplied by the average account value over the period, multiplied by the number of days in the most recent fiscal half-year (184)/365 (to reflect the half-year period). |
Semi-Annual Report | October 31, 2014 |
5 |
Table of Contents
The Disciplined Growth Investors Fund | Portfolio of Investments | |
October 31, 2014 (Unaudited)
|
| Shares | Value (Note 2) | |||||||
| ||||||||
COMMON STOCKS (75.10%) | ||||||||
CONSUMER DISCRETIONARY (20.29%) | ||||||||
Auto & Auto Parts (1.51%) | ||||||||
Gentex Corp. | 46,800 | $ | 1,532,232 | |||||
|
| |||||||
Consumer Products (5.58%) | ||||||||
Ethan Allen Interiors, Inc. | 45,569 | 1,289,603 | ||||||
Garmin Ltd. | 25,163 | 1,396,043 | ||||||
Ralph Lauren Corp. | 9,431 | 1,554,606 | ||||||
Select Comfort Corp.(a) | 55,436 | 1,424,151 | ||||||
|
| |||||||
| 5,664,403 | ||||||||
|
| |||||||
Leisure (2.50%) | ||||||||
Cheesecake Factory, Inc. | 14,650 | 673,021 | ||||||
Royal Caribbean Cruises Ltd. | 27,400 | 1,862,378 | ||||||
|
| |||||||
| 2,535,399 | ||||||||
|
| |||||||
Media (0.61%) | ||||||||
DreamWorks Animation SKG, Inc. - | 27,962 | 622,993 | ||||||
|
| |||||||
Retail (9.47%) | ||||||||
Cabela’s, Inc.(a) | 35,200 | 1,690,304 | ||||||
L Brands, Inc. | 37,580 | 2,710,270 | ||||||
TJX Cos., Inc. | 72,575 | 4,595,449 | ||||||
Urban Outfitters, Inc.(a) | 20,500 | 622,380 | ||||||
|
| |||||||
| 9,618,403 | ||||||||
|
| |||||||
Textiles, Apparel & Luxury Goods (0.62%) | ||||||||
Tumi Holdings, Inc.(a) | 30,325 | 629,850 | ||||||
|
| |||||||
TOTAL CONSUMER DISCRETIONARY | 20,603,280 | |||||||
|
| |||||||
ENERGY (1.43%) | ||||||||
Energy Equipment & Services (0.83%) | ||||||||
Noble Corp. PLC | 40,232 | 841,653 | ||||||
|
| |||||||
Oil & Gas (0.06%) | ||||||||
Paragon Offshore PLC | 13,410 | 65,307 | ||||||
|
| |||||||
6 |
1-855-DGI-FUND (344-3863) | www.DGIfund.com |
Table of Contents
The Disciplined Growth Investors Fund | Portfolio of Investments | |
October 31, 2014 (Unaudited)
|
| Shares | Value (Note 2) | |||||||
| ||||||||
ENERGY (continued) | ||||||||
Oil, Gas & Consumable Fuels (0.54%) | ||||||||
Ultra Petroleum Corp.(a) | 24,075 | $ | 548,910 | |||||
|
| |||||||
TOTAL ENERGY | 1,455,870 | |||||||
|
| |||||||
FINANCIAL SERVICES (3.87%) | ||||||||
Banks (0.59%) | ||||||||
TCF Financial Corp. | 38,725 | 598,301 | ||||||
|
| |||||||
Consumer Finance & Credit Services (1.89%) | ||||||||
FactSet Research Systems, Inc. | 14,644 | 1,924,808 | ||||||
|
| |||||||
Investment Banking & Brokerage (1.39%) | ||||||||
E*Trade Financial Corp.(a) | 30,196 | 673,371 | ||||||
Janus Capital Group, Inc. | 49,175 | 737,133 | ||||||
|
| |||||||
| 1,410,504 | ||||||||
|
| |||||||
TOTAL FINANCIAL SERVICES | 3,933,613 | |||||||
|
| |||||||
HEALTH CARE (8.25%) | ||||||||
Biotechnology (0.70%) | ||||||||
Myriad Genetics, Inc.(a) | 17,925 | 707,858 | ||||||
|
| |||||||
Medical Equipment & Services (6.60%) | ||||||||
Edwards Lifesciences Corp.(a) | 29,650 | 3,585,278 | ||||||
Intuitive Surgical, Inc.(a) | 3,612 | 1,790,830 | ||||||
Varian Medical Systems, Inc.(a) | 15,750 | 1,324,890 | ||||||
|
| |||||||
| 6,700,998 | ||||||||
|
| |||||||
Medical Specialties (0.95%) | ||||||||
Align Technology, Inc.(a) | 18,300 | 962,946 | ||||||
|
| |||||||
TOTAL HEALTH CARE | 8,371,802 | |||||||
|
| |||||||
PRODUCER DURABLES (12.55%) | ||||||||
Computers (0.65%) | ||||||||
IHS, Inc. - Class A(a) | 5,000 | 655,150 | ||||||
|
| |||||||
Machinery (3.02%) | ||||||||
Middleby Corp.(a) | 34,704 | 3,071,304 | ||||||
|
| |||||||
Semi-Annual Report | October 31, 2014 |
7 |
Table of Contents
The Disciplined Growth Investors Fund | Portfolio of Investments | |
October 31, 2014 (Unaudited)
|
| Value | ||||||||
| Shares | (Note 2) | |||||||
PRODUCER DURABLES (continued) | ||||||||
Machinery-Diversified (0.75%) | ||||||||
Graco, Inc. | 9,725 | $ | 763,412 | |||||
|
| |||||||
Manufacturing & Production (1.74%) | ||||||||
Eaton Corp. PLC | 25,864 | 1,768,839 | ||||||
|
| |||||||
Professional Services (1.35%) | ||||||||
Corporate Executive Board Co. | 18,625 | 1,372,662 | ||||||
|
| |||||||
Scientific Instruments & Services (1.95%) | ||||||||
Brady Corp. - Class A | 13,100 | 312,304 | ||||||
Trimble Navigation Ltd.(a) | 61,950 | 1,663,977 | ||||||
|
| |||||||
| 1,976,281 | ||||||||
|
| |||||||
Software (0.61%) | ||||||||
Paychex, Inc. | 13,225 | 620,782 | ||||||
|
| |||||||
Transportation & Freight (2.48%) | ||||||||
JetBlue Airways Corp.(a) | 81,675 | 942,530 | ||||||
Landstar System, Inc. | 21,225 | 1,570,862 | ||||||
|
| |||||||
| 2,513,392 | ||||||||
|
| |||||||
TOTAL PRODUCER DURABLES | 12,741,822 | |||||||
|
| |||||||
TECHNOLOGY (27.69%) | ||||||||
Computers (0.64%) | ||||||||
Imation Corp.(a) | 800 | 2,344 | ||||||
Teradata Corp.(a) | 15,400 | 651,728 | ||||||
|
| |||||||
| 654,072 | ||||||||
|
| |||||||
Electronics (7.17%) | ||||||||
ARM Holdings PLC ADR | 19,812 | 846,171 | ||||||
Microchip Technology, Inc. | 20,900 | 900,999 | ||||||
Open Text Corp. | 54,862 | 3,023,993 | ||||||
Plexus Corp.(a) | 60,700 | 2,509,945 | ||||||
|
| |||||||
| 7,281,108 | ||||||||
|
| |||||||
8 |
1-855-DGI-FUND (344-3863) | www.DGIfund.com |
Table of Contents
The Disciplined Growth Investors Fund | Portfolio of Investments | |
October 31, 2014 (Unaudited)
|
| Value | ||||||||
| Shares | (Note 2) | |||||||
TECHNOLOGY (continued) | ||||||||
Information Technology (15.45%) | ||||||||
Akamai Technologies, Inc.(a) | 35,475 | $ | 2,139,143 | |||||
Apple, Inc. | 7,351 | 793,908 | ||||||
Autodesk, Inc.(a) | 40,850 | 2,350,509 | ||||||
Dolby Laboratories, Inc. - Class A | 15,625 | 655,000 | ||||||
Intuit, Inc. | 43,575 | 3,835,036 | ||||||
Seagate Technology PLC | 53,487 | 3,360,588 | ||||||
Yahoo!, Inc.(a) | 55,500 | 2,555,775 | ||||||
|
| |||||||
| 15,689,959 | ||||||||
|
| |||||||
Semiconductors (0.07%) | ||||||||
Power Integrations, Inc. | 1,400 | 70,504 | ||||||
|
| |||||||
Software (1.66%) | ||||||||
Qlik Technologies, Inc.(a) | 32,000 | 907,200 | ||||||
RealPage, Inc.(a) | 39,000 | 774,930 | ||||||
|
| |||||||
| 1,682,130 | ||||||||
|
| |||||||
Telecommunications (2.70%) | ||||||||
Aruba Networks, Inc.(a) | 34,200 | 738,036 | ||||||
Plantronics, Inc. | 28,700 | 1,488,669 | ||||||
ViaSat, Inc.(a) | 8,244 | 516,404 | ||||||
|
| |||||||
| 2,743,109 | ||||||||
|
| |||||||
TOTAL TECHNOLOGY | 28,120,882 | |||||||
|
| |||||||
UTILITIES (1.02%) | ||||||||
Utilities (1.02%) | ||||||||
tw telecom, Inc.(a) | 24,200 | 1,035,276 | ||||||
|
| |||||||
TOTAL UTILITIES | 1,035,276 | |||||||
|
| |||||||
TOTAL COMMON STOCKS (Cost $53,009,269) | 76,262,545 | |||||||
|
| |||||||
Semi-Annual Report | October 31, 2014 |
9 |
Table of Contents
The Disciplined Growth Investors Fund | Portfolio of Investments | |
October 31, 2014 (Unaudited) |
| Principal | Value | |||||||
| Amount | (Note 2) | |||||||
| ||||||||
ASSET/MORTGAGE BACKED SECURITIES (0.18%) | ||||||||
Government National Mortgage Association, Series 2005-93 | ||||||||
5.500% 12/20/2034 | $ | 175,318 | $ | 183,249 | ||||
|
| |||||||
TOTAL ASSET/MORTGAGE BACKED SECURITIES (Cost $189,575) | 183,249 | |||||||
|
| |||||||
CORPORATE BONDS (22.44%) | ||||||||
21st Century Fox America, Inc. | ||||||||
6.900% 03/01/2019 | 265,000 | 315,428 | ||||||
Advance Auto Parts, Inc. | ||||||||
5.750% 05/01/2020 | 283,000 | 319,008 | ||||||
Ameren Illinois Co. | ||||||||
9.750% 11/15/2018 | 236,000 | 305,551 | ||||||
American Express Co. | ||||||||
7.000% 03/19/2018 | 374,000 | 436,227 | ||||||
American International Group, Inc. | ||||||||
5.850% 01/16/2018 | 289,000 | 325,933 | ||||||
Anheuser-Busch InBev Worldwide, Inc. | ||||||||
5.375% 01/15/2020 | 280,000 | 318,338 | ||||||
Arizona Public Service Co. | ||||||||
8.750% 03/01/2019 | 251,000 | 319,090 | ||||||
AT&T, Inc. | ||||||||
5.500% 02/01/2018 | 428,000 | 479,410 | ||||||
Bank of America Corp. | ||||||||
5.650% 05/01/2018 | 290,000 | 324,007 | ||||||
CenterPoint Energy Resources Corp. | ||||||||
6.000% 05/15/2018 | 279,000 | 316,996 | ||||||
Coca-Cola HBC Finance BV | ||||||||
5.500% 09/17/2015 | 246,000 | 255,130 | ||||||
Comcast Cable Communications Holdings, Inc. | ||||||||
9.455% 11/15/2022 | 210,000 | 301,415 | ||||||
Commonwealth Edison Co. | ||||||||
5.800% 03/15/2018 | 233,000 | 264,782 | ||||||
Connecticut Light & Power Co., Series 09-A | ||||||||
5.500% 02/01/2019 | 198,000 | 224,608 | ||||||
ConocoPhillips Holding Co. | ||||||||
6.950% 04/15/2029 | 237,000 | 320,813 | ||||||
Corning, Inc. | ||||||||
6.625% 05/15/2019 | 269,000 | 320,537 | ||||||
Corporacion Andina de Fomento | ||||||||
5.750% 01/12/2017 | 1,000 | 1,099 | ||||||
8.125% 06/04/2019 | 205,000 | 253,792 | ||||||
10 |
1-855-DGI-FUND (344-3863) | www.DGIfund.com |
Table of Contents
The Disciplined Growth Investors Fund | Portfolio of Investments | |
October 31, 2014 (Unaudited) |
| Principal | Value | |||||||
| Amount | (Note 2) | |||||||
| ||||||||
CORPORATE BONDS (continued) | ||||||||
CSX Corp. | ||||||||
7.375% 02/01/2019 | $ | 258,000 | $ | 311,933 | ||||
CVS Health Corp. | ||||||||
4.125% 05/15/2021 | 296,000 | 321,821 | ||||||
DCP Midstream Operating LP | ||||||||
3.875% 03/15/2023 | 312,000 | 312,757 | ||||||
Diageo Capital PLC | ||||||||
5.750% 10/23/2017 | 429,000 | 482,262 | ||||||
Dominion Resources, Inc. | ||||||||
2.250% 09/01/2015 | 500,000 | 506,012 | ||||||
Edison International | ||||||||
3.750% 09/15/2017 | 296,000 | 313,823 | ||||||
El Paso Natural Gas Co. LLC | ||||||||
5.950% 04/15/2017 | 292,000 | 323,526 | ||||||
Emerson Electric Co. | ||||||||
5.000% 04/15/2019 | 280,000 | 315,727 | ||||||
Energy Transfer Partners LP | ||||||||
9.700% Perpetual Maturity (b) | 245,000 | 314,123 | ||||||
Enterprise Products Operating LLC | ||||||||
5.200% 09/01/2020 | 279,000 | 313,559 | ||||||
Fluor Corp. | ||||||||
3.375% 09/15/2021 | 305,000 | 317,831 | ||||||
General Electric Capital Corp. | ||||||||
5.875% 01/14/2038 | 256,000 | 314,987 | ||||||
Georgia Power Co. | ||||||||
5.400% 06/01/2018 | 240,000 | 270,260 | ||||||
Health Care REIT, Inc. | ||||||||
6.200% 06/01/2016 | 252,000 | 272,611 | ||||||
ITC Holdings Corp. | ||||||||
4.050% 07/01/2023 | 195,000 | 204,200 | ||||||
Jersey Central Power & Light Co. | ||||||||
7.350% 02/01/2019 | 428,000 | 511,928 | ||||||
Johnson & Johnson | ||||||||
5.850% 07/15/2038 | 205,000 | 272,362 | ||||||
Joy Global, Inc. | ||||||||
6.000% 11/15/2016 | 445,000 | 485,282 | ||||||
JPMorgan Chase & Co. | ||||||||
1.800% 01/25/2018 | 316,000 | 316,159 | ||||||
Lockheed Martin Corp. | ||||||||
4.250% 11/15/2019 | 287,000 | 314,662 | ||||||
Lubrizol Corp. | ||||||||
8.875% 02/01/2019 | 245,000 | 310,104 | ||||||
McDonald’s Corp. | ||||||||
6.300% 03/01/2038 | 190,000 | 246,412 | ||||||
Semi-Annual Report | October 31, 2014 |
11 |
Table of Contents
The Disciplined Growth Investors Fund | Portfolio of Investments | |
October 31, 2014 (Unaudited) |
| Principal | Value | |||||||
| Amount | (Note 2) | |||||||
| ||||||||
CORPORATE BONDS (continued) | ||||||||
MetLife, Inc. | ||||||||
6.750% 06/01/2016 | $ | 386,000 | $ | 421,482 | ||||
National Rural Utilities Cooperative Finance Corp. | ||||||||
10.375% 11/01/2018 | 354,000 | 466,425 | ||||||
Nevada Power Co. | ||||||||
7.125% 03/15/2019 | 259,000 | 311,356 | ||||||
Noble Energy, Inc. | ||||||||
8.250% 03/01/2019 | 249,000 | 307,142 | ||||||
Nucor Corp. | ||||||||
5.750% 12/01/2017 | 287,000 | 320,289 | ||||||
Ohio Power Co., Series M | ||||||||
5.375% 10/01/2021 | 274,000 | 319,319 | ||||||
Oncor Electric Delivery Co. LLC | ||||||||
7.000% 09/01/2022 | 254,000 | 322,521 | ||||||
ONEOK Partners LP | ||||||||
3.200% 09/15/2018 | 395,000 | 409,039 | ||||||
Pepsi Bottling Group, Inc., Series B | ||||||||
7.000% 03/01/2029 | 240,000 | 327,736 | ||||||
Plains All American Pipeline LP / Plains All American Finance Corp. | ||||||||
8.750% 05/01/2019 | 247,000 | 313,204 | ||||||
PPL Capital Funding, Inc. | ||||||||
3.500% 12/01/2022 | 505,000 | 511,014 | ||||||
PSEG Power LLC | ||||||||
2.450% 11/15/2018 | 315,000 | 318,583 | ||||||
5.320% 09/15/2016 | 440,000 | 474,564 | ||||||
Puget Energy, Inc. | ||||||||
5.625% 07/15/2022 | 278,000 | 321,380 | ||||||
Republic Services, Inc. | ||||||||
5.500% 09/15/2019 | 273,000 | 311,151 | ||||||
Royal Bank of Scotland Group PLC, Series 1 | ||||||||
9.118% Perpetual Maturity (b) | 3,000 | 3,011 | ||||||
Sempra Energy | ||||||||
6.500% 06/01/2016 | 445,000 | 484,062 | ||||||
TCI Communications, Inc. | ||||||||
8.750% 08/01/2015 | 691,000 | 732,582 | ||||||
TECO Finance, Inc. | ||||||||
6.572% 11/01/2017 | 280,000 | 319,787 | ||||||
Texas Gas Transmission LLC | ||||||||
4.600% 06/01/2015 | 209,000 | 213,797 | ||||||
Total System Services, Inc. | ||||||||
2.375% 06/01/2018 | 325,000 | 324,018 | ||||||
TransCanada PipeLines Ltd. | ||||||||
7.250% 08/15/2038 | 202,000 | 272,572 | ||||||
12 |
1-855-DGI-FUND (344-3863) | www.DGIfund.com |
Table of Contents
The Disciplined Growth Investors Fund | Portfolio of Investments | |
October 31, 2014 (Unaudited) |
| Principal | Value | |||||||
| Amount | (Note 2) | |||||||
| ||||||||
CORPORATE BONDS (continued) | ||||||||
Tyco Electronics Group SA | ||||||||
3.500% 02/03/2022 | $ | 287,000 | $ | 296,645 | ||||
Unilever Capital Corp. | ||||||||
4.800% 02/15/2019 | 279,000 | 311,675 | ||||||
United Parcel Service, Inc. | ||||||||
6.200% 01/15/2038 | 195,000 | 258,886 | ||||||
Verizon Communications, Inc. | ||||||||
4.500% 09/15/2020 | 289,000 | 314,016 | ||||||
Viacom, Inc. | ||||||||
2.500% 09/01/2018 | 311,000 | 316,074 | ||||||
Wal-Mart Stores, Inc. | ||||||||
6.200% 04/15/2038 | 211,000 | 277,022 | ||||||
Waste Management, Inc. | ||||||||
7.375% 03/11/2019 | 258,000 | 311,971 | ||||||
Xerox Business Services LLC | ||||||||
5.200% 06/01/2015 | 138,000 | 141,478 | ||||||
|
| |||||||
TOTAL CORPORATE BONDS (Cost $22,546,204) | 22,787,306 | |||||||
|
| |||||||
FOREIGN GOVERNMENT BONDS (0.49%) | ||||||||
Israel Government AID Bonds | ||||||||
5.500% 12/04/2023 | 203,000 | 248,309 | ||||||
Province of Quebec Canada, Series NN | ||||||||
7.125% 02/09/2024 | 191,000 | 252,850 | ||||||
|
| |||||||
TOTAL FOREIGN GOVERNMENT BONDS (Cost $498,402) | 501,159 | |||||||
|
| |||||||
GOVERNMENT & AGENCY OBLIGATIONS (0.12%) | ||||||||
U.S. Treasury Bonds | ||||||||
5.125% 05/15/2016 | 20,000 | 21,464 | ||||||
6.500% 11/15/2026 | 28,000 | 39,686 | ||||||
U.S. Treasury Notes | ||||||||
4.500% 11/15/2015 | 16,000 | 16,715 | ||||||
4.500% 02/15/2016 | 38,000 | 40,075 | ||||||
|
| |||||||
TOTAL GOVERNMENT & AGENCY OBLIGATIONS (Cost $117,978) | 117,940 | |||||||
|
| |||||||
Semi-Annual Report | October 31, 2014 |
13 |
Table of Contents
The Disciplined Growth Investors Fund | Portfolio of Investments | |
October 31, 2014 (Unaudited) |
| 7-Day | Value | |||||||||||
| Yield | Shares | (Note 2) | ||||||||||
| ||||||||||||
SHORT TERM INVESTMENTS (1.55%) | ||||||||||||
Fidelity Institutional Money Market | ||||||||||||
Government Portfolio - Class I | 0.01 | % | 1,572,062 | $ | 1,572,062 | |||||||
|
| |||||||||||
TOTAL SHORT TERM INVESTMENTS (Cost $1,572,062) | 1,572,062 | |||||||||||
|
| |||||||||||
TOTAL INVESTMENTS (99.88%) (Cost $77,933,490) | $ | 101,424,261 | ||||||||||
Other Assets In Excess Of Liabilities (0.12%) | 125,878 | |||||||||||
|
| |||||||||||
NET ASSETS (100.00%) | $ | 101,550,139 | ||||||||||
|
| |||||||||||
| (a) | Non-Income Producing Security. |
| (b) | This security has no contractual maturity date, is not redeemable and contractually pays an indefinite stream of interest. |
Common Abbreviations:
ADR - American Depositary Receipt.
AID - Agency for International Development.
BV - Besloten Vennootschap is the Dutch term for private limited liability company.
LLC - Limited Liability Company.
LP - Limited Partnership.
Ltd. - Limited.
PLC - Public Limited Company.
REIT - Real Estate Investment Trust.
SA - Generally designates corporations in various countries, mostly those employing the civil law. This translates literally in all languages mentioned as anonymous company.
Holdings are subject to change.
For Fund compliance purposes, the Fund’s industry classifications refer to any one or more of the industry sub-classifications used by one or more widely recognized market indexes or ratings group indexes, and/or as defined by Fund management. This definition may not apply for purposes of this report, which may combine industry sub-classifications for reporting ease. Industries are shown as a percent of net assets.
See Notes to Financial Statements.
14 |
1-855-DGI-FUND (344-3863) | www.DGIfund.com |
Table of Contents
The Disciplined Growth Investors Fund | Statement of Assets and Liabilities | |
| October 31, 2014 (Unaudited) |
| ||||
ASSETS | ||||
Investments, at value | $ | 101,424,261 | ||
Dividends and interest receivable | 352,903 | |||
| ||||
Total assets | 101,777,164 | |||
| ||||
LIABILITIES | ||||
Payable for investments purchased | 166,093 | |||
Payable to adviser | 60,932 | |||
| ||||
Total liabilities | 227,025 | |||
| ||||
NET ASSETS | $ | 101,550,139 | ||
| ||||
NET ASSETS CONSIST OF | ||||
Paid-in capital (Note 5) | $ | 77,278,000 | ||
Accumulated net investment income | 68,403 | |||
Accumulated net realized gain on investments | 712,965 | |||
Net unrealized appreciation on investments | 23,490,771 | |||
| ||||
NET ASSETS | $ | 101,550,139 | ||
| ||||
INVESTMENTS, AT COST | $ | 77,933,490 | ||
PRICING OF SHARES | ||||
Net Asset Value, offering and redemption price per share | $ | 16.16 | ||
Shares of beneficial interest outstanding | 6,285,845 | |||
See Notes to Financial Statements.
Semi-Annual Report | October 31, 2014 |
15 |
Table of Contents
The Disciplined Growth Investors Fund | Statement of Operations | |
| For the Six Months Ended October 31, 2014 (Unaudited) | ||||||
| ||||||
INVESTMENT INCOME | ||||||
Dividends | $ | 355,626 | ||||
Foreign taxes withheld | (2,619) | |||||
Interest | 268,464 | |||||
| ||||||
Total investment income | 621,471 | |||||
| ||||||
EXPENSES | ||||||
Investment advisory fees (Note 6) | 353,747 | |||||
| ||||||
Total expenses | 353,747 | |||||
| ||||||
NET INVESTMENT INCOME | 267,724 | |||||
| ||||||
REALIZED AND UNREALIZED GAIN ON INVESTMENTS | ||||||
Net realized gain on investments | 432,700 | |||||
Net change in unrealized appreciation on investments | 6,427,048 | |||||
| ||||||
NET REALIZED AND UNREALIZED GAIN ON INVESTMENTS | 6,859,748 | |||||
| ||||||
NET INCREASE IN NET ASSETS RESULTING FROM OPERATIONS | $ | 7,127,472 | ||||
| ||||||
See Notes to Financial Statements.
16 |
1-855-DGI-FUND (344-3863) | www.DGIfund.com |
Table of Contents
The Disciplined Growth Investors Fund | Statements of Changes in Net Assets | |
| For the Six Months Ended October 31, 2014 (Unaudited) | For the Year Ended | |||||||||||||||
| ||||||||||||||||
OPERATIONS | ||||||||||||||||
Net investment income | $ | 267,724 | $ | 364,119 | ||||||||||||
Net realized gain on investments | 432,700 | 359,277 | ||||||||||||||
Net change in unrealized appreciation on investments | 6,427,048 | 9,603,782 | ||||||||||||||
| ||||||||||||||||
Net increase in net assets resulting from operations | 7,127,472 | 10,327,178 | ||||||||||||||
| ||||||||||||||||
DISTRIBUTIONS (Note 3) | ||||||||||||||||
From net investment income | (205,094) | (381,779) | ||||||||||||||
From net realized gains on investments | – | (278,995) | ||||||||||||||
| ||||||||||||||||
Net decrease in net assets from distributions | (205,094) | (660,774) | ||||||||||||||
| ||||||||||||||||
CAPITAL SHARE TRANSACTIONS (Note 5) | ||||||||||||||||
Proceeds from sales of shares | 10,193,247 | 13,673,561 | ||||||||||||||
Issued to shareholders in reinvestment of distributions | 203,159 | 656,043 | ||||||||||||||
Cost of shares redeemed, net of redemption fees | (2,509,255) | (4,222,784) | ||||||||||||||
| ||||||||||||||||
Net increase from capital share transactions | 7,887,151 | 10,106,820 | ||||||||||||||
| ||||||||||||||||
Net increase in net assets | 14,809,529 | 19,773,224 | ||||||||||||||
| ||||||||||||||||
NET ASSETS | ||||||||||||||||
Beginning of period | 86,740,610 | 66,967,386 | ||||||||||||||
| ||||||||||||||||
End of period* | $ | 101,550,139 | $ | 86,740,610 | ||||||||||||
| ||||||||||||||||
*Including accumulated net investment income of: | $ | 68,403 | $ | 5,773 | ||||||||||||
OTHER INFORMATION | ||||||||||||||||
Share Transactions | ||||||||||||||||
Issued | 659,880 | 938,053 | ||||||||||||||
Issued in lieu of cash distributions | 12,944 | 45,106 | ||||||||||||||
Redeemed | (161,878) | (293,031) | ||||||||||||||
| ||||||||||||||||
Net increase in share transactions | 510,946 | 690,128 | ||||||||||||||
| ||||||||||||||||
See Notes to Financial Statements.
Semi-Annual Report | October 31, 2014 |
17 |
Table of Contents
The Disciplined Growth Investors Fund | Financial Highlights | |
For a share outstanding during the periods presented |
| For the Six Months Ended October 31, 2014 (Unaudited) | For the Year Ended April 30, 2014 | For the Year Ended April 30, 2013 | For the Period August 12, 2011 (Inception) to April 30, 2012 | |||||||||||||||
| ||||||||||||||||||
NET ASSET VALUE, BEGINNING OF PERIOD | $ | 15.02 | $ | 13.17 | $ | 12.13 | $ | 10.00 | ||||||||||
INCOME FROM OPERATIONS | ||||||||||||||||||
Net investment income(a) | 0.05 | 0.07 | 0.11 | 0.05 | ||||||||||||||
Net realized and unrealized gain on investments | 1.13 | 1.90 | 1.09 | 2.11 | ||||||||||||||
| ||||||||||||||||||
Total from investment operations | 1.18 | 1.97 | 1.20 | 2.16 | ||||||||||||||
| ||||||||||||||||||
DISTRIBUTIONS | ||||||||||||||||||
From net investment income | (0.04) | (0.07) | (0.11) | (0.03) | ||||||||||||||
From net realized gain on investments | – | (0.05) | (0.05) | – | ||||||||||||||
| ||||||||||||||||||
Total distributions | (0.04) | (0.12) | (0.16) | (0.03) | ||||||||||||||
| ||||||||||||||||||
REDEMPTION FEES ADDED TO PAID-IN CAPITAL | – | – | – | – | ||||||||||||||
| ||||||||||||||||||
INCREASE IN NET ASSET VALUE | 1.14 | 1.85 | 1.04 | 2.13 | ||||||||||||||
| ||||||||||||||||||
NET ASSET VALUE, END OF PERIOD | $ | 16.16 | $ | 15.02 | $ | 13.17 | $ | 12.13 | ||||||||||
| ||||||||||||||||||
TOTAL RETURN | 7.83%(b) | 15.02% | 9.93% | 21.65%(b) | ||||||||||||||
RATIOS AND SUPPLEMENTAL DATA | ||||||||||||||||||
Net assets, end of period (000’s) | $ | 101,550 | $ | 86,741 | $ | 66,967 | $ | 35,678 | ||||||||||
RATIOS TO AVERAGE NET ASSETS | ||||||||||||||||||
Expenses | 0.78%(c) | 0.78% | 0.78% | 0.77%(c) | ||||||||||||||
Net investment income | 0.59%(c) | 0.47% | 0.90% | 0.60%(c) | ||||||||||||||
PORTFOLIO TURNOVER RATE | 5%(b) | 10% | 10% | 6%(b) | ||||||||||||||
| (a) | Per share numbers have been calculated using the average shares method. |
| (b) | Not annualized. |
| (c) | Annualized. |
See Notes to Financial Statements.
18 |
1-855-DGI-FUND (344-3863) | www.DGIfund.com |
Table of Contents
The Disciplined Growth Investors Fund | Notes to Financial Statements | |
October 31, 2014 (Unaudited) |
1. ORGANIZATION
Financial Investors Trust (the “Trust”), a Delaware statutory trust, is an open-end management investment company registered under the Investment Company Act of 1940, as amended (“1940 Act”). As of October 31, 2014, the Trust had 32 registered funds. This semi-annual report describes the Disciplined Growth Investors Fund (the “Fund”). The Fund seeks long-term capital growth and as a secondary objective, modest income with reasonable risk.
2. SIGNIFICANT ACCOUNTING POLICIES
The accompanying financial statements were prepared in accordance with accounting principles generally accepted in the United States of America (“U.S. GAAP”). The preparation of financial statements in conformity with U.S. GAAP requires management to make certain estimates and assumptions that affect the reported amounts of assets and liabilities and disclosures of contingent assets and liabilities at the date of the financial statements and the reported amounts of revenue and expenses during the period. Actual results could differ from those estimates. The Fund is considered an investment company for financial reporting purposes under GAAP. The following is a summary of significant accounting policies consistently followed by the Fund in preparation of their financial statements.
Investment Valuation: The Fund generally values its securities based on market prices determined at the close of regular trading on the New York Stock Exchange (“NYSE”), normally 4:00 p.m. Eastern Time, on each day the NYSE is open for trading.
For equity securities and mutual funds that are traded on an exchange, the market price is usually the closing sale or official closing price on that exchange. In the case of equity securities not traded on an exchange, or if such closing prices are not otherwise available, the securities are valued at the mean of the most recent bid and ask prices on such day. Redeemable securities issued by open-end registered investment companies are valued at the investment company’s applicable net asset value, with the exception of exchange-traded open-end investment companies, which are priced as equity securities.
The market price for debt obligations is generally the price supplied by an independent third-party pricing service approved by the Board of Trustees (the “Board”), which may use a matrix, formula or other objective method that takes into consideration quotations from dealers, market transactions in comparable investments, market indices and yield curves. If vendors are unable to supply a price, or if the price supplied is deemed to be unreliable, the market price may be determined using quotations received from one or more broker–dealers that make a market in the security. Short–term debt obligations that will mature in 60 days or less are valued at amortized cost, unless it is determined that using this method would not reflect an investment’s fair value.
When such prices or quotations are not available, or when the Fair Value Committee appointed by the Board believes that they are unreliable, securities may be priced using fair value procedures approved by the Board.
Semi-Annual Report | October 31, 2014 |
19 |
Table of Contents
The Disciplined Growth Investors Fund | Notes to Financial Statements | |
October 31, 2014 (Unaudited) |
Fair Value Measurements: The Fund discloses the classification of its fair value measurements following a three-tier hierarchy based on the inputs used to measure fair value. Inputs refer broadly to the assumptions that market participants would use in pricing the asset or liability, including assumptions about risk. Inputs may be observable or unobservable. Observable inputs reflect the assumptions market participants would use in pricing the asset or liability that are developed based on market data obtained from sources independent of the reporting entity. Unobservable inputs reflect the reporting entity’s own assumptions about the assumptions market participants would use in pricing the asset or liability that are developed based on the best information available.
Various inputs are used in determining the value of the Fund’s investments as of the end of the reporting period. When inputs used fall into different levels of the fair value hierarchy, the level in the hierarchy within which the fair value measurement falls is determined based on the lowest level input that is significant to the fair value measurement in its entirety. The designated input levels are not necessarily an indication of the risk or liquidity associated with these investments. These inputs are categorized in the following hierarchy under applicable financial accounting standards:
Level 1 – | Unadjusted quoted prices in active markets for identical investments, unrestricted assets or liabilities that the Fund has the ability to access at the measurement date; | |
Level 2 – | Quoted prices which are not active, quoted prices for similar assets or liabilities in active markets or inputs other than quoted prices that are observable (either directly or indirectly) for substantially the full term of the asset or liability; and | |
Level 3 – | Significant unobservable prices or inputs (including the Fund’s own assumptions in determining the fair value of investments) where there is little or no market activity for the asset or liability at the measurement date. | |
The following is a summary of each input used to value the Fund as of October 31, 2014:
Investments in Securities at Value | Level 1 - Unadjusted Quoted Prices | Level 2 - Other Significant Observable Inputs | Level 3 - Significant Unobservable Inputs | Total | ||||||||||||
| ||||||||||||||||
Common Stocks(a) | $ | 76,262,545 | $ | – | $ | – | $ | 76,262,545 | ||||||||
Asset/Mortgage Backed Securities | – | 183,249 | – | 183,249 | ||||||||||||
Corporate Bonds | – | 22,787,306 | – | 22,787,306 | ||||||||||||
Foreign Government Bonds | – | 501,159 | – | 501,159 | ||||||||||||
Government & Agency Obligations | – | 117,940 | – | 117,940 | ||||||||||||
Short Term Investments | 1,572,062 | – | – | 1,572,062 | ||||||||||||
| ||||||||||||||||
TOTAL | $ | 77,834,607 | $ | 23,589,654 | $ | – | $ | 101,424,261 | ||||||||
| ||||||||||||||||
| (a) | For detailed descriptions, see the accompanying Portfolio of Investments. |
20 |
1-855-DGI-FUND (344-3863) | www.DGIfund.com |
Table of Contents
The Disciplined Growth Investors Fund | Notes to Financial Statements | |
October 31, 2014 (Unaudited) |
The Fund recognizes transfers between levels as of the end of the period. For the six months October 31, 2014, the Fund did not have any transfers between Level 1 and Level 2 securities. For the six months ended October 31, 2014, the Fund did not have any securities that used unobservable inputs (Level 3) in determining fair value.
Investment Transactions and Investment Income: Investment transactions are accounted for on the date the investments are purchased or sold (trade date). Realized gains and losses from investment transactions are reported on an identified cost basis. Interest income, which includes accretion of discounts, is accrued and recorded as earned. Dividend income is recognized on the ex-dividend date or for certain foreign securities, as soon as information is available to the Fund.
Trust Expenses: Some expenses of the Trust can be directly attributed to the Fund. Expenses which cannot be directly attributed to the Fund are apportioned among all funds in the Trust based on average net assets of each fund.
Fund Expenses: Expenses that are specific to the Fund are charged directly to the Fund.
Federal Income Taxes: The Fund complies with the requirements under Subchapter M of the Internal Revenue Code of 1986, as amended, applicable to regulated investment companies and intends to distribute substantially all of their net taxable income and net capital gains, if any, each year so that it will not be subject to excise tax on undistributed income and gains. The Fund is not subject to income taxes to the extent such distributions are made.
As of and during the six months ended October 31, 2014, the Fund did not have a liability for any unrecognized tax benefits. The Fund files U.S. federal, state, and local tax returns as required. The Fund’s tax returns are subject to examination by the relevant tax authorities until expiration of the applicable statute of limitations, which is generally three years after the filing of the tax return for federal purposes and four years for most state returns. Tax returns for open years have incorporated no uncertain tax positions that require a provision for income taxes.
Distributions to Shareholders: The Fund normally pays dividends, if any, quarterly and distributes capital gains, if any, on an annual basis. Income dividend distributions are derived from interest and other income the Fund receives from its investments, including short term capital gains. Long term capital gain distributions are derived from gains realized when the Fund sells a security it has owned for more than a year. The Fund may make additional distributions and dividends at other times if the portfolio manager believes doing so may be necessary for the Fund to avoid or reduce taxes.
Semi-Annual Report | October 31, 2014 |
21 |
Table of Contents
The Disciplined Growth Investors Fund | Notes to Financial Statements | |
October 31, 2014 (Unaudited) |
3. TAX BASIS INFORMATION
Tax Basis of Investments: As of October 31, 2014, the aggregate cost of investments, gross unrealized appreciation/ (depreciation) and net unrealized appreciation for Federal tax purposes was as follows:
| Disciplined Growth Investors Fund | ||||
| ||||
Gross appreciation (excess of value over tax cost) | $ | 24,561,187 | ||
Gross depreciation (excess of tax cost over value) | (1,070,416) | |||
| ||||
Net unrealized appreciation | $ | 23,490,771 | ||
| ||||
Cost of investments for income tax purposes | $ | 77,933,490 | ||
| ||||
Tax Basis of Distributions to Shareholders: The character of distributions made during the year from net investment income or net realized gains may differ from its ultimate characterization for federal income tax purposes. Also, due to the timing of dividend distributions, the fiscal year in which amounts are distributed may differ from the fiscal year in which the income or realized gain was recorded by the Fund.
The tax character of distributions paid during the year ended April 30, 2014, were as follows:
| Ordinary Income | Long-Term Capital Gain | |||||||
| ||||||||
The Disciplined Growth Investors Fund | $ | 381,779 | $ | 278,995 | ||||
The amounts and characteristics of tax basis distributions and composition of distributable earnings/(accumulated losses) are finalized at fiscal year-end. Accordingly, tax basis balances have not been determined as of October 31, 2014.
4. SECURITIES TRANSACTIONS
During the six months ended October 31, 2014, equity holdings and U.S. Treasury Notes were transferred in-kind. The intent of the transfers was to save on equity transaction costs both for the new shareholders at the institution they transferred from and for the Fund on the addition of assets. The assets of one separate account was transferred-in-kind into the Fund in the amount of $6,132,084.
22 |
1-855-DGI-FUND (344-3863) | www.DGIfund.com |
Table of Contents
The Disciplined Growth Investors Fund | Notes to Financial Statements | |
October 31, 2014 (Unaudited) |
The cost of purchases and proceeds from sales of securities (excluding short-term securities, transfers-in-kind, and U.S. Government Obligations) during the six months ended October 31, 2014, were as follows:
| Fund | Purchases of Securities | Proceeds From Sales of Securities | ||
| ||||
The Disciplined Growth Investors Fund | $ 8,516,630 | $ 4,469,068 | ||
Investment transactions in U.S. government and agency securities (excluding transfers-in-kind) for the period ended October 31, 2014 were as follows:
| Fund | Purchases of Securities | Proceeds From Sales of Securities | ||
| ||||
The Disciplined Growth Investors Fund | $ – | $ 75,000 | ||
5. SHARES OF BENEFICIAL INTEREST
The capitalization of the Trust consists of an unlimited number of shares of beneficial interest with no par value per share. Holders of the shares of the Fund of the Trust have one vote for each share held and a proportionate fraction of a vote for each fractional share. All shares issued and outstanding are fully paid and are non-assessable, transferable and redeemable at the option of the shareholder. Shares have no pre-emptive rights.
Shares redeemed within 90 days of purchase may incur a 2% short-term redemption fee deducted from the redemption amount. For the six months ended October 31, 2014, and year ended April 30, 2014, the Fund did not receive any redemption fees.
6. MANAGEMENT AND RELATED-PARTY TRANSACTIONS
Disciplined Growth Investors, Inc. (the “Adviser” or “DGI”), subject to the authority of the Board, is responsible for the overall management and administration of the Fund’s business affairs. DGI manages the investments of the Fund in accordance with the Fund’s investment objective, policies and limitations and investment guidelines established jointly by the Adviser and the Trustees. Pursuant to the Advisory Agreement, the Fund pays the Adviser a unitary fee for the services and facilities it provides payable on a monthly basis at the annual rate of 0.78% of the Fund’s average daily net assets.
Out of the unitary management fee, the Adviser pays substantially all expenses of the Fund, including the cost of transfer agency, custody, fund administration, bookkeeping and pricing services, legal, audit and other services, except for interest expenses, brokerage expenses, taxes and extraordinary expenses not incurred in the ordinary course of the Fund’s business. Also included are Trustee fees which were $1,329 for the six months ended October 31, 2014.
Fund Administrator Fees and Expenses
ALPS Fund Services, Inc. (“ALPS” and the “Administrator”) (an affiliate of ALPS Distributors, Inc.) serves as administrator to the Fund, and the Fund has agreed to pay expenses incurred in connection with its administrative activities. Pursuant to the Administration, Bookkeeping
Semi-Annual Report | October 31, 2014 |
23 |
Table of Contents
The Disciplined Growth Investors Fund | Notes to Financial Statements | |
October 31, 2014 (Unaudited) |
and Pricing Services Agreement, ALPS will provide operational services to the Fund including, but not limited to fund accounting and fund administration and generally assist in the Fund’s operations.
Annual administrative fee, billed monthly, in the amount of the greater of (a) $150,000 annual minimum or (b) following basis point fee schedule:
| Average Total Net Assets | Contractual Fee | |||
| ||||
Between $0-$500M | 0.05% | |||
$500M-$1B | 0.03% | |||
Above $1B | 0.02% | |||
The Administrator is also reimbursed by the Fund for certain out-of-pocket expenses. The administrative fee and out-of-pocket expenses are included in the unitary fee paid to the Adviser.
Transfer Agent
ALPS serves as transfer, dividend paying and shareholder servicing agent for the Fund. ALPS receives an annual minimum fee, a fee based upon the number of shareholder accounts, and is also reimbursed by the Fund for certain out-of-pocket expenses. The fee is included in the unitary fee paid to the Adviser.
Compliance Services
ALPS provides services that assist the Trust’s chief compliance officer in monitoring and testing the policies and procedures of the Trust in conjunction with requirements under Rule 38a-1 under the 1940 Act and receives an annual base fee. ALPS is reimbursed for certain out-of-pocket expenses. The fee is included in the unitary fee paid to the Adviser.
Principal Financial Officer
ALPS receives an annual fee for providing principal financial officer services to the Fund. The fee is included in the unitary fee paid to the Adviser.
Distributor
ALPS Distributors, Inc. (“ADI” or the “Distributor”) (an affiliate of ALPS) acts as the distributor of the Fund’s shares pursuant to a Distribution Agreement with the Trust. Shares are sold on a continuous basis by ADI as agent for the Fund, and ADI has agreed to use its best efforts to solicit orders for the sale of the Fund’s shares, although it is not obliged to sell any particular amount of shares. ADI is not entitled to any compensation for its services as Distributor. ADI is registered as a broker-dealer with the Securities and Exchange Commission.
7. INDEMNIFICATIONS
Under the Trust’s organizational documents, its officers and Trustees are indemnified against certain liability arising out of the performance of their duties to the Trust. Additionally, in the normal course of business, the Trust enters into contracts with service providers that may contain general indemnification clauses, which may permit indemnification to the extent permissible under applicable law. The Trust’s maximum exposure under these arrangements is unknown, as this would involve future claims that may be made against the Trust that have not yet occurred.
24 |
1-855-DGI-FUND (344-3863) | www.DGIfund.com |
Table of Contents
The Disciplined Growth Investors Fund | Disclosure Regarding Approval of Fund Advisory Agreements | |
October 31, 2014 (Unaudited) |
THE DISCIPLINED GROWTH INVESTORS FUND (THE “DGI FUND”)
On June 10, 2014, the Trustees met in person to discuss, among other things, the approval of the investment advisory agreement between the Trust and Disciplined Growth Investors, Inc. (“DGI”) (the “Investment Advisory Agreement”), in accordance with Section 15(c) of the 1940 Act. The Independent Trustees met with independent legal counsel during executive session and discussed the Investment Advisory Agreement and other related materials.
In renewing and approving the Investment Advisory Agreement with DGI, the Trustees, including the Independent Trustees, considered the following factors with respect to the Disciplined Growth Investors Fund (the “DGI Fund”):
Investment Advisory Fee Rate: The Trustees reviewed and considered the contractual annual unitary fee to be paid by the Trust, on behalf of the DGI Fund, to DGI of 0.78% of the DGI Fund’s daily average net assets, in light of the extent and quality of the advisory services to be provided by DGI to the DGI Fund.
The Trustees considered the information they received comparing the DGI Fund’s contractual annual unitary advisory fee and overall expenses with those of funds in both the relevant expense group and universe of funds provided by an independent provider of investment company data.
Based on such information, the Trustees further determined that the contractual total expense ratio of 0.78% for the DGI Fund was generally below the median within the DGI Fund’s anticipated peer group and universe.
Nature, Extent and Quality of the Services under the Advisory Agreement: The Trustees received and considered information regarding the nature, extent and quality of services provided to the DGI Fund under the Advisory Agreement. The Trustees reviewed certain background materials supplied by DGI in its presentation, including its Form ADV.
The Trustees reviewed and considered DGI’s investment advisory personnel, its history as an asset manager, its performance and the amount of assets currently under management by DGI. The Trustees also reviewed the research and decision-making processes utilized by DGI, including the methods adopted to seek to achieve compliance with the investment objectives, policies and restrictions of the DGI Fund.
The Trustees considered the background and experience of DGI’s management in connection with the DGI Fund, including reviewing the qualifications, backgrounds and responsibilities of the management team primarily responsible for the day-to-day portfolio management of the DGI Fund and the extent of the resources devoted to research and analysis of actual and potential investments.
The Trustees also reviewed the accompanying compliance-related materials and further noted that they have received reports on these services and compliance issues at each regular Board meeting throughout the year related to the services rendered by DGI with respect to the DGI Fund.
Semi-Annual Report | October 31, 2014 |
25 |
Table of Contents
The Disciplined Growth Investors Fund | Disclosure Regarding Approval of Fund Advisory Agreements | |
October 31, 2014 (Unaudited) |
Performance: The Trustees reviewed performance information for the DGI Fund for the three-month and 1-year periods ended December 31, 2013. That review included a comparison of the DGI Fund’s performance to the performance of a group of comparable funds selected by an independent provider of investment company data. The Trustees noted the comparable performance of the DGI Fund compared against funds identified by an independent provider of investment company data, specifically that the DGI Fund’s performance exceeded that of the peer group average for the 1-year period. The Trustees also considered DGI’s discussion of the DGI Fund’s underlying portfolio diversification categories, its top contributors and top detractors, as well as DGI’s performance and reputation generally and its investment techniques, risk management controls and decision-making processes.
Comparable Accounts, Total Expense Ratios, and the Advisers’ Profitability: The Trustees received a profitability analysis prepared by DGI based on the fees payable under the Advisory Agreement. The Board then reviewed DGI’s financial statements in order to analyze the financial condition and stability and profitability of the adviser. The Board also considered information provided by DGI regarding its standard fee schedule for similarly managed separate accounts, and the corresponding rates applicable at different asset levels.
Economies of Scale: The Trustees considered whether economies of scale in the provision of services to the DGI Fund will be passed along to the shareholders under the proposed agreements.
Other Benefits to the Adviser: The Trustees reviewed and considered any other benefits derived or to be derived by DGI from its relationship with the DGI Fund, including whether soft dollar arrangements were used.
The Board summarized its deliberations with respect to the Investment Advisory Agreement with DGI. In selecting DGI and approving the investment advisory agreement and fees under such agreement, the Trustees concluded that no single factor reviewed by the Trustees was identified by the Trustees to be determinative as the principal factor in whether to approve the investment advisory agreement. Further, the Independent Trustees were advised by separate independent legal counsel throughout the process. The Trustees, including all of the Independent Trustees, concluded that:
| — | the investment advisory fees to be received by DGI with respect to the DGI Fund were within an acceptable range of others with in the Fund’s peer group and universe; |
| — | the nature, extent and quality of services rendered by DGI under the Advisory Agreement were adequate; |
| — | bearing in mind the limitations of comparing different types of managed accounts and the different levels of service typically associated with such accounts, the fee structures applicable to DGI’s other clients employing a comparable strategy were not indicative of any unreasonableness with respect to the advisory fees proposed to be payable by the DGI Fund; |
26 |
1-855-DGI-FUND (344-3863) | www.DGIfund.com |
Table of Contents
The Disciplined Growth Investors Fund | Disclosure Regarding Approval of Fund Advisory Agreements | |
October 31, 2014 (Unaudited) |
| — | the performance of the DGI Fund was generally comparable to, or in certain cases better than, the performance of the funds in its peer group selected by an independent provider of investment company data; |
| — | the profit, if any, anticipated to be realized by DGI in connection with the operation of the DGI Fund is fair to the Trust, especially in light of the unitary fee arrangement; and |
| — | there were no material economies of scale or other benefits accruing to DGI in connection with its relationship with the DGI Fund. |
Based on the Trustees’ deliberations and their evaluation of the information described above, the Trustees, including all of the Independent Trustees, concluded that DGI’s compensation for investment advisory services is consistent with the best interests of the DGI Fund and its shareholders.
Semi-Annual Report | October 31, 2014 |
27 |
Table of Contents
The Disciplined Growth Investors Fund | Additional Information | |
October 31, 2014 (Unaudited) |
1. FUND HOLDINGS
The Fund files its complete schedule of portfolio holdings with the Securities and Exchange Commission (the “SEC”) for the first and third quarters of each fiscal year on Form N-Q within 60 days after the end of the period. Copies of the Fund’s Form N-Q are available without charge on the SEC website at http://www.sec.gov. You may also review and copy the Form N-Q at the SEC’s Public Reference Room in Washington, DC. For more information about the operation of the Public Reference Room, please call the SEC at 1-800-SEC-0330.
2. FUND PROXY VOTING POLICIES, PROCEDURES AND SUMMARIES
The Fund’s policies and procedures used in determining how to vote proxies and information regarding how the Fund voted proxies relating to portfolio securities during the most recent prior 12-month period ending June 30 are available without charge, (1) upon request, by calling (toll-free) 855-DGI-Fund and (2) on the SEC’s website at http://www.sec.gov.
28 |
1-855-DGI-FUND (344-3863) | www.DGIfund.com |
Table of Contents

Table of Contents
Table of Contents
| 1 | ||||
| 5 | ||||
| 9 | ||||
| 13 | ||||
| 15 | ||||
| 17 | ||||
| 19 | ||||
| 21 | ||||
| 22 | ||||
| 23 | ||||
| 25 | ||||
| 26 | ||||
| 28 | ||||
| 32 | ||||
| 36 | ||||
| 40 | ||||
| 47 | ||||
| 49 | ||||
Table of Contents
| Emerald Growth Fund | Manager Commentary | |
October 31, 2014 (Unaudited) |
November 11, 2014
Dear Shareholders:
Investment Results
The performance of the Emerald Growth Fund’s Class A shares (without sales load), for the six months ended October 31, 2014, reflected a gain of 6.18% lagging the Russell 2000® Growth Index1 which gained 6.90%.
Although the absolute return figures for the last six months are nicely positive, performance has been anything but linear. After a challenging March through May trading period for the Russell 2000® Growth Index in which small capitalization stocks declined 11.11% from peak to trough, stocks again retraced in the third calendar quarter, with absolute returns for the Russell 2000® Growth Index declining 6.13%. The month of September proved to be particularly challenging and the index declined 5.35% accounting for the majority of the Russell 2000® Growth Index’s third quarter decline. Growing concern regarding the timing and trajectory of interest rate increases, slowing global growth and the implications of a strengthening dollar weighed on the market. As corporate earnings reports and a litany of domestic economic reports were released throughout October and broadly supported ongoing domestic economic strength, the market after a challenging September resumed its upward trajectory, with small capitalization stocks again leading performance.
This heightened month-to-month volatility in market performance experienced fiscal year-to-date is likely here to stay in the near-term as the investment community continues to assess the rate of U.S. economic growth and the resulting impact to the timing and trajectory of interest rate increases.
Investment Analysis
The Emerald Growth Fund lagged its benchmark for the trailing six-month period. At the sector level, relative outperformance within the producer durables and healthcare sectors offset relative underperformance within the consumer discretionary and consumer staples sectors.
The consumer discretionary sector represented the portfolio’s largest source of relative underperformance for the trailing period as stock selection within the restaurant, specialty retail and apparel industries weighed on relative returns. Performance within the consumer staples sector similarly lagged the index but in this instance was largely a result of the portfolio’s underweight position relative to the benchmark.
The underperformance in the aforementioned sectors was partially offset by relative outperformance within the producer durables and healthcare sectors. Holdings within the biotechnology, healthcare facilities, air transport and scientific instrument industries were the most notable contributors to return.
Exiting October, the portfolio has the largest active exposure to the financial services, producer durables and healthcare sectors. Within financial services, the banking industry remains a key area of focus. Non-residential construction/investment indicators continue to inflect positively and we believe should remain a tailwind to loan growth through the balance of 2014 and into 2015. The portfolio is also participating in the improvement in non-residential construction through its exposures in the producer durable and materials sectors with investments in equipment rental, electrical distribution, engineering and construction, building materials and glass industries.
The healthcare sector is also an area of emphasis in the portfolio as Emerald continues to seek to identify attractive investment opportunities within the biotechnology, pharmaceutical, services and equipment industries.
Market Outlook
Global growth concerns have risen to the top of the wall of worry. The Eurozone recovery is faltering as recent data points from industrial production to the Institute for Supply Management Surveys have been broadly disappointing. Asian economies are similarly showing signs of weakness with the recent Asian purchasing manager’s index surveys surprising to the downside in September. This drumbeat of negative indicators abroad is raising concerns that global weakness will ultimately dampen U.S. growth.
From our perspective we have seen little evidence to support slowing domestic economic growth at either the corporate or macroeconomic level. These findings are supported by recent reports on employment, Institute for Supply Management manufacturing and non-manufacturing surveys which continue to point to an economy that is tracking toward above trend growth for the balance of the year. The relative strength of the U.S. dollar is being driven by the fact that the US economy is growing faster than the global economy, while at the same time the global economies are slowing. Interestingly, although the market seems to be viewing the strong dollar as a threat to growth, historically when the dollar is rising the US markets, when domestic GDP has tracked above trend, have outperformed the global markets.
Semi-Annual Report | October 31, 2014 |
1 |
Table of Contents
| Emerald Growth Fund | Manager Commentary | |
October 31, 2014 (Unaudited) |
Although global growth concerns have risen to the forefront, with every piece of strong U.S. economic data, we believe the market turns its focus to the Federal Reserve and the timing and trajectory of interest rate increases. The Federal Reserve ended its balance sheet expansion at the end of October, and our assessment of the general market sentiment is that the market currently anticipates that the first rate hike will occur at the June 19th Federal Reserve meeting. We believe the consternation about the improving labor market outlook after the strong September jobs report and the potential for removal of the “considerable time language” at the next Federal Reserve meeting may ultimately be premature given tame inflation and the strengthening dollar. We continue to believe that the Federal Reserve is likely to err on the side of caution and would prefer to follow the trend (whether that be jobs or inflation) rather than anticipate it. That being said, we also continue to point out that rising interest rates in response to strong domestic growth have historically been positively correlated to small capitalization performance.
Further, if we are correct and domestic growth remains strong, and given small capitalization stocks tilt toward the domestic economy, the gap between the rate of earnings growth for the S&P 500 and the Russell 2000 should widen in favor of small capitalization stocks.
As always, Emerald remains focused on utilizing its fundamental bottom-up research process to identify the best growth opportunities within the small capitalization universe.
Top Five Contributors to Return | Top Five Detractors to Return | |||
InterMune, Inc. | Magnum Hunter Resources Corporation | |||
Alnylam Pharmaceuticals, Inc. | Penn Virginia Corporation | |||
Spirit Airlines, Inc. | Sarepta Therapeutics, Inc. | |||
Proofpoint, Inc. | Channeladvisor Corporation | |||
Acadia Healthcare Company, Inc. | Lumber Liquidators Holdings, Inc. | |||
|
|
| ||
Kenneth G. Mertz II, CFA | Stacey L. Sears | Joseph W. Garner | ||
Chief Investment Officer | Portfolio Manager | Portfolio Manager | ||
Portfolio Manager | ||||


Emerald Mutual Fund Advisers Trust
The views and information discussed in this commentary are as of the date of publication, are subject to change, and may not reflect the writer’s current views. The views expressed represent an assessment of market conditions at a specific point in time, are opinions only and should not be relied upon as investment advice regarding a particular investment or markets in general. Such information does not constitute a recommendation to buy or sell specific securities or investment vehicles. It should not be assumed that any investment will be profitable or will equal the performance of the Fund or any securities or any sectors mentioned in this letter. The subject matter contained in this letter has been derived from several sources believed to be reliable and accurate at the time of compilation. Neither Emerald Mutual Fund Advisors Trust nor the Fund accepts any liability for losses either direct or consequential caused by the use of this information.
| (1) | The Russell 2000® Growth Index measures the performance of the small-cap growth segment of the U.S. equity universe. It includes those Russell 2000® Index companies with higher price-to-value ratios and higher forecasted growth values. The index is not actively managed and does not reflect any deductions for fees, expenses or taxes. An investor may not invest directly into the index. |
2 |
www.emeraldmutualfunds.com |
Table of Contents
| Emerald Growth Fund | Manager Commentary | |
October 31, 2014 (Unaudited) |
TOP TEN HOLDINGS (as a % of Net Assets)*
| ||||||
Spirit Airlines, Inc. | 3.09 | % | ||||
MWI Veterinary | 2.65 | % | ||||
Acadia Healthcare Co., Inc. | 2.21 | % | ||||
FARO Technologies, Inc. | 1.98 | % | ||||
Bank of the Ozarks, Inc. | 1.97 | % | ||||
AmTrust Financial Services, Inc. | 1.81 | % | ||||
PolyOne Corp. | 1.73 | % | ||||
Apogee Enterprises, Inc. | 1.72 | % | ||||
Proofpoint, Inc. | 1.68 | % | ||||
Alnylam | 1.68 | % | ||||
Top Ten Holdings | 20.52 | % | ||||
INDUSTRY SECTOR ALLOCATION (as a % of Net Assets)
|
| |||||
Health Care | 25.07 | % | ||||
Technology | 17.06 | % | ||||
Financial Services | 16.97 | % | ||||
Producer Durables | 14.84 | % | ||||
Consumer Discretionary | 11.88 | % | ||||
Materials & Processing | 7.54 | % | ||||
Energy | 2.75 | % | ||||
Utilities | 1.33 | % | ||||
Consumer Staples | 0.32 | % | ||||
Cash, Cash Equivalents, | 2.24 | % | ||||
* Holdings are subject to change.
| ||||||
GROWTH OF $10,000 INVESTMENT IN THE FUND (for the period ended October 31, 2014)
Comparison of change in value of a $10,000 investment (includes applicable sales loads)
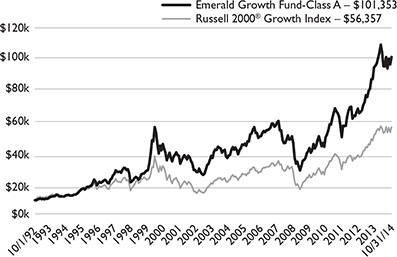
The chart represents historical performance of a hypothetical investment of $10,000 in the Fund since inception. Past performance does not guarantee future results. This chart does not reflect the deduction of taxes that a shareholder would pay on Fund distributions or the redemption of Fund shares.
AVERAGE ANNUAL TOTAL RETURN (for the period ended October 31, 2014)
| Since | Expense Ratio | |||||||||||||||||||
| 1 Year | 3 Year | 5 Year | 10 Year | Inception1 | Gross 2 | Net2 | ||||||||||||||
Class A (NAV) | 5.96% | 20.95% | 20.43% | 10.12% | 11.30% | 1.31% | 1.29% | |||||||||||||
Class A (MOP) | 0.94% | 19.00% | 19.25% | 9.58% | 11.06% | 1.31% | 1.29% | |||||||||||||
Russell 2000® | 8.26% | 18.42% | 18.61% | 9.42% | 8.15% | |||||||||||||||
Class C (NAV) | 5.28% | 20.20% | 19.63% | 9.46% | 5.27% | 1.96% | 1.94% | |||||||||||||
Class C (CDSC) | 4.32% | 20.20% | 19.63% | 9.46% | 5.27% | 1.96% | 1.94% | |||||||||||||
Russell 2000® | 8.26% | 18.42% | 18.61% | 9.42% | 8.15% | |||||||||||||||
Investor Class | 5.91% | 20.92% | – | – | 12.28% | 1.34% | 1.34% | |||||||||||||
Russell 2000® | 8.26% | 18.42% | 18.61% | 9.42% | 8.15% | |||||||||||||||
Institutional Class | 6.27% | 21.34% | 20.79% | – | 17.79% | 1.00% | 0.99% | |||||||||||||
Russell 2000® | 8.26% | 18.42% | 18.61% | 9.42% | – | |||||||||||||||
The performance quoted represents past performance, does not guarantee future results and current performance may be lower or higher than the data quoted. The investment return and principal value of an investment will fluctuate so that shares, when redeemed, may be worth more or less than their original cost. Performance data current to the most recent month end may be obtained at www.emeraldmutualfunds.com.
Performance shown for periods prior to March 16, 2012, reflects the performance of the Forward Growth Fund, a series of Forward Funds (as a result of a reorganization of the Forward Growth Fund into the Emerald Growth Fund).
Semi-Annual Report | October 31, 2014 |
3 |
Table of Contents
| Emerald Growth Fund | Manager Commentary | |
October 31, 2014 (Unaudited) |
| ||||
Maximum Offering Price (MOP) for Class A shares includes the Fund’s maximum sales charge of 4.75%. Performance shown at NAV does not include these sales charges and would have been lower had it been taken into account.
A Contingent Deferred Sales Charge (CDSC) of 1.00% may apply to Class C shares redeemed within the first 12 months after a purchase.
| 1 | Inception Dates - Class A: 10/01/1992, Class C: 07/01/2000, Class Institutional: 10/21/2008, Class Investor: 05/01/2011 |
| 2 | Emerald Mutual Fund Advisers Trust (“Emerald” or the “Adviser”) has agreed contractually to waive a portion of its fees and reimburse other expenses until August 31, 2015 in amounts necessary to limit the Fund’s operating expenses (exclusive of Acquired Fund Fees and Expenses, brokerage expenses, interest expenses, taxes and extraordinary expense) for Class A, Class C, Institutional Class, and Investor Class shares to an annual rate (as percentage of the Fund’s average daily net assets) of 1.29%, 1.94%, 0.99% and 1.34% respectively. The Adviser will be permitted to recover, on a class-by-class basis, expenses it has borne through the agreement described above to the extent that the Fund’s expenses in later periods fall below the annual rates set forth in the relevant agreement. The Fund will not be obligated to pay any such deferred fees and expenses more than three years after the year(s) in which the fees and expense were incurred. The Adviser may not discontinue this waiver prior to August 31, 2015, without the approval by the Fund’s Board of Trustees. Ratios as of the Prospectus dated August 31, 2014. |
| † | The Russell 2000® Growth Index measures the performance of the small-cap growth segment of the U.S. equity universe. It includes those Russell 2000® Index companies with higher price-to-value ratios and higher forecasted growth values. The index is not actively managed and does not reflect any deduction for fees, expenses or taxes. An Investor may not invest directly into an index. |
Important Risks
Investing in smaller companies generally will present greater investment risks, including: greater price volatility, greater sensitivity to changing economic conditions and less liquidity than the securities of larger, more mature companies.
4 |
www.emeraldmutualfunds.com |
Table of Contents
| Emerald Insights Fund | Manager Commentary | |
October 31, 2014 (Unaudited) |
November 11, 2014
Dear Shareholder:
Investment Results
Following approximately eight and one-half years of managing mid-capitalization stocks on a separate account basis, Emerald Advisers launched the Emerald Insights Fund on August 1, 2014. The team managing the Fund, consisting of David Volpe, CFA, Joseph Garner and Stephen Amsterdam, have collectively been employed as investment professionals at Emerald Advisers for nearly 50 years. The Fund employs a very similar strategy as the Emerald Advisers separately managed mid-capitalization portfolios1. The performance of the Emerald Insights Fund’s Class A shares (without sales load) for the three months since the Fund’s inception reflected a gain of 2.10%, lagging the Russell Midcap Growth Index2 benchmark’s return by 3.21%. The temporarily unallocated cash from the Fund’s initial inflows in a rising market had a negative impact on initial performance and was responsible for roughly one-third of the Fund’s underperformance.
Larger, higher quality names in the Russell Midcap Growth index held up better for the majority of the past three months, as investors grew increasingly concerned about a potential peak in U.S. economic indicators, a rising U.S. Dollar, and a loss of momentum in many global economies (particularly the larger European economies), as well as China and Japan. Mid cap growth stocks modestly outperformed their larger and smaller cap brethren, but are lagging mid cap value stocks on a year to date basis.
Investment Analysis
The inaugural three months for the Emerald Insights Fund was challenging. Beyond the capital inflow cash drag referenced above, our slightly smaller, higher growth positioning versus the benchmark hurt performance, as well as our overweight of companies involved directly or indirectly in the energy sector, particularly grow their, higher debt oriented names. From a sector perspective, beyond Energy, we lost ground in Consumer Staples, Financial Services, Materials and Producer Durables. The five largest detractors to performance are noted on the next page.
On the positive side, we did well in the Health Care, Technology and Consumer Discretionary sectors and broke even in Utilities. Of particular note, our holdings in shares of Alnylam Pharmaceuticals, a developer of novel therapeutics based on RNA interference, rallied over 40% during the quarter as excitement built for the extension data in the company’s most advanced clinical program for TTR Amyloidosis and other therapies. Shares of Cepheid, a molecular diagnostics company focused on testing in the clinical market, were up almost 40% over the past three months as the company benefited from reduced spending on growth as well as investor recognition of the company’s powerful business model.
Market Outlook
While we expect the market to be volatile in the near term due to investor concerns regarding Europe, China, oil prices, and the timing of the Fed’s move to start increasing the Federal Funds rate, we have seen little evidence to support deteriorating economic growth. Earnings season is nearing an end, and according to Steven DeSanctis at Bank of America Merrill Lynch, with 86% of mid cap stocks reporting, profits have risen 13.6% year over year with nearly 10% sales growth (Small Cap Strategy report dated 11/17/2014). We are optimistic about the economy and U.S. equities as we look towards the end of the year: we believe valuations in general are reasonable and multiples have pulled back somewhat for mid-capitalization stocks, inflation is low and stable, and the yield curve remains somewhat steep – all factors that normally point to a positive equity market tone.
While our energy overweight in August and part of September was clearly on the wrong side of the trade, we reduced our exposure to approximately equal weight the benchmark, but still have significant exposure through ownership in several high growth exploration and production companies, as we think these names are materially undervalued. We also maintain exposure to names that benefit from falling commodity prices, such as higher growth airlines and chemical/materials manufacturers. It is our hope that by bifurcating selected holdings within the Fund through ownership of some of the best names correlated to both rising and falling oil price environments, we can mitigate some of the volatility surrounding oil prices.
After strong performance from our healthcare exposure during the third quarter of 2014, at quarter-end, the Insights Fund remains overweight healthcare relative to the benchmark. The pharmaceutical industry, in particular, has been undergoing a wave of consolidation. This consolidation combined with recent clinical successes gives us confidence in the space. We continue to favor companies that save the healthcare system money, companies that lack reimbursement concerns, and companies with revolutionary new products that can withstand the scrutiny of payers.
Through October 31 the portfolio was overweight Healthcare, Materials and Technology, underweight Consumer Staples, Producer Durables, Financial Services and Energy and equal weight Consumer Discretionary stocks.
As always, Emerald remains focused on utilizing our fundamental bottom-up research process to identify the best growth companies in the mid-capitalization universe.
Semi-Annual Report | October 31, 2014 |
5 |
Table of Contents
| Emerald Insights Fund | Manager Commentary | |
October 31, 2014 (Unaudited) |
Top Five Contributors to Return | Top Five Detractors to Return | |||
iShares Russell Mid-Cap Growth ETF | Chicago Bridge & Iron Co. NV | |||
Alnylam Pharmaceuticals, Inc | Sarepta Therapeutics, Inc. | |||
Cepheid | Penn Virginia Corporation | |||
Medivation, Inc. | Patterson-UTI Energy, Inc. | |||
Palo Alto Networks, Inc. | Sanchez Energy Corporation | |||
|
|
| ||
David A. Volpe, CFA | Joseph W. Garner | Stephen L. Amsterdam | ||
Deputy Chief Investment Officer | Associate Portfolio Manager | Associate Portfolio Manager | ||
Portfolio Manager | ||||


The views and information discussed in this commentary are as of the date of publication, are subject to change, and may not reflect the writer’s current views. The views expressed represent an assessment of market conditions at a specific point in time, are opinions only and should not be relied upon as investment advice regarding a particular investment or markets in general. Such information does not constitute a recommendation to buy or sell specific securities or investment vehicles. It should not be assumed that any investment will be profitable or will equal the performance of the Fund or any securities or any sectors mentioned in this letter. The subject matter contained in this letter has been derived from several sources believed to be reliable and accurate at the time of compilation. Neither Emerald Mutual Fund Advisors Trust nor the Fund accepts any liability for losses either direct or consequential caused by the use of this information.
| (1) | SMA’s and related investment advisory services are provided by a federally registered investment adviser. ALPS is not affiliated with and does not distribute SMA’s. |
| (2) | The Russell Midcap Growth Index measures the performance of the mid-cap growth segment of the U.S. equity universe. It includes those Russell Midcap Index companies with higher price-to-book ratios and higher forecasted growth values. As of June 30, 2014, the Russell Midcap Growth Index included securities issued by companies that ranged in size between $2.2 billion and $27.1 billion. |
6 |
www.emeraldmutualfunds.com |
Table of Contents
| Emerald Insights Fund | Manager Commentary | |
October 31, 2014 (Unaudited) |
| TOP TEN HOLDINGS | ||||||
(as a % of Net Assets)*
| ||||||
iShares Russell Mid-Cap | 4.64 | % | ||||
Affiliated Managers | 2.25 | % | ||||
Cepheid | 2.15 | % | ||||
Alnylam | 2.05 | % | ||||
Proofpoint, Inc. | 2.03 | % | ||||
Wabtec Corp. | 2.02 | % | ||||
Lions Gate | 1.96 | % | ||||
Medivation, Inc. | 1.95 | % | ||||
Jarden Corp. | 1.89 | % | ||||
Quanta Services, Inc. | 1.82 | % | ||||
Top Ten Holdings | 22.77 | % | ||||
INDUSTRY SECTOR ALLOCATION (as a % of Net Assets)
|
| |||||
Health Care | 15.48 | % | ||||
Technology | 12.87 | % | ||||
Financial Services | 9.10 | % | ||||
Producer Durables | 12.85 | % | ||||
Consumer Discretionary | 24.60 | % | ||||
Materials & Processing | 5.85 | % | ||||
Energy | 4.98 | % | ||||
MUTUAL FUNDS/ ETF’S - Equity | 4.64 | % | ||||
Consumer Staples | 2.15 | % | ||||
Cash, Cash Equivalents, & Other Net Assets | 7.48 | % | ||||
* Holdings are subject to change.
| ||||||
GROWTH OF $10,000 INVESTMENT IN THE FUND (for the period ended October 31, 2014)
Comparison of change in value of a $10,000 investment (includes applicable sales loads)
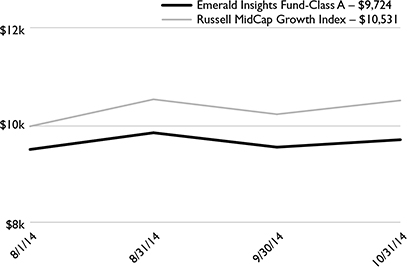
The chart represents historical performance of a hypothetical investment of $10,000 in the Fund since inception. Past performance does not guarantee future results. This chart does not reflect the deduction of taxes that a shareholder would pay on Fund distributions or the redemption of Fund shares.
AVERAGE ANNUAL TOTAL RETURN (for the period ended October 31, 2014)
| Expense Ratio | ||||||||||
| 1 Month | YTD | Since Inception1 | Gross2 | Net2 | ||||||
Class A (NAV) | 1.59% | 2.10% | 2.10% | 1.89% | 1.35% | |||||
Class A (MOP) | -3.22% | -2.76% | -2.76% | 1.89% | 1.35% | |||||
Class C (NAV) | 1.60% | 1.80% | 1.80% | 2.54% | 2.00% | |||||
Class C (CDSC) | 0.60% | 0.80% | 0.80% | 2.54% | 2.00% | |||||
Investor Class | 1.59% | 2.00% | 2.00% | 1.94% | 1.40% | |||||
Institutional Class | 1.59% | 1.90% | 1.90% | 1.59% | 1.05% | |||||
Russell MidCap Growth Index† | 2.76% | 5.31% | 5.31% | |||||||
The performance quoted represents past performance, does not guarantee future results and current performance may be lower or higher than the data quoted. The investment return and principal value of an investment will fluctuate so that shares, when redeemed, may be worth more or less than their original cost. Performance data current to the most recent month end may be obtained at www.emeraldmutualfunds.com.
Maximum Offering Price (MOP) for Class A shares includes the Fund’s maximum sales charge of 4.75%. Performance shown at NAV does not include these sales charges and would have been lower had it been taken into account.
A Contingent Deferred Sales Charge (CDSC) of 1.00% may apply to Class C shares redeemed within the first 12 months after a purchase.
| 1 | Inception Date – August 1, 2014. |
| 2 | Emerald Mutual Fund Advisers Trust (“Emerald” or the “Adviser”) has agreed contractually to waive a portion of its fees and reimburse other expenses until August 31, 2015 in amounts necessary to limit the Fund’s operating expenses (exclusive of Acquired Fund Fees and Expenses, brokerage |
Semi-Annual Report | October 31, 2014 |
7 |
Table of Contents
| Emerald Insights Fund | Manager Commentary | |
October 31, 2014 (Unaudited) |
| ||||
expenses, interest expenses, taxes and extraordinary expense) for Class A, Class C, Institutional Class, and Investor Class shares to an annual rate (as percentage of the Fund’s average daily net assets) of 1.35%, 2.00%, 1.05% and 1.40% respectively. The Adviser will be permitted to recover, on a class-by-class basis, expenses it has borne through the agreement described above to the extent that the Fund’s expenses in later periods fall below the annual rates set forth in the relevant agreement. The Fund will not be obligated to pay any such deferred fees and expenses more than three years after the year(s) in which the fees and expense were incurred. The Adviser may not discontinue this waiver prior to August 31, 2015, without the approval by the Fund’s Board of Trustees. Ratios as of the Prospectus dated July 31, 2014.
| † | The Russell Midcap Growth Index measures the performance of the mid-cap growth segment of the U.S. equity universe. It includes those Russell Midcap Index companies with higher price-to-book ratios and higher forecasted growth values. As of June 30, 2014, the Russell Midcap Growth Index included securities issued by companies that ranged in size between $2.2 billion and $27.1 billion. |
Important Risks
Investing in smaller companies generally will present greater investment risks, including: greater price volatility, greater sensitivity to changing economic conditions and less liquidity than the securities of larger, more mature companies.
8 |
www.emeraldmutualfunds.com |
Table of Contents
| Emerald Banking and Finance Fund | Manager Commentary | |
October 31, 2014 (Unaudited) |
November 11, 2014
Dear Shareholder:
Investment Results
Bank stocks outperformed the Russell 2000® Index1 during the second half of the fiscal year but underperformed the broad market despite strong commercial loan growth and expectations of rising interest rates in the second half of calendar year 2015. The SNL Small Cap U.S. Bank & Thrift Index2 gained 6.15% versus an 8.22% gain delivered by the S&P’s 500® Index3 and a gain of 4.83% for the Russell 2000® Index. The Emerald Banking and Finance Fund Class A (without sales load) continued its outperformance of the Russell 2000® Index, having posted a 4.94% return for the six month period ended October 31, 2014. Larger sized banks have led the smaller community banks driven by strength in the broader market. In fact, the SNL Large Cap U.S. Bank & Thrift index4 was up 8.19% versus 8.22% for the S&P 500® Index.
Investment Analysis
Calendar third quarter earnings came in strong for regional and community banks which led to a 7.66% return for the SNL Small Cap U.S. Bank & Thrift Index for the month of October. Community banks continued to report strong credit quality and commercial loan growth continued to impress as the economy slowly improved. If we were to point out a negative for the quarter it would be that net interest margins continue to compress as most banks have found it difficult to lower funding costs and replace higher yielding interest earning assets that have been paid-down with new loans at comparable yields due to a prolonged low interest rate environment.
We believe that commercial and industrial (C&I) loans will continue to benefit community banks as C&I loans outstanding at domestically chartered banks are currently near an all-time high after having grown at an annualized pace of 11% year-to-date. (Federal Reserve H.8 statistical data) Community banks are not just growing via organic loan growth but we are also in the midst of a quiet uptick in merger and acquisition activity. With 264 acquisitions thus far in 2014, the pace of acquisitions annualizes to more than 310 transactions for 2014 which if achieved, would be the fastest pace of bank M&A activity since 2007. (SNL Financial Bank M&A Deal Tracker and FDIC data as of 09/30/14)
Market Outlook
We believe that loan growth will continue to be one of the main focus areas for investors going into the next fiscal year and should be a positive tailwind for the banks as a whole. In fact, the latest H.8 data available from the Federal Reserve suggests that we are now witnessing the strongest overall loan growth since 2008. We believe that the strength in recent loan growth will bolster earnings even as banks continue to grapple with lower earning asset yields.
While we previously believed that net interest margins (or NIMs) would begin to flatten out in the second half of calendar year 2014, we no longer believe this to be the case. We now believe that the NIM for the industry will continue to slowly decline two or three basis points per quarter for the next two to three quarters due to a recent and increasing trend of regional and community bank management teams extending duration of CDs in order to “lock-in” historically low cost funding. We believe that many banks over the last five years have actively “run-off” their CD balances as they sought to decrease their overall costs of deposits. This objective was fairly easy to achieve in light of the tremendous deposit growth that has occurred since the credit crisis. Deposits have grown roughly 47% since year end 2006 according to SNL. Investors are now concerned that the composition and cost of those deposits will at least change and some deposits could even run-off when rates rise. These concerns have created a debate as to whether or not it makes sense to build CDs now to maintain some level of lower cost funding in the event rates rise in 2015. We believe that it is prudent for bankers to mitigate the impact of rising rates by layering on fixed rate funding either through Federal Home Loan Bank borrowings or by increasing their CD balances and we believe we are starting to see some banks adopt this strategy.
With bankers locking-in lower cost funding, investors are now beginning to believe that rates will rise significantly over the next twelve months. We disagree, we believe that rates will begin to rise in mid-2015 but we believe the increases will be a bit slower and gradual. However, we believe that what is more important to bank earnings is what end of the yield curve rises. Generalist investors tend to believe that an increase in the 10-Year Treasury is extremely beneficial to banks as banks lending long and borrowing short is a popular misconception in the marketplace. In fact, 71% of bank loans are priced off of the short end of the curve and based on Prime or LIBOR. Therefore, an increase in the short end of the curve is more beneficial to the bottom line of most banks.
We believe that the market remains in the early stages of a long term recovery in bank stocks and remain confident in our expectations for improved fundamentals and continued consolidation amongst the small-to-mid capitalization bank and thrift stocks. However, we continue to believe stock selection remains paramount as earnings power remains challenging due to increased capital requirements, regulatory burdens, and the low interest rate environment. This type of “stock pickers market” falls directly into the strengths of Emerald’s Ten Step Research Process and this combined with any increase in short term interest rates which are more directly beneficial to revenue growth at community banks as many variable rate C&I loans are indexed off short term LIBOR will provide momentum for the Emerald Banking and Finance Fund in 2014.
Semi-Annual Report | October 31, 2014 |
9 |
Table of Contents
| Emerald Banking and Finance Fund | Manager Commentary | |
October 31, 2014 (Unaudited) |
Top Five Contributors to Return | Top Five Detractors to Return | |||
Bank of the Ozarks, Inc. | Santander Consumer USA Holdings, Inc. | |||
Federated National Holding Company | Independent Bank Group, Inc. | |||
First NBC Bank Holding Co. | BankUnited, Inc. | |||
CoBiz Financial Inc. | Flagstar Bancorp, Inc. | |||
Diamond Resorts International, Inc. | Opus Bank | |||
|
| |||
Kenneth G. Mertz II, CFA | Steven E. Russell, Esq. | |||
Chief Investment Officer | Portfolio Manager | |||
Portfolio Manager | ||||


Emerald Mutual Fund Advisers Trust
The views and information discussed in this commentary are as of the date of publication, are subject to change, and may not reflect the writer’s current views. The views expressed represent an assessment of market conditions at a specific point in time, are opinions only and should not be relied upon as investment advice regarding a particular investment or markets in general. Such information does not constitute a recommendation to buy or sell specific securities or investment vehicles. It should not be assumed that any investment will be profitable or will equal the performance of the Fund or any securities or any sectors mentioned in this letter. The subject matter contained in this letter has been derived from several sources believed to be reliable and accurate at the time of compilation. Neither Emerald Mutual Fund Advisors Trust nor the Fund accepts any liability for losses either direct or consequential caused by the use of this information.
| (1) | Russell 2000® Index measures the performance of the small-cap segment of the U.S. equity universe. The Russell 2000® Index is a subset of the Russell 3000® Index representing approximately 10% of the total market capitalization of that index. It includes approximately 2000 of the smallest securities based on a combination of their market cap and current index membership. The index is not actively managed and does not reflect any deduction of fees, expenses or taxes. An investor may not invest directly into the index. |
| (2) | SNL Small Cap Bank & Thrift Index: Includes all publicly traded (NYSE, NYSE Amex, NASDAQ, OTC BB, Pink Sheets) Banks and Thrifts in SNL’s coverage universe with $250M to $1B Total Common Market Capitalization as of most recent pricing data. Source: SNL Financial, data as of October 31, 2014. The index is not actively managed and does not reflect any deduction of fees, expenses or taxes. An investor may not invest directly into the index. |
| (3) | Standard & Poor’s 500® Index is an unmanaged index of 500 common stocks chosen for the market size, liquidity and industry group representation. It is a market-value weighted index. The index is not actively managed and does not reflect any deduction for fees, expenses or taxes. An investor may not invest directly into the index. The index is not actively managed and does not reflect any deduction of fees, expenses or taxes. An investor may not invest directly into the index. |
| (4) | SNL Large Cap U.S. Bank & Thrift Index: Includes all publicly traded (NYSE, NYSE Amex, NASDAQ, OTC BB, Pink Sheets) Banks and Thrifts in SNL’s coverage universe with greater than $5 billion Total Common Market Capitalization as of most recent pricing data. Source: SNL Financial, data as of October 31, 2014. The index is not actively managed and does not reflect any deduction of fees, expenses or taxes. An investor may not invest directly into the index. |
10 |
www.emeraldmutualfunds.com |
Table of Contents
| Emerald Banking and Finance Fund | Manager Commentary | |
| October 31, 2014 (Unaudited) |
TOP TEN HOLDINGS | ||||
(as a % of Net Assets)*
| ||||
California Republic Bancorp | 3.50% | |||
Bank of the Ozarks, Inc. | 3.44% | |||
PacWest Bancorp | 3.21% | |||
Signature Bank | 2.83% | |||
ConnectOne Bancorp, Inc. | 2.59% | |||
SVB Financial Group | 2.51% | |||
First NBC Bank Holding Co. | 2.31% | |||
Eagle Bancorp, Inc. | 2.21% | |||
BankUnited, Inc. | 2.09% | |||
Old Second Bancorp, Inc. | 2.05% | |||
Top Ten Holdings | 26.77% | |||
INDUSTRY SECTOR ALLOCATION | ||||
(as a % of Net Assets)
| ||||
Banks: Diversified | 74.42% | |||
Banks: Savings, Thrift & | 8.50% | |||
Commercial Banks | 5.84% | |||
Insurance: | 3.56% | |||
Diversified | 2.55% | |||
Real Estate Investment | 1.12% | |||
Consumer Lending | 0.80% | |||
Financial Data & Services | 0.57% | |||
Asset Management | 0.54% | |||
Commercial Finance & | 0.49% | |||
Real Estate Management | 0.45% | |||
Cash, Cash Equivalents, | 1.16% | |||
* Holdings are subject to change.
| ||||
GROWTH OF $10,000 INVESTMENT IN THE FUND (for the period ended October 31, 2014)
Comparison of change in value of a $10,000 investment (includes applicable sales loads)
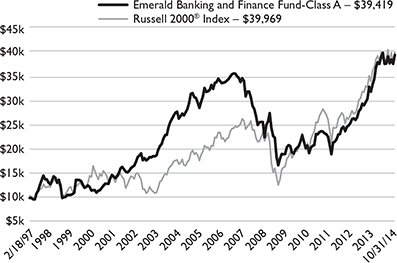
The chart represents historical performance of a hypothetical investment of $10,000 in the Fund since inception. Past performance does not guarantee future results. This chart does not reflect the deduction of taxes that a shareholder would pay on Fund distributions or the redemption of Fund shares.
AVERAGE ANNUAL TOTAL RETURN (for the period ended October 31, 2014)
| Since | Expense Ratio | |||||||||||||||||||||||||||
| 1 Year | 3 Year | 5 Year | 10 Year | Inception1 | Gross2 | Net2 | ||||||||||||||||||||||
Class A (NAV) | 14.69% | 23.12% | 15.66% | 2.98% | 8.36% | 1.72% | 1.72% | |||||||||||||||||||||
Class A (MOP) | 9.25% | 21.15% | 14.54% | 2.48% | 8.06% | 1.72% | 1.72% | |||||||||||||||||||||
Russell 2000® Index† | 8.06% | 18.18% | 17.39% | 8.67% | 8.14% | |||||||||||||||||||||||
Russell 2000® | 12.10% | 20.46% | 16.63% | 5.14% | 8.45% | |||||||||||||||||||||||
Class C (NAV) | 13.93% | 22.36% | 14.95% | 2.34% | 8.53% | 2.38% | 2.38% | |||||||||||||||||||||
Class C (CDSC) | 12.93% | 22.36% | 14.95% | 2.34% | 8.53% | 2.38% | 2.38% | |||||||||||||||||||||
Russell 2000® Index† | 8.06% | 18.18% | 17.39% | 8.67% | 8.14% | |||||||||||||||||||||||
Russell 2000® | 12.10% | 20.46% | 16.63% | 5.14% | 8.45% | |||||||||||||||||||||||
Investor Class | 14.69% | 23.21% | – | – | 13.09% | 1.69% | 1.69% | |||||||||||||||||||||
Russell 2000® Index† | 8.06% | 18.18% | 17.39% | 8.67% | 8.14% | |||||||||||||||||||||||
Russell 2000® | 12.10% | 20.46% | 16.63% | 5.14% | 8.45% | |||||||||||||||||||||||
Institutional Class | 15.03% | – | – | – | 20.78% | 1.37% | 1.37% | |||||||||||||||||||||
Russell 2000® Index† | 8.06% | 18.18% | 17.39% | 8.67% | 8.14% | |||||||||||||||||||||||
Russell 2000® | 12.10% | 20.46% | 16.63% | 5.14% | 8.45% | |||||||||||||||||||||||
Semi-Annual Report | October 31, 2014 |
11 |
Table of Contents
| Emerald Banking and Finance Fund | Manager Commentary | |
October 31, 2014 (Unaudited) |
| ||||
The performance quoted represents past performance, does not guarantee future results and current performance may be lower or higher than the data quoted. The investment return and principal value of an investment will fluctuate so that shares, when redeemed, may be worth more or less than their original cost. Performance data current to the most recent month end may be obtained at www.emeraldmutualfunds.com.
Performance shown for periods prior to March 16, 2012, reflects the performance of the Forward Banking & Finance Fund, a series of Forward Funds (as a result of a reorganization of the Forward Banking & Finance Fund into the Emerald Banking & Finance Fund).
Maximum Offering Price (MOP) for Class A shares includes the Fund’s maximum sales charge of 4.75%. Performance shown at NAV does not include these sales charges and would have been lower had it been taken into account.
A Contingent Deferred Sales Charge (CDSC) of 1.00% may apply to Class C shares redeemed within the first 12 months after a purchase.
| 1 | Inception Dates - Class A: 02/18/1997, Class C: 07/01/2000, Class Institutional: 03/19/2012, Class Investor: 03/16/2010 |
| 2 | Emerald Mutual Fund Advisers Trust (“Emerald” or the “Adviser”) has agreed contractually to waive a portion of its fees and reimburse other expenses until August 31, 2014 in amounts necessary to limit the Fund’s operating expenses (exclusive of Acquired Fund Fees and Expenses, brokerage expenses, interest expenses, taxes and extraordinary expense) for Class A, Class C, Institutional Class, and Investor Class shares to an annual rate (as percentage of the Fund’s average daily net assets) of 1.84%, 2.49%, 1.54% and 1.89% respectively. The Adviser will be permitted to recover, on a class-by-class basis, expenses it has borne through the agreement described above to the extent that the Fund’s expenses in later periods fall below the annual rates set forth in the relevant agreement. The Fund will not be obligated to pay any such deferred fees and expenses more than three years after the year(s) in which the fees and expense were incurred. The Adviser may not discontinue this waiver prior to August 31, 2014, without the approval by the Fund’s Board of Trustees. Ratios as of the Prospectus dated August 31, 2014. |
| † | The Russell 2000® Index measures the performance of the small-cap segment of the U.S. equity universe. The Russell 2000® is a subset of the Russell 3000® Index representing approximately 10% of the total market capitalization of that index. It includes approximately 2000 of the smallest securities based on a combination of their market cap and current index membership. The index is not actively managed and does not reflect any deductions for fees, expenses or taxes. An investor may not invest directly into an index. |
| †† | The Russell 2000® Financial Services TR Index is comprised of the smallest financial services companies in the Russell 3000 Index. The Index is not actively managed and does not reflect any deductions for fees, expense, or taxes. An investor may not invest directly in the Index. |
Important Risks
A fund that concentrates in a particular industry will involve a greater degree of risk than a fund with a more diversified portfolio. Investing in smaller companies generally will present greater investment risks, including: greater price volatility, greater sensitivity to changing economic conditions and less liquidity than the securities of larger, more mature companies.
12 |
www.emeraldmutualfunds.com |
Table of Contents
| Emerald Funds | Disclosure of Fund Expenses | |
October 31, 2014 (Unaudited) |
As a shareholder of the Funds, you incur two types of costs: (1) transaction costs, including applicable sales charges (loads); and (2) ongoing costs, including management fees, distribution and service (12b-1) fees, shareholder services fees and other Fund expenses. This example is intended to help you understand your ongoing costs (in dollars) of investing in the Funds and to compare these costs with the ongoing costs of investing in other mutual funds. The example is based on an investment of $1,000 invested at the beginning of the (six-month) period and held for the entire period May 1, 2014 through October 31, 2014.
Actual Expenses
The first line for each share class of each Fund in the table provides information about actual account values and actual expenses. You may use this information, together with the amount you invested, to estimate the expenses that you paid over the period. Simply divide your account value by $1,000 (for example, an $8,600 account value divided by $1,000 = 8.6), then multiply the result by the number in the applicable line under the heading entitled “Expenses Paid During Period” to estimate the expenses you paid on your account during this period.
Hypothetical Example For Comparison Purposes
The second line for each share class of each Fund in the table below provides information about hypothetical account values and hypothetical expenses based on the Fund’s actual expense ratio and an assumed rate of return of 5% per year before expenses, which is not the Fund’s actual return. The hypothetical account values and expenses may not be used to estimate the actual ending account balance or expenses you paid for the period. You may use this information to compare the ongoing costs of investing in the Funds and other funds. To do so, compare this 5% hypothetical example with the 5% hypothetical examples that appear in the shareholder reports of other funds.
Please note that the expenses shown in the table below are meant to highlight your ongoing costs only and do not reflect any transactional costs, such as sales charges (loads), redemption fees or exchange fees. Therefore, the second line for each share class of each Fund within the table is useful in comparing ongoing costs only, and will not help you determine the relative total costs of owning different funds. If these transactional costs were included, your costs would have been higher.
| Emerald Growth Fund | Beginning Account Value 05/01/14 | Ending Account Value 10/31/14 | Expense Ratio(a) | Expense Paid During Period 5/01/14 - 10/31/14(b) | ||||
Class A | ||||||||
Actual | $ 1,000.00 | $ 1,061.80 | 1.29% | $ 6.70 | ||||
Hypothetical (5% return before expenses) | $ 1,000.00 | $ 1,018.70 | 1.29% | $ 6.56 | ||||
Class C | ||||||||
Actual | $ 1,000.00 | $ 1,058.50 | 1.94% | $ 10.07 | ||||
Hypothetical (5% return before expenses) | $ 1,000.00 | $ 1,015.43 | 1.94% | $ 9.86 | ||||
Institutional Class | ||||||||
Actual | $ 1,000.00 | $ 1,063.80 | 0.99% | $ 5.15 | ||||
Hypothetical (5% return before expenses)
| $ 1,000.00
| $ 1,020.21
| 0.99%
| $ 5.04
| ||||
Investor Class | ||||||||
Actual | $ 1,000.00 | $ 1,062.00 | 1.34% | $ 6.96 | ||||
Hypothetical (5% return before expenses) | $ 1,000.00 | $ 1,018.45 | 1.34% | $ 6.82 |
| (a) | The Fund’s expense ratios have been based on the Fund’s most recent fiscal half-year expenses. |
| (b) | Expenses are equal to the Fund’s annualized expense ratio multiplied by the average account value over the period, multiplied by the number of days in the most recent fiscal half-year (184)/365 (to reflect the half-year period). |
Semi-Annual Report | October 31, 2014 |
13 |
Table of Contents
| Emerald Funds | Disclosure of Fund Expenses | |
October 31, 2014 (Unaudited) |
| Emerald Insights Fund | Beginning Account Value 05/01/14 | Ending Account Value 10/31/14 | Expense Ratio(a) | Expense Paid 5/01/14 - 10/31/14(b) | ||||
Class A | ||||||||
Actual(c) | $ 1,000.00 | $ 1,021.00 | 1.35% | $ 3.33 | ||||
Hypothetical (5% return before expenses) | $ 1,000.00 | $ 1,018.40 | 1.35% | $ 6.87 | ||||
Class C | ||||||||
Actual(c) | $ 1,000.00 | $ 1,018.00 | 2.00% | $ 4.92 | ||||
Hypothetical (5% return before expenses) | $ 1,000.00 | $ 1,015.12 | 2.00% | $ 10.16 | ||||
Institutional Class | ||||||||
Actual(c) | $ 1,000.00 | $ 1,021.00 | 1.05% | $ 2.59 | ||||
Hypothetical (5% return before expenses) | $ 1,000.00 | $ 1,019.91 | 1.05% | $ 5.35 | ||||
Investor Class | ||||||||
Actual(c) | $ 1,000.00 | $ 1,019.00 | 1.40% | $ 3.45 | ||||
Hypothetical (5% return before expenses) | $ 1,000.00 | $ 1,018.15 | 1.40% | $ 7.12 |
| (a) | The Fund’s expense ratios have been based on the Fund’s most recent fiscal half-year expenses. |
| (b) | Expenses are equal to the Fund’s annualized expense ratio multiplied by the average account value over the period, multiplied by the number of days in the most recent fiscal half-year (184)/365 (to reflect the half-year period). |
| (c) | Shares commenced operations on August 1, 2014. |
| Emerald Banking and Finance Fund | Beginning Account Value 05/01/14 | Ending Account Value 10/31/14 | Expense Ratio(a) | Expense Paid During Period 5/01/14 - 10/31/14(b) | ||||
Class A | ||||||||
Actual | $ 1,000.00 | $ 1,049.40 | 1.59% | $ 8.21 | ||||
Hypothetical (5% return before expenses) | $ 1,000.00 | $ 1,017.19 | 1.59% | $ 8.08 | ||||
| ||||||||
Class C | ||||||||
Actual | $ 1,000.00 | $ 1,045.70 | 2.24% | $ 11.55 | ||||
Hypothetical (5% return before expenses) | $ 1,000.00 | $ 1,013.91 | 2.24% | $ 11.37 | ||||
Institutional Class | ||||||||
Actual | $ 1,000.00 | $ 1,051.00 | 1.30% | $ 6.72 | ||||
Hypothetical (5% return before expenses) | $ 1,000.00 | $ 1,018.65 | 1.30% | $ 6.61 | ||||
| ||||||||
Investor Class | ||||||||
Actual | $ 1,000.00 | $ 1,049.20 | 1.65% | $ 8.52 | ||||
Hypothetical (5% return before expenses) | $ 1,000.00 | $ 1,016.89 | 1.65% | $ 8.39 | ||||
| (a) | The Fund’s expense ratios have been based on the Fund’s most recent fiscal half-year expenses. |
| (b) | Expenses are equal to the Fund’s annualized expense ratio multiplied by the average account value over the period, multiplied by the number of days in the most recent fiscal half-year (184)/365 (to reflect the half-year period). |
14 |
www.emeraldmutualfunds.com |
Table of Contents
| Emerald Growth Fund | Schedule of Investments | |
| October 31, 2014 (Unaudited) |
| Value | ||||||||
| Shares | (Note 2) | |||||||
| COMMON STOCKS: 97.76% |
| ||||||
| Consumer Discretionary: 11.88% |
| ||||||
| 105,450 | Black Diamond, Inc.(a) | $818,292 | ||||||
| 60,500 | Brunswick Corp. | 2,831,400 | ||||||
| 127,860 | Chegg, Inc.(a) | 850,269 | ||||||
| 207,410 | Christopher & Banks Corp.(a) | 1,354,387 | ||||||
| 93,283 | Chuy’s Holdings, Inc.(a) | 2,790,094 | ||||||
| 30,871 | Dave & Buster’s Entertainment, | 606,924 | ||||||
| 189,636 | Diversified Restaurant Holdings, | 982,314 | ||||||
| 39,559 | Five Below, Inc.(a) | 1,577,217 | ||||||
| 106,380 | HomeAway, Inc.(a) | 3,712,662 | ||||||
| 54,271 | Jack in the Box, Inc. | 3,855,412 | ||||||
| 43,930 | Kate Spade & Co.(a) | 1,191,821 | ||||||
| 70,319 | Malibu Boats, Inc., Class A(a) | 1,312,152 | ||||||
| 118,263 | MarineMax, Inc.(a) | 2,267,102 | ||||||
| 31,444 | Multimedia Games Holding Co., | 1,097,396 | ||||||
| 53,042 | Red Robin Gourmet Burgers, Inc.(a) | 2,915,719 | ||||||
| 119,980 | Scientific Games Corp., Class A(a) | 1,412,165 | ||||||
| 118,870 | Sequential Brands Group, Inc.(a) | 1,490,630 | ||||||
| 120,825 | Tilly’s, Inc., Class A(a) | 860,274 | ||||||
| 31,926,230 | ||||||||
| Consumer Staples: 0.32% | |||||||
| 65,520 | Inventure Foods, Inc.(a) | 867,485 | ||||||
| 867,485 | ||||||||
| Energy: 2.75% | |||||||
| 31,989 | Diamondback Energy, Inc.(a) | 2,189,327 | ||||||
| 82,650 | Enphase Energy, Inc.(a) | 1,241,403 | ||||||
| 291,378 | Magnum Hunter Resources Corp.(a) | 1,351,994 | ||||||
| 193,325 | Penn Virginia Corp.(a) | 1,656,796 | ||||||
| 55,000 | Sanchez Energy Corp.(a) | 938,850 | ||||||
| 7,378,370 | ||||||||
| Financial Services: 16.97% | |||||||
| 108,558 | AmTrust Financial Services, Inc. | 4,870,997 | ||||||
| 150,424 | Bank of the Ozarks, Inc. | 5,300,942 | ||||||
| 54,000 | California Republic Bancorp(a) | 1,509,300 | ||||||
| 215,282 | CoBiz Financial, Inc. | 2,587,690 | ||||||
| 66,159 | ConnectOne Bancorp, Inc. | 1,223,942 | ||||||
| 77,033 | Customers Bancorp, Inc.(a) | 1,471,330 | ||||||
| 24,846 | Evercore Partners, Inc., Class A | 1,286,277 | ||||||
| 125,651 | FCB Financial Holdings, Inc., | 2,883,690 | ||||||
| 100,034 | First NBC Bank Holding Co.(a) | 3,674,249 | ||||||
| 26,720 | Greenhill & Co., Inc. | 1,202,400 | ||||||
| 118,203 | Howard Bancorp, Inc.(a) | 1,282,503 | ||||||
| 21,870 | Independent Bank Group, Inc. | 977,370 | ||||||
| 78,300 | Ladder Capital Corp., Class A(a) | 1,486,917 | ||||||
| 41,802 | Moelis & Co., Class A | 1,427,956 | ||||||
| 140,040 | Opus Bank(a) | 3,683,052 | ||||||
| 78,444 | Pacific Premier Bancorp, Inc.(a) | 1,270,008 | ||||||
| 62,400 | PacWest Bancorp | 2,661,984 | ||||||
| 51,908 | Peoples Bancorp, Inc. | 1,279,532 | ||||||
| Value | ||||||||
| Shares | (Note 2) | |||||||
| Financial Services (continued) |
| ||||||
| 18,257 | South State Corp. | $1,101,080 | ||||||
| 105,067 | Square 1 Financial, Inc., Class A(a) | 2,089,783 | ||||||
| 167,409 | Talmer Bancorp, Inc., Class A | 2,340,378 | ||||||
| 45,611,380 | ||||||||
| Health Care: 25.07% | |||||||
| 6,670 | AAC Holdings, Inc.(a) | 145,273 | ||||||
| 13,420 | Abaxis, Inc. | 706,697 | ||||||
| 95,561 | Acadia Healthcare Co., Inc.(a) | 5,929,560 | ||||||
| 68,414 | Adamas Pharmaceuticals, Inc.(a) | 1,041,945 | ||||||
| 48,550 | Alnylam Pharmaceuticals, Inc.(a) | 4,502,527 | ||||||
| 27,360 | ANI Pharmaceuticals, Inc.(a) | 929,146 | ||||||
| 58,920 | AtriCure, Inc.(a) | 1,027,565 | ||||||
| 36,570 | Auspex Pharmaceuticals, Inc.(a) | 991,047 | ||||||
| 62,210 | Bluebird Bio, Inc.(a) | 2,612,198 | ||||||
| 70,801 | Cepheid(a) | 3,753,161 | ||||||
| 194,002 | Depomed, Inc.(a) | 2,987,631 | ||||||
| 150,000 | Ekso Bionics Holdings, Inc.(a) | 205,500 | ||||||
| 71,080 | Epizyme, Inc.(a) | 1,885,752 | ||||||
| 61,239 | Everyday Health, Inc.(a) | 837,137 | ||||||
| 74,940 | Heron Therapeutics, Inc.(a) | 660,971 | ||||||
| 123,104 | Horizon Pharma Plc(a) | 1,592,966 | ||||||
| 92,150 | Icad, Inc.(a) | 1,036,687 | ||||||
| 87,217 | Inogen, Inc.(a) | 2,059,193 | ||||||
| 90,479 | Intrexon Corp.(a) | 2,019,491 | ||||||
| 67,054 | Isis Pharmaceuticals, Inc.(a) | 3,088,507 | ||||||
| 123,559 | K2M Group Holdings, Inc.(a) | 1,989,300 | ||||||
| 79,151 | LDR Holding Corp.(a) | 2,725,960 | ||||||
| 50,326 | MacroGenics, Inc.(a) | 1,071,441 | ||||||
| 39,110 | Marinus Pharmaceuticals, Inc.(a) | 293,325 | ||||||
| 41,991 | MWI Veterinary Supply, Inc.(a) | 7,123,983 | ||||||
| 82,327 | NanoString Technologies, Inc.(a) | 876,783 | ||||||
| 81,390 | Neurocrine Biosciences, Inc.(a) | 1,507,343 | ||||||
| 76,627 | NPS Pharmaceuticals, Inc.(a) | 2,099,580 | ||||||
| 62,650 | OvaScience, Inc.(a) | 1,223,554 | ||||||
| 86,694 | Portola Pharmaceuticals, Inc.(a) | 2,470,779 | ||||||
| 6,310 | Puma Biotechnology, Inc.(a) | 1,581,286 | ||||||
| 19,480 | Sientra, Inc.(a) | 346,744 | ||||||
| 15,922 | Ultragenyx Pharmaceutical, Inc.(a) | 748,493 | ||||||
| 37,660 | WellCare Health Plans, Inc.(a) | 2,555,984 | ||||||
| 12,240 | West Pharmaceutical Services, Inc. | 627,300 | ||||||
| 35,000 | Zafgen, Inc.(a) | 745,500 | ||||||
| 36,730 | ZS Pharma, Inc.(a) | 1,381,783 | ||||||
| 67,382,092 | ||||||||
| Materials & Processing: 7.54% | |||||||
| 18,760 | Acuity Brands, Inc. | 2,615,707 | ||||||
| 105,326 | Apogee Enterprises, Inc. | 4,623,811 | ||||||
| 37,155 | NN, Inc. | 928,875 | ||||||
| 125,478 | PolyOne Corp. | 4,643,941 | ||||||
| 47,810 | TimkenSteel Corp. | 1,940,130 | ||||||
| 100,504 | Trex Co., Inc.(a) | 4,321,672 | ||||||
Semi-Annual Report | October 31, 2014 |
15 |
Table of Contents
| Emerald Growth Fund | Schedule of Investments | |
October 31, 2014 (Unaudited) |
| Value | ||||||||
| Shares | (Note 2) | |||||||
| Materials & Processing (continued) |
| ||||||
| 26,830 | US Silica Holdings, Inc. | $1,204,667 | ||||||
| 20,278,803 | ||||||||
| Producer Durables: 14.84% | |||||||
| 41,954 | Astronics Corp.(a) | 2,173,637 | ||||||
| 8,390 | Astronics Corp., Class B(a) | 433,763 | ||||||
| 95,258 | FARO Technologies, Inc.(a) | 5,334,448 | ||||||
| 76,301 | H&E Equipment Services, Inc. | 2,852,894 | ||||||
| 11,760 | HEICO Corp. | 637,862 | ||||||
| 166,273 | Kforce, Inc. | 3,849,220 | ||||||
| 57,312 | Knoll, Inc. | 1,139,936 | ||||||
| 40,790 | Korn/Ferry International(a) | 1,139,265 | ||||||
| 7,780 | OSI Systems, Inc.(a) | 551,446 | ||||||
| 84,880 | Primoris Services Corp. | 2,437,754 | ||||||
| 19,970 | Proto Labs, Inc.(a) | 1,305,439 | ||||||
| 81,552 | Roadrunner Transportation Systems, Inc.(a) | 1,680,787 | ||||||
| 113,673 | Spirit Airlines, Inc.(a) | 8,310,633 | ||||||
| 27,160 | Tennant Co. | 2,002,507 | ||||||
| 147,827 | Tutor Perini Corp.(a) | 4,140,634 | ||||||
| 23,100 | WESCO International, Inc.(a) | 1,903,671 | ||||||
| 39,893,896 | ||||||||
| Technology: 17.06% | |||||||
| 122,213 | Adept Technology, Inc.(a) | 865,268 | ||||||
| 89,598 | Applied Optoelectronics, Inc.(a) | 1,446,112 | ||||||
| 89,890 | ARC Document Solutions, Inc.(a) | 912,383 | ||||||
| 14,140 | Aspen Technology, Inc.(a) | 522,190 | ||||||
| 47,736 | Cavium, Inc.(a) | 2,449,334 | ||||||
| 68,340 | ChannelAdvisor Corp.(a) | 949,243 | ||||||
| 77,281 | EPAM Systems, Inc.(a) | 3,689,395 | ||||||
| 541,357 | Glu Mobile, Inc.(a) | 2,095,052 | ||||||
| 26,290 | Guidewire Software, Inc.(a) | 1,312,923 | ||||||
| 104,540 | Imperva, Inc.(a) | 4,283,004 | ||||||
| 92,524 | Inphi Corp.(a) | 1,432,271 | ||||||
| 45,539 | IPG Photonics Corp.(a) | 3,343,018 | ||||||
| 45,410 | Methode Electronics, Inc. | 1,788,246 | ||||||
| 138,305 | Microsemi Corp.(a) | 3,605,611 | ||||||
| 16,640 | MicroStrategy, Inc., Class A(a) | 2,677,043 | ||||||
| 20,027 | PDF Solutions, Inc.(a) | 259,750 | ||||||
| 122,720 | Pixelworks, Inc.(a) | 554,694 | ||||||
| 102,320 | Proofpoint, Inc.(a) | 4,506,173 | ||||||
| 131,627 | Qlik Technologies, Inc.(a) | 3,731,625 | ||||||
| 78,027 | Reis, Inc. | 1,825,832 | ||||||
| 23,860 | Ultimate Software Group, Inc.(a) | 3,591,169 | ||||||
| 45,840,336 | ||||||||
| Utilities: 1.33% | |||||||
| 227,338 | 8x8, Inc.(a) | 1,786,877 | ||||||
| 164,960 | ORBCOMM, Inc.(a) | 1,042,547 | ||||||
| Value | ||||||||
| Shares | (Note 2) | |||||||
| Utilities (continued) | |||||||
| 215,130 | Vonage Holdings Corp.(a) | $748,652 | ||||||
| 3,578,076 | ||||||||
Total Common Stocks (Cost $206,118,562) | 262,756,668 | |||||||
| WARRANTS: 0.00% | |||||||
| 41,894 | Magnum Hunter Resources Corp., Strike Price $8.50 (expiring 04/15/16)(a) | 0 | ||||||
Total Warrants (Cost $0) | 0 | |||||||
| SHORT TERM INVESTMENTS: 1.92% | |||||||
| 5,144,452 | Dreyfus Government Cash Management Fund - Institutional Class 0.021% | 5,144,452 | ||||||
Total Short Term Investments (Cost $5,144,452) | 5,144,452 | |||||||
| Total Investments: 99.68% (Cost $211,263,014) | 267,901,120 | |||||||
| Other Assets | ||||||||
|
| |||||||
In Excess Of Liabilities: 0.32% | 868,813 | |||||||
|
| |||||||
| Net Assets: 100.00% | $ | 268,769,933 | ||||||
| (a) | Non-income producing security. |
Investment Abbreviations:
Plc - Public limited company.
Holdings are subject to change.
For Fund compliance purposes, the Fund’s industry classifications refer to any one or more of the industry sub-classifications used by one or more widely recognized market indexes or ratings group indexes, and/or as defined by Fund management. This definition may not apply for purposes of this report, which may combine industry sub-classifications for reporting ease. Industries are shown as a percentage of net assets.
See Notes to Financial Statements.
16 |
www.emeraldmutualfunds.com |
Table of Contents
| Emerald Insights Fund | Schedule of Investments | |
October 31, 2014 (Unaudited) |
| Value | ||||||||
| Shares | (Note 2) | |||||||
| COMMON STOCKS: 87.29% |
| ||||||
| Consumer Discretionary: 24.60% |
| ||||||
| 1,578 | Avis Budget Group, Inc.(a) | $ | 87,973 | |||||
| 420 | BorgWarner, Inc. | 23,948 | ||||||
| 1,800 | Brunswick Corp. | 84,240 | ||||||
| 447 | Deckers Outdoor Corp.(a) | 39,095 | ||||||
| 960 | Foot Locker, Inc. | 53,770 | ||||||
| 714 | Harman International Industries, | 76,641 | ||||||
| 1,905 | HomeAway, Inc.(a) | 66,484 | ||||||
| 1,790 | IMAX Corp.(a) | 52,733 | ||||||
| 1,191 | Jack in the Box, Inc. | 84,609 | ||||||
| 1,499 | Jarden Corp.(a) | 97,570 | ||||||
| 3,053 | Lions Gate Entertainment Corp. | 101,146 | ||||||
| 888 | McGraw Hill Financial, Inc. | 80,346 | ||||||
| 3,155 | MGM Resorts International(a) | 73,354 | ||||||
| 664 | Ross Stores, Inc. | 53,598 | ||||||
| 1,155 | Sinclair Broadcast Group, Inc., | 33,553 | ||||||
| 113 | Tesla Motors, Inc.(a) | 27,312 | ||||||
| 640 | Tribune Media Co., Class A(a) | 42,880 | ||||||
| 733 | Twitter, Inc.(a) | 30,398 | ||||||
| 841 | Under Armour, Inc., Class A(a) | 55,153 | ||||||
| 742 | Williams-Sonoma, Inc. | 48,252 | ||||||
| 312 | Wynn Resorts Ltd. | 59,283 | ||||||
| 1,272,338 | ||||||||
| Consumer Staples: 2.15% | |||||||
| 464 | Hain Celestial Group, Inc.(a) | 50,228 | ||||||
| 2,091 | Sprouts Farmers Market, Inc.(a) | 60,869 | ||||||
| 111,097 | ||||||||
| Energy: 4.98% | |||||||
| 452 | Cabot Oil & Gas Corp. | 14,057 | ||||||
| 546 | Diamondback Energy, Inc.(a) | 37,368 | ||||||
| 1,225 | EP Energy Corp., Class A(a) | 17,885 | ||||||
| 1,260 | Gulfport Energy Corp.(a) | 63,227 | ||||||
| 436 | InterOil Corp.(a) | 24,695 | ||||||
| 3,767 | Penn Virginia Corp.(a) | 32,283 | ||||||
| 1,359 | Sanchez Energy Corp.(a) | 23,198 | ||||||
| 736 | Whiting Petroleum Corp.(a) | 45,073 | ||||||
| 257,786 | ||||||||
| Financial Services: 8.51% | |||||||
| 583 | Affiliated Managers Group, Inc.(a) | 116,478 | ||||||
| 293 | Alliance Data Systems Corp.(a) | 83,022 | ||||||
| 2,157 | Genworth Financial, Inc., Class A(a) | 30,176 | ||||||
| 1,710 | PacWest Bancorp | 72,949 | ||||||
| 761 | SEI Investments Co. | 29,420 | ||||||
| 604 | Signature Bank(a) | 73,162 | ||||||
| 313 | SVB Financial Group(a) | 35,053 | ||||||
| 440,260 | ||||||||
| Health Care: 15.48% | |||||||
| 474 | Acadia Healthcare Co., Inc.(a) | 29,412 | ||||||
| Value | ||||||||
| Shares | (Note 2) | |||||||
| Health Care (continued) |
| ||||||
| 1,144 | Alnylam Pharmaceuticals, Inc.(a) | $ | 106,095 | |||||
| 968 | AmerisourceBergen Corp. | 82,677 | ||||||
| 2,102 | Cepheid(a) | 111,427 | ||||||
| 1,007 | Community Health Systems, Inc.(a) | 55,355 | ||||||
| 4,630 | Horizon Pharma Plc(a) | 59,912 | ||||||
| 136 | Intercept Pharmaceuticals, Inc.(a) | 35,141 | ||||||
| 2,464 | Intrexon Corp.(a) | 54,996 | ||||||
| 952 | Medivation, Inc.(a) | 100,626 | ||||||
| 321 | MWI Veterinary Supply, Inc.(a) | 54,459 | ||||||
| 1,628 | NPS Pharmaceuticals, Inc.(a) | 44,607 | ||||||
| 745 | Sarepta Therapeutics, Inc.(a) | 12,047 | ||||||
| 284 | United Therapeutics Corp.(a) | 37,196 | ||||||
| 149 | Vertex Pharmaceuticals, Inc.(a) | 16,783 | ||||||
| 800,733 | ||||||||
| Materials & Processing: 5.85% | |||||||
| 986 | Carpenter Technology Corp. | 49,349 | ||||||
| 831 | Eagle Materials, Inc. | 72,655 | ||||||
| 1,311 | PolyOne Corp. | 48,520 | ||||||
| 239 | PPG Industries, Inc. | 48,682 | ||||||
| 489 | United States Steel Corp. | 19,580 | ||||||
| 1,419 | US Silica Holdings, Inc. | 63,713 | ||||||
| 302,499 | ||||||||
| Producer Durables: 12.85% | |||||||
| 692 | Chicago Bridge & Iron Co., NV | 37,811 | ||||||
| 821 | EnerSys | 51,559 | ||||||
| 2,304 | Korn/Ferry International(a) | 64,351 | ||||||
| 656 | Middleby Corp.(a) | 58,056 | ||||||
| 2,761 | Quanta Services, Inc.(a) | 94,095 | ||||||
| 1,900 | Southwest Airlines Co. | 65,512 | ||||||
| 1,147 | Spirit Airlines, Inc.(a) | 83,857 | ||||||
| 509 | United Rentals, Inc.(a) | 56,020 | ||||||
| 1,213 | Wabtec Corp. | 104,682 | ||||||
| 591 | WESCO International, Inc.(a) | 48,704 | ||||||
| 664,647 | ||||||||
| Technology: 12.87% | |||||||
| 2,213 | Fortinet, Inc.(a) | 57,649 | ||||||
| 430 | Intuit, Inc. | 37,844 | ||||||
| 985 | IPG Photonics Corp.(a) | 72,309 | ||||||
| 296 | LinkedIn Corp., Class A(a) | 67,772 | ||||||
| 1,805 | Micron Technology, Inc.(a) | 59,727 | ||||||
| 322 | NetSuite, Inc.(a) | 34,989 | ||||||
| 634 | Palo Alto Networks, Inc.(a) | 67,014 | ||||||
| 2,384 | Proofpoint, Inc.(a) | 104,991 | ||||||
| 539 | SBA Communications Corp., | 60,546 | ||||||
| 929 | ServiceNow, Inc.(a) | 63,107 | ||||||
| 428 | Skyworks Solutions, Inc. | 24,927 | ||||||
Semi-Annual Report | October 31, 2014 |
17 |
Table of Contents
| Emerald Insights Fund | Schedule of Investments | |
October 31, 2014 (Unaudited) |
| Value | ||||||||
| Shares | (Note 2) | |||||||
| Technology (continued) |
| ||||||
| 222 | Synaptics, Inc.(a) | $15,191 | ||||||
| 666,066 | ||||||||
Total Common Stocks (Cost $4,353,809) | 4,515,426 | |||||||
| EXCHANGE TRADED FUNDS: 4.64% | |||||||
| Equity: 4.64% | |||||||
| 2,640 | iShares® Russell Mid-Cap Growth ETF | 239,765 | ||||||
| 239,765 | ||||||||
Total Exchange Traded Funds (Cost $234,948) | 239,765 | |||||||
| MASTER LIMITED PARTNERSHIPS: 0.59% | |||||||
| Financial Services: 0.59% | |||||||
| 625 | Lazard Ltd., Class A | 30,756 | ||||||
| 30,756 | ||||||||
Total Master Limited Partnerships (Cost $32,574) | 30,756 | |||||||
| SHORT TERM INVESTMENTS: 10.75% | |||||||
| 556,010 | Dreyfus Government Cash Management Fund - Institutional Class 0.021% (7-Day Yield) | 556,010 | ||||||
Total Short Term Investments (Cost $556,010) | 556,010 | |||||||
| Total Investments: 103.27% (Cost $5,177,341) | 5,341,957 | |||||||
| Liabilities In Excess Of Other Assets: (3.27)% | (169,349 | ) | |||||
| Net Assets: 100.00% | $ | 5,172,608 | |||||
| (a) | Non-income producing security. |
Investment Abbreviations:
ETF - Exchange Traded Funds.
Ltd. - Limited.
NV - Naamloze Vennootschap is the Dutch term for public limited
liability corporation.
Plc - Public limited company.
Holdings are subject to change.
For Fund compliance purposes, the Fund’s industry classifications refer to any one or more of the industry sub-classifications used by one or more widely recognized market indexes or ratings group indexes, and/or as defined by Fund management. This definition may not apply for purposes of this report, which may combine industry sub-classifications for reporting ease. Industries are shown as a percentage of net assets.
See Notes to Financial Statements.
18 |
www.emeraldmutualfunds.com |
Table of Contents
| Emerald Banking and Finance Fund | Schedule of Investments | |
October 31, 2014 (Unaudited) |
| Value | ||||||||
| Shares | (Note 2) | |||||||
| COMMON STOCKS: 98.84% | |||||||
| Financial Services: 98.84% | |||||||
| Asset Management & Custodian: 0.54% | |||||||
|
| 45,204
|
| Silvercrest Asset Management Group, Inc., Class A
|
| $674,896
|
| ||
| Banks: Diversified: 74.42% | |||||||
| 111,600 | Alerus Financial Corp. | 2,259,900 | ||||||
| 25,532 | American Business Bank(a) | 785,109 | ||||||
| 94,090 | Ameris Bancorp | 2,333,432 | ||||||
| 30,000 | Atlas Financial Holdings, Inc.(a) | 444,900 | ||||||
| 37,300 | Bancorp, Inc.(a) | 352,858 | ||||||
| 121,936 | Bank of the Ozarks, Inc. | 4,297,025 | ||||||
| 87,453 | BankUnited, Inc. | 2,614,845 | ||||||
| 95,070 | BNC Bancorp | 1,617,141 | ||||||
| 3,235 | Bofl Holding, Inc.(a) | 249,160 | ||||||
| 38,500 | Bridge Bancorp, Inc. | 1,011,010 | ||||||
| 18,290 | Bryn Mawr Bank Corp. | 563,881 | ||||||
| 80,000 | C1 Financial, Inc.(a) | 1,381,600 | ||||||
| 156,489 | California Republic Bancorp(a) | 4,373,868 | ||||||
| 150,670 | Cascade Bancorp(a) | 769,924 | ||||||
| 60,490 | Centerstate Banks, Inc. | 704,104 | ||||||
| 7,646 | Citizens Financial Services, Inc. | 414,795 | ||||||
| 206,178 | CoBiz Financial, Inc. | 2,478,260 | ||||||
| 89,500 | CommerceWest Bank(a) | 1,236,890 | ||||||
| 13,800 | Community National Bank(a) | 210,450 | ||||||
| 83,874 | CommunityOne Bancorp(a) | 892,419 | ||||||
| 174,752 | ConnectOne Bancorp, Inc. | 3,232,912 | ||||||
| 922 | Consumers Bancorp, Inc. | 16,181 | ||||||
| 46,605 | CU Bancorp(a) | 920,449 | ||||||
| 127,682 | Customers Bancorp, Inc.(a) | 2,438,726 | ||||||
| 76,890 | Eagle Bancorp, Inc.(a) | 2,762,658 | ||||||
| 23,220 | East West Bancorp, Inc. | 853,567 | ||||||
| 51,345 | EverBank Financial Corp. | 983,257 | ||||||
| 86,853 | Farmers National Banc Corp. | 703,509 | ||||||
| 21,820 | First Bancorp | 395,378 | ||||||
| 65,100 | First Bank(a) | 395,157 | ||||||
| 29,445 | First Business Financial Services, Inc. | 1,381,854 | ||||||
| 42,300 | First Financial Bankshares, Inc. | 1,344,294 | ||||||
| 78,450 | First NBC Bank Holding Co.(a) | 2,881,468 | ||||||
| 39,225 | First of Long Island Corp. | 1,033,186 | ||||||
| 68,316 | Flagstar Bancorp, Inc.(a) | 1,073,927 | ||||||
| 125,000 | Great Western Bancorp, Inc.(a) | 2,427,500 | ||||||
| 22,506 | Guaranty Bancorp | 354,920 | ||||||
| 96,537 | Heritage Oaks Bancorp | 759,746 | ||||||
| 50,540 | Home BancShares, Inc. | 1,613,237 | ||||||
| 16,003 | HopFed Bancorp, Inc. | 183,074 | ||||||
| 59,296 | Howard Bancorp, Inc.(a) | 643,362 | ||||||
| 15,250 | Independent Bank Corp. | 622,200 | ||||||
| 50,000 | Independent Bank Corporation | 603,500 | ||||||
| 53,000 | Independent Bank Group, Inc. | 2,368,570 | ||||||
| 67,294 | Investors Bancorp, Inc. | 723,410 | ||||||
| 14,700 | John Marshall Bank(a) | | 260,190 | | ||||
| Value | ||||||||
| Shares | (Note 2) | |||||||
| Banks: Diversified (continued) |
| ||||||
| 45,870 | Meridian Bancorp, Inc.(a) | $520,166 | ||||||
| 29,870 | Meta Financial Group, Inc. | 1,120,424 | ||||||
| 52,180 | Northeast Bancorp | 470,142 | ||||||
| 6,224 | Oak Valley Bancorp | 62,178 | ||||||
| 73,738 | Old Line Bancshares, Inc. | 1,178,333 | ||||||
| 120,532 | Pacific Premier Bancorp, Inc.(a) | 1,951,413 | ||||||
| 93,875 | PacWest Bancorp | 4,004,707 | ||||||
| 63,580 | Peoples Bancorp, Inc. | 1,567,247 | ||||||
| 33,413 | Peoples Financial Corp. | 430,359 | ||||||
| 24,300 | Pinnacle Financial Partners, Inc. | 952,560 | ||||||
| 40,440 | PrivateBancorp, Inc. | 1,307,021 | ||||||
| 5,280 | Prosperity Bancshares, Inc. | 318,859 | ||||||
| 12,860 | Renasant Corp. | 387,729 | ||||||
| 481,505 | Royal Bancshares of Pennsylvania, Inc., Class A(a) | 900,414 | ||||||
| 61,435 | ServisFirst Bancshares, Inc. | 1,811,718 | ||||||
| 84,050 | Shore Bancshares, Inc.(a) | 771,579 | ||||||
| 29,220 | Signature Bank(a) | 3,539,419 | ||||||
| 31,940 | Simmons First National Corp., Class A | 1,341,161 | ||||||
| 8,582 | Southern Missouri Bancorp, Inc. | 317,276 | ||||||
| 20,598 | Southern National Bancorp of Virginia, Inc. | 238,525 | ||||||
| 22,420 | Southside Bancshares, Inc. | 752,864 | ||||||
| 61,563 | Square 1 Financial, Inc., Class A(a) | 1,224,488 | ||||||
| 15,426 | Sun Bancorp, Inc.(a) | 311,605 | ||||||
| 28,013 | SVB Financial Group(a) | 3,137,176 | ||||||
| 52,682 | Talmer Bancorp, Inc., Class A | 736,494 | ||||||
| 28,090 | Texas Capital Bancshares, Inc.(a) | 1,717,703 | ||||||
| 87,675 | WashingtonFirst Bankshares, Inc. | 1,332,660 | ||||||
| 20,584 | Western Alliance Bancorp(a) | 547,946 | ||||||
|
| 92,919,969
|
| ||||||
| Banks: Savings, Thrift & Mortgage Lending: 8.50% |
| ||||||
| 225,594 | Atlantic Coast Financial Corp.(a) | 929,447 | ||||||
| 11,750 | Bridge Capital Holdings(a) | 283,410 | ||||||
| 36,162 | Elmira Savings Bank | 783,269 | ||||||
| 12,500 | Flushing Financial Corp. | 251,750 | ||||||
| 103,401 | Heritage Financial Corp. | 1,814,688 | ||||||
| 57,670 | Heritage Financial Group, Inc. | 1,222,027 | ||||||
| 11,680 | Home Bancorp, Inc.(a) | 266,187 | ||||||
| 18,520 | Home Federal Bancorp, Inc. | 362,529 | ||||||
| 36,429 | Mackinac Financial Corp. | 372,304 | ||||||
| 90,232 | Opus Bank(a) | 2,373,102 | ||||||
| 104,750 | Sterling Bancorp | 1,472,785 | ||||||
| 30,890 | Sussex Bancorp | 310,445 | ||||||
| 7,930 | Territorial Bancorp, Inc. | 170,336 | ||||||
| 10,612,279 | ||||||||
| Commercial Banks: 5.84% | |||||||
| 9,000 | 1st Enterprise Bank(a) | 237,600 | ||||||
| 90,134 | First Capital Bancorp, Inc.(a) | 403,800 | ||||||
| 561,112 | First Security Group, Inc.(a) | 1,105,391 | ||||||
| 532,555 | Old Second Bancorp, Inc.(a) | 2,556,264 | ||||||
Semi-Annual Report | October 31, 2014 |
19 |
Table of Contents
| Emerald Banking and Finance Fund | Schedule of Investments | |
October 31, 2014 (Unaudited) |
| Value | ||||||||
| Shares | (Note 2) | |||||||
| Commercial Banks (continued) |
| ||||||
| 44,200 | Seacoast Commerce Bank(a) | $ | 442,000 | |||||
| 42,510 | Stonegate Bank | 1,155,847 | ||||||
| 100,000 | Veritex Holdings, Inc.(a) | 1,396,000 | ||||||
| 7,296,902 | ||||||||
| Commercial Finance & Mortgage Companies: 0.49% | ||||||||
| 32,000 | Ladder Capital Corp., Class A(a) | 607,680 | ||||||
| Consumer Lending: 0.80% |
| ||||||
| 27,087 | Tree.com, Inc.(a) | 1,001,948 | ||||||
| Diversified Financial Services: 2.55% |
| ||||||
| 8,960 | Evercore Partners, Inc., Class A | 463,859 | ||||||
| 90,445 | FCB Financial Holdings, Inc., | 2,075,713 | ||||||
| 14,430 | Greenhill & Co., Inc. | 649,350 | ||||||
| 3,188,922 | ||||||||
| Financial Data & Services: 0.57% |
| ||||||
|
| 15,022
|
| Cass Information Systems, Inc.
|
| 714,146
|
| ||
| Insurance: Property-Casualty: 3.56% | |||||||
| 41,320 | AmTrust Financial Services, Inc. | 1,854,028 | ||||||
| 40,000 | Federated National Holding Co. | 1,338,400 | ||||||
| 28,670 | Hilltop Holdings, Inc.(a) | 631,600 | ||||||
| 31,441 | United Insurance Holdings Corp. | 616,244 | ||||||
|
| 4,440,272
|
| ||||||
| Real Estate Investment Trusts (REITs): 1.12% |
| ||||||
| 53,830 | Diamond Resorts International, Inc.(a) | 1,397,427 | ||||||
| Real Estate Management & Development: 0.45% |
| ||||||
| 18,140 | Marcus & Millichap, Inc.(a) | 563,428 | ||||||
| Total Common Stocks | ||||||||
| (Cost $92,390,181) | 123,417,869 | |||||||
| SHORT TERM INVESTMENTS: 1.21% |
| ||||||
| Dreyfus Government Cash Management | ||||||||
Fund - Institutional Class | ||||||||
| 1,515,192 | 0.021% (7-Day Yield) | 1,515,192 | ||||||
| Total Short Term Investments | ||||||||
| (Cost $1,515,192) | 1,515,192 | |||||||
| Total Investments: 100.05% | ||||||||
| (Cost $93,905,373) | 124,933,061 | |||||||
Liabilities In Excess Of Other Assets: (0.05)% | (64,314) | |||||||
| Net Assets: 100.00% | $ | 124,868,747 | ||||||
| (a) | Non-income producing security. |
Holdings are subject to change.
For Fund compliance purposes, the Fund’s industry classifications refer to any one or more of the industry sub-classifications used by one or more widely recognized market indexes or ratings group indexes, and/or as defined by Fund management. This definition may not apply for purposes of this report, which may combine industry sub-classifications for reporting ease. Industries are shown as a percentage of net assets.
See Notes to Financial Statements.
20 |
www.emeraldmutualfunds.com |
Table of Contents
| Emerald Funds | Statements of Assets and Liabilities | |
October 31, 2014 (Unaudited) |
| Emerald Growth | Emerald Insights | Emerald Banking | ||||||||||
| Fund | Fund | and Finance Fund | ||||||||||
ASSETS: | ||||||||||||
Investments, at value | $ | 267,901,120 | $ | 5,341,957 | $ | 124,933,061 | ||||||
Cash | 31 | – | – | |||||||||
Receivable for investments sold | 2,328,663 | 5,227 | – | |||||||||
Receivable for shares sold | 659,448 | 134,054 | 156,192 | |||||||||
Receivable due from advisor | – | 9,550 | – | |||||||||
Interest and dividends receivable | 35,699 | 1,071 | 41,056 | |||||||||
Other assets | 39,866 | 2,316 | 22,201 | |||||||||
|
|
|
|
|
| |||||||
Total Assets | 270,964,827 | 5,494,175 | 125,152,510 | |||||||||
|
|
|
|
|
| |||||||
LIABILITIES: | ||||||||||||
Payable for investments purchased | 1,720,561 | 305,986 | 19,039 | |||||||||
Payable for shares redeemed | 186,563 | – | 45,642 | |||||||||
Investment advisory fees payable | 155,975 | – | 99,414 | |||||||||
Payable to fund accounting and administration | 17,002 | 1,517 | 8,514 | |||||||||
Payable for distribution and service fees | 76,836 | 1,247 | 83,598 | |||||||||
Payable for trustee fees and expenses | 2,118 | 14 | 884 | |||||||||
Payable for transfer agency fees | 8,354 | 2,521 | 9,451 | |||||||||
Payable for chief compliance officer fee | 1,548 | 38 | 472 | |||||||||
Payable for principal financial officer fee | 643 | 8 | 236 | |||||||||
Payable for professional fees | 10,895 | 5,947 | 10,447 | |||||||||
Accrued expenses and other liabilities | 14,399 | 4,289 | 6,066 | |||||||||
|
|
|
|
|
| |||||||
Total Liabilities | 2,194,894 | 321,567 | 283,763 | |||||||||
|
|
|
|
|
| |||||||
NET ASSETS | $ | 268,769,933 | $ | 5,172,608 | $ | 124,868,747 | ||||||
|
|
|
|
|
| |||||||
NET ASSETS CONSIST OF: | ||||||||||||
Paid-in capital (Note 5) | $ | 193,670,905 | $ | 5,123,849 | $ | 99,373,694 | ||||||
Accumulated net investment loss | (1,048,652) | (5,390) | (653,269) | |||||||||
Accumulated net realized gain/(loss) on investments | 19,509,574 | (110,467) | (4,879,366) | |||||||||
Net unrealized appreciation on investments | 56,638,106 | 164,616 | 31,027,688 | |||||||||
|
|
|
|
|
| |||||||
NET ASSETS | $ | 268,769,933 | $ | 5,172,608 | $ | 124,868,747 | ||||||
|
|
|
|
|
| |||||||
INVESTMENTS, AT COST | $ | 211,263,014 | $ | 5,177,341 | $ | 93,905,373 | ||||||
PRICING OF SHARES | ||||||||||||
Class A: (a) | ||||||||||||
Net Asset Value, offering and redemption price per share | $ | 19.23 | $ | 10.21 | $ | 27.40 | ||||||
Net Assets | $ | 102,452,670 | $ | 4,956,255 | $ | 47,639,116 | ||||||
Shares of beneficial interest outstanding | 5,327,372 | 485,534 | 1,738,579 | |||||||||
Maximum offering price per share (NAV/.9525, based on maximum sales charge of 4.75% of the offering price) | $ | 20.19 | $ | 10.72 | $ | 28.77 | ||||||
Class C: (a) | ||||||||||||
Net Asset Value, offering and redemption price per share | $ | 17.01 | $ | 10.18 | $ | 24.95 | ||||||
Net Assets | $ | 10,979,246 | $ | 25,018 | $ | 29,792,246 | ||||||
Shares of beneficial interest outstanding | 645,522 | 2,457 | 1,193,861 | |||||||||
Institutional Class: | ||||||||||||
Net Asset Value, offering and redemption price per share | $ | 19.67 | $ | 10.21 | $ | 27.63 | ||||||
Net Assets | $ | 139,281,786 | $ | 58,954 | $ | 24,055,973 | ||||||
Shares of beneficial interest outstanding | 7,080,509 | 5,776 | 870,517 | |||||||||
Investor Class: | ||||||||||||
Net Asset Value, offering and redemption price per share | $ | 19.18 | $ | 10.19 | $ | 26.24 | ||||||
Net Assets | $ | 16,056,231 | $ | 132,381 | $ | 23,381,412 | ||||||
Shares of beneficial interest outstanding | 837,026 | 12,985 | 890,986 | |||||||||
| (a) | Redemption price per share may be reduced for any applicable contingent deferred sales charge. For a description of a possible sales charge, please see the Funds’ Prospectus. |
See Notes to Financial Statements.
Semi-Annual Report | October 31, 2014 |
21 |
Table of Contents
| Emerald Funds | Statements of Operations | |
For the Six Months or Period Ended October 31, 2014 (Unaudited) |
| Emerald Growth | Emerald Insights | Emerald Banking | ||||||||||
| Fund | Fund(a) | and Finance Fund | ||||||||||
INVESTMENT INCOME: | ||||||||||||
Dividends | $ | 425,717 | $ | 2,305 | $ | 624,866 | ||||||
Foreign taxes withheld | – | (28) | – | |||||||||
|
|
|
|
|
| |||||||
Total Investment Income | 425,717 | 2,277 | 624,866 | |||||||||
|
|
|
|
|
| |||||||
EXPENSES: | ||||||||||||
Investment advisory fee (Note 6) | 948,665 | 4,262 | 592,527 | |||||||||
Recoupment of previously waived fees | 141 | – | – | |||||||||
Administration fee | 89,348 | 1,865 | 43,783 | |||||||||
Custodian fee | 13,128 | 3,726 | 6,522 | |||||||||
Professional fees | 11,988 | 5,947 | 10,435 | |||||||||
Transfer agent fee | 52,778 | 6,552 | 46,631 | |||||||||
Trustee fees and expenses | 3,855 | 17 | 1,813 | |||||||||
Registration/filing fees | 33,162 | 496 | 24,590 | |||||||||
Reports to shareholder and printing fees | 14,042 | 60 | 8,969 | |||||||||
Distribution and service fees | ||||||||||||
Class A | 159,435 | 1,875 | 82,697 | |||||||||
Class C | 54,738 | 47 | 145,176 | |||||||||
Institutional Class | 33,659 | 7 | 5,790 | |||||||||
Investor Class | 34,060 | 55 | 42,039 | |||||||||
Chief compliance officer fee | 13,863 | 66 | 6,459 | |||||||||
Principal financial officer fee | 3,438 | 13 | 1,602 | |||||||||
Other | 9,525 | 3,049 | 6,490 | |||||||||
|
|
|
|
|
| |||||||
Total expenses before waiver | 1,475,825 | 28,037 | 1,025,523 | |||||||||
Less fees waived/reimbursed by investment adviser (Note 6) | (1,456) | (20,370) | – | |||||||||
|
|
|
|
|
| |||||||
Total Net Expenses | 1,474,369 | 7,667 | 1,025,523 | |||||||||
|
|
|
|
|
| |||||||
NET INVESTMENT LOSS: | (1,048,652) | (5,390) | (400,657) | |||||||||
|
|
|
|
|
| |||||||
Net realized gain/(loss) on investments | 4,522,102 | (110,467) | 655,221 | |||||||||
Net change in unrealized appreciation on investments | 11,563,281 | 164,616 | 5,455,537 | |||||||||
|
|
|
|
|
| |||||||
NET REALIZED AND UNREALIZED GAIN ON INVESTMENTS | 16,085,383 | 54,149 | 6,110,758 | |||||||||
|
|
|
|
|
| |||||||
NET INCREASE IN NET ASSETS RESULTING FROM OPERATIONS | $ | 15,036,731 | $ | 48,759 | $ | 5,710,101 | ||||||
|
|
|
|
|
| |||||||
| (a) | For the period August 1, 2014 (Inception) to October 31, 2014. |
See Notes to Financial Statements.
22 |
www.emeraldmutualfunds.com |
Table of Contents
| Emerald Growth Fund | Statements of Changes in Net Assets | |
| For the Six Months Ended October 31, 2014 (Unaudited) | Year Ended April 30, 2014 | |||||||||||
OPERATIONS: | ||||||||||||
Net investment loss | $ | (1,048,652) | $ | (1,903,752) | ||||||||
Net realized gain on investments | 4,522,102 | 28,529,898 | ||||||||||
Net change in unrealized appreciation on investments | 11,563,281 | 6,894,266 | ||||||||||
|
|
|
| |||||||||
Net increase in net assets resulting from operations | 15,036,731 | 33,520,412 | ||||||||||
|
|
|
| |||||||||
DISTRIBUTIONS TO SHAREHOLDERS (NOTE 3): | ||||||||||||
From net realized gains on investments | ||||||||||||
Class A | – | (5,103,134) | ||||||||||
Class C | – | (786,150) | ||||||||||
Institutional Class | – | (9,804,217) | ||||||||||
Investor Class | – | (833,989) | ||||||||||
|
|
|
| |||||||||
Net decrease in net assets from distributions | – | (16,527,490) | ||||||||||
|
|
|
| |||||||||
SHARE TRANSACTIONS (NOTE 5): | ||||||||||||
Class A | ||||||||||||
Proceeds from sale of shares | 30,478,883 | 32,230,458 | ||||||||||
Issued to shareholders in reinvestment of distributions | – | 4,588,579 | ||||||||||
Cost of shares redeemed | (11,257,297) | (10,981,411) | ||||||||||
|
|
|
| |||||||||
Net increase from share transactions | 19,221,586 | 25,837,626 | ||||||||||
|
|
|
| |||||||||
Class C | ||||||||||||
Proceeds from sale of shares | 907,858 | 6,810,627 | ||||||||||
Issued to shareholders in reinvestment of distributions | – | 672,071 | ||||||||||
Cost of shares redeemed | (2,208,203) | (998,140) | ||||||||||
|
|
|
| |||||||||
Net increase/(decrease) from share transactions | (1,300,345) | 6,484,558 | ||||||||||
|
|
|
| |||||||||
Institutional Class | ||||||||||||
Proceeds from sale of shares | 15,994,679 | 44,708,051 | ||||||||||
Issued to shareholders in reinvestment of distributions | – | 9,632,675 | ||||||||||
Cost of shares redeemed | (19,316,589) | (17,935,648) | ||||||||||
|
|
|
| |||||||||
Net increase/(decrease) from share transactions | (3,321,910) | 36,405,078 | ||||||||||
|
|
|
| |||||||||
Investor Class | ||||||||||||
Proceeds from sale of shares | 8,451,753 | 16,794,225 | ||||||||||
Issued to shareholders in reinvestment of distributions | – | 824,690 | ||||||||||
Cost of shares redeemed | (9,172,642) | (3,115,720) | ||||||||||
|
|
|
| |||||||||
Net increase/(decrease) from share transactions | (720,889) | 14,503,195 | ||||||||||
|
|
|
| |||||||||
Net increase in net assets | $ | 28,915,173 | $ | 100,223,379 | ||||||||
|
|
|
| |||||||||
NET ASSETS: | ||||||||||||
Beginning of period | 239,854,760 | 139,631,381 | ||||||||||
|
|
|
| |||||||||
End of period (including accumulated net investment loss of $(1,048,652) and $0, respectively) | $ | 268,769,933 | $ | 239,854,760 | ||||||||
|
|
|
| |||||||||
Semi-Annual Report | October 31, 2014 |
23 |
Table of Contents
| Emerald Growth Fund | Statements of Changes in Net Assets | |
| For the Six Months Ended October 31, 2014 (Unaudited) | Year Ended April 30, 2014 | |||||||||||
Other Information: | ||||||||||||
SHARE TRANSACTIONS: | ||||||||||||
Class A | ||||||||||||
Sold | 1,642,783 | 1,651,050 | ||||||||||
Distributions reinvested | – | 244,086 | ||||||||||
Redeemed | (617,262) | (580,859) | ||||||||||
|
|
|
| |||||||||
Net increase in shares outstanding | 1,025,521 | 1,314,277 | ||||||||||
|
|
|
| |||||||||
Class C | ||||||||||||
Sold | 56,086 | 391,694 | ||||||||||
Distributions reinvested | – | 40,196 | ||||||||||
Redeemed | (135,366) | (58,625) | ||||||||||
|
|
|
| |||||||||
Net increase/(decrease) in shares outstanding | (79,280) | 373,265 | ||||||||||
|
|
|
| |||||||||
Institutional Class | ||||||||||||
Sold | 851,374 | 2,251,862 | ||||||||||
Distributions reinvested | – | 502,225 | ||||||||||
Redeemed | (1,040,353) | (922,587) | ||||||||||
|
|
|
| |||||||||
Net increase/(decrease) in shares outstanding | (188,979) | 1,831,500 | ||||||||||
|
|
|
| |||||||||
Investor Class | ||||||||||||
Sold | 460,528 | 878,538 | ||||||||||
Distributions reinvested | – | 43,960 | ||||||||||
Redeemed | (502,037) | (162,295) | ||||||||||
|
|
|
| |||||||||
Net increase/(decrease) in shares outstanding | (41,509) | 760,203 | ||||||||||
|
|
|
| |||||||||
See Notes to Financial Statements.
24 |
www.emeraldmutualfunds.com |
Table of Contents
| Emerald Insights Fund | Statements of Changes in Net Assets | |
| For the Period August 1, 2014 (Inception) to October 31, 2014 (Unaudited) | ||||||
OPERATIONS: | ||||||
Net investment loss | $ | (5,390) | ||||
Net realized loss on investments | (110,467) | |||||
Net change in unrealized appreciation on investments | 164,616 | |||||
|
| |||||
Net increase in net assets resulting from operations | 48,759 | |||||
|
| |||||
SHARE TRANSACTIONS (NOTE 5): | ||||||
Class A | ||||||
Proceeds from sale of shares | 4,910,634 | |||||
|
| |||||
Net increase from share transactions | 4,910,634 | |||||
|
| |||||
Class C | ||||||
Proceeds from sale of shares | 24,452 | |||||
|
| |||||
Net increase from share transactions | 24,452 | |||||
|
| |||||
Institutional Class | ||||||
Proceeds from sale of shares | 57,763 | |||||
|
| |||||
Net increase from share transactions | 57,763 | |||||
|
| |||||
Investor Class | ||||||
Proceeds from sale of shares | 131,000 | |||||
|
| |||||
Net increase from share transactions | 131,000 | |||||
|
| |||||
Net increase in net assets | $ | 5,172,608 | ||||
|
| |||||
NET ASSETS: | ||||||
Beginning of period | – | |||||
|
| |||||
End of period (including accumulated net investment loss of $(5,390), respectively) | $ | 5,172,608 | ||||
|
| |||||
Other Information: | ||||||
SHARE TRANSACTIONS: | ||||||
Class A | ||||||
Sold | 485,534 | |||||
|
| |||||
Net increase in shares outstanding | 485,534 | |||||
|
| |||||
Class C | ||||||
Sold | 2,457 | |||||
|
| |||||
Net increase in shares outstanding | 2,457 | |||||
|
| |||||
Institutional Class | ||||||
Sold | 5,776 | |||||
|
| |||||
Net increase in shares outstanding | 5,776 | |||||
|
| |||||
Investor Class | ||||||
Sold | 12,985 | |||||
|
| |||||
Net increase in shares outstanding | 12,985 | |||||
|
| |||||
See Notes to Financial Statements.
Semi-Annual Report | October 31, 2014 |
25 |
Table of Contents
| Emerald Banking and Finance Fund | Statements of Changes in Net Assets | |
| For the Six Months Ended October 31, 2014 (Unaudited) | Year Ended April 30, 2014 | |||||||||||
OPERATIONS: | ||||||||||||
Net investment loss | $ | (400,657) | $ | (556,712) | ||||||||
Net realized gain on investments | 655,221 | 5,639,073 | ||||||||||
Net change in unrealized appreciation on investments | 5,455,537 | 12,763,257 | ||||||||||
|
|
|
| |||||||||
Net increase in net assets resulting from operations | 5,710,101 | 17,845,618 | ||||||||||
|
|
|
| |||||||||
SHARE TRANSACTIONS (NOTE 5): | ||||||||||||
Class A | ||||||||||||
Proceeds from sale of shares | 4,106,341 | 25,659,372 | ||||||||||
Cost of shares redeemed | (7,336,918) | (11,200,208) | ||||||||||
|
|
|
| |||||||||
Net increase/(decrease) from share transactions | (3,230,577) | 14,459,164 | ||||||||||
|
|
|
| |||||||||
Class C | ||||||||||||
Proceeds from sale of shares | 1,979,777 | 7,599,293 | ||||||||||
Cost of shares redeemed | (1,713,223) | (2,355,553) | ||||||||||
|
|
|
| |||||||||
Net increase from share transactions | 266,554 | 5,243,740 | ||||||||||
|
|
|
| |||||||||
Institutional Class | ||||||||||||
Proceeds from sale of shares | 1,691,883 | 16,536,237 | ||||||||||
Cost of shares redeemed | (837,751) | (608,192) | ||||||||||
|
|
|
| |||||||||
Net increase from share transactions | 854,132 | 15,928,045 | ||||||||||
|
|
|
| |||||||||
Investor Class | ||||||||||||
Proceeds from sale of shares | 7,470,534 | 12,230,717 | ||||||||||
Cost of shares redeemed | (4,342,773) | (1,343,232) | ||||||||||
|
|
|
| |||||||||
Net increase from share transactions | 3,127,761 | 10,887,485 | ||||||||||
|
|
|
| |||||||||
Net increase in net assets | $ | 6,727,971 | $ | 64,364,052 | ||||||||
|
|
|
| |||||||||
NET ASSETS: | ||||||||||||
Beginning of period | 118,140,776 | 53,776,724 | ||||||||||
|
|
|
| |||||||||
End of period (including accumulated net investment loss of $(653,269) and $(252,612), respectively) | $ | 124,868,747 | $ | 118,140,776 | ||||||||
|
|
|
| |||||||||
26 |
www.emeraldmutualfunds.com |
Table of Contents
| Emerald Banking and Finance Fund | Statements of Changes in Net Assets | |
| For the Six Months Ended October 31, 2014 (Unaudited) | Year Ended April 30, 2014 | |||||||||||
Other Information: | ||||||||||||
SHARE TRANSACTIONS: | ||||||||||||
Class A | ||||||||||||
Sold | 155,062 | 1,038,680 | ||||||||||
Redeemed | (278,759) | (446,319) | ||||||||||
|
|
|
| |||||||||
Net increase/(decrease) in shares outstanding | (123,697) | 592,361 | ||||||||||
|
|
|
| |||||||||
Class C | ||||||||||||
Sold | 81,933 | 329,912 | ||||||||||
Redeemed | (71,117) | (105,783) | ||||||||||
|
|
|
| |||||||||
Net increase in shares outstanding | 10,816 | 224,129 | ||||||||||
|
|
|
| |||||||||
Institutional Class | ||||||||||||
Sold | 62,992 | 649,087 | ||||||||||
Redeemed | (31,629) | (24,418) | ||||||||||
|
|
|
| |||||||||
Net increase in shares outstanding | 31,363 | 624,669 | ||||||||||
|
|
|
| |||||||||
Investor Class | ||||||||||||
Sold | 294,683 | 500,859 | ||||||||||
Redeemed | (172,761) | (57,090) | ||||||||||
|
|
|
| |||||||||
Net increase in shares outstanding | 121,922 | 443,769 | ||||||||||
|
|
|
| |||||||||
See Notes to Financial Statements.
Semi-Annual Report | October 31, 2014 |
27 |
Table of Contents
| Emerald Growth Fund | Financial Highlights | |
For a share outstanding throughout the periods presented |
| CLASS A | ||||||||||||||||||||||||||||
| For the | ||||||||||||||||||||||||||||
| Six Months | For the Period | |||||||||||||||||||||||||||
| Ended | January 1, 2012 | |||||||||||||||||||||||||||
| October 31, | to | Year Ended | Year Ended | Year Ended | ||||||||||||||||||||||||
| 2014 | Year Ended | Year Ended | April 30, 2012 | December 31, | December 31, | December 31, | ||||||||||||||||||||||
| (Unaudited) | April 30, 2014 | April 30, 2013 | (a)(b) | 2011 | 2010 | 2009 | ||||||||||||||||||||||
NET ASSET VALUE, BEGINNING OF PERIOD | $ | 18.11 | $ | 15.60 | $ | 16.20 | $ | 13.37 | $ | 13.57 | $ | 10.63 | $ | 7.99 | ||||||||||||||
INCOME/(LOSS) FROM OPERATIONS: | ||||||||||||||||||||||||||||
Net investment loss | (0.09)(c) | (0.21)(c) | (0.15)(c) | (0.05)(c) | (0.14)(c) | (0.12) | (0.11) | |||||||||||||||||||||
Net realized and unrealized gain/(loss) on investments | 1.21 | 4.33 | 1.40 | 2.88 | (0.06) | 3.06 | 2.75 | |||||||||||||||||||||
|
|
|
|
|
|
|
|
|
|
|
|
|
| |||||||||||||||
Total from Investment Operations | 1.12 | 4.12 | 1.25 | 2.83 | (0.20) | 2.94 | 2.64 | |||||||||||||||||||||
|
|
|
|
|
|
|
|
|
|
|
|
|
| |||||||||||||||
LESS DISTRIBUTIONS: | ||||||||||||||||||||||||||||
From capital gains | – | (1.61) | (1.85) | – | – | – | – | |||||||||||||||||||||
|
|
|
|
|
|
|
|
|
|
|
|
|
| |||||||||||||||
Total Distributions | – | (1.61) | (1.85) | – | – | – | – | |||||||||||||||||||||
|
|
|
|
|
|
|
|
|
|
|
|
|
| |||||||||||||||
NET INCREASE/(DECREASE) IN NET | ||||||||||||||||||||||||||||
ASSET VALUE | 1.12 | 2.51 | (0.60) | 2.83 | (0.20) | 2.94 | 2.64 | |||||||||||||||||||||
|
|
|
|
|
|
|
|
|
|
|
|
|
| |||||||||||||||
NET ASSET VALUE, END OF PERIOD | $ | 19.23 | $ | 18.11 | $ | 15.60 | $ | 16.20 | $ | 13.37 | $ | 13.57 | $ | 10.63 | ||||||||||||||
|
|
|
|
|
|
|
|
|
|
|
|
|
| |||||||||||||||
TOTAL RETURN(d) | 6.18% | (e) | 26.01% | 9.14 | % | 21.17% | (e) | (1.47) | % | 27.66% | 33.04 | % | ||||||||||||||||
RATIOS/SUPPLEMENTAL DATA: | ||||||||||||||||||||||||||||
Net Assets, End of Period (000s) | $ | 102,453 | $ | 77,900 | $ | 46,605 | $ | 41,991 | $ | 37,008 | $ | 46,785 | $ | 51,177 | ||||||||||||||
RATIOS TO AVERAGE NET ASSETS: | ||||||||||||||||||||||||||||
Net Investment loss | (0.95)% | (f) | (1.12)% | (1.01) | % | (1.02)% | (f) | (1.03) | % | (0.85)% | (1.03) | % | ||||||||||||||||
Operating expenses excluding reimbursement/waiver | 1.29% | (f) | 1.31% | 1.38 | % | 1.36% | (f) | 1.36 | % | 1.41% | 1.38 | % | ||||||||||||||||
Operating expenses including reimbursement/waiver | 1.29% | (f) | 1.29% | 1.29 | % | 1.29% | (f) | 1.29 | % | 1.29% | 1.29% | (g) | ||||||||||||||||
PORTFOLIO TURNOVER RATE | 37 % | (e) | 70% | 78 | % | 28% | (e) | 75 | % | 78% | 113 | % | ||||||||||||||||
| (a) | Prior to its March 16, 2012 reorganization with and into the Emerald Growth Fund, the Fund was known as the Forward Growth Fund. |
| (b) | Effective March 13, 2012 the Board approved changing the fiscal year-end of the Fund from December 31 to April 30. |
| (c) | Per share amounts are based upon average shares outstanding. |
| (d) | Total return does not reflect the effect of sales charges. |
| (e) | Not Annualized. |
| (f) | Annualized. |
| (g) | Effective January 1, 2009, the Advisor agreed to limit expenses at 1.29%. |
See Notes to Financial Statements.
28 |
www.emeraldmutualfunds.com |
Table of Contents
| Emerald Growth Fund | Financial Highlights | |
For a share outstanding throughout the periods presented |
| CLASS C | ||||||||||||||||||||||||||||
For the Six Months | Year Ended April 30, 2014 | Year Ended April 30, 2013 | For the Period January 1, 2012 to April 30, 2012 | Year Ended December 31, 2011 | Year Ended December 31, 2010 | Year Ended December 31, 2009 | ||||||||||||||||||||||
NET ASSET VALUE, BEGINNING OF PERIOD | $ | 16.07 | $ | 14.07 | $ | 14.89 | $ | 12.31 | $ | 12.58 | $ | 9.92 | $ | 7.49 | ||||||||||||||
INCOME/(LOSS) FROM OPERATIONS: | ||||||||||||||||||||||||||||
Net investment loss | (0.13)(c) | (0.30)(c) | (0.23)(c) | (0.08)(c) | (0.22)(c) | (0.03) | (0.36) | |||||||||||||||||||||
Net realized and unrealized gain/(loss) on investments | 1.07 | 3.91 | 1.26 | 2.66 | (0.05) | 2.69 | 2.79 | |||||||||||||||||||||
|
|
|
|
|
|
|
|
|
|
|
|
|
| |||||||||||||||
Total from Investment Operations | 0.94 | 3.61 | 1.03 | 2.58 | (0.27) | 2.66 | 2.43 | |||||||||||||||||||||
|
|
|
|
|
|
|
|
|
|
|
|
|
| |||||||||||||||
LESS DISTRIBUTIONS: | ||||||||||||||||||||||||||||
From capital gains | – | (1.61) | (1.85) | – | – | – | – | |||||||||||||||||||||
|
|
|
|
|
|
|
|
|
|
|
|
|
| |||||||||||||||
Total Distributions | – | (1.61) | (1.85) | – | – | – | – | |||||||||||||||||||||
|
|
|
|
|
|
|
|
|
|
|
|
|
| |||||||||||||||
NET INCREASE/(DECREASE) IN NET ASSET VALUE | 0.94 | 2.00 | (0.82) | 2.58 | (0.27) | 2.66 | 2.43 | |||||||||||||||||||||
|
|
|
|
|
|
|
|
|
|
|
|
|
| |||||||||||||||
NET ASSET VALUE, END OF PERIOD | $ | 17.01 | $ | 16.07 | $ | 14.07 | $ | 14.89 | $ | 12.31 | $ | 12.58 | $ | 9.92 | ||||||||||||||
|
|
|
|
|
|
|
|
|
|
|
|
|
| |||||||||||||||
TOTAL RETURN(d) | 5.85% | (e) | 25.19% | 8.43% | 20.96% | (e) | (2.15)% | 26.81% | 32.44% | |||||||||||||||||||
RATIOS/SUPPLEMENTAL DATA: | ||||||||||||||||||||||||||||
Net Assets, End of Period (000s) | $ | 10,979 | $ | 11,645 | $ | 4,946 | $ | 3,026 | $ | 2,743 | $ | 2,812 | $ | 2,555 | ||||||||||||||
RATIOS TO AVERAGE NET ASSETS: | ||||||||||||||||||||||||||||
Net Investment loss | (1.61)% | (f) | (1.77)% | (1.65)% | (1.67)% | (f) | (1.68)% | (1.48)% | (1.68)% | |||||||||||||||||||
Operating expenses excluding reimbursement/waiver | 1.94% | (f) | 1.96% | 2.03% | 2.01% | (f) | 2.01% | 2.06% | 2.04% | |||||||||||||||||||
Operating expenses including reimbursement/waiver | 1.94% | (f) | 1.94% | 1.94% | 1.94% | (f) | 1.94% | 1.94% | 1.94% | (g) | ||||||||||||||||||
PORTFOLIO TURNOVER RATE | 37% | (e) | 70% | 78% | 28% | (e) | 75% | 78% | 113% | |||||||||||||||||||
| (a) | Prior to its March 16, 2012 reorganization with and into the Emerald Growth Fund, the Fund was known as the Forward Growth Fund. |
| (b) | Effective March 13, 2012 the Board approved changing the fiscal year-end of the Fund from December 31 to April 30. |
| (c) | Per share amounts are based upon average shares outstanding. |
| (d) | Total return does not reflect the effect of sales charges. |
| (e) | Not Annualized. |
| (f) | Annualized. |
| (g) | Effective January 1, 2009, the Advisor agreed to limit expenses at 1.94%. |
See Notes to Financial Statements.
Semi-Annual Report | October 31, 2014 |
29 |
Table of Contents
| Emerald Growth Fund | Financial Highlights | |
For a share outstanding throughout the periods presented |
| INSTITUTIONAL CLASS | ||||||||||||||||||||||||||||
For the Six Months | Year Ended April 30, 2014 | Year Ended April 30, 2013 | For the Period January 1, 2012 to April 30, 2012 (a)(b) | Year Ended December 31, 2011 | Year Ended December 31, 2010 | Year Ended December 31, 2009 | ||||||||||||||||||||||
NET ASSET VALUE, BEGINNING OF PERIOD | $ | 18.49 | $ | 15.86 | $ | 16.39 | $ | 13.51 | $ | 13.67 | $ | 10.68 | $ | 8.00 | ||||||||||||||
INCOME/(LOSS) FROM OPERATIONS: | ||||||||||||||||||||||||||||
Net investment loss | (0.06)(c) | (0.16)(c) | (0.11)(c) | (0.04)(c) | (0.10)(c) | (0.06) | (0.17) | |||||||||||||||||||||
Net realized and unrealized gain/(loss) on investments | 1.24 | 4.40 | 1.43 | 2.92 | (0.06) | 3.05 | 2.85 | |||||||||||||||||||||
|
|
|
|
|
|
|
|
|
|
|
|
|
| |||||||||||||||
Total from Investment Operations | 1.18 | 4.24 | 1.32 | 2.88 | (0.16) | 2.99 | 2.68 | |||||||||||||||||||||
|
|
|
|
|
|
|
|
|
|
|
|
|
| |||||||||||||||
LESS DISTRIBUTIONS: | ||||||||||||||||||||||||||||
From capital gains | – | (1.61) | (1.85) | – | – | – | – | |||||||||||||||||||||
|
|
|
|
|
|
|
|
|
|
|
|
|
| |||||||||||||||
Total Distributions | – | (1.61) | (1.85) | – | – | – | – | |||||||||||||||||||||
|
|
|
|
|
|
|
|
|
|
|
|
|
| |||||||||||||||
NET INCREASE/(DECREASE) IN NET ASSET VALUE | 1.18 | 2.63 | (0.53) | 2.88 | (0.16) | 2.99 | 2.68 | |||||||||||||||||||||
|
|
|
|
|
|
|
|
|
|
|
|
|
| |||||||||||||||
NET ASSET VALUE, END OF PERIOD | $ | 19.67 | $ | 18.49 | $ | 15.86 | $ | 16.39 | $ | 13.51 | $ | 13.67 | $ | 10.68 | ||||||||||||||
|
|
|
|
|
|
|
|
|
|
|
|
|
| |||||||||||||||
TOTAL RETURN | 6.38% | (d) | 26.35% | 9.47% | 21.32% | (d) | (1.17)% | 28.00% | 33.50% | |||||||||||||||||||
RATIOS/SUPPLEMENTAL DATA: | ||||||||||||||||||||||||||||
Net Assets, End of Period (000s) | $ | 139,282 | $ | 134,440 | $ | 86,238 | $ | 83,149 | $ | 64,930 | $ | 64,880 | $ | 47,091 | ||||||||||||||
RATIOS TO AVERAGE NET ASSETS: | ||||||||||||||||||||||||||||
Net Investment loss | (0.66)% | (e) | (0.82)% | (0.71)% | (0.72)% | (e) | (0.72)% | (0.52)% | (0.73)% | |||||||||||||||||||
Operating expenses excluding reimbursement/waiver | 0.99% | (e) | 1.00% | 1.08% | 1.06% | (e) | 1.06% | 1.11% | 1.08% | |||||||||||||||||||
Operating expenses including reimbursement/waiver | 0.99% | (e) | 0.99% | 0.99% | 0.99% | (e) | 0.99% | 0.99% | 0.99% | (f) | ||||||||||||||||||
PORTFOLIO TURNOVER RATE | 37% | (d) | 70% | 78% | 28% | (d) | 75% | 78% | 113% | |||||||||||||||||||
| (a) | Prior to its March 16, 2012 reorganization with and into the Emerald Growth Fund, the Fund was known as the Forward Growth Fund. |
| (b) | Effective March 13, 2012 the Board approved changing the fiscal year-end of the Fund from December 31 to April 30. |
| (c) | Per share amounts are based upon average shares outstanding. |
| (d) | Not Annualized. |
| (e) | Annualized. |
| (f) | Effective January 1, 2009, the Advisor agreed to limit expenses at 0.99%. |
See Notes to Financial Statements.
30 |
www.emeraldmutualfunds.com |
Table of Contents
| Emerald Growth Fund | Financial Highlights | |
For a share outstanding throughout the periods presented |
| INVESTOR CLASS | ||||||||||||||||||||
For the Six Months | Year Ended April 30, 2014 | Year Ended April 30, 2013 | For the Period January 1, 2012 to April 30, 2012 | Period Ended December 31, 2011 (c) | ||||||||||||||||
NET ASSET VALUE, BEGINNING OF PERIOD | $ | 18.06 | $ | 15.57 | $ | 16.18 | $ | 13.35 | $ | 15.74 | ||||||||||
INCOME/(LOSS) FROM OPERATIONS: | ||||||||||||||||||||
Net investment loss(d) | (0.09) | (0.23) | (0.16) | (0.05) | (0.09) | |||||||||||||||
Net realized and unrealized gain/(loss) on investments | 1.21 | 4.33 | 1.40 | 2.88 | (2.30) | |||||||||||||||
|
|
|
|
|
|
|
|
|
| |||||||||||
Total from Investment Operations | 1.12 | 4.10 | 1.24 | 2.83 | (2.39) | |||||||||||||||
|
|
|
|
|
|
|
|
|
| |||||||||||
LESS DISTRIBUTIONS: | ||||||||||||||||||||
From capital gains | – | (1.61) | (1.85) | – | – | |||||||||||||||
|
|
|
|
|
|
|
|
|
| |||||||||||
Total Distributions | – | (1.61) | (1.85) | – | – | |||||||||||||||
|
|
|
|
|
|
|
|
|
| |||||||||||
NET INCREASE/(DECREASE) IN NET ASSET VALUE | 1.12 | 2.49 | (0.61) | 2.83 | (2.39) | |||||||||||||||
|
|
|
|
|
|
|
|
|
| |||||||||||
NET ASSET VALUE, END OF PERIOD | $ | 19.18 | $ | 18.06 | $ | 15.57 | $ | 16.18 | $ | 13.35 | ||||||||||
|
|
|
|
|
|
|
|
|
| |||||||||||
TOTAL RETURN | 6.20% | (e) | 25.93% | 9.08% | 21.20% | (e) | (15.18)% | (e) | ||||||||||||
RATIOS/SUPPLEMENTAL DATA: | ||||||||||||||||||||
Net Assets, End of Period (000s) | $ | 16,056 | $ | 15,870 | $ | 1,842 | $ | 1,085 | $ | 879 | ||||||||||
RATIOS TO AVERAGE NET ASSETS: | ||||||||||||||||||||
Net Investment loss | (1.01)% | (f) | (1.18)% | (1.05)% | (1.07)% | (f) | (1.00)% | (f) | ||||||||||||
Operating expenses excluding reimbursement/waiver | 1.34%( | f) | 1.34% | 1.43% | 1.41% | (f) | 1.43% | (f) | ||||||||||||
Operating expenses including reimbursement/waiver | 1.34% | (f) | 1.34% | 1.34% | 1.34% | (f) | 1.34% | (f) | ||||||||||||
PORTFOLIO TURNOVER RATE | 37% | (e) | 70% | 78% | 28% | (e) | 75% | (g) | ||||||||||||
| (a) | Prior to its March 16, 2012 reorganization with and into the Emerald Growth Fund, the Fund was known as the Forward Growth Fund. |
| (b) | Effective March 13, 2012 the Board approved changing the fiscal year-end of the Fund from December 31 to April 30. |
| (c) | The Fund began offering Investor Class shares on May 2, 2011. |
| (d) | Per share amounts are based upon average shares outstanding. |
| (e) | Not Annualized. |
| (f) | Annualized. |
| (g) | Portfolio turnover is calculated at the Fund level and represents the year ended December 31, 2011. |
See Notes to Financial Statements.
Semi-Annual Report | October 31, 2014 |
31 |
Table of Contents
| Emerald Insights Fund | Financial Highlights | |
For a share outstanding throughout the period presented |
| CLASS A | ||||
For the Period Ended August 1, 2014 (Inception) to October 31, 2014 (Unaudited) | ||||
NET ASSET VALUE, BEGINNING OF PERIOD | $ | 10.00 | ||
INCOME FROM OPERATIONS: | ||||
Net investment loss(a) | (0.05) | |||
Net realized and unrealized gain on investments | 0.26 | |||
|
| |||
Total from Investment Operations | 0.21 | |||
|
| |||
NET INCREASE IN NET ASSET VALUE | 0.21 | |||
|
| |||
NET ASSET VALUE, END OF PERIOD | $ | 10.21 | ||
|
| |||
TOTAL RETURN(b) | 2.10%(c) | |||
RATIOS/SUPPLEMENTAL DATA: | ||||
Net Assets, End of Period (000s) | $ | 4,956 | ||
RATIOS TO AVERAGE NET ASSETS: | ||||
Net Investment loss | (0.95%)(d) | |||
Operating expenses excluding reimbursement/waiver | 4.32%(d)(e) | |||
Operating expenses including reimbursement/waiver | 1.35%(d)(e) | |||
PORTFOLIO TURNOVER RATE | 53%(c) | |||
| (a) | Per share amounts are based upon average shares outstanding. |
| (b) | Total return does not reflect the effect of sales charges. |
| (c) | Not Annualized. |
| (d) | Annualized. |
| (e) | Expense ratios before reductions for startup costs may not be representative of longer term operating periods. |
See Notes to Financial Statements.
32 |
www.emeraldmutualfunds.com |
Table of Contents
| Emerald Insights Fund | Financial Highlights | |
For a share outstanding throughout the period presented |
| CLASS C | ||||
For the Period Ended August 1, 2014 (Inception) to October 31, 2014 (Unaudited) | ||||
NET ASSET VALUE, BEGINNING OF PERIOD | $ | 10.00 | ||
INCOME FROM OPERATIONS: | ||||
Net investment loss(a) | (0.04) | |||
Net realized and unrealized gain on investments | 0.22 | |||
|
| |||
Total from Investment Operations | 0.18 | |||
|
| |||
NET INCREASE IN NET ASSET VALUE | 0.18 | |||
|
| |||
NET ASSET VALUE, END OF PERIOD | $ | 10.18 | ||
|
| |||
TOTAL RETURN(b) | 1.80%(c) | |||
RATIOS/SUPPLEMENTAL DATA: | ||||
Net Assets, End of Period (000s) | $ | 25 | ||
RATIOS TO AVERAGE NET ASSETS: | ||||
Net Investment loss | (1.58%)(d) | |||
Operating expenses excluding reimbursement/waiver | 19.23%(d)(e) | |||
Operating expenses including reimbursement/waiver | 2.00%(d)(e) | |||
PORTFOLIO TURNOVER RATE | 53%(c) | |||
| (a) | Per share amounts are based upon average shares outstanding. |
| (b) | Total return does not reflect the effect of sales charges. |
| (c) | Not Annualized. |
| (d) | Annualized. |
| (e) | Expense ratios before reductions for startup costs may not be representative of longer term operating periods. |
See Notes to Financial Statements.
Semi-Annual Report | October 31, 2014 |
33 |
Table of Contents
| Emerald Insights Fund | Financial Highlights | |
For a share outstanding throughout the period presented |
| INSTITUTIONAL CLASS | ||||
For the Period Ended August 1, 2014 (Inception) to October 31, 2014 (Unaudited) | ||||
NET ASSET VALUE, BEGINNING OF PERIOD | $ | 10.00 | ||
INCOME FROM OPERATIONS: | ||||
Net investment loss(a) | (0.02) | |||
Net realized and unrealized gain on investments | 0.23 | |||
|
| |||
Total from Investment Operations | 0.21 | |||
|
| |||
NET INCREASE IN NET ASSET VALUE | 0.21 | |||
|
| |||
NET ASSET VALUE, END OF PERIOD | $ | 10.21 | ||
|
| |||
TOTAL RETURN | 2.10%(b) | |||
RATIOS/SUPPLEMENTAL DATA: | ||||
Net Assets, End of Period (000s) | $ | 59 | ||
RATIOS TO AVERAGE NET ASSETS: | ||||
Net Investment loss | (0.62%)(c) | |||
Operating expenses excluding reimbursement/waiver | 20.40%(c)(d) | |||
Operating expenses including reimbursement/waiver | 1.05%(c)(d) | |||
PORTFOLIO TURNOVER RATE | 53%(b) | |||
| (a) | Per share amounts are based upon average shares outstanding. |
| (b) | Not Annualized. |
| (c) | Annualized. |
| (d) | Expense ratios before reductions for startup costs may not be representative of longer term operating periods. |
See Notes to Financial Statements.
34 |
www.emeraldmutualfunds.com |
Table of Contents
| Emerald Insights Fund | Financial Highlights | |
For a share outstanding throughout the period presented |
| INVESTOR CLASS | ||||
For the Period Ended August 1, 2014 (Inception) to October 31, 2014 (Unaudited) | ||||
NET ASSET VALUE, BEGINNING OF PERIOD | $ | 10.00 | ||
INCOME FROM OPERATIONS: | ||||
Net investment loss(a) | (0.04) | |||
Net realized and unrealized gain on investments | 0.23 | |||
|
| |||
Total from Investment Operations | 0.19 | |||
|
| |||
NET INCREASE IN NET ASSET VALUE | 0.19 | |||
|
| |||
NET ASSET VALUE, END OF PERIOD | $ | 10.19 | ||
|
| |||
TOTAL RETURN | 1.90%(b) | |||
RATIOS/SUPPLEMENTAL DATA: | ||||
Net Assets, End of Period (000s) | $ | 132 | ||
RATIOS TO AVERAGE NET ASSETS: | ||||
Net Investment loss | (1.00%)(c) | |||
Operating expenses excluding reimbursement/waiver | 8.14%(c)(d) | |||
Operating expenses including reimbursement/waiver | 1.40%(c)(d) | |||
PORTFOLIO TURNOVER RATE | 53%(b) | |||
| (a) | Per share amounts are based upon average shares outstanding. |
| (b) | Not Annualized. |
| (c) | Annualized. |
| (d) | Expense ratios before reductions for startup costs may not be representative of longer term operating periods. |
See Notes to Financial Statements.
Semi-Annual Report | October 31, 2014 |
35 |
Table of Contents
| Emerald Banking and Finance Fund | Financial Highlights | |
For a share outstanding throughout the periods presented |
| CLASS A | ||||||||||||||||||||||||||||
For the Six Months | Year Ended April 30, 2014 | Year Ended April 30, 2013 | For the Period January 1, 2012 to April 30, 2012 (a)(b) | Year Ended December 31, 2011 | Year Ended December 31, 2010 | Year Ended December 31, 2009 | ||||||||||||||||||||||
NET ASSET VALUE, BEGINNING OF PERIOD | $ | 26.11 | $ | 20.08 | $ | 16.96 | $ | 15.16 | $ | 15.89 | $ | 13.62 | $ | 15.39 | ||||||||||||||
INCOME/(LOSS) FROM OPERATIONS:(c) | ||||||||||||||||||||||||||||
Net investment income/(loss) | (0.07)(d) | (0.13)(d) | (0.01)(d) | (0.01)(d) | (0.03)(d) | (0.04) | 0.02(d) | |||||||||||||||||||||
Net realized and unrealized gain/(loss) on investments | 1.36 | 6.16 | 3.13 | 1.81 | (0.70) | 2.31 | (1.76) | |||||||||||||||||||||
|
|
|
|
|
|
|
|
|
|
|
|
|
| |||||||||||||||
Total from Investment Operations | 1.29 | 6.03 | 3.12 | 1.80 | (0.73) | 2.27 | (1.74) | |||||||||||||||||||||
|
|
|
|
|
|
|
|
|
|
|
|
|
| |||||||||||||||
LESS DISTRIBUTIONS: | ||||||||||||||||||||||||||||
From investment income | – | – | – | – | – | – | (0.03) | |||||||||||||||||||||
|
|
|
|
|
|
|
|
|
|
|
|
|
| |||||||||||||||
Total Distributions | – | – | – | – | – | – | (0.03) | |||||||||||||||||||||
|
|
|
|
|
|
|
|
|
|
|
|
|
| |||||||||||||||
NET INCREASE/(DECREASE) IN NET ASSET VALUE | 1.29 | 6.03 | 3.12 | 1.80 | (0.73) | 2.27 | (1.77) | |||||||||||||||||||||
|
|
|
|
|
|
|
|
|
|
|
|
|
| |||||||||||||||
NET ASSET VALUE, END OF PERIOD | $ | 27.40 | $ | 26.11 | $ | 20.08 | $ | 16.96 | $ | 15.16 | $ | 15.89 | $ | 13.62 | ||||||||||||||
|
|
|
|
|
|
|
|
|
|
|
|
|
| |||||||||||||||
TOTAL RETURN(e) | 4.94% | (f) | 30.03% | 18.40% | 11.87% | (f) | (4.59)% | 16.67% | (11.29)% | |||||||||||||||||||
RATIOS/SUPPLEMENTAL DATA: | ||||||||||||||||||||||||||||
Net Assets, End of Period (000s) | $ | 47,639 | $ | 48,622 | $ | 25,496 | $ | 21,363 | $ | 20,412 | $ | 26,756 | $ | 22,675 | ||||||||||||||
RATIOS TO AVERAGE NET ASSETS: | ||||||||||||||||||||||||||||
Net Investment income/(loss) | (0.56)% | (g) | (0.53)% | (0.06)% | (0.24)% | (g) | (0.22)% | (0.22)% | 0.15% | |||||||||||||||||||
Operating expenses excluding reimbursement/waiver | 1.59% | (g) | 1.72% | 1.88% | 1.96% | (g) | 1.90% | 1.95% | 1.88% | |||||||||||||||||||
Operating expenses including reimbursement/waiver | 1.59% | (g) | 1.72% | 1.84% | 1.85% | (g) | n/a | n/a | n/a | |||||||||||||||||||
PORTFOLIO TURNOVER RATE | 17% | (f) | 34% | 53% | 9% | (f) | 27% | 48% | 43% | |||||||||||||||||||
| (a) | Prior to its March 16, 2012 reorganization with and into the Emerald Banking and Finance Fund, the Fund was known as the Forward Banking and Finance Fund. |
| (b) | Effective March 13, 2012 the Board approved changing the fiscal year-end of the Fund from December 31 to April 30. |
| (c) | The amount shown for a share outstanding throughout the period may not correlate with the Statement of Operations for the period due to the timing of sales and redemptions of Fund shares in relation to income earned and/or fluctuating market value of the investments of the Fund. |
| (d) | Per share amounts are based upon average shares outstanding. |
| (e) | Total return does not reflect the effect of sales charges. |
| (f) | Not Annualized. |
| (g) | Annualized. |
See Notes to Financial Statements.
36 |
www.emeraldmutualfunds.com |
Table of Contents
| Emerald Banking and Finance Fund | Financial Highlights | |
For a share outstanding throughout the periods presented |
| CLASS C | ||||||||||||||||||||||||||||
For the Six Months | Year Ended April 30, 2014 | Year Ended April 30, 2013 | For the Period April 30, 2012 | Year Ended December 31, 2011 | Year Ended December 31, 2010 | Year Ended December 31, 2009 | ||||||||||||||||||||||
NET ASSET VALUE, BEGINNING OF PERIOD | $ | 23.86 | $ | 18.46 | $ | 15.70 | $ | 14.06 | $ | 14.82 | $ | 12.77 | $ | 14.52 | ||||||||||||||
INCOME/(LOSS) FROM OPERATIONS:(c) | ||||||||||||||||||||||||||||
Net investment loss | (0.15)(d) | (0.26)(d) | (0.11)(d) | (0.04)(d) | (0.11)(d) | (0.18) | (0.19) | |||||||||||||||||||||
Net realized and unrealized gain/(loss) on investments | 1.24 | 5.66 | 2.87 | 1.68 | (0.65) | 2.23 | (1.56) | |||||||||||||||||||||
|
|
|
|
|
|
|
|
|
|
|
|
|
| |||||||||||||||
Total from Investment Operations | 1.09 | 5.40 | 2.76 | 1.64 | (0.76) | 2.05 | (1.75) | |||||||||||||||||||||
|
|
|
|
|
|
|
|
|
|
|
|
|
| |||||||||||||||
NET INCREASE/(DECREASE) IN NET ASSET VALUE | 1.09 | 5.40 | 2.76 | 1.64 | (0.76) | 2.05 | (1.75) | |||||||||||||||||||||
|
|
|
|
|
|
|
|
|
|
|
|
|
| |||||||||||||||
NET ASSET VALUE, END OF PERIOD | $ | 24.95 | $ | 23.86 | $ | 18.46 | $ | 15.70 | $ | 14.06 | $ | 14.82 | $ | 12.77 | ||||||||||||||
|
|
|
|
|
|
|
|
|
|
|
|
|
| |||||||||||||||
TOTAL RETURN(e) | 4.57% | (f) | 29.25% | 17.58% | 11.66% | (f) | (5.13)% | 16.05% | (12.05)% | |||||||||||||||||||
RATIOS/SUPPLEMENTAL DATA: | ||||||||||||||||||||||||||||
Net Assets, End of Period (000s) | $ | 29,792 | $ | 28,222 | $ | 17,705 | $ | 14,690 | $ | 13,675 | $ | 17,872 | $ | 16,907 | ||||||||||||||
RATIOS TO AVERAGE NET ASSETS: | ||||||||||||||||||||||||||||
Net Investment loss | (1.21)% | (g) | (1.18)% | (0.68)% | (0.82)% | (g) | (0.77)% | (0.77)% | (0.47)% | |||||||||||||||||||
Operating expenses excluding reimbursement/waiver | 2.24% | (g) | 2.38% | 2.54% | 2.55% | (g) | 2.45% | 2.50% | 2.49% | |||||||||||||||||||
Operating expenses including reimbursement/waiver | 2.24% | (g) | 2.38% | 2.49% | 2.44% | (g) | n/a | n/a | n/a | |||||||||||||||||||
PORTFOLIO TURNOVER RATE | 17% | (f) | 34% | 53% | 9% | (f) | 27% | 48% | 43% | |||||||||||||||||||
| (a) | Prior to its March 16, 2012 reorganization with and into the Emerald Banking and Finance Fund, the Fund was known as the Forward Banking and Finance Fund. |
| (b) | Effective March 13, 2012 the Board approved changing the fiscal year-end of the Fund from December 31 to April 30. |
| (c) | The amount shown for a share outstanding throughout the period may not correlate with the Statement of Operations for the period due to the timing of sales and redemptions of Fund shares in relation to income earned and/or fluctuating market value of the investments of the Fund. |
| (d) | Per share amounts are based upon average shares outstanding. |
| (e) | Total return does not reflect the effect of sales charges. |
| (f) | Not Annualized. |
| (g) | Annualized. |
See Notes to Financial Statements.
Semi-Annual Report | October 31, 2014 |
37 |
Table of Contents
| Emerald Banking and Finance Fund | Financial Highlights | |
For a share outstanding throughout the periods presented |
| INSTITUTIONAL CLASS | ||||||||||||||||
For the Six Months | Year Ended April 30, 2014 | Year Ended April 30, 2013 | For the Period April 30, 2012 (a) | |||||||||||||
NET ASSET VALUE, BEGINNING OF PERIOD | $ | 26.29 | $ | 20.15 | $ | 16.96 | $ | 16.85 | ||||||||
INCOME/(LOSS) FROM OPERATIONS: | ||||||||||||||||
Net investment income/(loss)(b) | (0.03) | (0.06) | 0.01 | (0.01) | ||||||||||||
Net realized and unrealized gain on investments | 1.37 | 6.20 | 3.18 | 0.12 | ||||||||||||
|
|
|
|
|
|
|
| |||||||||
Total from Investment Operations | 1.34 | 6.14 | 3.19 | 0.11 | ||||||||||||
|
|
|
|
|
|
|
| |||||||||
NET INCREASE IN NET ASSET VALUE | 1.34 | 6.14 | 3.19 | 0.11 | ||||||||||||
|
|
|
|
|
|
|
| |||||||||
NET ASSET VALUE, END OF PERIOD | $ | 27.63 | $ | 26.29 | $ | 20.15 | $ | 16.96 | ||||||||
|
|
|
|
|
|
|
| |||||||||
TOTAL RETURN | 5.10% | (c) | 30.47% | 18.81% | 0.65% | (c) | ||||||||||
RATIOS/SUPPLEMENTAL DATA: | ||||||||||||||||
Net Assets, End of Period (000s) | $ | 24,056 | $ | 22,062 | $ | 4,321 | $ | 8 | ||||||||
RATIOS TO AVERAGE NET ASSETS: | ||||||||||||||||
Net Investment income/(loss) | (0.26)% | (d) | (0.23)% | 0.06% | (0.27)% | (d) | ||||||||||
Operating expenses excluding reimbursement/waiver | 1.30% | (d) | 1.37% | 1.62% | 1.83% | (d) | ||||||||||
Operating expenses including reimbursement/waiver | 1.30% | (d) | 1.37% | 1.54% | 1.53% | (d) | ||||||||||
PORTFOLIO TURNOVER RATE | 17% | (c) | 34% | 53% | 9% | (c)(e) | ||||||||||
| (a) | The Fund began offering Institutional Class shares on March 16, 2012. |
| (b) | Per share amounts are based upon average shares outstanding. |
| (c) | Not Annualized. |
| (d) | Annualized. |
| (e) | Portfolio turnover rate is calculated at the Fund level and represents the period ended April 30, 2012. |
See Notes to Financial Statements.
38 |
www.emeraldmutualfunds.com |
Table of Contents
| Emerald Banking and Finance Fund | Financial Highlights | |
For a share outstanding throughout the periods presented |
| INVESTOR CLASS | ||||||||||||||||||||||||
| For the | ||||||||||||||||||||||||
| Six Months | For the Period | |||||||||||||||||||||||
| Ended | January 1, 2012 | |||||||||||||||||||||||
| October 31, | to | Year Ended | Period Ended | |||||||||||||||||||||
| 2014 | Year Ended | Year Ended | April 30, 2012 | December 31, | December 31, | |||||||||||||||||||
| (Unaudited) | April 30, 2014 | April 30, 2013 | (a)(b) | 2011 | 2010 (c) | |||||||||||||||||||
NET ASSET VALUE, BEGINNING OF PERIOD | $ | 25.01 | $ | 19.23 | $ | 16.25 | $ | 14.50 | $ | 15.14 | $ | 14.85 | ||||||||||||
INCOME/(LOSS) FROM OPERATIONS:(d) | ||||||||||||||||||||||||
Net investment income/(loss)(e) | (0.08) | (0.12) | (0.01) | (0.00) | (f) | 0.07 | (0.02) | |||||||||||||||||
Net realized and unrealized gain/(loss) on investments | 1.31 | 5.90 | 2.99 | 1.75 | (0.71) | 0.31 | ||||||||||||||||||
|
|
|
|
|
|
|
|
|
|
|
| |||||||||||||
Total from Investment Operations | 1.23 | 5.78 | 2.98 | 1.75 | (0.64) | 0.29 | ||||||||||||||||||
|
|
|
|
|
|
|
|
|
|
|
| |||||||||||||
NET INCREASE/(DECREASE) IN NET ASSET VALUE | 1.23 | 5.78 | 2.98 | 1.75 | (0.64) | 0.29 | ||||||||||||||||||
|
|
|
|
|
|
|
|
|
|
|
| |||||||||||||
NET ASSET VALUE, END OF PERIOD | $ | 26.24 | $ | 25.01 | $ | 19.23 | $ | 16.25 | $ | 14.50 | $ | 15.14 | ||||||||||||
|
|
|
|
|
|
|
|
|
|
|
| |||||||||||||
TOTAL RETURN | 4.92% | (g) | 30.06% | 18.34% | 12.07% | (g) | (4.23)% | 1.95% | (g) | |||||||||||||||
RATIOS/SUPPLEMENTAL DATA: | ||||||||||||||||||||||||
Net Assets, End of Period (000s) | $ | 23,381 | $ | 19,235 | $ | 6,255 | $ | 693 | $ | 136 | $ | 4 | ||||||||||||
RATIOS TO AVERAGE NET ASSETS: | ||||||||||||||||||||||||
Net Investment income/(loss) | (0.61)% | (h) | (0.53)% | (0.08)% | (0.07)% | (h) | 0.47% | (0.20)% | (h) | |||||||||||||||
Operating expenses excluding reimbursement/waiver | 1.65% | (h) | 1.69% | 1.94% | 1.88% | (h) | 1.48% | 1.83% | (h) | |||||||||||||||
Operating expenses including reimbursement/waiver | 1.65% | (h) | 1.69% | 1.89% | 1.72% | (h) | n/a | n/ | a | |||||||||||||||
PORTFOLIO TURNOVER RATE | 17% | (g) | 34% | 53% | 9% | (g) | 27% | 48% | (i) | |||||||||||||||
| (a) | Prior to its March 16, 2012 reorganization with and into the Emerald Banking and Finance Fund, the Fund was known as the Forward Banking and Finance Fund. |
| (b) | Effective March 13, 2012 the Board approved changing the fiscal year-end of the Fund from December 31 to April 30. |
| (c) | The Fund began offering Investor Class shares on March 16, 2010. |
| (d) | The amount shown for a share outstanding throughout the period may not correlate with the Statement of Operations for the period due to the timing of sales and redemptions of Fund shares in relation to income earned and/or fluctuating market value of the investments of the Fund. |
| (e) | Per share amounts are based upon average shares outstanding. |
| (f) | Less than $0.005 per share. |
| (g) | Not Annualized. |
| (h) | Annualized. |
| (i) | Portfolio turnover rate is calculated at the Fund level and represents the year ended December 31, 2010. |
See Notes to Financial Statements.
Semi-Annual Report | October 31, 2014 |
39 |
Table of Contents
| Emerald Funds | Notes to Financial Statements | |
October 31, 2014 (Unaudited) |
1. ORGANIZATION
Financial Investors Trust (the “Trust”), a Delaware statutory trust, is an open-end management investment company registered under the Investment Company Act of 1940, as amended (the “1940 Act”). As of October 31, 2014, the Trust had 32 registered funds. This semi-annual report describes the Emerald Growth Fund, Emerald Insights Fund and Emerald Banking and Finance Fund (each a “Fund” and collectively, the “Funds”). Prior to March 16, 2012, the Emerald Banking and Finance Fund was known as the Forward Banking and Finance Fund and the Emerald Growth Fund was known as the Forward Growth Fund. Effective March 13, 2012, the Board of Trustees (the “Board”) approved changing the fiscal year end of the Funds from December 31 to April 30.
The Emerald Growth Fund seeks to achieve long-term growth through capital appreciation.
The Emerald Insights Fund seeks to achieve long-term growth through capital appreciation.
The Emerald Banking and Finance Fund seeks to achieve long term growth through capital appreciation with income as a secondary objective.
2. SIGNIFICANT ACCOUNTING POLICIES
The accompanying financial statements were prepared in accordance with accounting principles generally accepted in the United States of America (“U.S. GAAP”). The preparation of financial statements in conformity with U.S. GAAP requires management to make certain estimates and assumptions that affect the reported amounts of assets and liabilities and disclosures of contingent assets and liabilities at the date of the financial statements and the reported amounts of revenue and expenses during the period. Actual results could differ from those estimates. The Funds are considered an investment company for financial reporting purposes under GAAP. The following is a summary of significant accounting policies consistently followed by the Funds in preparation of their financial statements.
Investment Valuation: The Funds generally value their securities based on market prices determined at the close of regular trading on the New York Stock Exchange (“NYSE”), normally, 4:00 p.m. Eastern time, on each business day the NYSE is open for trading.
For equity securities and mutual funds that are traded on an exchange, the market price is usually the closing sale or official closing price on that exchange. In the case of equity securities not traded on an exchange, or if such closing prices are not otherwise available, the securities are valued at the mean of the most recent bid and ask prices on such day. Redeemable securities issued by open-end registered investment companies are valued at the investment company’s applicable net asset value.
The market price for debt obligations is generally the price supplied by an independent third-party pricing service approved by the Board of Trustees (the “Board”), which may use a matrix, formula or other objective method that takes into consideration quotations from dealers, market transactions in comparable investments, market indices and yield curves. If vendors are unable to supply a price, or if the price supplied is deemed to be unreliable, the market price may be determined using quotations received from one or more brokers–dealers that make a market in the security. Short–term debt obligations that will mature in 60 days or less are valued at amortized cost, unless it is determined that using this method would not reflect an investment’s fair value. Investments in non-exchange traded funds are fair valued at their respective net asset values.
Equity securities that are primarily traded on foreign securities exchanges are valued at the preceding closing values of such securities on their respective exchanges, except when an occurrence subsequent to the time a value was so established is likely to have changed such value. In such an event, the fair values of those securities are determined in good faith through consideration of other factors in accordance with procedures established by and under the general supervision of the Board.
When such prices or quotations are not available, or when the Fair Value Committee appointed by the Board believes that they are unreliable, securities may be priced using fair value procedures approved by the Board.
Fair Value Measurements: A three-tier hierarchy has been established to classify fair value measurements for disclosure purposes. Inputs refer broadly to the assumptions that market participants would use in pricing the asset or liability, including assumptions about risk. Inputs may be observable or unobservable. Observable inputs are inputs that reflect the assumptions market participants would use in pricing the asset or liability that are developed based on market data obtained from sources independent of the reporting entity. Unobservable inputs are inputs that reflect the reporting entity’s own assumptions about the assumptions market participants would use in pricing the asset or liability that are developed based on the best information available. Various inputs are used in determining the value of each Fund’s investments as of the reporting period end. The designated input levels are not necessarily an indication of the risk or liquidity associated with these investments. These inputs are categorized in the following hierarchy under applicable financial accounting standards:
Level 1 – | Unadjusted quoted prices in active markets for identical investments, unrestricted assets or liabilities that the Funds have the ability to access at the measurement date; |
40 |
www.emeraldmutualfunds.com |
Table of Contents
| Emerald Funds | Notes to Financial Statements | |
October 31, 2014 (Unaudited) |
Level 2 | – | Quoted prices which are not active, quoted prices for similar assets or liabilities in active markets or inputs other than quoted prices that are observable (either directly or indirectly) for substantially the full term of the asset or liability; and | ||
Level 3 | – | Significant unobservable prices or inputs (including the Funds’ own assumptions in determining the fair value of investments) where there is little or no market activity for the asset or liability at the measurement date. |
The following is a summary of each input used to value the Funds as of October 31, 2014:
| Level 3 - | ||||||||||||||||
| Level 2 - | Significant | |||||||||||||||
| Level 1 - | Other Significant | Unobservable | ||||||||||||||
| Investments in Securities at Value | Quoted Prices | Observable Inputs | Inputs | Total | ||||||||||||
Emerald Growth Fund | ||||||||||||||||
Common Stocks | ||||||||||||||||
Financial Services | $ | 44,102,080 | $ | 1,509,300 | $ | – | $ | 45,611,380 | ||||||||
Other(a) | 217,145,288 | – | – | 217,145,288 | ||||||||||||
Short Term Investments | 5,144,452 | – | – | 5,144,452 | ||||||||||||
TOTAL | $ | 266,391,820 | $ | 1,509,300 | $ | – | $ | 267,901,120 | ||||||||
| Level 3 - | ||||||||||||||||
| Level 2 - | Significant | |||||||||||||||
| Level 1 - | Other Significant | Unobservable | ||||||||||||||
| Investments in Securities at Value | Quoted Prices | Observable Inputs | Inputs | Total | ||||||||||||
Emerald Insights Fund | ||||||||||||||||
Common Stocks | $ | 4,515,426 | $ | – | $ | – | $ | 4,515,426 | ||||||||
Exchange Traded Funds | 239,765 | – | – | 239,765 | ||||||||||||
Master Limited Partnerships | 30,756 | – | – | 30,756 | ||||||||||||
Short Term Investments | 556,010 | – | – | 556,010 | ||||||||||||
TOTAL | $ | 5,341,957 | $ | – | $ | – | $ | 5,341,957 | ||||||||
| Level 3 - | ||||||||||||||||
| Level 2 - | Significant | |||||||||||||||
| Level 1 - | Other Significant | Unobservable | ||||||||||||||
| Investments in Securities at Value | Quoted Prices | Observable Inputs | Inputs | Total | ||||||||||||
Emerald Banking and Finance Fund | ||||||||||||||||
Common Stocks | ||||||||||||||||
Banks: Diversified | $ | 86,875,557 | $ | 6,044,412 | $ | – | $ | 92,919,969 | ||||||||
Other(a) | 30,497,900 | – | – | 30,497,900 | ||||||||||||
Short Term Investments | 1,515,192 | – | – | 1,515,192 | ||||||||||||
TOTAL | $ | 118,888,649 | $ | 6,044,412 | $ | – | $ | 124,933,061 | ||||||||
| (a) | For detailed descriptions of sector and industry, see the accompanying Schedule of Investments. |
The Funds recognize transfers between levels as of the end of the period. For the six months ended October 31, 2014, the Funds had the following transfers between Level 1 and Level 2 securities.
| Level 1 | Level 2 | |||||||||||||||
| Emerald Growth Fund | Transfer In | Transfers (Out) | Transfer In | Transfers (Out) | ||||||||||||
Common Stocks | $ | - | $ | (1,509,300.00 | ) | $ | 1,509,300.00 | $ | - | |||||||
Total | $ | - | $ | (1,509,300.00 | ) | $ | 1,509,300.00 | $ | - | |||||||
Semi-Annual Report | October 31, 2014 |
41 |
Table of Contents
| Emerald Funds | Notes to Financial Statements | |
October 31, 2014 (Unaudited) |
| Level 1 | Level 2 | |||||||
| Emerald Banking and Finance Fund | Transfer In | Transfers (Out) | Transfer In | Transfers (Out) | ||||
Common Stocks | $695,781 | $(5,833,962) | $5,833,962 | $(695,781) | ||||
Total | $695,781 | $(5,833,962) | $5,833,962 | $(695,781) | ||||
The above transfers from Level 1 to Level 2 were due to the Funds’ lack of a closing market price. Transfers from Level 2 to Level 1 are due to the Funds’ being able to obtain a closing market price. For the period ended October 31, 2014, the Emerald Insights Fund did not have any transfers between Level 1 and Level 2 securities.
For the six months and/or period ended October 31, 2014, the Funds did not have any securities that used significant unobservable inputs (Level 3) in determining fair value.
Investment Transactions and Investment Income: Investment transactions are accounted for on the date the investments are purchased or sold (trade date). Realized gains and losses from investment transactions are reported on an identified cost basis, which is the same basis the Funds use for federal income tax purposes. Interest income, which includes accretion of discounts, is accrued and recorded as earned. Dividend income is recognized on the ex-dividend date or for certain foreign securities, as soon as information is available to the Funds. All of the realized and unrealized gains and losses and net investment income, are allocated daily to each class in proportion to its average daily net assets.
Real Estate Investment Trusts (“REITs”): The Funds may invest a portion of their assets in REITs and are subject to certain risks associated with direct investment in REITs. REITs may be affected by changes in the value of their underlying properties and by defaults by borrowers or tenants. REITs depend generally on their ability to generate cash flow to make distributions to shareowners, and certain REITs have self-liquidation provisions by which mortgages held may be paid in full and distributions of capital returns may be made at any time. In addition, the performance of a REIT may be affected by its failure to qualify for tax-free pass-through of income under the Internal Revenue Code of 1986, as amended (the “Code”), or its failure to maintain exemption from registration under the 1940 Act.
Trust Expenses: Some expenses of the Trust can be directly attributed to the Funds. Expenses which cannot be directly attributed to the Funds are apportioned among all funds in the Trust based on average net assets of each fund.
Fund and Class Expenses: Expenses that are specific to a Fund or class of shares of a Fund are charged directly to that Fund or share class. All expenses of the Fund, other than class specific expenses, are allocated daily to each class in proportion to its average daily net assets. Expenses that are common to the Funds generally are allocated among the Funds in proportion to their average daily net assets. Fees provided under the distribution (Rule 12b-1) and/or shareholder service plans for a particular class of the Funds are charged to the operations of such class.
Federal Income Taxes: Each Fund complies with the requirements under Subchapter M of the Internal Revenue Code of 1986, as amended, applicable to regulated investment companies and intends to distribute substantially all of its net taxable income and net capital gains, if any, each year so that the Funds will not be subject to excise tax on undistributed income and gains. The Funds are not subject to income taxes to the extent such distributions are made.
As of and during the six months and/or period ended October 31, 2014, the Funds did not have a liability for any unrecognized tax benefits. The Funds file U.S. federal, state, and local tax returns as required. The Funds’ tax returns are subject to examination by the relevant tax authorities until expiration of the applicable statute of limitations, which is generally three years after the filing of the tax return for federal purposes and four years for most state returns. Tax returns for open years have incorporated no uncertain tax positions that require a provision for income taxes.
Distributions to Shareholders: Each Fund normally pays dividends and distributes capital gains, if any, on an annual basis. Income dividend distributions are derived from interest and other income each Fund receives from its investments, including short-term capital gains. Long term capital gain distributions are derived from gains realized when each Fund sells a security it has owned for more than a year. Each Fund may make additional distributions and dividends at other times if the portfolio manager believes doing so may be necessary for each Fund to avoid or reduce taxes.
42 |
www.emeraldmutualfunds.com |
Table of Contents
| Emerald Funds | Notes to Financial Statements | |
October 31, 2014 (Unaudited) |
3. TAX BASIS INFORMATION
Tax Basis of Investments: As of October 31, 2014, the aggregate cost of investments, gross unrealized appreciation/(depreciation) and net unrealized appreciation/(depreciation) for Federal tax purposes was as follows:
| Gross Appreciation | Gross Depreciation | |||||||||||||||
| (excess of value over tax | (excess of tax cost over | Net Unrealized | Cost of Investments for | |||||||||||||
| cost) | value) | Appreciation | Income Tax Purposes | |||||||||||||
Emerald Growth Fund | $ | 65,847,382 | $ | (10,220,025) | $ | 55,627,357 | $ | 212,273,763 | ||||||||
Emerald Insights Fund | 221,426 | (115,500) | 105,926 | 5,236,031 | ||||||||||||
Emerald Banking and Finance Fund | 32,087,010 | (1,081,765) | 31,005,245 | 93,927,816 | ||||||||||||
Tax Basis of Distributions to Shareholders: The character of distributions made during the year from net investment income or net realized gains may differ from its ultimate characterization for federal income tax purposes. Also, due to the timing of dividend distributions, the fiscal year in which amounts are distributed may differ from the fiscal year in which the income or realized gain were recorded by each Fund.
The tax character of distributions paid by the Funds for the fiscal year ended April 30, 2014, were as follows:
| Ordinary Income | Long-Term Capital Gain | |||||||
Emerald Growth Fund | $ | 1,100,217 | $ | 15,427,273 | ||||
Emerald Banking and Finance Fund | – | – | ||||||
During the six months and/or period ended October 31, 2014, the Funds did not make any distributions.
4. SECURITIES TRANSACTIONS
The cost of purchases and proceeds from sales of securities (excluding short-term securities) during the six months and/or period ended October 31, 2014, was as follows:
| Cost of Investments | Proceeds from | |||||||
| Funds | Purchased | Investments Sold | ||||||
Emerald Growth Fund | $ | 102,336,863 | $ | 93,509,709 | ||||
Emerald Insights Fund | 6,283,584 | 1,551,785 | ||||||
Emerald Banking and Finance Fund | 20,495,791 | 19,693,865 | ||||||
5. SHARES OF BENEFICIAL INTEREST
The capitalization of the Trust consists of an unlimited number of shares of beneficial interest with no par value per share. Holders of the shares of the Funds of the Trust have one vote for each share held and a proportionate fraction of a vote for each fractional share. All shares issued and outstanding are fully paid and are non-assessable, transferable and redeemable at the option of the shareholder. Shares have no pre-emptive rights.
6. MANAGEMENT AND RELATED-PARTY TRANSACTIONS
Emerald Mutual Fund Advisers Trust, (“the Adviser”), subject to the authority of the Board, is responsible for the overall management and administration of the Funds’ business affairs. The Adviser manages the investments of the Funds in accordance with the Funds’ investment objective, policies and limitations and investment guidelines established jointly by the Adviser and the Trustees. Pursuant to the Advisory Agreement, the Funds pay the Adviser fees for the services and facilities it provides payable on a monthly basis at the annual rate set forth below of the Funds’ average daily net assets.
Emerald Growth Fund
| Average Total Net Assets | Contractual Fee | |||
Up to and including $250M | 0.75% | |||
Over $250M and including $500M | 0.65% | |||
Over $500M and including $750M | 0.55% | |||
Over $750M | 0.45% |
Semi-Annual Report | October 31, 2014 |
43 |
Table of Contents
| Emerald Funds | Notes to Financial Statements | |
October 31, 2014 (Unaudited) |
| Emerald Insights Fund | ||||
| Average Total Net Assets | Contractual Fee | |||
Up to and including $250M | 0.75% | |||
Over $250M and including $500M | 0.65% | |||
Over $500M and including $750M | 0.55% | |||
Over $750M | 0.45% | |||
| Emerald Banking and Finance Fund | ||||
| Average Total Net Assets | Contractual Fee | |||
Up to and including $100M | 1.00% | |||
Over $100M | 0.90% | |||
The Adviser has contractually agreed to limit the total amount of “Management Fees” and “Other Expenses” that it is entitled to receive from both Funds through August 31, 2015, with respect to the Funds’ different classes, to the extent the Total Annual Fund Operating Expenses of a Fund (exclusive of acquired fund fees and expenses, brokerage expenses, interest expense, taxes and extraordinary expenses) exceed the annual rates (as a percentage of each Funds average daily net assets) set forth on the tables below. The Adviser will reduce the fee payable with respect to such Fund to the extent of such excess, and/or shall reimburse the Fund (or class) by the amount of such excess. The waiver or reimbursement shall be allocated to each class of the Fund in the same manner as the underlying expenses or fees were allocated. Pursuant to the expense limitation agreement between the Adviser and the Trust, each Fund will reimburse the Adviser for any contractual fee waivers and expense reimbursements made by the Adviser, provided that any such reimbursements made by each Fund to the Adviser will not cause the Funds’ expense limitation to exceed expense limitations in existence at the time the expense was incurred, or at the time of the reimbursement, whichever is lower, and the reimbursement is made within three years after the end of the fiscal year in which fees or expenses were incurred.
| Emerald Growth Fund | ||||||
| Class A | Class C | Institutional Class | Investor Class | |||
1.29% | 1.94% | 0.99% | 1.34% | |||
| Emerald Insights Fund | ||||||
| Class A | Class C | Institutional Class | Investor Class | |||
1.35% | 2.00% | 1.05% | 1.40% | |||
| Emerald Banking and Finance Fund | ||||||
| Class A | Class C | Institutional Class | Investor Class | |||
1.84% | 2.49% | 1.54% | 1.89% | |||
For the six months and/or period ended October 31, 2014, the fee waivers and/or reimbursements were as follows:
| Fund | Fees Waived/ Reimbursed By Adviser | Recoupment of Past Waived Fees By Adviser | ||||||||
Emerald Growth Fund | ||||||||||
Class A | $ 1,083 | $ – | ||||||||
Class C | – | 60 | ||||||||
Institutional Class | 373 | – | ||||||||
Investor Class | – | 81 | ||||||||
Emerald Insights Fund | ||||||||||
Class A | $ 15,907 | $ – | ||||||||
Class C | 806 | – | ||||||||
Institutional Class | 2,734 | – | ||||||||
Investor Class | 924 | – | ||||||||
Emerald Banking and Finance Fund | ||||||||||
Class A | $ – | $ – | ||||||||
Class C | – | – | ||||||||
Institutional Class | – | – | ||||||||
Investor Class | – | – | ||||||||
44 |
www.emeraldmutualfunds.com |
Table of Contents
| Emerald Funds | Notes to Financial Statements | |
October 31, 2014 (Unaudited) |
As of 2014, the balances of recoupable expenses for each Fund were as follows:
| Fund | Expires 2015 | Expires 2016 | Expires 2017 | Total | ||||||||||||
Emerald Growth Fund | ||||||||||||||||
Class A | $ | 6,877 | $ | 37,509 | $ | 11,560 | $ | 55,946 | ||||||||
Class C | 518 | 3,189 | 1,471 | 5,178 | ||||||||||||
Institutional Class | 13,614 | 70,871 | 16,688 | 101,173 | ||||||||||||
Investor Class | – | 397 | – | 397 | ||||||||||||
Emerald Banking and Finance Fund | ||||||||||||||||
Class A | $ | – | $ | – | $ | – | �� | $ | – | |||||||
Class C | – | – | – | – | ||||||||||||
Institutional Class | – | – | – | – | ||||||||||||
Investor Class | – | – | – | – | ||||||||||||
The Funds will not be obligated to pay any such deferred fees and expenses more than three years after the year(s) in which the fees and expense were incurred.
Distributor: ALPS Distributors, Inc. (“ADI” or the “Distributor”) (an affiliate of ALPS Fund Services Inc. (“ALPS”)) acts as the distributor of the Funds’ shares pursuant to a Distribution Agreement with the Trust. Shares are sold on a continuous basis by ADI as agent for the Funds, and ADI has agreed to use its best efforts to solicit orders for the sale of Funds’ shares, although it is not obliged to sell any particular amount of shares. ADI is not entitled to any compensation for its services as Distributor. ADI is registered as a broker-dealer with the Securities and Exchange Commission.
Each Fund has adopted a separate Distribution and Services Plan (each a “Plan” and collectively, the “Plans”) pursuant to Rule 12b-1 of the 1940 Act. The Plans allow each Fund, as applicable, to use each Fund’s assets to pay fees in connection with the distribution and marketing of the Funds’ shares and/or the provision of shareholder services to the Funds’ shareholders. The Plan permits payment for services in connection with the administration of plans or programs that use shares of each Fund as their funding medium and for related expenses. The Plans permit each Fund to make total payments at an annual rate of up to 0.35%, 0.75% and 0.25% of the average daily net asset value of Class A, Class C and Investor Class, respectively. Because these fees are paid out of the Funds’ assets on an ongoing basis, over time they will increase the cost of an investment in the Funds, and Plan fees may cost an investor more than other types of sales charges.
Each Fund has adopted a Shareholder Services Plan (a “Shareholder Services Plan”) with respect to its shares. Under the Shareholder Services Plan, each Fund is authorized to pay banks and their affiliates and other institutions, including broker-dealers and Fund affiliates (“Participating Organizations”), an aggregate fee in an amount not to exceed on an annual basis 0.25%, 0.05% and 0.15% of the average daily net asset value of Class C, Institutional Class and Investor Class, respectively, of the Funds attributable to or held in the name of a Participating Organization for its clients as compensation for providing services pursuant to an agreement with a Participating Organization. Any amount of such payment not paid during the Funds’ fiscal year for such service activities shall be reimbursed to the Funds as soon as practicable after the end of the fiscal year. Shareholder Services Plan fees are included with distribution and service fees on the Statement of Operations.
Fund Administrator Fees and Expenses: ALPS (an affiliate of ADI) serves as administrator to the Funds, and each Fund has agreed to pay expenses incurred in connection with its administrative activities. Pursuant to the Administration, Bookkeeping and Pricing Services Agreement, ALPS will provide operational services to the Funds including, but not limited to, fund accounting and fund administration and generally assist in each Fund’s operations.
Prior to August 1, 2014, the inception date of the Emerald Insights Fund, the annual administrative fee, billed monthly in total and allocated to each Fund, in the amount of the greater of (a) the annual minimum for both Funds of $200,000 or (b) following basis point fee schedule:
| Average Total Net Assets | Contractual Fee | |||||||||
Between $0-$500M | 0.06% | |||||||||
$500M-$1B | 0.04% | |||||||||
Above $1B | 0.025% | |||||||||
The minimum annual total fee of $200,000 was increased to $285,000 for all 3 Funds with the inception of the Emerald Insights Fund on August 1, 2014.
The Administrator is also reimbursed by the Funds for certain out-of-pocket expenses.
Semi-Annual Report | October 31, 2014 |
45 |
Table of Contents
| Emerald Funds | Notes to Financial Statements | |
October 31, 2014 (Unaudited) |
Transfer Agent: ALPS serves as transfer, dividend paying and shareholder servicing agent for the Funds. ALPS receives an annual minimum fee, a fee based upon the number of shareholder accounts, and is also reimbursed by the Funds for certain out-of-pocket expenses.
Compliance Services: ALPS provides services that assist the Trust’s chief compliance officer in monitoring and testing the policies and procedures of the Trust in conjunction with requirements under Rule 38a-1 under the 1940 Act and receives an annual base fee. ALPS is reimbursed for certain out-of-pocket expenses by the Funds.
Principal Financial Officer: ALPS receives an annual fee for providing principal financial officer services to the Funds.
7. INDEMNIFICATIONS
Under the Trust’s organizational documents, its officers and Trustees are indemnified against certain liability arising out of the performance of their duties to the Trust. Additionally, in the normal course of business, the Trust enters into contracts with service providers that may contain general indemnification clauses, which may permit indemnification to the extent permissible under applicable law. The Trust’s maximum exposure under these arrangements is unknown, as this would involve future claims that may be made against the Trust that have not yet occurred.
46 |
www.emeraldmutualfunds.com |
Table of Contents
| Disclosure Regarding Approval of Fund Advisory Agreements | ||
October 31, 2014 (Unaudited) | ||
On June 10, 2014, the Trustees met in person to discuss, among other things, the approval of the investment advisory agreement between the Trust and Emerald Mutual Funds Advisors Trust (“Emerald”) (the “Insights Fund”) (the “Investment Advisory Agreement”), in accordance with Section 15(c) of the 1940 Act. The Independent Trustees met with independent legal counsel during executive session and discussed the Investment Advisory Agreement, and other related materials.
In approving the Investment Advisory Agreement with Emerald, the Trustees, including the Independent Trustees, considered the following factors with respect to the Insights Fund:
Investment Advisory Fee Rate: The Trustees reviewed and considered the contractual annual advisory fee to be paid by the Trust, on behalf of the Insights Fund, to Emerald of 0.75%, 0.65%, 0.55%, and 0.45%, depending on the average daily net assets of the Insights Fund, in light of the extent and quality of the advisory services provided by Emerald to the Insights Fund.
The Trustees considered the information they received comparing the Insights Fund contractual annual advisory fee and overall expenses (net of waivers) with those of funds in the relevant expense peer group provided by an independent provider of investment company data.
Based on such information, the Trustees further determined that the contractual annual advisory fee of 0.75%, 0.65%, 0.55% and 0.45%, depending on total net assets, and the total expense ratio (net of waivers) of 1.35%, 1.40%, 2.00% and 1.05% of the Class A, Investor Class, Class C and Institutional Class Shares, respectively, of the Insights Fund, were expected to be generally lower than the median of the respective peer expense group provided by an independent provider of investment company data.
Nature, Extent and Quality of the Services under the Advisory Agreement: The Trustees received and considered information regarding the nature, extent and quality of services provided to the Insights Fund under the Advisory Agreement. The Trustees reviewed certain background materials supplied by Emerald in its presentation, including its Form ADV and Summary of Compliance Policies.
The Trustees reviewed and considered Emerald’s investment advisory personnel, its history as an asset manager, its performance and the amount of assets currently under management by Emerald. The Trustees also reviewed the research and decision-making processes utilized by Emerald, including the methods adopted to seek to achieve compliance with the investment objectives, policies and restrictions of the Insights Fund.
The Trustees considered the background and experience of Emerald’s management in connection with the Insights Fund, including reviewing the qualifications, backgrounds and responsibilities of the management team primarily responsible for the day-to-day portfolio management of the Insights Fund and the extent of the resources devoted to research and analysis of actual and potential investments.
The Trustees also reviewed the accompanying compliance-related materials and further noted that they have received reports on these services and compliance issues at each regular Board meeting throughout the year related to the services rendered by Emerald with respect to the Emerald Growth Fund and Emerald Banking and Finance Fund.
Performance: The Trustees noted that since the Insights Fund has not yet begun operations, there is no fund performance to be reviewed or analyzed at this time. The Trustees also considered the limitations on the comparability of performance information for certain related funds and accounts. The Trustees considered Emerald’s reputation generally and its investment techniques, risk management controls and decision-making processes.
Comparable Accounts, Total Expense Ratios, and the Advisers’ Profitability: The Trustees discussed the projected profitability of Emerald with respect to the Insights Fund based on information provided by Emerald. The Trustees noted Emerald’s statements that the Insights Fund was expected to be profitable to Emerald as assets grow. The Trustees also considered information provided by Emerald regarding its institutional fee schedule as compared to the fee rates applicable to the Insights Fund. The Board then reviewed Emerald’s financial statements in order to analyze the financial condition and stability of Emerald. In assessing the projected profitability analysis, the Trustees noted that the Insight Fund’s total expense ratios (after waivers) and contractual advisory fee rate were was generally either lower than, or within an acceptable range of the median of, comparable funds identified by an independent provider of investment company data.
Economies of Scale: The Trustees considered whether economies of scale in the provision of services to the Insights Fund will be passed along to the shareholders under the proposed agreement.
Other Benefits to the Adviser: The Trustees reviewed and considered any other benefits derived or to be derived by Emerald from its relationship with the Insights Fund, including whether soft dollar arrangements would be used.
Semi-Annual Report | October 31, 2014 |
47 |
Table of Contents
| Disclosure Regarding Approval of Fund Advisory Agreements | ||
October 31, 2014 (Unaudited) | ||
The Board summarized its deliberations with respect to the Investment Advisory Agreement with Emerald. In selecting Emerald and approving the Investment Advisory Agreement and fees under such agreement, the Trustees concluded that no single factor reviewed by the Trustees was identified by the Trustees to be determinative as the principal factor in whether to approve the Investment Advisory Agreement. Further, the Independent Trustees were advised by separate independent legal counsel throughout the process. The Trustees, including all of the Independent Trustees, concluded that:
| • | the investment advisory fees to be received by Emerald and total expenses (net of waivers) with respect to the Insights Fund were generally expected to be lower than that of the expense peer group median; |
| • | the nature, extent and quality of services rendered by Emerald under the Advisory Agreement were adequate; |
| • | bearing in mind the limitations of comparing different types of managed accounts and the different levels of service typically associated with such accounts, the fee structures applicable to Emerald’s other clients employing a comparable strategy were not indicative of any unreasonableness with respect to the advisory fees proposed to be payable by the Insights Fund; |
| • | there was no performance history for the Insights Fund for the Board to consider; |
| • | the Emerald Funds were expected to be profitable to Emerald in the near future, and such profit is expected to be fair to the Trust; and |
| • | to the extent there were any material economies of scale or other benefits accruing to Emerald in connection with its relationship with the Insights Fund as assets grow, their benefits would be substantially passed through to shareholders. |
Based on the Trustees’ deliberations and their evaluation of the information described above, the Trustees, including all of the Independent Trustees, concluded that Emerald’s compensation for investment advisory services is consistent with the best interests of the Insights Fund and its shareholders.
48 |
www.emeraldmutualfunds.com |
Table of Contents
| Emerald Funds | Additional Information | |
October 31, 2014 (Unaudited) |
1. FUND HOLDINGS
The Funds file their complete schedule of portfolio holdings with the Securities and Exchange Commission (the “SEC”) for the first and third quarters of each fiscal year on Form N-Q within 60 days after the end of the period. Copies of the Funds’ Form N-Q are available without charge on the SEC website at http://www.sec.gov. You may also review and copy the Form N-Q at the SEC’s Public Reference Room in Washington, DC. For more information about the operation of the Public Reference Room, please call the SEC at 1-800-SEC-0330.
2. FUND PROXY VOTING POLICIES, PROCEDURES AND SUMMARIES
Each Fund’s policies and procedures used in determining how to vote proxies and information regarding how the Funds voted proxies relating to portfolio securities during the most recent prior 12-month period ending June 30 are available without charge, (1) upon request, by calling (toll-free) (855) 828-9909 and (2) on the SEC’s website at http://www.sec.gov.
Semi-Annual Report | October 31, 2014 |
49 |
Table of Contents

Table of Contents

Table of Contents

| 1 | ||||
| ||||
| 5 | ||||
| ||||
| 13 | ||||
| ||||
| 14 | ||||
| 18 | ||||
| 23 | ||||
| 30 | ||||
| ||||
| 35 | ||||
| ||||
| 36 | ||||
| ||||
| 37 | ||||
| 38 | ||||
| 39 | ||||
| 40 | ||||
| ||||
| 41 | ||||
| 43 | ||||
| 45 | ||||
| 47 | ||||
| ||||
| 49 | ||||
| ||||
| 60 | ||||
| ||||
| 62 | ||||
| ||||
Table of Contents
| Grandeur Peak Funds® | Shareholder Letter | |
October 31, 2014 (Unaudited) |
| ||||

Dear Fellow Shareholders,
September was a rougher month for stocks, but otherwise the market seems to find a way to keep climbing. In our Q4 letter last year we mentioned that we were surprised at how strong the stock market remained through 2013 after a strong showing in 2012. We thought the market had gotten ahead of itself in 2012 so were quite surprised that markets advanced another 24% in 2013 (as measured by the Russell Global Index). So this year we’ve been extra cautious and have focused on maintaining the Quality factor in our portfolios despite their higher valuations. Not that we are calling for a correction, but we certainly believe there is increasing downside risk.
We talk a lot about Quality. As a reminder, we look for three components of Quality: business quality, management quality, and financial quality. We believe a high quality company is one that has a good business model, is led by a skilled and motivated management team with high integrity, has a sustainable competitive advantage, has headroom to grow, delivers significant cash flow and returns on capital, and has a strong balance sheet.
We especially think that the current market environment calls for a high quality portfolio. When valuations get stretched it becomes tempting to try to find stocks trading at more reasonable valuations. It never feels good when you believe your portfolio is a tad expensive, like we do now. But history has taught us many things, including the value of holding a quality portfolio when markets begin to crack. Looking at our results for the period, we think that our focus on Quality helped when the market began to show some weakness (see performance for the period on pages 5, 7, 9 and 11), but it also means we have less upside room for outperformance if a bullish market persists.
Notes from the Road
Recent travels took our team to the UK, Canada, Israel, Austria, Germany, Sri Lanka, Bangladesh and a number of U.S. cities. Here are Stuart’s notes on his recent trip to Israel with Zach:
Overall I was quite impressed with Tel Aviv and the companies we met. When we arrived, I was really curious about what to expect given the violence flare up over the past month. As Zach and I drove around to our meetings, I felt more or less normal – no imminent threat. I started to feel a little on edge during the day before the cease-fire because that morning, the rocket sirens went off in Tel Aviv and as I was standing in the bomb shelter room at the hotel, we heard two explosions. I was sure the rockets had landed in Tel Aviv but I later learned that the explosions occurred in the air above the city; the Iron Dome defense system was successful in shooting the rockets out of the sky. We had experienced sirens a day or two earlier but that turned out to be a false alarm. Before we left that day, Zach and I downloaded the Iron Dome app, which alerts you of rocket warnings around Israel with a map that shows the areas at risk, and our apps blew up all day long with alerts everywhere. Apparently there had been 100 or so alerts during that day and as we drove up north towards Nazareth I was reading to Zach all the news about rockets coming from Lebanon in the north as well. I was really glad to see that they came to a cease-fire agreement that evening and Zach told everyone throughout the rest of the trip that we had brought peace to Israel. Interestingly, Israel seems way more dangerous from the outside because all you hear is the negative news. Every day during our trip, the roads, restaurants and beaches were full
Semi-Annual Report | October 31, 2014 |
1 |
Table of Contents
| Grandeur Peak Funds® | Shareholder Letter | |
October 31, 2014 (Unaudited) |
of people. Most people we met with brushed the safety risk aside – business as usual. Most said that seeing rockets in the air and hearing sirens is just part of the Israel experience and they were really confident about the Iron Dome.
Israel seems to have a fairly young population. I think we ran into a lot more small children and young people in Israel than in any other country that I’ve visited this year. The culture seemed sort of informal, particularly in dress, but this is probably a function of the weather being so hot, the beach being close, and the fact that many people, including the kids, were on holiday given the time of year (we saw lots of children in many of the offices). Before this trip, I had a negative perception of Israeli management teams – that they were hard to communicate with. But in actuality, all of the people with whom we met were (for the most part) easy to communicate with and were on point. The companies we met with were all focused on international markets, of course, as Israel itself offers limited headroom. Generally, the sentiment from management teams was upbeat, even despite the war, and I was impressed with the technology/offerings coming out of some of the tech companies. Overall it was a good trip and I expect to see more interesting new tech companies come out of the country in the future.
Portfolio Manager Update
In August we announced the shifting of a few portfolio manager responsibilities. We are a team-based firm. We have a relatively small investment team working very collaboratively to manage the portfolios. As we have expanded from two strategies to four strategies it has become a little trickier to make sure we are fully leveraging the skill of the entire team across all portfolios and maintaining tight oversight of each strategy.
Consequently, we have been evolving our weekly team meetings and daily communications to ensure that we are keeping all strategies in sight as we vet each company and trade. It is also important that the portfolio managers (who are each analysts first) have the bandwidth for passionate oversight of their Fund(s) in order to ensure we are executing the way we intend.
Having us (Robert & Blake) leading all four strategies simply spreads us too thin to be as effective as we could be on a day-to-day basis. Fortunately, we have a strong and cohesive senior investment team. Last year we named Randy, Amy, and Spencer as additional portfolio managers (“PMs”) on the Global Reach Fund, and then included Spencer as a portfolio manager on the Emerging Markets Fund. They have each proven to be a great addition, and we have now expanded the breadth of their roles.
We have also learned that two is a good number for lead PMs on a portfolio…it’s enough to provide a sounding board and continuous coverage, but not so many that we run into group-think and delayed action; so we have designed our PM teams around two lead portfolio managers for each strategy.
We are not a portfolio manager “star” system. Our PMs will not be “running” the strategies. Our investment team collaboratively runs all of our strategies, and the PMs are point people assigned to ensure we are executing daily on each portfolio. You may be interested to know that the bonus for each PM remains tied to how all four strategies perform – to reinforce our holistic team approach.
We are also introducing what we are calling a “Guardian Portfolio Manager” for each strategy. The Guardian PM has the ability to make daily trades and be a back-up when either lead PM is on the road or unavailable, but their most important role is to provide a big picture view for the portfolio. The Guardian PM will regularly provide a holistic review of the portfolio to the lead PMs to make sure we are not missing the forest for the trees. The Guardian PM will also need to be aligned on all large positions in the portfolio.
Our revised portfolio manager coverage is outlined below:
Global Opportunities
Portfolio Managers: Robert Gardiner & Amy Hu Sunderland
Guardian PM: Blake Walker
International Opportunities
Portfolio Managers: Blake Walker & Randy Pearce
Guardian PM: Robert Gardiner
Emerging Markets Opportunities
Portfolio Managers: Blake Walker & Spencer Stewart
Guardian PM: Robert Gardiner
The Global Reach strategy is a little different in that the senior industry analysts act as the portfolio manager on their industry tranche within the portfolio, and then the Guardian PMs serve as the asset allocators across industries (as well as providing the roles of a Guardian PM described above).
2 |
1.855.377.7325 | www.GrandeurPeakGlobal.com |
Table of Contents
| Grandeur Peak Funds® | Shareholder Letter | |
October 31, 2014 (Unaudited) |
Global Reach
Portfolio Managers:
Amy Hu Sunderland
Randy Pearce
Spencer Stewart
Blake Walker
Robert Gardiner
Guardian PMs: Robert Gardiner & Blake Walker
Here are a couple of excerpts from the letter sent out in September to introduce these changes:
Blake: “From the outset of our firm, we’ve avoided a “star” PM approach to managing your funds. This has not been, nor ever will be, the “Robert and Blake” show. Randy, Amy and Spencer have been an integral part of our team approach from the beginning, so recognizing their contribution is important. The other aspect of this change is subtle but important. As a team-oriented asset management firm grows there is a risk that the team becomes nothing more than a slow-moving bureaucratic committee. These announced changes reflect our need to stay in that sweet spot of “team” and away from the extremes of “star” or “committee.” We think these changes preserve our team culture and help us keep a clear focus on each strategy.”
Robert: “We all know the expression “Give a boy a fish and you feed him for a day. Teach him how to fish and you feed him for a lifetime.” The single most important effort I pursue at Grandeur Peak is not picking a great undiscovered best-in-class company/stock. Rather, the most important effort I pursue is to find high-quality stock pickers who share our culture, who themselves will be able to pick great undiscovered best-in-class companies/stocks continuously over decades, and to develop them as part of our team.
Three years ago when Blake, Eric and I announced our intentions to leave our former firm and start a new one, we were not sure of the team we could gather around us to form Grandeur Peak. The additions of Randy, Amy and Spence were a godsend. I cannot express enough my appreciation for both their tireless work ethic these last three years, and the intellectual capital they brought and continue to bring to bear on your portfolios. There are also other key employees at Grandeur Peak who have made similar contributions both in research and across the rest of the firm. There is nothing more important to me than developing a broad, talented team of individuals who are strong culture carriers for our firm and absolutely passionate about doing well for our clients. These announced changes recognize the valued contribution and role of just a few of our talented team members.”
The other nuance this change reflects is the continuous need for us to stay nimble and quick on our feet across all of our Funds in a fast-paced, changing global economy.”
We view these as small, but meaningful, tweaks to how we are managing the portfolios. We do not play favorites among strategies. Each strategy helps the others, just the as the team members do. Global Reach, as the umbrella for all of our strategies, is the initial center of our attention. If we get Global Reach right, we should be well-positioned across strategies, particularly with these passionate champions watching over each portfolio.
Business Update
All four Funds are now closed to additional investment. As we’ve said, we’re really sorry to not be able to leave the Funds open to existing shareholders. We found that even by closing the Funds to new investors we continued to receive a steady flow of additional money. Our first priority is to protect the long-term interest of our clients by limiting our assets at a level where we can remain nimble to fully implement our investment strategy. We ultimately believe limiting assets is a critical element of being a premier global small and micro-cap investment firm. We are frequently asked if we will be coming out with new strategies in the near future. For now the answer is “probably not.” We do have other strategies on our radar, but we will wait until we feel the timing is right for our next launch.
As of September 30, 2014, our firm-wide AUM was $2.4 billion, broken down as follows:
Global Opportunities Strategy | $909 million | |||
International Opportunities Fund | $819 million | |||
Emerging Markets Opportunities Fund | $434 million | |||
Global Reach Fund | $264 million |
We thank you for your continued trust in our team.
Sincerely,
Robert Gardiner, CFA | Blake Walker | |||
Chief Executive Officer & Portfolio Manager | Chief Investment Officer & Portfolio Manager | |||
Semi-Annual Report | October 31, 2014 |
3 |
Table of Contents
| Grandeur Peak Funds® | Shareholder Letter | |
October 31, 2014 (Unaudited) |
The objective of all Grandeur Peak Funds is long-term growth of capital.
RISKS: Mutual fund investing involves risks and loss of principal is possible. Investing in small and micro-cap funds will be more volatile and loss of principal could be greater than investing in large cap or more diversified funds. Investing in foreign securities entails special risks, such as currency fluctuations and political uncertainties, which are described in more detail in the prospectus. Investments in emerging markets are subject to the same risks as other foreign securities and may be subject to greater risks than investments in foreign countries with more established economies and securities markets.
An investor should consider investment objectives, risks, charges, and expenses carefully before investing. To obtain a Grandeur Peak Funds prospectus, containing this and other information, visit www.grandeurpeakglobal.com or call 1-855-377-PEAK (7325). Please read it carefully before investing.
The views and information discussed in this commentary are as of the date of publication, are subject to change, and may not reflect the writer’s current views. The views expressed represent an assessment of market conditions at a specific point in time, are opinions only and should not be relied upon as investment advice regarding a particular investment or markets in general. Such information does not constitute a recommendation to buy or sell specific securities or investment vehicles. It should not be assumed that any investment will be profitable or will equal the performance of the Funds or any securities or any sectors mentioned in this letter. The subject matter contained in this letter has been derived from several sources believed to be reliable and accurate at the time of compilation. Neither Grandeur Peak Global Advisors, LLC nor the Funds accept any liability for losses either direct or consequential caused by the use of this information. Past performance does not guarantee future results.
The Russell Global Index seeks to measures the performance of the global equity universe. The Index is not actively managed and does not reflect any deductions for fees, expense, or taxes. You cannot invest directly in the Index.
CFA® is trademark owned by CFA Institute.
ALPS Distributors, Inc. is the Distributor for the Grandeur Peak Funds.
4 |
1.855.377.7325 | www.GrandeurPeakGlobal.com |
Table of Contents
| Grandeur Peak Emerging Markets Opportunities Fund | Performance Update | |
October 31, 2014 (Unaudited) |
Cumulative Total Return Performance for the periods ended October 31, 2014
| Expense Ratio | ||||||||||
| Since | ||||||||||
| 6 Months | Calendar YTD | Inception(a) | Gross | Net(b) | ||||||
Grandeur Peak Emerging Markets Opportunities | 5.41% | 10.01% | 11.00% | 2.00% | 1.95% | |||||
Grandeur Peak Emerging Markets Opportunities | 5.50% | 10.21% | 11.20% | 1.75% | 1.70% | |||||
Russell Emerging Markets Small Cap Index(c) | 1.31% | 4.36% | 6.37% | |||||||
| (a) | Fund inception date of December 16, 2013. |
| (b) | Grandeur Peak Global Advisors, LLC (the “Adviser”), has agreed to waive and/or reimburse fees or expenses in order to limit Total Annual Fund Operating Expenses After Fee Waiver/Expense Reimbursement (excluding acquired fund fees and expenses, brokerage expenses, interest expenses, taxes and extraordinary expenses) to 1.95% of the Fund’s average daily net assets for the Investor Class and 1.70% of the Fund’s average daily net assets for the Institutional Class. This agreement is in effect through August 31, 2015. The Fund may have to repay some of these waivers and reimbursements to the Adviser in the following three years. This agreement may not be terminated or modified prior to this date except with the approval of the Fund’s Board of Trustees. |
| (c) | The Russell Emerging Markets Small Cap Index seeks to measure the performance of the small-cap equity universe of emerging countries. The Index is not actively managed and does not reflect any deductions for fees, expense, or taxes. An investor may not invest directly in the Index. |
Returns for periods greater than 1 year are annualized.
The returns shown above do not reflect the deduction of taxes a shareholder would pay on Fund distributions or redemption of Fund shares.
Performance data quoted represents past performance. Past performance does not guarantee future results. Investment return and principal value of an investment will fluctuate so that an investor’s shares, when sold or redeemed, may be worth more or less than the original cost. Current performance data may be higher or lower than actual data quoted. For the most current month-end performance data, please call 1-855-377-PEAK (7325).
Growth of $10,000 for the period ended October 31, 2014
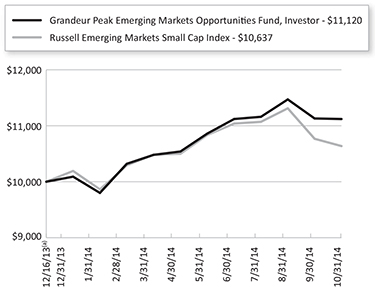
Semi-Annual Report | October 31, 2014 |
5 |
Table of Contents
| Grandeur Peak Emerging Markets Opportunities Fund | Performance Update | |
October 31, 2014 (Unaudited) |
The graphs shown above represent a hypothetical investment of $10,000 in the Fund’s Investor Class shares for the period from inception to 10/31/2014. All returns reflect reinvested dividends, but do not reflect the deduction of taxes that an investor would pay on distributions or redemptions.
The Fund also offers Institutional Class shares, performance for which is not reflected in the graphs above. The performance of Institutional Class shares may be higher or lower than the performance of the Investor Class shares shown in the graphs above based upon differences in fees paid by shareholders investing in the Investor Class shares and Institutional Class shares.
Regional Allocation (as a % of Net Assets)* | ||||||
Asia ex Japan | 71.4% | |||||
Africa/Middle East | 7.3% | |||||
Latin America | 6.9% | |||||
Europe | 3.5% | |||||
North America | 2.1% | |||||
Cash, Cash Equivalents, & Other Net Assets | 8.8% | |||||
Total | 100.0% | |||||
Industry Sector Allocation (as a % of Net Assets)* | ||||||
Financials | 20.2% | |||||
Industrials | 19.2% | |||||
Technology | 17.5% | |||||
Consumer | 16.8% | |||||
Health Care | 11.7% | |||||
Energy & Materials | 5.8% | |||||
Cash, Cash Equivalents, & Other Net Assets | 8.8% | |||||
Total | 100.0% | |||||
Top 10 Holdings (as a % of Net Assets)* | ||||||
Man Wah Holdings, Ltd. | 2.6% | |||||
Value Partners Group, Ltd. | 1.6% | |||||
Sporton International, Inc. | 1.3% | |||||
KONA I Co., Ltd. | 1.2% | |||||
Security Bank Corp. | 1.2% | |||||
Hy-Lok Corp. | 1.2% | |||||
Sinmag Equipment Corp. | 1.1% | |||||
UDE Corp. | 1.1% | |||||
Transaction Capital, Ltd. | 1.1% | |||||
Far East Horizon, Ltd. | 1.1% | |||||
Total | 13.5% | |||||
| * | Holdings are subject to change. |
6 |
1.855.377.7325 | www.GrandeurPeakGlobal.com |
Table of Contents
| Grandeur Peak Global Opportunities Fund | Performance Update | |
October 31, 2014 (Unaudited) |
Cumulative Total Return Performance for the periods ended October 31, 2014
| Expense Ratio | ||||||||||||||||
| Since | ||||||||||||||||
| 6 Months | Calendar YTD | 3 Years | Inception(a) | Gross | Net(b) | |||||||||||
Grandeur Peak Global Opportunities Fund – Investor (GPGOX) | 2.11% | 2.74% | 19.93% | 21.21% | 1.70 | % | 1.70 | % | ||||||||
Grandeur Peak Global Opportunities Fund – Institutional (GPGIX) | 2.10% | 3.02% | 20.38% | 21.65% | 1.46 | % | 1.46 | % | ||||||||
Russell Global Small Cap Index(c) | -0.50% | 0.22% | 12.31% | 13.77% | ||||||||||||
Russell Global Index(d) | 2.36% | 4.64% | 13.81% | 15.22% | ||||||||||||
| (a) | Fund inception date of October 17, 2011. |
| (b) | Grandeur Peak Global Advisors, LLC (the “Adviser”), has agreed to waive and/or reimburse fees or expenses in order to limit Total Annual Fund Operating Expenses After Fee Waiver/Expense Reimbursement (excluding acquired fund fees and expenses, brokerage expenses, interest expenses, taxes and extraordinary expenses) to 1.75% of the Fund’s average daily net assets for the Investor Class and 1.50% of the Fund’s average daily net assets for the Institutional Class. This agreement is in effect through August 31, 2015. The Fund may have to repay some of these waivers and reimbursements to the Adviser in the following three years. This agreement may not be terminated or modified prior to this date except with the approval of the Fund’s Board of Trustees. |
| (c) | The Russell Global Small Cap Index seeks to measure the performance of the small-cap segment of the global equity universe. The Index is not actively managed and does not reflect any deductions for fees, expense, or taxes. An investor may not invest directly in the Index. |
| (d) | The Russell Global Index seeks to measure the performance of the global equity universe. The Index is not actively managed and does not reflect any deductions for fees, expense, or taxes. An investor may not invest directly in the Index. |
Returns for periods greater than 1 year are annualized.
The returns shown above do not reflect the deduction of taxes a shareholder would pay on Fund distributions or redemption of Fund shares.
Performance data quoted represents past performance. Past performance does not guarantee future results. Investment return and principal value of an investment will fluctuate so that an investor’s shares, when sold or redeemed, may be worth more or less than the original cost. Current performance data may be higher or lower than actual data quoted. For the most current month-end performance data, please call 1-855-377-PEAK (7325).
Growth of $10,000 for the period ended October 31, 2014
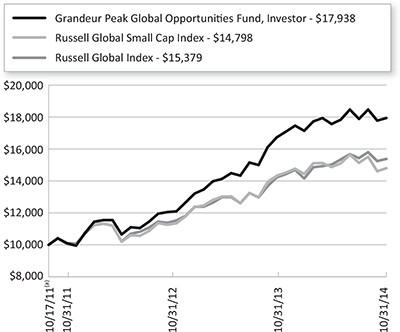
Semi-Annual Report | October 31, 2014 |
7 |
Table of Contents
| Grandeur Peak Global Opportunities Fund | Performance Update | |
October 31, 2014 (Unaudited) |
The graphs shown above represent a hypothetical investment of $10,000 in the Fund’s Investor Class shares for the period from inception to 10/31/2014. All returns reflect reinvested dividends, but do not reflect the deduction of taxes that an investor would pay on distributions or redemptions.
The Fund also offers Institutional Class shares, performance for which is not reflected in the graphs above. The performance of Institutional Class shares may be higher or lower than the performance of the Investor Class shares shown in the graphs above based upon differences in fees paid by shareholders investing in the Investor Class shares and Institutional Class shares.
Regional Allocation (as a % of Net Assets)* | ||||||
North America | 34.0% | |||||
Asia ex Japan | 33.2% | |||||
Europe | 20.1% | |||||
Latin America | 4.2% | |||||
Japan | 3.8% | |||||
Australia/New Zealand | 1.8% | |||||
Africa/Middle East | 1.7% | |||||
Cash, Cash Equivalents, & Other Net Assets | 1.2% | |||||
Total | 100.0% | |||||
Industry Sector Allocation (as a % of Net Assets)* | ||||||
Industrials | 23.2% | |||||
Technology | 22.5% | |||||
Financials | 22.2% | |||||
Health Care | 13.4% | |||||
Consumer | 13.1% | |||||
Energy & Materials | 4.4% | |||||
Cash, Cash Equivalents, & Other Net Assets | 1.2% | |||||
Total | 100.0% | |||||
Top 10 Holdings (as a % of Net Assets)* | ||||||
First Republic Bank | 3.0% | |||||
Roadrunner Transportation Systems, Inc. | 1.7% | |||||
Clinigen Group PLC | 1.7% | |||||
Melexis NV | 1.5% | |||||
Universal Truckload Services, Inc. | 1.5% | |||||
Man Wah Holdings, Ltd. | 1.4% | |||||
RPS Group PLC | 1.3% | |||||
Magellan Financial Group, Ltd. | 1.3% | |||||
Knight Transportation, Inc. | 1.3% | |||||
Home Capital Group, Inc. | 1.1% | |||||
Total | 15.8% | |||||
| * | Holdings are subject to change. |
8 |
1.855.377.7325 | www.GrandeurPeakGlobal.com |
Table of Contents
| Grandeur Peak Global Reach Fund | Performance Update | |
October 31, 2014 (Unaudited) |
Cumulative Total Return Performance for the periods ended October 31, 2014
| Expense Ratio | ||||||||||||||||||||
| 6 Months | Calendar YTD | Since Inception(a) | Gross | Net(b) | ||||||||||||||||
Grandeur Peak Global Reach Fund – Investor (GPROX) | 2.41% | 7.52% | 20.02% | 1.88% | 1.64% | |||||||||||||||
Grandeur Peak Global Reach Fund – Institutional (GPRIX) | 2.58% | 7.78% | 20.26% | 1.72% | 1.39% | |||||||||||||||
Russell Global Small Cap Index(c) | -0.50% | 0.22% | 10.31% | |||||||||||||||||
Russell Global Index(d) | 2.36% | 4.64% | 13.53% | |||||||||||||||||
| (a) | Fund inception date of June 19, 2013. |
| (b) | Grandeur Peak Global Advisors, LLC (the “Adviser”), has agreed to waive and/or reimburse fees or expenses in order to limit Total Annual Fund Operating Expenses After Fee Waiver/Expense Reimbursement (excluding acquired fund fees and expenses, brokerage expenses, interest expenses, taxes and extraordinary expenses) to 1.60% of the Fund’s average daily net assets for the Investor Class and 1.35% of the Fund’s average daily net assets for the Institutional Class. This agreement is in effect through August 31, 2015. The Fund may have to repay some of these waivers and reimbursements to the Adviser in the following three years. This agreement may not be terminated or modified prior to this date except with the approval of the Fund’s Board of Trustees. |
| (c) | The Russell Global Small Cap Index seeks to measure the performance of the small-cap segment of the global equity universe. The Index is not actively managed and does not reflect any deductions for fees, expense, or taxes. An investor may not invest directly in the Index. |
| (d) | The Russell Global Index seeks to measure the performance of the global equity universe. The Index is not actively managed and does not reflect any deductions for fees, expense, or taxes. An investor may not invest directly in the Index. |
Returns for periods greater than 1 year are annualized.
The returns shown above do not reflect the deduction of taxes a shareholder would pay on Fund distributions or redemption of Fund shares.
Performance data quoted represents past performance. Past performance does not guarantee future results. Investment return and principal value of an investment will fluctuate so that an investor’s shares, when sold or redeemed, may be worth more or less than the original cost. Current performance data may be higher or lower than actual data quoted. For the most current month-end performance data, please call 1-855-377-PEAK (7325).
Growth of $10,000 for the period ended October 31, 2014
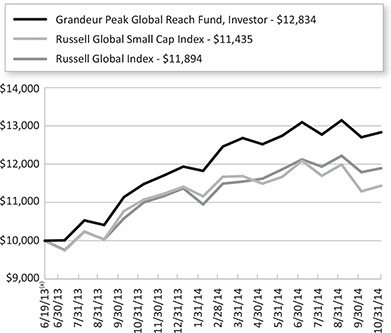
Semi-Annual Report | October 31, 2014 |
9 |
Table of Contents
| Grandeur Peak Global Reach Fund | Performance Update | |
October 31, 2014 (Unaudited) |
The graphs shown above represent a hypothetical investment of $10,000 in the Fund’s Investor Class shares for the period from inception to 10/31/2014. All returns reflect reinvested dividends, but do not reflect the deduction of taxes that an investor would pay on distributions or redemptions.
The Fund also offers Institutional Class shares, performance for which is not reflected in the graphs above. The performance of Institutional Class shares may be higher or lower than the performance of the Investor Class shares shown in the graphs above based upon differences in fees paid by shareholders investing in the Investor Class shares and Institutional Class shares.
Regional Allocation (as a % of Net Assets)* | ||||||
Asia ex Japan | 31.5% | |||||
North America | 26.6% | |||||
Europe | 19.0% | |||||
Africa/Middle East | 4.4% | |||||
Japan | 3.6% | |||||
Latin America | 2.6% | |||||
Australia/New Zealand | 2.1% | |||||
Cash, Cash Equivalents, & Other Net Assets | 10.2% | |||||
Total | 100.0% | |||||
Industry Sector Allocation (as a % of Net Assets)* | ||||||
Financials | 20.7% | |||||
Industrials | 19.9% | |||||
Technology | 18.1% | |||||
Consumer | 16.7% | |||||
Health Care | 11.7% | |||||
Energy & Materials | 2.7% | |||||
Cash, Cash Equivalents, & Other Net Assets | 10.2% | |||||
Total | 100.0% | |||||
Top 10 Holdings (as a % of Net Assets)* | ||||||
First Republic Bank | 1.8% | |||||
Roadrunner Transportation Systems, Inc. | 1.8% | |||||
Man Wah Holdings, Ltd. | 1.4% | |||||
Magellan Financial Group, Ltd. | 1.2% | |||||
Clinigen Group PLC | 1.1% | |||||
Home Capital Group, Inc. | 0.8% | |||||
Bank of Georgia Holdings PLC | 0.8% | |||||
IG Group Holdings PLC | 0.7% | |||||
CETIP SA - Mercados Organizados | 0.7% | |||||
Gentex Corp. | 0.7% | |||||
Total | 11.0% | |||||
| * | Holdings are subject to change. |
10 |
1.855.377.7325 | www.GrandeurPeakGlobal.com |
Table of Contents
| Grandeur Peak International Opportunities Fund | Performance Update | |
October 31, 2014 (Unaudited) |
Cumulative Total Return Performance for the periods ended October 31, 2014
| Expense Ratio | ||||||||||||
| 6 Months | Calendar YTD | 3 Years | Since Inception(a) | Gross | Net(b) | |||||||
Grandeur Peak International Opportunities Fund – Investor (GPIOX) | 0.29% | 4.59% | 19.67% | 20.95% | 1.68% | 1.68% | ||||||
Grandeur Peak International Opportunities Fund – Institutional (GPIIX) | 0.29% | 4.57% | 19.88% | 21.16% | 1.44% | 1.44% | ||||||
Russell Global ex-U.S. Small Cap Index(c) | -3.94% | -0.99% | 8.86% | 9.75% | ||||||||
| (a) | Fund inception date of October 17, 2011. |
| (b) | Grandeur Peak Global Advisors, LLC (the “Adviser”),has agreed to waive and/or reimburse fees or expenses in order to limit Total Annual Fund Operating Expenses After Fee Waiver/Expense Reimbursement (excluding acquired fund fees and expenses, brokerage expenses, interest expenses, taxes and extraordinary expenses) to 1.75% of the Fund’s average daily net assets for the Investor Class and 1.50% of the Fund’s average daily net assets for the Institutional Class. This agreement is in effect through August 31, 2015. The Fund may have to repay some of these waivers and reimbursements to the Adviser in the following three years. This agreement may not be terminated or modified prior to this date except with the approval of the Fund’s Board of Trustees. |
| (c) | The Russell Global ex-U.S. Small Cap Index seeks to measure the performance of the small-cap segment of the global equity universe, excluding companies assigned to the United States. The Index is not actively managed and does not reflect any deductions for fees, expense, or taxes. An investor may not invest directly in the Index. |
Returns for periods greater than 1 year are annualized.
The returns shown above do not reflect the deduction of taxes a shareholder would pay on Fund distributions or redemption of Fund shares.
Performance data quoted represents past performance. Past performance does not guarantee future results. Investment return and principal value of an investment will fluctuate so that an investor’s shares, when sold or redeemed, may be worth more or less than the original cost. Current performance data may be higher or lower than actual data quoted. For the most current month-end performance data, please call 1-855-377-PEAK (7325).
Growth of $10,000 for the period ended October 31, 2014
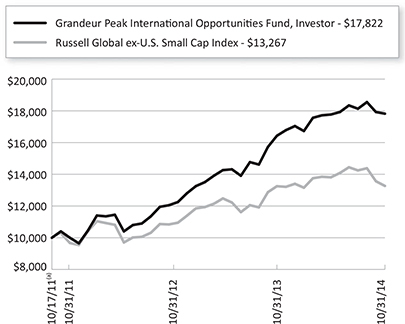
Semi-Annual Report | October 31, 2014 |
11 |
Table of Contents
| Grandeur Peak International Opportunities Fund | Performance Update | |
October 31, 2014 (Unaudited) |
The graphs shown above represent a hypothetical investment of $10,000 in the Fund’s Investor Class shares for the period from inception to 10/31/2014. All returns reflect reinvested dividends, but do not reflect the deduction of taxes that an investor would pay on distributions or redemptions.
The Fund also offers Institutional Class shares, performance for which is not reflected in the graphs above. The performance of Institutional Class shares may be higher or lower than the performance of the Investor Class shares shown in the graphs above based upon differences in fees paid by shareholders investing in the Investor Class shares and Institutional Class shares.
Regional Allocation (as a % of Net Assets)* | ||||||
Asia ex Japan | 41.4% | |||||
Europe | 27.5% | |||||
Japan | 5.3% | |||||
Latin America | 5.1% | |||||
North America | 4.9% | |||||
Africa/Middle East | 3.0% | |||||
Australia/New Zealand | 2.1% | |||||
Cash, Cash Equivalents, & Other Net Assets | 10.7% | |||||
Total | 100.0% | |||||
Industry Sector Allocation (as a % of Net Assets)* | ||||||
Financials | 20.2% | |||||
Industrials | 19.7% | |||||
Technology | 17.9% | |||||
Consumer | 13.8% | |||||
Health Care | 12.5% | |||||
Energy & Materials | 5.2% | |||||
Cash, Cash Equivalents, & Other Net Assets | 10.7% | |||||
Total | 100.0% | |||||
Top 10 Holdings (as a % of Net Assets)* | ||||||
Clinigen Group PLC | 2.2% | |||||
Home Capital Group, Inc. | 1.7% | |||||
Melexis NV | 1.5% | |||||
Man Wah Holdings, Ltd. | 1.3% | |||||
CETIP SA - Mercados Organizados | 1.3% | |||||
Magellan Financial Group, Ltd. | 1.3% | |||||
RPS Group PLC | 1.3% | |||||
Hy-Lok Corp. | 1.2% | |||||
Trancom Co., Ltd. | 1.2% | |||||
Sporton International, Inc. | 1.2% | |||||
Total | 14.2% | |||||
| * | Holdings are subject to change. |
12 |
1.855.377.7325 | www.GrandeurPeakGlobal.com |
Table of Contents
| Grandeur Peak Funds® | Disclosure of Fund Expenses | |
October 31, 2014 (Unaudited) |
As a shareholder of a Fund, you incur two types of costs: direct costs, such as short-term redemption fees and wire fees, and indirect costs, including management fees, and other fund operating expenses. This example is intended to help you understand your indirect costs, also referred to as “ongoing costs” (in dollars), of investing in the Fund and to compare these costs with the ongoing costs of investing in other mutual funds.
This example is based on an investment of $1,000 invested at the beginning of the period and held for the entire six-month period of May 1, 2014 through October 31, 2014.
Actual Expenses The first line of the table below provides information about actual account values and actual expenses. You may use the information in this line, together with the amount you invested at the beginning of the period, to estimate the expenses that you paid over the period. Simply divide your account value by $1,000 (for example, an $8,600 account value divided by $1,000 = 8.6), then multiply the result by the number in the first line under the heading “Expenses Paid During Period” to estimate the expenses you paid on your account during this period.
Hypothetical Example for Comparison Purposes The second line of the table provides information about hypothetical account values and hypothetical expenses based on the Fund’s actual expense ratio and an assumed rate of return of 5% per year before expenses, which is not the Fund’s actual return. The hypothetical account values and expenses may not be used to estimate the actual ending account balance or expenses you paid for the period. You may use this information to compare ongoing costs of investing in the Fund and other funds. To do so, compare this 5% hypothetical example with the 5% hypothetical examples that appear in the shareholder reports of other funds.
Please note that the expenses shown in the table are meant to highlight your ongoing costs only and do not reflect any direct costs, such as wire fees or low balance fees. Therefore, the second line of the table is useful in comparing ongoing costs only and will not help you determine the relative total costs of owning different funds. In addition, if these direct costs were included, your costs would be higher.
Beginning Account Value May 1, 2014 | Ending Account Value October 31, 2014 | Expense Ratio(a) | Expenses Paid During period May 1, 2014 - October 31, 2014(b) | |||||
Grandeur Peak Emerging Markets Opportunities Fund | ||||||||
Institutional Class | ||||||||
Actual | $ 1,000.00 | $ 1,055.00 | 1.57% | $ 8.13 | ||||
Hypothetical (5% return before expenses) | $ 1,000.00 | $ 1,017.29 | 1.57% | $ 7.98 | ||||
Investor Class | ||||||||
Actual | $ 1,000.00 | $ 1,054.10 | 1.82% | $ 9.42 | ||||
Hypothetical (5% return before expenses) | $ 1,000.00 | $ 1,016.03 | 1.82% | $ 9.25 | ||||
Grandeur Peak Global Opportunities Fund | ||||||||
Institutional Class | ||||||||
Actual | $ 1,000.00 | $ 1,021.00 | 1.37% | $ 6.98 | ||||
Hypothetical (5% return before expenses) | $ 1,000.00 | $ 1,018.30 | 1.37% | $ 6.97 | ||||
Investor Class | ||||||||
Actual | $ 1,000.00 | $ 1,021.10 | 1.62% | $ 8.25 | ||||
Hypothetical (5% return before expenses) | $ 1,000.00 | $ 1,017.04 | 1.62% | $ 8.24 | ||||
Grandeur Peak Global Reach Fund | ||||||||
Institutional Class | ||||||||
Actual | $ 1,000.00 | $ 1,025.80 | 1.35% | $ 6.89 | ||||
Hypothetical (5% return before expenses) | $ 1,000.00 | $ 1,018.40 | 1.35% | $ 6.87 | ||||
Investor Class | ||||||||
Actual | $ 1,000.00 | $ 1,024.10 | 1.60% | $ 8.16 | ||||
Hypothetical (5% return before expenses) | $ 1,000.00 | $ 1,017.14 | 1.60% | $ 8.13 | ||||
Grandeur Peak International Opportunities Fund | ||||||||
Institutional Class | ||||||||
Actual | $ 1,000.00 | $ 1,002.90 | 1.38% | $ 6.97 | ||||
Hypothetical (5% return before expenses) | $ 1,000.00 | $ 1,018.25 | 1.38% | $ 7.02 | ||||
Investor Class | ||||||||
Actual | $ 1,000.00 | $ 1,002.90 | 1.63% | $ 8.23 | ||||
Hypothetical (5% return before expenses) | $ 1,000.00 | $ 1,016.99 | 1.63% | $ 8.29 | ||||
| (a) | The Fund’s expense ratios have been annualized based on the Fund’s most recent fiscal half-year expenses. |
| (b) | Expenses are equal to the Fund’s annualized expense ratio multiplied by the average account value over the period, multiplied by the number of days in the most recent fiscal half-year 184/365 (to reflect the half-year period). |
Semi-Annual Report | October 31, 2014 |
13 |
Table of Contents
| Grandeur Peak Emerging Markets Opportunities Fund | Portfolio of Investments | |
October 31, 2014 (Unaudited) |
| Shares | Value (Note 2) | |||||||
| ||||||||
COMMON STOCKS (90.80%) |
| |||||||
Bangledesh (0.79%) | ||||||||
Active Fine Chemicals, Ltd. | 1,146,000 | $ | 1,103,276 | |||||
Islami Bank Bangladesh, Ltd.(a) | 3,103,500 | 1,070,795 | ||||||
Olympic Industries, Ltd.(a) | 378,000 | 1,282,713 | ||||||
|
| |||||||
| 3,456,784 | ||||||||
|
| |||||||
Brazil (4.73%) | ||||||||
Banco Daycoval SA | 662,137 | 2,408,858 | ||||||
CETIP SA - Mercados Organizados | 270,162 | 3,423,498 | ||||||
Even Construtora e Incorporadora SA | 628,700 | 1,361,750 | ||||||
Linx SA | 62,500 | 1,298,317 | ||||||
Magazine Luiza SA | 495,400 | 1,649,401 | ||||||
Odontoprev SA | 428,500 | 1,547,712 | ||||||
Ser Educacional SA | 137,700 | 1,497,649 | ||||||
Sonae Sierra Brasil SA | 211,500 | 1,527,846 | ||||||
Tegma Gestao Logistica | 130,300 | 957,044 | ||||||
Totvs SA | 104,900 | 1,528,946 | ||||||
Valid Solucoes SA | 212,300 | 3,408,247 | ||||||
|
| |||||||
| 20,609,268 | ||||||||
|
| |||||||
China (14.44%) | ||||||||
51job, Inc., ADR(a) | 44,150 | 1,355,405 | ||||||
AAC Technologies Holdings, Inc. | 194,000 | 1,163,764 | ||||||
Bolina Holding Co., Ltd. | 6,023,000 | 2,252,271 | ||||||
China Biologic Products, Inc.(a) | 51,425 | 3,098,356 | ||||||
China Lesso Group Holdings, Ltd. | 4,717,000 | 2,476,468 | ||||||
China Medical System Holdings, Ltd. | 1,245,000 | 2,295,404 | ||||||
China Pioneer Pharma Holdings, Ltd. | 3,982,000 | 3,786,614 | ||||||
China Shineway Pharmaceutical Group, Ltd. | 1,413,000 | 2,549,483 | ||||||
Dongpeng Holdings Co., Ltd. | 8,772,000 | 3,218,339 | ||||||
Far East Horizon, Ltd. | 4,934,500 | 4,589,372 | ||||||
Freetech Road Recycling Technology Holdings, Ltd. | 5,363,700 | 1,099,792 | ||||||
Labixiaoxin Snacks Group, Ltd.(a) | 6,967,000 | 934,306 | ||||||
Le Saunda Holdings, Ltd. | 1,304,000 | 656,160 | ||||||
Man Wah Holdings, Ltd. | 7,514,300 | 11,242,820 | ||||||
Mindray Medical International, Ltd., ADR | 116,675 | 3,399,910 | ||||||
| Shares | Value (Note 2) | |||||||
| ||||||||
China (continued) | ||||||||
Noah Holdings, Ltd., Sponsored ADR(a) | 223,625 | $ | 3,667,450 | |||||
O2Micro International, Ltd., ADR(a) | 241,250 | 472,850 | ||||||
Phoenix New Media, Ltd., ADR(a) | 335,190 | 3,439,049 | ||||||
Sihuan Pharmaceutical Holdings Group, Ltd. | 2,424,000 | 1,935,565 | ||||||
SPT Energy Group, Inc. | 13,710,000 | 4,319,282 | ||||||
Tao Heung Holdings, Ltd. | 880,000 | 463,961 | ||||||
Tsui Wah Holdings, Ltd. | 2,512,000 | 949,471 | ||||||
WuXi PharmaTech Cayman, Inc., ADR(a) | 95,000 | 3,581,500 | ||||||
|
| |||||||
| 62,947,592 | ||||||||
|
| |||||||
Colombia (1.71%) | ||||||||
Gran Tierra Energy, | 764,300 | 3,485,208 | ||||||
Parex Resources, Inc.(a) | 434,231 | 3,979,953 | ||||||
|
| |||||||
| 7,465,161 | ||||||||
|
| |||||||
Georgia (0.75%) | ||||||||
Bank of Georgia Holdings PLC | 79,397 | 3,256,264 | ||||||
|
| |||||||
Greece (0.47%) | ||||||||
Sarantis SA | 233,541 | 2,048,631 | ||||||
|
| |||||||
Hong Kong (3.34%) | ||||||||
ASR Holdings, Ltd. | 14,083,000 | 2,142,827 | ||||||
China South City Holdings, Ltd. | 4,721,000 | 2,138,239 | ||||||
International Housewares Retail Co., Ltd. | 2,436,000 | 669,152 | ||||||
Playmates Toys, Ltd. | 4,036,000 | 942,841 | ||||||
Value Partners Group, Ltd. | 9,483,800 | 7,147,425 | ||||||
Vitasoy International Holdings, Ltd. | 1,101,900 | 1,518,081 | ||||||
|
| |||||||
| 14,558,565 | ||||||||
|
| |||||||
India (14.63%) | ||||||||
AIA Engineering, Ltd. | 120,750 | 1,845,390 | ||||||
Ajanta Pharma, Ltd. | 113,172 | 3,501,051 | ||||||
Amara Raja Batteries, Ltd. | 201,300 | 2,147,961 | ||||||
Bajaj Finance, Ltd. | 66,100 | 3,018,109 | ||||||
Balkrishna Industries, Ltd. | 175,300 | 2,200,049 | ||||||
Cera Sanitaryware, Ltd. | 15,955 | 433,019 | ||||||
Credit Analysis & Research, Ltd. | 177,490 | 3,863,582 | ||||||
eClerx Services, Ltd. | 69,479 | 1,470,092 | ||||||
Engineers India, Ltd. | 633,000 | 2,805,147 | ||||||
Glenmark Pharmaceuticals, Ltd. | 267,700 | 3,134,199 | ||||||
See Notes to Financial Statements.
14 |
1.855.377.7325 | www.GrandeurPeakGlobal.com |
Table of Contents
| Grandeur Peak Emerging Markets Opportunities Fund | Portfolio of Investments | |
October 31, 2014 (Unaudited) |
| Shares | Value (Note 2) | |||||||
| ||||||||
India (continued) | ||||||||
Hinduja Global Solutions, Ltd. | 166,500 | $ | 1,832,852 | |||||
IFGL Refractories, Ltd. | 359,956 | 1,125,492 | ||||||
Indag Rubber, Ltd. | 14,750 | 176,423 | ||||||
Infotech Enterprises, Ltd. | 358,595 | 2,804,225 | ||||||
Ipca Laboratories, Ltd. | 94,956 | 1,130,936 | ||||||
Jammu & Kashmir Bank, Ltd. | 702,830 | 1,592,357 | ||||||
Just Dial, Ltd. | 32,300 | 789,646 | ||||||
Kolte-Patil Developers, Ltd. | 1,058,750 | 3,243,212 | ||||||
KPIT Technologies, Ltd. | 1,331,280 | 3,596,248 | ||||||
Mahindra & Mahindra Financial Services, Ltd. | 250,900 | 1,198,701 | ||||||
Mayur Uniquoters, Ltd. | 127,045 | 909,423 | ||||||
MT Educare, Ltd. | 812,148 | 1,778,918 | ||||||
Persistent Systems, Ltd. | 51,025 | 1,080,043 | ||||||
PI Industries, Ltd. | 247,675 | 1,799,879 | ||||||
Poly Medicure, Ltd. | 45,861 | 615,912 | ||||||
Repco Home Finance, Ltd. | 285,727 | 2,267,622 | ||||||
Suprajit Engineering, Ltd. | 687,287 | 1,303,220 | ||||||
Time Technoplast, Ltd. | 3,806,100 | 2,932,061 | ||||||
Vaibhav Global, Ltd.(a) | 274,337 | 3,689,252 | ||||||
Vakrangee Software, Ltd. | 573,100 | 1,189,051 | ||||||
Vardhman Textiles, Ltd. | 308,219 | 2,195,181 | ||||||
Vesuvius India, Ltd. | 171,200 | 1,944,542 | ||||||
V-Mart Retail, Ltd. | 19,283 | 171,983 | ||||||
|
| |||||||
| 63,785,778 | ||||||||
|
| |||||||
Indonesia (4.15%) | ||||||||
Arwana Citramulia Tbk PT | 12,410,700 | 939,687 | ||||||
Astra Graphia Tbk PT | 8,442,500 | 1,550,204 | ||||||
Bank Negara Indonesia Persero Tbk PT | 3,981,000 | 1,962,096 | ||||||
Bank Tabungan Pensiunan Nasional Tbk PT(a) | 4,746,500 | 1,661,911 | ||||||
Bekasi Fajar Industrial Estate Tbk PT | 43,361,100 | 2,100,657 | ||||||
Express Transindo Utama Tbk PT | 16,473,000 | 1,588,775 | ||||||
Lippo Cikarang Tbk PT(a) | 1,031,600 | 725,968 | ||||||
Panin Sekuritas Tbk PT | 2,622,500 | 1,112,148 | ||||||
Selamat Sempurna Tbk PT | 5,999,100 | 2,231,218 | ||||||
Tempo Scan Pacific Tbk PT | 14,898,500 | 3,516,172 | ||||||
Ultrajaya Milk Industry & | ||||||||
Trading Co. Tbk PT | 2,240,900 | 709,122 | ||||||
|
| |||||||
| 18,097,958 | ||||||||
|
| |||||||
Malaysia (3.69%) | ||||||||
AEON Credit Service M Bhd | 748,300 | 3,581,338 | ||||||
Berjaya Food Bhd | 1,676,584 | 1,442,497 | ||||||
CB Industrial Product Holding Bhd | 2,798,400 | 2,050,130 | ||||||
| Shares | Value (Note 2) | |||||||
| ||||||||
Malaysia (continued) | ||||||||
Freight Management Holdings Bhd | 327,900 | $ | 168,481 | |||||
JobStreet Corp. Bhd | 398,200 | 315,878 | ||||||
Kossan Rubber Industries | 3,083,300 | 4,312,842 | ||||||
My EG Services Bhd | 1,330,900 | 1,626,507 | ||||||
Padini Holdings Bhd | 2,814,100 | 1,574,828 | ||||||
Uzma Bhd(a) | 971,300 | 1,019,341 | ||||||
|
| |||||||
| 16,091,842 | ||||||||
|
| |||||||
Mexico (1.74%) | ||||||||
Credito Real SAB de CV | 1,008,300 | 2,586,969 | ||||||
Genomma Lab Internacional SAB de CV, Class B(a) | 633,400 | 1,604,402 | ||||||
Medica Sur SAB de CV, Series B | 807,546 | 3,412,187 | ||||||
|
| |||||||
| 7,603,558 | ||||||||
|
| |||||||
Netherlands (0.31%) | ||||||||
Nostrum Oil & Gas LP, PLC(a) | 125,490 | 1,362,949 | ||||||
|
| |||||||
Oman (0.51%) | ||||||||
Al Anwar Ceramic Tile Co. | 1,623,190 | 2,209,225 | ||||||
|
| |||||||
Philippines (4.09%) | ||||||||
Concepcion Industrial Corp. | 3,844,660 | 3,427,628 | ||||||
Metropolitan Bank & Trust Co. | 454,000 | 834,683 | ||||||
Pepsi-Cola Products Philippines, Inc.(a) | 36,678,000 | | 3,817,642 | | ||||
Puregold Price Club, Inc. | 1,620,100 | 1,249,696 | ||||||
RFM Corp. | 8,592,700 | 955,254 | ||||||
Robinsons Land Corp. | 3,372,600 | 1,844,926 | ||||||
Security Bank Corp. | 1,604,600 | 5,138,589 | ||||||
Union Bank of the Philippines | 205,360 | 538,169 | ||||||
|
| |||||||
| 17,806,587 | ||||||||
|
| |||||||
Poland (1.99%) | ||||||||
KRUK SA(a) | 124,346 | 3,978,973 | ||||||
Magellan SA(a) | 73,840 | 1,712,041 | ||||||
Wawel SA | 3,626 | 991,349 | ||||||
Work Service SA(a) | 346,838 | 1,993,961 | ||||||
|
| |||||||
| 8,676,324 | ||||||||
|
| |||||||
Russia (0.37%) | ||||||||
MD Medical Group Investments PLC, GDR(b) | 193,800 | 1,608,540 | ||||||
|
| |||||||
Singapore (1.12%) | ||||||||
Petra Foods, Ltd. | 705,400 | 2,091,986 | ||||||
See Notes to Financial Statements.
Semi-Annual Report | October 31, 2014 |
15 |
Table of Contents
| Grandeur Peak Emerging Markets Opportunities Fund | Portfolio of Investments | |
October 31, 2014 (Unaudited) |
| Shares | Value (Note 2) | |||||||
| ||||||||
Singapore (continued) | ||||||||
Technovator International, Ltd.(a) | 6,147,000 | $ | 2,786,978 | |||||
|
| |||||||
| 4,878,964 | ||||||||
|
| |||||||
South Africa (6.69%) | ||||||||
ARB Holdings, Ltd. | 631,808 | 372,013 | ||||||
Blue Label Telecoms, Ltd. | 4,999,823 | 4,419,708 | ||||||
Clicks Group, Ltd. | 402,300 | 2,739,203 | ||||||
Comair, Ltd. | 8,289,753 | 3,008,864 | ||||||
Ellies Holdings, Ltd.(a) | 4,832,608 | 560,823 | ||||||
EOH Holdings, Ltd. | 264,424 | 2,580,386 | ||||||
Interwaste Holdings, Ltd.(a) | 15,898,682 | 2,032,425 | ||||||
Invicta Holdings, Ltd. | 162,400 | 1,491,688 | ||||||
Italtile, Ltd. | 1,302,579 | 1,096,973 | ||||||
MiX Telematics, Ltd., Sponsored ADR(a) | 165,587 | 1,475,380 | ||||||
OneLogix Group, Ltd.(a) | 2,142,622 | 950,935 | ||||||
Super Group, Ltd.(a) | 1,252,680 | 3,586,964 | ||||||
Transaction Capital, Ltd. | 7,317,109 | 4,842,802 | ||||||
|
| |||||||
| 29,158,164 | ||||||||
|
| |||||||
South Korea (6.16%) | ||||||||
Duksan Hi-Metal Co., Ltd.(a) | 124,500 | 1,254,811 | ||||||
ENF Technology Co., Ltd. | 179,810 | 1,057,405 | ||||||
Global Display Co., Ltd. | 239,575 | 1,455,063 | ||||||
Hanssem Co., Ltd. | 8,183 | 975,384 | ||||||
Hy-Lok Corp. | 183,908 | 5,022,872 | ||||||
ISC Co., Ltd. | 53,832 | 1,970,524 | ||||||
Koh Young Technology, Inc. | 77,244 | 2,384,319 | ||||||
Kolao Holdings | 85,952 | 1,321,105 | ||||||
KONA I Co., Ltd. | 132,697 | 5,417,446 | ||||||
LEENO Industrial, Inc. | 44,245 | 1,761,913 | ||||||
LF Corp. | 48,260 | 1,522,169 | ||||||
Solueta Co., Ltd.(a) | 48,000 | 409,250 | ||||||
Vieworks Co., Ltd. | 30,093 | 1,020,303 | ||||||
Wins Technet Co., Ltd. | 179,412 | 1,290,360 | ||||||
|
| |||||||
| 26,862,924 | ||||||||
|
| |||||||
Sri Lanka (1.81%) | ||||||||
Asiri Hospital Holdings PLC | 4,000,000 | 746,320 | ||||||
Expolanka Holdings PLC | 8,266,517 | 625,796 | ||||||
Hatton National Bank PLC | 484,700 | 731,514 | ||||||
Hemas Holdings PLC | 1,459,745 | 781,359 | ||||||
The Lanka Hospital Corp. PLC | 1,640,200 | 634,633 | ||||||
Royal Ceramics Lanka PLC | 3,878,675 | 3,312,927 | ||||||
Sampath Bank PLC | 575,400 | 1,059,725 | ||||||
|
| |||||||
| 7,892,274 | ||||||||
|
| |||||||
Taiwan (12.29%) | ||||||||
ASPEED Technology, Inc. | 280,608 | 2,145,182 | ||||||
Chipbond Technology Corp. | 848,000 | 1,563,614 | ||||||
| Shares | Value (Note 2) | |||||||
| ||||||||
Taiwan (continued) | ||||||||
Cleanaway Co., Ltd. | 348,000 | $ | 1,547,045 | |||||
Cowealth Medical Holding Co., Ltd. | 431,000 | 1,335,299 | ||||||
Cub Elecparts, Inc. | 91,165 | 961,767 | ||||||
DYNACOLOR, Inc. | 767,000 | 1,593,573 | ||||||
Elan Microelectronics Corp. | 1,586,000 | 2,518,176 | ||||||
King’s Town Bank Co., Ltd. | 2,288,000 | 2,502,356 | ||||||
Ledlink Optics, Inc. | 567,161 | 917,975 | ||||||
Novatek Microelectronics Corp. | �� | 617,000 | 3,193,629 | |||||
On-Bright Electronics, Inc. | 144,900 | 756,904 | ||||||
Polyronics Tech Corp. | 1,383,000 | 3,065,003 | ||||||
Richtek Technology Corp. | 190,000 | 916,848 | ||||||
Silergy Corp. | 558,422 | 3,872,835 | ||||||
Sinmag Equipment Corp. | 762,660 | 4,893,379 | ||||||
Solidwizard Technology Co., Ltd. | 520,000 | 2,137,087 | ||||||
Sporton International, Inc. | 1,149,000 | 5,568,191 | ||||||
St. Shine Optical Co., Ltd. | 98,000 | 1,721,658 | ||||||
Test Research, Inc. | 1,735,000 | 2,832,856 | ||||||
TSC Auto ID Technology Co., Ltd. | 278,000 | 2,076,531 | ||||||
UDE Corp. | 1,819,000 | 4,886,182 | ||||||
Voltronic Power Technology Corp. | 315,020 | 2,544,061 | ||||||
|
| |||||||
| 53,550,151 | ||||||||
|
| |||||||
Thailand (1.88%) | ||||||||
Beauty Community PCL(a) | 1,997,200 | 1,931,615 | ||||||
Jubilee Enterprise PCL | 840,200 | 1,052,167 | ||||||
LPN Development PCL | 5,007,100 | 3,829,720 | ||||||
Mega Lifesciences PCL | 330,800 | 187,942 | ||||||
Nok Airlines PCL | 235,300 | 104,733 | ||||||
Premier Marketing PCL | 3,731,500 | 1,105,053 | ||||||
|
| |||||||
| 8,211,230 | ||||||||
|
| |||||||
Turkey (2.41%) | ||||||||
Albaraka Turk Katilim Bankasi AS | 2,072,290 | 1,463,323 | ||||||
EGE Seramik Sanayi ve Ticaret AS | 1,312,061 | 2,106,495 | ||||||
Emlak Konut Gayrimenkul Yatirim Ortakligi AS, REIT | 1,079,100 | 1,212,036 | ||||||
Is Girisim Sermayesi Yatirim Ortakligi AS | 904,559 | 891,271 | ||||||
Pegasus Hava Tasimaciligi AS(a) | 57,700 | 741,897 | ||||||
Pinar SUT Mamulleri Sanayii AS | 223,646 | 2,153,296 | ||||||
TAV Havalimanlari Holding AS | 79,100 | 663,575 | ||||||
See Notes to Financial Statements.
16 |
1.855.377.7325 | www.GrandeurPeakGlobal.com |
Table of Contents
| Grandeur Peak Emerging Markets Opportunities Fund | Portfolio of Investments | |
October 31, 2014 (Unaudited) |
| Shares | Value (Note 2) | |||||||
| ||||||||
Turkey (continued) | ||||||||
Uyum Gida Ihtiyac Maddeleri Sanayi ve Ticaret AS(a) | 1,423,772 | $ | 1,254,219 | |||||
|
| |||||||
| 10,486,112 | ||||||||
|
| |||||||
United Arab Emirates (0.09%) | ||||||||
Aramex PJSC | 451,125 | 388,117 | ||||||
|
| |||||||
United States (0.37%) | ||||||||
First Cash Financial Services, Inc.(a) | 27,525 | 1,626,177 | ||||||
|
| |||||||
Vietnam (0.27%) | ||||||||
Vietnam Dairy Products JSC | 234,816 | 1,158,362 | ||||||
|
| |||||||
TOTAL COMMON STOCKS (Cost $377,821,742) | 395,797,501 | |||||||
|
| |||||||
PREFERRED STOCKS (0.44%) |
| |||||||
Brazil (0.44%) | ||||||||
Banco ABC Brasil SA | 342,104 | 1,901,115 | ||||||
|
| |||||||
TOTAL PREFERRED STOCKS (Cost $1,774,087) |
| 1,901,115 | ||||||
|
| |||||||
WARRANTS (0.00%) | ||||||||
Malaysia (0.00%) | ||||||||
CB Industrial Product Holding Bhd, Strike Price 2.40 MYR, Expires 11/06/2019(c) | 466,400 | 0 | ||||||
|
| |||||||
TOTAL WARRANTS (Cost $0) | 0 | |||||||
|
| |||||||
TOTAL INVESTMENTS (91.24%) (Cost $379,595,829) |
| $ | 397,698,616 | |||||
Assets In Excess Of Other Liabilities (8.76%) |
| 38,200,203 | ||||||
|
| |||||||
NET ASSETS (100.00%) | $ | 435,898,819 | ||||||
|
| |||||||
| (a) | Non-Income Producing Security. |
| (b) | Security was purchased pursuant to Regulation S under the Securities Act of 1933, which exempts securities offered and sold outside of the United States from registration. Such security cannot be sold in the United States without either an effective registration statement filed pursuant to the Securities Act of 1933, or pursuant to an exemption from registration. The security has been deemed liquid under guidelines approved by the Fund’s Board of Trustees. As of October 31, 2014, the aggregate market value of those securities was $1,608,540, representing 0.37% of net assets. |
| (c) | Fair valued security under the procedures approved by the Fund’s Board of Trustees. |
Common Abbreviations:
ADR - American Depositary Receipt.
AS - Aktieselskab is the Danish term for a stock-based corporation.
Bhd - Berhad is the Malaysian term for public limited company.
GDR - Global Depositary Receipt.
JSC - Joint Stock Company.
LP - Limited Partnership
Ltd. - Limited.
PCL - Public Company Limited.
PJSC - Public Joint Stock Company.
PLC - Public Limited Company.
REIT - Real Estate Investment Trust.
| SA | - Generally designates corporations in various countries, mostly those employing the civil law. |
SAB de CV - A variable capital company.
| Tbk | PT - Terbuka Perseroan Terbatas is an Indonesian term for a limited liability company. |
Currency Abbreviations:
MYR - Malaysian Ringgit
Holdings are subject to change.
For Fund compliance purposes, the Fund’s geographical classifications refer to any one or more of the country sub-classifications used by one or more widely recognized market indexes or ratings group indexes, and/or as defined by Fund management. This definition may not apply for purposes of this report, which may combine sub-classifications for reporting ease. Geographical regions are shown as a percentage of net assets.
See Notes to Financial Statements.
Semi-Annual Report | October 31, 2014 |
17 |
Table of Contents
| Grandeur Peak Global Opportunities Fund | Portfolio of Investments | |
October 31, 2014 (Unaudited) |
| Value | ||||||||
| Shares | (Note 2) | |||||||
| ||||||||
COMMON STOCKS (98.37%) | ||||||||
Australia (1.80%) | ||||||||
ALS, Ltd. | 214,337 | $ | 1,061,483 | |||||
Countplus, Ltd. | 315,836 | 308,510 | ||||||
CTI Logistics, Ltd. | 1,421,632 | 2,152,152 | ||||||
Magellan Financial Group, Ltd. | 760,564 | 9,028,741 | ||||||
|
| |||||||
| 12,550,886 | ||||||||
|
| |||||||
Austria (0.55%) | ||||||||
Palfinger AG | 164,221 | 3,827,756 | ||||||
|
| |||||||
Belgium (1.54%) | ||||||||
Melexis NV | 236,034 | 10,765,119 | ||||||
|
| |||||||
Brazil (2.61%) | ||||||||
Banco Daycoval SA | 1,233,600 | 4,487,844 | ||||||
CETIP SA - Mercados Organizados | 549,282 | 6,960,513 | ||||||
Grazziotin SA | 43,600 | 326,683 | ||||||
Tegma Gestao Logistica | 418,600 | 3,074,587 | ||||||
Valid Solucoes SA | 211,000 | 3,387,377 | ||||||
|
| |||||||
| 18,237,004 | ||||||||
|
| |||||||
Britain (7.46%) | ||||||||
Abcam PLC | 339,553 | 2,175,280 | ||||||
blinkx PLC(a) | 2,586,394 | 1,163,898 | ||||||
Bovis Homes Group PLC | 178,143 | 2,405,858 | ||||||
Brammer PLC | 399,279 | 2,071,062 | ||||||
Clinigen Group PLC | 1,574,144 | 11,759,746 | ||||||
Diploma PLC | 169,900 | 1,890,284 | ||||||
EMIS Group PLC | 378,117 | 4,536,533 | ||||||
Halma PLC | 80,100 | 799,228 | ||||||
Hunting PLC | 222,000 | 2,614,943 | ||||||
IG Group Holdings PLC | 556,800 | 5,366,111 | ||||||
Premier Oil PLC | 756,808 | 3,125,066 | ||||||
Robert Walters PLC | 140,483 | 648,907 | ||||||
RPS Group PLC | 2,468,284 | 9,267,176 | ||||||
Ted Baker PLC | 32,479 | 1,014,172 | ||||||
Ultra Electronics Holdings PLC | 116,650 | 3,262,139 | ||||||
|
| |||||||
| 52,100,403 | ||||||||
|
| |||||||
Canada (2.11%) | ||||||||
Halogen Software, Inc.(a) | 115,600 | 923,118 | ||||||
Home Capital Group, Inc. | 164,928 | 7,905,071 | ||||||
Richelieu Hardware, Ltd. | 73,555 | 3,489,629 | ||||||
Stantec, Inc. | 38,464 | 2,437,083 | ||||||
|
| |||||||
| 14,754,901 | ||||||||
|
| |||||||
China (6.28%) | ||||||||
China Medical System Holdings, Ltd. | 3,703,000 | 6,827,213 | ||||||
| Value | ||||||||
| Shares | (Note 2) | |||||||
| ||||||||
China (continued) | ||||||||
Dongpeng Holdings Co., Ltd. | 13,489,000 | $ | 4,948,948 | |||||
Far East Horizon, Ltd. | 4,895,000 | 4,552,634 | ||||||
Labixiaoxin Snacks Group, Ltd.(a) | 6,633,000 | 889,515 | ||||||
Le Saunda Holdings, Ltd. | 4,653,200 | 2,341,445 | ||||||
Man Wah Holdings, Ltd. | 6,325,400 | 9,464,000 | ||||||
Mindray Medical International, Ltd., ADR | 34,825 | 1,014,801 | ||||||
Noah Holdings, Ltd., Sponsored ADR(a) | 54,900 | 900,360 | ||||||
O2Micro International, Ltd., ADR(a) | 530,892 | 1,040,548 | ||||||
Pacific Online, Ltd. | 3,298,853 | 1,787,850 | ||||||
Sihuan Pharmaceutical Holdings Group, Ltd. | 3,768,000 | 3,008,750 | ||||||
SPT Energy Group, Inc. | 7,000,000 | 2,205,323 | ||||||
Tao Heung Holdings, Ltd. | 1,861,300 | 981,331 | ||||||
Tsui Wah Holdings, Ltd. | 2,809,000 | 1,061,729 | ||||||
WuXi PharmaTech Cayman, Inc., ADR(a) | 75,500 | 2,846,350 | ||||||
|
| |||||||
| 43,870,797 | ||||||||
|
| |||||||
Colombia (1.24%) | ||||||||
Gran Tierra Energy, Inc.(a) | 884,775 | 4,034,574 | ||||||
Parex Resources, Inc.(a) | 507,300 | 4,649,669 | ||||||
|
| |||||||
| 8,684,243 | ||||||||
|
| |||||||
France (1.70%) | ||||||||
Alten SA | 8,953 | 382,947 | ||||||
Argan SA, REIT | 38,700 | 848,695 | ||||||
Audika Groupe | 75,200 | 1,106,847 | ||||||
Esker SA | 31,547 | 695,436 | ||||||
Infotel SA | 27,620 | 692,808 | ||||||
Medicrea International(a) | 167,370 | 1,856,194 | ||||||
MGI Digital Graphic Technology(a) | 39,250 | 1,266,561 | ||||||
Neurones | 45,508 | 762,713 | ||||||
Prodware(a) | 199,300 | 1,577,488 | ||||||
SoluCom | 29,356 | 1,364,814 | ||||||
Thermador Groupe | 14,473 | 1,350,286 | ||||||
|
| |||||||
| 11,904,789 | ||||||||
|
| |||||||
Georgia (0.71%) | ||||||||
Bank of Georgia Holdings PLC | 120,400 | 4,937,897 | ||||||
|
| |||||||
Germany (3.07%) | ||||||||
Bertrandt AG | 42,019 | 5,500,291 | ||||||
ElringKlinger AG | 119,051 | 3,641,519 | ||||||
Nexus AG | 160,092 | 2,453,565 | ||||||
Norma Group SE | 43,068 | 2,018,768 | ||||||
See Notes to Financial Statements.
18 |
1.855.377.7325 | www.GrandeurPeakGlobal.com |
Table of Contents
| Grandeur Peak Global Opportunities Fund | Portfolio of Investments | |
October 31, 2014 (Unaudited) |
| Value | ||||||||
| Shares | (Note 2) | |||||||
| ||||||||
Germany (continued) | ||||||||
Patrizia Immobilien AG(a) | 202,511 | $ | 2,737,868 | |||||
Softing AG | 75,599 | 1,385,653 | ||||||
Wirecard AG | 104,085 | 3,734,487 | ||||||
|
| |||||||
| 21,472,151 | ||||||||
|
| |||||||
Hong Kong (1.06%) | ||||||||
ASR Holdings, Ltd. | 5,335,200 | 811,788 | ||||||
International Housewares Retail Co., Ltd. | 4,580,000 | 1,258,094 | ||||||
Value Partners Group, Ltd. | 4,970,000 | 3,745,619 | ||||||
Vitasoy International Holdings, Ltd. | 1,135,483 | 1,564,348 | ||||||
|
| |||||||
| 7,379,849 | ||||||||
|
| |||||||
India (7.65%) | ||||||||
AIA Engineering, Ltd. | 38,400 | 586,857 | ||||||
Ajanta Pharma, Ltd. | 230,758 | 7,138,653 | ||||||
Bajaj Corp., Ltd. | 287,440 | 1,331,030 | ||||||
Bajaj Finance, Ltd. | 76,475 | 3,491,828 | ||||||
City Union Bank, Ltd. | 895,267 | 1,237,697 | ||||||
Credit Analysis & Research, Ltd. | 134,700 | 2,932,134 | ||||||
Crisil, Ltd. | 57,500 | 1,709,115 | ||||||
eClerx Services, Ltd. | 131,800 | 2,788,729 | ||||||
Glenmark Pharmaceuticals, Ltd. | 414,000 | 4,847,062 | ||||||
Hinduja Global Solutions, Ltd. | 297,900 | 3,279,318 | ||||||
Infotech Enterprises, Ltd. | 359,116 | 2,808,299 | ||||||
Ipca Laboratories, Ltd. | 213,500 | 2,542,809 | ||||||
Jammu & Kashmir Bank, Ltd. | 955,000 | 2,163,682 | ||||||
Kolte-Patil Developers, Ltd. | 614,932 | 1,883,688 | ||||||
KPIT Technologies, Ltd. | 860,350 | 2,324,103 | ||||||
Mahindra & Mahindra Financial Services, Ltd. | 323,700 | 1,546,510 | ||||||
MT Educare, Ltd. | 517,689 | 1,133,939 | ||||||
Persistent Systems, Ltd. | 125,100 | 2,647,984 | ||||||
Poly Medicure, Ltd. | 18,534 | 248,911 | ||||||
Supreme Industries, Ltd. | 293,800 | 2,870,053 | ||||||
Vaibhav Global, Ltd.(a) | 151,300 | 2,034,665 | ||||||
Vakrangee Software, Ltd. | 632,400 | 1,312,085 | ||||||
Vesuvius India, Ltd. | 53,365 | 606,136 | ||||||
|
| |||||||
| 53,465,287 | ||||||||
|
| |||||||
Indonesia (3.19%) | ||||||||
Arwana Citramulia Tbk PT | 48,263,300 | 3,654,298 | ||||||
Astra Graphia Tbk PT | 9,349,400 | 1,716,729 | ||||||
Bank Negara Indonesia Persero Tbk PT | 6,496,000 | 3,201,652 | ||||||
Bank Tabungan Pensiunan Nasional Tbk PT(a) | 2,139,100 | 748,972 | ||||||
| Value | ||||||||
| Shares | (Note 2) | |||||||
| ||||||||
Indonesia (continued) | ||||||||
Express Transindo Utama Tbk PT | 17,548,500 | $ | 1,692,504 | |||||
Lippo Cikarang Tbk PT(a) | 2,069,000 | 1,456,018 | ||||||
Panin Sekuritas Tbk PT | 3,318,800 | 1,407,435 | ||||||
Selamat Sempurna Tbk PT | 12,987,000 | 4,830,195 | ||||||
Tempo Scan Pacific Tbk PT | 10,915,000 | 2,576,032 | ||||||
Ultrajaya Milk Industry & Trading Co. Tbk PT | 3,254,500 | 1,029,870 | ||||||
|
| |||||||
| 22,313,705 | ||||||||
|
| |||||||
Ireland (0.42%) | ||||||||
Beazley PLC | 700,000 | 2,940,138 | ||||||
|
| |||||||
Israel (0.28%) | ||||||||
Caesarstone Sdot Yam, Ltd. | 22,800 | 1,273,608 | ||||||
Hamlet Israel-Canada, Ltd.(a) | 75,283 | 700,643 | ||||||
|
| |||||||
| 1,974,251 | ||||||||
|
| |||||||
Japan (3.75%) | ||||||||
AIT Corp. | 329,200 | 2,389,558 | ||||||
Arcland Service Co., Ltd. | 53,700 | 1,647,486 | ||||||
Benefit One, Inc. | 213,500 | 1,898,430 | ||||||
CMIC Co., Ltd. | 96,020 | 1,463,251 | ||||||
Future Architect, Inc. | 276,100 | 1,579,104 | ||||||
GCA Savvian Corp. | 292,800 | 3,145,249 | ||||||
Mamezou Holdings Co., Ltd. | 47,500 | 298,786 | ||||||
Monogatari Corp. | 82,600 | 2,670,523 | ||||||
Prestige International, Inc. | 34,500 | 298,281 | ||||||
Shaklee Global Group, Inc.(a) | 11,000 | 385,845 | ||||||
SK Kaken Co., Ltd. | 39,000 | 2,982,506 | ||||||
Syuppin Co., Ltd. | 104,400 | 1,851,318 | ||||||
Trancom Co., Ltd. | 133,870 | 5,594,384 | ||||||
|
| |||||||
| 26,204,721 | ||||||||
|
| |||||||
Luxembourg (0.62%) | ||||||||
L’Occitane International SA | 1,843,753 | 4,353,514 | ||||||
|
| |||||||
Malaysia (2.21%) | ||||||||
AEON Credit Service M Bhd | 686,480 | 3,285,470 | ||||||
Berjaya Food Bhd | 1,273,500 | 1,095,692 | ||||||
JobStreet Corp. Bhd | 411,100 | 326,111 | ||||||
Kossan Rubber Industries | 1,342,800 | 1,878,275 | ||||||
My EG Services Bhd | 4,107,500 | 5,019,819 | ||||||
Padini Holdings Bhd | 6,077,650 | 3,401,178 | ||||||
Uzma Bhd(a) | 420,000 | 440,773 | ||||||
|
| |||||||
| 15,447,318 | ||||||||
|
| |||||||
Mexico (0.52%) | ||||||||
Credito Real SAB de CV | 404,700 | 1,038,328 | ||||||
See Notes to Financial Statements.
Semi-Annual Report | October 31, 2014 |
19 |
Table of Contents
| Grandeur Peak Global Opportunities Fund | Portfolio of Investments | |
October 31, 2014 (Unaudited) |
| Value | ||||||||
| Shares | (Note 2) | |||||||
| ||||||||
Mexico (continued) | ||||||||
Genomma Lab Internacional SAB de CV, Class B(a) | 1,025,400 | $ | 2,597,337 | |||||
|
| |||||||
| 3,635,665 | ||||||||
|
| |||||||
Netherlands (0.37%) | ||||||||
Aalberts Industries NV | 96,200 | 2,564,283 | ||||||
|
| |||||||
Norway (0.03%) | ||||||||
Zalaris ASA(a) | 42,100 | 193,098 | ||||||
|
| |||||||
Philippines (1.04%) | ||||||||
Pepsi-Cola Products | ||||||||
Philippines, Inc.(a) | 22,499,900 | 2,341,909 | ||||||
Security Bank Corp. | 1,530,640 | 4,901,739 | ||||||
|
| |||||||
| 7,243,648 | ||||||||
|
| |||||||
Poland (0.10%) | ||||||||
Wawel SA | 2,456 | 671,471 | ||||||
|
| |||||||
Singapore (1.44%) | ||||||||
ARA Asset Management, Ltd. | 1,582,888 | 2,109,932 | ||||||
CSE Global, Ltd. | 4,531,250 | 2,380,784 | ||||||
Petra Foods, Ltd. | 1,333,300 | 3,954,132 | ||||||
Riverstone Holdings, Ltd. | 2,133,600 | 1,603,885 | ||||||
|
| |||||||
| 10,048,733 | ||||||||
|
| |||||||
South Africa (1.34%) | ||||||||
Clicks Group, Ltd. | 347,649 | 2,367,093 | ||||||
EOH Holdings, Ltd. | 153,300 | 1,495,981 | ||||||
Italtile, Ltd. | 829,366 | 698,454 | ||||||
MiX Telematics, Ltd., Sponsored ADR(a) | 117,000 | 1,042,470 | ||||||
Super Group, Ltd.(a) | 1,309,307 | 3,749,111 | ||||||
|
| |||||||
| 9,353,109 | ||||||||
|
| |||||||
South Korea (4.09%) | ||||||||
Duksan Hi-Metal Co., Ltd.(a) | 100,600 | 1,013,927 | ||||||
Global Display Co., Ltd. | 191,091 | 1,160,595 | ||||||
Hanssem Co., Ltd. | 25,260 | 3,010,900 | ||||||
Hy-Lok Corp. | 259,250 | 7,080,603 | ||||||
ISC Co., Ltd. | 137,172 | 5,021,189 | ||||||
Koh Young Technology, Inc. | 97,281 | 3,002,809 | ||||||
KONA I Co., Ltd. | 84,600 | 3,453,853 | ||||||
LEENO Industrial, Inc. | 89,000 | 3,544,136 | ||||||
LF Corp. | 40,350 | 1,272,680 | ||||||
|
| |||||||
| 28,560,692 | ||||||||
|
| |||||||
Sweden (2.86%) | ||||||||
AddTech AB, Class B | 212,427 | 3,011,001 | ||||||
Beijer Alma AB | 95,000 | 2,212,848 | ||||||
| Value | ||||||||
| Shares | (Note 2) | |||||||
| ||||||||
Sweden (continued) | ||||||||
Bufab Holding AB(a) | 698,300 | $ | 5,035,151 | |||||
Indutrade AB | 62,400 | 2,519,810 | ||||||
Moberg Pharma AB(a) | 245,880 | 1,048,898 | ||||||
Nibe Industrier AB, Class B | 108,600 | 2,882,708 | ||||||
Opus Group AB | 2,135,278 | 3,241,495 | ||||||
|
| |||||||
| 19,951,911 | ||||||||
|
| |||||||
Switzerland (0.65%) | ||||||||
VZ Holding AG | 27,475 | 4,526,100 | ||||||
|
| |||||||
Taiwan (4.74%) | ||||||||
ASPEED Technology, Inc. | 217,698 | 1,664,250 | ||||||
Cub Elecparts, Inc. | 193,778 | 2,044,309 | ||||||
Novatek Microelectronics Corp. | 569,000 | 2,945,178 | ||||||
On-Bright Electronics, Inc. | 337,900 | 1,765,065 | ||||||
Polyronics Tech Corp. | 1,938,200 | 4,295,436 | ||||||
Silergy Corp. | 397,852 | 2,759,231 | ||||||
Sinmag Equipment Corp. | 197,120 | 1,264,761 | ||||||
Sporton International, Inc. | 1,364,347 | 6,611,789 | ||||||
Test Research, Inc. | 1,324,708 | 2,162,943 | ||||||
TSC Auto ID Technology Co., Ltd. | 132,000 | 985,979 | ||||||
UDE Corp. | 1,599,000 | 4,295,221 | ||||||
Voltronic Power Technology Corp. | 282,100 | 2,278,204 | ||||||
|
| |||||||
| 33,072,366 | ||||||||
|
| |||||||
Thailand (0.85%) | ||||||||
LPN Development PCL | 4,770,000 | 3,648,372 | ||||||
Mega Lifesciences PCL | 186,400 | 105,902 | ||||||
Premier Marketing PCL | 7,328,000 | 2,170,127 | ||||||
|
| |||||||
| 5,924,401 | ||||||||
|
| |||||||
Turkey (0.66%) | ||||||||
Albaraka Turk Katilim Bankasi AS | 2,701,883 | 1,907,903 | ||||||
EGE Seramik Sanayi ve Ticaret AS | 952,000 | 1,528,422 | ||||||
Emlak Konut Gayrimenkul Yatirim Ortakligi AS, REIT | 1,053,000 | 1,182,720 | ||||||
|
| |||||||
| 4,619,045 | ||||||||
|
| |||||||
United Arab Emirates (0.09%) | ||||||||
Aramex PJSC | 755,100 | 649,637 | ||||||
|
| |||||||
United States (31.33%) | ||||||||
Abaxis, Inc. | 67,530 | 3,556,130 | ||||||
ABIOMED, Inc.(a) | 92,125 | 3,020,779 | ||||||
Alamo Group, Inc. | 4,550 | 194,922 | ||||||
Amsurg Corp.(a) | 54,430 | 2,939,764 | ||||||
See Notes to Financial Statements.
20 |
1.855.377.7325 | www.GrandeurPeakGlobal.com |
Table of Contents
| Grandeur Peak Global Opportunities Fund | Portfolio of Investments | |
October 31, 2014 (Unaudited) |
| Value | ||||||||
| Shares | (Note 2) | |||||||
| ||||||||
United States (continued) | ||||||||
Aratana Therapeutics, Inc.(a) | 137,600 | $ | 1,541,120 | |||||
BioDelivery Sciences International, Inc.(a) | 52,575 | 914,805 | ||||||
Cardica, Inc.(a) | 359,695 | 354,156 | ||||||
Cardtronics, Inc.(a) | 57,200 | 2,195,908 | ||||||
Cempra, Inc.(a) | 276,300 | 3,757,680 | ||||||
Chase Corp. | 5,552 | 199,150 | ||||||
Covance, Inc.(a) | 33,732 | 2,695,187 | ||||||
CRA International, Inc.(a) | 78,873 | 2,366,190 | ||||||
Diamond Hill Investment Group, Inc. | 34,300 | 4,595,857 | ||||||
EPAM Systems, Inc.(a) | 105,050 | 5,015,087 | ||||||
ExlService Holdings, Inc.(a) | 71,700 | 2,006,883 | ||||||
First Cash Financial Services, Inc.(a) | 68,700 | 4,058,796 | ||||||
First Republic Bank | 408,875 | 20,824,004 | ||||||
Fresh Market, Inc.(a) | 102,825 | 3,774,706 | ||||||
Genpact, Ltd.(a) | 106,300 | 1,865,565 | ||||||
Gentex Corp. | 156,100 | 5,110,714 | ||||||
Geospace Technologies Corp.(a) | 51,500 | 1,585,685 | ||||||
Grand Canyon Education, Inc.(a) | 60,475 | 2,896,752 | ||||||
Inphi Corp.(a) | 264,750 | 4,098,330 | ||||||
Integrated Silicon Solution, Inc. | 254,100 | 3,450,678 | ||||||
IPC The Hospitalist Co., | 85,575 | 3,565,054 | ||||||
Jones Energy, Inc., | 188,761 | 2,333,086 | ||||||
K2M Group Holdings, Inc.(a) | 185,000 | 2,978,500 | ||||||
Knight Transportation, Inc. | 301,795 | 8,830,522 | ||||||
LGI Homes, Inc.(a) | 295,525 | 5,739,095 | ||||||
Littelfuse, Inc. | 44,100 | 4,301,514 | ||||||
Manitex International, Inc.(a) | 221,355 | 2,530,088 | ||||||
Manning & Napier, Inc. | 61,025 | 966,636 | ||||||
MarketAxess Holdings, Inc. | 78,400 | 5,068,560 | ||||||
MaxLinear, Inc., Class A(a) | 533,275 | 3,780,920 | ||||||
Mesa Laboratories, Inc. | 2,395 | 182,906 | ||||||
Microchip Technology, Inc. | 108,395 | 4,672,908 | ||||||
Navigant Consulting, Inc.(a) | 98,910 | 1,522,225 | ||||||
NorthStar Asset Management Group, Inc. | 107,550 | 1,948,806 | ||||||
NorthStar Realty Finance Corp., REIT | 132,525 | 2,462,314 | ||||||
Nu Skin Enterprises, Inc., Class A | 21,800 | 1,151,694 | ||||||
Perficient, Inc.(a) | 236,300 | 3,917,854 | ||||||
Pericom Semiconductor Corp.(a) | 359,712 | 3,931,652 | ||||||
Power Integrations, Inc. | 95,000 | 4,784,200 | ||||||
| Value | ||||||||
| Shares | (Note 2) | |||||||
| ||||||||
United States (continued) | ||||||||
Q2 Holdings, Inc.(a) | 54,900 | $ | 828,441 | |||||
Quaker Chemical Corp. | 9,725 | 798,228 | ||||||
Redwood Trust, Inc., REIT | 133,800 | 2,514,102 | ||||||
Resources Connection, Inc. | 291,850 | 4,514,919 | ||||||
Roadrunner Transportation Systems, Inc.(a) | 591,000 | 12,180,510 | ||||||
SEI Investments Co. | 54,200 | 2,095,372 | ||||||
Signature Bank(a) | 23,350 | 2,828,386 | ||||||
Silicon Laboratories, Inc.(a) | 61,415 | 2,799,910 | ||||||
STAAR Surgical Co.(a) | 487,375 | 4,664,179 | ||||||
Synaptics, Inc.(a) | 52,175 | 3,570,335 | ||||||
Synergetics USA, Inc.(a) | 171,113 | 607,451 | ||||||
Syntel, Inc.(a) | 50,400 | 4,365,144 | ||||||
Transcat, Inc.(a) | 14,102 | 148,212 | ||||||
TriMas Corp.(a) | 116,600 | 3,691,556 | ||||||
TriNet Group, Inc.(a) | 35,700 | 1,068,144 | ||||||
TubeMogul, Inc.(a) | 103,025 | 1,601,009 | ||||||
Universal Truckload Services, Inc. | 387,457 | 10,197,868 | ||||||
Virtusa Corp.(a) | 110,900 | 4,544,682 | ||||||
Vocera Communications, | 75,525 | 781,684 | ||||||
Wesco Aircraft Holdings, | 268,225 | 4,760,994 | ||||||
Whitestone, REIT | 172,450 | 2,586,750 | ||||||
|
| |||||||
| 218,835,258 | ||||||||
|
| |||||||
Vietnam (0.01%) | ||||||||
DHG Pharmaceutical JSC | 7,440 | 32,865 | ||||||
|
| |||||||
TOTAL COMMON STOCKS (Cost $581,613,749) | 687,067,011 | |||||||
|
| |||||||
PREFERRED STOCKS (0.39%) | ||||||||
Brazil (0.39%) | ||||||||
Banco ABC Brasil SA | 490,158 | 2,723,869 | ||||||
|
| |||||||
TOTAL PREFERRED STOCKS (Cost $2,690,532) | 2,723,869 | |||||||
|
| |||||||
TOTAL INVESTMENTS (98.76%) (Cost $584,304,281) | $ | 689,790,880 | ||||||
Assets In Excess Of Other Liabilities (1.24%) |
| 8,684,689 | ||||||
|
| |||||||
NET ASSETS (100.00%) | $ | 698,475,569 | ||||||
|
| |||||||
| (a) | Non-Income Producing Security. |
See Notes to Financial Statements.
Semi-Annual Report | October 31, 2014 |
21 |
Table of Contents
| Grandeur Peak Global Opportunities Fund | Portfolio of Investments | |
October 31, 2014 (Unaudited) |
Common Abbreviations:
| AB | - Aktiebolag is the Swedish equivalent of the term corporation. |
| ADR | - American Depositary Receipt. |
| AG | - Aktiengesellschaft is a German term that refers to a corporation that is limited by shares, i.e., owned by shareholders. |
| AS | - Aktieselskab is the Danish term for a stock-based corporation. |
| ASA | - Allmennaksjeselskap is the Norwegian term for public limited company. |
| Bhd | - Berhad is the Malaysian term for public limited company. |
| JSC | - Joint Stock Company. |
| Ltd. | - Limited. |
| NV | - Naamloze Vennootschap is the Dutch term for a public limited liability corporation. |
| PCL | - Public Company Limited. |
| PJSC | - Public Joint Stock Company. |
| PLC | - Public Limited Company. |
| REIT | - Real Estate Investment Trust. |
| SA | - Generally designates corporations in various countries, mostly those employing the civil law. |
| SAB | de CV - A variable capital company. |
| SE | - A European Company which can operate on a Europe-wide basis and be governed by community law directly applicable in all member states. |
| Tbk | PT - Terbuka Perseroan Terbatas is an Indonesian term for a limited liability company. |
Holdings are subject to change.
For Fund compliance purposes, the Fund’s geographical classifications refer to any one or more of the country sub-classifications used by one or more widely recognized market indexes or ratings group indexes, and/or as defined by Fund management. This definition may not apply for purposes of this report, which may combine sub-classifications for reporting ease. Geographical regions are shown as a percentage of net assets.
See Notes to Financial Statements.
22 |
1.855.377.7325 | www.GrandeurPeakGlobal.com |
Table of Contents
| Grandeur Peak Global Reach Fund | Portfolio of Investments | |
October 31, 2014 (Unaudited) |
| Value | ||||||||
| Shares | (Note 2) | |||||||
COMMON STOCKS (89.60%) | ||||||||
Australia (2.13%) | ||||||||
ALS, Ltd. | 31,823 | $ | 157,600 | |||||
Austbrokers Holdings, Ltd. | 70,351 | 637,663 | ||||||
Beacon Lighting Group, Ltd. | 749,900 | 745,703 | ||||||
Countplus, Ltd. | 727,432 | 710,558 | ||||||
CTI Logistics, Ltd. | 296,611 | 449,028 | ||||||
LifeHealthcare Group, Ltd. | 140,900 | 282,118 | ||||||
Lycopodium, Ltd. | 80,800 | 114,205 | ||||||
Magellan Financial Group, Ltd. | 310,837 | 3,689,981 | ||||||
|
| |||||||
| 6,786,856 | ||||||||
|
| |||||||
Austria (0.11%) | ||||||||
Palfinger AG | 14,910 | 347,531 | ||||||
|
| |||||||
Belgium (0.37%) | ||||||||
Melexis NV | 25,785 | 1,176,011 | ||||||
|
| |||||||
Brazil (1.64%) | ||||||||
Banco Daycoval SA | 267,200 | 972,075 | ||||||
CETIP SA - Mercados Organizados | 173,788 | 2,202,245 | ||||||
Cia Hering | 10,000 | 100,883 | ||||||
Even Construtora e Incorporadora SA | 65,700 | 142,305 | ||||||
Grazziotin SA | 42,000 | 314,695 | ||||||
JSL SA | 49,900 | 273,676 | ||||||
Odontoprev SA | 121,000 | 437,043 | ||||||
Totvs SA | 19,300 | 281,303 | ||||||
Valid Solucoes SA | 30,100 | 483,223 | ||||||
|
| |||||||
| 5,207,448 | ||||||||
|
| |||||||
Britain (5.49%) | ||||||||
Abcam PLC | 178,089 | 1,140,892 | ||||||
Advanced Medical Solutions Group PLC | 226,395 | 427,352 | ||||||
Arrow Global Group PLC | 191,600 | 782,127 | ||||||
blinkx PLC(a) | 771,300 | 347,091 | ||||||
Bovis Homes Group PLC | 34,679 | 468,347 | ||||||
Brammer PLC | 88,000 | 456,456 | ||||||
Brit PLC(b)(c) | 157,800 | 636,357 | ||||||
Cambian Group PLC(a) | 214,000 | 777,224 | ||||||
Clinigen Group PLC | 481,656 | 3,598,243 | ||||||
Diploma PLC | 39,400 | 438,359 | ||||||
dotdigital group PLC | 811,500 | 374,776 | ||||||
EMIS Group PLC | 45,396 | 544,647 | ||||||
Foxtons Group PLC | 111,301 | 301,141 | ||||||
Halma PLC | 14,736 | 147,034 | ||||||
Hunting PLC | 28,800 | 339,236 | ||||||
IDOX PLC | 716,800 | 446,439 | ||||||
IG Group Holdings PLC | 241,500 | 2,327,435 | ||||||
ITE Group PLC | 74,900 | 204,362 | ||||||
| Value | ||||||||
| Shares | (Note 2) | |||||||
Britain (continued) | ||||||||
Ocado Group PLC(a) | 49,836 | $ | 198,517 | |||||
Premier Oil PLC | 83,858 | 346,272 | ||||||
RPS Group PLC | 282,849 | 1,061,957 | ||||||
Ted Baker PLC | 9,800 | 306,010 | ||||||
Topps Tiles PLC | 608,528 | 988,060 | ||||||
Tracsis PLC | 25,100 | 136,317 | ||||||
Ultra Electronics Holdings PLC | 10,750 | 300,626 | ||||||
WANdisco PLC(a) | 55,800 | 357,051 | ||||||
|
| |||||||
| 17,452,328 | ||||||||
|
| |||||||
Canada (1.55%) | ||||||||
Cipher Pharmaceuticals, Inc.(a) | 42,100 | 528,188 | ||||||
Halogen Software, Inc.(a) | 11,995 | 95,785 | ||||||
Home Capital Group, Inc. | 54,759 | 2,624,623 | ||||||
Mapan Energy, Ltd.(a)(d) | 422,300 | 487,104 | ||||||
Stantec, Inc. | 4,460 | 282,586 | ||||||
TransForce, Inc. | 37,296 | 912,007 | ||||||
|
| |||||||
| 4,930,293 | ||||||||
|
| |||||||
China (6.40%) | ||||||||
51job, Inc., ADR(a) | 9,900 | 303,930 | ||||||
AAC Technologies Holdings, Inc. | 50,000 | 299,939 | ||||||
Bolina Holding Co., Ltd. | 1,526,500 | 570,827 | ||||||
China Biologic Products, Inc.(a) | 9,075 | 546,769 | ||||||
China Lesso Group Holdings, Ltd. | 2,417,000 | 1,268,947 | ||||||
China Medical System Holdings, Ltd. | 546,000 | 1,006,659 | ||||||
China Pioneer Pharma Holdings, Ltd. | 1,063,000 | 1,010,841 | ||||||
China Shineway Pharmaceutical Group, Ltd. | 260,000 | 469,119 | ||||||
Dongpeng Holdings Co., Ltd. | 3,375,000 | 1,238,246 | ||||||
Far East Horizon, Ltd. | 1,799,900 | 1,674,012 | ||||||
Freetech Road Recycling Technology Holdings, Ltd. | 1,361,500 | 279,167 | ||||||
Hilong Holding, Ltd. | 430,000 | 139,721 | ||||||
Labixiaoxin Snacks Group, Ltd.(a) | 1,874,000 | 251,312 | ||||||
Le Saunda Holdings, Ltd. | 1,194,000 | 600,809 | ||||||
Man Wah Holdings, Ltd. | 2,997,300 | 4,484,530 | ||||||
Mindray Medical International, Ltd., ADR | 31,075 | 905,525 | ||||||
Noah Holdings, Ltd., Sponsored ADR(a) | 32,900 | 539,560 | ||||||
See Notes to Financial Statements.
Semi-Annual Report | October 31, 2014 |
23 |
Table of Contents
| Grandeur Peak Global Reach Fund | Portfolio of Investments | |
October 31, 2014 (Unaudited) |
| Value | ||||||||
| Shares | (Note 2) | |||||||
China (continued) | ||||||||
O2Micro International, Ltd., ADR(a) | 54,150 | $ | 106,134 | |||||
Pacific Online, Ltd. | 548,000 | 296,995 | ||||||
Phoenix New Media, Ltd., ADR(a) | 113,975 | 1,169,383 | ||||||
Sihuan Pharmaceutical Holdings Group, Ltd. | 707,000 | 564,540 | ||||||
SPT Energy Group, Inc. | 1,160,000 | 365,454 | ||||||
Tao Heung Holdings, Ltd. | 18,000 | 9,490 | ||||||
Tsui Wah Holdings, Ltd. | 2,124,000 | 802,817 | ||||||
WuXi PharmaTech Cayman, Inc., ADR(a) | 39,060 | 1,472,562 | ||||||
|
| |||||||
| 20,377,288 | ||||||||
|
| |||||||
Colombia (0.69%) | ||||||||
BBVA Colombia SA | 1,631,533 | 285,469 | ||||||
Gran Tierra Energy, Inc.(a) | 210,975 | 962,046 | ||||||
Parex Resources, Inc.(a) | 101,961 | 934,525 | ||||||
|
| |||||||
| 2,182,040 | ||||||||
|
| |||||||
Finland (0.13%) | ||||||||
BasWare OYJ | 6,612 | 331,778 | ||||||
Revenio Group OYJ | 5,550 | 94,860 | ||||||
|
| |||||||
| 426,638 | ||||||||
|
| |||||||
France (3.01%) | ||||||||
1000mercis | 4,350 | 218,102 | ||||||
Akka Technologies SA | 17,314 | 566,292 | ||||||
Alten SA | 15,200 | 650,150 | ||||||
Argan SA, REIT | 33,830 | 741,895 | ||||||
Audika Groupe | 7,200 | 105,975 | ||||||
Ausy(a) | 19,838 | 596,888 | ||||||
Esker SA | 34,409 | �� | 758,527 | |||||
Exel Industries SA, Class A | 5,358 | 303,221 | ||||||
GameLoft SE(a) | 66,290 | 340,592 | ||||||
Groupe Gorge | 35,876 | 827,676 | ||||||
ID Logistics Group(a) | 7,754 | 612,166 | ||||||
Infotel SA | 11,761 | 295,008 | ||||||
Medicrea International(a) | 78,969 | 875,795 | ||||||
MGI Digital Graphic Technology(a) | 24,519 | 791,206 | ||||||
Norbert Dentressangle SA | 3,366 | 491,997 | ||||||
Prodware(a) | 69,904 | 553,300 | ||||||
Rexel SA | 15,700 | 263,902 | ||||||
SoluCom | 9,733 | 452,505 | ||||||
Thermador Groupe | 1,460 | 136,213 | ||||||
|
| |||||||
| 9,581,410 | ||||||||
|
| |||||||
Georgia (0.78%) | ||||||||
Bank of Georgia Holdings PLC | 60,300 | 2,473,050 | ||||||
|
| |||||||
| Value | ||||||||
| Shares | (Note 2) | |||||||
Germany (2.68%) | ||||||||
2G Energy AG | 9,800 | $ | 293,658 | |||||
Bertrandt AG | 3,377 | 442,050 | ||||||
CANCOM SE | 11,900 | 488,447 | ||||||
Elmos Semiconductor AG | 43,453 | 777,856 | ||||||
ElringKlinger AG | 53,514 | 1,636,880 | ||||||
First Sensor AG(a) | 32,419 | 408,381 | ||||||
LPKF Laser & Electronics AG | 33,679 | 431,797 | ||||||
LS Telcom AG | 37,026 | 357,914 | ||||||
Nexus AG | 49,685 | 761,471 | ||||||
Norma Group SE | 11,160 | 523,113 | ||||||
Patrizia Immobilien AG(a) | 111,017 | 1,500,905 | ||||||
Softing AG | 16,200 | 296,930 | ||||||
Wirecard AG | 17,196 | 616,979 | ||||||
|
| |||||||
| 8,536,381 | ||||||||
|
| |||||||
Greece (0.50%) | ||||||||
Sarantis SA | 179,589 | 1,575,362 | ||||||
|
| |||||||
Hong Kong (1.55%) | ||||||||
ASR Holdings, Ltd. | 5,575,500 | 848,351 | ||||||
China South City Holdings, Ltd. | 973,000 | 440,692 | ||||||
International Housewares Retail Co., Ltd. | 1,696,000 | 465,879 | ||||||
Playmates Toys, Ltd. | 274,000 | 64,009 | ||||||
Value Partners Group, Ltd. | 2,044,000 | 1,540,452 | ||||||
Vitasoy International Holdings, Ltd. | 922,000 | 1,270,234 | ||||||
Wonderful Sky Financial Group Holdings, Ltd. | 1,579,000 | 293,127 | ||||||
|
| |||||||
| 4,922,744 | ||||||||
|
| |||||||
India (7.78%) | ||||||||
Accelya Kale Solutions, Ltd. | 12,300 | 163,446 | ||||||
AIA Engineering, Ltd. | 22,700 | 346,918 | ||||||
Ajanta Pharma, Ltd. | 31,629 | 978,464 | ||||||
Amara Raja Batteries, Ltd. | 59,300 | 632,757 | ||||||
Bajaj Corp., Ltd. | 35,000 | 162,072 | ||||||
Bajaj Finance, Ltd. | 27,400 | 1,251,077 | ||||||
Balkrishna Industries, Ltd. | 46,300 | 581,074 | ||||||
Biocon, Ltd. | 43,100 | 314,092 | ||||||
City Union Bank, Ltd. | 318,400 | 440,184 | ||||||
Container Corp. of India, Ltd. | 13,600 | 299,187 | ||||||
Credit Analysis & Research, Ltd. | 22,800 | 496,308 | ||||||
Crisil, Ltd. | 13,700 | 407,215 | ||||||
Dewan Housing Finance Corp., Ltd. | 92,400 | 554,613 | ||||||
eClerx Services, Ltd. | 12,900 | 272,949 | ||||||
Engineers India, Ltd. | 73,200 | 324,387 | ||||||
See Notes to Financial Statements.
24 |
1.855.377.7325 | www.GrandeurPeakGlobal.com |
Table of Contents
| Grandeur Peak Global Reach Fund | Portfolio of Investments | |
October 31, 2014 (Unaudited) |
| Value | ||||||||
| Shares | (Note 2) | |||||||
India (continued) | ||||||||
Glenmark Pharmaceuticals, Ltd. | 131,400 | $ | 1,538,416 | |||||
Granules India, Ltd. | 21,700 | 285,133 | ||||||
Hinduja Global Solutions, Ltd. | 102,500 | 1,128,332 | ||||||
IFGL Refractories, Ltd. | 108,100 | 338,002 | ||||||
Indag Rubber, Ltd. | 23,900 | 285,866 | ||||||
Infinite Computer Solutions, Ltd. | 97,724 | 284,519 | ||||||
Infotech Enterprises, Ltd. | 166,700 | 1,303,599 | ||||||
Ipca Laboratories, Ltd. | 78,400 | 933,753 | ||||||
Jammu & Kashmir Bank, Ltd. | 169,000 | 382,892 | ||||||
Karur Vysya Bank, Ltd. | 33,900 | 300,966 | ||||||
Kolte-Patil Developers, Ltd. | 252,200 | 772,551 | ||||||
KPIT Technologies, Ltd. | 227,600 | 614,826 | ||||||
La Opala RG, Ltd. | 92,505 | 528,363 | ||||||
Mahindra & Mahindra Financial Services, Ltd. | 63,130 | 301,610 | ||||||
Mayur Uniquoters, Ltd. | 61,571 | 440,742 | ||||||
MT Educare, Ltd. | 740,381 | 1,621,721 | ||||||
NIIT Technologies, Ltd. | 45,234 | 284,732 | ||||||
Persistent Systems, Ltd. | 38,816 | 821,616 | ||||||
PI Industries, Ltd. | 45,500 | 330,653 | ||||||
Poly Medicure, Ltd. | 40,687 | 546,425 | ||||||
Procter & Gamble Hygiene & Health Care, Ltd. | 1,000 | 87,917 | ||||||
Repco Home Finance, Ltd. | 70,300 | 557,924 | ||||||
Somany Ceramics, Ltd. | 48,000 | 245,797 | ||||||
Suprajit Engineering, Ltd. | 99,900 | 189,428 | ||||||
Supreme Industries, Ltd. | 38,000 | 371,212 | ||||||
Time Technoplast, Ltd. | 896,073 | 690,297 | ||||||
Vaibhav Global, Ltd.(a) | 105,200 | 1,414,717 | ||||||
Vakrangee Software, Ltd. | 144,500 | 299,804 | ||||||
Vesuvius India, Ltd. | 24,830 | 282,027 | ||||||
Vinati Organics, Ltd. | 24,400 | 170,184 | ||||||
V-Mart Retail, Ltd. | 18,567 | 165,597 | ||||||
|
| |||||||
| 24,744,364 | ||||||||
|
| |||||||
Indonesia (2.40%) | ||||||||
Astra Graphia Tbk PT | 847,000 | 155,525 | ||||||
Bank Negara Indonesia Persero Tbk PT | 2,389,500 | 1,177,702 | ||||||
Bank Tabungan Pensiunan Nasional Tbk PT(a) | 1,961,900 | 686,928 | ||||||
Bekasi Fajar Industrial Estate Tbk PT | 12,272,500 | 594,549 | ||||||
Express Transindo Utama Tbk PT | 7,321,500 | 706,139 | ||||||
Lippo Cikarang Tbk PT(a) | 452,500 | 318,438 | ||||||
Panin Sekuritas Tbk PT | 1,988,300 | 843,197 | ||||||
Selamat Sempurna Tbk PT | 5,140,900 | 1,912,031 | ||||||
| Value | ||||||||
| Shares | (Note 2) | |||||||
Indonesia (continued) | ||||||||
Tempo Scan Pacific Tbk PT | 3,623,300 | $ | 855,129 | |||||
Ultrajaya Milk Industry & Trading Co. Tbk PT | 1,251,500 | 396,031 | ||||||
|
| |||||||
| 7,645,669 | ||||||||
|
| |||||||
Ireland (0.74%) | ||||||||
Beazley PLC | 256,300 | 1,076,510 | ||||||
Irish Residential Properties, REIT PLC(a) | 954,147 | 1,285,365 | ||||||
|
| |||||||
| 2,361,875 | ||||||||
|
| |||||||
Israel (1.11%) | ||||||||
Caesarstone Sdot Yam, Ltd. | 5,715 | 319,240 | ||||||
Clicksoftware Technologies, Ltd.(a) | 90,150 | 640,065 | ||||||
Hamlet Israel-Canada, Ltd.(a) | 60,587 | 563,871 | ||||||
Magic Software Enterprises, Ltd. | 43,950 | 307,210 | ||||||
Sarin Technologies, Ltd. | 428,000 | 992,573 | ||||||
Silicom, Ltd. | 1,700 | 56,831 | ||||||
Wix.com, Ltd.(a) | 37,500 | 637,125 | ||||||
|
| |||||||
| 3,516,915 | ||||||||
|
| |||||||
Japan (3.59%) | ||||||||
ADJUVANT COSME JAPAN Co., Ltd. | 81,000 | 668,259 | ||||||
AIT Corp. | 41,200 | 299,058 | ||||||
Arcland Service Co., Ltd. | 23,400 | 717,899 | ||||||
Benefit One, Inc. | 31,400 | 279,207 | ||||||
Century Tokyo Leasing Corp. | 18,100 | 473,984 | ||||||
CMIC Co., Ltd. | 7,400 | 112,769 | ||||||
Daikokutenbussan Co. | 4,000 | 116,390 | ||||||
Future Architect, Inc. | 124,500 | 712,055 | ||||||
GCA Savvian Corp. | 82,300 | 884,064 | ||||||
Gurunavi, Inc. | 31,900 | 437,134 | ||||||
Hard Off Corp. Co., Ltd. | 35,500 | 288,942 | ||||||
Hiday Hidaka Corp. | 8,540 | 247,214 | ||||||
Komehyo Co., Ltd. | 16,200 | 375,935 | ||||||
Mamezou Holdings Co., Ltd. | 129,800 | 816,473 | ||||||
Monogatari Corp. | 29,200 | 944,059 | ||||||
Shaklee Global Group, Inc.(a) | 18,900 | 662,951 | ||||||
SK Kaken Co., Ltd. | 6,000 | 458,847 | ||||||
Syuppin Co., Ltd. | 92,300 | 1,636,750 | ||||||
Trancom Co., Ltd. | 27,000 | 1,128,321 | ||||||
WebCrew, Inc. | 30,000 | 174,104 | ||||||
|
| |||||||
| 11,434,415 | ||||||||
|
| |||||||
Luxembourg (0.70%) | ||||||||
Globant SA(a) | 47,825 | 618,855 | ||||||
See Notes to Financial Statements.
Semi-Annual Report | October 31, 2014 |
25 |
Table of Contents
| Grandeur Peak Global Reach Fund | Portfolio of Investments | |
October 31, 2014 (Unaudited) |
| Value | ||||||||
| Shares | (Note 2) | |||||||
Luxembourg (continued) | ||||||||
L’Occitane International SA | 678,000 | $ | 1,600,910 | |||||
|
| |||||||
| 2,219,765 | ||||||||
|
| |||||||
Malaysia (1.07%) | ||||||||
AEON Credit Service M Bhd | 202,500 | 969,158 | ||||||
Berjaya Food Bhd | 396,300 | 340,968 | ||||||
CB Industrial Product Holding Bhd | 589,400 | 431,799 | ||||||
Freight Management Holdings Bhd | 238,900 | 122,751 | ||||||
JobStreet Corp. Bhd | 62,600 | 49,659 | ||||||
Kossan Rubber Industries | 436,100 | 610,006 | ||||||
My EG Services Bhd | 545,400 | 666,539 | ||||||
Padini Holdings Bhd | 410,500 | 229,724 | ||||||
|
| |||||||
| 3,420,604 | ||||||||
|
| |||||||
Mexico (0.81%) | ||||||||
Credito Real SAB de CV | 425,600 | 1,091,951 | ||||||
Genomma Lab Internacional SAB de CV, Class B(a) | 428,800 | 1,086,150 | ||||||
Medica Sur SAB de CV, Series B | 98,062 | 414,349 | ||||||
|
| |||||||
| 2,592,450 | ||||||||
|
| |||||||
Netherlands (0.68%) | ||||||||
Aalberts Industries NV | 71,255 | 1,899,355 | ||||||
Brunel International NV | 6,880 | 154,642 | ||||||
Nostrum Oil & Gas LP, PLC(a) | 8,700 | 94,491 | ||||||
|
| |||||||
| 2,148,488 | ||||||||
|
| |||||||
Norway (0.05%) | ||||||||
Medistim ASA | 29,350 | 118,793 | ||||||
Zalaris ASA(a) | 11,400 | 52,288 | ||||||
|
| |||||||
| 171,081 | ||||||||
|
| |||||||
Philippines (1.44%) | ||||||||
Concepcion Industrial Corp. | 643,600 | 573,789 | ||||||
Pepsi-Cola Products Philippines, Inc.(a) | 8,752,100 | 910,965 | ||||||
Puregold Price Club, Inc. | 593,700 | 457,962 | ||||||
RFM Corp. | 1,727,000 | 191,991 | ||||||
Robinsons Land Corp. | 1,074,300 | 587,678 | ||||||
Security Bank Corp. | 576,700 | 1,846,831 | ||||||
|
| |||||||
| 4,569,216 | ||||||||
|
| |||||||
Poland (1.01%) | ||||||||
Ac SA | 28,532 | 271,915 | ||||||
KRUK SA(a) | 33,100 | 1,059,174 | ||||||
Magellan SA(a) | 18,916 | 438,583 | ||||||
Wawel SA | 3,062 | 837,151 | ||||||
| Value | ||||||||
| Shares | (Note 2) | |||||||
Poland (continued) | ||||||||
Work Service SA(a) | 106,400 | $ | 611,690 | |||||
|
| |||||||
| 3,218,513 | ||||||||
|
| |||||||
Russia (0.03%) | ||||||||
MD Medical Group Investments PLC, GDR(c) | 11,855 | 98,397 | ||||||
|
| |||||||
Singapore (1.38%) | ||||||||
ARA Asset Management, Ltd. | 260,000 | 346,570 | ||||||
CSE Global, Ltd. | 1,958,000 | 1,028,762 | ||||||
Midas Holdings, Ltd. | 297,000 | 75,181 | ||||||
Petra Foods, Ltd. | 666,700 | 1,977,214 | ||||||
Riverstone Holdings, Ltd. | 392,400 | 294,978 | ||||||
Super Group, Ltd. | 227,000 | 208,913 | ||||||
Technovator International, Ltd.(a) | 997,000 | 452,028 | ||||||
|
| |||||||
| 4,383,646 | ||||||||
|
| |||||||
South Africa (3.32%) | ||||||||
ARB Holdings, Ltd. | 1,213,585 | 714,568 | ||||||
Blue Label Telecoms, Ltd. | 1,091,100 | 964,503 | ||||||
Clicks Group, Ltd. | 173,700 | 1,182,698 | ||||||
Comair, Ltd. | 2,861,704 | 1,038,689 | ||||||
EOH Holdings, Ltd. | 35,000 | 341,548 | ||||||
Interwaste Holdings, Ltd.(a) | 8,806,252 | 1,125,757 | ||||||
Invicta Holdings, Ltd. | 78,965 | 725,315 | ||||||
Italtile, Ltd. | 785,972 | 661,910 | ||||||
MiX Telematics, Ltd., Sponsored ADR(a) | 83,879 | 747,362 | ||||||
OneLogix Group, Ltd.(a) | 1,015,438 | 450,670 | ||||||
Super Group, Ltd.(a) | 643,400 | 1,842,332 | ||||||
Transaction Capital, Ltd. | 909,700 | 602,082 | ||||||
Value Group, Ltd. | 385,300 | 153,427 | ||||||
|
| |||||||
| 10,550,861 | ||||||||
|
| |||||||
South Korea (2.85%) | ||||||||
Duksan Hi-Metal Co., Ltd.(a) | 27,300 | 275,151 | ||||||
ENF Technology Co., Ltd. | 10,000 | 58,807 | ||||||
Global Display Co., Ltd. | 19,150 | 116,308 | ||||||
Hanssem Co., Ltd. | 11,370 | 1,355,263 | ||||||
Hy-Lok Corp. | 55,340 | 1,511,439 | ||||||
iMarketKorea, Inc. | 4,820 | 119,134 | ||||||
ISC Co., Ltd. | 48,485 | 1,774,796 | ||||||
Koh Young Technology, Inc. | 15,143 | 467,425 | ||||||
KONA I Co., Ltd. | 30,105 | 1,229,057 | ||||||
LEENO Industrial, Inc. | 15,100 | 601,308 | ||||||
LF Corp. | 5,200 | 164,013 | ||||||
Solueta Co., Ltd.(a) | 33,500 | 285,623 | ||||||
Sung Kwang Bend Co., Ltd. | 33,900 | 490,441 | ||||||
Vieworks Co., Ltd. | 14,454 | 490,063 | ||||||
See Notes to Financial Statements.
26 |
1.855.377.7325 | www.GrandeurPeakGlobal.com |
Table of Contents
| Grandeur Peak Global Reach Fund | Portfolio of Investments | |
October 31, 2014 (Unaudited) |
| Value | ||||||||
| Shares | (Note 2) | |||||||
South Korea (continued) | ||||||||
Wins Technet Co., Ltd. | 17,000 | $ | 122,267 | |||||
|
| |||||||
| 9,061,095 | ||||||||
|
| |||||||
Spain (0.00%) | ||||||||
Let’s GOWEX SA(a) | 10,700 | 1 | ||||||
|
| |||||||
Sri Lanka (0.65%) | ||||||||
Expolanka Holdings PLC | 5,864,300 | 443,943 | ||||||
Hemas Holdings PLC | 730,999 | 391,282 | ||||||
Royal Ceramics Lanka PLC | 1,460,600 | 1,247,555 | ||||||
|
| |||||||
| 2,082,780 | ||||||||
|
| |||||||
Sweden (1.92%) | ||||||||
AddTech AB, Class B | 10,700 | 151,665 | ||||||
B&B Tools AB, Class B | 52,423 | 982,785 | ||||||
Bufab Holding AB(a) | 177,850 | 1,282,403 | ||||||
Bulten AB | 50,900 | 424,263 | ||||||
Moberg Pharma AB(a) | 99,300 | 423,603 | ||||||
Nibe Industrier AB, Class B | 12,400 | 329,149 | ||||||
Odd Molly International | 40,188 | 252,650 | ||||||
Opus Group AB | 767,797 | 1,165,567 | ||||||
Vitec Software Group AB, Class B | 15,300 | 277,847 | ||||||
Wihlborgs Fastigheter AB | 46,000 | 806,763 | ||||||
|
| |||||||
| 6,096,695 | ||||||||
|
| |||||||
Switzerland (0.83%) | ||||||||
Bossard Holding AG | 5,800 | 587,877 | ||||||
VZ Holding AG | 12,500 | 2,059,191 | ||||||
|
| |||||||
| 2,647,068 | ||||||||
|
| |||||||
Taiwan (3.73%) | ||||||||
ASPEED Technology, Inc. | 37,310 | 285,226 | ||||||
Chipbond Technology Corp. | 255,000 | 470,190 | ||||||
Cleanaway Co., Ltd. | 46,000 | 204,494 | ||||||
Cowealth Medical Holding Co., Ltd. | 103,000 | 319,109 | ||||||
Cub Elecparts, Inc. | 34,419 | 363,112 | ||||||
DYNACOLOR, Inc. | 159,000 | 330,350 | ||||||
Godex International Co., Ltd. | 106,000 | 310,117 | ||||||
King’s Town Bank Co., Ltd. | 1,048,000 | 1,146,184 | ||||||
Novatek Microelectronics Corp. | 166,000 | 859,226 | ||||||
On-Bright Electronics, Inc. | 68,000 | 355,207 | ||||||
Polyronics Tech Corp. | 399,000 | 884,263 | ||||||
Richtek Technology Corp. | 28,000 | 135,114 | ||||||
Silergy Corp. | 110,925 | 769,300 | ||||||
Sinmag Equipment Corp. | 88,560 | 568,219 | ||||||
Sporton International, Inc. | 337,830 | 1,637,165 | ||||||
Test Research, Inc. | 464,440 | 758,324 | ||||||
| Value | ||||||||
| Shares | (Note 2) | |||||||
Taiwan (continued) | ||||||||
TSC Auto ID Technology Co., Ltd. | 66,000 | $ | 492,989 | |||||
Tung Thih Electronic Co., Ltd. | 234,000 | 729,499 | ||||||
UDE Corp. | 461,000 | 1,238,334 | ||||||
|
| |||||||
| 11,856,422 | ||||||||
|
| |||||||
Thailand (0.49%) | ||||||||
Jubilee Enterprise PCL | 227,600 | 285,019 | ||||||
LPN Development PCL | 1,186,000 | 907,121 | ||||||
Mega Lifesciences PCL | 43,300 | 24,601 | ||||||
Premier Marketing PCL | 1,179,800 | 349,388 | ||||||
|
| |||||||
| 1,566,129 | ||||||||
|
| |||||||
Turkey (1.62%) | ||||||||
Albaraka Turk Katilim Bankasi AS | 818,100 | 577,692 | ||||||
EGE Seramik Sanayi ve Ticaret AS | 662,900 | 1,064,276 | ||||||
Emlak Konut Gayrimenkul Yatirim Ortakligi AS, REIT | 479,300 | 538,346 | ||||||
Is Girisim Sermayesi Yatirim Ortakligi AS | 268,052 | 264,114 | ||||||
Koza Altin Isletmeleri AS | 4,600 | 29,649 | ||||||
Pegasus Hava Tasimaciligi AS(a) | 15,650 | 201,225 | ||||||
Pinar SUT Mamulleri Sanayii AS | 132,600 | 1,276,692 | ||||||
TAV Havalimanlari Holding AS | 35,600 | 298,650 | ||||||
Tumosan Motor ve Traktor Sanayi AS | 200,100 | 455,351 | ||||||
Turk Traktor ve Ziraat Makineleri AS | 9,400 | 296,456 | ||||||
Uyum Gida Ihtiyac Maddeleri Sanayi ve Ticaret AS(a) | 182,900 | 161,119 | ||||||
|
| |||||||
| 5,163,570 | ||||||||
|
| |||||||
United States (24.22%) | ||||||||
2U, Inc.(a) | 22,375 | 407,225 | ||||||
Abaxis, Inc. | 15,700 | 826,762 | ||||||
ABIOMED, Inc.(a) | 41,675 | 1,366,523 | ||||||
Alamo Group, Inc. | 18,625 | 797,895 | ||||||
Amsurg Corp.(a) | 23,737 | 1,282,035 | ||||||
Aratana Therapeutics, | 62,375 | 698,600 | ||||||
Barrett Business Services, Inc. | 26,025 | 611,848 | ||||||
BioDelivery Sciences International, Inc.(a) | 109,700 | 1,908,780 | ||||||
Carbonite, Inc.(a) | 59,550 | 651,477 | ||||||
See Notes to Financial Statements.
Semi-Annual Report | October 31, 2014 |
27 |
Table of Contents
| Grandeur Peak Global Reach Fund | Portfolio of Investments | |
October 31, 2014 (Unaudited) |
| Shares | Value (Note 2) | |||||||
United States (continued) | ||||||||
Cardica, Inc.(a) | 148,600 | $ | 146,312 | |||||
Cardtronics, Inc.(a) | 8,475 | 325,355 | ||||||
Ceco Environmental Corp. | 80,200 | 1,148,464 | ||||||
Cempra, Inc.(a) | 93,900 | 1,277,040 | ||||||
ChannelAdvisor Corp.(a) | 37,225 | 517,055 | ||||||
Chase Corp. | 8,050 | 288,753 | ||||||
Covance, Inc.(a) | 7,500 | 599,250 | ||||||
Diamond Hill Investment Group, Inc. | 6,375 | 854,186 | ||||||
DXP Enterprises, Inc.(a) | 9,525 | 631,412 | ||||||
EPAM Systems, Inc.(a) | 9,300 | 443,982 | ||||||
ePlus, Inc.(a) | 13,100 | 800,017 | ||||||
Esperion Therapeutics, Inc.(a) | 16,050 | 469,462 | ||||||
ExlService Holdings, Inc.(a) | 12,050 | 337,280 | ||||||
First Cash Financial Services, Inc.(a) | 15,775 | 931,987 | ||||||
First Republic Bank | 112,600 | 5,734,718 | ||||||
Fresh Market, Inc.(a) | 44,099 | 1,618,874 | ||||||
Genpact, Ltd.(a) | 18,100 | 317,655 | ||||||
Gentex Corp. | 67,075 | 2,196,036 | ||||||
Geospace Technologies | 10,260 | 315,905 | ||||||
Grand Canyon Education, | 37,700 | 1,805,830 | ||||||
HeartWare International, Inc.(a) | 3,775 | 291,128 | ||||||
Home BancShares, Inc. | 40,050 | 1,278,396 | ||||||
Inphi Corp.(a) | 132,425 | 2,049,939 | ||||||
Integrated Silicon Solution, Inc. | 96,425 | 1,309,452 | ||||||
InvenSense, Inc.(a) | 14,800 | 239,908 | ||||||
IPC The Hospitalist Co., Inc.(a) | 19,275 | 802,997 | ||||||
Jones Energy, Inc., Class A(a) | 25,605 | 316,478 | ||||||
K2M Group Holdings, Inc.(a) | 66,925 | 1,077,493 | ||||||
KEYW Holding Corp.(a) | 13,690 | 138,954 | ||||||
Knight Transportation, Inc. | 10,800 | 316,008 | ||||||
LGI Homes, Inc.(a) | 49,500 | 961,290 | ||||||
Littelfuse, Inc. | 7,175 | 699,850 | ||||||
Manitex International, Inc.(a) | 68,125 | 778,669 | ||||||
Manning & Napier, Inc. | 29,960 | 474,566 | ||||||
Marin Software, Inc.(a) | 74,875 | 670,131 | ||||||
MarketAxess Holdings, Inc. | 14,280 | 923,202 | ||||||
Mastech Holdings, Inc. | 12,068 | 141,799 | ||||||
Mavenir Systems, Inc.(a) | 44,600 | 546,796 | ||||||
Maxim Integrated Products, Inc. | 9,760 | 286,358 | ||||||
MaxLinear, Inc., Class A(a) | 136,200 | 965,658 | ||||||
Mesa Laboratories, Inc. | 4,325 | 330,300 | ||||||
Microchip Technology, Inc. | 26,475 | 1,141,337 | ||||||
| Shares | Value (Note 2) | |||||||
United States (continued) | ||||||||
Navigant Consulting, Inc.(a) | 41,075 | $ | 632,144 | |||||
NorthStar Asset Management Group, Inc. | 35,400 | 641,448 | ||||||
NorthStar Realty Finance Corp., REIT | 104,375 | 1,939,288 | ||||||
Nu Skin Enterprises, Inc., Class A | 5,495 | 290,301 | ||||||
NxStage Medical, Inc.(a) | 57,425 | 870,563 | ||||||
Pegasystems, Inc. | 14,925 | 323,425 | ||||||
Perficient, Inc.(a) | 42,500 | 704,650 | ||||||
Performant Financial | 130,095 | 1,122,720 | ||||||
Pericom Semiconductor Corp.(a) | 46,900 | 512,617 | ||||||
Power Integrations, Inc. | 27,340 | 1,376,842 | ||||||
Q2 Holdings, Inc.(a) | 7,100 | 107,139 | ||||||
RealPage, Inc.(a) | 18,975 | 377,033 | ||||||
Redwood Trust, Inc., REIT | 44,400 | 834,276 | ||||||
Roadrunner Transportation Systems, Inc.(a) | 275,325 | 5,674,448 | ||||||
Ruckus Wireless, Inc.(a) | 24,950 | 323,851 | ||||||
Rush Enterprises, Inc., Class A(a) | 22,325 | 850,583 | ||||||
Signature Bank(a) | 13,125 | 1,589,831 | ||||||
Silicon Laboratories, Inc.(a) | 16,875 | 769,331 | ||||||
Sonus Networks, Inc.(a) | 142,875 | 495,776 | ||||||
STAAR Surgical Co.(a) | 115,825 | 1,108,445 | ||||||
Synaptics, Inc.(a) | 20,925 | 1,431,898 | ||||||
Synergetics USA, Inc.(a) | 50,939 | 180,833 | ||||||
Syntel, Inc.(a) | 6,750 | 584,618 | ||||||
Tandy Leather Factory, Inc. | 30,975 | 286,209 | ||||||
TearLab Corp.(a) | 39,825 | 115,094 | ||||||
Transcat, Inc.(a) | 124,765 | 1,311,280 | ||||||
TriMas Corp.(a) | 68,100 | 2,156,046 | ||||||
TriNet Group, Inc.(a) | 11,595 | 346,922 | ||||||
TubeMogul, Inc.(a) | 48,825 | 758,741 | ||||||
Universal Truckload Services, Inc. | 48,475 | 1,275,862 | ||||||
Virtusa Corp.(a) | 8,300 | 340,134 | ||||||
Vocera Communications, Inc.(a) | 13,400 | 138,690 | ||||||
Wesco Aircraft Holdings, Inc.(a) | 98,150 | 1,742,163 | ||||||
Whitestone, REIT | 52,800 | 792,000 | ||||||
|
| |||||||
| 77,056,628 | ||||||||
|
| |||||||
Vietnam (0.15%) | ||||||||
DHG Pharmaceutical JSC | 46,666 | 206,137 | ||||||
Traphaco JSC | 29,000 | 103,395 | ||||||
See Notes to Financial Statements.
28 |
1.855.377.7325 | www.GrandeurPeakGlobal.com |
Table of Contents
| Grandeur Peak Global Reach Fund | Portfolio of Investments | |
October 31, 2014 (Unaudited) |
| Shares | Value (Note 2) | |||||||
Vietnam (continued) | ||||||||
Vietnam Dairy Products JSC | 34,836 | $ | 171,848 | |||||
|
| |||||||
| 481,380 | ||||||||
|
| |||||||
TOTAL COMMON STOCKS (Cost $275,880,457) | 285,063,407 | |||||||
|
| |||||||
PREFERRED STOCKS (0.31%) | ||||||||
Brazil (0.31%) | ||||||||
Banco ABC Brasil SA | 180,955 | 1,005,589 | ||||||
|
| |||||||
TOTAL PREFERRED STOCKS (Cost $1,005,083) | 1,005,589 | |||||||
|
| |||||||
WARRANTS (0.00%) | ||||||||
Malaysia (0.00%) | ||||||||
CB Industrial Product Holding Bhd, Strike Price 2.40 MYR, Expires 11/06/2019(e) | 98,233 | 0 | ||||||
|
| |||||||
TOTAL WARRANTS (Cost $0) | 0 | |||||||
|
| |||||||
TOTAL INVESTMENTS (89.91%) (Cost $276,885,540) | $ | 286,068,996 | ||||||
Assets In Excess Of Other Liabilities (10.09%) |
| 32,090,019 | ||||||
|
| |||||||
NET ASSETS (100.00%) | $ | 318,159,015 | ||||||
|
| |||||||
| (a) | Non-Income Producing Security. |
| (b) | Security exempt from registration under Rule 144A of the Securities Act of 1933. These securities may be resold in the ordinary course of business in transactions exempt from registration, normally to qualified institutional buyers. As of October 31, 2014, these securities had a total aggregate market value of $636,357, representing 0.20% of net assets. |
| (c) | Security was purchased pursuant to Regulation S under the Securities Act of 1933, which exempts securities offered and sold outside of the United States from registration. Such security cannot be sold in the United States without either an effective registration statement filed pursuant to the Securities Act of 1933, or pursuant to an exemption from registration. The security has been deemed liquid under guidelines approved by the Fund’s Board of Trustees. As of October 31, 2014, the aggregate market value of those securities was $734,754, representing 0.23% of net assets. |
| (d) | Private Placement: these securities may only be resold in transactions exempt from registration under the Securities Act of 1933. As of October 31, 2014, these securities had a total value of $487,104 or 0.15% of Total Net Assets. |
| (e) | Fair valued security under the procedures approved by the Fund’s Board of Trustees. |
Common Abbreviations:
AB - Aktiebolag is the Swedish equivalent of the term corporation.
ADR - American Depositary Receipt.
AG - Aktiengesellschaft is a German term that refers to a corporation that is limited by shares, i.e., owned by shareholders.
AS - Aktieselskab is the Danish term for a stock-based corporation.
ASA - Allmennaksjeselskap is the Norwegian term for public limited company.
Bhd - Berhad is the Malaysian term for public limited company.
GDR - Global Depositary Receipt.
JSC - Joint Stock Company.
LP - Limited Partnership.
Ltd. - Limited.
NV - Naamloze Vennootschap is the Dutch term for a public limited liability corporation.
OYJ - Julkinen Osakeyhtiö is the Finnish term for a public limited company.
PCL - Public Company Limited.
PLC - Public Limited Company.
REIT - Real Estate Investment Trust.
SA - Generally designates corporations in various countries, mostly those employing the civil law.
SAB de CV - A variable capital company.
SE - A European Company which can operate on a Europe-wide basis and be governed by community law directly applicable in all member states.
Tbk PT - Terbuka Perseroan Terbatas is an Indonesian term for a limited liability company.
Currency Abbreviations:
MYR - Malaysian Ringgit
Holdings are subject to change.
For Fund compliance purposes, the Fund’s geographical classifications refer to any one or more of the country sub-classifications used by one or more widely recognized market indexes or ratings group indexes, and/or as defined by Fund management. This definition may not apply for purposes of this report, which may combine sub-classifications for reporting ease. Geographical regions are shown as a percentage of net assets.
See Notes to Financial Statements.
Semi-Annual Report | October 31, 2014 |
29 |
Table of Contents
| Grandeur Peak International Opportunities Fund | Portfolio of Investments | |
October 31, 2014 (Unaudited) |
| Shares | Value (Note 2) | |||||||
COMMON STOCKS (88.92%) | ||||||||
Australia (2.14%) | ||||||||
ALS, Ltd. | 300,232 | $ | 1,486,870 | |||||
Countplus, Ltd. | 974,352 | 951,750 | ||||||
CTI Logistics, Ltd. | 1,407,259 | 2,130,393 | ||||||
Magellan Financial Group, Ltd. | 906,800 | 10,764,725 | ||||||
Medical Developments International, Ltd.(a) | 576,538 | 684,929 | ||||||
Webjet, Ltd. | 435,318 | 1,315,856 | ||||||
|
| |||||||
| 17,334,523 | ||||||||
|
| |||||||
Austria (0.40%) | ||||||||
Palfinger AG | 139,696 | 3,256,113 | ||||||
|
| |||||||
Belgium (1.54%) | ||||||||
Melexis NV | 273,423 | 12,470,369 | ||||||
|
| |||||||
Brazil (3.45%) | ||||||||
Banco Daycoval SA | 1,579,600 | 5,746,594 | ||||||
CETIP SA - Mercados Organizados | 849,842 | 10,769,215 | ||||||
Even Construtora e Incorporadora SA | 932,700 | 2,020,207 | ||||||
Tegma Gestao Logistica | 607,144 | 4,459,430 | ||||||
Valid Solucoes SA | 309,200 | 4,963,871 | ||||||
|
| |||||||
| 27,959,317 | ||||||||
|
| |||||||
Britain (10.62%) | ||||||||
Abcam PLC | 449,266 | 2,878,135 | ||||||
Advanced Medical Solutions Group PLC | 2,095,869 | 3,956,241 | ||||||
Arrow Global Group PLC | 803,700 | 3,280,769 | ||||||
blinkx PLC(a) | 3,174,500 | 1,428,550 | ||||||
Bovis Homes Group PLC | 316,729 | 4,277,491 | ||||||
Brammer PLC | 471,317 | 2,444,723 | ||||||
Brit PLC(b)(c) | 700,000 | 2,822,877 | ||||||
Clinigen Group PLC | 2,330,273 | 17,408,458 | ||||||
Diploma PLC | 269,100 | 2,993,970 | ||||||
EMIS Group PLC | 611,900 | 7,341,391 | ||||||
Globo PLC(a) | 1,051,115 | 723,028 | ||||||
Halma PLC | 245,129 | 2,445,868 | ||||||
Hunting PLC | 403,100 | 4,748,124 | ||||||
IG Group Holdings PLC | 792,000 | 7,632,830 | ||||||
Premier Oil PLC | 894,941 | 3,695,454 | ||||||
RPS Group PLC | 2,846,790 | 10,688,277 | ||||||
Ted Baker PLC | 50,909 | 1,589,657 | ||||||
Tracsis PLC | 253,100 | 1,374,575 | ||||||
Ultra Electronics Holdings PLC | 150,100 | 4,197,575 | ||||||
|
| |||||||
| 85,927,993 | ||||||||
|
| |||||||
| Shares | Value (Note 2) | |||||||
Canada (3.46%) | ||||||||
Halogen Software, Inc.(a) | 136,700 | $ | 1,091,611 | |||||
Home Capital Group, Inc. | 287,360 | 13,773,291 | ||||||
Mapan Energy, Ltd.(a)(d) | 1,449,000 | 1,671,354 | ||||||
Richelieu Hardware, Ltd. | 98,550 | 4,675,452 | ||||||
Stantec, Inc. | 69,976 | 4,433,686 | ||||||
TransForce, Inc. | 97,400 | 2,381,744 | ||||||
|
| |||||||
| 28,027,138 | ||||||||
|
| |||||||
China (7.50%) | ||||||||
China Medical System Holdings, Ltd. | 4,895,000 | 9,024,901 | ||||||
China Pioneer Pharma Holdings, Ltd. | 3,577,000 | 3,401,486 | ||||||
Dongpeng Holdings Co., Ltd. | 16,368,000 | 6,005,218 | ||||||
Far East Horizon, Ltd. | 8,029,000 | 7,467,436 | ||||||
Labixiaoxin Snacks Group, | 11,212,000 | 1,503,579 | ||||||
Le Saunda Holdings, Ltd. | 4,989,800 | 2,510,819 | ||||||
Man Wah Holdings, Ltd. | 7,249,100 | 10,846,030 | ||||||
Mindray Medical International, Ltd., ADR | 40,650 | 1,184,541 | ||||||
Noah Holdings, Ltd., Sponsored ADR(a) | 61,700 | 1,011,880 | ||||||
O2Micro International, Ltd., ADR(a) | 569,914 | 1,117,031 | ||||||
Pacific Online, Ltd. | 5,136,152 | 2,783,595 | ||||||
Sihuan Pharmaceutical Holdings Group, Ltd. | 3,949,000 | 3,153,279 | ||||||
SPT Energy Group, Inc. | 13,743,000 | 4,329,679 | ||||||
Tao Heung Holdings, Ltd. | 2,203,700 | 1,161,854 | ||||||
WuXi PharmaTech Cayman, Inc., ADR(a) | 138,950 | 5,238,415 | ||||||
|
| |||||||
| 60,739,743 | ||||||||
|
| |||||||
Colombia (1.21%) | ||||||||
Gran Tierra Energy, Inc.(a) | 1,116,600 | 5,091,696 | ||||||
Parex Resources, Inc.(a) | 510,145 | 4,675,745 | ||||||
|
| |||||||
| 9,767,441 | ||||||||
|
| |||||||
Finland (0.31%) | ||||||||
BasWare OYJ | 18,902 | 948,466 | ||||||
Revenio Group OYJ | 91,000 | 1,555,360 | ||||||
|
| |||||||
| 2,503,826 | ||||||||
|
| |||||||
France (2.79%) | ||||||||
Alten SA | 69,000 | 2,951,341 | ||||||
Argan SA, REIT | 56,000 | 1,228,085 | ||||||
Audika Groupe | 122,381 | 1,801,290 | ||||||
Esker SA | 78,800 | 1,737,103 | ||||||
GameLoft SE(a) | 251,700 | 1,293,212 | ||||||
Infotel SA | 30,000 | 752,507 | ||||||
See Notes to Financial Statements.
30 |
1.855.377.7325 | www.GrandeurPeakGlobal.com |
Table of Contents
| Grandeur Peak International Opportunities Fund | Portfolio of Investments | |
October 31, 2014 (Unaudited) |
| Shares | Value (Note 2) | |||||||
France (continued) | ||||||||
Medicrea International(a) | 193,596 | $ | 2,147,050 | |||||
MGI Digital Graphic Technology(a) | 53,050 | 1,711,875 | ||||||
Neurones | 79,220 | 1,327,725 | ||||||
Norbert Dentressangle SA | 16,280 | 2,379,595 | ||||||
Prodware(a) | 268,000 | 2,121,258 | ||||||
SoluCom | 34,342 | 1,596,622 | ||||||
Thermador Groupe | 16,307 | 1,521,393 | ||||||
|
| |||||||
| 22,569,056 | ||||||||
|
| |||||||
Georgia (0.78%) | ||||||||
Bank of Georgia Holdings PLC | 154,111 | 6,320,467 | ||||||
|
| |||||||
Germany (4.12%) | ||||||||
Bertrandt AG | 48,704 | 6,375,358 | ||||||
CANCOM SE | 32,000 | 1,313,470 | ||||||
ElringKlinger AG | 137,802 | 4,215,072 | ||||||
First Sensor AG(a) | 119,964 | 1,511,182 | ||||||
Nexus AG | 364,726 | 5,589,779 | ||||||
Norma Group SE | 59,103 | 2,770,393 | ||||||
Patrizia Immobilien | 318,886 | 4,311,211 | ||||||
Softing AG | 96,691 | 1,772,248 | ||||||
Wirecard AG | 152,611 | 5,475,562 | ||||||
|
| |||||||
| 33,334,275 | ||||||||
|
| |||||||
Hong Kong (1.34%) | ||||||||
ASR Holdings, Ltd. | 15,054,000 | 2,290,571 | ||||||
Value Partners Group, Ltd. | 7,371,000 | 5,555,122 | ||||||
Vitasoy International Holdings, Ltd. | 2,163,338 | 2,980,418 | ||||||
|
| |||||||
| 10,826,111 | ||||||||
|
| |||||||
India (8.94%) | ||||||||
AIA Engineering, Ltd. | 103,424 | 1,580,601 | ||||||
Ajanta Pharma, Ltd. | 238,951 | 7,392,109 | ||||||
Amara Raja Batteries, Ltd. | 453,100 | 4,834,779 | ||||||
Bajaj Corp., Ltd. | 476,500 | 2,206,498 | ||||||
Bajaj Finance, Ltd. | 122,726 | 5,603,637 | ||||||
City Union Bank, Ltd. | 1,027,565 | 1,420,597 | ||||||
Credit Analysis & Research, Ltd. | 152,100 | 3,310,895 | ||||||
Crisil, Ltd. | 53,960 | 1,603,893 | ||||||
Glenmark Pharmaceuticals, Ltd. | 643,100 | 7,529,338 | ||||||
Hinduja Global Solutions, Ltd. | 340,600 | 3,749,365 | ||||||
Infotech Enterprises, Ltd. | 458,767 | 3,587,573 | ||||||
Ipca Laboratories, Ltd. | 246,000 | 2,929,887 | ||||||
Jammu & Kashmir Bank, Ltd. | 989,500 | 2,241,846 | ||||||
Kolte-Patil Developers, Ltd. | 684,300 | 2,096,180 | ||||||
| Shares | Value (Note 2) | |||||||
India (continued) | ||||||||
KPIT Technologies, Ltd. | 1,699,321 | $ | 4,590,454 | |||||
Mahindra & Mahindra Financial Services, Ltd. | 352,300 | 1,683,150 | ||||||
Persistent Systems, Ltd. | 153,373 | 3,246,437 | ||||||
Poly Medicure, Ltd. | 11,621 | 156,070 | ||||||
Supreme Industries, Ltd. | 198,834 | 1,942,355 | ||||||
Time Technoplast, Ltd. | 4,384,100 | 3,377,328 | ||||||
Vaibhav Global, Ltd.(a) | 221,000 | 2,971,982 | ||||||
Vakrangee Software, Ltd. | 1,805,600 | 3,746,206 | ||||||
Vesuvius India, Ltd. | 49,516 | 562,418 | ||||||
|
| |||||||
| 72,363,598 | ||||||||
|
| |||||||
Indonesia (2.70%) | ||||||||
Astra Graphia Tbk PT | 10,792,000 | 1,981,617 | ||||||
Bank Negara Indonesia Persero Tbk PT | 6,994,000 | 3,447,099 | ||||||
Bank Tabungan Pensiunan Nasional Tbk PT(a) | 2,566,200 | 898,514 | ||||||
Express Transindo Utama Tbk PT | 22,620,500 | 2,181,685 | ||||||
Lippo Cikarang Tbk | 1,866,000 | 1,313,161 | ||||||
Panin Sekuritas Tbk PT | 4,388,500 | 1,861,073 | ||||||
Selamat Sempurna Tbk PT | 14,531,800 | 5,404,745 | ||||||
Tempo Scan Pacific Tbk PT | 12,461,000 | 2,940,901 | ||||||
Ultrajaya Milk Industry & Trading Co. Tbk PT | 5,739,500 | 1,816,236 | ||||||
|
| |||||||
| 21,845,031 | ||||||||
|
| |||||||
Ireland (1.03%) | ||||||||
Beazley PLC | 925,100 | 3,885,602 | ||||||
Irish Residential Properties, | 3,307,600 | 4,455,783 | ||||||
|
| |||||||
| 8,341,385 | ||||||||
|
| |||||||
Israel (0.48%) | ||||||||
Caesarstone Sdot Yam, Ltd. | 27,100 | 1,513,806 | ||||||
Sarin Technologies, Ltd. | 1,013,000 | 2,349,245 | ||||||
|
| |||||||
| 3,863,051 | ||||||||
|
| |||||||
Japan (5.30%) | ||||||||
AIT Corp. | 339,800 | 2,466,500 | ||||||
Arcland Service Co., Ltd. | 51,200 | 1,570,788 | ||||||
Benefit One, Inc. | 426,900 | 3,795,971 | ||||||
CMIC Co., Ltd. | 137,755 | 2,099,251 | ||||||
Daikokutenbussan Co. | 62,000 | 1,804,048 | ||||||
Future Architect, Inc. | 464,700 | 2,657,767 | ||||||
GCA Savvian Corp. | 369,400 | 3,968,084 | ||||||
Gurunavi, Inc. | 150,500 | 2,062,342 | ||||||
Hiday Hidaka Corp. | 106,560 | 3,084,668 | ||||||
Monogatari Corp. | 100,900 | 3,262,176 | ||||||
Seria Co., Ltd. | 27,800 | 1,167,490 | ||||||
Shaklee Global Group, Inc.(a) | 12,000 | 420,921 | ||||||
See Notes to Financial Statements.
Semi-Annual Report | October 31, 2014 |
31 |
Table of Contents
| Grandeur Peak International Opportunities Fund | Portfolio of Investments | |
October 31, 2014 (Unaudited) |
| Shares | Value (Note 2) | |||||||
Japan (continued) | ||||||||
SK Kaken Co., Ltd. | 37,000 | $ | 2,829,557 | |||||
Syuppin Co., Ltd. | 93,600 | 1,659,803 | ||||||
Trancom Co., Ltd. | 240,090 | 10,033,284 | ||||||
|
| |||||||
| 42,882,650 | ||||||||
|
| |||||||
Luxembourg (0.82%) | ||||||||
L’Occitane International SA | 2,802,712 | 6,617,831 | ||||||
|
| |||||||
Malaysia (3.18%) | ||||||||
AEON Credit Service M Bhd | 868,040 | 4,154,410 | ||||||
Berjaya Food Bhd | 2,900,016 | 2,495,111 | ||||||
CB Industrial Product Holding Bhd | 2,674,800 | 1,959,579 | ||||||
JobStreet Corp. Bhd | 417,000 | 330,791 | ||||||
Kossan Rubber Industries | 1,763,000 | 2,466,040 | ||||||
My EG Services Bhd | 5,237,900 | 6,401,293 | ||||||
Padini Holdings Bhd | 8,523,750 | 4,770,066 | ||||||
Uzma Bhd(a) | 3,002,300 | 3,150,795 | ||||||
|
| |||||||
| 25,728,085 | ||||||||
|
| |||||||
Mexico (0.68%) | ||||||||
Credito Real SAB de CV | 273,631 | 703,470 | ||||||
Genomma Lab Internacional SAB de CV, Class B(a) | 1,888,400 | 4,783,316 | ||||||
|
| |||||||
| 5,486,786 | ||||||||
|
| |||||||
Netherlands (0.37%) | ||||||||
Aalberts Industries NV | 111,574 | 2,974,089 | ||||||
|
| |||||||
Norway (0.23%) | ||||||||
Medistim ASA | 417,000 | 1,687,796 | ||||||
Zalaris ASA(a) | 39,500 | 181,173 | ||||||
|
| |||||||
| 1,868,969 | ||||||||
|
| |||||||
Oman (0.26%) | ||||||||
Al Anwar Ceramic Tile Co. | 1,575,000 | 2,143,636 | ||||||
|
| |||||||
Philippines (1.86%) | ||||||||
Pepsi-Cola Products Philippines, Inc.(a) | 45,267,500 | 4,711,683 | ||||||
Puregold Price Club, Inc. | 1,432,000 | 1,104,601 | ||||||
RFM Corp. | 14,962,900 | 1,663,432 | ||||||
Security Bank Corp. | 2,356,760 | 7,547,315 | ||||||
|
| |||||||
| 15,027,031 | ||||||||
|
| |||||||
Russia (0.16%) | ||||||||
MD Medical Group Investments PLC, | 157,000 | 1,303,100 | ||||||
|
| |||||||
| Shares | Value (Note 2) | |||||||
Singapore (1.74%) | ||||||||
ARA Asset Management, Ltd. | 2,460,212 | $ | 3,279,372 | |||||
CSE Global, Ltd. | 5,921,055 | 3,111,008 | ||||||
Petra Foods, Ltd. | 1,849,600 | 5,485,309 | ||||||
Riverstone Holdings, Ltd. | 2,940,000 | 2,210,078 | ||||||
|
| |||||||
| 14,085,767 | ||||||||
|
| |||||||
South Africa (2.12%) | ||||||||
Clicks Group, Ltd. | 273,485 | 1,862,120 | ||||||
Ellies Holdings, Ltd.(a) | 3,854,240 | 447,284 | ||||||
EOH Holdings, Ltd. | 294,856 | 2,877,357 | ||||||
Italtile, Ltd. | 3,988,625 | 3,359,038 | ||||||
MiX Telematics, Ltd., Sponsored ADR(a) | 164,500 | 1,465,695 | ||||||
OneLogix Group, Ltd.(a) | 2,450,980 | 1,087,790 | ||||||
Super Group, Ltd.(a) | 1,966,797 | 5,631,789 | ||||||
Value Group, Ltd. | 1,017,368 | 405,118 | ||||||
|
| |||||||
| 17,136,191 | ||||||||
|
| |||||||
South Korea (5.52%) | ||||||||
Duksan Hi-Metal Co., | 211,600 | 2,132,674 | ||||||
ENF Technology Co., Ltd. | 144,600 | 850,346 | ||||||
Global Display Co., Ltd. | 329,250 | 1,999,706 | ||||||
Hanssem Co., Ltd. | 38,100 | 4,541,381 | ||||||
Hy-Lok Corp. | 367,828 | 10,046,071 | ||||||
ISC Co., Ltd. | 169,083 | 6,189,294 | ||||||
Koh Young Technology, Inc. | 107,883 | 3,330,065 | ||||||
KONA I Co., Ltd. | 162,894 | 6,650,259 | ||||||
KT Skylife Co., Ltd. | 79,100 | 1,438,301 | ||||||
LEENO Industrial, Inc. | 106,220 | 4,229,867 | ||||||
LF Corp. | 70,470 | 2,222,696 | ||||||
Wins Technet Co., Ltd. | 140,300 | 1,009,060 | ||||||
|
| |||||||
| 44,639,720 | ||||||||
|
| |||||||
Sweden (3.62%) | ||||||||
AddTech AB, Class B | 335,213 | 4,751,405 | ||||||
Beijer Alma AB | 122,700 | 2,858,068 | ||||||
Bufab Holding AB(a) | 836,000 | 6,028,048 | ||||||
Indutrade AB | 72,150 | 2,913,530 | ||||||
Moberg Pharma AB(a) | 351,300 | 1,498,608 | ||||||
Nibe Industrier AB, Class B | 224,581 | 5,961,340 | ||||||
Odd Molly International | 72,938 | 458,539 | ||||||
Opus Group AB | 3,204,612 | 4,864,816 | ||||||
|
| |||||||
| 29,334,354 | ||||||||
|
| |||||||
Switzerland (0.85%) | ||||||||
VZ Holding AG | 41,630 | 6,857,928 | ||||||
|
| |||||||
Taiwan (6.91%) | ||||||||
ASPEED Technology, Inc. | 240,799 | 1,840,852 | ||||||
Cleanaway Co., Ltd. | 476,000 | 2,116,073 | ||||||
See Notes to Financial Statements.
32 |
1.855.377.7325 | www.GrandeurPeakGlobal.com |
Table of Contents
| Grandeur Peak International Opportunities Fund | Portfolio of Investments | |
October 31, 2014 (Unaudited) |
| Shares | Value (Note 2) | |||||||
Taiwan (continued) | ||||||||
Cowealth Medical Holding Co., Ltd. | 677,000 | $ | 2,097,442 | |||||
Cub Elecparts, Inc. | 323,431 | 3,412,115 | ||||||
King’s Town Bank Co., Ltd. | 4,113,000 | 4,498,334 | ||||||
Ledlink Optics, Inc. | 240,895 | 389,899 | ||||||
Novatek Microelectronics Corp. | 741,000 | 3,835,460 | ||||||
On-Bright Electronics, Inc. | 383,000 | 2,000,651 | ||||||
Polyronics Tech Corp. | 2,786,300 | 6,174,994 | ||||||
Richtek Technology Corp. | 144,000 | 694,874 | ||||||
Silergy Corp. | 581,199 | 4,030,801 | ||||||
Sinmag Equipment Corp. | 396,500 | 2,544,023 | ||||||
Sporton International, Inc. | 2,060,340 | 9,984,654 | ||||||
Test Research, Inc. | 1,907,252 | 3,114,104 | ||||||
TSC Auto ID Technology Co., Ltd. | 451,000 | 3,368,761 | ||||||
UDE Corp. | 1,601,000 | 4,300,593 | ||||||
Voltronic Power Technology Corp. | 183,650 | 1,483,134 | ||||||
|
| |||||||
| 55,886,764 | ||||||||
|
| |||||||
Thailand (0.93%) | ||||||||
LPN Development PCL | 5,654,100 | 4,324,583 | ||||||
Mega Lifesciences PCL | 210,400 | 119,538 | ||||||
Premier Marketing PCL | 10,552,000 | 3,124,887 | ||||||
|
| |||||||
| 7,569,008 | ||||||||
|
| |||||||
Turkey (0.59%) | ||||||||
Albaraka Turk Katilim Bankasi AS | 4,272,500 | 3,016,975 | ||||||
Emlak Konut Gayrimenkul Yatirim Ortakligi AS, REIT | 1,580,100 | 1,774,755 | ||||||
|
| |||||||
| 4,791,730 | ||||||||
|
| |||||||
United Arab Emirates (0.17%) | ||||||||
Aramex PJSC | 1,561,000 | 1,342,978 | ||||||
|
| |||||||
United States (0.80%) | ||||||||
First Cash Financial Services, Inc.(a) | 88,200 | 5,210,856 | ||||||
Nu Skin Enterprises, Inc., Class A | 24,100 | 1,273,203 | ||||||
|
| |||||||
| 6,484,059 | ||||||||
|
| |||||||
TOTAL COMMON STOCKS (Cost $621,093,339) |
| 719,610,113 | ||||||
|
| |||||||
| Shares | Value (Note 2) | |||||||
PREFERRED STOCKS (0.43%) |
| |||||||
Brazil (0.43%) | ||||||||
Banco ABC Brasil SA | 630,706 | $ | 3,504,912 | |||||
|
| |||||||
TOTAL PREFERRED STOCKS (Cost $3,417,894) |
| 3,504,912 | ||||||
|
| |||||||
WARRANTS (0.00%) | ||||||||
Malaysia (0.00%) | ||||||||
CB Industrial Product Holding Bhd, Strike Price 2.40 MYR, Expires 11/06/2019(e) | 445,800 | 0 | ||||||
|
| |||||||
TOTAL WARRANTS (Cost $0) | 0 | |||||||
|
| |||||||
TOTAL INVESTMENTS (89.35%) (Cost $624,511,233) |
| $ | 723,115,025 | |||||
Assets In Excess Of Other Liabilities (10.65%) |
| 86,200,456 | ||||||
|
| |||||||
NET ASSETS (100.00%) | $ | 809,315,481 | ||||||
|
| |||||||
| (a) | Non-Income Producing Security. |
| (b) | Security exempt from registration under Rule 144A of the Securities Act of 1933. These securities may be resold in the ordinary course of business in transactions exempt from registration, normally to qualified institutional buyers. As of October 31, 2014, these securities had a total aggregate market value of $2,822,877, representing 0.35% of net assets. |
| (c) | Security was purchased pursuant to Regulation S under the Securities Act of 1933, which exempts securities offered and sold outside of the United States from registration. Such security cannot be sold in the United States without either an effective registration statement filed pursuant to the Securities Act of 1933, or pursuant to an exemption from registration. The security has been deemed liquid under guidelines approved by the Fund’s Board of Trustees. As of October 31, 2014, the aggregate market value of those securities was $4,125,977, representing 0.51% of net assets. |
| (d) | Private Placement: these securities may only be resold in transactions exempt from registration under the Securities Act of 1933. As of October 31, 2014, these securities had a total value of $1,671,354 or 0.21% of Total Net Assets. |
| (e) | Fair valued security under the procedures approved by the Fund’s Board of Trustees. |
| See Notes to Financial Statements. |
Semi-Annual Report | October 31, 2014 |
33 |
Table of Contents
| Grandeur Peak International Opportunities Fund | Portfolio of Investments | |
October 31, 2014 (Unaudited) |
Common Abbreviations:
AB - Aktiebolag is the Swedish equivalent of the term corporation.
ADR - American Depositary Receipt.
AG - Aktiengesellschaft is a German term that refers to a corporation that is limited by shares, i.e., owned by shareholders.
AS - Aktieselskab is the Danish term for a stock-based corporation.
ASA - Allmennaksjeselskap is the Norwegian term for public limited company.
Bhd - Berhad is the Malaysian term for public limited company.
GDR - Global Depositary Receipt.
Ltd. - Limited.
NV - Naamloze Vennootschap is the Dutch term for a public limited liability corporation.
OYJ - Julkinen Osakeyhtiö is the Finnish term for a public limited company.
PCL - Public Company Limited.
PJSC - Public Joint Stock Company.
PLC - Public Limited Company.
REIT - Real Estate Investment Trust.
SA - Generally designates corporations in various countries, mostly those employing the civil law.
SAB de CV - A variable capital company.
SE - A European Company which can operate on a Europe-wide basis and be governed by community law directly applicable in all member states.
Tbk PT - Terbuka Perseroan Terbatas is an Indonesian term for a limited liability company.
Currency Abbreviations:
MYR - Malaysian Ringgit
Holdings are subject to change.
For Fund compliance purposes, the Fund’s geographical classifications refer to any one or more of the country sub-classifications used by one or more widely recognized market indexes or ratings group indexes, and/or as defined by Fund management. This definition may not apply for purposes of this report, which may combine sub-classifications for reporting ease. Geographical regions are shown as a percentage of net assets.
See Notes to Financial Statements.
34 |
1.855.377.7325 | www.GrandeurPeakGlobal.com |
Table of Contents
| Grandeur Peak Funds® | Statements of Assets and Liabilities | |
October 31, 2014 (Unaudited) |
Grandeur Peak | Grandeur Peak Fund | Grandeur Peak Global Reach Fund | Grandeur Peak International Opportunities Fund | |||||||||||||||||||||||||
| ||||||||||||||||||||||||||||
ASSETS | ||||||||||||||||||||||||||||
Investments, at value (Cost - see below) | $ | 397,698,616 | $ | 689,790,880 | $ | 286,068,996 | $ | 723,115,025 | ||||||||||||||||||||
Cash | 37,298,567 | 8,842,714 | 31,448,652 | 85,774,073 | ||||||||||||||||||||||||
Foreign cash, at value (Cost $1,583,110, $994,097, $1,556,532 and $1,494,259, respectively) | 1,580,106 | 990,793 | 1,548,594 | 1,492,834 | ||||||||||||||||||||||||
Dividends and interest receivable | 104,278 | 794,214 | 235,347 | 995,004 | ||||||||||||||||||||||||
Receivable for investments sold | 2,533,450 | 1,838,301 | 1,765,414 | 2,535,553 | ||||||||||||||||||||||||
Receivable for fund shares subscribed | 7,820 | 150,068 | 3,131,412 | 54,721 | ||||||||||||||||||||||||
Deferred offering cost | 3,563 | – | – | – | ||||||||||||||||||||||||
Prepaid and other assets | 36,446 | 32,867 | 24,919 | 33,409 | ||||||||||||||||||||||||
| ||||||||||||||||||||||||||||
Total assets | 439,262,846 | 702,439,837 | 324,223,334 | 814,000,619 | ||||||||||||||||||||||||
| ||||||||||||||||||||||||||||
LIABILITIES | ||||||||||||||||||||||||||||
Payable for investments purchased | 666,894 | 1,423,967 | 4,873,502 | 1,214,314 | ||||||||||||||||||||||||
Foreign capital gains tax | 2,003,586 | 1,444,807 | 723,296 | 2,115,219 | ||||||||||||||||||||||||
Payable for fund shares redeemed | 1,502 | 134,786 | 33,346 | 200,707 | ||||||||||||||||||||||||
Advisory fees payable | 493,942 | 723,084 | 279,357 | 849,451 | ||||||||||||||||||||||||
Administration fees payable | 13,865 | 23,174 | 11,403 | 27,062 | ||||||||||||||||||||||||
Custodian fees payable | 136,054 | 127,535 | 100,202 | 200,834 | ||||||||||||||||||||||||
Payable for trustee fees and expenses | 1,204 | 6,453 | 488 | 6,838 | ||||||||||||||||||||||||
Payable for chief compliance officer fee | 119 | 1,745 | 69 | 1,748 | ||||||||||||||||||||||||
Payable for principal financial officer fees | 54 | 434 | 48 | 434 | ||||||||||||||||||||||||
Distribution and service fees payable | 9,323 | 41,860 | 17,532 | 31,813 | ||||||||||||||||||||||||
Payable for transfer agency fees | 2,922 | 8,856 | 2,589 | 6,879 | ||||||||||||||||||||||||
Accrued expenses and other liabilities | 34,562 | 27,567 | 22,487 | 29,839 | ||||||||||||||||||||||||
| ||||||||||||||||||||||||||||
Total liabilities | 3,364,027 | 3,964,268 | 6,064,319 | 4,685,138 | ||||||||||||||||||||||||
| ||||||||||||||||||||||||||||
NET ASSETS | $ | 435,898,819 | $ | 698,475,569 | $ | 318,159,015 | $ | 809,315,481 | ||||||||||||||||||||
| ||||||||||||||||||||||||||||
NET ASSETS CONSISTS OF | ||||||||||||||||||||||||||||
Paid-in capital (Note 5) | $ | 409,785,336 | $ | 548,122,370 | $ | 306,031,983 | $ | 661,665,711 | ||||||||||||||||||||
Accumulated net investment income | 2,136,785 | 1,465,335 | 504,157 | 3,257,356 | ||||||||||||||||||||||||
Accumulated net realized gain on investments and foreign currency transactions | 7,885,266 | 44,861,716 | 3,161,780 | 47,923,120 | ||||||||||||||||||||||||
Net unrealized appreciation on investments and translation of assets and liabilities in foreign currencies | 16,091,432 | 104,026,148 | 8,461,095 | 96,469,294 | ||||||||||||||||||||||||
| ||||||||||||||||||||||||||||
NET ASSETS | $ | 435,898,819 | $ | 698,475,569 | $ | 318,159,015 | $ | 809,315,481 | ||||||||||||||||||||
| ||||||||||||||||||||||||||||
INVESTMENTS, AT COST | $ | 379,595,829 | $ | 584,304,281 | $ | 276,885,540 | $ | 624,511,233 | ||||||||||||||||||||
PRICING OF SHARES | ||||||||||||||||||||||||||||
Investor Class | ||||||||||||||||||||||||||||
Net Assets | $ | 44,506,671 | $ | 202,033,846 | $ | 84,244,157 | $ | 151,968,464 | ||||||||||||||||||||
Net Asset Value, offering and redemption price per share | $ | 11.10 | $ | 3.38 | $ | 12.73 | $ | 3.42 | ||||||||||||||||||||
Shares of beneficial interest outstanding | 4,011,089 | 59,761,486 | 6,618,491 | 44,499,116 | ||||||||||||||||||||||||
Institutional Class | ||||||||||||||||||||||||||||
Net Assets | $ | 391,392,149 | $ | 496,441,723 | $ | 233,914,859 | $ | 657,347,017 | ||||||||||||||||||||
Net Asset Value, offering and redemption price per share | $ | 11.12 | $ | 3.41 | $ | 12.74 | $ | 3.43 | ||||||||||||||||||||
Shares of beneficial interest outstanding | 35,209,928 | 145,699,853 | 18,366,626 | 191,708,771 | ||||||||||||||||||||||||
See Notes to Financial Statements.
Semi-Annual Report | October 31, 2014 |
35 |
Table of Contents
| Grandeur Peak Funds® | Statements of Operations | |
| For the Six Months Ended October 31, 2014 (Unaudited) |
Grandeur Peak | Grandeur Peak Global Opportunities Fund | Grandeur Peak Global Reach Fund | Grandeur Peak International Opportunities Fund | |||||||||||||||||||||||||||
| ||||||||||||||||||||||||||||||
INVESTMENT INCOME | ||||||||||||||||||||||||||||||
Dividends | $ | 5,850,211 | $ | 7,882,054 | $ | 2,117,900 | $ | 10,584,180 | ||||||||||||||||||||||
Interest | 851 | 5,508 | 672 | 13,406 | ||||||||||||||||||||||||||
Foreign taxes withheld | (461,063) | (513,636) | (140,889) | (816,276) | ||||||||||||||||||||||||||
| ||||||||||||||||||||||||||||||
Total investment income | 5,389,999 | 7,373,926 | 1,977,683 | 9,781,310 | ||||||||||||||||||||||||||
| ||||||||||||||||||||||||||||||
EXPENSES | ||||||||||||||||||||||||||||||
Investment advisor fees (Note 6) | 2,524,340 | 4,506,323 | 1,112,505 | 5,202,415 | ||||||||||||||||||||||||||
Recoupment of previously waived fees (Note 6) | 39,198 | – | – | – | ||||||||||||||||||||||||||
Administrative fees | 70,630 | 131,743 | 48,243 | 151,947 | ||||||||||||||||||||||||||
Distribution and service fees - Investor Class | 46,362 | 265,492 | 75,292 | 195,767 | ||||||||||||||||||||||||||
Transfer agent fees | 18,282 | 44,214 | 23,129 | 34,354 | ||||||||||||||||||||||||||
Professional fees | 13,817 | 17,570 | 12,795 | 18,197 | ||||||||||||||||||||||||||
Printing fees | 4,584 | 16,965 | 5,238 | 13,558 | ||||||||||||||||||||||||||
Registration fees | 29,392 | 18,831 | 24,688 | 18,974 | ||||||||||||||||||||||||||
Custodian fees | 202,372 | 168,953 | 152,820 | 254,907 | ||||||||||||||||||||||||||
Trustee fees and expenses | 4,569 | 11,090 | 2,362 | 12,492 | ||||||||||||||||||||||||||
Chief compliance officer fees | 3,038 | 7,444 | 1,524 | 8,342 | ||||||||||||||||||||||||||
Principal financial officer fees | 784 | 1,858 | 411 | 2,083 | ||||||||||||||||||||||||||
Offering costs | 19,783 | – | 8,040 | – | ||||||||||||||||||||||||||
Other expenses | 4,389 | 12,308 | 3,935 | 13,448 | ||||||||||||||||||||||||||
| ||||||||||||||||||||||||||||||
Total expenses | 2,981,540 | 5,202,791 | 1,470,982 | 5,926,484 | ||||||||||||||||||||||||||
Less fees waived/reimbursed by investment advisor (Note 6) | – | – | (30,342) | – | ||||||||||||||||||||||||||
| ||||||||||||||||||||||||||||||
Total net expenses | 2,981,540 | 5,202,791 | 1,440,640 | 5,926,484 | ||||||||||||||||||||||||||
| ||||||||||||||||||||||||||||||
NET INVESTMENT INCOME | 2,408,459 | 2,171,135 | 537,043 | 3,854,826 | ||||||||||||||||||||||||||
| ||||||||||||||||||||||||||||||
REALIZED AND UNREALIZED GAIN/(LOSS) ON INVESTMENTS | ||||||||||||||||||||||||||||||
Net realized gain on investments | 6,513,368 | 31,327,066 | 2,026,895 | 31,563,313 | ||||||||||||||||||||||||||
Net realized gain/(loss) on foreign currency transactions | (76,238) | 72,606 | (33,768) | 163,717 | ||||||||||||||||||||||||||
Net change in unrealized appreciation/(depreciation) on investments (net of foreign capital gains tax of $2,003,586, $1,444,807, $723,296 and $2,115,219, respectively) | 6,510,877 | (18,865,826) | 1,343,760 | (32,421,003) | ||||||||||||||||||||||||||
Net change in unrealized appreciation/(depreciation) on translation of assets and liabilities in foreign currencies | (31,037) | (260,959) | 7,841 | (399,214) | ||||||||||||||||||||||||||
| ||||||||||||||||||||||||||||||
NET REALIZED AND UNREALIZED GAIN/(LOSS) ON INVESTMENTS AND FOREIGN CURRENCY TRANSACTIONS | 12,916,970 | 12,272,887 | 3,344,728 | (1,093,187) | ||||||||||||||||||||||||||
| ||||||||||||||||||||||||||||||
NET INCREASE IN NET ASSETS RESULTING FROM OPERATIONS | $ | 15,325,429 | $ | 14,444,022 | $ | 3,881,771 | $ | 2,761,639 | ||||||||||||||||||||||
| ||||||||||||||||||||||||||||||
See Notes to Financial Statements.
36 |
1.855.377.7325 | www.GrandeurPeakGlobal.com |
Table of Contents
| Grandeur Peak Emerging Markets Opportunities Fund | Changes in Net Assets | |
For the Six Months Ended October 31, 2014 | For the Period (Inception) to | |||||||||||||
| ||||||||||||||
OPERATIONS | ||||||||||||||
Net investment income/(loss) | $ | 2,408,459 | $ | (257,649) | ||||||||||
Net realized gain on investments and foreign currency transactions | 6,437,130 | 1,401,415 | ||||||||||||
Net change in unrealized appreciation on investments and foreign currency translations | 6,479,840 | 9,611,592 | ||||||||||||
| ||||||||||||||
Net increase in net assets resulting from operations | 15,325,429 | 10,755,358 | ||||||||||||
| ||||||||||||||
CAPITAL SHARE TRANSACTIONS (NOTE 5) | ||||||||||||||
Investor Class | ||||||||||||||
Proceeds from sales of shares | 18,127,330 | 28,115,421 | ||||||||||||
Cost of shares redeemed | (3,012,231) | (1,134,670) | ||||||||||||
Redemption fees | 359 | 2,526 | ||||||||||||
| ||||||||||||||
Net increase from capital shares transactions | 15,115,458 | 26,983,277 | ||||||||||||
| ||||||||||||||
Institutional Class | ||||||||||||||
Proceeds from sales of shares | 123,314,498 | 246,808,127 | ||||||||||||
Cost of shares redeemed | (1,628,630) | (776,919) | ||||||||||||
Redemption fees | 1,168 | 1,053 | ||||||||||||
| ||||||||||||||
Net increase from capital shares transactions | 121,687,036 | 246,032,261 | ||||||||||||
| ||||||||||||||
Net increase in net assets | 152,127,923 | 283,770,896 | ||||||||||||
| ||||||||||||||
NET ASSETS | ||||||||||||||
Beginning of period | 283,770,896 | – | ||||||||||||
| ||||||||||||||
End of period* | $ | 435,898,819 | $ | 283,770,896 | ||||||||||
| ||||||||||||||
*Including accumulated net investment income/(loss) of: | $ | 2,136,785 | $ | (271,674) | ||||||||||
OTHER INFORMATION | ||||||||||||||
Shares Transactions | ||||||||||||||
Investor Class | ||||||||||||||
Issued | 1,627,458 | 2,766,379 | ||||||||||||
Redeemed | (271,472) | (111,276) | ||||||||||||
| ||||||||||||||
Net increase in share transactions | 1,355,986 | 2,655,103 | ||||||||||||
| ||||||||||||||
Institutional Class | ||||||||||||||
Issued | 11,082,602 | 24,349,676 | ||||||||||||
Redeemed | (147,740) | (74,610) | ||||||||||||
| ||||||||||||||
Net increase in share transactions | 10,934,862 | 24,275,066 | ||||||||||||
| ||||||||||||||
See Notes to Financial Statements.
Semi-Annual Report | October 31, 2014 |
37 |
Table of Contents
| Grandeur Peak Global Opportunities Fund | Statements of Changes in Net Assets | |
| For the | ||||||||
| Six Months Ended | For the | |||||||
| October 31, 2014 | Year Ended | |||||||
| (Unaudited) | April 30, 2014 | |||||||
| ||||||||
OPERATIONS | ||||||||
Net investment income/(loss) | $ | 2,171,135 | $ | (1,238) | ||||
Net realized gain on investments and foreign currency transactions | 31,399,672 | 35,369,394 | ||||||
Net change in unrealized appreciation/(depreciation) on investments and foreign currency translations | (19,126,785) | 71,580,303 | ||||||
| ||||||||
Net increase in net assets resulting from operations | 14,444,022 | 106,948,459 | ||||||
| ||||||||
DISTRIBUTIONS TO SHAREHOLDERS (NOTE 3) | ||||||||
Net investment income | ||||||||
Investor Class | – | – | ||||||
Institutional Class | – | (550,548) | ||||||
Net realized gains on investments | ||||||||
Investor Class | – | (7,710,181) | ||||||
Institutional Class | – | (16,434,044) | ||||||
| ||||||||
Net decrease in net assets from distributions | – | (24,694,773) | ||||||
| ||||||||
CAPITAL SHARE TRANSACTIONS (NOTE 5) | ||||||||
Investor Class | ||||||||
Proceeds from sales of shares | 6,988,101 | 77,017,540 | ||||||
Distributions reinvested | – | 7,430,355 | ||||||
Cost of shares redeemed | (25,568,223) | (29,512,700) | ||||||
Redemption fees | 230 | 3,666 | ||||||
| ||||||||
Net increase/(decrease) from capital shares transactions | (18,579,892) | 54,938,861 | ||||||
| ||||||||
Institutional Class | ||||||||
Proceeds from sales of shares | 18,724,965 | 236,191,571 | ||||||
Distributions reinvested | – | 16,039,187 | ||||||
Cost of shares redeemed | (25,229,868) | (30,650,202) | ||||||
Redemption fees | 21 | 5,551 | ||||||
| ||||||||
Net increase/(decrease) from capital shares transactions | (6,504,882) | 221,586,107 | ||||||
| ||||||||
Net increase/(decrease) in net assets | (10,640,752) | 358,778,654 | ||||||
| ||||||||
NET ASSETS | ||||||||
Beginning of period | 709,116,321 | 350,337,667 | ||||||
| ||||||||
End of period* | $ | 698,475,569 | $ | 709,116,321 | ||||
| ||||||||
*Including accumulated net investment income/(loss) of: | $ | 1,465,335 | $ | (705,800) | ||||
OTHER INFORMATION | ||||||||
Shares Transactions | ||||||||
Investor Class | ||||||||
Issued | 2,062,295 | 24,473,188 | ||||||
Issued in lieu of cash distributions | – | 2,286,263 | ||||||
Redeemed | (7,535,646) | (9,301,622) | ||||||
| ||||||||
Net increase/(decrease) in share transactions | (5,473,351) | 17,457,829 | ||||||
| ||||||||
Institutional Class | ||||||||
Issued | 5,470,336 | 74,111,902 | ||||||
Issued in lieu of cash distributions | – | 4,904,950 | ||||||
Redeemed | (7,450,597) | (9,571,700) | ||||||
| ||||||||
Net increase/(decrease) in share transactions | (1,980,261) | 69,445,152 | ||||||
| ||||||||
See Notes to Financial Statements.
38 |
1.855.377.7325 | www.GrandeurPeakGlobal.com |
Table of Contents
| Grandeur Peak Global Reach Fund | Statements of Changes in Net Assets | |
For the Six Months Ended | For the Period June 19, 2013 (Inception) to April 30, 2014 | |||||||
| ||||||||
OPERATIONS | ||||||||
Net investment income | $ | 537,043 | $ | 32,885 | ||||
Net realized gain on investments and foreign currency transactions | 1,993,127 | 1,579,849 | ||||||
Net change in unrealized appreciation on investments and foreign currency translations | 1,351,601 | 7,109,494 | ||||||
| ||||||||
Net increase in net assets resulting from operations | 3,881,771 | 8,722,228 | ||||||
| ||||||||
DISTRIBUTIONS TO SHAREHOLDERS (NOTE 3) | ||||||||
Net investment income | ||||||||
Investor Class | – | (44,891) | ||||||
Institutional Class | – | (108,748) | ||||||
Net realized gains on investments | ||||||||
Investor Class | – | (171,869) | ||||||
Institutional Class | – | (195,310) | ||||||
| ||||||||
Net decrease in net assets from distributions | – | (520,818) | ||||||
| ||||||||
CAPITAL SHARE TRANSACTIONS (NOTE 5) | ||||||||
Investor Class | ||||||||
Proceeds from sales of shares | 44,356,996 | 56,808,405 | ||||||
Distributions reinvested | – | 209,868 | ||||||
Cost of shares redeemed | (7,196,987) | (13,615,726) | ||||||
Redemption fees | 10,146 | 7,176 | ||||||
| ||||||||
Net increase from capital shares transactions | 37,170,155 | 43,409,723 | ||||||
| ||||||||
Institutional Class | ||||||||
Proceeds from sales of shares | 146,550,211 | 86,258,768 | ||||||
Distributions reinvested | – | 295,528 | ||||||
Cost of shares redeemed | (3,919,291) | (3,696,595) | ||||||
Redemption fees | 2,503 | 4,832 | ||||||
| ||||||||
Net increase from capital shares transactions | 142,633,423 | 82,862,533 | ||||||
| ||||||||
Net increase in net assets | 183,685,349 | 134,473,666 | ||||||
| ||||||||
NET ASSETS | ||||||||
Beginning of period | 134,473,666 | – | ||||||
| ||||||||
End of period* | $ | 318,159,015 | $ | 134,473,666 | ||||
| ||||||||
*Including accumulated net investment income/(loss) of: | $ | 504,157 | $ | (32,886) | ||||
OTHER INFORMATION | ||||||||
Shares Transactions | ||||||||
Investor Class | ||||||||
Issued | 3,470,401 | 4,831,859 | ||||||
Issued in lieu of cash distributions | – | 17,984 | ||||||
Redeemed | (566,619) | (1,135,134) | ||||||
| ||||||||
Net increase in share transactions | 2,903,782 | 3,714,709 | ||||||
| ||||||||
Institutional Class | ||||||||
Issued | 11,565,976 | 7,398,753 | ||||||
Issued in lieu of cash distributions | – | 25,367 | ||||||
Redeemed | (310,468) | (313,002) | ||||||
| ||||||||
Net increase in share transactions | 11,255,508 | 7,111,118 | ||||||
| ||||||||
See Notes to Financial Statements.
Semi-Annual Report | October 31, 2014 |
39 |
Table of Contents
| Grandeur Peak International Opportunities Fund | Statements of Changes in Net Assets | |
For the Six Months Ended | For the Year Ended | |||||||||||
| ||||||||||||
OPERATIONS | ||||||||||||
Net investment income | $ | 3,854,826 | $ | 2,180,239 | ||||||||
Net realized gain on investments and foreign currency transactions | 31,727,030 | 32,761,153 | ||||||||||
Net change in unrealized appreciation/(depreciation) on investments and foreign currency translations | (32,820,217) | 90,655,973 | ||||||||||
| ||||||||||||
Net increase in net assets resulting from operations | 2,761,639 | 125,597,365 | ||||||||||
| ||||||||||||
DISTRIBUTIONS TO SHAREHOLDERS (NOTE 3) | ||||||||||||
Net investment income | ||||||||||||
Investor Class | – | (850,286) | ||||||||||
Institutional Class | – | (4,248,374) | ||||||||||
Net realized gains on investments | ||||||||||||
Investor Class | – | (3,131,062) | ||||||||||
Institutional Class | – | (12,702,647) | ||||||||||
| ||||||||||||
Net decrease in net assets from distributions | – | (20,932,369) | ||||||||||
| ||||||||||||
CAPITAL SHARE TRANSACTIONS (NOTE 5) | ||||||||||||
Investor Class | ||||||||||||
Proceeds from sales of shares | 7,310,157 | 55,833,951 | ||||||||||
Distributions reinvested | – | 3,836,965 | ||||||||||
Cost of shares redeemed | (9,037,189) | (23,996,762) | ||||||||||
Redemption fees | 55 | 9,771 | ||||||||||
| ||||||||||||
Net increase/(decrease) from capital shares transactions | (1,726,977) | 35,683,925 | ||||||||||
| ||||||||||||
Institutional Class | ||||||||||||
Proceeds from sales of shares | 14,873,981 | 332,595,278 | ||||||||||
Distributions reinvested | – | 15,198,982 | ||||||||||
Cost of shares redeemed | (18,016,810) | (24,245,014) | ||||||||||
Redemption fees | 1,138 | 12,327 | ||||||||||
| ||||||||||||
Net increase/(decrease) from capital shares transactions | (3,141,691) | 323,561,573 | ||||||||||
| ||||||||||||
Net increase/(decrease) in net assets | (2,107,029) | 463,910,494 | ||||||||||
| ||||||||||||
NET ASSETS | ||||||||||||
Beginning of period | 811,422,510 | 347,512,016 | ||||||||||
| ||||||||||||
End of period* | $ | 809,315,481 | �� | $ | 811,422,510 | |||||||
| ||||||||||||
*Including accumulated net investment income/(loss) of: | $ | 3,257,356 | $ | (597,470) | ||||||||
OTHER INFORMATION | ||||||||||||
Shares Transactions | ||||||||||||
Investor Class | ||||||||||||
Issued | 2,108,899 | 17,554,569 | ||||||||||
Issued in lieu of cash distributions | – | 1,195,316 | ||||||||||
Redeemed | (2,603,973) | (7,842,523) | ||||||||||
| ||||||||||||
Net increase/(decrease) in share transactions | (495,074) | 10,907,362 | ||||||||||
| ||||||||||||
Institutional Class | ||||||||||||
Issued | 4,291,597 | 107,001,298 | ||||||||||
Issued in lieu of cash distributions | – | 4,720,181 | ||||||||||
Redeemed | (5,219,511) | (7,558,233) | ||||||||||
| ||||||||||||
Net increase/(decrease) in share transactions | (927,914) | 104,163,246 | ||||||||||
| ||||||||||||
See Notes to Financial Statements.
40 |
1.855.377.7325 | www.GrandeurPeakGlobal.com |
Table of Contents
| Grandeur Peak Emerging Markets Opportunities Fund | Financial Highlights | |
For a Share Outstanding Throughout the Periods Presented | ||
| Investor Class | For the Six Months Ended October 31, 2014 (Unaudited) | For the Period December 16, 2013 (Inception) to April 30, 2014 | ||||||
| ||||||||
NET ASSET VALUE, BEGINNING OF PERIOD | $ 10.53 | $ 10.00 | ||||||
INCOME FROM INVESTMENT OPERATIONS | ||||||||
Net investment income/(loss)(a) | 0.06 | (0.05) | ||||||
Net realized and unrealized gain on investments | 0.51 | 0.58 | ||||||
| ||||||||
Total income from investment operations | 0.57 | 0.53 | ||||||
| ||||||||
REDEMPTION FEES ADDED TO PAID-IN CAPITAL | 0.00 | (b) | 0.00(b) | |||||
| ||||||||
INCREASE IN NET ASSET VALUE | 0.57 | 0.53 | ||||||
| ||||||||
NET ASSET VALUE, END OF PERIOD | $ 11.10 | $ 10.53 | ||||||
| ||||||||
| ||||||||
TOTAL RETURN | 5.41% | (c) | 5.30%(c) | |||||
RATIOS AND SUPPLEMENTAL DATA | ||||||||
Net assets, end of period (in 000s) | $ 44,507 | $ 27,952 | ||||||
RATIOS TO AVERAGE NET ASSETS | ||||||||
Expenses (excluding fees waived/reimbursed by investment advisor) | 1.82% | (d) | 2.01%(d)(e) | |||||
Expenses (including fees waived/reimbursed by investment advisor) | 1.82% | (d) | 1.95%(d)(e) | |||||
Net investment income/(loss) | 1.04% | (d) | (0.55)%(d) | |||||
PORTFOLIO TURNOVER RATE | 22% | (c) | 26%(c) | |||||
| (a) | Per share numbers have been calculated using the average shares method. |
| (b) | Less than $0.005 or ($0.005) per share. |
| (c) | Not Annualized. |
| (d) | Annualized. |
| (e) | Expense ratios during startup periods may not be representative of longer term operating periods. |
See Notes to Financial Statements.
Semi-Annual Report | October 31, 2014 |
41 |
Table of Contents
| Grandeur Peak Emerging Markets Opportunities Fund | Financial Highlights | |
For a Share Outstanding Throughout the Periods Presented | ||
| Institutional Class | For the Six Months Ended October 31, 2014 (Unaudited) | For the Period December 16, 2013 (Inception) to April 30, 2014 | ||||||
| ||||||||
NET ASSET VALUE, BEGINNING OF PERIOD | $ 10.54 | $ 10.00 | ||||||
INCOME FROM INVESTMENT OPERATIONS | ||||||||
Net investment income/(loss)(a) | 0.07 | (0.03) | ||||||
Net realized and unrealized gain on investments | 0.51 | 0.57 | ||||||
| ||||||||
Total income from investment operations | 0.58 | 0.54 | ||||||
| ||||||||
REDEMPTION FEES ADDED TO PAID-IN CAPITAL | 0.00 | (b) | 0.00(b) | |||||
| ||||||||
INCREASE IN NET ASSET VALUE | 0.58 | 0.54 | ||||||
| ||||||||
NET ASSET VALUE, END OF PERIOD | $ 11.12 | $ 10.54 | ||||||
| ||||||||
| ||||||||
TOTAL RETURN | 5.50% | (c) | 5.40%(c) | |||||
RATIOS AND SUPPLEMENTAL DATA | ||||||||
Net assets, end of period (in 000s) | $ 391,392 | $ 255,819 | ||||||
RATIOS TO AVERAGE NET ASSETS | ||||||||
Expenses (excluding fees waived/reimbursed by investment advisor) | 1.57% | (d) | 1.76%(d)(e) | |||||
Expenses (including fees waived/reimbursed by investment advisor) | 1.57% | (d) | 1.70%(d)(e) | |||||
Net investment income/(loss) | 1.32% | (d) | (0.37)%(d) | |||||
PORTFOLIO TURNOVER RATE | 22% | (c) | 26%(c) | |||||
| (a) | Per share numbers have been calculated using the average shares method. |
| (b) | Less than $0.005 or ($0.005) per share. |
| (c) | Not Annualized. |
| (d) | Annualized. |
| (e) | Expense ratios during startup periods may not be representative of longer term operating periods. |
See Notes to Financial Statements.
42 |
1.855.377.7325 | www.GrandeurPeakGlobal.com |
Table of Contents
| Grandeur Peak Global Opportunities Fund | Financial Highlights | |
For a Share Outstanding Throughout the Periods Presented | ||
| Investor Class | For the Six Months Ended October 31, 2014 (Unaudited) | Year Ended April 30, 2014 | Year Ended April 30, 2013 | For the Period October 17, 2011 (Inception) to April 30, 2012 | ||||||||||||
| ||||||||||||||||
NET ASSET VALUE, BEGINNING OF PERIOD | $ 3.31 | $ | 2.77 | $ | 2.31 | $ 2.00 | ||||||||||
INCOME FROM INVESTMENT OPERATIONS | ||||||||||||||||
Net investment income/(loss)(a) | 0.01 | (0.00) | (b) | 0.00 | (b) | (0.00)(b) | ||||||||||
Net realized and unrealized gain on investments | 0.06 | 0.67 | 0.51 | 0.31 | ||||||||||||
| ||||||||||||||||
Total income from investment operations | 0.07 | 0.67 | 0.51 | 0.31 | ||||||||||||
| ||||||||||||||||
DISTRIBUTIONS | ||||||||||||||||
From net investment income | – | – | (0.01) | – | ||||||||||||
From net realized gain on investments | – | (0.13) | (0.04) | – | ||||||||||||
| ||||||||||||||||
Total distributions | – | (0.13) | (0.05) | – | ||||||||||||
| ||||||||||||||||
REDEMPTION FEES ADDED TO PAID-IN CAPITAL | 0.00 | (b) | 0.00 | (b) | 0.00 | (b) | 0.00(b) | |||||||||
| ||||||||||||||||
INCREASE IN NET ASSET VALUE | 0.07 | 0.54 | 0.46 | 0.31 | ||||||||||||
| ||||||||||||||||
NET ASSET VALUE, END OF PERIOD | $ 3.38 | $ | 3.31 | $ | 2.77 | $ 2.31 | ||||||||||
| ||||||||||||||||
| ||||||||||||||||
TOTAL RETURN | 2.11% | (c) | 24.31% | 22.34% | 15.50%(c) | |||||||||||
RATIOS AND SUPPLEMENTAL DATA | ||||||||||||||||
Net assets, end of period (in 000s) | $ 202,034 | $ | 216,247 | $ | 132,384 | $ 73,154 | ||||||||||
RATIOS TO AVERAGE NET ASSETS | ||||||||||||||||
Expenses (excluding fees waived/ reimbursed by investment advisor) | 1.62% | (d) | 1.68% | 1.76% | 2.30%(d) | |||||||||||
Expenses (including fees waived/ reimbursed by investment advisor) | 1.62% | (d) | 1.68% | 1.75% | 1.75%(d) | |||||||||||
Net investment income/(loss) | 0.43% | (d) | (0.15)% | 0.19% | (0.04)%(d) | |||||||||||
PORTFOLIO TURNOVER RATE | 20% | (c) | 38% | 35% | 42%(c) | |||||||||||
| (a) | Per share numbers have been calculated using the average shares method. |
| (b) | Less than $0.005 or ($0.005) per share. |
| (c) | Not Annualized. |
| (d) | Annualized. |
See Notes to Financial Statements.
Semi-Annual Report | October 31, 2014 |
43 |
Table of Contents
| Grandeur Peak Global Opportunities Fund | Financial Highlights | |
For a Share Outstanding Throughout the Periods Presented | ||
| Institutional Class | For the Six Months Ended October 31, 2014 (Unaudited) | Year Ended April 30, 2014 | Year Ended April 30, 2013 | For the Period October 17, 2011 (Inception) to April 30, 2012 | ||||||||||||
| ||||||||||||||||
NET ASSET VALUE, BEGINNING OF PERIOD | $ 3.34 | $ | 2.79 | $ | 2.32 | $ 2.00 | ||||||||||
INCOME FROM INVESTMENT OPERATIONS | ||||||||||||||||
Net investment income(a) | 0.01 | 0.00 | (b) | 0.01 | 0.00(b) | |||||||||||
Net realized and unrealized gain on investments | 0.06 | 0.68 | 0.52 | 0.32 | ||||||||||||
| ||||||||||||||||
Total income from investment operations | 0.07 | 0.68 | 0.53 | 0.32 | ||||||||||||
| ||||||||||||||||
DISTRIBUTIONS | ||||||||||||||||
From net investment income | – | (0.00) | (b) | (0.02) | – | |||||||||||
From net realized gain on investments | – | (0.13) | (0.04) | – | ||||||||||||
| ||||||||||||||||
Total distributions | – | (0.13) | (0.06) | – | ||||||||||||
| ||||||||||||||||
REDEMPTION FEES ADDED TO PAID-IN CAPITAL | 0.00 | (b) | 0.00 | (b) | 0.00 | (b) | 0.00(b) | |||||||||
| ||||||||||||||||
INCREASE IN NET ASSET VALUE | 0.07 | 0.55 | 0.47 | 0.32 | ||||||||||||
| ||||||||||||||||
NET ASSET VALUE, END OF PERIOD | $ 3.41 | $ | 3.34 | $ | 2.79 | $ 2.32 | ||||||||||
| ||||||||||||||||
| ||||||||||||||||
TOTAL RETURN | 2.10% | (c) | 24.67% | 22.86% | 16.00%(c) | |||||||||||
RATIOS AND SUPPLEMENTAL DATA | ||||||||||||||||
Net assets, end of period (in 000s) | $ 496,442 | $ | 492,869 | $ | 217,953 | $ 77,737 | ||||||||||
RATIOS TO AVERAGE NET ASSETS | ||||||||||||||||
Expenses (excluding fees waived/ reimbursed by investment advisor) | 1.37% | (d) | 1.44% | 1.51% | 2.03%(d) | |||||||||||
Expenses (including fees waived/ reimbursed by investment advisor) | 1.37% | (d) | 1.44% | 1.50% | 1.50%(d) | |||||||||||
Net investment income | 0.67% | (d) | 0.08% | 0.37% | 0.40%(d) | |||||||||||
PORTFOLIO TURNOVER RATE | 20% | (c) | 38% | 35% | 42%(c) | |||||||||||
| (a) | Per share numbers have been calculated using the average shares method. |
| (b) | Less than $0.005 or ($0.005) per share. |
| (c) | Not Annualized. |
| (d) | Annualized. |
See Notes to Financial Statements.
44 |
1.855.377.7325 | www.GrandeurPeakGlobal.com |
Table of Contents
| Grandeur Peak Global Reach Fund | Financial Highlights | |
For a Share Outstanding Throughout the Periods Presented | ||
| Investor Class | For the Six Months Ended October 31, 2014 (Unaudited) | For the Period June 19, 2013 (Inception) to April 30, 2014 | ||||||
| ||||||||
NET ASSET VALUE, BEGINNING OF PERIOD | $ 12.43 | $ | 10.00 | |||||
INCOME FROM INVESTMENT OPERATIONS | ||||||||
Net investment income/(loss)(a) | 0.02 | (0.02) | ||||||
Net realized and unrealized gain on investments | 0.28 | 2.54 | ||||||
| ||||||||
Total income from investment operations | 0.30 | 2.52 | ||||||
| ||||||||
DISTRIBUTIONS | ||||||||
From net investment income | – | (0.02) | ||||||
From net realized gain on investments | – | (0.08) | ||||||
| ||||||||
Total distributions | – | (0.10) | ||||||
| ||||||||
REDEMPTION FEES ADDED TO PAID-IN CAPITAL | 0.00(b) | 0.01 | ||||||
| ||||||||
INCREASE IN NET ASSET VALUE | 0.30 | 2.43 | ||||||
| ||||||||
NET ASSET VALUE, END OF PERIOD | $ 12.73 | $ | 12.43 | |||||
| ||||||||
| ||||||||
TOTAL RETURN | 2.41%(c) | 25.31%(c) | ||||||
RATIOS AND SUPPLEMENTAL DATA | ||||||||
Net assets, end of period (in 000s) | $ 84,244 | $ | 46,163 | |||||
RATIOS TO AVERAGE NET ASSETS | ||||||||
Expenses (excluding fees waived/reimbursed by investment advisor) | 1.63%(d) | 1.91%(d)(e) | ||||||
Expenses (including fees waived/reimbursed by investment advisor) | 1.60%(d) | 1.60%(d)(e) | ||||||
Net investment income/(loss) | 0.38%(d) | (0.17)%(d) | ||||||
PORTFOLIO TURNOVER RATE | 16%(c) | 39%(c) | ||||||
| (a) | Per share numbers have been calculated using the average shares method. |
| (b) | Less than $0.005 or ($0.005) per share. |
| (c) | Not Annualized. |
| (d) | Annualized. |
| (e) | Expense ratios during startup periods may not be representative of longer term operating periods. |
See Notes to Financial Statements.
Semi-Annual Report | October 31, 2014 |
45 |
Table of Contents
| Grandeur Peak Global Reach Fund | Financial Highlights | |
For a Share Outstanding Throughout the Periods Presented | ||
| Institutional Class | For the Six Months Ended October 31, 2014 (Unaudited) | For the Period June 19, 2013 (Inception) to April 30, 2014 | ||||||
| ||||||||
NET ASSET VALUE, BEGINNING OF PERIOD | $ 12.42 | $ | 10.00 | |||||
INCOME FROM INVESTMENT OPERATIONS | ||||||||
Net investment income(a) | 0.04 | 0.02 | ||||||
Net realized and unrealized gain on investments | 0.28 | 2.52 | ||||||
| ||||||||
Total income from investment operations | 0.32 | 2.54 | ||||||
| ||||||||
DISTRIBUTIONS | ||||||||
From net investment income | – | (0.04) | ||||||
From net realized gain on investments | – | (0.08) | ||||||
| ||||||||
Total distributions | – | (0.12) | ||||||
| ||||||||
REDEMPTION FEES ADDED TO PAID-IN CAPITAL | 0.00(b) | 0.00(b) | ||||||
| ||||||||
INCREASE IN NET ASSET VALUE | 0.32 | 2.42 | ||||||
| ||||||||
NET ASSET VALUE, END OF PERIOD | $ 12.74 | $ | 12.42 | |||||
| ||||||||
| ||||||||
TOTAL RETURN | 2.58%(c) | 25.45%(c) | ||||||
RATIOS AND SUPPLEMENTAL DATA | ||||||||
Net assets, end of period (in 000s) | $ 233,915 | $ | 88,311 | |||||
RATIOS TO AVERAGE NET ASSETS | ||||||||
Expenses (excluding fees waived/reimbursed by investment advisor) | 1.38%(d) | 1.75%(d)(e) | ||||||
Expenses (including fees waived/reimbursed by investment advisor) | 1.35%(d) | 1.35%(d)(e) | ||||||
Net investment income | 0.59%(d) | 0.21%(d) | ||||||
PORTFOLIO TURNOVER RATE | 16%(c) | 39%(c) | ||||||
| (a) | Per share numbers have been calculated using the average shares method. |
| (b) | Less than $0.005 or ($0.005) per share. |
| (c) | Not Annualized. |
| (d) | Annualized. |
| (e) | Expense ratios during startup periods may not be representative of longer term operating periods. |
See Notes to Financial Statements.
46 |
1.855.377.7325 | www.GrandeurPeakGlobal.com |
Table of Contents
| Grandeur Peak International Opportunities Fund | Financial Highlights | |
For a Share Outstanding Throughout the Periods Presented | ||
| Investor Class | For the Six Months Ended October 31, 2014 (Unaudited) | Year Ended | Year Ended | For the Period October 17, 2011 (Inception) to April 30, 2012 | ||||||||||||||||||||||||||||||
| ||||||||||||||||||||||||||||||||||
NET ASSET VALUE, BEGINNING OF PERIOD | $ 3.41 | $ | 2.83 | $ | 2.29 | $ 2.00 | ||||||||||||||||||||||||||||
INCOME FROM INVESTMENT OPERATIONS | ||||||||||||||||||||||||||||||||||
Net investment income(a) | 0.01 | 0.01 | 0.01 | 0.00(b) | ||||||||||||||||||||||||||||||
Net realized and unrealized gain/(loss) on investments | (0.00) | (b) | 0.68 | 0.55 | 0.29 | |||||||||||||||||||||||||||||
| ||||||||||||||||||||||||||||||||||
Total income from investment operations | 0.01 | 0.69 | 0.56 | 0.29 | ||||||||||||||||||||||||||||||
| ||||||||||||||||||||||||||||||||||
DISTRIBUTIONS | ||||||||||||||||||||||||||||||||||
From net investment income | – | (0.02) | (0.01) | – | ||||||||||||||||||||||||||||||
From net realized gain on investments | – | (0.09) | (0.01) | – | ||||||||||||||||||||||||||||||
| ||||||||||||||||||||||||||||||||||
Total distributions | – | (0.11) | (0.02) | – | ||||||||||||||||||||||||||||||
| ||||||||||||||||||||||||||||||||||
REDEMPTION FEES ADDED TO PAID-IN CAPITAL | 0.00 | (b) | 0.00 | (b) | 0.00 | (b) | 0.00(b) | |||||||||||||||||||||||||||
| ||||||||||||||||||||||||||||||||||
INCREASE IN NET ASSET VALUE | 0.01 | 0.58 | 0.54 | 0.29 | ||||||||||||||||||||||||||||||
| ||||||||||||||||||||||||||||||||||
NET ASSET VALUE, END OF PERIOD | $ 3.42 | $ | 3.41 | $ | 2.83 | $ 2.29 | ||||||||||||||||||||||||||||
| ||||||||||||||||||||||||||||||||||
| ||||||||||||||||||||||||||||||||||
TOTAL RETURN | 0.29% | (c) | 24.59% | 24.57% | 14.50%(c) | |||||||||||||||||||||||||||||
RATIOS AND SUPPLEMENTAL DATA | ||||||||||||||||||||||||||||||||||
Net assets, end of period (in 000s) | $ 151,968 | $ | 153,296 | $ | 96,550 | $ 9,274 | ||||||||||||||||||||||||||||
RATIOS TO AVERAGE NET ASSETS | ||||||||||||||||||||||||||||||||||
Expenses (excluding fees waived/ reimbursed by investment advisor) | 1.63% | (d) | 1.73% | 1.88% | 2.94%(d) | |||||||||||||||||||||||||||||
Expenses (including fees waived/ reimbursed by investment advisor) | 1.63% | (d) | 1.73% | 1.75% | 1.75%(d) | |||||||||||||||||||||||||||||
Net investment income | 0.73% | (d) | 0.20% | 0.26% | 0.33%(d) | |||||||||||||||||||||||||||||
PORTFOLIO TURNOVER RATE | 17% | (c) | 37% | 52% | 24%(c) | |||||||||||||||||||||||||||||
| (a) | Per share numbers have been calculated using the average shares method. |
| (b) | Less than $0.005 or ($0.005) per share. |
| (c) | Not Annualized. |
| (d) | Annualized. |
See Notes to Financial Statements.
Semi-Annual Report | October 31, 2014 |
47 |
Table of Contents
| Grandeur Peak International Opportunities Fund | Financial Highlights | |
For a Share Outstanding Throughout the Periods Presented |
| Institutional Class | For the Six Months Ended | Year Ended | Year Ended | For the Period | ||||||||||||||||||||||||||
| ||||||||||||||||||||||||||||||
NET ASSET VALUE, BEGINNING OF PERIOD | $ 3.42 | $ | 2.84 | $ | 2.29 | $ 2.00 | ||||||||||||||||||||||||
INCOME FROM INVESTMENT OPERATIONS | ||||||||||||||||||||||||||||||
Net investment income(a) | 0.02 | 0.01 | 0.01 | 0.01 | ||||||||||||||||||||||||||
Net realized and unrealized gain/(loss) on investments | (0.01) | 0.69 | 0.57 | 0.28 | ||||||||||||||||||||||||||
| ||||||||||||||||||||||||||||||
Total income from investment operations | 0.01 | 0.70 | 0.58 | 0.29 | ||||||||||||||||||||||||||
| ||||||||||||||||||||||||||||||
DISTRIBUTIONS | ||||||||||||||||||||||||||||||
From net investment income | – | (0.03) | (0.02) | – | ||||||||||||||||||||||||||
From net realized gain on investments | – | (0.09) | (0.01) | – | ||||||||||||||||||||||||||
| ||||||||||||||||||||||||||||||
Total distributions | – | (0.12) | (0.03) | – | ||||||||||||||||||||||||||
| ||||||||||||||||||||||||||||||
REDEMPTION FEES ADDED TO PAID-IN CAPITAL | 0.00 | (b) | 0.00 | (b) | 0.00 | (b) | 0.00(b) | |||||||||||||||||||||||
| ||||||||||||||||||||||||||||||
INCREASE IN NET ASSET VALUE | 0.01 | 0.58 | 0.55 | 0.29 | ||||||||||||||||||||||||||
| ||||||||||||||||||||||||||||||
NET ASSET VALUE, END OF PERIOD | $ 3.43 | $ | 3.42 | $ | 2.84 | $ 2.29 | ||||||||||||||||||||||||
| ||||||||||||||||||||||||||||||
TOTAL RETURN | 0.29% | (c) | 24.70% | 25.11% | 14.50%(c) | |||||||||||||||||||||||||
RATIOS AND SUPPLEMENTAL DATA | ||||||||||||||||||||||||||||||
Net assets, end of period (in 000s) | $ 657,347 | $ | 658,127 | $ | 250,962 | $ 55,458 | ||||||||||||||||||||||||
RATIOS TO AVERAGE NET ASSETS | ||||||||||||||||||||||||||||||
Expenses (excluding fees waived/ reimbursed by investment advisor) | 1.38% | (d) | 1.46% | 1.59% | 2.50%(d) | |||||||||||||||||||||||||
Expenses (including fees waived/ reimbursed by investment advisor) | 1.38% | (d) | 1.46% | 1.50% | 1.50%(d) | |||||||||||||||||||||||||
Net investment income | 0.97% | (d) | 0.42% | 0.51% | 0.56%(d) | |||||||||||||||||||||||||
PORTFOLIO TURNOVER RATE | 17% | (c) | 37% | 52% | 24%(c) | |||||||||||||||||||||||||
| (a) | Per share numbers have been calculated using the average shares method. |
| (b) | Less than $0.005 or ($0.005) per share. |
| (c) | Not Annualized. |
| (d) | Annualized. |
See Notes to Financial Statements.
48 |
1.855.377.7325 | www.GrandeurPeakGlobal.com |
Table of Contents
| Grandeur Peak Funds® | Notes to Financial Statements | |
October 31, 2014 (Unaudited) |
1. ORGANIZATION
Financial Investors Trust (the “Trust”), a Delaware statutory trust, is an open-end management investment company registered under the Investment Company Act of 1940, as amended (“1940 Act”). As of October 31, 2014, the Trust had 32 registered funds. This Semi-Annual report describes the Grandeur Peak Emerging Markets Opportunities Fund, Grandeur Peak Global Opportunities Fund, Grandeur Peak Global Reach Fund, and Grandeur Peak International Opportunities Fund (individually a “Fund” and collectively, the “Funds”). The Grandeur Peak Emerging Markets Opportunities Fund seeks long-term growth of capital. The Grandeur Peak Global Opportunities Fund seeks long-term growth of capital. The Grandeur Peak Global Reach Fund seeks long-term growth of capital. The Grandeur Peak International Opportunities Fund seeks long-term growth of capital. The Funds offer Investor Class and Institutional Class shares. All classes of shares have identical rights to earnings, assets and voting privileges, except for class specific expenses and exclusive rights to vote on matters affecting only individual classes. The Grandeur Peak Global Opportunities Fund and Grandeur Peak International Opportunities Fund were each previously a non-diversified investment company for the diversification purposes of the Investment Company Act of 1940. As a result of operating in a diversified manner for the past three years, the Funds are now deemed to be diversified under the Investment Company Act of 1940. Neither Fund may resume operating in a non-diversified manner without first obtaining shareholder approval.
2. SIGNIFICANT ACCOUNTING POLICIES
The accompanying financial statements were prepared in accordance with accounting principles generally accepted in the United States of America (“U.S. GAAP”). The preparation of financial statements in conformity with U.S. GAAP requires management to make certain estimates and assumptions that affect the reported amounts of assets and liabilities and disclosures of contingent assets and liabilities at the date of the financial statements and the reported amounts of revenue and expenses during the period. Actual results could differ from those estimates. The Funds are considered an investment company for financial reporting purposes under GAAP. The following is a summary of significant accounting policies consistently followed by the Funds in preparation of their financial statements.
Investment Valuation: The Funds generally value their securities based on market prices determined at the close of regular trading on the New York Stock Exchange (“NYSE”), normally 4:00 p.m. Eastern Time, on each day the NYSE is open for trading.
For equity securities and mutual funds that are traded on an exchange, the market price is usually the closing sale or official closing price on that exchange. In the case of equity securities not traded on an exchange, or if such closing prices are not otherwise available, the securities are valued at the mean of the most recent bid and ask prices on such day. Redeemable securities issued by open-end registered investment companies are valued at the investment company’s applicable net asset value.
Equity securities that are primarily traded on foreign securities exchanges are valued at the closing values of such securities on their respective foreign exchanges, except when an event occurs subsequent to the close of the foreign exchange and the close of the NYSE that was likely to have changed such value. In such an event, the fair value of those securities are determined in good faith through consideration of other factors in accordance with procedures established by and under the general supervision of the Board of Trustees (the “Board”). The Funds will use a fair valuation model provided by an independent pricing service, which is intended to reflect fair value when a security’s value or a meaningful portion of each Fund’s portfolio is believed to have been materially affected by a valuation event that has occurred between the close of the exchange or market on which the security is traded and the close of the regular trading day on the NYSE. The Funds’ valuation procedures set forth certain triggers which instruct when to use the fair valuation model.
Forward currency exchange contracts have a market value determined by the prevailing foreign currency exchange daily rates and current foreign currency exchange forward rates. The foreign currency exchange forward rates are calculated using an automated system that estimates rates on the basis of the current day foreign currency exchange rates and forward foreign currency exchange rates supplied by a pricing service.
When such prices or quotations are not available, or when the Fair Value Committee appointed by the Board believes that they are unreliable, securities may be priced using fair value procedures approved by the Board.
Fair Value Measurements: The Funds disclose the classification of their fair value measurements following a three-tier hierarchy based on the inputs used to measure fair value. Inputs refer broadly to the assumptions that market participants would use in pricing the asset or liability, including assumptions about risk. Inputs may be observable or unobservable. Observable inputs reflect the assumptions market participants would use in pricing the asset or liability that are developed based on market data obtained from sources independent of the reporting entity. Unobservable inputs reflect the reporting entity’s own assumptions about the assumptions market participants would use in pricing the asset or liability that are developed based on the best information available.
Various inputs are used in determining the value of the Funds’ investments as of the end of the reporting period. When inputs used fall into different levels of the fair value hierarchy, the level in the hierarchy within which the fair value measurement falls is determined based on the
Semi-Annual Report | October 31, 2014 |
49 |
Table of Contents
| Grandeur Peak Funds® | Notes to Financial Statements | |
October 31, 2014 (Unaudited) |
lowest level input that is significant to the fair value measurement in its entirety. The designated input levels are not necessarily an indication of the risk or liquidity associated with these investments. These inputs are categorized in the following hierarchy under applicable financial accounting standards:
Level 1 – Unadjusted quoted prices in active markets for identical investments, unrestricted assets or liabilities that the Funds have the ability to access at the measurement date;
Level 2 – Quoted prices which are not active, quoted prices for similar assets or liabilities in active markets or inputs other than quoted prices that are observable (either directly or indirectly) for substantially the full term of the asset or liability; and
Level 3 – Significant unobservable prices or inputs (including the Funds’ own assumptions in determining the fair value of investments) where there is little or no market activity for the asset or liability at the measurement date.
The following is a summary of each Fund’s investments in the fair value hierarchy as of October 31, 2014:
| Investments in Securities at Value | Level 1 - Quoted and | Level 2 - Other | Level 3 - Significant | Total | ||||||||||||||||||||||||
| ||||||||||||||||||||||||||||
Grandeur Peak Emerging Markets Opportunities Fund | ||||||||||||||||||||||||||||
Common Stocks | ||||||||||||||||||||||||||||
Bangledesh | $ | 3,456,784 | $ | – | $ | – | $ | 3,456,784 | ||||||||||||||||||||
Brazil | 12,513,748 | 8,095,520 | – | 20,609,268 | ||||||||||||||||||||||||
China | 22,201,097 | 40,746,495 | – | 62,947,592 | ||||||||||||||||||||||||
Colombia | 7,465,161 | – | – | 7,465,161 | ||||||||||||||||||||||||
Georgia | – | 3,256,264 | – | 3,256,264 | ||||||||||||||||||||||||
Greece | 2,048,631 | – | – | 2,048,631 | ||||||||||||||||||||||||
Hong Kong | 2,142,827 | 12,415,738 | – | 14,558,565 | ||||||||||||||||||||||||
India | 20,013,480 | 43,772,298 | – | 63,785,778 | ||||||||||||||||||||||||
Indonesia | 1,112,148 | 16,985,810 | – | 18,097,958 | ||||||||||||||||||||||||
Malaysia | 1,442,497 | 14,649,345 | – | 16,091,842 | ||||||||||||||||||||||||
Mexico | 7,603,558 | – | – | 7,603,558 | ||||||||||||||||||||||||
Netherlands | – | 1,362,949 | – | 1,362,949 | ||||||||||||||||||||||||
Oman | 2,209,225 | – | – | 2,209,225 | ||||||||||||||||||||||||
Philippines | 538,169 | 17,268,418 | – | 17,806,587 | ||||||||||||||||||||||||
Poland | 3,706,002 | 4,970,322 | – | 8,676,324 | ||||||||||||||||||||||||
Russia | 1,608,540 | – | – | 1,608,540 | ||||||||||||||||||||||||
Singapore | 2,091,986 | 2,786,978 | – | 4,878,964 | ||||||||||||||||||||||||
South Africa | 16,442,354 | 12,715,810 | – | 29,158,164 | ||||||||||||||||||||||||
South Korea | – | 26,862,924 | – | 26,862,924 | ||||||||||||||||||||||||
Sri Lanka | 6,101,035 | 1,791,239 | – | 7,892,274 | ||||||||||||||||||||||||
Taiwan | – | 53,550,151 | – | 53,550,151 | ||||||||||||||||||||||||
Thailand | – | 8,211,230 | – | 8,211,230 | ||||||||||||||||||||||||
Turkey | 3,044,567 | �� | 7,441,545 | – | 10,486,112 | |||||||||||||||||||||||
United Arab Emirates | 388,117 | – | – | 388,117 | ||||||||||||||||||||||||
United States | 1,626,177 | – | – | 1,626,177 | ||||||||||||||||||||||||
Vietnam | – | 1,158,362 | – | 1,158,362 | ||||||||||||||||||||||||
Preferred Stocks | ||||||||||||||||||||||||||||
Brazil | 1,901,115 | – | – | 1,901,115 | ||||||||||||||||||||||||
Warrants | ||||||||||||||||||||||||||||
Malaysia(a) | – | – | 0 | 0 | ||||||||||||||||||||||||
| ||||||||||||||||||||||||||||
Total | $ | 119,657,218 | $ | 278,041,398 | $ | 0 | $ | 397,698,616 | ||||||||||||||||||||
| ||||||||||||||||||||||||||||
| (a) | CB Industrial Product Holding Bhd warrants are considered Level 3. The market value of the warrants was $0 as of 10/31/14. |
50 |
1.855.377.7325 | www.GrandeurPeakGlobal.com |
Table of Contents
| Grandeur Peak Funds® | Notes to Financial Statements | |
October 31, 2014 (Unaudited) |
| Investments in Securities at Value | Level 1 - Quoted and | Level 2 - Other Significant Observable Inputs | Level 3 - Significant | Total | ||||||||||||||||||||||||||||
| ||||||||||||||||||||||||||||||||
Grandeur Peak Global Opportunities Fund |
| |||||||||||||||||||||||||||||||
Common Stocks | ||||||||||||||||||||||||||||||||
Australia | $ | 308,510 | $ | 12,242,376 | $ | – | $ | 12,550,886 | ||||||||||||||||||||||||
Austria | 3,827,756 | – | – | 3,827,756 | ||||||||||||||||||||||||||||
Belgium | 10,765,119 | – | – | 10,765,119 | ||||||||||||||||||||||||||||
Brazil | 13,422,477 | 4,814,527 | – | 18,237,004 | ||||||||||||||||||||||||||||
Britain | 20,906,532 | 31,193,871 | – | 52,100,403 | ||||||||||||||||||||||||||||
Canada | 14,754,901 | – | – | 14,754,901 | ||||||||||||||||||||||||||||
China | 6,691,574 | 37,179,223 | – | 43,870,797 | ||||||||||||||||||||||||||||
Colombia | 8,684,243 | – | – | 8,684,243 | ||||||||||||||||||||||||||||
France | 5,419,989 | 6,484,800 | – | 11,904,789 | ||||||||||||||||||||||||||||
Georgia | – | 4,937,897 | – | 4,937,897 | ||||||||||||||||||||||||||||
Germany | – | 21,472,151 | – | 21,472,151 | ||||||||||||||||||||||||||||
Hong Kong | 811,788 | 6,568,061 | – | 7,379,849 | ||||||||||||||||||||||||||||
India | 21,143,430 | 32,321,857 | – | 53,465,287 | ||||||||||||||||||||||||||||
Indonesia | 1,407,435 | 20,906,270 | – | 22,313,705 | ||||||||||||||||||||||||||||
Ireland | – | 2,940,138 | – | 2,940,138 | ||||||||||||||||||||||||||||
Israel | 1,974,251 | – | – | 1,974,251 | ||||||||||||||||||||||||||||
Japan | 3,368,351 | 22,836,370 | – | 26,204,721 | ||||||||||||||||||||||||||||
Luxembourg | – | 4,353,514 | – | 4,353,514 | ||||||||||||||||||||||||||||
Malaysia | 1,095,692 | 14,351,626 | – | 15,447,318 | ||||||||||||||||||||||||||||
Mexico | 3,635,665 | – | – | 3,635,665 | ||||||||||||||||||||||||||||
Netherlands | – | 2,564,283 | – | 2,564,283 | ||||||||||||||||||||||||||||
Norway | – | 193,098 | – | 193,098 | ||||||||||||||||||||||||||||
Philippines | – | 7,243,648 | – | 7,243,648 | ||||||||||||||||||||||||||||
Poland | – | 671,471 | – | 671,471 | ||||||||||||||||||||||||||||
Singapore | 6,334,916 | 3,713,817 | – | 10,048,733 | ||||||||||||||||||||||||||||
South Africa | 3,409,563 | 5,943,546 | – | 9,353,109 | ||||||||||||||||||||||||||||
South Korea | – | 28,560,692 | – | 28,560,692 | ||||||||||||||||||||||||||||
Sweden | 3,261,746 | 16,690,165 | – | 19,951,911 | ||||||||||||||||||||||||||||
Switzerland | 4,526,100 | – | – | 4,526,100 | ||||||||||||||||||||||||||||
Taiwan | – | 33,072,366 | – | 33,072,366 | ||||||||||||||||||||||||||||
Thailand | – | 5,924,401 | – | 5,924,401 | ||||||||||||||||||||||||||||
Turkey | – | 4,619,045 | – | 4,619,045 | ||||||||||||||||||||||||||||
United Arab Emirates | 649,637 | – | – | 649,637 | ||||||||||||||||||||||||||||
United States | 218,835,258 | – | – | 218,835,258 | ||||||||||||||||||||||||||||
Vietnam | 32,865 | – | – | 32,865 | ||||||||||||||||||||||||||||
Preferred Stocks | ||||||||||||||||||||||||||||||||
Brazil | 2,723,869 | – | – | 2,723,869 | ||||||||||||||||||||||||||||
| ||||||||||||||||||||||||||||||||
Total | $ | 357,991,667 | $ | 331,799,213 | $ | – | $ | 689,790,880 | ||||||||||||||||||||||||
| ||||||||||||||||||||||||||||||||
Semi-Annual Report | October 31, 2014 |
51 |
Table of Contents
| Grandeur Peak Funds® | Notes to Financial Statements | |
October 31, 2014 (Unaudited) |
| Investments in Securities at Value | Level 1 - Quoted and | Level 2 - Other Significant | Level 3 - Significant Unobservable Inputs | Total | ||||||||||||||||||||||||
| ||||||||||||||||||||||||||||
Grandeur Peak Global Reach Fund | ||||||||||||||||||||||||||||
Common Stocks | ||||||||||||||||||||||||||||
Australia | $ | 2,093,924 | $ | 4,692,932 | $ | – | $ | 6,786,856 | ||||||||||||||||||||
Austria | 347,531 | – | – | 347,531 | ||||||||||||||||||||||||
Belgium | 1,176,011 | – | – | 1,176,011 | ||||||||||||||||||||||||
Brazil | 3,396,187 | 1,811,261 | – | 5,207,448 | ||||||||||||||||||||||||
Britain | 7,321,261 | 10,131,067 | – | 17,452,328 | ||||||||||||||||||||||||
Canada | 4,930,293 | – | – | 4,930,293 | ||||||||||||||||||||||||
China | 5,866,002 | 14,511,286 | – | 20,377,288 | ||||||||||||||||||||||||
Colombia | 1,896,571 | 285,469 | – | 2,182,040 | ||||||||||||||||||||||||
Finland | – | 426,638 | – | 426,638 | ||||||||||||||||||||||||
France | 5,671,345 | 3,910,065 | – | 9,581,410 | ||||||||||||||||||||||||
Georgia | – | 2,473,050 | – | 2,473,050 | ||||||||||||||||||||||||
Germany | – | 8,536,381 | – | 8,536,381 | ||||||||||||||||||||||||
Greece | 1,575,362 | – | – | 1,575,362 | ||||||||||||||||||||||||
Hong Kong | 848,351 | 4,074,393 | – | 4,922,744 | ||||||||||||||||||||||||
India | 8,247,735 | 16,496,629 | – | 24,744,364 | ||||||||||||||||||||||||
Indonesia | 843,197 | 6,802,472 | – | 7,645,669 | ||||||||||||||||||||||||
Ireland | 1,285,365 | 1,076,510 | – | 2,361,875 | ||||||||||||||||||||||||
Israel | 2,524,342 | 992,573 | – | 3,516,915 | ||||||||||||||||||||||||
Japan | 1,121,798 | 10,312,617 | – | 11,434,415 | ||||||||||||||||||||||||
Luxembourg | 618,855 | 1,600,910 | – | 2,219,765 | ||||||||||||||||||||||||
Malaysia | 340,968 | 3,079,636 | – | 3,420,604 | ||||||||||||||||||||||||
Mexico | 2,592,450 | – | – | 2,592,450 | ||||||||||||||||||||||||
Netherlands | – | 2,148,488 | – | 2,148,488 | ||||||||||||||||||||||||
Norway | 118,793 | 52,288 | – | 171,081 | ||||||||||||||||||||||||
Philippines | – | 4,569,216 | – | 4,569,216 | ||||||||||||||||||||||||
Poland | 1,322,188 | 1,896,325 | – | 3,218,513 | ||||||||||||||||||||||||
Russia | 98,397 | – | – | 98,397 | ||||||||||||||||||||||||
Singapore | 3,005,976 | 1,377,670 | – | 4,383,646 | ||||||||||||||||||||||||
South Africa | 5,336,970 | 5,213,891 | – | 10,550,861 | ||||||||||||||||||||||||
South Korea | – | 9,061,095 | – | 9,061,095 | ||||||||||||||||||||||||
Spain | – | 1 | – | 1 | ||||||||||||||||||||||||
Sri Lanka | 2,082,780 | – | – | 2,082,780 | ||||||||||||||||||||||||
Sweden | 423,603 | 5,673,092 | – | 6,096,695 | ||||||||||||||||||||||||
Switzerland | 2,059,191 | 587,877 | – | 2,647,068 | ||||||||||||||||||||||||
Taiwan | – | 11,856,422 | – | 11,856,422 | ||||||||||||||||||||||||
Thailand | – | 1,566,129 | – | 1,566,129 | ||||||||||||||||||||||||
Turkey | 1,540,806 | 3,622,764 | – | 5,163,570 | ||||||||||||||||||||||||
United States | 77,056,628 | – | – | 77,056,628 | ||||||||||||||||||||||||
Vietnam | 206,137 | 275,243 | – | 481,380 | ||||||||||||||||||||||||
Preferred Stocks | ||||||||||||||||||||||||||||
Brazil | 1,005,589 | – | – | 1,005,589 | ||||||||||||||||||||||||
Warrants | ||||||||||||||||||||||||||||
Malaysia(a) | – | – | 0 | 0 | ||||||||||||||||||||||||
| ||||||||||||||||||||||||||||
Total | $ | 146,954,606 | $ | 139,114,390 | $ | 0 | $ | 286,068,996 | ||||||||||||||||||||
| ||||||||||||||||||||||||||||
| (a) | CB Industrial Product Holding Bhd warrants are considered Level 3. The market value of the warrants was $0 as of 10/31/14. |
52 |
1.855.377.7325 | www.GrandeurPeakGlobal.com |
Table of Contents
| Grandeur Peak Funds® | Notes to Financial Statements | |
October 31, 2014 (Unaudited) |
| Investments in Securities at Value | Level 1 - Quoted and | Level 2 - Other Significant Observable Inputs | Level 3 - Significant | Total | ||||||||||||||||||||||||
| ||||||||||||||||||||||||||||
Grandeur Peak International Opportunities Fund | ||||||||||||||||||||||||||||
Common Stocks | ||||||||||||||||||||||||||||
Australia | $ | 1,636,679 | $ | 15,697,844 | $ | – | $ | 17,334,523 | ||||||||||||||||||||
Austria | 3,256,113 | – | – | 3,256,113 | ||||||||||||||||||||||||
Belgium | 12,470,369 | – | – | 12,470,369 | ||||||||||||||||||||||||
Brazil | 20,192,516 | 7,766,801 | – | 27,959,317 | ||||||||||||||||||||||||
Britain | 36,242,386 | 49,685,607 | – | 85,927,993 | ||||||||||||||||||||||||
Canada | 28,027,138 | – | – | 28,027,138 | ||||||||||||||||||||||||
China | 10,055,446 | 50,684,297 | – | 60,739,743 | ||||||||||||||||||||||||
Colombia | 9,767,441 | – | – | 9,767,441 | ||||||||||||||||||||||||
Finland | – | 2,503,826 | – | 2,503,826 | ||||||||||||||||||||||||
France | 7,786,362 | 14,782,694 | – | 22,569,056 | ||||||||||||||||||||||||
Georgia | – | 6,320,467 | – | 6,320,467 | ||||||||||||||||||||||||
Germany | – | 33,334,275 | – | 33,334,275 | ||||||||||||||||||||||||
Hong Kong | 2,290,571 | 8,535,540 | – | 10,826,111 | ||||||||||||||||||||||||
India | 23,236,272 | 49,127,326 | – | 72,363,598 | ||||||||||||||||||||||||
Indonesia | 1,861,073 | 19,983,958 | – | 21,845,031 | ||||||||||||||||||||||||
Ireland | 4,455,783 | 3,885,602 | – | 8,341,385 | ||||||||||||||||||||||||
Israel | 1,513,806 | 2,349,245 | – | 3,863,051 | ||||||||||||||||||||||||
Japan | 3,250,478 | 39,632,172 | – | 42,882,650 | ||||||||||||||||||||||||
Luxembourg | – | 6,617,831 | – | 6,617,831 | ||||||||||||||||||||||||
Malaysia | 2,495,111 | 23,232,974 | – | 25,728,085 | ||||||||||||||||||||||||
Mexico | 5,486,786 | – | – | 5,486,786 | ||||||||||||||||||||||||
Netherlands | – | 2,974,089 | – | 2,974,089 | ||||||||||||||||||||||||
Norway | 1,687,796 | 181,173 | – | 1,868,969 | ||||||||||||||||||||||||
Oman | 2,143,636 | – | – | 2,143,636 | ||||||||||||||||||||||||
Philippines | – | 15,027,031 | – | 15,027,031 | ||||||||||||||||||||||||
Russia | 1,303,100 | – | – | 1,303,100 | ||||||||||||||||||||||||
Singapore | 8,596,317 | 5,489,450 | – | 14,085,767 | ||||||||||||||||||||||||
South Africa | 3,775,099 | 13,361,092 | – | 17,136,191 | ||||||||||||||||||||||||
South Korea | – | 44,639,720 | – | 44,639,720 | ||||||||||||||||||||||||
Sweden | 4,356,676 | 24,977,678 | – | 29,334,354 | ||||||||||||||||||||||||
Switzerland | 6,857,928 | – | – | 6,857,928 | ||||||||||||||||||||||||
Taiwan | – | 55,886,764 | – | 55,886,764 | ||||||||||||||||||||||||
Thailand | – | 7,569,008 | – | 7,569,008 | ||||||||||||||||||||||||
Turkey | – | 4,791,730 | – | 4,791,730 | ||||||||||||||||||||||||
United Arab Emirates | 1,342,978 | – | – | 1,342,978 | ||||||||||||||||||||||||
United States | 6,484,059 | – | – | 6,484,059 | ||||||||||||||||||||||||
Preferred Stocks | ||||||||||||||||||||||||||||
Brazil | 3,504,912 | – | – | 3,504,912 | ||||||||||||||||||||||||
Warrants | ||||||||||||||||||||||||||||
Malaysia(a) | – | – | 0 | 0 | ||||||||||||||||||||||||
| ||||||||||||||||||||||||||||
Total | $ | 214,076,831 | $ | 509,038,194 | $ | 0 | $ | 723,115,025 | ||||||||||||||||||||
| ||||||||||||||||||||||||||||
| (a) | CB Industrial Product Holding Bhd warrants are considered Level 3. The market value of the warrants was $0 as of 10/31/14. |
Semi-Annual Report | October 31, 2014 |
53 |
Table of Contents
| Grandeur Peak Funds® | Notes to Financial Statements | |
October 31, 2014 (Unaudited) |
The Funds recognize transfers between levels as of the end of the period. For the six months ended October 31, 2014, the Funds had the following transfers between Level 1 and Level 2 securities. The most frequent, although not exclusive, cause of common stocks to be transferred between level 1 and 2 is due to whether the foreign securities in the Funds are fair value priced on the last day of the period (i.e. when the S&P 500 moves +/- 1% on the day, the foreign securities are re-priced as of 4:00pm EST based on a historic pricing algorithm performed by a third-party service.
The Grandeur Peak Emerging Markets Opportunities Fund had the following transfers out of Levels 1 and 2 at October 31, 2014:
| Level 1 - Quoted and Unadjusted Prices | Level 2 - Quoted and Unadjusted Prices | |||||||||||||||
| Transfers In | Transfers (Out) | Transfers In | Transfers (Out) | |||||||||||||
Common Stocks | $ – | $ (246,598,874) | $ 246,598,874 | $ – | ||||||||||||
Total | $ – | $ (246,598,874) | $ 246,598,874 | $ – | ||||||||||||
The Grandeur Peak Global Opportunities Fund had the following transfers out of Levels 1 and 2 at October 31, 2014: | ||||||||||||||||
| Level 1 - Quoted and Unadjusted Prices | Level 2 - Quoted and Unadjusted Prices | |||||||||||||||
| Transfers In | Transfers (Out) | Transfers In | Transfers (Out) | |||||||||||||
Common Stocks | $ – | $ (284,685,445) | $ 284,685,445 | $ – | ||||||||||||
Total | $ – | $ (284,685,445) | $ 284,685,445 | $ – | ||||||||||||
The Grandeur Peak Global Reach Fund had the following transfers out of Levels 1 and 2 at October 31, 2014: | ||||||||||||||||
| Level 1 - Quoted and Unadjusted Prices | Level 2 - Quoted and Unadjusted Prices | |||||||||||||||
| Transfers In | Transfers (Out) | Transfers In | Transfers (Out) | |||||||||||||
Common Stocks | $ – | $ (108,802,418) | $ 108,802,418 | $ – | ||||||||||||
Total | $ – | $ (108,802,418) | $ 108,802,418 | $ – | ||||||||||||
The Grandeur Peak International Opportunities Fund had the following transfers out of Levels 1 and 2 at October 31, 2014: | ||||||||||||||||
| Level 1 - Quoted and Unadjusted Prices | Level 2 - Quoted and Unadjusted Prices | |||||||||||||||
| Transfers In | Transfers (Out) | Transfers In | Transfers (Out) | |||||||||||||
Common Stocks | $ – | $ (454,395,422) | $ 454,395,422 | $ – | ||||||||||||
Total | $ – | $ (454,395,422) | $ 454,395,422 | $ – | ||||||||||||
The following is a reconciliation of the investments in which significant unobservable inputs (Level 3) were used in determining fair value:
| Grandeur Peak Emerging Markets Opportunities Fund | Common Stock | Total | ||||||
|
| |||||||
Balance as of April 30, 2014 | $ | 2,701,643 | $ | 2,701,643 | ||||
Accrued discount/premium | – | – | ||||||
Return of Capital | – | – | ||||||
Realized Gain/(Loss) | (641,970) | (641,970) | ||||||
Change in Unrealized Appreciation/(Depreciation) | (824,408) | (824,408) | ||||||
Purchases | – | – | ||||||
Sales Proceeds | (300,959) | (300,959) | ||||||
Transfer into Level 3 | – | – | ||||||
Transfer out of Level 3 | (934,306) | (934,306) | ||||||
|
| |||||||
Balance as of October 31, 2014 | $ | 0 | $ | 0 | ||||
|
| |||||||
Net change in unrealized appreciation/(depreciation) included in the Statements of Operations attributable to Level 3 investments held at October 31, 2014 | $ | 0 | $ | 0 | ||||
54 |
1.855.377.7325 | www.GrandeurPeakGlobal.com |
Table of Contents
| Grandeur Peak Funds® | Notes to Financial Statements | |
October 31, 2014 (Unaudited) |
| Grandeur Peak Global Opportunities Fund | Common Stock | Total | ||||||
|
| |||||||
Balance as of April 30, 2014 | $ | 4,062,331 | $ | 4,062,331 | ||||
Accrued discount/premium | – | – | ||||||
Return of Capital | – | – | ||||||
Realized Gain/(Loss) | (2,174,876) | (2,174,876) | ||||||
Change in Unrealized Appreciation/(Depreciation) | 169,993 | 169,993 | ||||||
Purchases | 141,038 | 141,038 | ||||||
Sales Proceeds | (1,308,971) | (1,308,971) | ||||||
Transfer into Level 3 | – | – | ||||||
Transfer out of Level 3 | (889,515) | (889,515) | ||||||
|
| |||||||
Balance as of October 31, 2014 | $ | – | $ | – | ||||
|
| |||||||
Net change in unrealized appreciation/(depreciation) included in the Statements of Operations attributable to Level 3 investments held at October 31, 2014 | $ | – | $ | – | ||||
| Grandeur Peak Global Reach Fund | Common Stock | Total | ||||||
|
| |||||||
Balance as of April 30, 2014 | $ | 941,990 | $ | 941,990 | ||||
Accrued discount/premium | – | – | ||||||
Return of Capital | – | – | ||||||
Realized Gain/(Loss) | (322,728) | (322,728) | ||||||
Change in Unrealized Appreciation/(Depreciation) | (151,278) | (151,278) | ||||||
Purchases | – | – | ||||||
Sales Proceeds | (216,672) | (216,672) | ||||||
Transfer into Level 3 | – | – | ||||||
Transfer out of Level 3 | (251,312) | (251,312) | ||||||
|
| |||||||
Balance as of October 31, 2014 | $ | 0 | $ | 0 | ||||
|
| |||||||
Net change in unrealized appreciation/(depreciation) included in the Statements of Operations attributable to Level 3 investments held at October 31, 2014 | $ | 0 | $ | 0 | ||||
| Grandeur Peak International Opportunities Fund | Common Stock | Total | ||||||
|
| |||||||
Balance as of April 30, 2014 | $ | 4,769,152 | $ | 4,769,152 | ||||
Accrued discount/premium | – | – | ||||||
Return of Capital | – | – | ||||||
Realized Gain/(Loss) | (1,187,428) | (1,187,428) | ||||||
Change in Unrealized Appreciation/(Depreciation) | (1,295,253) | (1,295,253) | ||||||
Purchases | – | – | ||||||
Sales Proceeds | (782,892) | (782,892) | ||||||
Transfer into Level 3 | – | – | ||||||
Transfer out of Level 3 | (1,503,579) | (1,503,579) | ||||||
|
| |||||||
Balance as of October 31, 2014 | $ | 0 | $ | 0 | ||||
|
| |||||||
Net change in unrealized appreciation/(depreciation) included in the Statements of Operations attributable to Level 3 investments held at October 31, 2014 | $ | 0 | $ | 0 | ||||
Net change in unrealized appreciation/depreciation on Level 3 securities is included on the Statements of Assets and Liabilities under Net unrealized appreciation on investments and translation of assets and liabilities in foreign currencies.
Investment Transactions and Investment Income: Investment transactions are accounted for on the date the investments are purchased or sold (trade date). Realized gains and losses from investment transactions are reported on an identified cost basis. Interest income, which includes accretion of discounts and amortization of premiums, is accrued and recorded as earned. Dividend income is recognized on the ex-dividend date or for certain foreign securities, as soon as information is available to the Funds. All of the realized and unrealized gains and losses and net investment income, are allocated daily to each class in proportion to its average daily net assets.
Cash Management Transactions: The Funds subscribe to the Brown Brothers Harriman & Co. (“BBH”) Cash Management Service (“CMS”), whereby cash balances are automatically swept into overnight offshore demand deposits with either the BBH Grand Cayman branch or a branch of a pre-approved commercial bank. This fully automated program allows the Funds to earn interest on cash balances. Excess cash with deposit institutions domiciled outside of the U.S. are subject to sovereign actions in the jurisdiction of the deposit institution including, but not limited to,
Semi-Annual Report | October 31, 2014 |
55 |
Table of Contents
| Grandeur Peak Funds® | Notes to Financial Statements | |
October 31, 2014 (Unaudited) |
freeze, seizure or diminution. Cash balances in the BBH CMS are included on the statements of assets and liabilities under cash and foreign cash. As of October 31, 2014, the Funds had the following cash balances participating in the BBH CMS:
| Fund | ||||||||
Grandeur Peak Emerging Markets Opportunities Fund | $ | 37,297,578 | ||||||
Grandeur Peak Global Opportunities Fund | $ | 8,842,546 | ||||||
Grandeur Peak Global Reach Fund | $ | 31,447,724 | ||||||
Grandeur Peak International Opportunities Fund | $ | 85,771,894 | ||||||
As of October 31, 2014, the Funds had the following foreign cash balances participating in the BBH CMS (cost and value of foreign cash balances are equal): | ||||||||
| Fund | ||||||||
Grandeur Peak Emerging Markets Opportunities Fund | $ | 220,523 | ||||||
Grandeur Peak Global Opportunities Fund | $ | 65,813 | ||||||
Grandeur Peak Global Reach Fund | $ | 829,146 | ||||||
Grandeur Peak International Opportunities Fund | $ | 1,151,934 | ||||||
Foreign Securities: The Funds may directly purchase securities of foreign issuers. Investing in securities of foreign issuers involves special risks not typically associated with investing in securities of U.S. issuers. The risks include possible reevaluation of currencies, the inability to repatriate foreign currency, less complete financial information about companies and possible future adverse political and economic developments. Moreover, securities of many foreign issuers and their markets may be less liquid and their prices more volatile than those of securities of comparable U.S. issuers.
Foreign Currency Translation: The books and records of the Funds are maintained in U.S. dollars. Investment valuations and other assets and liabilities initially expressed in foreign currencies are converted each business day into U.S. dollars based upon current exchange rates. Prevailing foreign exchange rates may generally be obtained at the close of the NYSE (normally, 4:00 p.m. Eastern Time). The portion of realized and unrealized gains or losses on investments due to fluctuations in foreign currency exchange rates is not separately disclosed and is included in realized and unrealized gains or losses on investments, when applicable.
Foreign Currency Spot Contracts: The Funds may enter into foreign currency spot contracts to facilitate transactions in foreign securities or to convert foreign currency receipts into U.S. dollars. A foreign currency spot contract is an agreement between two parties to buy and sell currencies at the current market rate, for settlement generally within two business days. The U.S. dollar value of the contracts is determined using current currency exchange rates supplied by a pricing service.
The contract is marked-to-market daily for settlements beyond one day and any change in market value is recorded as an unrealized gain or loss. When the contract is closed, a realized gain or loss is recorded equal to the difference between the value on the open and close date. Losses may arise from changes in the value of the foreign currency, or if the counterparties do not perform under the contract’s terms. The maximum potential loss from such contracts is the aggregate face value in U.S. dollars at the time the contract was opened.
Trust Expenses: Some expenses of the Trust can be directly attributed to the Funds. Expenses which cannot be directly attributed to the Funds are apportioned among all funds in the Trust based on average net assets of each fund.
Fund and Class Expenses: Expenses that are specific to a Fund or class of shares of a Fund are charged directly to that Fund or share class. Expenses that are common to all Funds generally are allocated among the Funds in proportion to their average daily net assets. Fees provided under the distribution (Rule 12b-1) and/or shareholder service plans for a particular class of the Funds are charged to the operations of such class.
Offering Costs: Offering costs, including costs of printing initial prospectuses, legal and registration fees, are being amortized over twelve months from the inception date of the Funds. As of October 31, 2014, $3,563 of offering costs remain to be amortized for Grandeur Peak Emerging Markets Opportunities Fund.
Federal Income Taxes: The Funds comply with the requirements under Subchapter M of the Internal Revenue Code of 1986, as amended, applicable to regulated investment companies and intend to distribute substantially all of their net taxable income and net capital gains, if any, each year so that it will not be subject to excise tax on undistributed income and gains. The Funds are not subject to income taxes to the extent such distributions are made.
56 |
1.855.377.7325 | www.GrandeurPeakGlobal.com |
Table of Contents
| Grandeur Peak Funds® | Notes to Financial Statements | |
October 31, 2014 (Unaudited) |
As of and during the six months ended October 31, 2014, the Funds did not have a liability for any unrecognized tax benefits. The Funds file U.S. federal, state, and local tax returns as required. The Funds’ tax returns are subject to examination by the relevant tax authorities until expiration of the applicable statute of limitations, which is generally three years after the filing of the tax return for federal purposes and four years for most state returns. Tax returns for open years have incorporated no uncertain tax positions that require a provision for income taxes.
Distributions to Shareholders: Each Fund normally pays dividends and distributes capital gains, if any, on an annual basis. Income dividend distributions are derived from interest and other income each Fund receives from their investments, including short term capital gains. Long term capital gain distributions are derived from gains realized when each Fund sells a security it has owned for more than a year. Each Fund may make additional distributions and dividends at other times if the portfolio manager believes doing so may be necessary for each Fund to avoid or reduce taxes. The Funds intend to pass through foreign tax credits to shareholders.
3. TAX BASIS INFORMATION
Tax Basis of Investments: As of October 31, 2014, the aggregate cost of investments, gross unrealized appreciation/(depreciation) and net unrealized appreciation for Federal tax purposes was as follows:
| Gross Appreciation | Gross Depreciation | Cost of Investments | ||||||||||||||||||
| (excess of value over | (excess of tax cost | Net Unrealized | for Income Tax | |||||||||||||||||
| tax cost) | over value) | Appreciation | Purposes | |||||||||||||||||
Grandeur Peak Emerging Markets Opportunities Fund | $ | 48,022,467 | $ | (31,128,623 | ) | $ | 16,893,844 | $ | 380,804,772 | |||||||||||
Grandeur Peak Global Opportunities Fund | 149,158,088 | �� (44,007,773 | ) | 105,150,315 | 584,640,565 | |||||||||||||||
Grandeur Peak Global Reach Fund | 26,060,692 | (17,205,135 | ) | 8,855,557 | 277,213,439 | |||||||||||||||
Grandeur Peak International Opportunities Fund | 155,559,079 | (57,199,734 | ) | 98,359,345 | 624,755,680 | |||||||||||||||
Tax Basis of Distributions to Shareholders: The character of distributions made during the year from net investment income or net realized gains may differ from its ultimate characterization for federal income tax purposes. Also, due to the timing of dividend distributions, the fiscal year in which amounts are distributed may differ from the fiscal year in which the income or realized gain were recorded by the Funds.
The tax character of distributions paid by the Funds for the fiscal year and or period ended April 30, 2014 were as follows:
| Ordinary Income | Long-Term Capital Gain | |||||||
Grandeur Peak Emerging Markets Opportunities Fund | $ | – | $ | – | ||||
Grandeur Peak Global Opportunities Fund | 12,405,055 | 12,289,718 | ||||||
Grandeur Peak Global Reach Fund | 520,818 | – | ||||||
Grandeur Peak International Opportunities Fund | 16,309,161 | 4,623,208 | ||||||
During the six months ended October 31, 2014, the Funds did not make any distributions.
4. SECURITIES TRANSACTIONS
The cost of purchases and proceeds from sales of securities (excluding short term securities) during the six months ended October 31, 2014 were as follows:
| Proceeds From Sales of | ||||||||
| Fund | Purchases of Securities | Securities | ||||||
Grandeur Peak Emerging Markets Opportunities Fund | $ | 181,146,022 | $ | 73,849,055 | ||||
Grandeur Peak Global Opportunities Fund | 141,523,104 | 145,981,108 | ||||||
Grandeur Peak Global Reach Fund | 193,798,345 | 30,039,724 | ||||||
Grandeur Peak International Opportunities Fund | 125,224,185 | 125,841,782 | ||||||
5. SHARES OF BENEFICIAL INTEREST
The capitalization of the Trust consists of an unlimited number of shares of beneficial interest with no par value per share. Holders of the shares of the Funds of the Trust have one vote for each share held and a proportionate fraction of a vote for each fractional share. All shares issued
Semi-Annual Report | October 31, 2014 |
57 |
Table of Contents
| Grandeur Peak Funds® | Notes to Financial Statements | |
October 31, 2014 (Unaudited) |
and outstanding are fully paid and are non-assessable, transferable and redeemable at the option of the shareholder. Shares have no pre-emptive rights.
Shares redeemed within 60 days of purchase may incur a 2% short-term redemption fee deducted from the redemption amount. For the six months ended October 31, 2014 and the year ended April 30, 2014, the redemption fees charged by the Funds are presented in the Statements of Changes in Net Assets.
6. MANAGEMENT AND RELATED-PARTY TRANSACTIONS
Grandeur Peak Global Advisors, LLC (the “Adviser” or “Grandeur Peak Global Advisors”), subject to the authority of the Board, is responsible for the overall management and administration of the Funds’ business affairs. The Adviser manages the investments of the Funds in accordance with the Funds’ investment objective, policies and limitations and investment guidelines established jointly by the Adviser and the Trustees. Pursuant to the Advisory Agreement, (the “Advisory Agreement”), each Fund pays the Adviser an annual management fee based on each Fund’s average daily net assets. The management fee is paid on a monthly basis. The following table reflects the Funds’ advisory fee rates.
| Fund | Advisory Fee | |
Grandeur Peak Emerging Markets Opportunities Fund | 1.35% | |
Grandeur Peak Global Opportunities Fund | 1.25% | |
Grandeur Peak Global Reach Fund | 1.10% | |
Grandeur Peak International Opportunities Fund | 1.25% |
With respect to the Grandeur Peak Global Opportunities Fund and the Grandeur Peak International Opportunities Fund, the Adviser has contractually agreed to limit certain of each Fund’s expenses to 1.75% of the Fund’s average daily net assets in the Investor Class shares and 1.50% of the Fund’s average daily net assets in the Institutional Class shares until August 31, 2015. With respect to the Grandeur Peak Emerging Markets Opportunities Fund, the Adviser has contractually agreed to limit certain of the Fund’s expenses to 1.95% of the Fund’s average daily net assets in the Investor Class shares and 1.70% of the Fund’s average daily net assets in the Institutional Class shares until August 31, 2015. With respect to the Grandeur Peak Global Reach Fund, the Adviser has contractually agreed to limit certain of the Fund’s expenses to 1.60% of the Fund’s average daily net assets in the Investor Class shares and 1.35% of the Fund’s average daily net assets in the Institutional Class shares until August 31, 2015. Pursuant to these agreements, each Fund will reimburse the Adviser for any fee waivers and expense reimbursements made by the Adviser, provided that any such reimbursements made by the Funds to the Adviser will not cause the Funds’ expense limitation to exceed expense limitations in existence at the time the expense was incurred, or at the time of the reimbursement, whichever is lower, and the reimbursement is made within three years after the expenses were incurred.
For the six months ended October 31, 2014, the fee waivers and/or reimbursements were as follows:
| Recoupment of | ||||||||||||||||||||
| Fees Waived/Reimbursed | Previously, Waived Fees | |||||||||||||||||||
| Fund | By Adviser | By Adviser | Total | |||||||||||||||||
Grandeur Peak Emerging Markets Opportunities Fund | ||||||||||||||||||||
Investor Class | $ | – | $ | 3,666 | $ | 3,666 | ||||||||||||||
Institutional Class | – | 35,532 | 35,532 | |||||||||||||||||
Grandeur Peak Global Opportunities Fund | ||||||||||||||||||||
Investor Class | $ | – | $ | – | $ | – | ||||||||||||||
Institutional Class | – | – | – | |||||||||||||||||
Grandeur Peak Global Reach Fund | ||||||||||||||||||||
Investor Class | $ | 8,397 | $ | – | $ | 8,397 | ||||||||||||||
Institutional Class | 21,945 | – | 21,945 | |||||||||||||||||
Grandeur Peak International Opportunities Fund | ||||||||||||||||||||
Investor Class | $ | – | $ | – | $ | – | ||||||||||||||
Institutional Class | – | – | – | |||||||||||||||||
58 |
1.855.377.7325 | www.GrandeurPeakGlobal.com |
Table of Contents
| Grandeur Peak Funds® | Notes to Financial Statements | |
October 31, 2014 (Unaudited) |
As of October 31, 2014, the balances of recoupable expenses for each Fund were as follows:
| Fund | Expires 2017 | Total | ||||||
Grandeur Peak Global Reach Fund | ||||||||
Investor Class | $ | 50,773 | $ | 50,773 | ||||
Institutional Class | 114,461 | 114,461 | ||||||
Administrator Fees and Expenses
ALPS Fund Services, Inc. (“ALPS” and the “Administrator”) (an affiliate of ALPS Distributors, Inc.) serves as administrator to the Funds, and each Fund has agreed to pay expenses incurred in connection with its administrative activities. Pursuant to the Administration, Bookkeeping and Pricing Services Agreement, ALPS will provide operational services to the Funds including, but not limited to fund accounting and fund administration and generally assist in each Fund’s operations.
The annual administrative Fee is billed monthly in total and allocated to each Fund in the amount of the greater of (a) the annual minimum for both Funds of $285,000 or (b) following basis point fee schedule:
| Average Total Net Assets | Contractual Fee | |
Between $0-$500M | 0.05% | |
$500M-$1B | 0.03% | |
Above $1B | 0.02% |
The Administrator is also reimbursed by the Funds for certain out-of-pocket expenses.
Transfer Agent
ALPS serves as transfer, dividend paying and shareholder servicing agent for the Funds. ALPS receives an annual minimum fee, a fee based upon the number of shareholder accounts, and is also reimbursed by the Funds for certain out-of-pocket expenses.
Compliance Services
ALPS provides services that assist the Trust’s chief compliance officer in monitoring and testing the policies and procedures of the Trust in conjunction with requirements under Rule 38a-1 under the 1940 Act and receives an annual base fee. ALPS is reimbursed for certain out-of-pocket expenses by the Funds.
Principal Financial Officer
ALPS receives an annual fee for providing principal financial officer services to the Funds.
Distributor: ALPS Distributors, Inc. (“ADI” or the “Distributor”) (an affiliate of ALPS) acts as the distributor of the Funds’ shares pursuant to a Distribution Agreement with the Trust. Shares are sold on a continuous basis by ADI as agent for the Funds, and ADI has agreed to use its best efforts to solicit orders for the sale of each Fund’s shares, although it is not obliged to sell any particular amount of shares. ADI is not entitled to any compensation for its services as Distributor. ADI is registered as a broker-dealer with the Securities and Exchange Commission.
Each Fund has adopted a Distribution and Services (12b-1) Plan pursuant to Rule 12b-1 of the 1940 Act (the “Plan”) for its Investor Class shares. The Plan allows the Funds to use Investor Class assets to pay fees in connection with the distribution and marketing of Investor Class shares and/or the provision of shareholder services to Investor Class shareholders. The Plan permits payment for services in connection with the administration of plans or programs that use Investor Class shares of each Fund as their funding medium and for related expenses. The Plan permits the Funds to make total payments at an annual rate of up to 0.25% of each Fund’s average daily net assets attributable to its Investor Class shares. The expenses of the Plan are reflected as distribution and service fees in the Statement of Operations.
7. INDEMNIFICATIONS
Under the Trust’s organizational documents, its officers and Trustees are indemnified against certain liability arising out of the performance of their duties to the Trust. Additionally, in the normal course of business, the Trust enters into contracts with service providers that may contain general indemnification clauses, which may permit indemnification to the extent permissible under applicable law. The Trust’s maximum exposure under these arrangements is unknown, as this would involve future claims that may be made against the Trust that have not yet occurred.
Semi-Annual Report | October 31, 2014 |
59 |
Table of Contents
| Grandeur Peak Funds® | Disclosure Regarding Approval of Fund Advisory Agreements | |
October 31, 2014 (Unaudited) |
On September 9, 2014, the Trustees met in person to discuss, among other things, the approval of the investment advisory agreement between the Trust and Grandeur Peak Global Advisors, LLC (“Grandeur Peak”) (the “Investment Advisory Agreement”), in accordance with Section 15(c) of the 1940 Act. The Independent Trustees met with independent legal counsel during executive session and discussed the Investment Advisory Agreement and other related materials.
In renewing and approving the Investment Advisory Agreement with Grandeur Peak, the Trustees, including the Independent Trustees, considered the following factors with respect to the Grandeur Peak Funds:
Investment Advisory Fee Rate: The Trustees reviewed and considered the contractual annual advisory fee to be paid by the Trust, on behalf of the Grandeur Peak Funds, to Grandeur Peak of 1.25% of the Grandeur Peak Global Opportunities Fund’s daily average net assets, 1.25% of the Grandeur Peak Emerging Markets Opportunities Fund’s daily average net assets, 1.10% of the Grandeur Peak Global Reach Fund’s daily average net assets, and 1.25% of the Grandeur Peak International Opportunities Fund’s daily average net assets, in light of the extent and quality of the advisory services provided by Grandeur Peak to the Grandeur Peak Funds.
The Trustees considered the information they received comparing the Grandeur Peak Funds’ contractual annual advisory fee and total expenses (net of waivers) with those of funds in both the relevant peer expense group and universe of funds provided by an independent provider of investment company data.
Based on such information, the Trustees further determined that the contractual annual advisory fee of 1.25% of each of the Grandeur Peak Global Opportunities Fund’s, Grandeur Peak Emerging Markets Opportunities Fund’s, and Grandeur Peak International Opportunities Fund’s daily average net assets, and 1.00% of the Grandeur Peak Global Reach Fund’s daily average net assets, and the total expense ratios (net of waivers) for each of the Grandeur Peak Funds, were high but within an acceptable range within each of the Grandeur Peak Funds’ respective peer groups and universes.
The Trustees also considered the fee structures applicable to Grandeur Peak’s other clients employing a comparable strategy to that of the Grandeur Peak Funds, as applicable.
Nature, Extent and Quality of the Services under the Investment Advisory Agreement: The Trustees received and considered information regarding the nature, extent and quality of services to be provided to the Grandeur Peak Funds under the Investment Advisory Agreement. The Trustees reviewed certain background materials supplied by Grandeur Peak in its presentation, including its Form ADV.
The Trustees reviewed and considered Grandeur Peak’s investment advisory personnel, its history as an asset manager and its performance and the amount of assets currently under management by Grandeur Peak. The Trustees also reviewed the research and decision-making processes utilized by Grandeur Peak, including the methods adopted to seek to achieve compliance with the investment objectives, policies and restrictions of the Grandeur Peak Funds.
The Trustees considered the background and experience of Grandeur Peak’s management in connection with the Grandeur Peak Funds, including reviewing the qualifications, backgrounds and responsibilities of the management team primarily responsible for the day-to-day portfolio management of the Grandeur Peak Funds and the extent of the resources devoted to research and analysis of actual and potential investments.
The Trustees also reviewed, among other things, Grandeur Peak’s insider trading policies and procedures and its Code of Ethics.
Performance: The Trustees reviewed performance information for each of the Grandeur Peak Funds for the three-month and 1-year periods ended June 30, 2014. That review included a comparison of each Grandeur Peak Fund’s performance to the performance of a universe of comparable funds selected by an independent provider of investment company data. The Trustees noted the performance of each Grandeur Peak Fund was generally above the respective peer universe median for the most recent 1-year period, as applicable. The Trustees also considered Grandeur Peak’s discussion of each Grandeur Peak Fund’s top contributors and top detractors, as well as Grandeur Peak’s performance and reputation generally and its investment techniques, risk management controls and decision-making processes.
Total Expense Ratios and the Adviser’s Profitability: The Trustees received and considered a profitability analysis prepared by Grandeur Peak based on the fees payable under the Investment Advisory Agreement. The Trustees considered the profits, if any, anticipated to be realized by Grandeur Peak in connection with the operation of the Grandeur Peak Funds. The Board then reviewed Grandeur Peak’s financial statements in order to analyze the financial condition and stability and profitability of the adviser.
Economies of Scale: The Trustees considered whether economies of scale in the provision of services to the Grandeur Peak Funds will be passed along to the shareholders under the proposed agreements.
60 |
1.855.377.7325 | www.GrandeurPeakGlobal.com |
Table of Contents
| Grandeur Peak Funds® | Disclosure Regarding Approval of Fund Advisory Agreements | |
October 31, 2014 (Unaudited) |
Other Benefits to the Adviser: The Trustees reviewed and considered any other incidental benefits derived or to be derived by Grandeur Peak from its relationship with the Grandeur Peak Funds, including whether soft dollar arrangements were used.
In selecting Grandeur Peak as the Grandeur Peak Funds’ investment adviser and approving the Investment Advisory Agreement and the fees charged under the Investment Advisory Agreement, the Trustees concluded that no single factor reviewed by the Trustees was identified by the Trustees to be determinative as the principal factor in whether to approve the Investment Advisory Agreement. Further, the Independent Trustees were advised by separate independent legal counsel throughout the process. The Trustees, including all of the Independent Trustees, concluded that:
| — | the investment advisory fees to be received by Grandeur Peak with respect to the Grandeur Peak Funds were high but within an acceptable range within each of the Grandeur Peak Fund’s peer group and universe; |
| — | the nature, extent and quality of services to be rendered by Grandeur Peak under the Investment Advisory Agreement were adequate; |
| — | the performance history of each of the Grandeur Peak Funds was short in that no fund had a 3-year track record, and generally better than the performance of the funds in its respective peer universe selected by an independent provider of investment company data for the most recent 1-year period; |
| — | bearing in mind the limitations of comparing different types of managed accounts and the different levels of service typically associated with such accounts, the fee structures applicable to Grandeur Peak’s other clients employing a comparable strategy to one or more of the Grandeur Peak Funds were not indicative of any unreasonableness with respect to the advisory fees proposed to be payable by the Grandeur Peak Funds; |
| — | the profit, if any, anticipated to be realized by Grandeur Peak in connection with the operation of the Grandeur Peak Funds is not unreasonable to the Grandeur Peak Funds; and |
| — | there were no material economies of scale or other incidental benefits accruing to Grandeur Peak in connection with its relationship with the Grandeur Peak Funds. |
Based on the Trustees’ deliberations and their evaluation of the information described above, the Trustees, including all of the Independent Trustees, concluded that Grandeur Peak’s compensation for investment advisory services is consistent with the best interests of the Grandeur Peak Funds and their shareholders.
Semi-Annual Report | October 31, 2014 |
61 |
Table of Contents
| Grandeur Peak Funds® | Additional Information | |
October 31, 2014 (Unaudited) |
1. FUND HOLDINGS
The Funds file their complete schedule of portfolio holdings with the Securities and Exchange Commission (the “SEC”) for the first and third quarters of each fiscal year on Form N-Q within 60 days after the end of the period. Copies of the Funds’ Form N-Q are available without charge on the SEC website at http://www.sec.gov. You may also review and copy the Form N-Q at the SEC’s Public Reference Room in Washington, DC. For more information about the operation of the Public Reference Room, please call the SEC at 1-800-SEC-0330.
2. FUND PROXY VOTING POLICIES, PROCEDURES AND SUMMARIES
The Funds’ policies and procedures used in determining how to vote proxies and information regarding how the Funds voted proxies relating to portfolio securities during the most recent prior 12-month period ending June 30 are available without charge, (1) upon request, by calling (toll-free) 855-377-PEAK(7325) and (2) on the SEC’s website at http://www.sec.gov.
62 |
1.855.377.7325 | www.GrandeurPeakGlobal.com |
Table of Contents
Intentinally Left Blank.
Table of Contents

Contact Us
| Mail: | Grandeur Peak Funds, P.O. Box 13664, Denver, CO 80201 | E-Mail: | grandeurpeakglobal@alpsinc.com | |||
| Phone: | 1.855.377.PEAK (7325) | Web: | www.GrandeurPeakGlobal.com | |||
Table of Contents
Table of Contents
| 1 | ||||
| 5 | ||||
| 8 | ||||
| 11 | ||||
| 14 | ||||
| 16 | ||||
| 18 | ||||
| 20 | ||||
| 21 | ||||
| 22 | ||||
| 23 | ||||
| 24 | ||||
| 25 | ||||
| 26 | ||||
| 27 | ||||
| 28 | ||||
| 29 | ||||
| 37 | ||||
| 40 | ||||
Table of Contents
Pathway Advisors Funds | Shareholder Letter | |
October 31, 2014 (Unaudited) |
November 24, 2014
Dear Shareholder:
Our funds continue to garner attention in the self-directed brokerage space of 401k plans. Below is a table of our year-to-date, six months performance as of 10/31/14. We’ve also included the annualized since inception return through the same period.
| 6 Months | Calendar YTD | Since Inception* | ||||
Pathway Advisors Conservative Fund | 2.07% | 4.64% | 4.97% | |||
Pathway Advisors Growth & Income Fund | 2.17% | 4.81% | 8.45% | |||
Pathway Advisors Aggressive Growth Fund | 2.69% | 4.76% | 13.28% |
| * | The Funds’ inception date is July 30, 2012. |
The performance data quoted represents past performance. Past performance does not guarantee future results. The investment return and principal value of an investment will fluctuate so that an Investor’s shares, when redeemed, may not be worth more or less than their original cost and current performance may be lower or higher than the performance quoted. To obtain the most recent month-end performance data, please call 1-888-288-1121 or visit www.pathwayadvisorsfunds.com.
Hanson McClain, Inc. (the “Adviser”) has agreed contractually to limit the amount of the Fund’s total annual expenses, exclusive of Acquired Fund Fees and Expenses, brokerage expenses, interest expenses, taxes and extraordinary expenses, to 1.88% (1.98% prior to October 1, 2013) of the Fund’s average daily net assets. This agreement is in effect through August 31, 2015. The Adviser will be permitted to recover expenses it has borne through the agreement described above to the extent that the Fund’s expenses in later periods fall below the annual rates set forth in the relevant agreement. The Fund will not be obligated to pay any such deferred fees and expenses more than three years after the end of the fiscal year in which the fees and expense were deferred. The Adviser may not discontinue this waiver without the approval by the Fund’s Board of Trustees.
This year has been, to a large degree, a year of anticipation. Anticipation for US economic growth to pick up and unemployment to decline. Anticipation for quantitative easing (QE) to end and longer-term bond yields to gradually rise. On the back of QE, the equity markets kept pushing forward and volatility, both realized and implied, kept moving lower. High yield spreads to treasuries also kept shrinking. With growing concern about the Islamic State in Iraq and Syria and Russia’s incursion in Ukraine, there was also now concern about Ebola. The S&P 500® Index was near an all-time high and high yield spreads were starting to widen from a low of 323 basis points set in June. There was also concern about much of Europe and Japan going into a recession and for China’s economic growth to further slow. This also coincided with greater anticipation about the end of QE in October and the beginning of anticipation of when the Federal Reserve will start to raise rates.
Apparently, fears and uncertainty finally caught up with the apathy and complacency of many investors in October. It was a healthy reminder that stocks cannot just go up in a straight line without some retracement, whether due to contented profit-taking, exhaustion from moving up with little pause, or rational price discovery. From mid-September to mid-October, the S&P 500® Index dropped by nearly 7.5% while the Russell 2000® Index and the MSCI EAFE® Index lost more
Semi-Annual Report | October 31, 2014 |
1 |
Table of Contents
Pathway Advisors Funds | Shareholder Letter | |
October 31, 2014 (Unaudited) |
than 11% from early September to mid-October. The MSCI Emerging Markets Index lost 12% in the same time period. Since the dip in mid-October, the S&P 500® Index has not only made up for the drawdown, but set new highs. As of 10/31/14, the Russell 2000® Index was close to making it up. The MSCI EAFE® Index and MSCI Emerging Markets Index, however, were still 8-11% from making up the drawdown.
This short-lived drawdown was a good reminder that volatility is still here. The VIX index, which measures implied volatility, got as high as 31 intraday. Prior to the pullback, the VIX Index got as low as 10.32, implying that the S&P 500® Index could deviate by 10%. The pullback was a reminder that there are still panic sellers and panic buyers of assets. The 10-year US Treasury yield got as low as 1.87% intraday, suggesting a large amount of buying interest in a perceived less risky asset. More importantly, the selloff was a good reminder that diversification, especially in portfolios consisting of both stocks and bonds, is still very important. For those who abandoned the idea that high quality core bonds should continue to play a role in a balanced portfolio, that duration risk is still needed to be balanced with credit risk, these investors were reminded that credit risk is not only more highly correlated with equity risk, but that in a “flight to quality” or “risk off” environment, having only credit exposure does not offer near the volatility buffer that duration exposure may. High quality bonds, as measured by iShares Core US Aggregate Bond ETF (AGG), were up 2.1% during this selloff, while low quality or high yield bonds, as measured by SPDR Barclays High Yield Bond ETF (JNK), were down 3.2% in the same time frame.
In seeing the rebound in hindsight, particularly with the S&P 500® Index, this is also a good reminder to investors that one cannot simply judge the risks and rewards only after the fact. If they did, investors would be clamoring to only own the S&P 500® Index in such an environment, as the S&P 500® Index had a much more pronounced rebound than the other equity indices. The temptation to look for and to only own the best performing asset class will always be toying with investor’s emotions and clouding their logic. We remind every shareholder of the funds that, while we may have some insights as it relates to valuations, growth, and the risks of owning different asset classes, neither we nor any other firm has a “crystal ball” on what will perform well and what will not perform well or how quickly asset classes will perform.
This is the whole premise behind our globally diversified portfolios, to take broad calculated risks based on long-term expected returns of several different asset classes while not knowing exactly how things will play, but having long-term conviction that the calculated risks taken will be rewarded. We know that the behavioral impact of investors in aggregate can lead asset classes to be mispriced, especially relative to each other, and that this mispricing can persist until fundamental, economic or statistical relationships are brought back near parity with investor perceptions. For this reason, we gently remind investors to not get caught up in the noise of short-term market movements and to not lose focus of the big picture and to view or measure their investments over a longer time horizon.
We made some significant adjustments to the funds, none of which materially changed the stock and bond allocations. The changes we made were to reduce the expenses of core stock and bond allocations and to introduce some liquid alternative strategies into the funds. These changes did not materially change the acquired expenses of the funds, but we believe they did improve the risk/reward measures of the funds, including the ability to hedge some equity and interest rate risks or to reduce beta during sustained periods of distress, when necessary.
2 |
www.pathwayadvisorsfunds.com |
Table of Contents
Pathway Advisors Funds | Shareholder Letter | |
October 31, 2014 (Unaudited) |
Our attribution in the 3rd quarter, which incorporated these changes, showed positive active returns for each fund. Our exposures in domestic equities and being underweight equities generally helped our portfolios perform well while international equity exposures and credit/high yield exposures on the fixed income side were a drag on our funds’ performance during this period. We believe the recent changes will most benefit shareholders during periods of higher and sustained volatility. Our strategic and tactical positioning will also benefit shareholders if and when the more attractively priced asset classes start to perform better than those that are priced closer to fair value.
We are honored and humbled to be chosen as your investment manager. We are thankful for the trust that you have placed with us and we sincerely wish each of you to have a happy and safe holiday season in the days to come.
Sincerely,
David Schauer
Chief Investment Officer
The views and information discussed in this commentary are as of the date of publication, are subject to change, and may not reflect the writer’s current views. The views expressed represent an assessment of market conditions at a specific point in time, are opinions only and should not be relied upon as investment advice regarding a particular investment or markets in general. Such information does not constitute a recommendation to buy or sell specific securities or investment vehicles. It should not be assumed that any investment will be profitable or will equal the performance of the portfolios or any securities or any sectors mentioned in this letter. The subject matter contained in this letter has been derived from several sources believed to be reliable and accurate at the time of compilation. Neither Hanson McClain, Inc. nor the Funds accept any liability for losses either direct or consequential caused by the use of this information.
The Pathway Aggressive Growth Fund invests in underlying funds that use investment techniques and financial instruments that may be considered aggressive, including the use of futures contracts, options on futures contracts, securities and indices, forward contracts, swap agreements and similar instruments, exposes an underlying fund to potentially dramatic changes (losses) in the value of certain of its portfolio holdings.
The Pathway Growth and Income Fund’s share price can move down in response to stock market conditions, changes in the economy or changes in a particular underlying fund’s share price. An underlying fund may decline in value even when the values of stocks or bonds in general are rising. An underlying fund’s investments in fixed-income securities may decline in value because of changes in interest rates. As nominal interest rates rise, the value of fixed income securities held by an underlying fund (and indirectly, by the Fund) are likely to decrease.
The Pathway Conservative Fund invests in underlying funds that invest long or short in fixed-income securities subjects the Fund to additional risks that include credit risk, interest risk, maturity risk, investment-grade securities risk, municipal securities risk and prepayment risk. These risks could affect the value of a particular investment by the Fund, possibly causing the Fund’s share price and total return to be reduced and fluctuate more than other types of investments.
The Pathway Advisors Funds are distributed by ALPS Distributors, Inc.
Semi-Annual Report | October 31, 2014 |
3 |
Table of Contents
Pathway Advisors Funds | Shareholder Letter | |
October 31, 2014 (Unaudited) |
Diversification does not assure a profit or protect against a loss.
The S&P 500® Total Return Index is an unmanaged index of 500 common stocks chosen for the market size, liquidity and industry group representation. It is a market-value weighted index. The Index is not actively managed and does not reflect any deduction for fees, expenses or taxes. An investor may not invest directly into the Index.
The Russell 2000® Index measures the performance of the small-cap segment of the U.S. equity universe. The Russell 2000® Index is a subset of the Russell 3000® Index representing approximately 10% of the total market capitalization of that index. It includes approximately 2000 of the smallest securities based on a combination of their market cap and current index membership. The Index is not actively managed and does not reflect any deduction for fees, expenses or taxes. An investor may not invest directly into the Index.
The MSCI EAFE® Index (Europe, Australasia, Far East) is a free float-adjusted market capitalization weighted index designed to measure developed market equity performance. The MSCI EAFE® Index is composed of companies representative of the market structure of Developed Market countries. The Index includes reinvestment of dividends, net of foreign withholding taxes. The Index is not actively managed and does not reflect any deduction for fees, expenses or taxes. An investor may not invest directly into the Index.
The Volatility Index® is an index which measures expectations of volatility, or fluctuations in price, of the S&P 500® Total Return Index. Higher values for the volatility index indicate that investors expect the value of the S&P 500® Total Return Index to fluctuate wildly – up, down, or both – in the next 30 days. The Index is not actively managed and does not reflect any deduction for fees, expenses or taxes. An investor cannot invest directly in the Index.
The MSCI Emerging Markets Index is a free float-adjusted market capitalization index that is designed to measure equity market performance in the global emerging markets. As of June 2006, the MSCI Emerging Markets Index consisted of the following 25 emerging market country indices: Argentina, Brazil, Chile, China, Colombia, Czech Republic, Egypt, Hungary, India, Indonesia, Israel, Jordan, Korea, Malaysia, Mexico, Morocco, Pakistan, Peru, Philippines, Poland, Russia, South Africa, Taiwan, Thailand and Turkey. The Index is not actively managed and does not reflect any deduction for fees, expenses or taxes. An investor cannot invest directly in the Index.
Definitions:
Basis point – A commonly used expression for describing 1/100th of 1%.
Beta – A measure of the volatility, or systematic risk, of a security or a portfolio in comparison to an index or asset class as a whole.
Quantitative Easing (QE) – An unconventional monetary policy used by central banks to stimulate the economy when standard monetary policy has become ineffective.
4 |
www.pathwayadvisorsfunds.com |
Table of Contents
| Performance Update | ||
October 31, 2014 (Unaudited) |
Cumulative Total Return for the period ended October 31, 2014
| Calendar YTD | One Year | Since Inception* | ||||||
Pathway Advisors Conservative Fund | 4.64% | 4.96% | 4.97% | |||||
S&P 500® Total Return Index1 | 10.99% | 17.27% | 20.72% | |||||
Barclays Capital U.S. Aggregate Bond Index2 | 5.12% | 4.14% | 1.53% | |||||
Russell 2000® Index3 | 1.90% | 8.06% | 20.71% | |||||
| * | Fund inception date of July 30, 2012. |
The returns shown above do not reflect the deduction of taxes a shareholder would pay on Fund distributions or redemption of Fund shares.
Performance data quoted represents past performance. Past performance does not guarantee future results. Investment return and principal value of an investment will fluctuate so that an investor’s shares, when sold or redeemed, may be worth more or less than the original cost. Current performance data may be higher or lower than actual data quoted. For the most current month-end performance data, please call 1-888-288-1121 or visit www.pathwayadvisorsfunds.com.
| 1 | The S&P 500® Total Return Index is an unmanaged index of 500 common stocks chosen for the market size, liquidity and industry group representation. It is a market-value weighted index. The Index is not actively managed and does not reflect any deduction for fees, expenses or taxes. An investor may not invest directly into the Index. |
| 2 | The Barclays Capital U.S. Aggregate Bond Index is a market capitalization-weighted index, meaning the securities in the index are weighted according to the market size of each bond type. Most U.S. traded investment grade bonds are represented. Municipal bonds, and Treasury Inflation-Protected Securities are excluded, due to tax treatment issues. The Index includes Treasury securities, Government agency bonds, Mortgage-backed bonds, Corporate bonds, and a small amount of foreign bonds traded in U.S. The Index is not actively managed and does not reflect any deduction for fees, expenses or taxes. An investor may not invest directly into the Index. |
| 3 | The Russell 2000® Index measures the performance of the small-cap segment of the U.S. equity universe. The Russell 2000® Index is a subset of the Russell 3000® Index representing approximately 10% of the total market capitalization of that index. It includes approximately 2000 of the smallest securities based on a combination of their market cap and current index membership. The Index is not actively managed and does not reflect any deduction for fees, expenses or taxes. An investor may not invest directly into the Index. |
Semi-Annual Report | October 31, 2014 |
5 |
Table of Contents
Pathway Advisors Conservative Fund | Performance Update | |
October 31, 2014 (Unaudited) |
Growth of $10,000 for the period ended October 31, 2014
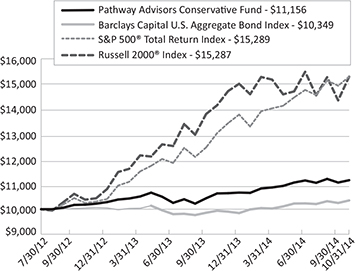
The graphs shown above represent a hypothetical investment of $10,000 in the Fund’s Investor Class shares for the period from inception to 10/31/14. All returns reflect reinvested dividends, but do not reflect the deduction of taxes that an investor would pay on distributions or redemptions.
6 |
www.pathwayadvisorsfunds.com |
Table of Contents
Pathway Advisors Conservative Fund | Performance Update | |
October 31, 2014 (Unaudited) |
| Top Ten Long Holdings | (as a % of Net Assets)* | |
iShares Core U.S. Aggregate Bond ETF | 13.99% | |
DoubleLine Total Return Bond Fund - Class I | 13.93% | |
Vanguard® Total Stock Market ETF | 11.40% | |
Metropolitan West Total Return Bond Fund - Class I | 8.00% | |
Goldman Sachs Strategic Income Fund - Institutional Class | 6.01% | |
Vanguard® Wellington Fund - Class Admiral | 5.92% | |
Templeton Global Bond Fund - Advisor Class | 5.76% | |
Vanguard® S&P 500 ETF | 5.01% | |
Putnam Capital Spectrum Fund - Class Y | 4.08% | |
Hartford World Bond Fund | 4.00% | |
Top Ten Holdings | 78.10% |
Portfolio Allocation (as a % of Net Assets)*
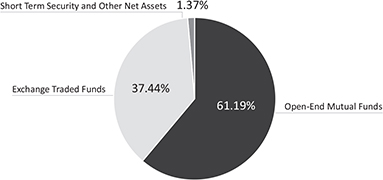
| * | Holdings are subject to change. |
Semi-Annual Report | October 31, 2014 |
7 |
Table of Contents
| Performance Update | ||
October 31, 2014 (Unaudited) |
Cumulative Total Return for the period ended October 31, 2014
| Calendar YTD | One Year | Since Inception* | ||||||
Pathway Advisors Growth and Income Fund | 4.81% | 6.45% | 8.45% | |||||
S&P 500 Total Return Index1 | 10.99% | 17.27% | 20.72% | |||||
Barclays Capital U.S. Aggregate Bond Index2 | 5.12% | 4.14% | 1.53% | |||||
Russell 2000® Index3 | 1.90% | 8.06% | 20.71% | |||||
| * | Fund inception date of July 30, 2012. |
The returns shown above do not reflect the deduction of taxes a shareholder would pay on Fund distributions or redemption of Fund shares.
Performance data quoted represents past performance. Past performance does not guarantee future results. Investment return and principal value of an investment will fluctuate so that an investor’s shares, when sold or redeemed, may be worth more or less than the original cost. Current performance data may be higher or lower than actual data quoted. For the most current month-end performance data, please call 1-888-288-1121 or visit www.pathwayadvisorsfunds.com.
| 1 | The S&P 500® Total Return Index is an unmanaged index of 500 common stocks chosen for the market size, liquidity and industry group representation. It is a market-value weighted index. The Index is not actively managed and does not reflect any deduction for fees, expenses or taxes. An investor may not invest directly into the Index. |
| 2 | The Barclays Capital U.S. Aggregate Bond Index is a market capitalization-weighted index, meaning the securities in the index are weighted according to the market size of each bond type. Most U.S. traded investment grade bonds are represented. Municipal bonds, and Treasury Inflation-Protected Securities are excluded, due to tax treatment issues. The Index includes Treasury securities, Government agency bonds, Mortgage-backed bonds, Corporate bonds, and a small amount of foreign bonds traded in U.S. The Index is not actively managed and does not reflect any deduction for fees, expenses or taxes. An investor may not invest directly into the Index. |
| 3 | The Russell 2000® Index measures the performance of the small-cap segment of the U.S. equity universe. The Russell 2000® Index is a subset of the Russell 3000® Index representing approximately 10% of the total market capitalization of that Index. It includes approximately 2000 of the smallest securities based on a combination of their market cap and current index membership. The Index is not actively managed and does not reflect any deduction for fees, expenses or taxes. An investor may not invest directly into the Index. |
8 |
www.pathwayadvisorsfunds.com |
Table of Contents
Pathway Advisors Growth and Income Fund | Performance Update | |
October 31, 2014 (Unaudited) |
Growth of $10,000 for the period ended October 31, 2014
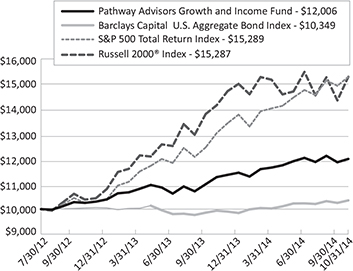
The graphs shown above represent a hypothetical investment of $10,000 in the Fund’s Investor Class shares for the period from inception to 10/31/14. All returns reflect reinvested dividends, but do not reflect the deduction of taxes that an investor would pay on distributions or redemptions.
Semi-Annual Report | October 31, 2014 |
9 |
Table of Contents
Pathway Advisors Growth and Income Fund | Performance Update | |
October 31, 2014 (Unaudited) |
| Top Ten Long Holdings | (as a % of Net Assets)* | |
Vanguard® Total Stock Market ETF | 17.56% | |
Vanguard® S&P 500 ETF | 9.01% | |
DoubleLine Total Return Bond Fund - Class I | 8.64% | |
Vanguard® Total International Stock ETF | 8.16% | |
iShares Core U.S. Aggregate Bond ETF | 6.99% | |
Putnam Capital Spectrum Fund - Class Y | 6.02% | |
Deutsche Global Infrastructure Fund - Institutional Class | 5.05% | |
Metropolitan West Total Return Bond Fund - Class I | 4.99% | |
Goldman Sachs Strategic Income Fund - Institutional Class | 3.89% | |
iShares® Dow Jones International Select Dividend Index Fund | 3.06% | |
Top Ten Holdings | 73.37% |
Portfolio Allocation (as a % of Net Assets)*
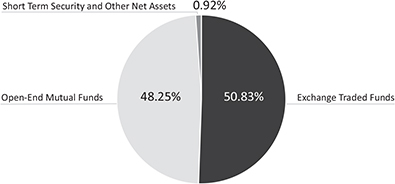
| * | Holdings are subject to change. |
10 |
www.pathwayadvisorsfunds.com |
Table of Contents
| Performance Update | ||
October 31, 2014 (Unaudited) |
Cumulative Total Return for the period ended October 31, 2014
| Calendar YTD | One Year | Since Inception* | ||||||
Pathway Advisors Aggressive Growth Fund | 4.76% | 7.25% | 13.28% | |||||
MSCI EAFE® Index1 | -2.81% | -0.60% | 14.05% | |||||
S&P 500 Total Return Index2 | 10.99% | 17.27% | 20.72% | |||||
Russell 2000® Index3 | 1.90% | 8.06% | 20.71% | |||||
| * | Fund inception date of July 30, 2012. |
The returns shown above do not reflect the deduction of taxes a shareholder would pay on Fund distributions or redemption of Fund shares.
Performance data quoted represents past performance. Past performance does not guarantee future results. Investment return and principal value of an investment will fluctuate so that an investor’s shares, when sold or redeemed, may be worth more or less than the original cost. Current performance data may be higher or lower than actual data quoted. For the most current month-end performance data, please call 1-888-288-1121 or visit www.pathwayadvisorsfunds.com.
| 1 | MSCI EAFE® Index (Europe, Australasia, Far East) is a free float-adjusted market capitalization weighted index designed to measure developed market equity performance. The MSCI EAFE® Index is composed of companies representative of the market structure of Developed Market countries. The index includes reinvestment of dividends, net of foreign withholding taxes. The Index is not actively managed and does not reflect any deduction for fees, expenses or taxes. An investor may not invest directly into the Index. |
| 2 | The S&P 500® Total Return Index is an unmanaged index of 500 common stocks chosen for the market size, liquidity and industry group representation. It is a market-value weighted index. The Index is not actively managed and does not reflect any deduction for fees, expenses or taxes. An investor may not invest directly into the Index. |
| 3 | The Russell 2000® Index measures the performance of the small-cap segment of the U.S. equity universe. The Russell 2000® Index is a subset of the Russell 3000® Index representing approximately 10% of the total market capitalization of that index. It includes approximately 2000 of the smallest securities based on a combination of their market cap and current index membership. The Index is not actively managed and does not reflect any deduction for fees, expenses or taxes. An investor may not invest directly into the Index. |
Source: MSCI. MSCI makes no express or implied warranties or representations and shall have no liability whatsoever with respect to any MSCI data contained herein. The MSCI data may not be further redistributed or used to create indices or financial products. This report is not approved or produced by MSCI.
Semi-Annual Report | October 31, 2014 |
11 |
Table of Contents
Pathway Advisors Aggressive Growth Fund | Performance Update | |
October 31, 2014 (Unaudited) |
Growth of $10,000 for the period ended October 31, 2014
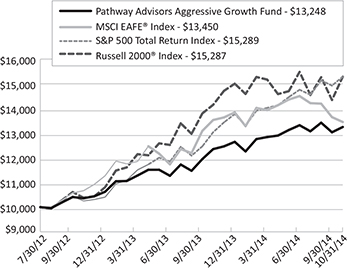
The graphs shown above represent a hypothetical investment of $10,000 in the Fund’s Investor Class shares for the period from inception 10/31/14. All returns reflect reinvested dividends, but do not reflect the deduction of taxes that an investor would pay on distributions or redemptions.
12 |
www.pathwayadvisorsfunds.com |
Table of Contents
Pathway Advisors Aggressive Growth Fund | Performance Update | |
October 31, 2014 (Unaudited) |
| Top Ten Long Holdings | (as a % of Net Assets)* | |
Vanguard® Total Stock Market ETF | 23.71% | |
Vanguard® Total International Stock ETF | 12.15% | |
Vanguard® S&P 500 ETF | 10.09% | |
DoubleLine Total Return Bond Fund - Class I | 9.60% | |
Putnam Capital Spectrum Fund - Class Y | 6.06% | |
Deutsche Global Infrastructure Fund - Institutional Class | 5.95% | |
iShares® Dow Jones International Select Dividend Index Fund | 5.00% | |
Principal MidCap Fund - Institutional Class | 4.08% | |
Akre Focus Fund - Institutional Class | 4.07% | |
Vanguard® FTSE Emerging Markets ETF | 4.06% | |
Top Ten Holdings | 84.77% |
Portfolio Allocation (as a % of Net Assets)*
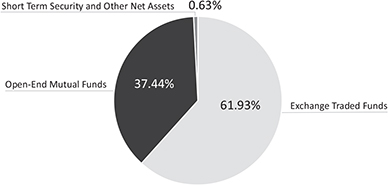
| * | Holdings are subject to change. |
Semi-Annual Report | October 31, 2014 |
13 |
Table of Contents
Pathway Advisors Funds | Disclosure of Fund Expenses | |
October 31, 2014 (Unaudited) |
As a shareholder of a Fund, you incur two types of costs: direct costs, such as short-term redemption fees and wire fees, and indirect costs, including management fees, and other fund operating expenses. This example is intended to help you understand your indirect costs, also referred to as “ongoing costs” (in dollars), of investing in the Fund and to compare these costs with the ongoing costs of investing in other mutual funds.
This example is based on an investment of $1,000 invested at the beginning of the period and held for the entire six-month period of May 1, 2014 through October 31, 2014.
Actual Expenses The first line of the table below provides information about actual account values and actual expenses. You may use the information in this line, together with the amount you invested at the beginning of the period, to estimate the expenses that you paid over the period. Simply divide your account value by $1,000 (for example, an $8,600 account value divided by $1,000 = 8.6), then multiply the result by the number in the first line under the heading “Expenses Paid During Period” to estimate the expenses you paid on your account during this period.
Hypothetical Example for Comparison Purposes The second line of the table provides information about hypothetical account values and hypothetical expenses based on the Fund’s actual expense ratio and an assumed rate of return of 5% per year before expenses, which is not the Fund’s actual return. The hypothetical account values and expenses may not be used to estimate the actual ending account balance or expenses you paid for the period. You may use this information to compare ongoing costs of investing in the Fund and other funds. To do so, compare this 5% hypothetical example with the 5% hypothetical examples that appear in the shareholder reports of other funds.
Please note that the expenses shown in the table are meant to highlight your ongoing costs only and do not reflect any direct costs, such as wire fees or low balance fees. Therefore, the second line of the table is useful in comparing ongoing costs only and will not help you determine the relative total costs of owning different funds. In addition, if these direct costs were included, your costs would be higher.
14 |
www.pathwayadvisorsfunds.com |
Table of Contents
Pathway Advisors Funds | Disclosure of Fund Expenses | |
October 31, 2014 (Unaudited)
|
| EXPENSES PAID | ||||||||
| BEGINNING | ENDING | DURING PERIOD | ||||||
| ACCOUNT VALUE | ACCOUNT VALUE | EXPENSE | 05/01/14- | |||||
| 05/01/14 | 10/31/14 | RATIO(a) | 10/31/14(b) | |||||
Pathway Advisors Conservative Fund | ||||||||
Actual | $ 1,000.00 | $ 1,020.70 | 1.88% | $ 9.58 | ||||
Hypothetical | $ 1,000.00 | $ 1,015.73 | 1.88% | $ 9.55 | ||||
Pathway Advisors Growth and Income Fund | ||||||||
Actual | $ 1,000.00 | $ 1,021.70 | 1.88% | $ 9.58 | ||||
Hypothetical | $ 1,000.00 | $ 1,015.73 | 1.88% | $ 9.55 | ||||
Pathway Advisors Aggressive Growth Fund | ||||||||
Actual | $ 1,000.00 | $ 1,026.90 | 1.88% | $ 9.60 | ||||
Hypothetical | $ 1,000.00 | $ 1,015.73 | 1.88% | $ 9.55 | ||||
| (a) | Annualized, based on the Funds’ most recent fiscal half year expenses. |
| (b) | Expenses are equal to the Fund’s annualized expense ratio multiplied by the average account value over the period, multiplied by the number of days in the most recent fiscal half-year (184)/365 (to reflect the half-year period). |
Semi-Annual Report | October 31, 2014 |
15 |
Table of Contents
| Portfolio of Investments | ||
October 31, 2014 (Unaudited)
|
| Value | ||||||||||||||||
| Description | Shares | (Note 2) | ||||||||||||||
| ||||||||||||||||
EXCHANGE TRADED FUNDS (37.44%) | ||||||||||||||||
iShares® Core U.S. Aggregate Bond ETF | 9,545 | $ 1,050,714 | ||||||||||||||
Schwab U.S. TIPs ETF™ | 4,100 | 223,983 | ||||||||||||||
Vanguard® FTSE Emerging Markets ETF | 3,555 | 151,585 | ||||||||||||||
Vanguard® S&P 500® ETF | 2,036 | 376,518 | ||||||||||||||
Vanguard® Total International Stock ETF | 2,993 | 152,523 | ||||||||||||||
Vanguard® Total Stock Market ETF | 8,234 | 856,501 | ||||||||||||||
|
| |||||||||||||||
TOTAL EXCHANGE TRADED FUNDS (Cost $2,719,941) | 2,811,824 | |||||||||||||||
| ||||||||||||||||
OPEN-END MUTUAL FUNDS (61.19%) | ||||||||||||||||
Catalyst Hedged Futures Strategy Fund - Class I(a) | 13,988 | 147,153 | ||||||||||||||
Deutsche Global Infrastructure Fund - Institutional Class | 9,508 | 148,233 | ||||||||||||||
DoubleLine Total Return Bond Fund - Class I | 95,393 | 1,046,457 | ||||||||||||||
Goldman Sachs Strategic Income Fund - Institutional Class | 43,096 | 451,649 | ||||||||||||||
Hartford World Bond Fund - Class Y | 27,883 | 300,298 | ||||||||||||||
Loomis Sayles Bond Fund - Institutional Class | 18,528 | 287,369 | ||||||||||||||
Metropolitan West Total Return Bond Fund - Class I | 55,199 | 600,562 | ||||||||||||||
Osterweis Strategic Income Fund - Class I | 24,382 | 287,219 | ||||||||||||||
PIMCO All Asset All Authority Fund - Institutional Class | 14,381 | 142,944 | ||||||||||||||
Putnam Capital Spectrum Fund - Class Y | 7,933 | 306,305 | ||||||||||||||
Templeton Global Bond Fund - Advisor Class | 32,638 | 432,785 | ||||||||||||||
Vanguard® Wellington Fund - Class Admiral | 6,389 | 444,537 | ||||||||||||||
|
| |||||||||||||||
TOTAL OPEN-END MUTUAL FUNDS (Cost $4,543,966) | 4,595,511 | |||||||||||||||
| ||||||||||||||||
| 7-Day | Value | |||||||||||||||
| Yield | Shares | (Note 2) | ||||||||||||||
| ||||||||||||||||
SHORT TERM INVESTMENTS (1.78%) | ||||||||||||||||
Dreyfus Cash Management, Institutional Shares | 0.090 | % | 133,545 | 133,545 | ||||||||||||
|
| |||||||||||||||
TOTAL SHORT TERM INVESTMENTS (Cost $133,545) | 133,545 | |||||||||||||||
| ||||||||||||||||
TOTAL INVESTMENTS (100.41%) (Cost $7,397,452) | $ | 7,540,880 | ||||||||||||||
Liabilities in Excess of Other Assets (-0.41%) | (30,668) | |||||||||||||||
| ||||||||||||||||
NET ASSETS (100.00%) | $ | 7,510,212 | ||||||||||||||
| ||||||||||||||||
| ||||||||||||||||
| (a) | Non-income producing security. |
Common Abbreviations:
ETF - Exchange Traded Fund.
FTSE - Financial Times and Stock Exchange.
PIMCO - Pacific Investment Management Company, LLC.
16 |
www.pathwayadvisorsfunds.com |
Table of Contents
Pathway Advisors Conservative Fund | Portfolio of Investments | |
October 31, 2014 (Unaudited)
|
S&P - Standard & Poor’s
TIPS - Treasury Inflation Protected Securities
Holdings are subject to change.
See Notes to Financial Statements.
Semi-Annual Report | October 31, 2014 |
17 |
Table of Contents
| Portfolio of Investments | ||
October 31, 2014 (Unaudited)
|
| Value | ||||||||||||||||
| Description | Shares | (Note 2) | ||||||||||||||
| ||||||||||||||||
EXCHANGE TRADED FUNDS (50.83%) | ||||||||||||||||
iShares® Core U.S. Aggregate Bond ETF | 26,910 | $ 2,962,253 | ||||||||||||||
iShares® Dow Jones International Select Dividend Index Fund | 35,989 | 1,298,483 | ||||||||||||||
iShares® Dow Jones Select Dividend Index Fund | 11,119 | 868,950 | ||||||||||||||
Vanguard® FTSE Emerging Markets ETF | 19,910 | 848,962 | ||||||||||||||
Vanguard® S&P 500® ETF | 20,666 | 3,821,763 | ||||||||||||||
Vanguard® Total International Stock ETF | 67,919 | 3,461,152 | ||||||||||||||
Vanguard® Total Stock Market ETF | 71,562 | 7,443,879 | ||||||||||||||
WisdomTree® Emerging Markets SmallCap Dividend Fund | 18,634 | 847,102 | ||||||||||||||
|
| |||||||||||||||
TOTAL EXCHANGE TRADED FUNDS (Cost $21,458,984) | 21,552,544 | |||||||||||||||
| ||||||||||||||||
OPEN-END MUTUAL FUNDS (48.25%) | ||||||||||||||||
Catalyst Hedged Futures Strategy Fund - Class I(a) | 118,218 | 1,243,658 | ||||||||||||||
Deutsche Global Infrastructure Fund - Institutional Class | 137,281 | 2,140,212 | ||||||||||||||
DoubleLine Total Return Bond Fund - Class I | 333,752 | 3,661,259 | ||||||||||||||
Goldman Sachs Strategic Income Fund - Institutional Class | 157,266 | 1,648,149 | ||||||||||||||
Hartford World Bond Fund - Class Y | 78,654 | 847,099 | ||||||||||||||
Loomis Sayles Bond Fund - Institutional Class | 80,151 | 1,243,137 | ||||||||||||||
Metropolitan West Total Return Bond Fund - Class I | 194,635 | 2,117,631 | ||||||||||||||
Osterweis Strategic Income Fund - Class I | 105,459 | 1,242,301 | ||||||||||||||
PIMCO All Asset All Authority Fund - Institutional Class | 124,401 | 1,236,542 | ||||||||||||||
Putnam Capital Spectrum Fund - Class Y | 66,054 | 2,550,346 | ||||||||||||||
Templeton Global Bond Fund - Advisor Class | 93,813 | 1,243,965 | ||||||||||||||
Vanguard® Wellington Fund - Class Admiral | 18,432 | 1,282,484 | ||||||||||||||
|
| |||||||||||||||
TOTAL OPEN-END MUTUAL FUNDS (Cost $20,324,497) | 20,456,783 | |||||||||||||||
| ||||||||||||||||
| 7-Day | Value | |||||||||||||||
| Yield | Shares | (Note 2) | ||||||||||||||
| ||||||||||||||||
SHORT TERM INVESTMENTS (0.95%) | ||||||||||||||||
Dreyfus Cash Management, Institutional Shares | 0.090 | % | 404,348 | 404,348 | ||||||||||||
|
| |||||||||||||||
TOTAL SHORT TERM INVESTMENTS (Cost $404,348) | 404,348 | |||||||||||||||
| ||||||||||||||||
TOTAL INVESTMENTS (100.03%) (Cost $42,187,829) | $ | 42,413,675 | ||||||||||||||
Liabilities in Excess of Other Assets (-0.03%) | (14,696) | |||||||||||||||
| ||||||||||||||||
NET ASSETS (100.00%) | $ | 42,398,979 | ||||||||||||||
| ||||||||||||||||
| ||||||||||||||||
| (a) | Non-income producing security. |
Common Abbreviations:
ETF - Exchange Traded Fund.
18 |
www.pathwayadvisorsfunds.com |
Table of Contents
Pathway Advisors Growth and Income Fund | Portfolio of Investments | |
October 31, 2014 (Unaudited)
|
FTSE - Financial Times and Stock Exchange.
PIMCO - Pacific Investment Management Company, LLC.
S&P - Standard & Poor’s.
Holdings are subject to change.
See Notes to Financial Statements.
Semi-Annual Report | October 31, 2014 |
19 |
Table of Contents
| Portfolio of Investments | ||
October 31, 2014 (Unaudited)
|
| Value | ||||||||||||||||
| Description | Shares | (Note 2) | ||||||||||||||
| ||||||||||||||||
EXCHANGE TRADED FUNDS (61.93%) | ||||||||||||||||
iShares® Dow Jones International Select Dividend Index Fund | 20,420 | $ 736,754 | ||||||||||||||
iShares® Dow Jones Select Dividend Index Fund | 7,547 | 589,798 | ||||||||||||||
Vanguard® FTSE Emerging Markets ETF | 14,036 | 598,495 | ||||||||||||||
Vanguard® S&P 500® ETF | 8,040 | 1,486,837 | ||||||||||||||
Vanguard® Total International Stock ETF | 35,124 | 1,789,919 | ||||||||||||||
Vanguard® Total Stock Market ETF | 33,587 | 3,493,720 | ||||||||||||||
WisdomTree® Emerging Markets SmallCap Dividend Fund | 9,457 | 429,915 | ||||||||||||||
|
| |||||||||||||||
TOTAL EXCHANGE TRADED FUNDS (Cost $8,903,338) | 9,125,438 | |||||||||||||||
| ||||||||||||||||
OPEN-END MUTUAL FUNDS (37.43%) | ||||||||||||||||
Akre Focus Fund - Institutional Class | 26,317 | 599,493 | ||||||||||||||
Catalyst Hedged Futures Strategy Fund - Class I(a) | 39,824 | 418,954 | ||||||||||||||
Deutsche Global Infrastructure Fund - Institutional Class | 56,212 | 876,342 | ||||||||||||||
DoubleLine Total Return Bond Fund - Class I | 129,005 | 1,415,186 | ||||||||||||||
Osterweis Strategic Income Fund - Class I | 24,461 | 288,154 | ||||||||||||||
PIMCO All Asset All Authority Fund - Institutional Class | 42,753 | 424,961 | ||||||||||||||
Principal MidCap Fund - Institutional Class | 26,904 | 600,762 | ||||||||||||||
Putnam Capital Spectrum Fund - Class Y | 23,117 | 892,548 | ||||||||||||||
|
| |||||||||||||||
TOTAL OPEN-END MUTUAL FUNDS (Cost $5,380,743) | 5,516,400 | |||||||||||||||
| ||||||||||||||||
| 7-Day | Value | |||||||||||||||
| Yield | Shares | (Note 2) | ||||||||||||||
| ||||||||||||||||
SHORT TERM INVESTMENTS (1.03%) | ||||||||||||||||
Dreyfus Cash Management, Institutional Shares | 0.090 | % | 151,592 | 151,592 | ||||||||||||
|
| |||||||||||||||
TOTAL SHORT TERM INVESTMENTS (Cost $151,592) | 151,592 | |||||||||||||||
| ||||||||||||||||
TOTAL INVESTMENTS (100.39%) (Cost $14,435,673) | $ | 14,793,430 | ||||||||||||||
Liabilities in Excess of Other Assets (-0.39%) | (57,123) | |||||||||||||||
| ||||||||||||||||
NET ASSETS (100.00%) | $ | 14,736,307 | ||||||||||||||
| ||||||||||||||||
| ||||||||||||||||
| (a) | Non-income producing security. |
Common Abbreviations:
ETF - Exchange Traded Fund.
FTSE - Financial Times and Stock Exchange.
PIMCO - Pacific Investment Management Company, LLC.
S&P - Standard & Poor’s.
Holdings are subject to change.
See Notes to Financial Statements.
20 |
www.pathwayadvisorsfunds.com |
Table of Contents
Pathway Advisors Funds | Statements of Assets and Liabilities | |
October 31, 2014 (Unaudited)
|
| PATHWAY | PATHWAY | PATHWAY | ||||||||||
| ADVISORS | ADVISORS | ADVISORS | ||||||||||
| CONSERVATIVE | GROWTH AND | AGGRESSIVE | ||||||||||
| FUND | INCOME FUND | GROWTH FUND | ||||||||||
|
| |||||||||||
ASSETS | ||||||||||||
Investments, at value | $ 7,540,880 | $ 42,413,675 | $ 14,793,430 | |||||||||
Cash | 1,028 | – | – | |||||||||
Receivable for shares sold | 247,124 | 576,623 | – | |||||||||
Dividends receivable | 5,080 | 19,285 | 5,073 | |||||||||
Other assets | 10,224 | 11,325 | 10,676 | |||||||||
| ||||||||||||
Total assets | 7,804,336 | 43,020,908 | 14,809,179 | |||||||||
| ||||||||||||
LIABILITIES | ||||||||||||
Investment advisory fees payable | – | 74,539 | 19,406 | |||||||||
Distributions and service fees payable | 5,634 | 40,110 | 14,504 | |||||||||
Payable for investments purchased | 261,282 | 430,781 | – | |||||||||
Payable due to advisor | 1,518 | – | – | |||||||||
Payable for trustee fees and expenses | 39 | 327 | 143 | |||||||||
Payable for chief compliance officer fees | 784 | 4,522 | 1,682 | |||||||||
Payable for principal financial officer fees | 195 | 1,146 | 423 | |||||||||
Payable for administration fees | 7,063 | 44,475 | 16,142 | |||||||||
Payable for transfer agency fees | 5,499 | 8,871 | 7,235 | |||||||||
Payable for professional fees | 9,101 | 10,450 | 9,472 | |||||||||
Payable for custody fees | 2,102 | 1,183 | 1,432 | |||||||||
Payable for reports to shareholders | 238 | 1,659 | 605 | |||||||||
Accrued expenses and other liabilities | 669 | 3,866 | 1,828 | |||||||||
| ||||||||||||
Total liabilities | 294,124 | 621,929 | 72,872 | |||||||||
| ||||||||||||
NET ASSETS | $ 7,510,212 | $ 42,398,979 | $ 14,736,307 | |||||||||
| ||||||||||||
| ||||||||||||
NET ASSETS CONSIST OF | ||||||||||||
Paid-in capital (Note 5) | $ 7,214,184 | $ 39,460,616 | $ 13,198,419 | |||||||||
Accumulated net investment income | 47,500 | 204,495 | 63,042 | |||||||||
Accumulated net realized gain on investments | 105,100 | 2,508,022 | 1,117,089 | |||||||||
Net unrealized appreciation on investments | 143,428 | 225,846 | 357,757 | |||||||||
| ||||||||||||
NET ASSETS | $ 7,510,212 | $ 42,398,979 | $ 14,736,307 | |||||||||
| ||||||||||||
| ||||||||||||
INVESTMENTS, AT COST | $ 7,397,452 | $ 42,187,829 | $ 14,435,673 | |||||||||
| ||||||||||||
PRICING OF SHARES | ||||||||||||
Net Asset Value, offering and redemption price per share | $ 10.83 | $ 11.77 | $ 12.99 | |||||||||
Net Assets | $ 7,510,212 | $ 42,398,979 | $ 14,736,307 | |||||||||
Shares of beneficial interest outstanding (unlimited number of shares, no par value common stock authorized) | 693,620 | 3,602,235 | 1,134,841 | |||||||||
See Notes to Financial Statements.
Semi-Annual Report | October 31, 2014 |
21 |
Table of Contents
Pathway Advisors Funds | Statements of Operations | |
For the Six Months Ended October 31, 2014 (Unaudited)
|
| PATHWAY | PATHWAY | PATHWAY | ||||||||||||||
| ADVISORS | ADVISORS | ADVISORS | ||||||||||||||
| CONSERVATIVE | GROWTH AND | AGGRESSIVE | ||||||||||||||
| FUND | INCOME FUND | GROWTH FUND | ||||||||||||||
|
| |||||||||||||||
INVESTMENT INCOME | ||||||||||||||||
Dividends from other investment companies | $ | 91,175 | $ | 579,310 | $ | 213,747 | ||||||||||
| ||||||||||||||||
Total investment income | 91,175 | 579,310 | 213,747 | |||||||||||||
| ||||||||||||||||
EXPENSES | ||||||||||||||||
Investment advisory fees (Note 6) | 32,018 | 216,344 | 80,162 | |||||||||||||
Administration fees | 13,493 | 88,346 | 32,951 | |||||||||||||
Transfer agency fees | 15,450 | 22,231 | 18,581 | |||||||||||||
Distribution and service fees | 10,410 | 64,292 | 23,397 | |||||||||||||
Professional fees | 6,958 | 8,361 | 7,392 | |||||||||||||
Custody fees | 3,491 | 3,469 | 2,787 | |||||||||||||
Reports to shareholders | 245 | 1,643 | 631 | |||||||||||||
Trustee fees and expenses | 90 | 662 | 254 | |||||||||||||
Registration/filing fees | 9,951 | 12,745 | 10,985 | |||||||||||||
Chief compliance officer fees | 2,026 | 13,602 | 5,069 | |||||||||||||
Principal financial officer fees | 489 | 3,302 | 1,224 | |||||||||||||
Other | 1,727 | 4,181 | 1,786 | |||||||||||||
| ||||||||||||||||
Total expenses before waivers | 96,348 | 439,178 | 185,219 | |||||||||||||
Less fees waived/reimbursed by investment advisor (Note 6) | (36,155) | (32,452) | (34,514) | |||||||||||||
| ||||||||||||||||
Total net expenses | 60,193 | 406,726 | 150,705 | |||||||||||||
| ||||||||||||||||
NET INVESTMENT INCOME | 30,982 | 172,584 | 63,042 | |||||||||||||
| ||||||||||||||||
Net realized gain on investments | 94,877 | 2,338,821 | 1,032,925 | |||||||||||||
Net change in unrealized appreciation/(depreciation) on investments | 5,854 | (1,637,091) | (655,216) | |||||||||||||
| ||||||||||||||||
NET REALIZED AND UNREALIZED GAIN ON INVESTMENTS | 100,731 | 701,730 | 377,709 | |||||||||||||
| ||||||||||||||||
NET INCREASE IN NET ASSETS RESULTING FROM OPERATIONS | $ | 131,713 | $ | 874,314 | $ | 440,751 | ||||||||||
| ||||||||||||||||
| ||||||||||||||||
See Notes to Financial Statements.
22 |
www.pathwayadvisorsfunds.com |
Table of Contents
Pathway Advisors | Statements of Changes in Net Assets | |
|
| Six Months Ended | For the | |||||||
| October 31, 2014 | Year Ended | |||||||
| (Unaudited) | April 30, 2014 | |||||||
| ||||||||
OPERATIONS | ||||||||
Net investment income | $ | 30,982 | $ | 52,229 | ||||
Net realized gain/(loss) on investments | 94,877 | (9,884) | ||||||
Net realized capital gain distributions from other investment companies | – | 26,283 | ||||||
Net change in unrealized appreciation on investments | 5,854 | 113,990 | ||||||
| ||||||||
Net increase in net assets resulting from operations | 131,713 | 182,618 | ||||||
| ||||||||
DISTRIBUTIONS (NOTE 3) | ||||||||
Net investment income | – | (43,119) | ||||||
Net realized gains on investments | – | (9,256) | ||||||
| ||||||||
Net decrease in net assets from distributions | – | (52,375) | ||||||
| ||||||||
BENEFICIAL INTEREST TRANSACTIONS (NOTE 5) | ||||||||
Shares sold | 3,455,662 | 4,685,131 | ||||||
Dividends reinvested | – | 52,374 | ||||||
Shares redeemed | (1,500,186) | (808,445) | ||||||
| ||||||||
Net increase in net assets derived from beneficial interest transactions | 1,955,476 | 3,929,060 | ||||||
| ||||||||
Net increase in Net Assets | 2,087,189 | 4,059,303 | ||||||
NET ASSETS: | ||||||||
Beginning of period | 5,423,023 | 1,363,720 | ||||||
| ||||||||
End of period* | $ | 7,510,212 | $ | 5,423,023 | ||||
| ||||||||
| ||||||||
* Includes accumulated net investment income of: | $ | 47,500 | $ | 16,518 | ||||
See Notes to Financial Statements.
Semi-Annual Report | October 31, 2014 |
23 |
Table of Contents
Pathway Advisors | Statements of Changes in Net Assets | |
|
| Six Months Ended | For the | |||||||
| October 31, 2014 | Year Ended | |||||||
| (Unaudited) | April 30, 2014 | |||||||
| ||||||||
OPERATIONS | ||||||||
Net investment income | $ | 172,584 | $ | 303,804 | ||||
Net realized gain/(loss) on investments | 2,338,821 | (56,031) | ||||||
Net realized capital gain distributions from other investment companies | – | 230,232 | ||||||
Net change in unrealized appreciation/(depreciation) on investments | (1,637,091) | 1,779,420 | ||||||
| ||||||||
Net increase in net assets resulting from operations | 874,314 | 2,257,425 | ||||||
| ||||||||
DISTRIBUTIONS (NOTE 3) | ||||||||
Net investment income | – | (262,518) | ||||||
Net realized gains on investments | – | (27,907) | ||||||
| ||||||||
Net decrease in net assets from distributions | – | (290,425) | ||||||
| ||||||||
BENEFICIAL INTEREST TRANSACTIONS (NOTE 5) | ||||||||
Shares sold | 15,420,233 | 36,950,034 | ||||||
Dividends reinvested | – | 290,424 | ||||||
Shares redeemed | (14,483,835) | (3,725,804) | ||||||
| ||||||||
Net increase in net assets derived from beneficial interest transactions | 936,398 | 33,514,654 | ||||||
| ||||||||
Net increase in Net Assets | 1,810,712 | 35,481,654 | ||||||
NET ASSETS: | ||||||||
Beginning of period | 40,588,267 | 5,106,613 | ||||||
| ||||||||
End of period* | $ | 42,398,979 | $ | 40,588,267 | ||||
| ||||||||
| ||||||||
* Includes accumulated net investment income of: | $ | 204,495 | $ | 31,911 | ||||
See Notes to Financial Statements.
24 |
www.pathwayadvisorsfunds.com |
Table of Contents
Pathway Advisors | Statements of Changes in Net Assets | |
|
| Six Months Ended | For the | |||||||
| October 31, 2014 | Year Ended | |||||||
| (Unaudited) | April 30, 2014 | |||||||
| ||||||||
OPERATIONS | ||||||||
Net investment income | $ | 63,042 | $ | 80,975 | ||||
Net realized gain on investments | 1,032,925 | 40,254 | ||||||
Net realized capital gain distributions from other investment companies | – | 73,997 | ||||||
Net change in unrealized appreciation/(depreciation) on investments | (655,216) | 944,050 | ||||||
| ||||||||
Net increase in net assets resulting from operations | 440,751 | 1,139,276 | ||||||
| ||||||||
DISTRIBUTIONS (NOTE 3) | ||||||||
Net investment income | – | (92,205) | ||||||
Net realized gains on investments | – | (35,419) | ||||||
| ||||||||
Net decrease in net assets from distributions | – | (127,624) | ||||||
| ||||||||
BENEFICIAL INTEREST TRANSACTIONS (NOTE 5) | ||||||||
Shares sold | 4,019,004 | 15,021,195 | ||||||
Dividends reinvested | – | 127,625 | ||||||
Shares redeemed | (6,347,255) | (1,115,620) | ||||||
| ||||||||
Net increase/(decrease) in net assets derived from beneficial interest transactions | (2,328,251) | 14,033,200 | ||||||
| ||||||||
Net increase/(decrease) in Net Assets | (1,887,500) | 15,044,852 | ||||||
NET ASSETS: | ||||||||
Beginning of period | 16,623,807 | 1,578,955 | ||||||
| ||||||||
End of period* | $ | 14,736,307 | $ | 16,623,807 | ||||
| ||||||||
| ||||||||
* Includes accumulated net investment income of: | $ | 63,042 | $ | 0 | ||||
See Notes to Financial Statements.
Semi-Annual Report | October 31, 2014 |
25 |
Table of Contents
| Financial Highlights | ||
For a share outstanding throughout the periods presented. |
For the Six Months October 31, 2014 | For the Year Ended April 30, 2014 | For the Period Ended April 30, 2013(a) | ||||||||||||||
| ||||||||||||||||
NET ASSET VALUE, BEGINNING OF PERIOD | $ | 10.61 | $ | 10.51 | $ | 10.00 | ||||||||||
INCOME FROM OPERATIONS | ||||||||||||||||
Net investment income(b) | 0.05 | 0.16 | 0.14 | |||||||||||||
Net realized and unrealized gain on investments | 0.17 | 0.10 | 0.52 | |||||||||||||
|
|
|
|
|
| |||||||||||
Total from Investment Operations | 0.22 | 0.26 | 0.66 | |||||||||||||
|
|
|
|
|
| |||||||||||
LESS DISTRIBUTIONS | ||||||||||||||||
Net investment income | – | (0.13) | (0.13) | |||||||||||||
Net realized gain on investments | – | (0.03) | (0.02) | |||||||||||||
|
|
|
|
|
| |||||||||||
Total Distributions | – | (0.16) | (0.15) | |||||||||||||
|
|
|
|
|
| |||||||||||
NET INCREASE IN NET ASSET VALUE | 0.22 | 0.10 | 0.51 | |||||||||||||
|
|
|
|
|
| |||||||||||
NET ASSET VALUE, END OF PERIOD | $ | 10.83 | $ | 10.61 | $ | 10.51 | ||||||||||
|
|
|
|
|
| |||||||||||
TOTAL RETURN(c) | 2.07% | 2.53% | 6.59% | |||||||||||||
RATIOS/SUPPLEMENTAL DATA | ||||||||||||||||
Net assets, End of Period (000s) | $ | 7,510 | $ | 5,423 | $ | 1,364 | ||||||||||
RATIOS TO AVERAGE NET ASSETS: | ||||||||||||||||
Operating expenses excluding reimbursement/waiver(d) | 3.01%(e) | 4.84% | 49.62%(e)(f) | |||||||||||||
Operating expenses including reimbursement/waiver(d) | 1.88%(e) | 1.91%(g) | 1.98%(e)(f) | |||||||||||||
Net investment income including reimbursement/waiver(d) | 0.97%(e) | 1.57% | 1.83%(e) | |||||||||||||
PORTFOLIO TURNOVER RATE | 54%(h) | 38% | 18%(h) | |||||||||||||
| (a) | The Fund commenced operations on July 31, 2012. |
| (b) | Calculated using the average shares method. |
| (c) | Total investment return is calculated assuming a purchase of a common share at the opening of the first day and a sale at closing on the last day of each period reported. Dividends and distributions, if any, are assumed for purposes of this calculation to be reinvested at prices obtained under the Fund’s dividend reinvestment plan. Total returns would have been lower had certain expenses not been waived during the period. Total investment returns do not reflect brokerage commissions, if any, and are not annualized. |
| (d) | The ratios exclude the impact of expenses of the underlying funds in which the Fund invests as represented in the Portfolio of Investments. |
| (e) | Annualized. |
| (f) | Expense ratios before reductions for startup periods may not be representative of longer term operating periods. |
| (g) | Contractual expense limitation changed from 1.98% to 1.88% effective October 1, 2013. |
| (h) | Not Annualized. |
See Notes to Financial Statements.
26 |
www.pathwayadvisorsfunds.com |
Table of Contents
| Financial Highlights | ||
For a share outstanding throughout the periods presented. |
For the Six Months Ended October 31, 2014 | For the Year Ended April 30, 2014 | For the Period Ended April 30, 2013(a) | ||||||||||||||
| ||||||||||||||||
NET ASSET VALUE, BEGINNING OF PERIOD | $ | 11.52 | $ | 10.85 | $ | 10.00 | ||||||||||
INCOME FROM OPERATIONS | ||||||||||||||||
Net investment income(b) | 0.05 | 0.14 | 0.05 | |||||||||||||
Net realized and unrealized gain on investments | 0.20 | 0.63 | 0.91 | |||||||||||||
|
|
|
|
|
| |||||||||||
Total from Investment Operations | 0.25 | 0.77 | 0.96 | |||||||||||||
|
|
|
|
|
| |||||||||||
LESS DISTRIBUTIONS | ||||||||||||||||
Net investment income | – | (0.09) | (0.09) | |||||||||||||
Net realized gain on investments | – | (0.01) | (0.02) | |||||||||||||
|
|
|
|
|
| |||||||||||
Total Distributions | – | (0.10) | (0.11) | |||||||||||||
|
|
|
|
|
| |||||||||||
NET INCREASE IN NET ASSET VALUE | 0.25 | 0.67 | 0.85 | |||||||||||||
|
|
|
|
|
| |||||||||||
NET ASSET VALUE, END OF PERIOD | $ | 11.77 | $ | 11.52 | $ | 10.85 | ||||||||||
|
|
|
|
|
| |||||||||||
TOTAL RETURN(c) | 2.17% | 7.17% | 9.65% | |||||||||||||
RATIOS/SUPPLEMENTAL DATA | ||||||||||||||||
Net assets, End of Period (000s) | $ | 42,399 | $ | 40,588 | $ | 5,107 | ||||||||||
RATIOS TO AVERAGE NET ASSETS: | ||||||||||||||||
Operating expenses excluding reimbursement/waiver(d) | 2.03%(e) | 2.73% | 33.89%(e)(f) | |||||||||||||
Operating expenses including reimbursement/waiver(d) | 1.88%(e) | 1.90%(g) | 1.98%(e)(f) | |||||||||||||
Net investment income including reimbursement/waiver(d) | 0.80%(e) | 1.26% | 0.64%(e) | |||||||||||||
PORTFOLIO TURNOVER RATE | 85%(h) | 11% | 5%(h) | |||||||||||||
| (a) | The Fund commenced operations on July 31, 2012. |
| (b) | Calculated using the average shares method. |
| (c) | Total investment return is calculated assuming a purchase of a common share at the opening of the first day and a sale at closing on the last day of each period reported. Dividends and distributions, if any, are assumed for purposes of this calculation to be reinvested at prices obtained under the Fund’s dividend reinvestment plan. Total returns would have been lower had certain expenses not been waived during the period. Total investment returns do not reflect brokerage commissions, if any, and are not annualized. |
| (d) | The ratios exclude the impact of expenses of the underlying funds in which the Fund invests as represented in the Portfolio of Investments. |
| (e) | Annualized. |
| (f) | Expense ratios before reductions for startup periods may not be representative of longer term operating periods. |
| (g) | Contractual expense limitation changed from 1.98% to 1.88% effective October 1, 2013. |
| (h) | Not Annualized. |
See Notes to Financial Statements.
Semi-Annual Report | October 31, 2014 |
27 |
Table of Contents
| Financial Highlights | ||
For a share outstanding throughout the periods presented. |
For the Six Months October 31, 2014 | For the Year Ended April 30, 2014 | For the Period Ended April 30, 2013(a) | ||||||||||||||
| ||||||||||||||||
NET ASSET VALUE, BEGINNING OF PERIOD | $ | 12.65 | $ | 11.40 | $ | 10.00 | ||||||||||
INCOME FROM OPERATIONS | ||||||||||||||||
Net investment income(b) | 0.05 | 0.10 | 0.03 | |||||||||||||
Net realized and unrealized gain on investments | 0.29 | 1.27 | 1.47 | |||||||||||||
|
|
|
|
|
| |||||||||||
Total from Investment Operations | 0.34 | 1.37 | 1.50 | |||||||||||||
|
|
|
|
|
| |||||||||||
LESS DISTRIBUTIONS | ||||||||||||||||
Net investment income | – | (0.09) | (0.08) | |||||||||||||
Net realized gain on investments | – | (0.03) | (0.02) | |||||||||||||
|
|
|
|
|
| |||||||||||
Total Distributions | – | (0.12) | (0.10) | |||||||||||||
|
|
|
|
|
| |||||||||||
NET INCREASE IN NET ASSET VALUE | 0.34 | 1.25 | 1.40 | |||||||||||||
|
|
|
|
|
| |||||||||||
NET ASSET VALUE, END OF PERIOD | $ | 12.99 | $ | 12.65 | $ | 11.40 | ||||||||||
|
|
|
|
|
| |||||||||||
TOTAL RETURN(c) | 2.69% | 12.05% | 15.14% | |||||||||||||
RATIOS/SUPPLEMENTAL DATA | ||||||||||||||||
Net assets, End of Period (000s) | $ | 14,736 | $ | 16,624 | $ | 1,579 | ||||||||||
RATIOS TO AVERAGE NET ASSETS: | ||||||||||||||||
Operating expenses excluding reimbursement/waiver(d) | 2.31%(e) | 3.16% | 44.74%(e)(f) | |||||||||||||
Operating expenses including reimbursement/waiver(d) | 1.88%(e) | 1.90%(g) | 1.98%(e)(f) | |||||||||||||
Net investment income including reimbursement/waiver(d) | 0.79%(e) | 0.85% | 0.39%(e) | |||||||||||||
PORTFOLIO TURNOVER RATE | 56%(h) | 18% | 31%(h) | |||||||||||||
| (a) | The Fund commenced operations on July 31, 2012. |
| (b) | Calculated using the average shares method. |
| (c) | Total investment return is calculated assuming a purchase of a common share at the opening of the first day and a sale at closing on the last day of each period reported. Dividends and distributions, if any, are assumed for purposes of this calculation to be reinvested at prices obtained under the Fund’s dividend reinvestment plan. Total returns would have been lower had certain expenses not been waived during the period. Total investment returns do not reflect brokerage commissions, if any, and are not annualized. |
| (d) | The ratios exclude the impact of expenses of the underlying funds in which the Fund invests as represented in the Portfolio of Investments. |
| (e) | Annualized. |
| (f) | Expense ratios before reductions for startup periods may not be representative of longer term operating periods. |
| (g) | Contractual expense limitation changed from 1.98% to 1.88% effective October 1, 2013. |
| (h) | Not Annualized. |
See Notes to Financial Statements.
28 |
www.pathwayadvisorsfunds.com |
Table of Contents
Pathway Advisors Funds | Notes to Financial Statements | |
October 31, 2014 (Unaudited) |
1. ORGANIZATION
Financial Investors Trust (the “Trust”), a Delaware statutory trust, is an open-end management investment company registered under the Investment Company Act of 1940, as amended (“1940 Act”). As of October 31, 2014, the Trust has 32 registered funds. This semi-annual report describes Pathway Advisors Conservative Fund, Pathway Advisors Growth and Income Fund and Pathway Advisors Aggressive Growth Fund (individually a “Fund” and collectively, the “Funds”). The Funds’ inception date was July 30, 2012 and operations commenced on July 31, 2012. The Pathway Advisors Conservative Fund seeks total return through a primary emphasis on income with a secondary emphasis on growth of capital. The Pathway Advisors Growth and Income Fund seeks total return through growth of capital and income. The Pathway Advisors Aggressive Growth Fund seeks total return through a primary emphasis on growth with a secondary emphasis on income.
2. SIGNIFICANT ACCOUNTING POLICIES
The accompanying financial statements were prepared in accordance with accounting principles generally accepted in the United States of America (“U.S. GAAP”). The preparation of financial statements in conformity with U.S. GAAP requires management to make certain estimates and assumptions that affect the reported amounts of assets and liabilities and disclosures of contingent assets and liabilities at the date of the financial statements and the reported amounts of revenue and expenses during the period. Actual results could differ from those estimates. The Funds are considered an investment company for financial reporting purposes under GAAP. The following is a summary of significant accounting policies consistently followed by the Funds in preparation of their financial statements.
Investment Valuation: The Funds generally value their securities based on market prices determined at the close of regular trading on the New York Stock Exchange (“NYSE”), normally 4:00 p.m. Eastern Time, on each day the NYSE is open for trading.
For equity securities and mutual funds that are traded on an exchange, the market price is usually the closing sale or official closing price on that exchange. In the case of equity securities not traded on an exchange, or if such closing prices are not otherwise available, the securities are valued at the mean of the most recent bid and ask prices on such day. Redeemable securities issued by open-end registered investment companies are valued at the investment company’s applicable net asset value, with the exception of exchange-traded open-end investment companies, which are priced as equity securities.
The market price for debt obligations is generally the price supplied by an independent third-party pricing service approved by the Board of Trustees (the “Board”), which may use a matrix, formula or other objective method that takes into consideration quotations from dealers, market transactions in comparable investments, market indices and yield curves. If vendors are unable to supply a price, or if the price supplied is deemed to be unreliable, the market price may be determined using quotations received from one or more broker-dealers that make a market in the security. Short–term debt obligations that will mature in 60 days or less are valued at amortized cost, unless it is determined that using this method would not reflect an investment’s fair value.
When such prices or quotations are not available, or when the Fair Value Committee appointed by the Board believes that they are unreliable, securities may be priced using fair value procedures approved by the Board.
Semi-Annual Report | October 31, 2014 |
29 |
Table of Contents
Pathway Advisors Funds | Notes to Financial Statements | |
| October 31, 2014 (Unaudited) |
Fair Value Measurements: The Funds disclose the classification of their fair value measurements following a three-tier hierarchy based on the inputs used to measure fair value. Inputs refer broadly to the assumptions that market participants would use in pricing the asset or liability, including assumptions about risk. Inputs may be observable or unobservable. Observable inputs reflect the assumptions market participants would use in pricing the asset or liability that are developed based on market data obtained from sources independent of the reporting entity. Unobservable inputs reflect the reporting entity’s own assumptions about the assumptions market participants would use in pricing the asset or liability that are developed based on the best information available.
Various inputs are used in determining the value of the Funds’ investments as of the end of the reporting period. When inputs used fall into different levels of the fair value hierarchy, the level in the hierarchy within which the fair value measurement falls is determined based on the lowest level input that is significant to the fair value measurement in its entirety. The designated input levels are not necessarily an indication of the risk or liquidity associated with these investments. These inputs are categorized in the following hierarchy under applicable financial accounting standards:
Level 1 – | Unadjusted quoted prices in active markets for identical investments, unrestricted assets or liabilities that the Funds have the ability to access at the measurement date; | |
Level 2 – | Quoted prices which are not active, quoted prices for similar assets or liabilities in active markets or inputs other than quoted prices that are observable (either directly or indirectly) for substantially the full term of the asset or liability; and | |
Level 3 – | Significant unobservable prices or inputs (including the Funds’ own assumptions in determining the fair value of investments) where there is little or no market activity for the asset or liability at the measurement date. | |
The following is a summary of the inputs used to value the Funds’ investments as of October 31, 2014:
Pathway Advisors Conservative Fund
| Level 2 - | Level 3 - | |||||||||||||||
| Other Significant | Significant | |||||||||||||||
| Investments in Securities at | Level 1 - | Observable | Unobservable | |||||||||||||
| Value | Quoted Prices | Inputs | Inputs | Total | ||||||||||||
| ||||||||||||||||
Exchange Traded Funds | $ | 2,811,824 | $ | – | $ | – | $ | 2,811,824 | ||||||||
Open-End Mutual Funds | 4,595,511 | – | – | 4,595,511 | ||||||||||||
Short Term Investments | 133,545 | – | – | 133,545 | ||||||||||||
| ||||||||||||||||
Total | $ | 7,540,880 | $ | – | $ | – | $ | 7,540,880 | ||||||||
| ||||||||||||||||
| ||||||||||||||||
30 |
www.pathwayadvisorsfunds.com |
Table of Contents
Pathway Advisors Funds | Notes to Financial Statements | |
October 31, 2014 (Unaudited) |
Pathway Advisors Growth and Income Fund
| Level 2 - | ||||||||||||||||
Other Significant | Level 3 - Significant | |||||||||||||||
| Investments in Securities at | Level 1 - | Observable | Unobservable | |||||||||||||
| Value | Quoted Prices | Inputs | Inputs | Total | ||||||||||||
| ||||||||||||||||
Exchange Traded Funds | $ | 21,552,544 | $ | – | $ | – | $ | 21,552,544 | ||||||||
Open-End Mutual Funds | 20,456,783 | – | – | 20,456,783 | ||||||||||||
Short Term Investments | 404,348 | – | – | 404,348 | ||||||||||||
| ||||||||||||||||
Total | $ | 42,413,675 | $ | – | $ | – | $ | 42,413,675 | ||||||||
| ||||||||||||||||
| ||||||||||||||||
Pathway Advisors Aggressive Growth Fund
| Level 2 - | ||||||||||||||||
Other Significant | Level 3 - Significant | |||||||||||||||
| Investments in Securities at | Level 1 - | Observable | Unobservable | |||||||||||||
| Value | Quoted Prices | Inputs | Inputs | Total | ||||||||||||
| ||||||||||||||||
Exchange Traded Funds | $ | 9,125,438 | $ | – | $ | – | $ | 9,125,438 | ||||||||
Open-End Mutual Funds | 5,516,400 | – | – | 5,516,400 | ||||||||||||
Short Term Investments | 151,592 | – | – | 151,592 | ||||||||||||
| ||||||||||||||||
Total | $ | 14,793,430 | $ | – | $ | – | $ | 14,793,430 | ||||||||
| ||||||||||||||||
| ||||||||||||||||
The Funds recognize transfers between levels as of the end of the period. For the six months ended October 31, 2014, the Funds did not have any transfers between Level 1 and Level 2 securities. For the six months ended October 31, 2014, the Funds did not have any securities that used significant unobservable inputs (Level 3) in determining fair value.
Investment Transactions and Investment Income: Investment transactions are accounted for on the date the investments are purchased or sold (trade date basis). Net realized gains and losses from investment transactions are reported on an identified cost basis. Interest income, which includes accretion of discounts and amortization of premiums, is accrued and recorded as earned. Dividend income is recognized on the ex-dividend date or for certain foreign securities, as soon as information is available to the Funds.
Trust Expenses: Some expenses of the Trust can be directly attributed to the Funds. Expenses which cannot be directly attributed to the Funds are apportioned among all funds in the Trust based on average net assets of each fund.
Fund Expenses: Expenses that are specific to a Fund are charged directly to that Fund. Expenses which cannot be directly attributed are apportioned among all funds in the Trust based on average net assets of each Fund.
Federal Income Taxes: The Funds comply with the requirements under Subchapter M of the Internal Revenue Code of 1986, as amended, applicable to regulated investment companies and intend to distribute substantially all of their net taxable income and net capital gains, if any, each
Semi-Annual Report | October 31, 2014 |
31 |
Table of Contents
Pathway Advisors Funds | Notes to Financial Statements | |
October 31, 2014 (Unaudited) |
year, so that it will not be subject to excise tax on undistributed income and gains. The Funds are not subject to income taxes to the extent such distributions are made.
As of and during the six months ended October 31, 2014, the Funds did not have a liability for any unrecognized tax benefits. The Funds file U.S. federal, state, and local tax returns as required. The Funds’ tax returns are subject to examination by the relevant tax authorities until expiration of the applicable statute of limitations, which is generally three years after the filing of the tax return for federal purposes and four years for most state returns. Tax returns for open years have incorporated no uncertain tax positions that require a provision for income taxes.
Distributions to Shareholders: Each Fund normally pays dividends and distributes capital gains, if any, on an annual basis. Income dividend distributions are derived from interest and other income each Fund receives from its investments, including short-term capital gains. Long term capital gain distributions are derived from gains realized when each Fund sells a security it has owned for more than a year. Each Fund may make additional distributions and dividends at other times if the portfolio manager believes doing so may be necessary for each Fund to avoid or reduce taxes.
3. TAX BASIS INFORMATION
Tax Basis of Investments: As of October 31, 2014, the costs of investments for federal income tax purposes and accumulated net unrealized appreciation/(depreciation) on investments were as follows:
| Gross Appreciation (excess of value over tax cost) | Gross Depreciation (excess of tax cost over value) | Net Unrealized Appreciation | Cost of Investments for Income Tax Purposes | |||||||||||||
Pathway Advisors Conservative Fund | $ | 153,895 | $ | (26,070) | $ | 127,825 | $ | 7,413,055 | ||||||||
Pathway Advisors Growth and Income Fund | 620,704 | (440,688) | 180,016 | 42,233,659 | ||||||||||||
Pathway Advisors Aggressive Growth Fund | 516,871 | (175,196) | 341,675 | 14,451,755 | ||||||||||||
Tax Basis of Distributions to Shareholders: The character of distributions made during the period from net investment income or net realized gains may differ from its ultimate characterization for federal income tax purposes. Also, due to the timing of dividend distributions, the fiscal year in which amounts are distributed may differ from the fiscal year in which the income or realized gain were recorded by the Funds.
32 |
www.pathwayadvisorsfunds.com |
Table of Contents
Pathway Advisors Funds | Notes to Financial Statements | |
October 31, 2014 (Unaudited) |
The tax character of distributions paid by the Funds for the year ended April 30, 2014, were as follows:
| Long-Term Capital | ||||||||
| Ordinary Income | Gain | |||||||
Pathway Advisors Conservative Fund | $ | 44,742 | $ | 7,633 | ||||
Pathway Advisors Growth and Income Fund | 283,872 | 6,553 | ||||||
Pathway Advisors Aggressive Growth Fund | 125,902 | 1,722 | ||||||
During the six months ended October 31, 2014, the Funds did not make any distributions.
4. SECURITIES TRANSACTIONS
Purchases and sales of securities (excluding short-term securities) during the six months ended October 31, 2014, were as follows:
| Purchases of | Proceeds From Sales | |||||||
| Fund | Securities | of Securities | ||||||
Pathway Advisors Conservative Fund | $ | 5,420,417 | $ | 3,411,738 | ||||
Pathway Advisors Growth and Income Fund | 37,042,688 | 35,869,003 | ||||||
Pathway Advisors Aggressive Growth Fund | 8,834,911 | 11,048,138 | ||||||
5. BENEFICIAL SHARE TRANSACTIONS
The capitalization of the Trust consists of an unlimited number of shares of beneficial interest with no par value per share. Holders of the shares of the Funds of the Trust have one vote for each share held and a proportionate fraction of a vote for each fractional share. All shares issued and outstanding are fully paid and are non-assessable, transferable and redeemable at the option of the shareholder. Shares have no pre-emptive rights.
Transactions in shares of capital stock:
Pathway Advisors Conservative Fund
| For the Year Ended | For the Year Ended | |||||||
| October 31, 2014 | April 30, 2014 | |||||||
Common Shares Outstanding - Beginning of Period | 510,894 | 129,714 | ||||||
Common Shares Sold | 322,321 | 453,941 | ||||||
Common Shares Issued as Reinvestment of Dividends | – | 5,060 | ||||||
Common Shares Redeemed | (139,595) | (77,821) | ||||||
| ||||||||
Common Shares Outstanding - End of Period | 693,620 | 510,894 | ||||||
| ||||||||
| ||||||||
Semi-Annual Report | October 31, 2014 |
33 |
Table of Contents
Pathway Advisors Funds | Notes to Financial Statements | |
October 31, 2014 (Unaudited) |
Pathway Advisors Growth and Income Fund
| For the Year Ended | For the Year Ended | |||||||
| October 31, 2014 | April 30, 2014 | |||||||
Common Shares Outstanding - Beginning of Period | 3,524,222 | 470,791 | ||||||
Common Shares Sold | 1,315,270 | 3,359,753 | ||||||
Common Shares Issued as Reinvestment of Dividends | – | 25,908 | ||||||
Common Shares Redeemed | (1,237,257) | (332,230) | ||||||
| ||||||||
Common Shares Outstanding - End of Period | 3,602,235 | 3,524,222 | ||||||
| ||||||||
| ||||||||
Pathway Advisors Aggressive Growth Fund
| For the Year Ended | For the Year Ended | |||||||
| October 31, 2014 | April 30, 2014 | |||||||
Common Shares Outstanding - Beginning of Period | 1,314,394 | 138,460 | ||||||
Common Shares Sold | 311,230 | 1,256,587 | ||||||
Common Shares Issued as Reinvestment of Dividends | – | 10,317 | ||||||
Common Shares Redeemed | (490,783) | (90,970) | ||||||
| ||||||||
Common Shares Outstanding - End of Period | 1,134,841 | 1,314,394 | ||||||
| ||||||||
| ||||||||
6. MANAGEMENT AND RELATED PARTY TRANSACTIONS
Investment Advisory
Hanson McClain, Inc. (the “Adviser”), subject to the authority of the Board, is responsible for the overall management and administration of the Funds’ business affairs. The Adviser manages the investments of the Funds in accordance with the Funds’ investment objective, policies and limitations and investment guidelines established jointly by the Adviser and the Board. Pursuant to the Investment Advisory Agreement (“Advisory Agreement”), the Adviser is entitled to an investment advisory fee, computed daily and payable monthly of 1.00% of the average daily net assets for each Fund.
Prior to October 1, 2013, the Adviser had agreed contractually to limit the amount of each Fund’s total annual expenses to 1.98% of each Fund’s average daily net assets. Effective October 1, 2013, the Adviser has agreed contractually to limit the amount of each Fund’s total annual expenses, exclusive of acquired fund fees and expenses, brokerage expenses, interest expenses, taxes and extraordinary expenses, to 1.88% of each Fund’s average daily net assets. This amended agreement is in effect through August 31, 2015. The Adviser will be permitted to recover expenses it has borne through the agreement described above to the extent that the Funds’ expenses in later periods fall below the annual rates set forth in the relevant agreement. The Funds will not be obligated to pay any such deferred fees and expenses more than three years after the end of the fiscal year in which the fees and expense were deferred. The Adviser may not discontinue this waiver without the approval by the Funds’ Board.
34 |
www.pathwayadvisorsfunds.com |
Table of Contents
Pathway Advisors Funds | Notes to Financial Statements | |
October 31, 2014 (Unaudited) |
For the six months ended October 31, 2014, the fee waivers and/or reimbursements were as follows:
| Fees Waived/ | Recoupment of | |||||||||||
| Reimbursed By | Past Waived Fees | |||||||||||
| Adviser | By Adviser | Total | ||||||||||
Pathway Advisors Conservative Fund | $ | 36,155 | $ | – | $ | 36,155 | ||||||
Pathway Advisors Growth and Income Fund | 32,452 | – | 32,452 | |||||||||
Pathway Advisors Aggressive Growth Fund | 34,514 | – | 34,514 | |||||||||
As of October 31, 2014, the balances of recoupable expenses for each Fund were as follows:
|
| |||||||||||
| Fund | Expires 2016 | Expires 2017 | Total | |||||||||
Pathway Advisors Conservative Fund | $ | 153,925 | $ | 97,471 | $ | 251,396 | ||||||
Pathway Advisors Growth and Income Fund | 176,190 | 199,873 | 376,063 | |||||||||
Pathway Advisors Aggressive Growth Fund | 167,248 | 120,826 | 288,074 | |||||||||
Fund Administrator Fees and Expenses
ALPS Fund Services, Inc. (“ALPS” and the “Administrator”) (an affiliate of ALPS Distributors, Inc.) serves as administrator to the Funds, and each Fund has agreed to pay expenses incurred in connection with its administrative activities. Pursuant to the Administration, Bookkeeping and Pricing Services Agreement, ALPS will provide operational services to the Funds including, but not limited to fund accounting and fund administration and generally assist in each Fund’s operations.
Annual administrative fee, billed monthly in total and allocated to each Fund, in the amount of the greater of (a) the total annual minimum for all three Funds of $245,000 in year 1 of operations and $260,000 in year 2 and forward (subject to an annual cost of living increase) or (b) following basis point fee schedule:
| Average Total Net Assets | Contractual Fee | |||
Between $0-$500 Million | 0.05% | |||
$500M-$1 Billion | 0.03% | |||
Above $1 Billion | 0.02% |
The Administrator is also reimbursed by the Funds for certain out of pocket expenses.
Transfer Agent
ALPS serves as transfer, dividend paying and shareholder servicing agent for the Funds. ALPS receives an annual minimum fee, a fee based upon the number of shareholder accounts, and is also reimbursed by each Fund for certain out-of-pocket expenses.
Compliance Services
ALPS provides services that assist the Trust’s chief compliance officer in monitoring and testing the policies and procedures of the Trust in conjunction with requirements under Rule 38a-1 under the 1940 Act and receives an annual base fee. ALPS is reimbursed for certain out-of-pocket expenses by the Fund.
Semi-Annual Report | October 31, 2014 |
35 |
Table of Contents
Pathway Advisors Funds | Notes to Financial Statements | |
| October 31, 2014 (Unaudited) |
Principal Financial Officer
ALPS receives an annual fee for providing principal financial officer services to the Fund.
Distributor
ALPS Distributors, Inc. (“ADI” or the “Distributor”) (an affiliate of ALPS) acts as the distributor of the Funds’ shares pursuant to a Distribution Agreement with the Trust. Shares are sold on a continuous basis by ADI as agent for the Funds, and ADI has agreed to use its best efforts to solicit orders for the sale of Funds’ shares, although it is not obliged to sell any particular amount of shares. ADI is not entitled to any compensation for its services as Distributor. ADI is registered as a broker-dealer with the Securities and Exchange Commission.
Each Fund has adopted a separate Distribution and Services Plan (each a “Plan” and collectively, the “Plans”) pursuant to Rule 12b-1 of the 1940 Act. The Plans allow each Fund, as applicable, to use each Fund’s assets to pay fees in connection with the distribution and marketing of the Funds’ shares and/or the provision of shareholder services to the Funds’ shareholders. The Plan permits payment for services in connection with the administration of plans or programs that use shares of each Fund as their funding medium and for related expenses. The Plans permit each Fund to make total payments at an annual rate of up to 0.25% of each Funds’ average daily net assets. Because these fees are paid out of the Funds’ assets on an ongoing basis, over time they will increase the cost of an investment in the Funds, and Plan fees may cost an investor more than other types of sales charges.
Each Fund has adopted a Shareholder Services Plan (a “Shareholder Services Plan”) with respect to its shares. Under the Shareholder Services Plan, each Fund is authorized to pay banks and their affiliates and other institutions, including broker-dealers and Fund affiliates (“Participating Organizations”), an aggregate fee in an amount not to exceed on an annual basis 0.15% of the average daily net asset value of shares of the Funds attributable to or held in the name of a Participating Organization for its clients as compensation for providing services pursuant to an agreement with a Participating Organization. Any amount of such payment not paid during the Funds’ fiscal year for such service activities shall be reimbursed to the Funds as soon as practicable after the end of the fiscal year. Shareholder Services Plan fees are included within “Distribution and service fees” on the Statement of Operations.
7. INDEMNIFICATIONS
Under the Trust’s organizational documents, its officers and Trustees are indemnified against certain liability arising out of the performance of their duties to the Trust. Additionally, in the normal course of business, the Trust enters into contracts with service providers that may contain general indemnification clauses, which may permit indemnification to the extent permissible under applicable laws. The Trust’s maximum exposure under these arrangements is unknown, as this would involve future claims that may be made against the Trust that have not yet occurred.
36 |
www.pathwayadvisorsfunds.com |
Table of Contents
Pathway Advisors Funds | Disclosure Regarding Approval of Fund Advisory Agreement | |
October 31, 2014 (Unaudited) |
On June 10, 2014, the Trustees met in person to discuss, among other things, the approval of the investment advisory agreement between the Trust and Hanson McClain, Inc. (“Hanson McClain”) (the “Investment Advisory Agreement”), in accordance with Section 15(c) of the 1940 Act. The Independent Trustees met with independent legal counsel during executive session and discussed the Investment Advisory Agreement and other related materials.
In renewing and approving the Investment Advisory Agreement with Hanson McClain, the Trustees, including the Independent Trustees, considered the following factors with respect to the Pathway Advisors Funds:
Investment Advisory Fee Rate: The Trustees reviewed and considered the contractual annual advisory fee to be paid by the Trust, on behalf of the Pathway Advisors Funds, to Hanson McClain of 1.00% of each of the Pathway Advisors Funds’ daily average net assets, in light of the extent and quality of the advisory services provided by Hanson McClain to the Pathway Advisors Funds.
The Trustees considered the information they received comparing the Pathway Advisors Funds’ contractual annual advisory fee and overall expenses (net of waivers) with those of funds in both the relevant expense group and universe of funds provided by an independent provider of investment company data.
Based on such information, the Trustees further determined that the contractual annual advisory fee of 1.00% of each of the Pathway Advisors Funds and the total net expense ratio of 1.88% (after waivers) for each of the Pathway Advisors Funds, while greater than the median, were within an acceptable range of the median within each of the Pathway Advisors Funds’ respective peer universes.
Nature, Extent and Quality of the Services under the Investment Advisory Agreement: The Trustees received and considered information regarding the nature, extent and quality of services to be provided to the Pathway Advisors Funds under the Investment Advisory Agreement. The Trustees reviewed certain background materials supplied by Hanson McClain in its presentation, including its Form ADV.
The Trustees reviewed and considered Hanson McClain’s investment advisory personnel, its history as an asset manager and its performance and the amount of assets currently under management by Hanson McClain and its affiliated entities. The Trustees also reviewed the research and decision-making processes utilized by Hanson McClain, including the methods adopted to seek to achieve compliance with the investment objectives, policies and restrictions of the Pathway Advisors Funds.
The Trustees considered the background and experience of Hanson McClain’s management in connection with the Pathway Advisors Funds, including reviewing the qualifications, backgrounds and responsibilities of the management team primarily responsible for the day-to-day portfolio management of the Pathway Advisors Funds and the extent of the resources devoted to research and analysis of actual and potential investments.
The Trustees also reviewed, among other things, Hanson McClain’s insider trading policies and procedures and its Code of Ethics.
Semi-Annual Report | October 31, 2014 |
37 |
Table of Contents
Pathway Advisors Funds | Disclosure Regarding Approval of Fund Advisory Agreement | |
October 31, 2014 (Unaudited) |
Performance: The Trustees reviewed performance information for each of the Pathway Advisors Funds for the three-month, 1-year, 3-year and 5-year periods ended December 31, 2013. That review included a comparison of each Pathway Advisors Fund’s performance to the performance of a group of comparable funds selected by an independent provider of investment company data. The Trustees noted the performance of each Pathway Advisors Fund was generally above the respective peer universe median for the most recent 3-month period. The Trustees also considered Hanson McClain’s discussion of each Pathway Advisors Fund’s underlying portfolio diversification categories, its top contributors and top detractors, as well as Hanson McClain’s performance and reputation generally and its investment techniques, risk management controls and decision-making processes.
Total Expense Ratios, and the Adviser’s Profitability: The Trustees received and considered a projected profitability analysis prepared by Hanson McClain based on the fees payable under the Investment Advisory Agreement. The Trustees considered the profits, if any, anticipated to be realized by Hanson McClain in connection with the operation of the Pathway Advisors Funds. The Board then reviewed Hanson McClain’s financial statements in order to analyze the financial condition and stability and profitability of the adviser. In assessing the projected profitability analysis, the Trustees noted that the Pathway Advisors Funds’ total expense ratios (after waivers) and contractual advisory fee rates were was generally above the respective medians of comparable funds identified by an independent provider of investment company data.
Economies of Scale: The Trustees considered whether economies of scale in the provision of services to the Pathway Advisors Funds will be passed along to the shareholders under the proposed agreements.
Other Benefits to the Adviser: The Trustees reviewed and considered any other incidental benefits derived or to be derived by Hanson McClain from its relationship with the Pathway Advisors Funds, including whether soft dollar arrangements were used.
In selecting Hanson McClain as the Pathway Advisors Funds’ investment adviser and approving the Investment Advisory Agreement and the fees charged under the Investment Advisory Agreement, the Trustees concluded that no single factor reviewed by the Trustees was identified by the Trustees to be determinative as the principal factor in whether to approve the Investment Advisory Agreement. Further, the Independent Trustees were advised by separate independent legal counsel throughout the process. The Trustees, including all of the Independent Trustees, concluded that:
| • | the investment advisory fees to be received by Hanson McClain with respect to the Pathway Advisors Funds were within an acceptable range of the median of others within each of the Pathway Advisors Fund’s peer universes; |
| • | the nature, extent and quality of services to be rendered by Hanson McClain under the Investment Advisory Agreement were adequate; |
| • | the performance of each Pathway Advisors Fund was generally within an acceptable range of, or in more recent periods better than, the performance of the funds in its respective peer universe selected by an independent provider of investment company data; |
38 |
www.pathwayadvisorsfunds.com |
Table of Contents
Pathway Advisors Funds | Disclosure Regarding Approval of Fund Advisory Agreement | |
October 31, 2014 (Unaudited) |
| • | there was no comparable account information of Hanson McClain for the Trustees to consider; |
| • | the profit, if any, anticipated to be realized by Hanson McClain in connection with the operation of the Pathway Advisors Funds is not unreasonable to the Pathway Advisors Funds; and |
| • | there were no material economies of scale or other incidental benefits accruing to Hanson McClain in connection with its relationship with the Pathway Advisors Funds. |
Based on the Trustees’ deliberations and their evaluation of the information described above, the Trustees, including all of the Independent Trustees, concluded that Hanson McClain’s compensation for investment advisory services is consistent with the best interests of the Pathway Advisors Funds and their shareholders.
Semi-Annual Report | October 31, 2014 |
39 |
Table of Contents
Pathway Advisors Funds | Additional Information | |
October 31, 2014 (Unaudited) |
1. FUND HOLDINGS
The Funds file their complete schedule of portfolio holdings with the Securities and Exchange Commission (the “SEC”) for the first and third quarters of each fiscal year on Form N-Q within 60 days after the end of the period. Copies of the Funds’ Form N-Q are available without charge on the SEC website at http://www.sec.gov. You may also review and copy the Form N-Q at the SEC’s Public Reference Room in Washington, DC. For more information about the operation of the Public Reference Room, please call the SEC at 1-800-SEC-0330.
2. FUND PROXY VOTING POLICIES, PROCEDURES AND SUMMARIES
The Funds’ policies and procedures used in determining how to vote proxies and information regarding how the Fund voted proxies relating to portfolio securities during the most recent prior 12-month period ending June 30 are available without charge, (1) upon request, by calling (toll-free) 888-288-1121 and (2) on the SEC’s website at http://www.sec.gov.
40 |
www.pathwayadvisorsfunds.com |
Table of Contents
Table of Contents
Table of Contents
| PAGE | ||
| 1 | ||
| 6 | ||
| 7 | ||
| 8 | ||
| 9 | ||
| 23 | ||
| 50 | ||
| 52 | ||
| 53 | ||
| 55 | ||
| 57 | ||
| 58 | ||
| 69 | ||
| 71 | ||
Table of Contents
| Redmont Funds | Shareholder Letter | |
October 31, 2014 (Unaudited) |
Introduction:
October 31, 2014
The Funds performed well during the past six months. The absolute performance was driven by the Tactical allocation and relative performance was driven by the Long/Short and Opportunistic allocations.
Tactical Managers – the Tactical managers had mixed performance with FPA performing as expected and Blackrock Global Allocation underperforming our expectations. Blackrock was replaced during September (discussed further below) by two new managers and the allocation was rebalanced to equal-weight all three of the ongoing managers.
Long/Short Managers – three of the Long/Short managers performed very well – Boston Partners, Dalton & Diamond Hill – and added considerable value over their index. The fourth manager, Marketfield, struggled and lost money during the period. We are evaluating this manager to determine if they will be a part of the portfolio going forward and will provide an update if anything changes.
Opportunistic Managers – two of the Opportunistic managers performed very well – AQR Risk Parity & AQR Multi-Strategy – and added considerable value over their index. Stadion performed in-line with the index while Loeb struggled and lost money during the period. We remain comfortable with all four strategies and do not anticipate any changes in the near future.
Please see our fact sheet for a more detailed listing of performance and allocations.
REDMONT RESOLUTE FUND I
Table 1 notes the performance for Fund I as of quarter end under standard reporting (since inception) as well as of October 31st.
Table 1 i. ii. iii. iv. v.
Performance (amounts greater than one year are annualized)
| Standardized Performance Data | ||||||||||||||||||||
| Redmont Resolute Fund I | As of October 31, 2014 | |||||||||||||||||||
| Since Inception | ||||||||||||||||||||
| Year-to-Date | 1-Year | (12/30/11) | ||||||||||||||||||
Resolute Fund I - I Class | 0.94% | 2.21% | 3.15% | |||||||||||||||||
Resolute Fund I - A Class | 0.57% | 1.75% | 2.73% | |||||||||||||||||
Load Adjusted | -4.99% | -3.88% | 0.71% | |||||||||||||||||
Resolute Fund II - I Class | 1.89% | 3.48% | 5.34% | |||||||||||||||||
HFRX Global Index | -0.16% | 0.96% | 3.51% | |||||||||||||||||
S&P 500® Total Return Index | 10.99% | 17.27% | 20.67% | |||||||||||||||||
Morningstar Multi-Alternative Universe | 1.23% | 2.66% | 2.50% | |||||||||||||||||
| Gross Expense | Less Expense | Net Expense | ||||||||||||||||||
| Ratio | Waivers | Ratio | Net Ratio ex Dividend & Short Expense | |||||||||||||||||
Resolute Fund I - I Class | 5.62% | -3.22% | 2.40% | 2.32% | ||||||||||||||||
Resolute Fund I - A Class | 6.15% | -3.35% | 2.80% | 2.72% | ||||||||||||||||
Resolute Fund II - I Class | 2.64% | -1.35% | 1.29% | 1.21% | ||||||||||||||||
This performance analysis section shows the fund’s historical performance. Past performance is not indicative of future results. Investment return and value of shares will fluctuate. Upon redemption, shares may be worth more or less than their original cost. The current performance may be higher or lower than the quoted performance. Call 1-855-268-2242 or visit www.redmontfunds.com for the most recent month end performance results. The Fund has a redemption fee of 2.00% for shares redeemed within the first 90 days of purchase. Maximum Offering Price (MOP) for Class A includes the Fund’s maximum sales charge of 5.50%. Performance shown at NAV does not include these sales charges and would have been lower had it been taken into account.
| Semi-Annual Report | October 31, 2014 | 1 |
Table of Contents
| Redmont Funds | Shareholder Letter | |
October 31, 2014 (Unaudited) |
REDMONT RESOLUTE FUND II
Table 2 notes the performance for Fund II as of quarter end under standard reporting (since inception) as well as of October 31st.
Table 2 i. ii. iii. iv. v.
Performance (amounts greater than one year are annualized)
| Standardized Performance Data | Non-Standardized Performance Data | |||||||||||||||||||||||||||||
| Redmont Resolute Fund II | As of September 30, 2014 | As of October 31, 2014 | ||||||||||||||||||||||||||||
| Since Inception | Year-to- | Since Funding | ||||||||||||||||||||||||||||
| Year-to-Date | 1-Year | (12/30/11) | Date | 1-Year | (12/30/11) | |||||||||||||||||||||||||
Resolute Fund II - I Class | 5.17% | 6.04% | 5.97% | 6.47% | 8.23% | 6.37% | ||||||||||||||||||||||||
HFRX Global Index | 4.29% | 5.13% | 4.46% | 5.54% | 6.95% | 4.93% | ||||||||||||||||||||||||
S&P 500® Total Return Index | 19.79% | 19.34% | 20.69% | 25.30% | 27.18% | 22.63% | ||||||||||||||||||||||||
Morningstar Multi-Alternative Universe | 1.49% | 1.98% | 2.50% | 2.65% | 3.69% | 3.01% | ||||||||||||||||||||||||
| Gross Expense | Less Expense | Net Expense | ||||||||||||||||||||||||||||
| Ratio | Waivers | Ratio | Net Ratio ex Dividend & Short Expense | |||||||||||||||||||||||||||
Resolute Fund II - I Class | 2.68% | -1.39% | 1.29% | 1.18% | ||||||||||||||||||||||||||
This performance analysis section shows the fund’s historical performance. Past performance is not indicative of future results. Investment return and value of shares will fluctuate. Upon redemption, shares may be worth more or less than their original cost. The current performance may be higher or lower than the quoted performance. Call 1-855-268-2242 or visit www.redmontfunds.com for the most recent month end performance results. The Fund has a redemption fee of 2.00% for shares redeemed within the first 90 days of purchase. Performance shown at NAV does not include these sales charges and would have been lower had it been taken into account.
Portfolio Changes:
The overall allocation has remained unchanged during 2014 but we have made several manager changes as we continue to identify unique strategies that add value to the portfolio as well as our planned transition from mutual funds (as underlying investments) to separate accounts for a number of strategies. Within the Tactical allocation, we replaced Blackrock Global Allocation during September with two more flexible strategies – Morgan Stanley Multi-Asset and Pinebridge Global Dynamic Allocation. As a part of funding those two managers, we rebalanced the Tactical allocation so that all three managers have an equal weight. There were no changes in the Long/Short or Opportunistic allocations during the last six months.
Closing:
We are excited about the manager transitions and how they impact the Funds. We appreciate your investment in our Redmont Resolute Funds, please feel free to contact us with any questions.
Sincerely,

R. Scott Graham, CFA & Michael T. Lytle, CFA
Portfolio Managers vi.
2 |
www.redmontfunds.com |
Table of Contents
| Redmont Funds | Shareholder Letter | |
October 31, 2014 (Unaudited) |
Underlying Allocation Weights & Performance:
The current allocation remained roughly unchanged during the six months ending October 31, 2014. Figure 1 lists the long-term target asset allocation for the Funds as well as the allocation for Fund I and Fund II as of October 31, 2014.
Figure 1
| Fund I | Fund II | |||
| Target Asset Allocation | October 31, 2014 Allocation | October 31, 2014 Allocation | ||
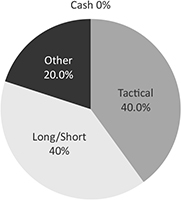 | 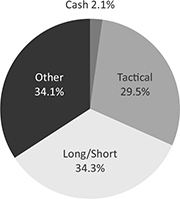 | 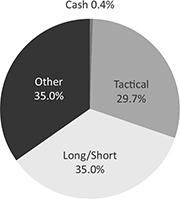 |
Holdings and allocations subject to change.
| Semi-Annual Report | October 31, 2014 | 3 |
Table of Contents
| Redmont Funds | Shareholder Letter | |
October 31, 2014 (Unaudited) |
IMPORTANT NOTES AND DISCLOSURES
The Funds’ investment objectives, risks, charges and expenses must be considered before investing. The prospectus contains this and other important information about the investment company, and may be obtained by calling 1-855-268-2242 or by visiting www.redmontfunds.com. Read it carefully before investing.
The views and information discussed in this commentary are as of the date of publication, are subject to change, and may not reflect the writer’s current views. The views expressed represent an assessment of market conditions at a specific point in time, are opinions only and should not be relied upon as investment advice regarding a particular investment or markets in general. Such information does not constitute a recommendation to buy or sell specific securities or investment vehicles. It should not be assumed that any investment will be profitable or will equal the performance of the portfolios or any securities or any sectors mentioned in this letter. The subject matter contained in this letter has been derived from several sources believed to be reliable and accurate at the time of compilation. Neither Highland Associates, Inc. nor the Funds accept any liability for losses either direct or consequential caused by the use of this information.
RISKS:
Each Fund is structured as a Fund-of-Funds. There are certain risks associated with the use of a fund-of-funds structure. These risks include, but are not limited to higher expenses, allocation risk, underlying manager and fund risk, and transparency risk. Investments such as sub-advisers and mutual funds which focus on alternative strategies are subject to increased risk and loss of principal and are not suitable for all investors.
Each Fund’s investments may subject each Fund to significantly greater volatility than investments in traditional securities and involve substantial risks, including risk of a significant portion on their principal value. The commodities markets and the prices of various commodities may fluctuate widely based on a variety of factors. Because the Fund’s performance is linked to the performance of highly volatile commodities, investors should consider purchasing shares of the Fund only as part of an overall diversified portfolio and should be willing to assume the risks of potentially significant fluctuations in the value of the Fund. Additional risks of Commodity Futures-Linked Investments include liquidity risk and counterparty credit risk.
Another principal risk of investing in the Fund is equity risk, which is the risk that the value of the securities held by the Fund will fall due to general market and economic conditions, perceptions regarding the industries in which the issuers of securities held by the Fund participate or factors relating to specific companies in which the Fund invest.
The Fund’s investments in non-U.S. issuers may be even more volatile and may present more risks than investments in U.S. issuers. The Fund is new and has a limited operating history. Equity investments in commodity-related companies may not move in the same direction and to the same extent as the underlying commodities.
This Fund is not suitable for all investors. Subject to investment risks, including possible loss of the principal amount invested.
| i. | Source: Factset |
| ii. | The HFRX Global Index is designed to be representative of the overall composition of the hedge fund universe, and includes convertible arbitrage, distressed securities, equity hedge, equity market neutral, event driven, macro, merger arbitrage, and relative value strategies. The index is not actively managed and does not reflect any deductions for fees, expense or taxes. An investor may not invest directly in an index. |
| iii. | The S&P 500 Index is an unmanaged index of 500 common stocks chosen for market size, liquidity, and industry group representation. It is a market-value weighted index. The index is not actively managed and does not reflect any deductions for fees, expense or taxes. An investor may not invest directly in an index. |
| iv. | The Morningstar Multi-Alternative Universe is designed to represent the exposure to alternative investment tactics. Funds in this category have the majority of their assets exposed to alternative strategies. An investor’s exposure to different tactics may change slightly over time in response to market movements. Funds in this category include both funds with static allocations to alternative strategies and funds tactically allocating among alternative strategies and asset classes. The gross short exposure is greater than 20%. |
| v. | Highland Associates, Inc. (the “Adviser”) has agreed, with respect to each share class of the Redmont Resolute Fund I, contractually to waive a portion of its Management Fee and/or reimburse Fund expenses in two ways. First, the Adviser will waive the portion of its 1.50% Management Fee and/or reimburse the Fund (or share class, as applicable) by an amount equal to any amount over the total of (i) 0.50% plus (ii) any sub-advisory fees paid by the Adviser (“Sub-Advisory Fees”). Second, and after the fee waiver and/or expense reimbursement described above has been applied, to the extent the Fund’s total annual expenses (exclusive of Distribution and Service (12b-1) Fees, Swap Fees and Expenses, Shareholder Services Fees, Acquired Fund Fees and Expenses, Sub-Advisory Fees, brokerage expenses, interest expense, taxes and extraordinary expenses) exceed 1.40% of the Fund’s average daily net assets, the Adviser has contractually agreed to also either reduce the fee payable by the amount of such excess, and/or to reimburse the Fund (or share class, as applicable) by the amount of such excess. This agreement is in effect through August 31, 2017. The Adviser will be permitted to recover expenses it has borne through the agreement to limit total annual expenses for each share class to 1.40% of the Fund’s average daily net assets, on a class-by-class basis, to the extent that the |
4 |
www.redmontfunds.com |
Table of Contents
| Redmont Funds | Shareholder Letter | |
October 31, 2014 (Unaudited)
|
Fund’s expenses in later periods fall below the annual rates set forth in the relevant agreement. The Fund will not be obligated to pay any such deferred fees and expenses more than three years after the end of the fiscal year in which the fees and expense were deferred. With respect to Redmont Resolute Fund II, the Adviser has agreed to waive Fund II’s Class I share portion of its 1.50% Management Fee in excess of any sub-advisory fees paid by the Adviser to sub-advisors in connection with Fund II. The fee waivers and/or expense reimbursements for the Funds are in effect through August 31, 2017. The Adviser may not discontinue this agreement to waive fees and/or reimburse expenses without the approval by the Fund’s Board of Trustees. |
| vi. | ALPS Distributors, Inc. is the distributor for the Redmont Funds. R. Scott Graham and Michael T. Lytle are registered representatives of ALPS Distributors, Inc. CFA Institute Marks are trademarks owned by the CFA Institute. |
| Semi-Annual Report | October 31, 2014 | 5 |
Table of Contents
| Redmont Resolute Fund I | Performance Update | |
October 31, 2014 (Unaudited)
|
Performance (for the period ended October 31, 2014)
Redmont Resolute Fund I
Cumulative Total Return
| (for the period ended October 31, 2014) | Year-to-Date | 1 Year | Since Inception* | ||||||||||||
Class A (NAV)(a) | 0.57% | 1.75 | % | 2.73% | |||||||||||
Class I (NAV) | 0.94% | 2.21 | % | 3.15% | |||||||||||
HFRX Global Hedge Fund Index(b) | -0.16% | 0.96 | % | 3.51% | |||||||||||
S&P 500® Total Return Index(c) | 10.99% | 17.27 | % | 20.67% | |||||||||||
Dow Jones U.S. Select Dividend Index(d) | 12.61% | 15.99 | % | 18.29% | |||||||||||
| * | Fund inception date of 12/30/11. |
| (a) | Net Asset Value (NAV) is the share price without sales charges. |
| (b) | The HFRX Global Hedge Fund Index is designed to be representative of the overall composition of the hedge fund universe, and includes convertible arbitrage, distressed securities, equity hedge, equity market neutral, event driven, macro, merger arbitrage, and relative value strategies. The index is not actively managed and does not reflect any deduction of fees, expenses or taxes. An investor may not invest directly in an index. |
| (c) | The S&P 500® Total Return Index is the Standard & Poor’s composite index of 500 stocks, a widely recognized, unmanaged index of common stock prices. The index is not actively managed and does not reflect any deduction of fees, expenses or taxes. An investor may not invest directly in an index. |
| (d) | The Dow Jones U.S. Select Dividend Index represents the country’s top stocks by dividend yield, selected annually and subject to screening and buffering criteria. The index is not actively managed and does not reflect any deductions of fees, expenses or taxes. An investor may not invest directly in an index. |
Performance data quoted represents past performance. Past performance does not guarantee future results. Investment return and principal value of an investment will fluctuate so that an investor’s shares, when sold or redeemed, may be worth more or less than the original cost. Current performance data may be higher or lower than actual data quoted. For the most current month-end performance data please call 1-855-268-2242.
The table does not reflect the deduction of taxes that a shareholder would pay on Fund distributions or the redemption of Fund shares.
Performance of $10,000 Initial Investment (for the period ended October 31, 2014)
Comparison of change in value of a $10,000 investment (includes applicable sales loads)
Top Ten Holdings* (for the period ended October 31, 2014)
| ||||||||
As a percentage of Net Assets | ||||||||
PIMCO Short-Term Fund, | 19.12% | |||||||
Morgan Stanley Institutional Fund, Inc.- Multi-Asset Portfolio | 10.10% | |||||||
FPA Crescent Fund | 8.93% | |||||||
Diamond Hill Long-Short Fund, Class Y | 7.76% | |||||||
MainStay Marketfield Fund, Class I | 5.62% | |||||||
AQR Multi Strategy Alternative Fund, | 2.71% | |||||||
AQR Risk Parity Fund, Class I | 2.67% | |||||||
SPDR® S&P 500® ETF Trust | 2.04% | |||||||
iShares® MSCI Japan ETF | 1.72% | |||||||
iShares® Europe ETF | 1.53% | |||||||
Top Ten Holdings | 62.20% | |||||||
* Holdings are subject to change. Table presents indicative values only. | ||||||||
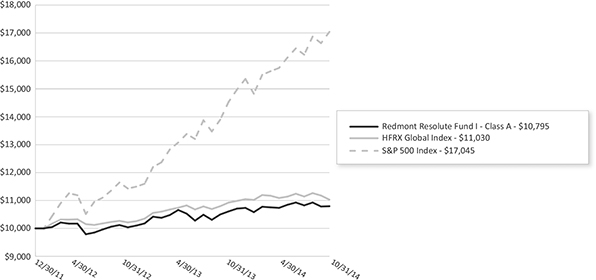
The chart represents historical performance of a hypothetical investment of $10,000 in the Fund since inception. Past performance does not guarantee future results. This chart does not reflect the deduction of taxes that a shareholder would pay on Fund distributions or the redemption of Fund shares.
6 |
www.redmontfunds.com |
Table of Contents
| Redmont Resolute Fund II | Performance Update | |
October 31, 2014 (Unaudited)
|
Performance (for the period ended October 31, 2014)
Redmont Resolute Fund II
Cumulative Total Return
| (for the period ended October 31, 2014) | Year-to-Date | 1 Year | Since Inception* | ||||||||||||
Class I (NAV) | 1.89% | 3.48% | 5.34% | ||||||||||||
HFRX Global Hedge Fund Index(a) | -0.16% | 0.96% | 3.51% | ||||||||||||
S&P 500® Total Return Index(b) | 10.99% | 17.27% | 20.67% | ||||||||||||
Dow Jones U.S. Select Dividend Index(c) | 12.61% | 15.99% | 18.29% | ||||||||||||
| * | Fund inception date of 12/30/11. |
| (a) | The HFRX Global Hedge Fund Index is designed to be representative of the overall composition of the hedge fund universe and includes convertible arbitrage, distressed securities, equity hedge, equity market neutral, event driven, macro, merger arbitrage and relative value strategies. The index is not actively managed and does not reflect any deduction of fees, expenses or taxes. An investor may not invest directly in an index. |
| (b) | The S&P 500® Total Return Index is the Standard & Poor’s composite index of 500 stocks, a widely recognized, unmanaged index of common stock prices. The index is not actively managed and does not reflect any deduction of fees, expenses or taxes. An investor may not invest directly in an index. |
| (c) | The Dow Jones U.S. Select Dividend Index represents the country’s top stocks by dividend yield, selected annually and subject to screening and buffering criteria. The index is not actively managed and does not reflect any deductions of fees, expenses or taxes. An investor may not invest directly in an index. |
Performance data quoted represents past performance. Past performance does not guarantee future results. Investment return and principal value of an investment will fluctuate so that an investor’s shares, when sold or redeemed, may be worth more or less than the original cost. Current performance data may be higher or lower than actual data quoted. For the most current month-end performance data please call 1-855-268-2242.
The table does not reflect the deduction of taxes that a shareholder would pay on Fund distributions or the redemption of Fund shares.
Performance of $10,000 Initial Investment (for the period ended October 31, 2014)
Comparison of change in value of a $10,000 investment
Top Ten Holdings* (for the period ended October 31, 2014)
| ||||
As a percentage of Net Assets | ||||
PIMCO Short-Term Fund, Institutional Class | 15.24% | |||
FPA Crescent Fund | 9.96% | |||
Morgan Stanley Institutional Fund, Inc. - Multi-Asset Portfolio | 9.95% | |||
Diamond Hill Long-Short Fund, Class Y | 9.77% | |||
MainStay Marketfield Fund, Class I | 8.50% | |||
AQR Risk Parity Fund, | 6.21% | |||
AQR Multi Strategy Alternative Fund, Class I | 6.10% | |||
Nuveen Symphony | 1.01% | |||
MV EM Local Currency | 0.46% | |||
iShares® Emerging Markets Local Currency Bond ETF | 0.18% | |||
Top Ten Holdings | 67.38% | |||
* Holdings are subject to change. Table presents indicative values only. | ||||
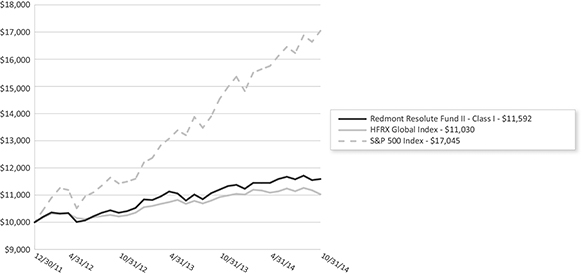
The chart represents historical performance of a hypothetical investment of $10,000 in the Fund since inception. Past performance does not guarantee future results. This chart does not reflect the deduction of taxes that a shareholder would pay on Fund distributions or the redemption of Fund shares.
Semi-Annual Report | October 31, 2014 | 7 |
Table of Contents
| Redmont Funds | Disclosure of Fund Expenses | |
October 31, 2014 (Unaudited) |
As a shareholder of the Funds, you incur two types of costs: (1) transaction costs, including applicable sales charges (loads), redemption fees, wire fees and low balance fees; and (2) ongoing costs, including management fees, distribution and service (12b-1) fees, shareholder services fees and other Fund expenses. This example is intended to help you understand your indirect costs, also referred to as “ongoing costs” (in dollars), of investing in the Fund and to compare these costs with the ongoing costs of investing in other mutual funds.
This example is based on an investment of $1,000 invested at the beginning of the period and held for the six-month period of May 1, 2014 through October 31, 2014.
Actual Expenses The first line of the table below provides information about actual account values and actual expenses. You may use the information in this line, together with the amount you invested at the beginning of the period, to estimate the expenses that you paid over the period. Simply divide your account value by $1,000 (for example, an $8,600 account value divided by $1,000 = 8.6), then multiply the result by the number in the first line under the heading “Expenses Paid During Period” to estimate the expenses you paid on your account during this period.
Hypothetical Example for Comparison Purposes The second line of the table provides information about hypothetical account values and hypothetical expenses based on the Fund’s actual expense ratio and an assumed rate of return of 5% per year before expenses, which is not the Fund’s actual return. The hypothetical account values and expenses may not be used to estimate the actual ending account balance or expenses you paid for the period. You may use this information to compare ongoing costs of investing in the Fund and other funds. To do so, compare this 5% hypothetical example with the 5% hypothetical examples that appear in the shareholder reports of other funds.
Please note that the expenses shown in the table are meant to highlight your ongoing costs only and do not reflect any transactional costs, such as applicable sales charges (loads), redemption fees, wire fees and low balance fees. Therefore, the second line of the table is useful in comparing ongoing costs only and will not help you determine the relative total costs of owning different funds. In addition, if these transaction costs were included, your costs would be higher.
| BEGINNING | ENDING | EXPENSES PAID | ||||||
| ACCOUNT VALUE | ACCOUNT VALUE | EXPENSE | DURING PERIOD | |||||
| 05/01/14 | 10/31/14 | RATIO(a) | 05/01/14-10/31/14(b) | |||||
Redmont Resolute Fund I | ||||||||
Class A | ||||||||
Actual | $ 1,000.00 | $ 1,005.70 | 2.03% | $ 10.26 | ||||
Hypothetical (5% return before expenses) | $ 1,000.00 | $ 1,014.97 | 2.03% | $ 10.31 | ||||
| ||||||||
Class I | ||||||||
Actual | $ 1,000.00 | $ 1,008.40 | 1.63% | $ 8.25 | ||||
Hypothetical (5% return before expenses) | $ 1,000.00 | $ 1,016.99 | 1.63% | $ 8.29 | ||||
Redmont Resolute Fund II | ||||||||
Class I | ||||||||
Actual | $ 1,000.00 | $ 1,012.50 | 0.30% | $ 1.52 | ||||
Hypothetical (5% return before expenses) | $ 1,000.00 | $ 1,023.69 | 0.30% | $ 1.53 | ||||
| (a) | Annualized, based on the Fund’s most recent fiscal half year expenses. |
| (b) | Expenses are equal to the Fund’s annualized expense ratio multiplied by the average account value over the period, multiplied by the number of days in the most recent fiscal half-year (184)/365 (to reflect the half-year period). |
8 |
www.redmontfunds.com |
Table of Contents
| Redmont Resolute Fund I | Schedule of Investments | |
October 31, 2014 (Unaudited) |
| Value | ||||||||
| Description | Shares | (Note 2) | ||||||
| ||||||||
COMMON STOCKS (11.16%) | ||||||||
ADVERTISING (0.10%) | ||||||||
Alliance Data Systems Corp.(a) | 4 | $ | 1,134 | |||||
Omnicom Group, Inc.(b) | 26 | 1,868 | ||||||
|
| |||||||
| 3,002 | ||||||||
|
| |||||||
AEROSPACE & DEFENSE (0.41%) | ||||||||
Cubic Corp. | 24 | 1,158 | ||||||
General Dynamics Corp. | 12 | 1,677 | ||||||
Lockheed Martin Corp.(b) | 16 | 3,049 | ||||||
Northrop Grumman Corp.(b) | 12 | 1,656 | ||||||
Raytheon Co.(b) | 16 | 1,662 | ||||||
The Boeing Co. | 7 | 874 | ||||||
Triumph Group, Inc.(b) | 24 | 1,671 | ||||||
United Technologies Corp.(b) | 11 | 1,177 | ||||||
|
| |||||||
| 12,924 | ||||||||
|
| |||||||
AGRICULTURE (0.09%) | ||||||||
Bunge, Ltd. | 14 | 1,241 | ||||||
Lorillard, Inc.(b) | 28 | 1,722 | ||||||
|
| |||||||
| 2,963 | ||||||||
|
| |||||||
AIRLINES (0.02%) | ||||||||
Delta Air Lines, Inc. | 19 | 764 | ||||||
|
| |||||||
AUTO PARTS & EQUIPMENT (0.13%) | ||||||||
Lear Corp.(b) | 24 | 2,220 | ||||||
Tenneco, Inc.(a) | 38 | 1,990 | ||||||
|
| |||||||
| 4,210 | ||||||||
|
| |||||||
BANKS (1.11%) | ||||||||
Bank of America Corp.(b) | 172 | 2,952 | ||||||
BB&T Corp.(b) | 64 | 2,424 | ||||||
Capital One Financial Corp.(b) | 39 | 3,228 | ||||||
Citigroup, Inc.(b) | 66 | 3,533 | ||||||
Comerica, Inc. | 11 | 525 | ||||||
Fifth Third Bancorp(b) | 159 | 3,179 | ||||||
Huntington Bancshares, Inc.(b) | 188 | 1,863 | ||||||
JPMorgan Chase & Co.(b) | 52 | 3,145 | ||||||
Morgan Stanley | 21 | 734 | ||||||
Regions Financial Corp.(b) | 219 | 2,175 | ||||||
State Street Corp.(b) | 33 | 2,490 | ||||||
SunTrust Banks, Inc.(b) | 23 | 900 | ||||||
The Goldman Sachs Group, Inc.(b) | 12 | 2,280 | ||||||
The PNC Financial Services Group, Inc.(b) | 23 | 1,987 | ||||||
Wells Fargo & Co.(b) | 59 | 3,132 | ||||||
|
| |||||||
| 34,547 | ||||||||
|
| |||||||
BEVERAGES (0.03%) | ||||||||
Constellation Brands, Inc., Class A(a) | 11 | 1,007 | ||||||
|
| |||||||
See Notes to Financial Statements.
| Semi-Annual Report | October 31, 2014 | 9 |
Table of Contents
| Redmont Resolute Fund I | Schedule of Investments | |
October 31, 2014 (Unaudited) |
| Value | ||||||||
| Description | Shares | (Note 2) | ||||||
| ||||||||
BIOTECHNOLOGY (0.14%) | ||||||||
Amgen, Inc.(b) | 23 | $ | 3,730 | |||||
Celgene Corp.(a) | 6 | 643 | ||||||
|
| |||||||
| 4,373 | ||||||||
|
| |||||||
BUILDING MATERIALS (0.05%) | ||||||||
Masco Corp. | 71 | 1,567 | ||||||
|
| |||||||
CHEMICALS (0.07%) | ||||||||
Huntsman Corp.(b) | 92 | 2,245 | ||||||
|
| |||||||
COAL (0.03%) | ||||||||
Cloud Peak Energy, Inc.(a) | 88 | 1,053 | ||||||
|
| |||||||
COMMERCIAL SERVICES (0.58%) | ||||||||
Apollo Education Group, Inc.(a) | 36 | 1,032 | ||||||
Equifax, Inc. | 25 | 1,893 | ||||||
EVERTEC, Inc. | 68 | 1,544 | ||||||
FTI Consulting, Inc.(a)(b) | 19 | 767 | ||||||
Global Payments, Inc. | 18 | 1,449 | ||||||
H&R Block, Inc. | 60 | 1,939 | ||||||
Manpowergroup, Inc.(b) | 26 | 1,735 | ||||||
Moody’s Corp.(b) | 18 | 1,786 | ||||||
Robert Half International, Inc.(b) | 36 | 1,972 | ||||||
Total System Services, Inc. | 48 | 1,622 | ||||||
Towers Watson & Co., Class A(b) | 20 | 2,206 | ||||||
|
| |||||||
| 17,945 | ||||||||
|
| |||||||
COMPUTERS (0.61%) | ||||||||
Amdocs, Ltd.(b) | 36 | 1,711 | ||||||
Apple, Inc.(b) | 28 | 3,024 | ||||||
Brocade Communications Systems, Inc. | 295 | 3,165 | ||||||
EMC Corp.(b) | 104 | 2,988 | ||||||
NetApp, Inc.(b) | 55 | 2,354 | ||||||
Seagate Technology PLC(b) | 41 | 2,576 | ||||||
Western Digital Corp.(b) | 32 | 3,148 | ||||||
|
| |||||||
| 18,966 | ||||||||
|
| |||||||
DISTRIBUTION & WHOLESALE (0.08%) | ||||||||
Arrow Electronics, Inc.(a)(b) | 44 | 2,502 | ||||||
WESCO International, Inc.(a) | 1 | 82 | ||||||
|
| |||||||
| 2,584 | ||||||||
|
| |||||||
DIVERSIFIED FINANCIAL SERVICES (0.31%) | ||||||||
Discover Financial Services(b) | 46 | 2,934 | ||||||
Navient Corp. | 60 | 1,187 | ||||||
Outerwall, Inc.(a) | 15 | 949 | ||||||
Raymond James Financial, Inc.(b) | 21 | 1,179 | ||||||
SLM Corp. | 69 | 659 | ||||||
TD Ameritrade Holding Corp.(b) | 40 | 1,349 | ||||||
See Notes to Financial Statements.
10 |
www.redmontfunds.com |
Table of Contents
| Redmont Resolute Fund I | Schedule of Investments | |
October 31, 2014 (Unaudited) |
| Value | ||||||||
| Description | Shares | (Note 2) | ||||||
| ||||||||
DIVERSIFIED FINANCIAL SERVICES (0.31%) (continued) | ||||||||
The Charles Schwab Corp.(b) | 45 | $ | 1,290 | |||||
|
| |||||||
| 9,547 | ||||||||
|
| |||||||
ELECTRICAL COMPONENTS & EQUIPMENT (0.03%) | ||||||||
Emerson Electric Co. | 13 | 833 | ||||||
|
| |||||||
ELECTRONICS (0.35%) | ||||||||
Avnet, Inc.(b) | 50 | 2,162 | ||||||
Flextronics International, Ltd.(a)(b) | 283 | 3,034 | ||||||
Honeywell International, Inc.(b) | 14 | 1,346 | ||||||
Jabil Circuit, Inc. | 116 | 2,430 | ||||||
TE Connectivity, Ltd. | 32 | 1,956 | ||||||
|
| |||||||
| 10,928 | ||||||||
|
| |||||||
ENGINEERING & CONSTRUCTION (0.06%) | ||||||||
Fluor Corp. | 27 | 1,791 | ||||||
|
| |||||||
ENTERTAINMENT (0.04%) | ||||||||
Six Flags Entertainment Corp. | 30 | 1,209 | ||||||
|
| |||||||
FOOD (0.08%) | ||||||||
Tyson Foods, Inc., Class A | 61 | 2,461 | ||||||
|
| |||||||
FOREST PRODUCTS & PAPER (0.05%) | ||||||||
International Paper Co.(b) | 33 | 1,670 | ||||||
|
| |||||||
HAND & MACHINE TOOLS (0.02%) | ||||||||
Stanley Black & Decker, Inc. | 7 | 655 | ||||||
|
| |||||||
HEALTHCARE - PRODUCTS (0.28%) | ||||||||
Baxter International, Inc. | 8 | 561 | ||||||
Boston Scientific Corp.(a) | 78 | 1,036 | ||||||
Covidien PLC | 8 | 739 | ||||||
Medtronic, Inc.(b) | 52 | 3,544 | ||||||
Stryker Corp. | 7 | 613 | ||||||
Zimmer Holdings, Inc. | 20 | 2,225 | ||||||
|
| |||||||
| 8,718 | ||||||||
|
| |||||||
HEALTHCARE - SERVICES (0.26%) | ||||||||
DaVita HealthCare Partners, Inc.(a)(b) | 23 | 1,796 | ||||||
ICON PLC(a) | 25 | 1,315 | ||||||
Laboratory Corp. of America Holdings(a) | 18 | 1,967 | ||||||
Select Medical Holdings Corp. | 76 | 1,096 | ||||||
Universal Health Services, Inc., Class B(b) | 20 | 2,074 | ||||||
|
| |||||||
| 8,248 | ||||||||
|
| |||||||
See Notes to Financial Statements.
| Semi-Annual Report | October 31, 2014 | 11 |
Table of Contents
| Redmont Resolute Fund I | Schedule of Investments | |
October 31, 2014 (Unaudited) |
| Value | ||||||||
| Description | Shares | (Note 2) | ||||||
| ||||||||
HOUSEWARES (0.17%) | ||||||||
Avery Dennison Corp.(b) | 64 | $ | 2,998 | |||||
Newell Rubbermaid, Inc.(b) | 68 | 2,267 | ||||||
|
| |||||||
| 5,265 | ||||||||
|
| |||||||
INSURANCE (0.74%) | ||||||||
ACE, Ltd.(b) | 20 | 2,186 | ||||||
Alleghany Corp.(a) | 4 | 1,777 | ||||||
Berkshire Hathaway, Inc., Class B(a)(b) | 16 | 2,242 | ||||||
Endurance Specialty Holdings, Ltd. | 27 | 1,565 | ||||||
MetLife, Inc.(b) | 24 | 1,302 | ||||||
Prudential Financial, Inc. | 15 | 1,328 | ||||||
Reinsurance Group of America, Inc.(b) | 15 | 1,264 | ||||||
The Allstate Corp.(b) | 36 | 2,334 | ||||||
The Travelers Companies, Inc.(b) | 21 | 2,117 | ||||||
Torchmark Corp.(b) | 24 | 1,271 | ||||||
Validus Holdings, Ltd.(b) | 46 | 1,830 | ||||||
WR Berkley Corp. | 40 | 2,062 | ||||||
XL Group PLC | 52 | 1,762 | ||||||
|
| |||||||
| 23,040 | ||||||||
|
| |||||||
INTERNET (0.33%) | ||||||||
Baidu, Inc., Sponsored ADR(a) | 4 | 955 | ||||||
CDW Corp. | 51 | 1,573 | ||||||
eBay, Inc.(a) | 29 | 1,522 | ||||||
Expedia, Inc. | 20 | 1,699 | ||||||
Google, Inc., Class A(a) | 2 | 1,136 | ||||||
Google, Inc., Class C(a) | 1 | 559 | ||||||
NetEase, Inc., ADR | 12 | 1,137 | ||||||
Yahoo!, Inc.(a) | 34 | 1,566 | ||||||
|
| |||||||
| 10,147 | ||||||||
|
| |||||||
MACHINERY - DIVERSIFIED (0.03%) | ||||||||
Flowserve Corp. | 15 | 1,020 | ||||||
|
| |||||||
MEDIA (0.60%) | ||||||||
CBS Corp., Class B(b) | 31 | 1,681 | ||||||
Comcast Corp., Class A(b) | 55 | 3,044 | ||||||
Liberty Global PLC, Class A(a) | 9 | 409 | ||||||
Liberty Global PLC, Class C(a) | 82 | 3,647 | ||||||
Liberty Media Corp., Class A(a)(b) | 10 | 480 | ||||||
Liberty Media Corp., Class C(a)(b) | 20 | 959 | ||||||
News Corp., Class A(a)(b) | 117 | 1,811 | ||||||
Phoenix New Media, Ltd., ADR(a) | 54 | 554 | ||||||
Time Warner Cable, Inc. | 6 | 883 | ||||||
Time Warner, Inc.(b) | 26 | 2,066 | ||||||
Time, Inc.(b) | 3 | 68 | ||||||
Tribune Media Co., Class A(a) | 22 | 1,474 | ||||||
Viacom, Inc., Class B(b) | 23 | 1,672 | ||||||
|
| |||||||
| 18,748 | ||||||||
|
| |||||||
See Notes to Financial Statements.
12 |
www.redmontfunds.com |
Table of Contents
| Redmont Resolute Fund I | Schedule of Investments | |
October 31, 2014 (Unaudited) |
| Value | ||||||||
| Description | Shares | (Note 2) | ||||||
| ||||||||
METAL FABRICATE & HARDWARE (0.06%) | ||||||||
Global Brass & Copper Holdings, Inc. | 76 | $ | 1,064 | |||||
The Timken Co. | 21 | 903 | ||||||
|
| |||||||
| 1,967 | ||||||||
|
| |||||||
MINING (0.04%) | ||||||||
Barrick Gold Corp. | 93 | 1,104 | ||||||
|
| |||||||
MISCELLANEOUS MANUFACTURING (0.31%) | ||||||||
Carlisle Companies, Inc.(b) | 16 | 1,422 | ||||||
Crane Co.(b) | 38 | 2,369 | ||||||
Danaher Corp.(b) | 36 | 2,895 | ||||||
Parker-Hannifin Corp.(b) | 10 | 1,270 | ||||||
Textron, Inc. | 43 | 1,786 | ||||||
|
| |||||||
| 9,742 | ||||||||
|
| |||||||
OIL & GAS (1.18%) | ||||||||
Canadian Natural Resources, Ltd.(b) | 65 | 2,267 | ||||||
Diamondback Energy, Inc.(a)(b) | 38 | 2,601 | ||||||
Energen Corp. | 31 | 2,099 | ||||||
EOG Resources, Inc.(b) | 34 | 3,232 | ||||||
EQT Corp. | 27 | 2,539 | ||||||
Exxon Mobil Corp.(b) | 45 | 4,352 | ||||||
Kosmos Energy, Ltd.(a) | 98 | 914 | ||||||
Marathon Petroleum Corp. | 22 | 2,000 | ||||||
Occidental Petroleum Corp. | 23 | 2,045 | ||||||
Pacific Drilling SA(a) | 148 | 1,077 | ||||||
Parsley Energy, Inc., Class A(a)(b) | 157 | 2,664 | ||||||
Phillips 66(b) | 40 | 3,140 | ||||||
Precision Drilling Corp. | 149 | 1,240 | ||||||
QEP Resources, Inc. | 78 | 1,955 | ||||||
Rice Energy, Inc.(a)(b) | 102 | 2,696 | ||||||
Valero Energy Corp. | 23 | 1,152 | ||||||
Western Refining, Inc. | 20 | 912 | ||||||
|
| |||||||
| 36,885 | ||||||||
|
| |||||||
OIL & GAS SERVICES (0.09%) | ||||||||
Halliburton Co. | 7 | 386 | ||||||
Schlumberger, Ltd.(b) | 24 | 2,368 | ||||||
|
| |||||||
| 2,754 | ||||||||
|
| |||||||
PACKAGING & CONTAINERS (0.38%) | ||||||||
Berry Plastics Group, Inc.(a) | 92 | 2,394 | ||||||
Crown Holdings, Inc.(a)(b) | 59 | 2,828 | ||||||
Graphic Packaging Holding Co.(a)(b) | 201 | 2,438 | ||||||
Owens-Illinois, Inc.(a) | 48 | 1,237 | ||||||
Packaging Corp. of America | 39 | 2,811 | ||||||
|
| |||||||
| 11,708 | ||||||||
|
| |||||||
PHARMACEUTICALS (0.72%) | ||||||||
Cardinal Health, Inc.(b) | 27 | 2,119 | ||||||
Express Scripts Holding Co.(a)(b) | 31 | 2,382 | ||||||
See Notes to Financial Statements.
| Semi-Annual Report | October 31, 2014 | 13 |
Table of Contents
| Redmont Resolute Fund I | Schedule of Investments | |
October 31, 2014 (Unaudited) |
| Value | ||||||||
| Description | Shares | (Note 2) | ||||||
| ||||||||
PHARMACEUTICALS (0.72%) (continued) | ||||||||
Johnson & Johnson | 15 | $ | 1,617 | |||||
McKesson Corp.(b) | 10 | 2,034 | ||||||
Novartis AG, Sponsored ADR | 26 | 2,410 | ||||||
Omnicare, Inc.(b) | 31 | 2,064 | ||||||
Pfizer, Inc.(b) | 124 | 3,714 | ||||||
Sanofi, ADR(b) | 33 | 1,526 | ||||||
Shire PLC, ADR | 3 | 599 | ||||||
Teva Pharmaceutical Industries, Ltd., Sponsored ADR | 71 | 4,009 | ||||||
|
| |||||||
| 22,474 | ||||||||
|
| |||||||
REAL ESTATE INVESTMENT TRUSTS (0.11%) | ||||||||
American Capital Agency Corp. | 32 | 728 | ||||||
American Homes 4 Rent, Class A | 40 | 701 | ||||||
American Residential Properties, Inc.(a) | 32 | 608 | ||||||
Boston Properties, Inc. | 5 | 634 | ||||||
Equity Residential(b) | 9 | 626 | ||||||
|
| |||||||
| 3,297 | ||||||||
|
| |||||||
RETAIL (0.42%) | ||||||||
CVS Health Corp.(b) | 27 | 2,317 | ||||||
Macy’s, Inc.(b) | 31 | 1,792 | ||||||
Rite Aid Corp.(a)(b) | 383 | 2,011 | ||||||
Sally Beauty Holdings, Inc.(a) | 45 | 1,319 | ||||||
The Gap, Inc. | 45 | 1,705 | ||||||
The Home Depot, Inc.(b) | 22 | 2,146 | ||||||
Wal-Mart Stores, Inc. | 23 | 1,754 | ||||||
|
| |||||||
| 13,044 | ||||||||
|
| |||||||
SAVINGS & LOANS (0.03%) | ||||||||
Investors Bancorp, Inc. | 94 | 1,010 | ||||||
|
| |||||||
SEMICONDUCTORS (0.36%) | ||||||||
Avago Technologies, Ltd. | 26 | 2,243 | ||||||
NXP Semiconductor NV(a) | 34 | 2,334 | ||||||
ON Semiconductor Corp.(a)(b) | 212 | 1,757 | ||||||
QUALCOMM, Inc.(b) | 19 | 1,492 | ||||||
Texas Instruments, Inc.(b) | 42 | 2,086 | ||||||
TriQuint Semiconductor, Inc.(a) | 68 | 1,471 | ||||||
|
| |||||||
| 11,383 | ||||||||
|
| |||||||
SHIPBUILDING (0.06%) | ||||||||
Huntington Ingalls Industries, Inc.(b) | 18 | 1,905 | ||||||
|
| |||||||
SOFTWARE (0.40%) | ||||||||
Activision Blizzard, Inc.(b) | 116 | 2,314 | ||||||
CA, Inc. | 31 | 901 | ||||||
Electronic Arts, Inc.(a) | 28 | 1,147 | ||||||
Fidelity National Information Services, Inc. | 30 | 1,752 | ||||||
Microsoft Corp.(b) | 76 | 3,568 | ||||||
See Notes to Financial Statements.
14 |
www.redmontfunds.com |
Table of Contents
| Redmont Resolute Fund I | Schedule of Investments | |
October 31, 2014 (Unaudited) |
| Value | ||||||||
| Description | Shares | (Note 2) | ||||||
| ||||||||
SOFTWARE (0.40%) (continued) | ||||||||
Oracle Corp.(b) | 70 | $ | 2,734 | |||||
|
| |||||||
| 12,416 | ||||||||
|
| |||||||
TELECOMMUNICATIONS (0.20%) | ||||||||
Cisco Systems, Inc.(b) | 67 | 1,639 | ||||||
Harris Corp. | 16 | 1,114 | ||||||
Motorola Solutions, Inc.(b) | 31 | 2,000 | ||||||
Verizon Communications, Inc. | 28 | 1,407 | ||||||
|
| |||||||
| 6,160 | ||||||||
|
| |||||||
TOTAL COMMON STOCKS (Cost $296,758) | 348,279 | |||||||
| ||||||||
EXCHANGE TRADED FUNDS (9.34%) | ||||||||
iShares® Emerging Markets Local Currency Bond ETF | 429 | 20,828 | ||||||
iShares® Europe ETF | 1,081 | 47,661 | ||||||
iShares® iBoxx $ Investment Grade Corporate Bond ETF | 84 | 10,025 | ||||||
iShares® MSCI Emerging Markets ETF | 302 | 12,729 | ||||||
iShares® MSCI Japan ETF | 4,446 | 53,619 | ||||||
iShares® MSCI Mexico Capped ETF | 143 | 9,788 | ||||||
iShares® MSCI United Kingdom ETF | 824 | 15,664 | ||||||
iShares® Russell 2000 ETF | 154 | 17,950 | ||||||
PowerShares® Senior Loan Portfolio | 1,336 | 32,572 | ||||||
SPDR® S&P 500® ETF Trust | 315 | 63,523 | ||||||
Vanguard Total International Bond ETF | 135 | 7,070 | ||||||
|
| |||||||
| 291,429 | ||||||||
|
| |||||||
TOTAL EXCHANGE TRADED FUNDS (Cost $279,506) | 291,429 | |||||||
| ||||||||
EXCHANGE TRADED NOTES (0.40%) | ||||||||
PowerShares® DB Italian Treasury Bond Futures ETN | 415 | 12,384 | ||||||
|
| |||||||
TOTAL EXCHANGE TRADED NOTES (Cost $12,412) | 12,384 | |||||||
| ||||||||
LIMITED PARTNERSHIPS (0.02%) | ||||||||
CHEMICALS (0.01%) | ||||||||
CVR Partners LP | 28 | 341 | ||||||
|
| |||||||
OIL & GAS (0.01%) | ||||||||
Viper Energy Partners LP(a) | 11 | 223 | ||||||
|
| |||||||
TOTAL LIMITED PARTNERSHIPS (Cost $864) | 564 | |||||||
| ||||||||
OPEN-END MUTUAL FUNDS (56.90%) | ||||||||
AQR Multi Strategy Alternative Fund, Class I | 8,488 | 84,460 | ||||||
AQR Risk Parity Fund, Class I | 7,061 | 83,178 | ||||||
See Notes to Financial Statements.
| Semi-Annual Report | October 31, 2014 | 15 |
Table of Contents
| Redmont Resolute Fund I | Schedule of Investments | |
October 31, 2014 (Unaudited) |
| Value | ||||||||
| Description | Shares | (Note 2) | ||||||
| ||||||||
OPEN-END MUTUAL FUNDS (56.90%) (continued) | ||||||||
Diamond Hill Long-Short Fund, Class Y | 10,210 | $ | 242,086 | |||||
FPA Crescent Fund | 8,141 | 278,601 | ||||||
MainStay Marketfield Fund, Class I | 10,533 | 175,272 | ||||||
Morgan Stanley Institutional Fund, Inc. - Multi-Asset Portfolio, Class I | 26,560 | 315,266 | ||||||
PIMCO Short-Term Fund, Institutional Class | 60,186 | 596,446 | ||||||
|
| |||||||
| 1,775,309 | ||||||||
|
| |||||||
TOTAL OPEN-END MUTUAL FUNDS (Cost $1,639,973) | 1,775,309 | |||||||
| ||||||||
| Principal Amount/ | Value | |||||||
| Shares | (Note 2) | |||||||
| ||||||||
SHORT TERM INVESTMENTS (3.36%) | ||||||||
MONEY MARKET FUND (3.30%) | ||||||||
Dreyfus Treasury Cash Management Fund, Institutional Class, 7-day yield, | 102,957 | 102,957 | ||||||
|
| |||||||
U.S. TREASURY BILLS (0.06%) | ||||||||
0.000%(d) , 12/18/2014(c) | 2,000 | 2,000 | ||||||
|
| |||||||
TOTAL SHORT TERM INVESTMENTS (Cost $104,957) | 104,957 | |||||||
| ||||||||
TOTAL INVESTMENTS (81.18%) (Cost $2,334,470) | $ | 2,532,922 | ||||||
SEGREGATED CASH WITH BROKERS (22.87%)(e) | 713,595 | |||||||
SECURITIES SOLD SHORT (-5.21%) | ||||||||
(Proceeds $153,495) | (162,469) | |||||||
OTHER ASSETS IN EXCESS OF LIABILITIES (1.16%) | 35,929 | |||||||
| ||||||||
NET ASSETS (100.00%) | $ | 3,119,977 | ||||||
| ||||||||
| SCHEDULE OF SECURITIES SOLD SHORT | ||||||||
| Value | ||||||||
| Shares | (Note 2) | |||||||
| ||||||||
COMMON STOCKS (-5.10%) | ||||||||
APPAREL (-0.07%) | ||||||||
Deckers Outdoor Corp. | (12) | (1,049) | ||||||
Under Armour, Inc., Class A | (17) | (1,115) | ||||||
|
| |||||||
| (2,164) | ||||||||
|
| |||||||
AUTO PARTS & EQUIPMENT (-0.05%) | ||||||||
Autoliv, Inc. | (16) | (1,468) | ||||||
|
| |||||||
BANKS (-0.40%) | ||||||||
BancorpSouth, Inc. | (39) | (898) | ||||||
Community Bank System, Inc. | (30) | (1,144) | ||||||
CVB Financial Corp. | (50) | (789) | ||||||
First Financial Bankshares, Inc. | (42) | (1,335) | ||||||
HDFC Bank, Ltd., ADR | (20) | (1,049) | ||||||
See Notes to Financial Statements.
16 |
www.redmontfunds.com |
Table of Contents
| Redmont Resolute Fund I | Schedule of Investments | |
October 31, 2014 (Unaudited) |
| Value | ||||||||
| Shares | (Note 2) | |||||||
| ||||||||
BANKS (-0.40%) (continued) | ||||||||
Home BancShares, Inc. | (27) | $ | (862) | |||||
Northern Trust Corp. | (15) | (994) | ||||||
Trustmark Corp. | (41) | (998) | ||||||
UMB Financial Corp. | (14) | (834) | ||||||
United Bankshares, Inc. | (41) | (1,405) | ||||||
Valley National Bancorp | (82) | (818) | ||||||
Westamerica Bancorporation | (31) | (1,530) | ||||||
|
| |||||||
| (12,656) | ||||||||
|
| |||||||
BEVERAGES (-0.03%) | ||||||||
Keurig Green Mountain, Inc. | (7) | (1,062) | ||||||
|
| |||||||
BIOTECHNOLOGY (-0.06%) | ||||||||
Biogen Idec, Inc. | (4) | (1,284) | ||||||
Puma Biotechnology, Inc. | (3) | (752) | ||||||
|
| |||||||
| (2,036) | ||||||||
|
| |||||||
BUILDING MATERIALS (-0.07%) | ||||||||
Trex Co., Inc. | (29) | (1,247) | ||||||
Vulcan Materials Co. | (16) | (987) | ||||||
|
| |||||||
| (2,234) | ||||||||
|
| |||||||
CHEMICALS (-0.12%) | ||||||||
Air Products & Chemicals, Inc. | (8) | (1,077) | ||||||
EI du Pont de Nemours & Co. | (22) | (1,521) | ||||||
Intrepid Potash, Inc. | (83) | (1,117) | ||||||
|
| |||||||
| (3,715) | ||||||||
|
| |||||||
COAL (-0.05%) | ||||||||
CONSOL Energy, Inc. | (40) | (1,472) | ||||||
|
| |||||||
COMMERCIAL SERVICES (-0.14%) | ||||||||
The ADT Corp. | (40) | (1,434) | ||||||
Monro Muffler Brake, Inc. | (29) | (1,550) | ||||||
Ritchie Bros. Auctioneers, Inc. | (55) | (1,341) | ||||||
|
| |||||||
| (4,325) | ||||||||
|
| |||||||
COMPUTERS (-0.24%) | ||||||||
3D Systems Corp. | (24) | (907) | ||||||
IHS, Inc., Class A | (7) | (917) | ||||||
Infosys, Ltd., Sponsored ADR | (27) | (1,805) | ||||||
VeriFone Systems, Inc. | (62) | (2,310) | ||||||
Wipro, Ltd., ADR | (122) | (1,489) | ||||||
|
| |||||||
| (7,428) | ||||||||
|
| |||||||
COSMETICS & PERSONAL CARE (-0.04%) | ||||||||
Colgate-Palmolive Co. | (18) | (1,204) | ||||||
|
| |||||||
DISTRIBUTION & WHOLESALE (-0.12%) | ||||||||
Fastenal Co. | (41) | (1,806) | ||||||
WW Grainger, Inc. | (8) | (1,974) | ||||||
|
| |||||||
| (3,780) | ||||||||
|
| |||||||
DIVERSIFIED FINANCIAL SERVICES (-0.10%) | ||||||||
Eaton Vance Corp. | (27) | (995) | ||||||
Financial Engines, Inc. | (22) | (877) | ||||||
Greenhill & Co., Inc. | (21) | (945) | ||||||
LPL Financial Holdings, Inc. | (8) | (331) | ||||||
|
| |||||||
| (3,148) | ||||||||
|
| |||||||
See Notes to Financial Statements.
| Semi-Annual Report | October 31, 2014 | 17 |
Table of Contents
| Redmont Resolute Fund I | Schedule of Investments | |
October 31, 2014 (Unaudited) |
| Value | ||||||||
| Shares | (Note 2) | |||||||
| ||||||||
ELECTRIC (-0.01%) | ||||||||
Ormat Technologies, Inc. | (13) | $ | (376) | |||||
|
| |||||||
ELECTRONICS (-0.19%) | ||||||||
Itron, Inc. | (41) | (1,596) | ||||||
LG Display Co., Ltd., ADR | (94) | (1,412) | ||||||
National Instruments Corp. | (57) | (1,806) | ||||||
Trimble Navigation, Ltd. | (40) | (1,074) | ||||||
|
| |||||||
| (5,888) | ||||||||
|
| |||||||
ENTERTAINMENT (-0.10%) | ||||||||
DreamWorks Animation SKG, Inc., Class A | (56) | (1,248) | ||||||
Gaming and Leisure Properties, Inc., REIT | (61) | (1,906) | ||||||
|
| |||||||
| (3,154) | ||||||||
|
| |||||||
FOOD (-0.32%) | ||||||||
Campbell Soup Co. | (34) | (1,502) | ||||||
Flowers Foods, Inc. | (63) | (1,197) | ||||||
The Hain Celestial Group, Inc. | (15) | (1,624) | ||||||
McCormick & Co., Inc. | (19) | (1,344) | ||||||
Mondelez International, Inc., Class A | (35) | (1,234) | ||||||
Snyder’s-Lance, Inc. | (35) | (1,043) | ||||||
Sprouts Farmers Market, Inc. | (39) | (1,135) | ||||||
United Natural Foods, Inc. | (15) | (1,020) | ||||||
|
| |||||||
| (10,099) | ||||||||
|
| |||||||
FOREST PRODUCTS & PAPER (-0.02%) | ||||||||
Wausau Paper Corp. | (50) | (494) | ||||||
|
| |||||||
HAND & MACHINE TOOLS (-0.01%) | ||||||||
Kennametal, Inc. | (8) | (309) | ||||||
|
| |||||||
HEALTHCARE - PRODUCTS (-0.10%) | ||||||||
Insulet Corp. | (17) | (734) | ||||||
ResMed, Inc. | (30) | (1,567) | ||||||
Sirona Dental Systems, Inc. | (11) | (864) | ||||||
|
| |||||||
| (3,165) | ||||||||
|
| |||||||
HEALTHCARE - SERVICES (-0.03%) | ||||||||
Health Net, Inc. | (22) | (1,045) | ||||||
|
| |||||||
HOUSEWARES (-0.13%) | ||||||||
The Clorox Co. | (16) | (1,592) | ||||||
The Scotts Miracle-Gro Co., Class A | (22) | (1,304) | ||||||
Tumi Holdings, Inc. | (51) | (1,059) | ||||||
|
| |||||||
| (3,955) | ||||||||
|
| |||||||
INTERNET (-0.15%) | ||||||||
Cogent Communications Holdings, Inc. | (27) | (916) | ||||||
Equinix, Inc. | (7) | (1,462) | ||||||
Internap Network Services Corp. | (82) | (657) | ||||||
Netflix, Inc. | (2) | (786) | ||||||
Shutterstock, Inc. | (4) | (311) | ||||||
Twitter, Inc. | (12) | (498) | ||||||
|
| |||||||
| (4,630) | ||||||||
|
| |||||||
METAL FABRICATE & HARDWARE (-0.02%) | ||||||||
Sun Hydraulics Corp. | (17) | (677) | ||||||
|
| |||||||
See Notes to Financial Statements.
18 |
www.redmontfunds.com |
Table of Contents
| Redmont Resolute Fund I | Schedule of Investments | |
October 31, 2014 (Unaudited) |
| Value | ||||||||
| Shares | (Note 2) | |||||||
| ||||||||
MINING (-0.02%) | ||||||||
Teck Resources, Ltd., Class B | (40) | $ | (631) | |||||
|
| |||||||
MISCELLANEOUS MANUFACTURING (-0.12%) | ||||||||
Polypore International, Inc. | (19) | (834) | ||||||
Proto Labs, Inc. | (26) | (1,700) | ||||||
Raven Industries, Inc. | (20) | (507) | ||||||
Trinity Industries, Inc. | (17) | (607) | ||||||
|
| |||||||
| (3,648) | ||||||||
|
| |||||||
OIL & GAS (-0.40%) | ||||||||
Atwood Oceanics, Inc. | (30) | (1,219) | ||||||
Cabot Oil & Gas Corp. | (25) | (778) | ||||||
Carrizo Oil & Gas, Inc. | (16) | (831) | ||||||
Concho Resources, Inc. | (7) | (763) | ||||||
ConocoPhillips | (24) | (1,732) | ||||||
Continental Resources, Inc. | (29) | (1,635) | ||||||
Denbury Resources, Inc. | (91) | (1,128) | ||||||
Goodrich Petroleum Corp. | (37) | (305) | ||||||
Helmerich & Payne, Inc. | (10) | (868) | ||||||
HollyFrontier Corp. | (27) | (1,225) | ||||||
Matador Resources Co. | (59) | (1,432) | ||||||
Oasis Petroleum, Inc. | (8) | (240) | ||||||
Rex Energy Corp. | (44) | (345) | ||||||
|
| |||||||
| (12,501) | ||||||||
|
| |||||||
OIL & GAS SERVICES (-0.11%) | ||||||||
National Oilwell Varco, Inc. | (19) | (1,380) | ||||||
NOW, Inc. | (46) | (1,383) | ||||||
Weatherford International PLC | (36) | (591) | ||||||
|
| |||||||
| (3,354) | ||||||||
|
| |||||||
PACKAGING & CONTAINERS (-0.02%) | ||||||||
Bemis Co., Inc. | (20) | (769) | ||||||
|
| |||||||
PHARMACEUTICALS (-0.05%) | ||||||||
GW Pharmaceuticals PLC, ADR | (9) | (664) | ||||||
Pharmacyclics, Inc. | (6) | (784) | ||||||
|
| |||||||
| (1,448) | ||||||||
|
| |||||||
REAL ESTATE INVESTMENT TRUSTS (-0.36%) | ||||||||
HCP, Inc. | (51) | (2,242) | ||||||
Health Care REIT, Inc. | (33) | (2,347) | ||||||
Iron Mountain, Inc. | (10) | (361) | ||||||
Omega Healthcare Investors, Inc. | (55) | (2,099) | ||||||
Plum Creek Timber Co., Inc. | (21) | (861) | ||||||
Realty Income Corp. | (45) | (2,071) | ||||||
Rouse Properties, Inc. | (75) | (1,366) | ||||||
|
| |||||||
| (11,347) | ||||||||
|
| |||||||
RETAIL (-0.40%) | ||||||||
AutoNation, Inc. | (18) | (1,031) | ||||||
Bob Evans Farms, Inc. | (31) | (1,514) | ||||||
Cabela’s, Inc. | (16) | (768) | ||||||
CarMax, Inc. | (27) | (1,510) | ||||||
The Cheesecake Factory, Inc. | (32) | (1,470) | ||||||
Krispy Kreme Doughnuts, Inc. | (79) | (1,495) | ||||||
L Brands, Inc. | (17) | (1,226) | ||||||
See Notes to Financial Statements.
| Semi-Annual Report | October 31, 2014 | 19 |
Table of Contents
| Redmont Resolute Fund I | Schedule of Investments | |
October 31, 2014 (Unaudited) |
| Value | ||||||||
| Shares | (Note 2) | |||||||
| ||||||||
RETAIL (-0.40%) (continued) | ||||||||
Texas Roadhouse, Inc. | (41) | $ | (1,184) | |||||
Vitamin Shoppe, Inc. | (25) | (1,173) | ||||||
The Wendy’s Co. | (147) | (1,179) | ||||||
|
| |||||||
| (12,550) | ||||||||
|
| |||||||
SAVINGS & LOANS (-0.07%) | ||||||||
Astoria Financial Corp. | (73) | (960) | ||||||
New York Community Bancorp, Inc. | (69) | (1,100) | ||||||
|
| |||||||
| (2,060) | ||||||||
|
| |||||||
SEMICONDUCTORS (-0.08%) | ||||||||
Cirrus Logic, Inc. | (22) | (424) | ||||||
International Rectifier Corp. | (53) | (2,108) | ||||||
|
| |||||||
| (2,532) | ||||||||
|
| |||||||
SOFTWARE (-0.49%) | ||||||||
Acxiom Corp. | (46) | (867) | ||||||
Aspen Technology, Inc. | (19) | (702) | ||||||
athenahealth, Inc. | (7) | (857) | ||||||
Blackbaud, Inc. | (57) | (2,537) | ||||||
NetSuite, Inc. | (14) | (1,521) | ||||||
Rackspace Hosting, Inc. | (31) | (1,189) | ||||||
Red Hat, Inc. | (22) | (1,296) | ||||||
salesforce.com, Inc. | (32) | (2,048) | ||||||
Synchronoss Technologies, Inc. | (27) | (1,395) | ||||||
Tyler Technologies, Inc. | (12) | (1,343) | ||||||
The Ultimate Software Group, Inc. | (8) | (1,204) | ||||||
VMware, Inc., Class A | (3) | (251) | ||||||
|
| |||||||
| (15,210) | ||||||||
|
| |||||||
STORAGE & WAREHOUSING (-0.03%) | ||||||||
Mobile Mini, Inc. | (20) | (877) | ||||||
|
| |||||||
TELECOMMUNICATIONS (-0.22%) | ||||||||
America Movil SAB de CV, Sponsored ADR, Class L | (33) | (806) | ||||||
Arista Networks, Inc. | (7) | (569) | ||||||
CenturyLink, Inc. | (12) | (498) | ||||||
Finisar Corp. | (42) | (702) | ||||||
Frontier Communications Corp. | (134) | (876) | ||||||
Level 3 Communications, Inc. | (19) | (891) | ||||||
Sprint Corp. | (137) | (812) | ||||||
Telefonica SA, Sponsored ADR | (66) | (989) | ||||||
ViaSat, Inc. | (14) | (877) | ||||||
|
| |||||||
| (7,020) | ||||||||
|
| |||||||
TOYS, GAMES & HOBBIES (-0.04%) | ||||||||
Mattel, Inc. | (36) | (1,118) | ||||||
|
| |||||||
TRANSPORTATION (-0.12%) | ||||||||
Heartland Express, Inc. | (34) | (855) | ||||||
JB Hunt Transport Services, Inc. | (13) | (1,037) | ||||||
Kansas City Southern | (7) | (859) | ||||||
See Notes to Financial Statements.
20 |
www.redmontfunds.com |
Table of Contents
| Redmont Resolute Fund I | Schedule of Investments | |
October 31, 2014 (Unaudited) |
| Value | ||||||||
| Shares | (Note 2) | |||||||
| ||||||||
TRANSPORTATION (-0.12%) (continued) | ||||||||
Ryder System, Inc. | (10) | $ | (885) | |||||
|
| |||||||
| (3,636) | ||||||||
|
| |||||||
TOTAL COMMON STOCKS (Proceeds $149,901) | (159,185) | |||||||
| ||||||||
EXCHANGE TRADED FUNDS (-0.06%) | ||||||||
United States Oil Fund LP | (63) | (1,930) | ||||||
|
| |||||||
TOTAL EXCHANGE TRADED FUNDS (-0.06%) (Proceeds $2,207) | (1,930) | |||||||
| ||||||||
LIMITED PARTNERSHIPS (-0.04%) | ||||||||
OIL & GAS (0.00%)(a) | ||||||||
Seadrill Partners LLC | (1) | (25) | ||||||
|
| |||||||
PIPELINES (-0.04%) | ||||||||
EQT Midstream Partners LP | (15) | (1,329) | ||||||
|
| |||||||
TOTAL LIMITED PARTNERSHIPS (Proceeds $1,387) | (1,354) | |||||||
| ||||||||
TOTAL SECURITIES SOLD SHORT (Proceeds $153,495) | $ | (162,469) | ||||||
| ||||||||
| (a) | Non-income producing security. |
| (b) | Security position either entirely or partially held in a segregated account as collateral for securities sold short. Aggregate total market value of $152,534. |
| (c) | Rate shown represents the bond equivalent yield to maturity at date of purchase. |
| (d) | Less than 0.0005%. |
| (e) | Includes cash which is being held as collateral for securities sold short and total return swap contracts. |
| (f) | Less than (0.005)%. |
FUTURES CONTRACTS
At October 31, 2014, the Fund had outstanding futures contracts:
| Description | Position | Contracts | Expiration Date | Underlying Face Amount at Value | Unrealized Appreciation | |||||||||||||||
| ||||||||||||||||||||
Domestic Currency Contracts | ||||||||||||||||||||
U.S. Dollar Index Future | Long | 1 | 12/16/2014 | $ | 87,016 | $ | 1,333 | |||||||||||||
|
| |||||||||||||||||||
| $ | 87,016 | $ | 1,333 | |||||||||||||||||
|
| |||||||||||||||||||
See Notes to Financial Statements.
| Semi-Annual Report | October 31, 2014 | 21 |
Table of Contents
| Redmont Resolute Fund I | Schedule of Investments | |
October 31, 2014 (Unaudited) |
TOTAL RETURN SWAP CONTRACTS*
| Termination | ||||||||||
| Counterparty | Reference Obligation | Notional Amount | Rate Paid by the Fund | Date | Unrealized Appreciation | |||||
| ||||||||||
Morgan Stanley | Loeb King Multi Segregated Portfolio | $ 441,637 | 1-Month LIBOR BBA | 09/02/2015 | $ 1,678 | |||||
Morgan Stanley | Melchior Segregated Portfolio | 293,513 | 1-Month LIBOR BBA | 03/20/2019 | 1,860 | |||||
Morgan Stanley | Trilogy Segregated Portfolio | 450,077 | 1-Month LIBOR BBA | 09/02/2015 | 4,334 | |||||
|
| |||||||||
| $ 1,185,227 | $ 7,872 | |||||||||
|
| |||||||||
| * | The Fund receives payments based on any positive return of the Reference Obligation less the rate paid by the Fund. The Fund makes payments on any negative return of such Reference Obligation plus the rate paid by the Fund. |
Common Abbreviations:
ADR - American Depositary Receipt.
AG - Aktiengesellschaft is a German term that refers to a corporation that is limited by shares, i.e., owned by shareholders.
AQR - AQR Capital Management LLC.
BBA - British Bankers Association.
DB - Deutsche Bank AG.
ETF - Exchange Traded Fund.
ETN - Exchange Traded Note.
FPA - First Pacific Advisors LLC.
LIBOR - London Interbank Offered Rate.
LLC - Limited Liability Company.
LP - Limited Partnership.
Ltd. - Limited.
MSCI - Morgan Stanley Capital International.
NV - Naamloze Vennootschap is the Dutch term for a public limited liability corporation.
PIMCO - Pacific Investment Management Company.
PLC - Public Limited Company.
REIT - Real Estate Investment Trust.
S&P - Standard & Poor’s.
SA - Generally designates corporations in various countries, mostly those employing the civil law.
SAB de CV - A variable capital company.
SPDR - Standard & Poor’s Depositary Receipt.
See Notes to Financial Statements.
22 |
www.redmontfunds.com |
Table of Contents
| Redmont Resolute Fund II | Schedule of Investments | |
October 31, 2014 (Unaudited) |
| Description | Shares | Value (Note 2) | ||||||
| ||||||||
COMMON STOCKS (13.99%) | ||||||||
ADVERTISING (0.08%) | ||||||||
Alliance Data Systems Corp.(a) | 574 | $ | 162,643 | |||||
Omnicom Group, Inc.(b) | 4,919 | 353,479 | ||||||
The Interpublic Group of Companies, Inc. | 296 | 5,740 | ||||||
|
| |||||||
| 521,862 | ||||||||
|
| |||||||
AEROSPACE & DEFENSE (0.43%) | ||||||||
Airbus Group NV | 533 | 31,793 | ||||||
BAE Systems PLC | 18,729 | 137,429 | ||||||
Cubic Corp. | 3,953 | 190,693 | ||||||
General Dynamics Corp. | 1,976 | 276,166 | ||||||
Lockheed Martin Corp.(b) | 3,265 | 622,211 | ||||||
Northrop Grumman Corp.(b) | 2,636 | 363,663 | ||||||
Raytheon Co.(b) | 2,957 | 307,173 | ||||||
Safran SA | 2,251 | 142,452 | ||||||
The Boeing Co.(b) | 2,346 | 293,039 | ||||||
Triumph Group, Inc.(b) | 3,828 | 266,544 | ||||||
United Technologies Corp.(b) | 1,972 | 211,004 | ||||||
|
| |||||||
| 2,842,167 | ||||||||
|
| |||||||
AGRICULTURE (0.14%) | ||||||||
Altria Group, Inc. | 3,963 | 191,571 | ||||||
Archer-Daniels-Midland Co. | 1,359 | 63,873 | ||||||
British American Tobacco PLC | 465 | 26,385 | ||||||
Bunge, Ltd. | 2,312 | 204,959 | ||||||
Japan Tobacco, Inc. | 1,100 | 36,880 | ||||||
Lorillard, Inc.(b) | 5,991 | 368,447 | ||||||
Reynolds American, Inc. | 299 | 18,810 | ||||||
|
| |||||||
| 910,925 | ||||||||
|
| |||||||
AIRLINES (0.04%) | ||||||||
All Nippon Airways | 47,000 | 107,704 | ||||||
Delta Air Lines, Inc. | 3,228 | 129,862 | ||||||
easyJet PLC | 961 | 23,060 | ||||||
Japan Airlines Co., Ltd. | 300 | 7,980 | ||||||
|
| |||||||
| 268,606 | ||||||||
|
| |||||||
APPAREL (0.02%) | ||||||||
Burberry Group PLC | 5,538 | 135,633 | ||||||
Michael Kors Holdings, Ltd.(a) | 206 | 16,189 | ||||||
|
| |||||||
| 151,822 | ||||||||
|
| |||||||
AUTO MANUFACTURERS (0.24%) | ||||||||
Bayerische Motoren Werke AG | 1,536 | 164,227 | ||||||
Daihatsu Motors Co. | 7,000 | 97,592 | ||||||
Daimler AG | 2,152 | 167,281 | ||||||
Fiat Chrysler Auto NV | 3,856 | 43,030 | ||||||
Fuji Heavy Industries, Ltd. | 5,100 | 163,409 | ||||||
Hino Motors, Ltd. | 7,900 | 111,546 | ||||||
Honda Motor Co., Ltd. | 3,100 | 96,015 | ||||||
Isuzu Motors, Ltd. | 8,000 | 101,990 | ||||||
Suzuki Motor Corp. | 4,500 | 146,367 | ||||||
See Notes to Financial Statements.
| Semi-Annual Report | October 31, 2014 | 23 |
Table of Contents
| Redmont Resolute Fund II | Schedule of Investments | |
October 31, 2014 (Unaudited) |
| Description | Shares | Value (Note 2) | ||||||
| ||||||||
AUTO MANUFACTURERS (0.24%) (continued) | ||||||||
Toyota Motor Corp. | 8,300 | $ | 480,155 | |||||
|
| |||||||
| 1,571,612 | ||||||||
|
| |||||||
AUTO PARTS & EQUIPMENT (0.18%) | ||||||||
Aisin Seiki Co., Ltd. | 3,100 | 100,735 | ||||||
Bridgestone Corp. | 5,300 | 172,294 | ||||||
Continental AG | 495 | 97,171 | ||||||
Delphi Automotive PLC | 1,132 | 78,085 | ||||||
GKN PLC | 2,594 | 13,196 | ||||||
Lear Corp.(b) | 3,958 | 366,115 | ||||||
Tenneco, Inc.(a) | 6,263 | 327,931 | ||||||
|
| |||||||
| 1,155,527 | ||||||||
|
| |||||||
BANKS (1.35%) | ||||||||
Banco de Sabadell SA | 15,768 | 45,447 | ||||||
Banco Santander SA | 29,039 | 255,750 | ||||||
Bank of America Corp.(b) | 39,860 | 683,998 | ||||||
BB&T Corp.(b) | 10,410 | 394,331 | ||||||
BNP Paribas SA | 3,236 | 203,327 | ||||||
Capital One Financial Corp.(b) | 7,324 | 606,207 | ||||||
Citigroup, Inc.(b) | 10,724 | 574,056 | ||||||
Comerica, Inc. | 2,065 | 98,583 | ||||||
Credit Agricole SA | 6,734 | 99,534 | ||||||
Danske Bank A/S | 5,237 | 143,633 | ||||||
Fifth Third Bancorp(b) | 30,706 | 613,813 | ||||||
Hokuhoku Financial | 45,000 | 88,938 | ||||||
HSBC Holdings PLC | 14,926 | 152,694 | ||||||
Huntington Bancshares, Inc.(b) | 30,578 | 303,028 | ||||||
Intesa Sanpaolo SpA | 46,137 | 117,599 | ||||||
JPMorgan Chase & Co.(b) | 9,198 | 556,295 | ||||||
KBC Groep NV | 2,494 | 133,609 | ||||||
KeyCorp | 4,355 | 57,486 | ||||||
Mitsubishi UFJ Financial Group, Inc. | 28,900 | 162,658 | ||||||
Mizuho Financial Group, Inc. | 29,900 | 53,238 | ||||||
Morgan Stanley | 3,483 | 121,731 | ||||||
Natixis SA | 18,359 | 126,329 | ||||||
Regions Financial Corp.(b) | 45,808 | 454,873 | ||||||
State Street Corp.(b) | 5,318 | 401,296 | ||||||
Sumitomo Mitsui Financial Group, Inc. | 3,100 | 121,420 | ||||||
Sumitomo Mitsui Trust Holdings, Inc. | 36,000 | 142,301 | ||||||
SunTrust Banks, Inc.(b) | 7,762 | 303,805 | ||||||
Swedbank AB, Class A | 5,733 | 151,629 | ||||||
The Bank of Yokohama, Ltd. | 22,000 | 124,822 | ||||||
The Goldman Sachs Group, Inc.(b) | 2,031 | 385,870 | ||||||
The Hachijuni Bank, Ltd. | 18,000 | 108,008 | ||||||
The PNC Financial Services Group, Inc.(b) | 3,799 | 328,196 | ||||||
U.S. Bancorp | 854 | 36,380 | ||||||
Wells Fargo & Co.(b) | 13,941 | 740,128 | ||||||
|
| |||||||
| 8,891,012 | ||||||||
|
| |||||||
BEVERAGES (0.13%) | ||||||||
Carlsberg A/S, Class B | 1,424 | 125,390 | ||||||
See Notes to Financial Statements.
24 |
www.redmontfunds.com |
Table of Contents
| Redmont Resolute Fund II | Schedule of Investments | |
October 31, 2014 (Unaudited) |
| Description | Shares | Value (Note 2) | ||||||
| ||||||||
BEVERAGES (0.13%) (continued) | ||||||||
Constellation Brands, Inc., Class A(a)(b) | 1,731 | $ | 158,456 | |||||
Dr Pepper Snapple Group, Inc. | 233 | 16,135 | ||||||
Heineken Holding NV | 1,903 | 123,267 | ||||||
Heineken NV | 1,895 | 141,510 | ||||||
Kirin Holdings Co., Ltd. | 10,400 | 132,216 | ||||||
PepsiCo, Inc. | 1,578 | 151,756 | ||||||
|
| |||||||
| 848,730 | ||||||||
|
| |||||||
BIOTECHNOLOGY (0.15%) | ||||||||
Alexion Pharmaceuticals, Inc.(a) | 336 | 64,297 | ||||||
Amgen, Inc. | 3,688 | 598,120 | ||||||
Biogen Idec, Inc.(a) | 158 | 50,731 | ||||||
Celgene Corp.(a) | 949 | 101,628 | ||||||
Gilead Sciences, Inc.(a) | 1,155 | 129,360 | ||||||
Vertex Pharmaceuticals, Inc.(a) | 315 | 35,482 | ||||||
|
| |||||||
| 979,618 | ||||||||
|
| |||||||
BUILDING MATERIALS (0.07%) | ||||||||
Daikin Industries, Ltd. | 2,400 | 145,592 | ||||||
Geberit AG | 134 | 45,653 | ||||||
Masco Corp. | 11,544 | 254,776 | ||||||
Taiheiyo Cement Corp. | 11,000 | 39,564 | ||||||
|
| |||||||
| 485,585 | ||||||||
|
| |||||||
CHEMICALS (0.22%) | ||||||||
Akzo Nobel NV | 2,059 | 136,778 | ||||||
Arkema SA | 1,325 | 81,726 | ||||||
Asahi Kasei Corp. | 17,000 | 136,499 | ||||||
BASF SE | 813 | 71,561 | ||||||
Daicel Corp. | 1,000 | 11,360 | ||||||
EI du Pont de Nemours & Co. | 48 | 3,319 | ||||||
Huntsman Corp.(b) | 14,964 | 365,122 | ||||||
Kuraray Co., Ltd. | 3,300 | 37,546 | ||||||
Lonza Group AG | 1,032 | 113,588 | ||||||
LyondellBasell Industries NV, Class A | 1,604 | 146,975 | ||||||
Mitsubishi Chemical Holdings Corp. | 9,600 | 46,613 | ||||||
Nitto Denko Corp. | 2,000 | 105,996 | ||||||
PPG Industries, Inc. | 571 | 116,307 | ||||||
The Dow Chemical Co. | 814 | 40,212 | ||||||
|
| |||||||
| 1,413,602 | ||||||||
|
| |||||||
COAL (0.03%) | ||||||||
Cloud Peak Energy, Inc.(a) | 14,332 | 171,554 | ||||||
|
| |||||||
COMMERCIAL SERVICES (0.53%) | ||||||||
Adecco SA | 1,960 | 132,514 | ||||||
Apollo Education Group, Inc.(a) | 5,868 | 168,177 | ||||||
Babcock International Group PLC | 5,261 | 92,155 | ||||||
Benesse Holdings | 2,200 | 68,453 | ||||||
Dai Nippon Printing | 11,000 | 105,960 | ||||||
Equifax, Inc.(b) | 4,124 | 312,352 | ||||||
See Notes to Financial Statements.
| Semi-Annual Report | October 31, 2014 | 25 |
Table of Contents
| Redmont Resolute Fund II | Schedule of Investments | |
October 31, 2014 (Unaudited) |
| Description | Shares | Value (Note 2) | ||||||
| ||||||||
COMMERCIAL SERVICES (0.53%) (continued) | ||||||||
EVERTEC, Inc. | 11,114 | $ | 252,288 | |||||
FTI Consulting, Inc.(a)(b) | 3,097 | 125,057 | ||||||
Global Payments, Inc. | 2,959 | 238,199 | ||||||
H&R Block, Inc. | 9,762 | 315,410 | ||||||
Manpowergroup, Inc.(b) | 4,263 | 284,555 | ||||||
MasterCard, Inc., Class A | 1,624 | 136,010 | ||||||
McGraw Hill Financial, Inc. | 165 | 14,929 | ||||||
Moody’s Corp.(b) | 2,964 | 294,118 | ||||||
Robert Half International, Inc.(b) | 5,927 | 324,681 | ||||||
The ADT Corp. | 384 | 13,763 | ||||||
Total System Services, Inc. | 7,871 | 265,961 | ||||||
Towers Watson & Co., Class A | 3,183 | 351,053 | ||||||
|
| |||||||
| 3,495,635 | ||||||||
|
| |||||||
COMPUTERS (0.64%) | ||||||||
Accenture PLC, Class A | 201 | 16,305 | ||||||
Amdocs, Ltd.(b) | 5,803 | 275,875 | ||||||
Apple, Inc. | 10,400 | 1,123,200 | ||||||
AtoS | 299 | 20,642 | ||||||
Brocade Communications Systems, Inc.(b) | 47,967 | 514,686 | ||||||
Cognizant Technology Solutions Corp., Class A(a) | 1,218 | 59,499 | ||||||
Computer Sciences Corp. | 630 | 38,052 | ||||||
EMC Corp.(b) | 17,044 | 489,674 | ||||||
Fujitsu, Ltd. | 22,000 | 130,129 | ||||||
Hewlett-Packard Co. | 3,937 | 141,260 | ||||||
International Business Machines Corp. | 17 | 2,795 | ||||||
Itochu Techno-Solutions Corp. | 1,000 | 39,350 | ||||||
NetApp, Inc.(b) | 10,028 | 429,198 | ||||||
Seagate Technology PLC | 6,623 | 416,123 | ||||||
Western Digital Corp.(b) | 5,297 | 521,066 | ||||||
|
| |||||||
| 4,217,854 | ||||||||
|
| |||||||
CONSUMER DISCRETIONARY (0.01%) | ||||||||
Publicis Groupe SA | 704 | 48,760 | ||||||
|
| |||||||
COSMETICS & PERSONAL CARE (0.04%) | ||||||||
Avon Products, Inc. | 1,116 | 11,606 | ||||||
Kao Corp. | 4,300 | 164,784 | ||||||
The Procter & Gamble Co. | 922 | 80,463 | ||||||
|
| |||||||
| 256,853 | ||||||||
|
| |||||||
DISTRIBUTION & WHOLESALE (0.12%) | ||||||||
Arrow Electronics, Inc.(a)(b) | 7,161 | 407,175 | ||||||
Genuine Parts Co. | 763 | 74,072 | ||||||
ITOCHU Corp. | 13,600 | 161,820 | ||||||
Marubeni Corp. | 3,600 | 22,691 | ||||||
Mitsubishi Corp. | 300 | 5,778 | ||||||
Sumitomo Corp. | 7,100 | 74,334 | ||||||
WESCO International, Inc.(a) | 157 | 12,939 | ||||||
|
| |||||||
| 758,809 | ||||||||
|
| |||||||
See Notes to Financial Statements.
26 |
www.redmontfunds.com |
Table of Contents
| Redmont Resolute Fund II | Schedule of Investments | |
October 31, 2014 (Unaudited) |
| Description | Shares | Value (Note 2) | ||||||
| ||||||||
DIVERSIFIED FINANCIAL SERVICES (0.40%) | ||||||||
Aberdeen Asset Management PLC | 18,445 | $ | 128,058 | |||||
Affiliated Managers Group, Inc.(a) | 347 | 69,327 | ||||||
Ameriprise Financial, Inc. | 747 | 94,249 | ||||||
BlackRock, Inc. | 140 | 47,755 | ||||||
CME Group, Inc. | 1,078 | 90,347 | ||||||
Daiwa Securities Group, Inc. | 18,000 | 137,975 | ||||||
Discover Financial Services(b) | 7,437 | 474,332 | ||||||
Franklin Resources, Inc. | 715 | 39,761 | ||||||
Japan Exchange Group, Inc. | 1,000 | 23,913 | ||||||
Legg Mason, Inc. | 439 | 22,828 | ||||||
Mitsubishi UFJ Lease | 800 | 4,088 | ||||||
Navient Corp. | 9,795 | 193,745 | ||||||
ORIX Corp. | 12,000 | 161,157 | ||||||
Outerwall, Inc.(a) | 2,493 | 157,732 | ||||||
Partners Group Holding AG | 467 | 124,134 | ||||||
Raymond James Financial, Inc.(b) | 3,453 | 193,817 | ||||||
SLM Corp. | 11,292 | 107,839 | ||||||
TD Ameritrade Holding Corp.(b) | 6,546 | 220,862 | ||||||
The Charles Schwab Corp.(b) | 7,300 | 209,291 | ||||||
Visa, Inc., Class A | 617 | 148,962 | ||||||
|
| |||||||
| 2,650,172 | ||||||||
|
| |||||||
ELECTRIC (0.13%) | ||||||||
AES Corp. | 2,686 | 37,792 | ||||||
Ameren Corp. | 2,712 | 114,826 | ||||||
Chubu Electric Power(a) | 10,900 | 128,238 | ||||||
Chugoku Electric | 7,900 | 102,262 | ||||||
Duke Energy Corp. | 650 | 53,398 | ||||||
E.ON SE | 9,229 | 158,792 | ||||||
Enel SpA | 3,882 | 19,800 | ||||||
Entergy Corp. | 236 | 19,829 | ||||||
Exelon Corp. | 1,002 | 36,663 | ||||||
Hokuriku Electric | 300 | 3,974 | ||||||
Iberdrola SA | 23,914 | 169,048 | ||||||
Wisconsin Energy Corp. | 502 | 24,929 | ||||||
|
| |||||||
| 869,551 | ||||||||
|
| |||||||
ELECTRICAL COMPONENTS & EQUIPMENT (0.04%) | ||||||||
Emerson Electric Co. | 3,130 | 200,508 | ||||||
Hitachi, Ltd. | 5,000 | 38,242 | ||||||
|
| |||||||
| 238,750 | ||||||||
|
| |||||||
ELECTRONICS (0.36%) | ||||||||
Agilent Technologies, Inc. | 917 | 50,692 | ||||||
Avnet, Inc.(b) | 8,095 | 350,109 | ||||||
Flextronics International, Ltd.(a)(b) | 46,067 | 493,838 | ||||||
Hirose Elect Co., Ltd. | 900 | 108,248 | ||||||
Honeywell International, Inc.(b) | 3,511 | 337,477 | ||||||
Jabil Circuit, Inc.(b) | 18,922 | 396,416 | ||||||
Kyocera Corp. | 3,300 | �� | 148,217 | |||||
Murata Manufacturing Co., Ltd. | 1,700 | 184,719 | ||||||
See Notes to Financial Statements.
| Semi-Annual Report | October 31, 2014 | 27 |
Table of Contents
| Redmont Resolute Fund II | Schedule of Investments | |
October 31, 2014 (Unaudited) |
| Description | Shares | Value (Note 2) | ||||||
| ||||||||
ELECTRONICS (0.36%) (continued) | ||||||||
TE Connectivity, Ltd. | 5,265 | $ | 321,850 | |||||
|
| |||||||
| 2,391,566 | ||||||||
|
| |||||||
ENGINEERING & CONSTRUCTION (0.11%) | ||||||||
ACS Actividades de Construccion y Servicios SA | 2,501 | 92,613 | ||||||
Aeroports de Paris | 913 | 107,960 | ||||||
Bouygues SA | 775 | 26,756 | ||||||
Fluor Corp. | 5,664 | 375,750 | ||||||
Kajima Corp. | 20,000 | 87,603 | ||||||
Vinci SA | 135 | 7,693 | ||||||
|
| |||||||
| 698,375 | ||||||||
|
| |||||||
ENTERTAINMENT (0.04%) | ||||||||
Oriental Land Co., Ltd. | 400 | 84,505 | ||||||
Six Flags Entertainment Corp. | 4,848 | 195,374 | ||||||
|
| |||||||
| 279,879 | ||||||||
|
| |||||||
FOOD (0.26%) | ||||||||
Associated British Foods PLC | 3,175 | 139,876 | ||||||
CALBEE, Inc. | 3,200 | 111,106 | ||||||
Carrefour SA | 4,746 | 138,992 | ||||||
Casino Guichard Perrachon SA | 1,008 | 103,302 | ||||||
General Mills, Inc. | 1,703 | 88,488 | ||||||
Kellogg Co. | 551 | 35,242 | ||||||
Koninklijke Ahold NV | 7,144 | 119,426 | ||||||
Kraft Foods Group, Inc. | 2,525 | 142,284 | ||||||
Nestle SA | 2,870 | 209,997 | ||||||
Orkla ASA | 14,905 | 113,915 | ||||||
Seven & I Holdings Co., Ltd. | 600 | 22,868 | ||||||
Tate & Lyle PLC | 7,235 | 70,137 | ||||||
Tyson Foods, Inc., Class A(b) | 10,614 | 428,275 | ||||||
Unilever PLC | 189 | 7,601 | ||||||
|
| |||||||
| 1,731,509 | ||||||||
|
| |||||||
FOREST PRODUCTS & PAPER (0.07%) | ||||||||
International Paper Co.(b) | 6,067 | 307,111 | ||||||
Oji Holdings | 8,000 | 28,133 | ||||||
UPM-Kymmene OYJ | 8,835 | 139,723 | ||||||
|
| |||||||
| 474,967 | ||||||||
|
| |||||||
GAS (0.03%) | ||||||||
AGL Resources, Inc. | 1,829 | 98,601 | ||||||
Gas Natural SDG SA | 4,498 | 129,700 | ||||||
|
| |||||||
| 228,301 | ||||||||
|
| |||||||
HAND & MACHINE TOOLS (0.03%) | ||||||||
Fuji Electric Holdings Co., Ltd. | 15,000 | 63,966 | ||||||
Stanley Black & Decker, Inc. | 1,226 | 114,803 | ||||||
|
| |||||||
| 178,769 | ||||||||
|
| |||||||
HEALTHCARE - PRODUCTS (0.29%) | ||||||||
Baxter International, Inc. | 1,358 | 95,250 | ||||||
See Notes to Financial Statements.
28 |
www.redmontfunds.com |
Table of Contents
| Redmont Resolute Fund II | Schedule of Investments | |
October 31, 2014 (Unaudited) |
| Description | Shares | Value (Note 2) | ||||||
| ||||||||
HEALTHCARE - PRODUCTS (0.29%) (continued) | ||||||||
Becton Dickinson and Co. | 1,015 | $ | 130,630 | |||||
Boston Scientific Corp.(a) | 12,684 | 168,444 | ||||||
CareFusion Corp.(a) | 106 | 6,081 | ||||||
Covidien PLC | 1,373 | 126,920 | ||||||
CR Bard, Inc. | 1,016 | 166,594 | ||||||
Medtronic, Inc. | 10,720 | 730,675 | ||||||
Stryker Corp. | 1,097 | 96,020 | ||||||
Zimmer Holdings, Inc.(b) | 3,182 | 353,966 | ||||||
|
| |||||||
| 1,874,580 | ||||||||
|
| |||||||
HEALTHCARE - SERVICES (0.26%) | ||||||||
Aetna, Inc. | 253 | 20,875 | ||||||
Cigna Corp. | 261 | 25,988 | ||||||
DaVita HealthCare Partners, Inc.(a)(b) | 3,676 | 286,985 | ||||||
Fresenius SE & Co., KGaA | 2,788 | 143,420 | ||||||
Humana, Inc. | 90 | 12,496 | ||||||
ICON PLC(a) | 4,066 | 213,912 | ||||||
Laboratory Corp. of America Holdings(a) | 2,919 | 319,017 | ||||||
Quest Diagnostics, Inc. | 1,334 | 84,656 | ||||||
Select Medical Holdings Corp. | 12,392 | 178,693 | ||||||
UnitedHealth Group, Inc. | 429 | 40,759 | ||||||
Universal Health Services, Inc., Class B(b) | 3,243 | 336,332 | ||||||
WellPoint, Inc. | 452 | 57,264 | ||||||
|
| |||||||
| 1,720,397 | ||||||||
|
| |||||||
HOME BUILDERS (0.02%) | ||||||||
PulteGroup, Inc. | 317 | 6,083 | ||||||
Sekisui Chemical Co., Ltd. | 10,000 | 120,454 | ||||||
|
| |||||||
| 126,537 | ||||||||
|
| |||||||
HOME FURNISHINGS (0.03%) | ||||||||
Harman International Industries, Inc. | 213 | 22,863 | ||||||
Panasonic Corp. | 16,300 | 189,375 | ||||||
|
| |||||||
| 212,238 | ||||||||
|
| |||||||
HOUSEHOLD PRODUCTS & WARES (0.02%) | ||||||||
Kimberly-Clark Corp. | 1,332 | 152,208 | ||||||
|
| |||||||
HOUSEWARES (0.15%) | ||||||||
Avery Dennison Corp. | 11,570 | 542,054 | ||||||
Newell Rubbermaid, Inc.(b) | 11,057 | 368,530 | ||||||
The Clorox Co. | 816 | 81,192 | ||||||
|
| |||||||
| 991,776 | ||||||||
|
| |||||||
INSURANCE (0.83%) | ||||||||
ACE, Ltd.(b) | 4,205 | 459,607 | ||||||
Aflac, Inc. | 1,319 | 78,784 | ||||||
Alleghany Corp.(a) | 633 | 281,229 | ||||||
Aviva PLC | 18,222 | 151,869 | ||||||
AXA SA | 7,243 | 167,099 | ||||||
Baloise-Holding AG | 970 | 121,886 | ||||||
See Notes to Financial Statements.
| Semi-Annual Report | October 31, 2014 | 29 |
Table of Contents
| Redmont Resolute Fund II | Schedule of Investments | |
October 31, 2014 (Unaudited) |
| Description | Shares | Value (Note 2) | ||||||
| ||||||||
INSURANCE (0.83%) (continued) | ||||||||
Berkshire Hathaway, Inc., Class B(a)(b) | 3,050 | $ | 427,488 | |||||
Endurance Specialty Holdings, Ltd. | 4,420 | 256,139 | ||||||
ING Groep NV(a) | 3,280 | 46,899 | ||||||
Legal & General Group PLC | 39,004 | 144,131 | ||||||
MetLife, Inc.(b) | 3,945 | 213,977 | ||||||
Prudential Financial, Inc. | 3,873 | 342,915 | ||||||
Reinsurance Group of America, Inc.(b) | 2,385 | 200,936 | ||||||
Swiss Life Holding AG | 533 | 122,095 | ||||||
The Allstate Corp.(b) | 7,516 | 487,413 | ||||||
The Dai-ichi Life Insurance Co., Ltd. | 10,600 | 155,709 | ||||||
The Progressive Corp. | 2,926 | 77,276 | ||||||
The Travelers Companies, Inc.(b) | 3,720 | 374,976 | ||||||
Tokio Marine Holdings, Inc. | 5,700 | 178,269 | ||||||
Torchmark Corp.(b) | 3,982 | 210,887 | ||||||
Unum Group | 856 | 28,642 | ||||||
Validus Holdings, Ltd.(b) | 7,498 | 298,270 | ||||||
WR Berkley Corp. | 6,445 | 332,175 | ||||||
XL Group PLC | 8,487 | 287,540 | ||||||
|
| |||||||
| 5,446,211 | ||||||||
|
| |||||||
INTERNET (0.36%) | ||||||||
ASOS PLC(a) | 2,951 | 125,382 | ||||||
Baidu, Inc., Sponsored ADR(a) | 578 | 138,009 | ||||||
CDW Corp. | 8,371 | 258,162 | ||||||
Dena Co., Ltd. | 2,400 | 30,255 | ||||||
eBay, Inc.(a) | 5,320 | 279,300 | ||||||
Expedia, Inc.(b) | 3,586 | 304,702 | ||||||
F5 Networks, Inc.(a) | 120 | 14,758 | ||||||
Facebook, Inc., Class A(a) | 2,770 | 207,722 | ||||||
Google, Inc., Class A(a) | 261 | 148,214 | ||||||
Google, Inc., Class C(a) | 244 | 136,415 | ||||||
Gree, Inc. | 3,800 | 26,252 | ||||||
NetEase, Inc., ADR(b) | 2,000 | 189,440 | ||||||
Nexon Co., Ltd. | 600 | 5,155 | ||||||
Symantec Corp. | 2,067 | 51,303 | ||||||
The Priceline Group, Inc.(a) | 148 | 178,519 | ||||||
Yahoo!, Inc.(a) | 5,556 | 255,854 | ||||||
|
| |||||||
| 2,349,442 | ||||||||
|
| |||||||
INVESTMENT COMPANIES (0.04%) | ||||||||
EXOR SpA | 3,203 | 139,481 | ||||||
Pargesa Holding SA | 1,413 | 109,777 | ||||||
|
| |||||||
| 249,258 | ||||||||
|
| |||||||
IRON & STEEL (0.02%) | ||||||||
Hitachi Metals, Ltd. | 5,000 | 82,261 | ||||||
Kobe Steel, Ltd. | 22,000 | 34,276 | ||||||
|
| |||||||
| 116,537 | ||||||||
|
| |||||||
See Notes to Financial Statements.
30 |
www.redmontfunds.com |
Table of Contents
| Redmont Resolute Fund II | Schedule of Investments | |
October 31, 2014 (Unaudited) |
| Description | Shares | Value (Note 2) | ||||||
| ||||||||
LEISURE TIME (0.01%) | ||||||||
Harley-Davidson, Inc. | 541 | $ | 35,544 | |||||
|
| |||||||
LODGING (0.02%) | ||||||||
Starwood Hotels & Resorts Worldwide, Inc. | 402 | 30,817 | ||||||
Wyndham Worldwide Corp. | 1,122 | 87,146 | ||||||
|
| |||||||
| 117,963 | ||||||||
|
| |||||||
MACHINERY - CONSTRUCTION & MINING (0.06%) | ||||||||
Caterpillar, Inc. | 771 | 78,187 | ||||||
Hitachi Construction Machinery Co., Ltd. | 5,300 | 105,457 | ||||||
Joy Global, Inc. | 148 | 7,789 | ||||||
Mitsubishi Electric Corp. | 14,000 | 174,058 | ||||||
|
| |||||||
| 365,491 | ||||||||
|
| |||||||
MACHINERY - DIVERSIFIED (0.10%) | ||||||||
Alstom SA(a) | 1,672 | 58,165 | ||||||
FANUC Corp. | 800 | 136,176 | ||||||
Flowserve Corp. | 2,374 | 161,408 | ||||||
Hexagon AB, Class B | 3,644 | 122,632 | ||||||
Kawasaki Heavy Industries, Ltd. | 28,000 | 107,189 | ||||||
Nabtesco Corp. | 3,800 | 91,342 | ||||||
|
| |||||||
| 676,912 | ||||||||
|
| |||||||
MEDIA (0.57%) | ||||||||
British Sky Broadcasting Group PLC | 9,378 | 132,917 | ||||||
Cablevision Systems Corp., Class A | 652 | 12,140 | ||||||
CBS Corp., Class B(b) | 5,074 | 275,112 | ||||||
Comcast Corp., Class A(b) | 13,011 | 720,159 | ||||||
Liberty Global PLC, Class A(a) | 1,420 | 64,567 | ||||||
Liberty Global PLC, Class C(a) | 13,307 | 591,762 | ||||||
Liberty Media Corp., Class A(a)(b) | 1,680 | 80,674 | ||||||
Liberty Media Corp., Class C(a)(b) | 3,360 | 161,045 | ||||||
News Corp., Class A(a) | 18,994 | 294,027 | ||||||
Phoenix New Media, Ltd., ADR(a) | 8,853 | 90,832 | ||||||
The Walt Disney Co. | 2,165 | 197,838 | ||||||
Time Warner Cable, Inc. | 1,440 | 211,982 | ||||||
Time Warner, Inc.(b) | 4,167 | 331,152 | ||||||
Time, Inc.(b) | 418 | 9,443 | ||||||
Tribune Media Co., Class A(a) | 3,605 | 241,535 | ||||||
Viacom, Inc., Class B(b) | 4,511 | 327,859 | ||||||
|
| |||||||
| 3,743,044 | ||||||||
|
| |||||||
METAL FABRICATE & HARDWARE (0.05%) | ||||||||
Global Brass & Copper Holdings, Inc. | 12,385 | 173,390 | ||||||
The Timken Co. | 3,475 | 149,390 | ||||||
|
| |||||||
| 322,780 | ||||||||
|
| |||||||
MINING (0.06%) | ||||||||
Anglo American PLC | 6,897 | 145,250 | ||||||
Antofagasta PLC | 9,229 | 103,714 | ||||||
See Notes to Financial Statements.
| Semi-Annual Report | October 31, 2014 | 31 |
Table of Contents
| Redmont Resolute Fund II | Schedule of Investments | |
October 31, 2014 (Unaudited) |
| Description | Shares | Value (Note 2) | ||||||
| ||||||||
MINING (0.06%) (continued) | ||||||||
Barrick Gold Corp. | 15,111 | $ | 179,368 | |||||
|
| |||||||
| 428,332 | ||||||||
|
| |||||||
MISCELLANEOUS MANUFACTURING (0.35%) | ||||||||
3M Co. | 837 | 128,705 | ||||||
Carlisle Companies, Inc.(b) | 2,530 | 224,866 | ||||||
Crane Co. | 6,203 | 386,757 | ||||||
Danaher Corp.(b) | 5,807 | 466,883 | ||||||
Dover Corp. | 927 | 73,641 | ||||||
FUJIFILM Holdings Corp. | 4,800 | 157,557 | ||||||
General Electric Co. | 2,641 | 68,164 | ||||||
Illinois Tool Works, Inc. | 1,852 | 168,625 | ||||||
IMI PLC | 3,077 | 60,150 | ||||||
Nikon Corp. | 2,700 | 36,104 | ||||||
Parker-Hannifin Corp.(b) | 1,698 | 215,697 | ||||||
Pentair PLC | 70 | 4,693 | ||||||
Siemens AG | 104 | 11,718 | ||||||
Textron, Inc.(b) | 6,969 | 289,423 | ||||||
|
| |||||||
| 2,292,983 | ||||||||
|
| |||||||
OFFICE & BUSINESS EQUIPMENT (0.04%) | ||||||||
Canon, Inc. | 7,100 | 214,217 | ||||||
Ricoh Co., Ltd. | 1,700 | 17,374 | ||||||
|
| |||||||
| 231,591 | ||||||||
|
| |||||||
OIL & GAS (1.25%) | ||||||||
BP PLC | 41,801 | 300,241 | ||||||
Canadian Natural Resources, Ltd.(b) | 10,546 | 367,845 | ||||||
Chesapeake Energy Corp. | 1,530 | 33,935 | ||||||
Chevron Corp. | 433 | 51,938 | ||||||
ConocoPhillips | 2,623 | 189,249 | ||||||
Devon Energy Corp. | 480 | 28,800 | ||||||
Diamondback Energy, Inc.(a)(b) | 6,106 | 417,895 | ||||||
Energen Corp.(b) | 5,046 | 341,614 | ||||||
Eni SpA | 8,385 | 178,630 | ||||||
EOG Resources, Inc. | 5,928 | 563,456 | ||||||
EQT Corp. | 4,327 | 406,911 | ||||||
Exxon Mobil Corp. | 9,953 | 962,555 | ||||||
Helmerich & Payne, Inc. | 282 | 24,483 | ||||||
Hess Corp. | 1,323 | 112,204 | ||||||
Inpex Corp. | 10,100 | 126,154 | ||||||
JX Holdings, Inc. | 13,000 | 54,998 | ||||||
Kosmos Energy, Ltd.(a) | 15,951 | 148,823 | ||||||
Marathon Oil Corp. | 2,131 | 75,437 | ||||||
Marathon Petroleum Corp. | 4,343 | 394,779 | ||||||
Nabors Industries, Ltd. | 1,496 | 26,704 | ||||||
Neste Oil OYJ | 4,859 | 105,036 | ||||||
Occidental Petroleum Corp. | 4,570 | 406,410 | ||||||
Pacific Drilling SA(a) | 24,142 | 175,754 | ||||||
Parsley Energy, Inc., Class A(a) | 25,538 | 433,380 | ||||||
Phillips 66 | 6,504 | 510,564 | ||||||
Pioneer Natural Resources Co. | 50 | 9,453 | ||||||
See Notes to Financial Statements.
32 |
www.redmontfunds.com |
Table of Contents
| Redmont Resolute Fund II | Schedule of Investments | |
October 31, 2014 (Unaudited) |
| Description | Shares | Value (Note 2) | ||||||
| ||||||||
OIL & GAS (1.25%) (continued) | ||||||||
Precision Drilling Corp. | 24,281 | $ | 202,018 | |||||
QEP Resources, Inc. | 12,700 | 318,389 | ||||||
Rice Energy, Inc.(a)(b) | 16,553 | 437,496 | ||||||
Royal Dutch Shell PLC, Class A | 3,487 | 124,699 | ||||||
Royal Dutch Shell PLC, Class B | 6,409 | 237,088 | ||||||
Total SA | 1,066 | 63,346 | ||||||
Valero Energy Corp. | 4,703 | 235,573 | ||||||
Western Refining, Inc. | 3,270 | 149,079 | ||||||
|
| |||||||
| 8,214,936 | ||||||||
|
| |||||||
OIL & GAS SERVICES (0.11%) | ||||||||
Baker Hughes, Inc. | 1,875 | 99,300 | ||||||
FMC Technologies, Inc.(a) | 759 | 42,534 | ||||||
Halliburton Co. | 1,179 | 65,010 | ||||||
National Oilwell Varco, Inc. | 635 | 46,127 | ||||||
Schlumberger, Ltd.(b) | 4,652 | 458,966 | ||||||
|
| |||||||
| 711,937 | ||||||||
|
| |||||||
PACKAGING & CONTAINERS (0.31%) | ||||||||
Ball Corp. | 1,580 | 101,799 | ||||||
Bemis Co., Inc. | 238 | 9,156 | ||||||
Berry Plastics Group, Inc.(a) | 14,940 | 388,739 | ||||||
Crown Holdings, Inc.(a)(b) | 9,612 | 460,703 | ||||||
Graphic Packaging Holding Co.(a)(b) | 32,705 | 396,712 | ||||||
Owens-Illinois, Inc.(a) | 7,957 | 205,052 | ||||||
Packaging Corp. of America | 6,281 | 452,734 | ||||||
|
| |||||||
| 2,014,895 | ||||||||
|
| |||||||
PHARMACEUTICALS (0.98%) | ||||||||
AbbVie, Inc.(b) | 3,491 | 221,539 | ||||||
Actelion, Ltd. | 117 | 13,911 | ||||||
Alfresa Holdings | 7,500 | 93,746 | ||||||
Allergan, Inc. | 307 | 58,348 | ||||||
Astellas Pharma, Inc. | 1,500 | 22,689 | ||||||
AstraZeneca PLC | 3,406 | 247,555 | ||||||
Bayer AG | 1,979 | 281,354 | ||||||
Cardinal Health, Inc.(b) | 5,215 | 409,273 | ||||||
Dainippon Sumitomo | 8,300 | 95,174 | ||||||
Eisai Co., Ltd. | 300 | 11,487 | ||||||
Express Scripts Holding Co.(a)(b) | 6,742 | 517,920 | ||||||
GlaxoSmithKline PLC | 1,518 | 34,422 | ||||||
Hisamitsu Pharmaceutical Co., Inc. | 2,900 | 95,268 | ||||||
Johnson & Johnson(b) | 3,506 | 377,877 | ||||||
McKesson Corp. | 1,682 | 342,136 | ||||||
Merck & Co., Inc. | 1,165 | 67,500 | ||||||
Novartis AG | 1,925 | 178,665 | ||||||
Novartis AG, Sponsored ADR | 4,291 | 397,733 | ||||||
Novo Nordisk A/S, Class B | 5,162 | 233,526 | ||||||
Omnicare, Inc.(b) | 5,047 | 336,080 | ||||||
Otsuka Holdings Co. | 300 | 10,356 | ||||||
Pfizer, Inc.(b) | 29,892 | 895,265 | ||||||
Roche Holding AG | 570 | 168,070 | ||||||
See Notes to Financial Statements.
| Semi-Annual Report | October 31, 2014 | 33 |
Table of Contents
| Redmont Resolute Fund II | Schedule of Investments | |
October 31, 2014 (Unaudited) |
| Value | ||||||||
| Description | Shares | (Note 2) | ||||||
| ||||||||
PHARMACEUTICALS (0.98%) (continued) | ||||||||
Sanofi | 549 | $ | 50,677 | |||||
Sanofi, ADR(b) | 5,406 | 249,973 | ||||||
Shionogi & Co. | 5,300 | 134,570 | ||||||
Shire PLC | 1,424 | 94,832 | ||||||
Shire PLC, ADR | 518 | 103,496 | ||||||
Takeda Pharmaceutical Co., Ltd. | 900 | 38,496 | ||||||
Teva Pharmaceutical Industries, Ltd., Sponsored ADR | 11,527 | 650,930 | ||||||
|
| |||||||
| 6,432,868 | ||||||||
|
| |||||||
REAL ESTATE (0.06%) | ||||||||
Aeon Mall Co., Ltd. | 1,400 | 25,252 | ||||||
Daito Trust Construction Co., Ltd. | 1,100 | 135,388 | ||||||
Mitsubishi Estate Co., Ltd. | 9,000 | 223,989 | ||||||
Nomura Real Estate Holdings, Inc. | 1,800 | 31,120 | ||||||
|
| |||||||
| 415,749 | ||||||||
|
| |||||||
REAL ESTATE INVESTMENT TRUSTS (0.12%) | ||||||||
American Capital Agency Corp. | 5,233 | 118,999 | ||||||
American Homes 4 Rent, Class A | 6,555 | 114,909 | ||||||
American Residential Properties, Inc.(a) | 5,177 | 98,363 | ||||||
Boston Properties, Inc.(b) | 787 | 99,752 | ||||||
Equity Residential(b) | 1,402 | 97,523 | ||||||
Host Hotels & Resorts, Inc. | 6,078 | 141,678 | ||||||
Japan Real Estate Investment Corp. | 1 | 5,413 | ||||||
Simon Property Group, Inc. | 680 | 121,863 | ||||||
|
| |||||||
| 798,500 | ||||||||
|
| |||||||
RETAIL (0.52%) | ||||||||
Aeon Co., Ltd. | 11,700 | 114,005 | ||||||
AutoZone, Inc.(a) | 294 | 162,735 | ||||||
Bed Bath & Beyond, Inc.(a) | 133 | 8,956 | ||||||
Best Buy Co., Inc. | 532 | 18,162 | ||||||
Chipotle Mexican Grill, Inc.(a) | 55 | 35,090 | ||||||
CVS Health Corp.(b) | 5,629 | 483,024 | ||||||
FamilyMart Co., Ltd | 2,700 | 106,486 | ||||||
J Front Retailing Co., Ltd. | 4,000 | 51,956 | ||||||
Kohl’s Corp. | 451 | 24,453 | ||||||
Lowe’s Companies, Inc. | 1,773 | 101,416 | ||||||
Macy’s, Inc.(b) | 5,542 | 320,438 | ||||||
Next PLC | 276 | 28,456 | ||||||
O’Reilly Automotive, Inc.(a) | 627 | 110,277 | ||||||
PetSmart, Inc. | 330 | 23,876 | ||||||
Rite Aid Corp.(a) | 62,412 | 327,663 | ||||||
Sally Beauty Holdings, Inc.(a) | 7,322 | 214,608 | ||||||
Takashimaya Co., Ltd. | 4,000 | 33,296 | ||||||
The Gap, Inc. | 8,068 | 305,697 | ||||||
The Home Depot, Inc.(b) | 3,535 | 344,733 | ||||||
The Swatch Group AG | 1,406 | 118,805 | ||||||
Wal-Mart Stores, Inc. | 5,566 | 424,519 | ||||||
Yum! Brands, Inc. | 672 | 48,270 | ||||||
|
| |||||||
| 3,406,921 | ||||||||
|
| |||||||
See Notes to Financial Statements.
34 |
www.redmontfunds.com |
Table of Contents
| Redmont Resolute Fund II | Schedule of Investments | |
October 31, 2014 (Unaudited) |
| Value | ||||||||
| Description | Shares | (Note 2) | ||||||
| ||||||||
SAVINGS & LOANS (0.02%) | ||||||||
Investors Bancorp, Inc. | 15,336 | $ | 164,862 | |||||
|
| |||||||
SEMICONDUCTORS (0.37%) | ||||||||
ASML Holding NV | 411 | 40,920 | ||||||
Avago Technologies, Ltd. | 4,252 | 366,735 | ||||||
Intel Corp. | 3,301 | 112,267 | ||||||
NVIDIA Corp. | 1,747 | 34,136 | ||||||
NXP Semiconductor NV(a) | 5,453 | 374,403 | ||||||
ON Semiconductor Corp.(a)(b) | 34,406 | 285,226 | ||||||
QUALCOMM, Inc.(b) | 6,090 | 478,126 | ||||||
Texas Instruments, Inc.(b) | 10,489 | 520,884 | ||||||
TriQuint Semiconductor, Inc.(a) | 11,015 | 238,255 | ||||||
|
| |||||||
| 2,450,952 | ||||||||
|
| |||||||
SHIPBUILDING (0.05%) | ||||||||
Huntington Ingalls Industries, Inc.(b) | 2,967 | 313,968 | ||||||
|
| |||||||
SOFTWARE (0.45%) | ||||||||
Activision Blizzard, Inc.(b) | 18,861 | 376,277 | ||||||
Amadeus IT Holding SA, Class A | 3,044 | 111,767 | ||||||
CA, Inc. | 4,987 | 144,922 | ||||||
Electronic Arts, Inc.(a) | 4,997 | 204,727 | ||||||
Fidelity National Information Services, Inc. | 5,743 | 335,334 | ||||||
GungHo Online | 15,200 | 59,406 | ||||||
Intuit, Inc. | 1,563 | 137,560 | ||||||
Microsoft Corp.(b) | 15,322 | 719,368 | ||||||
Oracle Corp.(b) | 15,345 | 599,222 | ||||||
Paychex, Inc. | 336 | 15,772 | ||||||
SAP SE | 2,887 | 196,232 | ||||||
The Dun & Bradstreet Corp. | 369 | 45,317 | ||||||
|
| |||||||
| 2,945,904 | ||||||||
|
| |||||||
TELECOMMUNICATIONS (0.43%) | ||||||||
AT&T, Inc. | 5,874 | 204,650 | ||||||
BT Group PLC | 28,567 | 167,942 | ||||||
Cisco Systems, Inc.(b) | 12,890 | 315,418 | ||||||
Corning, Inc. | 144 | 2,942 | ||||||
Deutsche Telekom AG | 12,205 | 183,842 | ||||||
Eutelsat Communications SA | 3,774 | 122,302 | ||||||
Harris Corp.(b) | 3,073 | 213,881 | ||||||
Hikari Tsushin, Inc. | 400 | 26,067 | ||||||
KDDI Corp. | 2,400 | 154,373 | ||||||
Motorola Solutions, Inc. | 5,001 | 322,564 | ||||||
NTT DOCOMO, Inc. | 11,300 | 187,319 | ||||||
Orange SA | 3,857 | 61,457 | ||||||
SoftBank Corp. | 2,000 | 141,358 | ||||||
TDC A/S | 13,209 | 100,766 | ||||||
Telecom Italia SpA | 106,287 | 120,207 | ||||||
Verizon Communications, Inc. | 8,691 | 436,723 | ||||||
Vivendi SA | 1,907 | 46,540 | ||||||
See Notes to Financial Statements.
| Semi-Annual Report | October 31, 2014 | 35 |
Table of Contents
| Redmont Resolute Fund II | Schedule of Investments | |
October 31, 2014 (Unaudited) |
| Description | Shares | Value (Note 2) | ||||||
| ||||||||
TELECOMMUNICATIONS (0.43%) (continued) | ||||||||
Vodafone Group PLC | 1,375 | $ | 4,560 | |||||
|
| |||||||
| 2,812,911 | ||||||||
|
| |||||||
TOYS, GAMES & HOBBIES (0.00%)(c) | ||||||||
Mattel, Inc. | 348 | 10,812 | ||||||
|
| |||||||
TRANSPORTATION (0.15%) | ||||||||
AP Moeller-Maersk A/S, Class A | 32 | 72,679 | ||||||
AP Moeller-Maersk A/S, Class B | 55 | 128,159 | ||||||
Central Japan Railway Co. | 1,300 | 191,022 | ||||||
Deutsche Post AG | 1,569 | 49,263 | ||||||
DSV A/S | 371 | 11,093 | ||||||
East Japan Railway Co. | 1,500 | 115,446 | ||||||
FedEx Corp. | 30 | 5,022 | ||||||
Hankyu Hanshin Holdings | 20,000 | 115,914 | ||||||
Nippon Yusen Kabushiki Kaisha | 13,000 | 33,100 | ||||||
Union Pacific Corp. | 917 | 106,785 | ||||||
United Parcel Service, Inc., Class B | 1,645 | 172,577 | ||||||
|
| |||||||
| 1,001,060 | ||||||||
|
| |||||||
TOTAL COMMON STOCKS (Cost $81,964,340) | 91,882,471 | |||||||
| ||||||||
EXCHANGE TRADED FUNDS (0.85%) | ||||||||
iShares® Emerging Markets Local Currency Bond ETF | 24,784 | 1,203,263 | ||||||
iShares® Europe ETF | 12,138 | 535,164 | ||||||
iShares® MSCI Japan ETF | 35,612 | 429,481 | ||||||
Market Vectors® Emerging Markets Local Currency Bond ETF | 130,551 | 2,990,923 | ||||||
SPDR® S&P 500® ETF Trust | 1,983 | 399,892 | ||||||
|
| |||||||
| 5,558,723 | ||||||||
|
| |||||||
TOTAL EXCHANGE TRADED FUNDS (Cost $5,487,454) | 5,558,723 | |||||||
| ||||||||
LIMITED PARTNERSHIPS (0.01%) | ||||||||
CHEMICALS (0.01%) | ||||||||
CVR Partners LP | 4,593 | 55,943 | ||||||
|
| |||||||
OIL & GAS (0.00%)(c) | ||||||||
Viper Energy Partners LP(a) | 1,796 | 36,351 | ||||||
|
| |||||||
TOTAL LIMITED PARTNERSHIPS (Cost $140,796) | 92,294 | |||||||
| ||||||||
OPEN-END MUTUAL FUNDS (66.74%) | ||||||||
AQR Multi Strategy Alternative Fund, Class I | 4,022,543 | 40,024,301 | ||||||
AQR Risk Parity Fund, Class I | 3,462,037 | 40,782,795 | ||||||
Diamond Hill Long-Short Fund, Class Y | 2,705,726 | 64,152,775 | ||||||
FPA Crescent Fund | 1,911,490 | 65,411,189 | ||||||
See Notes to Financial Statements.
36 |
www.redmontfunds.com |
Table of Contents
| Redmont Resolute Fund II | Schedule of Investments | |
October 31, 2014 (Unaudited) |
| Description | Shares | Value (Note 2) | ||||||||||||
| ||||||||||||||
OPEN-END MUTUAL FUNDS (66.74%) (continued) | ||||||||||||||
MainStay Marketfield Fund, Class I | 3,354,674 | $ | 55,821,767 | |||||||||||
Morgan Stanley Institutional Fund, Inc. - Multi-Asset Portfolio, Class I | 5,505,902 | 65,355,059 | ||||||||||||
Nuveen Symphony Floating Rate Income Fund, Class I | 319,824 | 6,613,965 | ||||||||||||
PIMCO Short-Term Fund, Institutional Class | 10,098,043 | 100,071,605 | ||||||||||||
|
| |||||||||||||
| 438,233,456 | ||||||||||||||
|
| |||||||||||||
TOTAL OPEN-END MUTUAL FUNDS (Cost $413,382,773) | 438,233,456 | |||||||||||||
| ||||||||||||||
PREFERRED STOCKS (0.02%) | ||||||||||||||
AUTO MANUFACTURERS (0.02%) | ||||||||||||||
Bayerische Motoren Werke AG | 1,306 | 104,514 | ||||||||||||
|
| |||||||||||||
TOTAL PREFERRED STOCKS (Cost $103,209) | 104,514 | |||||||||||||
| ||||||||||||||
| Description | Principal Amount | Value (Note 2) | ||||||||||||
| ||||||||||||||
CORPORATE BONDS (1.23%) | ||||||||||||||
Abbey National Treasury Services PLC | ||||||||||||||
1.38%, 03/13/2017 | $ | 84,000 | 84,246 | |||||||||||
Actavis Funding SCS | ||||||||||||||
4.85%, 06/15/2044(d) | 24,000 | 22,718 | ||||||||||||
Alcoa, Inc. | ||||||||||||||
5.13%, 10/01/2024 | 61,000 | 64,495 | ||||||||||||
American Campus Communities Operating Partnership LP | ||||||||||||||
4.13%, 07/01/2024 | 40,000 | 40,607 | ||||||||||||
American Honda Finance Corp. | ||||||||||||||
1.20%, 07/14/2017 | 85,000 | 84,947 | ||||||||||||
Anadarko Finance Co., Series B | ||||||||||||||
7.50%, 05/01/2031 | 20,000 | 26,959 | ||||||||||||
Anadarko Petroleum Corp. | ||||||||||||||
6.45%, 09/15/2036 | 142,000 | 175,590 | ||||||||||||
Anheuser-Busch InBev Worldwide, Inc. | ||||||||||||||
0.80%, 07/15/2015 | 148,000 | 148,455 | ||||||||||||
Assurant, Inc. | ||||||||||||||
6.75%, 02/15/2034 | 98,000 | 117,816 | ||||||||||||
Astoria Financial Corp. | ||||||||||||||
5.00%, 06/19/2017 | 97,000 | 104,235 | ||||||||||||
BAE Systems Holdings, Inc. | ||||||||||||||
3.80%, 10/07/2024(d) | 58,000 | 58,475 | ||||||||||||
4.75%, 10/07/2044(d) | 35,000 | 35,587 | ||||||||||||
Bank of America Corp. | ||||||||||||||
7.25%, 10/15/2025 | 7,000 | 8,680 | ||||||||||||
2.60%, 01/15/2019 | 104,000 | 105,016 | ||||||||||||
CISCO Systems, Inc. | ||||||||||||||
2.13%, 03/01/2019 | 66,000 | 66,329 | ||||||||||||
Citigroup, Inc. | ||||||||||||||
5.88%, 02/22/2033 | 216,000 | 245,885 | ||||||||||||
Comerica, Inc. | ||||||||||||||
2.13%, 05/23/2019 | 40,000 | 39,874 | ||||||||||||
See Notes to Financial Statements.
| Semi-Annual Report | October 31, 2014 | 37 |
Table of Contents
| Redmont Resolute Fund II | Schedule of Investments | |
October 31, 2014 (Unaudited) |
Principal Amount | Value (Note 2) | |||||||||||||
| ||||||||||||||
CORPORATE BONDS (1.23%) (continued) | ||||||||||||||
Credit Suisse New York | ||||||||||||||
5.40%, 01/14/2020 | $ | 73,000 | $ | 81,852 | ||||||||||
CVS Pass-Through Trust | ||||||||||||||
5.93%, 01/10/2034(d) | 35,486 | 41,026 | ||||||||||||
DIRECTV Holdings LLC / DIRECTV Financing Co., Inc. | ||||||||||||||
6.35%, 03/15/2040 | 51,000 | 60,048 | ||||||||||||
Dollar General Corp. | ||||||||||||||
4.13%, 07/15/2017 | 59,000 | 61,468 | ||||||||||||
Dominion Gas Holdings LLC | ||||||||||||||
4.80%, 11/01/2043 | 34,000 | 36,948 | ||||||||||||
Dominion Resources, Inc. | ||||||||||||||
5.75%, 10/01/2054(e) | 31,000 | 32,309 | ||||||||||||
Domtar Corp. | ||||||||||||||
6.75%, 02/15/2044 | 101,000 | 110,785 | ||||||||||||
El Paso Pipeline Partners Operating Co., LLC | ||||||||||||||
6.50%, 04/01/2020 | 135,000 | 155,111 | ||||||||||||
Ensco PLC | ||||||||||||||
4.50%, 10/01/2024 | 8,000 | 8,115 | ||||||||||||
Farmers Exchange Capital III | ||||||||||||||
5.45%, 10/15/2054(d)(e) | 65,000 | 66,165 | ||||||||||||
Fifth Third Bancorp, Series J | ||||||||||||||
4.90%, Perpetual Maturity(f) | �� | 79,000 | 78,135 | |||||||||||
First Niagara Financial Group, Inc. | ||||||||||||||
6.75%, 03/19/2020 | 166,000 | 190,989 | ||||||||||||
7.25%, 12/15/2021 | 37,000 | 42,692 | ||||||||||||
FirstEnergy Corp., Series C | ||||||||||||||
7.38%, 11/15/2031 | 74,000 | 88,155 | ||||||||||||
FirstEnergy Transmission LLC | ||||||||||||||
5.45%, 07/15/2044(d) | 49,000 | 50,642 | ||||||||||||
Forest Laboratories, Inc. | ||||||||||||||
4.88%, 02/15/2021(d) | 115,000 | 122,765 | ||||||||||||
Freeport-McMoran Oil & Gas LLC / FCX Oil & Gas, Inc. | ||||||||||||||
6.63%, 05/01/2021 | 35,000 | 38,367 | ||||||||||||
6.75%, 02/01/2022 | 60,000 | 66,600 | ||||||||||||
General Electric Capital Corp. | ||||||||||||||
1.50%, 07/12/2016 | 79,000 | 80,089 | ||||||||||||
5.88%, 01/14/2038 | 150,000 | 184,563 | ||||||||||||
General Electric Co. | ||||||||||||||
2.70%, 10/09/2022 | 52,000 | 51,357 | ||||||||||||
Georgia Power Co. | ||||||||||||||
3.00%, 04/15/2016 | 22,000 | 22,727 | ||||||||||||
Georgia-Pacific LLC | ||||||||||||||
5.40%, 11/01/2020(d) | 118,000 | 134,992 | ||||||||||||
3.73%, 07/15/2023(d) | 72,000 | 74,617 | ||||||||||||
Goldcorp, Inc. | ||||||||||||||
5.45%, 06/09/2044 | 46,000 | 45,035 | ||||||||||||
Hess Corp. | ||||||||||||||
7.88%, 10/01/2029 | 32,000 | 43,380 | ||||||||||||
5.60%, 02/15/2041 | 67,000 | 76,200 | ||||||||||||
Hewlett-Packard Co. | ||||||||||||||
6.00%, 09/15/2041 | 52,000 | 58,181 | ||||||||||||
See Notes to Financial Statements.
38 |
www.redmontfunds.com |
Table of Contents
| Redmont Resolute Fund II | Schedule of Investments | |
October 31, 2014 (Unaudited) |
Principal Amount | Value (Note 2) | |||||||||||||
| ||||||||||||||
CORPORATE BONDS (1.23%) (continued) | ||||||||||||||
Hydro-Quebec | ||||||||||||||
1.38%, 06/19/2017 | $ | 95,000 | $ | 95,862 | ||||||||||
Ingersoll-Rand Global Holding Co., Ltd. | ||||||||||||||
5.75%, 06/15/2043 | 122,000 | 141,281 | ||||||||||||
Ingersoll-Rand Luxembourg Finance SA | ||||||||||||||
4.65%, 11/01/2044 | 14,000 | 13,988 | ||||||||||||
Intel Corp. | ||||||||||||||
1.35%, 12/15/2017 | 71,000 | 70,874 | ||||||||||||
John Deere Capital Corp. | ||||||||||||||
1.13%, 06/12/2017 | 116,000 | 115,782 | ||||||||||||
1.55%, 12/15/2017 | 85,000 | 85,169 | ||||||||||||
JPMorgan Chase & Co. | ||||||||||||||
2.20%, 10/22/2019 | 17,000 | 16,815 | ||||||||||||
3.25%, 09/23/2022 | 197,000 | 197,537 | ||||||||||||
JPMorgan Chase & Co., Series 1 | ||||||||||||||
7.90%, Perpetual Maturity(f) | 49,000 | 53,349 | ||||||||||||
JPMorgan Chase & Co., Series V | ||||||||||||||
5.00%, Perpetual Maturity(f) | 62,000 | 61,303 | ||||||||||||
Kinder Morgan, Inc. | ||||||||||||||
5.00%, 02/15/2021(d) | 57,000 | 60,420 | ||||||||||||
Kinross Gold Corp. | ||||||||||||||
5.95%, 03/15/2024(d) | 25,000 | 23,943 | ||||||||||||
KLA-Tencor Corp. | ||||||||||||||
5.65%, 11/01/2034 | 8,000 | 8,060 | ||||||||||||
4.65%, 11/01/2024 | 19,000 | 19,091 | ||||||||||||
Lubrizol Corp. | ||||||||||||||
6.50%, 10/01/2034 | 24,000 | 31,568 | ||||||||||||
Macquarie Bank, Ltd. | ||||||||||||||
2.60%, 06/24/2019(d) | 42,000 | 42,433 | ||||||||||||
Mondelez International, Inc. | ||||||||||||||
6.50%, 02/09/2040 | 52,000 | 66,431 | ||||||||||||
Morgan Stanley | ||||||||||||||
4.10%, 05/22/2023 | 174,000 | 175,745 | ||||||||||||
4.35%, 09/08/2026 | 29,000 | 29,104 | ||||||||||||
4.75%, 03/22/2017 | 63,000 | 67,734 | ||||||||||||
Motorola Solutions, Inc. | ||||||||||||||
5.50%, 09/01/2044 | 53,000 | 53,772 | ||||||||||||
Mylan, Inc. | ||||||||||||||
7.88%, 07/15/2020(d) | 149,000 | 160,399 | ||||||||||||
National Rural Utilities Cooperative Finance Corp. | ||||||||||||||
4.75%, 04/30/2043(e) | 64,000 | 63,540 | ||||||||||||
1.10%, 01/27/2017 | 109,000 | 109,033 | ||||||||||||
New York Life Global Funding | ||||||||||||||
1.65%, 05/15/2017(d) | 104,000 | 104,906 | ||||||||||||
Omega Healthcare Investors, Inc. | ||||||||||||||
4.95%, 04/01/2024(d) | 49,000 | 50,692 | ||||||||||||
Omnicom Group, Inc. | ||||||||||||||
3.65%, 11/01/2024 | 17,000 | 16,915 | ||||||||||||
Paccar Financial Corp. | ||||||||||||||
2.20%, 09/15/2019 | 93,000 | 93,712 | ||||||||||||
Pacific LifeCorp. | ||||||||||||||
6.00%, 02/10/2020(d) | 51,000 | 58,240 | ||||||||||||
See Notes to Financial Statements.
| Semi-Annual Report | October 31, 2014 | 39 |
Table of Contents
| Redmont Resolute Fund II | Schedule of Investments | |
October 31, 2014 (Unaudited) |
Principal Amount | Value (Note 2) | |||||||||||||
| ||||||||||||||
CORPORATE BONDS (1.23%) (continued) | ||||||||||||||
Petrobras Global Finance BV | ||||||||||||||
7.25%, 03/17/2044 | $ | 44,000 | $ | 48,442 | ||||||||||
Petroleos Mexicanos | ||||||||||||||
5.50%, 06/27/2044 | 34,000 | 35,615 | ||||||||||||
Pitney Bowes, Inc. | ||||||||||||||
4.63%, 03/15/2024 | 83,000 | 84,856 | ||||||||||||
Plains All American Pipeline LP / PAA Finance Corp. | ||||||||||||||
3.60%, 11/01/2024 | 57,000 | 56,756 | ||||||||||||
President and Fellows of Harvard College | ||||||||||||||
3.62%, 10/01/2037 | 34,000 | 33,445 | ||||||||||||
Principal Life Global Funding II | ||||||||||||||
1.00%, 12/11/2015(d) | 91,000 | 91,482 | ||||||||||||
Prudential Financial, Inc. | ||||||||||||||
5.63%, 06/15/2043(e) | 81,000 | 84,443 | ||||||||||||
Regions Financial Corp. | ||||||||||||||
7.38%, 12/10/2037 | 111,000 | 141,722 | ||||||||||||
Stanley Black & Decker, Inc. | ||||||||||||||
5.75%, 12/15/2053(e) | 83,000 | 89,848 | ||||||||||||
Synchrony Financial | ||||||||||||||
4.25%, 08/15/2024 | 54,000 | 54,930 | ||||||||||||
SYSCO Corp. | ||||||||||||||
4.35%, 10/02/2034 | 19,000 | 19,720 | ||||||||||||
4.50%, 10/02/2044 | 44,000 | 45,494 | ||||||||||||
Talisman Energy, Inc. | ||||||||||||||
5.50%, 05/15/2042 | 40,000 | 39,246 | ||||||||||||
The Boeing Co. | ||||||||||||||
2.85%, 10/30/2024 | 31,000 | 30,627 | ||||||||||||
0.95%, 05/15/2018 | 86,000 | 84,079 | ||||||||||||
The Goldman Sachs Group, Inc. | ||||||||||||||
4.80%, 07/08/2044 | 24,000 | 24,881 | ||||||||||||
6.13%, 02/15/2033 | 53,000 | 64,960 | ||||||||||||
6.75%, 10/01/2037 | 123,000 | 151,275 | ||||||||||||
2.55%, 10/23/2019 | 24,000 | 23,863 | ||||||||||||
5.25%, 07/27/2021 | 53,000 | 59,118 | ||||||||||||
The Interpublic Group of Companies, Inc. | ||||||||||||||
3.75%, 02/15/2023 | 42,000 | 41,893 | ||||||||||||
4.20%, 04/15/2024 | 36,000 | 36,674 | ||||||||||||
The Procter & Gamble Co. | ||||||||||||||
1.90%, 11/01/2019 | 24,000 | 23,905 | ||||||||||||
The Southern Co. | ||||||||||||||
1.30%, 08/15/2017 | 71,000 | 70,839 | ||||||||||||
Time Warner Cable, Inc. | ||||||||||||||
6.55%, 05/01/2037 | 20,000 | 25,248 | ||||||||||||
7.30%, 07/01/2038 | 51,000 | 69,939 | ||||||||||||
4.50%, 09/15/2042 | 45,000 | 44,817 | ||||||||||||
Time Warner Entertainment Co., LP | ||||||||||||||
8.38%, 07/15/2033 | 53,000 | 78,986 | ||||||||||||
Transocean, Inc. | ||||||||||||||
3.80%, 10/15/2022 | 43,000 | 38,769 | ||||||||||||
Trinity Industries, Inc. | ||||||||||||||
4.55%, 10/01/2024 | 27,000 | 26,387 | ||||||||||||
See Notes to Financial Statements.
40 |
www.redmontfunds.com |
Table of Contents
| Redmont Resolute Fund II | Schedule of Investments | |
October 31, 2014 (Unaudited) |
Principal Amount | Value (Note 2) | |||||||||||||||||
CORPORATE BONDS (1.23%) (continued) | ||||||||||||||||||
Tristate Generation & Transmission Association, Inc. | ||||||||||||||||||
3.70%, 11/01/2024(d) | $ | 9,000 | $ | 9,025 | ||||||||||||||
4.70%, 11/01/2044(d) | 10,000 | 10,106 | ||||||||||||||||
Valmont Industries, Inc. | ||||||||||||||||||
5.25%, 10/01/2054 | 60,000 | 59,397 | ||||||||||||||||
5.00%, 10/01/2044 | 59,000 | 58,404 | ||||||||||||||||
Verizon Communications, Inc. | ||||||||||||||||||
6.40%, 09/15/2033 | 67,000 | 81,754 | ||||||||||||||||
4.86%, 08/21/2046(d) | 83,000 | 84,849 | ||||||||||||||||
3.50%, 11/01/2024 | 41,000 | 40,420 | ||||||||||||||||
Viacom, Inc. | ||||||||||||||||||
5.85%, 09/01/2043 | 26,000 | 29,561 | ||||||||||||||||
Wells Fargo & Co. | ||||||||||||||||||
1.40%, 09/08/2017 | 259,000 | 259,118 | ||||||||||||||||
4.65%, 11/04/2044 | 41,000 | 41,030 | ||||||||||||||||
Wells Fargo Capital X | ||||||||||||||||||
5.95%, 12/15/2036 | 28,000 | 28,700 | ||||||||||||||||
|
| |||||||||||||||||
| 8,045,548 | ||||||||||||||||||
|
| |||||||||||||||||
TOTAL CORPORATE BONDS (Cost $8,127,812) | Currency | 8,045,548 | ||||||||||||||||
| ||||||||||||||||||
FOREIGN GOVERNMENT BONDS (0.04%) | ||||||||||||||||||
Canada Government International Bond | ||||||||||||||||||
0.88%, 02/14/2017 | USD | 90,000 | 90,306 | |||||||||||||||
Mexico Government International Bond | ||||||||||||||||||
4.75%, 03/08/2044 | USD | 71,000 | 72,456 | |||||||||||||||
Province of British Columbia | ||||||||||||||||||
2.85%, 06/15/2015 | USD | 97,000 | 98,591 | |||||||||||||||
|
| |||||||||||||||||
| 261,353 | ||||||||||||||||||
|
| |||||||||||||||||
TOTAL FOREIGN GOVERNMENT BONDS (Cost $262,890) | 261,353 | |||||||||||||||||
| ||||||||||||||||||
GOVERNMENT BONDS (0.11%) | ||||||||||||||||||
Tennessee Valley Authority | ||||||||||||||||||
1.75%, 10/15/2018 | 43,000 | 43,297 | ||||||||||||||||
|
| |||||||||||||||||
U.S. Treasury Bonds | ||||||||||||||||||
5.25%, 11/15/2028 | 69,000 | 90,309 | ||||||||||||||||
3.50%, 02/15/2039 | 81,000 | 88,391 | ||||||||||||||||
3.38%, 05/15/2044 | 26,000 | 27,587 | ||||||||||||||||
|
| |||||||||||||||||
| 206,287 | ||||||||||||||||||
|
| |||||||||||||||||
See Notes to Financial Statements.
| Semi-Annual Report | October 31, 2014 | 41 |
Table of Contents
| Redmont Resolute Fund II | Schedule of Investments | |
October 31, 2014 (Unaudited)
|
| Value | ||||||||||||||
| Principal Amount | (Note 2) | |||||||||||||
U.S. Treasury Notes | ||||||||||||||
1.50%, 12/31/2018 | $ | 38,000 | $ | 38,116 | ||||||||||
2.38%, 08/15/2024 | 22,000 | 22,077 | ||||||||||||
0.25%, 01/31/2015 | 149,000 | 149,070 | ||||||||||||
1.00%, 05/31/2018 | 21,000 | 20,841 | ||||||||||||
0.25%, 10/31/2015 | 47,000 | 47,051 | ||||||||||||
0.07%, 01/31/2016(e) | 198,000 | 198,003 | ||||||||||||
|
| |||||||||||||
| 475,158 | ||||||||||||||
|
| |||||||||||||
TOTAL GOVERNMENT BONDS (Cost $725,873) | 724,742 | |||||||||||||
| ||||||||||||||
| Principal Amount/ Shares | Value (Note 2) | |||||||||||||
SHORT TERM INVESTMENTS (1.35%) | ||||||||||||||
MONEY MARKET FUND (1.15%) | ||||||||||||||
Dreyfus Treasury Cash Management Fund, Institutional Class, 7-day yield, 0.021% | 7,533,639 | 7,533,639 | ||||||||||||
|
| |||||||||||||
U.S. TREASURY BILLS (0.20%) | ||||||||||||||
0.000%(h), 12/18/2014(g) | 745,000 | 744,993 | ||||||||||||
0.048%, 04/23/2015(g) | 600,000 | 599,865 | ||||||||||||
|
| |||||||||||||
| 1,344,858 | ||||||||||||||
|
| |||||||||||||
TOTAL SHORT TERM INVESTMENTS (Cost $8,878,502) | 8,878,497 | |||||||||||||
| ||||||||||||||
TOTAL INVESTMENTS (84.34%) (Cost $519,073,649) | $ | 553,781,598 | ||||||||||||
SEGREGATED CASH WITH BROKERS (18.19%)(i) | 119,471,639 | |||||||||||||
SECURITIES SOLD SHORT (-4.03%) (Proceeds $25,017,625) | (26,434,575) | |||||||||||||
OTHER ASSETS IN EXCESS OF LIABILITIES (1.50%) | 9,814,617 | |||||||||||||
| ||||||||||||||
NET ASSETS (100.00%) | $ | 656,633,279 | ||||||||||||
| ||||||||||||||
| ||||||||||||||
SCHEDULE OF SECURITIES SOLD SHORT
| Shares | Value (Note 2) | |||||||
COMMON STOCKS (-3.94%) | ||||||||
APPAREL (-0.05%) | ||||||||
Deckers Outdoor Corp. | (1,920) | (167,923) | ||||||
Under Armour, Inc., Class A | (2,702) | (177,197) | ||||||
|
| |||||||
| (345,120) | ||||||||
|
| |||||||
AUTO PARTS & EQUIPMENT (-0.04%) | ||||||||
Autoliv, Inc. | (2,534) | (232,469) | ||||||
|
| |||||||
BANKS (-0.31%) | ||||||||
BancorpSouth, Inc. | (6,417) | (147,784) | ||||||
Community Bank System, Inc. | (4,949) | (188,804) | ||||||
CVB Financial Corp. | (8,148) | (128,575) | ||||||
See Notes to Financial Statements.
42 |
www.redmontfunds.com |
Table of Contents
| Redmont Resolute Fund II | Schedule of Investments | |
October 31, 2014 (Unaudited) |
| Shares | Value (Note 2) | |||||||
| ||||||||
BANKS (-0.31%) (continued) | ||||||||
First Financial Bankshares, Inc. | (6,821) | $ | (216,771) | |||||
HDFC Bank, Ltd., ADR | (3,291) | (172,547) | ||||||
Home BancShares, Inc. | (4,390) | (140,129) | ||||||
Northern Trust Corp. | (2,498) | (165,617) | ||||||
Trustmark Corp. | (6,693) | (162,841) | ||||||
UMB Financial Corp. | (2,264) | (134,889) | ||||||
United Bankshares, Inc. | (6,668) | (228,579) | ||||||
Valley National Bancorp | (13,362) | (133,353) | ||||||
Westamerica Bancorporation | (4,972) | (245,319) | ||||||
|
| |||||||
| (2,065,208) | ||||||||
|
| |||||||
BEVERAGES (-0.03%) | ||||||||
Keurig Green Mountain, Inc. | (1,199) | (181,948) | ||||||
|
| |||||||
BIOTECHNOLOGY (-0.05%) | ||||||||
Biogen Idec, Inc. | (679) | (218,014) | ||||||
Puma Biotechnology, Inc. | (457) | (114,524) | ||||||
|
| |||||||
| (332,538) | ||||||||
|
| |||||||
BUILDING MATERIALS (-0.05%) | ||||||||
Trex Co., Inc. | (4,767) | (204,981) | ||||||
Vulcan Materials Co. | (2,561) | (158,039) | ||||||
|
| |||||||
| (363,020) | ||||||||
|
| |||||||
CHEMICALS (-0.09%) | ||||||||
Air Products & Chemicals, Inc. | (1,310) | (176,405) | ||||||
EI du Pont de Nemours & Co. | (3,596) | (248,663) | ||||||
Intrepid Potash, Inc. | (13,490) | (181,440) | ||||||
|
| |||||||
| (606,508) | ||||||||
|
| |||||||
COAL (-0.04%) | ||||||||
CONSOL Energy, Inc. | (6,427) | (236,514) | ||||||
|
| |||||||
COMMERCIAL SERVICES (-0.11%) | ||||||||
The ADT Corp. | (6,447) | (231,060) | ||||||
Monro Muffler Brake, Inc. | (4,658) | (248,924) | ||||||
Ritchie Bros. Auctioneers, Inc. | (8,877) | (216,510) | ||||||
|
| |||||||
| (696,494) | ||||||||
|
| |||||||
COMPUTERS (-0.18%) | ||||||||
3D Systems Corp. | (3,839) | (145,114) | ||||||
IHS, Inc., Class A | (1,129) | (147,933) | ||||||
Infosys, Ltd., Sponsored ADR | (4,362) | (291,643) | ||||||
VeriFone Systems, Inc. | (10,152) | (378,264) | ||||||
Wipro, Ltd., ADR | (19,848) | (242,146) | ||||||
|
| |||||||
| (1,205,100) | ||||||||
|
| |||||||
COSMETICS & PERSONAL CARE (-0.03%) | ||||||||
Colgate-Palmolive Co. | (2,925) | (195,624) | ||||||
|
| |||||||
DISTRIBUTION & WHOLESALE (-0.09%) | ||||||||
Fastenal Co. | (6,710) | (295,508) | ||||||
WW Grainger, Inc. | (1,280) | (315,904) | ||||||
|
| |||||||
| (611,412) | ||||||||
|
| |||||||
DIVERSIFIED FINANCIAL SERVICES (-0.08%) | ||||||||
Eaton Vance Corp. | (4,404) | (162,199) | ||||||
Financial Engines, Inc. | (3,605) | (143,731) | ||||||
Greenhill & Co., Inc. | (3,346) | (150,570) | ||||||
See Notes to Financial Statements.
| Semi-Annual Report | October 31, 2014 | 43 |
Table of Contents
| Redmont Resolute Fund II | Schedule of Investments | |
October 31, 2014 (Unaudited) |
| Shares | Value (Note 2) | |||||||
| ||||||||
DIVERSIFIED FINANCIAL SERVICES (-0.08%) (continued) | ||||||||
LPL Financial Holdings, Inc. | (1,276) | $ | (52,814) | |||||
|
| |||||||
| (509,314) | ||||||||
|
| |||||||
ELECTRIC (-0.01%) | ||||||||
Ormat Technologies, Inc. | (2,097) | (60,708) | ||||||
|
| |||||||
ELECTRONICS (-0.15%) | ||||||||
Itron, Inc. | (6,649) | (258,845) | ||||||
LG Display Co., Ltd., ADR | (15,343) | (230,452) | ||||||
National Instruments Corp. | (9,265) | (293,515) | ||||||
Trimble Navigation, Ltd. | (6,494) | (174,429) | ||||||
|
| |||||||
| (957,241) | ||||||||
|
| |||||||
ENTERTAINMENT (-0.08%) | ||||||||
DreamWorks Animation SKG, Inc., Class A | (9,070) | (202,080) | ||||||
Gaming and Leisure Properties, Inc., REIT | (9,948) | (310,875) | ||||||
|
| |||||||
| (512,955) | ||||||||
|
| |||||||
FOOD (-0.25%) | ||||||||
Campbell Soup Co. | (5,599) | (247,308) | ||||||
Flowers Foods, Inc. | (10,308) | (195,852) | ||||||
The Hain Celestial Group, Inc. | (2,389) | (258,609) | ||||||
McCormick & Co., Inc. | (3,102) | (219,373) | ||||||
Mondelez International, Inc., Class A | (5,721) | (201,722) | ||||||
Snyder’s-Lance, Inc. | (5,631) | (167,748) | ||||||
Sprouts Farmers Market, Inc. | (6,298) | (183,335) | ||||||
United Natural Foods, Inc. | (2,400) | (163,248) | ||||||
|
| |||||||
| (1,637,195) | ||||||||
|
| |||||||
FOREST PRODUCTS & PAPER (-0.01%) | ||||||||
Wausau Paper Corp. | (8,169) | (80,791) | ||||||
|
| |||||||
HAND & MACHINE TOOLS (-0.01%) | ||||||||
Kennametal, Inc. | (1,374) | (53,050) | ||||||
|
| |||||||
HEALTHCARE - PRODUCTS (-0.08%) | ||||||||
Insulet Corp. | (2,742) | (118,372) | ||||||
ResMed, Inc. | (4,906) | (256,191) | ||||||
Sirona Dental Systems, Inc. | (1,741) | (136,756) | ||||||
|
| |||||||
| (511,319) | ||||||||
|
| |||||||
HEALTHCARE - SERVICES (-0.03%) | ||||||||
Health Net, Inc. | (3,600) | (171,036) | ||||||
|
| |||||||
HOUSEWARES (-0.10%) | ||||||||
The Clorox Co. | (2,531) | (251,834) | ||||||
The Scotts Miracle-Gro Co., Class A | (3,515) | (208,229) | ||||||
Tumi Holdings, Inc. | (8,318) | (172,765) | ||||||
|
| |||||||
| (632,828) | ||||||||
|
| |||||||
INTERNET (-0.11%) | ||||||||
Cogent Communications Holdings, Inc. | (4,309) | (146,247) | ||||||
Equinix, Inc. | (1,160) | (242,324) | ||||||
Internap Network Services Corp. | (13,389) | (107,246) | ||||||
Netflix, Inc. | (328) | (128,829) | ||||||
Shutterstock, Inc. | (603) | (46,889) | ||||||
Twitter, Inc. | (1,870) | (77,549) | ||||||
|
| |||||||
| (749,084) | ||||||||
|
| |||||||
See Notes to Financial Statements.
44 |
www.redmontfunds.com |
Table of Contents
| Redmont Resolute Fund II | Schedule of Investments | |
October 31, 2014 (Unaudited) |
| Shares | Value (Note 2) | |||||||
| ||||||||
METAL FABRICATE & HARDWARE (-0.02%) | ||||||||
Sun Hydraulics Corp. | (2,752) | $ | (109,557) | |||||
|
| |||||||
MINING (-0.02%) | ||||||||
Teck Resources, Ltd., Class B | (6,550) | (103,359) | ||||||
|
| |||||||
MISCELLANEOUS MANUFACTURING (-0.09%) | ||||||||
Polypore International, Inc. | (3,073) | (134,966) | ||||||
Proto Labs, Inc. | (4,222) | (275,992) | ||||||
Raven Industries, Inc. | (3,222) | (81,678) | ||||||
Trinity Industries, Inc. | (2,777) | (99,167) | ||||||
|
| |||||||
| (591,803) | ||||||||
|
| |||||||
OIL & GAS (-0.31%) | ||||||||
Atwood Oceanics, Inc. | (4,857) | (197,437) | ||||||
Cabot Oil & Gas Corp. | (3,993) | (124,182) | ||||||
Carrizo Oil & Gas, Inc. | (2,569) | (133,434) | ||||||
Concho Resources, Inc. | (1,177) | (128,328) | ||||||
ConocoPhillips | (3,976) | (286,869) | ||||||
Continental Resources, Inc. | (4,674) | (263,474) | ||||||
Denbury Resources, Inc. | (14,735) | (182,714) | ||||||
Goodrich Petroleum Corp. | (6,027) | (49,663) | ||||||
Helmerich & Payne, Inc. | (1,615) | (140,214) | ||||||
HollyFrontier Corp. | (4,322) | (196,132) | ||||||
Matador Resources Co. | (9,621) | (233,502) | ||||||
Oasis Petroleum, Inc. | (1,273) | (38,139) | ||||||
Rex Energy Corp. | (7,173) | (56,236) | ||||||
|
| |||||||
| (2,030,324) | ||||||||
|
| |||||||
OIL & GAS SERVICES (-0.08%) | ||||||||
National Oilwell Varco, Inc. | (3,032) | (220,245) | ||||||
NOW, Inc. | (7,424) | (223,165) | ||||||
Weatherford International PLC | (5,813) | (95,449) | ||||||
|
| |||||||
| (538,859) | ||||||||
|
| |||||||
PACKAGING & CONTAINERS (-0.02%) | ||||||||
Bemis Co., Inc. | (3,327) | (127,990) | ||||||
|
| |||||||
PHARMACEUTICALS (-0.03%) | ||||||||
GW Pharmaceuticals PLC, ADR | (1,444) | (106,495) | ||||||
Pharmacyclics, Inc. | (964) | (125,966) | ||||||
|
| |||||||
| (232,461) | ||||||||
|
| |||||||
REAL ESTATE INVESTMENT TRUSTS (-0.28%) | ||||||||
HCP, Inc. | (8,376) | (368,293) | ||||||
Health Care REIT, Inc. | (5,425) | (385,772) | ||||||
Iron Mountain, Inc. | (1,619) | (58,397) | ||||||
Omega Healthcare Investors, Inc. | (8,943) | (341,265) | ||||||
Plum Creek Timber Co., Inc. | (3,362) | (137,876) | ||||||
Realty Income Corp. | (7,372) | (339,333) | ||||||
Rouse Properties, Inc. | (12,139) | (221,051) | ||||||
|
| |||||||
| (1,851,987) | ||||||||
|
| |||||||
RETAIL (-0.31%) | ||||||||
AutoNation, Inc. | (2,933) | (167,944) | ||||||
Bob Evans Farms, Inc. | (5,072) | (247,767) | ||||||
Cabela’s, Inc. | (2,679) | (128,646) | ||||||
CarMax, Inc. | (4,409) | (246,507) | ||||||
See Notes to Financial Statements.
| Semi-Annual Report | October 31, 2014 | 45 |
Table of Contents
| Redmont Resolute Fund II | Schedule of Investments | |
October 31, 2014 (Unaudited) |
| Shares | Value (Note 2) | |||||||
| ||||||||
RETAIL (-0.31%) (continued) | ||||||||
The Cheesecake Factory, Inc. | (5,238) | $ | (240,634) | |||||
Krispy Kreme Doughnuts, Inc. | (12,868) | (243,462) | ||||||
L Brands, Inc. | (2,758) | (198,907) | ||||||
Texas Roadhouse, Inc. | (6,682) | (192,909) | ||||||
Vitamin Shoppe, Inc. | (4,002) | (187,814) | ||||||
The Wendy’s Co. | (23,982) | (192,336) | ||||||
|
| |||||||
| (2,046,926) | ||||||||
|
| |||||||
SAVINGS & LOANS (-0.05%) | ||||||||
Astoria Financial Corp. | (11,906) | (156,564) | ||||||
New York Community Bancorp, Inc. | (11,171) | (178,177) | ||||||
|
| |||||||
| (334,741) | ||||||||
|
| |||||||
SEMICONDUCTORS (-0.06%) | ||||||||
Cirrus Logic, Inc. | (3,620) | (69,866) | ||||||
International Rectifier Corp. | (8,623) | (342,937) | ||||||
|
| |||||||
| (412,803) | ||||||||
|
| |||||||
SOFTWARE (-0.38%) | ||||||||
Acxiom Corp. | (7,448) | (140,320) | ||||||
Aspen Technology, Inc. | (3,074) | (113,523) | ||||||
athenahealth, Inc. | (1,218) | (149,205) | ||||||
Blackbaud, Inc. | (9,245) | (411,402) | ||||||
NetSuite, Inc. | (2,318) | (251,874) | ||||||
Rackspace Hosting, Inc. | (5,075) | (194,677) | ||||||
Red Hat, Inc. | (3,554) | (209,402) | ||||||
salesforce.com, Inc. | (5,130) | (328,269) | ||||||
Synchronoss Technologies, Inc. | (4,436) | (229,208) | ||||||
Tyler Technologies, Inc. | (1,929) | (215,894) | ||||||
The Ultimate Software Group, Inc. | (1,375) | (206,951) | ||||||
VMware, Inc., Class A | (560) | (46,799) | ||||||
|
| |||||||
| (2,497,524) | ||||||||
|
| |||||||
STORAGE & WAREHOUSING (-0.02%) | ||||||||
Mobile Mini, Inc. | (3,237) | (141,878) | ||||||
|
| |||||||
TELECOMMUNICATIONS (-0.17%) | ||||||||
America Movil SAB de CV, Sponsored ADR, Class L | (5,363) | (130,911) | ||||||
Arista Networks, Inc. | (1,118) | (90,837) | ||||||
CenturyLink, Inc. | (2,018) | (83,707) | ||||||
Finisar Corp. | (6,903) | (115,418) | ||||||
Frontier Communications Corp. | (21,773) | (142,395) | ||||||
Level 3 Communications, Inc. | (3,042) | (142,700) | ||||||
Sprint Corp. | (22,230) | (131,824) | ||||||
Telefonica SA, Sponsored ADR | (10,773) | (161,380) | ||||||
ViaSat, Inc. | (2,304) | (144,323) | ||||||
|
| |||||||
| (1,143,495) | ||||||||
|
| |||||||
TOYS, GAMES & HOBBIES (-0.03%) | ||||||||
Mattel, Inc. | (5,811) | (180,548) | ||||||
|
| |||||||
TRANSPORTATION (-0.09%) | ||||||||
Heartland Express, Inc. | (5,539) | (139,251) | ||||||
JB Hunt Transport Services, Inc. | (2,183) | (174,138) | ||||||
Kansas City Southern | (1,179) | (144,769) | ||||||
See Notes to Financial Statements.
46 |
www.redmontfunds.com |
Table of Contents
| Redmont Resolute Fund II | Schedule of Investments | |
October 31, 2014 (Unaudited) |
| Shares | Value (Note 2) | |||||||||||||
| ||||||||||||||
TRANSPORTATION (-0.09%) (continued) | ||||||||||||||
Ryder System, Inc. | (1,639) | $ | (145,002) | |||||||||||
|
| |||||||||||||
| (603,160) | ||||||||||||||
|
| |||||||||||||
TOTAL COMMON STOCKS (Proceeds $24,426,940) | (25,894,891) | |||||||||||||
| ||||||||||||||
EXCHANGE TRADED FUNDS (-0.05%) | ||||||||||||||
United States Oil Fund LP | (10,242) | (313,712) | ||||||||||||
|
| |||||||||||||
TOTAL EXCHANGE TRADED FUNDS (-0.05%) (Proceeds $358,708) | (313,712) | |||||||||||||
| ||||||||||||||
LIMITED PARTNERSHIPS (-0.03%) | ||||||||||||||
OIL & GAS (0.00%)(a) | ||||||||||||||
Seadrill Partners LLC | (134) | (3,370) | ||||||||||||
|
| |||||||||||||
PIPELINES (-0.03%) | ||||||||||||||
EQT Midstream Partners LP | (2,513) | (222,602) | ||||||||||||
|
| |||||||||||||
TOTAL LIMITED PARTNERSHIPS (Proceeds $231,977) | (225,972) | |||||||||||||
| ||||||||||||||
TOTAL SECURITIES SOLD SHORT (Proceeds $25,017,625) | $ | (26,434,575) | ||||||||||||
| ||||||||||||||
SCHEDULE OF WRITTEN OPTIONS | ||||||||||||||
| Number of Contracts | Exercise Price | Maturity Date | Value (Note 2) | |||||||||||
| ||||||||||||||
WRITTEN OPTIONS | ||||||||||||||
Call Options | ||||||||||||||
Exxon Mobil Corp. | (22) | $ 97.50 | 01/17/2015 | $ | (4,290) | |||||||||
Exxon Mobil Corp. | (32) | 95.00 | 04/17/2015 | (14,240) | ||||||||||
Occidental Petroleum Corp. | (34) | 85.00 | 01/17/2015 | (19,040) | ||||||||||
|
| |||||||||||||
TOTAL WRITTEN OPTIONS (Proceeds $32,320) | $ | (37,570) | ||||||||||||
|
| |||||||||||||
| (a) | Non-income producing security. |
| (b) | Security position either entirely or partially held in a segregated account as collateral for securities sold short and written options Aggregate total market value of $21,190,327. |
| (c) | Less than 0.005%. |
| (d) | Security exempt from registration under rule 144A of the securities act of 1933. This security may be resold in transactions exempt from registration, normally to qualified institutional buyers. At period end, the market value of those securities was $1,303,482, representing 0.20% of the Fund’s net assets. |
| (e) | The coupon rate shown on floating or adjustable rate securities represents the rate at period end. |
| (f) | This security has no contractual maturity date, is not redeemable and contractually pays an indefinite stream of interest. |
| (g) | Rate shown represents the bond equivalent yield to maturity at date of purchase. |
| (h) | Less than 0.0005%. |
| (i) | Includes cash which is being held as collateral for securities sold short, written options, and total return swap contracts. |
| (j) | Less than (0.005)%. |
See Notes to Financial Statements.
| Semi-Annual Report | October 31, 2014 | 47 |
Table of Contents
| Redmont Resolute Fund II | Schedule of Investments | |
October 31, 2014 (Unaudited) |
FUTURES CONTRACTS
At October 31, 2014, the Fund had outstanding futures contracts:
| Description | Position | Contracts | Expiration Date | Underlying Face Amount at Value | Unrealized Appreciation | |||||||||||
| ||||||||||||||||
Equity Contracts | ||||||||||||||||
E-Mini MSCI Emerging Markets Future | Long | 52 | 12/22/2014 | $ | 2,635,360 | $ | 115,734 | |||||||||
Euro STOXX 50® Index Future | Short | 18 | 12/22/2014 | (699,482) | 995 | |||||||||||
Euro STOXX 50® Index Future | Long | 39 | 12/22/2014 | 1,515,545 | 114,775 | |||||||||||
FTSE® 100 Index Future | Long | 3 | 12/22/2014 | 312,204 | 5,728 | |||||||||||
Mexican Bolsa Index Future | Long | 61 | 12/22/2014 | 2,041,238 | 100,330 | |||||||||||
Russell 2000® E-Mini Future | Long | 31 | 12/22/2014 | 3,630,100 | 366,243 | |||||||||||
Tokyo Price Index Future | Long | 5 | 12/12/2014 | 595,148 | 38,692 | |||||||||||
Fixed Income Contracts | ||||||||||||||||
Australian 10 Year Bond Future | Long | 2 | 12/16/2014 | 17,018,374 | 54 | |||||||||||
Australian 3 Year Bond Future | Long | 2 | 12/16/2014 | 17,145,975 | 28 | |||||||||||
Euro-BTP Future | Long | 16 | 12/09/2014 | 261,296,507 | 25,635 | |||||||||||
Euro-OAT Future | Long | 8 | 12/09/2014 | 145,224,878 | 10,512 | |||||||||||
U.S. 10 Year Note Future | Short | 46 | 12/22/2014 | (581,253,240) | 103,397 | |||||||||||
U.S. 5 Year Treasury Note Future | Short | 23 | 01/02/2015 | (274,688,310) | 28,340 | |||||||||||
U.S. Long Bond Future | Short | 4 | 12/22/2014 | (56,437,520) | 14,741 | |||||||||||
Foreign Currency Contracts | ||||||||||||||||
Euro FX Currency Future | Short | 35 | 12/16/2014 | (5,481,875) | 54,136 | |||||||||||
Japanese Yen Currency Future | Short | 107 | 12/16/2014 | (119,144,500,000) | 455,739 | |||||||||||
Swiss Franc Currency Future | Short | 25 | 12/16/2014 | (324,750,000) | 30,231 | |||||||||||
|
| |||||||||||||||
| $ | (119,936,395,098) | $ | 1,465,310 | |||||||||||||
|
| |||||||||||||||
| Description | Position | Contracts | Expiration Date | Underlying Face Amount at Value | Unrealized Depreciation | |||||||||||
| ||||||||||||||||
Equity Contracts | ||||||||||||||||
E-Mini S&P 500® Future | Short | 18 | 12/22/2014 | $ | (1,810,260) | $ | (151,236) | |||||||||
Fixed Income Contracts | ||||||||||||||||
Canadian 10 Year Bond Future | Long | 4 | 12/19/2014 | 48,633,157 | (1,430) | |||||||||||
Canadian 5 Year Bond Future | Long | 2 | 12/19/2014 | 21,292,755 | (431) | |||||||||||
Euro-BOBL Future | Short | 9 | 12/09/2014 | (144,419,103) | (2,723) | |||||||||||
Foreign Currency Contracts | ||||||||||||||||
Australian Dollar Currency Future | Short | 31 | 12/16/2014 | (271,839,000) | (14,361) | |||||||||||
New Zealand Dollar Currency Future | Long | 34 | 12/16/2014 | 263,568,000 | (7,251) | |||||||||||
|
| |||||||||||||||
| $ | (84,574,451) | $ | (177,432) | |||||||||||||
|
| |||||||||||||||
TOTAL RETURN SWAP CONTRACTS*
| Counterparty | Reference Obligation | Notional Amount | Rate Paid by the Fund | Termination Date | Unrealized Appreciation | |||||||||
| ||||||||||||||
Morgan Stanley | Loeb King Multi Segregated Portfolio | $ 73,164,481 | 1-Month LIBOR BBA | 09/02/2015 | $ 277,981 | |||||||||
Morgan Stanley | Melchior Segregated Portfolio | 51,200,012 | 1-Month LIBOR BBA | 03/20/2019 | 324,456 | |||||||||
Morgan Stanley | Trilogy Segregated Portfolio | 74,562,733 | 1-Month LIBOR BBA | 09/02/2015 | 718,055 | |||||||||
|
|
|
| |||||||||||
| $ 198,927,226 | $ 1,320,492 | |||||||||||||
|
|
|
| |||||||||||
| * | The Fund receives payments based on any positive return of the Reference Obligation less the rate paid by the Fund. The Fund makes payments on any negative return of such Reference Obligation plus the rate paid by the Fund. |
See Notes to Financial Statements.
48 |
www.redmontfunds.com |
Table of Contents
| Redmont Resolute Fund II | Schedule of Investments | |
October 31, 2014 (Unaudited) |
Common Abbreviations:
AB - Aktiebolag is the Swedish equivalent of the term corporation.
ADR - American Depositary Receipt.
AG - Aktiengesellschaft is a German term that refers to a corporation that is limited by shares, i.e., owned by shareholders.
AQR - AQR Capital Management LLC.
A/S - Aktieselskab is the Danish term for Joint Stock Company.
ASA - Allmennaksjeselskap is the Norwegian term for public limited company.
BBA - British Bankers Association.
BOBL - Bundesobligationen is the German word for a German government security issued with a 5 year maturity.
BTP - Bonds offered by the government on Italy.
BV - Besloten Vennootschap is the Dutch term for private limited liability company.
ETF - Exchange Traded Fund.
FPA - First Pacific Advisors LLC.
FTSE - Financial Times and the London Stock Exchange.
KGaA - Kommanditgesellschaft Auf Aktien is the German term for a partnership limited by shares.
LIBOR - London Interbank Offered Rate.
LLC - Limited Liability Company.
LP - Limited Partnership.
Ltd. - Limited.
MSCI - Morgan Stanley Capital International.
NV - Naamloze Vennootschap is the Dutch term for a public limited liability corporation.
OAT - Obligations Assimilables du Tresor is the French term for Long-term French government bonds.
OYJ - Osakeyhtio is the Finnish equivalent of a public limited company.
PIMCO - Pacific Investment Management Company.
PLC - Public Limited Company.
REIT - Real Estate Investment Trust.
S&P - Standard & Poor’s.
SA - Generally designates corporations in various countries, mostly those employing the civil law.
SAB de CV - A variable capital company.
SE - SE Regulation. A European company which can operate on a Europe-wide basis and be governed by Community law directly applicable in all Member States.
SpA - Societa per Azione.
SPDR - Standard & Poor’s Depositary Receipt.
STOXX 50 - A stock index representing 50 of the largest companies in Europe based on market capitalization.
See Notes to Financial Statements.
| Semi-Annual Report | October 31, 2014 | 49 |
Table of Contents
| Redmont Funds | Statements of Assets and Liabilities | |
October 31, 2014 (Unaudited)
|
| REDMONT RESOLUTE | REDMONT RESOLUTE | |||||||
| FUND I | FUND II | |||||||
|
| |||||||
ASSETS | ||||||||
Investments, at value | $ | 2,532,922 | $ | 553,781,598 | ||||
Unrealized appreciation on total return swap contracts | 7,872 | 1,320,492 | ||||||
Deposits with brokers for securities sold short and written options | 132,058 | 22,516,837 | ||||||
Deposits with brokers for total return swap contracts | 581,528 | 96,953,406 | ||||||
Deposit with broker for futures contracts | – | 155,836 | ||||||
Cash | 16,009 | 9,524,657 | ||||||
Foreign currency, at value (Cost $– and $2,691, respectively) | – | 2,758 | ||||||
Receivable for investments sold | 14,949 | 1,516,110 | ||||||
Variation margin receivable | 1,333 | 1,465,310 | ||||||
Receivable due from adviser | 7,806 | – | ||||||
Receivable for dividends | 584 | 211,446 | ||||||
Other assets | 15,373 | 9,042 | ||||||
| ||||||||
Total assets | 3,310,434 | 687,457,492 | ||||||
| ||||||||
LIABILITIES | ||||||||
Securities sold short (Proceeds $153,495 and $25,017,625, respectively) | 162,469 | 26,434,575 | ||||||
Written options, at value (Premiums received $– and $32,320, respectively) | – | 37,570 | ||||||
Payable to foreign custodian (Cost $17 and $–, respectively) | 17 | – | ||||||
Investment advisory fees payable | – | 236,245 | ||||||
Distributions and service fees payable | 38 | N/A | ||||||
Payable for dividend expense on securities sold short | 314 | 51,142 | ||||||
Payable for interest expense on total return swap contracts | 43 | 7,206 | ||||||
Payable for investments purchased | 7,381 | 3,723,676 | ||||||
Variation margin payable | – | 177,432 | ||||||
Payable due to broker for futures contracts | 1,333 | – | ||||||
Trustee fees and expenses payable | 39 | 5,699 | ||||||
Chief compliance officer fee payable | 26 | 4,105 | ||||||
Principal financial officer fees payable | – | 859 | ||||||
Administration fees payable | 1,594 | 26,366 | ||||||
Transfer agent fees payable | 5,779 | 4,168 | ||||||
Professional fees payable | 7,869 | 24,787 | ||||||
Custody fees payable | 3,014 | 12,579 | ||||||
Accrued expenses and other liabilities | 541 | 77,804 | ||||||
| ||||||||
Total liabilities | 190,457 | 30,824,213 | ||||||
| ||||||||
NET ASSETS | $ | 3,119,977 | $ | 656,633,279 | ||||
| ||||||||
NET ASSETS CONSIST OF | ||||||||
Paid-in capital (Note 6) | $ | 2,885,459 | $ | 617,903,281 | ||||
Accumulated net investment income/(loss) | (39,088) | 592,383 | ||||||
Accumulated net realized gain on investments, securities sold short, written options, futures contracts, and total return swap contracts | 74,923 | 2,243,449 | ||||||
Net unrealized appreciation on investments, securities sold short, written options, futures contracts, and total return swap contracts | 198,683 | 35,894,166 | ||||||
| ||||||||
NET ASSETS | $ | 3,119,977 | $ | 656,633,279 | ||||
| ||||||||
INVESTMENTS, AT COST | $ | 2,334,470 | $ | 519,073,649 | ||||
| ||||||||
See Notes to Financial Statements.
50 |
www.redmontfunds.com |
Table of Contents
| Redmont Funds | Statements of Assets and Liabilities | |
October 31, 2014 (Unaudited)
|
| REDMONT RESOLUTE | REDMONT RESOLUTE | |||||||
| FUND I | FUND II | |||||||
|
| |||||||
PRICING OF SHARES | ||||||||
Class A: | ||||||||
Net Asset Value, offering and redemption price per share(a) | $ | 10.67 | N/A | |||||
Net Assets | $ | 89,212 | N/A | |||||
Shares of beneficial interest outstanding (unlimited number of shares, no par value common stock authorized) | 8,357 | N/A | ||||||
Maximum offering price per share ((NAV/0.9450), based on maximum sales charge of 5.50% of the offering price) | $ | 11.29 | N/A | |||||
Class I: | ||||||||
Net Asset Value, offering and redemption price per share | $ | 10.79 | $ | 11.32 | ||||
Net Assets | $ | 3,030,765 | $ | 656,633,279 | ||||
Shares of beneficial interest outstanding (unlimited number of shares, no par value common stock authorized) | 280,792 | 57,995,154 | ||||||
| (a) | Redemption price per share may be reduced for any applicable contingent deferred sales charge. For a description of a possible sales charge, please see the Fund’s Prospectus. |
See Notes to Financial Statements.
| Semi-Annual Report | October 31, 2014 | 51 |
Table of Contents
| Redmont Funds | Statements of Operations | |
For the Six Months Ended October 31, 2014 (Unaudited) |
| REDMONT RESOLUTE FUND I | REDMONT RESOLUTE FUND II | |||||||
|
| |||||||
INVESTMENT INCOME | ||||||||
Dividends | $ | 14,935 | $ | 2,534,087 | ||||
Interest | – | 7,019 | ||||||
Foreign taxes withheld | (38) | (6,840) | ||||||
| ||||||||
Total investment income | 14,897 | 2,534,266 | ||||||
| ||||||||
EXPENSES | ||||||||
Investment advisory fees (Note 7) | 27,295 | 4,852,452 | ||||||
Broker fees and charges on securities sold short | 515 | 81,432 | ||||||
Administration fees | 7,083 | 153,488 | ||||||
Transfer agency fees | 23,395 | 18,725 | ||||||
Distribution and service fees | ||||||||
Class A | 215 | N/A | ||||||
Professional fees | 6,836 | 21,954 | ||||||
Custody fees | 8,848 | 35,561 | ||||||
Reports to shareholders and printing fees | 148 | 7,033 | ||||||
Trustee fees and expenses | 67 | 10,292 | ||||||
Registration/filing fees | 13,896 | 1,560 | ||||||
Chief compliance officer fees | 131 | 23,704 | ||||||
Principal financial officer fees | 36 | 5,009 | ||||||
Dividend expense on securities sold short | 1,537 | 249,668 | ||||||
Other | 3,787 | 10,938 | ||||||
| ||||||||
Total expenses before waivers | 93,789 | 5,471,816 | ||||||
Less fees waived/reimbursed by investment adviser (Note 7) | ||||||||
Class A | (1,896) | N/A | ||||||
Class I | (61,941) | (4,495,135) | ||||||
| ||||||||
Total net expenses | 29,952 | 976,681 | ||||||
| ||||||||
NET INVESTMENT INCOME/(LOSS) | (15,055) | 1,557,585 | ||||||
| ||||||||
Net realized gain on investments | 85,679 | 5,663,873 | ||||||
Net realized loss on securities sold short | (5,444) | (866,871) | ||||||
Net realized gain on written options | – | 15,776 | ||||||
Net realized loss on total return swap contracts | (1,507) | (151,157) | ||||||
Net realized loss on foreign currency transactions | – | (30,417) | ||||||
Net change in unrealized depreciation on investments | (26,808) | (594,015) | ||||||
Net change in unrealized depreciation on securities sold short | (1,214) | (209,954) | ||||||
Net change in unrealized appreciation on written options | – | 40,503 | ||||||
Net change in unrealized appreciation on futures contracts | 1,333 | 1,287,878 | ||||||
Net change in unrealized appreciation on total return swap contracts | 6,637 | 1,111,286 | ||||||
Net change in unrealized appreciation on translation of assets and liabilities in foreign currency transactions | – | 47 | ||||||
| ||||||||
NET REALIZED AND UNREALIZED GAIN ON INVESTMENTS | 58,676 | 6,266,949 | ||||||
| ||||||||
NET INCREASE IN NET ASSETS RESULTING FROM OPERATIONS | $ | 43,621 | $ | 7,824,534 | ||||
| ||||||||
See Notes to Financial Statements.
52 |
www.redmontfunds.com |
Table of Contents
| Redmont Funds | Statements of Changes in Net Assets | |
| REDMONT RESOLUTE FUND I | ||||||||
| Six Months Ended October 31, 2014 (Unaudited) | For the Year Ended April 30, 2014 | |||||||
OPERATIONS | ||||||||
Net investment loss | $ | (15,055) | $ | (13,472) | ||||
Net realized gain on investments, securities sold short, and total return swap contracts | 78,728 | 1,493 | ||||||
Net realized gain distributions from other investment companies | – | 31,794 | ||||||
Net change in unrealized appreciation/(depreciation) on investments, securities sold short, futures contracts, and total return swap contracts | (20,052) | 44,042 | ||||||
| ||||||||
Net increase in net assets resulting from operations
| 43,621 | 63,857 | ||||||
| ||||||||
DISTRIBUTIONS (NOTE 4) | ||||||||
Net realized gains on investments | ||||||||
Class A | – | (291) | ||||||
Class I | – | (35,858) | ||||||
| ||||||||
Net decrease in net assets from distributions | – | (36,149) | ||||||
| ||||||||
BENEFICIAL INTEREST TRANSACTIONS (NOTE 6) | ||||||||
Shares sold | ||||||||
Class A | 5,357 | 81,978 | ||||||
Class I | 118,211 | 1,070,517 | ||||||
Dividends reinvested | ||||||||
Class A | – | 291 | ||||||
Class I | – | 35,858 | ||||||
Shares redeemed, net of redemption fees | ||||||||
Class A | (20,102) | – | ||||||
Class I | (1,280,449) | (179,407) | ||||||
| ||||||||
Net increase/(decrease) in net assets derived from beneficial interest transactions
| (1,176,983) | 1,009,237 | ||||||
| ||||||||
Net increase/(decrease) in Net Assets | (1,133,362) | 1,036,945 | ||||||
NET ASSETS: | ||||||||
Beginning of period | 4,253,339 | 3,216,394 | ||||||
| ||||||||
End of period* | $ | 3,119,977 | $ | 4,253,339 | ||||
| ||||||||
* Includes accumulated net investment loss of: | $ | (39,088) | $ | (24,033) | ||||
See Notes to Financial Statements.
| Semi-Annual Report | October 31, 2014 | 53 |
Table of Contents
| Redmont Funds | Statements of Changes in Net Assets | |
| REDMONT RESOLUTE FUND II | ||||||||
| Six Months Ended October 31, 2014 (Unaudited) | For the Year Ended April 30, 2014 | |||||||
OPERATIONS | ||||||||
Net investment income | $ | 1,557,585 | $ | 7,169,861 | ||||
Net realized gain/(loss) on investments, securities sold short, written options, total return swap contracts, and foreign currency transactions | 4,631,204 | (5,891,610) | ||||||
Net realized gain distributions from other investment companies | – | 5,662,182 | ||||||
Net change in unrealized appreciation on investments, securities sold short, written options, futures contracts, total return swap contracts, and translation of assets and liabilities in foreign currency transactions | 1,635,745 | 10,861,443 | ||||||
| ||||||||
Net increase in net assets resulting from operations | 7,824,534 | 17,801,876 | ||||||
| ||||||||
DISTRIBUTIONS (NOTE 4) | ||||||||
Net investment income | ||||||||
Class I | – | (6,549,225) | ||||||
Net realized gains on investments | ||||||||
Class I | – | (4,724,816) | ||||||
| ||||||||
Net decrease in net assets from distributions | – | (11,274,041) | ||||||
| ||||||||
BENEFICIAL INTEREST TRANSACTIONS (NOTE 6) | ||||||||
Shares sold | ||||||||
Class I | 46,497,561 | 278,165,907 | ||||||
Dividends reinvested | ||||||||
Class I | – | 11,258,768 | ||||||
Shares redeemed, net of redemption fees | ||||||||
Class I | (2,638,141) | (137,322,440) | ||||||
| ||||||||
Net increase in net assets derived from beneficial interest transactions | 43,859,420 | 152,102,235 | ||||||
| ||||||||
Net increase in Net Assets | 51,683,954 | 158,630,070 | ||||||
NET ASSETS: | ||||||||
Beginning of period | 604,949,325 | 446,319,255 | ||||||
| ||||||||
End of period* | $ | 656,633,279 | $ | 604,949,325 | ||||
| ||||||||
* Includes accumulated net investment income/(loss) of: | $ | 592,383 | $ | (965,202) | ||||
See Notes to Financial Statements.
54 |
www.redmontfunds.com |
Table of Contents
| Redmont Resolute Fund I | Financial Highlights | |
For a share outstanding throughout the periods presented |
| CLASS A | ||||||||||||||||
| For the | ||||||||||||||||
| Six Months Ended | For the | For the | For the | |||||||||||||
| October 31, 2014 | Year Ended | Year Ended | Period Ended | |||||||||||||
| (Unaudited) | April 30, 2014 | April 30, 2013 | April 30, 2012(a) | |||||||||||||
NET ASSET VALUE, BEGINNING OF PERIOD | $ | 10.61 | $ | 10.63 | $ | 10.17 | $ | 10.00 | ||||||||
INCOME/(LOSS) FROM OPERATIONS | ||||||||||||||||
Net investment loss(b) | (0.07) | (0.10) | (0.04) | (0.07) | ||||||||||||
Net realized and unrealized gain on investments | 0.13 | 0.17 | 0.52 | 0.24 | ||||||||||||
|
|
|
|
|
|
|
| |||||||||
Total from Investment Operations | 0.06 | 0.07 | 0.48 | 0.17 | ||||||||||||
|
|
|
|
|
|
|
| |||||||||
LESS DISTRIBUTIONS | ||||||||||||||||
Net investment income | – | – | (0.03) | – | ||||||||||||
Net realized gain on investments | – | (0.09) | (0.00)(c) | – | ||||||||||||
|
|
|
|
|
|
|
| |||||||||
Total Distributions | – | (0.09) | (0.03) | – | ||||||||||||
|
|
|
|
|
|
|
| |||||||||
REDEMPTION FEES ADDED TO PAID IN CAPITAL | – | – | 0.01 | – | ||||||||||||
|
|
|
|
|
|
|
| |||||||||
NET INCREASE/(DECREASE) IN NET ASSET VALUE | 0.06 | (0.02) | 0.46 | 0.17 | ||||||||||||
|
|
|
|
|
|
|
| |||||||||
NET ASSET VALUE, END OF PERIOD | $ | 10.67 | $ | 10.61 | $ | 10.63 | $ | 10.17 | ||||||||
|
|
|
|
|
|
|
| |||||||||
TOTAL RETURN(d) | 0.57 | % | 0.70 | % | 4.81 | % | 1.70 | % | ||||||||
RATIOS/SUPPLEMENTAL DATA | ||||||||||||||||
Net assets, End of Period (000s) | $ | 89 | $ | 104 | $ | 21 | $ | 1 | ||||||||
RATIOS TO AVERAGE NET ASSETS: | ||||||||||||||||
Operating expenses excluding reimbursement/waiver(e) | 5.53%(f) | (g) | 5.38% | (g) | 6.47 | % | 689.76% | (f) | ||||||||
Operating expenses including reimbursement/waiver(e) | 2.03%(f) | (g) | 2.08% | (g) | 2.30 | % | 2.30% | (f) | ||||||||
Net investment loss including reimbursement/waiver(e) | (1.21)% | (f) | (0.99) | % | (0.38) | % | (2.21)% | (f) | ||||||||
PORTFOLIO TURNOVER RATE | 30% | (h) | 91 | % | 25 | % | 13% | (h) | ||||||||
| (a) | The Fund’s inception was December 30, 2011. |
| (b) | Calculated using the average shares method. |
| (c) | Less than $0.005 per share. |
| (d) | Total investment return is calculated assuming a purchase of a common share at the opening of the first day and a sale at closing on the last day of each period reported. Dividends and distributions, if any, are assumed for purposes of this calculation to be reinvested at prices obtained under the Fund’s dividend reinvestment plan. Total returns would have been lower had certain expenses not been waived during the period. Total investment returns do not reflect brokerage commissions, if any, and are not annualized. |
| (e) | The ratios exclude the impact of expenses of the underlying funds in which the Fund invests as represented in the Schedule of Investments. |
| (f) | Annualized. |
| (g) | Dividend and interest expense on securities sold short totaled 0.11% (annualized) and 0.08% of average net assets for the six months ended October 31, 2014 and the year ended April 30, 2014, respectively. |
| (h) | Not Annualized. |
See Notes to Financial Statements.
| Semi-Annual Report | October 31, 2014 | 55 |
Table of Contents
| Redmont Resolute Fund I | Financial Highlights | |
For a share outstanding throughout the periods presented |
| CLASS I | ||||||||||||||||
| For the | ||||||||||||||||
| Six Months Ended | For the | For the | For the | |||||||||||||
| October 31, 2014 | Year Ended | Year Ended | Period Ended | |||||||||||||
| (Unaudited) | April 30, 2014 | April 30, 2013 | April 30, 2012(a) | |||||||||||||
NET ASSET VALUE, BEGINNING OF PERIOD | $ | 10.70 | $ | 10.65 | $ | 10.18 | $ | 10.00 | ||||||||
INCOME/(LOSS) FROM OPERATIONS | ||||||||||||||||
Net investment loss(b) | (0.04) | (0.04) | (0.02) | (0.06) | ||||||||||||
Net realized and unrealized gain on investments | 0.13 | 0.18 | 0.52 | 0.24 | ||||||||||||
|
|
|
|
|
|
|
| |||||||||
Total from Investment Operations | 0.09 | 0.14 | 0.50 | 0.18 | ||||||||||||
|
|
|
|
|
|
|
| |||||||||
LESS DISTRIBUTIONS | ||||||||||||||||
Net investment income | – | – | (0.03) | – | ||||||||||||
Net realized gain on investments | – | (0.09) | (0.00)(c) | – | ||||||||||||
|
|
|
|
|
|
|
| |||||||||
Total Distributions | – | (0.09) | (0.03) | – | ||||||||||||
|
|
|
|
|
|
|
| |||||||||
REDEMPTION FEES ADDED TO PAID IN CAPITAL | 0.00(c) | – | – | – | ||||||||||||
|
|
|
|
|
|
|
| |||||||||
NET INCREASE IN NET ASSET VALUE | 0.09 | 0.05 | 0.47 | 0.18 | ||||||||||||
|
|
|
|
|
|
|
| |||||||||
NET ASSET VALUE, END OF PERIOD | $ | 10.79 | $ | 10.70 | $ | 10.65 | $ | 10.18 | ||||||||
|
|
|
|
|
|
|
| |||||||||
TOTAL RETURN(d) | 0.84 | % | 1.36 | % | 4.96 | % | 1.80 | % | ||||||||
RATIOS/SUPPLEMENTAL DATA | ||||||||||||||||
Net assets, End of Period (000s) | $ | 3,031 | $ | 4,149 | $ | 3,195 | $ | 951 | ||||||||
RATIOS TO AVERAGE NET ASSETS: | ||||||||||||||||
Operating expenses excluding reimbursement/waiver(e) | 5.14%(f) | (g) | 4.85% | (g) | 5.87 | % | 19.86% | (f) | ||||||||
Operating expenses including reimbursement/waiver(e) | 1.63%(f) | (g) | 1.73% | (g) | 1.90 | % | 1.90% | (f) | ||||||||
Net investment loss including reimbursement/waiver(e) | (0.82)% | (f) | (0.35) | % | (0.23) | % | (1.78)% | (f) | ||||||||
PORTFOLIO TURNOVER RATE | 30% | (h) | 91 | % | 25 | % | 13% | (h) | ||||||||
| (a) | The Fund’s inception was December 30, 2011. |
| (b) | Calculated using the average shares method. |
| (c) | Less than $0.005 per share. |
| (d) | Total investment return is calculated assuming a purchase of a common share at the opening of the first day and a sale at closing on the last day of each period reported. Dividends and distributions, if any, are assumed for purposes of this calculation to be reinvested at prices obtained under the Fund’s dividend reinvestment plan. Total returns would have been lower had certain expenses not been waived during the period. Total investment returns do not reflect brokerage commissions, if any, and are not annualized. |
| (e) | The ratios exclude the impact of expenses of the underlying funds in which the Fund invests as represented in the Schedule of Investments. |
| (f) | Annualized. |
| (g) | Dividend and interest expense on securities sold short totaled 0.11% (annualized) and 0.08% of average net assets for the six months ended October 31, 2014 and the year ended April 30, 2014, respectively. |
| (h) | Not Annualized. |
See Notes to Financial Statements.
56 |
www.redmontfunds.com |
Table of Contents
| Redmont Resolute Fund II | Financial Highlights | |
For a share outstanding throughout the periods presented |
| CLASS I | ||||||||||||||||
| For the | ||||||||||||||||
| Six Months Ended | For the | For the | For the | |||||||||||||
| October 31, 2014 | Year Ended | Year Ended | Period Ended | |||||||||||||
| (Unaudited) | April 30, 2014 | April 30, 2013 | April 30, 2012(a) | |||||||||||||
NET ASSET VALUE, BEGINNING OF PERIOD | $ | 11.18 | $ | 11.05 | $ | 10.34 | $ | 10.00 | ||||||||
INCOME/(LOSS) FROM OPERATIONS | ||||||||||||||||
Net investment income/(loss)(b) | 0.03 | 0.13 | 0.11 | (0.03) | ||||||||||||
Net realized and unrealized gain on investments | 0.11 | 0.19 | 0.68 | 0.37 | ||||||||||||
|
|
|
|
|
|
|
| |||||||||
Total from Investment Operations | 0.14 | 0.32 | 0.79 | 0.34 | ||||||||||||
|
|
|
|
|
|
|
| |||||||||
LESS DISTRIBUTIONS | ||||||||||||||||
Net investment income | – | (0.11) | (0.08) | – | ||||||||||||
Net realized gain on investments | – | (0.08) | – | – | ||||||||||||
|
|
|
|
|
|
|
| |||||||||
Total Distributions | – | (0.19) | (0.08) | – | ||||||||||||
|
|
|
|
|
|
|
| |||||||||
NET INCREASE IN NET ASSET VALUE | 0.14 | 0.13 | 0.71 | 0.34 | ||||||||||||
|
|
|
|
|
|
|
| |||||||||
NET ASSET VALUE, END OF PERIOD | $ | 11.32 | $ | 11.18 | $ | 11.05 | $ | 10.34 | ||||||||
|
|
|
|
|
|
|
| |||||||||
TOTAL RETURN(c) | 1.25 | % | 2.85 | % | 7.65 | % | 3.40 | % | ||||||||
RATIOS/SUPPLEMENTAL DATA | ||||||||||||||||
Net assets, End of Period (000s) | $ | 656,633 | $ | 604,949 | $ | 446,319 | $ | 78,498 | ||||||||
RATIOS TO AVERAGE NET ASSETS: | ||||||||||||||||
Operating expenses excluding reimbursement/waiver(d) | 1.69%(e) | (f) | 1.69% | (f) | 1.32 | % | 1.63% | (e) | ||||||||
Operating expenses including reimbursement/waiver(d) | 0.30%(e) | (f) | 0.29% | (f) | 0.22 | % | 1.13% | (e) | ||||||||
Net investment income/(loss) including reimbursement/waiver(d) | 0.48% | (e) | 1.19 | % | 1.08 | % | (0.97)% | (e) | ||||||||
PORTFOLIO TURNOVER RATE | 28% | (g) | 114 | % | 51 | % | 18% | (g) | ||||||||
| (a) | The Fund’s inception was December 30, 2011. |
| (b) | Calculated using the average shares method. |
| (c) | Total investment return is calculated assuming a purchase of a common share at the opening of the first day and a sale at closing on the last day of each period reported. Dividends and distributions, if any, are assumed for purposes of this calculation to be reinvested at prices obtained under the Fund’s dividend reinvestment plan. Total returns would have been lower had certain expenses not been waived during the period. Total investment returns do not reflect brokerage commissions, if any, and are not annualized. |
| (d) | The ratios exclude the impact of expenses of the underlying funds in which the Fund invests as represented in the Schedule of Investments. |
| (e) | Annualized. |
| (f) | Dividend and interest expense on securities sold short totaled 0.10% (annualized) and 0.08% of average net assets for the six months ended October 31, 2014 and the year ended April 30, 2014, respectively. |
| (g) | Not Annualized. |
See Notes to Financial Statements.
| Semi-Annual Report | October 31, 2014 | 57 |
Table of Contents
| Redmont Funds | Notes to Financial Statements | |
October 31, 2014 (Unaudited) |
1. ORGANIZATION
Financial Investors Trust (the “Trust”), a Delaware statutory trust, is an open-end management investment company registered under the Investment Company Act of 1940, as amended (“1940 Act”). As of October 31, 2014, the Trust has 32 registered funds. This semi-annual report describes the Redmont Resolute Fund I and Redmont Resolute Fund II (each a “Fund” and collectively, the “Funds”). The Funds seek to provide long-term total return with reduced volatility and reduced correlation to the conventional stock and bond markets. The Redmont Resolute Fund I offers Class A and Class I shares and the Redmont Resolute Fund II offers Class I shares. All classes of shares of a particular Fund have identical rights to earnings, assets and voting privileges, except for class specific expenses and exclusive rights to vote on matters affecting only individual classes.
2. SIGNIFICANT ACCOUNTING POLICIES
The accompanying financial statements were prepared in accordance with accounting principles generally accepted in the United States of America (“U.S. GAAP”). The preparation of financial statements in conformity with U.S. GAAP requires management to make certain estimates and assumptions that affect the reported amounts of assets and liabilities and disclosures of contingent assets and liabilities at the date of the financial statements and the reported amounts of revenue and expenses during the period. Actual results could differ from those estimates. The Funds are considered an investment company for financial reporting purposes under GAAP. The following is a summary of significant accounting policies consistently followed by the Funds in preparation of their financial statements.
Investment Valuation: The Funds generally value their securities based on market prices determined at the close of regular trading on the New York Stock Exchange (“NYSE”), normally 4:00 p.m. Eastern Time, on each day the NYSE is open for trading.
For equity securities and mutual funds that are traded on an exchange, the market price is usually the closing sale or official closing price on that exchange. In the case of equity securities not traded on an exchange, or if such closing prices are not otherwise available, the securities are valued at the mean of the most recent bid and ask prices on such day. Redeemable securities issued by open-end registered investment companies are valued at the investment company’s applicable net asset value, with the exception of exchange-traded open-end investment companies, which are priced as equity securities.
The market price for debt obligations is generally the price supplied by an independent third-party pricing service approved by the Board of Trustees (the “Board”), which may use a matrix, formula or other objective method that takes into consideration quotations from dealers, market transactions in comparable investments, market indices and yield curves. If vendors are unable to supply a price, or if the price supplied is deemed to be unreliable, the market price may be determined using quotations received from one or more brokers–dealers that make a market in the security. Short–term debt obligations that will mature in 60 days or less are valued at amortized cost, unless it is determined that using this method would not reflect an investment’s fair value.
Each Fund may pay or receive cash as collateral on these contracts which may be recorded as an asset and/or liability. The Fund must set aside liquid assets, or engage in other appropriate measures, to cover its obligations under these contracts. Swaps are marked to market daily using either pricing vendor quotations, counterparty prices or model prices and the change in value, if any, is recorded as an unrealized gain or loss. Upfront payments made and/or received by the Fund are recorded as an asset and/or liability and realized gains or losses are recognized ratably over the contract’s term/event, with the exception of forward starting interest rate swaps, whose realized gains or losses are recognized ratably from the effective start date. Periodic payments received or made on swap contracts are recorded as realized gains or losses. Gains or losses are realized upon termination of a swap contract and are recorded on the Statements of Operations.
When such prices or quotations are not available, or when the Fair Value Committee appointed by the Board believes that they are unreliable, securities may be priced using fair value procedures approved by the Board.
Fair Value Measurements: The Funds disclose the classification of their fair value measurements following a three-tier hierarchy based on the inputs used to measure fair value. Inputs refer broadly to the assumptions that market participants would use in pricing the asset or liability, including assumptions about risk. Inputs may be observable or unobservable. Observable inputs reflect the assumptions market participants would use in pricing the asset or liability that are developed based on market data obtained from sources independent of the reporting entity. Unobservable inputs reflect the reporting entity’s own assumptions about the assumptions market participants would use in pricing the asset or liability that are developed based on the best information available.
58 |
www.redmontfunds.com |
Table of Contents
| Redmont Funds | Notes to Financial Statements | |
October 31, 2014 (Unaudited) |
Various inputs are used in determining the value of the Funds’ investments as of the end of the reporting period. When inputs used fall into different levels of the fair value hierarchy, the level in the hierarchy within which the fair value measurement falls is determined based on the lowest level input that is significant to the fair value measurement in its entirety. The designated input levels are not necessarily an indication of the risk or liquidity associated with these investments. These inputs are categorized in the following hierarchy under applicable financial accounting standards:
Level 1 – | Unadjusted quoted prices in active markets for identical investments, unrestricted assets or liabilities that the Funds have the ability to access at the measurement date; | |
Level 2 – | Quoted prices which are not active, quoted prices for similar assets or liabilities in active markets or inputs other than quoted prices that are observable (either directly or indirectly) for substantially the full term of the asset or liability; and | |
Level 3 – | Significant unobservable prices or inputs (including the Funds’ own assumptions in determining the fair value of investments) where there is little or no market activity for the asset or liability at the measurement date. | |
The following is a summary of the inputs used to value the Funds’ investments as of October 31, 2014:
Redmont Resolute Fund I
| Investments in Securities at Value | Level 1 - Quoted Prices | Level 2 - Other Significant Observable Inputs | Level 3 - Significant Unobservable Inputs | Total | ||||||||||||
| ||||||||||||||||
Common Stocks* | $ | 348,279 | $ | – | $ | – | $ | 348,279 | ||||||||
Exchange Traded Funds | 291,429 | – | – | 291,429 | ||||||||||||
Exchange Traded Notes | 12,384 | – | – | 12,384 | ||||||||||||
Limited Partnerships* | 564 | – | – | 564 | ||||||||||||
Open-End Mutual Funds | 1,775,309 | – | – | 1,775,309 | ||||||||||||
Short Term Investments | ||||||||||||||||
Money Market Fund | 102,957 | – | – | 102,957 | ||||||||||||
U.S. Treasury Bills | – | 2,000 | – | 2,000 | ||||||||||||
| ||||||||||||||||
Total | $ | 2,530,922 | $ | 2,000 | $ | – | $ | 2,532,922 | ||||||||
| ||||||||||||||||
Other Financial Instruments | ||||||||||||||||
| ||||||||||||||||
Assets: | ||||||||||||||||
Futures Contracts | $ | 1,333 | $ | – | $ | – | $ | 1,333 | ||||||||
Total Return Swap Contracts | – | 7,872 | – | 7,872 | ||||||||||||
Liabilities: | ||||||||||||||||
Common Stocks* | (159,185) | – | – | (159,185) | ||||||||||||
Exchange Traded Funds | (1,930) | – | – | (1,930) | ||||||||||||
Limited Partnerships* | (1,354) | – | – | (1,354) | ||||||||||||
| ||||||||||||||||
Total | $ | (161,136) | $ | 7,872 | $ | – | $ | (153,264) | ||||||||
| ||||||||||||||||
Redmont Resolute Fund II | ||||||||||||||||
| Investments in Securities at Value | Level 1 - Quoted Prices | Level 2 - Other Significant | Level 3 - Significant Unobservable Inputs | Total | ||||||||||||
| ||||||||||||||||
Common Stocks* | $ | 91,882,471 | $ | – | $ | – | $ | 91,882,471 | ||||||||
Exchange Traded Funds | 5,558,723 | – | – | 5,558,723 | ||||||||||||
Limited Partnerships* | 92,294 | – | – | 92,294 | ||||||||||||
Open-End Mutual Funds | 438,233,456 | – | – | 438,233,456 | ||||||||||||
Preferred Stocks* | 104,514 | – | – | 104,514 | ||||||||||||
Corporate Bonds | – | 8,045,548 | – | 8,045,548 | ||||||||||||
Foreign Government Bonds | – | 261,353 | – | 261,353 | ||||||||||||
Government Bonds | – | 724,742 | – | 724,742 | ||||||||||||
Short Term Investments | ||||||||||||||||
Money Market Fund | 7,533,639 | – | – | 7,533,639 | ||||||||||||
U.S. Treasury Bills | – | 1,344,858 | – | 1,344,858 | ||||||||||||
| ||||||||||||||||
Total | $ | 543,405,097 | $ | 10,376,501 | $ | – | $ | 553,781,598 | ||||||||
| ||||||||||||||||
| Semi-Annual Report | October 31, 2014 | 59 |
Table of Contents
| Redmont Funds | Notes to Financial Statements | |
October 31, 2014 (Unaudited) |
Other Financial Instruments | ||||||||||||||||
| ||||||||||||||||
Assets: | ||||||||||||||||
Futures Contracts | $ | 1,465,310 | $ | – | $ | – | $ | 1,465,310 | ||||||||
Total Return Swap Contracts | – | 1,320,492 | – | 1,320,492 | ||||||||||||
Liabilities: | ||||||||||||||||
Common Stocks* | (25,894,891) | – | – | (25,894,891) | ||||||||||||
Exchange Traded Funds | (313,712) | – | – | (313,712) | ||||||||||||
Limited Partnerships* | (225,972) | – | – | (225,972) | ||||||||||||
Written Options | (37,570) | – | – | (37,570) | ||||||||||||
Futures Contracts | (177,432) | – | – | (177,432) | ||||||||||||
| ||||||||||||||||
Total | $ | (25,184,267) | $ | 1,320,492 | $ | – | $ | (23,863,775) | ||||||||
| ||||||||||||||||
| * | For detailed descriptions, see the accompanying Schedule of Investments. |
The Funds recognize transfers between levels as of the end of the period. For the six months ended October 31, 2014, the Funds did not have any transfers between Level 1 and Level 2 securities. There were no Level 3 securities held during the period.
Trust Expenses: Some expenses of the Trust can be directly attributed to the Funds. Expenses which cannot be directly attributed to the Funds are apportioned among all funds in the Trust based on average net assets of each fund.
Fund and Class Expenses: Expenses that are specific to a Fund or class of shares of a Fund are charged directly to that Fund or share class. Expenses that are common to all Funds generally are allocated among the Funds in proportion to their average daily net assets. Fees provided under the distribution (Rule 12b-1) and/or shareholder service plans for a particular class of the Fund are charged to the operations of such class.
Federal Income Taxes: The Funds comply with the requirements under Subchapter M of the Internal Revenue Code of 1986, as amended, applicable to regulated investment companies and intend to distribute substantially all of their net taxable income and net capital gains, if any, each year so that the Funds will not be subject to excise tax on undistributed income and gains. The Funds are not subject to income taxes to the extent such distributions are made.
As of and during the six months ended October 31, 2014, the Funds did not have a liability for any unrecognized tax benefits. The Funds file U.S. federal, state, and local tax returns as required. The Funds’ tax returns are subject to examination by the relevant tax authorities until expiration of the applicable statute of limitations, which is generally three years after the filing of the tax return for federal purposes and four years for most state returns. Tax returns for open years have incorporated no uncertain tax positions that require a provision for income taxes.
Investment Transactions and Investment Income: Investment transactions are accounted for on the date the investments are purchased or sold (trade date basis). Net realized gains and losses from investment transactions are reported on an identified cost basis. Interest income, which includes accretion of discounts and amortization of premiums, is accrued and recorded as earned. Dividend income is recognized on the ex-dividend date or for certain foreign securities, as soon as information is available to the Funds. All of the realized and unrealized gains and losses and net investment income, are allocated daily to each class in proportion its average daily net assets.
Short Sales: Each Fund may make short sales of securities consistent with its strategies. A short sale is a transaction in which a Fund sells a security it does not own in anticipation that the market price of that security will decline.
When a Fund makes a short sale, it must borrow the security sold short and deliver it to the broker dealer through which it made the short sale as collateral for its obligation to deliver the security upon conclusion of the sale. The Fund may have to pay a fee to borrow particular securities and is often obligated to pay over any accrued interest and dividends on such borrowed securities.
If the price of the security sold short increases between the time of the short sale and the time that a Fund replaces the borrowed security, the Fund will incur a loss; conversely, if the price declines, the Fund will realize a capital gain. Any gain will be decreased, and any loss increased, by the transaction costs described above. The successful use of short selling may be adversely affected by imperfect correlation between movements in the price of the security sold short and the securities being hedged.
To the extent that a Fund engages in short sales, it will provide collateral to the broker-dealer and (except in the case of short sales “against the box”) will maintain additional asset coverage in the form of segregated or “earmarked” assets determined to be liquid in accordance with procedures established by the Board and that is equal to the current market value of the securities sold short, or will ensure that such positions are
60 |
www.redmontfunds.com |
Table of Contents
| Redmont Funds | Notes to Financial Statements | |
October 31, 2014 (Unaudited) |
covered by “offsetting” positions, until the Fund replaces the borrowed security. A short sale is “against the box” to the extent that the Fund contemporaneously owns, or has the right to obtain at no added cost, securities identical to those sold short. Each Fund may engage in short selling to the extent permitted by the federal securities laws and rules and interpretations thereunder. To the extent a Fund engages in short selling in foreign (non-U.S.) jurisdictions, the Fund will do so to the extent permitted by the laws and regulations of such jurisdiction.
Distributions to Shareholders: Each Fund normally pays dividends and distributes capital gains, if any, on an annual basis. Income dividend distributions are derived from interest and other income each Fund receives from their investments, including distributions of short term capital gains. Capital gain distributions are derived from gains realized when each Fund sells a security it has owned for more than a year. Each Fund may make additional distributions and dividends at other times if its portfolio manager or managers believe doing so may be necessary for each Fund to avoid or reduce taxes.
3. DERIVATIVE INSTRUMENTS
Swap Contracts: Each Fund may enter into swap transactions for hedging purposes or to seek to increase total return. At the present time, the Funds primarily enter into swap transactions for the purpose of increasing total return. Risks may arise as a result of the failure of the counterparty to the swap contract to comply with the terms of the swap contract. The loss incurred by the failure of a counterparty is generally limited to the net payment to be received by the Funds and/or the termination value at the end of the contract.
Therefore, the Funds consider the creditworthiness of each counterparty to a contract in evaluating potential credit risk. Additionally, risks may arise from unanticipated movements in interest rates or in the value of the underlying reference asset or index. Entering into these agreements involves, to varying degrees, market risk, liquidity risk and elements of credit, legal and documentation risk that are not directly reflected in the amounts recognized in the Statements of Assets and Liabilities.
Each Fund invests in total return swaps to obtain exposure to a security or market without owning such security or investing directly in that market or to transfer the risk/return of one market (e.g., fixed income) to another market (e.g., equity) (equity risk and/or interest rate risk). Total return swaps are agreements in which there is an exchange of cash flows whereby one party commits to make payments based on the total return (coupons plus capital gains/losses) of an underlying instrument in exchange for fixed or floating rate interest payments. To the extent the total return of the instrument or index underlying the transaction exceeds or falls short of the offsetting interest rate obligation, the Fund will receive a payment from or make a payment to the counterparty. Swap agreements held at October 31, 2014 are disclosed in the Schedule of Investments.
International Swaps and Derivatives Association, Inc. Master Agreements (“ISDA Master Agreements”) govern OTC financial derivative transactions entered into by the Funds and those counterparties. The ISDA Master Agreements maintain provisions for general obligations, representations, agreements, collateral and events of default or termination. Events of termination include conditions that may entitle counterparties to elect to terminate early and cause settlement of all outstanding transactions under the applicable ISDA Master Agreement. Any election to early terminate could be material to the financial statements.
The number of swap contracts held at October 31, 2014 is representative of the swap contract activity for the six months ended October 31, 2014.
Option Contracts: Each Fund may enter into options transactions for hedging purposes and for non-hedging purposes such as seeking to enhance return. Each Fund may write covered put and call options on any stocks or stock indices, currencies traded on domestic and foreign securities exchanges, or futures contracts on stock indices, interest rates and currencies traded on domestic and, to the extent permitted by the CFTC, foreign exchanges. A call option on an asset written by a Fund obligates the Fund to sell the specified asset to the holder (purchaser) at a stated price (the exercise price) if the option is exercised before a specified date (the expiration date). A put option on an asset written by a Fund obligates the Fund to buy the specified asset from the purchaser at the exercise price if the option is exercised before the expiration date. Premiums received when writing options are recorded as liabilities and are subsequently adjusted to the current value of the options written. Premiums received from writing options that expire are treated as realized gains. Premiums received from writing options, which are either exercised or closed, are offset against the proceeds received or amount paid on the transaction to determine realized gains or losses which are recorded on the Statement of Operations.
Futures: Each Fund may enter into futures contracts for hedging purposes. A futures contract represents a commitment for the future purchase or sale of an asset at a specified price on a specified date. Upon entering into a futures contract, the Fund is required to deposit an initial margin with the broker in an amount equal to a certain percentage of the contract amount. The Fund receives from or pays to the broker, on a daily basis, an amount of cash equal to the daily fluctuation in value of the contract. Such receipts or payments are known as “variation margin,” and are recorded by the Fund as unrealized gains or losses. When the futures contract is closed, the Fund records a gain or loss equal to the difference between the value of the contract at the time it was opened and the value at the time it was closed.
A Fund’s potential losses from the use of futures extend beyond its initial investment in such contracts. The use of futures contracts involves, to varying degrees, elements of market risk in excess of the amount recognized in the Statements of Assets and Liabilities. The predominant risk is that the movement of a futures contract’s price may result in a loss, which could render a Fund’s hedging strategy unsuccessful. There is minimal
| Semi-Annual Report | October 31, 2014 | 61 |
Table of Contents
| Redmont Funds | Notes to Financial Statements | |
October 31, 2014 (Unaudited) |
counterparty credit risk since futures contracts are exchange traded and the exchange’s clearinghouse, as counterparty to all exchange traded futures, guarantees the futures against default.
Written option activity for the six months ended October 31, 2014 was as follows:
Redmont Resolute Fund II | ||||||||||||
| Written Call Options | ||||||||||||
| Contracts | Premiums | ||||||||||
Outstanding, April 30, 2014 | (121) | $ | 55,327 | |||||||||
Written | (164) | 75,622 | ||||||||||
Covered | 27 | (17,575 | ) | |||||||||
Exercised | 121 | (55,327 | ) | |||||||||
Expired | 49 | (25,727 | ) | |||||||||
Outstanding, October 31, 2014 | (88) | $ | 32,320 | |||||||||
Risk Exposure: The following tables disclose the amounts related to each Fund’s use of derivative instruments.
The effect of derivatives instruments on the Statements of Assets and Liabilities as of October 31, 2014:
| Risk Exposure | Asset Derivatives Statements of Assets and Liabilities Location | Fair Value | Liability Derivatives Statements of Assets and Liabilities Location | Fair Value | ||||||||
| ||||||||||||
Redmont Resolute Fund I | ||||||||||||
Equity Contracts (Total Return Swap Contracts) | Unrealized appreciation on | $ | 7,872 | Unrealized depreciation on | $ | – | ||||||
total return swap contracts | total return swap contracts | |||||||||||
Futures Contracts* | Variation margin receivable | 1,333 | Variation margin payable | – | ||||||||
| ||||||||||||
Total | $ | 9,205 | $ | – | ||||||||
| ||||||||||||
* Risk Exposure to Fund | ||||||||||||
Domestic Currency Contracts | $ | 1,333 | $ | – | ||||||||
|
| |||||||||||
| $ | 1,333 | $ | – | |||||||||
|
| |||||||||||
| Risk Exposure | Asset Derivatives Statements of Assets and Liabilities Location | Fair Value | Liability Derivatives Statements of Assets and Liabilities Location | Fair Value | ||||||||
| ||||||||||||
Redmont Resolute Fund II | ||||||||||||
Equity Contracts (Total Return Swap Contracts) | Unrealized appreciation on | $ | 1,320,492 | Unrealized depreciation on | $ | – | ||||||
total return swap contracts | total return swap contracts | |||||||||||
Equity Contracts (Written Options) | N/A | N/A | Written options, at value | 37,570 | ||||||||
Futures Contracts* | Variation margin receivable | 1,465,310 | Variation margin payable | 177,432 | ||||||||
| ||||||||||||
Total | $ | 2,785,802 | $ | 215,002 | ||||||||
| ||||||||||||
* Risk Exposure to Fund | ||||||||||||
Equity Contracts | $ | 742,497 | $ | 151,236 | ||||||||
Fixed Income Contracts | 182,707 | 4,584 | ||||||||||
Foreign Currency Contracts | 540,106 | 21,612 | ||||||||||
|
| |||||||||||
| $ | 1,465,310 | $ | 177,432 | |||||||||
|
| |||||||||||
62 |
www.redmontfunds.com |
Table of Contents
| Redmont Funds | Notes to Financial Statements | |
October 31, 2014 (Unaudited) |
The effect of derivatives instruments on the Statements of Operations for the six months ended October 31, 2014:
| Risk Exposure | Statement of Operations Location | Realized Gain/(Loss) on Derivatives Recognized in Income | Change in Unrealized Appreciation on Derivatives Recognized in Income | |||||||
| ||||||||||
Redmont Resolute Fund I | ||||||||||
Equity Contracts | Net realized loss on total return swap contracts/Net change in unrealized appreciation on total return swap contracts | $ | (1,507) | $ | 6,637 | |||||
Futures Contracts* | Net realized gain/(loss) on futures contracts/Net change in unrealized appreciation on futures contracts | N/A | 1,333 | |||||||
| ||||||||||
Total | $ | (1,507) | $ | 7,970 | ||||||
| ||||||||||
*Risk Exposure to Fund | ||||||||||
Domestic Currency Contracts | $ | N/A | $ | 1,333 | ||||||
|
| |||||||||
| $ | N/A | $ | 1,333 | |||||||
|
| |||||||||
Redmont Resolute Fund II | ||||||||||
Equity Contracts | Net realized loss on total return swap contracts/Net change in unrealized appreciation on total return swap contracts | $ | (151,157) | $ | 1,111,286 | |||||
Equity Contracts (Written Options) | Net realized gain on written options/Net change in unrealized appreciation on written options | 15,776 | 40,503 | |||||||
Futures Contracts* | Net realized gain/(loss) on futures contracts/Net change in unrealized appreciation on futures contracts | N/A | 1,287,878 | |||||||
| ||||||||||
Total | $ | (135,381) | $ | 2,439,667 | ||||||
| ||||||||||
*Risk Exposure to Fund | ||||||||||
Equity Contracts | $ | N/A | $ | 591,261 | ||||||
Fixed Income Contracts | N/A | 178,123 | ||||||||
Foreign Currency Contracts | N/A | 518,494 | ||||||||
|
| |||||||||
| $ | N/A | $ | 1,287,878 | |||||||
|
| |||||||||
| * | Reflects cumulative unrealized appreciation (depreciation) of futures contracts as reported in the Schedule of Investments. |
Certain derivative contracts and repurchase agreements are executed under either standardized netting agreements or, for exchange-traded derivatives, the relevant contracts for a particular exchange which contain enforceable netting provisions. A derivative netting arrangement creates an enforceable right of set-off that becomes effective, and affects the realization of settlement on individual assets, liabilities and collateral amounts, only following a specified event of default or early termination. Default events may include the failure to make payments or deliver securities timely, material adverse changes in financial condition or insolvency, the breach of minimum regulatory capital requirements, or loss of license, charter or other legal authorization necessary to perform under the contract.
| Semi-Annual Report | October 31, 2014 | 63 |
Table of Contents
| Redmont Funds | Notes to Financial Statements | |
October 31, 2014 (Unaudited) |
The following table presents financial instruments that are subject to enforceable netting arrangements or other similar agreements as of October 31, 2014:
Redmont Resolute Fund I
Offsetting of Derivatives Assets
Gross Amounts Not Offset in the Statement of Financial Position | ||||||||||||||||||||||||
|
| |||||||||||||||||||||||
| Description | Gross Amounts of Recognized Assets | Gross Amounts Offset in the Statement of Financial Position | Net Amounts Financial Position | Financial Instruments Available for Offset | Cash Collateral Received | Net Receivable Amount | ||||||||||||||||||
| ||||||||||||||||||||||||
Total Return Swap Contracts | $ | 7,872 | $ | – | $ | 7,872 | $ | – | $ | – | $ | 7,872 | ||||||||||||
| ||||||||||||||||||||||||
Total | $ | 7,872 | $ | – | $ | 7,872 | $ | – | $ | – | $ | 7,872 | ||||||||||||
| ||||||||||||||||||||||||
Redmont Resolute Fund II |
| |||||||||||||||||||||||
Offsetting of Derivatives Assets |
| |||||||||||||||||||||||
Gross Amounts Not Offset in the Statement of Financial Position | ||||||||||||||||||||||||
|
| |||||||||||||||||||||||
| Description | Gross Amounts of Recognized Assets | Gross Amounts Offset in the Statement of Financial Position | Net Amounts Financial Position | Financial Instruments Available for Offset | Cash Collateral Received | Net Receivable Amount | ||||||||||||||||||
| ||||||||||||||||||||||||
Total Return Swap Contracts | $ | 1,320,492 | $ | – | $ | 1,320,492 | $ | – | $ | – | $ | 1,320,492 | ||||||||||||
| ||||||||||||||||||||||||
Total | $ | 1,320,492 | $ | – | $ | 1,320,492 | $ | – | $ | – | $ | 1,320,492 | ||||||||||||
| ||||||||||||||||||||||||
4. TAX BASIS INFORMATION
Tax Basis of Investments: As of October 31, 2014, the aggregate cost of investments, gross unrealized appreciation/(depreciation) and net unrealized appreciation for Federal tax purposes were as follows:
| Gross Appreciation (excess of value over tax cost) | Gross Depreciation (excess of tax cost over value) | Net Unrealized Appreciation | Cost of Investments for Income Tax Purposes | |||||||||||||
| ||||||||||||||||
Redmont Resolute Fund I | $ | 202,653 | $ | (6,526 | ) | $ | 196,127 | $ | 2,336,795 | |||||||
Redmont Resolute Fund II | 37,168,567 | (3,180,144 | ) | 33,988,423 | 519,793,175 | |||||||||||
Tax Basis of Distributions to Shareholders: The character of distributions made during the year from net investment income or net realized gains may differ from its ultimate characterization for federal income tax purposes. Also, due to the timing of dividend distributions, the fiscal year in which amounts are distributed may differ from the fiscal year in which the income or realized gain were recorded by the Funds.
The tax character of distributions paid by the Funds for the fiscal year ended April 30, 2014, were as follows:
| Ordinary Income | Long-Term Capital Gains | |||||||
| ||||||||
Redmont Resolute Fund I | $ | 24,591 | $ | 11,558 | ||||
Redmont Resolute Fund II | 8,831,574 | 2,442,467 | ||||||
For the six months ended October 31, 2014, there were no distributions paid.
64 |
www.redmontfunds.com |
Table of Contents
| Redmont Funds | Notes to Financial Statements | |
October 31, 2014 (Unaudited) |
5. SECURITIES TRANSACTIONS
Purchases and sales of securities, excluding short-term securities and U.S. Government Obligations during the six months ended October 31, 2014 were as follows:
| Fund | Purchases of Securities | Proceeds From Sales of Securities | ||||||
| ||||||||
Redmont Resolute Fund I | $ | 890,585 | $ | 1,901,682 | ||||
Redmont Resolute Fund II | 209,277,052 | 147,258,350 | ||||||
Purchases and sales of U.S. Government Obligations during the six months ended October 31, 2014 were as follows:
| Fund | Purchases of Securities | Proceeds From Sales of Securities | ||||||
| ||||||||
Redmont Resolute Fund I | $ | – | $ | – | ||||
Redmont Resolute Fund II | 1,024,593 | 35,251 | ||||||
6. BENEFICIAL SHARE TRANSACTIONS
The capitalization of the Trust consists of an unlimited number of shares of beneficial interest with no par value per share. Holders of the shares of the Funds of the Trust have one vote for each share held and a proportionate fraction of a vote for each fractional share. All shares issued and outstanding are fully paid and are non-assessable, transferable and redeemable at the option of the shareholder. Shares have no pre-emptive rights.
Transactions in common shares were as follows:
Redmont Resolute Fund I
| Class A: | For the Six Months Ended October 31, 2014 (Unaudited) | For the Year Ended | ||||||
| ||||||||
Common Shares Outstanding - Beginning of Period | 9,794 | 2,016 | ||||||
Common Shares Sold | 496 | 7,751 | ||||||
Common Shares Issued as Reinvestment of Dividends | – | 27 | ||||||
Common Shares Redeemed | (1,933) | – | ||||||
| ||||||||
Common Shares Outstanding - End of Period | 8,357 | 9,794 | ||||||
| ||||||||
| Class I: | For the Six Months Ended October 31, 2014 (Unaudited) | For the Year Ended | ||||||
| ||||||||
Common Shares Outstanding - Beginning of Period | 387,727 | 299,893 | ||||||
Common Shares Sold | 11,004 | 101,486 | ||||||
Common Shares Issued as Reinvestment of Dividends | – | 3,354 | ||||||
Common Shares Redeemed | (117,939) | (17,006) | ||||||
| ||||||||
Common Shares Outstanding - End of Period | 280,792 | 387,727 | ||||||
| ||||||||
Redmont Resolute Fund II | ||||||||
| Class I: | For the Six Months Ended October 31, 2014 (Unaudited) | For the Year Ended April 30, 2014 | ||||||
| ||||||||
Common Shares Outstanding - Beginning of Period | 54,134,098 | 40,383,121 | ||||||
Common Shares Sold | 4,095,015 | 25,080,731 | ||||||
Common Shares Issued as Reinvestment of Dividends | – | 1,013,390 | ||||||
Common Shares Redeemed | (233,959) | (12,343,144) | ||||||
| ||||||||
Common Shares Outstanding - End of Period | 57,995,154 | 54,134,098 | ||||||
| ||||||||
| Semi-Annual Report | October 31, 2014 | 65 |
Table of Contents
| Redmont Funds | Notes to Financial Statements | |
October 31, 2014 (Unaudited) |
Shares redeemed within 30 days of purchase may incur a 2% short-term redemption fee deducted from the redemption amount. Redemption fees are reflected in the “Shares redeemed, net of redemption fees” in the Statements of Changes in Net Assets. For the six months ended October 31, 2014 and the year ended April 30, 2014, the Funds retained fees as follows:
| Fund | For the Six Months Ended October 31, 2014 (Unaudited) | For the Year Ended April 30, 2014 | ||||||||
Redmont Resolute Fund I | $ | 140 | $ | – | ||||||
Redmont Resolute Fund II | – | – | ||||||||
| Fund | For the Year Ended April 30, 2014 | For the Year Ended April 30, 2013 | ||||||||
Redmont Resolute Fund I | $ | – | $ | 51 | ||||||
Redmont Resolute Fund II | – | – | ||||||||
7. MANAGEMENT AND RELATED PARTY TRANSACTIONS
Investment Advisory
Highland Associates, Inc. (“Highland” or the Adviser”), subject to the authority of the Board, is responsible for the overall management and administration of the Funds’ business affairs. Pursuant to the Investment Advisory Agreement (the “Advisory Agreement”), the Adviser is entitled to an investment advisory fee, computed daily and payable monthly of 1.50% of the average daily net assets for each Fund.
As of April 1, 2013, the Adviser entered into an Investment Sub-Advisory Agreement with Robeco Investment Management, Inc. (“Robeco”) and with Pinebridge Investments LLC (“Pinebridge”) as of October 9, 2014. The Investment Sub-Advisory Agreements are in accordance with the Funds’ investment objective, policies and limitations and investment guidelines established jointly by the Adviser and the Board. The Adviser determines the allocation of each Fund’s assets among the Robeco, Pinebridge and Underlying Funds. The Funds are not required to invest with any minimum number of sub-advisers or Underlying Funds, and do not have minimum or maximum limitations with respect to allocations of assets to Robeco and Prinebridge (collectively the “Sub-Advisors”), investment strategy or market sector. Highland may change the allocation of each of the Fund’s assets among the available investment options, and may add or remove sub-advisers, at any time. The Sub-Advisors are responsible for the day-to-day management of its allocated portion of Fund assets. Highland has ultimate responsibility, subject to the oversight of the Board of the Funds, to oversee the Sub-Advisors, and to recommend their hiring, termination and replacement.
Pursuant to the each Investment Sub-Advisory Agreement, the Adviser pays the Sub-Advisors an annual sub-advisory management fee which is based on each Fund’s average quarterly market value of the assets managed by the Sub-Advisors. The Adviser is required to pay all fees due to Sub-Advisors out of the management fee the Adviser receives from each Fund. The following table reflects the Funds’ contractual sub-advisory fee rates.
| Sub-Advisers | Average Daily Market Value of the Fund | Contractual Sub-Advisory Fee | ||
| First $50 Million | 0.55% | |||
Pinebridge Investments LLC | First $50 Million | 0.50% | ||
| First $50 Million | 1.25% | |||
Robeco Investment Management, Inc. | Over $50 Million | 1.00% |
Effective September 1, 2013, the Adviser has agreed, with respect to Redmont Resolute Fund I’s Class A and Class I shares, to contractually to waive the portion of its 1.50% Management Fee in excess of the sum of 0.50% plus any sub-advisory fees paid by the Adviser to the Sub-Advisors, and/or reimburse the Fund (or class, as applicable) by the amount of such excess. In addition, after giving effect to the foregoing fee waiver and/or expense reimbursement, the Adviser has contractually agreed to limit the amount of the Fund’s total annual expenses (exclusive of Distribution and Service (12b-1) Fees, shareholder services fees, swap fees and expenses, acquired fund fees and expenses, sub-advisory fees, brokerage expenses, interest expense, taxes and extraordinary expenses) to 1.40% of the average daily net assets. The agreement is in effect through August 31, 2017. Pursuant to this agreement, the Fund will reimburse the Adviser for any fee waivers and expense reimbursements made by the Adviser, provided that any such reimbursements made by the Fund to the Adviser will not cause the Fund’s expense limitation to exceed expense limitations in existence at the time the expense was incurred, or at the time of the reimbursement, whichever is lower, and the reimbursement is made within three years after the expenses were incurred.
66 |
www.redmontfunds.com |
Table of Contents
| Redmont Funds | Notes to Financial Statements | |
October 31, 2014 (Unaudited) |
Prior to September 1, 2013, the Adviser had contractually agreed to limit the amount of the Redmont Resolute Fund I’s total annual expenses (exclusive of Distribution and Service (12b-1) Fees, shareholder services fees, acquired fund fees and expenses, sub-advisory fees, brokerage expenses, interest expense, taxes and extraordinary expenses) to 1.90% of the average daily net assets.
For the six months ended October 31, 2014, the fee waivers and/or reimbursements were as follows:
| Fees Waived/Reimbursed By Adviser | Recoupment of Previously Waived Fees By Adviser | |||||
Redmont Resolute Fund I - Class A | $ (1,896) | $ | – | |||
Redmont Resolute Fund I - Class I | (61,941) | – | ||||
Redmont Resolute Fund II - Class I | (4,495,135) | – | ||||
As of October 31, 2014, the balances of recoupable expenses for each Fund were as follows:
| Fund | Expires 2017 | Expires 2016 | Expires 2015 | Total | ||||||||||||
Redmont Resolute Fund I – Class A | $ | 801 | $ | 2,377 | $ | 2,270 | $ | 5,448 | ||||||||
Redmont Resolute Fund I – Class I | 83,109 | 61,265 | 30,963 | 175,337 | ||||||||||||
The Adviser has agreed, with respect to the Redmont Resolute Fund II Class I shares, to waive the portion of its 1.50% Management Fee in excess of any sub-advisory fees paid by the Adviser to Sub-Advisors. This agreement is in effect through August 31, 2017.
Fund Accounting Fees and Expenses
ALPS Fund Services, Inc. (“ALPS” and the “Administrator”) (an affiliate of ALPS Distributors, Inc.) provides administrative, fund accounting and other services to the Funds under the Administration, Bookkeeping and Pricing Services Agreement (the “Administrative Agreement”) with the Trust. ALPS is paid fees, accrued on a daily basis and billed on a monthly basis in total and allocated to each Fund, based on the greater of (a) an annual total fee for both Funds of $234,000 from the first to the last, or projected last, day of the then current year of service under the Administrative Agreement; or (b) following basis point fee schedule:
| Average Total Net Assets | Contractual Fee | |||
Between $0-$500M | 0.05% | |||
$500M-$1B | 0.03% | |||
Above $1B | 0.02% |
The Administrator is also reimbursed by the Funds for certain out-of-pocket expenses.
Transfer Agent
ALPS serves as transfer, dividend paying and shareholder servicing agent for the Funds. ALPS receives an annual minimum fee, a fee based upon the number of shareholder accounts, and is also reimbursed by the Funds for certain out-of-pocket expenses.
Compliance Services
ALPS provides services that assist the Trust’s chief compliance officer in monitoring and testing the policies and procedures of the Trust in conjunction with requirements under Rule 38a-1 under the 1940 Act and receives an annual base fee. ALPS is reimbursed for certain out-of-pocket expenses by the Funds.
Principal Financial Officer
ALPS receives an annual fee for providing principal financial officer services to the Funds.
Distributor
ALPS Distributors, Inc. (“ADI” or the “Distributor”) (an affiliate of ALPS) acts as the distributor of the Funds’ shares pursuant to a Distribution Agreement with the Trust. Shares are sold on a continuous basis by ADI as agent for the Funds, and ADI has agreed to use its best efforts to solicit orders for the sale of Funds’ shares, although it is not obliged to sell any particular amount of shares. ADI is not entitled to any compensation for its services as Distributor. ADI is registered as a broker-dealer with the Securities and Exchange Commission.
The Redmont Resolute Fund I has adopted a Distribution and Services Plan (the “Plan”) pursuant to Rule 12b-1 of the 1940 Act for Class A shares. The Plan allows the Fund to use Class A assets to pay fees in connection with the distribution and marketing of Class A shares and/or the provision
| Semi-Annual Report | October 31, 2014 | 67 |
Table of Contents
| Redmont Funds | Notes to Financial Statements | |
October 31, 2014 (Unaudited) |
of shareholder services to Class A shareholders. The Plan permits payment for services in connection with the administration of plans or programs that use Class A shares of the Fund, if any, as their funding medium and for related expenses. The Plan permits the Fund to make total payments at an annual rate of up to 0.25% of the Fund’s average daily net assets attributable to its Class A shares. Because these fees are paid out of the Fund’s Class A assets, if any, on an ongoing basis, over time they will increase the cost of an investment in Class A shares, if any, and Plan fees may cost an investor more than other types of sales charges.
The Redmont Resolute Fund I has adopted a shareholder services plan (“Shareholder Services Plan”) for Class A shares. Under the Shareholder Services Plan the Fund is authorized to pay banks and their affiliates and other institutions, including broker-dealers and Fund affiliates (“Participating Organizations”), an aggregate fee in an amount not to exceed on an annual basis 0.15% for Class A shares of the average daily net asset value of the Class A shares, respectively, attributable to or held in the name of a Participating Organization for its clients as compensation for providing shareholder service activities, which do not include distribution services, pursuant to an agreement with a Participating Organization. Shareholder Services plan fees are included with distribution and service fees on the Statement of Operations.
8. INDEMNIFICATIONS
Under the Trust’s organizational documents, its officers and Trustees are indemnified against certain liability arising out of the performance of their duties to the Trust. Additionally, in the normal course of business, the Trust enters into contracts with service providers that may contain general indemnification clauses which may permit indemnification to the extent permissible under applicable law. The Trust’s maximum exposure under these arrangements is unknown, as this would involve future claims that may be made against the Trust that have not yet occurred.
68 |
www.redmontfunds.com |
Table of Contents
| Redmont Funds | DISCLOSURE REGARDING APPROVAL OF FUND ADVISORY AGREEMENTS | |
October 31, 2014 (Unaudited) |
On September 9, 2014, the Trustees met in person to discuss, among other things, the approval of the investment advisory agreement between the Trust and PineBridge Investments LLC (the “Sub-Advisory Agreement”), in accordance with Section 15(c) of the 1940 Act. The Independent Trustees met with independent legal counsel during executive session and discussed the Sub-Advisory Agreement and other related materials.
In approving the Sub-Advisory Agreement with PineBridge Investments LLC (“PineBridge”), the Trustees, including the Independent Trustees, considered the following factors with respect to Redmont Resolute Fund I and Redmont Resolute Fund II (the “Redmont Funds”):
Investment Advisory Fee Rate: The Trustees reviewed and considered the contractual annual advisory fee rate paid (a) by the Trust, on behalf of each Redmont Fund, to Highland Associates of 1.50% of each Redmont Fund’s daily average net assets, and (b) the contractual annual sub-advisory fee to be paid by Highland Associates to PineBridge of 0.55% of each of the Redmont Fund’s daily average net assets allocated to PineBridge up to $50 million, and 0.50% of each of the Redmont Fund’s daily average net assets allocated to PineBridge above $50 million, in light of the extent and quality of the advisory services to be provided by it to the Redmont Funds.
The Trustees considered the information they received comparing each Redmont Fund’s contractual annual advisory fee and overall expenses with those of funds in both the relevant expense group and universe of funds provided by an independent provider of investment company data.
Based on such information, the Trustees further determined that the fees payable to PineBridge by Highland Associates, bearing in mind the contractual annual advisory fee of 1.50% and the estimated total expense ratios for the Class I and Class A Shares of the Redmont Resolute Fund I, taking into account the contractual fee waiver in place, and the estimated total expense ratio for the Class I Shares of the Redmont Resolute Fund II, taking into account the contractual fee waiver in place, were within an acceptable range.
Nature, Extent and Quality of the Services under the Sub-Advisory Agreement: The Trustees received and considered information regarding the nature, extent and quality of services to be provided to the Redmont Funds under the Sub-Advisory Agreement with PineBridge. The Trustees reviewed certain background materials supplied by PineBridge in its presentations, including their Forms ADV.
The Trustees reviewed and considered PineBridge’s investment advisory personnel, its history as asset managers and its performance and the amount of assets currently under management by it. The Trustees also reviewed the research and decision-making processes utilized by PineBridge, including the methods adopted to seek to achieve compliance with the investment objectives, policies and restrictions of each Redmont Fund.
The Trustees considered the background and experience of PineBridge’s management in connection with the Redmont Funds, including reviewing the qualifications, backgrounds and responsibilities of the management team primarily responsible for the day-to-day portfolio management of the Redmont Funds assets allocated to it and the extent of the resources devoted to research and analysis of actual and potential investments.
The Trustees also reviewed, among other things, PineBridge’s Compliance Manual.
Performance: The Trustees noted that since PineBridge had not yet begun to manage its portion of each Redmont Fund, there is no performance to be reviewed or analyzed at this time. The Trustees considered PineBridge’s reputation generally and its investment techniques, risk management controls and decision-making processes. The Trustees also considered composite returns provided by PineBridge, bearing in mind the limitations of using such data.
Profitability: The Trustees noted that since PineBridge had not yet begun to manage its portion of each Redmont Fund, there is no profitability to be reviewed or analyzed at this time.
Economies of Scale: The Trustees considered whether economies of scale in the provision of services to the Redmont Funds will be passed along to the shareholders under the proposed agreement.
Other Benefits to the Sub-Adviser: The Trustees reviewed and considered any other incidental benefits derived or to be derived by PineBridge from its relationship with the Redmont Funds, including soft dollar arrangements.
| Semi-Annual Report | October 31, 2014 | 69 |
Table of Contents
| Redmont Funds | DISCLOSURE REGARDING APPROVAL OF FUND ADVISORY AGREEMENTS | |
October 31, 2014 (Unaudited) |
The Board summarized its deliberations with respect to the Sub-Advisory Agreement with PineBridge. In selecting PineBridge and the fees charged under the Sub-Advisory Agreement, the Trustees concluded that no single factor reviewed by the Trustees was identified by the Trustees to be determinative as the principal factor in whether to approve the Sub-Advisory Agreement. Further, the Independent Trustees were advised by separate independent legal counsel throughout the process. The Trustees, including all of the Independent Trustees, concluded that:
| — | the contractual investment advisory fees received by Highland Associates with respect to each Redmont Fund were unchanged as a result of entering into these sub-advisory agreements; |
| — | the nature, extent and quality of services to be rendered by PineBridge under the Sub-Advisory Agreement were adequate; |
| — | there was no performance history for PineBridge with respect to the Redmont Funds for the Board to consider; |
| — | since PineBridge had not yet begun to manage its portion of each Redmont Fund, there was no profitability to be reviewed or analyzed; and |
| — | there were no material economies of scale or other incidental benefits accruing to PineBridge in connection with its relationship with the Redmont Funds. |
Based on the Trustees’ deliberations and their evaluation of the information described above, the Trustees, including all of the Independent Trustees, concluded that PineBridge’s compensation for sub-investment advisory services is consistent with the best interests of each Redmont Fund and its shareholders.
70 |
www.redmontfunds.com |
Table of Contents
| Redmont Funds | Additional Information | |
October 31, 2014 (Unaudited) |
1. FUND HOLDINGS
The Funds file their complete schedule of portfolio holdings with the Securities and Exchange Commission (the “SEC”) for the first and third quarters of each fiscal year on Form N-Q within 60 days after the end of the period. Copies of the Funds’ Form N-Q are available without charge on the SEC website at http:// www.sec.gov. You may also review and copy the Form N-Q at the SEC’s Public Reference Room in Washington, D.C. For more information about the operation of the Public Reference Room, please call the SEC at 1-800-SEC-0330.
2. FUND PROXY VOTING POLICIES, PROCEDURES AND SUMMARIES
Fund policies and procedures used in determining how to vote proxies and information regarding how each of the Funds voted proxies relating to portfolio securities during the most recent prior 12-month period ending June 30 are available without charge, (1) upon request, by calling (toll-free) (866) 759-5679 and (2) on the SEC’s website at http://www.sec.gov.
| Semi-Annual Report | October 31, 2014 | 71 |
Table of Contents
| Redmont Funds | Notes | |
| ||
72 |
www.redmontfunds.com |
Table of Contents

Table of Contents
Table of Contents
| 1 | ||||
| 6 | ||||
| 12 | ||||
| 13 | ||||
| 18 | ||||
| 19 | ||||
| 20 | ||||
| 22 | ||||
| 24 | ||||
| 32 | ||||
Table of Contents
Seafarer Overseas Growth and Income Fund
|
| |
| ||
October 31, 2014 | ||
LETTER TO SHAREHOLDERS
November 11, 2014
Dear Fellow Shareholders,
I am pleased to address you once again on behalf of the Seafarer Overseas Growth and Income Fund. This report addresses the first half of the Fund’s fiscal year (May 1 to October 31, 2014).
During the semi-annual period, the Fund gained 2.38%, while the Fund’s benchmark, the MSCI Emerging Markets Total Return Index, rose 3.96%.1 By way of broader comparison, the S&P 500 Index increased 8.22%.
The Fund began the fiscal year with a net asset value of $11.59 per share. In June, the Fund paid a semi-annual distribution of $0.075 per share. That payment brought the cumulative distribution per share, as measured from the Fund’s inception,2 to $0.749. The Fund finished the semi-annual period with a value of $11.79 per share.3
Performance Review
The first half of the fiscal year was marked by substantial swings in the value of both the Fund and the benchmark index.
Initially, both surged higher together: between the close of the prior fiscal year (April 30) and September 3, the Fund and the index gained 7.16% and 12.29%, respectively. However, early September proved to be the near-term peak in the emerging markets. By the end of October, both the Fund and the index had retreated substantially from the highs of September, and each finished the semi-annual period with only modest gains, as noted above.
When markets were rising prior to September, the Fund’s performance lagged its benchmark in part because of what the portfolio held (its Vietnam positions slumped), but mostly because of what it chose to omit (Taiwan technology firms surged, along with China banks, and China and Russia energy companies).
The Fund’s Vietnam holdings had enjoyed a modest degree of outperformance in the first several months of the calendar year, but over the summer, their prices crumbled as hostilities between China and Vietnam escalated. During the past several years, China has grown more assertive in its efforts to explore for oil in the South China Sea. This summer, China declared sovereignty over a section of what had been recognized as the East Vietnam Sea, and promptly inserted an oil rig in the contested waters. Vietnam’s coast guard retaliated by cutting the rig loose from its mooring, and Chinese warships circled. The conflict spilled onshore as Vietnamese protested Chinese presence on the country’s soil, and violent protesters burned or destroyed properties and factories they perceived to be of Chinese ownership. The local stock market plummeted in response, and the Fund’s Vietnam holdings detracted from performance. Seafarer continues to monitor the conflict; at this time, though, I do not believe this event constitutes sufficient grounds to exit the portfolio’s positions, given their strong growth prospects and reasonable valuations.
Meanwhile, the Fund’s lack of exposure to small and mid-size technology companies – mostly located in Taiwan – caused it to lag the benchmark during the market’s run-up. While interesting investments occasionally surface among the sea of smaller technology firms located in and around Taipei, this group of companies in general is not distinguished by sustainable growth. Most companies make components for consumer electronics or computers, and while some grow quickly for a while, often their good fortune is not sustainable, as their products are rapidly commoditized, or as technological evolution renders their products obsolete. Their share prices can jump rapidly higher for a time when their products are in vogue. Nevertheless, I rarely find much that is worthwhile or sustainable in this segment of the market, though there are sometimes exceptions.
Semi-Annual Report | October 31, 2014 | 1 |
Table of Contents
Seafarer Overseas Growth and Income Fund
| Letter to Shareholders
| |
| ||
October 31, 2014 | ||
Chinese equities were spurred higher over the summer for several reasons. First, stock prices had become overly depressed in the spring, and were therefore perhaps poised for a modest recovery, which indeed occurred. Second, the Chinese government had ample cause to provide mild stimulus to the economy, not only to offset slowing growth, but also to facilitate the recovery and recapitalization of the state-backed domestic banking system. Third, markets were cheered by news in early August that a former member of China’s elite politburo had been arrested. Investors took this as a sign that a long-running and wide-ranging anti-graft campaign was near an end – and consequently that politics and economics “as usual” (i.e. growth-oriented policy-making) might soon resume. Together, these three factors sustained Chinese stocks through the late summer.
September’s arrival ended the markets’ run. Early in the month, a series of economic reports indicated that the U.S. economy was growing faster than was broadly anticipated. Economic strength prompted investors to re-evaluate their expectations regarding the pace and magnitude of future interest rate increases, even as the Governors of the Federal Reserve cautioned that “conditions may warrant keeping the target federal funds rate below levels [viewed] as normal” for some time to come.4 The resulting change in expectations brought about a sharp decline in global stock and foreign currency markets.
Around the same time, a number of unwelcome events struck the emerging markets simultaneously. First, economic reports revealed that the Chinese economy was unexpectedly weak, despite the aforementioned stimulus measures introduced over the summer. Second, Brazil’s incumbent president, Dilma Rousseff, won re-election by a narrow margin – and the Brazilian currency (the real) and stocks declined out of fear that Rousseff’s victory would beget further fiscal stress and economic stagnation. Third, geopolitical concerns regarding Russia’s involvement in Ukraine resurfaced, and currency markets weakened after the release of new reports that Russia’s government was contemplating closing its capital account to foreign exchange. All of these events combined to eliminate the gains of the Fund and the index such that both slumped toward the end of the semi-annual period.
The bulk of the Fund’s holdings were unable to escape September’s downdraft, though the Fund fell less rapidly than the index. The Fund’s holdings in Brazil and Turkey weighed heavily on performance: both countries’ stock markets reacted badly to the prospect of higher interest rates, and their respective currencies fell very sharply, too. Of the two markets, Brazil was especially hard-hit, swooning on the re-election of President Rousseff. I acknowledge that both countries’ currencies are somewhat vulnerable in the short run to changing interest rate conditions, yet I am not particularly concerned about currency risks in the context of the Fund’s construction and long-term investment horizon.
If you wish to review a more detailed discussion of the Fund’s performance and holdings, Seafarer publishes four portfolio reviews per year. Each corresponds to a standard calendar quarter. Please visit www.seafarerfunds.com/archives for further information.
The Rise of Value
Note to readers: this section of the Letter to Shareholders is largely repetitive of a similar commentary published in Seafarer’s Portfolio Review for the third quarter of 2014.5 We are re-publishing the contents here because we believe the underlying ideas are important to convey to all shareholders. If you have previously read the aforementioned review, you may wish to skip to the next section of the letter, titled “Some Brief Announcements.”
The recent turmoil in global stock markets places the near-term outlook in sharp focus: where are markets headed next?
In my judgment, valuations within the emerging markets are generally favorable to long-term investors. Offsetting this is the precarious state of the Chinese economy, tepid growth in Europe and Latin America, severe instability in Eastern Europe and the Middle East, and the prospect of substantially higher interest rates in the U.S. Uncertainty prevails.
2 | (855) 732-9220 | seafarerfunds.com |
Table of Contents
Seafarer Overseas Growth and Income Fund
| Letter to Shareholders
| |
| ||
October 31, 2014 | ||
Unfortunately – but as usual – I have no means to determine the near-term direction of markets with any precision. Despite prevailing risks, the Fund’s portfolio holdings are attractive, and thus the Fund remains near full investment – very little cash is held in reserve right now. Yet even as the near-term is murky, I believe the longer-term outlook has recently come into sharper focus. A very important structural change – one that I think has been a long time in coming – has just begun to reshape the investment landscape within the developing world. I think the consequence of this change will play out over the next decade, at a minimum.
Before I explain this change, I need to provide some background. For the past sixteen years, I have subscribed to an investment philosophy that stresses “growth” over “value.” By “value,” I mean an investment approach that places its primary emphasis on the inherent cheapness of a company’s balance sheet, and which places secondary weight on the growth prospect of the company’s income statement. Such cheapness usually stems from an excessive amount of cash on the balance sheet; or assets whose liquidation value exceeds the company’s market capitalization; or operating assets that would become substantially more productive (and therefore more valuable) if in the hands of a more capable owner-operator.
When pursuing “growth,” I have never shunned “value.” On the contrary: I know price matters a great deal. I know that long-term investment success hinges on the pursuit of securities with reasonable prices, and the avoidance of securities with excessive valuations. In abstract, I prefer the concept “value” to “growth.” However, I have built the Fund’s investment strategy around a conservative “growth and income” strategy out of practical necessity. In the past, I have had substantial doubts as to whether a classic “value” strategy could be effectively implemented within the developing world – “value” seemed destined to become a “value trap.” Pursuing a “growth and income” strategy was a viable alternative. The strategy’s exposure to growth would ostensibly generate an underlying, compounding rate of return. The strategy’s focus on generating a reasonable measure of current income was intended to ensure the portfolio of stocks exhibited satisfactory value, and would be less prone to the volatility inherent to the emerging markets.
While I might prefer “value” in abstract, my doubts about it in practice stem from the many structural impediments that the emerging markets present to the pursuit of a classic value investment approach. Most of those impediments are a function of the rudimentary state of the protections afforded passive minority investors, especially foreigners (such as the Fund). In order to realize the value embedded in a cheap balance sheet, a minority investor must often invest patiently for an extended period, awaiting the catalyst that will ultimately unlock the value.
The problem with waiting in the developing world is that most countries lack sufficient legal, financial, accounting and regulatory standards to protect minority investors from abuse by “control parties.” A control party is the dominant owner of a given company. Without appropriate safeguards, minorities have little hope of avoiding exploitation while they wait; nor do they have sufficient legal clout to exert pressure on the control party to accelerate the realization of value. Thus in the past, a prospective “value” investment was more likely to be a “trap” than a source of long-term return. A passive, minority investor in common stock might be forced to wait a very long time before realizing the “value” underpinning the investment – if they realized anything at all.
Other challenges exist for a “value” strategy in the developing world. “Change-of-control” investors – either private equity firms, or operating companies attempting to consolidate their industry – are typically thwarted in their attempts to wrestle control from negligent control parties, thus precluding an important means by which investors might realize “value.” Change-of-control investors usually face legal and cultural barriers that impede their ability to execute hostile takeovers. Incumbent control parties are often secure in their status, benefiting from political patronage, legal systems that hamper takeovers, and guanxi.6 Another historical impediment to takeovers has been the stunted nature of debt capital markets. Capital markets in the developing world have historically been small and shallow. Obviously, leveraged buyouts and other “take private” transactions will struggle if local currency debt markets are not deep enough to provide the requisite capital.
Perhaps the most significant impediment is the relatively minimal presence of large, domestic institutional investors (i.e. pension funds, endowments, and other asset managers) within developing
Semi-Annual Report | October 31, 2014 | 3 |
Table of Contents
Seafarer Overseas Growth and Income Fund
| Letter to Shareholders
| |
| ||
October 31, 2014 | ||
markets. The absence of such institutions can hamper the realization of “value”: institutions with vested economic interests are often critical to ensuring a basic standard of economic discipline and corporate governance within a given market. Furthermore, such institutions usually enjoy as much or more local political clout than the control parties they might seek to discipline; this allows them to exert pressure for better governance in a way that very few foreign investors can. Historically, though, domestic institutional investors have been most notable for their minimal presence, or outright absence. Where such institutions exist, they have been mostly unable or unwilling to exercise their economic power to improve governance and corporate performance. Structural impediments such as these – common throughout the developing world – meant that a classic “value” approach had little chance of success in the past.
Now to the present day: all of this is changing. I believe that the prerequisites for realizing a “value” strategy in developing markets are materializing, slowly but steadily. Accounting standards, for example, have undergone enormous improvements in the past fifteen years. The resulting transparency means that it is much harder for control parties to abuse their position. Legal systems, while still imperfect, enforce much greater equality between shareholders than in the past. This means that minority investors and foreigners are on better footing relative to local investors and incumbent control parties.
Change-of-control investors are beginning to emerge. Private equity, while still small, is much better organized and funded than in the past. Local currency debt markets have mushroomed; they now seem large enough to support takeovers and buyouts efficiently. Perhaps most importantly, large domestic institutions have begun to credibly execute their investment mandates. Political reality has caught up with them: fiscal pressures and looming pension liabilities have forced such institutions to get serious about achieving better returns from their investment portfolios on behalf of their constituents. This in turn has prompted institutions to demand more from wayward companies and their management teams; they expect improved profitability and higher dividends. All of the aforementioned changes suggest the investment landscape has been altered – subtly, but irrevocably. Moreover, I believe the natural evolution of these markets will only magnify and sustain the structural change. The future holds further improvements in accounting and legal standards, the proliferation of change-of-control investors, and the rise of domestic institutional investors.
Taken together, all of these changes suggest the time for “value” has finally arrived in the emerging world. You will see Seafarer explore this approach in the future – though in doing so, the Fund will not deviate in any material way from its “growth and income” strategy. From the Fund’s inception, I have experimented with positions that were heavier on “balance sheet value” and somewhat lighter on “growth and income” than was normal for the strategy. Happily, most of those experiments have borne fruit, and consequently, I plan to expand the Fund’s exposure to “value-heavy / growth-and-income” positions. I believe the rise of “value” will be an important feature of investment in the emerging world for the decade to come.
Some Brief Announcements
I am pleased to report that Seafarer Capital Partners, the investment adviser for your Fund, continues to invest in its own capabilities, as well the cost structure of the Fund itself.
On September 1, Seafarer Capital Partners undertook an expense reduction (known as a “contractual cap”), such that the Fund’s net expenses were reduced to 1.25% for the Investor class and 1.05% for the Institutional class.7 This is the second such expense reduction since the Fund’s inception. In addition, and at the same time, Seafarer Capital Partners reduced its management fee for the Fund from 0.85% to 0.75%. Seafarer’s management fee constitutes a portion of the Fund’s overall expenses, and therefore such fees are subject to the aforementioned expense cap. For further background on these fee reductions, please see the Letter to Shareholders from the Fund’s Annual Report dated April 30, 2014.8
Seafarer’s team continues to grow. In August, we welcomed Sameer Agarwal to the firm. Sameer joins us as a research analyst. His background spans the developing world, with particular emphasis on
4 | (855) 732-9220 | seafarerfunds.com |
Table of Contents
Seafarer Overseas Growth and Income Fund
| Letter to Shareholders
| |
| ||
October 31, 2014 | ||
India, and he is well versed in many valuation techniques and fundamental analyses. He is an excellent complement to our research team.
In September, Daniel Duncan joined the Seafarer team as a Vice President. Daniel leads the firm’s business development and client service efforts. He is the first person within Seafarer to engage in a client-facing role. Daniel and I worked together previously, and over the years he has earned my trust and respect. I am so pleased by the opportunity to work with him again.
Amid the continued volatility that has characterized the emerging markets, we wish to thank you for entrusting us with your patience and your capital. It is an honor to serve as your investment adviser in the emerging markets.
Sincerely,
Andrew Foster
Chief Investment Officer
Seafarer Capital Partners, LLC
The MSCI Emerging Markets Total Return Index, Standard (Large+Mid Cap) Core, Gross (dividends reinvested), USD is a free float-adjusted market capitalization index designed to measure equity market performance of emerging markets. Index code: GDUEEGF. It is not possible to invest directly in this or any index.
The S&P 500 Total Return Index is a stock market index based on the market capitalizations of 500 large companies with common stock listed on the NYSE or NASDAQ. It is not possible to invest directly in this or any index.
The views and information discussed in this commentary are as of the date of publication, are subject to change, and may not reflect the writer’s current views. The views expressed represent an assessment of market conditions at a specific point in time, are opinions only and should not be relied upon as investment advice regarding a particular investment or markets in general. Such information does not constitute a recommendation to buy or sell specific securities or investment vehicles. It should not be assumed that any investment will be profitable or will equal the performance of the portfolios or any securities or any sectors mentioned in this letter. The subject matter contained in this letter has been derived from several sources believed to be reliable and accurate at the time of compilation. Neither Seafarer Capital Partners, LLC nor the Fund accepts any liability for losses either direct or consequential caused by the use of this information.
| 1 | References to the “Fund” pertain to the Fund’s Institutional share class (ticker: SIGIX). The Investor share class (ticker: SFGIX) returned 2.27% during the semi-annual period. |
| 2 | The Fund’s inception date is February 15, 2012. |
| 3 | The Fund’s Investor share class began the fiscal year with a net asset value of $11.58 per share; it paid a semi-annual distribution of $0.072 per share in June; and it finished the semi-annual period with a value of $11.77 per share. |
| 4 | Federal Reserve Board of Governors, Federal Open Market Committee, Press Release, 17 September 2014 (www.federalreserve.gov/newsevents/press/monetary/20140917a.htm). |
| 5 | The Portfolio Review for the third quarter of 2014 is available at www.seafarerfunds.com/fund/portfolio-review/2014/09/Q3. Information on the website is provided for textual reference only, and is not incorporated by reference into this letter or report. |
| 6 | Guanxi is a Chinese term used to describe business or social relationships that may result in the exchange of favors or connections that are beneficial for the parties involved. |
| 7 | Seafarer Capital Partners contractually committed to lower the expenses of the Fund for the ensuing twelve months, with the intent to renew the same obligation for the foreseeable future. |
| 8 | The Letter to Shareholders from the Annual Report dated April 30, 2014 is available at www.seafarerfunds.com/fund/shareholder-letter/2014/04/annual |
Semi-Annual Report | October 31, 2014 | 5 |
Table of Contents
Seafarer Overseas Growth and Income Fund
|
| |
| ||
October 31, 2014 | ||
Seafarer Overseas Growth and Income Fund Performance
Total Return (As of October 31, 2014) | 1 Year | Since Inception* - Annualized | Net Expense Ratio** | |||||
Investor Class (SFGIX) | 3.31% | 8.74% | 1.25% | |||||
Institutional Class (SIGIX) | 3.51% | 8.88% | 1.05% | |||||
MSCI Emerging Markets Total Return Index^ | 0.98% | 1.52% | ||||||
Gross expense ratio: 1.66% for Investor Class; 1.51% for Institutional Class. Ratios as of the Prospectus dated August 31, 2014**
All performance is in U.S. dollars with gross (pre-tax) dividends and/or distributions reinvested. The performance data quoted represents past performance and does not guarantee future results. Future returns may be lower or higher. The investment return and principal value will fluctuate so that an investor’s shares, when redeemed, may be worth more or less than the original cost. Shares of the Fund redeemed or exchanged within 90 days of purchase are subject to a 2% redemption fee. Performance does not reflect this fee, which if deducted would reduce an individual’s return. To obtain the Fund’s most recent month-end performance, visit seafarerfunds.com or call (855) 732-9220.
| * | Inception Date: February 15, 2012. |
| ** | Seafarer Capital Partners, LLC has agreed contractually to waive and/or reimburse fees or expenses in order to limit Total Annual Fund Operating Expenses After Fee Waiver/Expense Reimbursements (excluding brokerage expenses, interest expenses, taxes and extraordinary expenses) to 1.25% and 1.05% of the Fund’s average daily net assets for the Investor and Institutional share classes, respectively. This agreement is in effect through August 31, 2015. |
| ^ | The MSCI Emerging Markets Total Return Index, Standard (Large+Mid Cap) Core, Gross (dividends reinvested), USD is a free float-adjusted market capitalization index designed to measure equity market performance of emerging markets. Index code: GDUEEGF. The index is not actively managed and does not reflect any deductions for fees, expense or taxes. An investor may not invest directly in an index. |
6 | (855) 732-9220 | seafarerfunds.com |
Table of Contents
Seafarer Overseas Growth and Income Fund
| Portfolio Review
| |
| ||
October 31, 2014 | ||
Performance of a $10,000 Investment Since Inception
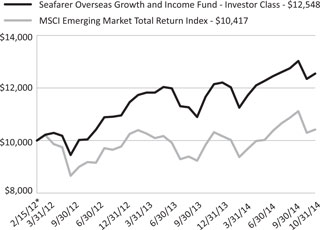
| * | Inception Date: February 15, 2012. |
The chart shown above represents historical performance of a hypothetical investment of $10,000 in the Fund’s Investor Class shares for the period from inception to October 31, 2014. All returns reflect reinvested dividends and/or distributions, but do not reflect the deduction of taxes that an investor would pay on distributions or redemptions.
The Fund also offers Institutional Class shares, performance for which is not reflected in the chart above. The performance of Institutional Class shares may be higher or lower than the performance of the Investor Class shares shown above based upon differences in fees paid by shareholders investing in the Investor Class shares and Institutional Class shares.
Investment Objective
The Fund seeks to provide long-term capital appreciation along with some current income. The Fund seeks to mitigate adverse volatility in returns as a secondary objective.
Strategy
The Fund invests primarily in the securities of companies located in developing countries. The Fund invests in several asset classes including dividend-paying common stocks, preferred stocks, convertible bonds, and fixed-income securities.
The Fund seeks to offer investors a relatively stable means of participating in a portion of developing countries’ growth prospects, while providing some downside protection compared to a portfolio that invests only in the common stocks of those countries.
Semi-Annual Report | October 31, 2014 | 7 |
Table of Contents
Seafarer Overseas Growth and Income Fund
| Portfolio Review
| |
| ||
October 31, 2014 | ||
Fund Characteristics
Inception Date | February 15, 2012 | |||
Net Assets | $ | 126.7M | ||
Portfolio Turnover1 | 13% |
| Investor Class | Institutional Class | |||||
Ticker | SFGIX | SIGIX | ||||
NAV | $11.77 | $11.79 | ||||
30-Day SEC Yield | 1.99% | 2.17% | ||||
Fund Distribution Yield | 0.99% | 1.09% | ||||
Net Expense Ratio | 1.25% | 1.05% | ||||
Redemption Fee (within 90 calendar days) | 2.00% | 2.00% | ||||
Minimum Initial Investment | $2,500 | $100,000 | ||||
Minimum Initial Investment - Automatic Investment Plan | $1,500 | $100,000 | ||||
Minimum Initial Investment - Retirement Account | $1,000 | $100,000 |
Underlying Portfolio Holdings
Number of Holdings | 46 | |||
% of Net Assets in Top 10 Holdings | 33% | |||
Weighted Average Market Cap | $ | 21.4B | ||
Market Cap of Portfolio Median Dollar | $ | 4.1B | ||
Gross Portfolio Yield2,3 | 3.2% | |||
Price / Book Value2 | 1.9 | |||
Price / Earnings2,4 | 13.2 | |||
Earnings Per Share Growth2,4 | 8% |
| 1 | For the six months ended October 31, 2014. Portfolio Turnover is for a period less than one year and is not annualized. |
| 2 | Calculated as a harmonic average of the underlying portfolio holdings. |
| 3 | Gross Portfolio Yield = gross yield for the underlying portfolio, estimated based on the dividend yield for common and preferred stocks and yield to maturity for bonds. This measure of yield does not account for offsetting Fund expenses and other costs, and consequently it should not be construed as the yield that an investor in the Fund would receive. |
| 4 | Based on consensus earnings estimates for next year. Excludes securities for which consensus earnings estimates are not available. |
Past performance does not guarantee future results.
Sources: ALPS Fund Services, Inc., Bloomberg, Seafarer.
30-Day SEC Yield: a standard yield calculation developed by the Securities and Exchange Commission (SEC). It represents net investment income earned by the Fund over a 30-day period, expressed as an annual percentage rate based on the Fund’s share price at the end of the 30-day period. The 30-Day Yield should be regarded as an estimate of the Fund’s rate of investment income, and it may not equal the Fund’s actual income distribution rate.
Fund Distribution Yield: a measure of the sum of the Fund’s income distributions during the trailing 12 months divided by the previous month’s NAV (adjusted upward for any capital gains distributed over the same time period).
Price / Book Value: the value of a company’s common shares, divided by the company’s book value.
Price / Earnings: the market price of a company’s common shares divided by the earnings per common share as forecast for next year.
Earnings Per Share (EPS) Growth: forecast growth rate of earnings per common share next year, expressed as a percentage.
Seafarer does not warrant the data’s accuracy, and disclaims any responsibility for its use for investment purposes.
8 | (855) 732-9220 | seafarerfunds.com |
Table of Contents
Seafarer Overseas Growth and Income Fund
| Portfolio Review
| |
| ||
October 31, 2014 | ||
Top 10 Holdings
| Holding | Sector | Country | % Net Assets | Issuer Mkt Cap ($B) | Yield1 | Price / Book | Price / Earnings2 | EPS Growth2 | ||||||||||||||||
Samsung Electronics Co. Ltd., Pfd. | Information Technology | South Korea | 4.0 | % | $170.6 | 1.5 | % | 1.1 | 8 | -9% | ||||||||||||||
Infosys, Ltd. ADR | Information Technology | India | 3.9 | % | $38.4 | 1.7 | % | 4.9 | 18 | 8% | ||||||||||||||
Singapore Telecommunications Ltd. | Telecom. Services | Singapore | 3.8 | % | $46.9 | 4.4 | % | 2.4 | 15 | 6% | ||||||||||||||
Valid Solucoes | Industrials | Brazil | 3.7 | % | $0.9 | 2.0 | % | 4.0 | 16 | 20% | ||||||||||||||
Dongsuh Co. Inc3 | Consumer Staples | South Korea | 3.2 | % | $1.9 | 2.6 | % | 2.0 | – | – | ||||||||||||||
Sindoh Co. Ltd.3 | Information Technology | South Korea | 3.1 | % | $0.7 | 3.2 | % | 0.8 | – | – | ||||||||||||||
Hisamitsu Pharmaceutical Co., Inc. | Health Care | Japan | 3.0 | % | $3.1 | 2.1 | % | 1.6 | 21 | -16% | ||||||||||||||
Odontoprev SA | Health Care | Brazil | 3.0 | % | $1.9 | 4.5 | % | 7.2 | 20 | 10% | ||||||||||||||
Hang Lung Properties, Ltd. | Financials | China / Hong Kong | 2.8 | % | $14.0 | 3.1 | % | 0.9 | 17 | 4% | ||||||||||||||
Astra International TbK PT | Consumer Discretionary | Indonesia | 2.8 | % | $22.7 | 3.2 | % | 3.0 | 12 | 11% | ||||||||||||||
Cumulative Weight of Top 10 Holdings: | 33 | % | ||||||||||||||||||||||
Total Number of Holdings: | 46 | |||||||||||||||||||||||
| 1 | Yield = dividend yield for common and preferred stocks and yield to maturity for bonds. |
| 2 | Based on consensus earnings estimates for next year. |
| 3 | Consensus estimates for earnings and EPS growth are not available for this security. |
Portfolio holdings are subject to change.
Sources: ALPS Fund Services, Inc., Bloomberg, Seafarer. Seafarer does not warrant the data’s accuracy and disclaims any responsibility for its use for investment purposes.
Semi-Annual Report | October 31, 2014 | 9 |
Table of Contents
Seafarer Overseas Growth and Income Fund
| Portfolio Review
| |
| ||
October 31, 2014 | ||
Portfolio Composition
| Region/Country | % Net Assets | |||
East and South Asia | 62 | |||
China / Hong Kong | 17 | |||
India | 6 | |||
Indonesia | 4 | |||
Japan | 5 | |||
Malaysia | 3 | |||
Singapore | 9 | |||
South Korea | 10 | |||
Taiwan | 4 | |||
Vietnam | 4 | |||
Eastern Europe | 14 | |||
Poland | 7 | |||
Turkey | 7 | |||
Latin America | 18 | |||
Brazil | 11 | |||
Chile | 1 | |||
Mexico | 5 | |||
Middle East & Africa | 4 | |||
South Africa | 4 | |||
Cash and Other Assets, | 2 | |||
Total | 100 | |||
| Asset Class | % Net Assets | |||
Common Stock | 80 | |||
ADR | 7 | |||
Preferred Stock | 5 | |||
Foreign Currency | 3 | |||
Foreign Currency | 2 | |||
USD Convertible Bond | 1 | |||
Cash and Other Assets, | 2 | |||
Total | 100 | |||
| Market Capitalization of Issuer | % Net Assets | |||
Large Cap (over $10 billion) | 37 | |||
Mid Cap ($1 - $10 billion) | 41 | |||
Small Cap (under $1 billion) | 18 | |||
Not Applicable | 3 | |||
Cash and Other Assets, | 2 | |||
Total | 100 | |||
| Sector | % Net Assets | |||
Consumer Discretionary | 10 | |||
Consumer Staples | 9 | |||
Financials* | 17 | |||
Government | 3 | |||
Health Care | 13 | |||
Industrials | 12 | |||
Information Technology | 22 | |||
Materials | 5 | |||
Telecommunication Services | 5 | |||
Utilities | 2 | |||
Cash and Other Assets, | 2 | |||
Total | 100 | |||
| * | The Fund’s concentration in the Financials sector includes holdings in property-related stocks, which are classified within the “Financials sector” according to the Global Industry Classification Standard (GICS) methodology utilized herein. Property-related holdings comprised 4% of the Fund’s net assets as of October 31, 2014. |
Percentage values may not sum to 100% due to rounding.
10 | (855) 732-9220 | seafarerfunds.com |
Table of Contents
Seafarer Overseas Growth and Income Fund
| Portfolio Review
| |
| ||
October 31, 2014 | ||
Top 5 Performance Contributors and Detractors
For the six months ended October 31, 2014
| Contributors | % Net Assets1 | |
Dongsuh Co. Inc | 3.2 | |
Xinhua Winshare Publishing and Media Co., Ltd. | 2.7 | |
Sun Pharma Advanced Research Co., Ltd. | 2.5 | |
Infosys, Ltd. ADR | 3.9 | |
Hartalega Holdings Bhd | 2.5 | |
| Detractors | % Net Assets1 | |
Samsung Electronics Co. Ltd., Pfd. | 4.0 | |
Odontoprev SA | 3.0 | |
Ulker Biskuvi Sanayi AS | 2.1 | |
Cia Vale do Rio Doce, Pfd. | 1.4 | |
Grupo Herdez SAB de CV | 2.6 | |
| 1 | As of end of period. |
Source: Bloomberg. Seafarer does not warrant the data’s accuracy and disclaims any responsibility for its use for investment purposes.
Semi-Annual Report | October 31, 2014 | 11 |
Table of Contents
Seafarer Overseas Growth and Income Fund
|
| |
| ||
October 31, 2014 (Unaudited) | ||
As a shareholder of the Fund you will incur two types of costs: (1) transaction costs, including applicable redemption fees; and (2) ongoing costs, including management fees and other Fund expenses. The following examples are intended to help you understand your ongoing costs (in dollars) of investing in the Fund and to compare these costs with the ongoing costs of investing in other mutual funds. The examples are based on an investment of $1,000 invested on May 1, 2014 and held until October 31, 2014.
Actual Expenses. The first line of each table below provides information about actual account values and actual expenses. You may use the information in this line, together with the amount you invested, to estimate the expenses that you paid over the period. Simply divide your account value by $1,000 (for example, an $8,600 account value divided by $1,000 = 8.6), then multiply the result by the number in the first line under the heading “Expenses Paid During Period” to estimate the expenses you paid on your account during this period.
Hypothetical Example for Comparison Purposes. The second line of the table below provides information about hypothetical account values and hypothetical expenses based on the Fund’s actual expense ratio and an assumed rate of return of 5% per year before expenses, which is not the Fund’s actual return. The hypothetical account values and expenses may not be used to estimate the actual ending account balance or expenses you paid for the period. You may use this information to compare the ongoing costs of investing in the Fund and other mutual funds. To do so, compare this 5% hypothetical example with the 5% hypothetical examples that appear in the shareholder reports of the other funds. The expenses shown in the table are meant to highlight ongoing Fund costs only and do not reflect transaction fees, such as redemption fees or exchange fees. Therefore, the second line of each table below is useful in comparing ongoing costs only, and may not help you determine the relative total costs of owning different funds. In addition, if these transactional costs were included, your costs would have been higher.
Beginning Account Value | Ending Account Value 10/31/14 | Expense Ratio(a) | Expenses Paid During Period 05/01/14 - 10/31/14(b) | |||||
Investor Class | ||||||||
Actual | $ 1,000.00 | $ 1,022.70 | 1.34% | $ 6.83 | ||||
Hypothetical (5% return before expenses) | $ 1,000.00 | $ 1,018.45 | 1.34% | $ 6.82 | ||||
Institutional Class | ||||||||
Actual | $ 1,000.00 | $ 1,023.80 | 1.17% | $ 5.97 | ||||
Hypothetical (5% return before expenses) | $ 1,000.00 | $ 1,019.31 | 1.17% | $ 5.96 |
| (a) | Annualized, based on the Fund’s most recent fiscal half year expenses. |
| (b) | Expenses are equal to the Fund’s annualized expense ratio multiplied by the average account value over the period, multiplied by the number of days in the most recent fiscal half-year (184)/365 (to reflect the half-year period). |
12 | (855) 732-9220 | seafarerfunds.com |
Table of Contents
Seafarer Overseas Growth and Income Fund
|
| |
| ||
October 31, 2014 (Unaudited) | ||
| Currency | Shares | Value | ||||||||
COMMON STOCKS (84.5%) | ||||||||||
Brazil (6.6%) | ||||||||||
Valid Solucoes e Servicos de Seguranca em Meios de Pagamento e Identificacao SA | BRL | 290,000 | $ | 4,655,636 | ||||||
Odontoprev SA | BRL | 1,040,500 | 3,758,212 | |||||||
|
| |||||||||
Total Brazil | 8,413,848 | |||||||||
|
| |||||||||
Chile (1.4%) | ||||||||||
Corpbanca SA | CLP | 135,000,000 | 1,814,952 | |||||||
|
| |||||||||
Total Chile | 1,814,952 | |||||||||
|
| |||||||||
China / Hong Kong (14.9%) | ||||||||||
Hang Lung Properties, Ltd. | HKD | 1,125,000 | 3,510,570 | |||||||
Xinhua Winshare Publishing and Media Co., Ltd., Class H | HKD | 3,675,000 | 3,430,881 | |||||||
Pico Far East Holdings, Ltd. | HKD | 13,804,000 | 3,417,559 | |||||||
Shandong Weigao Group Medical Polymer Co., Ltd., Class H | HKD | 2,400,000 | 2,420,069 | |||||||
Greatview Aseptic Packaging Co., Ltd. | HKD | 3,675,000 | 2,407,304 | |||||||
Digital China Holdings, Ltd. | HKD | 2,150,000 | 2,001,638 | |||||||
Dongfang Electric Corp., Ltd., Class H | HKD | 1,000,000 | 1,691,779 | |||||||
|
| |||||||||
Total China / Hong Kong | 18,879,800 | |||||||||
|
| |||||||||
India (6.4%) | ||||||||||
Infosys, Ltd., ADR | USD | 73,000 | 4,880,780 | |||||||
Sun Pharma Advanced Research Co., Ltd.(a) | INR | 980,000 | 3,165,049 | |||||||
|
| |||||||||
Total India | 8,045,829 | |||||||||
|
| |||||||||
Indonesia (2.8%) | ||||||||||
Astra International Tbk PT | IDR | 6,230,000 | 3,492,615 | |||||||
|
| |||||||||
Total Indonesia | 3,492,615 | |||||||||
|
| |||||||||
Japan (4.8%) | ||||||||||
Hisamitsu Pharmaceutical Co., Inc. | JPY | 117,000 | 3,843,579 | |||||||
NTT DOCOMO, Inc. | JPY | 132,500 | 2,196,439 | |||||||
|
| |||||||||
Total Japan | 6,040,018 | |||||||||
|
| |||||||||
Semi-Annual Report | October 31, 2014 | 13 |
Table of Contents
Seafarer Overseas Growth and Income Fund
| Portfolio of Investments
| |
| ||
October 31, 2014 (Unaudited) | ||
| Currency | Shares | Value | ||||||||
Malaysia (2.5%) | ||||||||||
Hartalega Holdings Bhd | MYR | 1,500,000 | $ | 3,192,217 | ||||||
|
| |||||||||
Total Malaysia | 3,192,217 | |||||||||
|
| |||||||||
Mexico (4.7%) | ||||||||||
Grupo Herdez SAB de CV | MXN | 1,275,000 | 3,275,968 | |||||||
Grupo Financiero Banorte SAB de CV | MXN | 425,000 | 2,723,661 | |||||||
|
| |||||||||
Total Mexico | 5,999,629 | |||||||||
|
| |||||||||
Poland (7.2%) | ||||||||||
Bank Pekao SA | PLN | 64,000 | 3,345,027 | |||||||
Asseco Poland SA | PLN | 205,000 | 3,042,175 | |||||||
PGE SA | PLN | 410,000 | 2,689,283 | |||||||
|
| |||||||||
Total Poland | 9,076,485 | |||||||||
|
| |||||||||
Singapore (8.1%) | ||||||||||
Singapore Telecommunications, Ltd. | SGD | 1,620,000 | 4,766,560 | |||||||
SIA Engineering Co., Ltd. | SGD | 825,000 | 3,056,745 | |||||||
Keppel Corp., Ltd. | SGD | 325,000 | 2,388,106 | |||||||
|
| |||||||||
Total Singapore | 10,211,411 | |||||||||
|
| |||||||||
South Africa (4.5%) | ||||||||||
Sanlam, Ltd. | ZAR | 500,000 | 3,157,370 | |||||||
EOH Holdings, Ltd. | ZAR | 260,000 | 2,536,884 | |||||||
|
| |||||||||
Total South Africa | 5,694,254 | |||||||||
|
| |||||||||
South Korea (6.3%) | ||||||||||
Dongsuh Co., Inc. | KRW | 211,157 | 4,109,612 | |||||||
Sindoh Co., Ltd. | KRW | 59,000 | 3,903,044 | |||||||
|
| |||||||||
Total South Korea | 8,012,656 | |||||||||
|
| |||||||||
Taiwan (4.2%) | ||||||||||
Taiwan Semiconductor Manufacturing Co., Ltd. | TWD | 550,000 | 2,359,739 | |||||||
Taiwan Hon Chuan Enterprise Co., Ltd. | TWD | 1,040,000 | 1,702,760 | |||||||
14 | (855) 732-9220 | seafarerfunds.com |
Table of Contents
Seafarer Overseas Growth and Income Fund
| Portfolio of Investments
| |
| ||
October 31, 2014 (Unaudited) | ||
| Currency | Shares | Value | ||||||||
Taiwan (continued) | ||||||||||
Taiwan Semiconductor Manufacturing Co., Ltd., ADR | USD | 58,000 | $ | 1,277,160 | ||||||
|
| |||||||||
Total Taiwan | 5,339,659 | |||||||||
|
| |||||||||
Turkey (6.2%) | ||||||||||
Aselsan Elektronik Sanayi Ve Ticaret AS | TRY | 585,000 | 2,658,313 | |||||||
Ulker Biskuvi Sanayi AS | TRY | 360,000 | 2,656,289 | |||||||
Arcelik AS | TRY | 420,000 | 2,579,353 | |||||||
|
| |||||||||
Total Turkey | 7,893,955 | |||||||||
|
| |||||||||
Vietnam (3.9%) | ||||||||||
Bao Viet Holdings | VND | 1,065,000 | 1,941,823 | |||||||
Nam Long Investment Corp. | VND | 2,333,190 | 1,940,670 | |||||||
Vietnam National Reinsurance Corp. | VND | 634,790 | 626,438 | |||||||
Dry Cell & Storage Battery JSC | VND | 424,290 | 476,529 | |||||||
|
| |||||||||
Total Vietnam | 4,985,460 | |||||||||
|
| |||||||||
| TOTAL COMMON STOCKS (Cost $104,171,081) | 107,092,788 | |||||||||
PREFERRED STOCKS (7.8%) | ||||||||||
Brazil (3.8%) | ||||||||||
Banco Bradesco SA, ADR | USD | 202,500 | 3,033,450 | |||||||
Vale SA | BRL | 210,000 | 1,826,345 | |||||||
|
| |||||||||
Total Brazil | 4,859,795 | |||||||||
|
| |||||||||
South Korea (4.0%) | ||||||||||
Samsung Electronics Co., Ltd. | KRW | 5,500 | 5,069,101 | |||||||
|
| |||||||||
Total South Korea | 5,069,101 | |||||||||
|
| |||||||||
| TOTAL PREFERRED STOCKS (Cost $10,771,105) | 9,928,896 | |||||||||
Semi-Annual Report | October 31, 2014 | 15 |
Table of Contents
Seafarer Overseas Growth and Income Fund
| Portfolio of Investments
| |
| ||
October 31, 2014 (Unaudited) | ||
| Currency | Rate | Maturity Date | Principal Amount | Value | ||||||||
FOREIGN CURRENCY CONVERTIBLE BONDS (2.2%) | ||||||||||||
China / Hong Kong (2.2%) | ||||||||||||
ASM Pacific Technology, Ltd. | HKD | 2.00% | 03/28/19 | 20,000,000 | $ | 2,817,483 | ||||||
|
| |||||||||||
Total China / Hong Kong | 2,817,483 | |||||||||||
|
| |||||||||||
| TOTAL FOREIGN CURRENCY CONVERTIBLE BONDS (Cost $2,763,230) | 2,817,483 | |||||||||||
FOREIGN CURRENCY GOVERNMENT BONDS (2.7%) | ||||||||||||
Brazil (1.0%) | ||||||||||||
Brazilian Government | BRL | 10.25% | 01/10/28 | 3,000,000 | 1,256,104 | |||||||
|
| |||||||||||
Total Brazil | 1,256,104 | |||||||||||
|
| |||||||||||
Indonesia (0.8%) | ||||||||||||
Indonesia Treasury Bond, | IDR | 8.38% | 03/15/24 | 11,000,000,000 | 933,202 | |||||||
|
| |||||||||||
Total Indonesia | 933,202 | |||||||||||
|
| |||||||||||
Turkey (0.9%) | ||||||||||||
Turkey Government Bond | TRY | 8.80% | 09/27/23 | 2,500,000 | 1,144,467 | |||||||
|
| |||||||||||
Total Turkey | 1,144,467 | |||||||||||
|
| |||||||||||
| TOTAL FOREIGN CURRENCY GOVERNMENT BONDS (Cost $3,266,196) | 3,333,773 | |||||||||||
USD CONVERTIBLE BONDS (1.0%) | ||||||||||||
Singapore (1.0%) | ||||||||||||
Olam International, Ltd. | USD | 6.00% | 10/15/16 | $1,200,000 | 1,285,500 | |||||||
|
| |||||||||||
Total Singapore | 1,285,500 | |||||||||||
|
| |||||||||||
| TOTAL USD CONVERTIBLE BONDS (Cost $1,250,540) | 1,285,500 | |||||||||||
16 | (855) 732-9220 | seafarerfunds.com |
Table of Contents
Seafarer Overseas Growth and Income Fund
| Portfolio of Investments
| |
| ||
October 31, 2014 (Unaudited) | ||
| Value | ||||
| ||||
TOTAL INVESTMENTS | ||||
(Cost $122,222,152) (98.2%) | $ | 124,458,440 | ||
Cash and Other Assets, Less Liabilities (1.8%) | 2,276,754 | |||
| ||||
NET ASSETS (100.0%) | $ | 126,735,194 | ||
| ||||
| (a) | Non-income producing security. |
Certain securities were fair valued in accordance with procedures established by the Fund’s Board of Trustees (Note 2).
Currency Abbreviations | ||||||
BRL | - | Brazil Real | ||||
CLP | - | Chile Peso | ||||
HKD | - | Hong Kong Dollar | ||||
IDR | - | Indonesia Rupiah | ||||
INR | - | India Rupee | ||||
JPY | - | �� | Japan Yen | |||
KRW | - | South Korea Won | ||||
MXN | - | Mexico Peso | ||||
MYR | - | Malaysia Ringgit | ||||
PLN | - | Poland Zloty | ||||
SGD | - | Singapore Dollar | ||||
TRY | - | Turkey Lira | ||||
TWD | - | Taiwan New Dollar | ||||
USD | - | United States Dollar | ||||
VND | - | Vietnam Dong | ||||
ZAR | - | South Africa Rand | ||||
Common Abbreviations: | ||||||
ADR | - | American Depositary Receipt. | ||||
AS | - | Andonim Sirketi, Joint Stock Company in Turkey. | ||||
Bhd | - | Berhad, Public Limited Company in Malaysia. | ||||
JSC | - | Joint Stock Company. | ||||
Ltd. | - | Limited. | ||||
SA | - | Generally designates corporations in various countries, mostly those employing the | ||||
civil law. This translates literally in all languages mentioned as anonymous | ||||||
company. | ||||||
SAB de CV | - | A variable capital company. | ||||
Tbk PT | - | Terbuka is the Indonesian term for limited liability company. | ||||
Holdings are subject to change.
For Fund compliance purposes, the Fund’s geographical classifications refer to any one or more of the sub-classifications used by one or more widely recognized market indexes or ratings group indexes, and/or as defined by Fund management. This definition may not apply for purposes of this report, which may combine sub-classifications for reporting ease. Geographical regions are shown as a percentage of net assets.
See Accompanying Notes to Financial Statements.
Semi-Annual Report | October 31, 2014 | 17 |
Table of Contents
Seafarer Overseas Growth and Income Fund
| Statement of Assets and Liabilities
| |
| ||
October 31, 2014 (Unaudited) | ||
ASSETS: | ||||
Investments, at value | $ | 124,458,440 | ||
Cash | 1,734,395 | |||
Foreign currency, at value (Cost $355,402) | 353,950 | |||
Receivable for investments sold | 1,010,329 | |||
Receivable for shares sold | 44,815 | |||
Interest and dividends receivable | 305,563 | |||
Prepaid expenses and other assets | 13,000 | |||
| ||||
Total Assets | 127,920,492 | |||
| ||||
LIABILITIES: | ||||
Payable for investments purchased | 976,224 | |||
Foreign capital gains tax | 57,314 | |||
Administrative fees payable | 14,718 | |||
Shareholder service plan fees payable | 14,206 | |||
Payable for shares redeemed | 12,905 | |||
Investment advisory fees payable | 76,956 | |||
Trustee fees and expenses payable | 409 | |||
Audit and tax fees payable | 9,838 | |||
Accrued expenses and other liabilities | 22,728 | |||
| ||||
Total Liabilities | 1,185,298 | |||
| ||||
NET ASSETS | $ | 126,735,194 | ||
| ||||
NET ASSETS CONSIST OF: | ||||
Paid-in capital (Note 5) | $ | 122,827,726 | ||
Accumulated net investment income | 209,853 | |||
Accumulated net realized gain on investments and foreign currency transactions | 1,520,731 | |||
Net unrealized appreciation on investments and translation of assets and liabilities in foreign currencies | 2,176,884 | |||
| ||||
NET ASSETS | $ | 126,735,194 | ||
| ||||
INVESTMENTS, AT COST | $ | 122,222,152 | ||
PRICING OF SHARES | ||||
Investor Class: | ||||
Net Asset Value, offering and redemption price per share | $ | 11.77 | ||
Net Assets | $ | 36,421,689 | ||
Shares of beneficial interest outstanding | 3,094,347 | |||
Institutional Class: | ||||
Net Asset Value, offering and redemption price per share | $ | 11.79 | ||
Net Assets | $ | 90,313,505 | ||
Shares of beneficial interest outstanding | 7,662,401 | |||
See Accompanying Notes to Financial Statements.
18 | (855) 732-9220 | seafarerfunds.com |
Table of Contents
Seafarer Overseas Growth and Income Fund
| Statement of Operations
| |
| ||
For the Six Months Ended October 31, 2014 (Unaudited) | ||
INVESTMENT INCOME: | ||||
Dividends | $ | 1,468,561 | ||
Foreign taxes withheld on dividends | (97,676) | |||
Interest and other income | 169,923 | |||
Foreign taxes withheld on interest | (7,121) | |||
| ||||
Total investment income | 1,533,687 | |||
| ||||
EXPENSES: | ||||
Investment advisory fees (Note 6) | 402,368 | |||
Administrative and transfer agency fees | 104,073 | |||
Trustee fees and expenses | 1,146 | |||
Registration/filing fees | 17,536 | |||
Shareholder service plan fees | ||||
Investor Class | 18,199 | |||
Institutional Class | 14,788 | |||
Recoupment of previously waived fees | ||||
Investor Class | 6,368 | |||
Legal fees | 3,396 | |||
Audit fees | 8,833 | |||
Reports to shareholders and printing fees | 3,510 | |||
Custody fees | 41,361 | |||
Miscellaneous | 5,477 | |||
| ||||
Total expenses | 627,055 | |||
Less fees waived/reimbursed by investment advisor (Note 6) | ||||
Institutional Class | (18,974) | |||
| ||||
Total net expenses | 608,081 | |||
| ||||
NET INVESTMENT INCOME: | 925,606 | |||
| ||||
Net realized gain on investments | 1,450,283 | |||
Net realized loss on foreign currency transactions | (129,571) | |||
Net change in unrealized depreciation on investments (net of foreign capital gains tax of $(15,800)) | (1,090,446) | |||
Net change in unrealized depreciation on translation of assets and liabilities in foreign currency transactions | (4,873) | |||
| ||||
NET REALIZED AND UNREALIZED GAIN ON INVESTMENTS AND FOREIGN CURRENCY TRANSLATIONS | 225,393 | |||
| ||||
NET INCREASE IN NET ASSETS RESULTING FROM OPERATIONS | $ | 1,150,999 | ||
| ||||
See Accompanying Notes to Financial Statements.
Semi-Annual Report | October 31, 2014 | 19 |
Table of Contents
Seafarer Overseas Growth and Income Fund
| Statements of Changes in Net Assets
| |
| ||
For the Six Months | Year Ended April 30, 2014 | |||||||
OPERATIONS: | ||||||||
Net investment income | $ | 925,606 | $ | 790,512 | ||||
Net realized gain on investments and foreign currency transactions | 1,320,712 | 472,767 | ||||||
Net change in unrealized appreciation/(depreciation) on investments and foreign currency translations | (1,095,319 | ) | 474,336 | |||||
| ||||||||
Net increase in net assets resulting from operations | 1,150,999 | 1,737,615 | ||||||
| ||||||||
DISTRIBUTIONS TO SHAREHOLDERS (NOTE 3): | ||||||||
From net investment income | ||||||||
Investor Class | $ | (174,216 | ) | $ | (585,611) | |||
Institutional Class | (307,901 | ) | (308,771) | |||||
From net realized gains on investments | ||||||||
Investor Class | – | (654,807) | ||||||
Institutional Class | – | (316,013) | ||||||
| ||||||||
Net decrease in net assets from distributions | (482,117 | ) | (1,865,202) | |||||
| ||||||||
BENEFICIAL INTEREST TRANSACTIONS (NOTE 5): | ||||||||
Shares sold | ||||||||
Investor Class | $ | 12,524,926 | $ | 18,789,915 | ||||
Institutional Class | 46,374,009 | 41,977,026 | ||||||
Dividends reinvested | ||||||||
Investor Class | 171,355 | 1,190,349 | ||||||
Institutional Class | 306,353 | 611,803 | ||||||
Shares Redeemed, net of redemption fees | ||||||||
Investor Class | (3,770,183 | ) | (18,143,918) | |||||
Institutional Class | (3,344,819 | ) | (8,326,537) | |||||
| ||||||||
Net increase in net assets derived from beneficial interest transactions | 52,261,641 | 36,098,638 | ||||||
| ||||||||
Net increase in net assets | $ | 52,930,523 | $ | 35,971,051 | ||||
NET ASSETS: | ||||||||
Beginning of period | $ | 73,804,671 | $ | 37,833,620 | ||||
| ||||||||
End of period (including accumulated net investment income/(loss) of $209,853 and ($233,636), respectively) | $ | 126,735,194 | $ | 73,804,671 | ||||
| ||||||||
20 | (855) 732-9220 | seafarerfunds.com |
Table of Contents
Seafarer Overseas Growth and Income Fund
| Statements of Changes in Net Assets |
For the Six Months | Year Ended April 30, 2014 | |||||||
Other Information: | ||||||||
SHARE TRANSACTIONS: | ||||||||
Investor Class | ||||||||
Sold | 1,051,678 | 1,651,517 | ||||||
Distributions reinvested | 14,621 | 105,435 | ||||||
Redeemed | (319,156) | (1,622,659) | ||||||
| ||||||||
Net increase in shares outstanding | 747,143 | 134,293 | ||||||
| ||||||||
Institutional Class | ||||||||
Sold | 3,898,227 | 3,748,511 | ||||||
Distributions reinvested | 26,117 | 54,211 | ||||||
Redeemed | (284,936) | (743,914) | ||||||
| ||||||||
Net increase in shares outstanding | 3,639,408 | 3,058,808 | ||||||
| ||||||||
See Accompanying Notes to Financial Statements.
Semi-Annual Report | October 31, 2014 | 21 |
Table of Contents
Seafarer Overseas Growth and Income Fund
| Financial Highlights
| |
| ||
For a share outstanding through the periods presented | ||
Investor Class | For the Six Months | Year Ended April 30, 2014 | Year Ended April 30, 2013 | For the Period April 30, 2012 | ||||||||||||
| ||||||||||||||||
NET ASSET VALUE, BEGINNING OF PERIOD | $ 11.58 | $ 11.91 | $ 10.18 | $ | 10.00 | |||||||||||
INCOME FROM OPERATIONS: | ||||||||||||||||
Net investment income(a) | 0.11 | 0.19 | 0.10 | 0.05 | ||||||||||||
Net realized and unrealized gain on investments | 0.15 | 0.02 | 1.74 | 0.13 | ||||||||||||
| ||||||||||||||||
Total from investment operations | 0.26 | 0.21 | 1.84 | 0.18 | ||||||||||||
| ||||||||||||||||
LESS DISTRIBUTIONS: | ||||||||||||||||
From net investment income | (0.07) | (0.26) | (0.11) | – | ||||||||||||
From net realized gains on investments | – | (0.28) | (0.00) | (b) | – | |||||||||||
| ||||||||||||||||
Total distributions | (0.07) | (0.54) | (0.11) | – | ||||||||||||
| ||||||||||||||||
REDEMPTION FEES ADDED TO PAID IN CAPITAL | 0.00 | (c) | 0.00 | (c) | 0.00 | (c) | – | |||||||||
| ||||||||||||||||
NET INCREASE/(DECREASE) IN NET ASSET VALUE | 0.19 | (0.33) | 1.73 | 0.18 | ||||||||||||
| ||||||||||||||||
NET ASSET VALUE, END OF PERIOD | $ | 11.77 | $ | 11.58 | $ | 11.91 | $ | 10.18 | ||||||||
| ||||||||||||||||
TOTAL RETURN(d) | 2.27% | 1.93% | 18.24% | 1.80% | ||||||||||||
SUPPLEMENTAL DATA: | ||||||||||||||||
Net assets, end of period (in 000s) | $ | 36,422 | $ | 27,181 | $ | 26,348 | $ | 1,443 | ||||||||
RATIOS TO AVERAGE NET ASSETS: | ||||||||||||||||
Operating expenses excluding reimbursement/waiver | 1.34% | (e) | 1.78% | 2.82% | 18.96%(e) | |||||||||||
Operating expenses including reimbursement/waiver | 1.34%(e) | (f) | 1.40% | 1.49% | 1.60%(e) | |||||||||||
Net investment income including reimbursement/waiver | 1.77% | (e) | 1.66% | 0.90% | 2.61%(e) | |||||||||||
PORTFOLIO TURNOVER RATE(g) | 13% | 51% | 39% | 5% | ||||||||||||
| (a) | Calculated using the average shares method. |
| (b) | Less than $(0.005) per share. |
| (c) | Less than $ 0.005 per share. |
| (d) | Total returns are for the period indicated and have not been annualized. Total returns would have been lower had certain expenses not been waived during the period. Returns shown do not reflect the deduction of taxes that a shareholder would pay on Fund distributions or the redemption of Fund shares. |
| (e) | Annualized. |
| (f) | Effective September 1, 2014 the Advisor agreed to limit expenses to 1.25%. |
| (g) | Portfolio turnover rate for periods less than one full year have not been annualized. |
See Accompanying Notes to Financial Statements.
22 | (855) 732-9220 | seafarerfunds.com |
Table of Contents
Seafarer Overseas Growth and Income Fund
| Financial Highlights
| |
| ||
For a share outstanding through the periods presented | ||
| Institutional Class | For the Six Months | Year Ended April 30, 2014 | Year Ended April 30, 2013 | For the Period February 15, 2012 (Inception) to April 30, 2012 | ||||||||||||
| ||||||||||||||||
NET ASSET VALUE, BEGINNING OF PERIOD | $ | 11.59 | $ | 11.91 | $ | 10.18 | $ | 10.00 | ||||||||
INCOME FROM OPERATIONS: | ||||||||||||||||
Net investment income(a) | 0.11 | 0.21 | 0.14 | 0.04 | ||||||||||||
Net realized and unrealized gain on investments | 0.16 | 0.02 | 1.71 | 0.14 | ||||||||||||
| ||||||||||||||||
Total from investment operations | 0.27 | 0.23 | 1.85 | 0.18 | ||||||||||||
| ||||||||||||||||
LESS DISTRIBUTIONS: | ||||||||||||||||
From net investment income | (0.07) | (0.27) | (0.12) | – | ||||||||||||
From net realized gains on investments | – | (0.28) | (0.00)(b) | – | ||||||||||||
| ||||||||||||||||
Total distributions | (0.07) | (0.55) | (0.12) | – | ||||||||||||
| ||||||||||||||||
REDEMPTION FEES ADDED TO PAID IN CAPITAL | 0.00 | (c) | 0.00 | (c) | 0.00 | (c) | – | |||||||||
| ||||||||||||||||
NET INCREASE/(DECREASE) IN NET ASSET VALUE | 0.20 | (0.32) | 1.73 | 0.18 | ||||||||||||
| ||||||||||||||||
NET ASSET VALUE, END OF PERIOD | $ | 11.79 | $ | 11.59 | $ | 11.91 | $ | 10.18 | ||||||||
| ||||||||||||||||
TOTAL RETURN(d) | 2.38% | 2.12% | 18.33% | 1.80% | ||||||||||||
SUPPLEMENTAL DATA: | ||||||||||||||||
Net assets, end of period (in 000s) | $ | 90,314 | $ | 46,624 | $ | 11,486 | $ | 1,346 | ||||||||
RATIOS TO AVERAGE NET ASSETS: | ||||||||||||||||
Operating expenses excluding reimbursement/waiver | 1.22% | (e) | 1.61% | 2.88% | 21.65% | (e) | ||||||||||
Operating expenses including reimbursement/waiver | 1.17% | (e)(f) | 1.25% | 1.35% | 1.45% | (e) | ||||||||||
Net investment income including reimbursement/waiver | 1.91% | (e) | 1.89% | 1.28% | 2.00% | (e) | ||||||||||
PORTFOLIO TURNOVER RATE(g) | 13% | 51% | 39% | 5% | ||||||||||||
| (a) | Calculated using the average shares method. |
| (b) | Less than $(0.005) per share. |
| (c) | Less than $0.005 per share. |
| (d) | Total returns are for the period indicated and have not been annualized. Total returns would have been lower had certain expenses not been waived during the period. Returns shown do not reflect the deduction of taxes that a shareholder would pay on Fund distributions or the redemption of Fund shares. |
| (e) | Annualized. |
| (f) | Effective September 1, 2014 the Advisor agreed to limit expenses to 1.05%. |
| (g) | Portfolio turnover rate for periods less than one full year have not been annualized. |
See Accompanying Notes to Financial Statements.
Semi-Annual Report | October 31, 2014 | 23 |
Table of Contents
Seafarer Overseas Growth and Income Fund
|
| |
| ||
October 31, 2014 (Unaudited) | ||
1. ORGANIZATION
Financial Investors Trust (the “Trust”), a Delaware statutory trust, is an open-end management investment company registered under the Investment Company Act of 1940, as amended (“1940 Act”). As of October 31, 2014, the Trust had 32 registered funds. This semi-annual report describes the Seafarer Overseas Growth and Income Fund (the “Fund”). The Fund seeks to provide long-term capital appreciation along with some current income; it also seeks to mitigate adverse volatility in returns as a secondary objective. The Fund offers Investor Class and Institutional Class shares. All classes of shares have identical rights to earnings, assets and voting privileges, except for class specific expenses and exclusive rights to vote on matters affecting only individual classes.
2. SIGNIFICANT ACCOUNTING POLICIES
The accompanying financial statements were prepared in accordance with accounting principles generally accepted in the United States of America (“U.S. GAAP”). The preparation of financial statements in conformity with U.S. GAAP requires management to make certain estimates and assumptions that affect the reported amounts of assets and liabilities and disclosures of contingent assets and liabilities at the date of the financial statements and the reported amounts of revenue and expenses during the period. Actual results could differ from those estimates. The Fund is considered an investment company for financial reporting purposes under GAAP. The following is a summary of significant accounting policies consistently followed by the Fund in preparation of its financial statements.
Investment Valuation: The Fund generally values its securities based on market prices determined at the close of regular trading on the New York Stock Exchange (“NYSE”), normally 4:00 p.m. Eastern Time, on each day the NYSE is open for trading.
For equity securities and mutual funds that are traded on an exchange, the market price is usually the closing sale or official closing price on that exchange. In the case of equity securities not traded on an exchange, or if such closing prices are not otherwise available, the securities are valued at the mean of the most recent bid and ask prices on such day. Redeemable securities issued by open-end registered investment companies are valued at the investment company’s applicable net asset value, with the exception of exchange-traded open-end investment companies, which are priced as equity securities.
Equity securities that are primarily traded on foreign securities exchanges are valued at the closing values of such securities on their respective foreign exchanges, except when an event occurs subsequent to the close of the foreign exchange but before the close of the NYSE, such that the securities’ value would likely change. In such an event, the fair values of those securities are determined in good faith through consideration of other factors in accordance with procedures established by and under the general supervision of the Board of Trustees (the “Board”). The Fund will use a fair valuation model provided by an independent pricing service, which is intended to reflect fair value when a security’s value or a meaningful portion of the Fund’s portfolio is believed to have been materially affected by a valuation event that has occurred between the close of the exchange or market on which the security is traded and the close of the regular trading day on the NYSE. The Fund’s valuation procedures set forth certain triggers that inform the Fund when to use the fair valuation model.
The market price for debt obligations is generally the price supplied by an independent third-party pricing service approved by the Board which may use a matrix, formula or other objective method that takes into consideration quotations from dealers, market transactions in comparable investments, market indices and yield curves. If vendors are unable to supply a price, or if the price supplied is deemed to be
24 | (855) 732-9220 | seafarerfunds.com |
Table of Contents
Seafarer Overseas Growth and Income Fund
| Notes to Financial Statements
| |
| ||
October 31, 2014 (Unaudited) | ||
unreliable, the market price may be determined using quotations received from one or more broker–dealers that make a market in the security. Short–term debt obligations that will mature in 60 days or less are valued at amortized cost, unless it is determined that using this method would not reflect an investment’s fair value.
Forward currency exchange contracts have a market value determined by the prevailing foreign currency exchange daily rates and current foreign currency exchange forward rates. The foreign currency exchange forward rates are calculated using an automated system that estimates rates on the basis of the current day foreign currency exchange rates and forward foreign currency exchange rates supplied by a pricing service.
When such prices or quotations are not available, or when the Fair Value Committee appointed by the Board believes that they are unreliable, securities may be priced using fair value procedures approved by the Board.
Certain foreign countries impose a tax on capital gains which is accrued by the Fund based on unrealized appreciation, if any, on affected securities. The tax is paid when the gain is realized.
Fair Value Measurements: The Fund discloses the classification of its fair value measurements following a three-tier hierarchy based on the inputs used to measure fair value. Inputs refer broadly to the assumptions that market participants would use in pricing the asset or liability, including assumptions about risk. Inputs may be observable or unobservable. Observable inputs reflect the assumptions market participants would use in pricing the asset or liability. Such inputs are developed based on market data obtained from sources independent of the reporting entity. Unobservable inputs reflect the reporting entity’s own assumptions about the assumptions market participants would use in pricing the asset or liability, which are developed based on the information available and the reporting entity’s best efforts to interpret such information.
Various inputs are used in determining the value of the Fund’s investments as of the end of the reporting period. When inputs used fall into different levels of the fair value hierarchy, the level in the hierarchy within which the fair value measurement falls is determined based on the lowest level input that is significant to the fair value measurement in its entirety. The designated input levels are not necessarily an indication of the risk or liquidity associated with these investments. These inputs are categorized in the following hierarchy under applicable financial accounting standards:
Level 1 – | Unadjusted quoted prices in active markets for identical investments, unrestricted assets or liabilities that a Fund has the ability to access at the measurement date; | |
Level 2 – | Quoted prices which are not active, quoted prices for similar assets or liabilities in active markets or inputs other than quoted prices that are observable (either directly or indirectly) for substantially the full term of the asset or liability; and | |
Level 3 – | Significant unobservable prices or inputs (including the Fund’s own assumptions in determining the fair value of investments) where there is little or no market activity for the asset or liability at the measurement date. | |
Semi-Annual Report | October 31, 2014 | 25 |
Table of Contents
Seafarer Overseas Growth and Income Fund
| Notes to Financial Statements
| |
| ||
October 31, 2014 (Unaudited) | ||
The following is a summary of each input used to value the Fund as of October 31, 2014:
Investments in Securities at Value(a) | Level 1 - Quoted Prices | Level 2 - Other Significant Observable Inputs | Level 3 - Significant Unobservable Inputs | Total | ||||||||||||
| ||||||||||||||||
Common Stocks | $ | 107,092,788 | $ | – | $ | – | $ | 107,092,788 | ||||||||
Preferred Stocks | 9,928,896 | – | – | 9,928,896 | ||||||||||||
Foreign Currency Convertible Bonds | – | 2,817,483 | – | 2,817,483 | ||||||||||||
Foreign Currency Government Bonds | – | 3,333,773 | – | 3,333,773 | ||||||||||||
USD Convertible Bonds | – | 1,285,500 | – | 1,285,500 | ||||||||||||
| ||||||||||||||||
Total | $ | 117,021,684 | $ | 7,436,756 | $ | – | $ | 124,458,440 | ||||||||
| ||||||||||||||||
| (a) | For detailed descriptions of countries, see the accompanying Portfolio of Investments. |
The Fund recognizes transfers between levels as of the end of the period. For the six months ended October 31, 2014, the Fund did not have any securities that used significant unobservable inputs (Level 3) in determining fair value.
Security amounts the Fund transferred between Levels 1 and 2 at October 31, 2014 were as follows:
Level 1 - Quoted Prices | Level 2 - Other Significant Observable Inputs | |||||||||||||||
| Transfers In | Transfers (Out) | Transfers In | Transfers (Out) | |||||||||||||
| ||||||||||||||||
Common Stocks | $ | 57,735,165 | $ | – | $ | – | $ | (57,735,165) | ||||||||
Preferred Stocks | 5,069,101 | (5,069,101) | ||||||||||||||
| ||||||||||||||||
Total | $ | 62,804,266 | $ | – | $ | – | $ | (62,804,266) | ||||||||
| ||||||||||||||||
The above transfers were due to the Fund utilizing a fair value evaluation service with respect to international securities with an earlier market closing than the Fund’s net asset value computation cutoff. When events trigger the use of the fair value evaluation service on a reporting date, it results in certain securities transferring from a Level 1 to a Level 2.
Investment Transactions and Investment Income: Investment transactions are accounted for on the date the investments are purchased or sold (trade date). Realized gains and losses from investment transactions are reported on an identified cost basis. Interest income, which includes accretion of discounts and amortization of premiums, is accrued and recorded as earned. Dividend income is recognized on the ex-dividend date or for certain foreign securities, as soon as information is available to the Fund. All of the realized and unrealized gains and losses and net investment income are allocated daily to each class in proportion to its average daily net assets.
Foreign Securities: The Fund may directly purchase securities of foreign issuers. Investing in securities of foreign issuers involves special risks not typically associated with investing in securities of U.S. issuers. The risks include possible reevaluation of currencies, the inability to repatriate foreign currency, less complete financial information about companies and possible future adverse political
26 | (855) 732-9220 | seafarerfunds.com |
Table of Contents
Seafarer Overseas Growth and Income Fund
| Notes to Financial Statements
| |
| ||
October 31, 2014 (Unaudited) | ||
and economic developments. Moreover, securities of many foreign issuers and their markets may be less liquid and their prices more volatile than those of securities of comparable U.S. issuers.
Foreign Currency Translation: The books and records of the Fund are maintained in U.S. dollars. Investment valuations and other assets and liabilities initially expressed in foreign currencies are converted each business day into U.S. dollars based upon current exchange rates. Prevailing foreign exchange rates may generally be obtained at the close of the NYSE (normally, 4:00 p.m. Eastern time). The portion of realized and unrealized gains or losses on investments due to fluctuations in foreign currency exchange rates is not separately disclosed and is included in realized and unrealized gains or losses on investments, when applicable.
Foreign Currency Spot Contracts: The Fund may enter into foreign currency spot contracts to facilitate transactions in foreign securities or to convert foreign currency receipts into U.S. dollars. A foreign currency spot contract is an agreement between two parties to buy and sell currencies at the current market rate, for settlement generally within two business days. The U.S. dollar value of the contracts is determined using current currency exchange rates supplied by a pricing service. The contract is marked-to-market daily for settlements beyond one day and any change in market value is recorded as an unrealized gain or loss. When the contract is closed, the Fund records a realized gain or loss equal to the difference between the value on the open and close date. Losses may arise from changes in the value of the foreign currency, or if the counterparties do not perform under the contract’s terms. The maximum potential loss from such contracts is the aggregate face value in U.S. dollars at the time the contract was opened.
Trust Expenses: Some expenses of the Trust can be directly attributed to the Fund. Expenses which cannot be directly attributed to the Fund are apportioned among all funds in the Trust based on average net assets of each fund.
Fund and Class Expenses: Expenses that are specific to the Fund or class of shares of the Fund are charged directly to the Fund or share class. All expenses of the Fund, other than class specific expenses, are allocated daily to each class in proportion to its average daily net assets. Fees provided under the shareholder service plans for a particular class of the Fund are charged to the operations of such class.
Federal Income Taxes: The Fund complies with the requirements under Subchapter M of the Internal Revenue Code of 1986, as amended, applicable to regulated investment companies and intends to distribute substantially all of its net taxable income and net capital gains, if any, each year so that it will not be subject to excise tax on undistributed income and gains. The Fund is not subject to income taxes to the extent such distributions are made.
As of and during the six months ended October 31, 2014, the Fund did not have a liability for any unrecognized tax benefits. The Fund files U.S. federal, state, and local tax returns as required. The Fund’s tax returns are subject to examination by the relevant tax authorities until expiration of the applicable statute of limitations, which is generally three years after the filing of the tax return for federal purposes and four years for most state returns. Tax returns for open years have incorporated no uncertain tax positions that require a provision for income taxes.
Distributions to Shareholders: The Fund normally pays dividends from net investment income, if any, on a semi-annual basis. The Fund normally distributes capital gains, if any, on an annual basis. Income dividend distributions are derived from interest and other income the Fund receives from its investments, including short term capital gains. Long term capital gain distributions are derived from
Semi-Annual Report | October 31, 2014 | 27 |
Table of Contents
Seafarer Overseas Growth and Income Fund
| Notes to Financial Statements
| |
| ||
October 31, 2014 (Unaudited) | ||
gains realized when the Fund sells a security it has owned for more than one year. The Fund may make additional distributions and dividends at other times if the adviser believes doing so may be necessary for the Fund to avoid or reduce taxes.
3. TAX BASIS INFORMATION
Tax Basis of Investments: As of October 31, 2014, the aggregate cost of investments, gross unrealized appreciation/ (depreciation) and net unrealized appreciation for Federal tax purposes were as follows:
| Cost of Investments | Gross Unrealized Appreciation | Gross Unrealized Depreciation | Net Depreciation | Net Unrealized Appreciation | ||||||||||||||||
| ||||||||||||||||||||
Seafarer Overseas Growth and Income Fund | $ | 123,476,202 | $ | 7,254,454 | $ | (6,272,216 | ) | $ | – | $ | 982,238 | |||||||||
Tax Basis of Distributions to Shareholders: The character of distributions made during the year from net investment income or net realized gains may differ from its ultimate characterization for federal income tax purposes. Also, due to the timing of dividend distributions, the fiscal year in which amounts are distributed may differ from the fiscal year in which the income or realized gain is recorded by the Fund.
The tax character of distributions paid by the Fund for the fiscal year ended April 30, 2014, were as follows:
| Ordinary Income | Long-Term Capital Gain | |||||||
| ||||||||
Seafarer Overseas Growth and Income Fund | $ | 1,543,197 | $ | 322,005 | ||||
The amounts and characteristics of tax basis distributions and composition of distributable earnings/(accumulated losses) are finalized at fiscal year-end. Accordingly, tax basis balances have not been determined as of October 31, 2014.
4. SECURITIES TRANSACTIONS
The cost of purchases and proceeds from sales of securities excluding short term securities during the six months ended October 31, 2014, were as follows:
| Purchases of Securities | Proceeds From Sales of Securities | |||||||
| ||||||||
Seafarer Overseas Growth and Income Fund | $ | 64,741,318 | $ 12,684,227 | |||||
5. SHARES OF BENEFICIAL INTEREST
The capitalization of the Trust consists of an unlimited number of shares of beneficial interest with no par value per share. Holders of the shares of the Fund of the Trust have one vote for each share held
28 | (855) 732-9220 | seafarerfunds.com |
Table of Contents
Seafarer Overseas Growth and Income Fund
| Notes to Financial Statements
| |
| ||
October 31, 2014 (Unaudited) | ||
and a proportionate fraction of a vote for each fractional share. All shares issued and outstanding are fully paid and are non-assessable, transferable and redeemable at the option of the shareholder. Shares have no pre-emptive rights.
Shares redeemed within 90 days of purchase may incur a 2% short-term redemption fee deducted from the redemption amount. The redemption fee is reflected in the “Shares redeemed, net of redemption fees” in the Statements of Changes in Net Assets. During the six months ended October 31, 2014, and the year ended April 30, 2014, the Fund retained the following redemption fees:
| Fund | For the Six Months Ended | For the Year Ended April 30, 2014 | ||
| ||||
Seafarer Overseas Growth and Income Fund - Investor | $ 2,048 | $ 9,035 | ||
| ||||
Seafarer Overseas Growth and Income Fund - Institutional | $ 2,452 | $ 3,790 | ||
| ||||
6. MANAGEMENT AND RELATED-PARTY TRANSACTIONS
Seafarer Capital Partners, LLC (the “Adviser”), subject to the authority of the Board, is responsible for the overall management and administration of the Fund’s business affairs. The Adviser manages the investments of the Fund in accordance with the Fund’s investment objective, policies, limitations and investment guidelines established jointly by the Adviser and the Trustees. Pursuant to the Advisory Agreement (the “Advisory Agreement”), the Fund pays the Adviser an annual management fee based on the Fund’s average daily net assets. The management fee is paid on a monthly basis. From the inception of the Fund through August 31, 2014, the Fund paid the Adviser an annual management fee of 0.85%. Effective January 15, 2013, the Adviser voluntarily agreed to waive a portion of its annual management fee payable by the Fund so that such fee was reduced to 0.75%. This voluntary arrangement expired on August 31, 2013. Effective September 1, 2014, the Adviser contractually agreed to reduce its annual management fee to 0.75%.
From the inception of the Fund through August 31, 2013, the Adviser contractually agreed to limit certain Fund expenses (exclusive of acquired fund fees and expenses, brokerage expenses, interest expenses, taxes and extraordinary expenses) to 1.60% and 1.45% of the Fund’s average daily net assets in the Investor and Institutional share classes, respectively. Effective January 15, 2013, the Adviser voluntarily agreed to further limit such Fund expenses to 1.40% and 1.25% of the Fund’s average daily net assets in the Investor and Institutional share classes, respectively. Effective September 1, 2013, the Adviser contractually agreed to limit certain Fund expenses (exclusive of brokerage expenses, interest expenses, taxes and extraordinary expenses) to 1.40% and 1.25% of the Fund’s average daily net assets in the Investor and Institutional share classes, respectively, through August 31, 2014. Effective September 1, 2014, the Adviser contractually agreed to limit such Fund expenses to 1.25% and 1.05% of the Fund’s average daily net assets in the Investor and Institutional share classes, respectively, through August 31, 2015, at which point this agreement may be extended further. The Fund may have to repay some of these waivers and reimbursements to the Adviser in the following three years. Pursuant to the expense limitation agreement between the Adviser and the Trust, the Fund will reimburse the Adviser for any contractual fee waivers and expense reimbursements made by the Adviser, provided that any such reimbursements made by the Fund to the Adviser will not cause the Fund’s expense limitation to exceed expense limitations in existence at the time the expense was incurred, or at the time of the reimbursement, whichever is lower, and the
Semi-Annual Report | October 31, 2014 | 29 |
Table of Contents
Seafarer Overseas Growth and Income Fund
| Notes to Financial Statements
| |
| ||
October 31, 2014 (Unaudited) | ||
reimbursement is made within three years after the end of the fiscal year in which fees or expenses were incurred.
For the six months ended October 31, 2014, the fee waivers and/or reimbursements were as follows:
| Fund | Fees Waived/ Reimbursed By Adviser | Total | ||||||
| ||||||||
Seafarer Overseas Growth and Income Fund | ||||||||
| ||||||||
Institutional Class | $ | 18,974 | $ | 18,974 | ||||
| ||||||||
As of October 31, 2014, the balances of recoupable expenses for each class were as follows:
| Fund | Expires 2015 | Expires 2016 | Expires 2017 | Total | ||||||||||||
| ||||||||||||||||
Seafarer Overseas Growth and Income Fund | ||||||||||||||||
| ||||||||||||||||
Investor Class | $ | 22,136 | $ | 177,710 | $ | 89,143 | $ | 288,989 | ||||||||
| ||||||||||||||||
Institutional Class | 51,869 | 78,354 | 66,379 | 196,602 | ||||||||||||
| ||||||||||||||||
Fund Administrator Fees and Expenses
ALPS Fund Services, Inc. (“ALPS” and the “Administrator”) (an affiliate of ALPS Distributors, Inc.) provides administrative, fund accounting and other services to the Fund under the Administration, Bookkeeping and Pricing Services Agreement with the Trust. Under this Agreement, ALPS is paid fees by the Fund, accrued on a daily basis and paid on a monthly basis following the end of the month, based on the greater of (a) an annual total fee of $143,000 (subject to an annual cost of living increase), or (b) the following fee schedule:
Average Total Net Assets | Contractual Fee | |
Between $0-$500M | 0.05% | |
$500M-$1B | 0.03% | |
Above $1B | 0.02% |
The Administrator is also reimbursed by the Fund for certain out-of-pocket expenses.
Transfer Agent
ALPS serves as transfer, dividend paying and shareholder servicing agent for the Fund (“Transfer Agent”). ALPS is compensated based upon a $25,000 annual base fee for the Fund, and annually $9 per direct open account and $7 per open account through NSCC. The Transfer Agent is also reimbursed by the Fund for certain out-of-pocket expenses.
Compliance Services
ALPS provides services that assist the Trust’s chief compliance officer in monitoring and testing the policies and procedures of the Trust in conjunction with requirements under Rule 38a-1 under the 1940 Act under the Chief Compliance Officer Services Agreement with the Trust. Under this Agreement, the Adviser pays ALPS an annual base fee of $30,000 and reimburses ALPS for certain out-of-pocket expenses.
30 | (855) 732-9220 | seafarerfunds.com |
Table of Contents
Seafarer Overseas Growth and Income Fund
| Notes to Financial Statements
| |
| ||
October 31, 2014 (Unaudited) | ||
Principal Financial Officer
ALPS provides principal financial officer services to the Fund under the principal financial officer Services Agreement with the Trust. Under this Agreement, the Adviser pays ALPS an annual base fee of $10,000 and reimburses ALPS for certain out-of-pocket expenses.
Distributor
ALPS Distributors, Inc. (“ADI” or the “Distributor”) (an affiliate of ALPS) acts as the distributor of the Fund’s shares pursuant to the Distribution Agreement with the Trust. Under a side letter agreement, the Adviser pays ADI an annual base fee of $12,000 for the distribution services. The Adviser also reimburses ADI for certain out-of-pocket expenses. Shares are sold on a continuous basis by ADI as agent for the Fund, and ADI has agreed to use its best efforts to solicit orders for the sale of the Fund’s shares, although it is not obliged to sell any particular amount of shares. ADI is registered as a broker-dealer with the Securities and Exchange Commission.
Shareholder Service Plan for Investor Class and Institutional Class Shares
The Fund has adopted a shareholder service plan (a “Service Plan”) for each of its share classes. Under the Service Plan, the Fund is authorized to enter into shareholder service agreements with investment advisors, financial institutions and other service providers (“Participating Organizations”) to maintain and provide certain administrative and servicing functions in relation to the accounts of shareholders. The Service Plan will cause the Fund to pay an aggregate fee, not to exceed on an annual basis 0.15% and 0.05% of the average daily net asset value of the Investor and Institutional share classes, respectively. Such payment will be made on assets attributable to or held in the name of a Participating Organization, on behalf of its clients as compensation for providing service activities pursuant to an agreement with a Participating Organization. Any amount of such payment not paid during the Fund’s fiscal year for such service activities shall be reimbursed to the Fund as soon as practicable after the end of the fiscal year.
7. INDEMNIFICATIONS
Under the Trust’s organizational documents, its officers and Trustees are indemnified against certain liability arising out of the performance of their duties to the Trust. Additionally, in the normal course of business, the Trust enters into contracts with service providers that may contain general indemnification clauses, which may permit indemnification to the extent permissible under the applicable law. The Trust’s maximum exposure under these arrangements is unknown, as this would involve future claims that may be made against the Trust that have not yet occurred.
Semi-Annual Report | October 31, 2014 | 31 |
Table of Contents
Seafarer Overseas Growth and Income Fund
|
| |
| ||
October 31, 2014 (Unaudited) | ||
1. FUND HOLDINGS
The Fund files its complete schedule of portfolio holdings with the Securities and Exchange Commission (the “SEC”) for the first and third quarters of each fiscal year on Form N-Q within 60 days after the end of the period. Copies of the Fund’s Form N-Q are available without charge on the SEC website at http://www.sec.gov. You may also review and copy the Form N-Q at the SEC’s Public Reference Room in Washington, D.C. For more information about the operation of the Public Reference Room, please call the SEC at 1-800-SEC-0330.
2. FUND PROXY VOTING POLICIES, PROCEDURES AND SUMMARIES
The Fund’s policies and procedures used in determining how to vote proxies and information regarding how the Fund voted proxies relating to portfolio securities during the most recent prior 12-month period ending June 30 are available without charge, (1) upon request, by calling toll-free (855) 732-9220 and (2) on the SEC’s website at http://www.sec.gov.
32 | (855) 732-9220 | seafarerfunds.com |
Table of Contents

Seafarer Funds distributed by ALPS Distributors, Inc.
Must be accompanied or preceded by a prospectus.
Table of Contents
Table of Contents
October 31, 2014
| 1 | ||||
| 6 | ||||
| 7 | ||||
| 12 | ||||
| 13 | ||||
| 14 | ||||
| 16 | ||||
| 18 | ||||
| 23 | ||||
| 26 | ||||
Table of Contents
Stonebridge Small-Cap Growth Fund
|
| |
| ||
October 31, 2014 (Unaudited) | ||
November 13, 2014
OVERVIEW
As we progressed through calendar year 2014, the investment environment became increasingly volatile. First, an unusually cold and long winter led to an expected decline in Gross Domestic Product (GDP) for the first quarter of 2014. Concurrent with this disappointing economic report, an acceleration of Russian involvement with separatists in Eastern Ukraine generated heightened political and military concern across the globe. Following the downing of a passenger commercial jet near the Russian border in mid-July, this regional destabilization brought about increased coordinated economic sanctions against Russia. Interestingly, this mid-July timeframe was the onset of two major economic inflection points; a rally in the U.S. Dollar and a dramatic decline in crude oil prices. One reason for October’s correction in the equity markets was anxiety about an economic slowdown in Europe, Japan and China. These concerns only propelled the dollar higher and crude oil lower. In summation, this increase of political and economic events was captured by the CBOE Market Volatility Index (VIX Index)(1) which peaked above 30 in mid-October at the peak of the equity market’s most recent correction. In conclusion, it has been a difficult environment for investing in small cap companies with little price appreciation of the various small cap indices.
Looking ahead to 2015, we remain constructive regarding the U.S. economy. Employment levels continue to increase, demand for housing is strengthening and energy costs are substantially lower. Regarding our international trade partners, Japan is still attempting to reinvigorate economic growth, China is still witnessing strong mid-single digit growth while Europe has initiated its own stimulative agenda. While the strong U.S. Dollar could undermine foreign sales growth at U.S. multinational companies, that is less of a concern for small companies that are domestically focused. Further, the longer energy prices remain depressed, the longer consumers will have additional buying power for things other than fueling their cars and heating their homes. Lower fuel costs should be supportive for the U.S. economy in the short-run.
However, we don’t think lower oil prices will last for very long and have used the recent 25% decline in crude oil prices from its calendar year highs to increase our energy exposure in the portfolio. While timing is uncertain, we believe that growth in demand for crude oil will outstrip the growth in supply for several reasons. From a supply perspective, the first issue is that the available spare capacity to increase production by Organization of Petroleum Exporting Countries (OPEC) is at an all-time low. Second, the rate of growth of U.S. production is projected to slow. Third, production growth elsewhere in the world (non-U.S. and non-OPEC) is currently non-existent. From a demand perspective, growth in emerging market consumption for oil continues to expand at 2-3x the rate of overall global demand growth. As these economies in Africa, the Middle East and Asia continue to develop, per capita demand increases in conjunction with growing consumer incomes and wealth. As a result, we believe oil prices should rise over time which would produce increasing cash flows and earnings for the companies in the Fund’s portfolio.
The Fund’s investments have struggled so far this calendar year. The Fund’s best performing economic sector was the health care sector where both the overweight position and stock selection added to relative returns. On the other hand, the Fund’s overweight position in technology and energy hurt its relative returns. Further, our minimal exposure to materials and consumer staples was a drag on relative performance as these sectors have outperformed the overall index.
Semi-Annual Report | October 31, 2014 |
1 |
Table of Contents
Stonebridge Small-Cap Growth Fund
| Letter to Shareholders
| |
| ||
October 31, 2014 (Unaudited) | ||
The performance of the Stonebridge Small-Cap Growth Fund during the period April 30, 2014 to October 31, 2014 was down 4.14%. The Russell 2000® Growth Index(2) rose 6.90% over this six month period. In terms of economic sectors, the Fund kept its allocations relatively constant. However, in October the Fund increased its exposure to energy as crude oil prices declined. The technology and health care sectors remain key areas of focus for the Fund’s investment strategy, as the investment team continues to identify businesses that have strong growth profiles due to leading innovation. The Fund continues to favor industrial companies with advanced technology in niche markets that benefit from long-term secular growth drivers. And while the Fund’s strategy remains cautious on the overall state of consumer spending, it does have investment positions in consumer companies with strong growth opportunities and market-leading positions.
Stonebridge Small-Cap Growth Fund (SBSGX) Sector Allocation
as a Percent of Net Assets as of October 31, 2014*
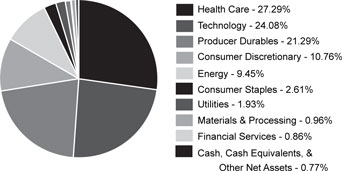
* These allocations may not reflect the current or future position of the portfolio.
2 |
Stonebridge Small-Cap Growth Fund |
Table of Contents
Stonebridge Small-Cap Growth Fund
| Letter to Shareholders
| |
| ||
October 31, 2014 (Unaudited) | ||
Change in value of a $10,000 investment in Stonebridge Small-Cap
Growth Fund (SBSGX) vs. the Russell 2000® Growth Index and
the S&P 500 Total Return Index from October 31, 2004 to October 31, 2014
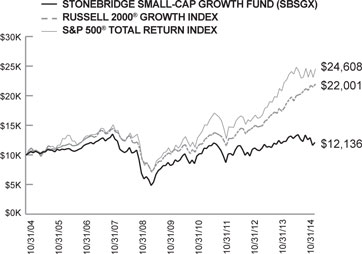
Average Annual Total Returns for the Years Ended October 31, 2014
| 1 Year | 5 Years | 10 Years | ||||||||||
Stonebridge Small-Cap Growth Fund (SBSGX)
|
|
-1.47%
|
| 8.06% | 1.95% | |||||||
Russell 2000® Growth Index(2)
|
|
18.42%
|
| 18.61% | 9.42% | |||||||
S&P 500® Total Return Index(3)
|
|
17.27%
|
| 16.69% | 8.20% | |||||||
Average annual total returns reflect reinvestment of all dividends and capital gains distributions, any fee waivers in effect and any expense reimbursements. Without the fee waivers and expense reimbursements, the total return figures would be lower. Past performance is not indicative of future results and current performance may be lower or higher than the performance quoted. Investment return and principal value will fluctuate and shares, when redeemed, may be worth more or less than their original cost. The total returns shown do not reflect the deduction of taxes that a shareholder would pay on fund distributions or the redemption of fund shares. To obtain the most recent month-end performance, please call the Fund’s toll-free number at 1-800-639-3935.
Effective as of the close of business February 15, 2013, Stonebridge Small-Cap Growth Fund (SBAGX) (the “Acquired Fund”) and Stonebridge Institutional Small-Cap Growth Fund (SBSCX) (the “Acquiring Fund”), each a series of Stonebridge Funds Trust were reorganized into a newly created fund, which is named the Stonebridge Small-Cap Growth Fund (SBSGX) (the “Fund”), under the Financial Investors Trust. The Fund’s performance for periods prior to the close of business February 15, 2013 is that of the Acquiring Fund.
As of the Prospectus dated August 31, 2014, the gross annual expense ratio for the Stonebridge Small-Cap Growth Fund was 2.25%. At October 31, 2014, the Fund’s gross annual expense ratio was 2.07%.
Semi-Annual Report | October 31, 2014 |
3 |
Table of Contents
Stonebridge Small-Cap Growth Fund
| Letter to Shareholders
| |
| ||
October 31, 2014 (Unaudited) | ||
CONCLUSION
In managing the Fund in accordance with its strategy, we seek to identify strong businesses that we believe exhibit competitive advantages, growing market share, and healthy balance sheets, and that are poised to rapidly grow earnings in excess of market expectations. We are positioning the Fund toward those businesses and economic sectors that we believe contain the best opportunities for future growth and investment returns. Although we are most excited about the outlook for technology, health care and energy companies, we believe that we will continue to find opportunities for the Fund across sectors that can deliver solid performance results for shareholders.
Sincerely,
Richard C. Barrett, CFA
Matthew W. Markatos, CFA
Portfolio Managers
Performance quoted above represents past performance. Past Performance does not guarantee future results.
The views and information discussed in this commentary are as of the date of publication, are subject to change, and may not reflect the writer’s current views. The views expressed represent an assessment of market conditions at a specific point in time, are opinions only and should not be relied upon as investment advice regarding a particular investment or markets in general. Such information does not constitute a recommendation to buy or sell specific securities or investment vehicles. It should not be assumed that any investment will be profitable or will equal the performance of the portfolios or any securities or any sectors mentioned in this letter. The subject matter contained in this letter has been derived from several sources believed to be reliable and accurate at the time of compilation. Neither Stonebridge Capital Management, Inc. nor the Fund accepts any liability for losses either direct or consequential caused by the use of this information.
DEFINITIONS:
(1) | The Volatility Index® (VIX) is an index which measures expectations of volatility, or fluctuations in price, of the S&P 500® Total Return Index. Higher values for the volatility index indicate that investors expect the value of the S&P 500® Total Return Index to fluctuate wildly – up, down, or both – in the next 30 days. The Index is not actively managed and does not reflect any deduction for fees, expenses or taxes. An investor cannot invest directly in the Index. |
(2) | The Russell 2000® Growth Index is an unmanaged index that measures the performance of those Russell 2000® Index companies with higher price-to-book ratios and higher forecasted growth values. The Russell 2000® Index measures the performance of the 2,000 smallest companies in the Russell 3000® Index, which measures the performance of the 3,000 largest U.S. companies in terms of market capitalization. The Russell 2000® Growth Index is constructed to provide a comprehensive and unbiased barometer of the small-cap growth market. This is a total return index which reflects the reinvestment of income dividends and capital gain distributions, if any, but does not reflect fees, brokerage commissions, or other expenses of investing. The Index is not actively managed and does not reflect any deductions for fees, expenses or taxes. An investor may not invest directly in the Index. |
4 |
Stonebridge Small-Cap Growth Fund |
Table of Contents
Stonebridge Small-Cap Growth Fund
| Letter to Shareholders
| |
| ||
October 31, 2014 (Unaudited) | ||
(3) | The S&P 500® Total Return Index is an unmanaged index of 500 common stocks chosen for market size, liquidity and industry group representation. It is a market-value weighted index. The S&P 500® Total Return Index is not actively managed and does not reflect any deduction for fees, expenses or taxes. An investor cannot invest directly in the Index. |
Semi-Annual Report | October 31, 2014 |
5 |
Table of Contents
Stonebridge Small-Cap Growth Fund
|
| |
| ||
October 31, 2014 (Unaudited) | ||
As a shareholder of a Fund, you incur two types of costs: (1) transaction costs (such as the 2% fee on redemption of Fund shares made within 30 days of purchase); and (2) ongoing costs, including management fees and other Fund expenses. The following examples are intended to help you understand your ongoing costs (in dollars) of investing in a Fund and to compare these costs with the ongoing costs of investing in other mutual funds. The examples are based on an investment of $1,000 invested on May 1, 2014 and held until October 31, 2014.
Actual Return — The first line of the following tables provides information about actual account values and actual expenses. You may use the information in this line, together with the amount you invested, to estimate the expenses that you paid over the period. Simply divide your account value by $1,000 (for example, an $8,600 account value divided by $1,000 = 8.6), then multiply the result by the number in the first line under the heading “Expense Paid During Period” to estimate the expenses you paid on your account during this period.
Hypothetical 5% Return — The second line of the following tables provides information about hypothetical account values and hypothetical expenses based on each Fund’s actual expense ratio and an assumed rate of return of 5% per year before expenses, which is not the Fund’s actual return. The hypothetical account values and expenses may not be used to estimate the actual ending account balance or expenses you paid for the period. You may use this information to compare the ongoing costs of investing in a Fund and other mutual funds. To do so, compare this 5% hypothetical example with the 5% hypothetical examples that appear in the shareholder reports of the other funds.
The expenses shown in the table are meant to highlight ongoing Fund costs only and do not reflect transaction fees, such as redemption fees. Therefore, the second line of the table is useful in comparing ongoing costs only, and may not help you determine the relative total costs of owning different funds. If the transaction fees were included, your costs would be higher.
Stonebridge Small-Cap Growth Fund
Beginning Account 5/01/14 | Ending Account Value at 10/31/14 | Expense Ratio(1) | Expense Paid During Period | |||||||||||||
Actual Fund Return | $ 1,000.00 | $ 958.60 | 2.07% | $ 10.22 | ||||||||||||
Hypothetical Fund Return (5% return before expenses) | $ 1,000.00 | $ 1,014.77 | 2.07% | $ 10.51 | ||||||||||||
(1) | The Fund’s expense ratios have been annualized based on the Fund’s most recent fiscal half-year expenses. |
(2) | Expenses are equal to the Fund’s annualized expense ratio multiplied by the average account value over the period, multiplied by the number of days in the most recent fiscal half-year (184)/365 (to reflect the half-year period). |
6 |
Stonebridge Small-Cap Growth Fund |
Table of Contents
Stonebridge Small-Cap Growth Fund
|
| |
| ||
October 31, 2014 (Unaudited) | ||
Shares | Market Value | |||||||
COMMON STOCKS (99.23%) | ||||||||
CONSUMER DISCRETIONARY - (10.76%) | ||||||||
Advertising Agencies (1.33%) | ||||||||
MDC Partners, Inc. - Class A | 11,000 | $ | 227,700 | |||||
|
| |||||||
Automotive Retail (1.21%) | ||||||||
America’s Car-Mart, Inc.** | 4,500 | 206,910 | ||||||
|
| |||||||
Consumer Services: Misc (2.71%) | ||||||||
Steiner Leisure, Ltd.** | 11,000 | 463,980 | ||||||
|
| |||||||
Homebuilding (1.94%) | ||||||||
Meritage Homes Corp.** | 9,000 | 331,110 | ||||||
|
| |||||||
Household Furnishings (2.28%) | ||||||||
Select Comfort Corp.** | 15,150 | 389,204 | ||||||
|
| |||||||
Leisure Time (1.29%) | ||||||||
Interval Leisure Group, Inc. | 10,500 | 220,920 | ||||||
|
| |||||||
TOTAL CONSUMER DISCRETIONARY | 1,839,824 | |||||||
|
| |||||||
CONSUMER STAPLES - (2.61%) | ||||||||
Foods (2.61%) | ||||||||
Chefs’ Warehouse, Inc.** | 25,000 | 446,750 | ||||||
|
| |||||||
TOTAL CONSUMER STAPLES | 446,750 | |||||||
|
| |||||||
ENERGY - (9.45%) | ||||||||
Offshore Drilling & Other Services (2.38%) | ||||||||
Atwood Oceanics, Inc.** | 10,000 | 406,500 | ||||||
|
| |||||||
Oil Well Equipment & Services (2.58%) | ||||||||
McDermott International, Inc.** | 115,000 | 441,600 | ||||||
|
| |||||||
Oil: Crude Producers (4.49%) | ||||||||
Halcon Resources Corp.** | 115,000 | 357,650 | ||||||
Resolute Energy Corp.** | 44,000 | 153,120 | ||||||
Sanchez Energy Corp.** | 15,000 | 256,050 | ||||||
|
| |||||||
| 766,820 | ||||||||
|
| |||||||
TOTAL ENERGY | 1,614,920 | |||||||
|
| |||||||
See Notes to Financial Statements.
Semi-Annual Report | October 31, 2014 |
7 |
Table of Contents
Stonebridge Small-Cap Growth Fund
| Statement of Investments
| |
| ||
October 31, 2014 (Unaudited) | ||
Shares | Market Value | |||||||
FINANCIAL SERVICES - (0.86%) | ||||||||
Financial Data & Systems (0.86%) | ||||||||
Higher One Holdings, Inc.** | 57,000 | $ | 146,490 | |||||
|
| |||||||
TOTAL FINANCIAL SERVICES | 146,490 | |||||||
|
| |||||||
HEALTH CARE - (27.29%) | ||||||||
Biotechnology (7.20%) | ||||||||
ACADIA Pharmaceuticals, Inc.** | 5,000 | 138,500 | ||||||
Exact Sciences Corp.** | 8,500 | 204,595 | ||||||
Genomic Health, Inc.** | 14,750 | 536,015 | ||||||
ImmunoGen, Inc.** | 38,000 | 351,880 | ||||||
|
| |||||||
| 1,230,990 | ||||||||
|
| |||||||
Health Care Facilities (1.33%) | ||||||||
VCA, Inc.** | 5,000 | 227,850 | ||||||
|
| |||||||
Health Care Services (9.55%) | ||||||||
HMS Holdings Corp.** | 11,500 | 267,145 | ||||||
IPC The Hospitalist Co., Inc.** | 11,300 | 470,758 | ||||||
MWI Veterinary Supply, Inc.** | 2,000 | 339,310 | ||||||
Quality Systems, Inc. | 36,750 | 555,292 | ||||||
|
| |||||||
| 1,632,505 | ||||||||
|
| |||||||
Medical & Dental Instruments & Supplies (3.37%) | ||||||||
Merit Medical Systems, Inc.** | 18,500 | 280,275 | ||||||
Trinity Biotech PLC - Sponsored ADR | 17,000 | 295,800 | ||||||
|
| |||||||
| 576,075 | ||||||||
|
| |||||||
Medical Equipment (5.84%) | ||||||||
Luminex Corp.** | 27,000 | 513,000 | ||||||
Masimo Corp.** | 19,250 | 485,870 | ||||||
|
| |||||||
| 998,870 | ||||||||
|
| |||||||
TOTAL HEALTH CARE | 4,666,290 | |||||||
|
| |||||||
MATERIALS & PROCESSING - (0.96%) | ||||||||
Chemicals: Specialty (0.96%) | ||||||||
Polypore International, Inc.** | 3,750 | 164,700 | ||||||
|
| |||||||
TOTAL MATERIALS & PROCESSING | 164,700 | |||||||
|
| |||||||
PRODUCER DURABLES - (21.29%) | ||||||||
Back Office Support HR & Consulting (2.84%) | ||||||||
Performant Financial Corp.** | 38,500 | 332,255 | ||||||
ServiceSource International, Inc.** | 40,000 | 152,800 | ||||||
|
| |||||||
| 485,055 | ||||||||
|
| |||||||
See Notes to Financial Statements.
8 |
Stonebridge Small-Cap Growth Fund |
Table of Contents
Stonebridge Small-Cap Growth Fund
| Statement of Investments
| |
| ||
October 31, 2014 (Unaudited) | ||
Shares | Market Value | |||||||
PRODUCER DURABLES (continued) | ||||||||
Construction (4.03%) | ||||||||
Aegion Corp.** | 18,500 | $ | 338,920 | |||||
Great Lakes Dredge & Dock Corp.** | 50,000 | 349,500 | ||||||
|
| |||||||
| 688,420 | ||||||||
|
| |||||||
Engineering & Contracting Services (1.88%) | ||||||||
Mistras Group, Inc.** | 19,500 | 321,555 | ||||||
|
| |||||||
Machinery: Industrial (6.97%) | ||||||||
Adept Technology, Inc.** | 37,000 | 261,960 | ||||||
Chart Industries, Inc.** | 12,000 | 558,600 | ||||||
Woodward, Inc. | 7,250 | 371,273 | ||||||
|
| |||||||
| 1,191,833 | ||||||||
|
| |||||||
Scientific Instruments: Control & Filter (1.41%) | ||||||||
Energy Recovery, Inc.** | 52,602 | 240,917 | ||||||
|
| |||||||
Shipping (2.26%) | ||||||||
Tidewater, Inc. | 10,500 | 387,135 | ||||||
|
| |||||||
Truckers (1.90%) | ||||||||
Quality Distribution, Inc.** | 25,000 | 324,000 | ||||||
|
| |||||||
TOTAL PRODUCER DURABLES | 3,638,915 | |||||||
|
| |||||||
TECHNOLOGY - (24.08%) | ||||||||
Communications Technology (2.19%) | ||||||||
Riverbed Technology, Inc.** | 19,750 | 375,053 | ||||||
|
| |||||||
Computer Services Software & Systems (13.47%) | ||||||||
BroadSoft, Inc.** | 22,750 | 520,975 | ||||||
Callidus Software, Inc.** | 32,000 | 450,880 | ||||||
Jive Software, Inc.** | 93,000 | 568,230 | ||||||
Marin Software, Inc.** | 22,250 | 199,137 | ||||||
PTC, Inc.** | 4,750 | 181,213 | ||||||
Tangoe, Inc.** | 26,000 | 381,420 | ||||||
|
| |||||||
| 2,301,855 | ||||||||
|
| |||||||
Electronic Entertainment (1.48%) | ||||||||
DTS, Inc.** | 8,500 | 253,130 | ||||||
|
| |||||||
Electronics (3.11%) | ||||||||
IPG Photonics Corp.** | 7,250 | 532,222 | ||||||
|
| |||||||
See Notes to Financial Statements.
Semi-Annual Report | October 31, 2014 |
9 |
Table of Contents
Stonebridge Small-Cap Growth Fund
| Statement of Investments
| |
| ||
October 31, 2014 (Unaudited) | ||
Shares | Market Value | |||||||
TECHNOLOGY (continued) | ||||||||
Semiconductors & Components (2.36%) | ||||||||
EZchip Semiconductor, Ltd.** | 19,000 | $ | 403,370 | |||||
|
| |||||||
Telecommunications Equipment (1.47%) | ||||||||
Ubiquiti Networks, Inc. | 7,000 | 250,390 | ||||||
|
| |||||||
TOTAL TECHNOLOGY | 4,116,020 | |||||||
|
| |||||||
UTILITIES - (1.93%) | ||||||||
Utilities: Telecommunications (1.93%) | ||||||||
8x8, Inc.** | 42,000 | 330,120 | ||||||
|
| |||||||
TOTAL UTILITIES | 330,120 | |||||||
|
| |||||||
TOTAL COMMON STOCKS | 16,964,029 | |||||||
|
| |||||||
MONEY MARKET MUTUAL FUNDS (0.19%) | ||||||||
Fidelity® Institutional Money Market | 32,347 | 32,347 | ||||||
|
| |||||||
TOTAL MONEY MARKET MUTUAL FUNDS | 32,347 | |||||||
|
| |||||||
TOTAL INVESTMENTS (99.42%) | $ | 16,996,376 | ||||||
OTHER ASSETS IN EXCESS OF LIABILITIES (0.58%) | 98,838 | |||||||
|
| |||||||
NET ASSETS (100.00%) | $ | 17,095,214 | ||||||
|
| |||||||
** | Non-Income Producing Security. |
Common Abbreviations:
ADR - American Depositary Receipt.
Ltd. - Limited.
PLC - Public Limited Company.
Holdings are subject to change.
See Notes to Financial Statements.
10 |
Stonebridge Small-Cap Growth Fund |
Table of Contents
Stonebridge Small-Cap Growth Fund
| Statement of Investments
| |
| ||
October 31, 2014 (Unaudited) | ||
For Fund compliance purposes, the Fund’s industry classifications refer to any one or more of the industry sub-classifications used by one or more widely recognized market indexes or ratings group indexes, and/or as defined by Fund management. This definition may not apply for purposes of this report, which may combine industry sub-classifications for reporting ease. Industries are shown as a percentage of net assets.
See Notes to Financial Statements.
Semi-Annual Report | October 31, 2014 |
11 |
Table of Contents
Stonebridge Small-Cap Growth Fund
| Statement of Assets and Liabilities
| |
| ||
October 31, 2014 (Unaudited) | ||
ASSETS: | ||||
Investments, at value | $ | 16,996,376 | ||
Receivable for investments sold | 439,136 | |||
Prepaid and other assets | 11,701 | |||
|
| |||
Total assets | 17,447,213 | |||
|
| |||
LIABILITIES: | ||||
Payable for investments purchased | 291,165 | |||
Payable for fund shares redeemed | 11,073 | |||
Advisory fees payable | 10,344 | |||
Administration and fund accounting fees payable | 6,895 | |||
Payable for transfer agent fees | 9,641 | |||
Payable for professional fees | 11,449 | |||
Payable for trustee fees and expenses | 177 | |||
Payable for chief compliance officer fees | 1,789 | |||
Accrued expenses and other liabilities | 9,466 | |||
|
| |||
Total liabilities | 351,999 | |||
|
| |||
Net Assets | $ | 17,095,214 | ||
|
| |||
COMPOSITION OF NET ASSETS: | ||||
Paid-in capital (Note 5) | $ | 16,539,818 | ||
Accumulated net investment loss | (165,410) | |||
Accumulated net realized gain on investments | 458,469 | |||
Net unrealized appreciation in value of investments | 262,337 | |||
|
| |||
Net Assets | $ | 17,095,214 | ||
|
| |||
NET ASSET VALUE PER SHARE: | ||||
Net Assets | $ | 17,095,214 | ||
Shares outstanding | 1,893,808 | |||
Net asset value and redemption price per share* | $ | 9.03 | ||
|
| |||
Investments, at cost | $ | 16,734,039 | ||
|
| |||
* | A charge of 2% is imposed on the redemption proceeds of shares held 30 days or less (Note 5). |
See Notes to Financial Statements.
12 |
Stonebridge Small-Cap Growth Fund |
Table of Contents
Stonebridge Small-Cap Growth Fund
|
| |
| ||
For the Six Months Ended October 31, 2014 (Unaudited) | ||
INCOME: | ||||
Dividends | $ | 21,729 | ||
Foreign taxes withheld on dividends | (195) | |||
|
| |||
Total Income | 21,534 | |||
|
| |||
EXPENSES: | ||||
Investment advisory fees (Note 6) | 67,732 | |||
Administration fees | 38,866 | |||
Transfer agent fees | 37,416 | |||
Fund accounting fees and expenses | 1,769 | |||
Custodian fees | 2,537 | |||
Professional fees | 9,528 | |||
Printing fees | 5,269 | |||
Registration fees | 4,841 | |||
Trustee fees and expenses | 303 | |||
Chief compliance officer fees | 10,356 | |||
Insurance | 191 | |||
Other | 8,136 | |||
|
| |||
Total Expenses | 186,944 | |||
|
| |||
Net Investment Loss | (165,410) | |||
|
| |||
REALIZED AND UNREALIZED GAIN/(LOSS) ON INVESTMENTS: | ||||
Net realized loss on investments | (636,390) | |||
Change in net unrealized appreciation of investments | 46,192 | |||
|
| |||
Net Realized and Unrealized Loss on Investments | (590,198) | |||
|
| |||
Net Decrease in Net Assets Resulting From Operations | $ | (755,608) | ||
|
| |||
See Notes to Financial Statements.
Semi-Annual Report | October 31, 2014 |
13 |
Table of Contents
Stonebridge Small-Cap Growth Fund
| Statements of Changes in Net Assets
| |
| ||
| For the Six Months Ended October 31, 2014 (Unaudited) | For the April 30, 2014 | |||||||
OPERATIONS: | ||||||||
Net investment loss | $ | (165,410) | $ | (399,846) | ||||
Net realized gain/(loss) on investments | (636,390) | 2,637,902 | ||||||
Change in net unrealized appreciation/(depreciation) of investments | 46,192 | (82,960) | ||||||
|
| |||||||
Increase/(Decrease) in Net Assets Resulting from Operations | (755,608) | 2,155,096 | ||||||
|
| |||||||
DISTRIBUTIONS (Note 3): | ||||||||
From net realized gains | – | (746,920) | ||||||
|
| |||||||
Total distributions | – | (746,920) | ||||||
|
| |||||||
CAPITAL SHARE TRANSACTIONS (NOTE 5): | ||||||||
Net decrease in shareholder activity derived from beneficial interest transactions, net of redemption fees | (853,663) | (545,370) | ||||||
|
| |||||||
NET INCREASE/(DECREASE) IN NET ASSETS | (1,609,271) | 862,806 | ||||||
NET ASSETS: | ||||||||
Beginning of period | 18,704,485 | 17,841,679 | ||||||
|
| |||||||
End of period* | $ | 17,095,214 | $ | 18,704,485 | ||||
|
| |||||||
* Includes accumulated net investment loss of: | $ | (165,410) | $ | – | ||||
See Notes to Financial Statements.
14 |
Stonebridge Small-Cap Growth Fund |
Table of Contents
Intentionally Left Blank
Table of Contents
Stonebridge Small-Cap Growth Fund
| ||
| ||
For a share outstanding through the periods presented | ||
PER SHARE DATA |
Net asset value, beginning of year |
INCOME/(LOSS) FROM INVESTMENT OPERATIONS: |
Net investment loss |
Net realized and unrealized gain/(loss) on investments |
Total Income/(Loss) from Investment Operations |
DISTRIBUTIONS TO SHAREHOLDERS: |
From net realized gain on investments |
Total Distributions to Shareholders |
Net Increase/(Decrease) in Net Asset Value |
Net asset value, end of year |
Total Return |
Ratios & Supplemental Data: |
Net assets, end of year (in 000s) |
Ratios to average net assets: |
Expenses (excluding fee waivers) |
Expenses (including fee waivers) |
Net investment loss (including fee waivers) |
Portfolio Turnover Rate(5) |
(1) | The Fund’s fiscal year end changed from October 31st to April 30th. See Note 1. |
(2) | Calculated using the average shares method. |
(3) | Total return not annualized for periods less than one full year. |
(4) | Annualized. |
(5) | Portfolio turnover rate for periods less than one full year have not been annualized. |
See Notes to Financial Statements.
16 |
Stonebridge Small-Cap Growth Fund |
Table of Contents
| ||
| ||
Six Months Ended October 31, 2014 (Unaudited) | Year Ended April 30, 2014 | Six Months Ended April 30, 2013(1) | Year Ended 2012 | Year Ended 2011 | Year Ended 2010 | Year Ended 2009 | ||||||||||||||||||
$9.42 | $8.74 | $8.42 | $7.90 | $7.91 | $6.38 | $5.35 | ||||||||||||||||||
| ||||||||||||||||||||||||
(0.09)(2) | (0.20)(2) | (0.15)(2) | (0.30) | (0.26) | (0.24) | (0.18) | ||||||||||||||||||
(0.30) | 1.26 | 0.47 | 0.82 | 0.25 | 1.77 | 1.21 | ||||||||||||||||||
| ||||||||||||||||||||||||
(0.39) | 1.06 | 0.32 | 0.52 | (0.01) | 1.53 | 1.03 | ||||||||||||||||||
| ||||||||||||||||||||||||
– | (0.38) | – | – | – | – | – | ||||||||||||||||||
| ||||||||||||||||||||||||
– | (0.38) | – | – | – | – | – | ||||||||||||||||||
| ||||||||||||||||||||||||
(0.39) | 0.68 | 0.32 | 0.52 | (0.01) | 1.53 | 1.03 | ||||||||||||||||||
| ||||||||||||||||||||||||
$9.03 | $9.42 | $8.74 | $8.42 | $7.90 | $7.91 | $6.38 | ||||||||||||||||||
| ||||||||||||||||||||||||
| ||||||||||||||||||||||||
(4.14)%(3) | 12.20% | 3.80%(3) | 6.58% | (0.13)% | 23.98% | 19.25% | ||||||||||||||||||
| ||||||||||||||||||||||||
| ||||||||||||||||||||||||
$17,095 | $18,704 | $17,842 | $12,673 | $12,457 | $13,492 | $11,767 | ||||||||||||||||||
| ||||||||||||||||||||||||
| ||||||||||||||||||||||||
N/A | N/A | N/A | N/A | N/A | 3.48% | N/A | ||||||||||||||||||
| ||||||||||||||||||||||||
| ||||||||||||||||||||||||
2.07%(4) | 2.25% | 3.86%(4) | 3.89% | 3.36% | 3.40% | 3.85% | ||||||||||||||||||
| ||||||||||||||||||||||||
| ||||||||||||||||||||||||
(1.83)%(4) | (2.09)% | (3.52)%(4) | (3.58)% | (2.96)% | (3.19)% | (3.34)% | ||||||||||||||||||
| ||||||||||||||||||||||||
| ||||||||||||||||||||||||
53% | 152% | 89% | 222% | 195% | 115% | 137% | ||||||||||||||||||
| ||||||||||||||||||||||||
| ||||||||||||||||||||||||
Semi-Annual Report | October 31, 2014 |
17 |
Table of Contents
Stonebridge Small-Cap Growth Fund
|
| |
| ||
October 31, 2014 (Unaudited) | ||
1. ORGANIZATION
Financial Investors Trust (the “Trust”), a Delaware statutory trust, is an open-end management investment company registered under the Investment Company Act of 1940, as amended (“1940 Act”). As of October 31, 2014, the Trust had 32 registered funds. This semi-annual report describes the Stonebridge Small-Cap Growth Fund (prior to the close of business on February 15, 2013 known as the Stonebridge Institutional Small-Cap Growth Fund) (the “Fund”). The Fund seeks long-term capital growth of capital.
The Fund is a successor to a previously operational fund which was a series of the Stonebridge Funds Trust, a Delaware statutory trust, and was organized into a series of the Trust effective as of the close of business on February 15, 2013. As a result, the Fund’s fiscal year end changed from October 31st to April 30th.
2. SIGNIFICANT ACCOUNTING POLICIES
The accompanying financial statements were prepared in accordance with accounting principles generally accepted in the United States of America (“U.S. GAAP”). The preparation of financial statements in conformity with U.S. GAAP requires management to make certain estimates and assumptions that affect the reported amounts of assets and liabilities and disclosures of contingent assets and liabilities at the date of the financial statements and the reported amounts of revenue and expenses during the period. Actual results could differ from those estimates. The Fund is considered an investment company for financial reporting purposes under GAAP. The following is a summary of significant accounting policies consistently followed by the Fund in preparation of its financial statements.
Investment Valuation: The Fund generally values its securities based on market prices determined at the close of regular trading on the New York Stock Exchange (“NYSE”), normally 4:00 p.m. Eastern Time, on each day the NYSE is open for trading.
For equity securities and mutual funds that are traded on an exchange, the market price is usually the closing sale or official closing price on that exchange. In the case of equity securities not traded on an exchange, or if such closing prices are not otherwise available, the securities are valued at the mean of the most recent bid and ask prices on such day. Redeemable securities issued by open-end registered investment companies are valued at the investment company’s applicable net asset value, with the exception of exchange-traded open-end investment companies, which are priced as equity securities.
Short–term debt obligations that will mature in 60 days or less are valued at amortized cost, unless it is determined that using this method would not reflect an investment’s fair value. Investments in non-exchange traded funds are fair valued at their respective net asset values.
When such prices or quotations are not available, or when the Fair Value Committee appointed by the Board of Trustees (the “Board”) believes that they are unreliable, securities may be priced using fair value procedures approved by the Board.
Fair Value Measurements: The Fund discloses the classification of its fair value measurements following a three-tier hierarchy based on the inputs used to measure fair value. Inputs refer broadly to the assumptions that market participants would use in pricing the asset or liability, including assumptions about risk. Inputs may be observable or unobservable. Observable inputs
18 |
Stonebridge Small-Cap Growth Fund |
Table of Contents
Stonebridge Small-Cap Growth Fund
| Notes to Financial Statements
| |
| ||
October 31, 2014 (Unaudited) | ||
reflect the assumptions market participants would use in pricing the asset or liability that are developed based on market data obtained from sources independent of the reporting entity.
Unobservable inputs reflect the reporting entity’s own assumptions about the assumptions market participants would use in pricing the asset or liability that are developed based on the best information available.
Various inputs are used in determining the value of the Fund’s investments as of the end of the reporting period. When inputs used fall into different levels of the fair value hierarchy, the level in the hierarchy within which the fair value measurement falls is determined based on the lowest level input that is significant to the fair value measurement in its entirety. The designated input levels are not necessarily an indication of the risk or liquidity associated with these investments. These inputs are categorized in the following hierarchy under applicable financial accounting standards:
Level 1 – | Unadjusted quoted prices in active markets for identical investments, unrestricted assets or liabilities that the Fund has the ability to access at the measurement date; | |
Level 2 – | Quoted prices which are not active, quoted prices for similar assets or liabilities in active markets or inputs other than quoted prices that are observable (either directly or indirectly) for substantially the full term of the asset or liability; and | |
Level 3 – | Significant unobservable prices or inputs (including the Fund’s own assumptions in determining the fair value of investments) where there is little or no market activity for the asset or liability at the measurement date. | |
The following is a summary of each input used to value the Fund as of October 31, 2014:
| Valuation Inputs | ||||||||||||||||
Investments in Securities at Value | Level 1 | Level 2 | Level 3 | Total | ||||||||||||
Common Stocks* | $ | 16,964,029 | $ | – | $ | – | $ | 16,964,029 | ||||||||
Money Market Mutual Funds | 32,347 | – | – | 32,347 | ||||||||||||
Total | $ | 16,996,376 | $ | – | $ | – | $ | 16,996,376 | ||||||||
| ||||||||||||||||
| ||||||||||||||||
* | For detailed descriptions, see the accompanying Statement of Investments. |
The Fund recognizes transfers between levels as of the end of the period. For the six months ended October 31, 2014, the Fund did not have any transfers between Level 1 and Level 2 securities. For the six months ended October 31, 2014, the Fund did not have any securities that used significant unobservable inputs (Level 3) in determining fair value.
Investment Transactions and Investment Income: Investment transactions are accounted for on the date the investments are purchased or sold (trade date). Realized gains and losses from investment transactions are reported on an identified cost basis. Interest income, which includes accretion of discounts, is accrued and recorded as earned. Dividend income is recognized on the ex-dividend date or for certain foreign securities, as soon as information is available to the Fund.
Trust Expenses: Some expenses of the Trust can be directly attributed to the Fund. Expenses which cannot be directly attributed to the Fund are apportioned among all funds in the Trust based on average net assets of each fund.
Semi-Annual Report | October 31, 2014 |
19 |
Table of Contents
Stonebridge Small-Cap Growth Fund
| Notes to Financial Statements
| |
| ||
October 31, 2014 (Unaudited) | ||
Fund Expenses: Expenses that are specific to the Fund are charged directly to the Fund.
Federal Income Taxes: The Fund complies with the requirements under Subchapter M of the Internal Revenue Code of 1986, as amended (the “Code”), applicable to regulated investment companies and intends to distribute substantially all of their net taxable income and net capital gains, if any, each year so that it will not be subject to excise tax on undistributed income and gains. The Fund is not subject to income taxes to the extent such distributions are made.
As of and during the six months ended October 31, 2014, the Fund did not have a liability for any unrecognized tax benefits. The Fund files U.S. federal, state, and local tax returns as required. The Fund’s tax returns are subject to examination by the relevant tax authorities until expiration of the applicable statute of limitations, which is generally three years after the filing of the tax return for federal purposes and four years for most state returns. Tax returns for open years have incorporated no uncertain tax positions that require a provision for income taxes.
Distributions to Shareholders: The Fund normally pays dividends and distributes capital gains, if any, on an annual basis. Income dividend distributions are derived from interest and other income the Fund receives from its investments, including short term capital gains. Long term capital gain distributions are derived from gains realized when the Fund sells a security it has owned for more than a year. The Fund may make additional distributions and dividends at other times if the portfolio manager believes doing so may be necessary for the Fund to avoid or reduce taxes.
3. TAX BASIS INFORMATION
Tax Basis of Investments: As of October 31, 2014, the aggregate cost of investments, gross unrealized appreciation/(depreciation) and net unrealized appreciation for Federal tax purposes was as follows:
Gross appreciation (excess of value over tax cost) | $ | 1,740,062 | ||||
Gross depreciation (excess of tax cost over value) | (1,562,526) | |||||
| ||||||
Net unrealized appreciation | $ | 177,536 | ||||
| ||||||
| ||||||
Cost of investments for income tax purposes | $ | 16,818,840 | ||||
| ||||||
| ||||||
Tax Basis of Distributions to Shareholders: The character of distributions made during the year from net investment income or net realized gains may differ from its ultimate characterization for federal income tax purposes. Also, due to the timing of dividend distributions, the fiscal year in which amounts are distributed may differ from the fiscal year in which the income or realized gain was recorded by the Fund.
The tax character of distributions paid during the year ended April 30, 2014, were as follows:
| Long-Term Capital | ||||||||
| Ordinary Income | Gain | |||||||
The Stonebridge Small-cap Growth Fund | $ 218,314 | $ 528,606 | ||||||
No distributions were paid during the six months ended October 31, 2014.
20 |
Stonebridge Small-Cap Growth Fund |
Table of Contents
Stonebridge Small-Cap Growth Fund
| Notes to Financial Statements
| |
| ||
October 31, 2014 (Unaudited) | ||
4. SECURITIES TRANSACTIONS
The cost of purchases and proceeds from sales of securities (excluding short-term securities) during the six months ended October 31, 2014, was as follows:
| Purchases | Sales | |||||||
Stonebridge Small-cap Growth Fund | $ | 9,441,028 | $ | 10,494,647 | ||||
5. SHARES OF BENEFICIAL INTEREST
The capitalization of the Trust consists of an unlimited number of shares of beneficial interest with no par value per share. Holders of the shares of the Fund of the Trust have one vote for each share held and a proportionate fraction of a vote for each fractional share. All shares issued and outstanding are fully paid and are non-assessable, transferable and redeemable at the option of the shareholder. Shares have no pre-emptive rights.
| Six Months Ended | Six Months Ended | Year Ended | Year Ended | |||||||||||||
| October 31, 2014 | October 31, 2014 | April 30, 2014 | April 30, 2014 | |||||||||||||
| Shares | Amount | Shares | Amount | |||||||||||||
Shares sold | 14,213 | $ | 127,724 | 11,430 | $ | 108,589 | ||||||||||
Shares issued in reinvestment of dividends | – | – | 78,468 | 734,465 | ||||||||||||
| ||||||||||||||||
Total | 14,213 | 127,724 | 89,898 | 843,054 | ||||||||||||
| ||||||||||||||||
Less shares redeemed, net of redemption fees | (106,522) | (981,387) | (144,715) | (1,388,424) | ||||||||||||
| ||||||||||||||||
Net Decrease | (92,309) | $ | (853,663) | (54,817) | $ | (545,370) | ||||||||||
| ||||||||||||||||
Shares redeemed within 30 days of purchase will incur a 2% short-term redemption fee deducted from the redemption amount. Redemption fees are reflected in the “Net increase/(decrease) in shareholder activity derived from beneficial interest transactions, net of redemption fees” in the Statements of Changes in Net Assets.
For the six months ended October 31, 2014, and the year ended April 30, 2014 the Fund did not receive any redemption fees.
6. MANAGEMENT AND RELATED-PARTY TRANSACTIONS
The Trust has entered into an advisory agreement with Stonebridge Capital Management, Inc. (the “Adviser”) with respect to the Fund. The advisory agreement has been approved by the Board and shareholders. Pursuant to the advisory agreement with the Trust, the Adviser is entitled to investment advisory fees, computed daily and payable monthly at an annual rate of 0.75% of the average daily net assets of the Fund.
Fund Accounting Fees and Expenses
ALPS Fund Services, Inc. (“ALPS” and the “Administrator”) (an affiliate of ALPS Distributors, Inc.) serves as administrator to the Fund. The Fund has agreed to pay expenses incurred in connection
Semi-Annual Report | October 31, 2014 |
21 |
Table of Contents
Stonebridge Small-Cap Growth Fund
| Notes to Financial Statements
| |
| ||
October 31, 2014 (Unaudited) | ||
with its administrative activities. Pursuant to the Administration, Bookkeeping and Pricing Services Agreement, ALPS will provide operational services to the Fund including, but not limited to fund accounting and fund administration and generally assist in the Fund’s operations.
The annual administrative fee, billed monthly in total and allocated to the Fund, in the amount of the greater of (a) the annual minimum of $75,000 or (b) following basis point fee schedule:
Average Total Net Assets | Contractual Fee | |||
Between $0-$500M | 0.05% | |||
$500M-$1B | 0.03% | |||
Above $1B | 0.02% |
The Administrator is also reimbursed by the Fund for certain out-of-pocket expenses.
Transfer Agent
ALPS serves as transfer, dividend paying and shareholder servicing agent for the Fund. ALPS receives an annual minimum fee, a fee based upon the number of shareholder accounts, and is also reimbursed by the Fund for certain out-of-pocket expenses.
Compliance Services
ALPS provides services that assist the Trust’s chief compliance officer in monitoring and testing the policies and procedures of the Trust in conjunction with requirements under Rule 38a-1 under the 1940 Act and receives an annual base fee. ALPS is reimbursed for certain out-of-pocket expenses by the Fund.
Principal Financial Officer
ALPS receives an annual fee for providing principal financial officer services to the Fund.
Distributor
ALPS Distributors, Inc. (“ADI” or the “Distributor”) (an affiliate of ALPS) acts as the distributor of the Fund’s shares pursuant to a Distribution Agreement with the Trust. Shares are sold on a continuous basis by ADI as agent for the Fund, and ADI has agreed to use its best efforts to solicit orders for the sale of the Fund’s shares, although it is not obliged to sell any particular amount of shares. ADI is not entitled to any compensation for its services as Distributor. ADI is registered as a broker-dealer with the Securities and Exchange Commission.
7. INDEMNIFICATIONS
Under the Trust’s organizational documents, its officers and Trustees are indemnified against certain liability arising out of the performance of their duties to the Trust. Additionally, in the normal course of business, the Trust enters into contracts with service providers that may contain general indemnification clauses, which may permit indemnification to the extent permissible under applicable law. The Trust’s maximum exposure under these arrangements is unknown, as this would involve future claims that may be made against the Trust that have not yet occurred.
22 |
Stonebridge Small-Cap Growth Fund |
Table of Contents
Stonebridge Small-Cap Growth Fund
| Disclosure Regarding Approval of Fund Advisory Agreement
| |
| ||
October 31, 2014 (Unaudited) | ||
On September 9, 2014, the Trustees met in person to discuss, among other things, the approval of the investment advisory agreement between the Trust and Stonebridge Capital Management, Incorporated (the “Investment Advisory Agreement”), in accordance with Section 15(c) of the 1940 Act. The Independent Trustees met with independent legal counsel during executive session and discussed the Investment Advisory Agreement and other related materials.
In renewing and approving the Investment Advisory Agreement with Stonebridge, the Trustees, including the Independent Trustees, considered the following factors with respect to the Stonebridge Small-Cap Growth Fund (the “Stonebridge Fund”):
Investment Advisory Fee Rate: The Trustees reviewed and considered the contractual annual advisory fee to be paid by the Trust, on behalf of the Stonebridge Fund, to Stonebridge of 0.75% of the Stonebridge Fund’s daily average net assets, in light of the extent and quality of the advisory services provided by Stonebridge to the Stonebridge Fund.
The Trustees considered the information they received comparing the Stonebridge Funds’ contractual annual advisory fee and total net expenses with those of funds in both the relevant peer expense group and universe of funds provided by an independent provider of investment company data.
Based on such information, the Trustees further determined that the contractual annual advisory fee of 0.75% of assets was within the lowest quartile of the Stonebridge Fund’s peer group and universe. The Trustees noted that the total net expense ratio for the Stonebridge Fund continued to remain high, but had been reduced significantly since the adoption of the Stonebridge Fund in 2013.
The Trustees also considered the fee structures applicable to Stonebridge’s other clients employing a comparable strategy to that of the Stonebridge Fund.
Nature, Extent and Quality of the Services under the Investment Advisory Agreement: The Trustees received and considered information regarding the nature, extent and quality of services to be provided to the Stonebridge Fund under the Investment Advisory Agreement. The Trustees reviewed certain background materials supplied by Stonebridge in its presentation, including its Form ADV.
The Trustees reviewed and considered Stonebridge’s investment advisory personnel, its history as an asset manager and its performance and the amount of assets currently under management by Stonebridge. The Trustees also reviewed the research and decision-making processes utilized by Stonebridge, including the methods adopted to seek to achieve compliance with the investment objectives, policies and restrictions of the Stonebridge Fund.
The Trustees considered the background and experience of Stonebridge’s management in connection with the Stonebridge Funds, including reviewing the qualifications, backgrounds and responsibilities of the management team primarily responsible for the day-to-day portfolio management of the Stonebridge Fund, and the extent of the resources devoted to research and analysis of actual and potential investments.
Semi-Annual Report | October 31, 2014 |
23 |
Table of Contents
Stonebridge Small-Cap Growth Fund
| Disclosure Regarding Approval of Fund Advisory Agreement
| |
| ||
October 31, 2014 (Unaudited) | ||
The Trustees also reviewed, among other things, Stonebridge’s trading policies and procedures and its Code of Ethics.
Performance: The Trustees reviewed historical, combined performance information for the Stonebridge Fund (before and after the adoption date) for the three-month, 1-year, 3-year and 5-year periods ended June 30, 2014. That review included a comparison of the Stonebridge Fund’s performance to the performance of a universe of comparable funds selected by an independent provider of investment company data. The Trustees noted the performance of the Stonebridge Fund significantly lagged that of its peer universe median for those periods, but showed improving relative performance for the most recent 3-month period. The Trustees also considered Stonebridge’s discussion of the Stonebridge Fund’s top contributors and top detractors, as well as Stonebridge’s performance and reputation generally and its investment techniques, risk management controls and decision-making processes.
Total Expense Ratios and the Adviser’s Profitability: The Trustees received and considered a profitability analysis prepared by Stonebridge based on the fees payable under the Investment Advisory Agreement. The Trustees considered the profits, if any, anticipated to be realized by Stonebridge in connection with the operation of the Stonebridge Fund. The Board then reviewed Stonebridge’s financial statements in order to analyze the financial condition and stability and profitability of the adviser.
Economies of Scale: The Trustees considered whether economies of scale in the provision of services to the Stonebridge Fund will be passed along to the shareholders under the proposed agreements.
Other Benefits to the Adviser: The Trustees reviewed and considered any other incidental benefits derived or to be derived by Stonebridge from its relationship with the Stonebridge Fund, including whether soft dollar arrangements were used.
In selecting Stonebridge as the Stonebridge Fund’s investment adviser and approving the Investment Advisory Agreement and the fees charged under the Investment Advisory Agreement, the Trustees concluded that no single factor reviewed by the Trustees was identified by the Trustees to be determinative as the principal factor in whether to approve the Investment Advisory Agreement. Further, the Independent Trustees were advised by separate independent legal counsel throughout the process. The Trustees, including all of the Independent Trustees, concluded that:
— | the investment advisory fees to be received by Stonebridge with respect to the Stonebridge Fund was within the lowest quartile of the Stonebridge Fund’s peer group and universe, and that the total net expense ratio for the Stonebridge Fund continued to remain high, but had been reduced significantly since the adoption of the Stonebridge Fund in 2013; |
— | the nature, extent and quality of services to be rendered by Stonebridge under the Investment Advisory Agreement were adequate; |
— | the performance of the Stonebridge Fund continued to lag its peer universe, but showed improving relative performance in more recent periods; |
24 |
Stonebridge Small-Cap Growth Fund |
Table of Contents
Stonebridge Small-Cap Growth Fund
| Disclosure Regarding Approval of Fund Advisory Agreement
| |
| ||
October 31, 2014 (Unaudited)
| ||
— | bearing in mind the limitations of comparing different types of managed accounts and the different levels of service typically associated with such accounts, the fee structures applicable to Stonebridge’s other clients employing a comparable strategy to that of the Stonebridge Fund were not indicative of any unreasonableness with respect to the advisory fees proposed to be payable by the Stonebridge Fund; |
— | the profit, if any, anticipated to be realized by Stonebridge in connection with the operation of the Stonebridge Fund is not unreasonable to the Stonebridge Fund; and |
— | there were no material economies of scale or other incidental benefits accruing to Stonebridge in connection with its relationship with the Stonebridge Fund. |
Based on the Trustees’ deliberations and their evaluation of the information described above, the Trustees, including all of the Independent Trustees, concluded that Stonebridge’s compensation for investment advisory services is consistent with the best interests of the Stonebridge Fund and its shareholders.
Semi-Annual Report | October 31, 2014 |
25 |
Table of Contents
Stonebridge Small-Cap Growth Fund
|
| |
| ||
October 31, 2014 (Unaudited) | ||
1. FUND HOLDINGS
The Fund files its complete schedule of portfolio holdings with the Securities and Exchange Commission (the “SEC”) for the first and third quarters of each fiscal year on Form N-Q within 60 days after the end of the period. Copies of the Fund’s Form N-Q are available without charge on the SEC website at http://www.sec.gov. You may also review and copy the Form N-Q at the SEC’s Public Reference Room in Washington, DC. For more information about the operation of the Public Reference Room, please call the SEC at 1-800-SEC-0330.
2. FUND PROXY VOTING POLICIES, PROCEDURES AND SUMMARIES
The Fund’s policies and procedures used in determining how to vote proxies and information regarding how the Fund voted proxies relating to portfolio securities during the most recent prior 12-month period ending June 30 are available without charge, (1) upon request, by calling (toll-free) 800-639-3935 and (2) on the SEC’s website at http://www.sec.gov.
26 |
Stonebridge Small-Cap Growth Fund |
Table of Contents
Page Intentionally Left Blank
Table of Contents

Table of Contents
Table of Contents
CONTENTS | PAGE | |
| 1 | ||
| 6 | ||
| 9 | ||
| 8 | ||
| 11 | ||
| 12 | ||
| 16 | ||
| 20 | ||
| 21 | ||
| 22 | ||
| 23 | ||
| 24 | ||
| 26 | ||
| 28 | ||
| 35 | ||
| www.vulcanvaluepartners.com |
Table of Contents
October 31, 2014 (Unaudited)
PORTFOLIO REVIEW
October 31, 2014
For the six months ended October 31, 2014, Vulcan Value Partners Fund returned 9.29% and the Vulcan Value Partners Small Cap Fund returned 4.38%. Having said that, we place no weight on short-term results, good or bad, and neither should you. In fact, we have and will continue to willingly make decisions that may negatively impact short-term performance when we believe we can mitigate risk and improve our opportunity for long-term returns. We encourage you to place more weight on our longer-term historical results and a great deal of weight on our long-term prospects. Vulcan Value Partners Fund and Vulcan Value Partners Small Cap Fund received a 5-Star Overall Morningstar Rating. (As of October 31, 2014, out of 1,509 Large Growth, and 614 Small Blend Funds, respectively, derived from a weighted average of the Fund’s three-, five- and ten-year (if applicable) Morningstar metrics, which are based on risk-adjusted return performance.)1
The six months ended October 31, 2014 was marked by complacency, low volatility, and greed winning out over fear. It was the kind of environment that is most challenging for us. Despite the limited opportunities that came our way, we believe we made the most of the few that did. I was very pleased with the tenacity of our research team. Through old-fashioned, roll up your sleeves hard work, we believe we were able to mitigate risk and improve our prospective returns. We continued to become more diversified and, very importantly, also reduced our estimated price to value ratios, thereby improving our margin of safety.
Our traders are an integral part of the research team and they do a fantastic job for us. Led by Anne Morrow Jones (who recently gave birth to a beautiful, healthy son), Michele O’Daniel, Geoff Kiker, and Leslie Boshell have delivered positive trading results over the past twelve month period ending September 30, 2014 in terms of market impact. From Anne’s perspective, she raises the bar for multi-tasking! As impressive as these results are, they do not capture the benefits we realize from our trading team discerning volume and price impacts in conjunction with price and value. Particularly in markets like the one we are now experiencing, where estimated discounts are not as great nor as plentiful as we would prefer, we believe our ability to execute on the trading desk is a real competitive advantage. It is an advantage we intend to maintain by being disciplined in who we work for and how large we become. As you know, we have closed the Vulcan Value Partners Small Cap Fund. We will close any strategy before size becomes an impediment to our ability to execute.
In terms of who we work for – thank you. You are one of our competitive advantages. Your patient capital allows us to take advantage of opportunities when they occur when others are forced sellers at exactly the wrong time. We truly have a partnership and we are grateful for you, our client-partners.
As this letter is being written, volatility has returned to the markets. We hope it continues. We believe we are well positioned with ample liquidity (a benefit of increased diversification) and, at the same time, fully invested in what we believe are outstanding businesses with stable, steadily compounding values. We also follow a number of what we believe are equally outstanding or, sometimes, even better businesses that are currently overvalued. Increased volatility increases the probability that a few of them will become discounted enough to make their way into our
Semi-Annual Report | October 31, 2014 | 1 |
Table of Contents
Shareholder Letter
| ||
| ||
October 31, 2014 (Unaudited) | ||
portfolios. We are not there yet, but it is nice to be headed in the right direction… and to be prepared for it.
Our results were positively impacted by our decision to exit Tesco in the second quarter. Our goal is to always protect capital and mitigate risk first. Returns will follow. In our second quarter letter we wrote the following about Tesco:
We sold one position, Tesco. Stated simply, Tesco is still a good business, but we thought it was a great business when we bought it roughly two years ago. We want to see our businesses at least meet and, hopefully, exceed the assumptions we are using to value them. If they do not do so in a reasonable period of time (we give them two years) then we re-evaluate our assumptions and the case for the investment. We define a mistake as a company whose estimated value has dropped. We do not define a mistake as a company whose price has dropped, as long as the estimated value is steady or growing. Despite management’s best efforts, Tesco did not meet our expectations. Even though it dominates the UK grocery business with a commanding market share lead over its rivals and has an enviable real estate portfolio, the company has not been able to fend off increased competition from low end rivals Aldi and Lidl and from the high end by Waitrose and Whole Foods. When we bought Tesco, the UK was in recession and same store sales were negative. We incorporated those results in our valuation but expected same store sales to turn positive when the UK emerged from recession, which it has. In fact, the UK economy is currently one of the strongest in the developed world. Despite the economic rebound, Tesco’s same store sales are still negative and our estimated value has dropped. This kind of risk is why we demand a margin of safety and never knowingly pay fair value for anything. We made a small profit on our investment in Tesco despite the estimated value dropping because it was very discounted when we bought it and the resulting margin of safety mitigated the risk of owning it.
Please note that we spent a lot more time in this section of the letter discussing Tesco than we did discussing our successes. In fact, we have not mentioned any successes, even though they have far outweighed our mistakes. We think we become better analysts by studying our mistakes than by dwelling on our successes and allocate our time accordingly.
We sold our stake in Tesco at an average price of £2.91. As this letter is being written it is trading at £1.93, a decline of 33.7%.
In the discussion that follows, we generally define material contributors and detractors as companies having a greater than 1% impact on the portfolio.
Vulcan Value Partners Fund Review2
We bought six new positions during the period and did not exit any positions.
There were no material contributors or detractors to performance in the period.
New purchases included Aetna, State Street, Sabre Corp., Boeing, Colgate-Palmolive, and Fossil Group. Aetna’s stock price has been under pressure due to concerns about the Affordable Care Act, but its estimated value has continued to grow. State Street is similar to Bank of New York Mellon, which we also own, but it is growing faster and became available to us at an attractive discount to our estimate of fair value. Sabre Corp. has a strong position in North America supplying
2 |
www.vulcanvaluepartners.com |
Table of Contents
Shareholder Letter
| ||
| ||
October 31, 2014 (Unaudited) | ||
mission critical software to airlines and the travel industry. We have owned and written about Boeing in the past. The company has done an outstanding job growing its estimated value since we sold it in the second quarter of 2010. Boeing’s stock has traded down double digits this year while its estimated value has continued to increase, making it more attractive than the more fully valued companies we trimmed to pay for it. Colgate-Palmolive is a leading consumer products company with strong overseas franchises. The strong dollar is temporarily creating a headwind for their otherwise consistently outstanding results. This currency induced slowdown has given us an opportunity to buy what we believe is a great business at an attractive price. Fossil Group is a leading affordable luxury brand company specializing in watches. They have strong brands, global distribution, and manufacturing advantages under one roof. Their stock price has suffered due to concerns about the new Apple Watch. We think there is a market for both traditional and smart watches. Moreover, we believe Fossil stands to benefit from selling its own branded Android smart watches, if smart watches catch on.
With the changes mentioned above combined with reallocating capital from more fully valued companies into more undervalued companies within the portfolio, we were able to both lower our estimated price to value ratio and further increase diversification during the period. As a result, we believe we are well positioned to take advantage of market volatility when it occurs.
Vulcan Value Partners Small Cap Fund Review2
As you know, we have been increasingly bearish in our comments regarding small caps throughout the year. We are pleased to be able to tell you that we are feeling a little bit better; not a lot, but a little bit. Small caps as a group have been trading down all year. Valuation levels are still elevated and opportunities are fleeting at best. However, valuation levels are improving and we believe selected opportunities are appearing. Moreover, we believe our research team has done a great job taking advantage of the few opportunities that have come our way.
We bought nine new positions during the period and exited eight positions. Diversification has increased compared to last year, as we own 36 names in Vulcan Value Partners Small Cap Fund today versus 31 names a year ago.
There was one material contributor to performance and one material detractor to performance in the period.
New purchases include Select Comfort Corp., Exponent, Sabre Corp., Omnicell, Actuant Corp., Avery Dennison, Axis Capital Holdings, Iconix Brands, and Sturm Ruger. Select Comfort Corp. sells high end mattresses and related bedding items. It has a unique product and distribution network which differentiates it from its competitors. Exponent provides best of class engineering and scientific consulting through its 400 PHD’s currently on staff. Sabre Corp. has a dominant position in North America supplying mission critical software to airlines and the travel industry. Omnicell makes drug delivery systems for hospitals that improves safety and lowers costs. Actuant Corp. has leading market positions in niche manufacturing products, most of which involve hydraulics. The company has a long history of strong operating results and we believe excellent capital allocation. Avery Dennison is the largest maker of labels and related pressure sensitive materials in the world, which allows it to generate strong free cash flow. Axis Capital Holdings is a Bermuda based insurer with strong underwriting results and outstanding capital allocation. Iconix Brand Group is discussed below. Sturm Ruger is a leading firearms maker. The company enjoys high barriers to
Semi-Annual Report | October 31, 2014 |
3 |
Table of Contents
Shareholder Letter
| ||
| ||
October 31, 2014 (Unaudited) | ||
entry, strong brands, and broad distribution which translate into consistent free cash flow generation and very high returns on invested capital.
Sells include Albemarle, Conversant, Heartland Payment Systems, Iconix Brand Group, and Select Comfort. Albemarle is a well-managed specialty chemicals company that made an acquisition that did not make sense to us. With acquisition related risk rising, we decided to reallocate capital to the new purchases above. Conversant was a material contributor to performance during the period and is discussed below. Heartland Payment Systems was another good investment for us. We owned it for nearly five years. During that time, we enjoyed high double digit average annual returns as the company’s stock price compounded faster than its value. Consequently, a margin of safety no longer existed for us and we sold it at our estimate of fair value. No matter how much we like a business, we will sell it when we no longer enjoy a margin of safety in terms of estimated value over price. Iconix Brand Group is a company we have owned for several years and it has been an excellent investment for us. We repurchased it during the third quarter, not being able to buy all we wanted at prices that we found attractive. However, the stock rallied further so we sold our stake as we no longer had a margin of safety. Select Comfort was an excellent investment for us, but it also rallied and reached our estimate of fair value faster than we anticipated, so we sold it to reallocate capital to more companies with a greater estimated discount.
Conversant was our largest position going into the third quarter and our largest contributor to performance. During the third quarter, Conversant announced that it was being acquired by Alliance Data Systems, so we were forced sellers. Conversant was an outstanding investment for us, and selling it was bittersweet.
Nu Skin was our largest position at the end of the third quarter, and it was the largest detractor to performance. Nu Skin is a highly profitable, rapidly growing company with the majority of its sales outside the U.S. The company utilizes a direct selling model to distribute its skin care and health related products. A temporary regulatory issue, since resolved, caused an interruption in their rapidly expanding Chinese operations. We believe the long-term fundamentals driving the company’s business remain intact and that this short-term disruption has created an attractive buying opportunity.
We are particularly pleased with the progress we made in improving Vulcan Value Partners Small Cap Fund’s estimated price to value ratio during the period. Overall valuations are still challenging, but our research productivity has helped us overcome a headwind.
I am very proud of the work our entire team did during the period to mitigate risk and improve our long-term prospective returns. The market did us no favors in the period. Still, we were able to execute our investment philosophy and lower estimated price to value ratios, mitigate risk, and improve liquidity. We believe we are well positioned to take advantage of increased volatility when it occurs.
Thank you for your long-term time horizon, patient capital, and confidence in us.
C.T. Fitzpatrick
Chief Executive Officer
4 |
www.vulcanvaluepartners.com |
Table of Contents
Shareholder Letter
| ||
| ||
October 31, 2014 (Unaudited) | ||
1 | For each fund with at least a three-year history, Morningstar calculates a Morningstar Rating™ based on a Morningstar Risk-Adjusted Return measure that accounts for variation in a fund’s monthly performance (including the effects of sales charges, loads, and redemption fees), placing more emphasis on downward variations and rewarding consistent performance. The top 10% of funds in each category receive 5 stars, the next 22.5% receive 4 stars, the next 35% receive 3 stars, the next 22.5% receive 2 stars and the bottom 10% receive 1 star. (Each share class is counted as a fraction of one fund within this scale and rated separately, which may cause slight variations in the distribution percentages.) The Overall Morningstar Rating for a fund is derived from a weighted average of the performance figures associated with its three-, five- and ten-year (if applicable) Morningstar Rating metrics, as of October 31, 2014. Morningstar Rating is for the retail share class only; other classes may have different performance characteristics. © 2014 Morningstar, Inc. All Rights Reserved. The information contained herein: (1) is proprietary to Morningstar and/or its content providers; (2) may not be copied or distributed; and (3) is not warranted to be accurate, complete or timely. Neither Morningstar nor its content providers are responsible for any damages or losses arising from any use of this information. Vulcan Value Partners (VVPLX) was rated 5 Stars out of 1,509 for the 3-year period against Large Growth Funds. Vulcan Value Partners (VVPSX) was rated 5 Stars out of 614 for the 3-year period against Small Blend Funds. All information in this report is as of the date shown in the upper right hand corner unless otherwise indicated. |
² | Please see page 6 and 9 for 1 year and inception to date returns for the Vulcan Value Partners Fund and Vulcan Value Partners Small Cap Fund, respectively. |
Margin of Safety is a favorable difference between the price of a company’s shares and the estimated intrinsic value of those shares.
Free Cash Flow is a measure of how much a business generates after accounting for capital expenditures. It is calculated as operating cash flow less capital expenditures.
Price to value ratio is a calculation that compares the price of a company’s stock to our appraisal of the company’s intrinsic value. Fair or intrinsic value is our estimate of the price a willing buyer would pay and a willing seller would accept, assuming neither was compelled to enter into a transaction.
The views and information discussed in this commentary are as of the date of publication, are subject to change, and may not reflect the writer’s current views. The views expressed represent an assessment of market conditions at a specific point in time, are opinions only and should not be relied upon as investment advice regarding a particular investment or markets in general. Such information does not constitute a recommendation to buy or sell specific securities or investment vehicles. It should not be assumed that any investment will be profitable or will equal the performance of the Funds or any securities or any sectors mentioned in this letter. The subject matter contained in this letter has been derived from several sources believed to be reliable and accurate at the time of compilation. Neither Vulcan Value Partners, LLC nor the Funds accept any liability for losses either direct or consequential caused by the use of this information.
Anne Jones is a registered representative of ALPS Distributors, Inc.
Diversification does not assure a profit or protect against loss.
The primary and secondary benchmark indexes are not actively managed and do not reflect any deductions for fees, expenses or taxes. An investor may not invest directly in an index.
Semi-Annual Report | October 31, 2014 |
5 |
Table of Contents
| ||
| ||
October 31, 2014 (Unaudited) | ||
Average Annual Total Returns (as of 10/31/14)
1 Year | 3 Year | Since Inception* | Expense Ratios | |||||||
| Total | Net** | |||||||||
| ||||||||||
Vulcan Value Partners Fund | 17.21% | 23.24% | 16.76% | 1.09% | 1.09% | |||||
S&P 500® Total Return Index*** | 17.27% | 19.77% | 15.20% | |||||||
Russell 1000® Value Index*** | 16.46% | 20.42% | 15.13% | |||||||
Performance data quoted represents past performance. Past performance does not guarantee future results. Investment return and principal value of an investment will fluctuate so that an investor’s shares, when sold or redeemed, may be worth more or less than the original cost. The Fund imposes a 2.00% redemption fee on shares held for less that 90 days. Current performance data may be higher or lower than actual data quoted. For the most current month-end performance data, please call 1-877-421-5078.
The table does not reflect the deduction of taxes that a shareholder would pay on Fund distributions or the redemption of Fund shares.
Subject to investment risks, including possible loss of the principal amount invested.
* | Fund inception date of 12/30/09. |
** | Vulcan Value Partners, LLC (“Vulcan” or the “Adviser”) has given a contractual agreement to the Fund that to the extent the Total Annual Fund Operating Expenses (as defined in Item 3 of Form N-1A) with respect to the Fund (exclusive of Acquired Fund Fees and Expenses (if any), brokerage expenses, interest expense, taxes and extraordinary expenses) (“Designated Annual Fund Operating Expenses”) exceed 1.25% of the Fund’s average daily net assets for a particular fiscal year of the Fund, the Adviser will reduce the Management Fee and/or Other Expenses otherwise payable to the Adviser with respect to the Fund for the fiscal year by an amount equal to such excess, and/or the Adviser shall reimburse the Fund by the amount of such excess. This agreement is in effect through August 31, 2015. Without this agreement, expenses could be higher. If the Adviser foregoes any fees and/or reimburses the Fund pursuant to this letter agreement with respect to a particular fiscal year, then the Adviser shall be entitled to recover from the Fund the amount foregone or reimbursed to the extent Designated Annual Fund Operating Expenses are less than 1.25% of the Fund’s average daily net assets if within three years after the expenses were incurred. Ratios as of the Prospectus dated August 31, 2014. |
*** | Indices are not actively managed and do not reflect any deduction for fees, expenses or taxes. An investor may not invest directly in an index. |
6 |
www.vulcanvaluepartners.com |
Table of Contents
Fund Overview
| ||
| ||
October 31, 2014 (Unaudited)
| ||
Performance of $10,000 Initial Investment (for the period ended October 31, 2014)
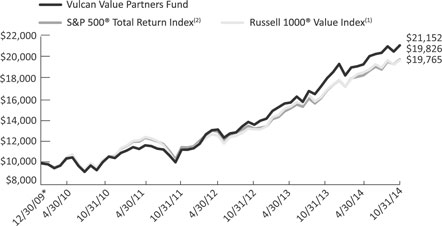
The chart above represents historical performance of a hypothetical investment of $10,000 in the Fund since inception. Past performance does not guarantee future results. This chart does not reflect the deduction of taxes that a shareholder would pay on Fund distributions or the redemption of Fund shares.
* | Fund inception date of 12/30/09. |
(1) | The Russell 1000® Value Index measures the performance of the large-cap value segment of the U.S. equity universe. It includes those Russell 1000® companies with lower price-to-book ratios and lower expected growth values. The index is not actively managed and does not reflect any deductions for fees, expense or taxes. An investor may not invest directly in an index. |
(2) | The S&P 500® Total Return Index is an unmanaged index of 500 common stocks chosen for market size, liquidity and industry group representation. It is a market-value weighted index. The index is not actively managed and does not reflect any deductions for fees, expense or taxes. An investor may not invest directly in an index. |
Investing in the Fund is subject to investment risks, including possible loss of the principal amount invested.
Industry Allocation (as a % of Net Assets)
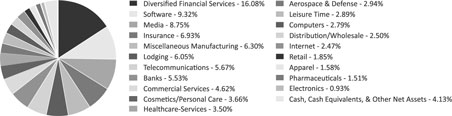
Semi-Annual Report | October 31, 2014 |
7 |
Table of Contents
| ||
| ||
October 31, 2014 (Unaudited) | ||
As a shareholder of the Vulcan Value Partners Fund (the “Fund”), you will incur two types of costs: (1) transaction costs, including applicable redemption fees; and (2) ongoing costs, including management fees and other Fund expenses. The following examples are intended to help you understand your ongoing costs (in dollars) of investing in the Fund and to compare these costs with the ongoing costs of investing in other mutual funds. The examples are based on an investment of $1,000 invested on May 1, 2014 and held until October 31, 2014.
Actual Expenses. The first line of each table below provides information about actual account values and actual expenses. You may use the information in this line, together with the amount you invested, to estimate the expenses that you paid over the period. Simply divide your account value by $1,000 (for example, an $8,600 account value divided by $1,000 = 8.6), then multiply the result by the number in the first line under the heading “Expenses Paid During Period” to estimate the expenses you paid on your account during this period.
Hypothetical Example for Comparison Purposes. The second line of the table below provides information about hypothetical account values and hypothetical expenses based on the Fund’s actual expense ratio and an assumed rate of return of 5% per year before expenses, which is not the Fund’s actual return. The hypothetical account values and expenses may not be used to estimate the actual ending account balance or expenses you paid for the period. You may use this information to compare the ongoing costs of investing in the Fund and other mutual funds. To do so, compare this 5% hypothetical example with the 5% hypothetical examples that appear in the shareholder reports of the other funds. The expenses shown in the table are meant to highlight ongoing Fund costs only and do not reflect transaction fees, such as redemption fees or exchange fees. Therefore, the second line of each table below is useful in comparing ongoing costs only, and may not help you determine the relative total costs of owning different funds. In addition, if these transactional costs were included, your costs would have been higher.
| Beginning Account | Ending Account | Expenses Paid During period 5/1/14 - 10/31/14(b) | ||||||
| Value | Value | Expense | ||||||
| 5/1/14 | 10/31/14 | Ratio(a) | ||||||
| ||||||||
Actual | $ 1,000.00 | $ 1,092.90 | 1.07% | $ 5.64 | ||||
Hypothetical (5% return before expenses) | $ 1,000.00 | $ 1,019.81 | 1.07% | $ 5.45 | ||||
(a) | The Fund’s expense ratios have been annualized based on the Fund’s most recent fiscal half-year expenses. |
(b) | Expenses are equal to the Fund’s annualized expense ratio multiplied by the average account value over the period, multiplied by the number of days in the most recent fiscal half-year (184)/365 (to reflect the half-year period). |
8 |
www.vulcanvaluepartners.com |
Table of Contents
Fund Overview
| ||
| ||
October 31, 2014 (Unaudited) | ||
VULCAN VALUE PARTNERS SMALL CAP FUND
Average Annual Total Returns (as of 10/31/14)
Since Inception* | Expense Ratios | |||||||||
| 1 Year | 3 Year | Total | Net** | |||||||
| ||||||||||
Vulcan Value Partners Small Cap Fund | 8.76% | 22.40% | 18.51% | 1.31% | 1.26% | |||||
Russell 2000® Value Index*** | 7.89% | 17.94% | 13.91% | |||||||
Russell 2000® Index*** | 8.06% | 18.18% | 15.12% | |||||||
Performance data quoted represents past performance. Past performance does not guarantee future results. Investment return and principal value of an investment will fluctuate so that an investor’s shares, when sold or redeemed, may be worth more or less than the original cost. The Fund imposes a 2.00% redemption fee on shares held for less than 90 days. Current performance data may be higher or lower than actual data quoted. For the most current month-end performance data, please call 1-877-421-5078.
The table does not reflect the deduction of taxes that a shareholder would pay on Fund distributions or the redemption of Fund shares.
Subject to investment risks, including possible loss of the principal amount invested.
* | Fund inception date of 12/30/09. |
** | Vulcan Value Partners, LLC (“Vulcan” or the “Adviser”) has given a contractual agreement to the Fund that to the extent the Total Annual Fund Operating Expenses (as defined in Item 3 of Form N-1A) with respect to the Fund (exclusive of Acquired Fund Fees and Expenses (if any), brokerage expenses, interest expense, taxes and extraordinary expenses) (“Designated Annual Fund Operating Expenses”) exceed 1.25% of such Fund’s average daily net assets for a particular fiscal year of the Fund, the Adviser will reduce the Management Fee and/or Other Expenses otherwise payable to the Adviser with respect to the Fund for such fiscal year by an amount equal to such excess, and/or the Adviser shall reimburse the Fund by the amount of such excess. This agreement is in effect through August 31, 2015. Without this agreement, expenses could be higher. If the Adviser foregoes any fees and/or reimburses the Fund pursuant to this letter agreement with respect to a particular fiscal year, then the Adviser shall be entitled to recover from the Fund the amount foregone or reimbursed to the extent Designated Annual Fund Operating Expenses are less than 1.25% of the Fund’s average daily net assets if within three years after the expenses were incurred. Ratios as of the Prospectus dated August 31, 2014. |
*** | Indices are not actively managed and do not reflect any deduction for fees, expenses or taxes. An investor may not invest directly in an index. |
Semi-Annual Report | October 31, 2014 |
9 |
Table of Contents
Fund Overview
| ||
| ||
October 31, 2014 (Unaudited) | ||
Performance of $10,000 Initial Investment (for the period ended October 31, 2014)
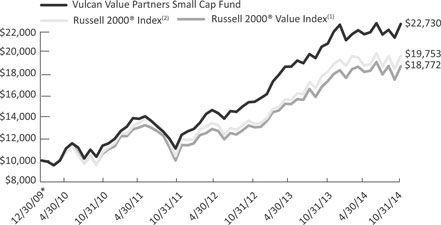
The chart above represents historical performance of a hypothetical investment of $10,000 in the Fund since inception. Past performance does not guarantee future results. This chart does not reflect the deduction of taxes that a shareholder would pay on Fund distributions or the redemption of Fund shares.
* | Fund inception date of 12/30/09. |
(1) | The Russell 2000® Value Index measures the performance of small-cap value segment of the U.S. equity universe. It includes those Russell 2000® companies with lower price-to-book ratios and lower forecasted growth values. The index is not actively managed and does not reflect any deductions for fees, expense or taxes. An investor may not invest directly in an index. |
(2) | The Russell 2000® Index measures the performance of the small-cap segment of the U.S. equity universe. The Russell 2000® Index is a subset of the Russell 3000® Index representing approximately 8% of the total market capitalization of that index. It includes approximately 2,000 of the smallest securities based on a combination of their market cap and current index membership. The index is not actively managed and does not reflect any deductions for fees, expense or taxes. An investor may not invest directly in an index. |
Investing in the Fund is subject to investment risks, including possible loss of the principal amount invested.
Industry Allocation (as a % of Net Assets)
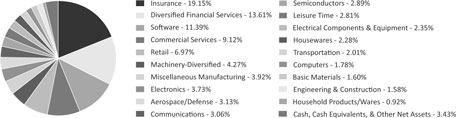
10 |
www.vulcanvaluepartners.com |
Table of Contents
Disclosure of Fund Expenses
| ||
| ||
October 31, 2014 (Unaudited) | ||
As a shareholder of the Vulcan Value Partners Small Cap Fund (the “Fund”), you will incur two types of costs: (1) transaction costs, including applicable redemption fees; and (2) ongoing costs, including management fees and other Fund expenses. The following examples are intended to help you understand your ongoing costs (in dollars) of investing in the Fund and to compare these costs with the ongoing costs of investing in other mutual funds. The examples are based on an investment of $1,000 invested on May 1, 2014 and held until October 31, 2014.
Actual Expenses. The first line of each table below provides information about actual account values and actual expenses. You may use the information in this line, together with the amount you invested, to estimate the expenses that you paid over the period. Simply divide your account value by $1,000 (for example, an $8,600 account value divided by $1,000 = 8.6), then multiply the result by the number in the first line under the heading “Expenses Paid During Period” to estimate the expenses you paid on your account during this period.
Hypothetical Example for Comparison Purposes. The second line of the table below provides information about hypothetical account values and hypothetical expenses based on the Fund’s actual expense ratio and an assumed rate of return of 5% per year before expenses, which is not the Fund’s actual return. The hypothetical account values and expenses may not be used to estimate the actual ending account balance or expenses you paid for the period. You may use this information to compare the ongoing costs of investing in the Fund and other mutual funds. To do so, compare this 5% hypothetical example with the 5% hypothetical examples that appear in the shareholder reports of the other funds. The expenses shown in the table are meant to highlight ongoing Fund costs only and do not reflect transaction fees, such as redemption fees or exchange fees. Therefore, the second line of each table below is useful in comparing ongoing costs only, and may not help you determine the relative total costs of owning different funds. In addition, if these transactional costs were included, your costs would have been higher.
Vulcan Value Partners Small Cap Fund
| Beginning Account | Ending Account | Expenses Paid | ||||||
| Value | Value | Expense | During period | |||||
| 5/1/14 | 10/31/14 | Ratio(a) | 5/1/14 - 10/31/14(b) | |||||
| ||||||||
Actual | $ 1,000.00 | $ 1,043.80 | 1.25% | $ 6.44 | ||||
Hypothetical (5% return before expenses) | $ 1,000.00 | $ 1,018.90 | 1.25% | $ 6.36 | ||||
(a) | The Fund’s expense ratios have been annualized based on the Fund’s most recent fiscal half-year expenses. |
(b) | Expenses are equal to the Fund’s annualized expense ratio multiplied by the average account value over the period, multiplied by the number of days in the most recent fiscal half-year (184)/365 (to reflect the half-year period). |
Semi-Annual Report | October 31, 2014 |
11 |
Table of Contents
|
| |
| ||
October 31, 2014 (Unaudited) | ||
| Shares | Value (Note 2) | |||
| ||||
COMMON STOCKS (95.87%) | ||||
Communications (16.89%) | ||||
Internet (2.47%) | ||||
eBay, Inc.(a) | 596,046 | $ 31,292,415 | ||
| ||||
Media (8.75%) | ||||
Discovery Communications, Inc., Class C(a) | 1,348,952 | 47,199,830 | ||
Time Warner, Inc. | 421,075 | 33,462,830 | ||
Walt Disney Co. | 331,131 | 30,258,751 | ||
| ||||
| 110,921,411 | ||||
| ||||
Telecommunications (5.67%) | ||||
Cisco Systems, Inc. | 1,341,558 | 32,827,924 | ||
Verizon Communications, Inc. | 775,186 | 38,953,097 | ||
| ||||
| 71,781,021 | ||||
| ||||
TOTAL COMMUNICATIONS | 213,994,847 | |||
| ||||
Consumer, Cyclical (14.87%) | ||||
Apparel (1.58%) | ||||
LVMH Moet Hennessy Louis Vuitton, SA | 118,141 | 20,078,063 | ||
| ||||
Distribution/Wholesale (2.50%) | ||||
Fossil Group, Inc.(a) | 311,866 | 31,704,297 | ||
| ||||
Leisure Time (2.89%) | ||||
Sabre Corp. | 2,129,684 | 36,630,565 | ||
| ||||
Lodging (6.05%) | ||||
Intercontinental Hotels Group PLC, ADR | 277,968 | 10,565,564 | ||
Marriott International, Inc., Class A | 328,261 | 24,865,771 | ||
Starwood Hotels & Resorts Worldwide, Inc. | 536,775 | 41,149,171 | ||
| ||||
| 76,580,506 | ||||
| ||||
Retail (1.85%) | ||||
MSC Industrial Direct Co., Inc., Class A | 288,867 | 23,389,561 | ||
| ||||
TOTAL CONSUMER, CYCLICAL | 188,382,992 | |||
| ||||
Consumer, Non-cyclical (13.29%) | ||||
Commercial Services (4.62%) | ||||
Mastercard, Inc., Class A | 698,976 | 58,539,240 | ||
| ||||
12 |
www.vulcanvaluepartners.com |
Table of Contents
Vulcan Value Partners Fund
| Statement of Investments
| |
| ||
October 31, 2014 (Unaudited) | ||
| Value | ||||
| Shares | (Note 2) | |||
| ||||
Consumer, Non-cyclical (continued) | ||||
Cosmetics/Personal Care (3.66%) | ||||
Colgate-Palmolive Co. | 283,120 | $ 18,935,066 | ||
Unilever NV, New York Registry Shares | 708,966 | 27,458,253 | ||
| ||||
| 46,393,319 | ||||
| ||||
Healthcare-Services (3.50%) | ||||
Aetna, Inc. | 225,723 | 18,624,405 | ||
WellPoint, Inc. | 202,836 | 25,697,293 | ||
| ||||
| 44,321,698 | ||||
| ||||
Pharmaceuticals (1.51%) | ||||
Express Scripts Holding Co.(a) | 248,365 | 19,079,399 | ||
| ||||
TOTAL CONSUMER, NON-CYCLICAL | 168,333,656 | |||
| ||||
Financial (28.54%) | ||||
Banks (5.53%) | ||||
Bank of New York Mellon Corp. | 815,819 | 31,588,512 | ||
State Street Corp. | 509,774 | 38,467,546 | ||
| ||||
| 70,056,058 | ||||
| ||||
Diversified Financial Services (16.08%) | ||||
Aberdeen Asset Management PLC | 7,196,745 | 50,017,378 | ||
Franklin Resources, Inc. | 897,369 | 49,902,690 | ||
NASDAQ OMX Group, Inc. | 870,793 | 37,670,505 | ||
T Rowe Price Group, Inc. | 67,750 | 5,561,598 | ||
Visa, Inc., Class A | 251,022 | 60,604,241 | ||
| ||||
| 203,756,412 | ||||
| ||||
Insurance (6.93%) | ||||
Chubb Corp. | 371,804 | 36,942,445 | ||
Everest Re Group, Ltd. | 297,893 | 50,835,441 | ||
| ||||
| 87,777,886 | ||||
| ||||
TOTAL FINANCIAL | 361,590,356 | |||
| ||||
Industrial (10.17%) | ||||
Aerospace & Defense (2.94%) | ||||
The Boeing Co. | 297,967 | 37,219,058 | ||
| ||||
Electronics (0.93%) | ||||
Waters Corp.(a) | 106,808 | 11,834,326 | ||
| ||||
Semi-Annual Report | October 31, 2014 |
13 |
Table of Contents
Statement of Investments
| Vulcan Value Partners Fund
| |
| ||
October 31, 2014 (Unaudited) | ||
| Value | ||||||||||||
| Shares | (Note 2) | |||||||||||
| ||||||||||||
Industrial (continued) | ||||||||||||
Miscellaneous Manufacturing (6.30%) | ||||||||||||
Dover Corp. | 294,892 | $ | 23,426,221 | |||||||||
Parker-Hannifin Corp. | 443,576 | 56,347,459 | ||||||||||
|
| |||||||||||
| 79,773,680 | ||||||||||||
|
| |||||||||||
TOTAL INDUSTRIAL | 128,827,064 | |||||||||||
|
| |||||||||||
Technology (12.11%) | ||||||||||||
Computers (2.79%) | ||||||||||||
Apple, Inc. | 326,788 | 35,293,104 | ||||||||||
|
| |||||||||||
Software (9.32%) | ||||||||||||
Check Point Software Technologies, Ltd.(a) | 365,926 | 27,170,005 | ||||||||||
Oracle Corp. | 2,329,339 | 90,960,688 | ||||||||||
|
| |||||||||||
| 118,130,693 | ||||||||||||
|
| |||||||||||
TOTAL TECHNOLOGY | 153,423,797 | |||||||||||
|
| |||||||||||
TOTAL COMMON STOCKS (Cost $1,009,778,214) | 1,214,552,712 | |||||||||||
| ||||||||||||
| 7-Day | Value | |||||||||||
| Yield | Shares | (Note 2) | ||||||||||
| ||||||||||||
SHORT TERM INVESTMENTS (5.46%) | ||||||||||||
Money Market Fund (5.46%) | ||||||||||||
Dreyfus Treasury Prime Cash Management Fund, Institutional Shares | 0.021 | % | 69,162,877 | 69,162,877 | ||||||||
|
| |||||||||||
TOTAL SHORT TERM INVESTMENTS (Cost $69,162,877) | 69,162,877 | |||||||||||
| ||||||||||||
TOTAL INVESTMENTS (101.33%) (Cost $1,078,941,091) | $ | 1,283,715,589 | ||||||||||
Liabilities In Excess Of Other Assets (-1.33%) | (16,860,606) | |||||||||||
| ||||||||||||
NET ASSETS (100.00%) | $ | 1,266,854,983 | ||||||||||
| ||||||||||||
(a) | Non-Income Producing Security. |
14 |
www.vulcanvaluepartners.com |
Table of Contents
Vulcan Value Partners Fund
| Statement of Investments
| |
| ||
October 31, 2014 (Unaudited) | ||
Common Abbreviations:
ADR - American Depositary Receipt.
Ltd. - Limited.
NV - Naamloze Vennootschap is the Dutch term for a public limited liability corporation.
PLC - Public Limited Company.
SA - Generally designates corporations in various countries, mostly those employing the civil law.
Holdings are subject to change.
For Fund compliance purposes, the Fund’s industry classifications refer to any one or more of the industry sub-classifications used by one or more widely recognized market indexes or ratings group indexes, and/or as defined by Fund management. This definition may not apply for purposes of this report, which may combine industry sub-classifications for reporting ease. Industries are shown as a percentage of net assets.
See Accompanying Notes to Financial Statements.
Semi-Annual Report | October 31, 2014 |
15 |
Table of Contents
Statement of Investments
| Vulcan Value Partners Small Cap Fund
| |
| ||
October 31, 2014 (Unaudited) | ||
| Value | ||||
| Shares | (Note 2) | |||
| ||||
COMMON STOCKS (96.57%) | ||||
Basic Materials (1.60%) | ||||
Chemicals (1.60%) | ||||
KMG Chemicals, Inc. | 952,085 | $ 16,851,905 | ||
| ||||
TOTAL BASIC MATERIALS | 16,851,905 | |||
| ||||
Communications (3.06%) | ||||
Media (3.06%) | ||||
SAI Global, Ltd. | 9,002,349 | 32,126,941 | ||
| ||||
TOTAL COMMUNICATIONS | 32,126,941 | |||
| ||||
Consumer, Cyclical (12.06%) | ||||
Housewares (2.28%) | ||||
Tupperware Brands Corp. | 375,594 | 23,944,117 | ||
| ||||
Leisure Time (2.81%) | ||||
Sabre Corp. | 1,718,806 | 29,563,463 | ||
| ||||
Retail (6.97%) | ||||
Nu Skin Enterprises, Inc., Class A | 1,385,414 | 73,191,422 | ||
| ||||
TOTAL CONSUMER, CYCLICAL | 126,699,002 | |||
| ||||
Consumer, Non-cyclical (10.04%) | ||||
Commercial Services (9.12%) | ||||
Chemed Corp. | 96,984 | 10,024,266 | ||
Insperity, Inc. | 1,106,631 | 34,925,274 | ||
Navigant Consulting, Inc.(a) | 1,967,923 | 30,286,335 | ||
Universal Technical Institute, Inc. | 1,731,701 | 20,624,559 | ||
| ||||
| 95,860,434 | ||||
| ||||
Household Products/Wares (0.92%) | ||||
Avery Dennison Corp. | 206,435 | 9,671,480 | ||
| ||||
TOTAL CONSUMER, NON-CYCLICAL | 105,531,914 | |||
| ||||
Financial (32.76%) | ||||
Diversified Financial Services (13.61%) | ||||
Ashmore Group PLC | 8,587,071 | 43,769,251 | ||
Eaton Vance Corp. | 1,437,987 | 52,961,061 | ||
NASDAQ OMX Group, Inc. | 718,476 | 31,081,272 | ||
16 |
www.vulcanvaluepartners.com |
Table of Contents
Vulcan Value Partners Small Cap Fund
| Statement of Investments
| |
| ||
October 31, 2014 (Unaudited) | ||
| Value | ||||
| Shares | (Note 2) | |||
| ||||
Financial (continued) | ||||
Diversified Financial Services (continued) | ||||
Virtus Investment Partners, Inc. | 85,020 | $ 15,236,434 | ||
| ||||
| 143,048,018 | ||||
| ||||
Insurance (19.15%) | ||||
Axis Capital Holdings Ltd. | 623,324 | 30,006,817 | ||
Everest Re Group, Ltd. | 251,749 | 42,960,967 | ||
Montpelier Re Holdings, Ltd. | 1,007,587 | 33,391,433 | ||
Navigators Group, Inc.(a) | 760,221 | 51,763,448 | ||
ProAssurance Corp. | 428,749 | 20,056,878 | ||
Safety Insurance Group, Inc. | 368,471 | 22,985,221 | ||
| ||||
| 201,164,764 | ||||
| ||||
TOTAL FINANCIAL | 344,212,782 | |||
| ||||
Industrial (20.99%) | ||||
Aerospace/Defense (3.13%) | ||||
Curtiss-Wright Corp. | 475,585 | 32,915,238 | ||
| ||||
Electrical Components & Equipment (2.35%) | ||||
EnerSys, Inc. | 392,853 | 24,671,168 | ||
| ||||
Electronics (3.73%) | ||||
Ituran Location and Control, Ltd. | 1,306,104 | 26,762,071 | ||
Woodward, Inc. | 243,151 | 12,451,763 | ||
| ||||
| 39,213,834 | ||||
| ||||
Engineering & Construction (1.58%) | ||||
Exponent, Inc. | 207,546 | 16,566,322 | ||
| ||||
Machinery-Diversified (4.27%) | ||||
Lindsay Corp. | 511,575 | 44,865,127 | ||
| ||||
Miscellaneous Manufacturing (3.92%) | ||||
Actuant Corp., Class A | 461,770 | 14,633,491 | ||
Donaldson Co., Inc. | 332,522 | 13,826,265 | ||
Sturm Ruger & Co., Inc. | 305,015 | 12,713,025 | ||
| ||||
| 41,172,781 | ||||
| ||||
Semi-Annual Report | October 31, 2014 |
17 |
Table of Contents
Statement of Investments
| Vulcan Value Partners Small Cap Fund
| |
| ||
October 31, 2014 (Unaudited) | ||
| Value | ||||||||||||
| Shares | (Note 2) | |||||||||||
| ||||||||||||
Industrial (continued) | ||||||||||||
Transportation (2.01%) | ||||||||||||
Forward Air Corp. | 441,193 | $ | 21,119,909 | |||||||||
|
| |||||||||||
TOTAL INDUSTRIAL | 220,524,379 | |||||||||||
|
| |||||||||||
Technology (16.06%) | ||||||||||||
Computers (1.78%) | ||||||||||||
Genpact, Ltd.(a) | 1,062,689 | 18,650,192 | ||||||||||
|
| |||||||||||
Semiconductors (2.89%) | ||||||||||||
Rovi Corp.(a) | 1,452,460 | 30,327,365 | ||||||||||
|
| |||||||||||
Software (11.39%) | ||||||||||||
ACI Worldwide, Inc.(a) | 2,502,757 | 48,153,045 | ||||||||||
Fair Isaac Corp. | 409,492 | 25,511,351 | ||||||||||
MSCI, Inc. | 646,005 | 30,142,593 | ||||||||||
Omnicell, Inc.(a) | 492,070 | 15,898,782 | ||||||||||
|
| |||||||||||
| 119,705,771 | ||||||||||||
|
| |||||||||||
TOTAL TECHNOLOGY | 168,683,328 | |||||||||||
|
| |||||||||||
TOTAL COMMON STOCKS (Cost $958,407,352) | 1,014,630,251 | |||||||||||
| ||||||||||||
| 7-Day | Value | |||||||||||
| Yield | Shares | (Note 2) | ||||||||||
| ||||||||||||
SHORT TERM INVESTMENTS (1.95%) | ||||||||||||
Money Market Fund (1.95%) | ||||||||||||
Dreyfus Treasury Prime Cash Management Fund, Institutional Shares | 0.021 | % | 20,467,018 | 20,467,018 | ||||||||
|
| |||||||||||
TOTAL SHORT TERM INVESTMENTS (Cost $20,467,018) | 20,467,018 | |||||||||||
| ||||||||||||
TOTAL INVESTMENTS (98.52%) (Cost $978,874,370) | $ | 1,035,097,269 | ||||||||||
Other Assets In Excess Of Liabilities (1.48%) | 15,509,037 | |||||||||||
| ||||||||||||
NET ASSETS (100.00%) | $ | 1,050,606,306 | ||||||||||
| ||||||||||||
(a) | Non-Income Producing Security. |
18 |
www.vulcanvaluepartners.com |
Table of Contents
Vulcan Value Partners Small Cap Fund
| Statement of Investments
| |
| ||
October 31, 2014 (Unaudited) | ||
Common Abbreviations:
Ltd. - Limited.
PLC - Public Limited Company.
Holdings are subject to change.
For Fund compliance purposes, the Fund’s industry classifications refer to any one or more of the industry sub-classifications used by one or more widely recognized market indexes or ratings group indexes, and/or as defined by Fund management. This definition may not apply for purposes of this report, which may combine industry sub-classifications for reporting ease. Industries are shown as a percentage of net assets.
See Accompanying Notes to Financial Statements.
Semi-Annual Report | October 31, 2014 |
19 |
Table of Contents
Statements of Assets and Liabilities
| ||
| ||
October 31, 2014 (Unaudited) | ||
| Vulcan Value Partners | Vulcan Value Partners | |||||||
| Fund | Small Cap Fund | |||||||
| ||||||||
ASSETS: | ||||||||
Investments, at value | $ | 1,283,715,589 | $ | 1,035,097,269 | ||||
Receivable for investments sold | 30,386,828 | 15,718,265 | ||||||
Receivable for shares sold | 4,933,177 | 1,846,873 | ||||||
Dividends receivable | 776,657 | 405,461 | ||||||
Other assets | 31,161 | 22,757 | ||||||
| ||||||||
Total assets | 1,319,843,412 | 1,053,090,625 | ||||||
| ||||||||
LIABILITIES: | ||||||||
Payable for investments purchased | 51,655,858 | 982,911 | ||||||
Payable for shares redeemed | 235,722 | 370,452 | ||||||
Payable to adviser | 1,001,644 | 977,020 | ||||||
Payable for administration fees | 29,287 | 24,819 | ||||||
Payable for transfer agency fees | 8,820 | 75,319 | ||||||
Payable for professional fees | 10,848 | 10,803 | ||||||
Payable for trustee fees and expenses | 7,393 | 10,437 | ||||||
Accrued expenses and other liabilities | 38,857 | 32,558 | ||||||
| ||||||||
Total liabilities | 52,988,429 | 2,484,319 | ||||||
| ||||||||
NET ASSETS | $ | 1,266,854,983 | $ | 1,050,606,306 | ||||
| ||||||||
NET ASSETS CONSIST OF: | ||||||||
Paid-in capital (Note 5) | $ | 987,769,649 | $ | 900,271,209 | ||||
Accumulated net investment income | 6,072,949 | 269,370 | ||||||
Accumulated net realized gain on investments | 68,237,887 | 93,842,828 | ||||||
Net unrealized appreciation in value of investments | 204,774,498 | 56,222,899 | ||||||
| ||||||||
NET ASSETS | $ | 1,266,854,983 | $ | 1,050,606,306 | ||||
| ||||||||
INVESTMENTS, AT COST | $ | 1,078,941,091 | $ | 978,874,370 | ||||
PRICING OF SHARES: | ||||||||
Net Asset Value, offering and redemption price per share | $ | 19.89 | $ | 19.56 | ||||
Shares of beneficial interest outstanding (unlimited number of shares, no par value common stock authorized) | 63,693,474 | 53,708,059 | ||||||
See Accompanying Notes to Financial Statements.
20 |
www.vulcanvaluepartners.com |
Table of Contents
| ||
| ||
For the Six Months Ended October 31, 2014 (Unaudited) | ||
| Vulcan Value Partners | Vulcan Value Partners | |||||||
| Fund | Small Cap Fund | |||||||
| ||||||||
INVESTMENT INCOME: | ||||||||
Dividends | $ | 10,716,826 | $ | 7,096,902 | ||||
Foreign taxes withheld | (149,076) | (182,956) | ||||||
Other Income | – | 17 | ||||||
| ||||||||
Total investment income | 10,567,750 | 6,913,963 | ||||||
| ||||||||
EXPENSES: | ||||||||
Investment advisory fees (Note 6) | 5,455,121 | 6,113,026 | ||||||
Administrative fees | 160,912 | 157,165 | ||||||
Transfer agency fees | 83,578 | 317,860 | ||||||
Professional fees | 16,606 | 19,509 | ||||||
Custodian fees | 53,610 | 73,143 | ||||||
Trustee fees and expenses | 15,833 | 17,574 | ||||||
Other | 61,461 | 49,794 | ||||||
| ||||||||
Total expenses before waiver | 5,847,121 | 6,748,071 | ||||||
Less fees waived/reimbursed by investment adviser (Note 6) | – | (103,478) | ||||||
| ||||||||
Total net expenses | 5,847,121 | 6,644,593 | ||||||
| ||||||||
NET INVESTMENT INCOME | 4,720,629 | 269,370 | ||||||
| ||||||||
Net realized gain on investments | 37,668,922 | 58,322,666 | ||||||
Net change in unrealized appreciation/(depreciation) of investments | 51,898,194 | (14,114,799) | ||||||
| ||||||||
NET REALIZED AND UNREALIZED GAIN ON INVESTMENTS | 89,567,116 | 44,207,867 | ||||||
| ||||||||
NET INCREASE IN NET ASSETS RESULTING FROM OPERATIONS | $ | 94,287,745 | $ | 44,477,237 | ||||
| ||||||||
See Accompanying Notes to Financial Statements.
Semi-Annual Report | October 31, 2014 |
21 |
Table of Contents
Statements of Changes in Net Assets
|
| |
| ||
| For the Six | ||||||||
| Months Ended | For the | |||||||
| October 31, 2014 | Year Ended | |||||||
| (Unaudited) | April 30, 2014 | |||||||
| ||||||||
OPERATIONS: | ||||||||
Net investment income | $ | 4,720,629 | $ | 5,507,738 | ||||
Net realized gain on investments and foreign currency transactions | 37,668,922 | 45,057,654 | ||||||
Net change in unrealized appreciation on investments | 51,898,194 | 84,723,466 | ||||||
| ||||||||
Net increase in net assets resulting from operations | 94,287,745 | 135,288,858 | ||||||
| ||||||||
DISTRIBUTIONS TO SHAREHOLDERS (Note 3): | ||||||||
From net investment income | – | (4,575,383) | ||||||
From net realized gains on investments | – | (18,524,637) | ||||||
| ||||||||
Net decrease in net assets from distributions | – | (23,100,020) | ||||||
| ||||||||
SHARE TRANSACTIONS (Note 5): | ||||||||
Proceeds from sales of shares | 299,361,336 | 410,644,045 | ||||||
Issued to shareholders in reinvestment of distributions | – | 19,326,050 | ||||||
Cost of shares redeemed, net of redemption fees | (56,623,152) | (59,627,069) | ||||||
| ||||||||
Net increase from share transactions | 242,738,184 | 370,343,026 | ||||||
| ||||||||
Net increase in net assets | 337,025,929 | 482,531,864 | ||||||
| ||||||||
NET ASSETS: | ||||||||
Beginning of year | 929,829,054 | 447,297,190 | ||||||
| ||||||||
End of period* | $ | 1,266,854,983 | $ | 929,829,054 | ||||
| ||||||||
*Includes accumulated net investment income of: | $ | 6,072,949 | $ | 1,352,320 | ||||
See Accompanying Notes to Financial Statements.
22 |
www.vulcanvaluepartners.com |
Table of Contents
Vulcan Value Partners Small Cap Fund
|
Statements of Changes in Net Assets | |
| ||
| For the Six Months Ended October 31, 2014 (Unaudited) | For the Year Ended | |||||||||
OPERATIONS: | ||||||||||
Net investment income/(loss) | $ | 269,370 | $ | (371,534) | ||||||
Net realized gain on investments | 58,322,666 | 59,583,583 | ||||||||
Net change in unrealized appreciation/(depreciation) on investments | (14,114,799) | 29,817,231 | ||||||||
Net increase in net assets resulting from operations | 44,477,237 | 89,029,280 | ||||||||
DISTRIBUTIONS TO SHAREHOLDERS (Note 3): | ||||||||||
From net realized gains on investments | – | (37,145,114) | ||||||||
Net decrease in net assets from distributions | – | (37,145,114) | ||||||||
SHARE TRANSACTIONS (Note 5): | ||||||||||
Proceeds from sales of shares | 90,061,232 | 753,029,272 | ||||||||
Issued to shareholders in reinvestment of distributions | – | 28,982,662 | ||||||||
Cost of shares redeemed, net of redemption fees | (150,178,426) | (192,802,041) | ||||||||
Net increase/(decrease) from share transactions | (60,117,194) | 589,209,893 | ||||||||
Net increase/(decrease) in net assets | (15,639,957) | 641,094,059 | ||||||||
NET ASSETS: | ||||||||||
Beginning of year | 1,066,246,263 | 425,152,204 | ||||||||
End of period* | $ | 1,050,606,306 | $ | 1,066,246,263 | ||||||
| ||||||||||
*Includes accumulated net investment income of: | $ | 269,370 | $ | – | ||||||
See Accompanying Notes to Financial Statements.
Semi-Annual Report | October 31, 2014 |
23 |
Table of Contents
| ||
| ||
For a share outstanding throughout the periods presented. | ||
NET ASSET VALUE, BEGINNING OF PERIOD |
INCOME/(LOSS) FROM OPERATIONS: |
Net investment income/(loss) |
Net realized and unrealized gain on investments |
Total from investment operations |
LESS DISTRIBUTIONS TO SHAREHOLDERS: |
From net investment income |
From net realized gains on investments |
Total distributions |
Redemption fees added to paid-in capital |
Increase in net asset value |
NET ASSET VALUE, END OF PERIOD |
|
Total return |
RATIOS AND SUPPLEMENTAL DATA: |
Net assets, end of period (000’s) |
Ratio of expenses to average net assets without fee waivers/reimbursements |
Ratio of expenses to average net assets including fee waivers/reimbursements |
Net investment income/(loss) to average net assets including fee waivers/reimbursements |
Portfolio turnover rate |
(a) | Per share numbers have been calculated using the average shares method. |
(b) | Less than $(0.005) per share. |
(c) | Less than $ 0.005 per share. |
(d) | Not annualized. |
(e) | Annualized. |
See Accompanying Notes to Financial Statements.
24 |
www.vulcanvaluepartners.com |
Table of Contents
Vulcan Value Partners Fund
| ||
| ||
For the Six Months Ended October 31, 2014 | For the Year Ended April 30, 2014 | For the Year Ended April 30, 2013 | For the Year Ended April 30, 2012 | For the Year Ended April 30, 2011 | For the Period 2009 (Inception) to April 30, 2010 | |||||
$ 18.20 | $ 15.28 | $ 13.03 | $ 11.66 | $ 10.57 | $ 10.00 | |||||
0.08(a) | 0.14(a) | 0.15(a) | 0.02(a) | 0.01(a) | (0.00)(b) | |||||
1.61 | 3.33 | 2.35 | 1.45 | 1.13 | 0.57 | |||||
1.69 | 3.47 | 2.50 | 1.47 | 1.14 | 0.57 | |||||
– | (0.11) | (0.12) | (0.01) | (0.01) | – | |||||
– | (0.44) | (0.13) | (0.09) | (0.04) | – | |||||
– | (0.55) | (0.25) | (0.10) | (0.05) | – | |||||
0.00(c) | 0.00(c) | 0.00(c) | 0.00(c) | 0.00(c) | 0.00(c) | |||||
1.69 | 2.92 | 2.25 | 1.37 | 1.09 | 0.57 | |||||
$ 19.89 | $ 18.20 | $ 15.28 | $ 13.03 | $ 11.66 | $ 10.57 | |||||
| ||||||||||
9.29%(d) | 22.84% | 19.33% | 12.73% | 10.82% | 5.70%(d) | |||||
$ 1,266,855 | $ 929,829 | $ 447,297 | $ 125,087 | $ 48,757 | $ 12,807 | |||||
1.07%(e) | 1.09% | 1.18% | 1.51% | 2.01% | 4.97%(e) | |||||
1.07%(e) | 1.09% | 1.18% | 1.50% | 1.50% | 1.50%(e) | |||||
0.87%(e) | 0.80% | 1.06% | 0.16% | 0.07% | (0.06%)(e) | |||||
30%(d) | 56% | 24% | 49% | 44% | 24%(d) | |||||
Semi-Annual Report | October 31, 2014 |
25 |
Table of Contents
Financial Highlights
| ||
| ||
For a share outstanding throughout the periods presented. | ||
NET ASSET VALUE, BEGINNING OF PERIOD |
INCOME/(LOSS) FROM OPERATIONS: |
Net investment income/(loss) |
Net realized and unrealized gain on investments |
Total from investment operations |
LESS DISTRIBUTIONS TO SHAREHOLDERS: |
From net investment income |
From net realized gains on investments |
Total distributions |
Redemption fees added to paid-in capital |
Increase/(decrease) in net asset value |
NET ASSET VALUE, END OF PERIOD |
|
Total return |
RATIOS AND SUPPLEMENTAL DATA: |
Net assets, end of period (000’s) |
Ratio of expenses to average net assets without fee waivers/reimbursements |
Ratio of expenses to average net assets including fee waivers/reimbursements |
Net investment income/(loss) to average net assets including fee waivers/reimbursements |
Portfolio turnover rate |
(a) Per | share numbers have been calculated using the average shares method. |
(b) Less | than $0.005 per share. |
(c) Less | than $(0.005) per share. |
(d) Not | annualized. |
(e) Annualized. |
See Accompanying Notes to Financial Statements.
26 |
www.vulcanvaluepartners.com |
Table of Contents
Vulcan Value Partners Small Cap Fund
| ||
| ||
For the Six Months Ended October 31, 2014 (Unaudited) | For the Year Ended April 30, 2014 | For the Year Ended April 30, 2013 | For the Year Ended April 30, 2012 | For the Year Ended April 30, 2011 | For the Period 2009 (Inception) to April 30, 2010 | |||||
$ 18.74 | $ 16.97 | $ 13.18 | $ 13.72 | $ 11.60 | $ 10.00 | |||||
0.00(a)(b) | (0.01)(a) | 0.03(a) | 0.02(a) | (0.09)(a) | (0.00)(c) | |||||
0.82 | 2.76 | 3.91 | 0.17 | 2.55 | 1.60 | |||||
0.82 | 2.75 | 3.94 | 0.19 | 2.46 | 1.60 | |||||
– | – | (0.06) | – | – | – | |||||
– | (0.98) | (0.09) | (0.73) | (0.34) | – | |||||
– | (0.98) | (0.15) | (0.73) | (0.34) | – | |||||
0.00(b) | 0.00(b) | 0.00(b) | 0.00(b) | 0.00(b) | – | |||||
0.82 | 1.77 | 3.79 | (0.54) | 2.12 | 1.60 | |||||
$ 19.56 | $ 18.74 | $ 16.97 | $ 13.18 | $ 13.72 | $ 11.60 | |||||
| ||||||||||
4.38%(d) | 16.11% | 30.07% | 2.10% | 21.75% | 16.00%(d) | |||||
$ 1,050,606 | $ 1,066,246 | $425,152 | $ 40,103 | $ 36,363 | $ 7,225 | |||||
1.27%(e) | 1.30% | 1.38% | 1.86% | 2.50% | 7.31%(e) | |||||
1.25%(e) | 1.25% | 1.28% | 1.50% | 1.50% | 1.50%(e) | |||||
0.05%(e) | (0.05%) | 0.21% | 0.15% | (0.71%) | (0.57%)(e) | |||||
36%(d) | 70% | 57% | 57% | 60% | 33%(d) | |||||
Semi-Annual Report | October 31, 2014 |
27 |
Table of Contents
| ||
| ||
October 31, 2014 (Unaudited) | ||
1. ORGANIZATION
Financial Investors Trust (the “Trust”) is organized as a Delaware statutory trust and is registered as an open-end management investment company under the Investment Company Act of 1940, as amended (“1940 Act”). As of October 31, 2014, the Trust had 32 registered funds. This semi-annual report describes the Vulcan Value Partners Fund and Vulcan Value Partners Small Cap Fund (each a “Fund” and collectively, the “Funds”). The Vulcan Value Partners Fund seeks to achieve long-term capital appreciation. The Vulcan Value Partners Small Cap Fund seeks to achieve long-term capital appreciation. The Vulcan Value Partners Fund and Vulcan Value Partners Small Cap Fund are both classified as a non-diversified investment company for purpose of the 1940 Act. As a result of ongoing operations, it is possible either Fund may become a diversified investment company, which would occur at the earliest on or about April, 2015 for Vulcan Value Partners Fund or on or about January, 2015 for Vulcan Value Partners Small Cap Fund. In such case, the Fund may not resume operating in a non-diversified manner without first obtaining shareholder approval.
2. SIGNIFICANT ACCOUNTING POLICIES
The accompanying financial statements were prepared in accordance with accounting principles generally accepted in the United States of America (“U.S. GAAP”). The preparation of financial statements in conformity with U.S. GAAP requires management to make certain estimates and assumptions that affect the reported amounts of assets and liabilities and disclosures of contingent assets and liabilities at the date of the financial statements and the reported amounts of revenue and expenses during the period. Actual results could differ from those estimates. The Funds are considered an investment company for financial reporting purposes under GAAP. The following is a summary of significant accounting policies consistently followed by the Funds in preparation of their financial statements.
Investment Valuation: The Funds generally value their securities based on market prices determined at the close of regular trading on the New York Stock Exchange (“NYSE”), normally 4:00 p.m. Eastern Time, on each day the NYSE is open for trading.
For equity securities and mutual funds that are traded on an exchange, the market price is usually the closing sale or official closing price on that exchange. In the case of equity securities not traded on an exchange, or if such closing prices are not otherwise available, the securities are valued at the mean of the most recent bid and ask prices on such day. Redeemable securities issued by open-end registered investment companies are valued at the investment company’s applicable net asset value.
The market price for debt obligations is generally the price supplied by an independent third-party pricing service approved by the Board of Trustees (the “Board”), which may use a matrix, formula or other objective method that takes into consideration quotations from dealers, market transactions in comparable investments, market indices and yield curves. If vendors are unable to supply a price, or if the price supplied is deemed to be unreliable, the market price may be determined using quotations received from one or more broker–dealers that make a market in the security. Short-term debt obligations that will mature in 60 days or less are valued at amortized cost, unless it is determined that using this method would not reflect an investment’s fair value.
28 |
www.vulcanvaluepartners.com |
Table of Contents
Notes to Financial Statements | ||
| ||
October 31, 2014 (Unaudited) | ||
When such prices or quotations are not available, or when the Fair Value Committee appointed by the Board believes that they are unreliable, securities may be priced using fair value procedures approved by the Board.
Fair Value Measurements: A three-tier hierarchy has been established to classify fair value measurements for disclosure purposes. Inputs refer broadly to the assumptions that market participants would use in pricing the asset or liability, including assumptions about risk. Inputs may be observable or unobservable. Observable inputs are inputs that reflect the assumptions market participants would use in pricing the asset or liability that are developed based on market data obtained from sources independent of the reporting entity. Unobservable inputs are inputs that reflect the reporting entity’s own assumptions about the assumptions market participants would use in pricing the asset or liability that are developed based on the best information available. Various inputs are used in determining the value of each Fund’s investments as of the reporting period end. The designated input levels are not necessarily an indication of the risk or liquidity associated with these investments. These inputs are categorized in the following hierarchy under applicable financial accounting standards:
Level 1 – | Unadjusted quoted prices in active markets for identical investments, unrestricted assets | |
or liabilities that the Funds have the ability to access at the measurement date; | ||
Level 2 – | Quoted prices which are not active, quoted prices for similar assets or liabilities in active markets or inputs other than quoted prices that are observable (either directly or indirectly) for substantially the full term of the asset or liability; and | |
Level 3 – | Significant unobservable prices or inputs (including the Funds’ own assumptions in determining the fair value of investments) where there is little or no market activity for the asset or liability at the measurement date. |
The following is a summary of each input used to value each Fund’s investments as of October 31, 2014.
Vulcan Value Partners Fund:
Investments in Securities at Value | Level 1 - Unadjusted Quoted Prices | Level 2 - Other Significant Observable Inputs | Level 3 - Significant Unobservable Inputs | Total | ||||||||||||
Common Stocks(a) | $ | 1,214,552,712 | $ | – | $ | – | $ | 1,214,552,712 | ||||||||
Short Term Investments | 69,162,877 | – | – | 69,162,877 | ||||||||||||
TOTAL | $ | 1,283,715,589 | $ | – | $ | – | $ | 1,283,715,589 | ||||||||
| ||||||||||||||||
Vulcan Value Partners Small Cap Fund:
Investments in Securities at Value | Level 1 - Unadjusted Quoted Prices | Level 2 - Other Significant Observable Inputs | Level 3 - Significant Unobservable Inputs | Total | ||||||||||||
Common Stocks(a) | $ | 938,734,059 | $ | 75,896,192 | $ | – | $ | 1,014,630,251 | ||||||||
Short Term Investments | 20,467,018 | – | – | 20,467,018 | ||||||||||||
TOTAL | $ | 959,201,077 | $ | 75,896,192 | $ | – | $ | 1,035,097,269 | ||||||||
| ||||||||||||||||
(a) | For detailed descriptions, see the accompanying Statements of Investments. |
Semi-Annual Report | October 31, 2014 |
29 |
Table of Contents
Notes to Financial Statements
| ||
| ||
October 31, 2014 (Unaudited) | ||
The Funds recognize transfers between levels as of the end of period. For the six months ended October 21, 2014, the Funds did not have any transfer between Level 1 and Level 2. For the six months ended October 31, 2014, the Funds did not have any securities that used significant unobservable inputs (Level 3) in determining fair value.
Investment Transactions and Investment Income: Investment transactions are accounted for on the date the investments are purchased or sold (trade date). Realized gains and losses from investment transactions are reported on an identified cost basis, which is the same basis the Funds use for federal income tax purposes. Interest income, which includes accretion of discounts and amortization of premiums, is accrued and recorded as earned. Dividend income is recognized on the ex-dividend date or for certain foreign securities, as soon as information is available to the Funds. All of the realized and unrealized gains and losses and net investment income, are allocated daily to each class in proportion to its average daily net assets.
Foreign Securities: The Funds may directly purchase securities of foreign issuers. Investing in securities of foreign issuers involves special risks not typically associated with investing in securities of U.S. issuers. The risks include possible reevaluation of currencies, the inability to repatriate foreign currency, less complete financial information about companies and possible future adverse political and economic developments. Moreover, securities of many foreign issuers and their markets may be less liquid and their prices more volatile than those of securities of comparable U.S. issuers.
Trust Expenses: Some expenses of the Trust can be directly attributed to the Funds. Expenses which cannot be directly attributed are apportioned among all funds in the Trust based on average net assets of each fund.
Fund Expenses: Expenses that are specific to a Fund are charged directly to that Fund. Expenses that are common to both Funds generally are allocated among the Funds in proportion to their average daily net assets.
Federal Income Taxes: Each Fund complies with the requirements under Subchapter M of the Internal Revenue Code of 1986, as amended, applicable to regulated investment companies and intends to distribute substantially all of its net taxable income and net capital gains, if any, each year so that it will not be subject to excise tax on undistributed income and gains. The Funds are not subject to income taxes to the extent such distributions are made.
As of and during the six months ended October 31, 2014, the Funds did not have a liability for any unrecognized tax benefits. The Funds file U.S. federal, state, and local tax returns as required. The Fund’s tax returns are subject to examination by the relevant tax authorities until expiration of the applicable statute of limitations, which is generally three years after the filing of the tax return for federal purposes and four years for most state returns. Tax returns for open years have incorporated no uncertain tax positions that require a provision for income taxes.
Distributions to Shareholders: Each Fund normally pays dividends and distributes capital gains, if any, on an annual basis. Income dividend distributions are derived from interest and other income each Fund receives from its investments, including short-term capital gains. Long term capital gain distributions are derived from gains realized when each Fund sells a security it has owned for more
30 |
www.vulcanvaluepartners.com |
Table of Contents
Notes to Financial Statements | ||
| ||
October 31, 2014 (Unaudited) | ||
than a year. Each Fund may make additional distributions and dividends at other times if the portfolio manager believes doing so may be necessary for each Fund to avoid or reduce taxes.
3. TAX BASIS INFORMATION:
Tax Basis of Investments: As of October 31, 2014, the aggregate cost of investments, gross unrealized appreciation/ (depreciation) and net unrealized appreciation for federal tax purposes was as follows:
| Vulcan Value Partners Fund | Vulcan Value Partners Small Cap Fund | |||||||
Gross appreciation (excess of value over tax cost) | $ | 214,432,085 | $ | 107,497,969 | ||||
Gross depreciation (excess of tax cost over value) | (10,249,013) | (52,388,904) | ||||||
| ||||||||
Net unrealized appreciation | $ | 204,183,072 | $ | 55,109,065 | ||||
| ||||||||
Cost of investments for income tax purposes | $ | 1,079,532,517 | $ | 979,988,204 | ||||
| ||||||||
Tax Basis of Distributions to Shareholders: The character of distributions made during the year from net investment income or net realized gains may differ from its ultimate characterization for federal income tax purposes. Also, due to the timing of dividend distributions, the fiscal year in which amounts are distributed may differ from the fiscal year in which the income or realized gain were recorded by each Fund.
The tax character of distributions paid by the Funds for the fiscal year ended April 30, 2014 were as follows:
| Ordinary Income | Long-Term Capital Gain | |||||||
2014 | ||||||||
Vulcan Value Partners Fund | $ | 17,739,758 | $ | 5,360,262 | ||||
Vulcan Value Partners Small Cap Fund | 26,859,770 | 10,285,344 | ||||||
There were no distributions paid by the Funds during the six months ended October 31, 2014.
4. SECURITIES TRANSACTIONS
The cost of purchases and proceeds from sales of securities (excluding short-term securities and transfers-in-kind) during the six months ended October 31, 2014 were as follows:
Fund | Purchase of Securities | Proceeds From Sales of Securities | ||||||
Vulcan Value Partners Fund | $ 613,318,668 | $ 308,697,275 | ||||||
Vulcan Value Partners Small Cap Fund | 361,304,489 | 381,470,529 | ||||||
5. CAPITAL SHARE TRANSACTIONS
The capitalization of the Trust consists of an unlimited number of shares of beneficial interest with no par value per share. Holders of the shares of the Funds of the Trust have one vote for each share held and a proportionate fraction of a vote for each
Semi-Annual Report | October 31, 2014 |
31 |
Table of Contents
Notes to Financial Statements
| ||
| ||
October 31, 2014 (Unaudited) | ||
share held and a proportionate fraction of a vote for each fractional share. All shares issued and outstanding are fully paid and are non-assessable, transferable and redeemable at the option of the shareholder. Shares have no pre-emptive rights.
Shares redeemed within 90 days of purchase may incur a 2% short-term redemption fee deducted from the redemption amount. The Vulcan Value Partners Fund and the Vulcan Value Partners Small Cap Fund retained $5,283 and $4,764, respectively, for the six months ended October 31, 2014, and $78,880 and $76,658, respectively, for the year ended April 30, 2014, which is reflected in the “Cost of shares redeemed, net of redemption fees” in the Statements of Changes in Net Assets.
Transactions in shares of capital stock for the dates listed below were as follows:
Vulcan Value Partners Fund
| For the Six Months Ended October 31, 2014 (Unaudited) | For the Year Ended April 30, 2014 | |||||||
Shares Sold | 15,558,690 | 24,274,979 | ||||||
Shares Issued in Reinvestment of Dividends | – | 1,094,860 | ||||||
Less Shares Redeemed | (2,960,358) | (3,545,292) | ||||||
| ||||||||
Net Increase | 12,598,332 | 21,824,547 | ||||||
| ||||||||
Vulcan Value Partners Small Cap Fund
| For the Six Months Ended October 31, 2014 (Unaudited) | For the Year Ended April 30, 2014 | |||||||
Shares Sold | 4,763,864 | 40,732,583 | ||||||
Shares Issued in Reinvestment of Dividends | – | 1,529,428 | ||||||
Less Shares Redeemed | (7,941,385) | (10,434,040) | ||||||
Net Increase/(Decrease) | (3,177,521) |
| 31,827,971
|
| ||||
| ||||||||
6. MANAGEMENT AND RELATED-PARTY TRANSACTIONS
Vulcan Value Partners, LLC (“Vulcan” or the “Adviser”), subject to the authority of the Board, is responsible for the overall management and administration of the Funds’ business affairs. Vulcan manages the investments of the Funds in accordance with each Fund’s investment objective, policies and limitations and investment guidelines established jointly by the Adviser and the Board. Pursuant to the Investment Advisory Agreement (the “Advisory Agreement”), the Funds pay Vulcan an annual management fee of 1.00% and 1.15% for Vulcan Value Partners Fund and Vulcan Value Partners Small Cap Fund, respectively, based on each Fund’s average daily net assets.
Vulcan has contractually agreed with the Funds to limit the amount of each Fund’s total annual expenses (exclusive of brokerage expenses, interest expense, taxes and extraordinary expenses) to 1.25% of each Fund’s average daily net assets. This agreement is in effect through August 31, 2015 and is reevaluated on an annual basis. Without this agreement, expenses could be higher. The
32 |
www.vulcanvaluepartners.com |
Table of Contents
Notes to Financial Statements | ||
| ||
October 31, 2014 (Unaudited) | ||
Adviser is permitted to recover expenses it has borne through the agreement described above to the extent that each Fund’s expenses in later periods fall below the annual rates set forth in the relevant agreement. If the Adviser foregoes any fees and/or reimburses the Funds pursuant to this agreement with respect to a particular fiscal year, then the Adviser shall be entitled to recover from the Funds the amount forgone or reimbursed to the extent annual fund operating expenses are less than 1.25% of the Funds’ average daily net assets during any fiscal year following such fiscal year.
Pursuant to the expense limitation agreement between the Adviser and the Trust, each Fund will reimburse the Adviser for any contractual fee waivers and expense reimbursements made by the Adviser, provided that any such reimbursements made by each Fund to the Adviser will not cause the Funds’ expense limitation to exceed expense limitations in existence at the time the expense was incurred, or at the time of the reimbursement, whichever is lower, and the reimbursement is made within three years after the end of the fiscal year in which fees or expenses were incurred.
For the six months ended October 31, 2014, the fee waivers and/or reimbursements were as follows:
Fund | Fees Waived/Reimbursed By Adviser | Recoupment of Previously Waived Fees by Adviser | ||||||
Vulcan Value Partners Fund | $ – | $ – | ||||||
Vulcan Value Partners Small Cap Fund | 103,478 | – | ||||||
As of October 31, 2014, the balances of recoupable expenses for each Fund were as follows:
Fund | Expires 2017 | Expires 2016 | Expires 2015 | Total | ||||||||||||
Vulcan Value Partners Fund | $ | – | $ | – | $ | – | $ | – | ||||||||
Vulcan Value Partners Small Cap Fund | 400,224 | 161,158 | 124,024 | 685,406 | ||||||||||||
Distributor: ALPS Distributors, Inc. (“ADI” or the “Distributor”) (an affiliate of ALPS Fund Services, Inc.) acts as the distributor of each Fund’s shares pursuant to a Distribution Agreement with the Trust. Shares are sold on a continuous basis by ADI as agent for the Funds, and ADI has agreed to use its best efforts to solicit orders for the sale of each Fund’s shares, although it is not obliged to sell any particular amount of shares. ADI is not entitled to any compensation for its services as Distributor. ADI is registered as a broker-dealer with the Securities and Exchange Commission.
Principal Financial Officer: ALPS Fund Services, Inc. (“ALPS” and the “Administrator”) (an affiliate of ADI) receives an annual fee for providing principal financial officer services to the Funds. Vulcan pays this fee on behalf of the Funds.
Compliance Services: ALPS provides services that assist the Trust’s chief compliance officer in monitoring and testing the policies and procedures of the Trust in conjunction with requirements under Rule 38a-1 under the 1940 Act and receives an annual base fee. ALPS is reimbursed for certain out-of-pocket expenses by the Funds. Vulcan pays this fee on behalf of the Funds.
Semi-Annual Report | October 31, 2014 |
33 |
Table of Contents
Notes to Financial Statements
| ||
| ||
October 31, 2014 (Unaudited) | ||
Transfer Agent: ALPS serves as transfer, dividend paying and shareholder servicing agent for the Funds. ALPS receives an annual minimum fee, a fee based upon the number of shareholder accounts, and is also reimbursed by the Funds for certain out-of-pocket expenses.
Fund Administrator Fees and Expenses: ALPS serves as administrator to the Funds, and each Fund has agreed to pay expenses incurred in connection with its administrative activities. Pursuant to the Administration, Bookkeeping and Pricing Services Agreement, ALPS will provide operational services to the Funds including, but not limited to fund accounting and fund administration and generally assist in each Fund’s operations.
Annual administrative fee, billed monthly in total and allocated to each Fund, in the amount of the greater of (a) $210,000 annual minimum for both Funds (subject to an annual cost of living adjustment increase) or (b) following basis point fee schedule:
Average Total Net Assets | Contractual Fee | |
Between $0-$500M | 0.05% | |
$500M-$1B | 0.03% | |
Above $1B | 0.02% |
The Administrator is also reimbursed by the Funds for certain out-of-pocket expenses.
7. INDEMNIFICATIONS
Under the Trust’s organizational documents, its Officers and Trustees are indemnified against certain liability arising out of the performance of their duties to the Trust. Additionally, in the normal course of business, the Trust enters into contracts with service providers that may contain general indemnification clauses which may permit indemnification to the extent permissible under applicable law. The Trust’s maximum exposure under these arrangements is unknown, as this would involve future claims that may be made against the Trust that have not yet occurred.
34 |
www.vulcanvaluepartners.com |
Table of Contents
| ||
| ||
October 31, 2014 (Unaudited) | ||
1. FUND HOLDINGS
The Fund files its complete schedule of portfolio holdings with the Securities and Exchange Commission (the “SEC”) for the first and third quarters of each fiscal year on Form N-Q within 60 days after the end of the period. Copies of the Fund’s Form N-Q are available without charge on the SEC website at http://www.sec.gov. You may also review and copy the Form N-Q at the SEC’s Public Reference Room in Washington, DC. For more information about the operation of the Public Reference Room, please call the SEC at 1-800-SEC-0330.
2. FUND PROXY VOTING POLICIES, PROCEDURES AND SUMMARIES
The Fund’s policies and procedures used in determining how to vote proxies and information regarding how the Fund voted proxies relating to portfolio securities during the most recent prior 12-month period ending June 30 are available without charge, (1) upon request, by calling (toll-free) (866)-759-5679 and (2) on the SEC’s website at http://www.sec.gov.
Semi-Annual Report | October 31, 2014 |
35 |
Table of Contents

Table of Contents
| Item 2. | Code of Ethics. |
Not applicable to this Report.
| Item 3. | Audit Committee Financial Expert. |
Not applicable to this Report.
| Item 4. | Principal Accountant Fees and Services. |
Not applicable to this Report.
| Item 5. | Audit Committee of Listed Registrants. |
Not applicable to Registrant.
| Item 6. | Investments. |
| (a) | Schedule of Investments is included as part of the Reports to Stockholders filed under Item 1 of this Form N-CSR. |
| (b) | Not applicable. |
| Item 7. | Disclosure of Proxy Voting Policies and Procedures for Closed-End Management Investment Companies. |
Not applicable to Registrant.
| Item 8. | Portfolio Managers of Closed-End Management Investment Companies. |
Not applicable to Registrant.
Table of Contents
| Item 9. | Purchases of Equity Securities by Closed-End Management Investment Company and Affiliated Purchasers. |
Not applicable to Registrant.
| Item 10. | Submission of Matters to a Vote of Security Holders. |
There have been no material changes to the procedures by which shareholders may recommend nominees to the Registrant’s Board of Trustees, where those changes were implemented after the Registrant last provided disclosure in response to the requirements of Item 407(c)(2)(iv) of Regulation S-K, or this Item.
| Item 11. | Controls and Procedures. |
| (a) | The Registrant’s principal executive officer and principal financial officer have concluded that the Registrant’s disclosure controls and procedures (as defined in Rule 30a-3(c) under the Investment Company Act of 1940, as amended) are effective based on their evaluation of these controls and procedures as of a date within 90 days of the filing date of this report. |
| (b) | There was no change in the Registrant’s internal control over financial reporting (as defined in Rule 30a-3(d) under the Investment Company Act of 1940, as amended) that occurred during the second fiscal quarter of the period covered by this report that has materially affected, or is reasonably likely to materially affect, the Registrant’s internal control over financial reporting. |
| Item 12. | Exhibits. |
| (a)(1) | Not applicable to this Report. |
| (a)(2) | The certifications required by Rule 30a-2(a) of the Investment Company Act of 1940, as amended, and Section 302 of the Sarbanes-Oxley Act of 2002 are attached hereto as Exhibit 99.Cert. |
| (a)(3) | Not applicable to Registrant. |
| (b) | The certifications by the Registrant’s principal executive officer and principal financial officer, as required by Rule 30a-2(b) of the Investment Company Act of 1940, as amended, and Section 906 of the Sarbanes-Oxley Act of 2002 are attached hereto as Exhibit 99.906Cert. |
Table of Contents
SIGNATURES
Pursuant to the requirements of the Securities Exchange Act of 1934 and the Investment Company Act of 1940, the Registrant has duly caused this report to be signed on its behalf by the undersigned, thereunto duly authorized.
FINANCIAL INVESTORS TRUST
| By: | /s/ Edmund J. Burke | |
Edmund J. Burke (Principal Executive Officer) President | ||
| Date: | January 8, 2015 | |
Pursuant to the requirements of the Securities Exchange Act of 1934 and the Investment Company Act of 1940, this report has been signed below by the following persons on behalf of the Registrant and in the capacities and on the dates indicated.
FINANCIAL INVESTORS TRUST
| By: | /s/ Edmund J. Burke | |
Edmund J. Burke (Principal Executive Officer) President | ||
| Date: | January 8, 2015 | |
| By: | /s/ Kimberly R. Storms | |
Kimberly R. Storms (Principal Financial Officer) Treasurer | ||
| Date: | January 8, 2015 | |